Reviews for the Intel Core i7-9750H processor
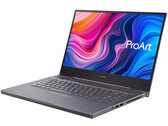
Asus ProArt StudioBook Pro 15 W500G5T Review: Powerful workstation with weaknesses
The Asus workstation scores some major points in our review thanks to a very high level of performance, 4K display and 16 GB of VRAM. Moreover, our review device features 32 GB of RAM and a 1 TB SSD. However, there is no Thunderbolt 3 port.
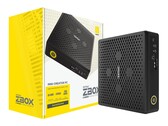
Intel Core i7-9750H, NVIDIA Quadro RTX 5000 Max-Q, 15.6", 2 kgZotac ZBOX Magnus mini PC with GeForce RTX 2080 in review
As a barebone system, Zotac is following the same path with the ZBOX as Intel did with its Ghost Canyon NUC. We took a closer look at the ZBOX Magnus with the GeForce RTX 2080 GPU and were positively surprised. You can find out what the mini PC is capable of in our detailed review.
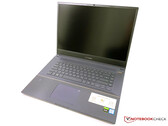
Intel Core i7-9750H, NVIDIA GeForce RTX 2080 MobileAcer ConceptD 3 Pro CN315-71P in review: Mobile workstation with space for 3 drives
Acer's 15.6-inch workstation scores points with powerful hardware, good battery life, extensive upgrade options and a Pantone-certified Full HD display. The device doesn't have a Thunderbolt 3 port on board, though.
Intel Core i7-9750H, NVIDIA Quadro T1000 (Laptop), 15.6", 2.4 kgAsus ProArt StudioBook Pro 17 W700G3T Review: The mobile workstation is hampered by small things
The new ProArt product line from Asus is specifically designed for content creators and includes notebooks, desktops, and special displays. We review the 17-inch StudioBook Pro 17 with Core i7 CPU and Nvidia Quadro RTX 3000 Studio Max-Q GPU. The slim workstation is convincing in many respects, but the devil is in the details.
Intel Core i7-9750H, NVIDIA Quadro RTX 3000 Max-Q, 17", 2.5 kgAcer ConceptD 5 17 inch Review: Creativity in large format
Acer's 17-inch notebook is almost a workstation, and it is well-positioned with its i7-9750H and GeForce RTX 2060. The matte display also does not need to hide with its 100% sRGB coverage and a high AdobeRGB percentage.
Intel Core i7-9750H, NVIDIA GeForce RTX 2060 Mobile, 17.3", 2.8 kgLenovo Legion Y740-17IRHg-81UJ001VGE: NVIDIA GeForce RTX 2080 Max-Q, 17.30", 3 kg
Review » Lenovo Legion Y740-17IRHg with a GeForce RTX 2080 Max-Q in Review
Schenker XMG Pro 17 PB71RD-G: NVIDIA GeForce RTX 2060 Mobile, 17.30", 2.8 kg
Review » Schenker XMG Pro 17 (Clevo PB71RD-G) Laptop Review: Temperature vs. Noise
Schenker XMG Pro 15: NVIDIA GeForce RTX 2070 Mobile, 15.60", 2.5 kg
Review » Schenker XMG Pro 15 (Clevo PB51RF-G) Laptop Review: Fun and games
Lenovo ThinkPad X1 Extreme 2019 20QV000WGE: NVIDIA GeForce GTX 1650 Mobile, 15.60", 1.7 kg
Review » Lenovo ThinkPad X1 Extreme 2019 Laptop Review: The second generation of Lenovo's premier multimedia laptop has gotten worse
Schenker XMG Core 15 GK5CP6V: NVIDIA GeForce GTX 1660 Ti Mobile, 15.60", 2 kg
Review » Schenker XMG Core 15 (Tongfang GK5CP6V) Laptop Review: Budget Gamer
Lenovo IdeaPad S740-15IRH: NVIDIA GeForce GTX 1650 Max-Q, 15.60", 1.9 kg
Review » Lenovo IdeaPad S740-15IRH Laptop Review: Best and Priciest IdeaPad Yet
Asus ROG Zephyrus S GX701GXR: NVIDIA GeForce RTX 2080 Max-Q, 17.30", 2.7 kg
Review » Asus ROG Zephyrus S GX701GXR laptop review: Slim gaming laptop scores points with a fast 300 Hz display
Lenovo Yoga C940-15IRH: NVIDIA GeForce GTX 1650 Max-Q, 15.60", 2 kg
Review » Lenovo Yoga C940-15IRH Convertible Review: The XPS 15 2-in-1 Dell Should Have Made
Razer Blade 15 Studio Edition: NVIDIA Quadro RTX 5000 Max-Q, 15.60", 2.2 kg
Review » Razer Blade 15 Studio Edition in Review: Solid Workstation with a Lot of Performance
Walmart EVOO Gaming 17: NVIDIA GeForce RTX 2060 Mobile, 17.30", 2.5 kg
Review » Walmart EVOO Gaming 17 Review: Chinese Laptop with Walmart's Name Slapped On
Schenker XMG Neo 17 XNE17M19: NVIDIA GeForce RTX 2060 Mobile, 17.30", 2.5 kg
Review » Schenker XMG Neo 17 (Tongfang GK7CP0S) Laptop Review: A good package
Schenker XMG Neo 15 XNE15M19: NVIDIA GeForce RTX 2070 Max-Q, 15.60", 2.1 kg
Review » Schenker XMG Neo 15 (Tongfang GK5CQ7Z) Laptop Review: A gaming laptop with slim bezels
MSI WE75 9TK: NVIDIA Quadro RTX 3000 (Laptop), 17.30", 2.6 kg
Review » MSI WE75 9TK Workstation Review: Core i7 with Quadro RTX Power
Maingear Vector 15: NVIDIA GeForce GTX 1660 Ti Mobile, 15.60", 1.9 kg
Review » Maingear Vector 15 Laptop Review: Gaming All-rounder
Xiaomi Mi Gaming Laptop 2019: NVIDIA GeForce RTX 2060 Mobile, 15.60", 2.6 kg
Review » Xiaomi Mi Gaming Laptop 2019 Review: Return of the Exotic
Acer ConceptD 7 CN715-71-743N: NVIDIA GeForce RTX 2060 Mobile, 15.60", 2.2 kg
Review » Acer ConceptD 7 Laptop in Review: Top-of-the-line Intel CPU with throttling behavior
Acer Predator Helios 300 PH315-52-79TY: NVIDIA GeForce GTX 1660 Ti Mobile, 15.60", 2.3 kg
Review » Acer Predator Helios 300 Laptop Review: A modern gaming laptop with a Turing GPU
Razer Blade Pro 17 4K UHD 120 Hz: NVIDIA GeForce RTX 2080 Max-Q, 17.30", 2.8 kg
Review » Razer Blade Pro 17 4K UHD 120 Hz Laptop Review: Finally, a 17-inch 4K Display With Almost No Ghosting
Dell G5 15 5590-P8RVW: NVIDIA GeForce RTX 2070 Max-Q, 15.60", 2.8 kg
Review » Dell G5 15 5590 Laptop Review: 15-inch gaming notebook with a Max-Q GPU
Asus ROG Zephyrus M15 GU502GU-XB74: NVIDIA GeForce GTX 1660 Ti Mobile, 15.60", 2 kg
Review » Asus Zephyrus M GU502GU Laptop Review: $1800 for Single-Channel RAM
Lenovo Legion Y740-17IRH: NVIDIA GeForce RTX 2060 Mobile, 17.30", 3 kg
Review » Lenovo Legion Y740-17IRH Review: Gaming bolide gets high marks for its great power delivery and low heat development
MSI GF65 9SD: NVIDIA GeForce GTX 1660 Ti Mobile, 15.60", 1.9 kg
Review » MSI GF65 9SD Laptop Review: GeForce GTX 1660 Ti for under $1000
MSI WP65: NVIDIA Quadro P620, 15.60", 1.9 kg
Review » MSI WP65 9TH Laptop Review: For Professionals on a Budget
Dell G7 7590: NVIDIA GeForce RTX 2060 Mobile, 15.60", 2.5 kg
Review » Dell G7 15 7590 Laptop Review: Alienware Performance for Less
Asus Strix Scar III G531GW-AZ062T: NVIDIA GeForce RTX 2070 Mobile, 15.60", 2.4 kg
Review » Asus ROG Strix Scar III G531GW Review: With a fast 240-Hz display
Asus ROG G703GXR: NVIDIA GeForce RTX 2080 Mobile, 17.30", 4.7 kg
Review » ASUS ROG G703GXR Laptop Review: A high-end old-school gamer
MSI GL75 9SEK-056US: NVIDIA GeForce RTX 2060 Mobile, 17.30", 2.5 kg
Review » MSI GL75 9SEK Laptop Review - An average mid-range gaming laptop with loud fans
MSI GL65 9SEK: NVIDIA GeForce RTX 2060 Mobile, 15.60", 2.3 kg
Review » MSI GL65 9SEK Laptop Review: Much More Portable than the GL63
Lenovo Legion Y740-15ICHg: NVIDIA GeForce RTX 2070 Max-Q, 15.60", 2.3 kg
Review » Lenovo Legion Y740 Laptop Review: Only a small CPU upgrade
Schenker XMG Fusion 15 XFU15L19: NVIDIA GeForce RTX 2070 Max-Q, 15.60", 1.9 kg
Review » Schenker XMG Fusion 15 in Review: Intel's reference design challenges the competition
Razer Blade 15 GTX 1660 Ti: NVIDIA GeForce GTX 1660 Ti Mobile, 15.60", 2.1 kg
Review » No RTX? No Problem — Razer Blade 15 GTX 1660 Ti Base Model Laptop Review
HP Omen X 2S 15-dg0075cl: NVIDIA GeForce RTX 2070 Max-Q, 15.60", 2.4 kg
Review » Double Trouble: HP Omen X 2S 15 Laptop Review
Alienware m15 R2 P87F: NVIDIA GeForce RTX 2080 Max-Q, 15.60", 2.2 kg
Review » The Area-51m mini-me: Dell Alienware m15 R2 Laptop Review
Acer Predator Helios 700 PH717-71-785M: NVIDIA GeForce RTX 2080 Mobile, 17.30", 4.8 kg
Review » Acer Predator Helios 700 Laptop Review: Innovative gaming laptop with a lot of features
MSI GP65 Leopard 9SE-225US: NVIDIA GeForce RTX 2060 Mobile, 15.60", 2.3 kg
Review » MSI GP65 Leopard 9SE Laptop Review - The best screen on a mid-tier gaming laptop
Asus Strix Hero III G731GV: NVIDIA GeForce RTX 2060 Mobile, 17.30", 2.9 kg
Review » Asus Strix Hero III G731GV RTX 2060 Laptop Review - Not that Much Better than the G731GU GTX 1660 Ti
Acer Aspire Nitro 5 AN517-51-7887: NVIDIA GeForce GTX 1660 Ti Mobile, 17.30", 2.8 kg
Review » Acer Aspire Nitro 5 Laptop Review: A gaming laptop with decent battery life
Eurocom Nightsky Ti15: NVIDIA GeForce GTX 1660 Ti Mobile, 15.60", 2.5 kg
Review » Eurocom Nightsky Ti15 (Clevo PB51RF) Laptop Review
Acer Predator Triton 500 PT515-51-71PZ: NVIDIA GeForce RTX 2070 Max-Q, 15.60", 2.1 kg
Review » Acer Predator Triton 500 Laptop Review: A Lot of Gaming Performance Despite the Slim Case
Lenovo Legion Y540-15IRH-81SX00B2GE: NVIDIA GeForce GTX 1660 Ti Mobile, 15.60", 2.2 kg
Review » Lenovo Legion Y540-15IRH Laptop Review: A good gaming laptop with a GeForce GTX 1660 Ti GPU
Origin PC EVO16-S i7-9750H RTX 2080 Max-Q: NVIDIA GeForce RTX 2080 Max-Q, 16.10", 2.1 kg
Review » Origin PC EVO16-S (Clevo P960RD) Review: A Rare 16.1-inch Gaming Laptop
Razer Blade Pro 17 RTX 2060: NVIDIA GeForce RTX 2060 Mobile, 17.30", 2.8 kg
Review » Razer Blade Pro 17 RTX 2060 Laptop Review: How does it Compare to the RTX 2080 Max-Q?
HP Gaming Pavilion 15-dk0009ng: NVIDIA GeForce GTX 1660 Ti Max-Q, 15.60", 2.4 kg
Review » HP Gaming Pavilion 15 Laptop Review: A powerful yet pleasingly quiet gaming laptop
Lenovo Legion Y540-15IRH: NVIDIA GeForce RTX 2060 Mobile, 15.60", 2.3 kg
Review » Lenovo Legion Y540 with RTX 2060 laptop review: Gaming laptop with good sound and 144 Hz panel
Asus Strix GL531GV-PB74: NVIDIA GeForce RTX 2060 Mobile, 15.60", 2.4 kg
Review » Asus ROG Strix G GL531GV Laptop Review: Like a Zephyrus, but Cheaper
Gigabyte Aero 15 OLED XA: NVIDIA GeForce RTX 2070 Max-Q, 15.60", 2.2 kg
Review » Gigabyte Aero 15 XA Laptop Review: With OLED panel and 4K in a new design
Asus ASUS ROG Strix SCAR III G731GW-XB74: NVIDIA GeForce RTX 2070 Mobile, 17.30", 2.9 kg
Review » Asus ROG Strix Hero III G731GW Review - a colorful laptop with compromises
HP Pavilion Gaming 17-cd0085cl: NVIDIA GeForce GTX 1660 Ti Max-Q, 17.30", 2.8 kg
Review » HP Pavilion Gaming 17 Review: Finally, a Quiet Gaming Laptop
Asus ROG Strix G GL731GU-RB74: NVIDIA GeForce GTX 1660 Ti Mobile, 17.30", 2.9 kg
Review » An LED Light Show: Asus ROG Strix G GL731GU Laptop Review
Schenker XMG Core 17: NVIDIA GeForce GTX 1660 Ti Mobile, 17.30", 2.5 kg
Review » Schenker XMG Core 17 (Core i7-9750H, GeForce GTX 1660 Ti, 144-Hz Display) Tongfang GK7CP6R Laptop Review
MSI GF75 Thin 9SC: NVIDIA GeForce GTX 1650 Mobile, 17.30", 2.3 kg
Review » Thin is in: MSI GF75 Thin 9SC Laptop Review
Eurocom Nightsky RX17: NVIDIA GeForce RTX 2070 Mobile, 17.30", 2.9 kg
Review » Eurocom Nightsky RX17 (Clevo PB71RF) Laptop Review
MSI GS75 Stealth 9SG: NVIDIA GeForce RTX 2080 Max-Q, 17.30", 2.3 kg
Review » MSI GS75 Stealth 9SG Laptop Review: A slim and powerful gaming laptop with good battery life
MSI WS75 9TL-636: NVIDIA Quadro RTX 4000 (Laptop), 17.30", 2.3 kg
Review » MSI WS75 Review: Thin 17-inch workstation with powerful GPU
Razer Blade Pro 17 RTX 2080 Max-Q: NVIDIA GeForce RTX 2080 Max-Q, 17.30", 2.8 kg
Review » So much better than before: Razer Blade Pro 17 Laptop Review
MSI GP75 Leopard 9SD: NVIDIA GeForce GTX 1660 Ti Mobile, 17.30", 2.6 kg
Review » Review of the MSI GP75 Leopard 9SD: Low-priced Gaming Laptop with a 144 Hz Panel
Aorus 15-SA: NVIDIA GeForce GTX 1660 Ti Mobile, 15.60", 2.1 kg
Review » Gigabyte Aorus 15-SA (Core i7-9750H, GTX 1660 Ti, 144 Hz FHD) Laptop Review
MSI GS65 Stealth 9SG: NVIDIA GeForce RTX 2080 Max-Q, 15.60", 2 kg
Review » MSI GS65 Stealth 9SG (i7-9750H, RTX 2080 Max-Q) Laptop Review
CUK Model Z GK5CQ7Z: NVIDIA GeForce RTX 2070 Max-Q, 15.60", 2.2 kg
Review » CUK Model Z (i7 9750H, RTX 2070 Max-Q) Tongfang GK5CQ7Z Laptop Review
Razer Blade 15 RTX 2080 Max-Q: NVIDIA GeForce RTX 2080 Max-Q, 15.60", 2.2 kg
Review » Razer Blade 15 Advanced Model (i7-9750H, RTX 2080 Max-Q, 240 Hz) Laptop Review
Asus Zephyrus S GX502GW: NVIDIA GeForce RTX 2070 Mobile, 15.60", 2.1 kg
Review » ASUS ROG Zephyrus S GX502GW (Core i7-9750H, RTX 2070) Laptop Review
Gigabyte Aero 15 Classic-XA: NVIDIA GeForce RTX 2070 Max-Q, 15.60", 2.1 kg
Review » Gigabyte Aero 15 Classic-XA (i7-9750H, RTX 2070 Max-Q) Laptop Review
Acer Nitro 5 AN517-51-76V6: NVIDIA GeForce RTX 2060 Mobile, 17.30", 2.7 kg
External Review » Acer Nitro 5 AN517-51-76V6
Lenovo Legion Y540 15IRH-81SX007YMH: NVIDIA GeForce RTX 2060 Mobile, 15.60", 2.3 kg
External Review » Lenovo Legion Y540 15IRH-81SX007YMH
Lenovo Ideapad L340 17IRH-81LL003BMH: NVIDIA GeForce GTX 1650 Mobile, 17.30", 2.8 kg
External Review » Lenovo Ideapad L340 17IRH-81LL003BMH
MSI GP75 Leopard 9SD-822BE: NVIDIA GeForce GTX 1660 Ti Mobile, 17.30"
External Review » MSI GP75 Leopard 9SD-822BE
Lenovo Legion Y540-15IRH-HASP: NVIDIA GeForce RTX 2060 Mobile, 15.60", 2.3 kg
External Review » Lenovo Legion Y540-15IRH-HASP
Acer Nitro 5 AN517-51-77QV: NVIDIA GeForce RTX 2060 Mobile, 17.30", 2.7 kg
External Review » Acer Nitro 5 AN517-51-77QV
Acer Nitro 5 AN515-54-70KK: NVIDIA GeForce RTX 2060 Mobile, 15.60", 2.3 kg
External Review » Acer Nitro 5 AN515-54-70KK
Acer Nitro 5 AN517-51-75JE: NVIDIA GeForce RTX 2060 Mobile, 17.30", 2.7 kg
External Review » Acer Nitro 5 AN517-51-75JE
Asus ProArt StudioBook Pro X W730G1T-H8004R: NVIDIA Quadro T1000 (Laptop), 17.00", 2.5 kg
External Review » Asus ProArt StudioBook Pro X W730G1T-H8004R
MSI GF65 Thin 9SD-657XES: NVIDIA GeForce GTX 1660 Ti Mobile, 15.60", 1.9 kg
External Review » MSI GF65 Thin 9SD-657XES
Lenovo Legion Y540-15IRH-81SX00HVSP: NVIDIA GeForce RTX 2060 Mobile, 15.60", 2.3 kg
External Review » Lenovo Legion Y540-15IRH-81SX00HVSP
Acer ConceptD 7 Pro CN715-71P-770L: NVIDIA Quadro RTX 5000 Max-Q, 15.60", 2.1 kg
External Review » Acer ConceptD 7 Pro CN715-71P-770L
Asus ROG Zephyrus M15 GU502GV-AZ037T: NVIDIA GeForce RTX 2060 Mobile, 15.60", 1.9 kg
External Review » Asus ROG Zephyrus M GU502GV-AZ037T
Medion Erazer P15811-i7-1024F16: NVIDIA GeForce GTX 1660 Ti Mobile, 15.60", 2.1 kg
External Review » Medion Erazer P15811-i7-1024F16
MSI GF65 Thin 9SEXR-686XES: NVIDIA GeForce RTX 2060 Mobile, 15.60"
External Review » MSI GF65 Thin 9SEXR-686XES
Acer ConceptD 7 Pro CN715-71P-73YL: NVIDIA Quadro RTX 5000 (Laptop), 15.60", 2.1 kg
External Review » Acer ConceptD 7 Pro CN715-71P-73YL
Medion Erazer X17805: NVIDIA GeForce RTX 2070 Max-Q, 17.30", 2.6 kg
External Review » Medion Erazer X17805
Asus F571GT-AL311T: NVIDIA GeForce GTX 1650 Mobile, 15.60", 1.8 kg
External Review » Asus F571GT-AL311T
Asus ProArt StudioBook Pro 17 W700G2T-AV002R, i7-9750H: NVIDIA Quadro T2000 (Laptop), 17.00", 2.2 kg
External Review » Asus ProArt StudioBook Pro 17 W700G2T-AV002R, i7-9750H
Acer Nitro 5 AN517-51-748R: NVIDIA GeForce GTX 1660 Ti Mobile, 17.30", 2.7 kg
External Review » Acer Nitro 5 AN517-51-748R
Lenovo Legion Y540-15IRH-PG0: NVIDIA GeForce GTX 1650 Mobile, 15.60", 1.3 kg
External Review » Lenovo Legion Y540-15IRH-PG0
Acer Aspire 7 A715-75G: NVIDIA GeForce GTX 1650 Ti Mobile, 15.60", 2.2 kg
External Review » Acer Aspire 7 A715-75G
Acer ConceptD 5 Pro CN515-71P-75FQ: NVIDIA Quadro RTX 3000 (Laptop), 15.60", 2.5 kg
External Review » Acer ConceptD 5 Pro CN515-71P-75FQ
Lenovo ThinkPad X1 Extreme-20QV000WGE: NVIDIA GeForce GTX 1650 Max-Q, 15.60", 1.7 kg
External Review » Lenovo ThinkPad X1 Extreme-20QV000WGE
MSI GE65 Raider 9SF-003ES: NVIDIA GeForce RTX 2070 Mobile, 15.60", 2.3 kg
External Review » MSI GE65 Raider 9SF-003ES
HP Gaming Pavilion 15-dk0031ns: NVIDIA GeForce GTX 1650 Mobile, 15.60", 2.3 kg
External Review » HP Gaming Pavilion 15-dk0031ns
MSI GL75 9SFK-1248: NVIDIA GeForce RTX 2070 Mobile, 17.30", 2.5 kg
External Review » MSI GL75 9SFK-1248
Acer ConceptD 5 Pro CN515-71P-767Y: NVIDIA Quadro T1000 (Laptop), 15.60", 2.5 kg
External Review » Acer ConceptD 5 Pro CN515-71P-767Y
Acer Aspire 7 A715-74G-77AW: NVIDIA GeForce GTX 1650 Mobile, 15.60", 2.4 kg
External Review » Acer Aspire 7 A715-74G-77AW
Asus ROG Strix G531GT-BQ165: NVIDIA GeForce GTX 1650 Mobile, 15.60", 2.4 kg
External Review » Asus ROG Strix G531GT-BQ165
MSI GL75 9SDK-268XES: NVIDIA GeForce GTX 1660 Ti Mobile, 17.30", 2.5 kg
External Review » MSI GL75 9SDK-268XES
Asus Zephyrus S GX701GXR-HG113R: NVIDIA GeForce RTX 2080 Max-Q, 17.30", 2.6 kg
External Review » Asus Zephyrus S GX701GXR-HG113R
Asus ProArt StudioBook 15 H500GV-HC012R: NVIDIA GeForce RTX 2060 Mobile, 15.60", 2 kg
External Review » Asus ProArt StudioBook 15 H500GV-HC012R
Asus ProArt StudioBook 15 H500GV-XS76: NVIDIA GeForce RTX 2060 Mobile, 15.60", 2 kg
External Review » Asus ProArt StudioBook 15 H500GV-XS76
Asus ProArt StudioBook Pro 15 W500G5T-HC013R: NVIDIA Quadro RTX 5000 Max-Q, 15.60", 2 kg
External Review » Asus ProArt StudioBook Pro 15 W500G5T-HC013R
Acer ConceptD 3 CN315-71-76MR: NVIDIA GeForce GTX 1650 Mobile, 15.60", 2.4 kg
External Review » Acer ConceptD 3 CN315-71-76MR
Acer Aspire 7 A715-74G-71WS: NVIDIA GeForce GTX 1050 Mobile, 15.60", 2.4 kg
External Review » Acer Aspire 7 A715-74G-71WS
HP Gaming Pavilion 15-dk0026ns: NVIDIA GeForce GTX 1650 Mobile, 15.60", 2.2 kg
External Review » HP Gaming Pavilion 15-dk0026ns
Acer Predator Helios 300 PH315-52-796B: NVIDIA GeForce GTX 1660 Ti Mobile, 15.60", 2.4 kg
External Review » Acer Predator Helios 300 PH315-52-796B
Acer Nitro 5 AN515-54-710E: NVIDIA GeForce GTX 1050 Mobile, 15.60", 2.5 kg
External Review » Acer Nitro 5 AN515-54-710E
Acer Nitro 5 AN515-54-71P8: NVIDIA GeForce GTX 1660 Ti Mobile, 15.60", 2.2 kg
External Review » Acer Nitro 5 AN515-54-71P8
Lenovo Legion Y740-17IRHg-81UJ001VGE: NVIDIA GeForce RTX 2080 Max-Q, 17.30", 3 kg
External Review » Lenovo Legion Y740-17IRHg-81UJ001VGE
Asus ROG Zephyrus M15 GU502GV-AZ038T: NVIDIA GeForce RTX 2060 Mobile, 15.60", 1.9 kg
External Review » Asus ROG Zephyrus M GU502GV-AZ038T
Alienware m17 R2-C1DGG: NVIDIA GeForce RTX 2070 Max-Q, 17.30", 2.6 kg
External Review » Alienware m17 R2-C1DGG
MSI GL75 9SD-032: NVIDIA GeForce GTX 1660 Ti Mobile, 17.30", 2.5 kg
External Review » MSI GL75 9SD-032
MSI GS75 Stealth-243: NVIDIA GeForce RTX 2070 Max-Q, 17.30", 2.3 kg
External Review » MSI GS75 Stealth-243
Alienware m15 R2-N00AWm15R210: NVIDIA GeForce RTX 2080 Max-Q, 15.60", 2.2 kg
External Review » Alienware m15 R2-N00AWm15R210
MSI GL65 9SD-007NL: NVIDIA GeForce GTX 1660 Ti Mobile, 15.60", 2.3 kg
External Review » MSI GL65 9SD-007NL
Acer Predator Triton 500 PT515-51-72QK: NVIDIA GeForce RTX 2070 Max-Q, 15.60", 2 kg
External Review » Acer Predator Triton 500 PT515-51-72QK
Asus ROG Strix G731GU-H7154: NVIDIA GeForce GTX 1660 Ti Mobile, 17.30", 2.9 kg
External Review » Asus ROG Strix G731GU-H7154
HP Pavilion Gaming 15-dk0760nd: NVIDIA GeForce GTX 1660 Ti Mobile, 15.60", 2.3 kg
External Review » HP Pavilion Gaming 15-dk0760nd
Asus ZenBook Pro Duo UX581GV-H2002R: NVIDIA GeForce RTX 2060 Mobile, 15.60", 2.5 kg
External Review » Asus ZenBook Pro Duo UX581GV-H2002R
Acer Predator Helios 300 PH317-53-750A: NVIDIA GeForce RTX 2070 Mobile, 17.30", 2.9 kg
External Review » Acer Predator Helios 300 PH317-53-750A
MSI GF65 Thin 9SEXR-236XES: NVIDIA GeForce RTX 2060 Mobile, 15.60", 1.9 kg
External Review » MSI GF65 Thin 9SEXR-236XES
Lenovo Legion Y540-15-81SX0034TX: NVIDIA GeForce GTX 1660 Ti Mobile, 15.60", 2.3 kg
External Review » Lenovo Legion Y540-15-81SX0034TX
Lenovo Ideapad L340-15IRH-81LK00CDSP: NVIDIA GeForce GTX 1650 Mobile, 15.60", 2.2 kg
External Review » Lenovo Ideapad L340-15IRH-81LK00CDSP
Acer Aspire Nitro 5 AN515-54-7793: NVIDIA GeForce GTX 1650 Mobile, 15.60", 2.5 kg
External Review » Acer Aspire Nitro 5 AN515-54-7793
Lenovo Legion Y540-15IRH-81SX00CKSP: NVIDIA GeForce RTX 2060 Max-Q, 15.60", 2.3 kg
External Review » Lenovo Legion Y540-15IRH-81SX00CKSP
Asus TUF FX505GT-BQ028: NVIDIA GeForce GTX 1650 Mobile, 15.60", 2.2 kg
External Review » Asus TUF FX505GT-BQ028
Asus ROG Strix G531GW-AL137: NVIDIA GeForce RTX 2070 Mobile, 15.60", 2.4 kg
External Review » Asus ROG Strix G531GW-AL137
Asus ROG Strix GL531GU-AL061T: NVIDIA GeForce GTX 1660 Ti Mobile, 15.60", 2.4 kg
External Review » Asus ROG Strix GL531GU-AL061T
Dell G5 15 5590-YWTRF: NVIDIA GeForce GTX 1660 Ti Mobile, 15.60", 2.9 kg
External Review » Dell G5 15 5590-YWTRF
Asus ROG Zephyrus S GX701GWR-H6089R: NVIDIA GeForce RTX 2070 Mobile, 17.30", 2.7 kg
External Review » Asus ROG Zephyrus S GX701GWR-H6089R
HP Omen X 2S 15-dg0830no: NVIDIA GeForce RTX 2080 Mobile, 15.60", 2.5 kg
External Review » HP Omen X 2S 15-dg0830no
Acer Predator Helios 300 PH315-52-79H8: NVIDIA GeForce RTX 2060 Mobile, 15.60", 2.4 kg
External Review » Acer Predator Helios 300 PH315-52-79H8
Asus ROG Zephyrus S GX502GW-AZ064T: NVIDIA GeForce RTX 2070 Mobile, 15.60", 2 kg
External Review » Asus ROG Zephyrus S GX502GW-AZ064T
MSI GF75 Thin 9SC-277XES: NVIDIA GeForce GTX 1650 Mobile, 17.30", 2.2 kg
External Review » MSI GF75 Thin 9SC-277XES
MSI GS65 Stealth 9SG: NVIDIA GeForce RTX 2080 Max-Q, 15.60", 2 kg
External Review » MSI GS65 Stealth 9SG
Asus ROG Strix G731GU-EV038T: NVIDIA GeForce GTX 1660 Ti Mobile, 17.30", 2.9 kg
External Review » Asus ROG Strix G731GU-EV038T
Gigabyte Aero 15 OLED WA-7BE5130SP: NVIDIA GeForce RTX 2060 Mobile, 15.60", 2 kg
External Review » Gigabyte Aero 15 OLED WA-7BE5130SP
HP Pavilion Gaming 15-dk0040nf: NVIDIA GeForce GTX 1660 Ti Mobile, 15.60", 2.3 kg
External Review » HP Pavilion Gaming 15-dk0040nf
Acer ConceptD 3 Pro CN315-71P-73W1: NVIDIA Quadro T1000 (Laptop), 15.60", 2.4 kg
External Review » Acer ConceptD 3 Pro CN315-71P-73W1
Asus ProArt StudioBook Pro 17 W700G3T: NVIDIA Quadro RTX 3000 Max-Q, 17.00", 2.5 kg
External Review » Asus ProArt StudioBook Pro 17 W700G3T
Asus ROG Zephyrus S GX701GXR: NVIDIA GeForce RTX 2080 Max-Q, 17.30", 2.7 kg
External Review » Asus ROG Zephyrus S GX701GXR
HP Pavilion Gaming 15-dk0045cl: NVIDIA GeForce GTX 1660 Ti Max-Q, 15.60", 2.4 kg
External Review » HP Pavilion Gaming 15-dk0045cl
Lenovo Legion Y740s-15IRH, i7-9750H: Intel HD Graphics 630, 15.60", 1.7 kg
External Review » Lenovo Legion Y740s-15IRH, i7-9750H
Dell Inspiron 15 7590-92P5C: NVIDIA GeForce GTX 1650 Ti Mobile, 15.60", 1.8 kg
External Review » Dell Inspiron 15 7590-92P5C
Asus VivoBook 15 K571GD-BQ215T: NVIDIA GeForce GTX 1050 Mobile, 15.60", 2.1 kg
External Review » Asus VivoBook 15 K571GD-BQ215T
Acer Nitro 7 AN715-51-76LS: NVIDIA GeForce GTX 1660 Ti Mobile, 15.60", 2.5 kg
External Review » Acer Nitro 7 AN715-51-76LS
Asus ROG Zephyrus M15 GU502GV-AZ088T: NVIDIA GeForce RTX 2060 Mobile, 15.60", 1.9 kg
External Review » Asus Zephyrus M GU502GV-AZ088T
Gigabyte Aero 17 XA-7DE4130SP: NVIDIA GeForce RTX 2070 Max-Q, 17.30", 2.5 kg
External Review » Gigabyte Aero 17 XA-7DE4130SP
MSI Prestige P75 9SD Creator 625: NVIDIA GeForce GTX 1660 Ti Mobile, 17.30", 2.3 kg
External Review » MSI Prestige P75 9SD Creator 625
Alienware m17 R2, i7-9750H, RTX 2080 Max-Q: NVIDIA GeForce RTX 2080 Max-Q, 17.30", 2.6 kg
External Review » Alienware m17 R2, i7-9750H, RTX 2080 Max-Q
Acer Nitro 5 AN517-51-76B3: NVIDIA GeForce GTX 1660 Ti Mobile, 17.30", 2.7 kg
External Review » Acer Nitro 5 AN517-51-76B3
Razer Blade 15 GTX 1660 Ti: NVIDIA GeForce GTX 1660 Ti Mobile, 15.60", 2.1 kg
External Review » Razer Blade 15 GTX 1660 Ti
HP Omen 15-dc1010nr: NVIDIA GeForce GTX 1650 Mobile, 15.60", 2.6 kg
External Review » HP Omen 15-dc1010nr
MSI GL63 9SD-1041IN: NVIDIA GeForce GTX 1660 Ti Mobile, 15.60", 2.3 kg
External Review » MSI GL63 9SD-1041IN
Lenovo ThinkPad X1 Extreme G2-20QV00CMGE: NVIDIA GeForce GTX 1650 Max-Q, 15.60", 1.7 kg
External Review » Lenovo ThinkPad X1 Extreme G2-20QV00CMGE
Lenovo Yoga C940-15IRH: NVIDIA GeForce GTX 1650 Max-Q, 15.60", 2 kg
External Review » Lenovo Yoga C940-15IRH
MSI GL65 9SFK-286XES: NVIDIA GeForce RTX 2070 Mobile, 15.60", 2.3 kg
External Review » MSI GL65 9SFK-286XES
MSI GF65 Thin 9SD-072XES: NVIDIA GeForce GTX 1660 Ti Mobile, 15.60", 0.2 kg
External Review » MSI GF65 Thin 9SD-072XES
HP Omen 15-dc1036ns: NVIDIA GeForce GTX 1660 Ti Mobile, 15.60", 2.3 kg
External Review » HP Omen 15-dc1036ns
Acer Aspire Nitro 5 AN517-51-76MG: NVIDIA GeForce GTX 1650 Mobile, 15.60", 2.5 kg
External Review » Acer Aspire Nitro 5 AN517-51-76MG
Schenker XMG Fusion 15-L19jby: NVIDIA GeForce GTX 1660 Ti Mobile, 15.60", 1.9 kg
External Review » Schenker XMG Fusion 15-L19jby
HP Omen X2S 15-dg0901ng: NVIDIA GeForce RTX 2080 Max-Q, 15.60", 2.5 kg
External Review » HP Omen X2S 15-dg0901ng
Lenovo Legion Y540-15IRH-81SX00HRSP: NVIDIA GeForce RTX 2060 Mobile, 15.60", 2.3 kg
External Review » Lenovo Legion Y540-15IRH-81SX00HRSP
Asus ROG Strix G531GV-AL172: NVIDIA GeForce RTX 2060 Mobile, 15.60", 2.4 kg
External Review » Asus ROG Strix G531GV-AL172
HP Pavilion 15-BC520NS: NVIDIA GeForce GTX 1650 Mobile, 15.60", 2.2 kg
External Review » HP Pavilion 15-BC520NS
MSI GL65 9SEK-255XES: NVIDIA GeForce RTX 2060 Mobile, 15.60", 2.3 kg
External Review » MSI GL65 9SEK-255XES
Asus ROG Zephyrus M15 GU502GV-ES004T: NVIDIA GeForce RTX 2060 Mobile, 15.60", 2 kg
External Review » Asus ROG Zephyrus M GU502GV-ES004T
MSI GF75 Thin 9RCX-270ID: NVIDIA GeForce GTX 1050 Ti Mobile, 17.30", 2.2 kg
External Review » MSI GF75 Thin 9RCX-270ID
Acer Predator Helios 700 PH717-71-785M: NVIDIA GeForce RTX 2080 Mobile, 17.30", 4.8 kg
External Review » Acer Predator Helios 700 PH717-71-785M
Asus ROG STRIX G531GU-AL003: NVIDIA GeForce GTX 1660 Ti Mobile, 15.60", 2.4 kg
External Review » Asus ROG STRIX G531GU-AL003
Lenovo ThinkPad P53-20QN002VMX: NVIDIA Quadro T1000 (Laptop), 15.60", 2.5 kg
External Review » Lenovo ThinkPad P53-20QN002VMX
Razer Blade 15 Studio Edition: NVIDIA Quadro RTX 5000 Max-Q, 15.60", 2.2 kg
External Review » Razer Blade 15 Studio Edition
Asus ROG Strix Scar III G731GV-EV106T: NVIDIA GeForce RTX 2060 Mobile, 17.30", 2.9 kg
External Review » Asus ROG Strix Scar III G731GV-EV106T
Asus TUF FX505GT-BQ024: NVIDIA GeForce GTX 1650 Mobile, 15.60", 2.2 kg
External Review » Asus TUF FX505GT-BQ024
Acer Predator Helios 300 PH317-53-75B4: NVIDIA GeForce GTX 1660 Ti Mobile, 15.60", 3 kg
External Review » Acer Predator Helios 300 PH317-53-75B4
Dell G5 15 5590-P8RVW: NVIDIA GeForce RTX 2070 Max-Q, 15.60", 2.8 kg
External Review » Dell G5 15 5590-P8RVW
Lenovo Legion Y540-17IRH-81Q4002CGE: NVIDIA GeForce RTX 2060 Mobile, 17.30", 2.8 kg
External Review » Lenovo Legion Y540-17IRH-81Q4002CGE
HP Pavilion Gaming 15-dk0052tx: NVIDIA GeForce GTX 1660 Ti Mobile, 15.60", 2.3 kg
External Review » HP Pavilion Gaming 15-dk0052tx
Alienware m17 R2-WNm17R240s: NVIDIA GeForce RTX 2080 Mobile, 15.60", 2.6 kg
External Review » Alienware m17 R2-WNm17R240s
Dell G3 15 3590-GN3R591AU: NVIDIA GeForce GTX 1650 Mobile, 15.60", 2.7 kg
External Review » Dell G3 15 3590-GN3R591AU
Asus Zephyrus S GX531GXR-AZ044R: NVIDIA GeForce RTX 2080 Max-Q, 15.60", 2.1 kg
External Review » Asus Zephyrus S GX531GXR-AZ044R
Schenker XMG Neo 15 XNE15M19: NVIDIA GeForce RTX 2070 Max-Q, 15.60", 2.1 kg
External Review » Schenker XMG Neo 15 XNE15M19
HP Omen 15-dh0022nf : NVIDIA GeForce RTX 2070 Mobile, 15.60", 2.6 kg
External Review » HP Omen 15-dh0022nf
Acer Nitro 5 AN515-54-749V: NVIDIA GeForce GTX 1650 Mobile, 15.60", 2.5 kg
External Review » Acer Nitro 5 AN515-54-749V
Acer Predator Triton 500 PT515-51-75C9: NVIDIA GeForce RTX 2080 Max-Q, 15.60", 2.1 kg
External Review » Acer Predator Triton 500 PT515-51-75C9
Acer ConceptD 7 Pro CN715-71P-75G8: NVIDIA Quadro RTX 5000 (Laptop), 15.60", 2.1 kg
External Review » Acer ConceptD 7 Pro CN715-71P-75G8
Acer Predator Triton 300 PT315-51-7815: NVIDIA GeForce GTX 1650 Mobile, 15.60", 2.3 kg
External Review » Acer Predator Triton 300 PT315-51-7815
HP Gaming Pavilion 15-dk0046nr: NVIDIA GeForce GTX 1650 Mobile, 15.60", 2.3 kg
External Review » HP Gaming Pavilion 15-dk0046nr
Asus ROG Strix G731GW-EV010T : NVIDIA GeForce RTX 2070 Mobile, 17.30", 2.9 kg
External Review » Asus ROG Strix G731GW-EV010T
Acer ConceptD 5 Pro CN517-71P-76BZ: NVIDIA Quadro RTX 3000 (Laptop), 17.30", 2.9 kg
External Review » Acer ConceptD 5 Pro CN517-71P-76BZ
Acer Aspire 7 A715-74G-743J: NVIDIA GeForce GTX 1650 Mobile, 15.60", 2.4 kg
External Review » Acer Aspire 7 A715-74G-743J
HP Omen 15-dh0011ng: NVIDIA GeForce RTX 2070 Max-Q, 15.60", 2.6 kg
External Review » HP Omen 15-dh0011ng
MSI GE65 Raider-052: NVIDIA GeForce RTX 2060 Mobile, 15.60", 2.3 kg
External Review » MSI GE65 Raider-052
MSI GE65 Raider 9SF-006: NVIDIA GeForce RTX 2070 Mobile, 15.60", 2.3 kg
External Review » MSI GE65 Raider 9SF-006
HP Omen 17-cb0040nr: NVIDIA GeForce RTX 2070 Mobile, 17.30", 3.3 kg
External Review » HP Omen 17-cb0040nr
Apple MacBook Pro 16 2019 Base 5300M: AMD Radeon Pro 5300M, 16.00", 2 kg
External Review » Apple MacBook Pro 16 2019 Base 5300M
Asus ROG Zephyrus S GX502GW-ES004T: NVIDIA GeForce RTX 2070 Mobile, 15.60", 2 kg
External Review » Asus ROG Zephyrus S GX502GW-ES004T
HP Omen 17-CB0006UR: NVIDIA GeForce RTX 2080 Mobile, 17.30", 3.3 kg
External Review » HP Omen 17-CB0006UR
HP Omen 15-dh0001ns: NVIDIA GeForce RTX 2060 Mobile, 15.60", 2.7 kg
External Review » HP Omen 15-dh0001ns
Asus ROG Strix G531GU-AL018: NVIDIA GeForce GTX 1660 Ti Mobile, 15.60", 2.4 kg
External Review » Asus ROG Strix G531GU-AL018
MSI GF75 Thin 9SC-061XES: NVIDIA GeForce GTX 1650 Mobile, 17.30", 2.2 kg
External Review » MSI GF75 Thin 9SC-061XES
Asus ROG Strix Scar III G731GU-EV044: NVIDIA GeForce GTX 1660 Ti Mobile, 17.30", 2.9 kg
External Review » Asus ROG Strix Scar III G731GU-EV044
Asus Zenbook Pro Duo UX581GV-H2004T: NVIDIA GeForce RTX 2060 Mobile, 15.60", 2.5 kg
External Review » Asus Zenbook Pro Duo UX581GV-H2004T
MSI GP75 Leopard 9SD: NVIDIA GeForce GTX 1660 Ti Mobile, 17.30", 2.6 kg
External Review » MSI GP75 Leopard 9SD
Acer ConceptD 7 CN715-71-73A9: NVIDIA GeForce RTX 2080 Mobile, 15.60", 2.1 kg
External Review » Acer ConceptD 7 CN715-71-73A9
Acer ConceptD 5 Pro CN515-71P (i7-9750H, Quadro T1000): NVIDIA Quadro T1000 (Laptop), 15.60", 2.5 kg
External Review » Acer ConceptD 5 Pro CN515-71P (i7-9750H, Quadro T1000)
Lenovo Legion Y7000 2019-81NSCTO1WW: NVIDIA GeForce GTX 1660 Ti Mobile, 15.60", 2.3 kg
External Review » Lenovo Legion Y7000 2019-81NSCTO1WW
Acer Aspire Nitro 7 AN715-51-70D6: NVIDIA GeForce GTX 1660 Ti Mobile, 15.60", 2.7 kg
External Review » Acer Aspire Nitro 7 AN715-51-70D6
Asus ZenBook Pro Duo UX581GV-H2003R: NVIDIA GeForce RTX 2060 Mobile, 15.60", 2.5 kg
External Review » Asus ZenBook Pro Duo UX581GV-H2003R
Acer Nitro 5 AN517-51-77B8: NVIDIA GeForce GTX 1650 Mobile, 17.30", 2.7 kg
External Review » Acer Nitro 5 AN517-51-77B8
MSI GL65 9SEK-210XES: NVIDIA GeForce RTX 2060 Mobile, 15.60", 2.3 kg
External Review » MSI GL65 9SEK-210XES
Asus ROG Strix Scar III G531GV-AZ177T: NVIDIA GeForce RTX 2060 Mobile, 15.60", 2.4 kg
External Review » Asus ROG Strix Scar III G531GV-AZ177T
HP Omen 15-dh0015ns: NVIDIA GeForce GTX 1660 Ti Mobile, 15.60", 2.6 kg
External Review » HP Omen 15-dh0015ns
Lenovo Legion Y740-17IRH: NVIDIA GeForce RTX 2060 Mobile, 17.30", 3 kg
External Review » Lenovo Legion Y740-17IRH
Acer Predator Helios 700 PH717-71-7091: NVIDIA GeForce RTX 2070 Mobile, 17.30", 4.5 kg
External Review » Acer Predator Helios 700 PH717-71-7091
HP Omen 15-dh0009ng: NVIDIA GeForce RTX 2080 Max-Q, 15.60", 2.6 kg
External Review » HP Omen 15-dh0009ng
Asus ROG Strix G531GT-BQ012 : NVIDIA GeForce GTX 1650 Mobile, 15.60", 2.4 kg
External Review » Asus ROG Strix G531GT-BQ012
Alienware m15 R2-390W9: NVIDIA GeForce RTX 2070 Max-Q, 15.60", 2.2 kg
External Review » Alienware m15 R2-390W9
Razer Blade 15 RTX 2070 Max-Q, i7-9750H: NVIDIA GeForce RTX 2070 Max-Q, 15.60", 2.2 kg
External Review » Razer Blade 15 RTX 2070 Max-Q, i7-9750H
Lenovo ThinkPad X1 Extreme G2-20QV000WGE: NVIDIA GeForce GTX 1650 Max-Q, 15.60", 1.7 kg
External Review » Lenovo ThinkPad X1 Extreme G2-20QV000WGE
Acer Predator Helios 300 PH315-52-78T7: NVIDIA GeForce RTX 2060 Mobile, 15.60", 2.4 kg
External Review » Acer Predator Helios 300 PH315-52-78T7
Asus ROG Zephyrus S GX502GV-ES047T: NVIDIA GeForce RTX 2060 Mobile, 15.60", 2 kg
External Review » Asus ROG Zephyrus S GX502GV-ES047T
Lenovo ThinkPad P1 20QT000LMH : NVIDIA Quadro T1000 (Laptop), 15.60", 1.7 kg
External Review » Lenovo ThinkPad P1 20QT000LMH
Asus ZenBook Pro Duo UX581GV-H2002T: NVIDIA GeForce RTX 2060 Mobile, 15.60", 2.5 kg
External Review » Asus ZenBook Pro Duo UX581GV-H2002T
Asus ZenBook Pro Duo UX581GV-H2004R: NVIDIA GeForce RTX 2060 Mobile, 15.60", 2.5 kg
External Review » Asus ZenBook Pro Duo UX581GV-H2004R
HP Omen 17-cb0006ng: NVIDIA GeForce RTX 2070 Mobile, 17.30", 3.3 kg
External Review » HP Omen 17-cb0006ng
Lenovo Legion Y545-15-81Q6CTO1WWENMY0: NVIDIA GeForce GTX 1660 Ti Mobile, 15.60", 2.3 kg
External Review » Lenovo Legion Y545-15-81Q6CTO1WWENMY0
Lenovo Legion Y740-15IRHg-81UH001XGE: NVIDIA GeForce RTX 2060 Mobile, 15.60", 2.2 kg
External Review » Lenovo Legion Y740-15IRHg-81UH001XGE
HP Gaming Pavilion 15-dk0205ng: NVIDIA GeForce GTX 1660 Ti Mobile, 15.60", 2.3 kg
External Review » HP Gaming Pavilion 15-dk0205ng
Asus Strix G G531GT-BI7N6: NVIDIA GeForce GTX 1650 Mobile, 15.60", 2.4 kg
External Review » Asus Strix G G531GT-BI7N6
Asus ProArt StudioBook Pro X-W730G5T, i7-9750H: NVIDIA Quadro RTX 5000 (Laptop), 17.00", 2.5 kg
External Review » Asus ProArt StudioBook Pro X-W730G5T, i7-9750H
Schenker XMG Fusion 15 XFU15L19: NVIDIA GeForce RTX 2070 Max-Q, 15.60", 1.9 kg
External Review » Schenker XMG Fusion 15 XFU15L19
MSI GL75 9SEK-074XES: NVIDIA GeForce RTX 2060 Mobile, 15.60", 2.5 kg
External Review » MSI GL75 9SEK-074XES
MSI GT76 9SF-013: NVIDIA GeForce RTX 2070 Mobile, 17.30", 4.5 kg
External Review » MSI GT76 9SF-013
Asus ROG Chimera G703GXR-EV003T: NVIDIA GeForce RTX 2080 Mobile, 17.30", 4.7 kg
External Review » Asus ROG Chimera G703GXR-EV003T
Acer Predator Triton 900 PT917-71-93MW: NVIDIA GeForce RTX 2080 Mobile, 17.30", 4.5 kg
External Review » Acer Predator Triton 900 PT917-71-93MW
Dell Inspiron 15 7591, i7-9750H: NVIDIA GeForce GTX 1050 Mobile, 15.60", 1.9 kg
External Review » Dell Inspiron 15 7591, i7-9750H
Acer Predator Triton 300-15: NVIDIA GeForce GTX 1650 Mobile, 15.60", 2.3 kg
External Review » Acer Predator Triton 300-15
Asus Zephyrus S GX701GXR-H6081R: NVIDIA GeForce RTX 2080 Max-Q, 17.30", 2.7 kg
External Review » Asus Zephyrus S GX701GXR-H6081R
Alienware m15 R2 P87F: NVIDIA GeForce RTX 2080 Max-Q, 15.60", 2.2 kg
External Review » Alienware m15 R2 P87F
MSI GE75 Raider 8SG-059FR: NVIDIA GeForce RTX 2060 Mobile, 17.30", 2.6 kg
External Review » MSI GE75 Raider 8SG-059FR
MSI GP75 Leopard 9SF-1037XES: NVIDIA GeForce RTX 2070 Mobile, 17.30", 2.6 kg
External Review » MSI GP75 Leopard 9SF-1037XES
Lenovo Legion Y540-15IRH-81SY00A6SP: NVIDIA GeForce GTX 1650 Mobile, 15.60", 2.3 kg
External Review » Lenovo Legion Y540-15IRH-81SY00A6SP
HP Gaming Pavilion 15-dk0009ng: NVIDIA GeForce GTX 1660 Ti Max-Q, 15.60", 2.4 kg
External Review » HP Gaming Pavilion 15-dk0009ng
Asus ASUS ROG Strix SCAR III G731GW-XB74: NVIDIA GeForce RTX 2070 Mobile, 17.30", 2.9 kg
External Review » Asus ASUS ROG Strix SCAR III G731GW-XB74
Asus Strix Hero III G731GV: NVIDIA GeForce RTX 2060 Mobile, 17.30", 2.9 kg
External Review » Asus Strix Hero III G731GV
MSI GS65 9SF-445: NVIDIA GeForce RTX 2070 Max-Q, 15.60", 1.9 kg
External Review » MSI GS65 9SF-445
Dell XPS 15 7590-K6XWV: NVIDIA GeForce GTX 1650 Mobile, 15.60", 2 kg
External Review » Dell XPS 15 7590-K6XWV
Acer Nitro 7 AN715-51-786X: NVIDIA GeForce GTX 1660 Ti Mobile, 15.60", 2.7 kg
External Review » Acer Nitro 7 AN715-51-786X
Lenovo Legion Y740-17ICHg-81UJ001UGE: NVIDIA GeForce RTX 2070 Max-Q, 17.30", 2.9 kg
External Review » Lenovo Legion Y740-17ICHg-81UJ001UGE
Acer Nitro 5 AN517-51-70U7: NVIDIA GeForce GTX 1650 Mobile, 17.30", 2.7 kg
External Review » Acer Nitro 5 AN517-51-70U7
Lenovo Legion Y740-15ICHg-81UH0020GE: NVIDIA GeForce RTX 2080 Max-Q, 15.60", 2.2 kg
External Review » Lenovo Legion Y740-15ICHg-81UH0020GE
HP Omen X 2S 15-dg0075cl: NVIDIA GeForce RTX 2070 Max-Q, 15.60", 2.4 kg
External Review » HP Omen X 2S 15-dg0075cl
Origin PC EVO16-S i7-9750H RTX 2080 Max-Q: NVIDIA GeForce RTX 2080 Max-Q, 16.10", 2.1 kg
External Review » Origin PC EVO16-S i7-9750H RTX 2080 Max-Q
Dell G3 15 3590-G1DFD: NVIDIA GeForce GTX 1660 Ti Mobile, 15.60", 2.3 kg
External Review » Dell G3 15 3590-G1DFD
Asus ROG Strix G531GU-AL008T: NVIDIA GeForce GTX 1660 Ti Mobile, 15.60", 2.4 kg
External Review » Asus ROG Strix G531GU-AL008T
Lenovo Ideapad L340-15IRH-81LK0093MB: NVIDIA GeForce GTX 1650 Mobile, 15.60", 2.2 kg
External Review » Lenovo Ideapad L340-15IRH-81LK0093MB
MSI P75 Creator 9SE-279DE: NVIDIA GeForce RTX 2060 Mobile, 17.30", 2.3 kg
External Review » MSI P75 Creator 9SE-279DE
HP Pavilion 15-dk0042tx: NVIDIA GeForce GTX 1650 Mobile, 15.60", 2.3 kg
External Review » HP Pavilion 15-dk0042tx
HP Omen 15-dh0105tx : NVIDIA GeForce RTX 2060 Mobile, 15.60", 2.4 kg
External Review » HP Omen 15-dh0105tx
Lenovo Legion Y545-15-81T20005US: NVIDIA GeForce GTX 1650 Mobile, 15.60", 2.3 kg
External Review » Lenovo Legion Y545-15-81T20005US
MSI WS75 9TL-496US: NVIDIA Quadro RTX 4000 (Laptop), 17.30", 2.3 kg
External Review » MSI WS75 9TL-496US
HP Omen X 2S 15: NVIDIA GeForce RTX 2080 Mobile, 15.60", 2.4 kg
External Review » HP Omen X 2S 15
Asus ROG Strix G531GT-BQ020: NVIDIA GeForce GTX 1650 Mobile, 15.60", 2.4 kg
External Review » Asus ROG Strix G531GT-BQ020
Acer Predator Helios 300 PH315-52-78VL: NVIDIA GeForce GTX 1660 Ti Mobile, 15.60", 2.5 kg
External Review » Acer Predator Helios 300 PH315-52-78VL
Aorus 15-SA: NVIDIA GeForce GTX 1660 Ti Mobile, 15.60", 2.1 kg
External Review » Aorus 15-SA
Acer Predator Helios 300 PH315-52-71KD: NVIDIA GeForce RTX 2060 Mobile, 15.60", 2.5 kg
External Review » Acer Predator Helios 300 PH315-52-71KD
Lenovo Legion Y540-15IRH-81SX00B2GE: NVIDIA GeForce GTX 1660 Ti Mobile, 15.60", 2.2 kg
External Review » Lenovo Legion Y540-15IRH-81SX00B2GE
Origin PC EVO17-S 2019 (i7-9750H, RTX 2080 Max-Q): NVIDIA GeForce RTX 2080 Max-Q, 17.30", 2.5 kg
External Review » Origin PC EVO17-S 2019 (i7-9750H, RTX 2080 Max-Q)
Acer Nitro 7 AN715-51-752B: NVIDIA GeForce GTX 1650 Mobile, 15.60", 2.7 kg
External Review » Acer Nitro 7 AN715-51-752B
Acer Predator Helios 300 PH317-53-75YB: NVIDIA GeForce RTX 2070 Mobile, 17.30", 2.9 kg
External Review » Acer Predator Helios 300 PH317-53-75YB
Acer ConceptD 7 CN715-71-743N: NVIDIA GeForce RTX 2060 Mobile, 15.60", 2.2 kg
External Review » Acer ConceptD 7 CN715-71-743N
Asus ROG Zephyrus M15 GU502GU-XB74: NVIDIA GeForce GTX 1660 Ti Mobile, 15.60", 2 kg
External Review » Asus Zephyrus M GU502GU-XB74
Asus Strix Scar 3 G531GW-DB76: NVIDIA GeForce RTX 2070 Mobile, 15.60", 2.6 kg
External Review » Asus Strix Scar 3 G531GW-DB76
Acer Predator Triton 900 PT917-71-71C: NVIDIA GeForce RTX 2080 Mobile, 17.30", 4.4 kg
External Review » Acer Predator Triton 900 PT917-71-71C
Acer Predator Triton 900 PT917-71-79PF: NVIDIA GeForce RTX 2080 Mobile, 17.30", 4.1 kg
External Review » Acer Predator Triton 900 PT917-71-79PF
Asus ROG Strix HERO III G531GW-ES013T: NVIDIA GeForce RTX 2070 Mobile, 15.60", 2.4 kg
External Review » Asus ROG Strix HERO III G531GW-ES013T
Hyperbook SL504: NVIDIA GeForce RTX 2060 Mobile, 15.60", 2.4 kg
External Review » Hyperbook SL504
Acer Predator Triton 500 PT515-51-71PZ: NVIDIA GeForce RTX 2070 Max-Q, 15.60", 2.1 kg
External Review » Acer Predator Triton 500 PT515-51-71PZ
Lenovo Legion Y540 15-IRH-81SY001KSB: NVIDIA GeForce GTX 1650 Mobile, 15.60", 2.3 kg
External Review » Lenovo Legion Y540 15-IRH-81SY001KSB
Asus Zephyrus S GX502GV-PB74: NVIDIA GeForce RTX 2060 Mobile, 15.60", 2 kg
External Review » Asus Zephyrus S GX502GV-PB74
Dell G5 15 5590-FJJN8: NVIDIA GeForce RTX 2060 Mobile, 15.60", 2.8 kg
External Review » Dell G5 15 5590-FJJN8
Lenovo Legion Y540-15IRH: NVIDIA GeForce RTX 2060 Mobile, 15.60", 2.3 kg
External Review » Lenovo Legion Y540-15IRH
Gigabyte Aero 15 OLED XA: NVIDIA GeForce RTX 2070 Max-Q, 15.60", 2.2 kg
External Review » Gigabyte Aero 15 OLED XA
Acer Nitro 5 AN515-54-73KT: NVIDIA GeForce GTX 1650 Mobile, 15.60", 2.7 kg
External Review » Acer Nitro 5 AN515-54-73KT
Acer Nitro 5 AN515-54-72T8: NVIDIA GeForce GTX 1660 Ti Mobile, 15.60", 2.7 kg
External Review » Acer Nitro 5 AN515-54-72T8
Asus ROG Strix G G531GU-AL061T: NVIDIA GeForce GTX 1660 Ti Mobile, 15.60", 2.4 kg
External Review » Asus ROG Strix G G531GU-AL061T
Asus ROG Strix G G531GU-AL001: NVIDIA GeForce GTX 1660 Ti Mobile, 15.60", 2.4 kg
External Review » Asus ROG Strix G G531GU-AL001
Asus ROG Zephyrus S GX701GXR-EV013R: NVIDIA GeForce RTX 2080 Max-Q, 17.30", 2.7 kg
External Review » Asus ROG Zephyrus S GX701GXR-EV013R
Asus ROG Strix Scar III G531GW-AZ015T: NVIDIA GeForce RTX 2070 Mobile, 15.60", 2.6 kg
External Review » Asus ROG Strix Scar III G531GW-AZ015T
Asus ROG Strix G531GW-AL023T: NVIDIA GeForce RTX 2070 Mobile, 15.60", 2.6 kg
External Review » Asus ROG Strix G531GW-AL023T
Gigabyte Aorus 7 SA: NVIDIA GeForce GTX 1660 Ti Mobile, 17.30", 2.5 kg
External Review » Gigabyte Aorus 7 SA
MSI GF75 Thin 9SC-039XES: NVIDIA GeForce GTX 1650 Max-Q, 15.60", 2.2 kg
External Review » MSI GF75 Thin 9SC-039XES
MSI GP75 Leopard 9SE-660XES: NVIDIA GeForce RTX 2060 Mobile, 17.30", 2.6 kg
External Review » MSI GP75 Leopard 9SE-660XES
MSI GS75 Stealth 9SD-604ES: NVIDIA GeForce GTX 1660 Ti Mobile, 17.30", 2.3 kg
External Review » MSI GS75 Stealth 9SD-604ES
Asus ROG Zephyrus S GX502GW-ES002: NVIDIA GeForce RTX 2070 Mobile, 15.60", 2 kg
External Review » Asus ROG Zephyrus S GX502GW-ES002
Acer Predator Helios 300 PH315-52-79TY: NVIDIA GeForce GTX 1660 Ti Mobile, 15.60", 2.3 kg
External Review » Acer Predator Helios 300 PH315-52-79TY
Acer Aspire Nitro 5 AN517-51-754T: NVIDIA GeForce GTX 1660 Ti Mobile, 17.30", 2.7 kg
External Review » Acer Aspire Nitro 5 AN517-51-754T
Asus ROG Zephyrus M15 GU502GV-BI7N10: NVIDIA GeForce RTX 2060 Mobile, 15.60", 1.9 kg
External Review » Asus Zephyrus M GU502GV-BI7N10
Asus Strix G531GT-BI7N6: NVIDIA GeForce GTX 1650 Mobile, 15.60", 2.4 kg
External Review » Asus Strix G531GT-BI7N6
Razer Blade Pro 17 RTX 2070 Max-Q : NVIDIA GeForce RTX 2070 Max-Q, 17.30", 2.8 kg
External Review » Razer Blade Pro 17 RTX 2070 Max-Q
Dell G7 15 7590 (i7-9750H, RTX 2060): NVIDIA GeForce RTX 2060 Mobile, 15.60", 2.5 kg
External Review » Dell G7 15 7590 (i7-9750H, RTX 2060)
Schenker XMG Pro 17-M19msb: NVIDIA GeForce RTX 2070 Mobile, 17.30", 2.9 kg
External Review » Schenker XMG Pro 17-M19msb
Schenker XMG Pro 15-M19mbm: NVIDIA GeForce RTX 2060 Mobile, 15.60", 2.5 kg
External Review » Schenker XMG Pro 15-M19mbm
Acer Predator Helios 300 PH317-53-79S0: NVIDIA GeForce RTX 2070 Mobile, 17.30", 2.9 kg
External Review » Acer Predator Helios 300 PH317-53-79S0
MSI GE75 Raider 9SG-417: NVIDIA GeForce RTX 2080 Mobile, 17.30", 2.6 kg
External Review » MSI GE75 Raider 9SG-417
Acer Predator Triton 500 PT515-51-70GK: NVIDIA GeForce RTX 2070 Max-Q, 15.60", 2.1 kg
External Review » Acer Predator Triton 500 PT515-51-70GK
Asus ROG Zephyrus S GX502GW-ES010T: NVIDIA GeForce RTX 2070 Mobile, 15.60", 2 kg
External Review » Asus ROG Zephyrus S GX502GW-ES010T
Razer Blade Pro 17 RTX 2060: NVIDIA GeForce RTX 2060 Mobile, 17.30", 2.8 kg
External Review » Razer Blade Pro 17 RTX 2060
Medion Erazer X17805-MD61499: NVIDIA GeForce RTX 2070 Mobile, 17.30", 2.6 kg
External Review » Medion Erazer X17805-MD61499
MSI GS75 9SE-278 Stealth: NVIDIA GeForce RTX 2060 Mobile, 17.30", 2.3 kg
External Review » MSI GS75 9SE-278 Stealth
MSI GE75 Raider 9SE-402NL: NVIDIA GeForce RTX 2060 Mobile, 17.30", 2.6 kg
External Review » MSI GE75 Raider 9SE-402NL
MSI GS75 Stealth 9SG: NVIDIA GeForce RTX 2080 Max-Q, 17.30", 2.3 kg
External Review » MSI GS75 Stealth 9SG
Asus ROG Strix Scar III G531GW-ES081T: NVIDIA GeForce RTX 2070 Mobile, 15.60", 2.6 kg
External Review » Asus ROG Strix Scar III G531GW-ES081T
Asus ROG Strix G G731GU-EV032T: NVIDIA GeForce GTX 1660 Ti Mobile, 17.30", 2.9 kg
External Review » Asus ROG Strix G G731GU-EV032T
Razer Blade Pro 17 RTX 2080 Max-Q: NVIDIA GeForce RTX 2080 Max-Q, 17.30", 2.8 kg
External Review » Razer Blade Pro 17 RTX 2080 Max-Q
Acer Predator Helios 300 PH317-53-79Y1: NVIDIA GeForce RTX 2060 Mobile, 17.30", 2.9 kg
External Review » Acer Predator Helios 300 PH317-53-79Y1
Acer Predator Helios 300 PH315-52-73XY: NVIDIA GeForce RTX 2060 Mobile, 15.60", 2.4 kg
External Review » Acer Predator Helios 300 PH315-52-73XY
Acer Aspire Nitro 5 AN515-54-72J1: NVIDIA GeForce GTX 1650 Mobile, 15.60", 2.3 kg
External Review » Acer Aspire Nitro 5 AN515-54-72J1
HP Pavilion 17-cd0228ng: NVIDIA GeForce GTX 1660 Ti Mobile, 17.30", 2.8 kg
External Review » HP Pavilion 17-cd0228ng
HP Omen 17-cb0005ng: NVIDIA GeForce RTX 2070 Mobile, 17.30", 3.3 kg
External Review » HP Omen 17-cb0005ng
Asus ZenBook Pro Duo UX481: NVIDIA GeForce MX250, 14.00", 1.8 kg
External Review » Asus ZenBook Pro Duo UX481
MSI GF63 Thin 9SC-047XES: NVIDIA GeForce GTX 1650 Mobile, 15.60", 1.9 kg
External Review » MSI GF63 Thin 9SC-047XES
Asus ROG Zephyrus M15 GU502GU-ES001T : NVIDIA GeForce GTX 1660 Ti Mobile, 15.60", 2 kg
External Review » Asus Zephyrus M GU502GU-ES001T
Aorus 15-XA-F74CDW: NVIDIA GeForce RTX 2070 Mobile, 15.60", 2.4 kg
External Review » Aorus 15-XA-F74CDW
Gigabyte Aero 15 Classic-XA: NVIDIA GeForce RTX 2070 Max-Q, 15.60", 2.1 kg
External Review » Gigabyte Aero 15 Classic-XA
Gigabyte Aero 15 Classic-SA-F74ADW: NVIDIA GeForce GTX 1660 Ti Mobile, 15.60", 2 kg
External Review » Gigabyte Aero 15 Classic-SA-F74ADW
Asus Zephyrus S GX502GW: NVIDIA GeForce RTX 2070 Mobile, 15.60", 2.1 kg
External Review » Asus Zephyrus S GX502GW
Acer Aspire Nitro 7 AN715-51-77D0: NVIDIA GeForce GTX 1660 Ti Mobile, 15.60", 2.7 kg
External Review » Acer Aspire Nitro 7 AN715-51-77D0
Asus Strix Scar III G531GW-AZ062T: NVIDIA GeForce RTX 2070 Mobile, 15.60", 2.4 kg
External Review » Asus Strix Scar III G531GW-AZ062T
Asus Zephyrus S GX502GW-ES006R: NVIDIA GeForce RTX 2070 Mobile, 15.60", 2 kg
External Review » Asus Zephyrus S GX502GW-ES006R
Acer Aspire Nitro 5 AN515-54-72B7: NVIDIA GeForce GTX 1660 Ti Mobile, 15.60", 2.3 kg
External Review » Acer Aspire Nitro 5 AN515-54-72B7
Acer ConceptD 7: NVIDIA GeForce RTX 2080 Max-Q, 15.60", 2.1 kg
External Review » Acer ConceptD 7
Acer Predator Triton 900 PT917-71-76VT: NVIDIA GeForce RTX 2080 Mobile, 17.30", 4.4 kg
External Review » Acer Predator Triton 900 PT917-71-76VT
Razer Blade 15 RTX 2080 Max-Q: NVIDIA GeForce RTX 2080 Max-Q, 15.60", 2.2 kg
External Review » Razer Blade 15 RTX 2080 Max-Q
Asus ProArt StudioBook Pro 15 W500G5T: NVIDIA Quadro RTX 5000 Max-Q, 15.60", 2 kg
» The Asus ProArt StudioBook Pro 15: 5000 Euros (~$5908) is too much money for a workstation without a Thunderbolt 3 port
Acer ConceptD 3 Pro CN315-71P-73W1: NVIDIA Quadro T1000 (Laptop), 15.60", 2.4 kg
» No Thunderbolt 3 for Acer's workstation - The Acer ConceptD 3 Pro CN315-71P in review
Asus ProArt StudioBook Pro 17 W700G3T: NVIDIA Quadro RTX 3000 Max-Q, 17.00", 2.5 kg
» The Asus StudioBook Pro 17 offers plenty of performance, but is hampered by some details
Acer ConceptD 5 CN517-71-74YA: NVIDIA GeForce RTX 2060 Mobile, 17.30", 2.8 kg
» Acer ConceptD 5 17 inch: Good is not good enough
Lenovo Legion Y740-17IRHg-81UJ001VGE: NVIDIA GeForce RTX 2080 Max-Q, 17.30", 3 kg
» Enough performance for the latest games - Lenovo Legion Y740-17IRHg in review
Schenker XMG Pro 17 PB71RD-G: NVIDIA GeForce RTX 2060 Mobile, 17.30", 2.8 kg
» Schenker XMG Pro 17: Simple gaming laptop with powerful components
Schenker XMG Pro 15: NVIDIA GeForce RTX 2070 Mobile, 15.60", 2.5 kg
» Schenker XMG Pro 15: A lot of power but annoying fans
Lenovo ThinkPad X1 Extreme 2019 20QV000WGE: NVIDIA GeForce GTX 1650 Mobile, 15.60", 1.7 kg
» Lenovo ThinkPad X1 Extreme Gen 2: A multimedia laptop that succeeds in being worse than its predecessor
Schenker XMG Core 15 GK5CP6V: NVIDIA GeForce GTX 1660 Ti Mobile, 15.60", 2 kg
» Good Price-Performance Ratio: Schenker XMG Core 15 (Tongfang GK5CP6V)
Apple MacBook Pro 16 2019 Base 5300M: AMD Radeon Pro 5300M, 16.00", 2 kg
» B&H offers US$100 off some new 16GB MacBook Pro 16-inch SKUs
» The wait is over: new 16-inch MacBook Pro official with new Magic Keyboard, up to 64 GB RAM and 8 TB of SSD storage
Lenovo ThinkPad X1 Extreme 2019 20QV000WGE: NVIDIA GeForce GTX 1650 Mobile, 15.60", 1.7 kg
» ThinkPad X1 Extreme 2019: 4K panel costs almost 50% battery life
Apple MacBook Pro 16 2019 Base 5300M: AMD Radeon Pro 5300M, 16.00", 2 kg
» Placeholders or products: Newly discovered icons for the upcoming 16-inch MacBook Pro fall flat at first sight