Lenovo Legion Y540-15IRH Laptop Review: A good gaming laptop with a GeForce GTX 1660 Ti GPU

The Legion Y540-15IRH is back again, with us already having reviewed the GeForce RTX 2060 version earlier this month. Our first review unit demonstrated that Lenovo had made improvements to the chassis and cooling system compared to the Legion Y530 while delivering the usual bump in performance between generations too. This model also came with 16 GB of RAM, a 1 TB SSD, a 2 TB HDD and an Intel Core i7-9750H, the combination of which made for a decent 15.6-inch gaming laptop.
Now it is the turn of its cheaper sibling, specifically the Y540-15IRH-81SX00B2GE, which retails for around 20% less than our first review unit at 1,400 Euros (~US$1,565). The device retains the CPU and 16 GB of RAM of our first review unit, although Lenovo has made some cutbacks to keep costs down. The GeForce GTX 1660 Ti takes over GPU responsibilities from the GeForce RTX 2060, with Lenovo including just a 512 GB SSD too. There is also a Core i5-9300H-powered model that costs less than 1,000 Euros (~US$1,118) online, but this also comes with less memory than either of our review units.
We shall compare the Legion Y540-15IRH against its GeForce RTX 2060-powered sibling, along with other comparably priced 15.6-inch gaming laptops like the ASUS ROG Strix G GL531GV, CUK Model Z and HP Gaming Pavilion 15. You can add more laptops from our database to the comparison tables below too.
Case
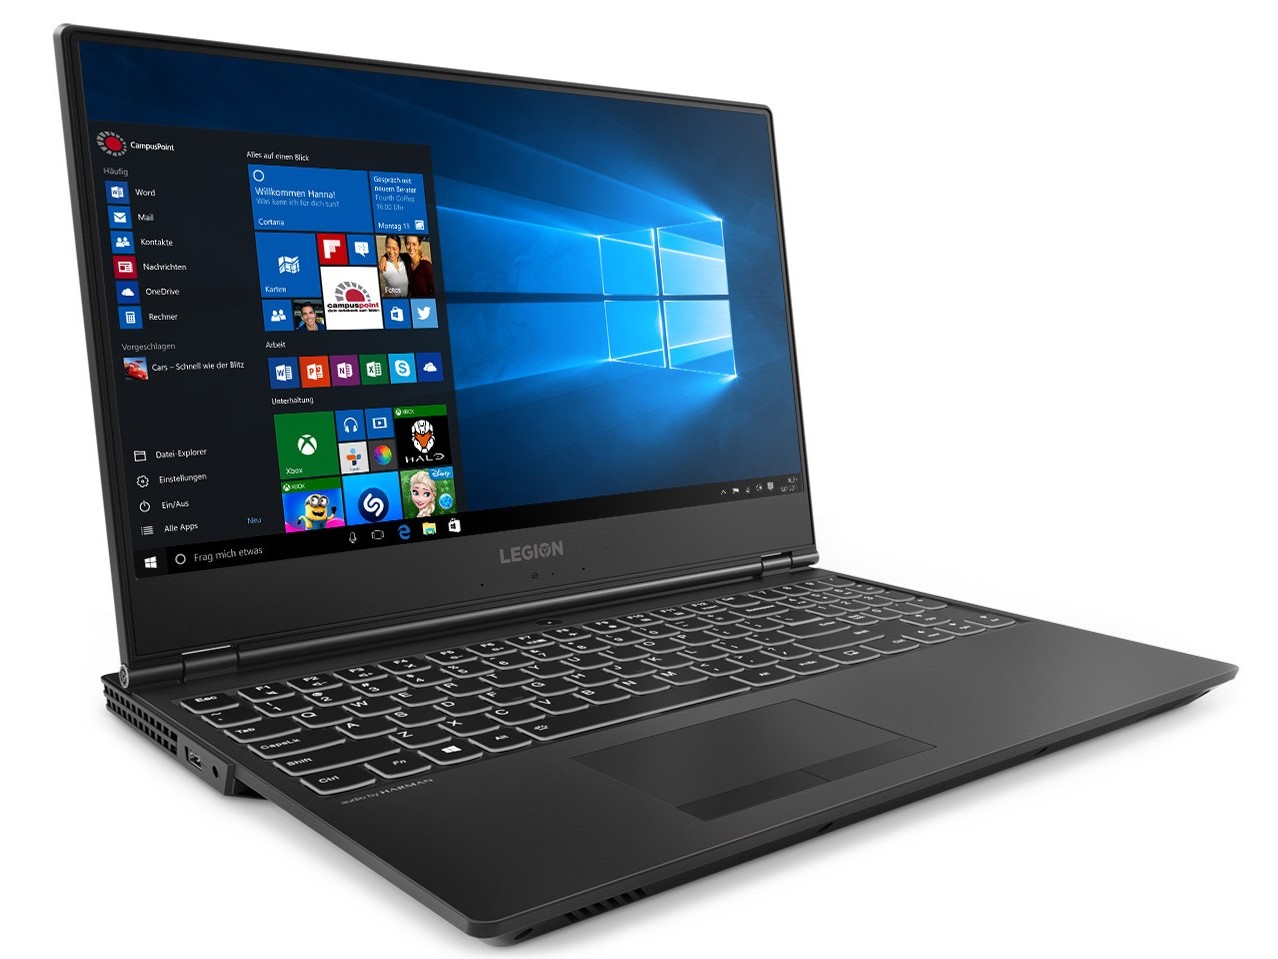
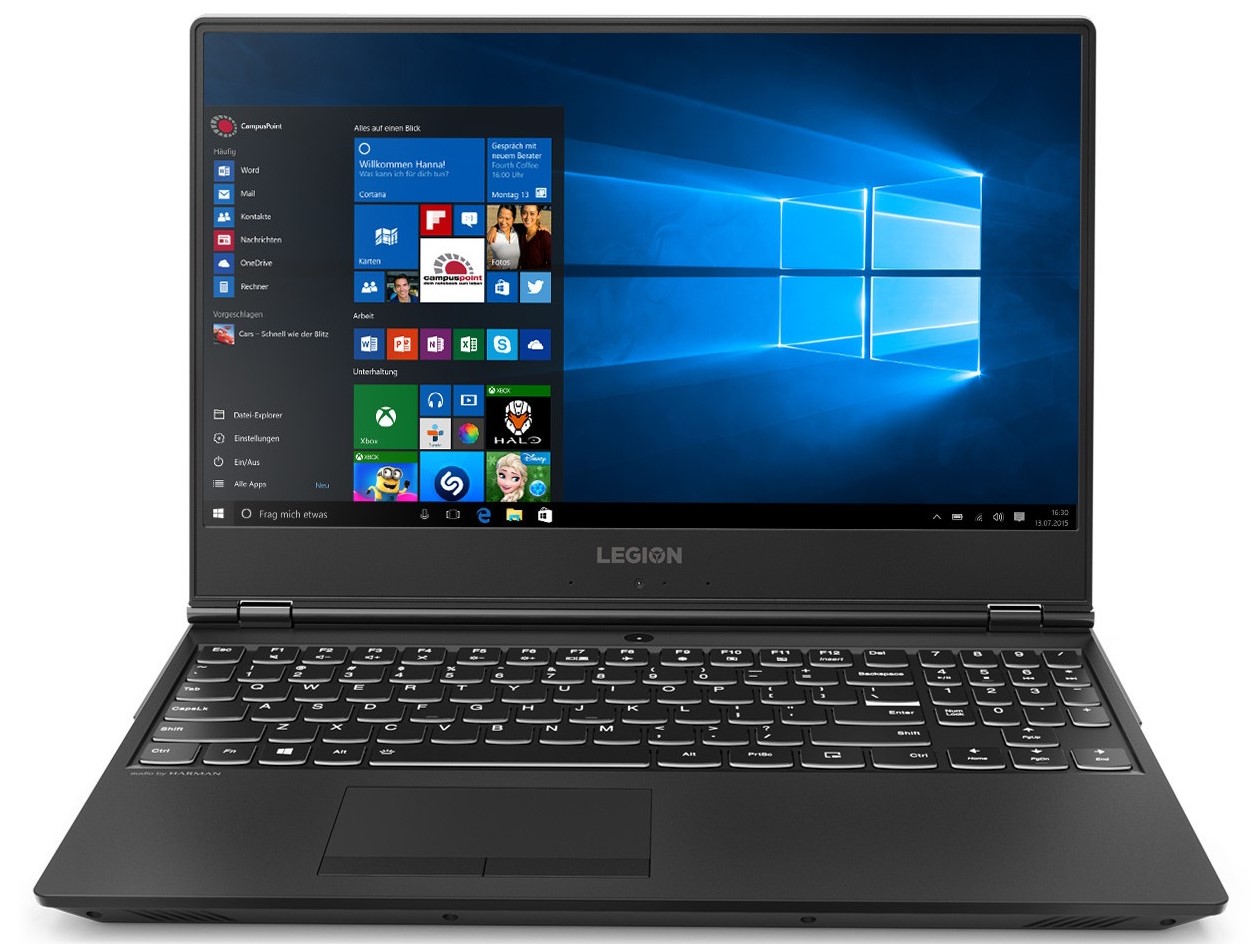
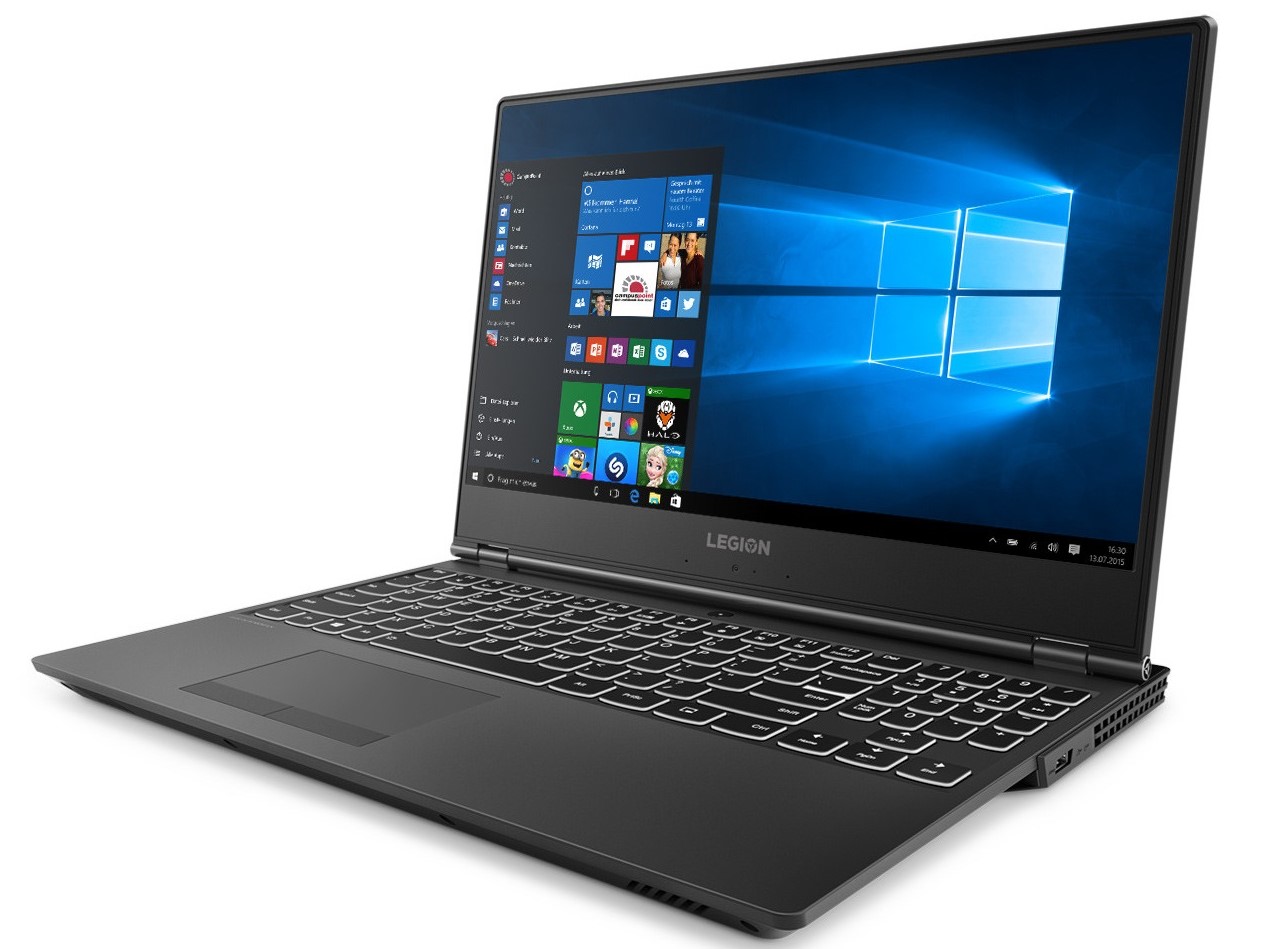
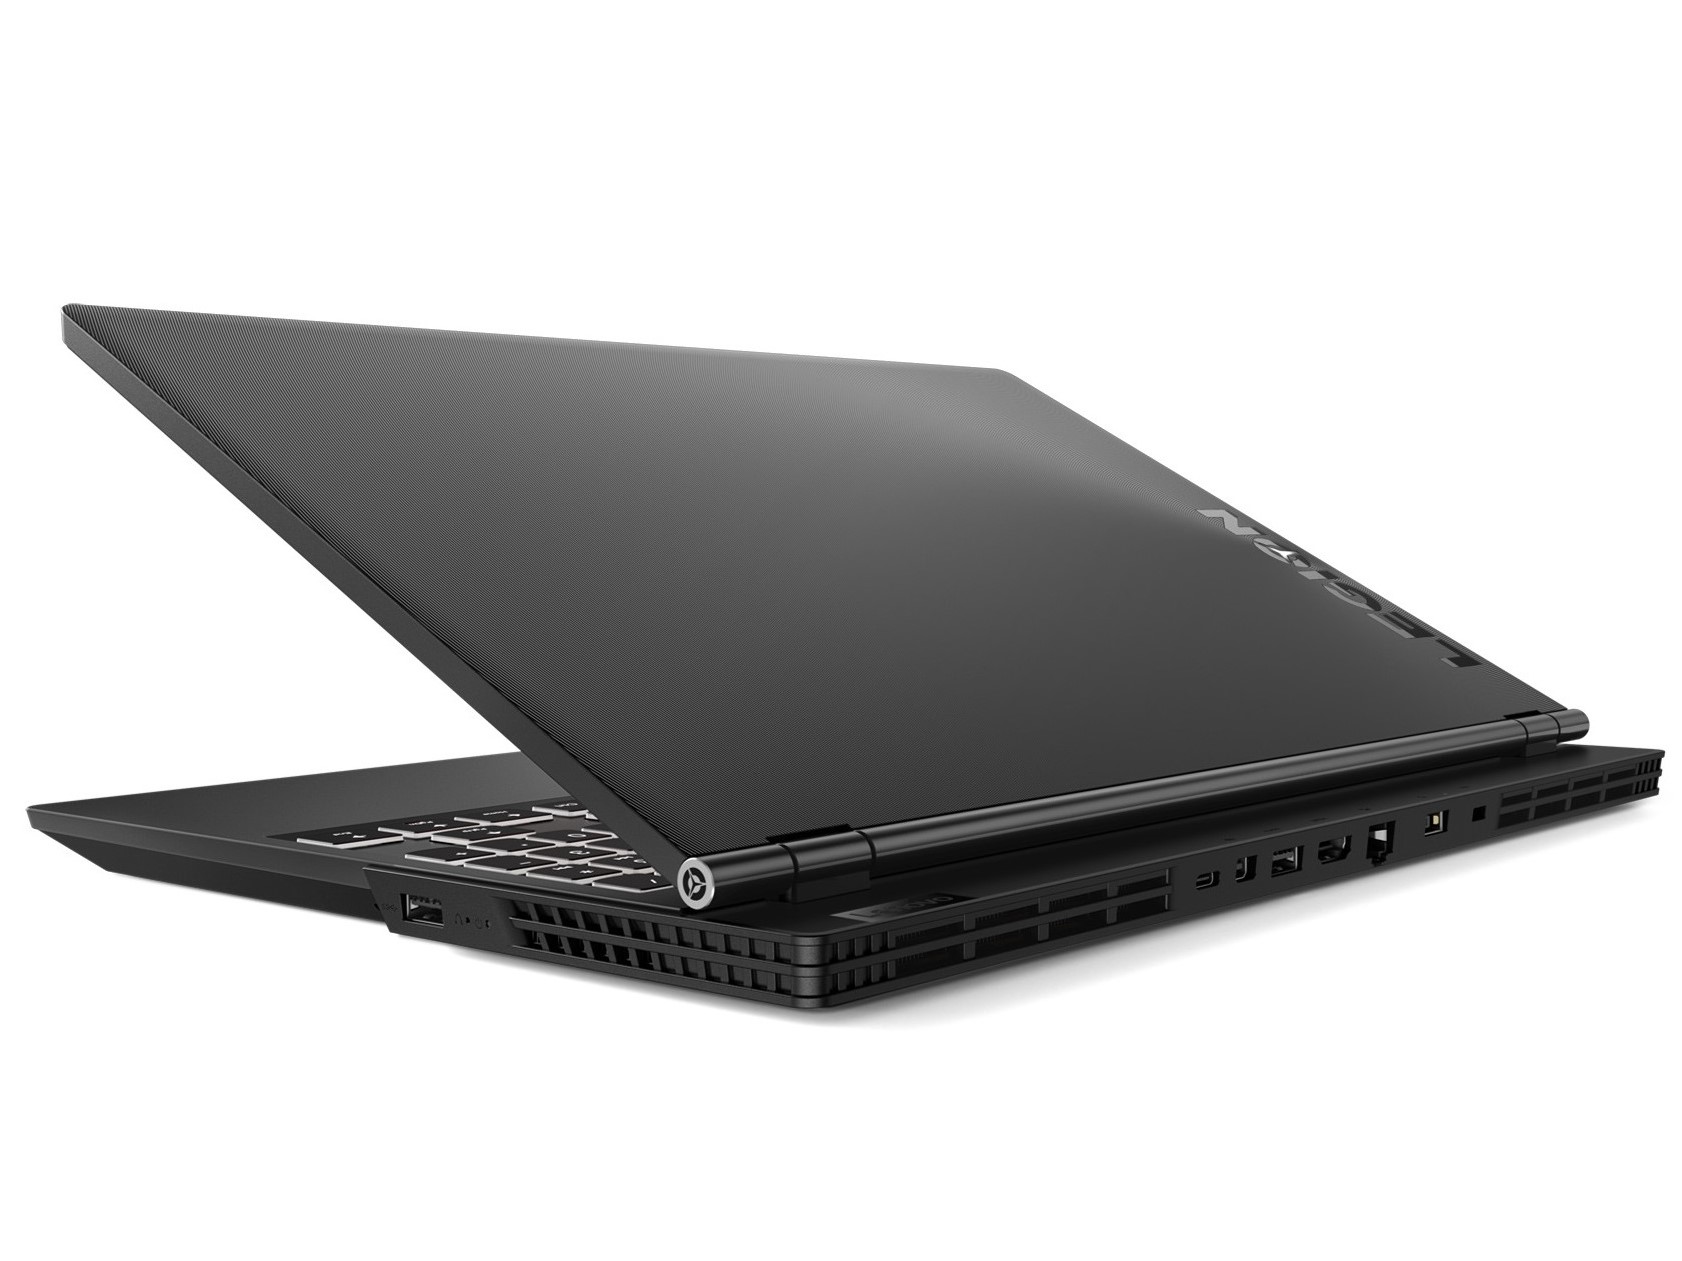
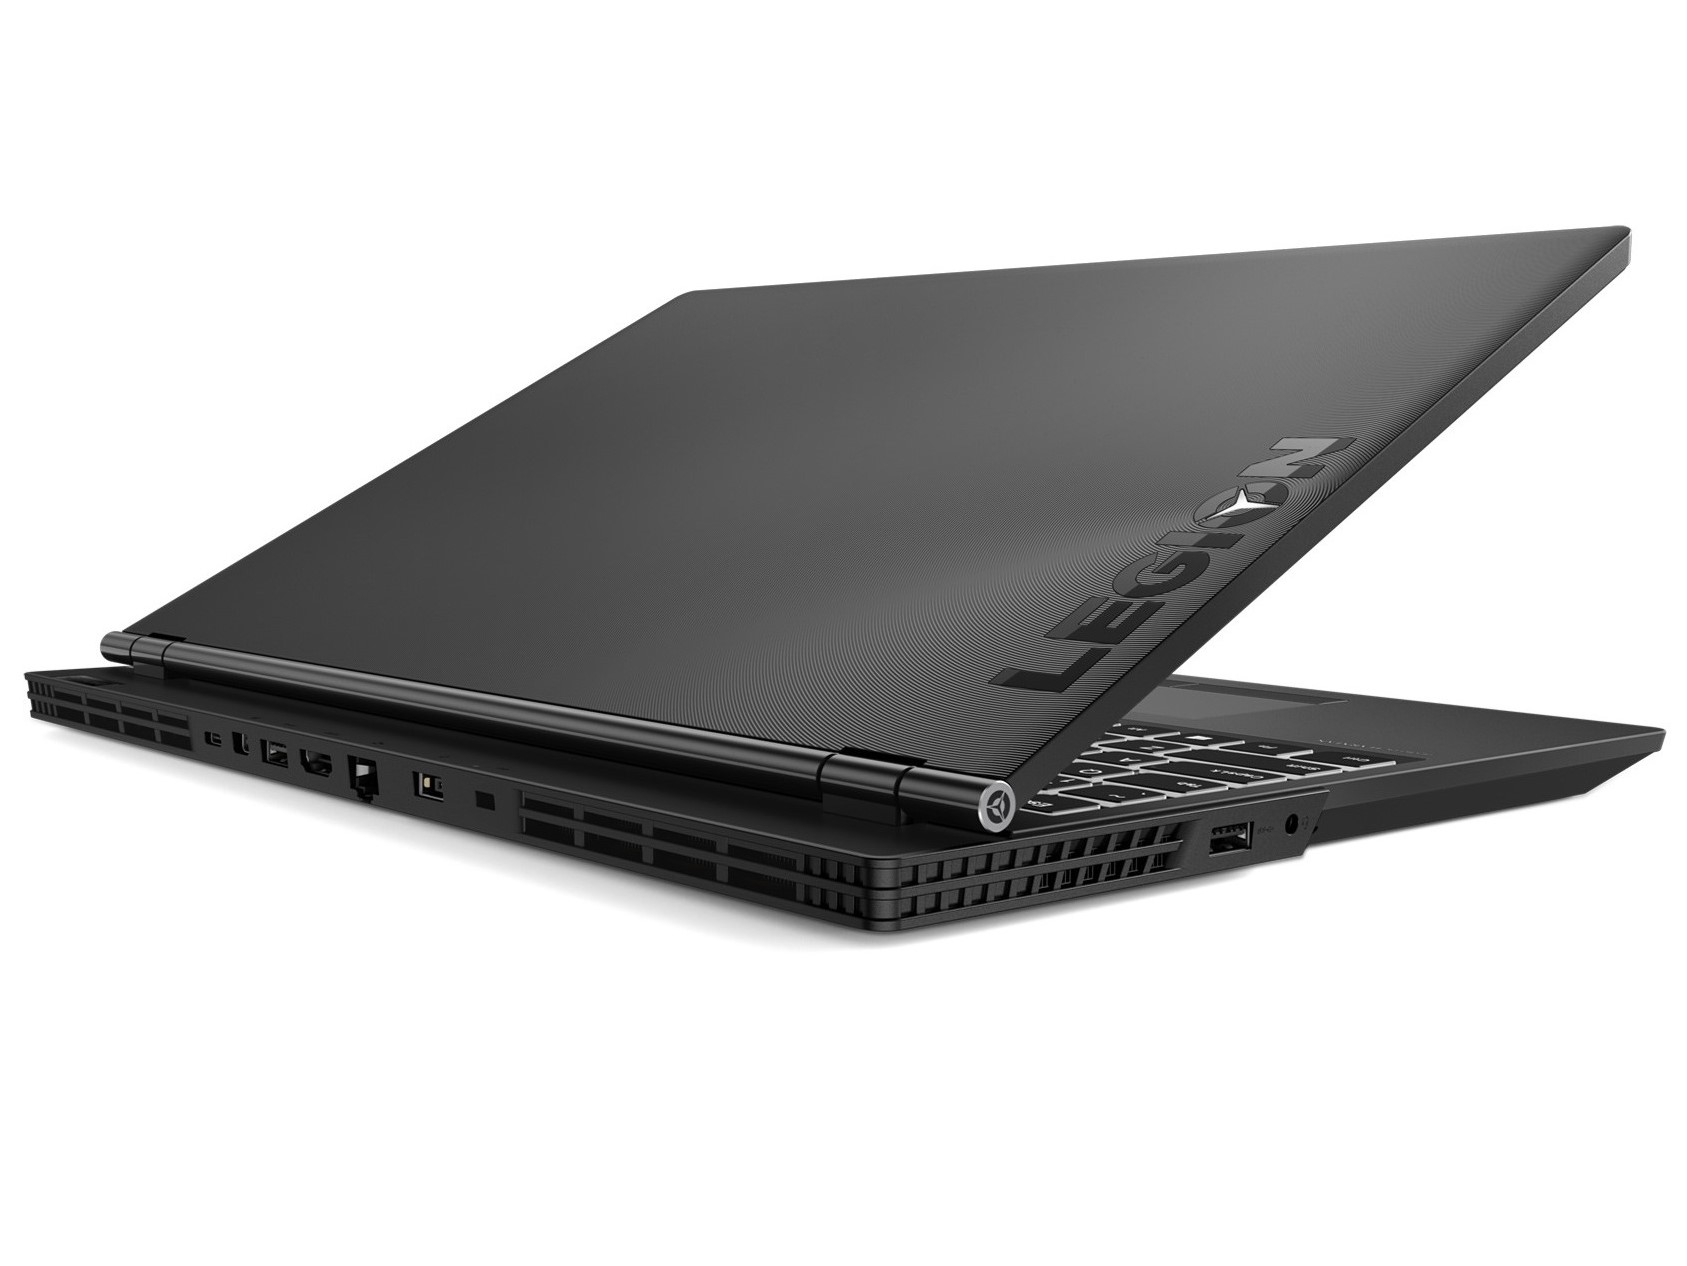
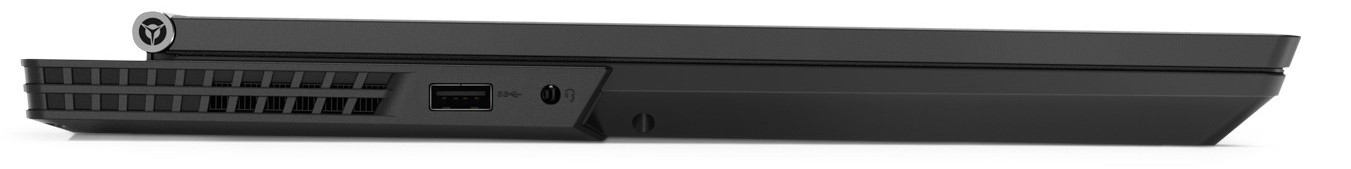
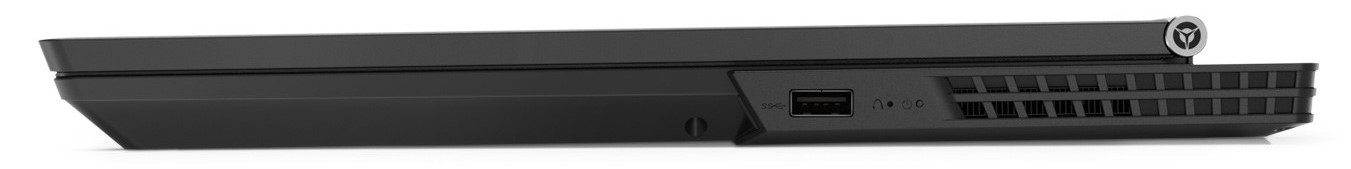
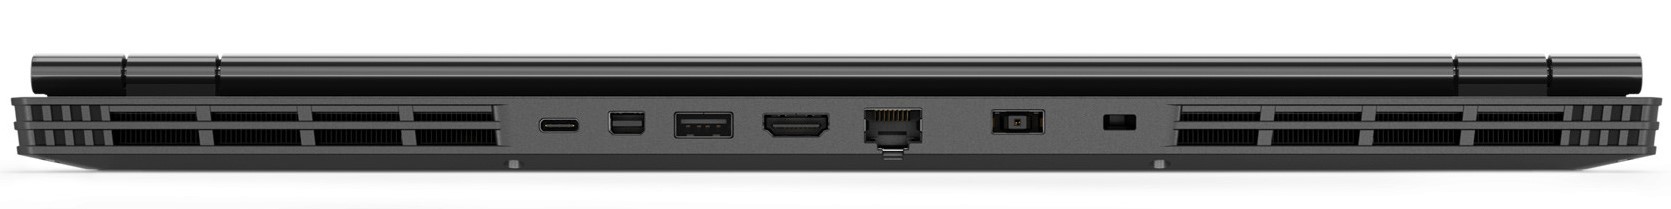
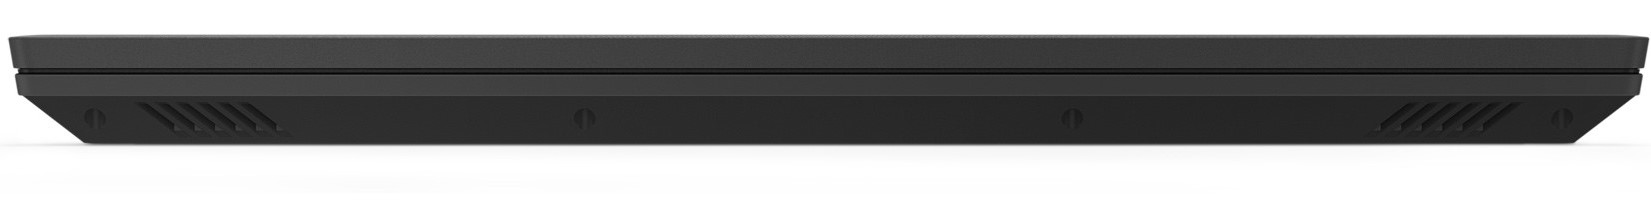
The Legion Y540-15IRH has the same design and I/O as its GeForce RTX 2060 sibling. Please see our first Legion Y540-15IRH review for our thoughts on these areas.
Connectivity
Communication
The Y540-15IRH comes with an Intel Wireless-AC 9560 module that supports all modern Wi-Fi standards up to IEEE 802.11ac. The chip utilises the current Bluetooth 5.0 too. The 9560 also has a 2x2 MIMO antenna, which allows our review unit to average over 600 Mb/s in both the iperf3 Client Wi-Fi tests that we conducted. The device finished in the midfield of our comparison tables and 9% off its GeForce RTX 2060-powered sibling, or approximately 50 Mb/s.
Accessories
The Y540-15IRH comes with only one accessory, with Lenovo including just a 230 W power supply in the box. The company does not sell any Y540-15IRH specific accessories either, although you can buy general or Legion-branded accessories like bags and rucksacks on its website.
Maintenance
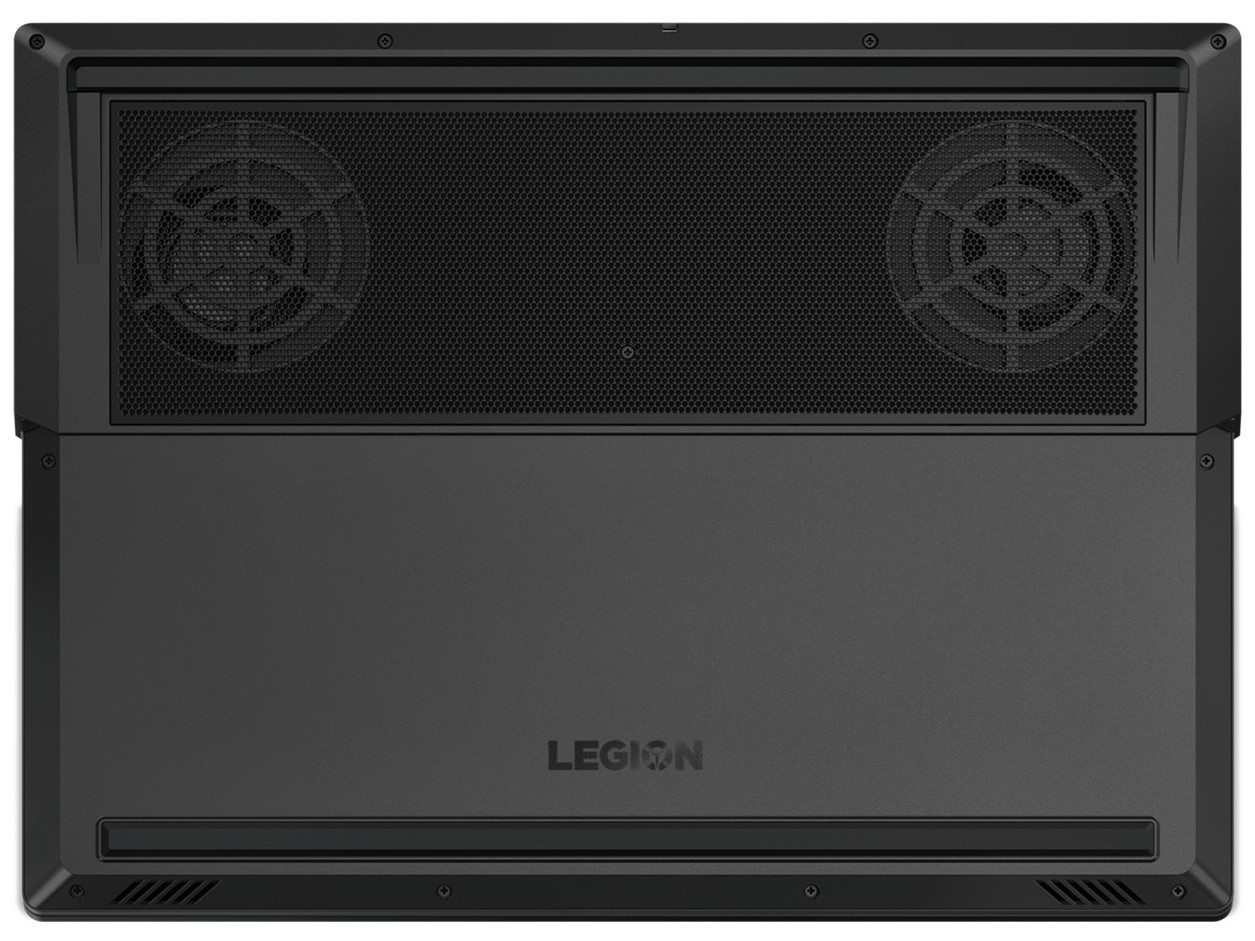
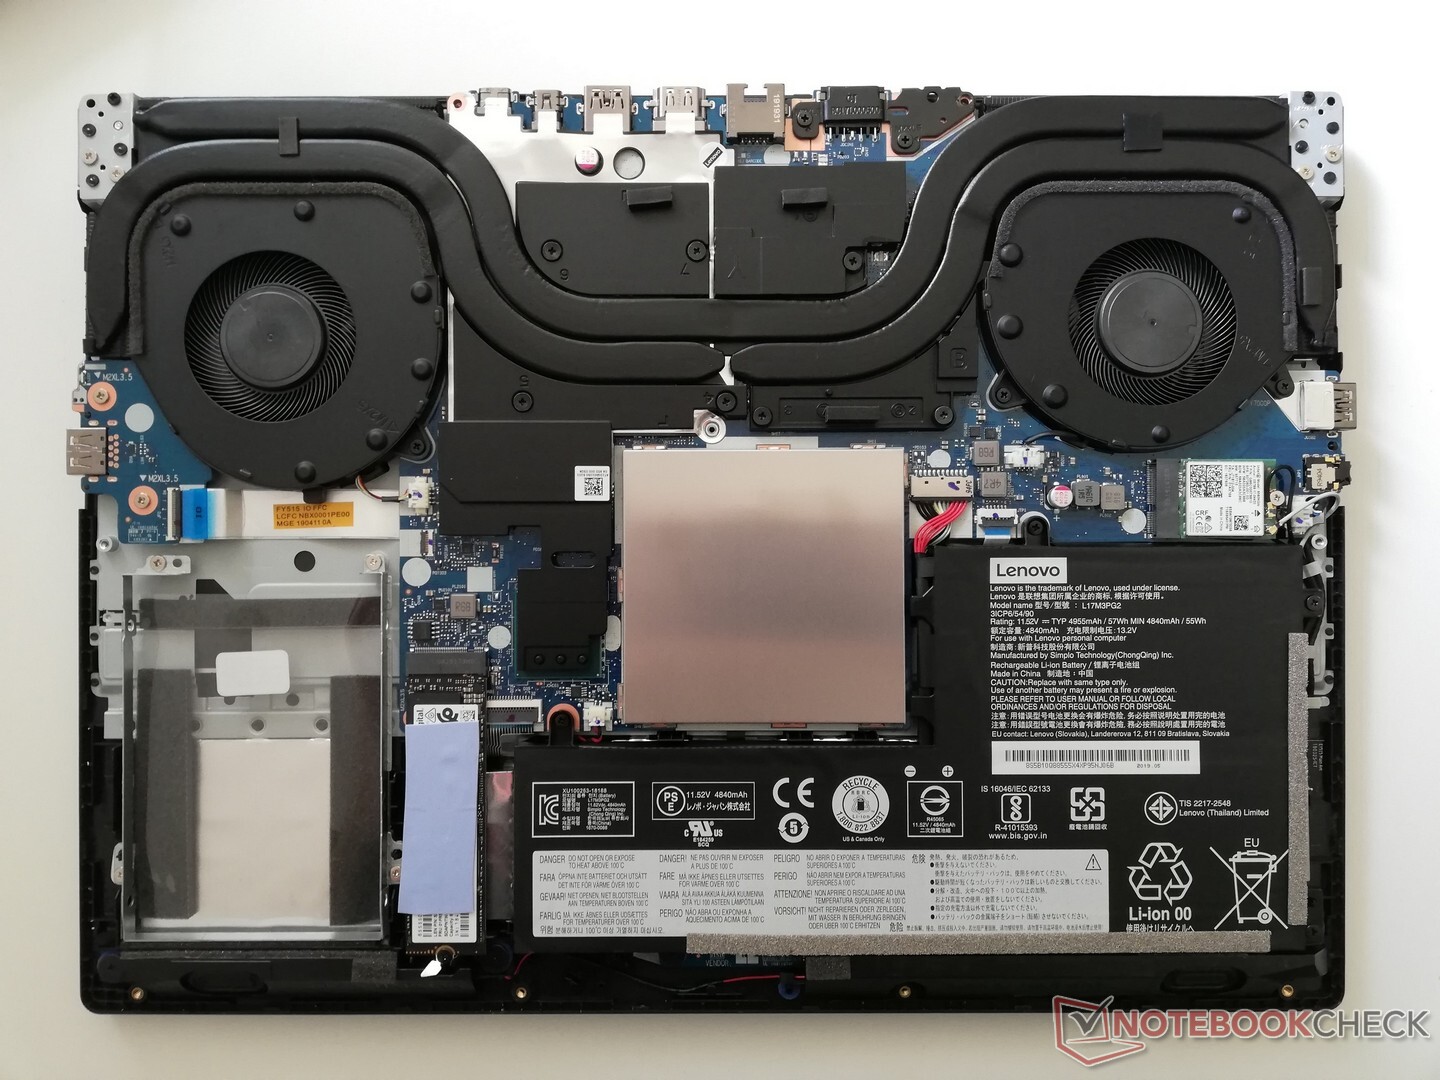
The Y540-15IRH does not have a maintenance cover for accessing the RAM or SSD as other laptops do, but the device is still easy to repair or maintain, nonetheless. Lenovo secures the bottom cover to the rest of the chassis with several screws, making it easy to access most internal components. Please keep in mind that Lenovo also uses several plastic clips to keep the cover in place, which are easy to break. Hence, we would recommend using a flat plastic tool like a spudger to pry the cover free to minimise the chance of doing any damage. Removing the cover reveals the cooling system, battery, drive bays, SODIMM slots and Wi-Fi card, as you can see from the photo below.
Warranty
The Y540-15IRH comes with a 24-month limited manufacturer’s warranty. Please see our Guarantees, Return Policies & Warranties FAQ for country-specific information.
Input Devices
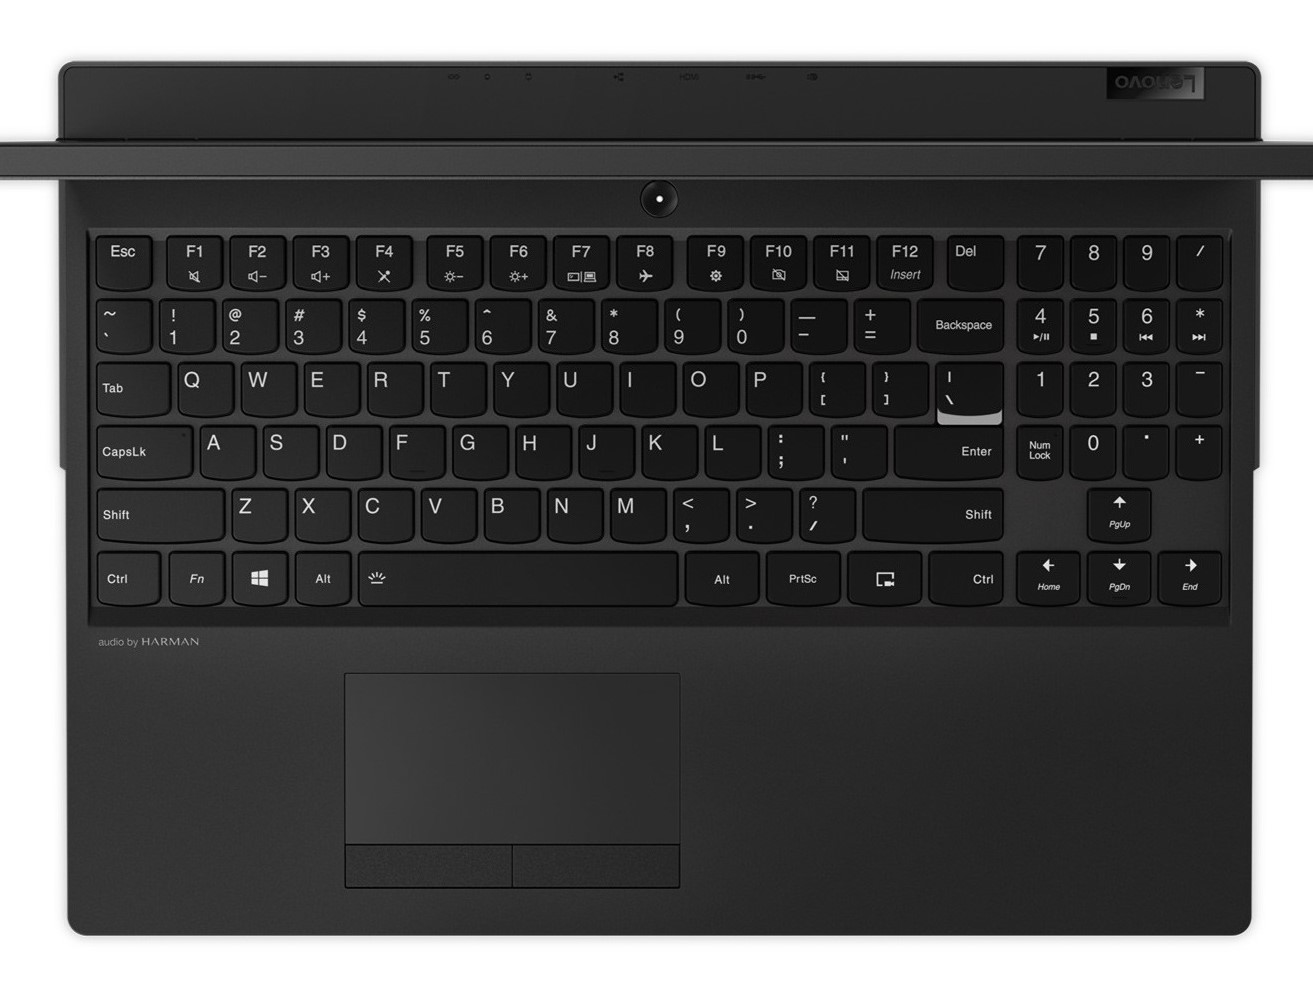
As we mentioned earlier, our review unit has the same keyboard and trackpad as the previous Y540-15IRH that we tested. Please see our original review for our thoughts on the keyboard and trackpad.
Display

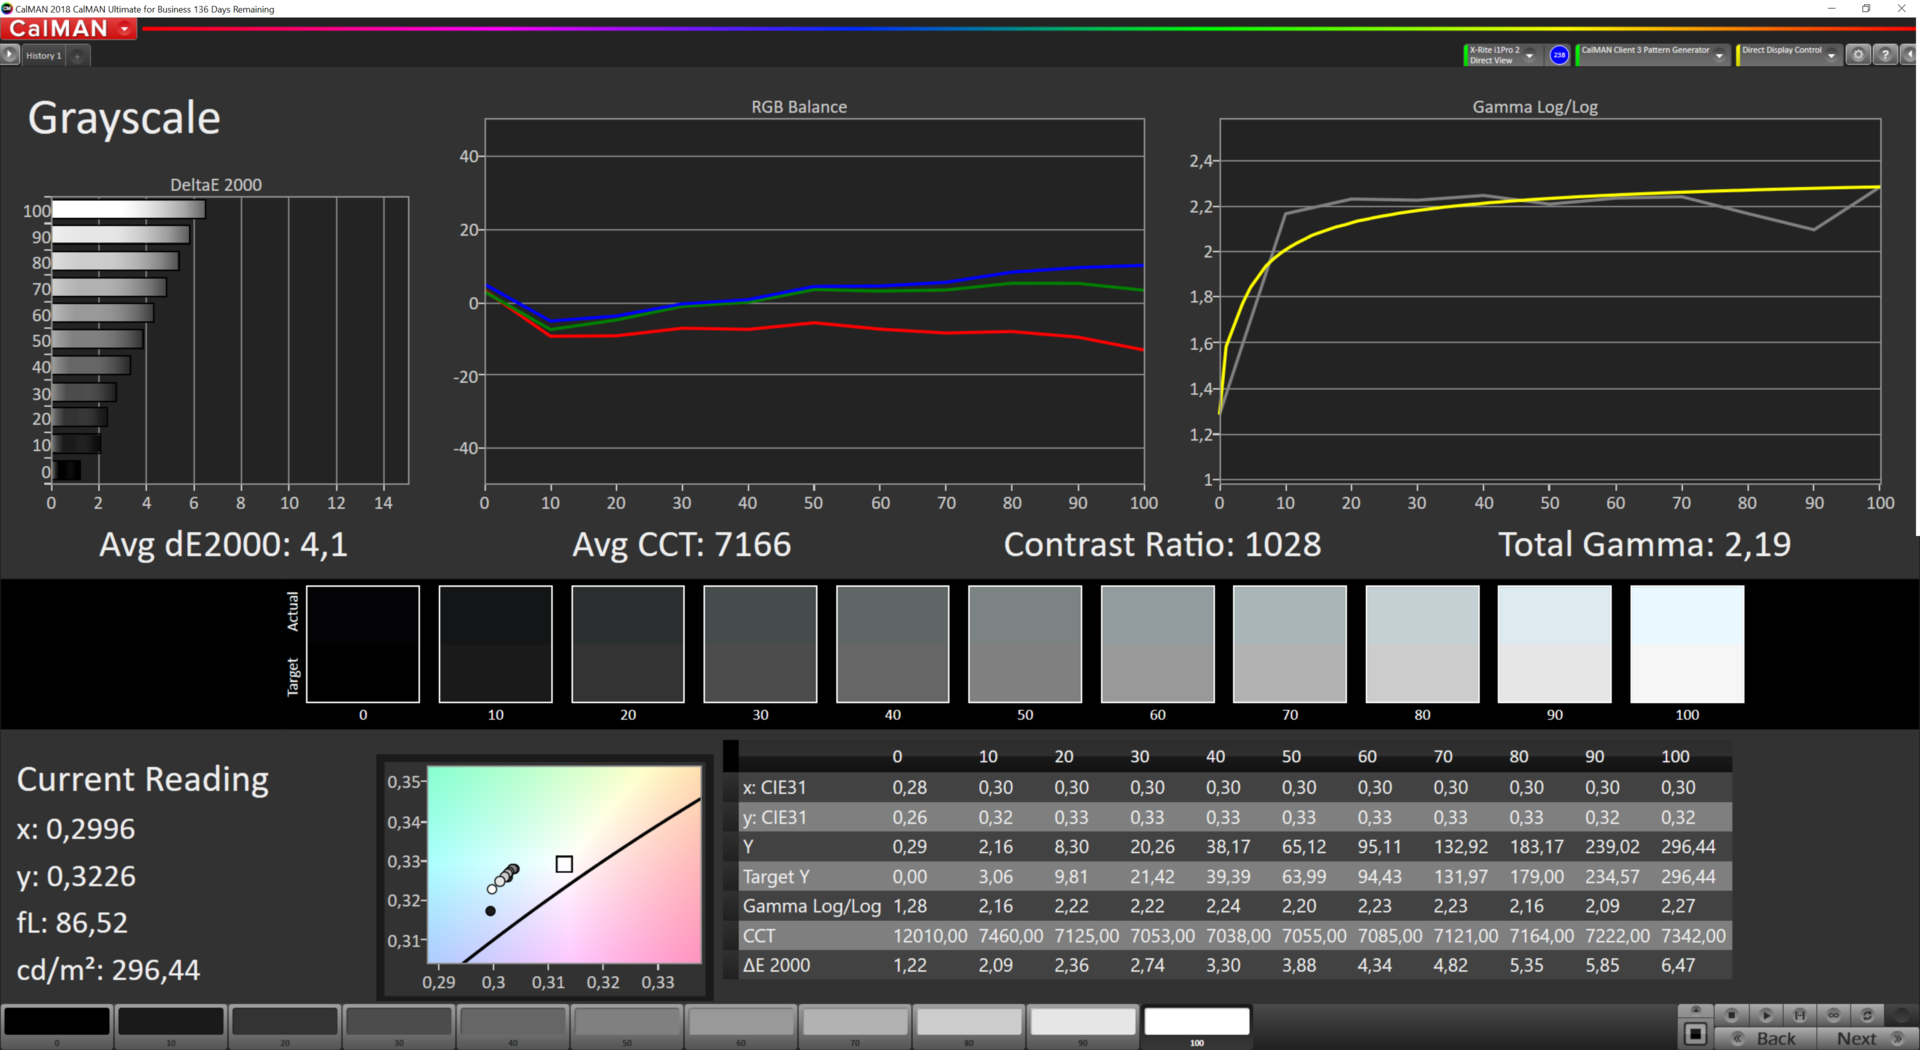
Our review unit also has the same 15.6-inch IPS panel as its Y540-15IRH sibling. The display operates natively at 1920x1080 with a 144 Hz refresh rate too, which remains the standard for midrange gaming laptops. The display achieved an average maximum brightness of 290 cd/m², according to X-Rite i1Pro 2, while also being 89% evenly lit. Our review unit leads our comparison devices with the latter, but it is slightly dimmer than the CUK Model Z and HP Gaming Pavilion 15. The display does not use pulse-width modulation (PWM) either, which is the bane of many laptops and smartphones.
| |||||||||||||||||||||||||
Brightness Distribution: 89 %
Center on Battery: 299 cd/m²
Contrast: 1031:1 (Black: 0.29 cd/m²)
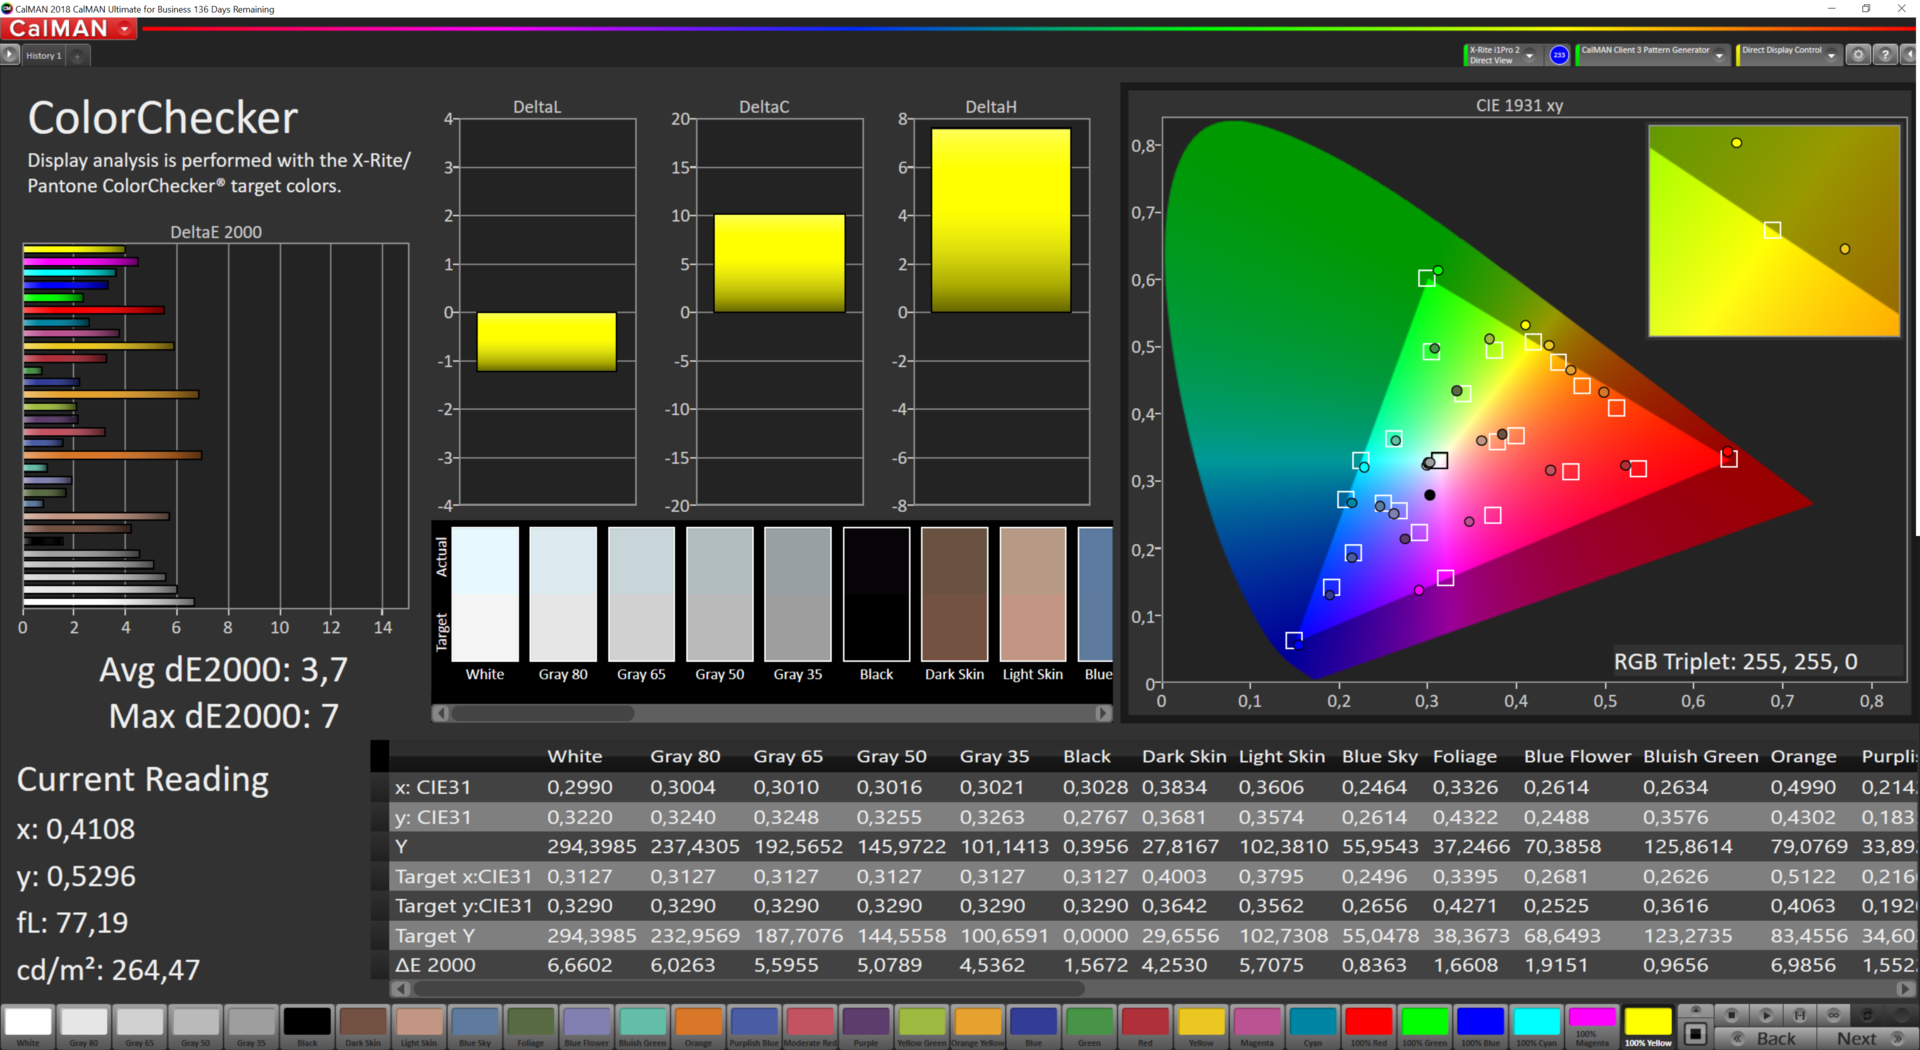
ΔE ColorChecker Calman: 3.7 | ∀{0.5-29.43 Ø4.73}
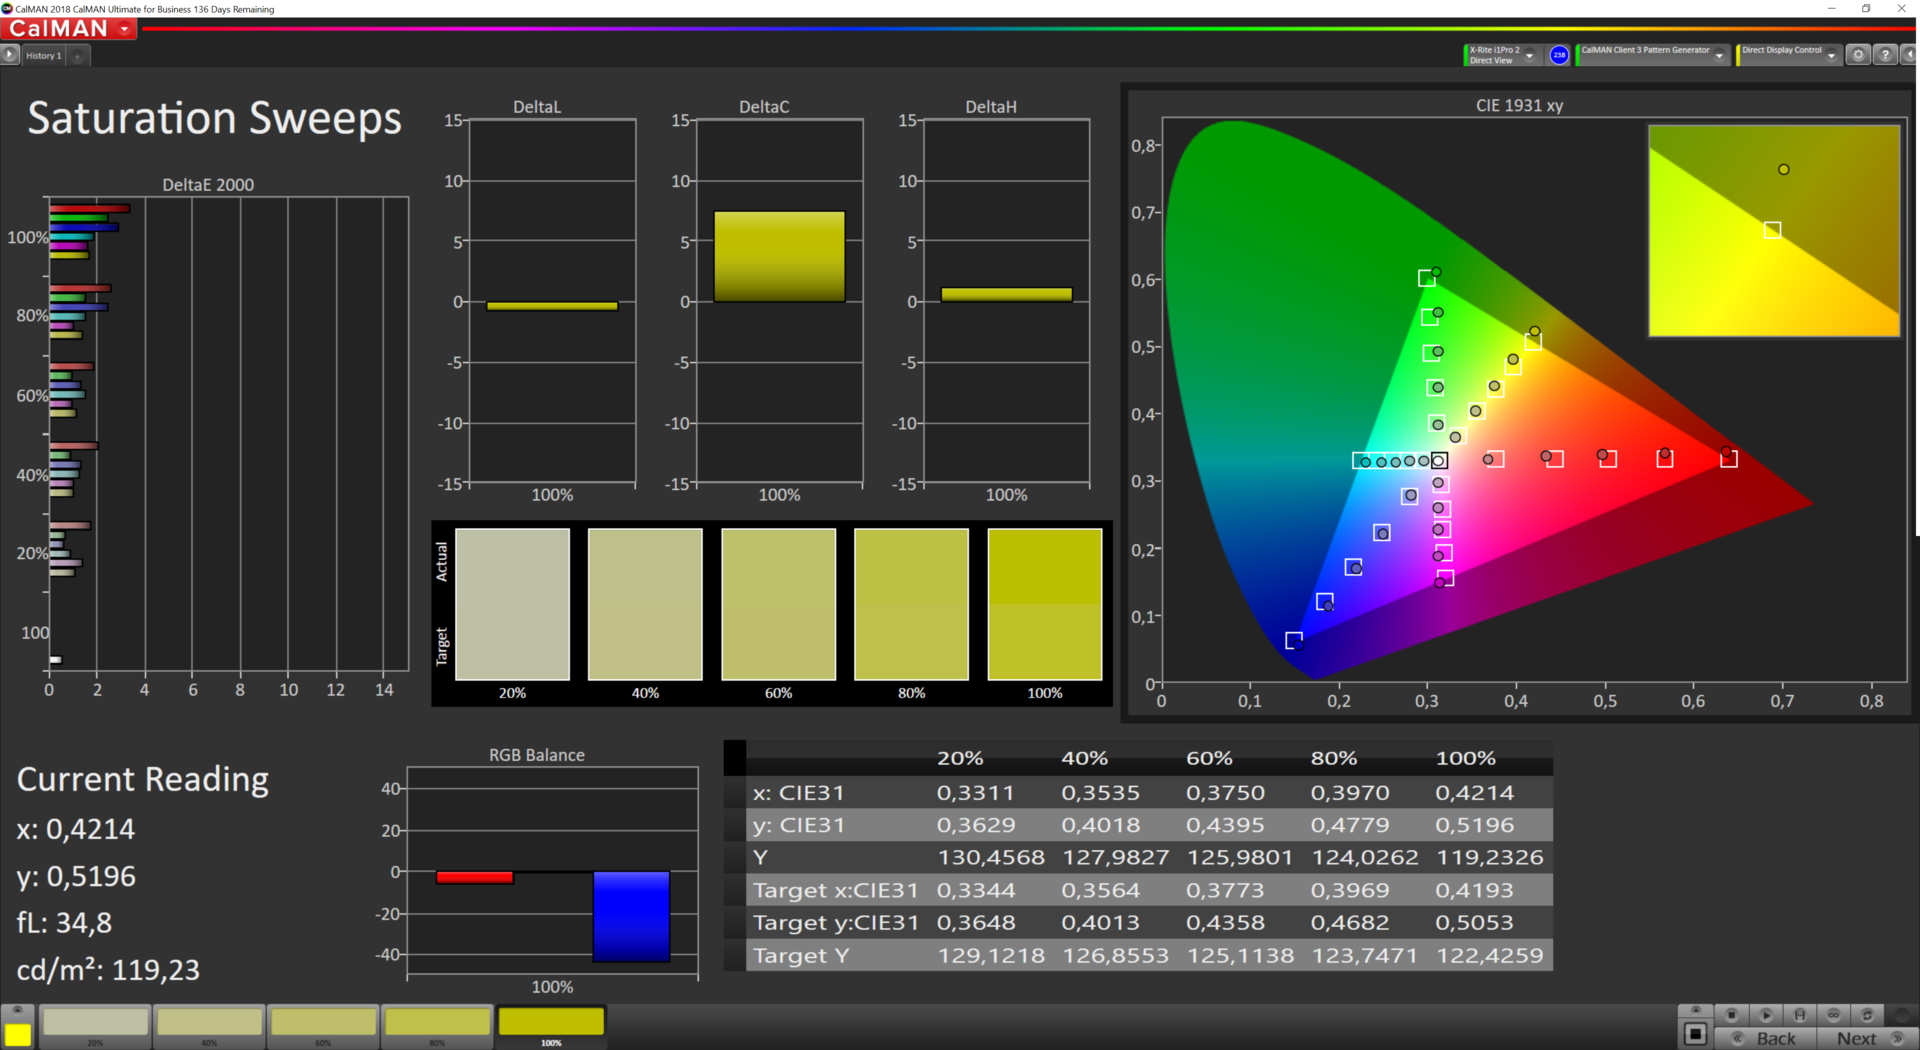
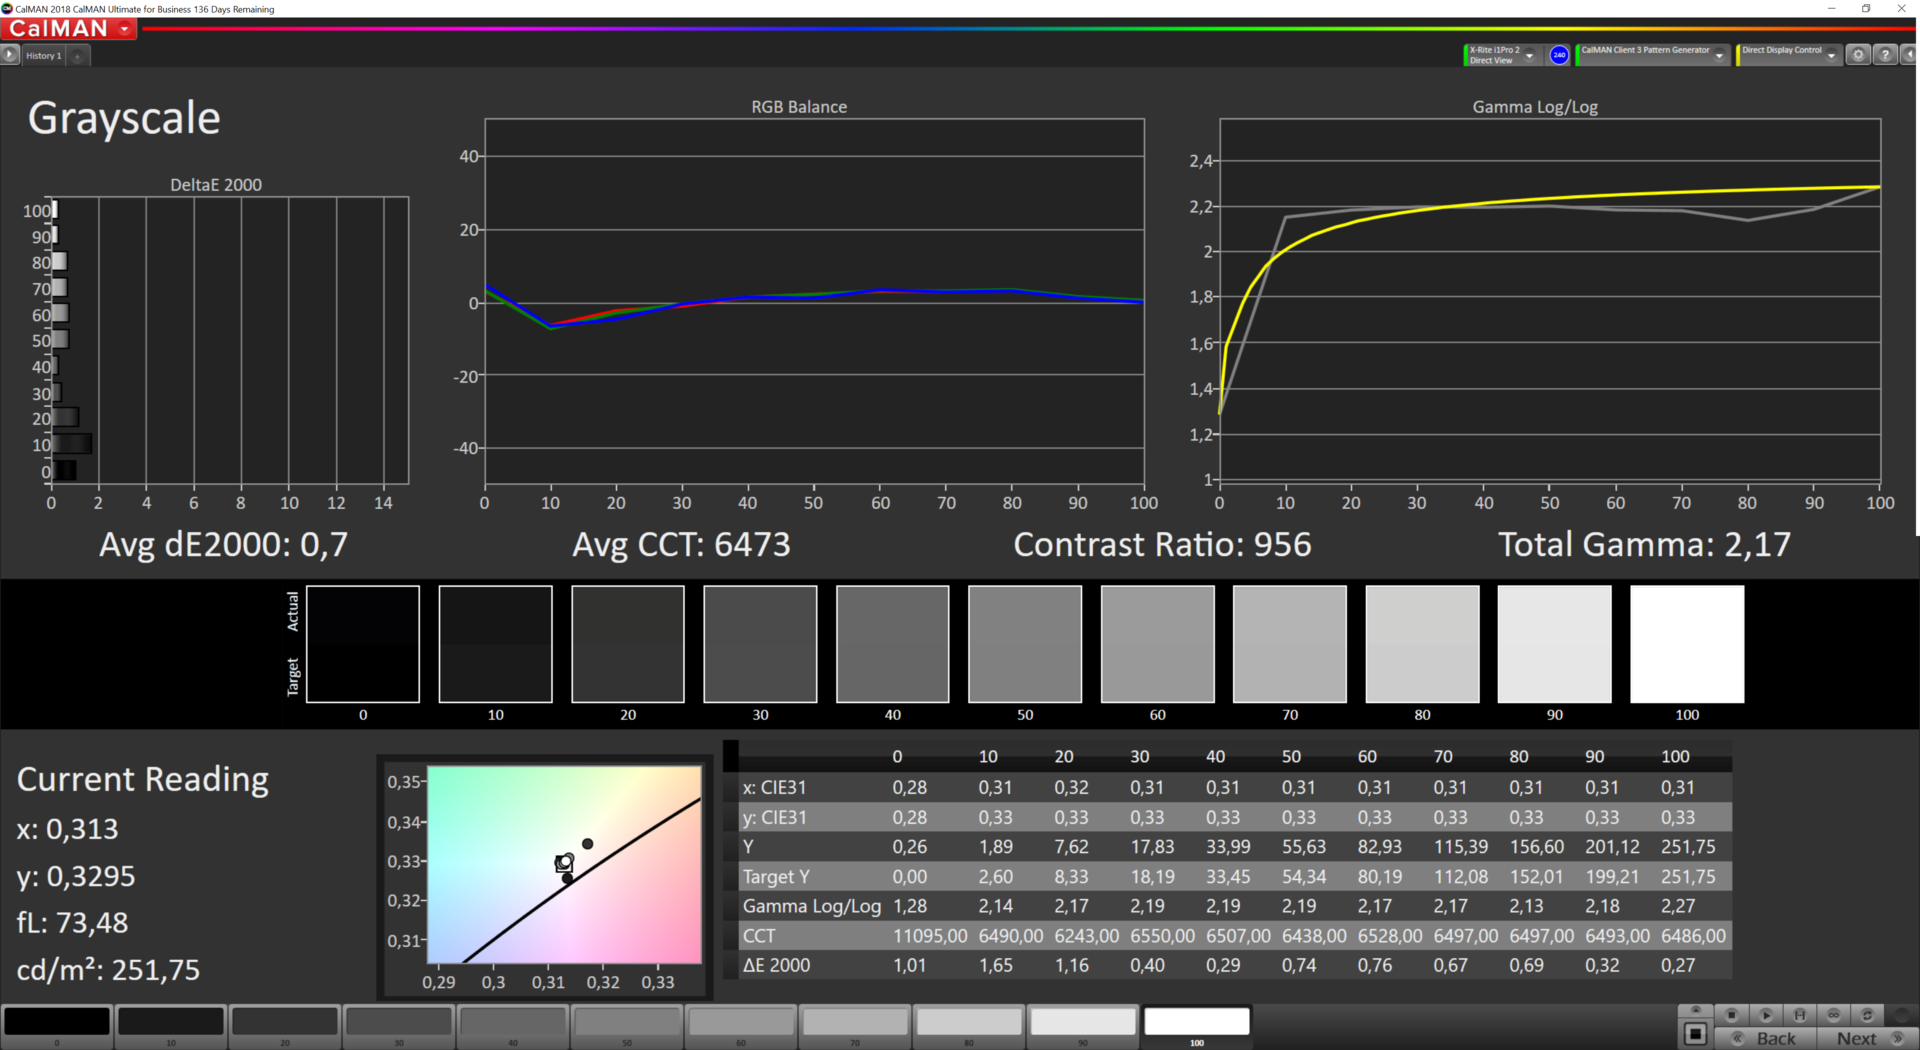
calibrated: 2
ΔE Greyscale Calman: 4.1 | ∀{0.09-98 Ø4.97}
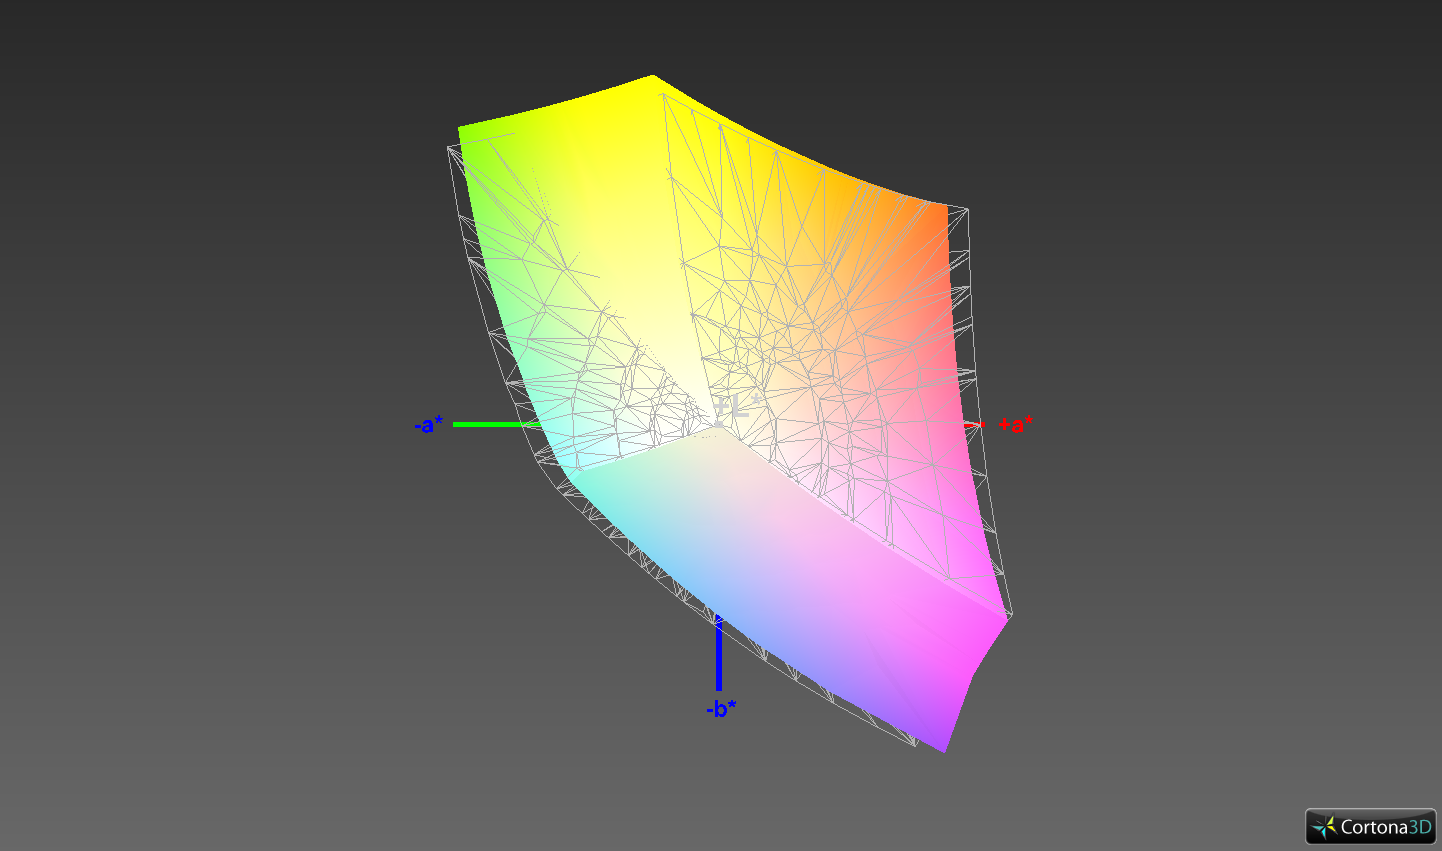
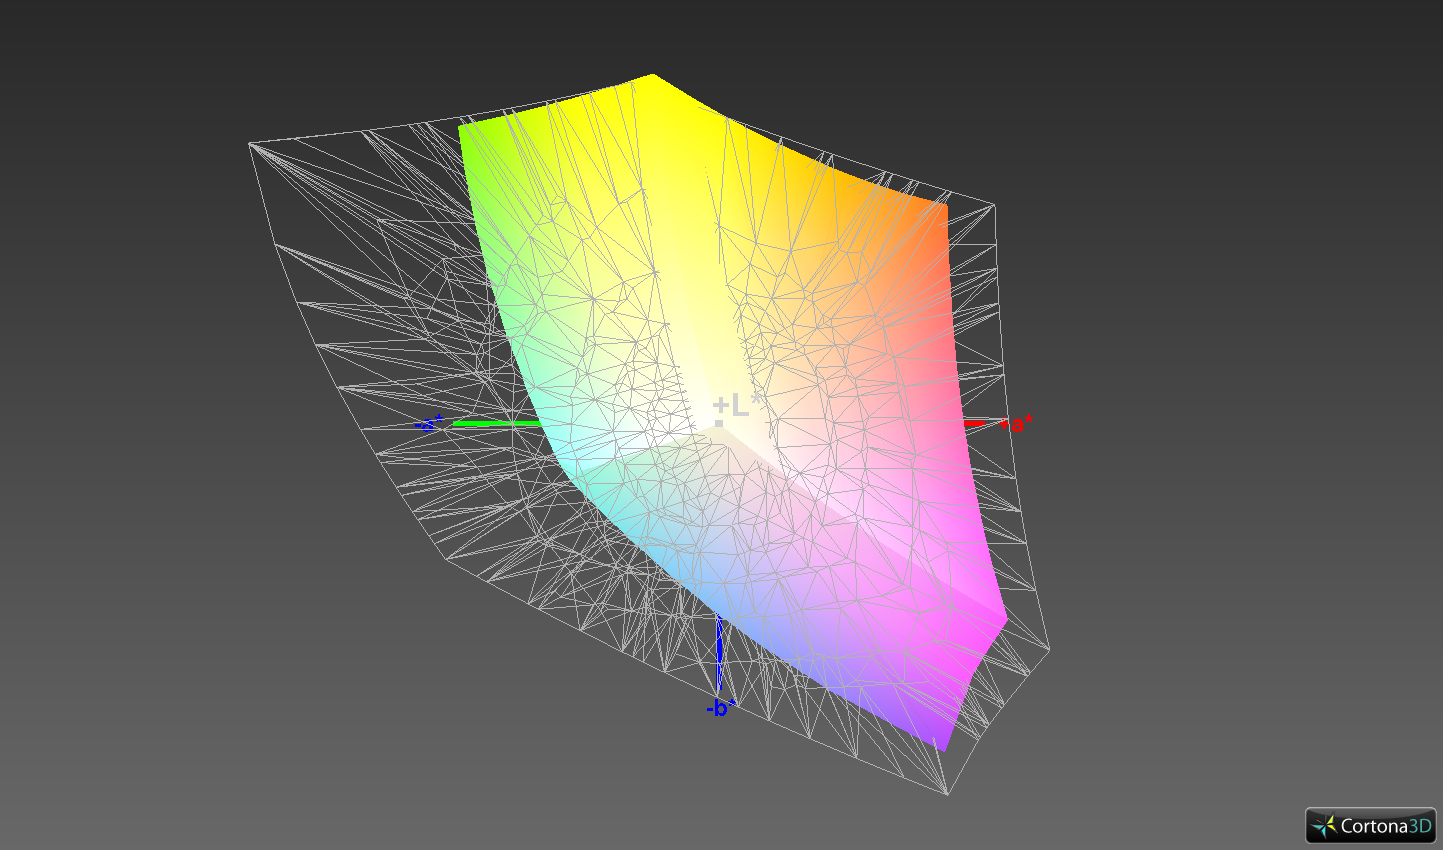
91.5% sRGB (Argyll 1.6.3 3D)
59.3% AdobeRGB 1998 (Argyll 1.6.3 3D)
65.2% AdobeRGB 1998 (Argyll 3D)
91.7% sRGB (Argyll 3D)
63.6% Display P3 (Argyll 3D)
Gamma: 2.19
CCT: 7166 K
| Lenovo Legion Y540-15IRH-81SX00B2GE BOE 084D, , 1920x1080, 15.6" | Asus Strix GL531GV-PB74 Panda LM156LF-GL02, , 1920x1080, 15.6" | CUK Model Z GK5CQ7Z LG Philips LGD05C0, , 1920x1080, 15.6" | HP Gaming Pavilion 15-dk0009ng LG Philips LGD05FE, , 1920x1080, 15.6" | Lenovo Legion Y530-15ICH LG Display LP156WFG-SPB2, , 1920x1080, 15.6" | Lenovo Legion Y540-15IRH BOE NV156FHM-N4G (BOE084D), , 1920x1080, 15.6" | |
|---|---|---|---|---|---|---|
| Display | -36% | 1% | 2% | -1% | 1% | |
| Display P3 Coverage (%) | 63.6 | 40.13 -37% | 64.5 1% | 64.2 1% | 62.5 -2% | 64.5 1% |
| sRGB Coverage (%) | 91.7 | 60.3 -34% | 93 1% | 95.1 4% | 93 1% | 91.6 0% |
| AdobeRGB 1998 Coverage (%) | 65.2 | 41.48 -36% | 65.7 1% | 65.8 1% | 63.8 -2% | 65.9 1% |
| Response Times | -154% | -28% | -37% | -31% | 9% | |
| Response Time Grey 50% / Grey 80% * (ms) | 8.8 ? | 26 ? -195% | 13.6 ? -55% | 16.4 ? -86% | 15 ? -70% | 8.8 ? -0% |
| Response Time Black / White * (ms) | 12 ? | 25.6 ? -113% | 12 ? -0% | 10.4 ? 13% | 11 ? 8% | 10 ? 17% |
| PWM Frequency (Hz) | ||||||
| Screen | -49% | 1% | 19% | -11% | 1% | |
| Brightness middle (cd/m²) | 299 | 290.1 -3% | 306.8 3% | 345 15% | 305 2% | 284 -5% |
| Brightness (cd/m²) | 290 | 274 -6% | 309 7% | 324 12% | 284 -2% | 277 -4% |
| Brightness Distribution (%) | 89 | 86 -3% | 87 -2% | 86 -3% | 83 -7% | 87 -2% |
| Black Level * (cd/m²) | 0.29 | 0.54 -86% | 0.38 -31% | 0.42 -45% | 0.52 -79% | 0.3 -3% |
| Contrast (:1) | 1031 | 537 -48% | 807 -22% | 821 -20% | 587 -43% | 947 -8% |
| Colorchecker dE 2000 * | 3.7 | 5.16 -39% | 3.16 15% | 1.3 65% | 3.63 2% | 3.53 5% |
| Colorchecker dE 2000 max. * | 7 | 18.09 -158% | 6.05 14% | 2.8 60% | 8.18 -17% | 6.11 13% |
| Colorchecker dE 2000 calibrated * | 2 | 4.35 -117% | 2.4 -20% | 1.1 45% | 1.31 34% | 1.81 9% |
| Greyscale dE 2000 * | 4.1 | 4.4 -7% | 2.3 44% | 1.2 71% | 4.77 -16% | 3.56 13% |
| Gamma | 2.19 100% | 2.1 105% | 2.17 101% | 2.31 95% | 2.54 87% | 2.47 89% |
| CCT | 7166 91% | 7362 88% | 6557 99% | 6476 100% | 7500 87% | 7257 90% |
| Color Space (Percent of AdobeRGB 1998) (%) | 59.3 | 38.1 -36% | 60 1% | 60.5 2% | 59 -1% | 59 -1% |
| Color Space (Percent of sRGB) (%) | 91.5 | 60 -34% | 92.6 1% | 94.9 4% | 93 2% | 91 -1% |
| Total Average (Program / Settings) | -80% /
-60% | -9% /
-3% | -5% /
9% | -14% /
-12% | 4% /
2% |
* ... smaller is better
The Y540-15IRH has a higher contrast ratio than our comparison devices too thanks to its comparatively low 0.29 cd/m² black value. The display has a slight grey haze to it but looks still look rich, with colours also being nicely demarcated from each other.
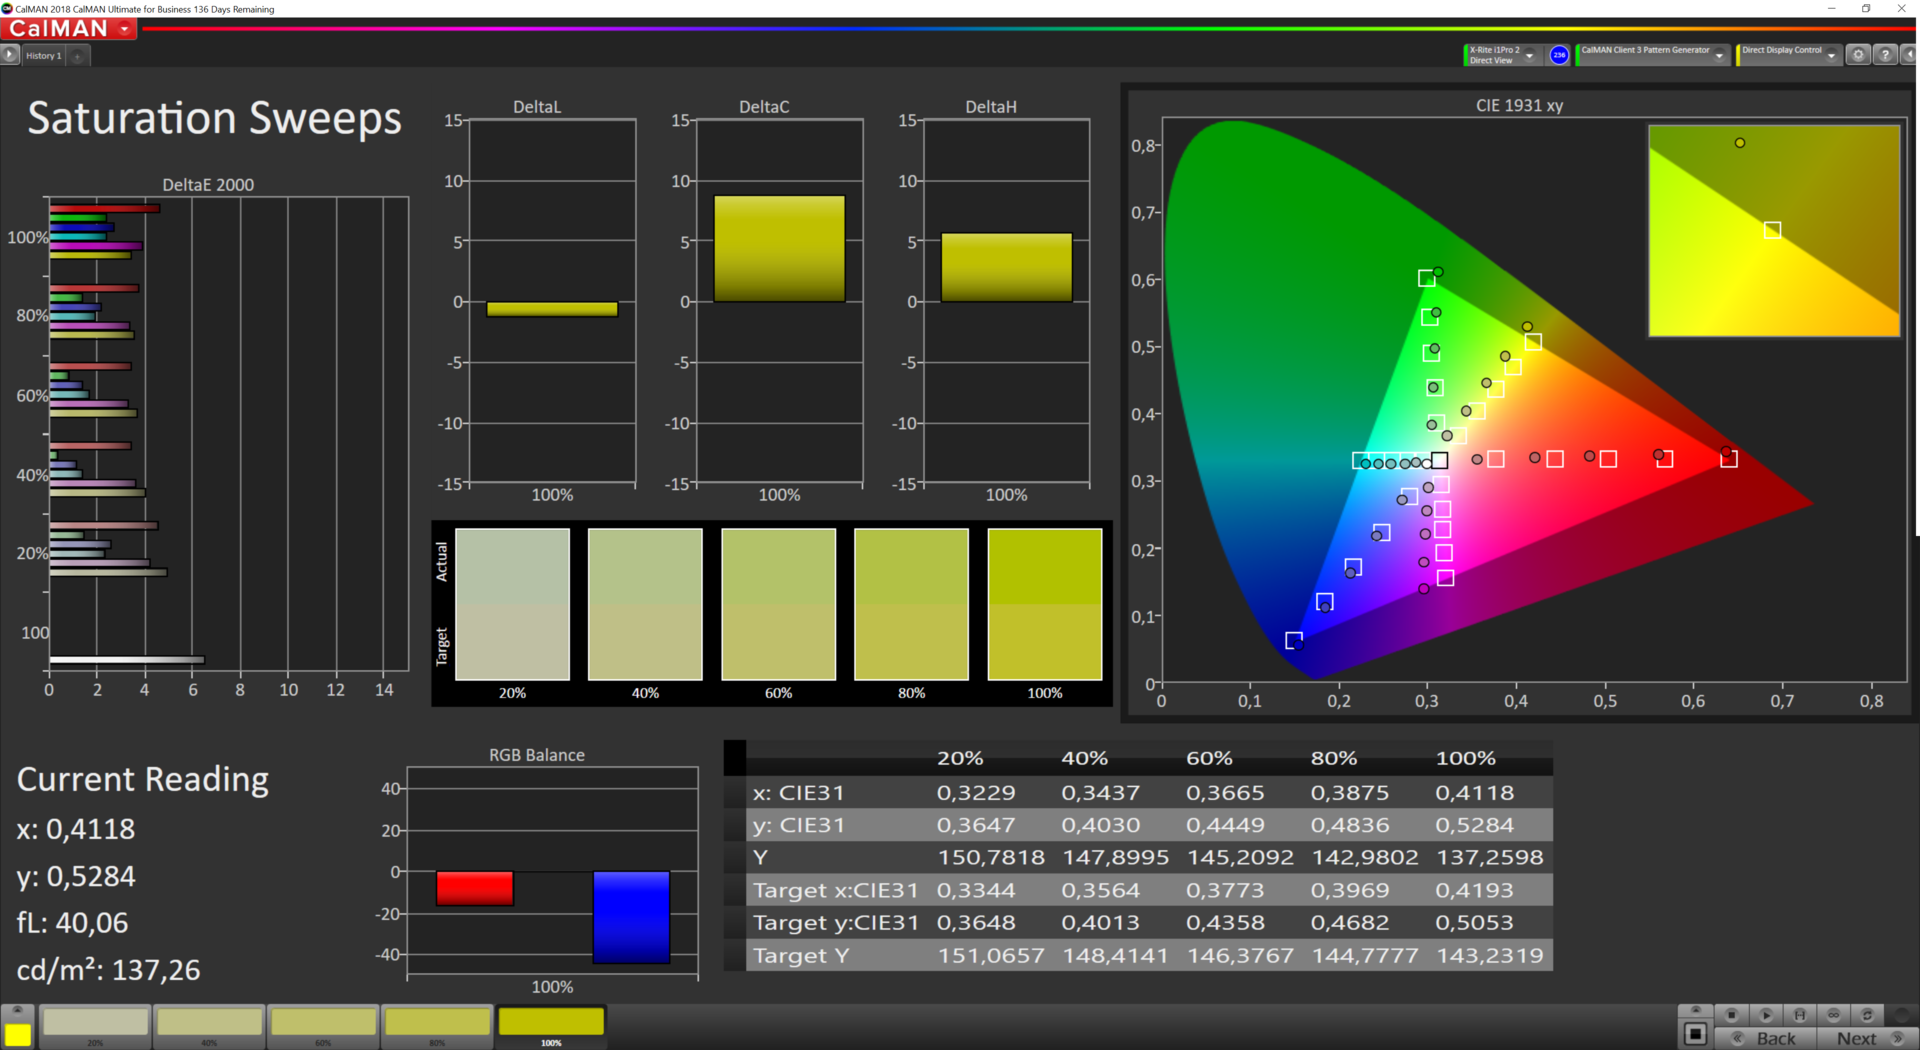
We also ran further tests with our spectrophotometer and CalMAN analysis software, which revealed that the display is well-calibrated out of the box. While DeltaE deviations were already low, additional calibration brought them even closer to ideal levels. We have included the corresponding ICC file in the box above our comparison table should you wish to use it. Applying it to any panel other than the BOE 084D could worsen colour accuracy rather than improve it though.

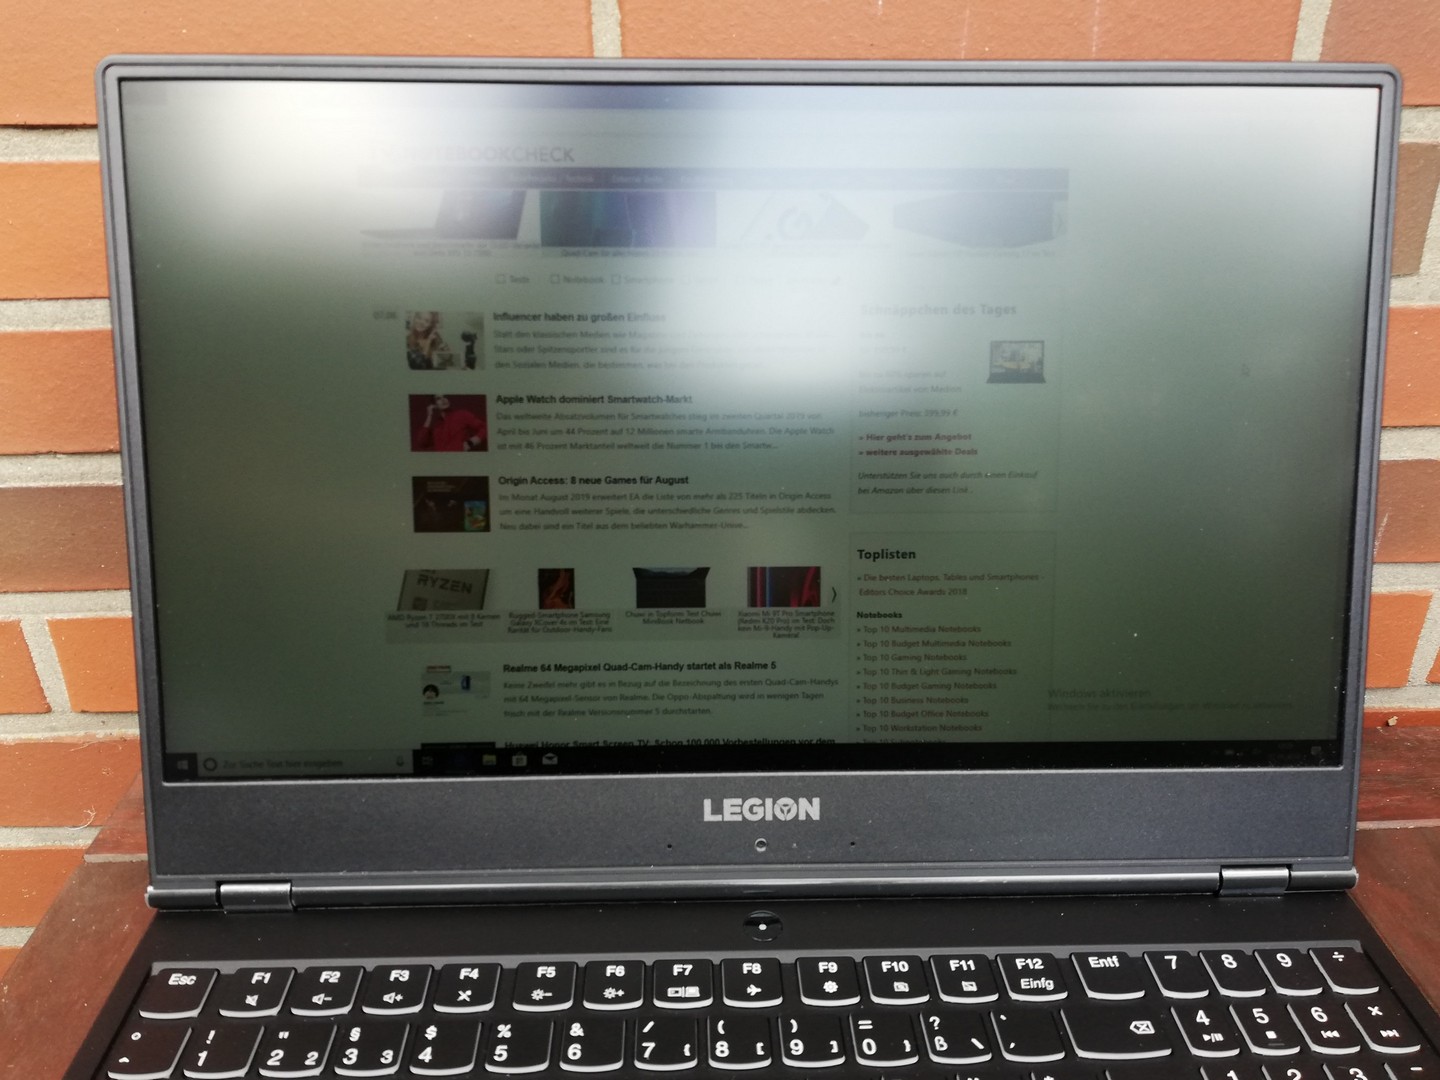
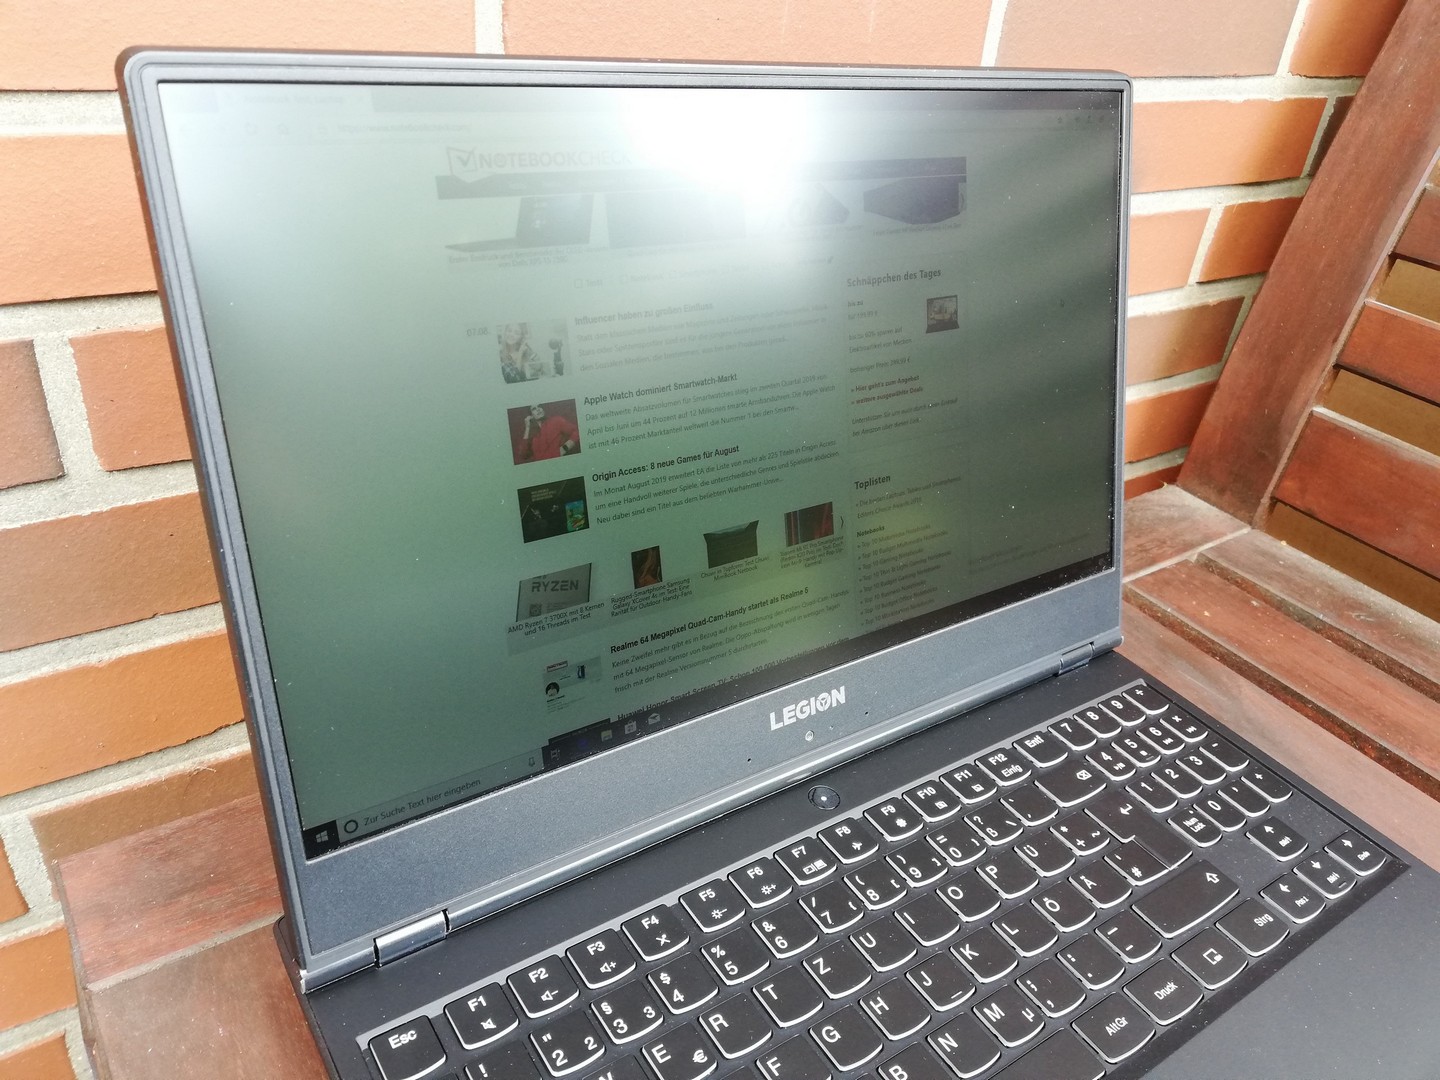
The Y540-15IRH is usable outdoors if you can find a shady spot. While the matte display diffuses reflections well, the panel does not get bright enough to overcome bright sunshine. In short, the display will look washed-out if it is placed in direct sunlight, as the photos below demonstrate.
Display Response Times
| ↔ Response Time Black to White | ||
|---|---|---|
| 12 ms ... rise ↗ and fall ↘ combined | ↗ 6.8 ms rise | 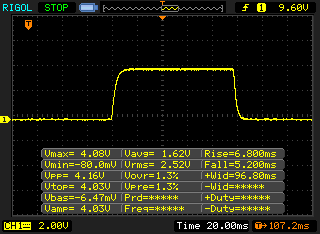 |
| ↘ 5.2 ms fall | ||
| The screen shows good response rates in our tests, but may be too slow for competitive gamers. In comparison, all tested devices range from 0.1 (minimum) to 240 (maximum) ms. » 31 % of all devices are better. This means that the measured response time is better than the average of all tested devices (19.9 ms). | ||
| ↔ Response Time 50% Grey to 80% Grey | ||
| 8.8 ms ... rise ↗ and fall ↘ combined | ↗ 4 ms rise | 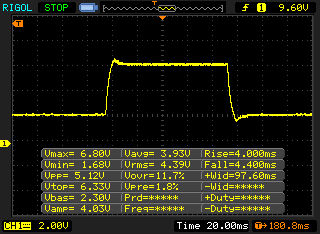 |
| ↘ 4.4 ms fall | ||
| The screen shows fast response rates in our tests and should be suited for gaming. In comparison, all tested devices range from 0.165 (minimum) to 636 (maximum) ms. » 22 % of all devices are better. This means that the measured response time is better than the average of all tested devices (31.1 ms). | ||
Screen Flickering / PWM (Pulse-Width Modulation)
| Screen flickering / PWM not detected |  | ||
In comparison: 52 % of all tested devices do not use PWM to dim the display. If PWM was detected, an average of 7797 (minimum: 5 - maximum: 343500) Hz was measured. | |||
The Y540-15IRH has stable viewing angles though thanks to its IPS panel. We noticed no distorted colours or drops in brightness even at acute viewing angles, making the display readable from practically any angle.

Performance
Lenovo currently sells several variants of the Y540-15IRH, with the company giving people two CPUs and three GPUs from which to choose. The base model comes with a Core i5-9300H and a GeForce GTX 1650, although you can upgrade to a GeForce GTX 1660 Ti while retaining the same CPU. The latter can also be paired with a Core i7-9750H, but Lenovo offers the GeForce RTX 2060 too, as we discussed in our previous Y540-15IRH review.
You can also choose up to 3 TB of storage with a 1 TB SSD and a 2 TB HDD. Incidentally, the base model comes with 8 GB of RAM, with Lenovo reserving 16 GB of RAM for the Core i7-9750H versions.
Processor
Lenovo equips our review unit with a Core i7-9750H, the successor to the popular Core i7-8750H. The Core i7-9750H is a hexa-core chip like its predecessor, which Intel also bases on its Coffee Lake Refresh architecture. The CPU has slightly higher clock speeds than its predecessor though, with its 2.6 GHz base clock being 400 MHz more than that of the Core i7-8750H. The Core i7-9750H can also boost up to 4 GHz on all cores thanks to Intel Turbo Boost, while it can also get 100 MHz faster for every fewer core it uses, with it peaking at 4.5 GHz on a single core. Not all devices maintain their turbo clock speeds for the same amount of time though, with the period that they can do so depending on the quality of their cooling system.
We subjected our review unit to an hour-long Cinebench R15 Multi 64Bit endurance test to see how well it maintained its performance under sustained load. Our review unit initially scored a lowly 899 points before rising to 1,211 points in the second benchmark run-through. Usually the opposite happens, with scores dropping after the first benchmark as the CPU exhausts its turbo, making this behaviour even stranger. Our review unit then dropped to around 1,150 points, with it scoring between 1,150 and 1,160 for the remainder of our endurance test. Overall, the Y540-15IRH finishes in the upper-midfield of our CPU benchmark comparison tables. Switching to battery power results in 25% lower benchmark scores though.
Please see our CPU benchmarks page for more information about the Core i7-9750H and how it fares against other processors.
System Performance
Our review unit performed smoothly during our tests, with no system stutters or the like. PCMark results reflected this, with the Y540-15IRH generally scoring well. There were some aberrations in our comparison tables, but the device always achieved above-average scores.
| PCMark 8 Home Score Accelerated v2 | 4507 points | |
| PCMark 8 Work Score Accelerated v2 | 5041 points | |
| PCMark 10 Score | 5716 points | |
Help | ||
Storage Devices
Lenovo has equipped our review unit with a 512 GB Western Digital SN720 SSD, of which around 454 GB was free upon first turning on the device. If 454 GB is not enough, then you could add a 2.5-inch drive or swap the SN720 for a higher capacity M.2-2280 SSD.
The SN720 is an impressively fast drive, with it only averaging slower transfer speeds than the 2 TB Intel 660p in CrystalDiskMark. Higher-capacity SSDs typically run faster than their smaller counterparts, which explains the discrepancy in speeds between the 512 GB and 2 TB Intel 660p. Please see our HDD/SSD benchmark page for more comparisons.
| Lenovo Legion Y540-15IRH-81SX00B2GE WDC PC SN720 SDAPNTW-512G | Asus Strix GL531GV-PB74 Intel SSD 660p SSDPEKNW512G8 | CUK Model Z GK5CQ7Z Intel SSD 660p 2TB SSDPEKNW020T8 | HP Gaming Pavilion 15-dk0009ng Samsung SSD PM981 MZVLB256HAHQ | Lenovo Legion Y530-15ICH Samsung SSD PM981 MZVLB256HAHQ | Lenovo Legion Y540-15IRH Samsung PM981a MZVLB1T0HBLR | Average WDC PC SN720 SDAPNTW-512G | |
|---|---|---|---|---|---|---|---|
| CrystalDiskMark 5.2 / 6 | -16% | 12% | -18% | -16% | 11% | -4% | |
| Write 4K (MB/s) | 158.8 | 121.9 -23% | 134.4 -15% | 100 -37% | 108.9 -31% | 131.7 -17% | 110 ? -31% |
| Read 4K (MB/s) | 29.11 | 53.6 84% | 56.8 95% | 31.39 8% | 40.23 38% | 48.06 65% | 36.9 ? 27% |
| Write Seq (MB/s) | 1584 | 967 -39% | 1742 10% | 1308 -17% | 1390 -12% | 1234 -22% | 1976 ? 25% |
| Read Seq (MB/s) | 1694 | 1461 -14% | 1687 0% | 1083 -36% | 964 -43% | 973 -43% | 1710 ? 1% |
| Write 4K Q32T1 (MB/s) | 536 | 431.4 -20% | 535 0% | 362.9 -32% | 314.2 -41% | 576 7% | 339 ? -37% |
| Read 4K Q32T1 (MB/s) | 363.9 | 337.3 -7% | 639 76% | 425.7 17% | 369.2 1% | 655 80% | 417 ? 15% |
| Write Seq Q32T1 (MB/s) | 2536 | 972 -62% | 1903 -25% | 1411 -44% | 1506 -41% | 3012 19% | 2218 ? -13% |
| Read Seq Q32T1 (MB/s) | 3458 | 1727 -50% | 1849 -47% | 3240 -6% | 3446 0% | 3481 1% | 2940 ? -15% |
| AS SSD | -44% | -26% | -43% | -45% | 13% | -22% | |
| Seq Read (MB/s) | 2927 | 1280 -56% | 1283 -56% | 2088 -29% | 1808 -38% | 1954 -33% | 2544 ? -13% |
| Seq Write (MB/s) | 2149 | 905 -58% | 1730 -19% | 1347 -37% | 1429 -34% | 2484 16% | 2034 ? -5% |
| 4K Read (MB/s) | 42.43 | 48.73 15% | 49.89 18% | 36.14 -15% | 46.1 9% | 56.7 34% | 36.5 ? -14% |
| 4K Write (MB/s) | 147.1 | 107 -27% | 110.1 -25% | 96.5 -34% | 97 -34% | 124.3 -15% | 110.8 ? -25% |
| 4K-64 Read (MB/s) | 1286 | 321.1 -75% | 904 -30% | 565 -56% | 536 -58% | 1599 24% | 1112 ? -14% |
| 4K-64 Write (MB/s) | 1432 | 761 -47% | 792 -45% | 588 -59% | 273.6 -81% | 1883 31% | 1222 ? -15% |
| Access Time Read * (ms) | 0.065 | 0.058 11% | 0.036 45% | 0.093 -43% | 0.085 -31% | 0.039 40% | 0.0965 ? -48% |
| Access Time Write * (ms) | 0.026 | 0.046 -77% | 0.042 -62% | 0.038 -46% | 0.038 -46% | 0.03 -15% | 0.04212 ? -62% |
| Score Read (Points) | 1621 | 498 -69% | 1082 -33% | 810 -50% | 763 -53% | 1851 14% | 1403 ? -13% |
| Score Write (Points) | 1794 | 958 -47% | 1075 -40% | 819 -54% | 514 -71% | 2256 26% | 1536 ? -14% |
| Score Total (Points) | 4208 | 1711 -59% | 2745 -35% | 2014 -52% | 1663 -60% | 5087 21% | 3633 ? -14% |
| Copy ISO MB/s (MB/s) | 1519 | 3089 | 1043 | 1506 ? | |||
| Copy Program MB/s (MB/s) | 749 | 549 | 371.7 | 410 ? | |||
| Copy Game MB/s (MB/s) | 943 | 1171 | 399.9 | 894 ? | |||
| Total Average (Program / Settings) | -30% /
-33% | -7% /
-10% | -31% /
-33% | -31% /
-33% | 12% /
12% | -13% /
-14% |
* ... smaller is better

Graphics Card
Our review unit generally scored a few percent below average in 3DMark for a GeForce GTX 1660 Ti-powered device, but it still placed well in our comparison tables. Switching to battery power caused 3DMark 11 scores to drop by almost 65% to just 6,858 points.
The Y540-15IRH has a second GPU too, the Intel UHD Graphics 630, although Lenovo disables this by default. You can activate this via the BIOS, which switches on NVIDIA Optimus too, extending battery life by almost 50% in the process.
| 3DMark 11 Performance | 17291 points | |
| 3DMark Cloud Gate Standard Score | 32884 points | |
| 3DMark Fire Strike Score | 12884 points | |
Help | ||
Gaming Performance
The GeForce GTX 1660 Ti is powerful enough to play all modern triple-A games smoothly in 1080p at high graphics. Even demanding titles like Anno 1800 averaged a respectable 54 FPS, as could The Witcher 3. We would recommend turning the graphics settings down if you plan to game in 4K on an external monitor, as complex games will look choppy if you try running them at maximum graphics.
Please see our GPU games list for more GeForce GTX 1660 Ti gaming benchmarks.
| The Witcher 3 - 1920x1080 Ultra Graphics & Postprocessing (HBAO+) | |
| Average of class Gaming (95 - 240, n=8, last 2 years) | |
| Asus Strix GL531GV-PB74 | |
| CUK Model Z GK5CQ7Z | |
| Lenovo Legion Y540-15IRH | |
| Average NVIDIA GeForce GTX 1660 Ti Mobile (51.6 - 65.1, n=21) | |
| HP Gaming Pavilion 15-dk0009ng | |
| Lenovo Legion Y540-15IRH-81SX00B2GE | |
| Lenovo Legion Y530-15ICH | |
| Anno 1800 - 1920x1080 Ultra Graphics Quality (DX11) | |
| Average of class Gaming (n=1last 2 years) | |
| Lenovo Legion Y540-15IRH-81SX00B2GE | |
| Average NVIDIA GeForce GTX 1660 Ti Mobile (31.1 - 54, n=4) | |
| HP Gaming Pavilion 15-dk0009ng | |
We also left The Witcher 3 running for an hour to see how the system managed under sustained load. Frame rates fluctuated between 50 and 58 FPS during this test, with the game set to 1080p and maximum graphics. While frame rates briefly drop to the low 50s, they recover to around 55 FPS, so you should not experience any prolonged throttling when gaming.
| low | med. | high | ultra | 4K | |
|---|---|---|---|---|---|
| BioShock Infinite (2013) | 138 | ||||
| The Witcher 3 (2015) | 53.1 | ||||
| Dota 2 Reborn (2015) | 137.2 | 130.2 | 121.3 | 118.2 | 85 |
| X-Plane 11.11 (2018) | 117 | 106 | 85 | ||
| Anno 1800 (2019) | 54 |
Emissions
Fan Noise
Our review unit always keeps its fans running, but they whir away at a pleasant 29.3 dB(A) at idle. Predictably, the fans get louder under load, but the Y540-15IRH is one of the quieter gaming laptops we have tested. The fans peaked at 45.7 dB(A) during our stress test and average 35.7 dB(A) when gaming, which is quiet enough to game without needing headphones.
However, we did hear some electrical interference during our tests, but only while charging. We doubt that this is coil whine, but we would recommend testing the Y540-15IRH before buying it if these noises annoy you, as the device will probably spend much of its life connected to a charger, especially when gaming.
Noise level
| Idle |
| 29.3 / 29.3 / 29.3 dB(A) |
| Load |
| 35.7 / 45.6 dB(A) |
 | ||
30 dB silent 40 dB(A) audible 50 dB(A) loud |
||
min: | ||
Temperature
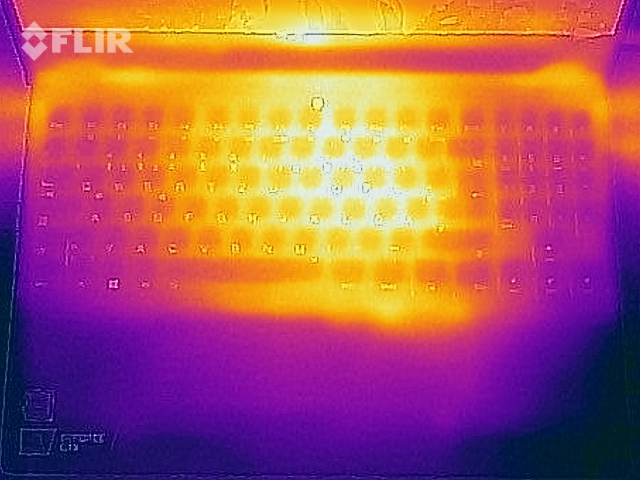
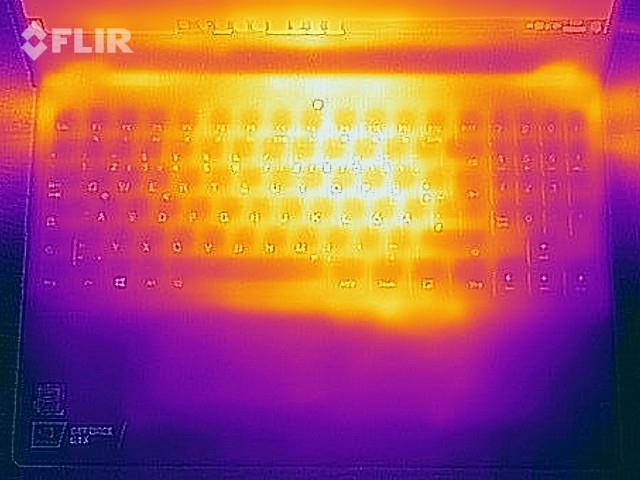
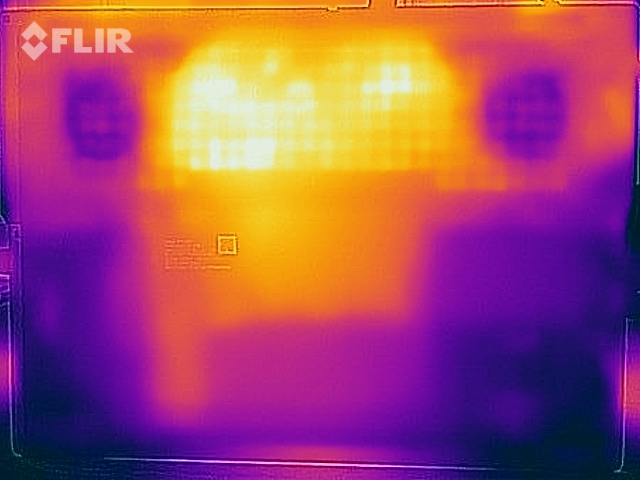
Our tests certify that the Y540-15IRH runs comparatively hot even when idling. Most of the bottom case remains at nearly 40 °C during undemanding tasks, with one area peaking at 41 °C. Only the palm rest remains below 30 °C on the top case too, which is disappointing. The latter area remains cool under sustained load or when gaming, so it should not feel hot to the touch during prolonged gaming sessions.
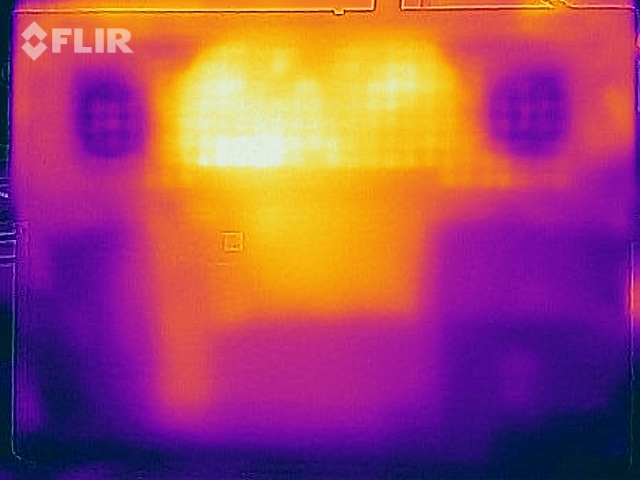
Surface temperatures generally increase by around 10 °C though, with one area peaking at 52.7 °C. Hence, we would recommend placing the Y540-15IRH on a table if you are pushing it hard, as it may burn your legs if you leave it on your lap.
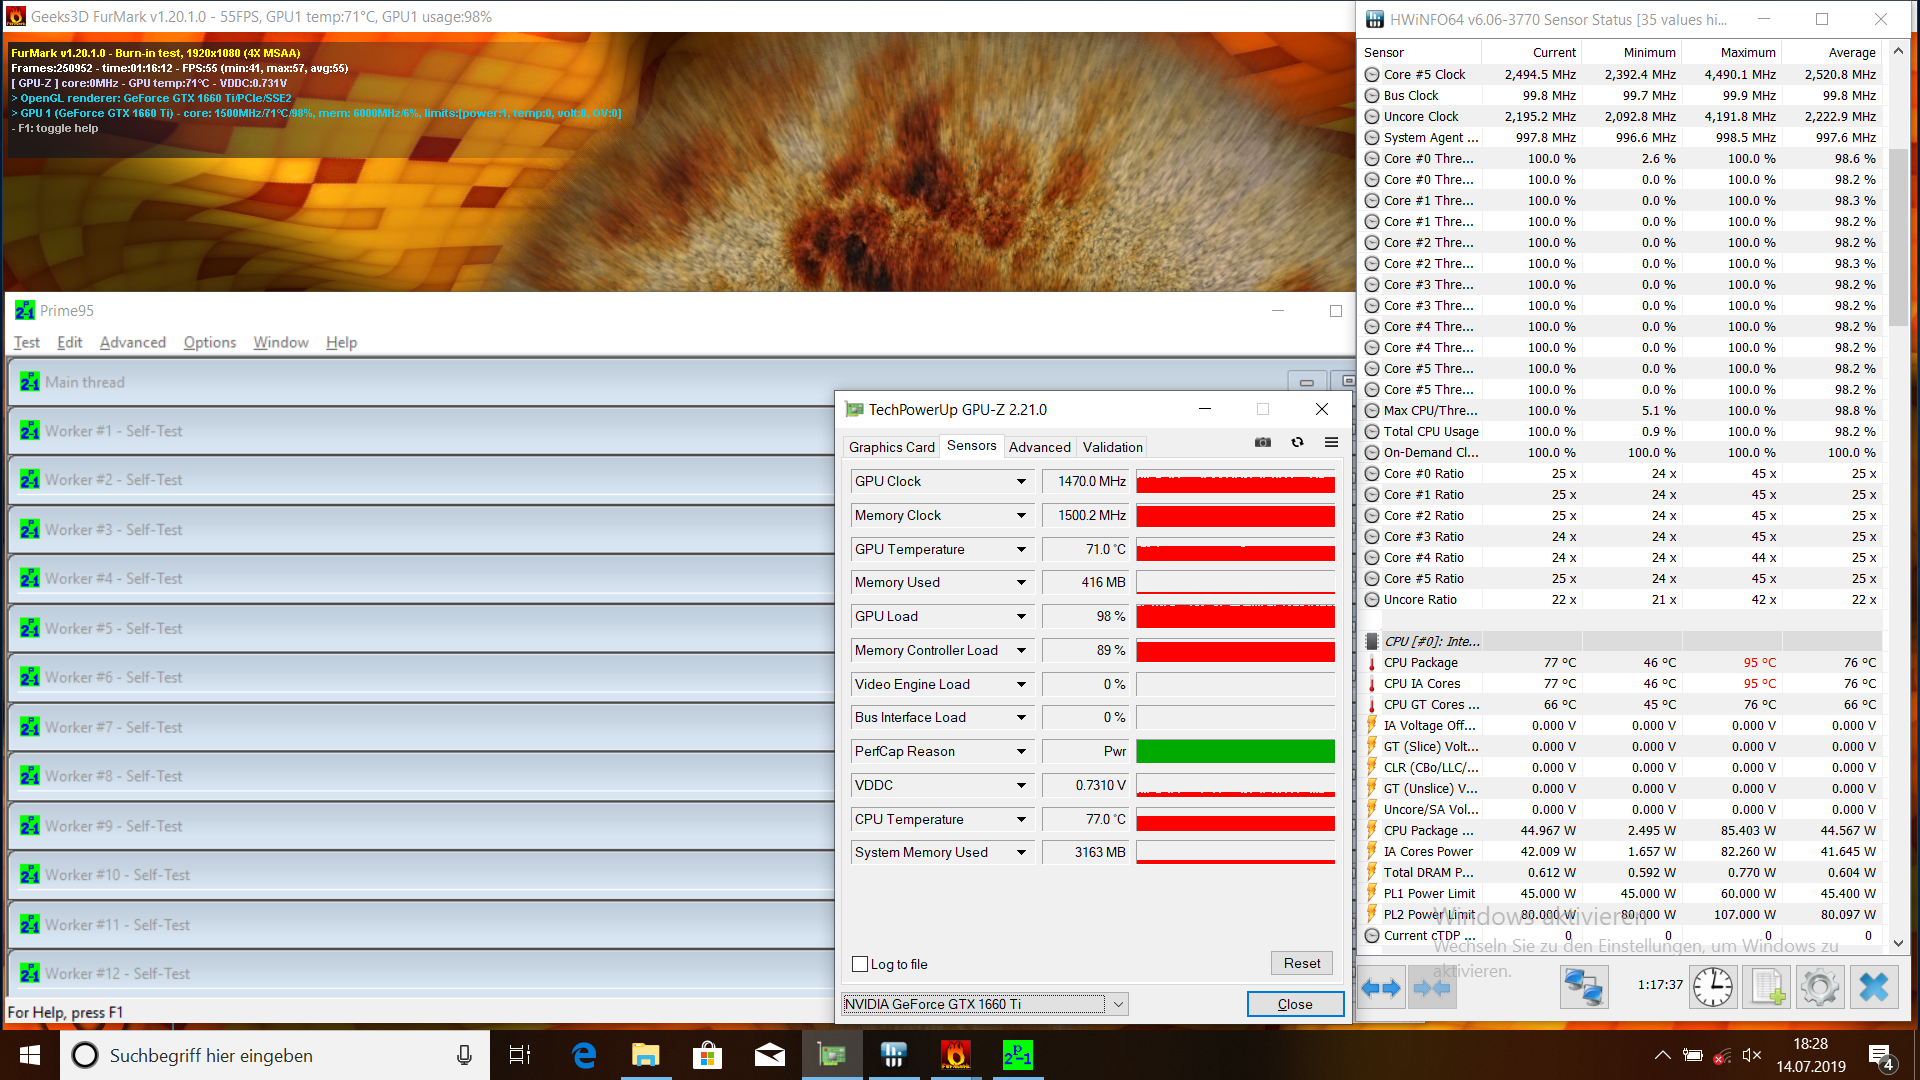
We also subjected our review unit to a FurMark and Prime95 combined stress test to see how well it managed its performance under extreme load conditions. We left our stress test running for an hour, with CPU core temperatures quickly rising to 95 °C. While this is within spec for the Core i7-9750H, it still downclocked below its 2.6 GHz base clock to 2.2 GHz, where it remained for the rest of the stress test. You should not experience such heavy thermal throttling in daily use though, as our stress test pushes systems to their limits.
(±) The maximum temperature on the upper side is 42.7 °C / 109 F, compared to the average of 40.4 °C / 105 F, ranging from 21.2 to 68.8 °C for the class Gaming.
(-) The bottom heats up to a maximum of 52.7 °C / 127 F, compared to the average of 43.2 °C / 110 F
(+) In idle usage, the average temperature for the upper side is 29.6 °C / 85 F, compared to the device average of 33.9 °C / 93 F.
(±) Playing The Witcher 3, the average temperature for the upper side is 35.2 °C / 95 F, compared to the device average of 33.9 °C / 93 F.
(+) The palmrests and touchpad are reaching skin temperature as a maximum (34.8 °C / 94.6 F) and are therefore not hot.
(-) The average temperature of the palmrest area of similar devices was 28.8 °C / 83.8 F (-6 °C / -10.8 F).
Speakers
Lenovo equips the Y540-15IRH with surprisingly good stereo speakers. While they only reached a maximum of 77.4 dB(A) during our tests, they deliver an impressively wide spectrum of frequencies. Bass tones are underrepresented, but that is a problem of almost all laptops. In short, the speakers are good enough for using when gaming or for watching the occasional video.
We would still recommend using external audio equipment where possible though, whether that be headphones or speakers. These can be connected via the 3.5 mm jack or Bluetooth, both of which worked perfectly during our tests.
Lenovo Legion Y540-15IRH-81SX00B2GE audio analysis
(±) | speaker loudness is average but good (77.4 dB)
Bass 100 - 315 Hz
(-) | nearly no bass - on average 17.7% lower than median
(±) | linearity of bass is average (11.6% delta to prev. frequency)
Mids 400 - 2000 Hz
(+) | balanced mids - only 3.7% away from median
(+) | mids are linear (4.5% delta to prev. frequency)
Highs 2 - 16 kHz
(+) | balanced highs - only 3.3% away from median
(+) | highs are linear (5.9% delta to prev. frequency)
Overall 100 - 16.000 Hz
(±) | linearity of overall sound is average (18.1% difference to median)
Compared to same class
» 57% of all tested devices in this class were better, 8% similar, 35% worse
» The best had a delta of 6%, average was 18%, worst was 132%
Compared to all devices tested
» 38% of all tested devices were better, 8% similar, 54% worse
» The best had a delta of 4%, average was 24%, worst was 134%
Apple MacBook 12 (Early 2016) 1.1 GHz audio analysis
(+) | speakers can play relatively loud (83.6 dB)
Bass 100 - 315 Hz
(±) | reduced bass - on average 11.3% lower than median
(±) | linearity of bass is average (14.2% delta to prev. frequency)
Mids 400 - 2000 Hz
(+) | balanced mids - only 2.4% away from median
(+) | mids are linear (5.5% delta to prev. frequency)
Highs 2 - 16 kHz
(+) | balanced highs - only 2% away from median
(+) | highs are linear (4.5% delta to prev. frequency)
Overall 100 - 16.000 Hz
(+) | overall sound is linear (10.2% difference to median)
Compared to same class
» 7% of all tested devices in this class were better, 2% similar, 91% worse
» The best had a delta of 5%, average was 18%, worst was 53%
Compared to all devices tested
» 5% of all tested devices were better, 1% similar, 94% worse
» The best had a delta of 4%, average was 24%, worst was 134%
Power Management
Power Consumption
Our tests certify that the Y540-15IRH consumes a minimum of 14.5 W at idle and up to 208 W under load. These values put the machine in the midfield of our comparison devices but a bit higher than other GeForce GTX 1660 Ti-powered gaming laptops.
Therefore, the 230 W power supply that Lenovo includes in the box has spare capacity and is never fully tested. Our review unit consumed a maximum of 132 W while running The Witcher 3 too, for reference.
| Off / Standby | |
| Idle | |
| Load |
|
Key:
min: | |
| Lenovo Legion Y540-15IRH-81SX00B2GE i7-9750H, GeForce GTX 1660 Ti Mobile, WDC PC SN720 SDAPNTW-512G, IPS, 1920x1080, 15.6" | Asus Strix GL531GV-PB74 i7-9750H, GeForce RTX 2060 Mobile, Intel SSD 660p SSDPEKNW512G8, IPS, 1920x1080, 15.6" | CUK Model Z GK5CQ7Z i7-9750H, GeForce RTX 2070 Max-Q, Intel SSD 660p 2TB SSDPEKNW020T8, IPS, 1920x1080, 15.6" | HP Gaming Pavilion 15-dk0009ng i7-9750H, GeForce GTX 1660 Ti Max-Q, Samsung SSD PM981 MZVLB256HAHQ, IPS, 1920x1080, 15.6" | Lenovo Legion Y530-15ICH i7-8750H, GeForce GTX 1060 Mobile, Samsung SSD PM981 MZVLB256HAHQ, IPS, 1920x1080, 15.6" | Lenovo Legion Y540-15IRH i7-9750H, GeForce RTX 2060 Mobile, Samsung PM981a MZVLB1T0HBLR, IPS, 1920x1080, 15.6" | Average NVIDIA GeForce GTX 1660 Ti Mobile | Average of class Gaming | |
|---|---|---|---|---|---|---|---|---|
| Power Consumption | -13% | -34% | 24% | 22% | -14% | -3% | -14% | |
| Idle Minimum * (Watt) | 14.5 | 10.9 25% | 23.5 -62% | 6.8 53% | 7.3 50% | 15 -3% | 12.4 ? 14% | 13.2 ? 9% |
| Idle Average * (Watt) | 18.5 | 14.7 21% | 28 -51% | 10.7 42% | 11.1 40% | 20 -8% | 18 ? 3% | 18.9 ? -2% |
| Idle Maximum * (Watt) | 20 | 32.4 -62% | 32 -60% | 12.5 37% | 12.6 37% | 33 -65% | 25.3 ? -27% | 24.3 ? -22% |
| Load Average * (Watt) | 81.6 | 121.9 -49% | 102.4 -25% | 87.2 -7% | 109 -34% | 88 -8% | 93.5 ? -15% | 108 ? -32% |
| Witcher 3 ultra * (Watt) | 132 | 143.5 -9% | 142.8 -8% | 121 8% | 128 3% | |||
| Load Maximum * (Watt) | 208.1 | 209.6 -1% | 209 -0% | 191.4 8% | 168 19% | 213 -2% | 191.9 ? 8% | 254 ? -22% |
* ... smaller is better
Battery Life
Lenovo equips the Y540-15IRH with a 57 Wh battery, which is on par with most of our comparison devices. However, the company disables the integrated Intel GPU by default, causing the machine to rely on its more powerful NVIDIA GPU for all tasks.
Thankfully, this can be re-enabled in the BIOS, as the Y540-15IRH has dreadful battery life at stock settings. Our review unit lasted just 2:25 hours in our practical Wi-Fi test, which is almost two hours shy of the class average. Re-enabling the integrated GPU allows the device to make use of NVIDIA Optimus, which allows it to switch between GPUs to reduce power consumption. Doing so extended the runtime in our Wi-Fi battery life test by about two hours, which still falls short of the 4:50 hours for which the HP Gaming Pavilion 15 lasted.
Our review unit also needs around 2:30 hours for a full charge with the included power supply.
| Lenovo Legion Y540-15IRH-81SX00B2GE i7-9750H, GeForce GTX 1660 Ti Mobile, 57 Wh | Asus Strix GL531GV-PB74 i7-9750H, GeForce RTX 2060 Mobile, 66 Wh | CUK Model Z GK5CQ7Z i7-9750H, GeForce RTX 2070 Max-Q, 46.74 Wh | HP Gaming Pavilion 15-dk0009ng i7-9750H, GeForce GTX 1660 Ti Max-Q, 52.5 Wh | Lenovo Legion Y530-15ICH i7-8750H, GeForce GTX 1060 Mobile, 52 Wh | Lenovo Legion Y540-15IRH i7-9750H, GeForce RTX 2060 Mobile, 57 Wh | Average of class Gaming | |
|---|---|---|---|---|---|---|---|
| Battery runtime | -21% | 25% | 72% | 32% | 5% | 108% | |
| Reader / Idle (h) | 4 | 8.7 117% | 8.3 108% | 3.9 -2% | 8.71 ? 118% | ||
| WiFi v1.3 (h) | 2.4 | 1.9 -21% | 3 25% | 4.8 100% | 3.8 58% | 3.2 33% | 7.02 ? 193% |
| Load (h) | 1.3 | 1.3 0% | 0.4 -69% | 1.1 -15% | 1.47 ? 13% | ||
| Witcher 3 ultra (h) | 1 |
Pros
Cons
Verdict
The Lenovo Legion Y540-15IRH remains a powerful gaming laptop that can run all modern triple-A games at 1080p, despite the switch to a GeForce GTX 1660 Ti GPU. While the Turing card does not support DLSS or ray tracing like the RTX 2060 does, the latter is not powerful enough to fully utilise these new technologies, so you would not be missing out on features by choosing the GTX 1660 Ti over the RTX 2060.
In short, the Y540-15IRH is a midrange gaming laptop that can maintain its potential over prolonged periods thanks to its decent cooling system. The device has good maintenance options too and a 2.5-inch drive bay should you need additional storage.
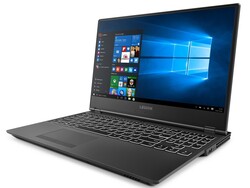
The Lenovo Legion Y540-15IRH-81SX00B2GE is a powerful gaming laptop despite the absence of RTX graphics.
The main oddity about the Y540-15IRH is Lenovo’s decision to disable the integrated GPU by default, which leaves the GTX 1660 Ti permanently active. Correspondingly, our review unit has woeful battery life at stock settings, but it is possible to enable the integrated GPU in the BIOS, which dramatically improves runtimes. Impracticalities aside, the Lenovo Legion Y540-15IRH is an excellent device for the money and one that we recommend if you are in the market for a 15.6-inch gaming laptop.
Lenovo Legion Y540-15IRH-81SX00B2GE
- 05/15/2020 v7 (old)
Mike Wobker
Price comparison

