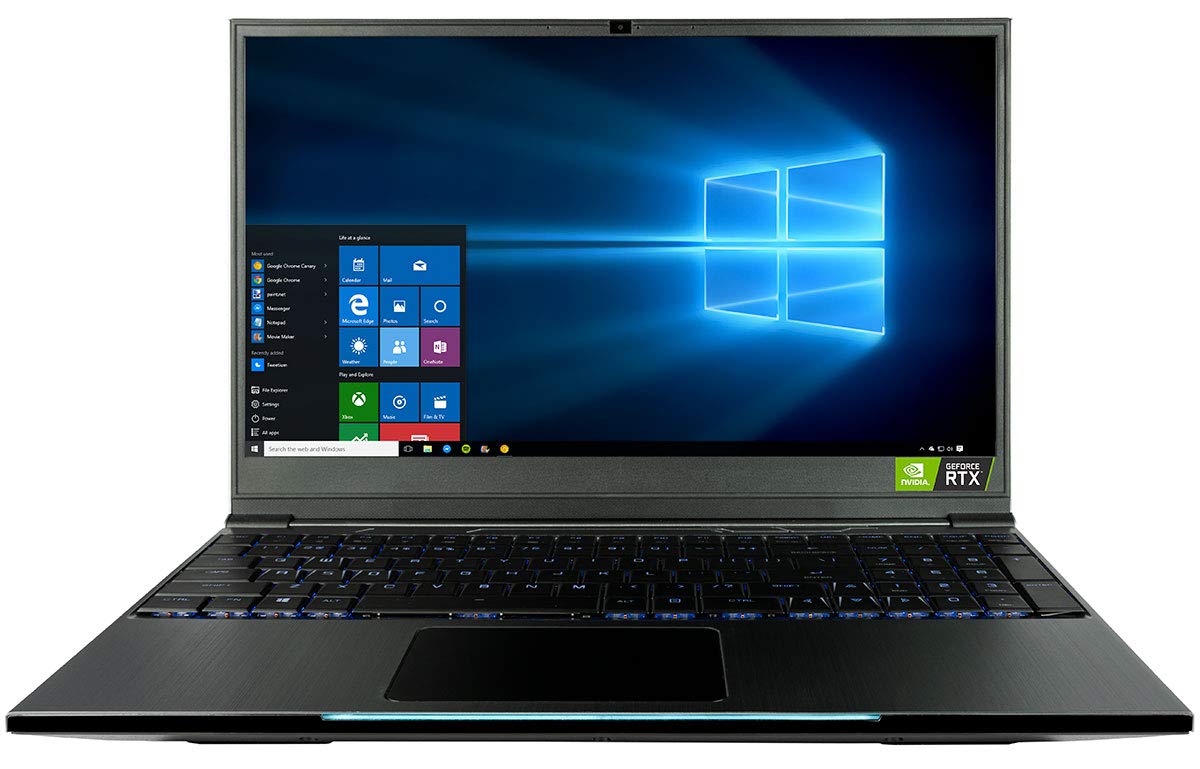
CUK Model Z (i7 9750H, RTX 2070 Max-Q) Tongfang GK5CQ7Z Laptop Review

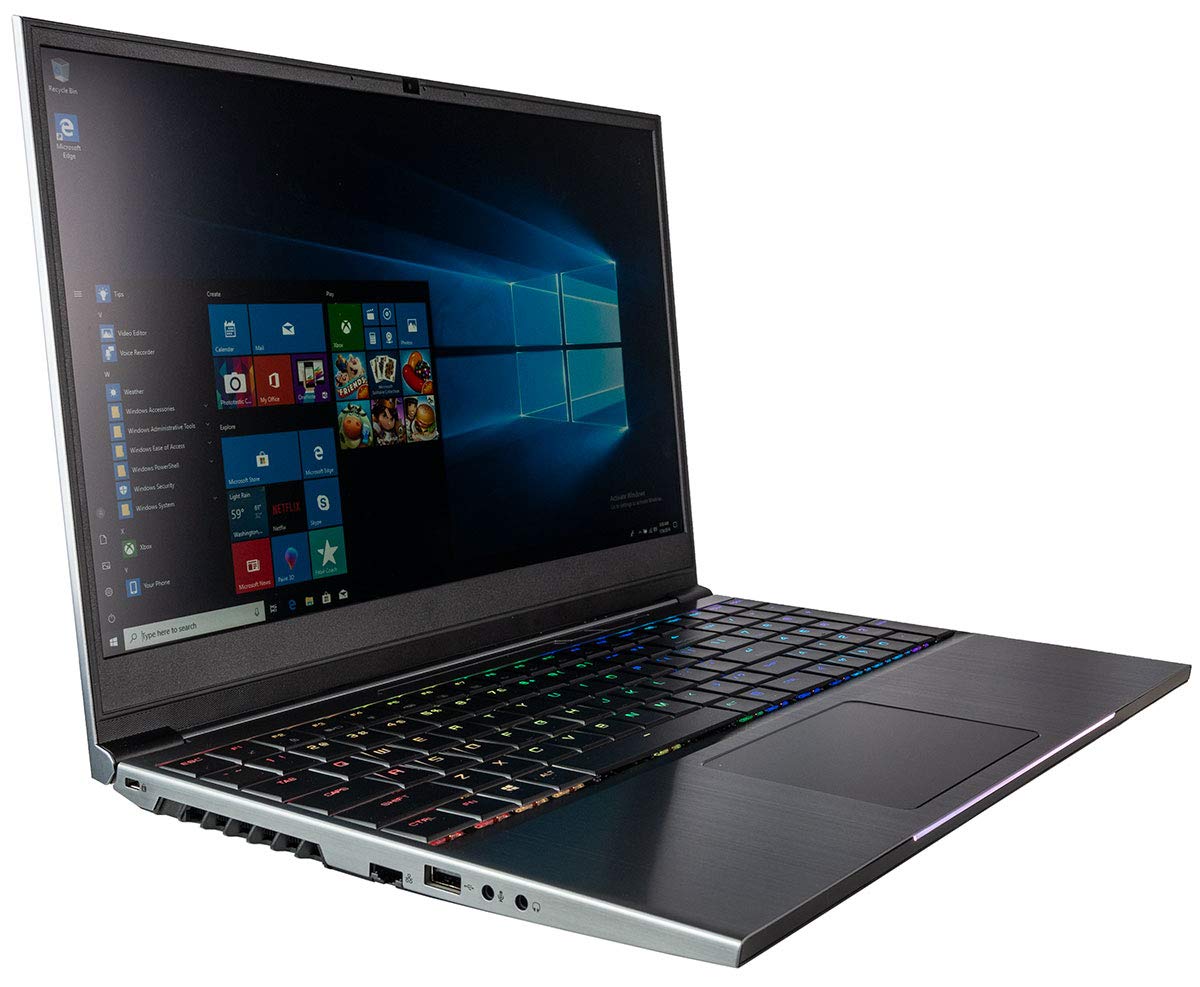
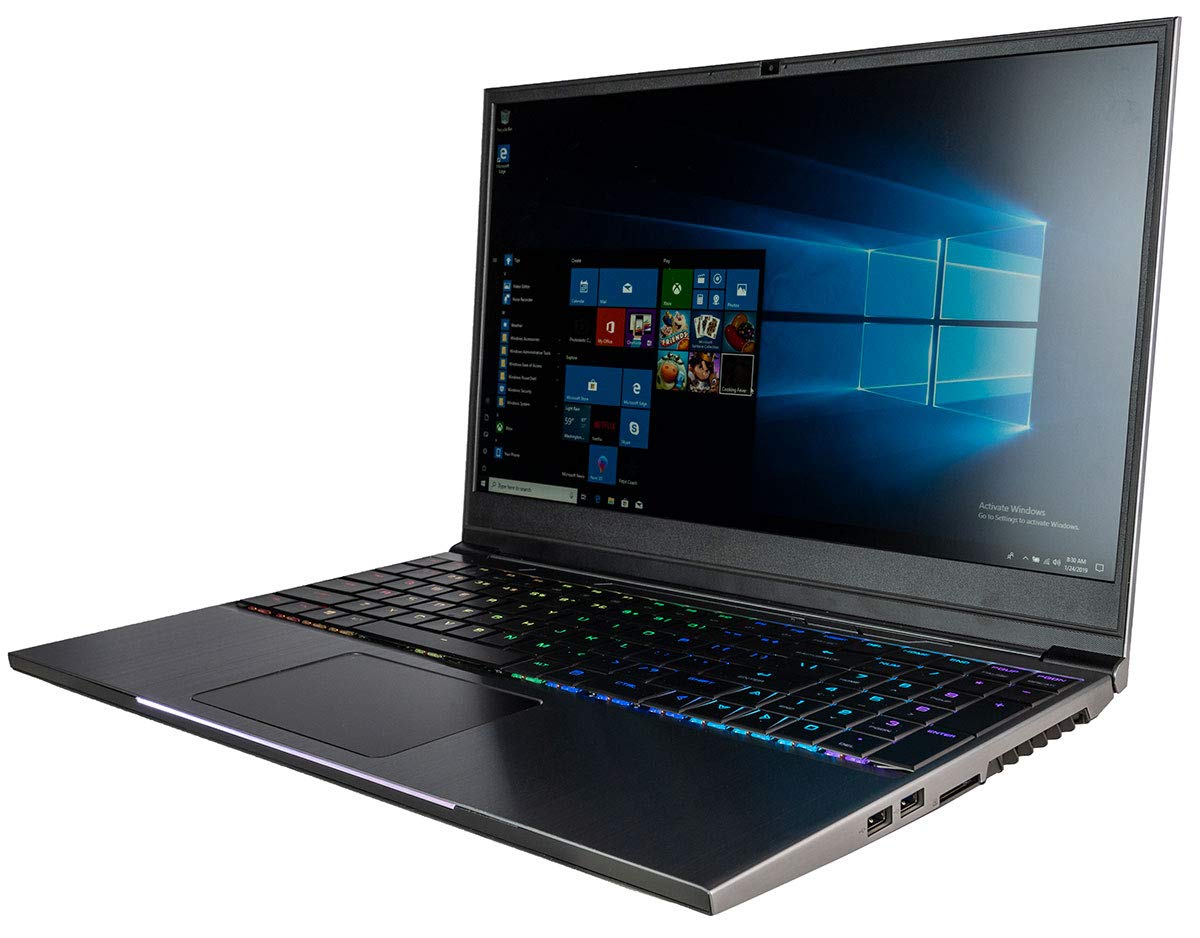
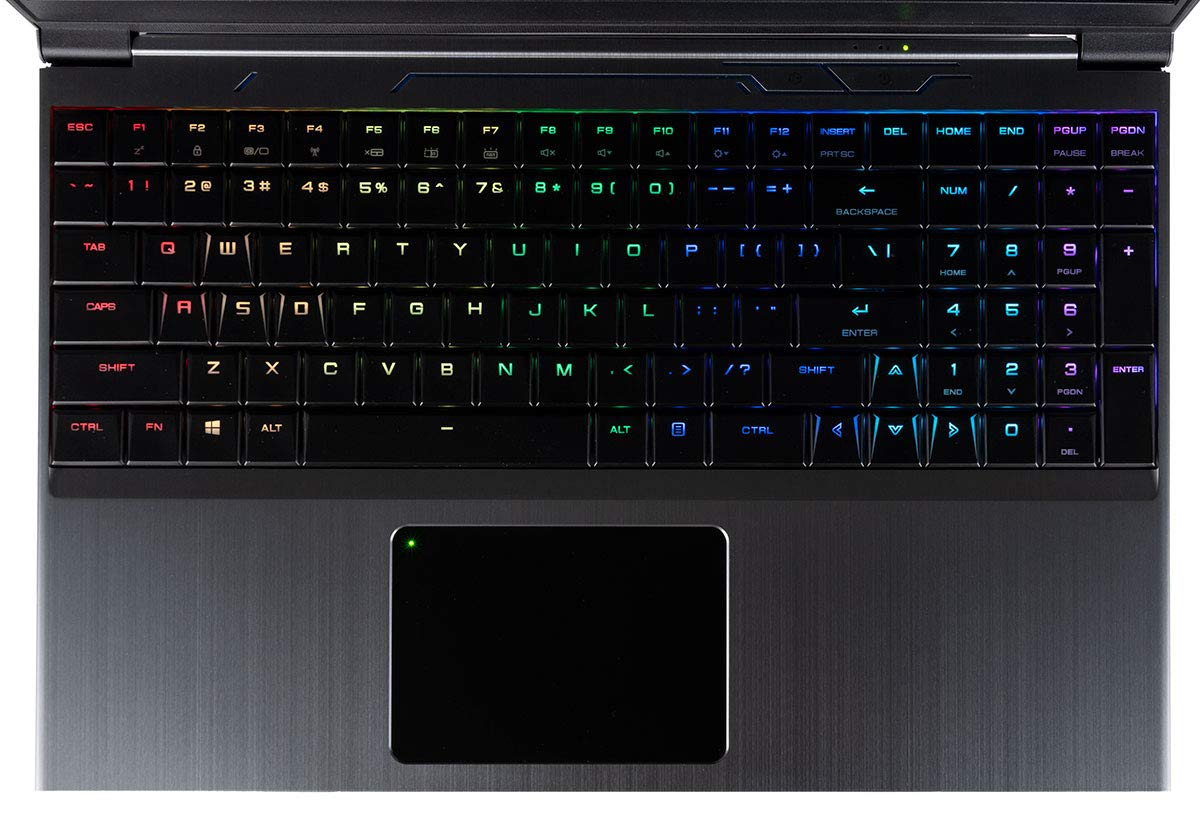
The 15.6-inch CUK Model Z gaming laptop is based on the Tongfang GK5CQ7Z chassis that is very similar to the Walmart Overpowered 15, Eluktronics Mech-15 G2, Origin PC RTS EON15-S, and CyberpowerPC Tracer III 15Z Slim. As a result, we've already checked out this machine in two other configurations with the Core i7-8750H and GTX 1060 instead of the Core i7-9750H and RTX 2070 Max-Q GPU we have here. We therefore recommend checking out our existing reviews on the Tongfang GK5CQ7Z as more information about the chassis, mechanical keyboard keys, display, speakers, and other features can all be found there.
What makes the Model Z particularly interesting, however, is that it ships with a 230 W AC adapter whereas our previous 15.6-inch Tongfang SKUs shipped with 180 W AC adapters. Does the more capable AC adapter make a difference when gaming?
The thin CUK Model Z competes directly with other 15.6-inch midrange-enthusiast gaming laptops including the MSI GS65, Razer Blade 15, Dell Alienware m15, Asus Zephyrus GX531, Acer Predator Helios 500, Aorus X5, and the Lenovo Legion Y740. The system is currently available on Amazon for $1500 to $2000 depending on the CPU, GPU, or storage option.
More Tongfang reviews:
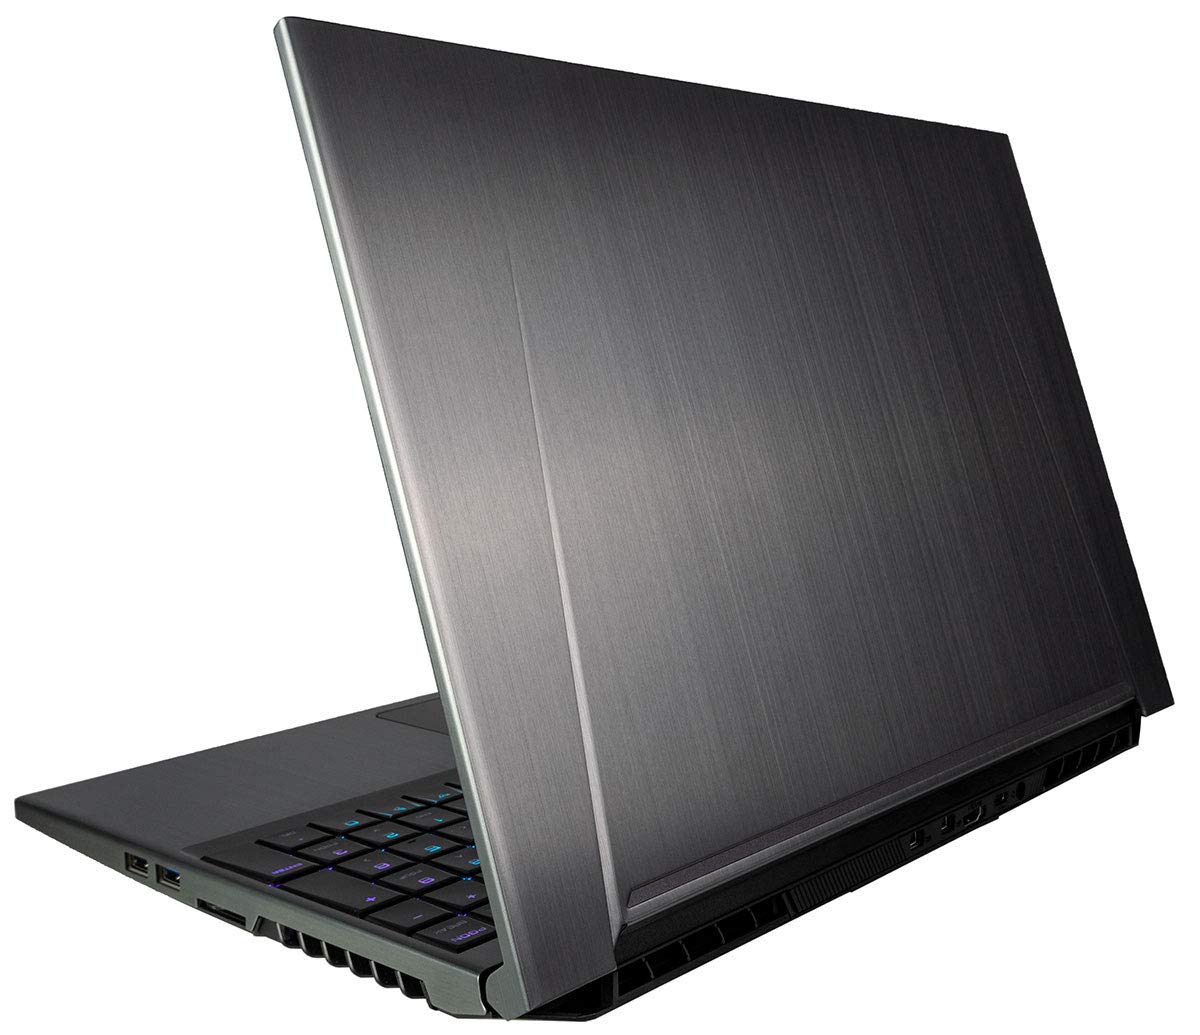
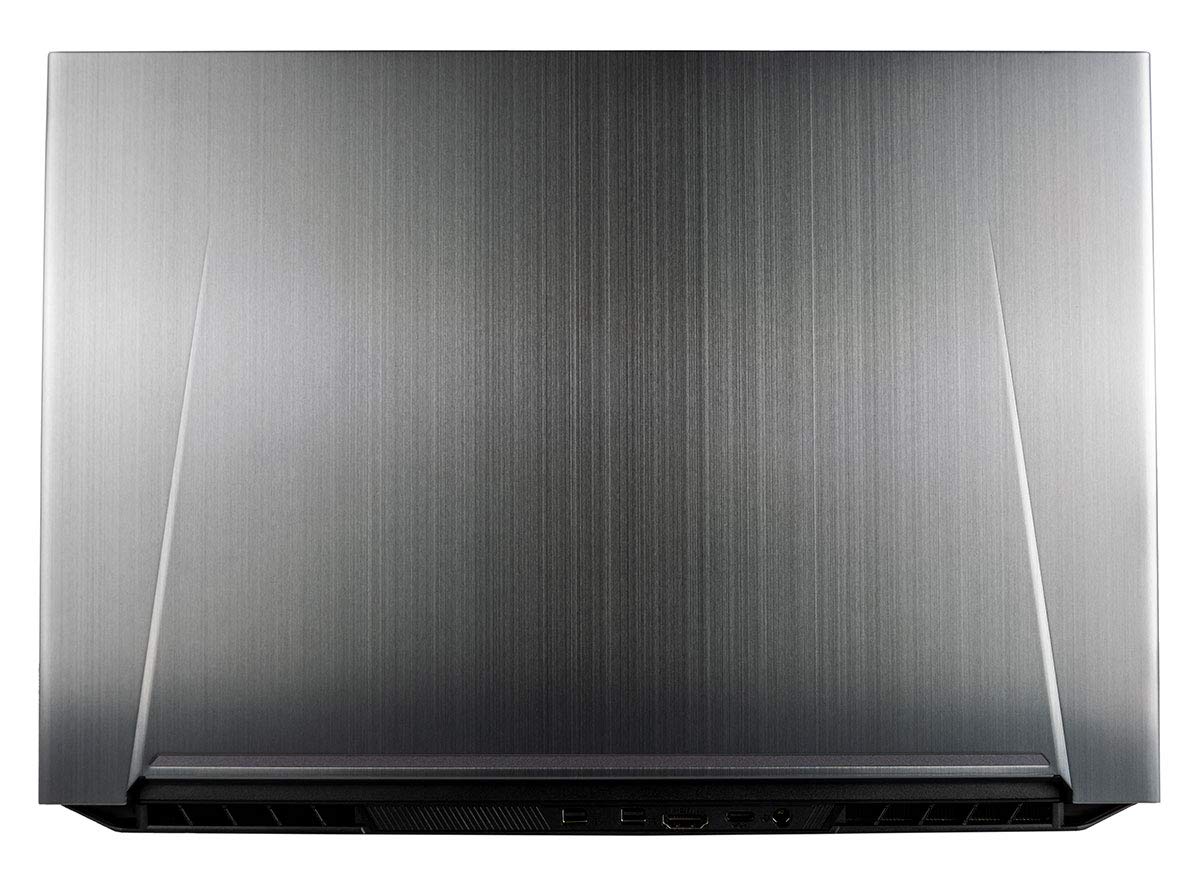
Case
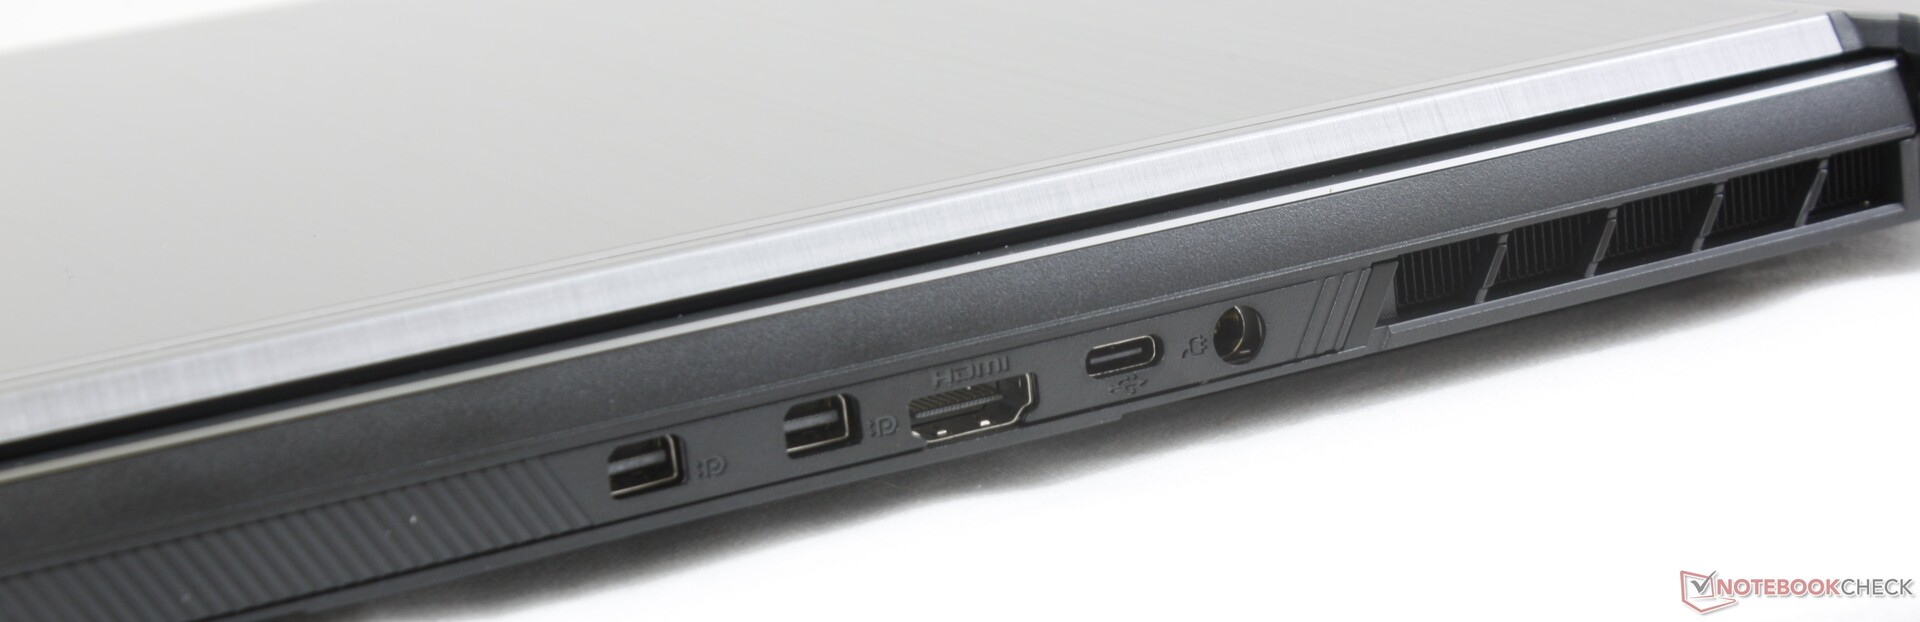
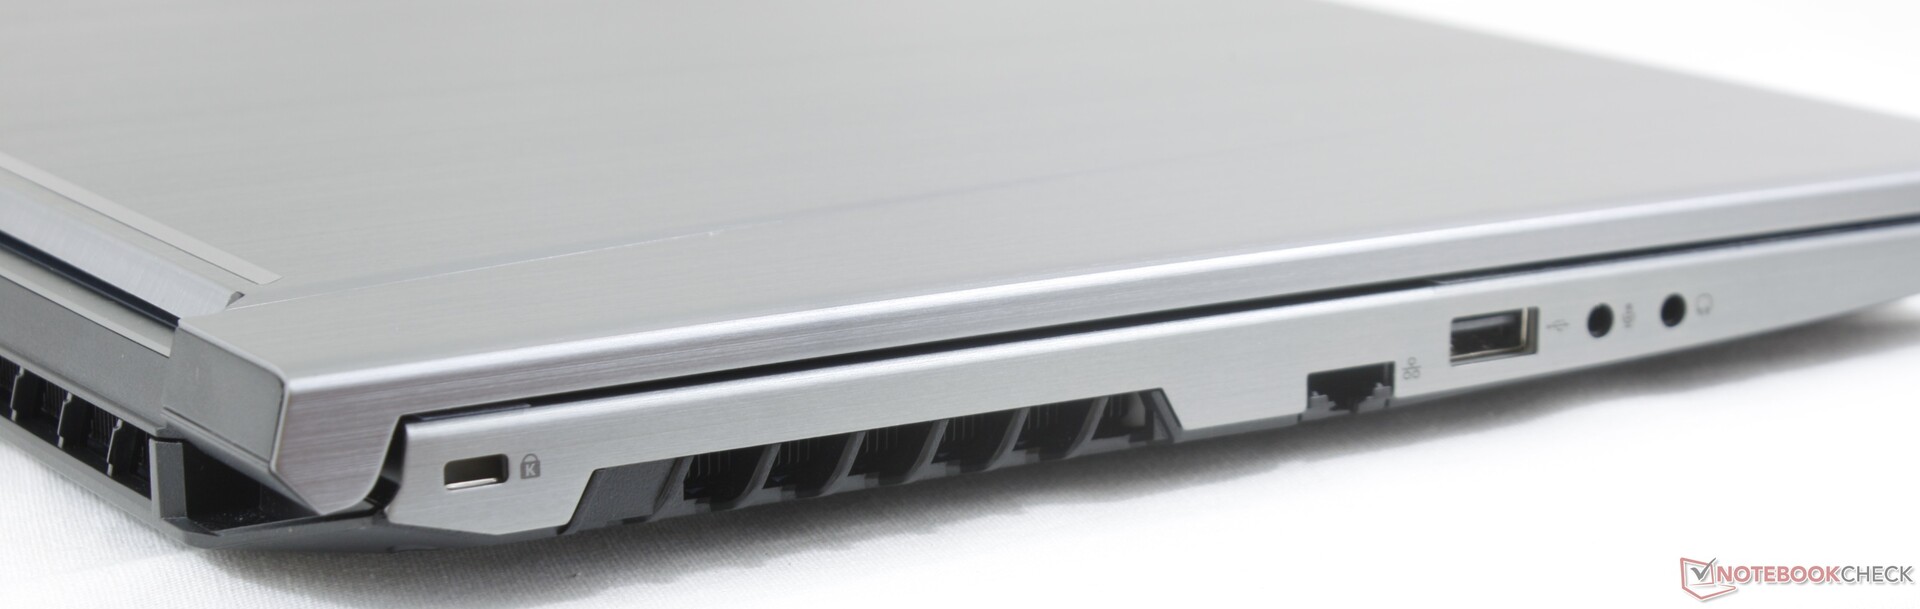
Connectivity
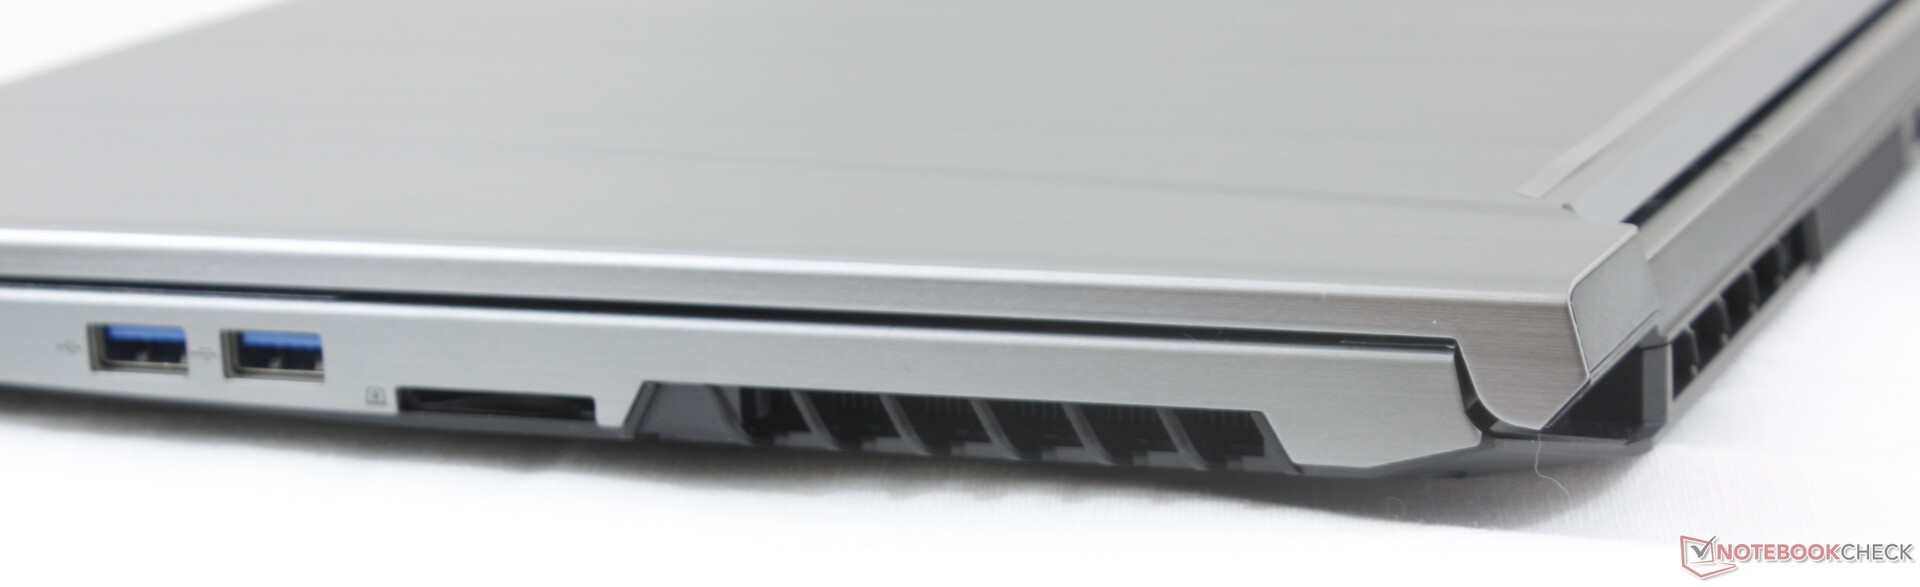
SD Card Reader
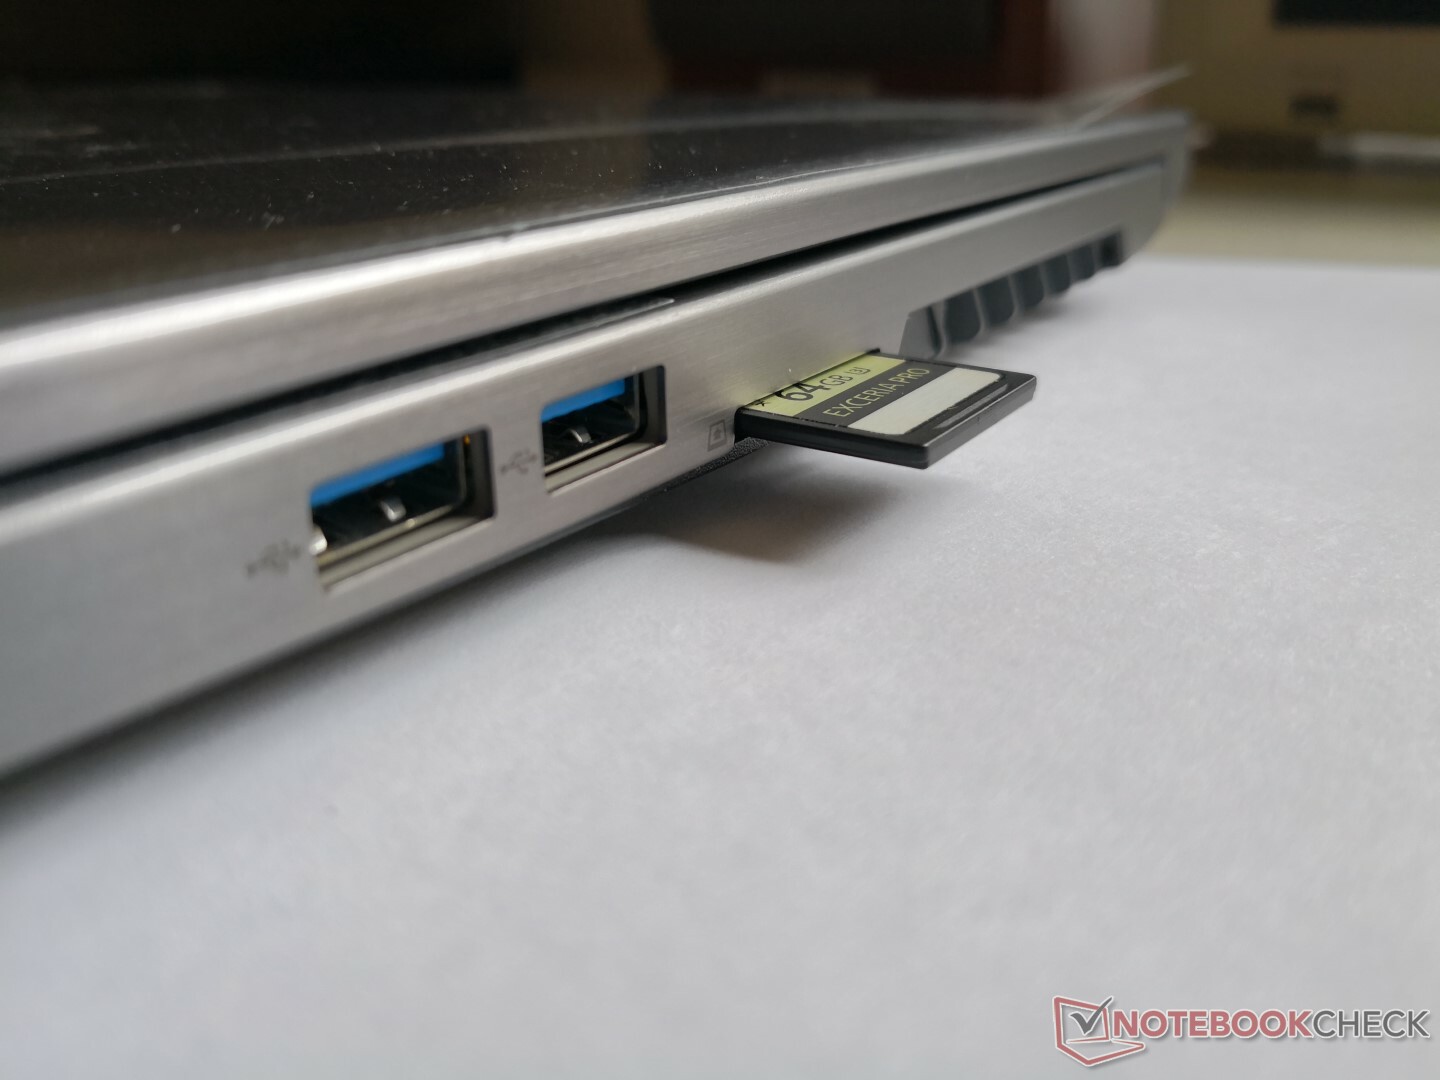
Transfer rates from the integrated card reader is limited to about 87 MB/s compared to twice that on the XPS 15 or Eurocom SKy X4C. Note that a fully inserted SD card will still protrude by over two-third its length.
| SD Card Reader | |
| average JPG Copy Test (av. of 3 runs) | |
| Eurocom Sky X4C (Toshiba Exceria Pro SDXC 64 GB UHS-II) | |
| CUK Model Z GK5CQ7Z (Toshiba Exceria Pro SDXC 64 GB UHS-II) | |
| HP Omen 15-dc0015ng (Toshiba Exceria Pro SDXC 64 GB UHS-II) | |
| Asus FX503VM-EH73 (Toshiba Exceria Pro SDXC 64 GB UHS-II) | |
| maximum AS SSD Seq Read Test (1GB) | |
| Eurocom Sky X4C (Toshiba Exceria Pro SDXC 64 GB UHS-II) | |
| CUK Model Z GK5CQ7Z (Toshiba Exceria Pro SDXC 64 GB UHS-II) | |
| Asus FX503VM-EH73 (Toshiba Exceria Pro SDXC 64 GB UHS-II) | |
| HP Omen 15-dc0015ng (Toshiba Exceria Pro SDXC 64 GB UHS-II) | |
Communication
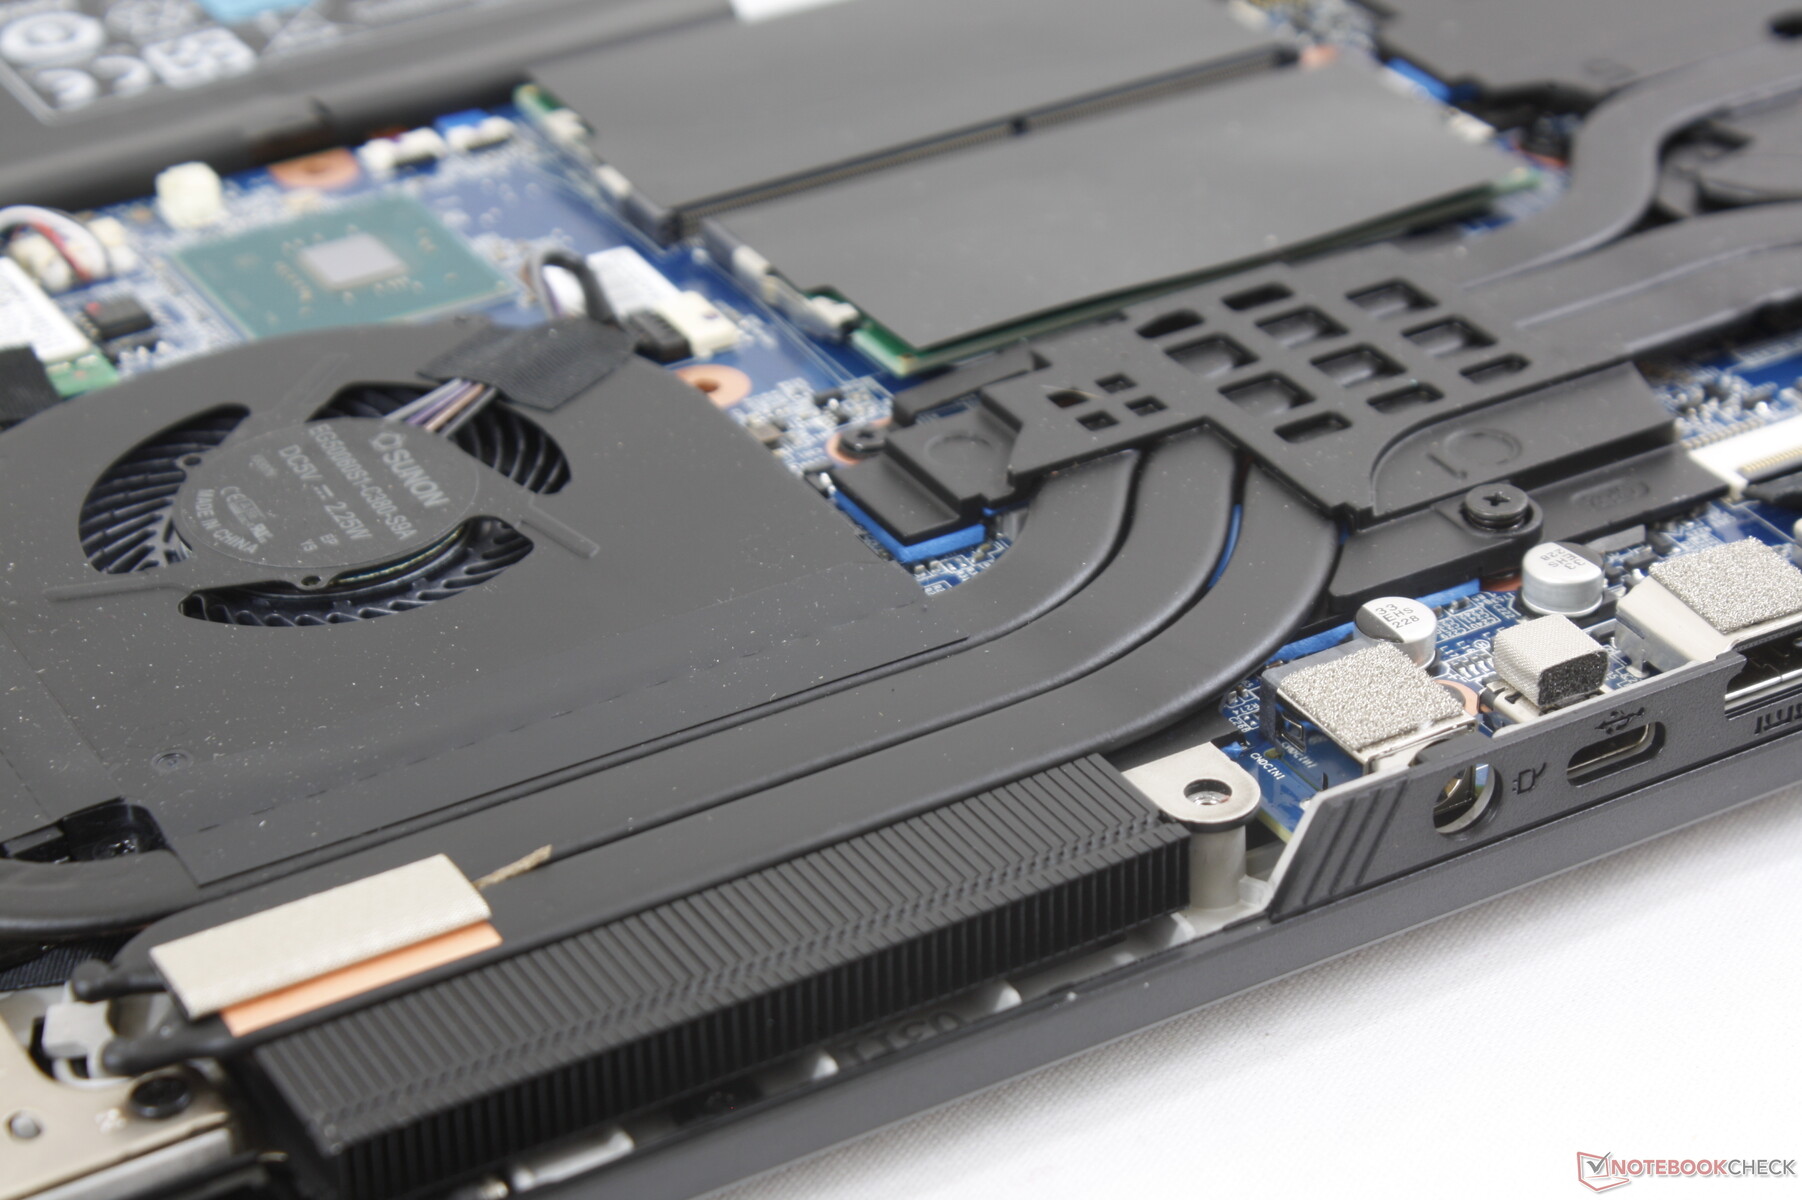
Maintenance
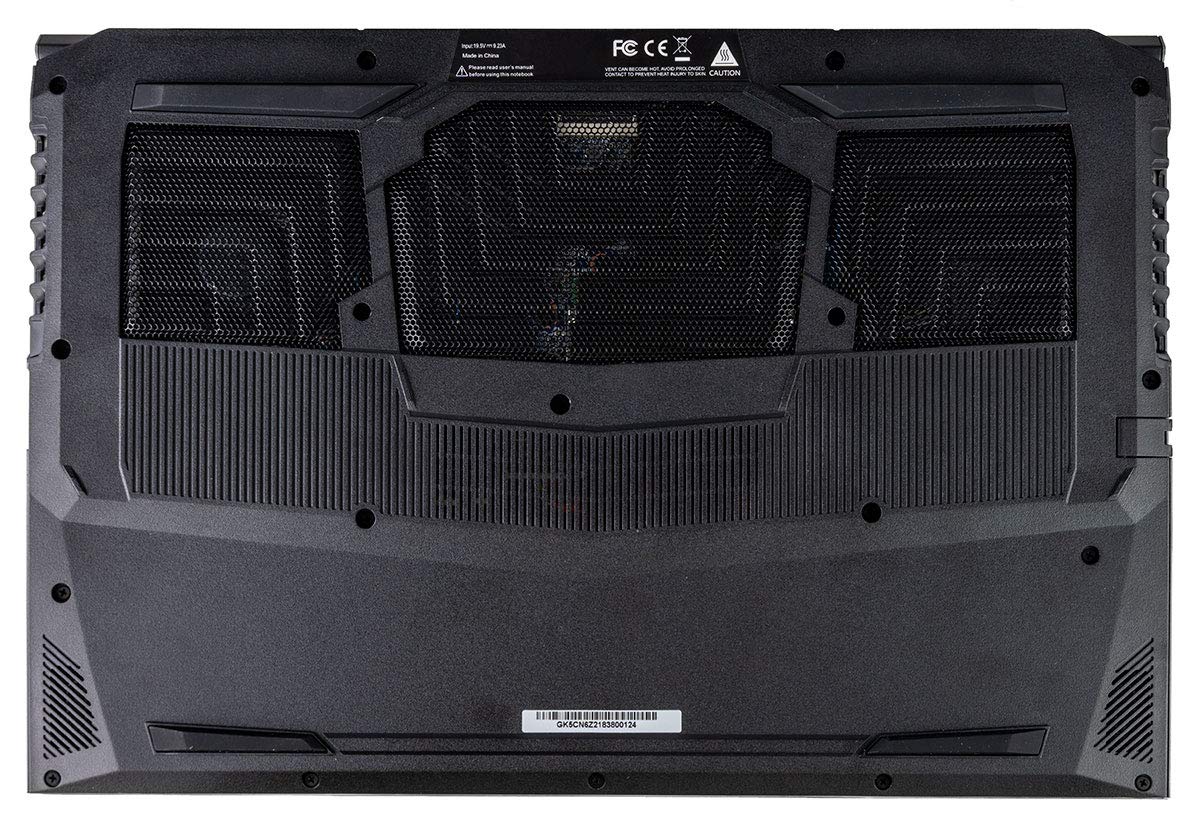
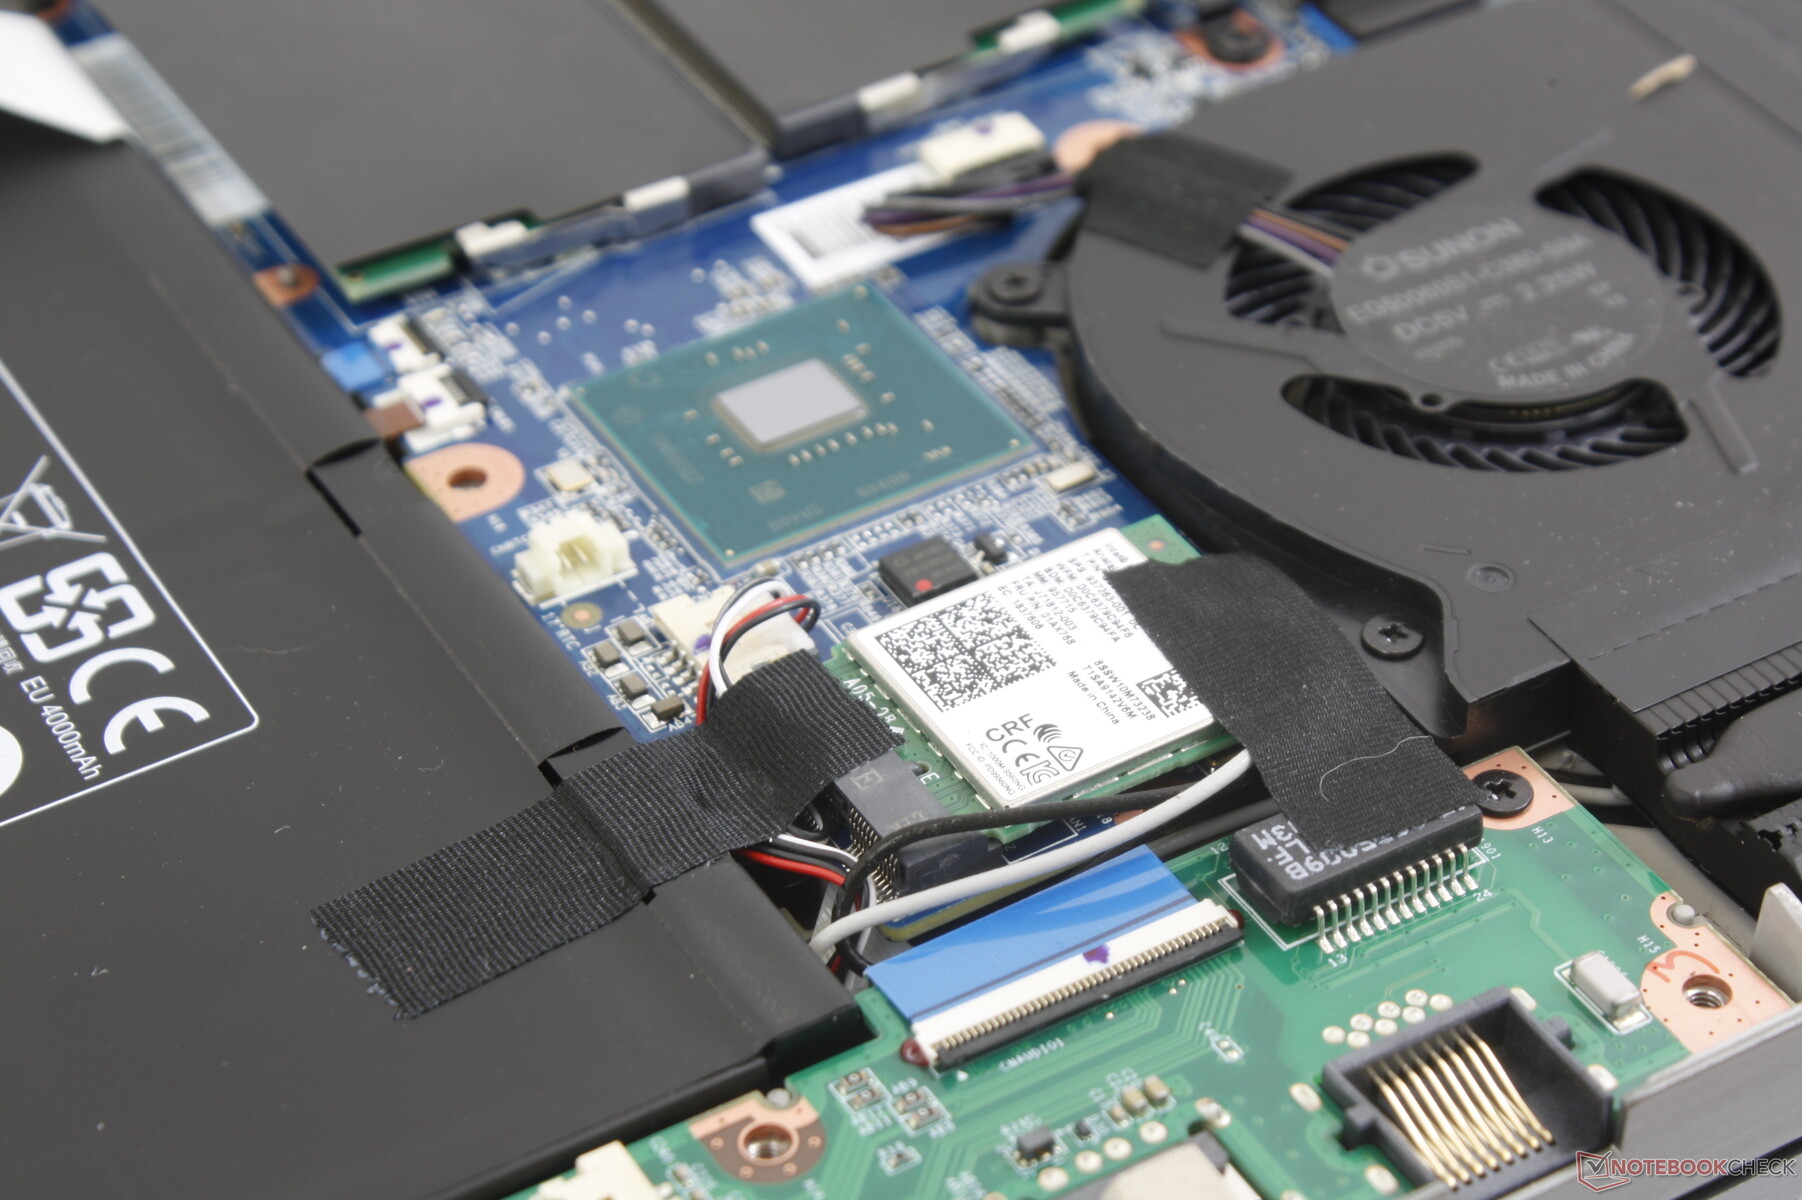
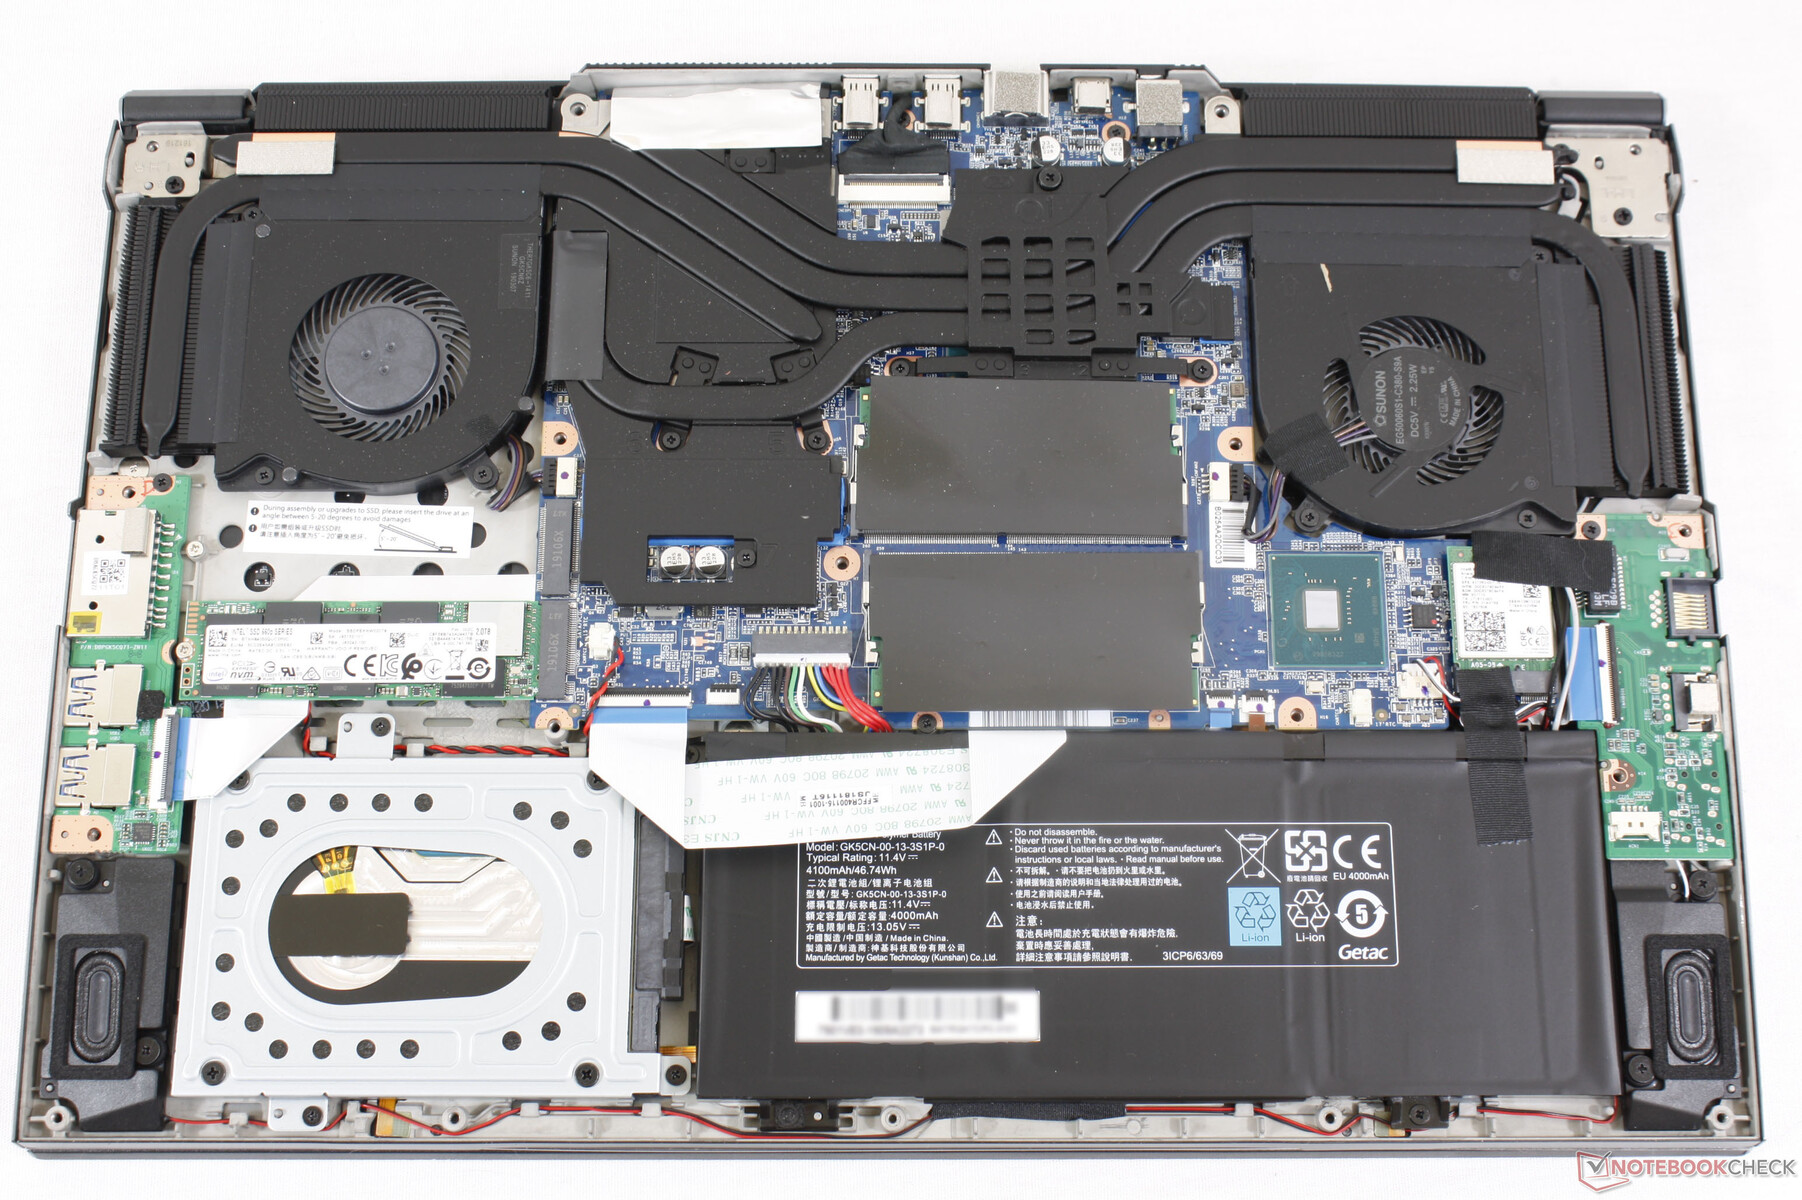
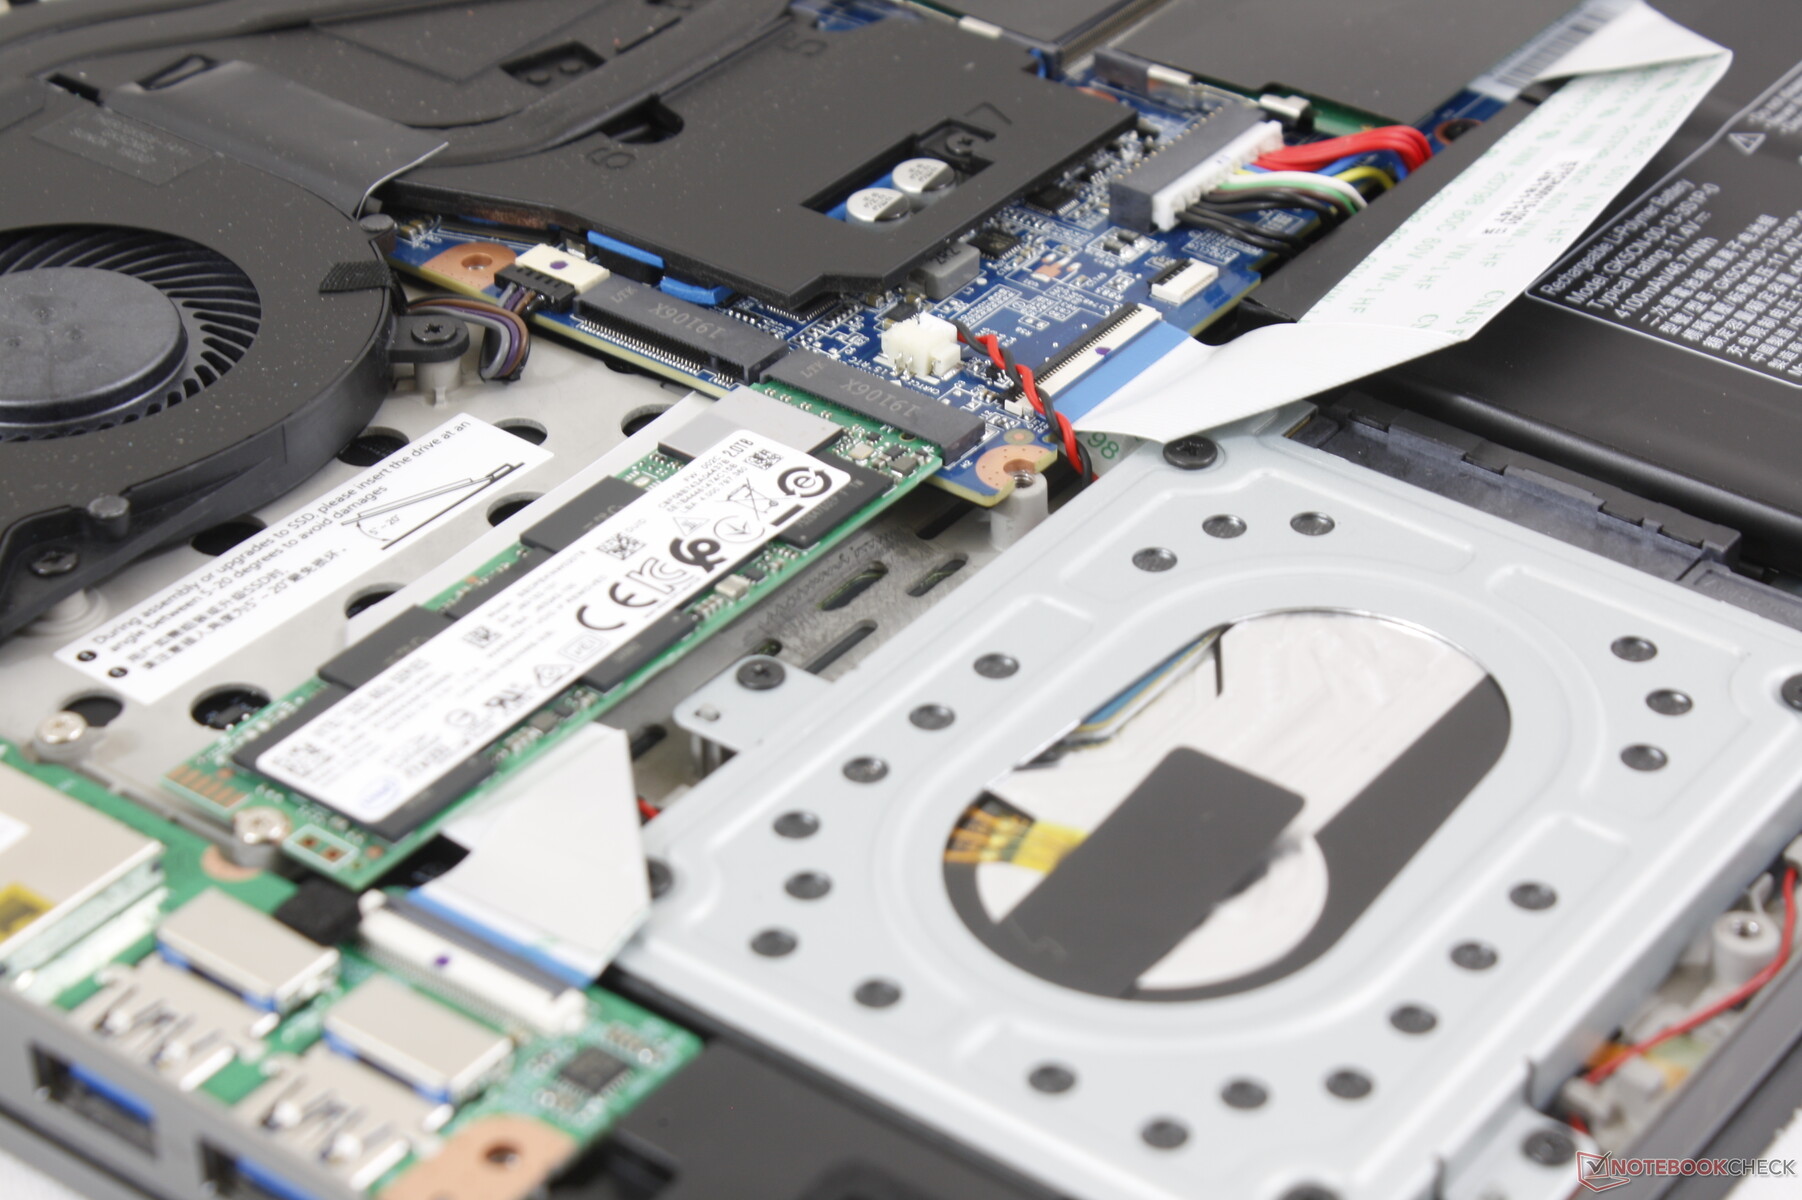
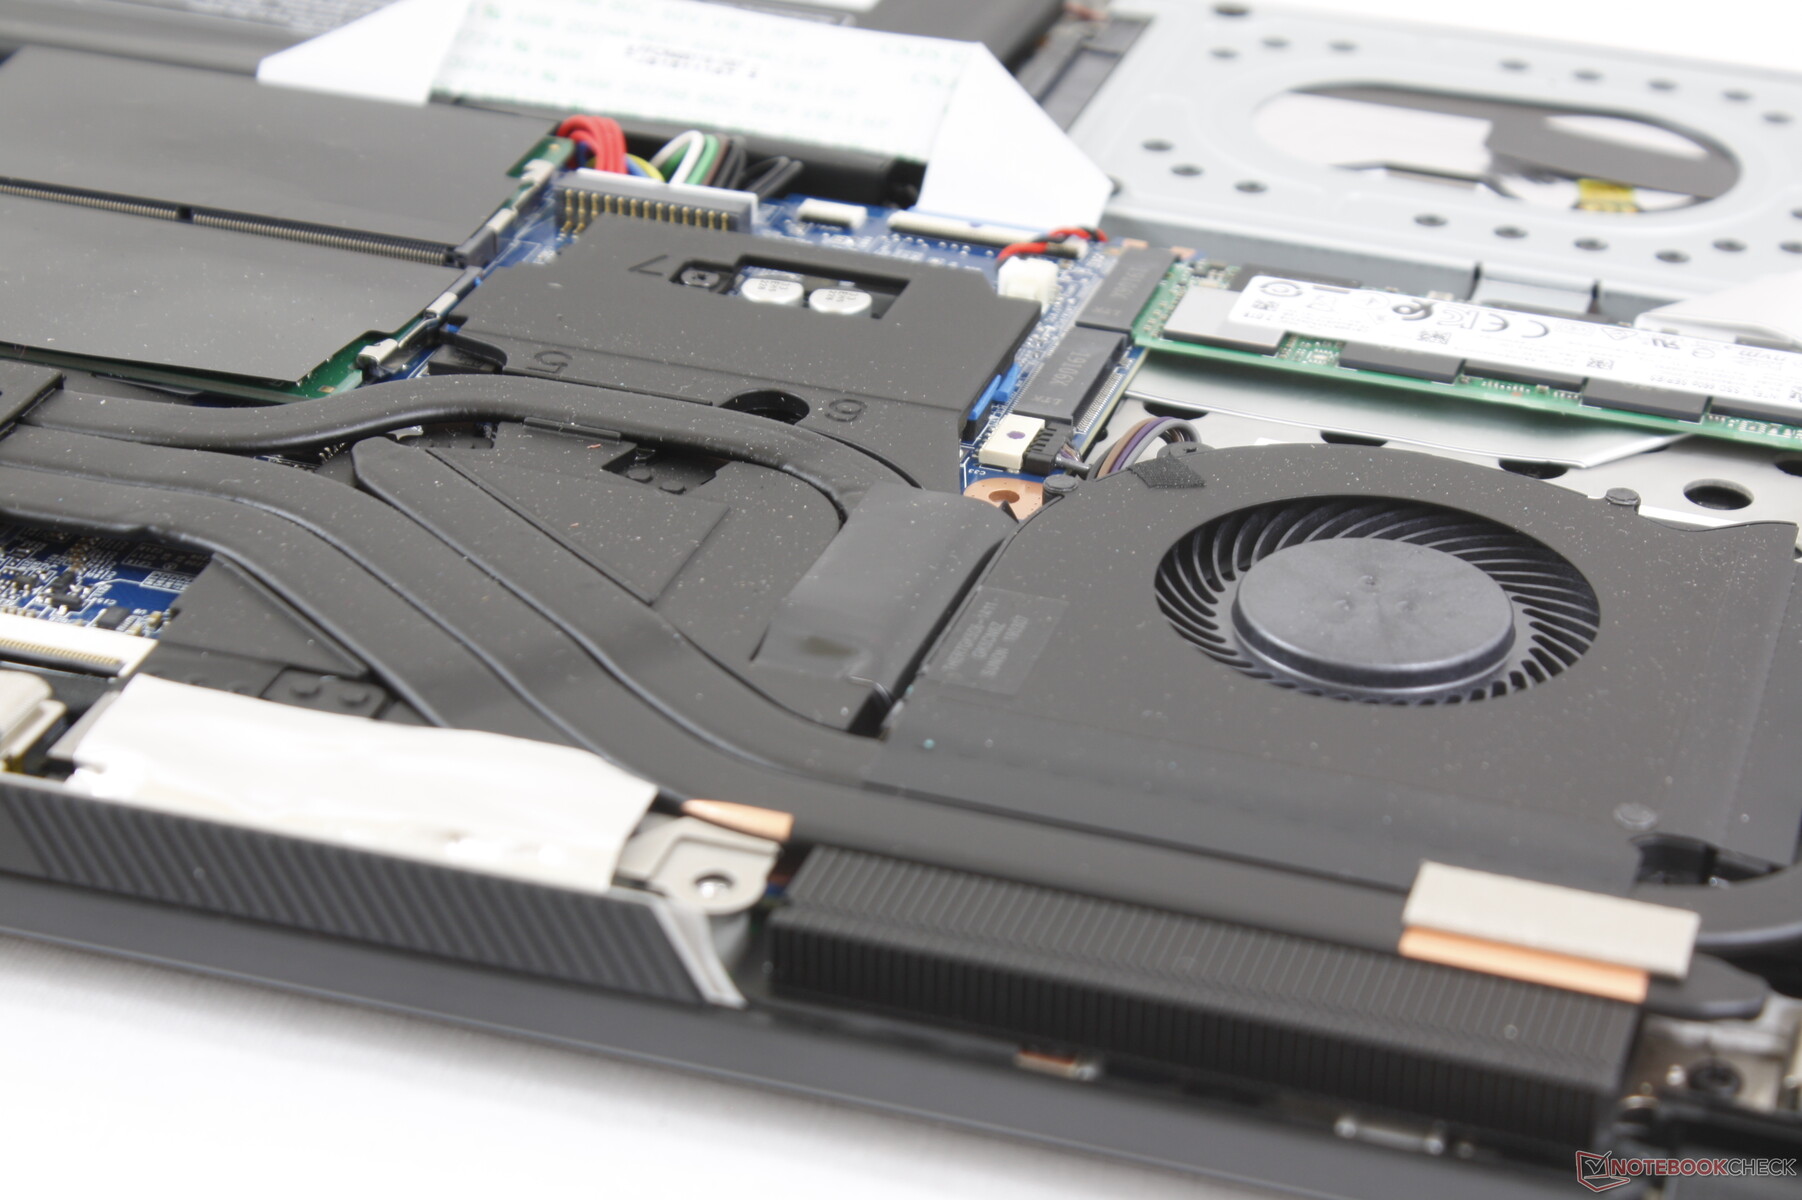
Not all Tongfang GK5CQ7Z chassis designs are created equal. As shown by our images below, our Model Z is equipped with a 2.5-inch SATA III bay which occupies a portion of the internal battery whereas our first Schenker XMG Neto 15 Tongfang GK5CN6Z did not have this option. Battery capacity is therefore smaller at just 46.7 Wh compared to 62.3 Wh inside our Schenker.
Warranty
The standard one-year limited manufacturer warranty applies. CUK offers three-year warranty on "all modified components from the original purchase date". It's unclear if the standard warranty for the Model Z is one-year or three-years since the chassis is a CUK brand and not from a third party like HP or Lenovo.
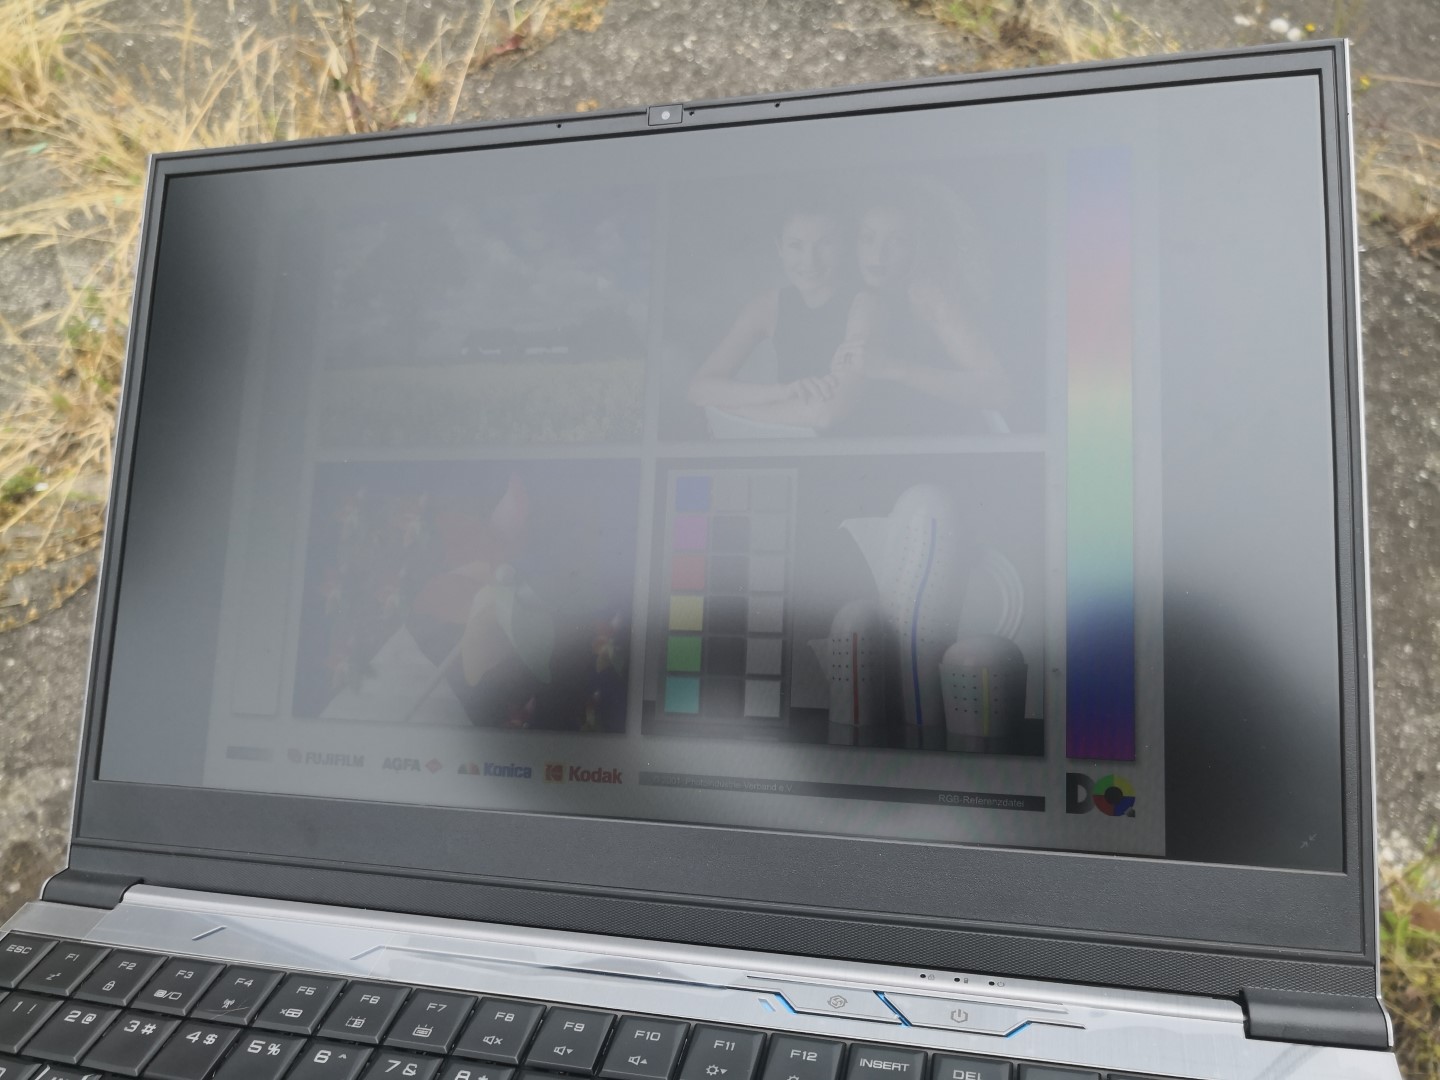
Display
The CUK Model Z utilizes the same LG Philips LGD05C0 panel as found on the Razer Blade 15. Thus, both of these laptops share similarly fast black-white and gray-gray response times, good contrast ratio of about 800:1, almost 100 percent sRGB coverage, and a native 144 Hz refresh rate for ultra-smooth animations. Such a panel was only available on a small handful of gaming laptops early last year and it has now become almost commonplace. Cheaper laptops like the Asus ROG GA502 are still shipping with basic 60 Hz IPS panels that almost always offer slower response times for noticeably more ghosting.
Graininess is a non-issue as texts and images appear almost as crisp as on a glossy panel and uneven backlight bleeding is minimal.


| |||||||||||||||||||||||||
Brightness Distribution: 87 %
Center on Battery: 306.8 cd/m²
Contrast: 807:1 (Black: 0.38 cd/m²)
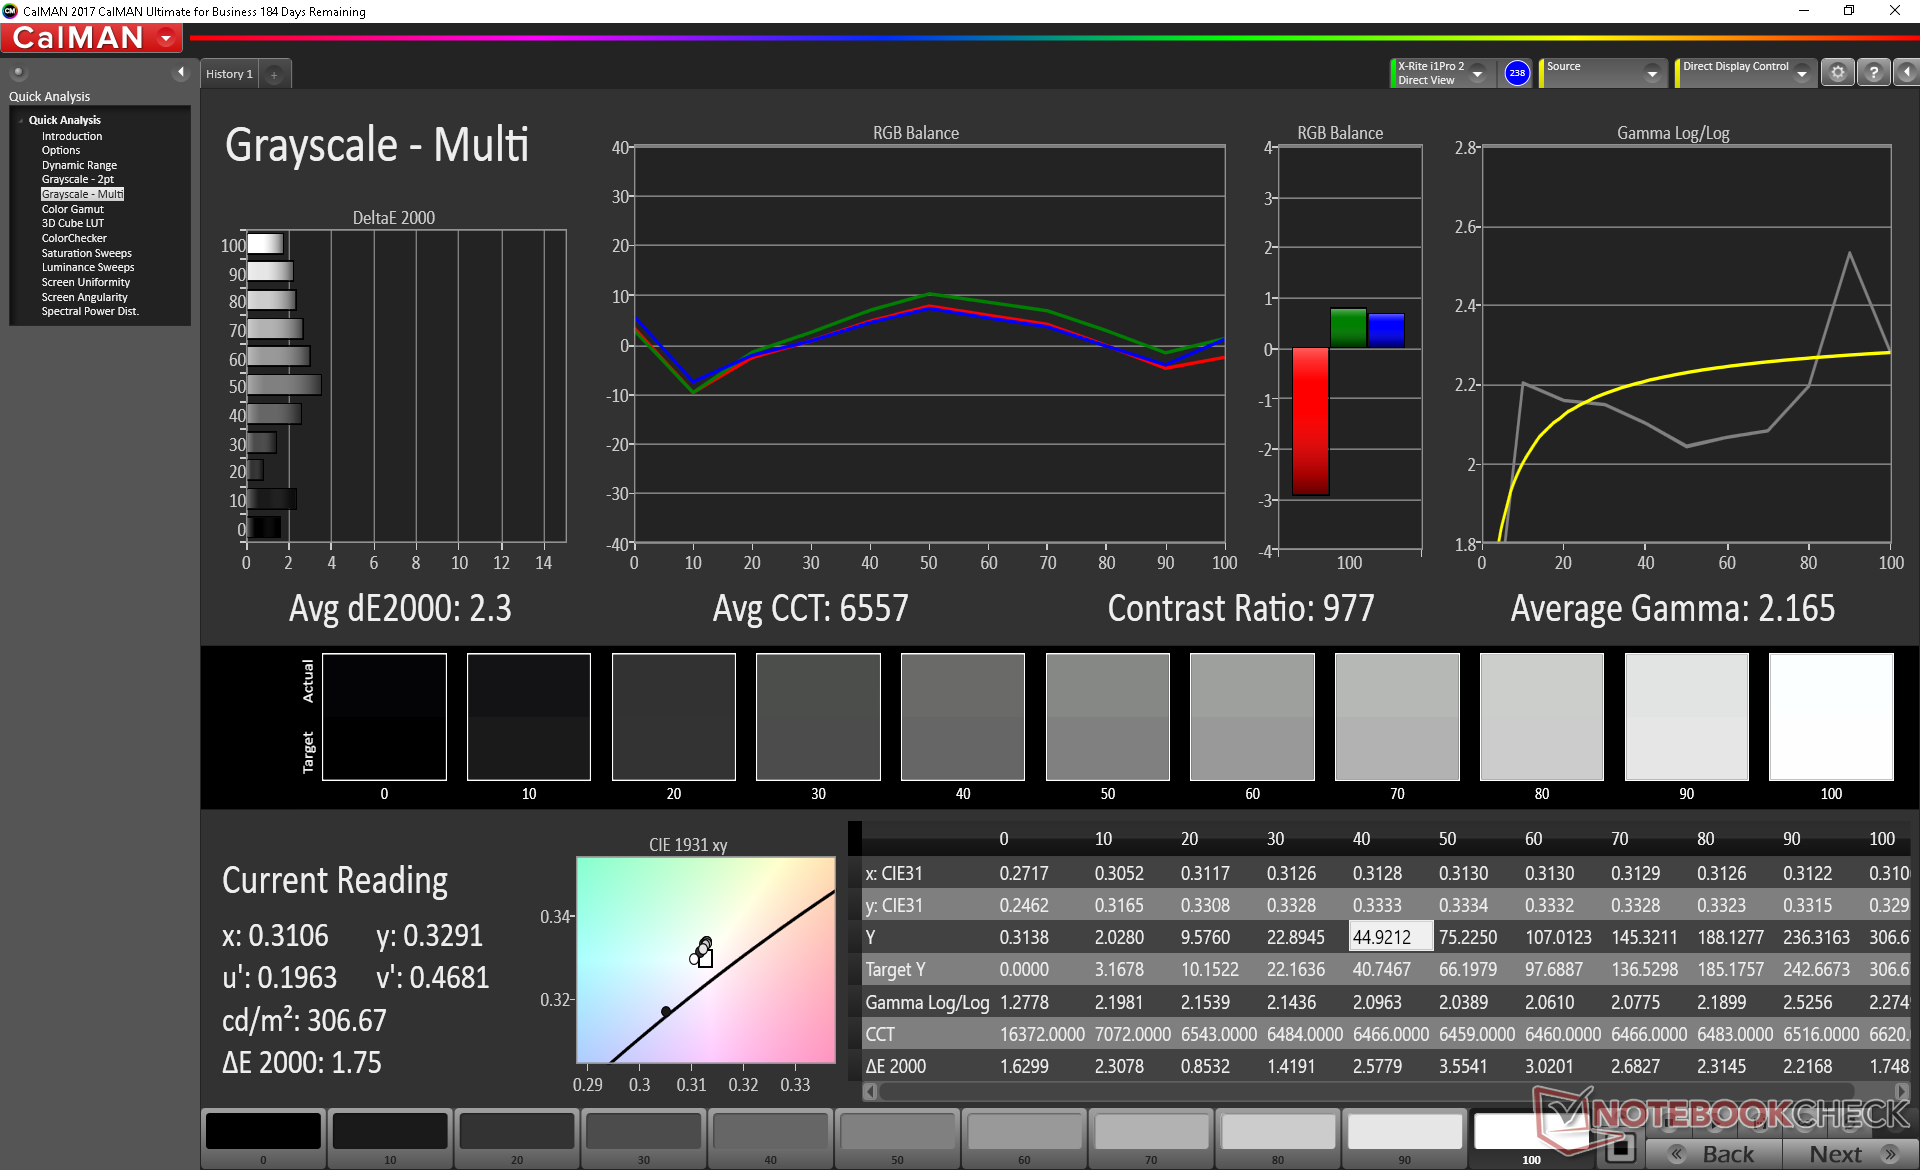
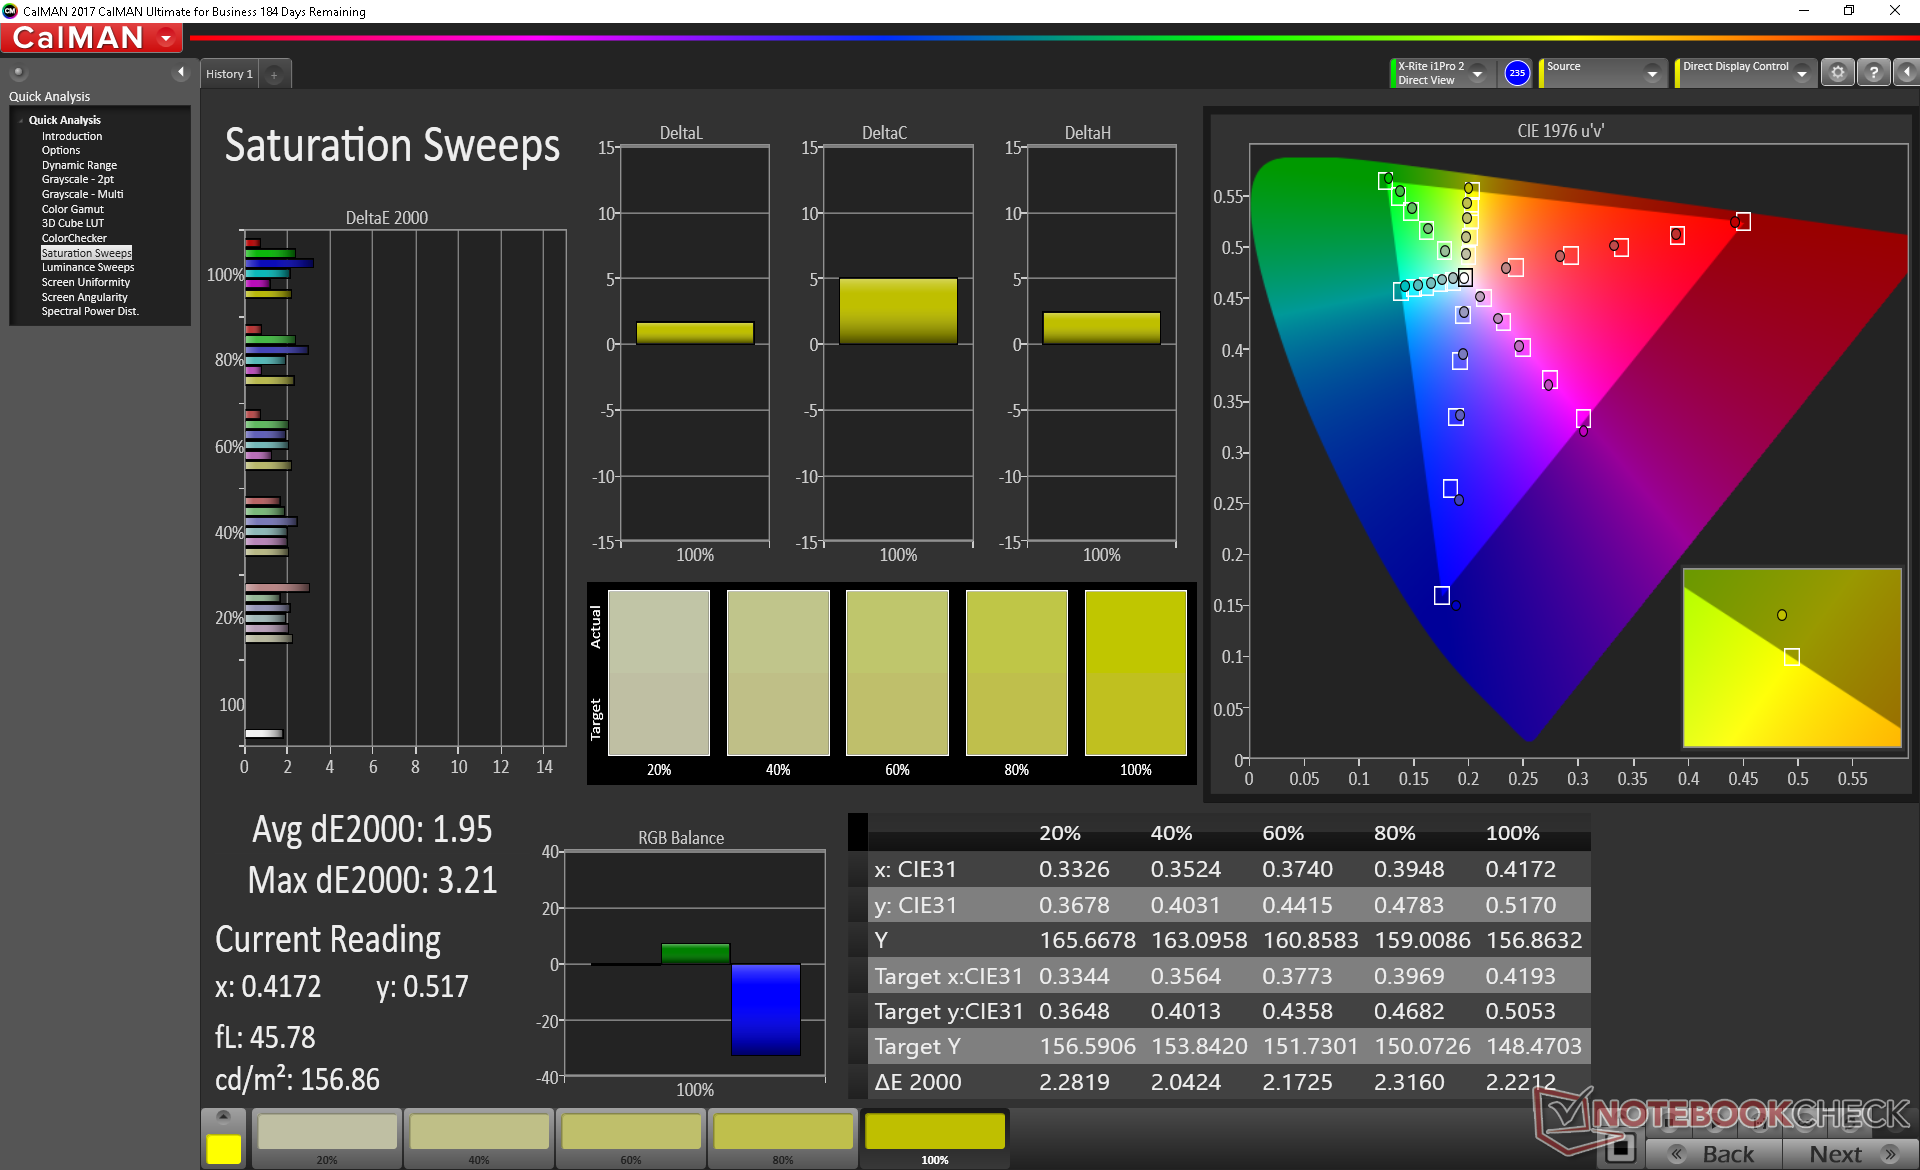
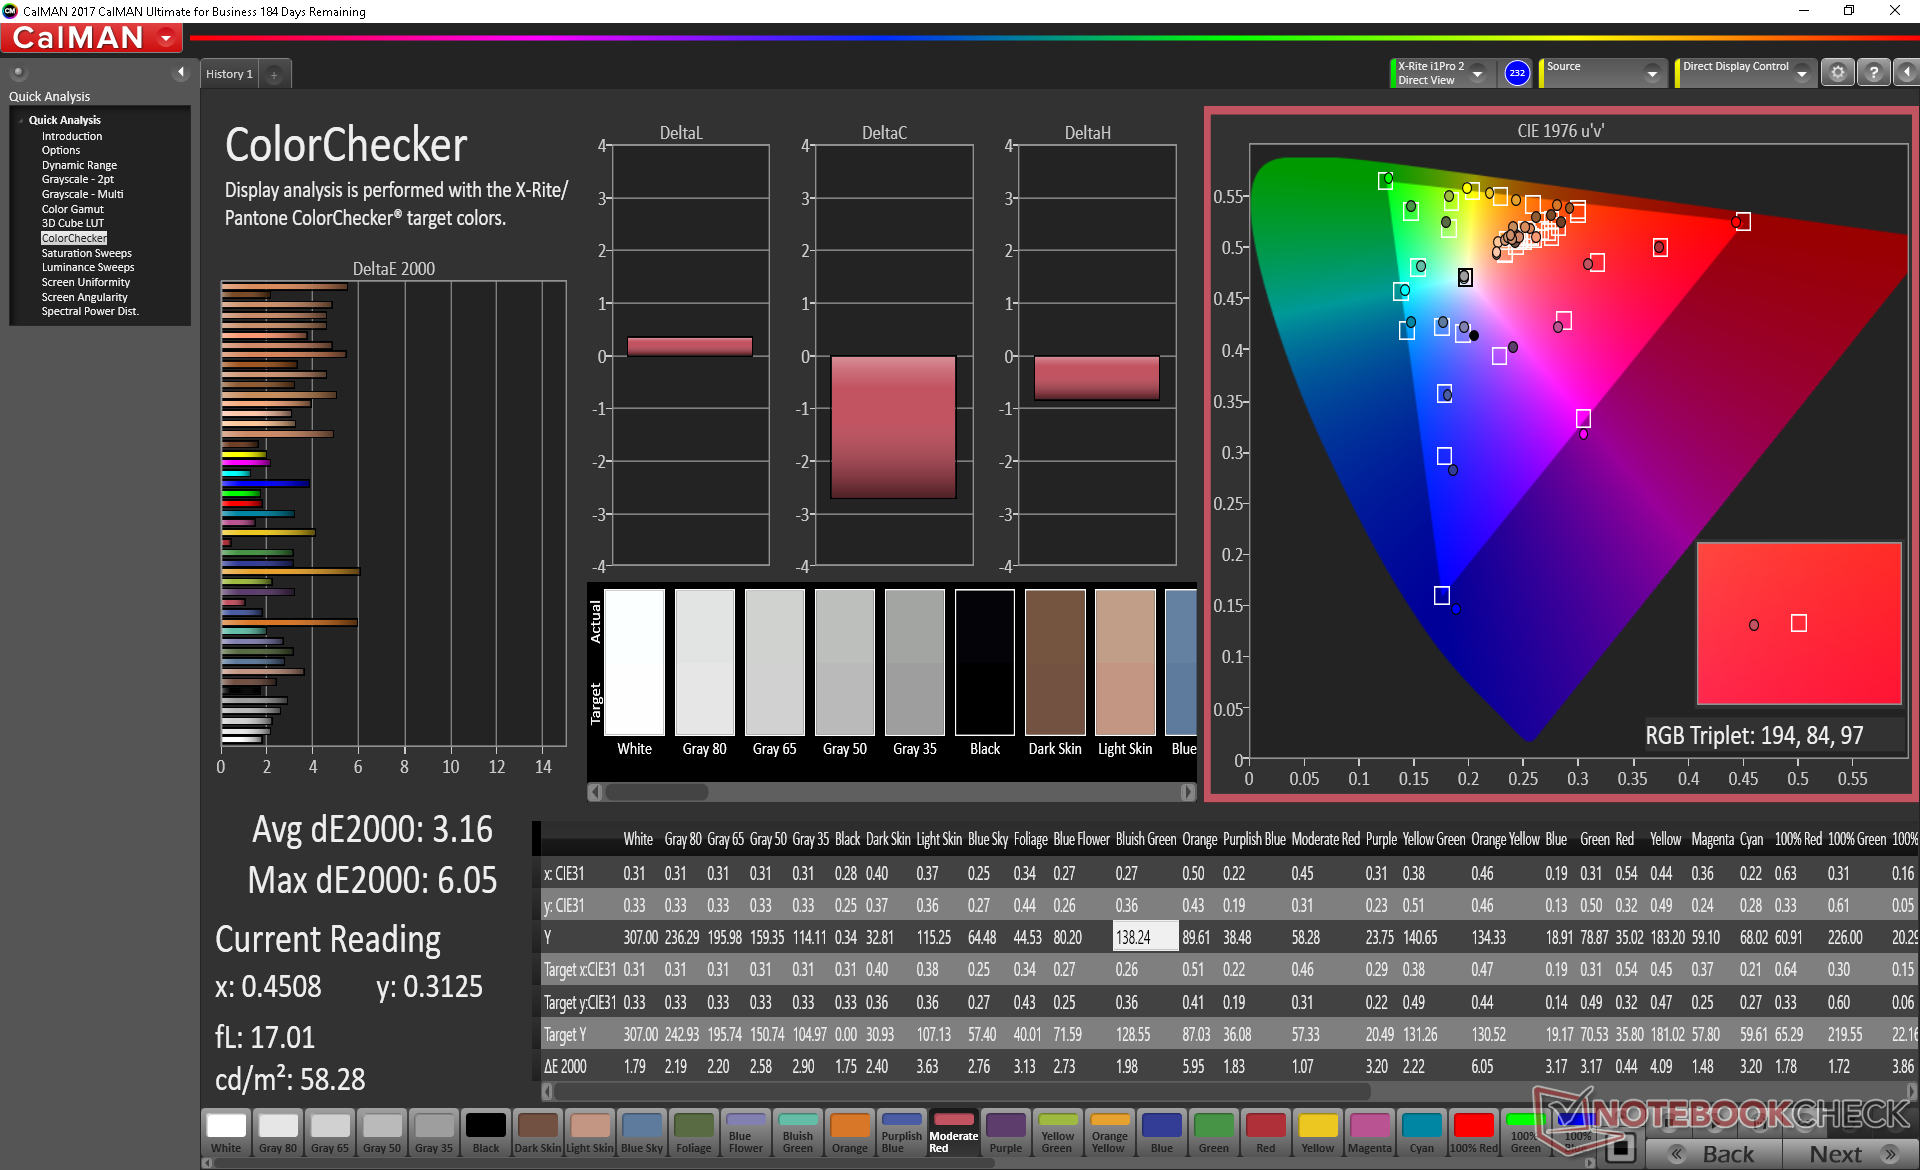
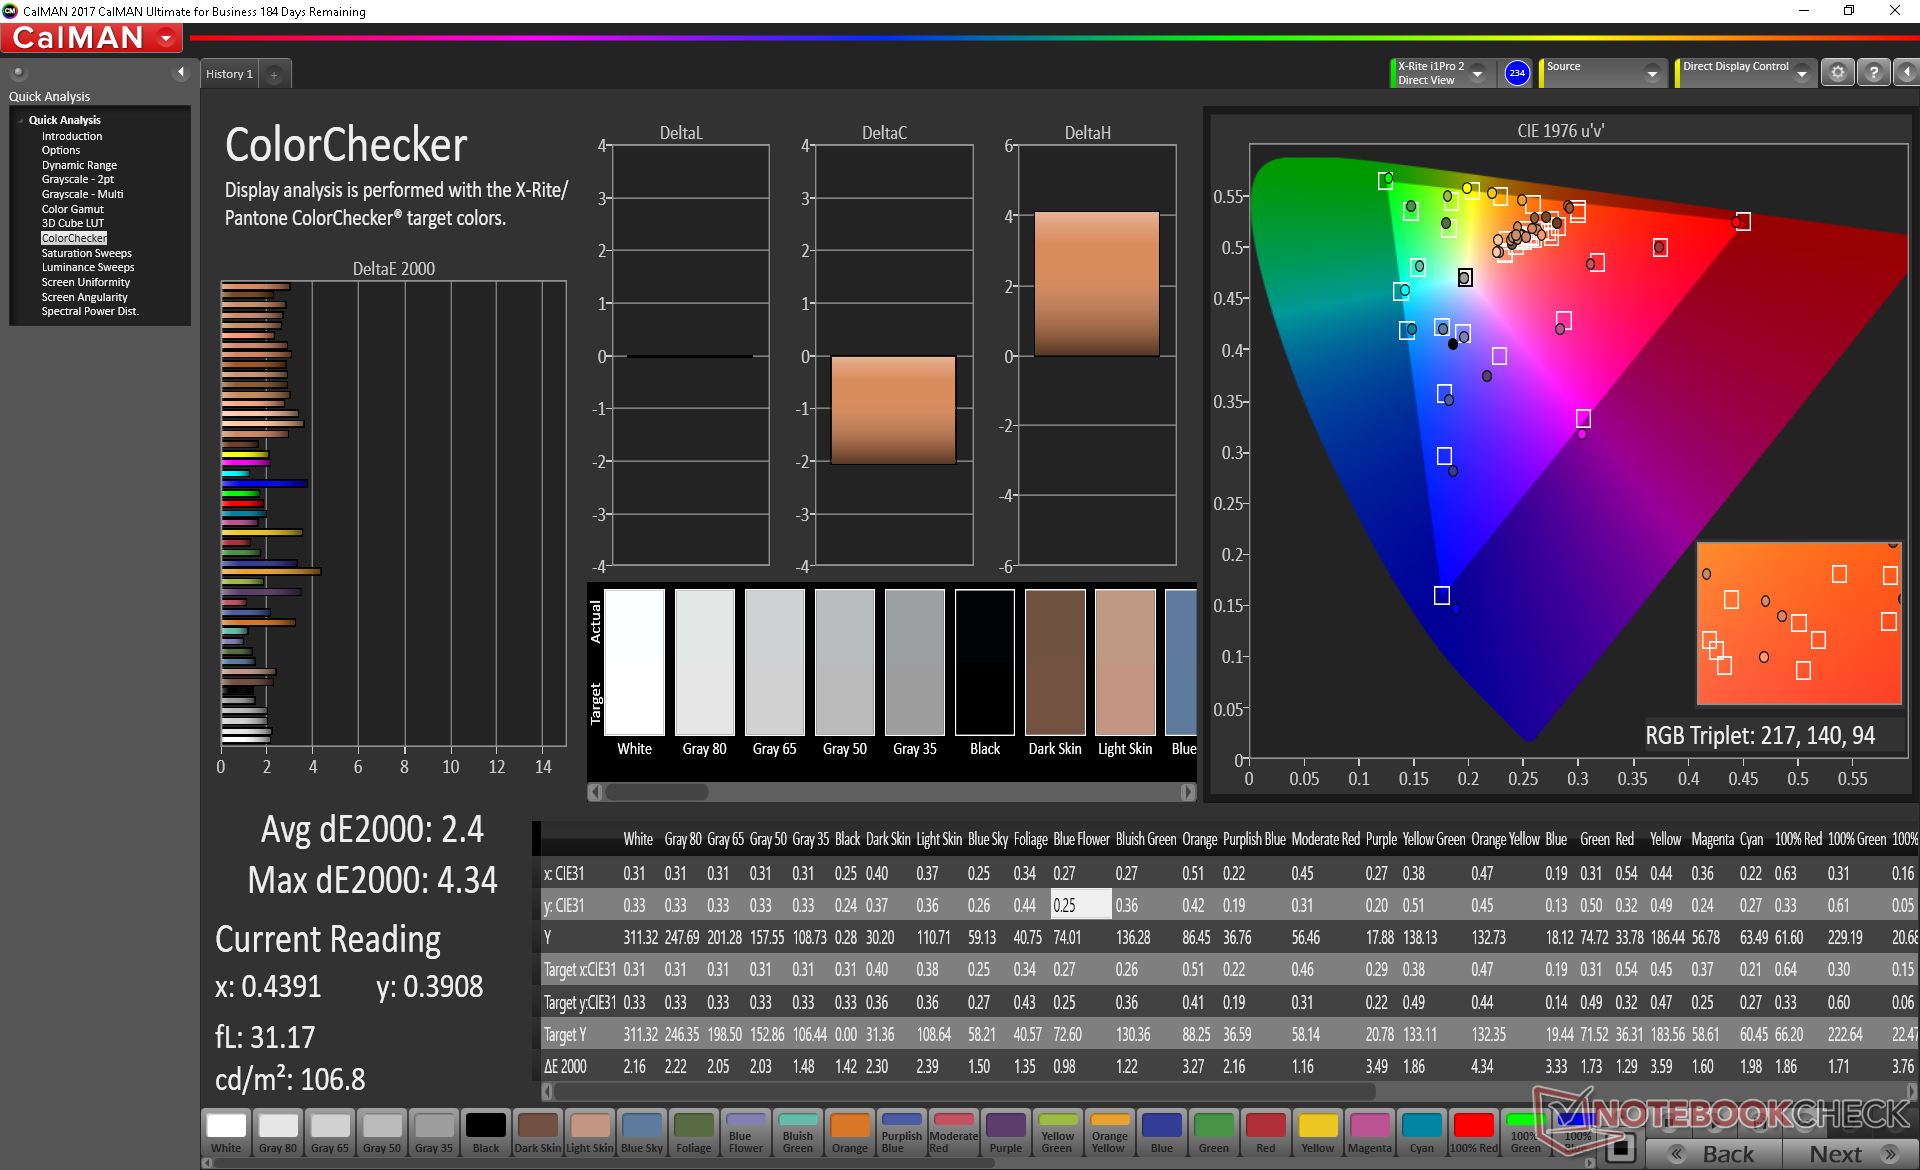
ΔE ColorChecker Calman: 3.16 | ∀{0.5-29.43 Ø4.73}
calibrated: 2.4
ΔE Greyscale Calman: 2.3 | ∀{0.09-98 Ø4.97}
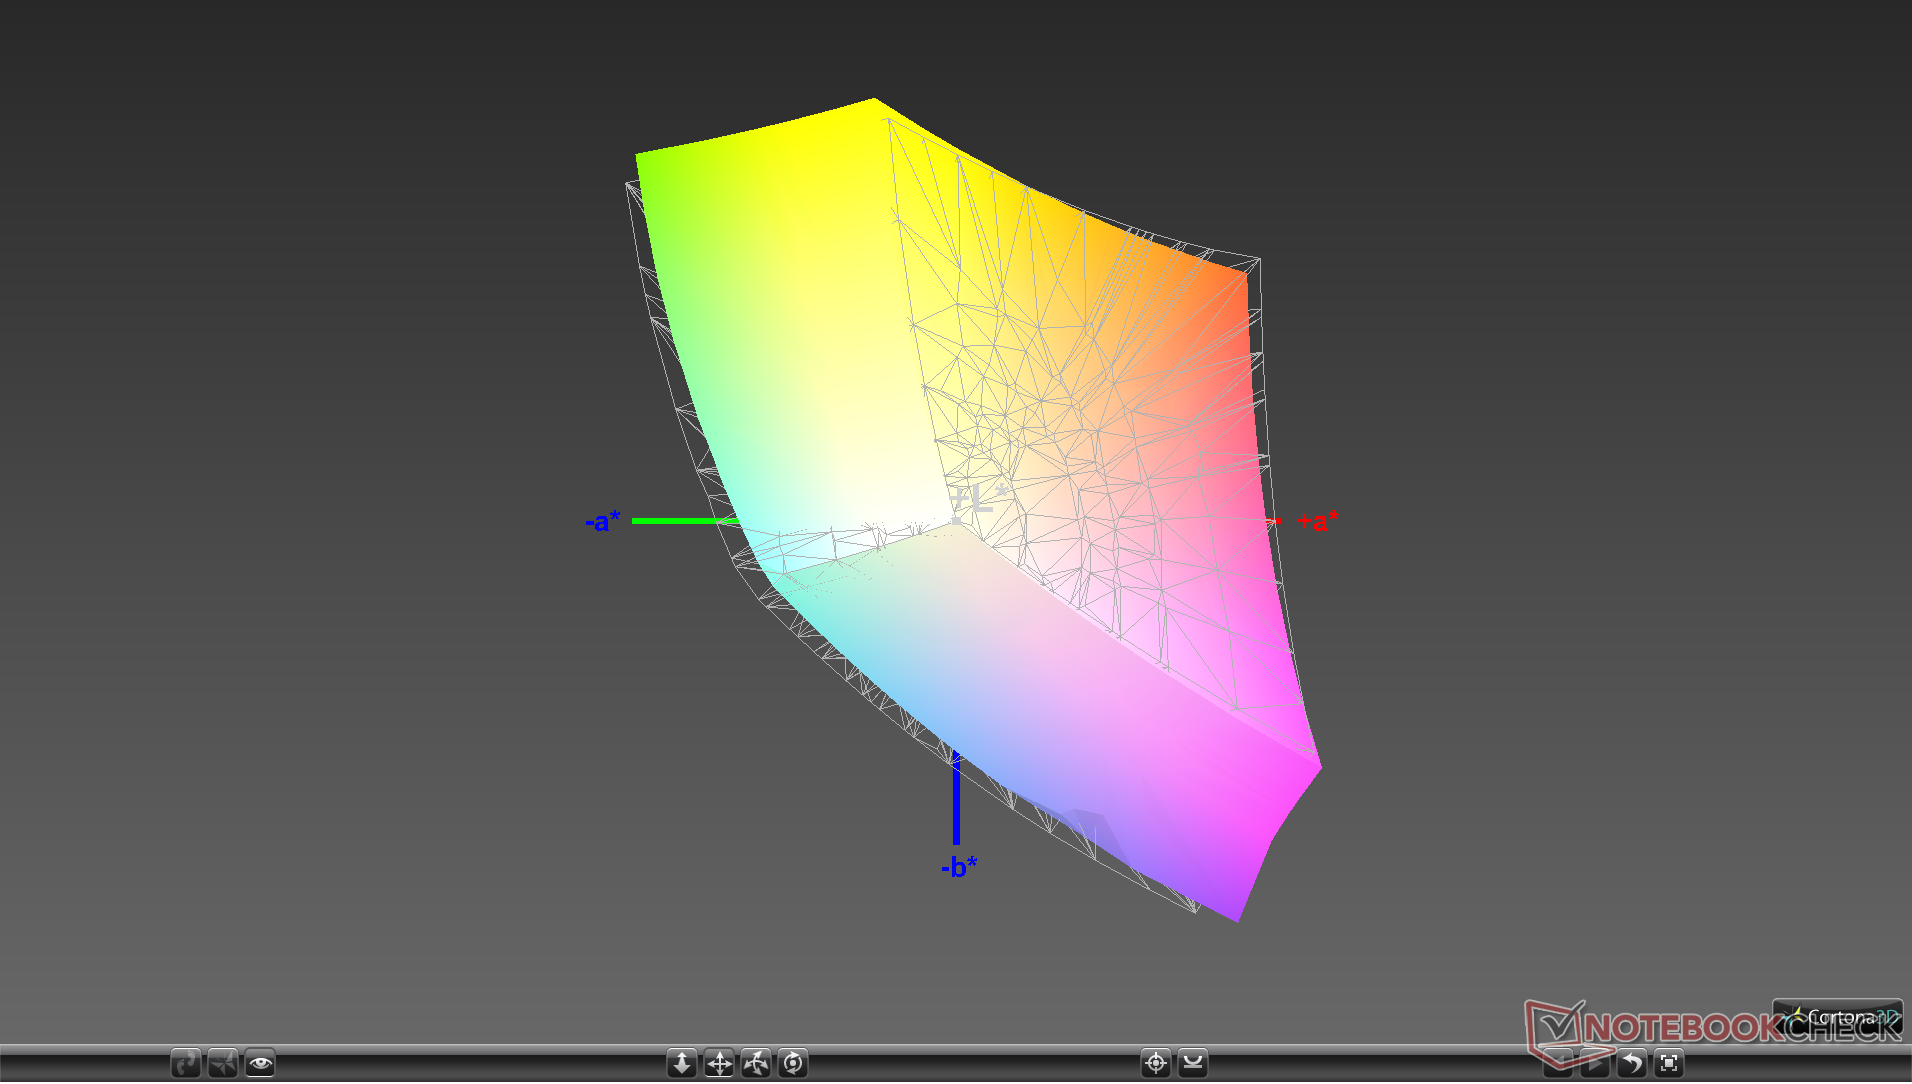
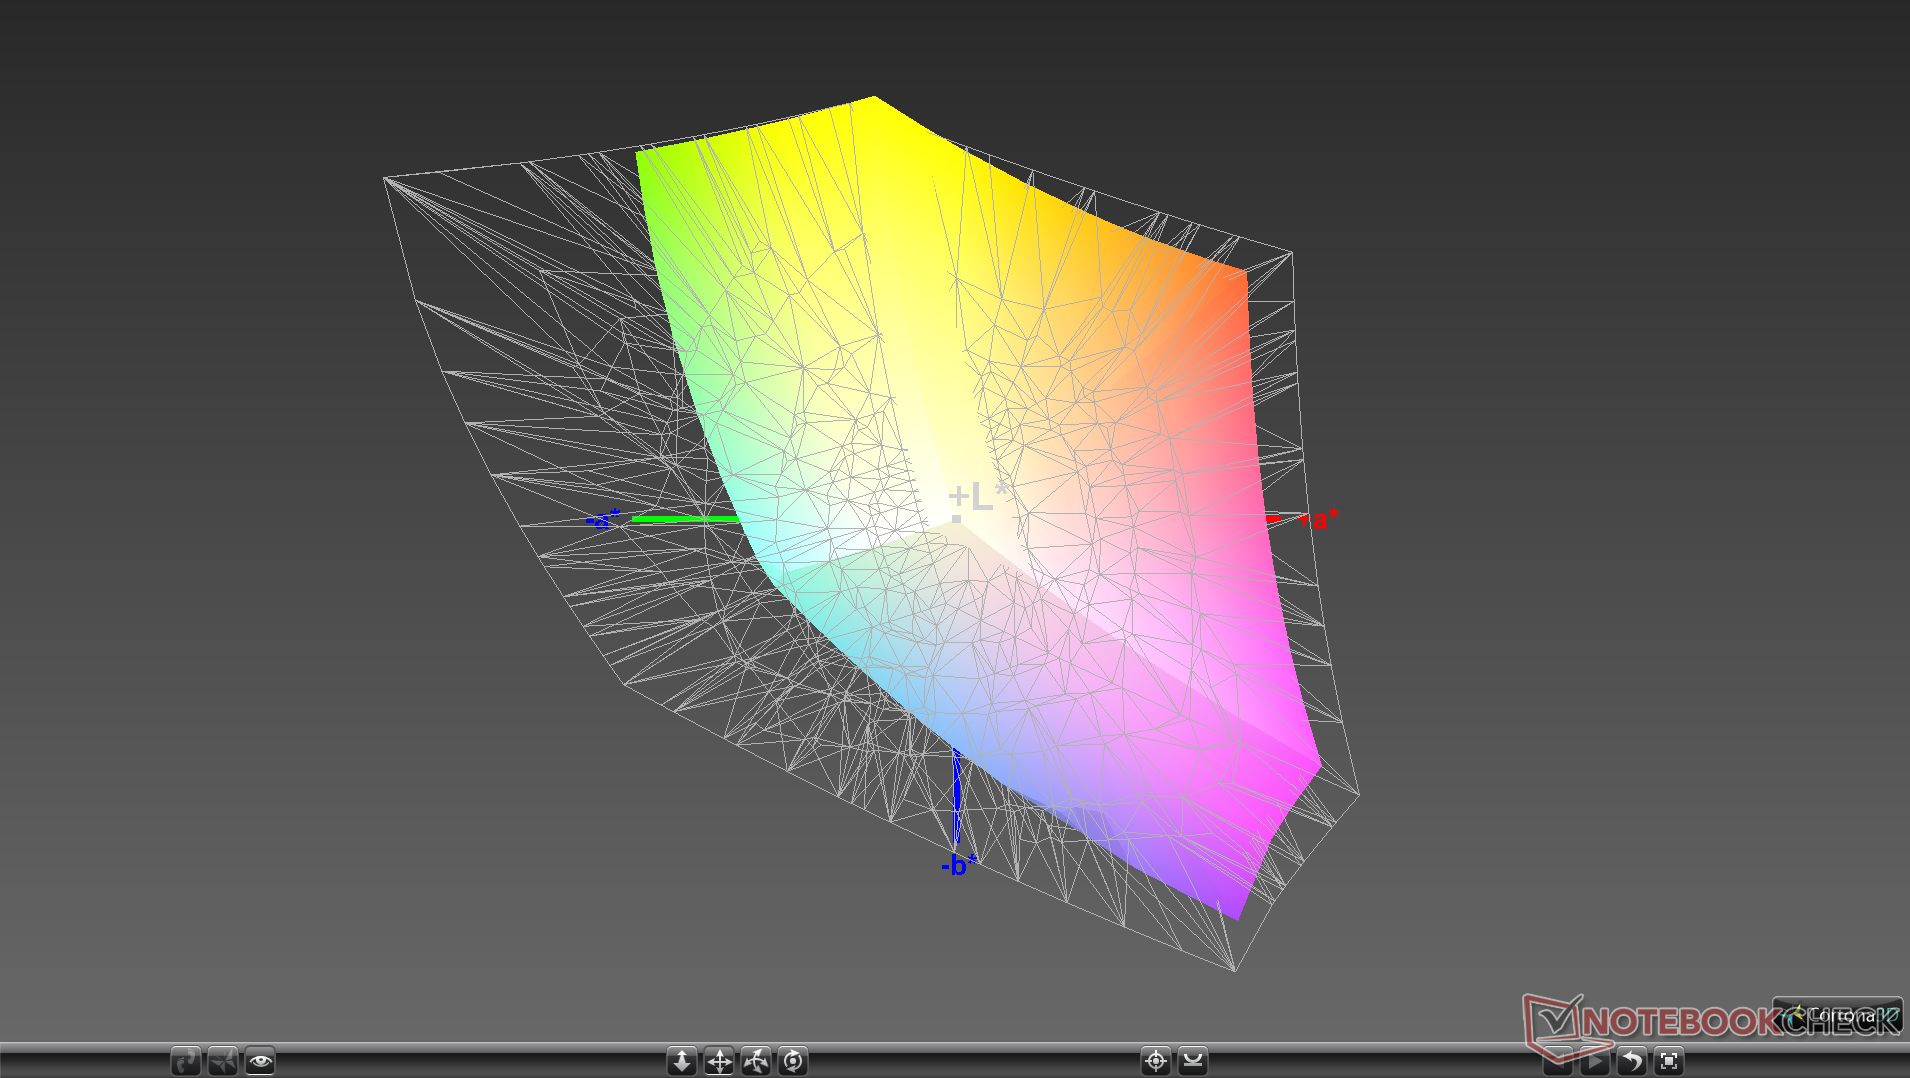
92.6% sRGB (Argyll 1.6.3 3D)
60% AdobeRGB 1998 (Argyll 1.6.3 3D)
65.7% AdobeRGB 1998 (Argyll 3D)
93% sRGB (Argyll 3D)
64.5% Display P3 (Argyll 3D)
Gamma: 2.17
CCT: 6557 K
| CUK Model Z GK5CQ7Z LG Philips LGD05C0, IPS, 15.6", 1920x1080 | Asus ROG Zephyrus G15 GA502DU Panda LM156LF-CL03, IPS, 15.6", 1920x1080 | Razer Blade 15 RTX 2070 Max-Q LG Philips LGD05C0, IPS, 15.6", 1920x1080 | MSI GS65 Stealth Thin 8RE-051US AUO80ED, IPS, 15.6", 1920x1080 | Lenovo Legion Y740-15ICHg LP156WFG-SPB2, IPS, 15.6", 1920x1080 | Alienware m15 GTX 1070 Max-Q AU Optronics B156HAN, IPS, 15.6", 1920x1080 | |
|---|---|---|---|---|---|---|
| Display | -36% | 1% | 1% | -2% | -3% | |
| Display P3 Coverage (%) | 64.5 | 40.33 -37% | 65.3 1% | 65.8 2% | 63.5 -2% | 63.5 -2% |
| sRGB Coverage (%) | 93 | 60.6 -35% | 94.9 2% | 92.1 -1% | 92.4 -1% | 89.4 -4% |
| AdobeRGB 1998 Coverage (%) | 65.7 | 41.69 -37% | 66.3 1% | 67 2% | 64.7 -2% | 64.5 -2% |
| Response Times | -142% | -11% | -24% | -24% | -16% | |
| Response Time Grey 50% / Grey 80% * (ms) | 13.6 ? | 34 ? -150% | 16.8 ? -24% | 20 ? -47% | 18.8 ? -38% | 18 ? -32% |
| Response Time Black / White * (ms) | 12 ? | 28 ? -133% | 11.6 ? 3% | 12 ? -0% | 13.2 ? -10% | 12 ? -0% |
| PWM Frequency (Hz) | 21280 ? | |||||
| Screen | -40% | 3% | -8% | -6% | -10% | |
| Brightness middle (cd/m²) | 306.8 | 240.1 -22% | 314.7 3% | 250.9 -18% | 320.4 4% | 353.6 15% |
| Brightness (cd/m²) | 309 | 231 -25% | 312 1% | 257 -17% | 298 -4% | 346 12% |
| Brightness Distribution (%) | 87 | 85 -2% | 90 3% | 83 -5% | 85 -2% | 86 -1% |
| Black Level * (cd/m²) | 0.38 | 0.34 11% | 0.38 -0% | 0.32 16% | 0.42 -11% | 0.3 21% |
| Contrast (:1) | 807 | 706 -13% | 828 3% | 784 -3% | 763 -5% | 1179 46% |
| Colorchecker dE 2000 * | 3.16 | 4.2 -33% | 2.56 19% | 2.77 12% | 3.21 -2% | 4.55 -44% |
| Colorchecker dE 2000 max. * | 6.05 | 17.8 -194% | 4.89 19% | 5.89 3% | 5.54 8% | 7.91 -31% |
| Colorchecker dE 2000 calibrated * | 2.4 | 4.09 -70% | 1.71 29% | 2.5 -4% | 2.36 2% | 3.37 -40% |
| Greyscale dE 2000 * | 2.3 | 2.8 -22% | 3.4 -48% | 4 -74% | 3.6 -57% | 4.1 -78% |
| Gamma | 2.17 101% | 2.2 100% | 2.3 96% | 2.27 97% | 2.27 97% | 2.27 97% |
| CCT | 6557 99% | 6925 94% | 6435 101% | 6901 94% | 6503 100% | 7434 87% |
| Color Space (Percent of AdobeRGB 1998) (%) | 60 | 38.4 -36% | 60.7 1% | 60 0% | 59 -2% | 57.9 -3% |
| Color Space (Percent of sRGB) (%) | 92.6 | 60.4 -35% | 94.6 2% | 92 -1% | 92 -1% | 88.9 -4% |
| Total Average (Program / Settings) | -73% /
-52% | -2% /
1% | -10% /
-8% | -11% /
-8% | -10% /
-9% |
* ... smaller is better
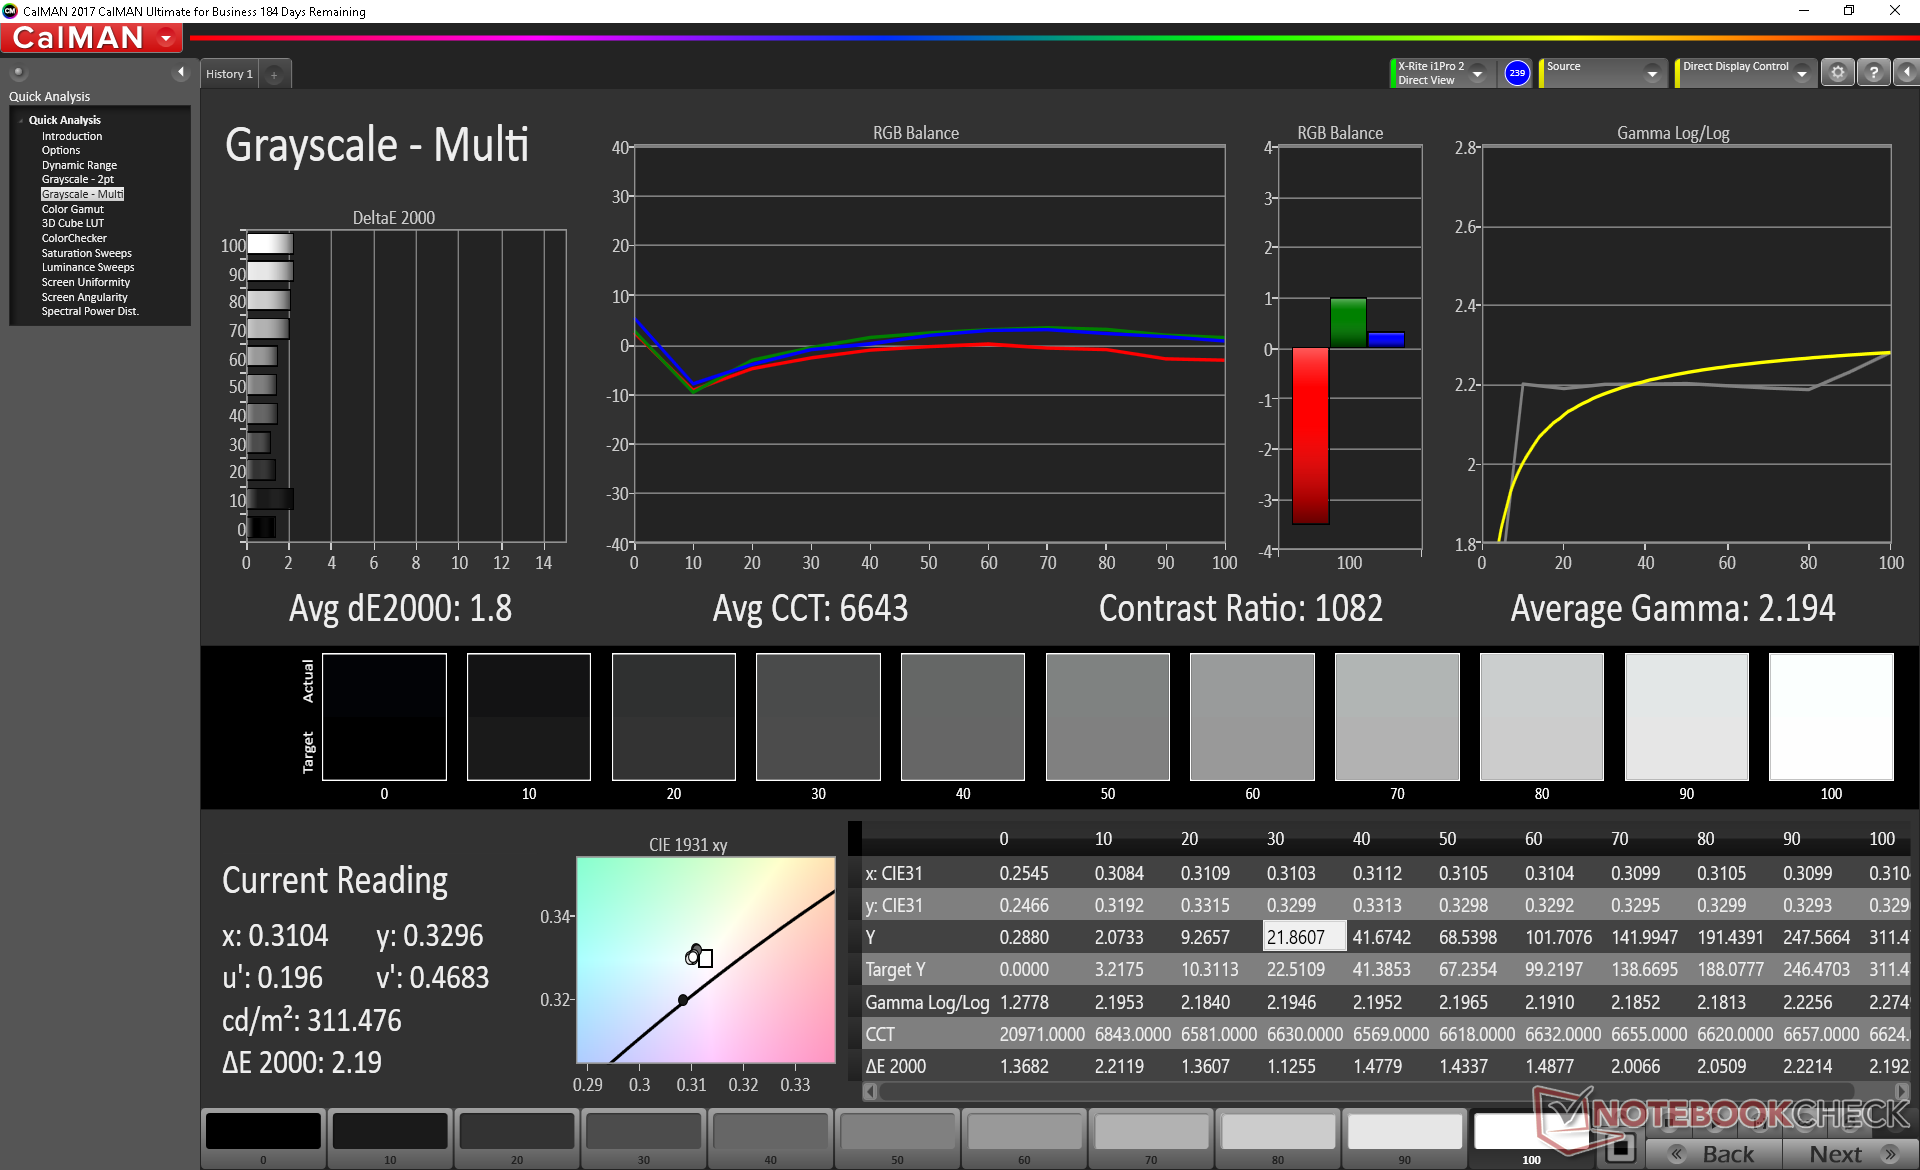
The display is relatively accurate out of the box with deltaE grayscale and color averages of 2.3 and 3.16, respectively. An end-user calibration will improve the display even further albeit just marginally.

Display Response Times
| ↔ Response Time Black to White | ||
|---|---|---|
| 12 ms ... rise ↗ and fall ↘ combined | ↗ 7.6 ms rise | 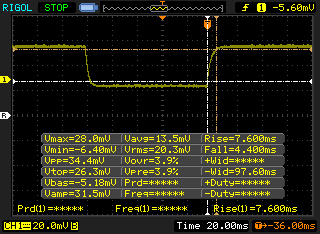 |
| ↘ 4.4 ms fall | ||
| The screen shows good response rates in our tests, but may be too slow for competitive gamers. In comparison, all tested devices range from 0.1 (minimum) to 240 (maximum) ms. » 31 % of all devices are better. This means that the measured response time is better than the average of all tested devices (19.9 ms). | ||
| ↔ Response Time 50% Grey to 80% Grey | ||
| 13.6 ms ... rise ↗ and fall ↘ combined | ↗ 6.8 ms rise | 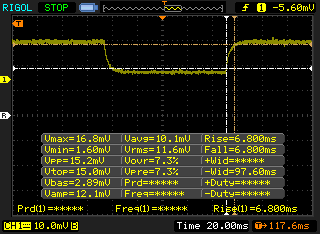 |
| ↘ 6.8 ms fall | ||
| The screen shows good response rates in our tests, but may be too slow for competitive gamers. In comparison, all tested devices range from 0.165 (minimum) to 636 (maximum) ms. » 27 % of all devices are better. This means that the measured response time is better than the average of all tested devices (31.1 ms). | ||
Screen Flickering / PWM (Pulse-Width Modulation)
| Screen flickering / PWM not detected | 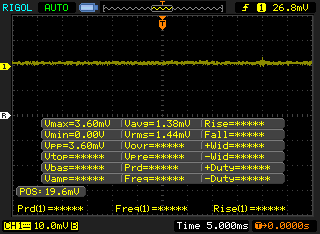 | ||
In comparison: 52 % of all tested devices do not use PWM to dim the display. If PWM was detected, an average of 7798 (minimum: 5 - maximum: 343500) Hz was measured. | |||
Outdoor visibility is essentially identical to the Razer Blade 15 144 Hz SKU as both systems share the same IPS panel and even nearly the same backlight brightness. As portable as it may be, the Model Z isn't as bright as most Ultrabooks and so users will still have an easier time using their XPS 15 or MacBook Pro outdoors.


Performance
A fair number of SKUs are available ranging from the Core i7-8750H to the i7-9750H, the RTX 2060 to the RTX 2070 Max-Q or RTX 2080 Max-Q, and various RAM and storage options. The lack of any Core i5, Core i9, or GTX 16 SKUs at the moment is not concerning since the Core i7 family pairs very well with the mobile RTX series in the mainstream-enthusiast segment.
Optimus is included by default for switching to the integrated UHD Graphics 630. Consequently, G-Sync is not available.
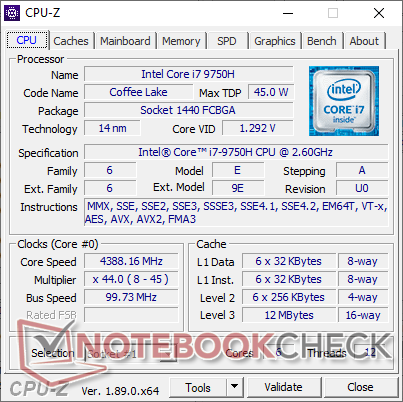
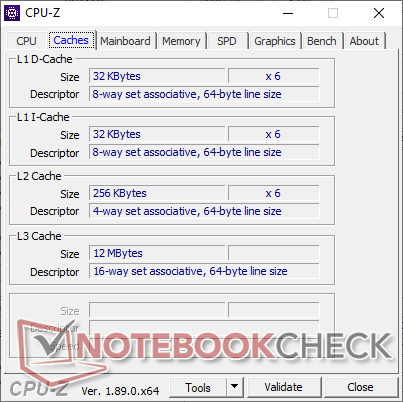
Processor
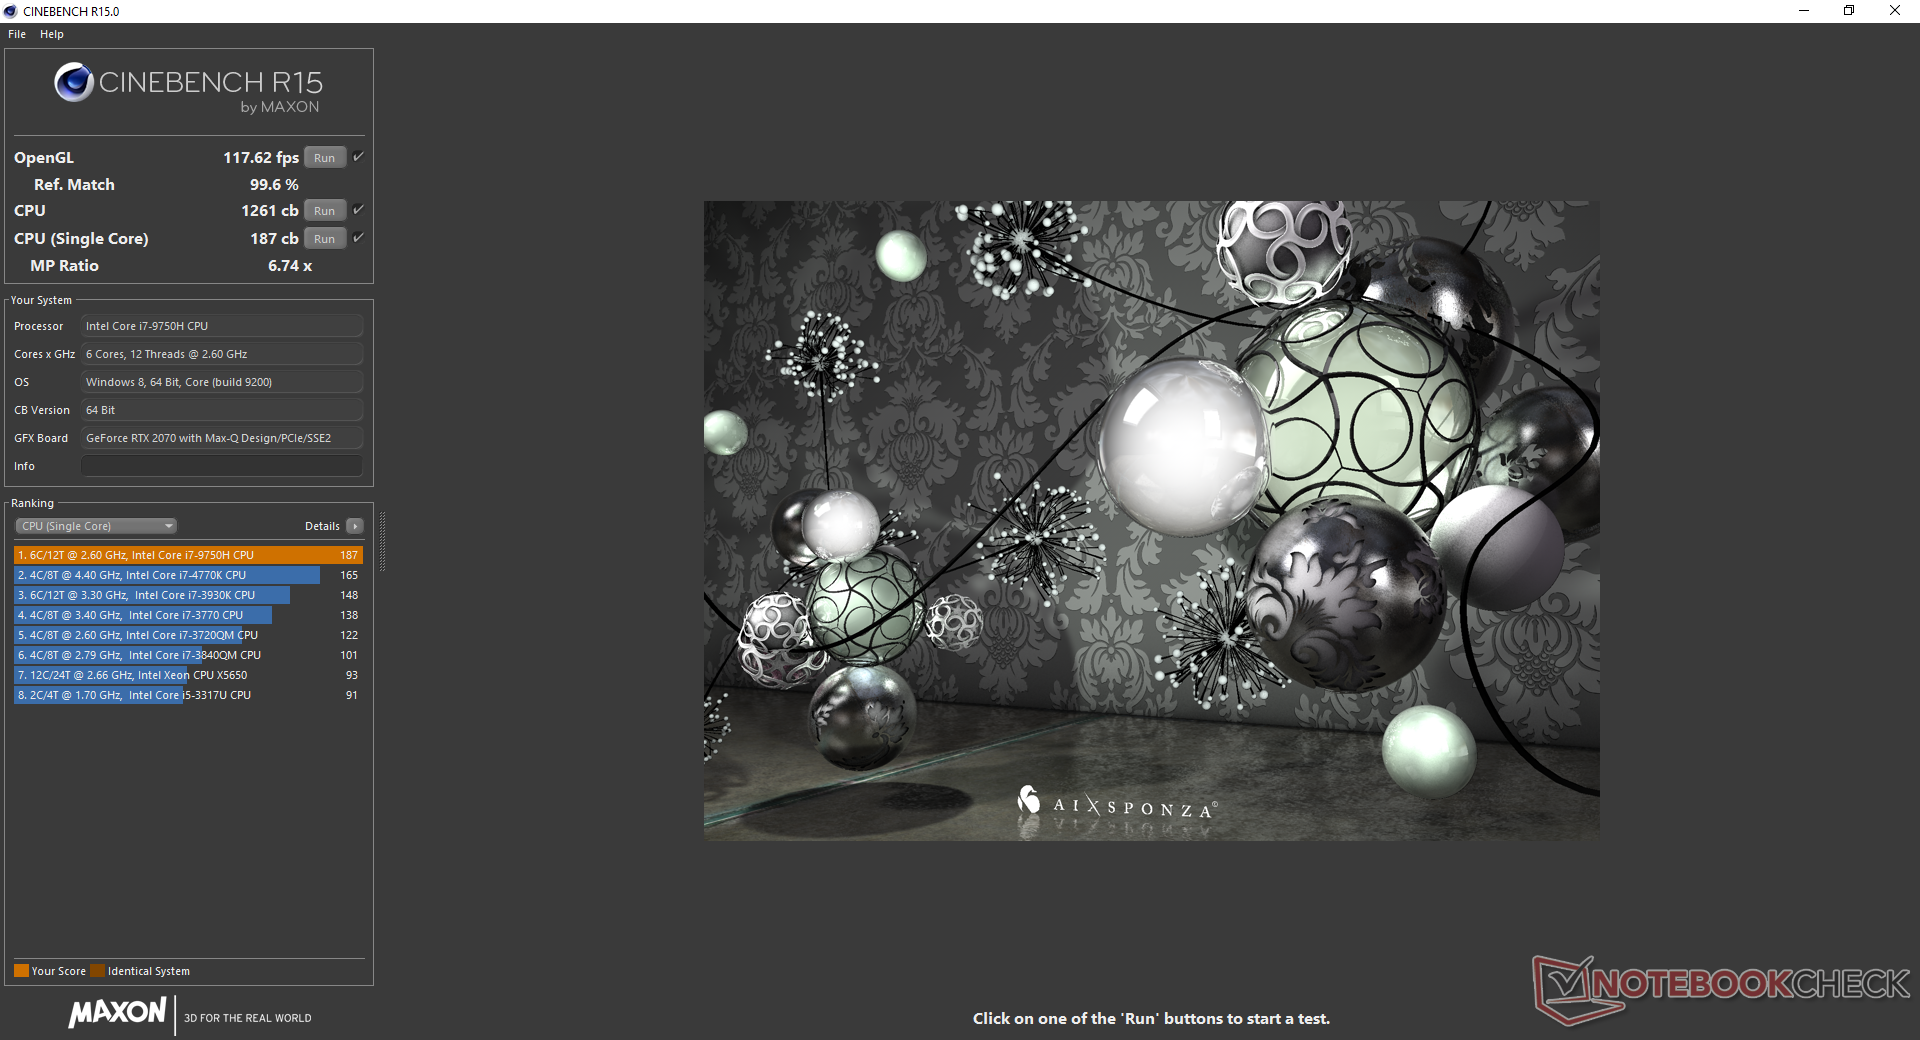
Multi-thread CPU performance is 17 percent faster than the Schenker Neo 15 with the Core i7-8750H according to CineBench R15. Additionally, the Model Z is better at maintaining Turbo Boost clock rates for longer and so it continues to be faster even after accounting for any performance throttling. Results are better than most laptops with the older (and more expensive) Core i9-8950HK including the Dell XPS 15.
See our dedicated page on the Core i7-9750H for more technical information and benchmark comparisons.
System Performance
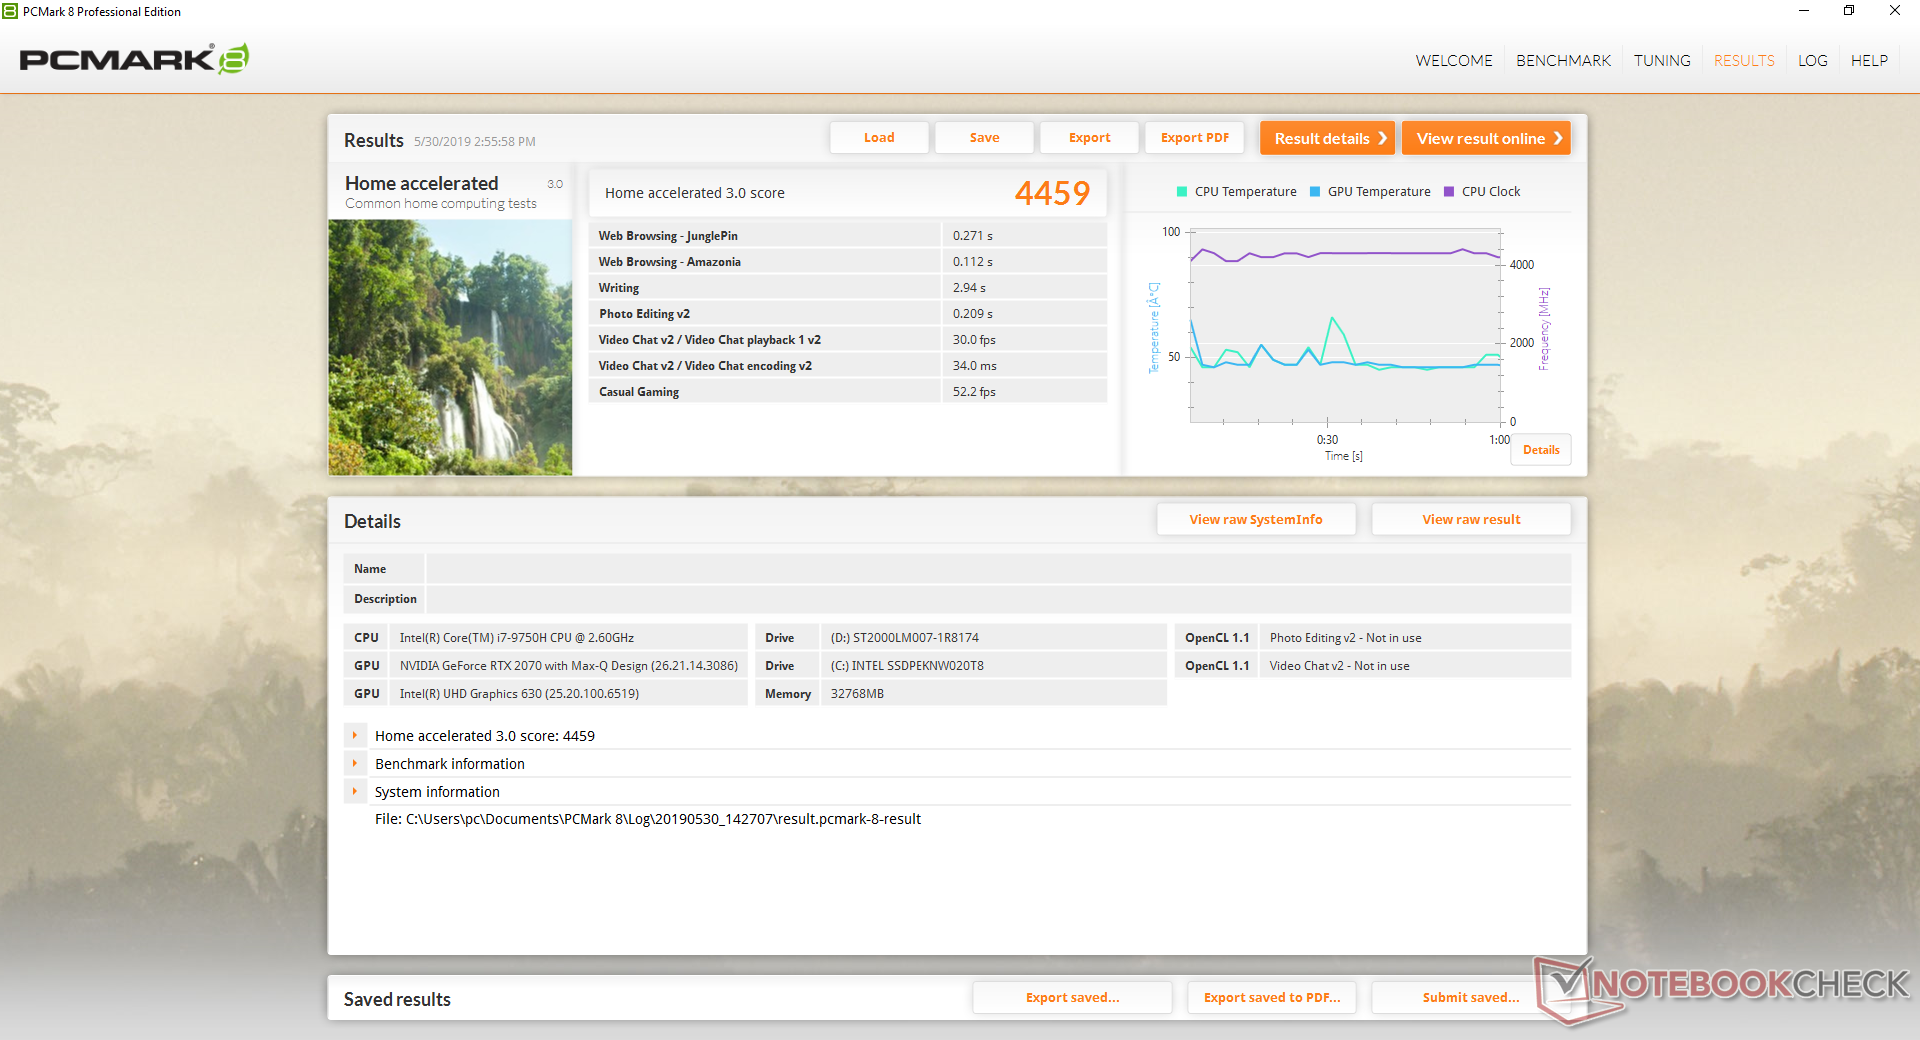
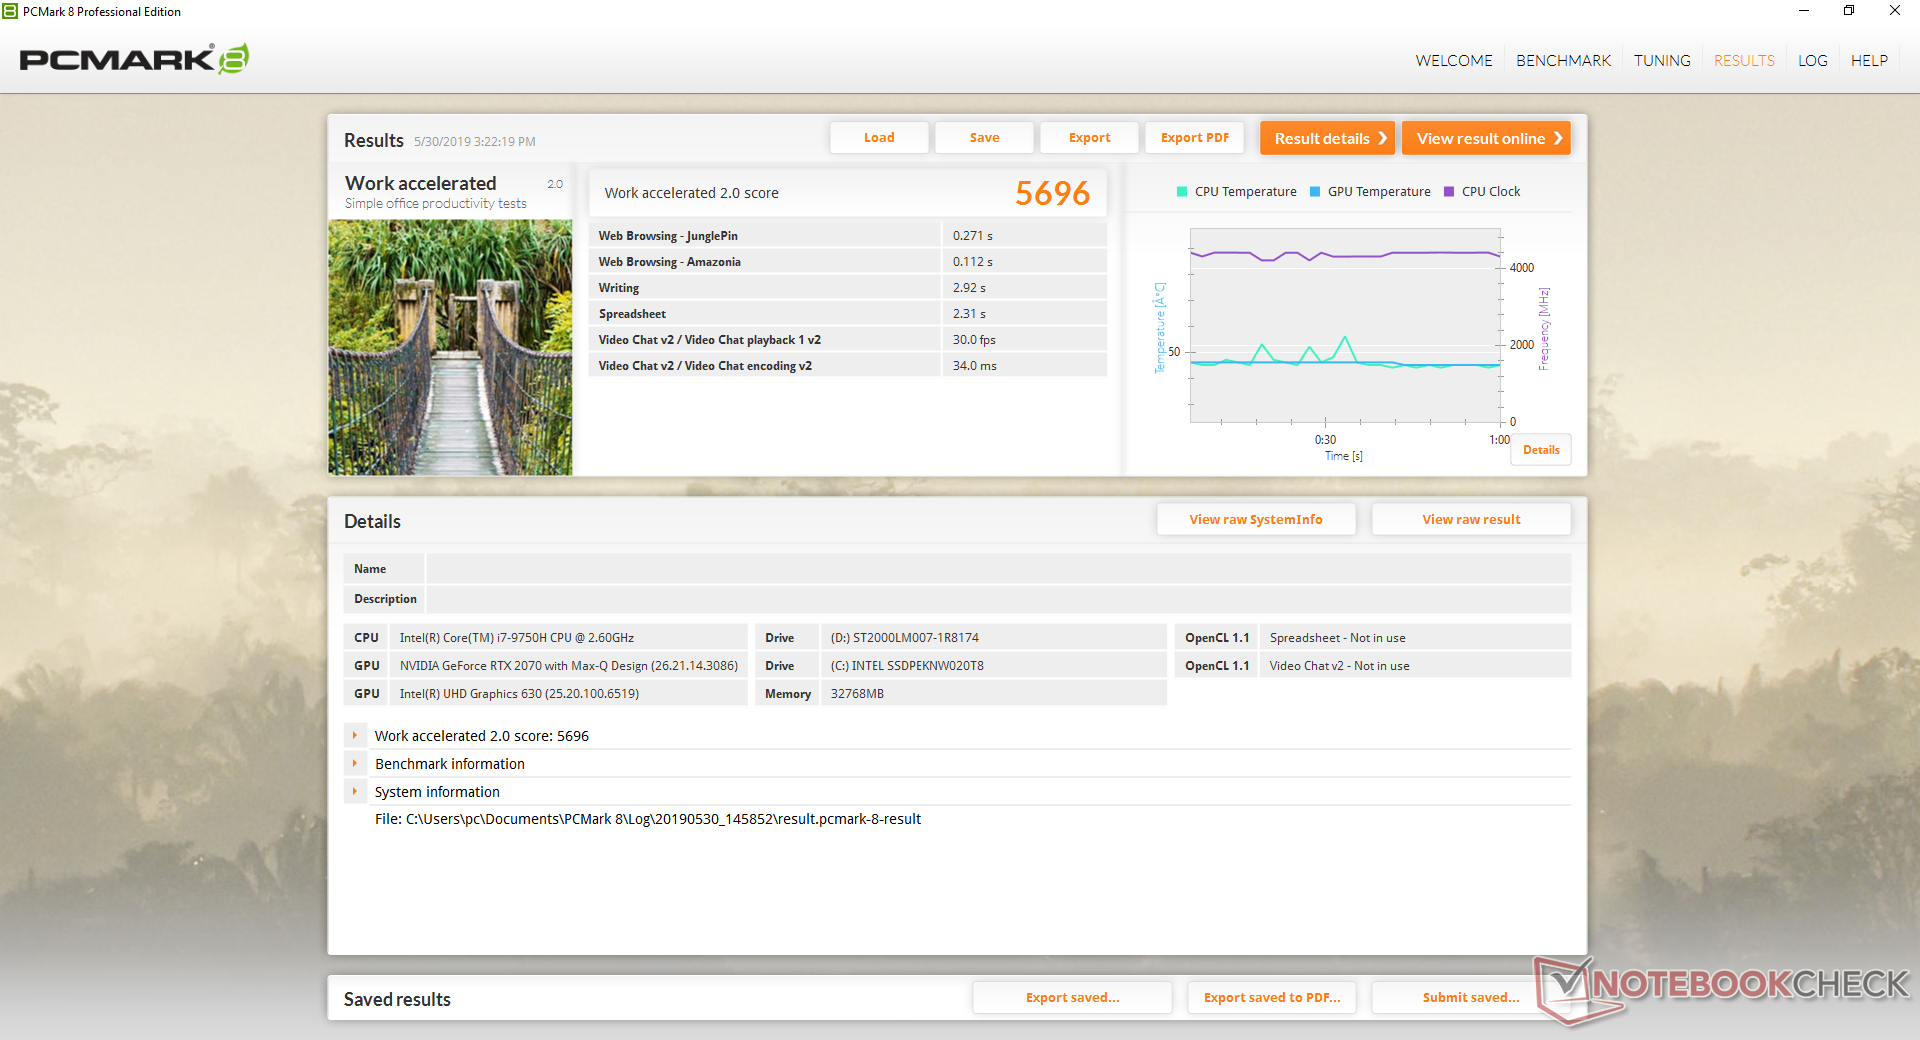
| PCMark 8 Home Score Accelerated v2 | 4459 points | |
| PCMark 8 Work Score Accelerated v2 | 5696 points | |
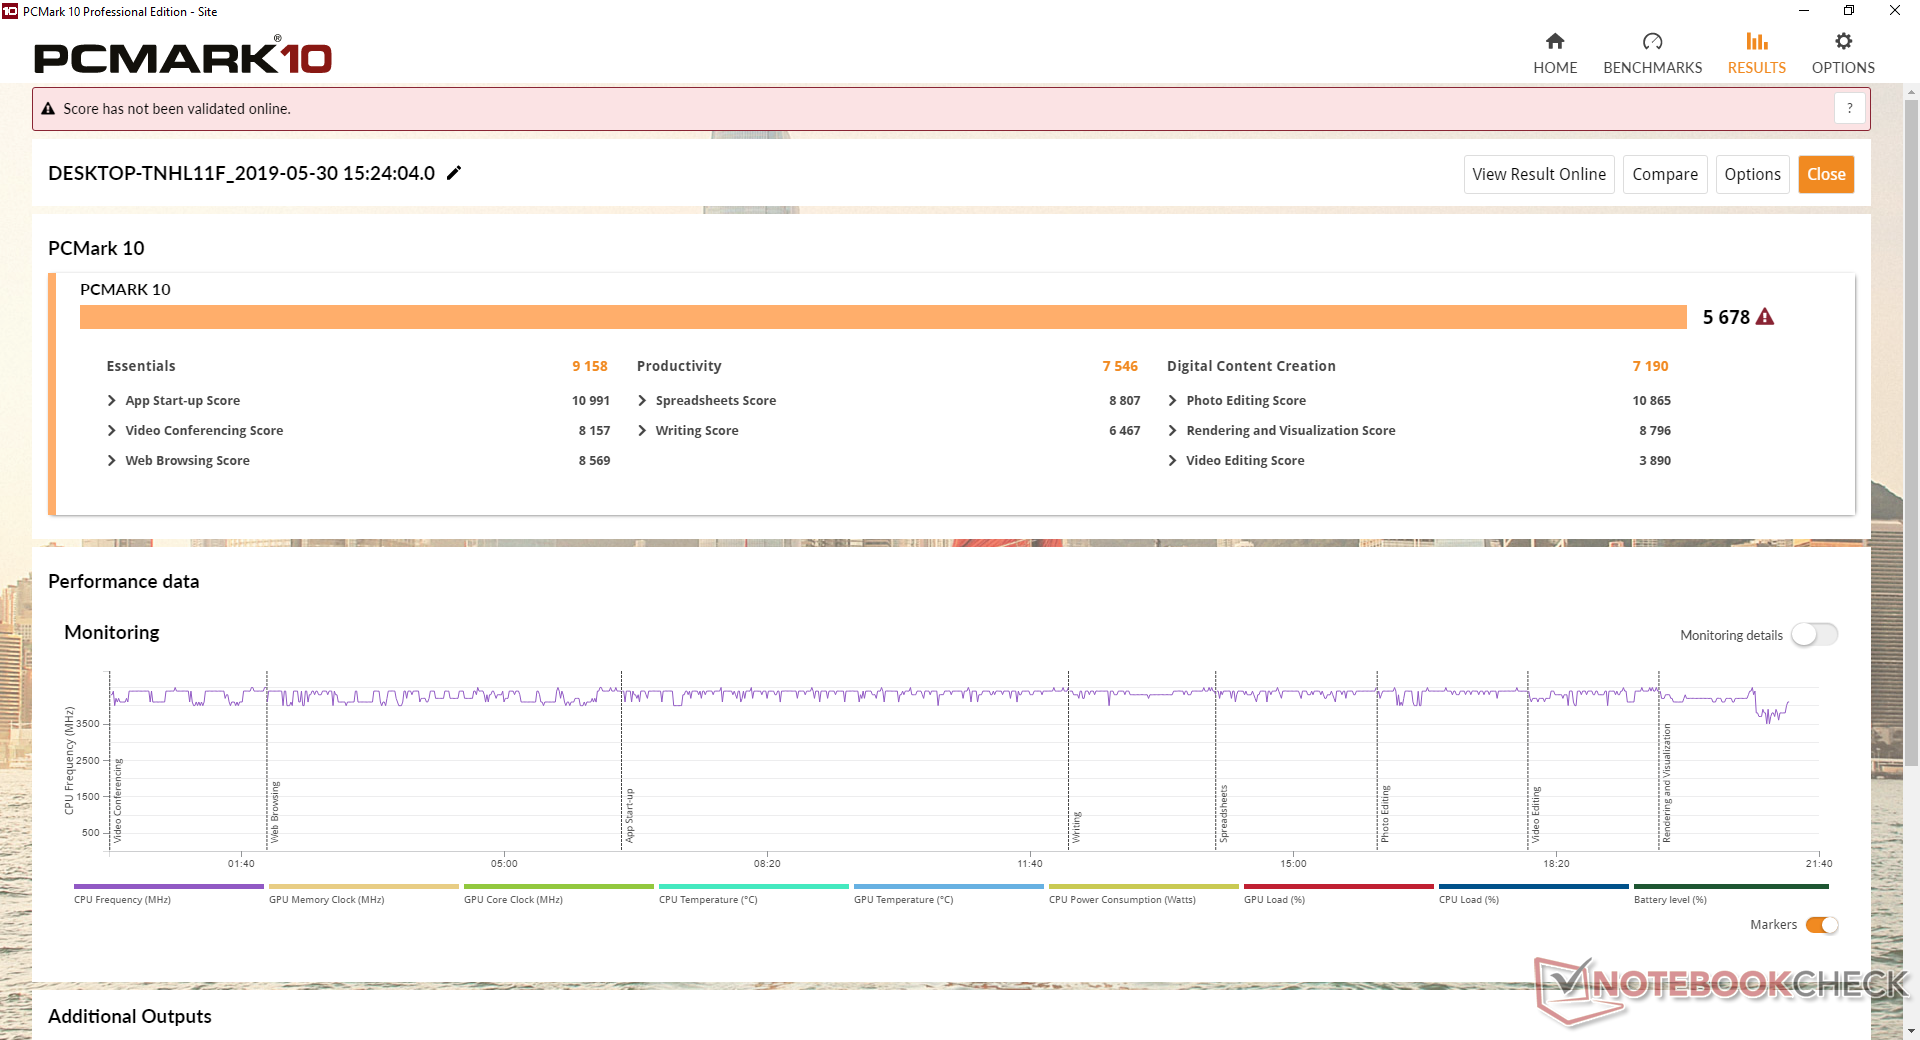
| PCMark 10 Score | 5678 points | |
Help | ||
Storage Devices
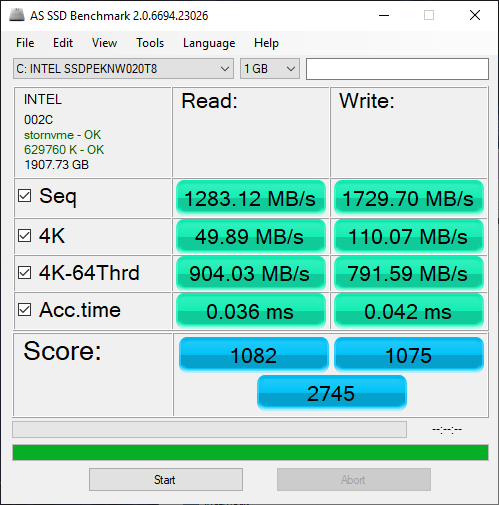
Three internal storage bays (2x M.2 2280 PCIe x4 + 1x 2.5-inch SATA III) are available. CUK offers multiple SSD options up to the 2 TB Intel SSD 660p like we have here on our test unit.
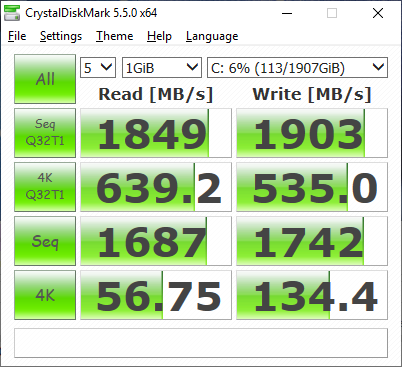
Sequential write rates are excellent at over 1700 MB/s according to AS SSD while sequential read rates are only average at about 1300 MB/s. The competing Samsung SSD PM981 is capable of sequential read rates of up to 2000 MB/s.
See our table of HDDs and SSDs for more benchmark comparisons.
| CUK Model Z GK5CQ7Z Intel SSD 660p 2TB SSDPEKNW020T8 | Asus ROG Zephyrus G15 GA502DU Intel SSD 660p SSDPEKNW512G8 | Razer Blade 15 RTX 2070 Max-Q Samsung SSD PM981 MZVLB512HAJQ | MSI GS65 Stealth Thin 8RE-051US Samsung SSD PM981 MZVLB256HAHQ | Lenovo Legion Y740-15ICHg Samsung SSD PM981 MZVLB256HAHQ | Alienware m15 GTX 1070 Max-Q Toshiba XG5 KXG50ZNV512G | |
|---|---|---|---|---|---|---|
| AS SSD | -33% | 22% | -24% | -2% | -33% | |
| Seq Read (MB/s) | 1283 | 907 -29% | 1840 43% | 1612 26% | 1953 52% | 1967 53% |
| Seq Write (MB/s) | 1730 | 926 -46% | 1822 5% | 1475 -15% | 1629 -6% | 1135 -34% |
| 4K Read (MB/s) | 49.89 | 47.26 -5% | 52.3 5% | 43.09 -14% | 33.2 -33% | 29.17 -42% |
| 4K Write (MB/s) | 110.1 | 98.7 -10% | 110.7 1% | 83.8 -24% | 88.1 -20% | 93.4 -15% |
| 4K-64 Read (MB/s) | 904 | 321.5 -64% | 1126 25% | 611 -32% | 757 -16% | 995 10% |
| 4K-64 Write (MB/s) | 792 | 736 -7% | 1717 117% | 570 -28% | 1501 90% | 656 -17% |
| Access Time Read * (ms) | 0.036 | 0.064 -78% | 0.047 -31% | 0.071 -97% | 0.077 -114% | 0.116 -222% |
| Access Time Write * (ms) | 0.042 | 0.045 -7% | 0.033 21% | 0.045 -7% | 0.043 -2% | 0.063 -50% |
| Score Read (Points) | 1082 | 459 -58% | 1362 26% | 815 -25% | 985 -9% | 1221 13% |
| Score Write (Points) | 1075 | 927 -14% | 2010 87% | 802 -25% | 1752 63% | 862 -20% |
| Score Total (Points) | 2745 | 1641 -40% | 4079 49% | 2039 -26% | 3230 18% | 2667 -3% |
| Copy ISO MB/s (MB/s) | 3089 | 905 -71% | 1975 -36% | 1872 -39% | 642 -79% | |
| Copy Program MB/s (MB/s) | 549 | 496.9 -9% | 526 -4% | 478.2 -13% | 431.5 -21% | |
| Copy Game MB/s (MB/s) | 1171 | 819 -30% | 1200 2% | 1165 -1% | 706 -40% |
* ... smaller is better

GPU Performance
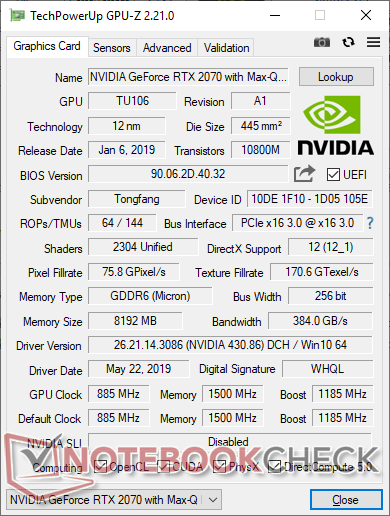
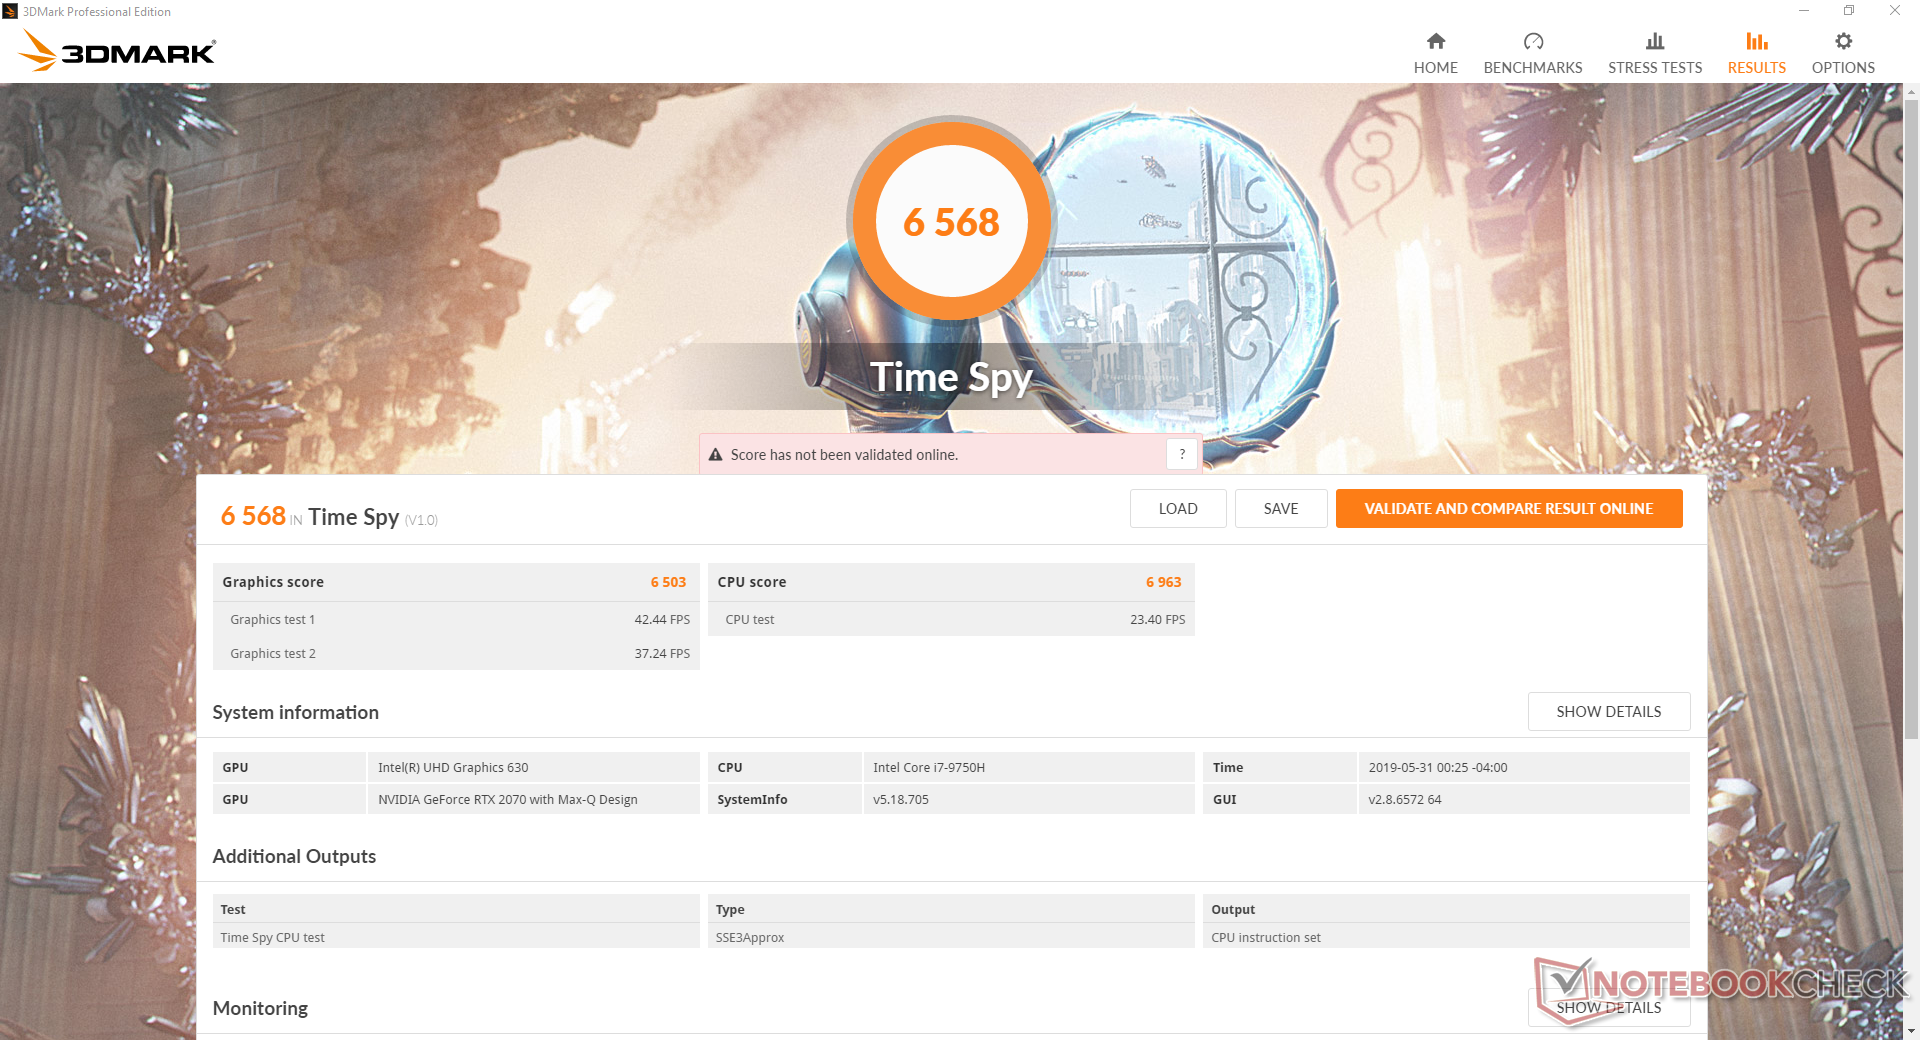
3DMark graphics results are essentially identical to the Schenker Neo 15 with the same RTX 2070 Max-Q GPU despite the fact that our CUK Model Z ships with a more capable 230 W AC adapter. Fire Strike and Time Spy graphics scores, for example, are within just 2 to 3 points of one another. Raw performance is about 23 to 34 percent faster than the new GTX 1660 Ti Max-Q.
It's worth mentioning that running the machine in "Gaming" or "Turbo" mode will not dramatically impact gaming performance when compared to regular "Balanced" mode. A Time Spy run on Balanced returns Physics and Graphics scores of 6863 and 6294 points, respectively, compared to 6963 and 6503 points when in "Gaming" mode.
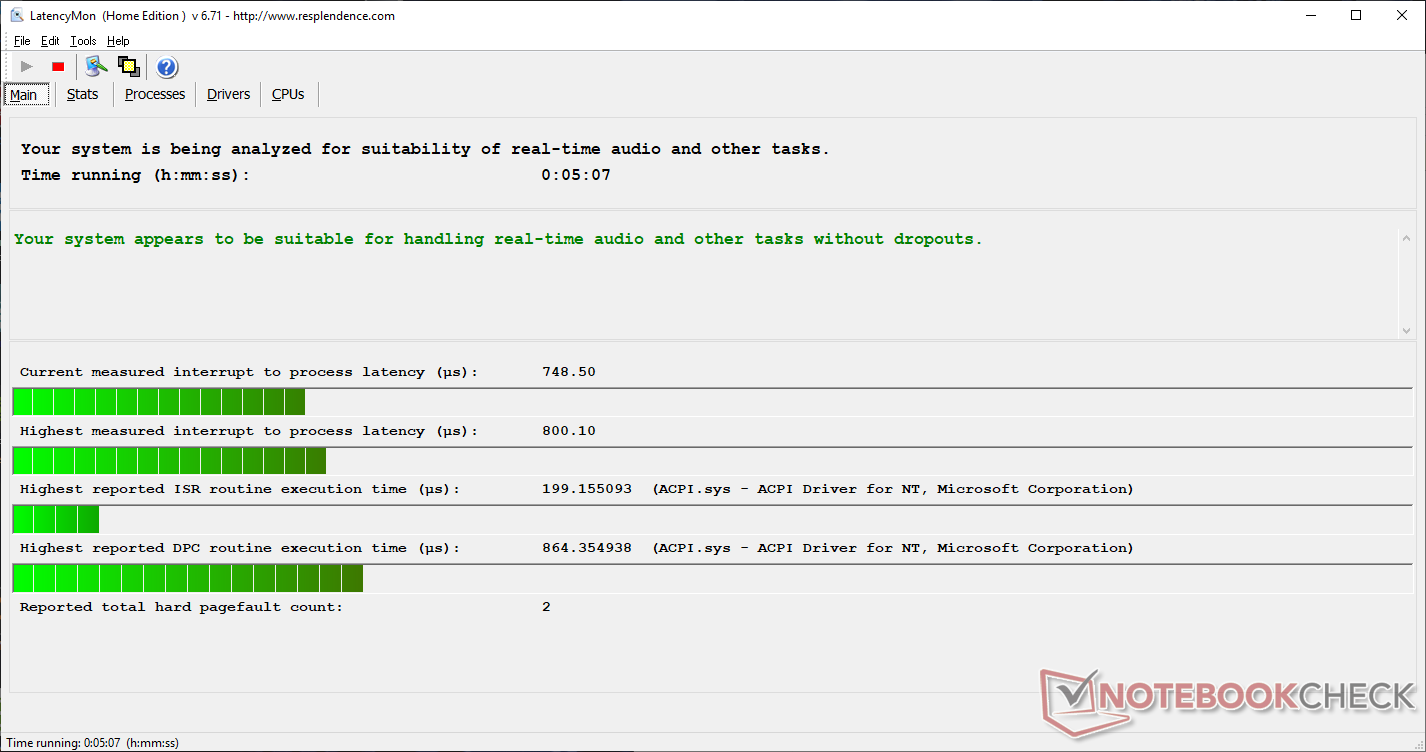
Idling on Witcher 3 shows no recurring dips in frame rate to suggest a smooth gaming experience with no interrupting background activity.
See our page on the GeForce RTX 2070 Max-Q for more technical information and benchmarks.
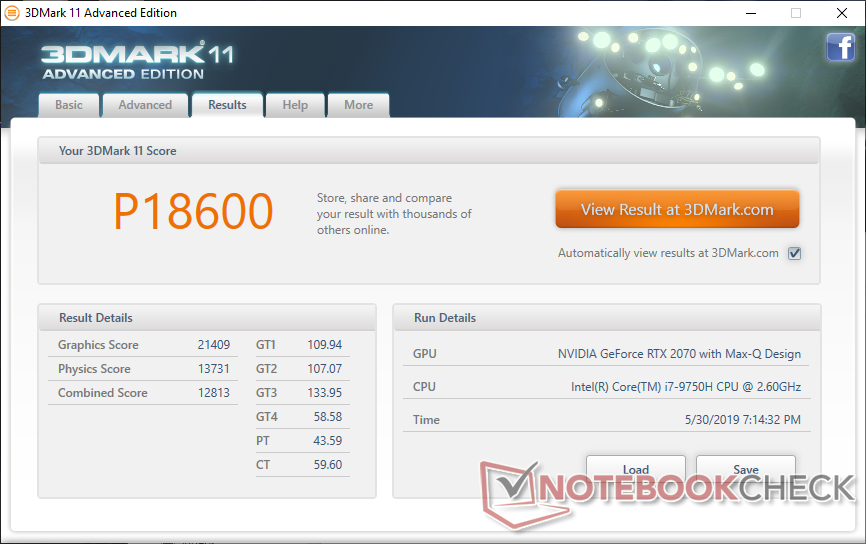

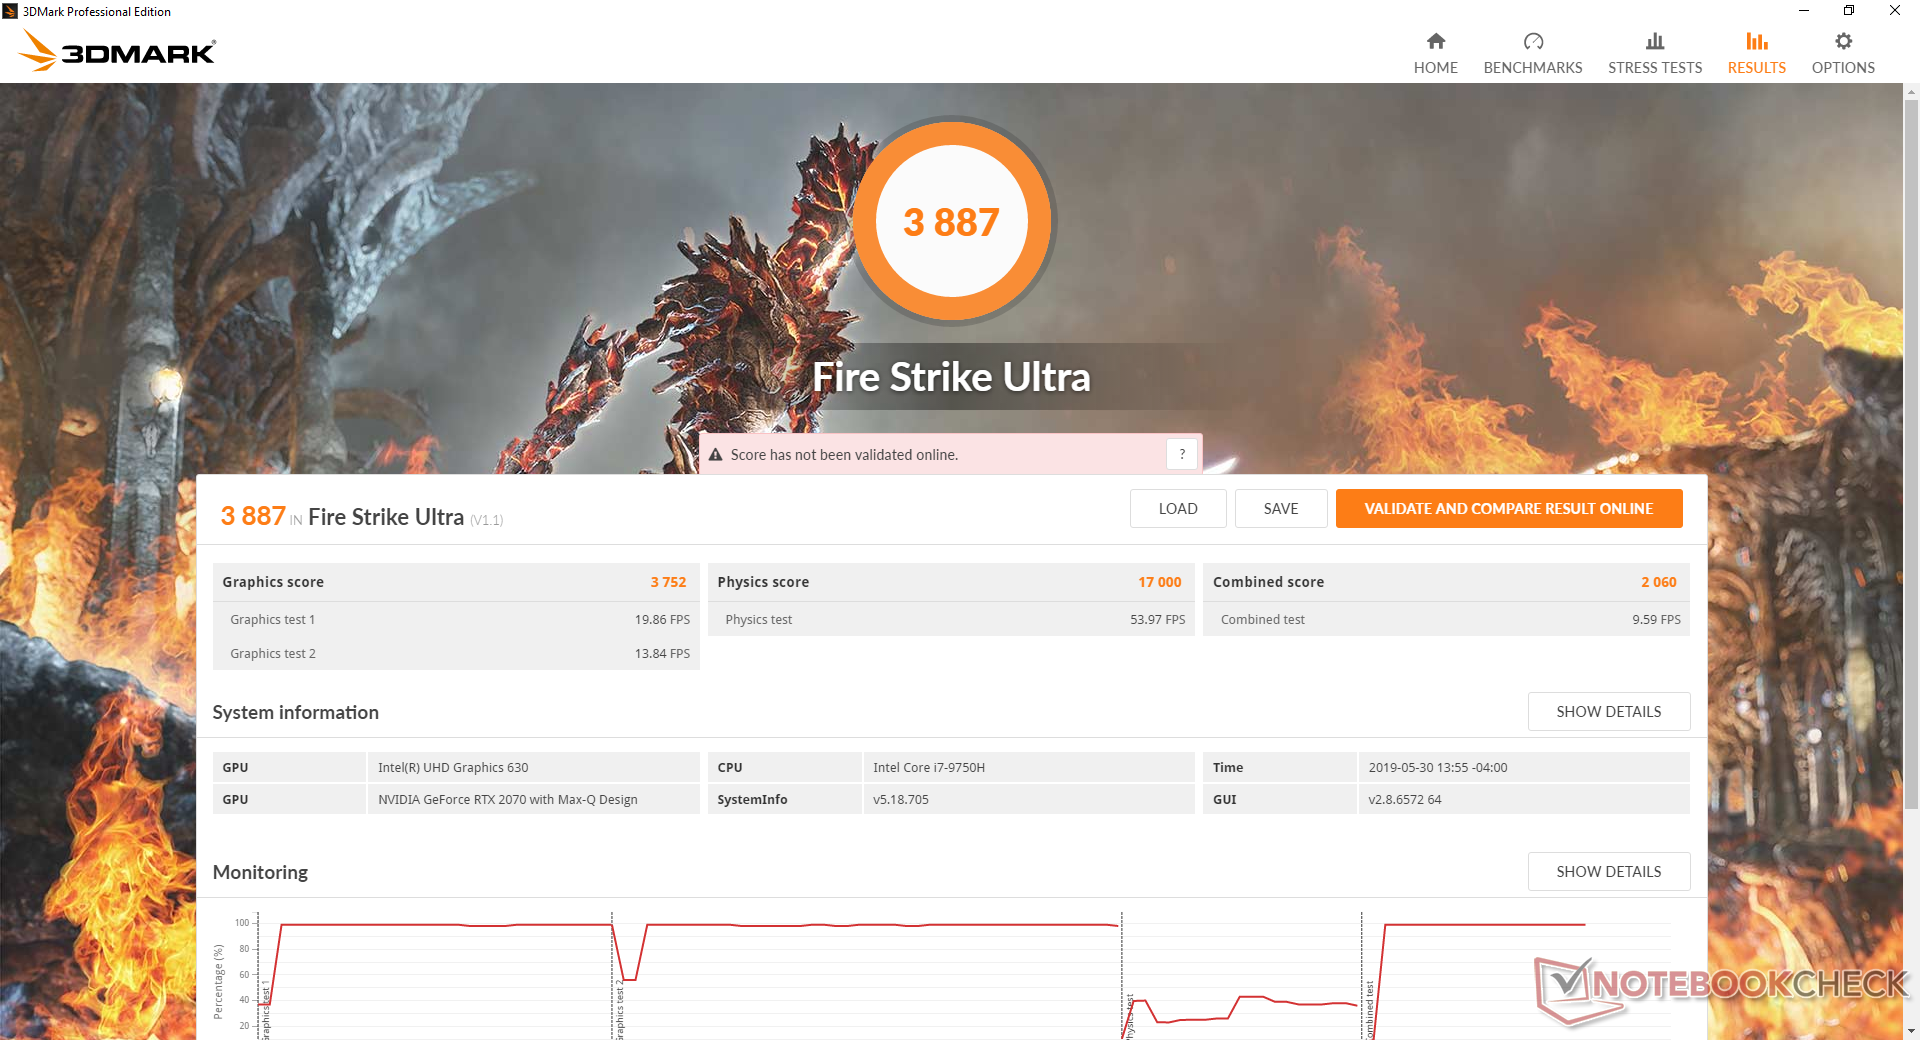

| 3DMark 11 Performance | 18600 points | |
| 3DMark Cloud Gate Standard Score | 37594 points | |
| 3DMark Fire Strike Score | 14950 points | |
| 3DMark Time Spy Score | 6568 points | |
Help | ||
| Shadow of the Tomb Raider - 1920x1080 Highest Preset AA:T | |
| MSI GE75 9SG | |
| Average NVIDIA GeForce RTX 2070 Max-Q (57 - 89, n=12) | |
| CUK Model Z GK5CQ7Z | |
| HP Omen 15-dc0015ng | |
| Asus ROG Zephyrus G15 GA502DU | |
| low | med. | high | ultra | |
|---|---|---|---|---|
| BioShock Infinite (2013) | 316.6 | 261.2 | 255.7 | 150.2 |
| The Witcher 3 (2015) | 306 | 209 | 122 | 63 |
| Rise of the Tomb Raider (2016) | 221.6 | 181.9 | 116 | 96.6 |
| Shadow of the Tomb Raider (2018) | 134 | 96 | 86 | 78 |
Emissions
System Noise
System noise is perhaps the weakest aspect of the Model Z. The fans are always active at 30.8 dB(A) to 35 dB(A) when browsing or video streaming when set to the "Balanced" profile. Pulsing is frequent and so we recommend setting the system to Power Saver for a quieter experience when the gaming horsepower is not needed.
When running Witcher 3 to represent gaming loads, fan noise stabilizes at 51.6 dB(A) to be significantly louder than the Razer Blade 15, MSI GS65, and Lenovo Legion Y740 when under similar conditions. We find the >50 dB(A) range to be difficult to ignore when gaming without a good pair of headphones.
Toggling "Turbo" mode will automatically bump the fan to >50 dB(A) no matter the onscreen load. We're able to record a maximum fan noise of almost 58 dB(A) when running both Prime95 and FurMark simultaneously.
Our test unit exhibits no noticeable electronic noise or coil whine.
| CUK Model Z GK5CQ7Z GeForce RTX 2070 Max-Q, i7-9750H | Asus ROG Zephyrus G15 GA502DU GeForce GTX 1660 Ti Max-Q, R7 3750H | Razer Blade 15 RTX 2070 Max-Q GeForce RTX 2070 Max-Q, i7-8750H | MSI GS65 Stealth Thin 8RE-051US GeForce GTX 1060 Mobile, i7-8750H | Lenovo Legion Y740-15ICHg GeForce RTX 2070 Max-Q, i7-8750H | Razer Blade 15 RTX 2080 Max-Q GeForce RTX 2080 Max-Q, i7-9750H | |
|---|---|---|---|---|---|---|
| Noise | 2% | 13% | 10% | 9% | 13% | |
| off / environment * (dB) | 28.6 | 28 2% | 28.8 -1% | 28.4 1% | 28 2% | 28.3 1% |
| Idle Minimum * (dB) | 30.8 | 29.4 5% | 28.8 6% | 28.4 8% | 32.6 -6% | 28.8 6% |
| Idle Average * (dB) | 30.8 | 31.9 -4% | 28.8 6% | 28.4 8% | 32.7 -6% | 28.8 6% |
| Idle Maximum * (dB) | 35 | 33 6% | 29.4 16% | 29.6 15% | 32.7 7% | 29 17% |
| Load Average * (dB) | 45 | 41.2 8% | 35.7 21% | 43.5 3% | 33.3 26% | 33.5 26% |
| Witcher 3 ultra * (dB) | 51.6 | 53.8 -4% | 42.5 18% | 45.7 11% | 41.6 19% | 45 13% |
| Load Maximum * (dB) | 57.8 | 55.7 4% | 45 22% | 45.7 21% | 45.2 22% | 45.2 22% |
* ... smaller is better
Noise level
| Idle |
| 30.8 / 30.8 / 35 dB(A) |
| Load |
| 45 / 57.8 dB(A) |
 | ||
30 dB silent 40 dB(A) audible 50 dB(A) loud |
||
min: | ||
Temperature

Surface temperature development is symmetric because of the nearly symmetrical cooling solution underneath. Temperatures are slightly warmer than expected when simply idling on desktop. The center of the keyboard, for example, idles at 34 C compared to 31 C on the Lenovo Legion Y740 with the same GPU. Nonetheless, we don't find the surfaces to be uncomfortable for typing.
When gaming, the same hot spot towards the center of the keyboard can become as warm as 45 C which is still cooler than on the Razer Blade 15. Key areas like the palm rests and WASD keys remain relatively cool since fresh air is forced through the sides of the keyboard much like on the Asus ROG GA502. Most of the edges and half of the bottom of the chassis have been dedicated to cooling and so it's important to not block any of the various ventilation grilles.
Stress Test
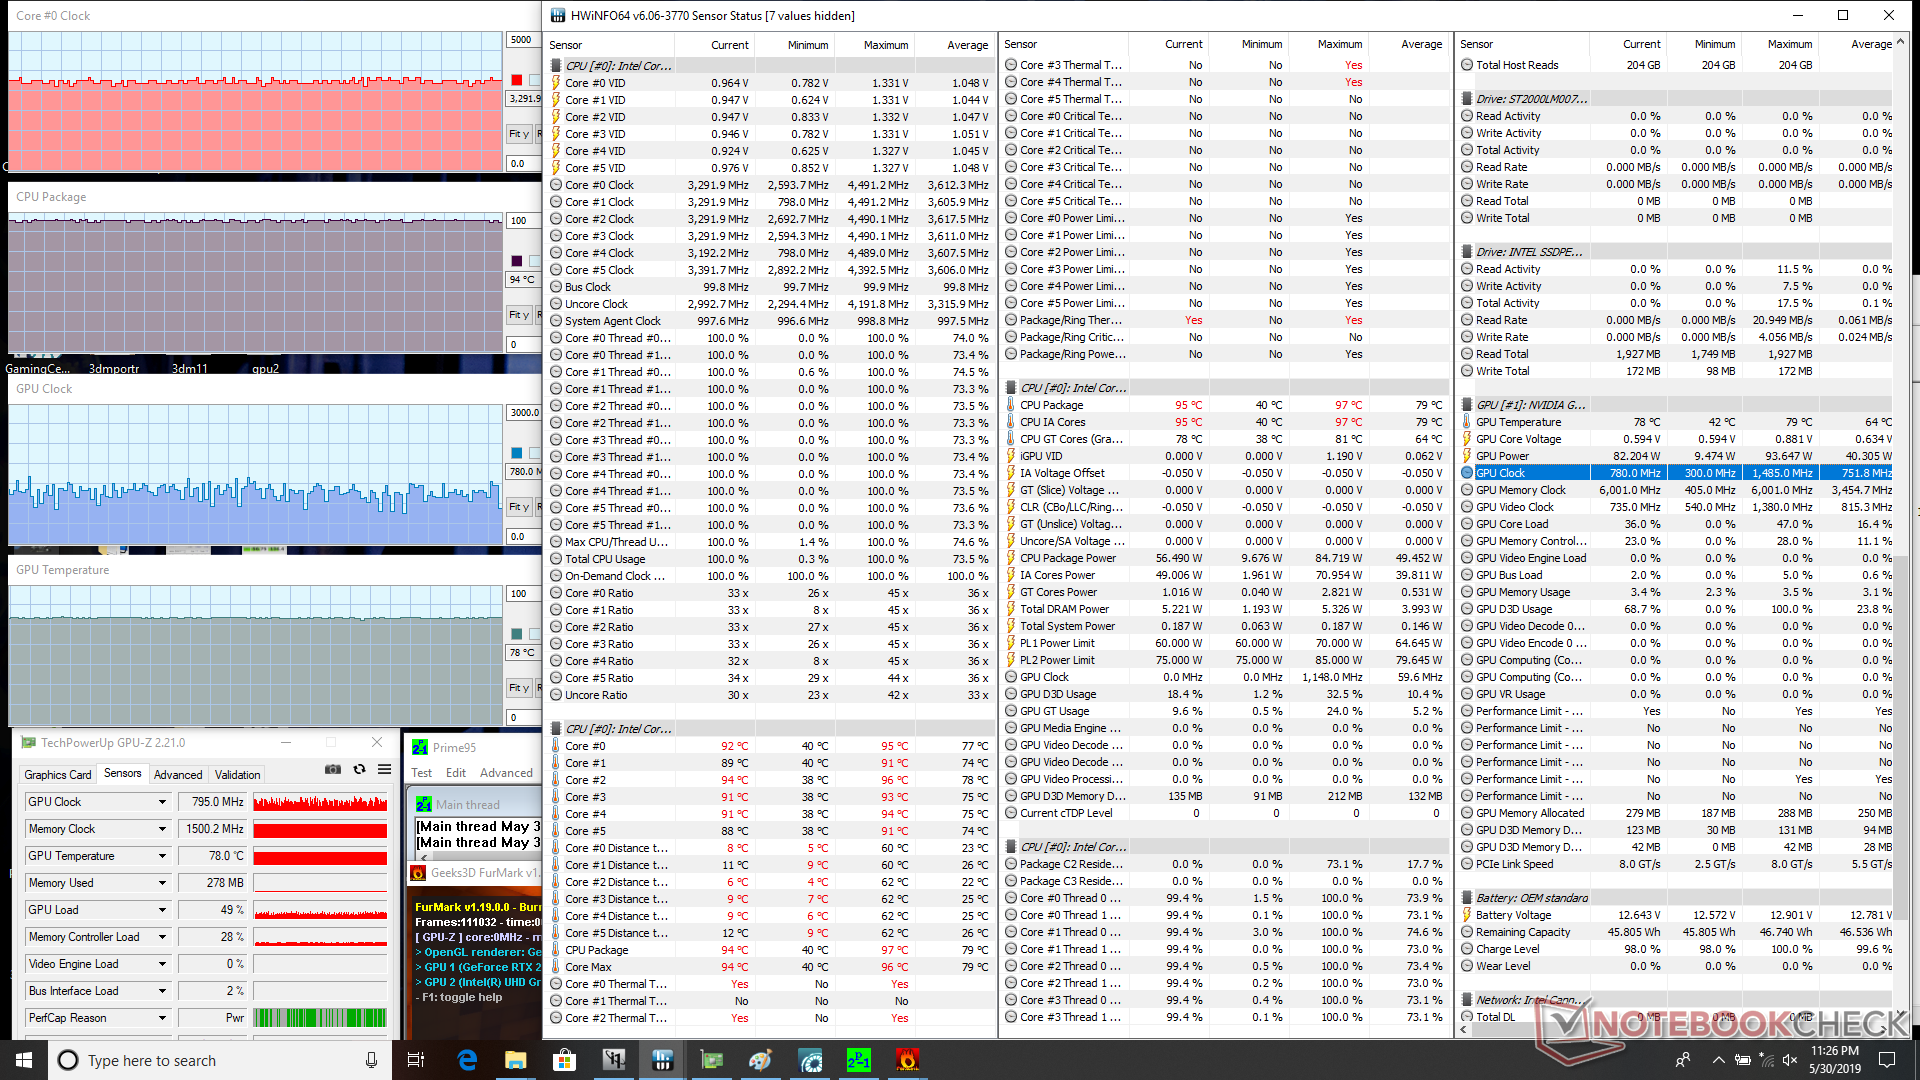
We stress the laptop with synthetic loads to identify for any potential throttling or stability issues. When running Prime95 on "Turbo" or "Gaming" mode, the CPU can boost up to 4 GHz for the first 30 seconds or so before hitting a core temperature of 87 C. Thereafter, clock rates drop and stabilize at 3.5 GHz in order to maintain a cooler core temperature of 80 C. Running both Prime95 and FurMark simultaneously will bump CPU and GPU core temperatures to 94 C and 78 C, respectively.
Running Witcher 3 is more representative of real-world gaming loads. The CPU and GPU stabilize at 71 C and 70 C, respectively, which are impressive numbers given the thin profile and performance under the hood. The Core i7-8750H CPU and RTX 2070 Max-Q GPU in the Lenovo Legion Y740-15ICH run slightly warmer at 76 C and 72 C, respectively, while the Razer Blade 15 can reach 80 C when subjected to the same conditions.
Running on battery power will impact performance significantly. A Fire Strike run on batteries returns Physics and Graphics scores of 9450 and 1729 points, respectively, compared to 16960 and 16460 points when on mains.
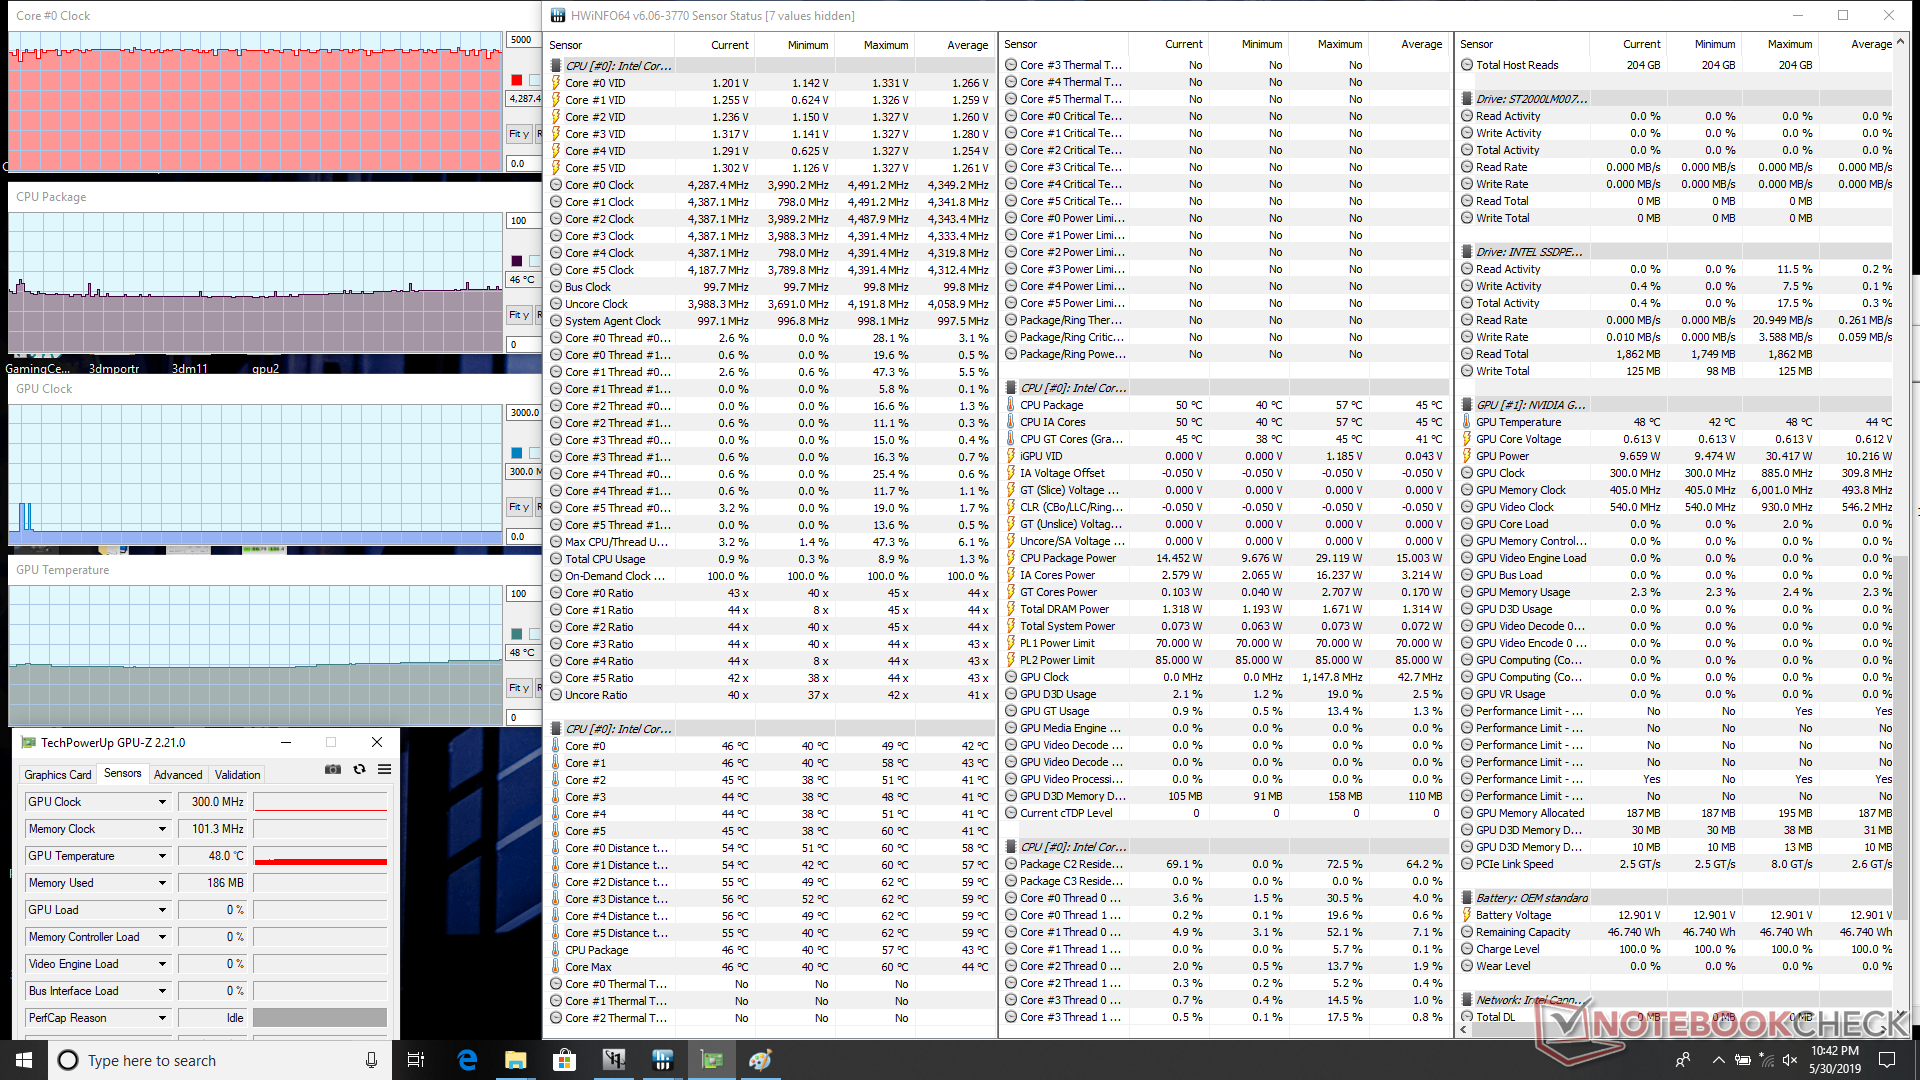
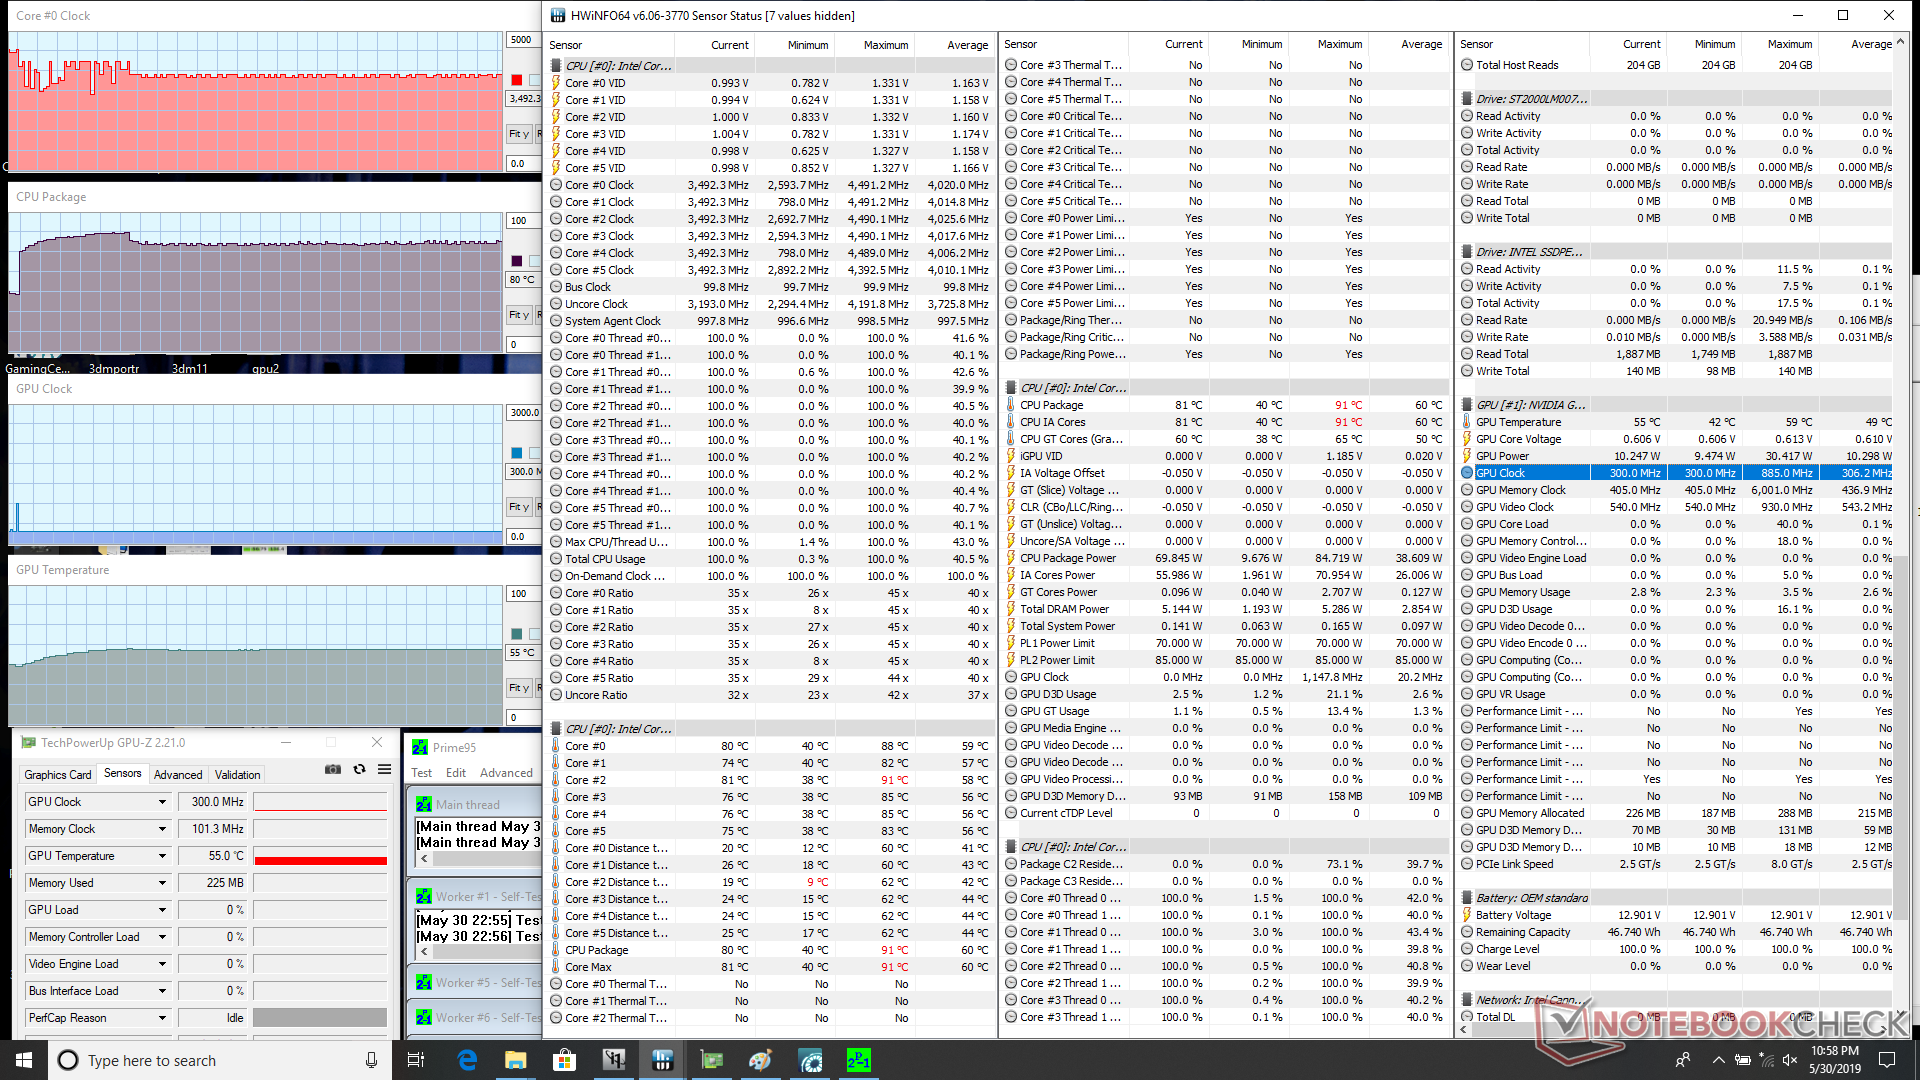
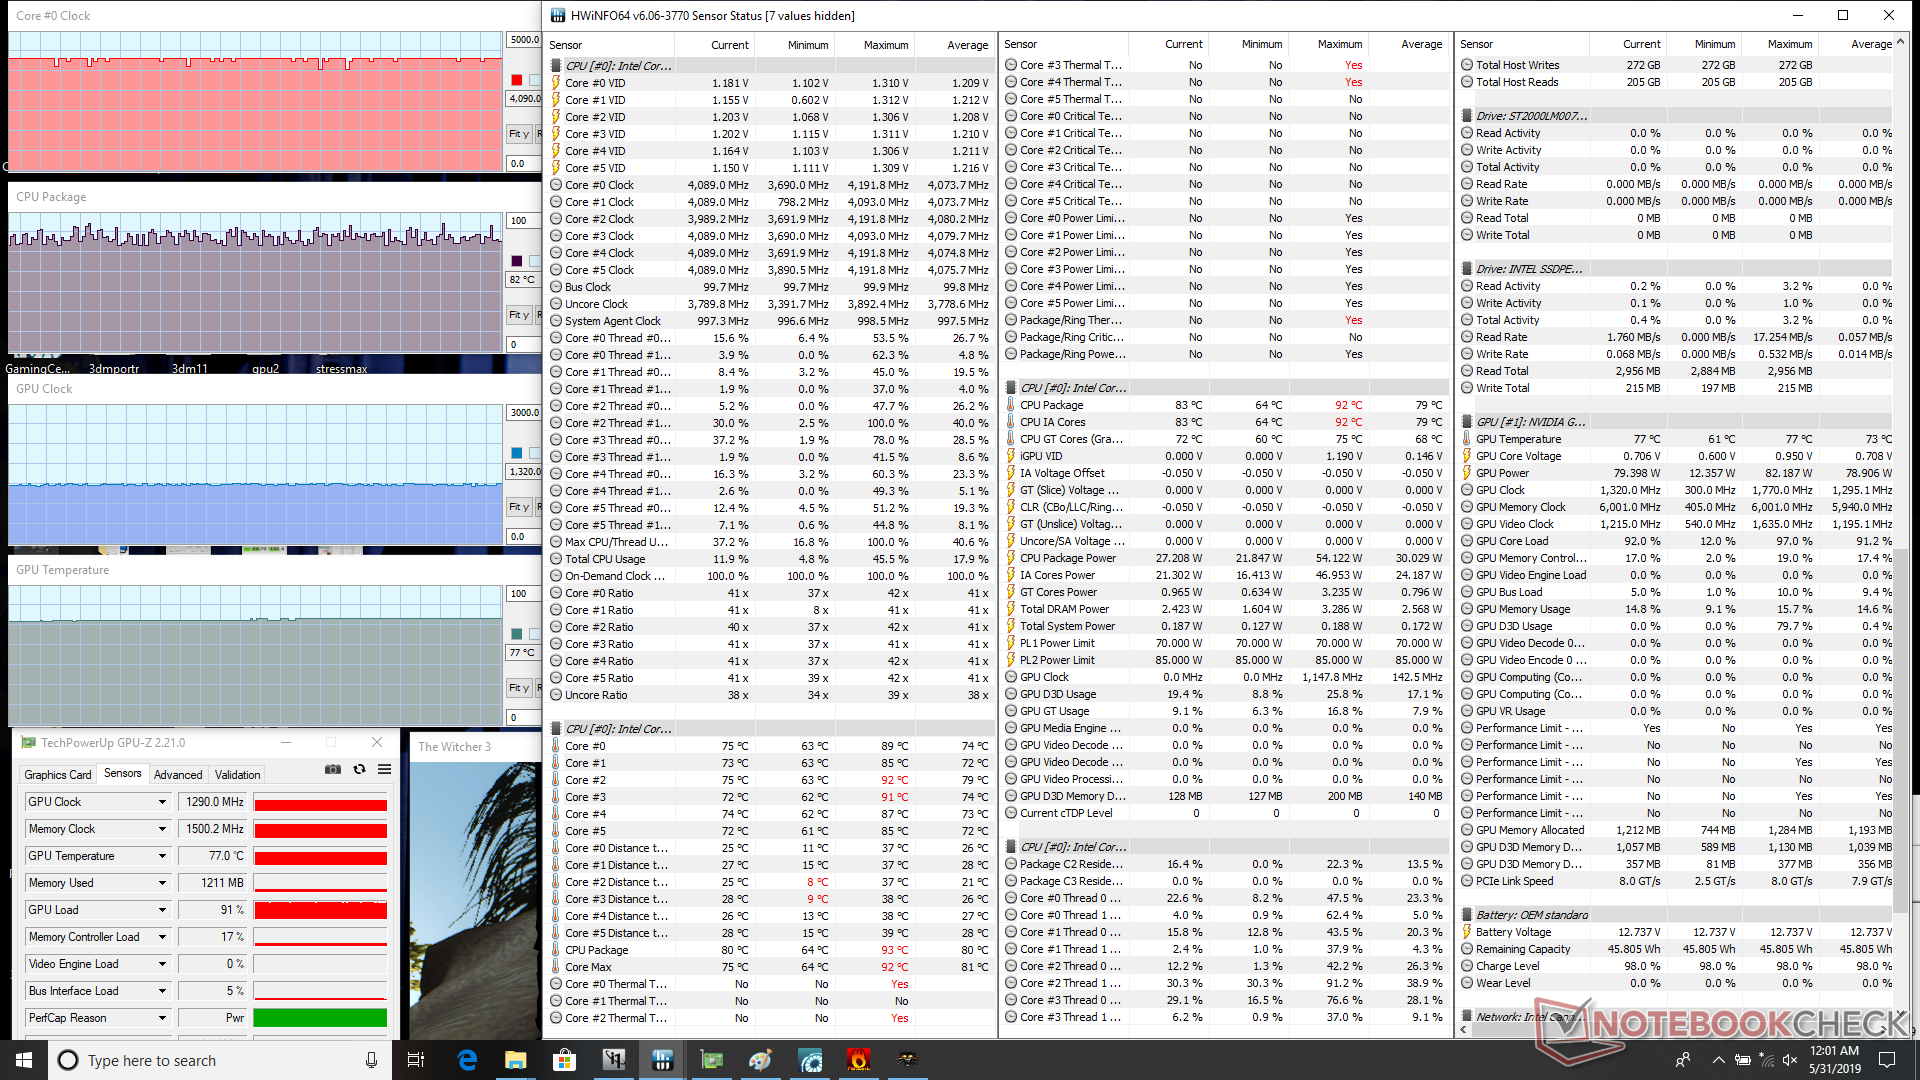
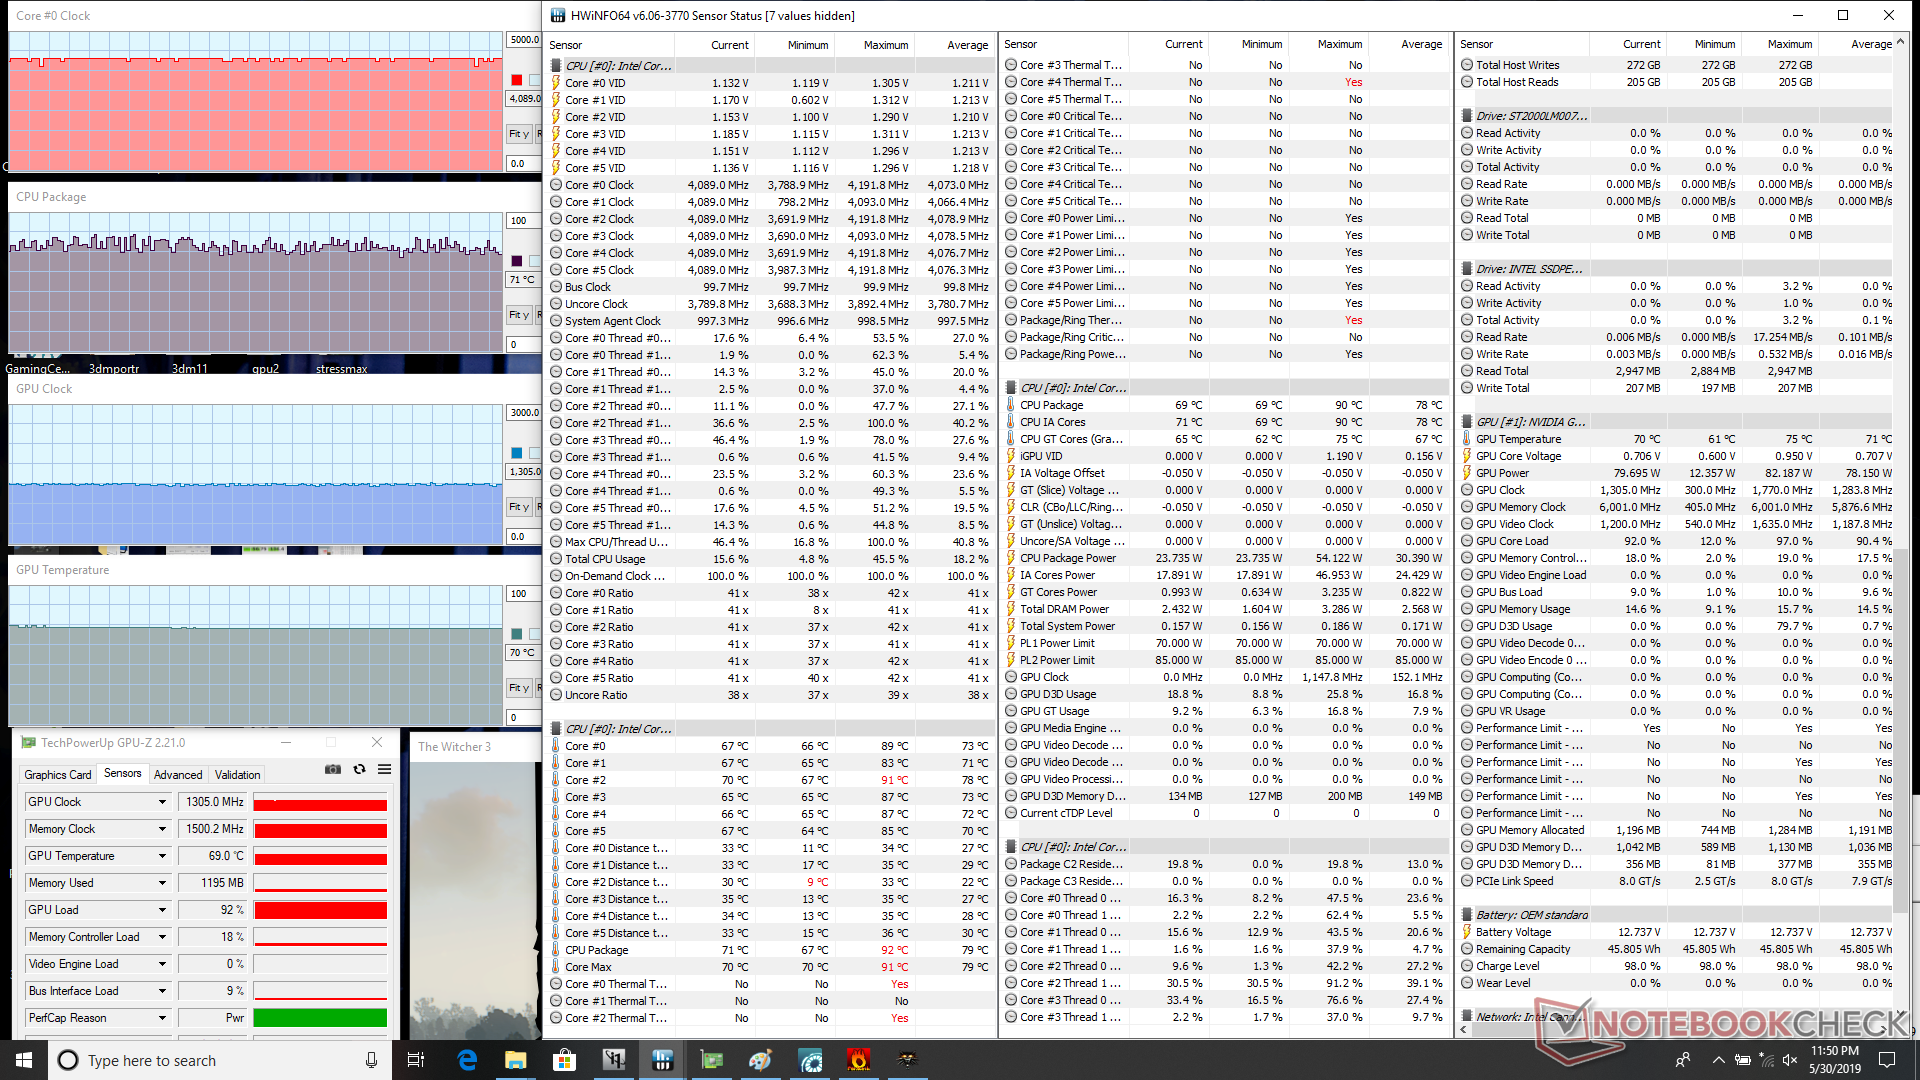
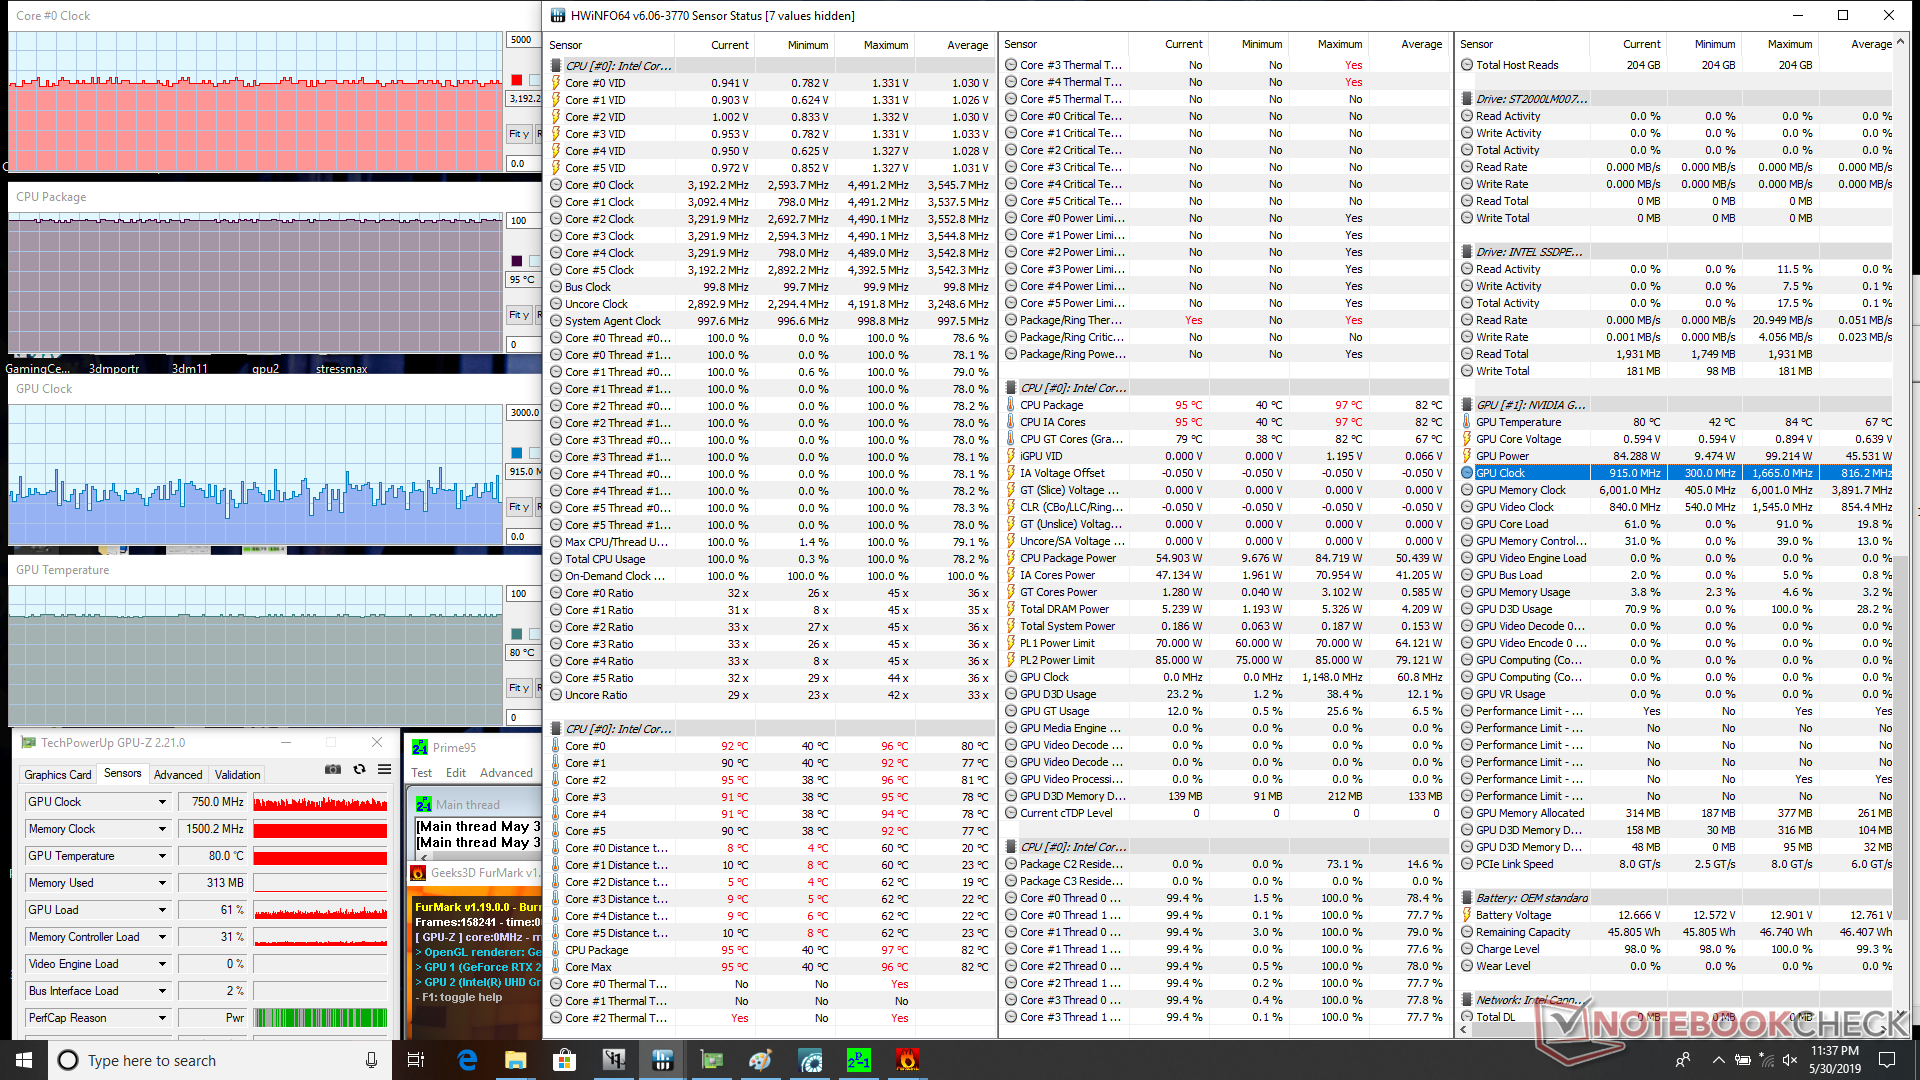
| CPU Clock (GHz) | GPU Clock (MHz) | Average CPU Temperature (°C) | Average GPU Temperature (°C) | |
| System Idle | -- | -- | 46 | 48 |
| Prime95 Stress | 3.4 - 3.5 | -- | 80 | 55 |
| Prime95 + FurMark Stress | 3.3 | ~800 | 94 | 78 |
| Witcher 3 Stress | 4.0 - 4.1 | 1305 | 71 | 70 |
(-) The maximum temperature on the upper side is 47.2 °C / 117 F, compared to the average of 40.4 °C / 105 F, ranging from 21.2 to 68.8 °C for the class Gaming.
(-) The bottom heats up to a maximum of 65.8 °C / 150 F, compared to the average of 43.2 °C / 110 F
(+) In idle usage, the average temperature for the upper side is 31.2 °C / 88 F, compared to the device average of 33.9 °C / 93 F.
(±) Playing The Witcher 3, the average temperature for the upper side is 33.9 °C / 93 F, compared to the device average of 33.9 °C / 93 F.
(+) The palmrests and touchpad are reaching skin temperature as a maximum (35 °C / 95 F) and are therefore not hot.
(-) The average temperature of the palmrest area of similar devices was 28.8 °C / 83.8 F (-6.2 °C / -11.2 F).


Speakers


CUK Model Z GK5CQ7Z audio analysis
(±) | speaker loudness is average but good (81.4 dB)
Bass 100 - 315 Hz
(-) | nearly no bass - on average 20.7% lower than median
(±) | linearity of bass is average (14.4% delta to prev. frequency)
Mids 400 - 2000 Hz
(±) | higher mids - on average 5.5% higher than median
(±) | linearity of mids is average (12.1% delta to prev. frequency)
Highs 2 - 16 kHz
(+) | balanced highs - only 3% away from median
(±) | linearity of highs is average (9.2% delta to prev. frequency)
Overall 100 - 16.000 Hz
(±) | linearity of overall sound is average (25.7% difference to median)
Compared to same class
» 91% of all tested devices in this class were better, 2% similar, 7% worse
» The best had a delta of 6%, average was 18%, worst was 132%
Compared to all devices tested
» 79% of all tested devices were better, 4% similar, 17% worse
» The best had a delta of 4%, average was 24%, worst was 134%
Apple MacBook 12 (Early 2016) 1.1 GHz audio analysis
(+) | speakers can play relatively loud (83.6 dB)
Bass 100 - 315 Hz
(±) | reduced bass - on average 11.3% lower than median
(±) | linearity of bass is average (14.2% delta to prev. frequency)
Mids 400 - 2000 Hz
(+) | balanced mids - only 2.4% away from median
(+) | mids are linear (5.5% delta to prev. frequency)
Highs 2 - 16 kHz
(+) | balanced highs - only 2% away from median
(+) | highs are linear (4.5% delta to prev. frequency)
Overall 100 - 16.000 Hz
(+) | overall sound is linear (10.2% difference to median)
Compared to same class
» 7% of all tested devices in this class were better, 2% similar, 91% worse
» The best had a delta of 5%, average was 18%, worst was 53%
Compared to all devices tested
» 5% of all tested devices were better, 1% similar, 94% worse
» The best had a delta of 4%, average was 24%, worst was 134%
Energy Management
Power Consumption
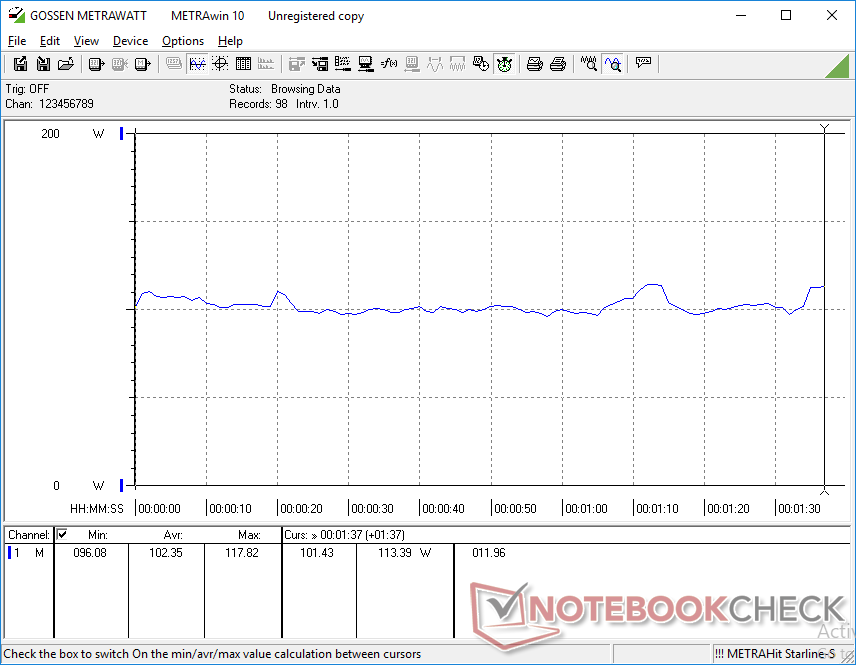
Our test unit is more demanding than the Schenker XMG Neo 15 even though both are equipped with the same RTX 2070 Max-Q GPU. Idling on desktop, for example, demands between 23 W and 32 W depending on the Power profile and display brightness compared to just 13 W to 21 W on the Schenker. This is rather high even for a gaming laptop possibly due to system activity running in the background.
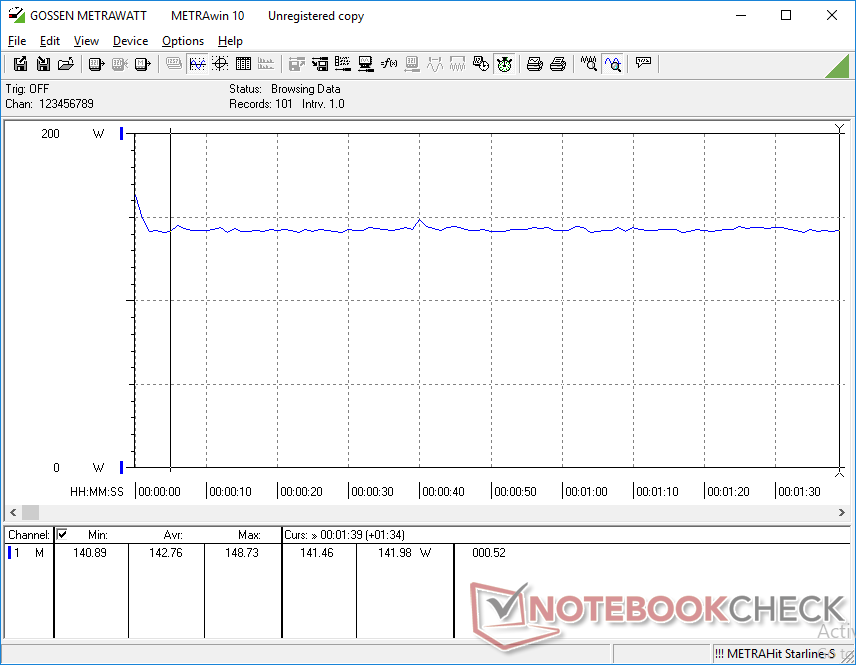
Power consumption when gaming is slightly higher on our Model Z as shown by the comparison table below. Running Witcher 3, for example, is 5 percent more demanding than our Schenker despite the fact that gaming performance is nearly identical between them.
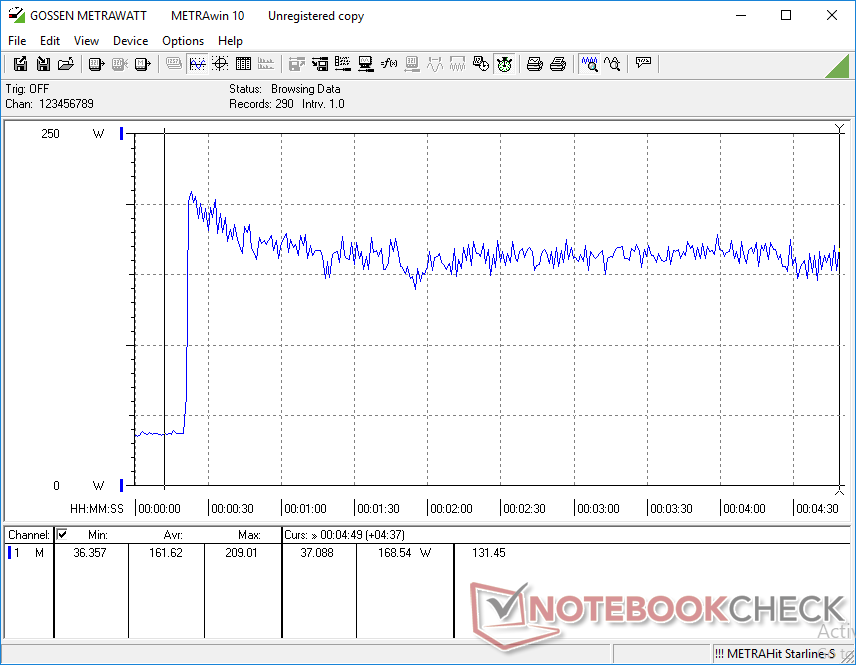
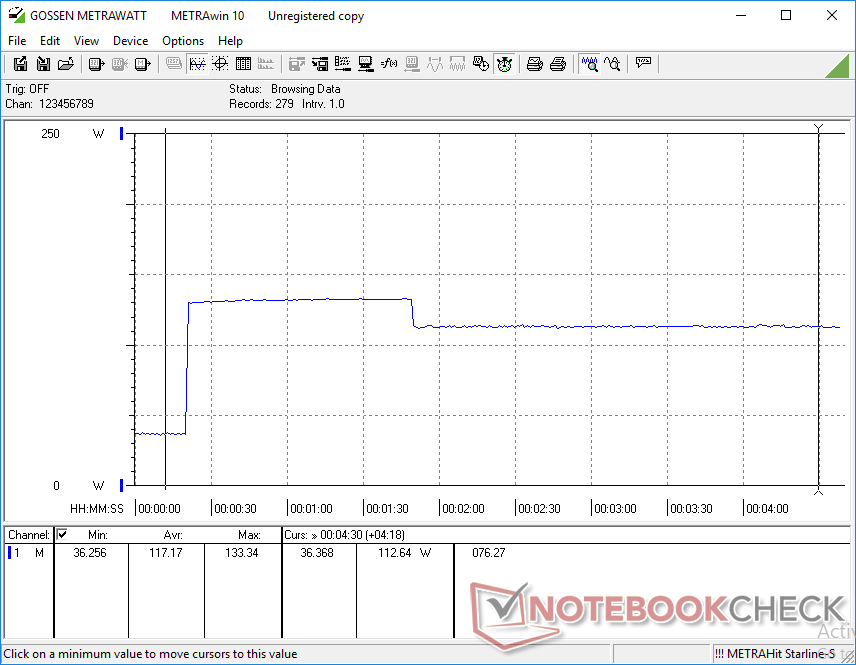
We're able to record a maximum draw of 209 W from the medium-sized (~15.4 x 7.4 x 3 cm) 230 W AC adapter compared to 183 W from the 180 W AC adapter that shipped with the Schenker. The higher power ceiling of the 230 W AC adapter is not fully utilized in this regard as power consumption eventually drops and stabilizes at about 170 W to keep temperatures in check.
| Off / Standby | |
| Idle | |
| Load |
|
Key:
min: | |
| CUK Model Z GK5CQ7Z i7-9750H, GeForce RTX 2070 Max-Q, Intel SSD 660p 2TB SSDPEKNW020T8, IPS, 1920x1080, 15.6" | Schenker XMG Neo 15 Turing i7-8750H, GeForce RTX 2070 Max-Q, Samsung SSD 970 EVO Plus 1TB, IPS, 1920x1080, 15.6" | Asus ROG Zephyrus G15 GA502DU R7 3750H, GeForce GTX 1660 Ti Max-Q, Intel SSD 660p SSDPEKNW512G8, IPS, 1920x1080, 15.6" | MSI GS65 Stealth Thin 8RE-051US i7-8750H, GeForce GTX 1060 Mobile, Samsung SSD PM981 MZVLB256HAHQ, IPS, 1920x1080, 15.6" | Alienware m15 GTX 1070 Max-Q i7-8750H, GeForce GTX 1070 Max-Q, Toshiba XG5 KXG50ZNV512G, IPS, 1920x1080, 15.6" | Razer Blade 15 RTX 2080 Max-Q i7-9750H, GeForce RTX 2080 Max-Q, Samsung SSD PM981 MZVLB512HAJQ, IPS, 1920x1080, 15.6" | |
|---|---|---|---|---|---|---|
| Power Consumption | 26% | 35% | 34% | 32% | 21% | |
| Idle Minimum * (Watt) | 23.5 | 13 45% | 7.4 69% | 8.7 63% | 7.6 68% | 12.5 47% |
| Idle Average * (Watt) | 28 | 16 43% | 8.6 69% | 13 54% | 13.8 51% | 15.3 45% |
| Idle Maximum * (Watt) | 32 | 21 34% | 39.1 -22% | 14.3 55% | 14.6 54% | 20.7 35% |
| Load Average * (Watt) | 102.4 | 84 18% | 65.9 36% | 107.4 -5% | 97.6 5% | 90.2 12% |
| Witcher 3 ultra * (Watt) | 142.8 | 135 5% | 106.9 25% | 129 10% | 145.8 -2% | 162 -13% |
| Load Maximum * (Watt) | 209 | 183 12% | 141.3 32% | 151.5 28% | 172.5 17% | 209.3 -0% |
* ... smaller is better
Battery Life
The higher-than-expected power consumption readings above and small 46.7 Wh battery led to lower-than-expected battery life. When setting the Windows profile to Balanced mode, the Gaming Center to Equilibrium mode, and Nvidia Optimus to the integrated GPU, we're able to record a WLAN runtime of only 3 hours compared to 5 hours on the Schenker XMG Neo 15 with the larger 62 Wh internal battery.
Charging from empty to full capacity takes about 2 to 2.5 hours compared to 1.5 hours on most Ultrabooks and other gaming laptops.
| CUK Model Z GK5CQ7Z i7-9750H, GeForce RTX 2070 Max-Q, 46.74 Wh | Asus ROG Zephyrus G15 GA502DU R7 3750H, GeForce GTX 1660 Ti Max-Q, 76 Wh | Razer Blade 15 RTX 2070 Max-Q i7-8750H, GeForce RTX 2070 Max-Q, 80 Wh | Schenker XMG Neo 15 Turing i7-8750H, GeForce RTX 2070 Max-Q, 62.3 Wh | Lenovo Legion Y740-15ICHg i7-8750H, GeForce RTX 2070 Max-Q, 57 Wh | Alienware m15 GTX 1070 Max-Q i7-8750H, GeForce GTX 1070 Max-Q, 90 Wh | |
|---|---|---|---|---|---|---|
| Battery runtime | 167% | 117% | 70% | -7% | 157% | |
| WiFi v1.3 (h) | 3 | 8 167% | 6.5 117% | 5.1 70% | 2.8 -7% | 7.7 157% |
| Reader / Idle (h) | 15.3 | 11.4 | 6.9 | 3.9 | 10.5 | |
| Load (h) | 2.1 | 1.5 | 1.6 | 0.8 | 1.7 |
Pros
Cons
Verdict

When compared to the Core i7-8750H SKU, the newer i7-9750H is able to offer 17 percent faster multi-thread performance. Beyond that, however, gaming performance is nearly identical to the i7-8750H SKU. The higher capacity 230 W AC adapter makes little to no difference here as power consumption averages well below 180 W when gaming. Nonetheless, the higher power ceiling can help in charging the system at a quicker rate whilst gaming.
The unique aspects of the Model Z are its mechanical keys and triple internal storage bays which are rarities for a thin gaming laptop. The Model Z also retails for hundreds of dollars less than its big name competitors when given the same CPU, GPU, display, and RAM configurations. If you're not fond of loud and clicky keys, however, then you may want to skip the Model Z for a quieter option like the pricier MSI GS65 or Asus Zephyrus GX531.
Enthusiast-level gaming performance and ultra-thin features at a more affordable price than the MSI GS65, Razer Blade 15, or Asus Zephyrus GX531. The unique and loud mechanical keys will be hit or miss depending on user preferences.
CUK Model Z GK5CQ7Z
- 06/05/2019 v6 (old)
Allen Ngo
Price comparison
