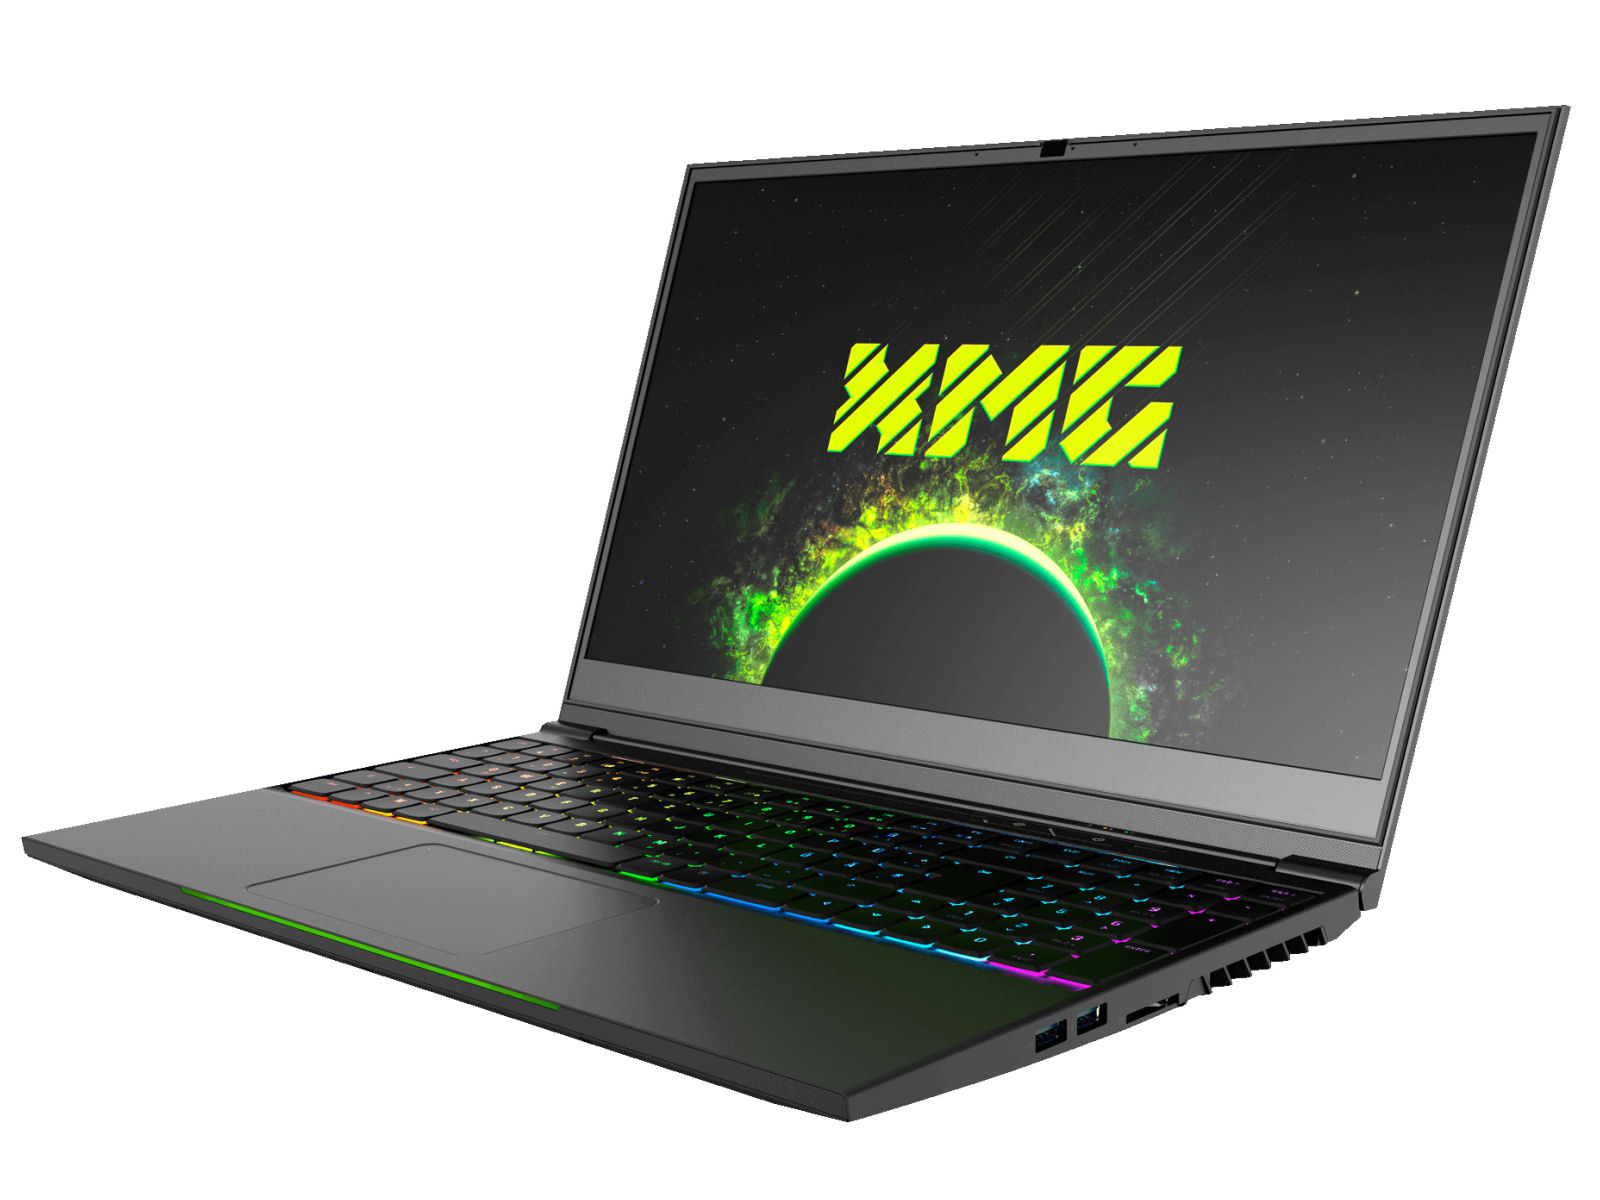
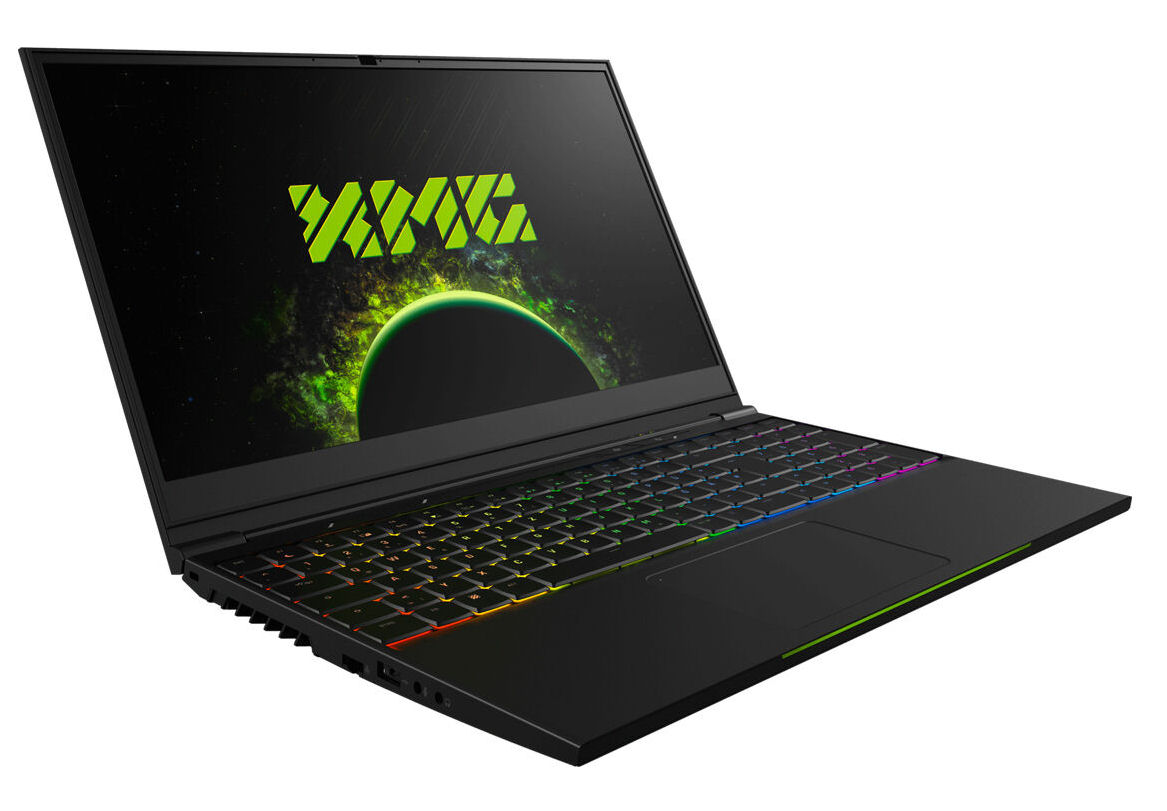
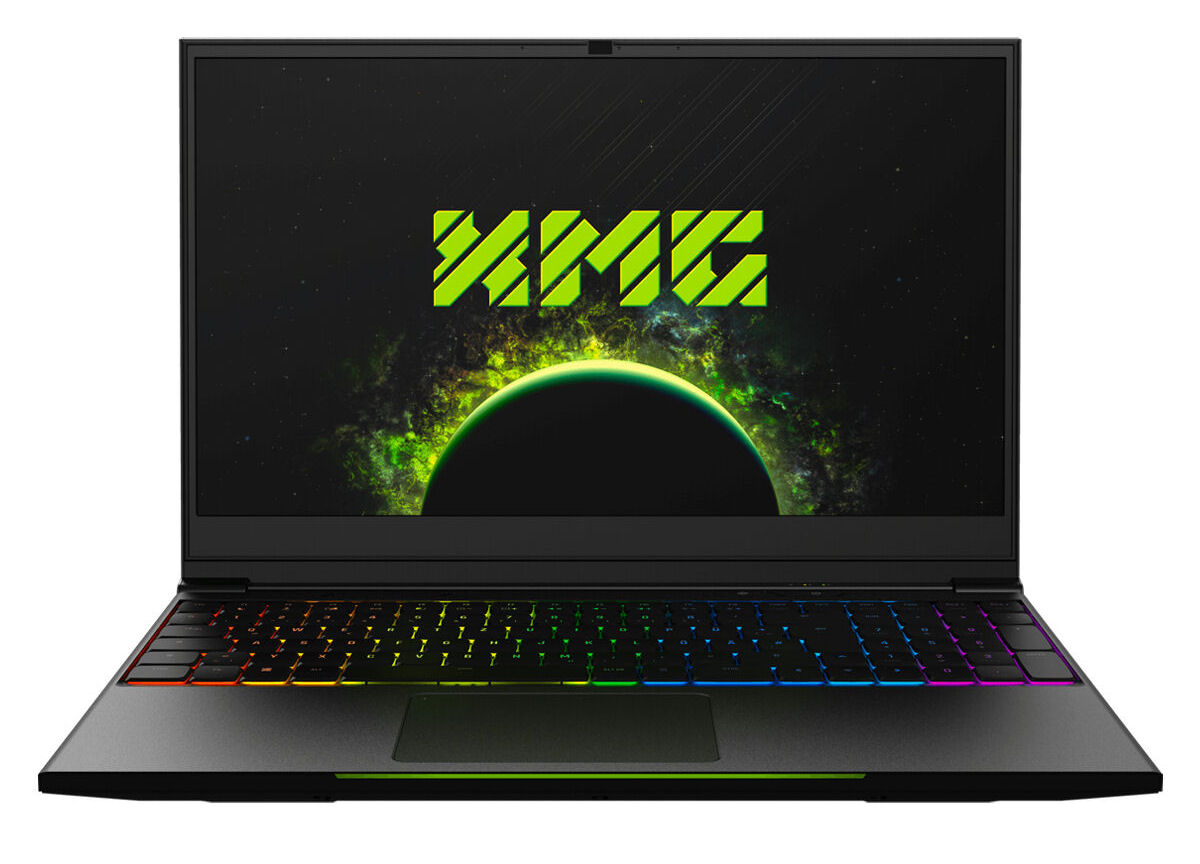
Schenker XMG Neo 15 (i7-8750H, RTX 2070 Max-Q) Tongfang GK5CQ7Z Laptop Review
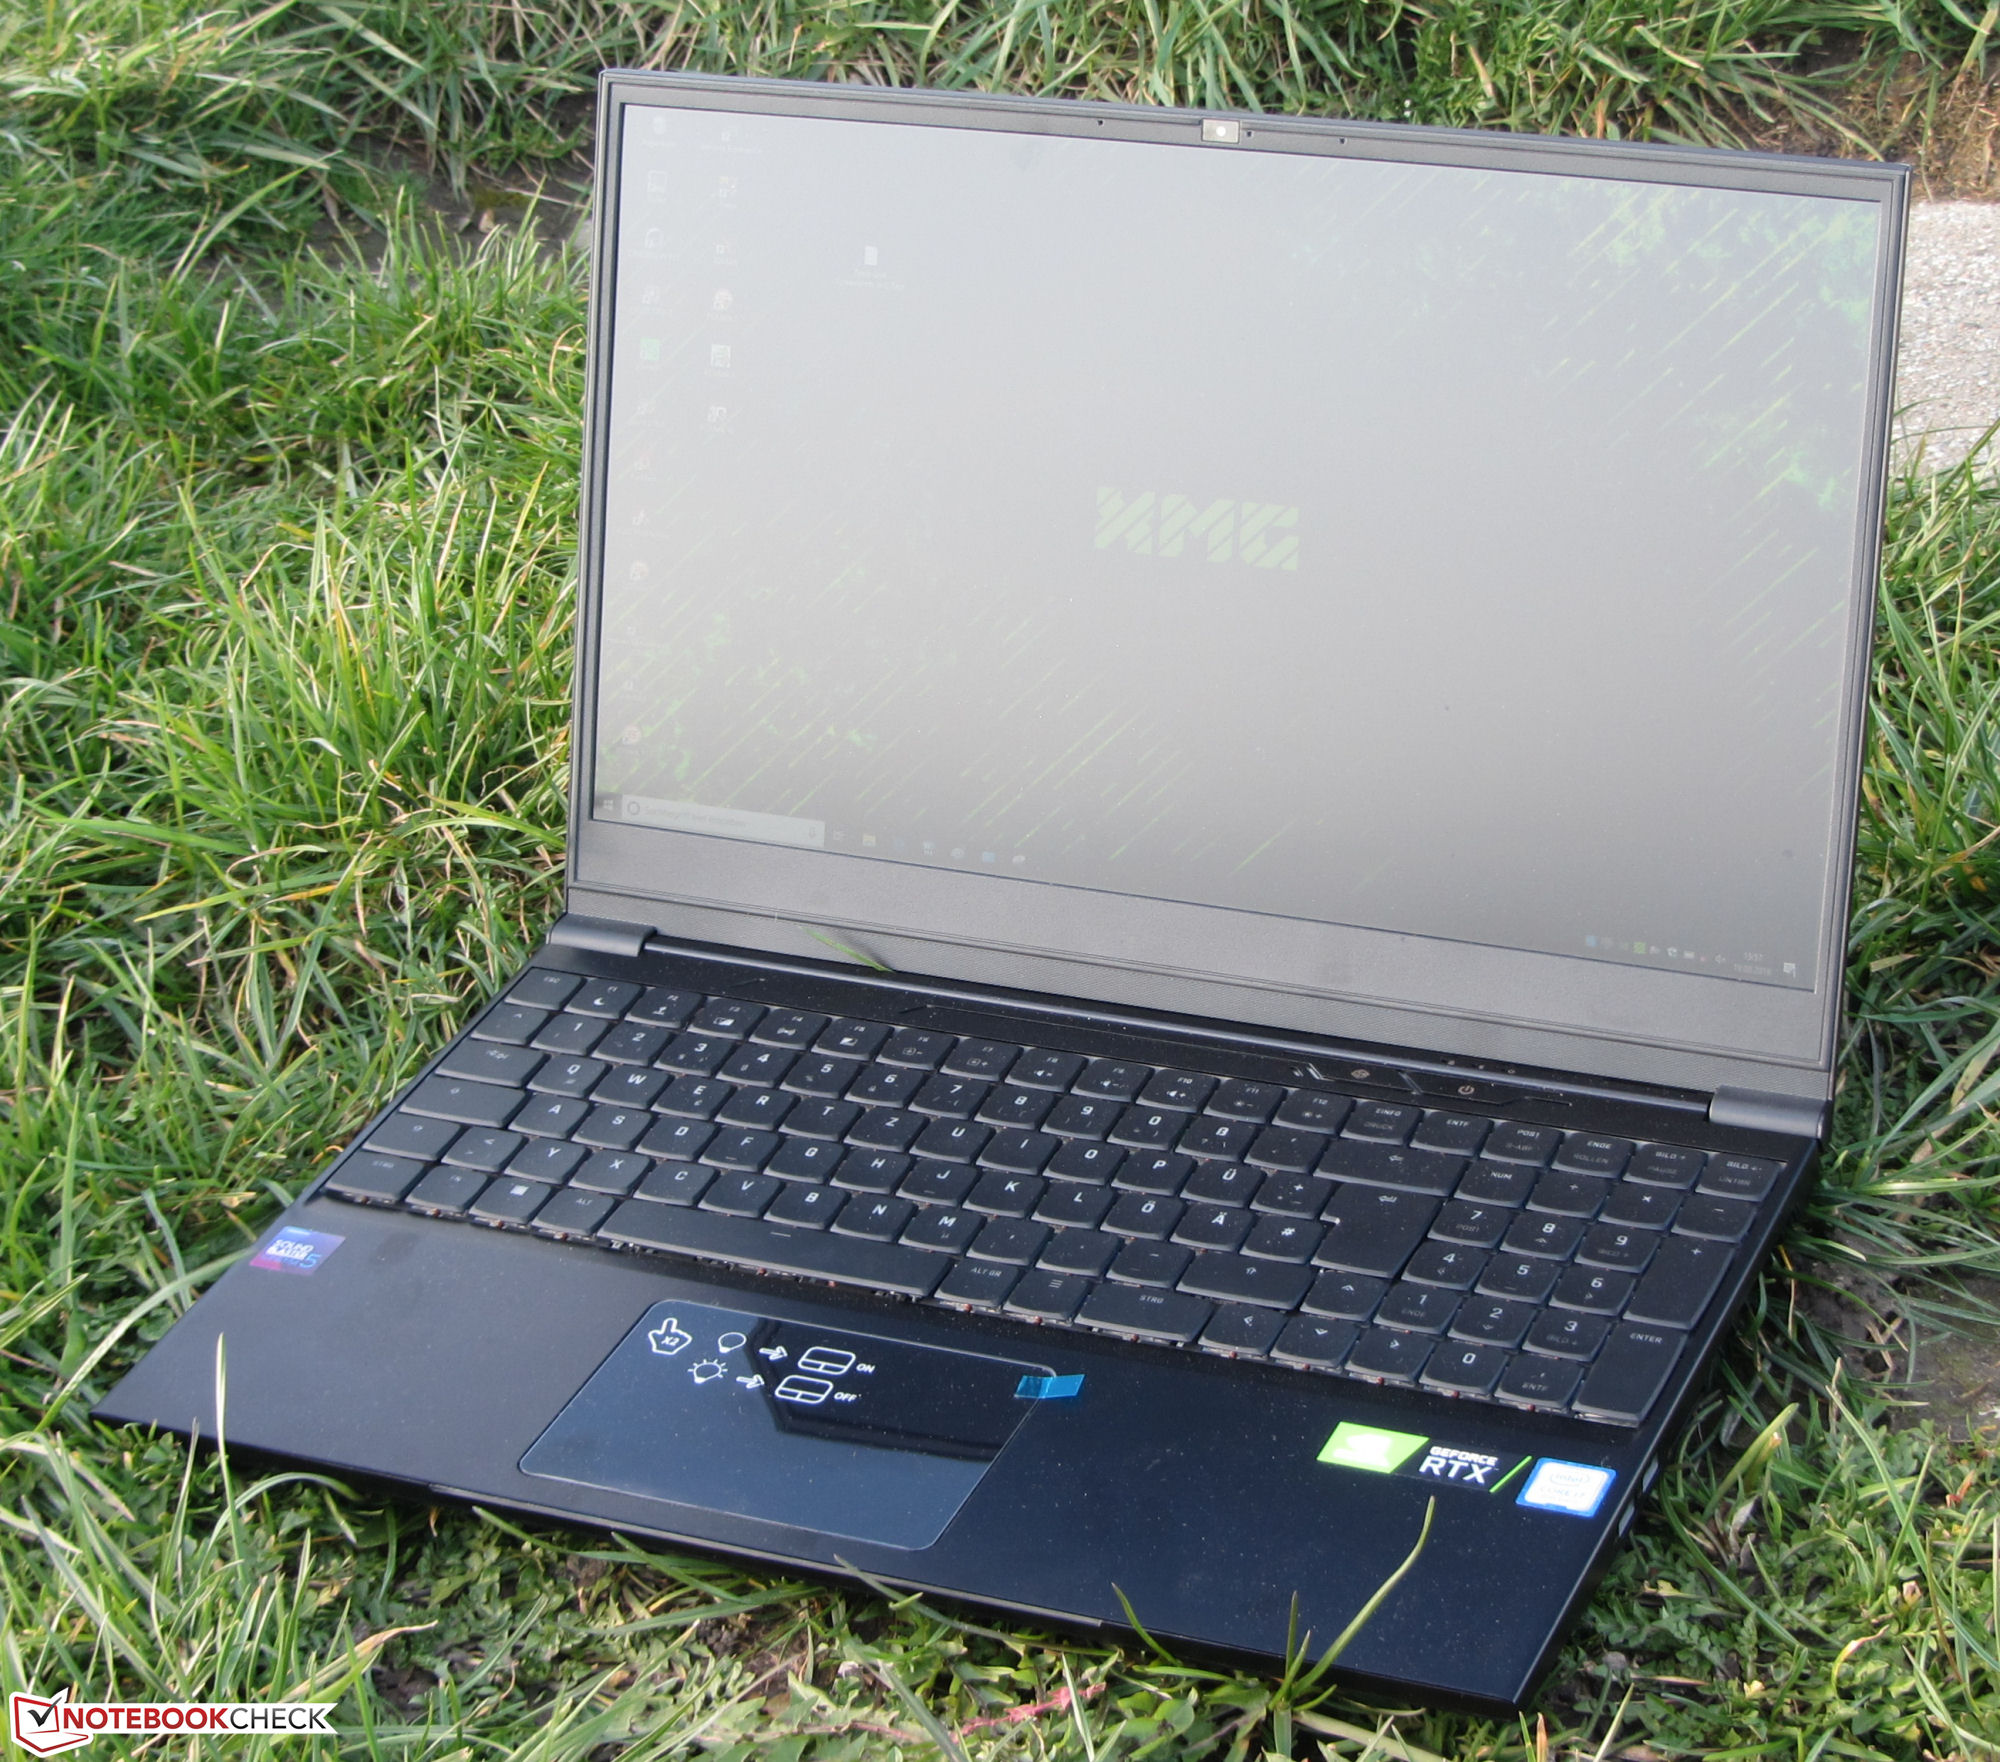
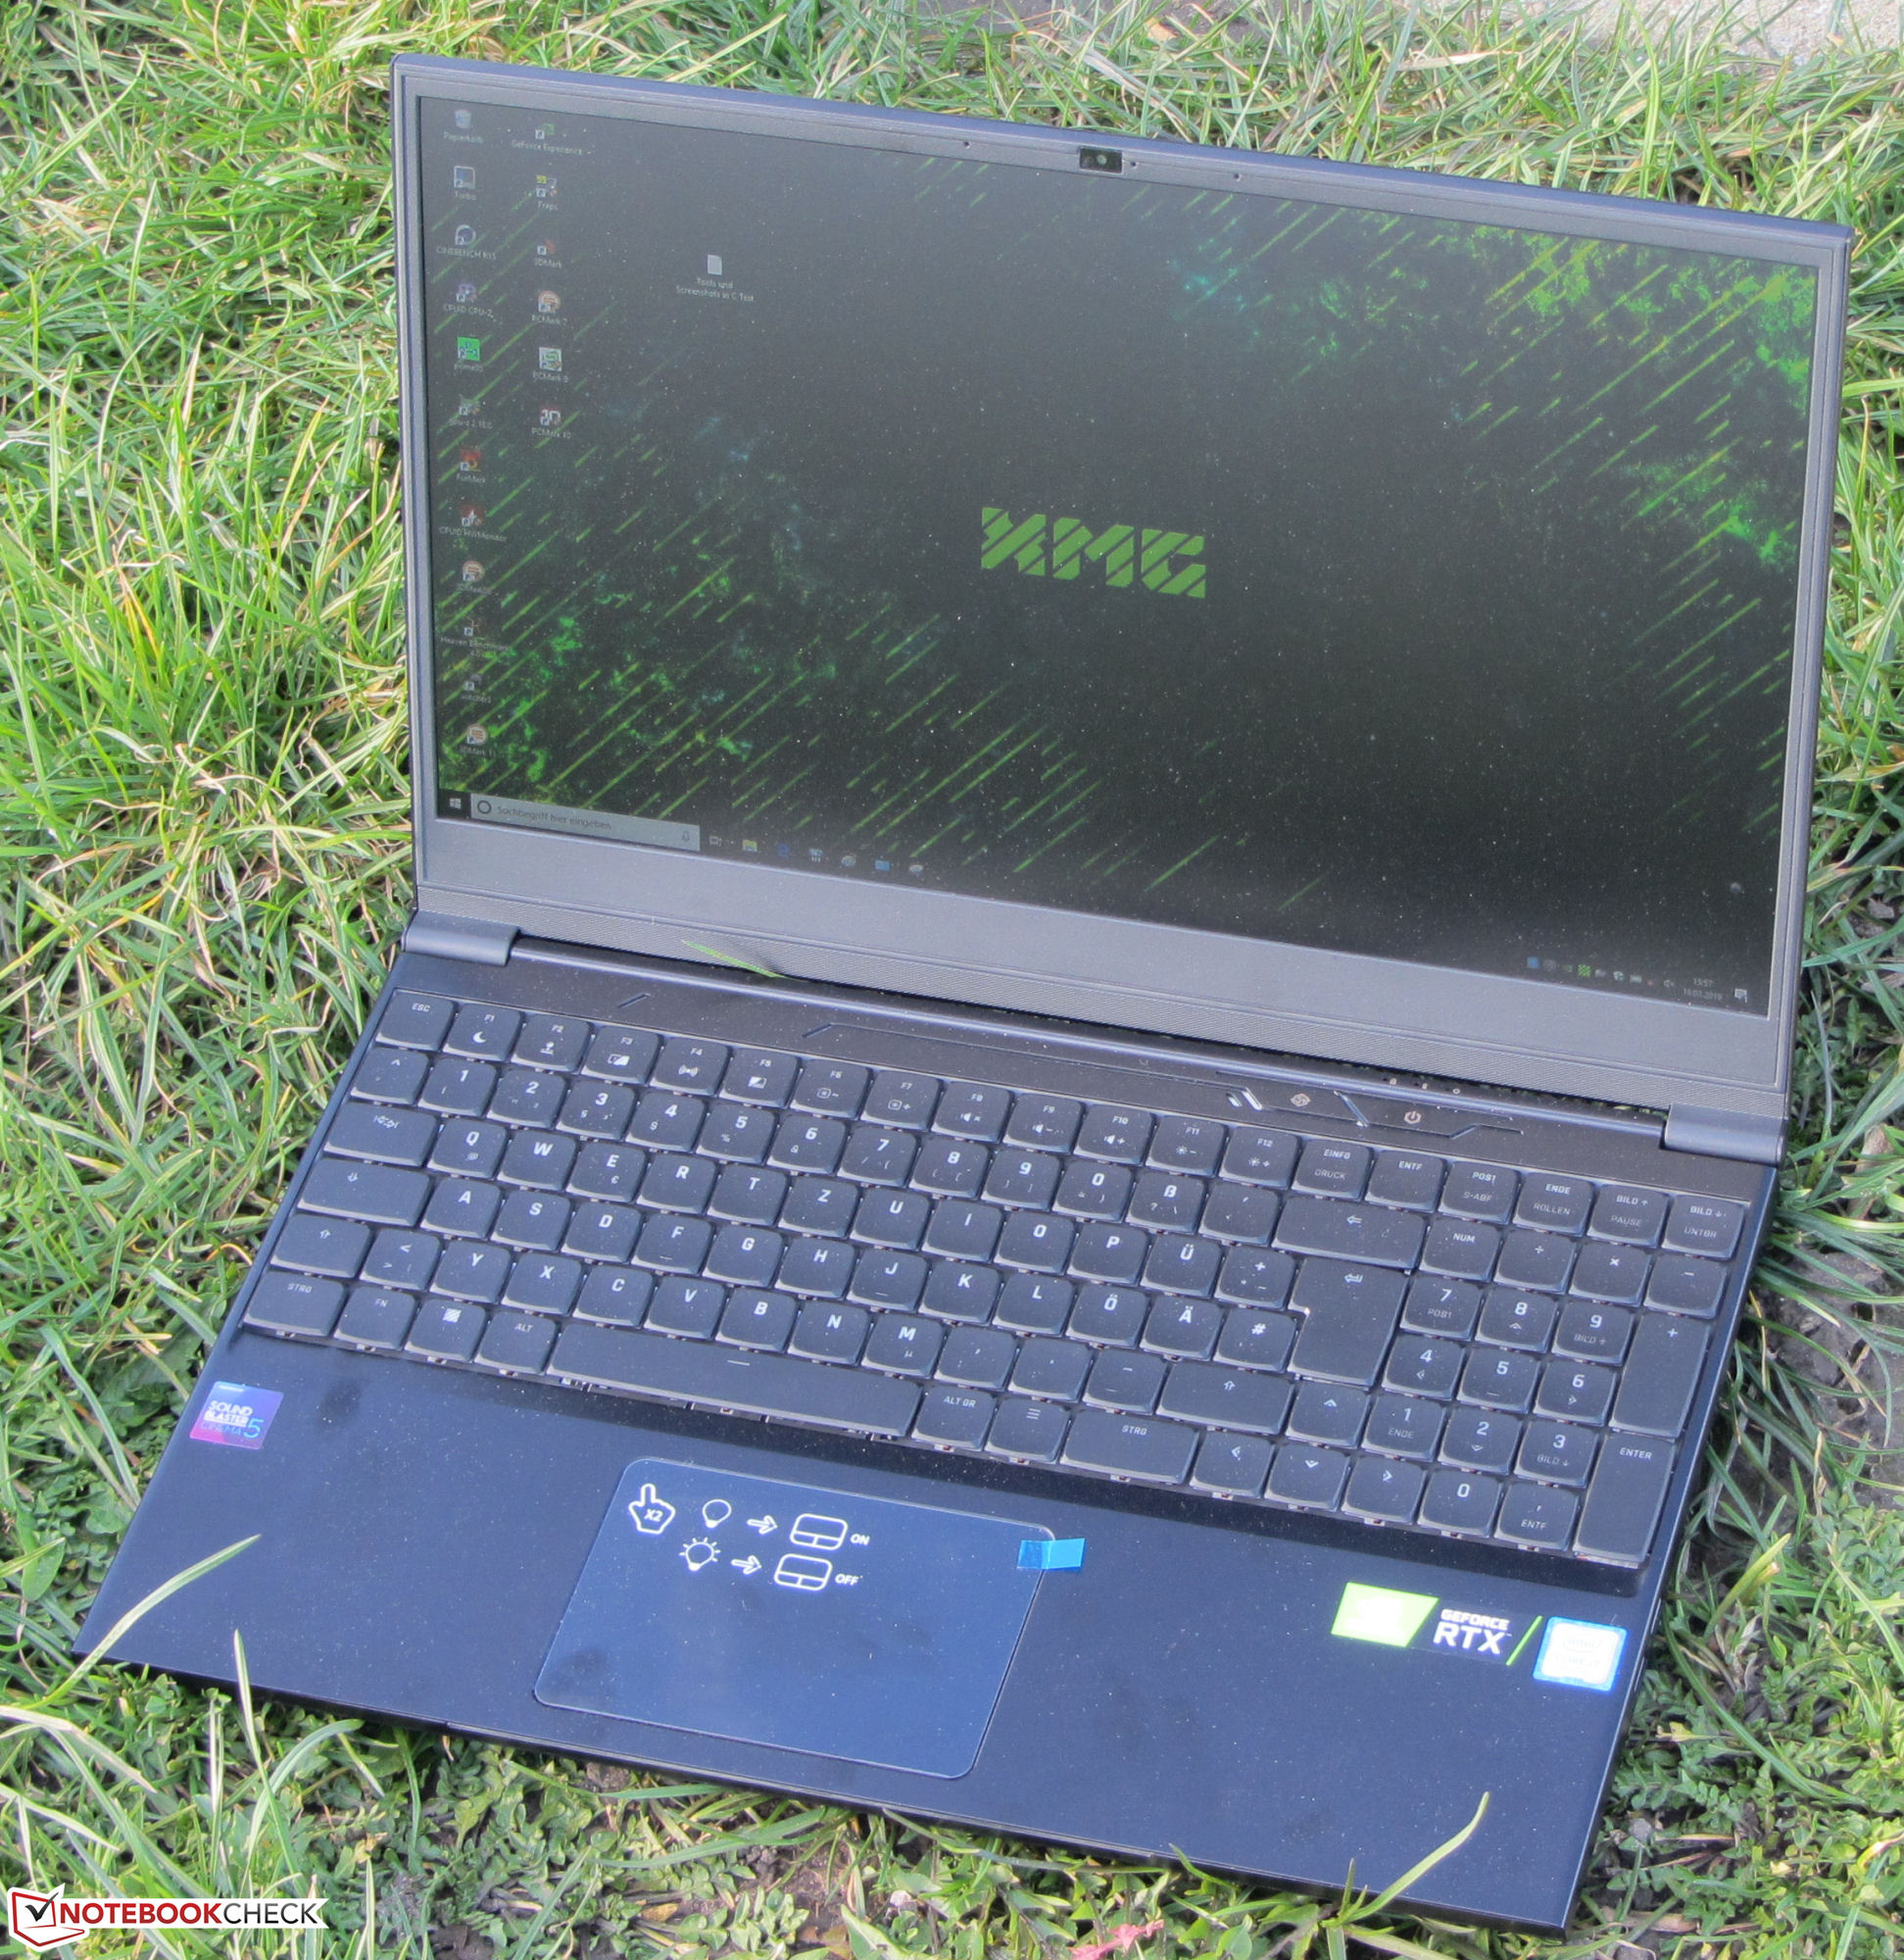
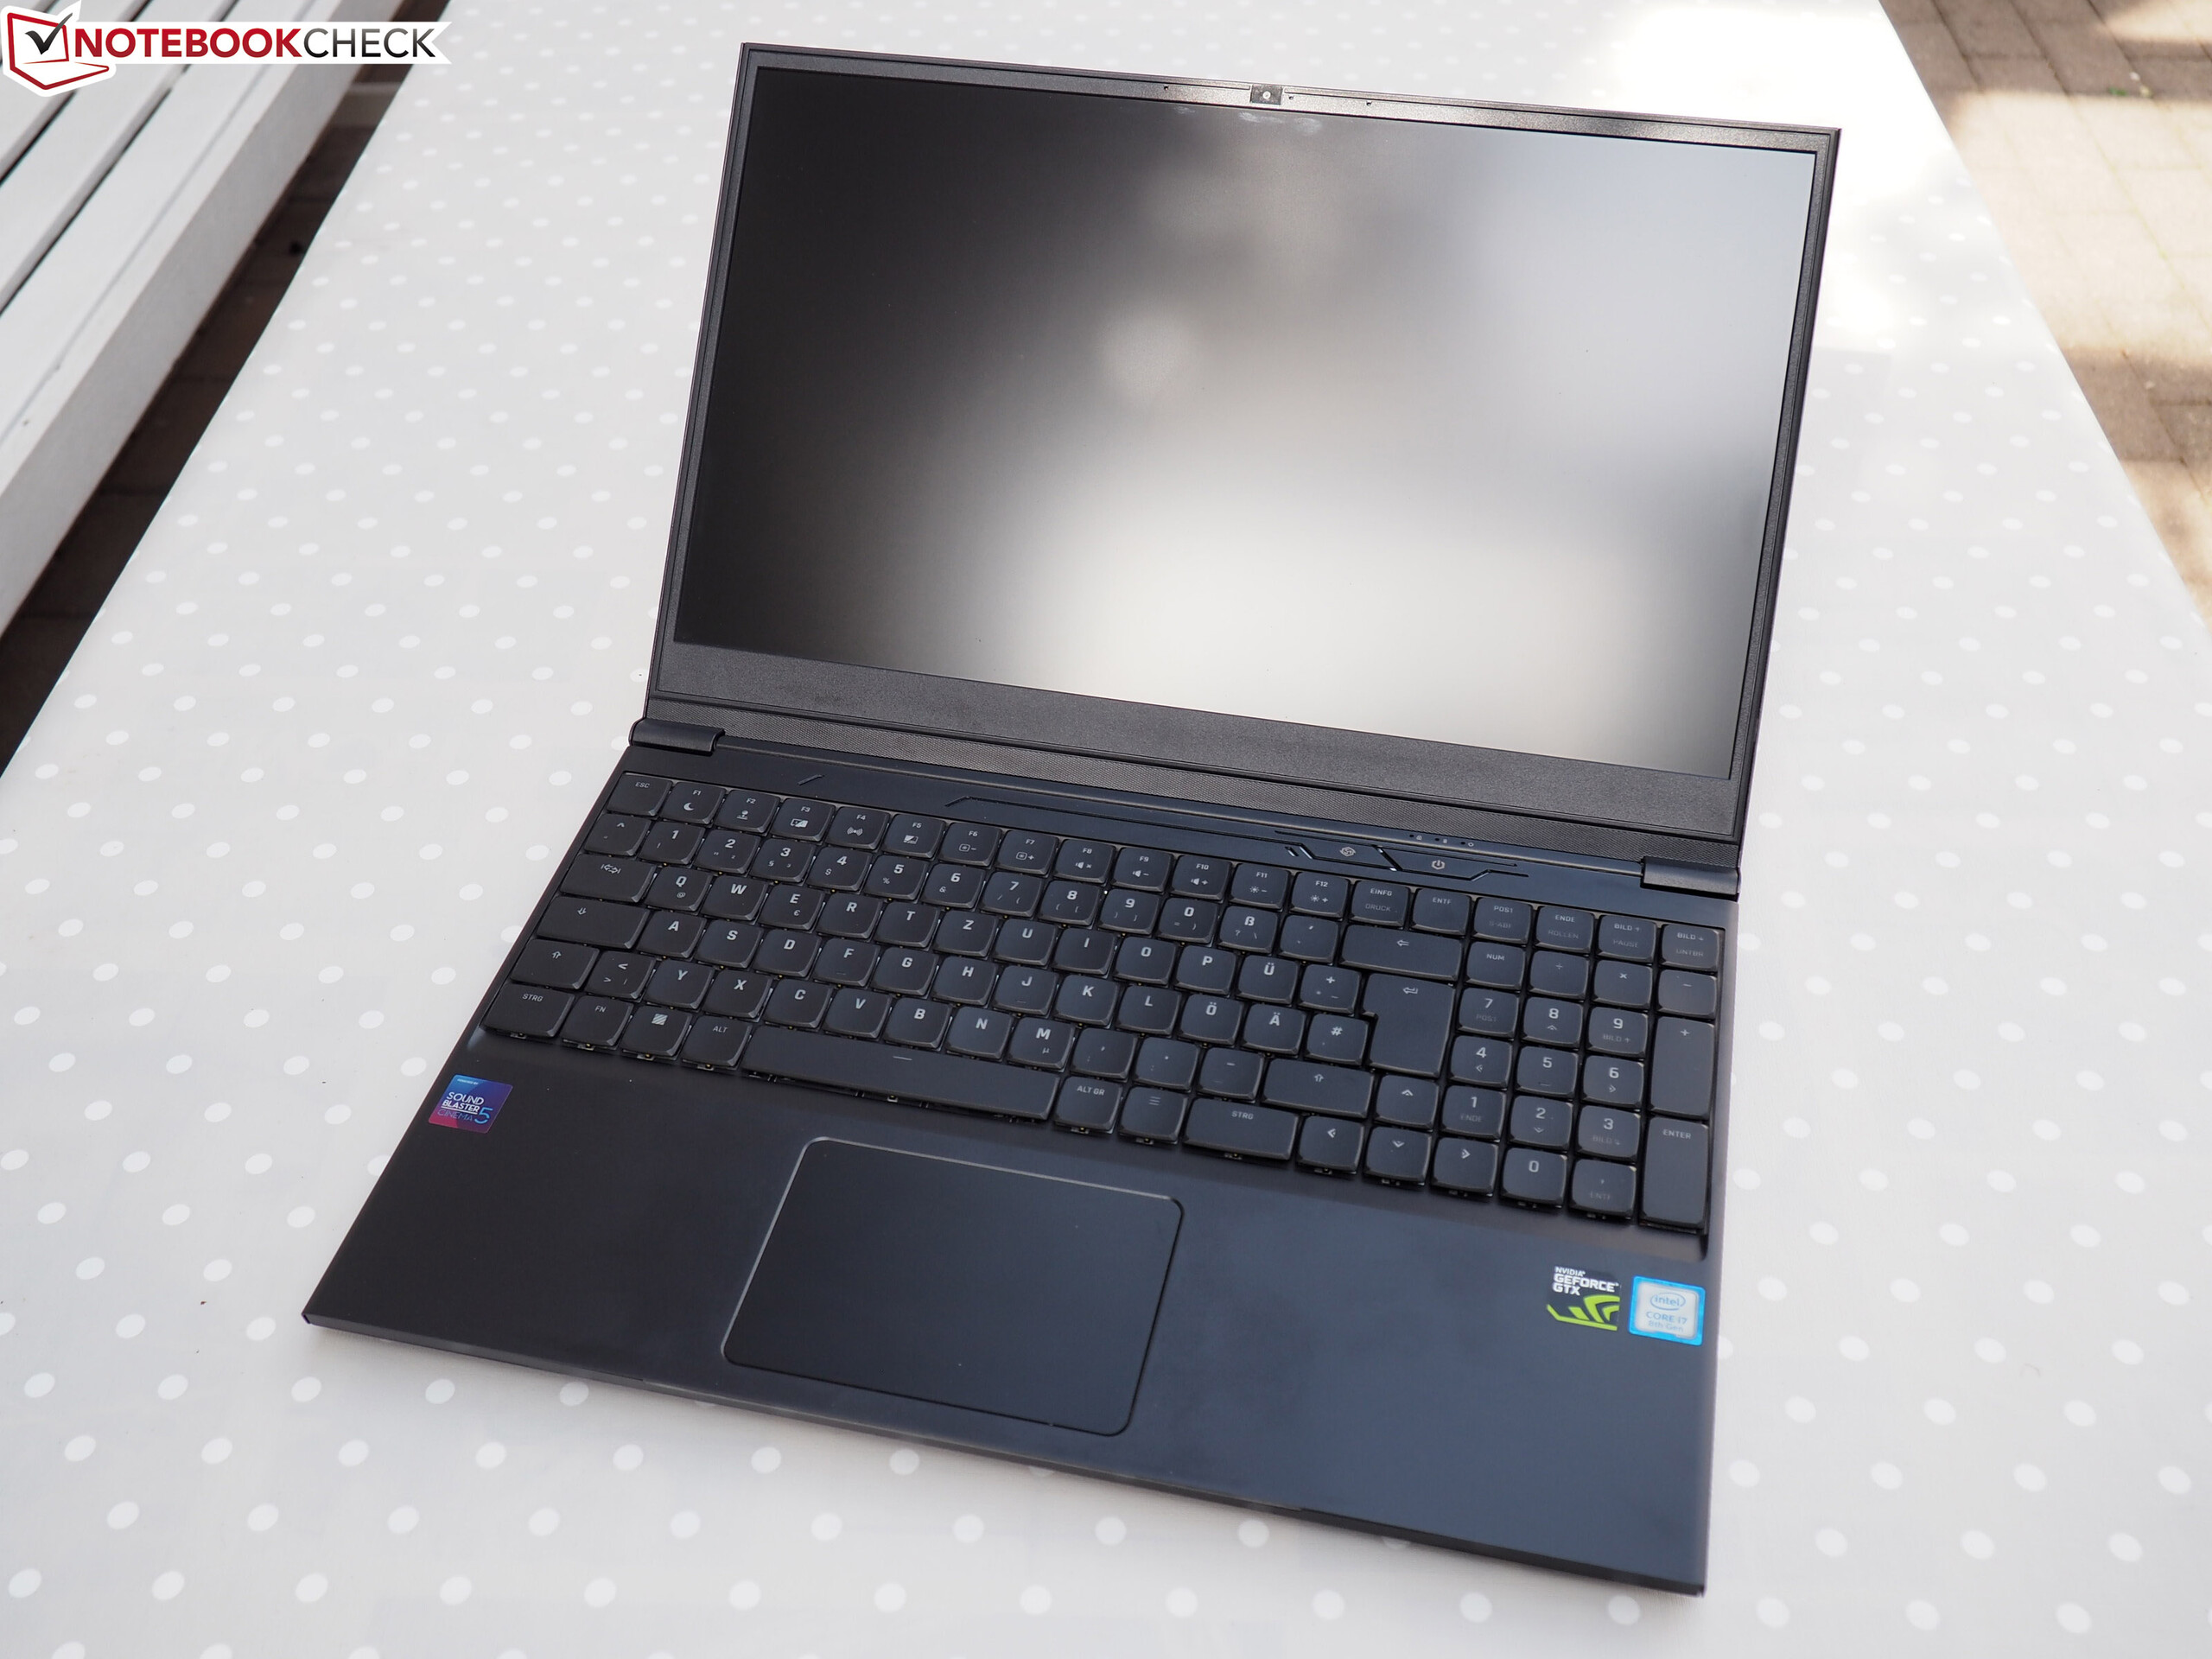
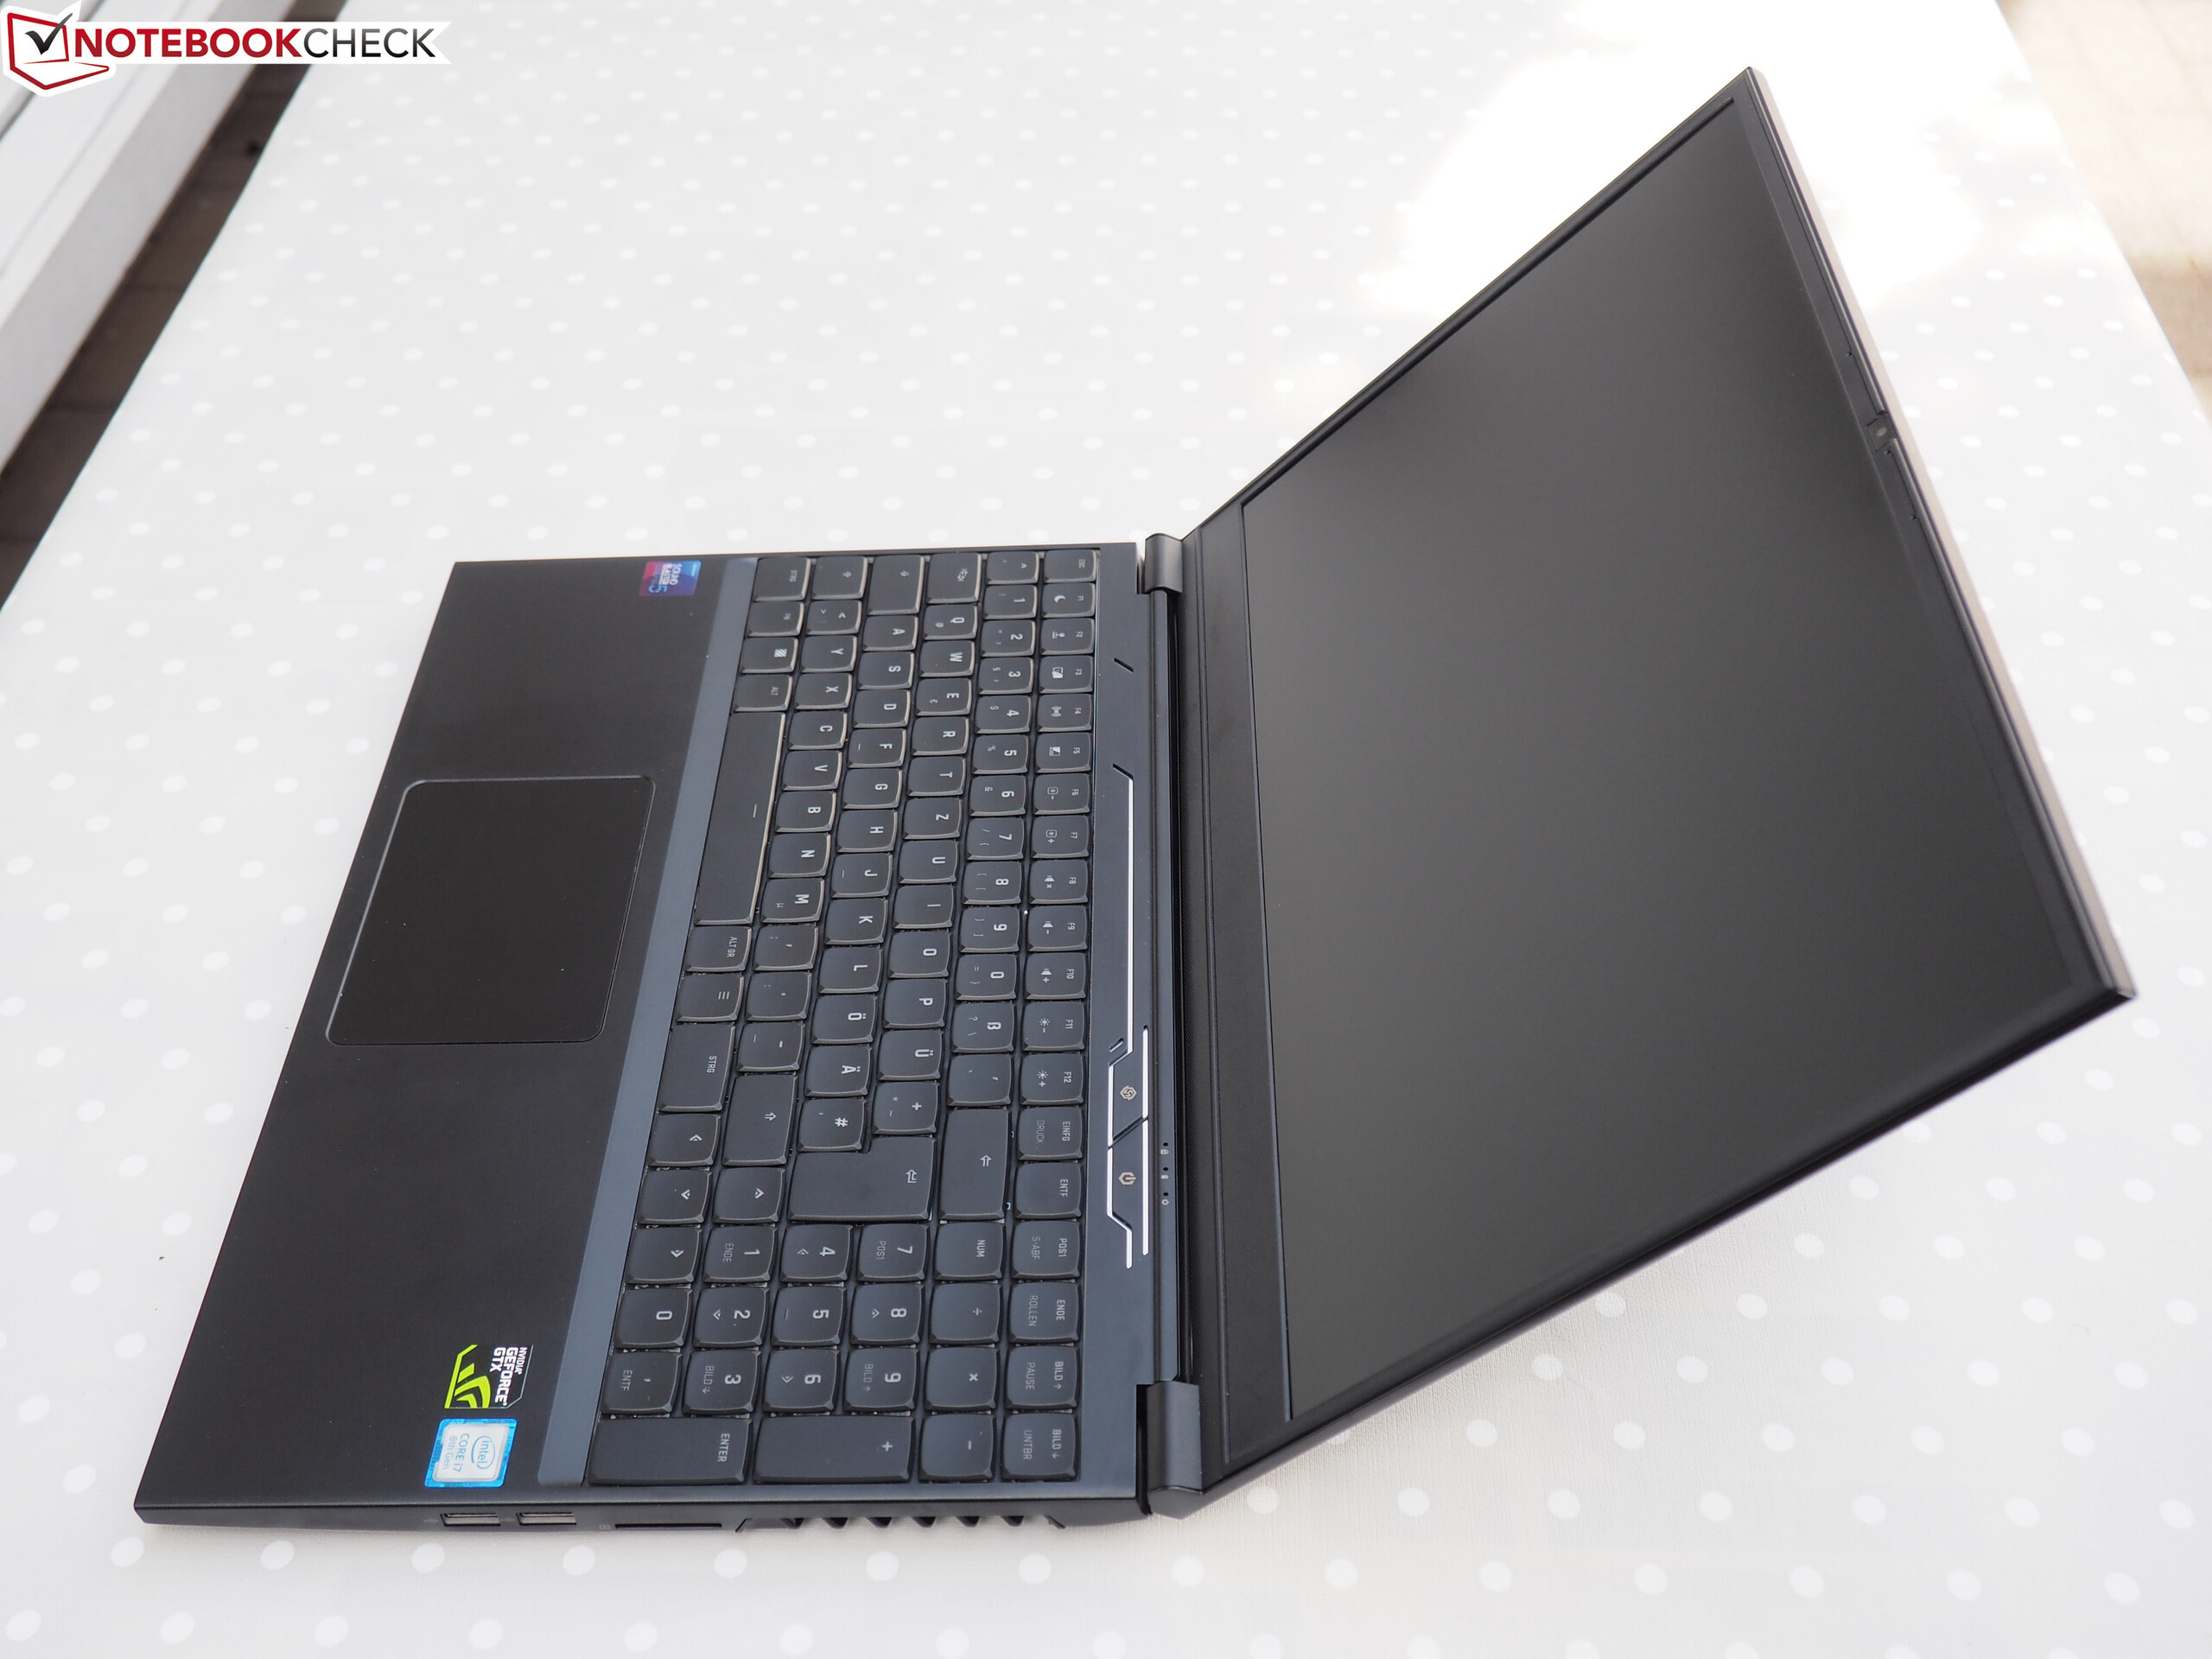
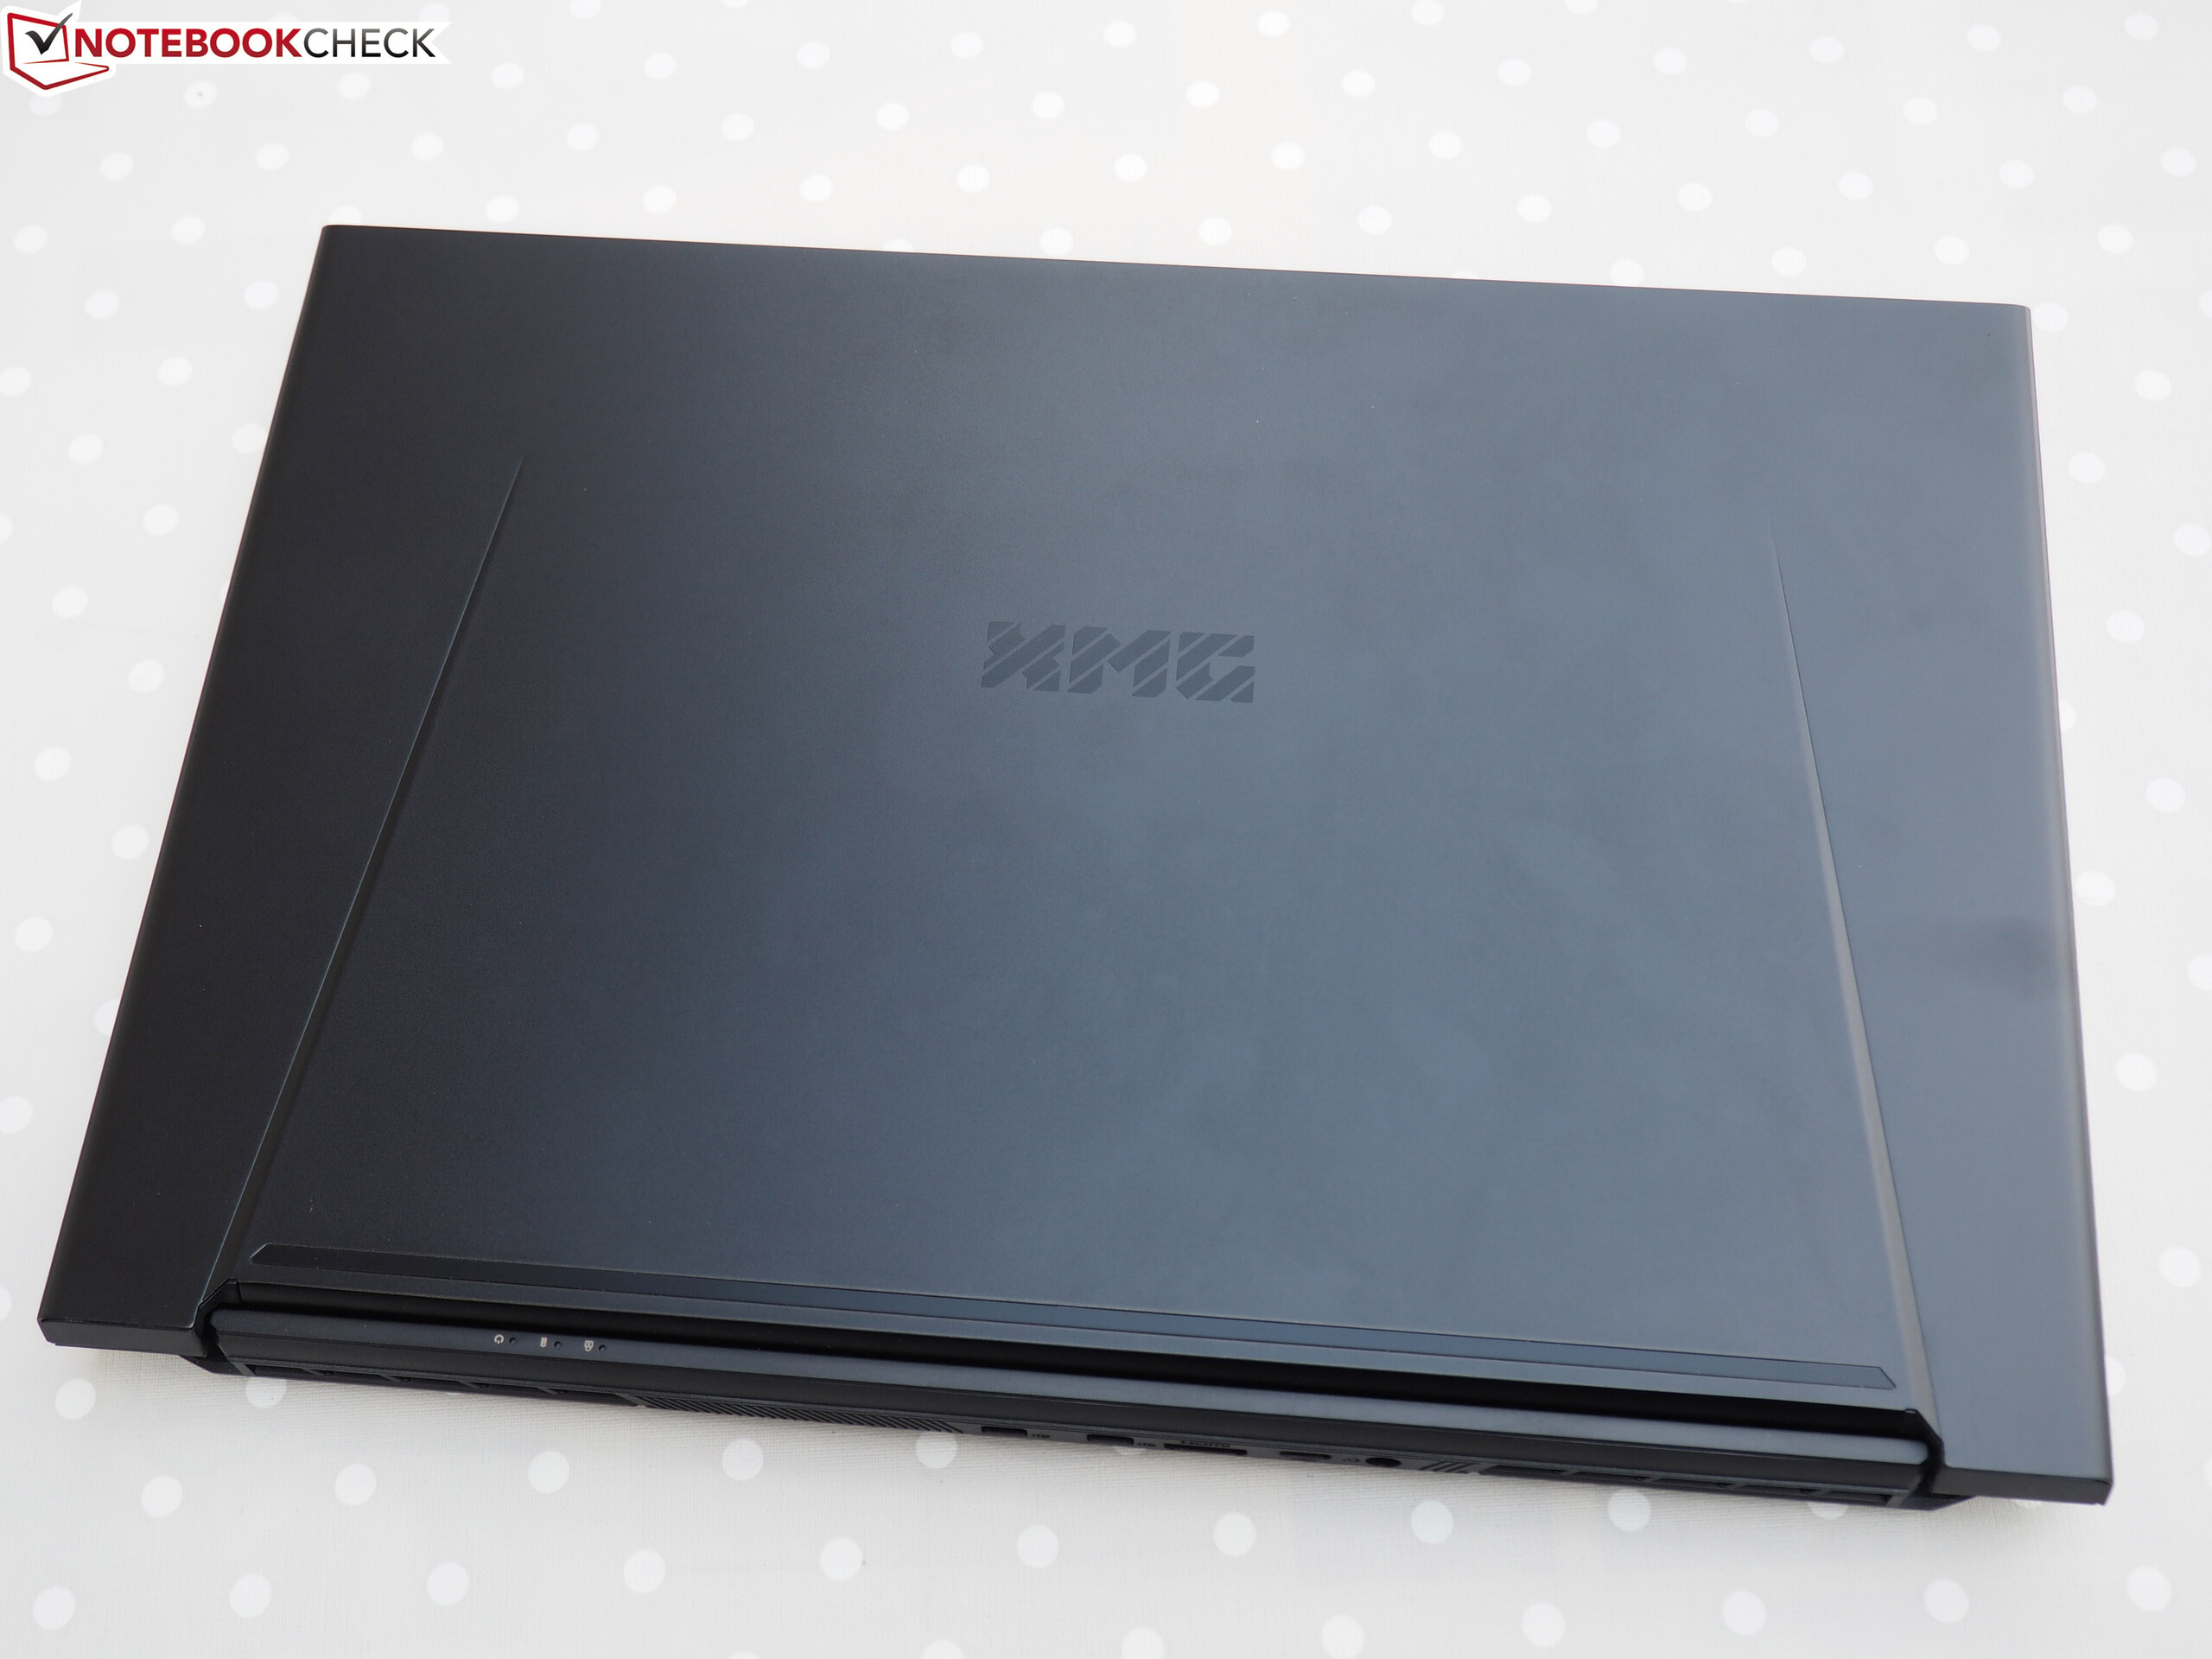
Thin and compact 15.6-inch gaming notebooks are growing increasingly popular, and accordingly there are plenty of devices available from various manufacturers. Schenker’s 15.6-inch gamer is called XMG Neo 15, and it is based on a Tongfang barebone. We have already had its predecessor in review in 2018.
As it was only updated internally the current XMG Neo 15’s case remained identical to its predecessor. This latest reincarnation features either a GeForce RTX 2060 or GeForce RTX 2070 Max-Q Turing GPU. Our review unit was equipped with the latter. Its competitors are the Gigabyte Aero 15-X9, MSI GS65 8RF Stealth Thin, Asus Zephyrus S GX531GS, Acer Predator Triton 500, and Razer Blade 15.
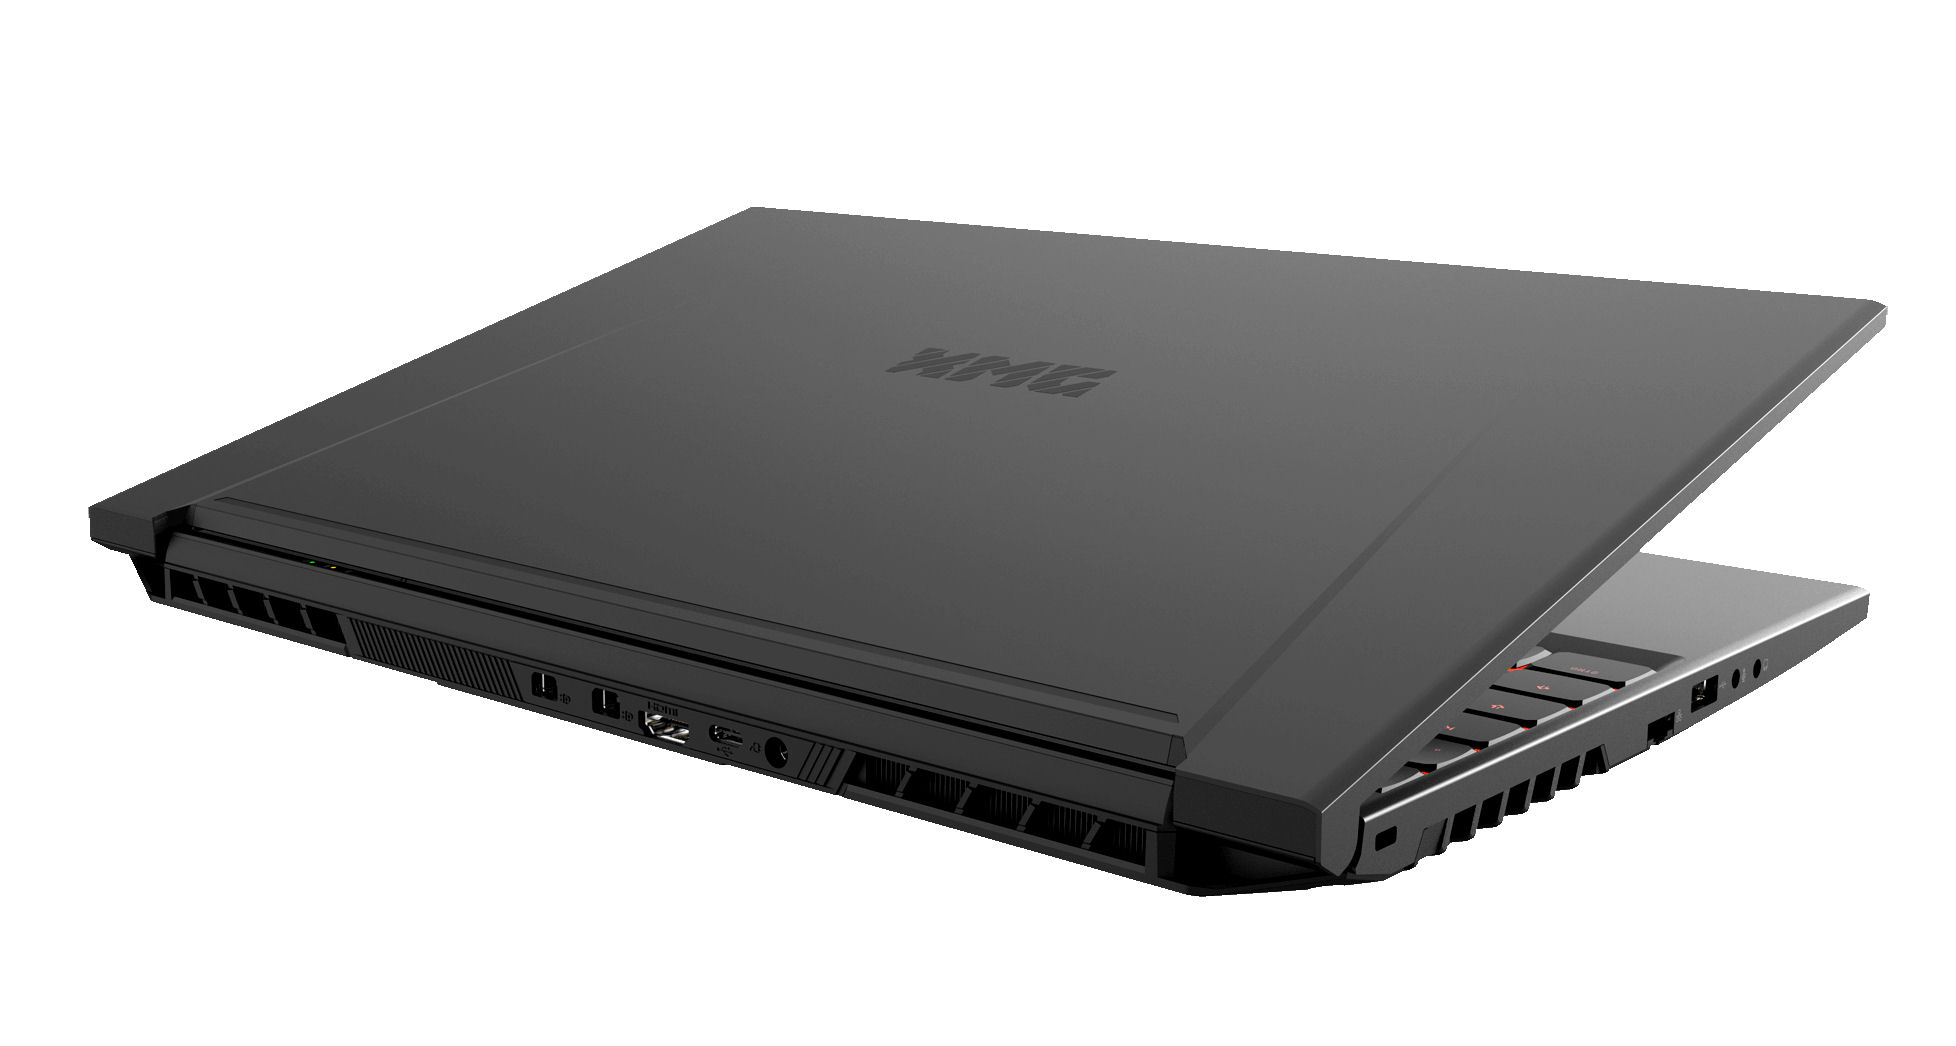
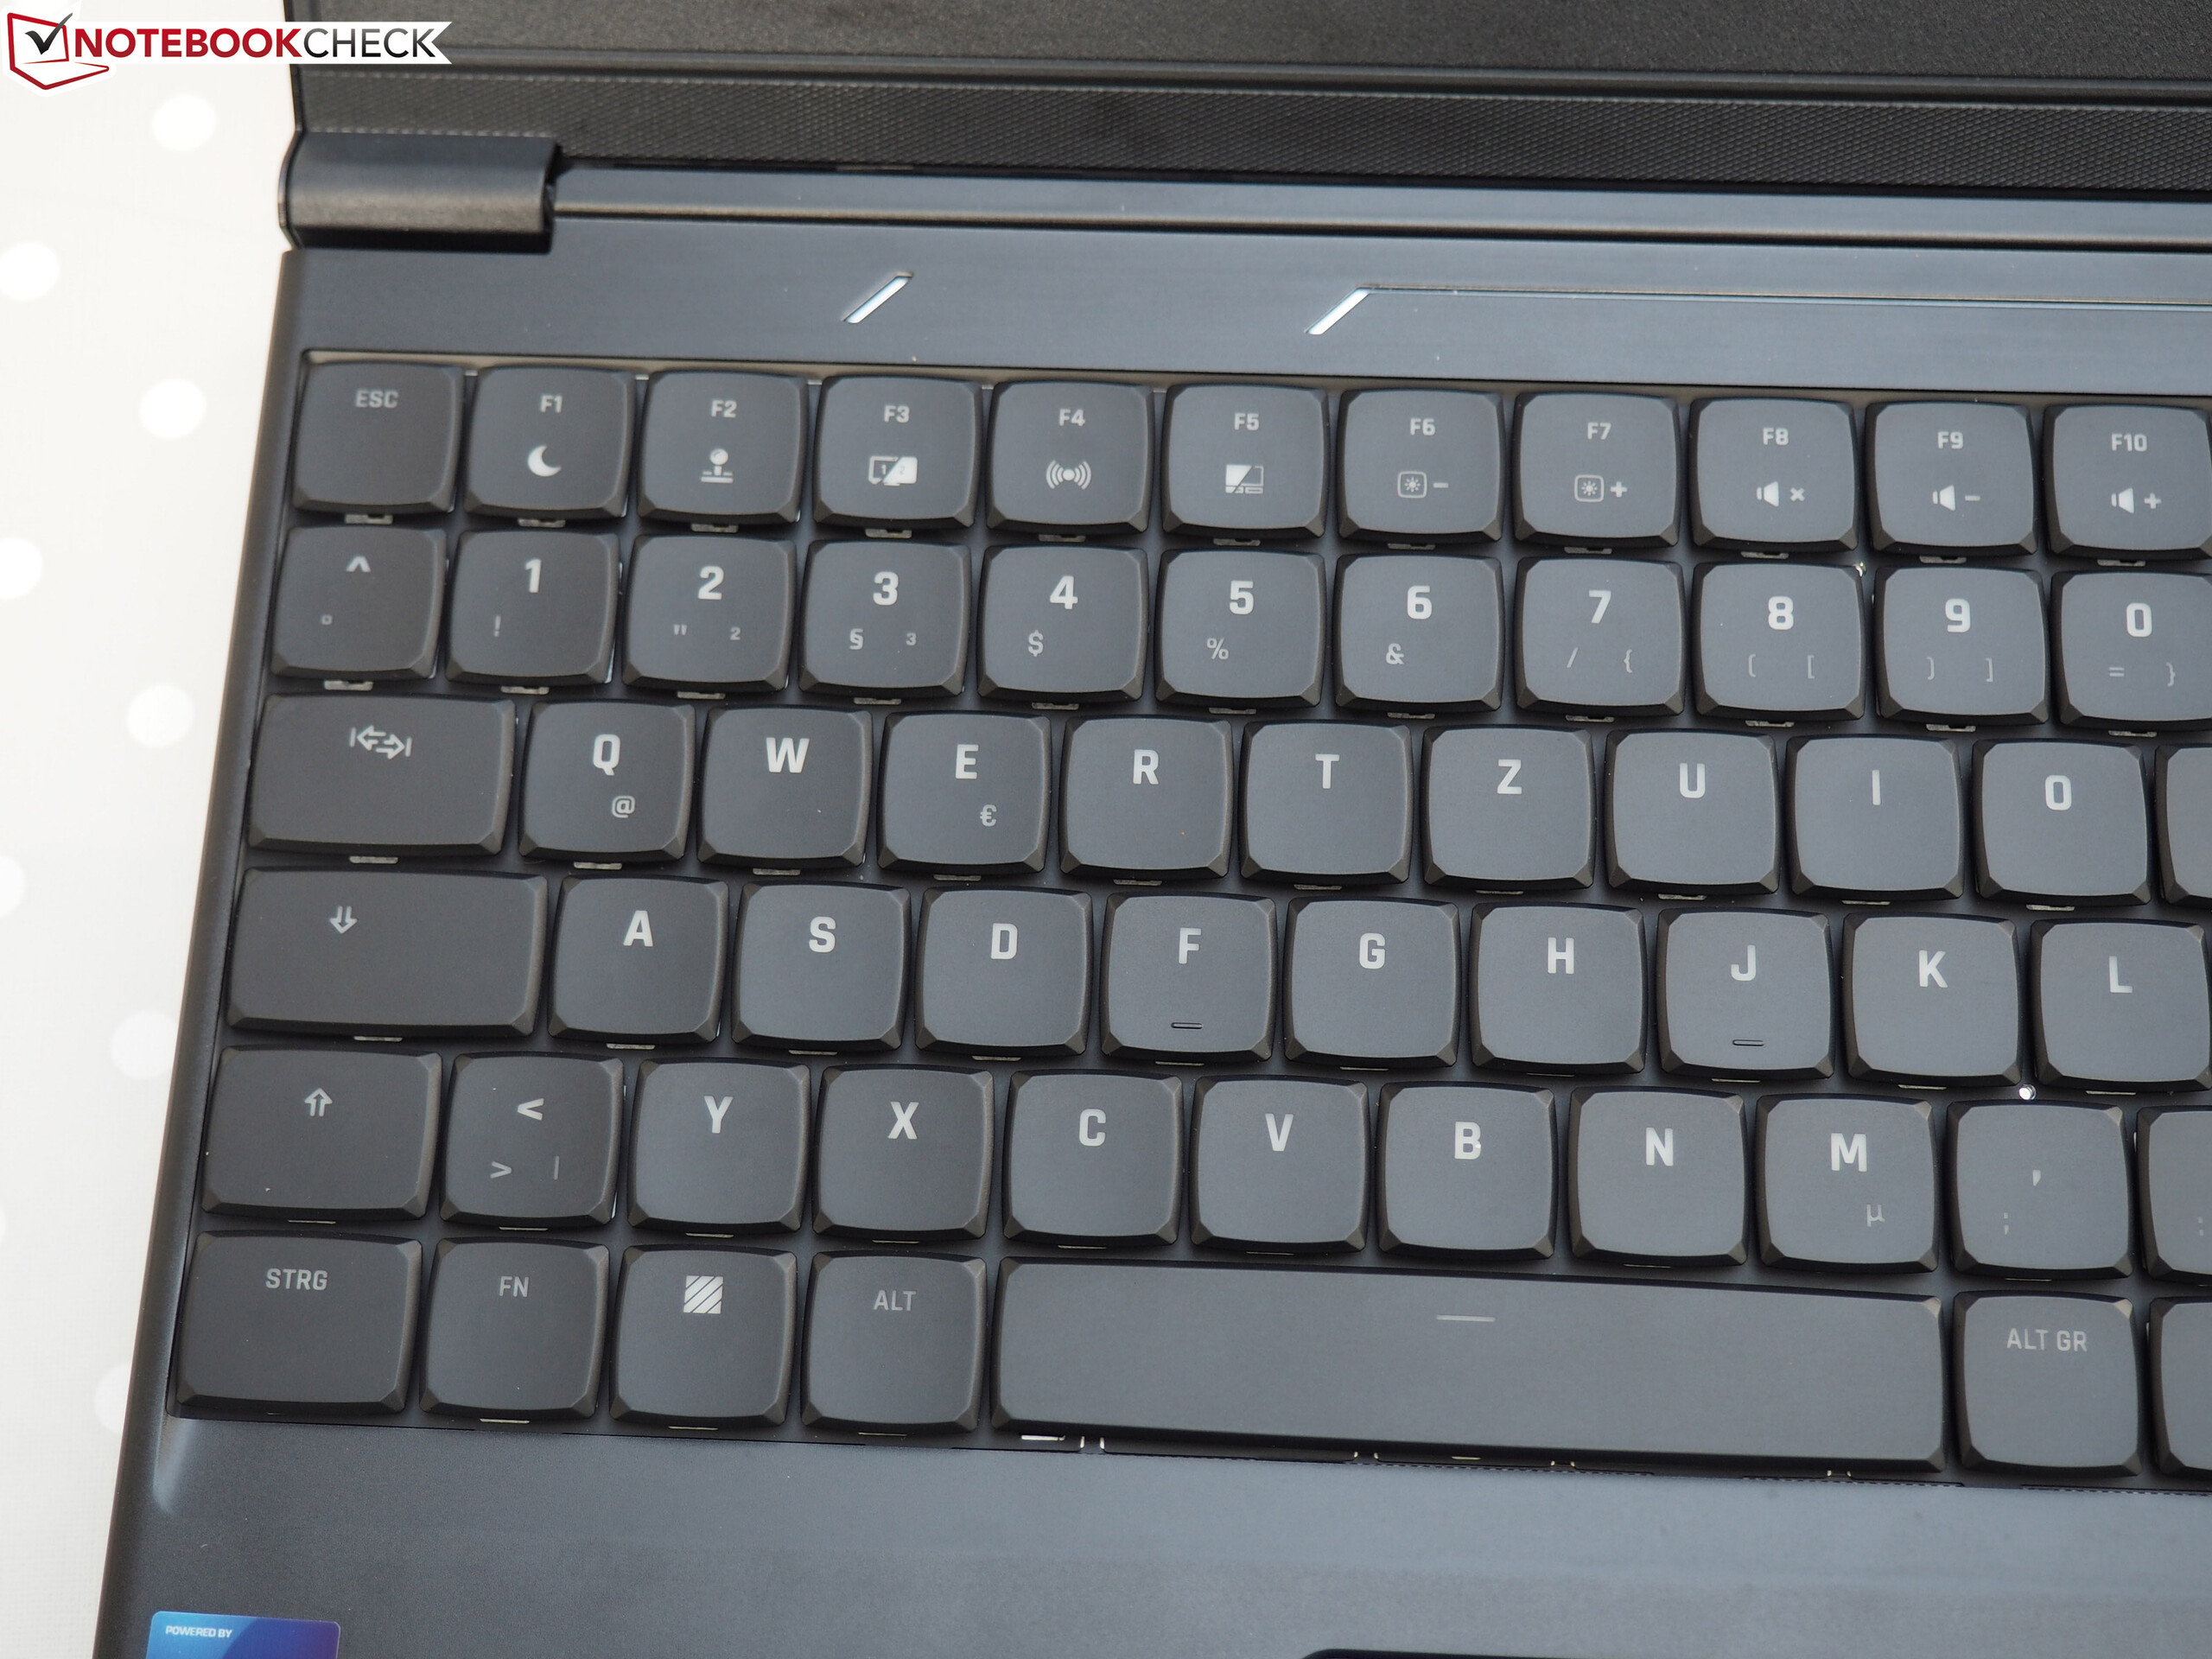
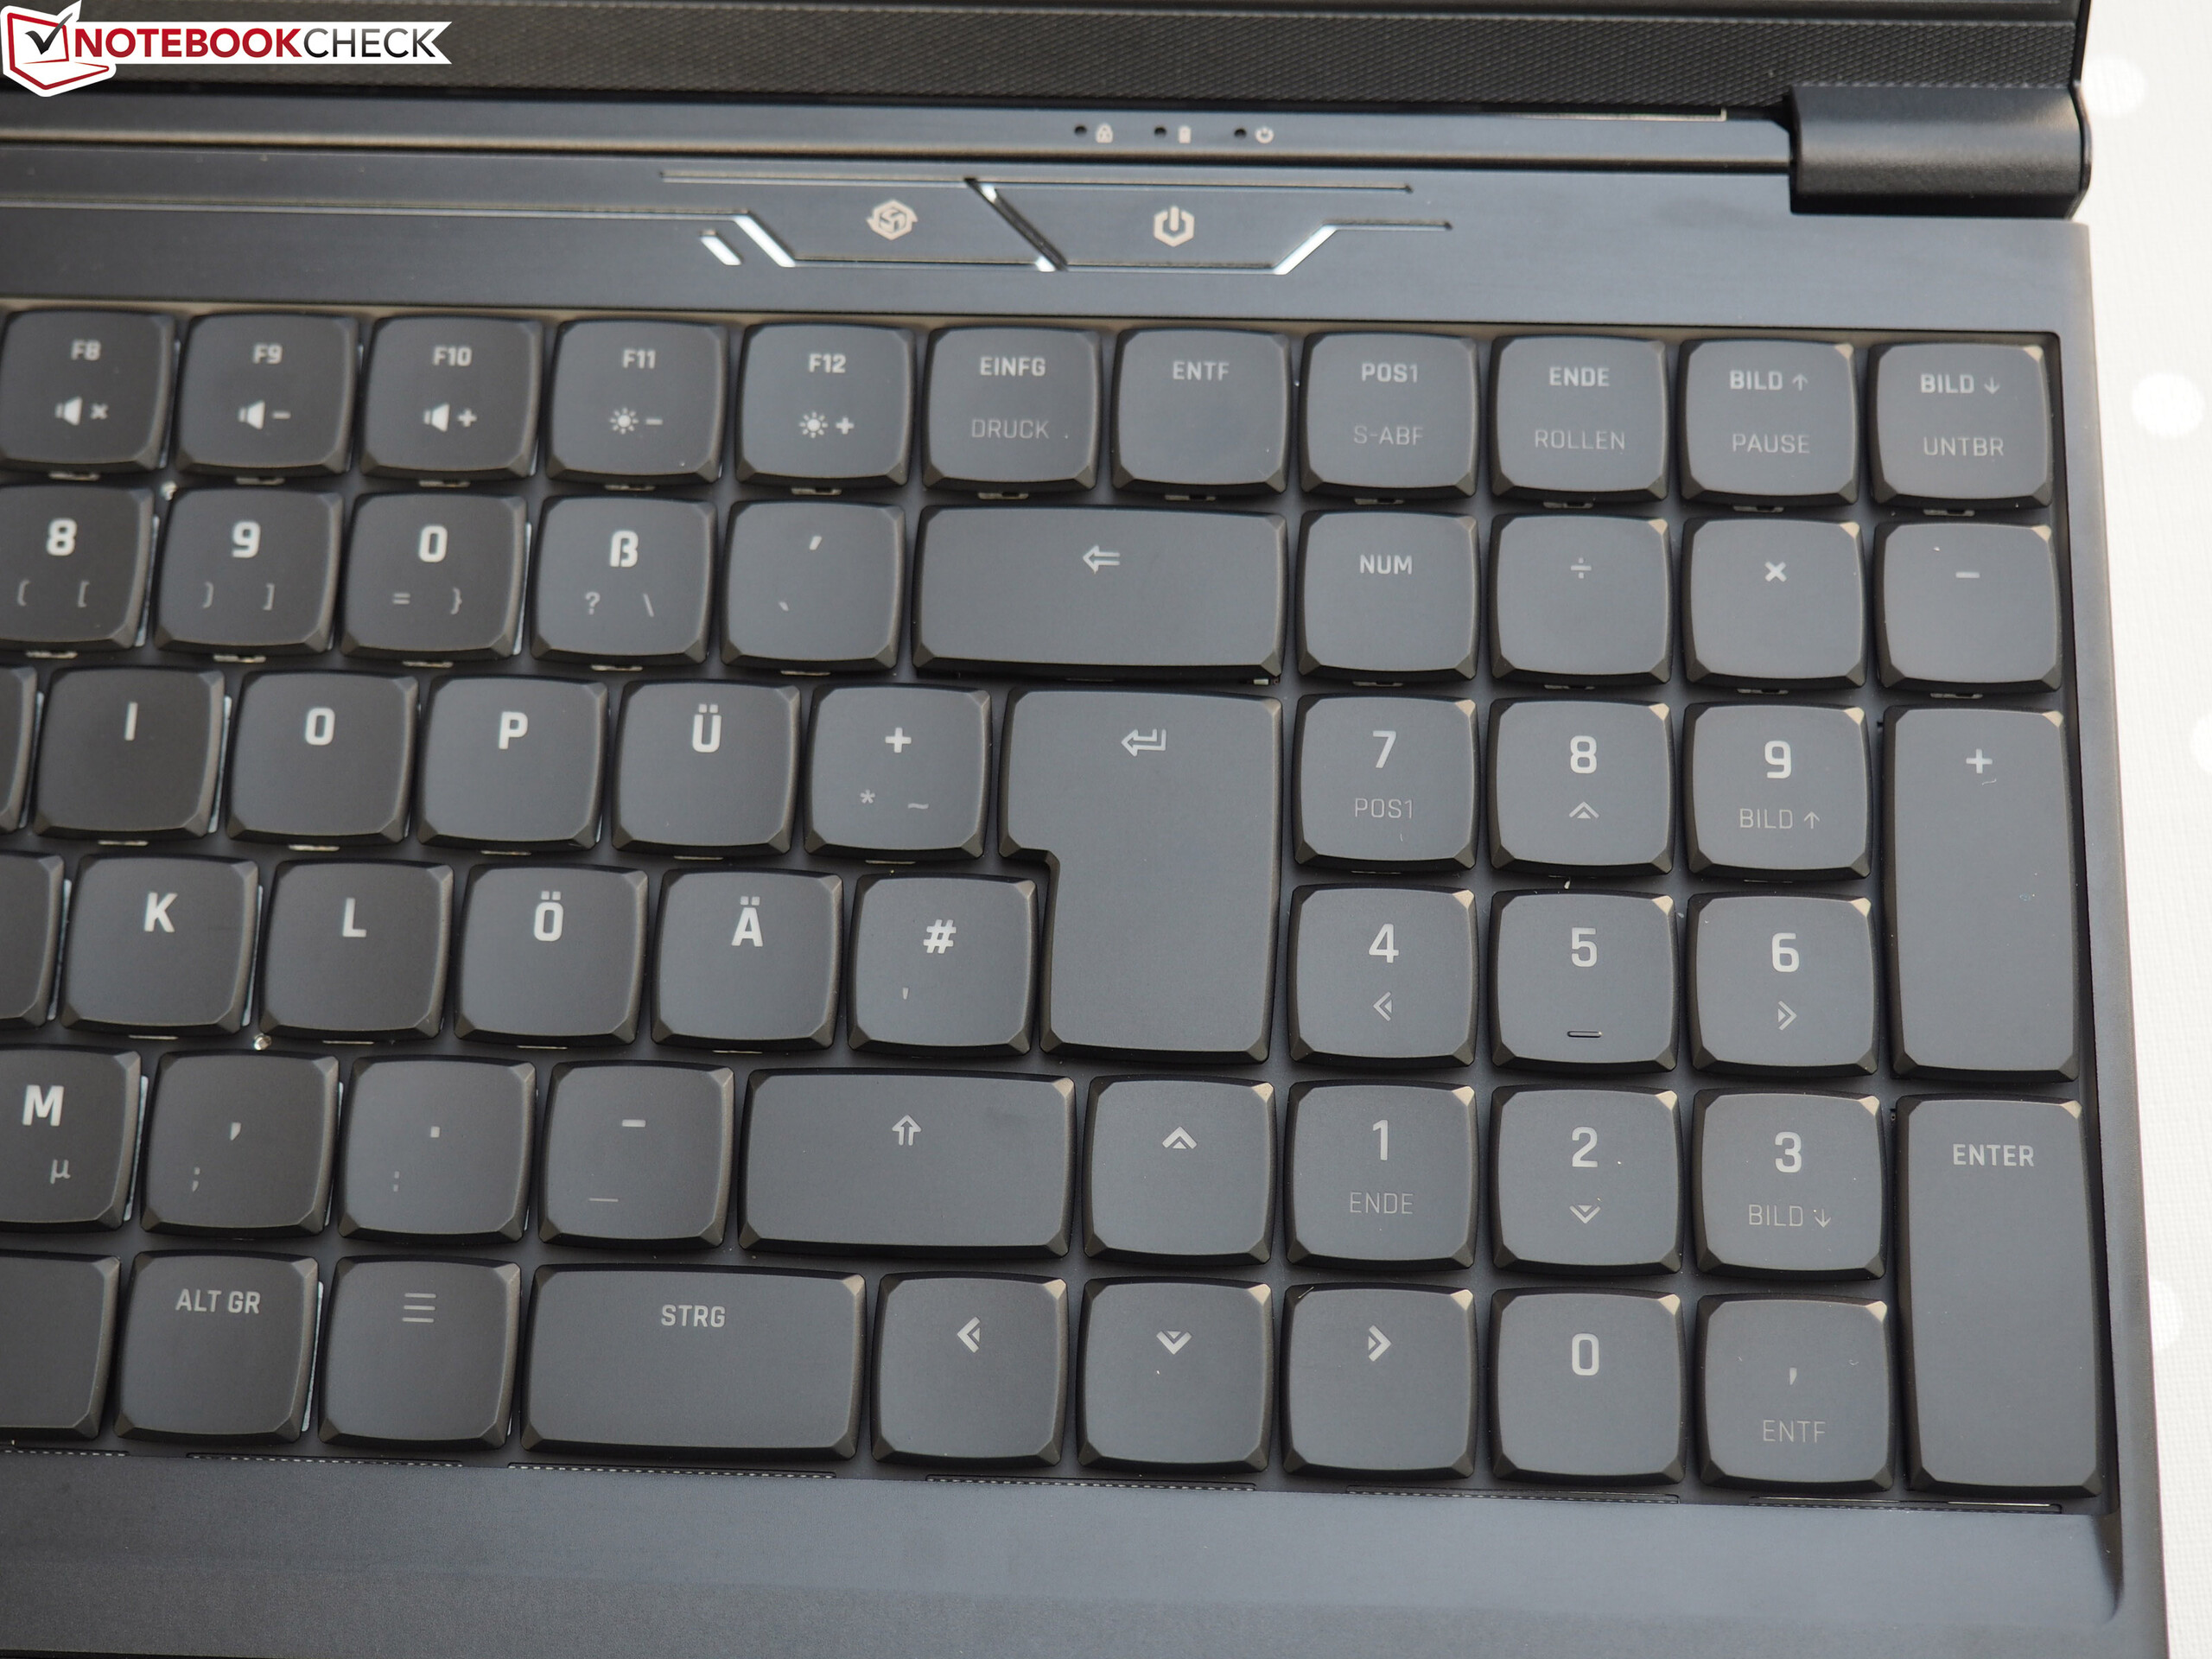
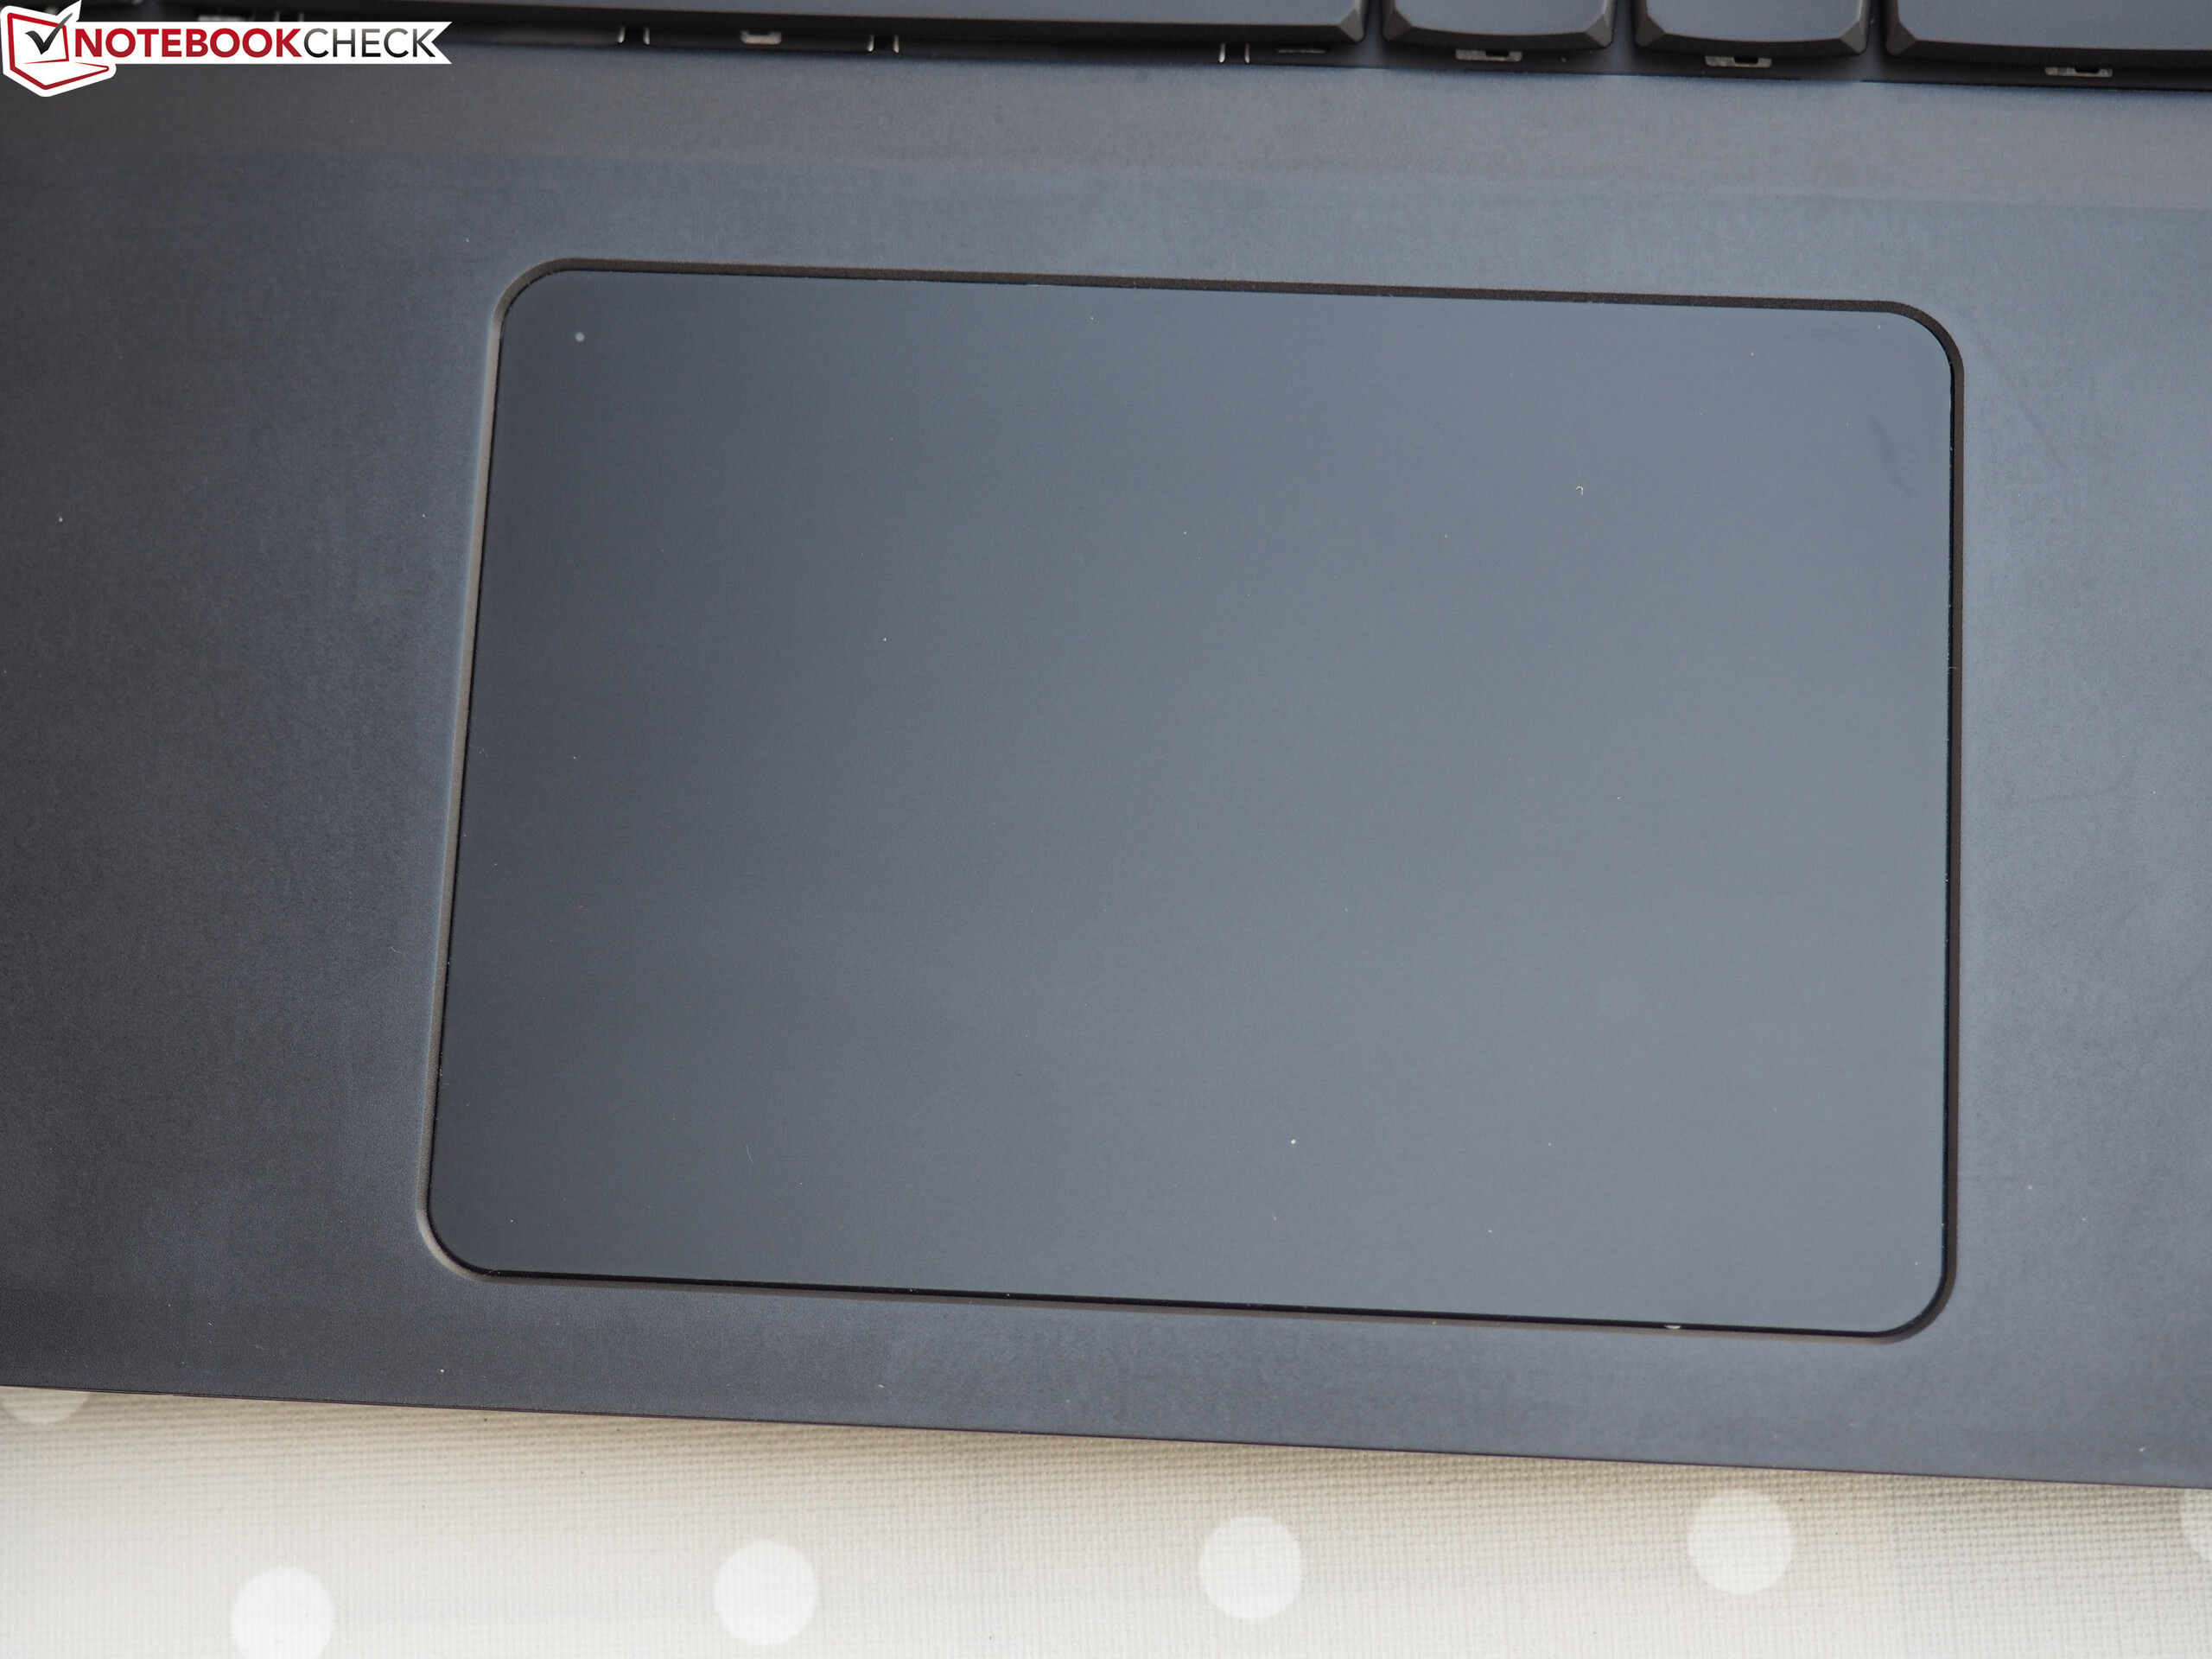
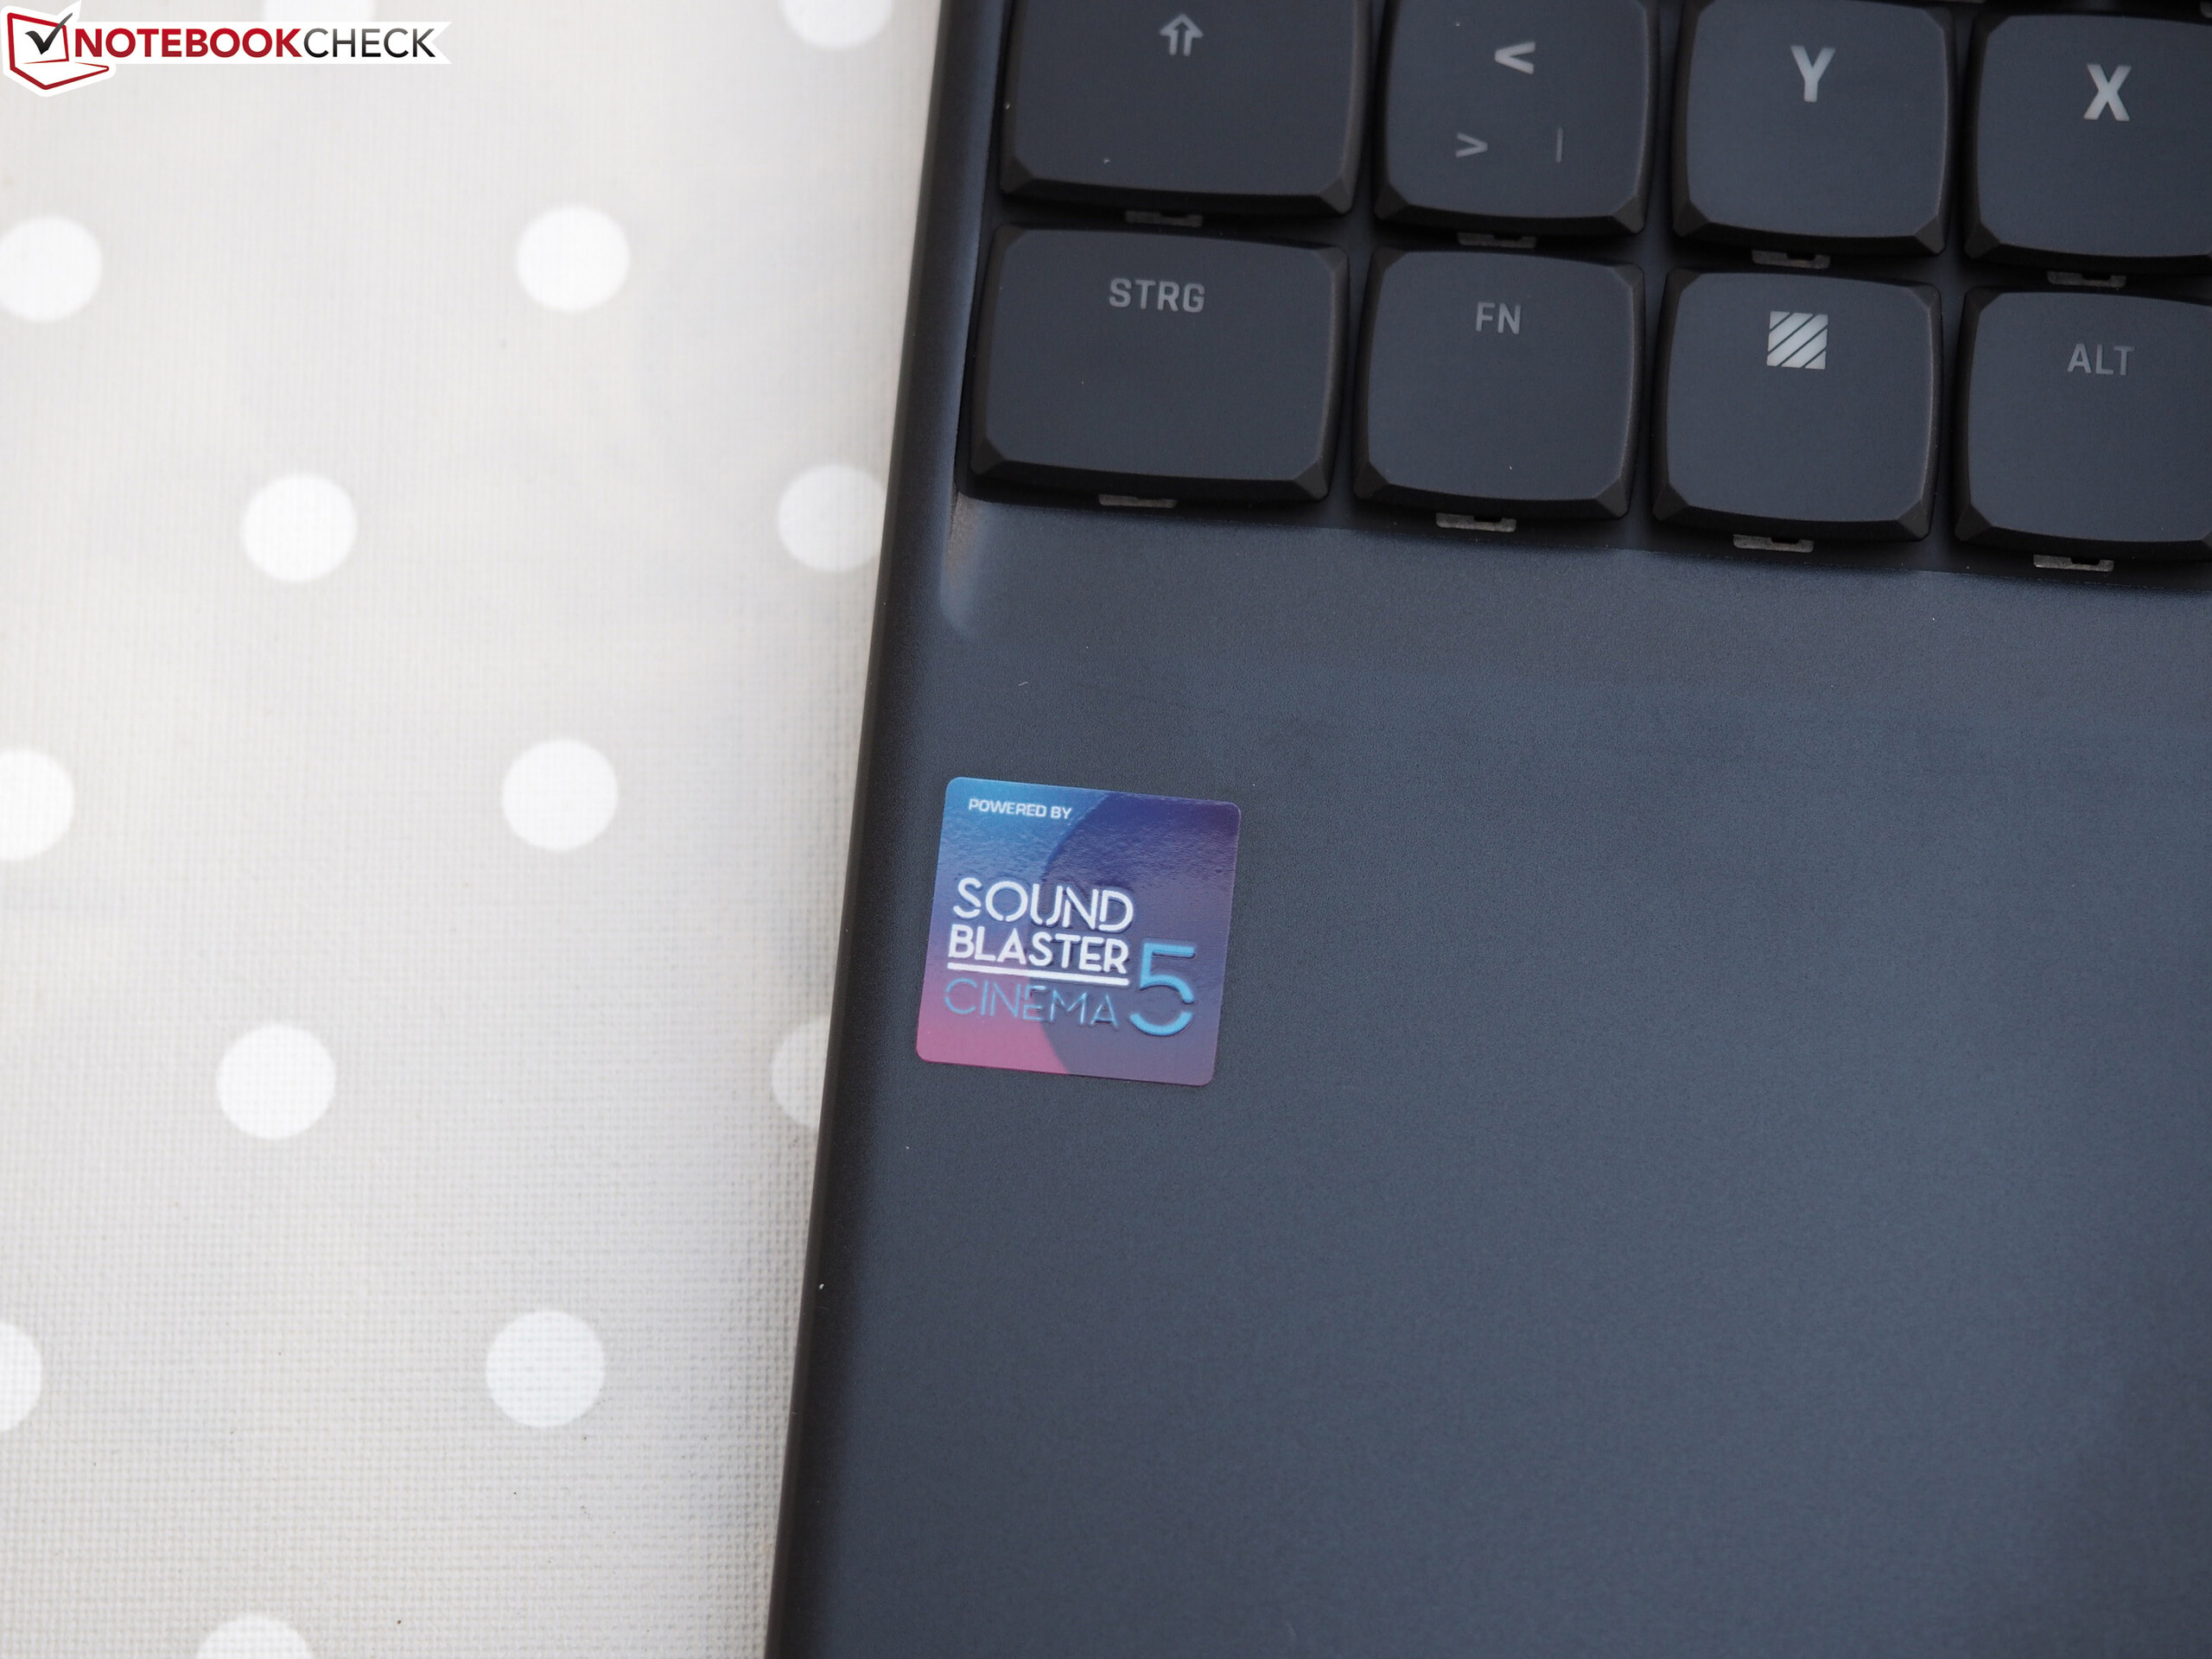
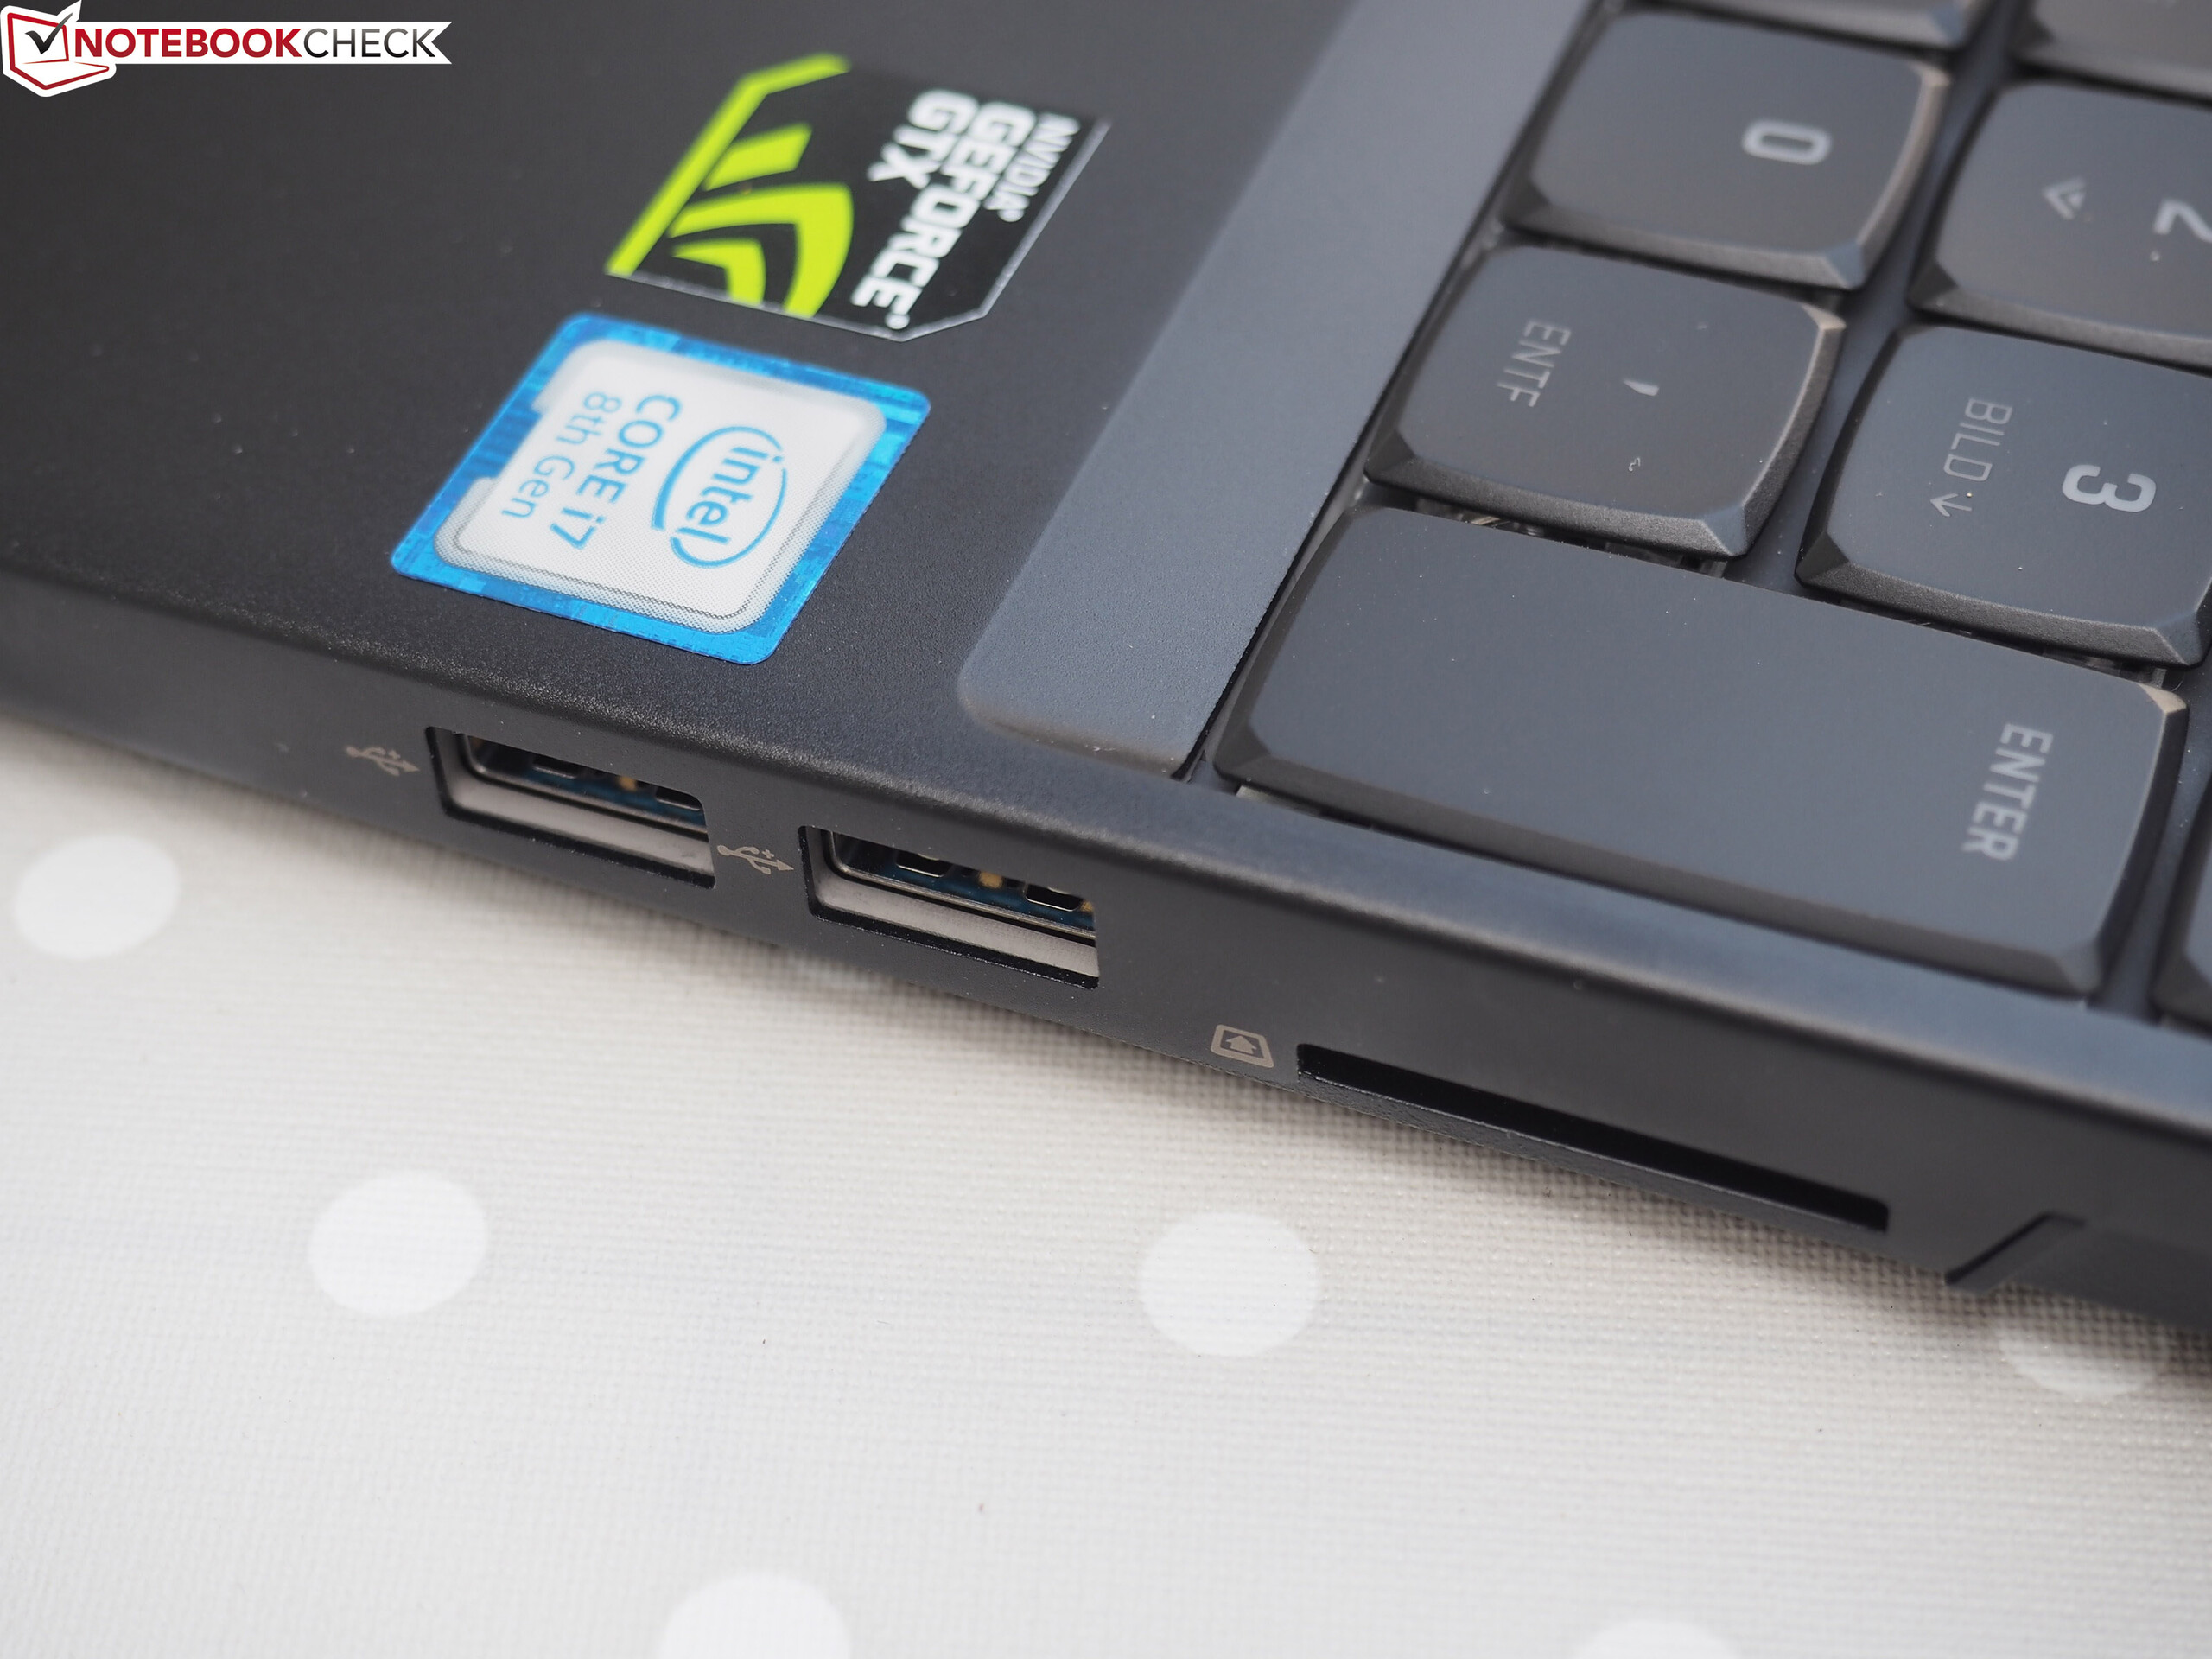
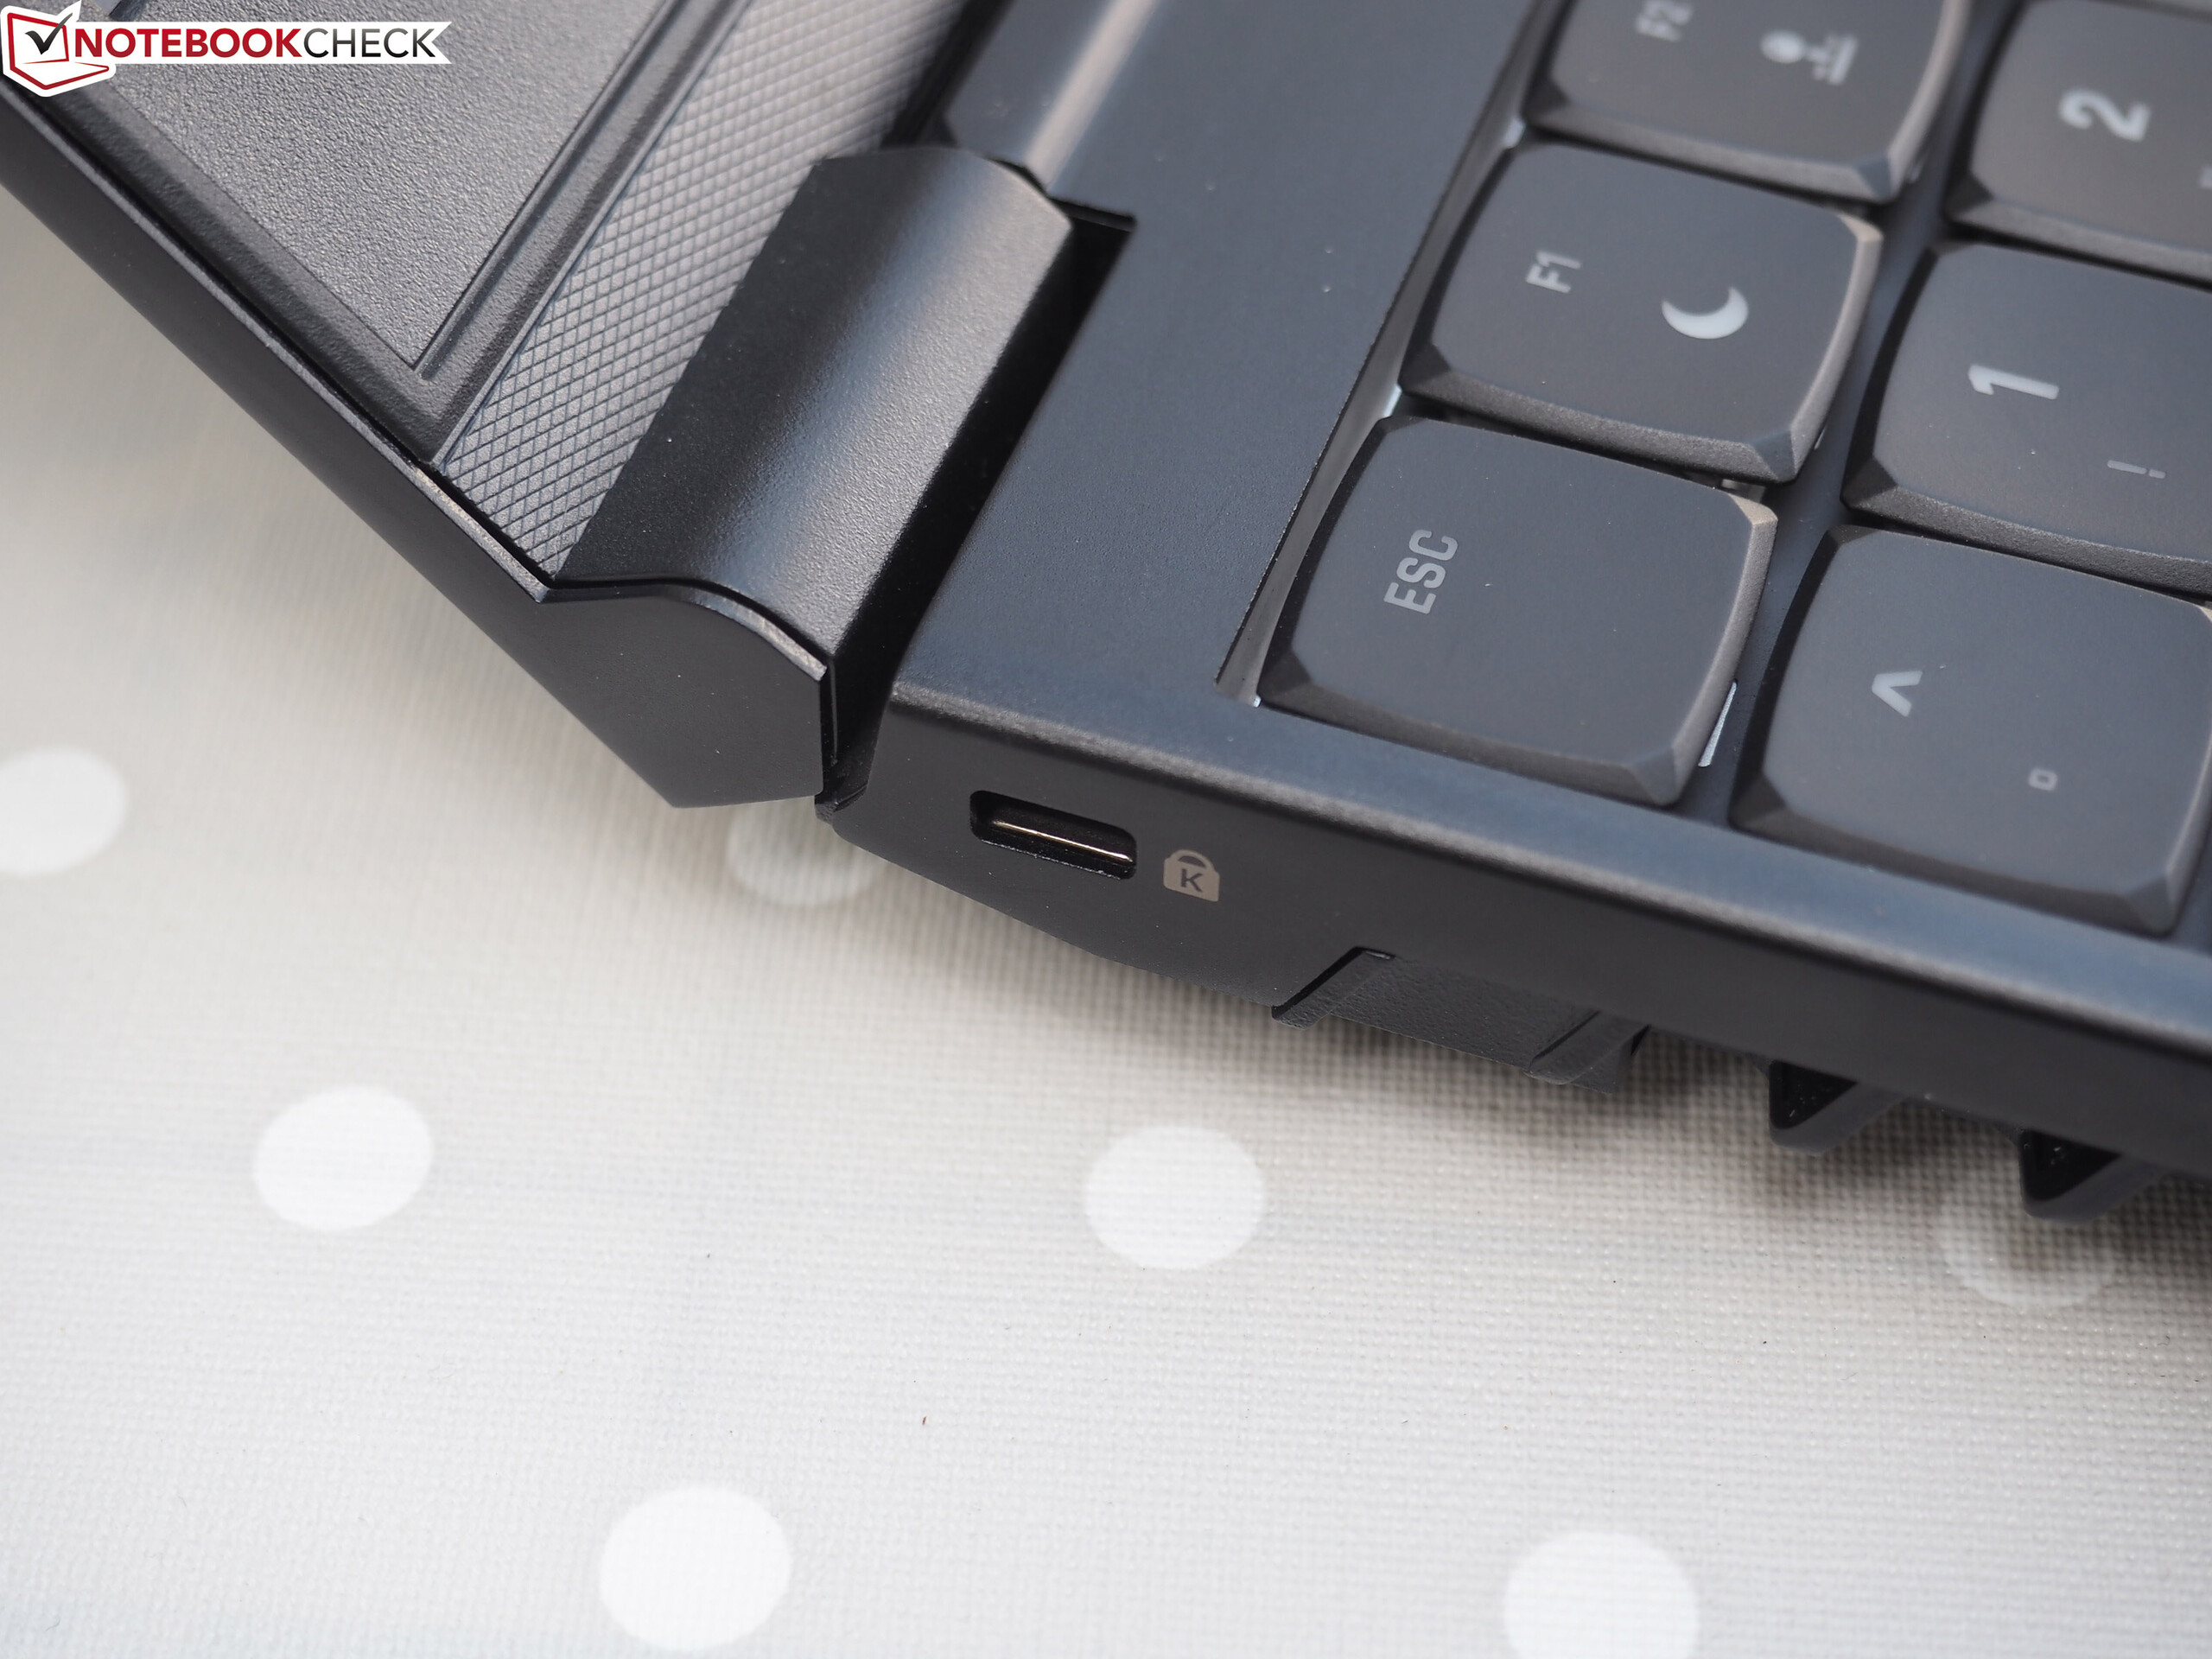
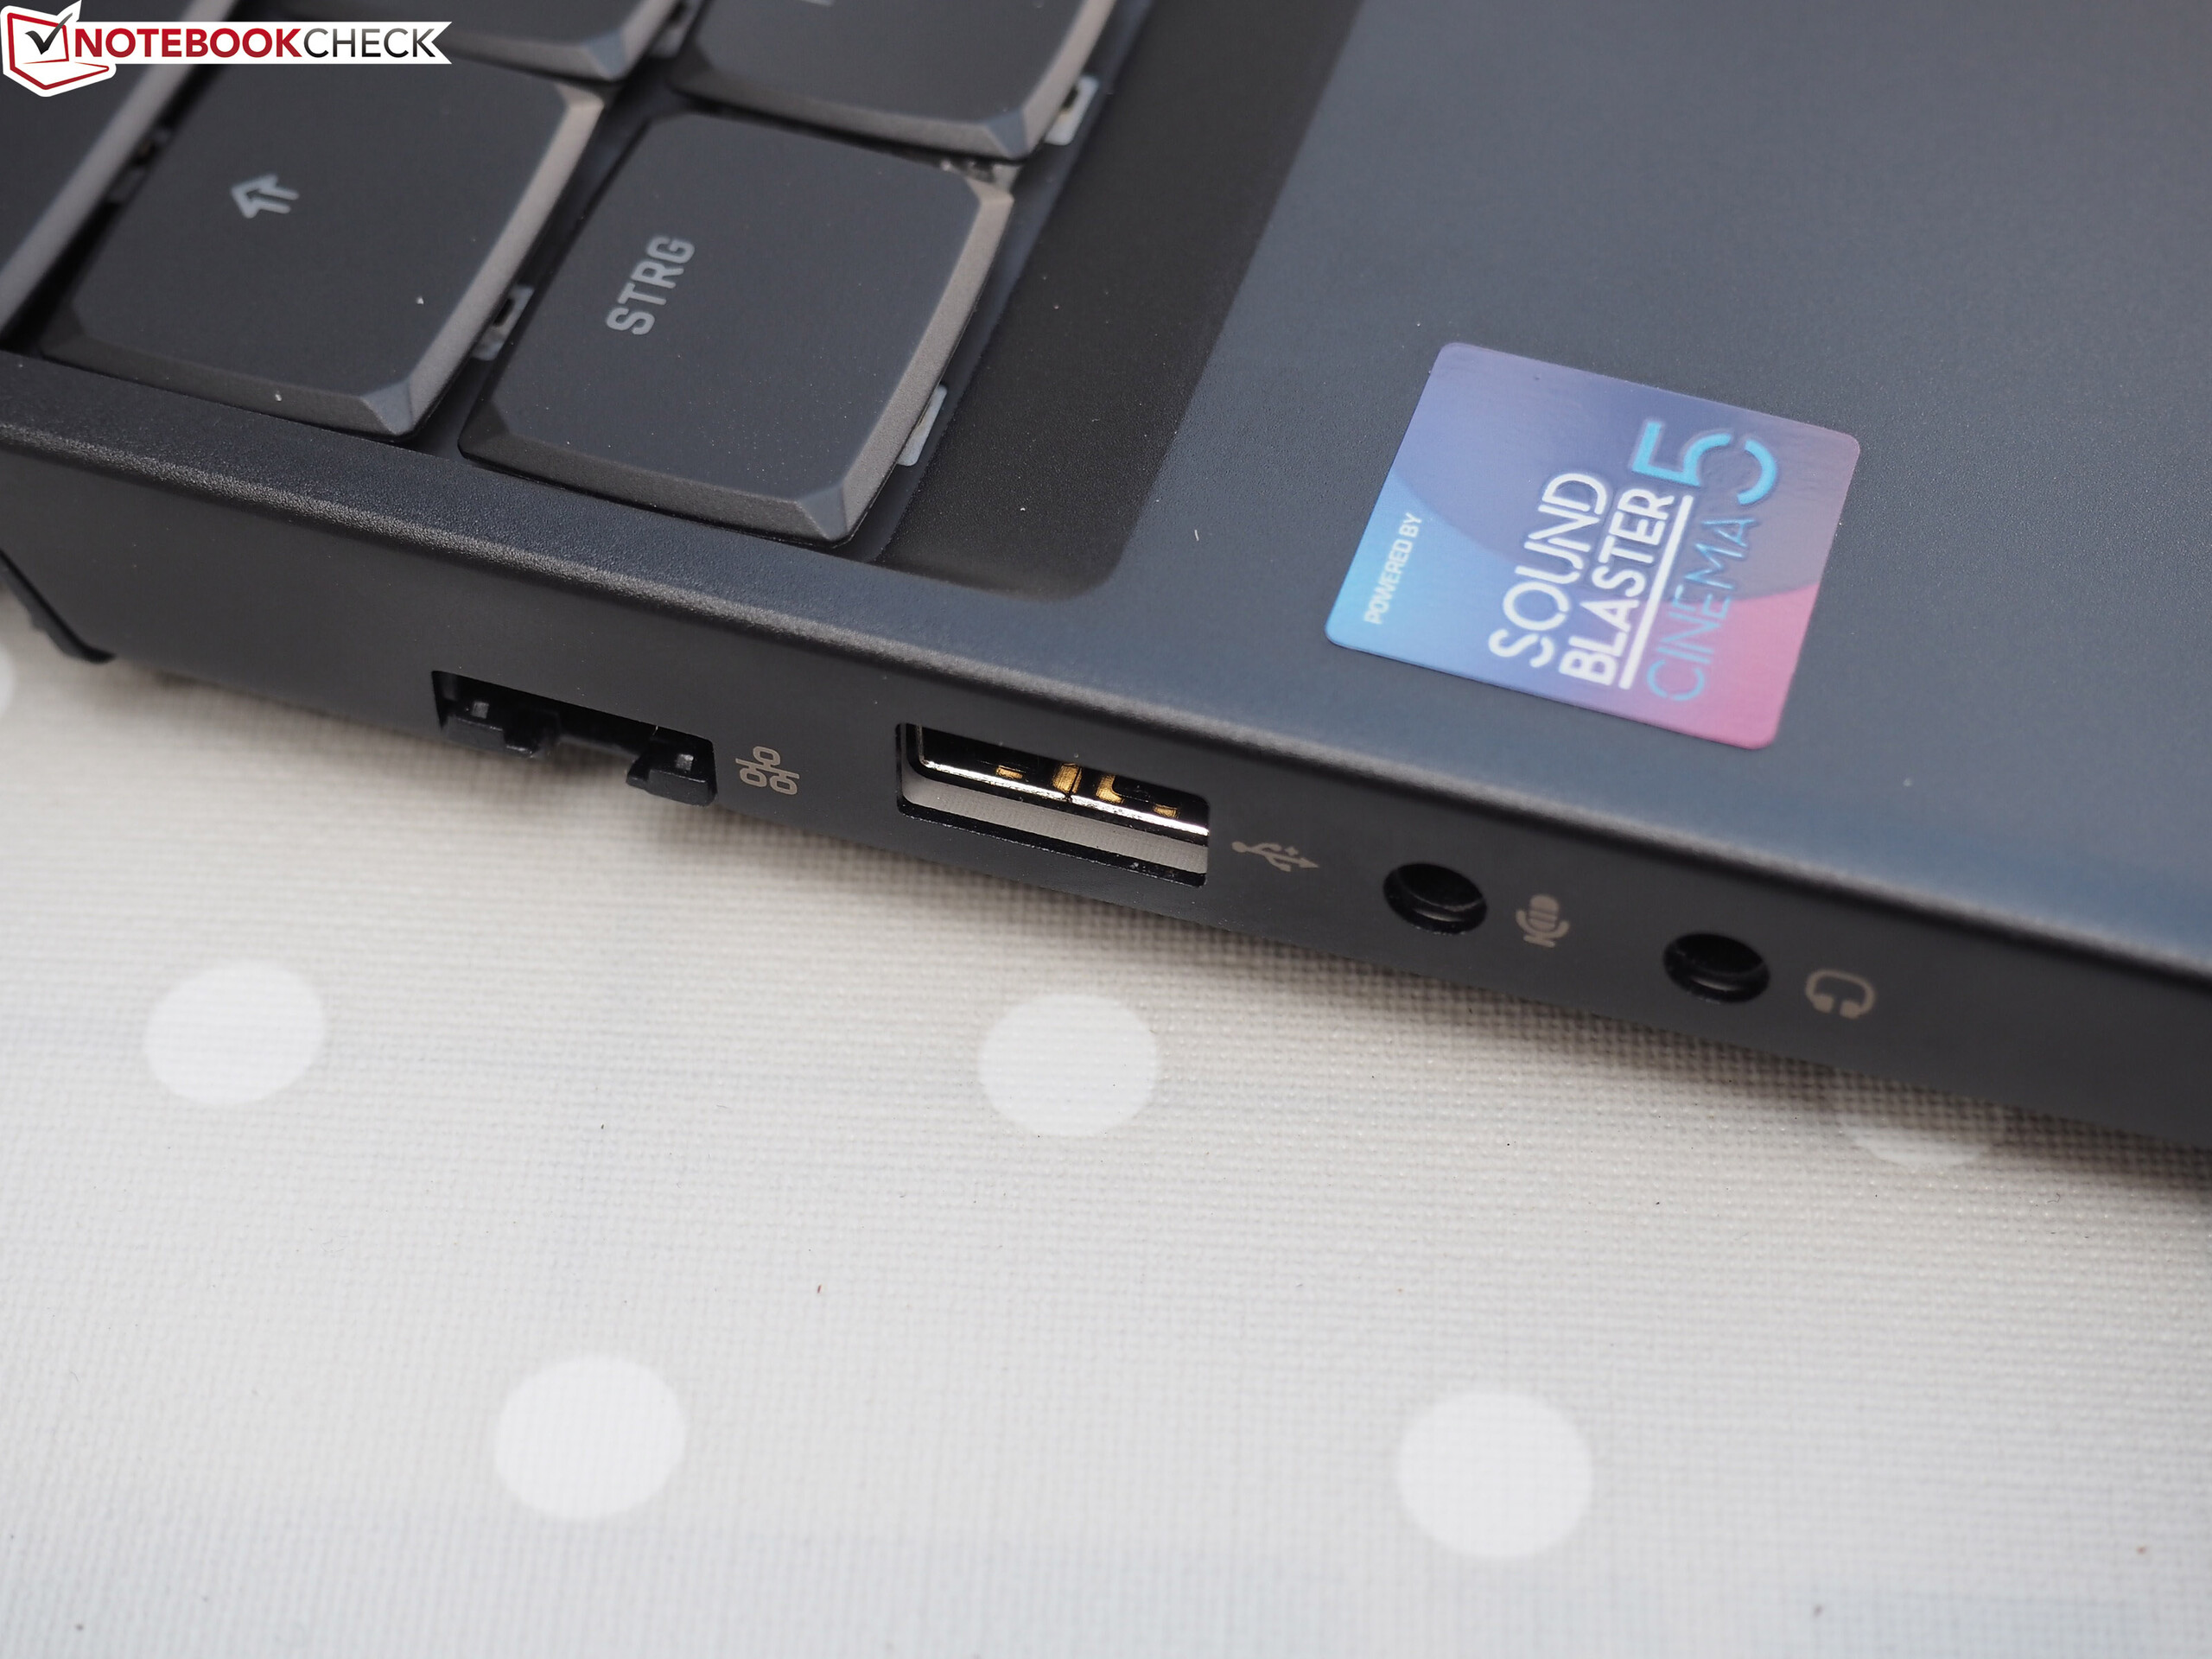
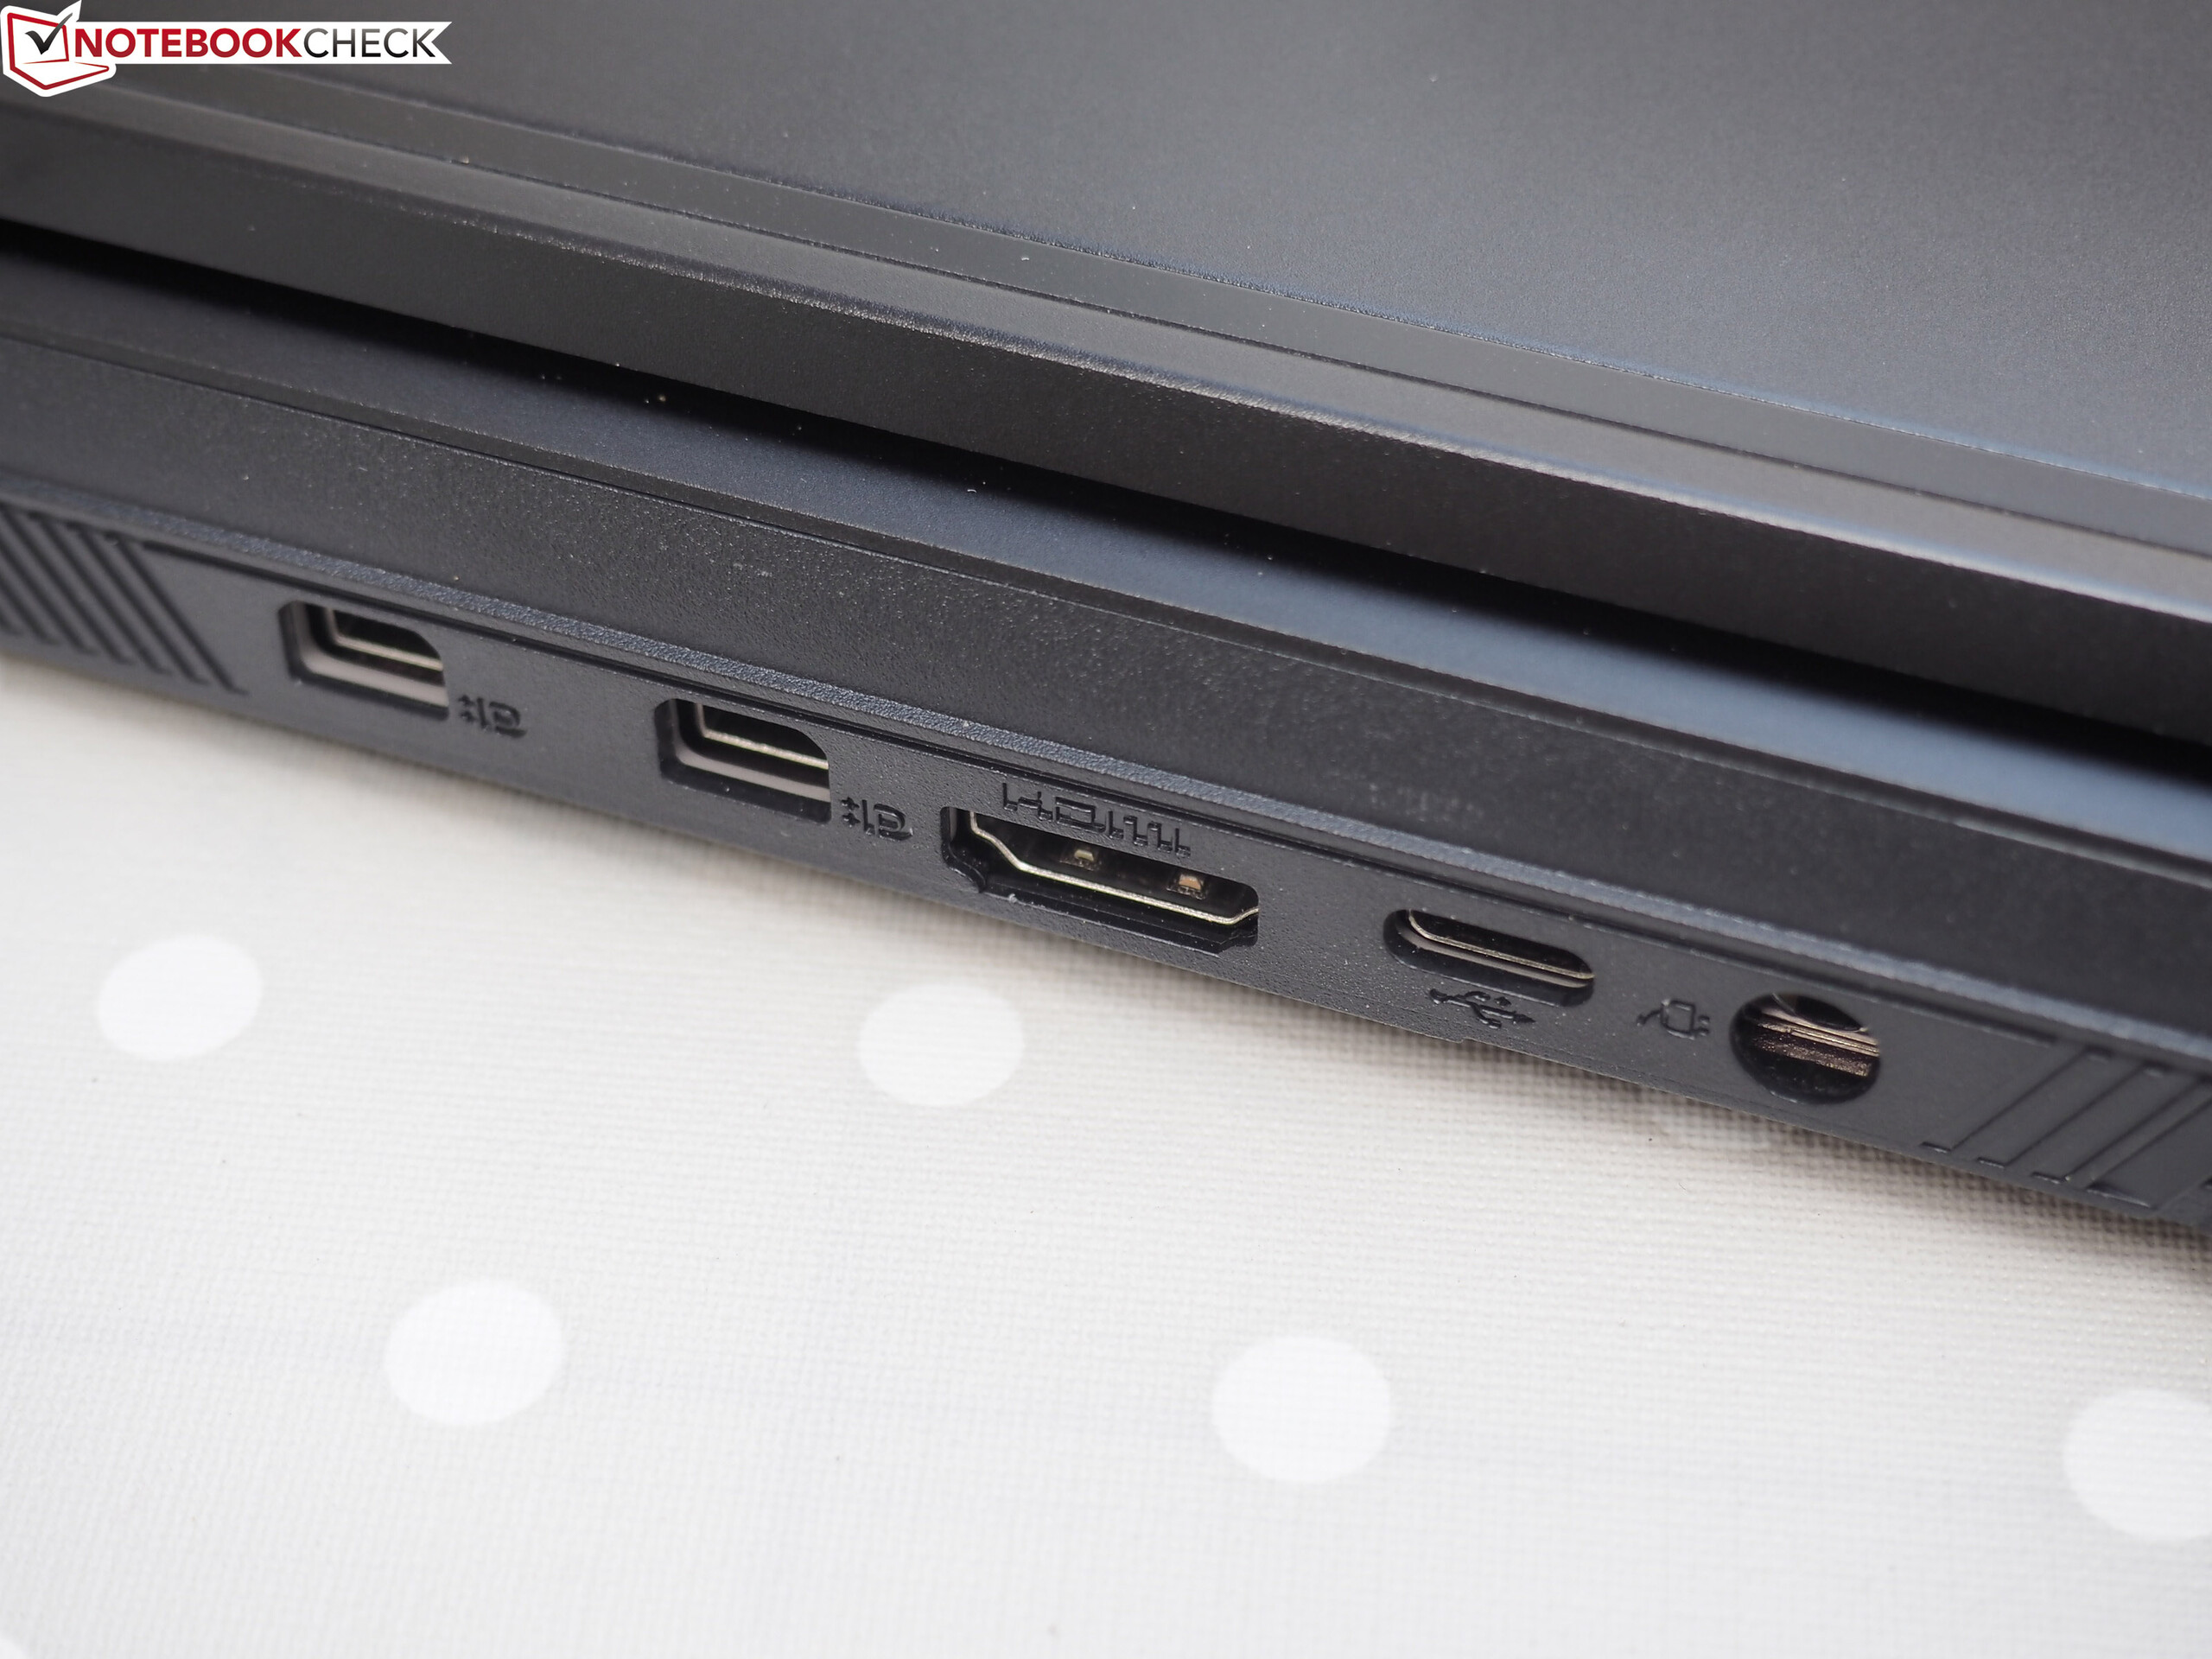
Given the similarities with its predecessor we are not going to cover case, connectivity, input devices, and speakers in detail in this review. Instead, we would like to refer you to last year’s Neo 15 review.
At a Glance: Modifications and Improvements
- Predecessor used Pascal GPUs, current model features Turing GPUs.
- 60 Hz display that was still offered with the predecessor is no longer available, and the only display available features a 144 Hz panel.
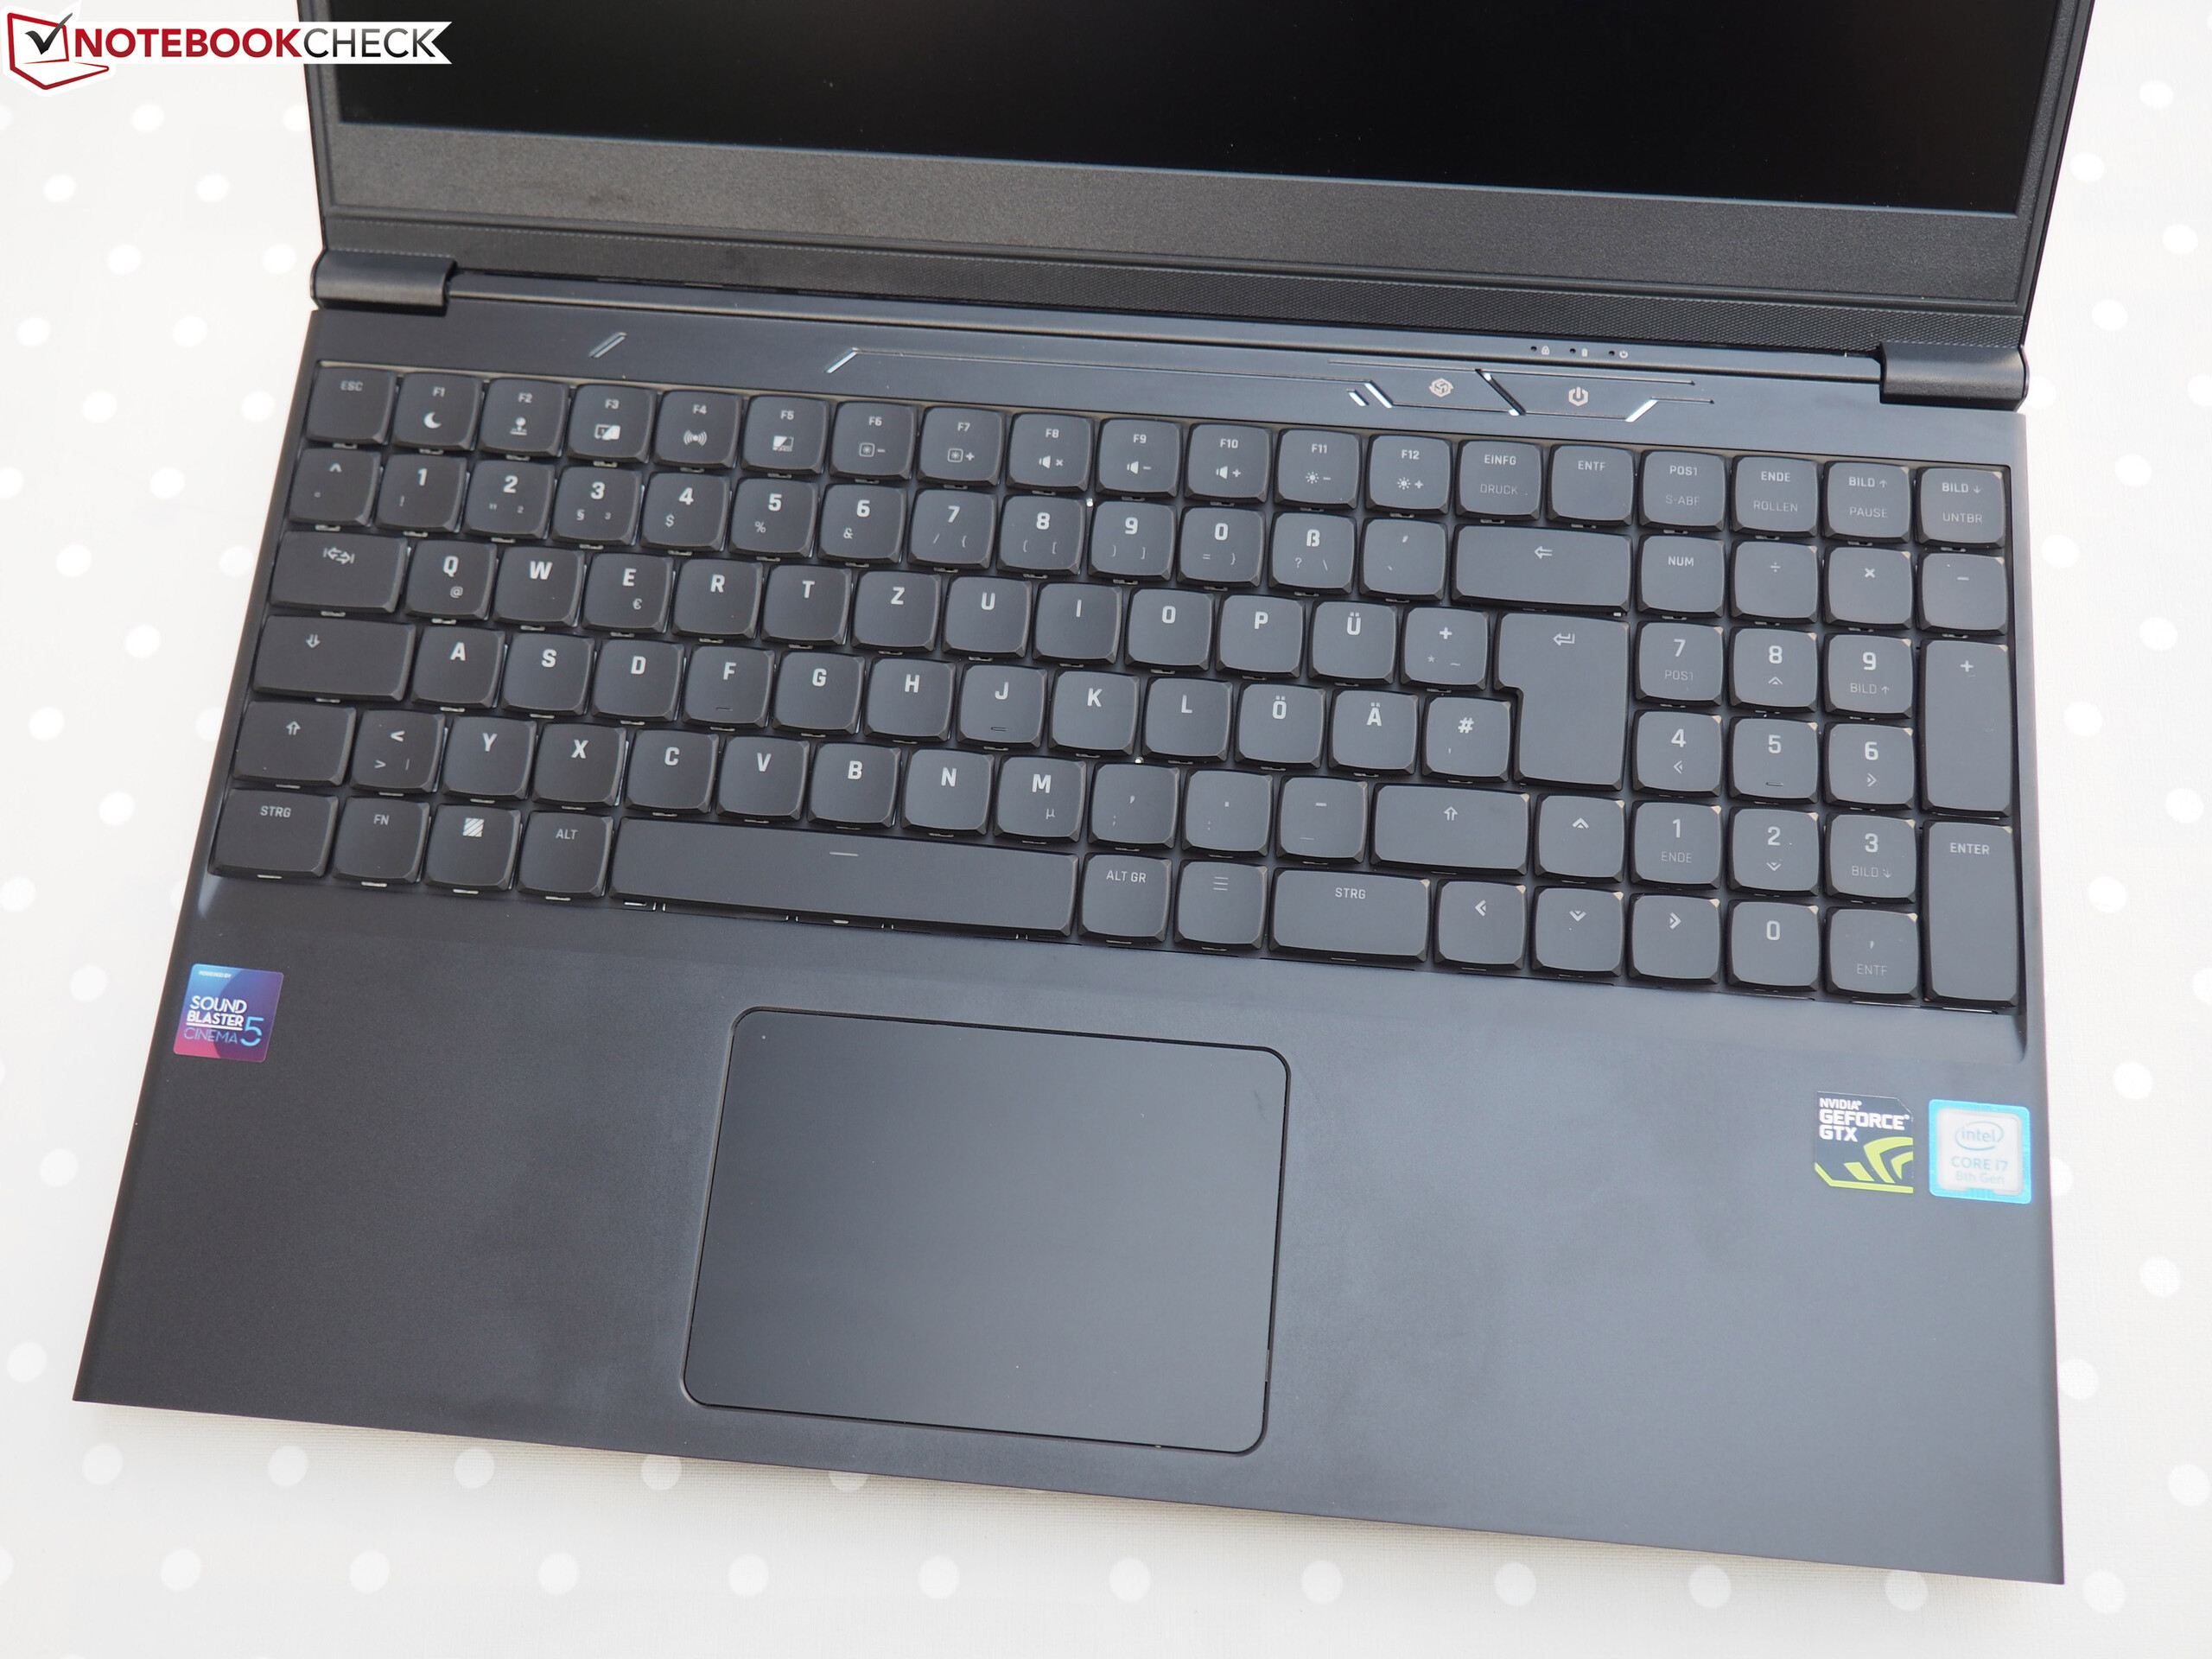
- Keyboard features quieter switches and a more prominent accentuation force.
- Improved battery capacity (62.3 Wh vs. 46.7 Wh).
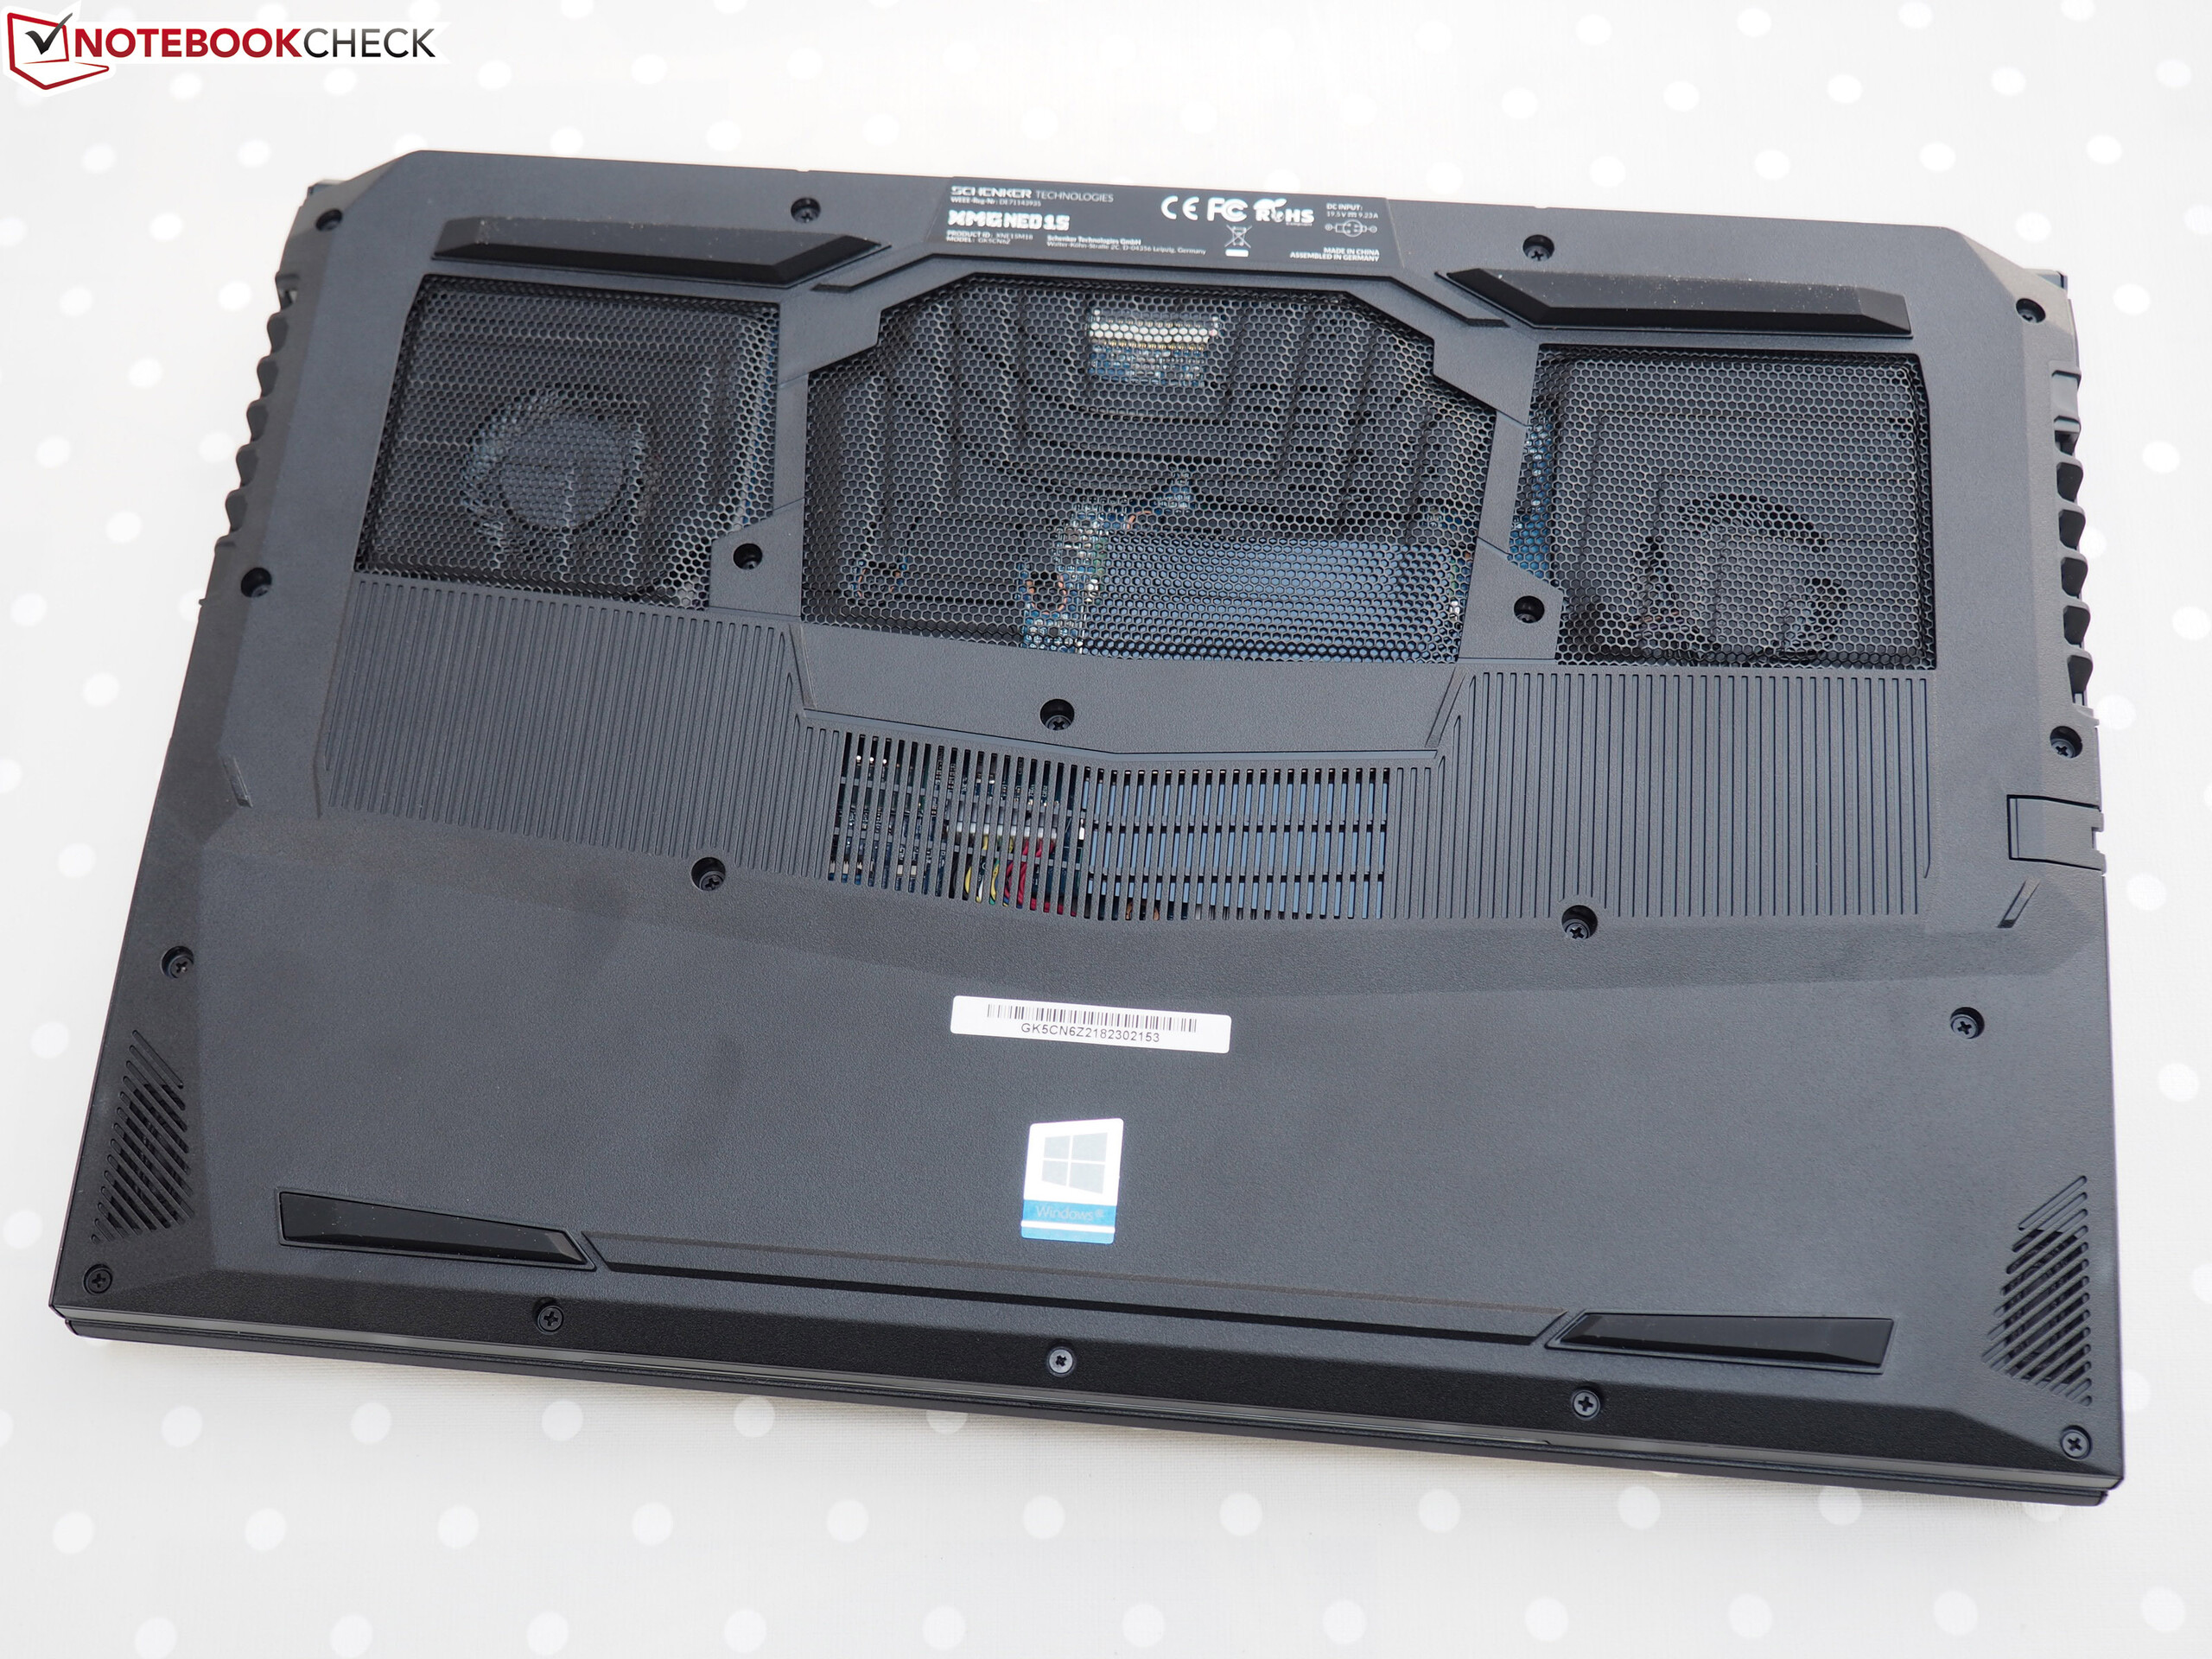
- 2.5-inch hard disk drive had to make room for larger battery.
| SD Card Reader | |
| average JPG Copy Test (av. of 3 runs) | |
| Gigabyte Aero 15-X9 (Toshiba Exceria Pro SDXC 64 GB UHS-II) | |
| Average of class Gaming (20.9 - 210, n=54, last 2 years) | |
| Schenker XMG Neo 15 Turing (Toshiba Exceria Pro SDXC 64 GB UHS-II) | |
| Schenker XMG Neo 15 (Toshiba Exceria Pro SDXC 64 GB UHS-II) | |
| maximum AS SSD Seq Read Test (1GB) | |
| Gigabyte Aero 15-X9 (Toshiba Exceria Pro SDXC 64 GB UHS-II) | |
| Average of class Gaming (25.5 - 261, n=51, last 2 years) | |
| Schenker XMG Neo 15 Turing (Toshiba Exceria Pro SDXC 64 GB UHS-II) | |
| Schenker XMG Neo 15 (Toshiba Exceria Pro SDXC 64 GB UHS-II) | |
Display
The matte 144 Hz 15.6-inch display runs at a native resolution of 1920 x 1080 (FHD) and features very short response times. Its contrast ratio of 1,117:1 is very decent, however its maximum brightness of just 270 nits is not. We would have expected more of a notebook at the Neo 15’s price point of more than $2,000.
Unfortunately, the display also suffered from PWM flickering at brightness levels of 99 % and below. That said, the frequency of 1,000 Hz should be high enough for most users, and should not cause headaches or sore eyes even in more sensitive users.
| |||||||||||||||||||||||||
Brightness Distribution: 84 %
Center on Battery: 268 cd/m²
Contrast: 1117:1 (Black: 0.24 cd/m²)
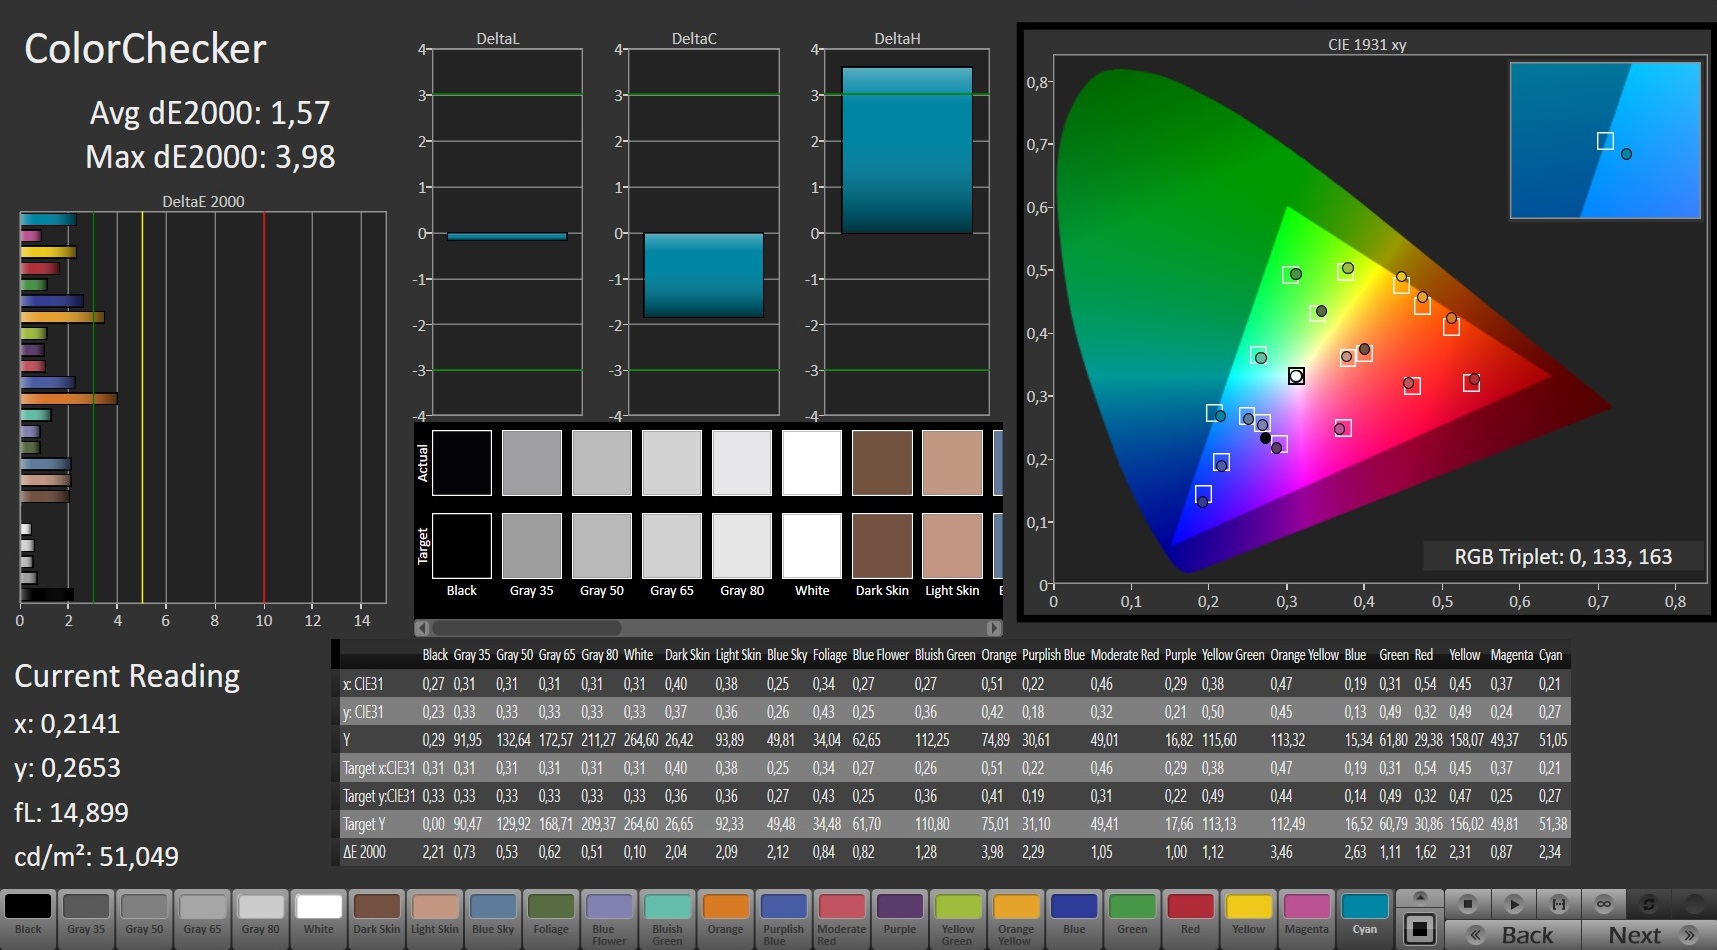
ΔE ColorChecker Calman: 4.51 | ∀{0.5-29.43 Ø4.71}
calibrated: 1.57
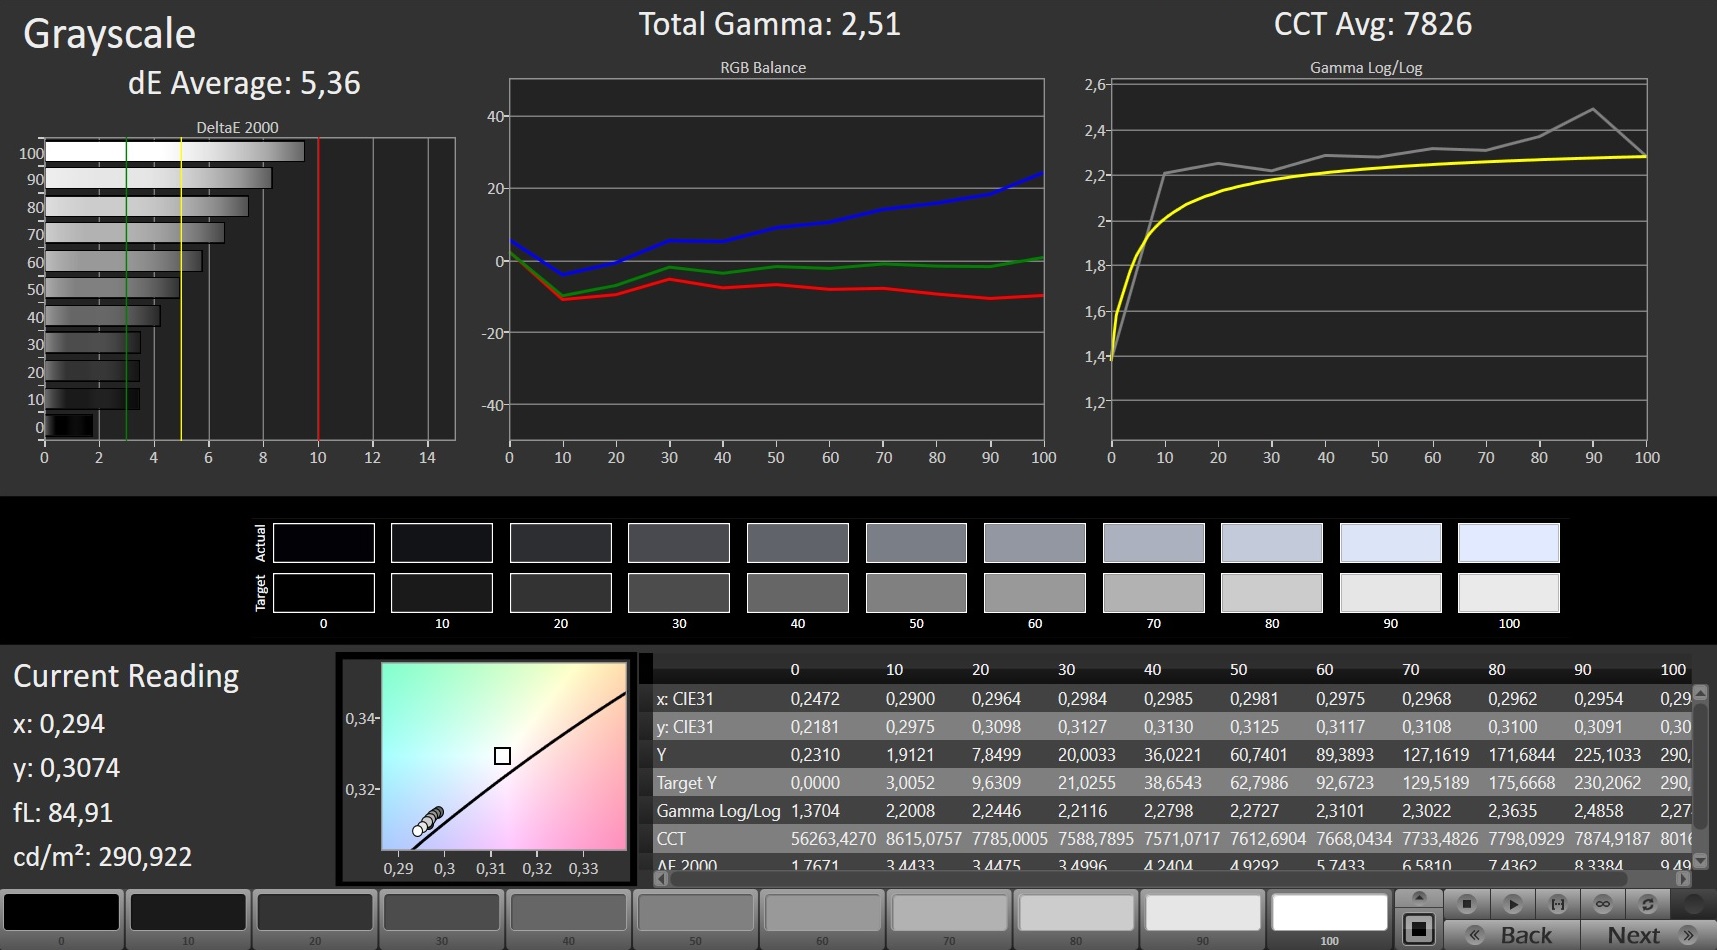
ΔE Greyscale Calman: 5.36 | ∀{0.09-98 Ø4.96}
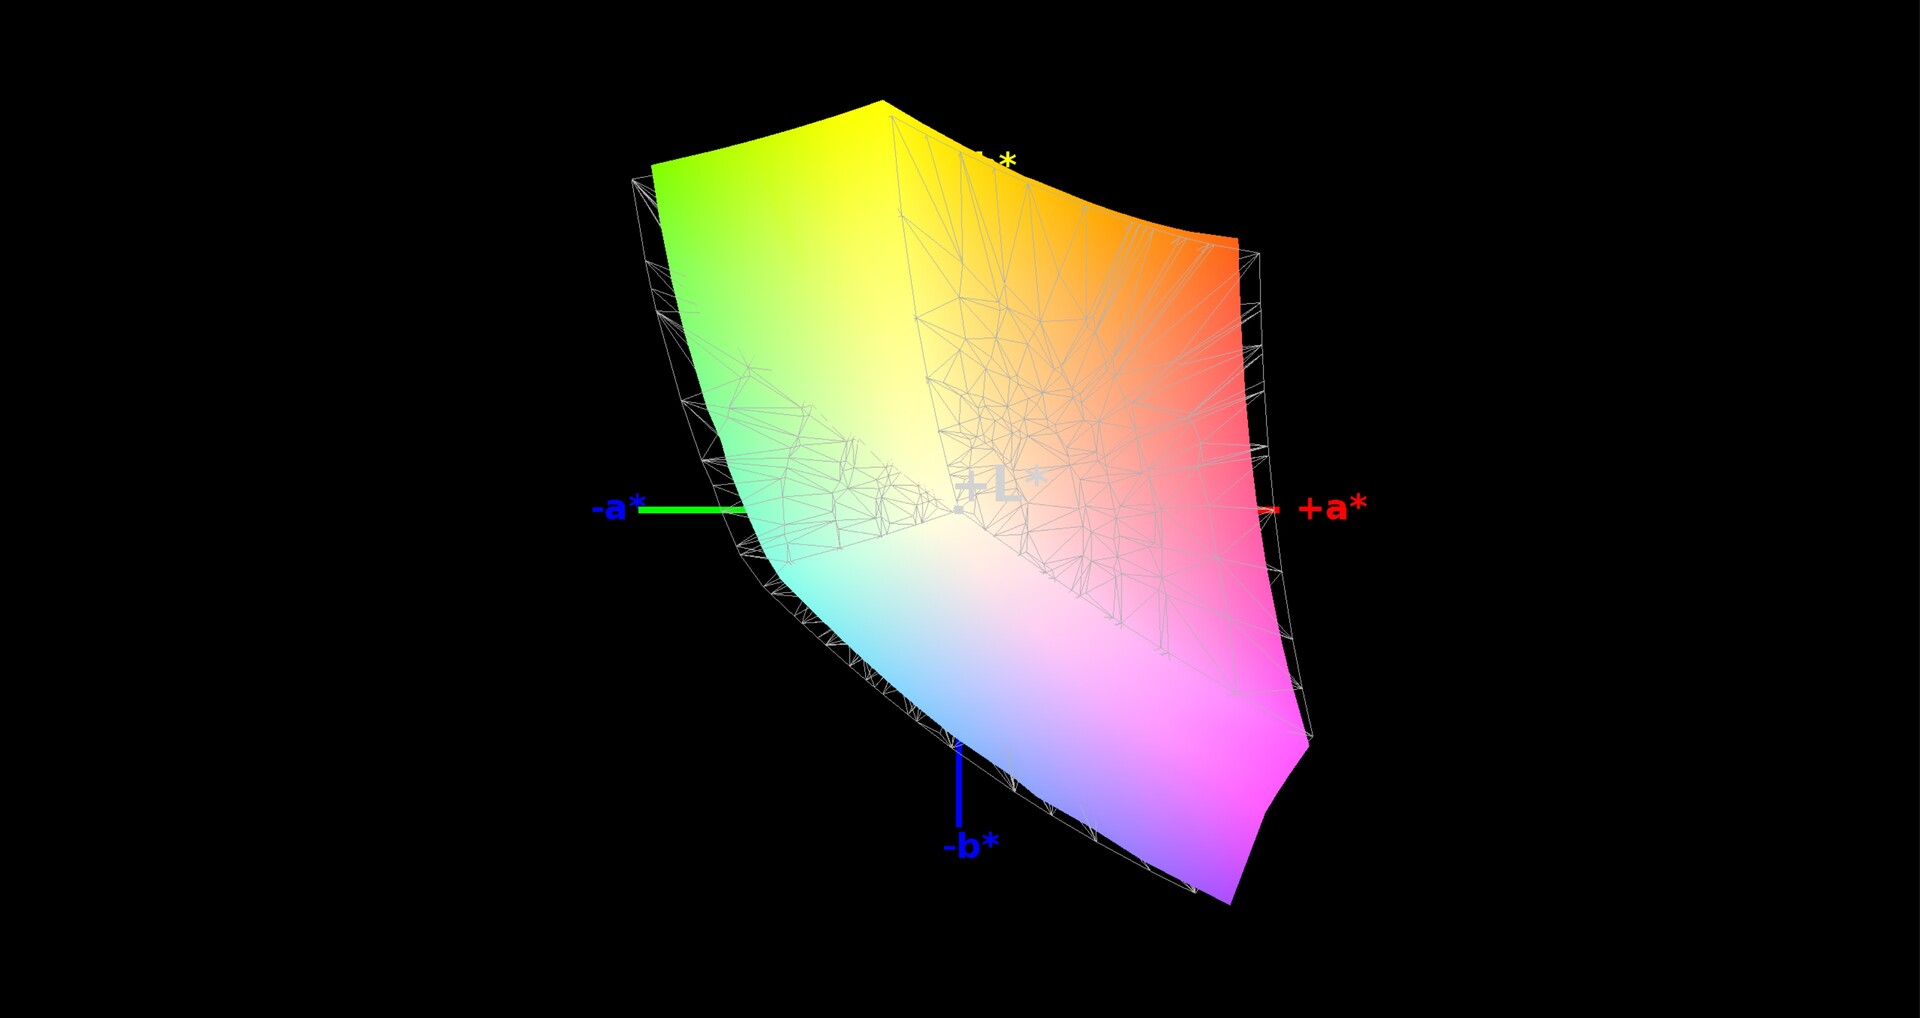
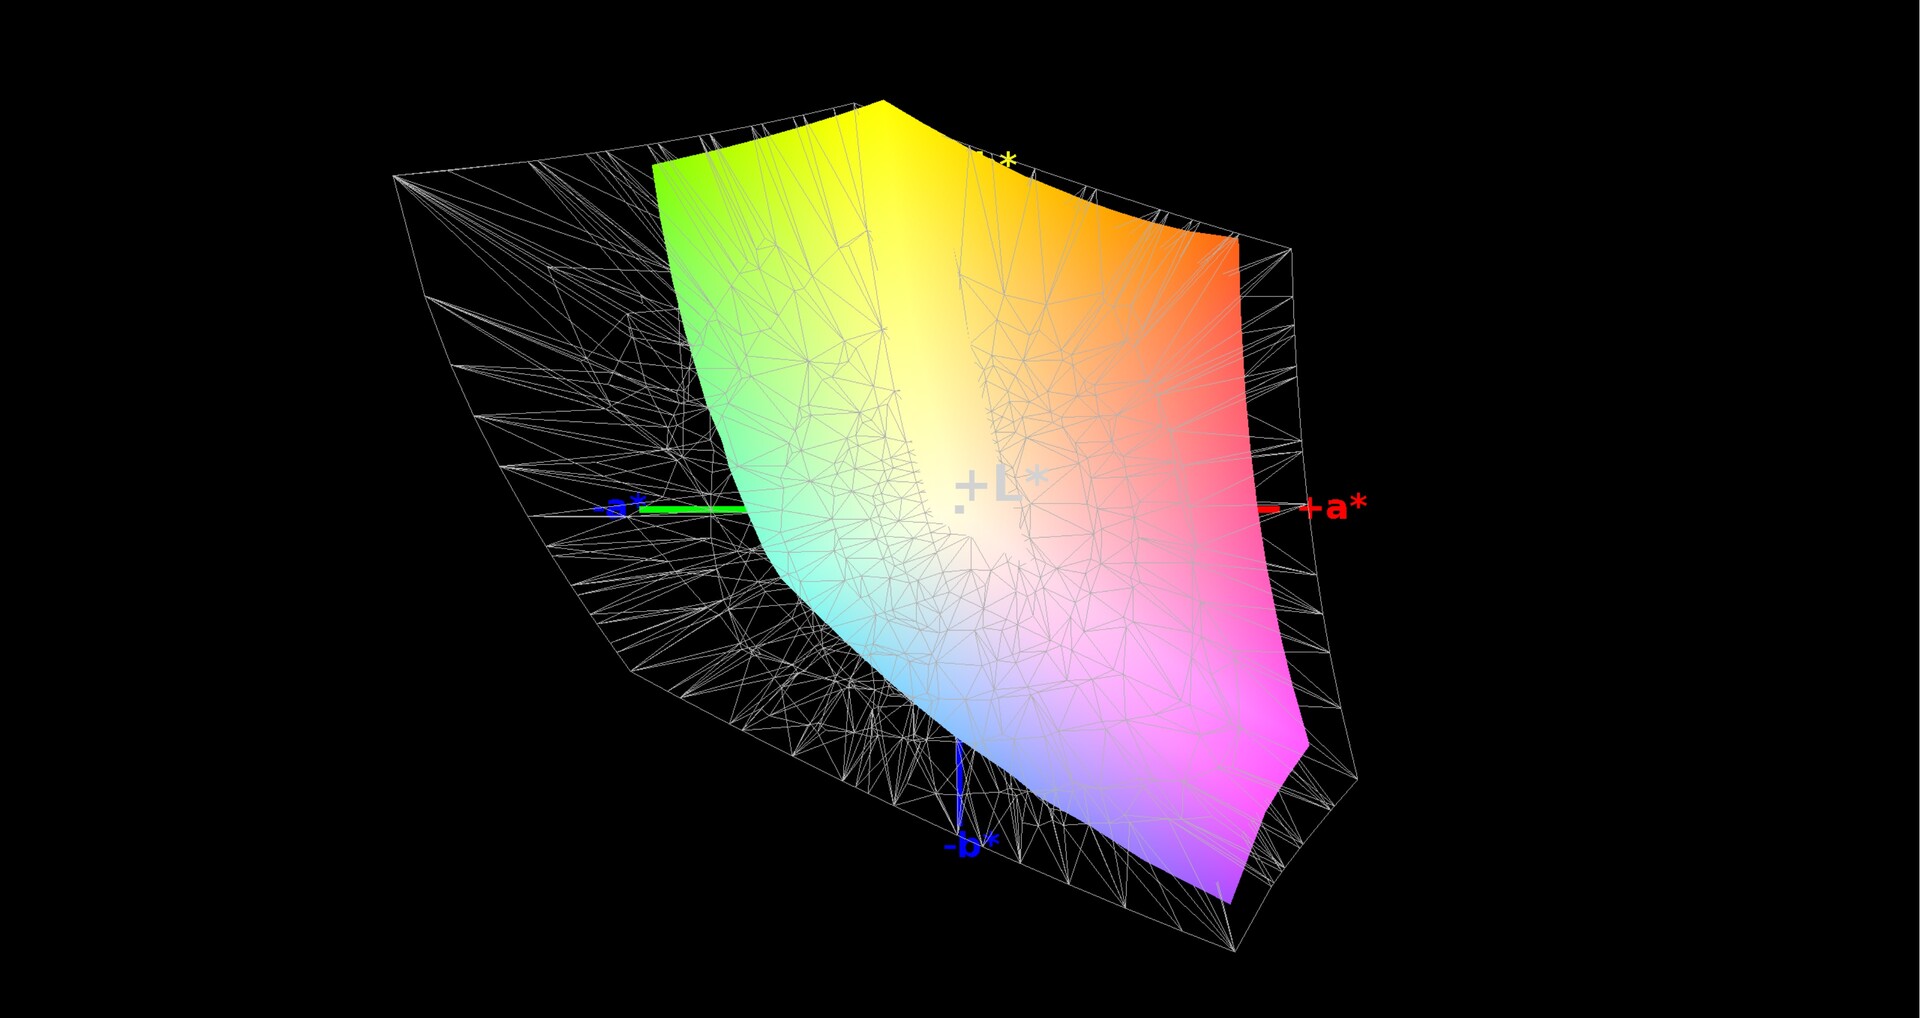
92% sRGB (Argyll 1.6.3 3D)
59% AdobeRGB 1998 (Argyll 1.6.3 3D)
65% AdobeRGB 1998 (Argyll 3D)
92.3% sRGB (Argyll 3D)
63.5% Display P3 (Argyll 3D)
Gamma: 2.51
CCT: 7826 K
| Schenker XMG Neo 15 Turing BOEhydis NV156FHM-N4G (BOE07AF), IPS, 1920x1080 | Schenker XMG Neo 15 LGD05C0, IPS, 1920x1080 | Gigabyte Aero 15-X9 LGD05C0, IPS, 1920x1080 | Razer Blade 15 RTX 2070 Max-Q LG Philips LGD05C0, IPS, 1920x1080 | Acer Predator Triton 500 AU Optronics B156HAN08.2 (AUO82ED), IPS, 1920x1080 | MSI GS65 8RF-019DE Stealth Thin AU Optronics B156HAN08.0 (AUO80ED), IPS, 1920x1080 | Asus Zephyrus S GX531GS AU Optronics B156HAN08.2 (AUO82ED), IPS, 1920x1080 | |
|---|---|---|---|---|---|---|---|
| Display | 1% | 0% | 3% | 1% | 2% | 2% | |
| Display P3 Coverage (%) | 63.5 | 64.3 1% | 63.5 0% | 65.3 3% | 64.2 1% | 66.2 4% | 66.7 5% |
| sRGB Coverage (%) | 92.3 | 94.1 2% | 93.1 1% | 94.9 3% | 92.6 0% | 92.1 0% | 91.2 -1% |
| AdobeRGB 1998 Coverage (%) | 65 | 65.3 0% | 64.5 -1% | 66.3 2% | 65.7 1% | 67.2 3% | 66.7 3% |
| Response Times | -39% | -61% | -54% | -2% | -64% | 8% | |
| Response Time Grey 50% / Grey 80% * (ms) | 8.8 ? | 16 ? -82% | 16.4 ? -86% | 16.8 ? -91% | 8 ? 9% | 17.6 ? -100% | 7.4 ? 16% |
| Response Time Black / White * (ms) | 10 ? | 9.6 ? 4% | 13.6 ? -36% | 11.6 ? -16% | 11.2 ? -12% | 12.8 ? -28% | 10 ? -0% |
| PWM Frequency (Hz) | 1000 ? | ||||||
| Screen | 14% | 16% | 7% | 0% | 15% | 12% | |
| Brightness middle (cd/m²) | 268 | 325 21% | 250 -7% | 314.7 17% | 304 13% | 254 -5% | 294 10% |
| Brightness (cd/m²) | 270 | 303 12% | 235 -13% | 312 16% | 299 11% | 262 -3% | 275 2% |
| Brightness Distribution (%) | 84 | 90 7% | 85 1% | 90 7% | 89 6% | 89 6% | 84 0% |
| Black Level * (cd/m²) | 0.24 | 0.33 -38% | 0.29 -21% | 0.38 -58% | 0.27 -13% | 0.22 8% | 0.24 -0% |
| Contrast (:1) | 1117 | 985 -12% | 862 -23% | 828 -26% | 1126 1% | 1155 3% | 1225 10% |
| Colorchecker dE 2000 * | 4.51 | 2.69 40% | 1.46 68% | 2.56 43% | 4.66 -3% | 2.37 47% | 2.57 43% |
| Colorchecker dE 2000 max. * | 9.58 | 4.91 49% | 2.47 74% | 4.89 49% | 9.65 -1% | 4.71 51% | 4.88 49% |
| Colorchecker dE 2000 calibrated * | 1.57 | 1.27 19% | 1.71 -9% | 1.72 -10% | 1.84 -17% | 2.14 -36% | |
| Greyscale dE 2000 * | 5.36 | 2.34 56% | 1.27 76% | 3.4 37% | 5.53 -3% | 1.58 71% | 2.41 55% |
| Gamma | 2.51 88% | 2.38 92% | 2.4 92% | 2.3 96% | 2.5 88% | 2.48 89% | 2.5 88% |
| CCT | 7826 83% | 6872 95% | 6749 96% | 6435 101% | 8028 81% | 6785 96% | 6370 102% |
| Color Space (Percent of AdobeRGB 1998) (%) | 59 | 60 2% | 60 2% | 60.7 3% | 60 2% | 60 2% | 59 0% |
| Color Space (Percent of sRGB) (%) | 92 | 94 2% | 93 1% | 94.6 3% | 93 1% | 92 0% | 91 -1% |
| Total Average (Program / Settings) | -8% /
5% | -15% /
2% | -15% /
-1% | -0% /
0% | -16% /
3% | 7% /
10% |
* ... smaller is better
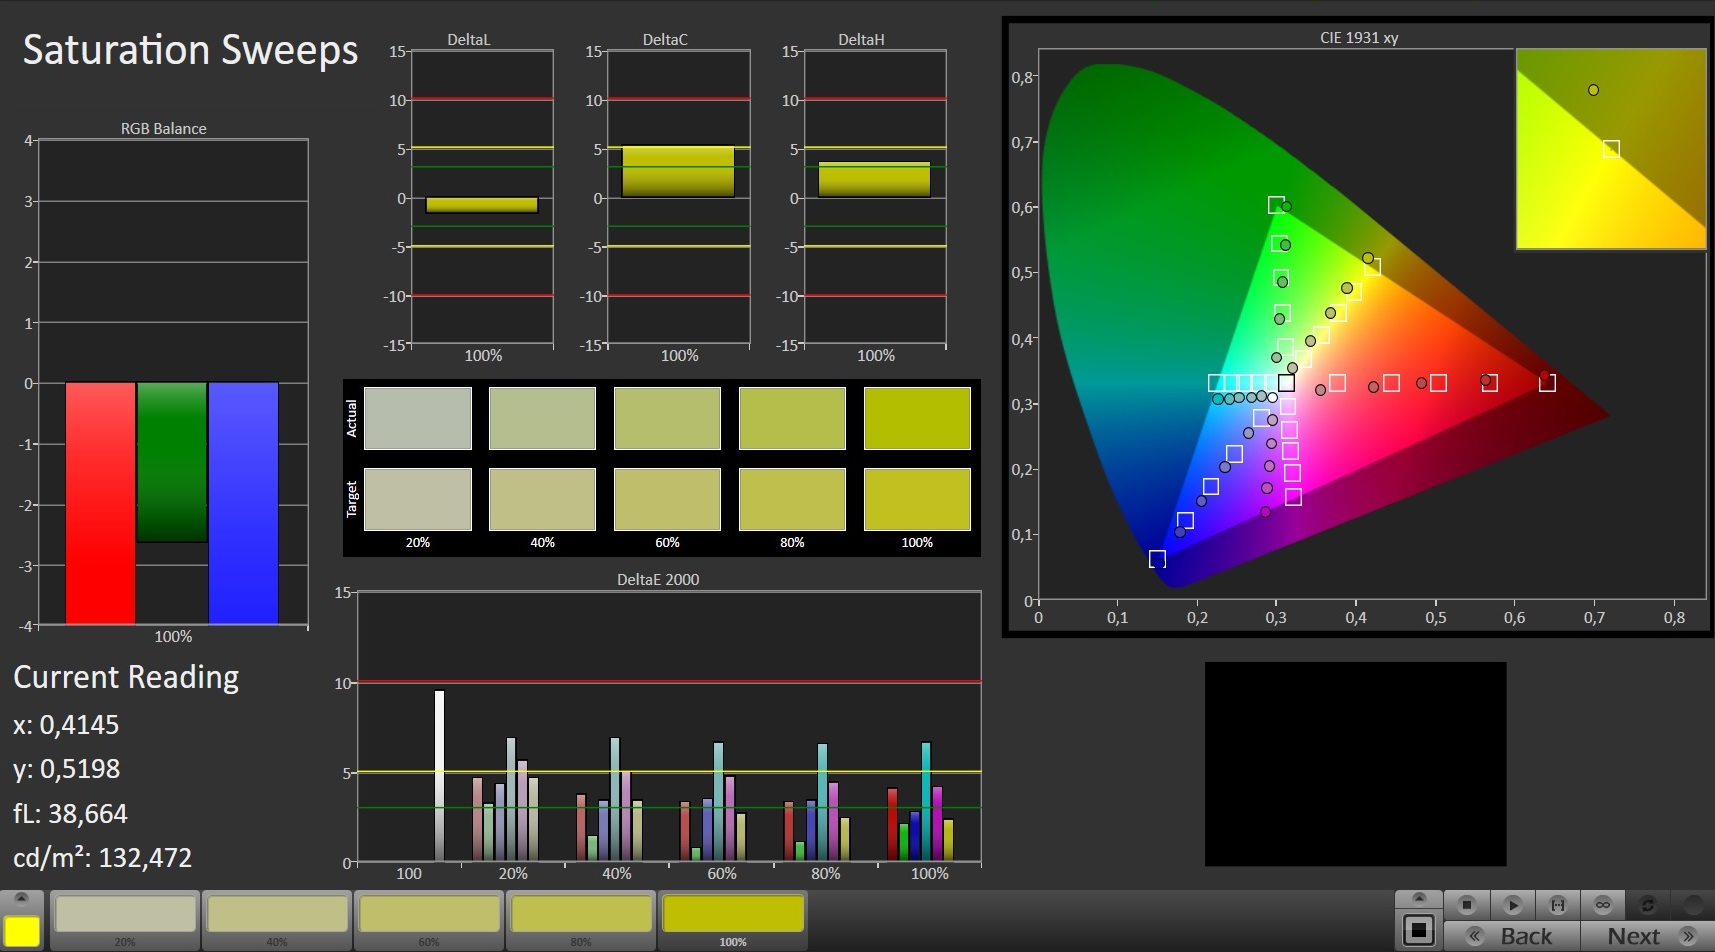
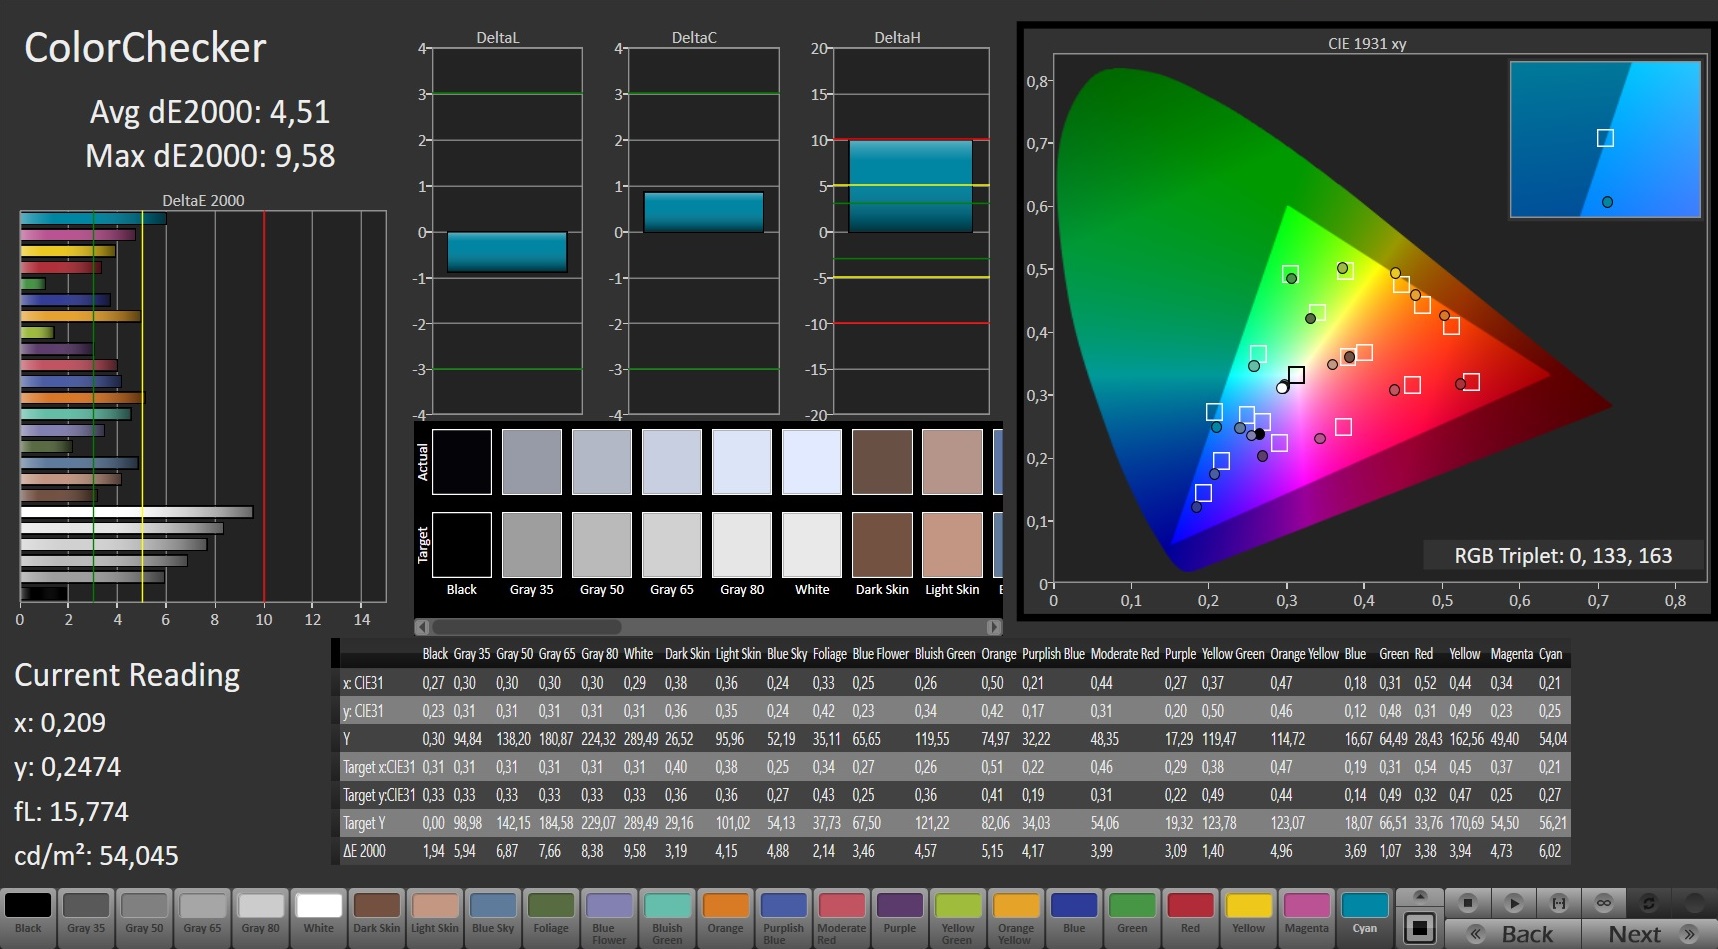
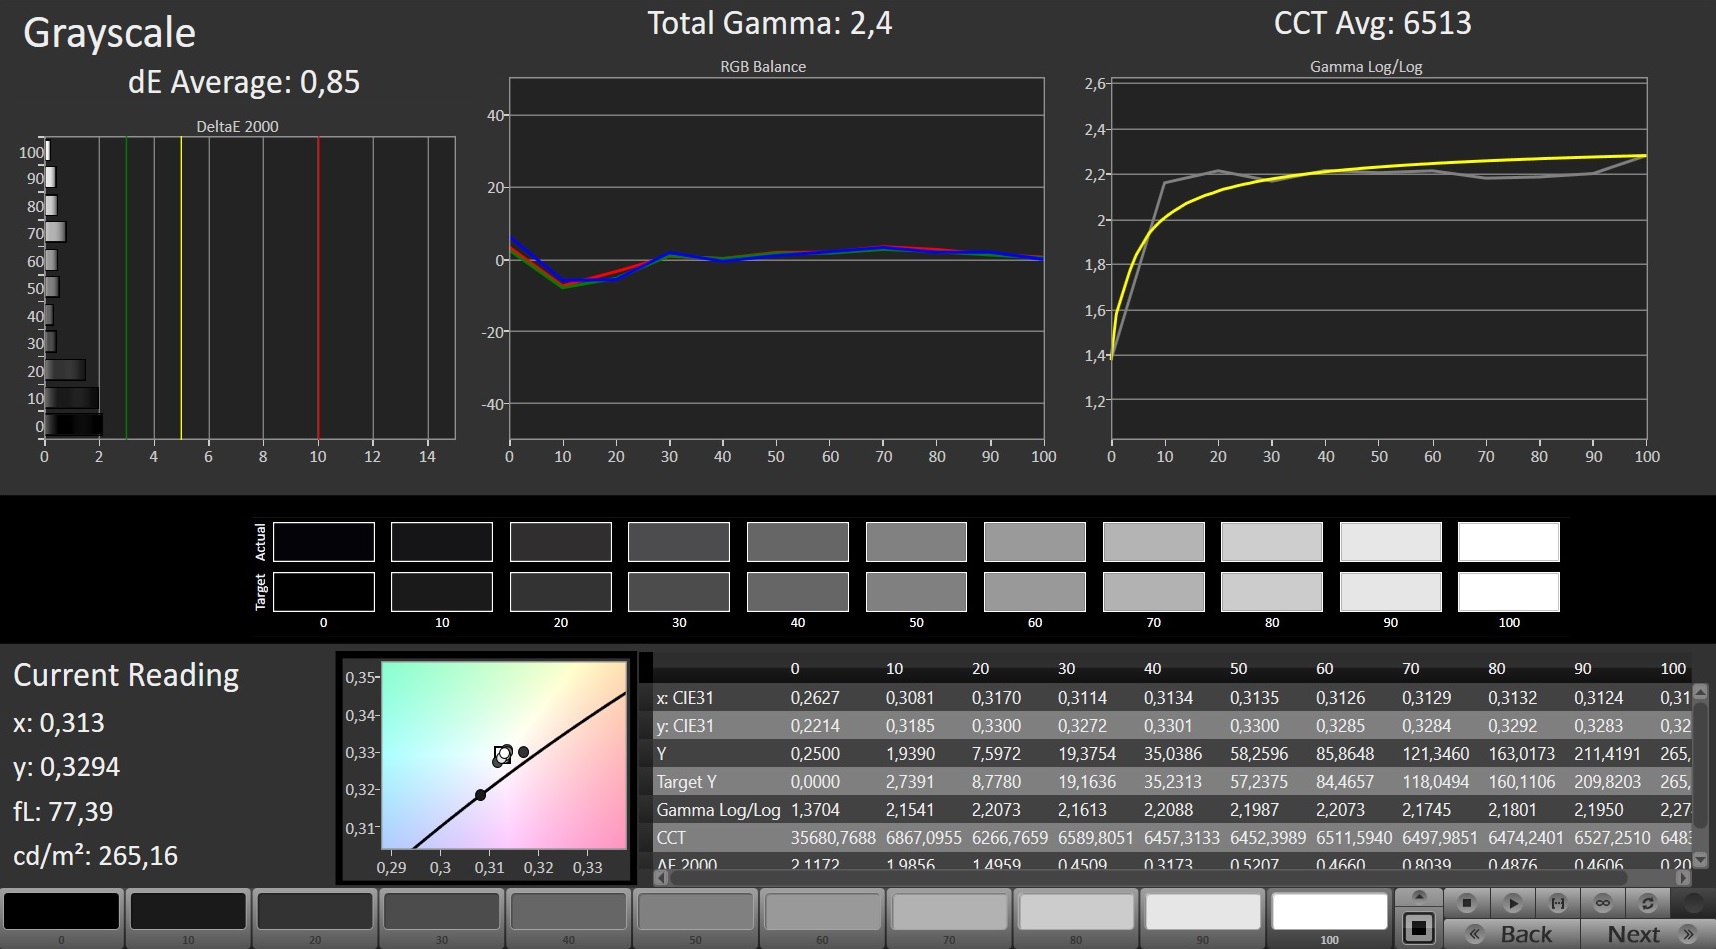
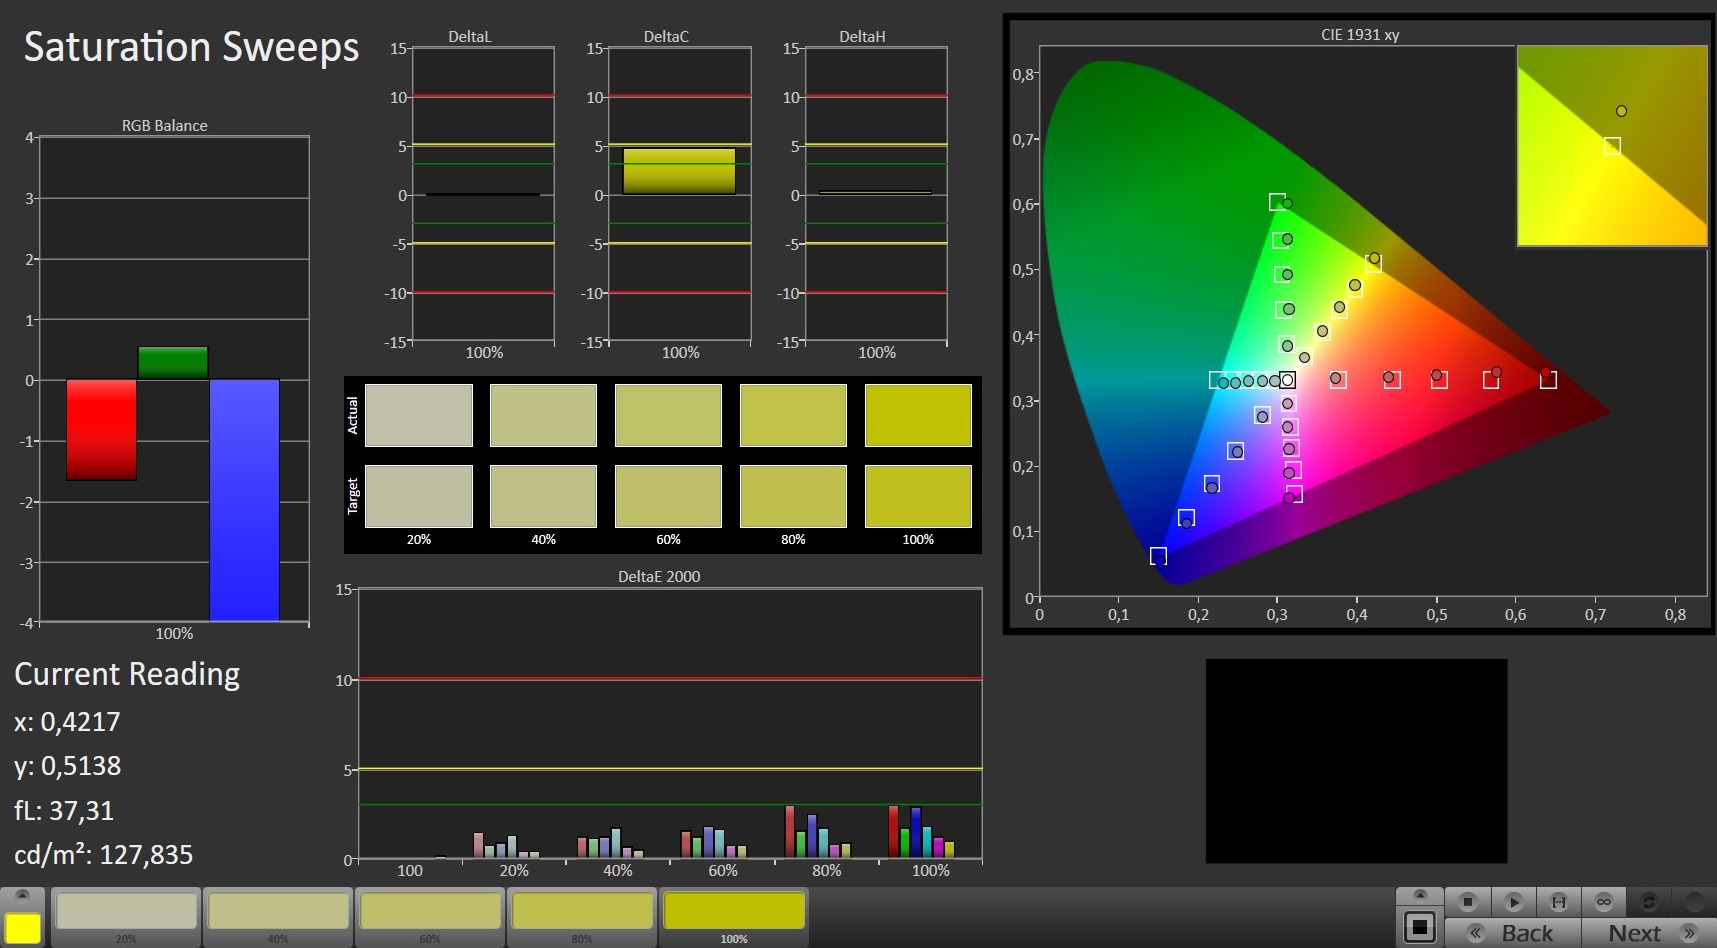
With a DeltaE 2000 deviation of just 4.51, color accuracy was fairly decent out of the box. Ideally, you would be aiming at a DeltaE of less than 3. The display did however suffer from a minor blue tint. We were able to improve upon accuracy through calibration and subsequently managed to reduce DeltaE to 1.57 and improve overall grayscale balance. The display failed to cover sRGB and AdobeRGB completely and stopped short at just 92% and 59%, respectively.
As always, you can improve color accuracy with the ICC profile resulting from our calibration attempts. Make sure that your particular device is equipped with the same display (make and model) as ours, otherwise you might inadvertently make things worse rather than better. Many OEMs source their panels from different manufacturers.
Display Response Times
| ↔ Response Time Black to White | ||
|---|---|---|
| 10 ms ... rise ↗ and fall ↘ combined | ↗ 6 ms rise | 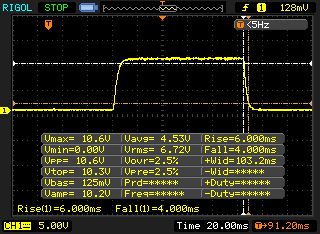 |
| ↘ 4 ms fall | ||
| The screen shows good response rates in our tests, but may be too slow for competitive gamers. In comparison, all tested devices range from 0.1 (minimum) to 240 (maximum) ms. » 27 % of all devices are better. This means that the measured response time is better than the average of all tested devices (19.8 ms). | ||
| ↔ Response Time 50% Grey to 80% Grey | ||
| 8.8 ms ... rise ↗ and fall ↘ combined | ↗ 4.4 ms rise | 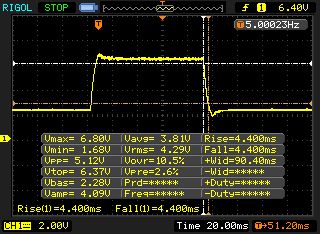 |
| ↘ 4.4 ms fall | ||
| The screen shows fast response rates in our tests and should be suited for gaming. In comparison, all tested devices range from 0.165 (minimum) to 636 (maximum) ms. » 22 % of all devices are better. This means that the measured response time is better than the average of all tested devices (30.9 ms). | ||
Screen Flickering / PWM (Pulse-Width Modulation)
| Screen flickering / PWM detected | 1000 Hz | ≤ 99 % brightness setting | 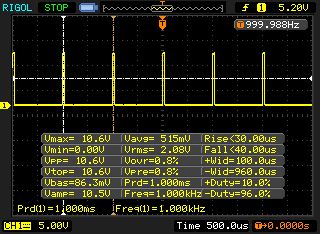 |
The display backlight flickers at 1000 Hz (worst case, e.g., utilizing PWM) Flickering detected at a brightness setting of 99 % and below. There should be no flickering or PWM above this brightness setting. The frequency of 1000 Hz is quite high, so most users sensitive to PWM should not notice any flickering. In comparison: 52 % of all tested devices do not use PWM to dim the display. If PWM was detected, an average of 7741 (minimum: 5 - maximum: 343500) Hz was measured. | |||
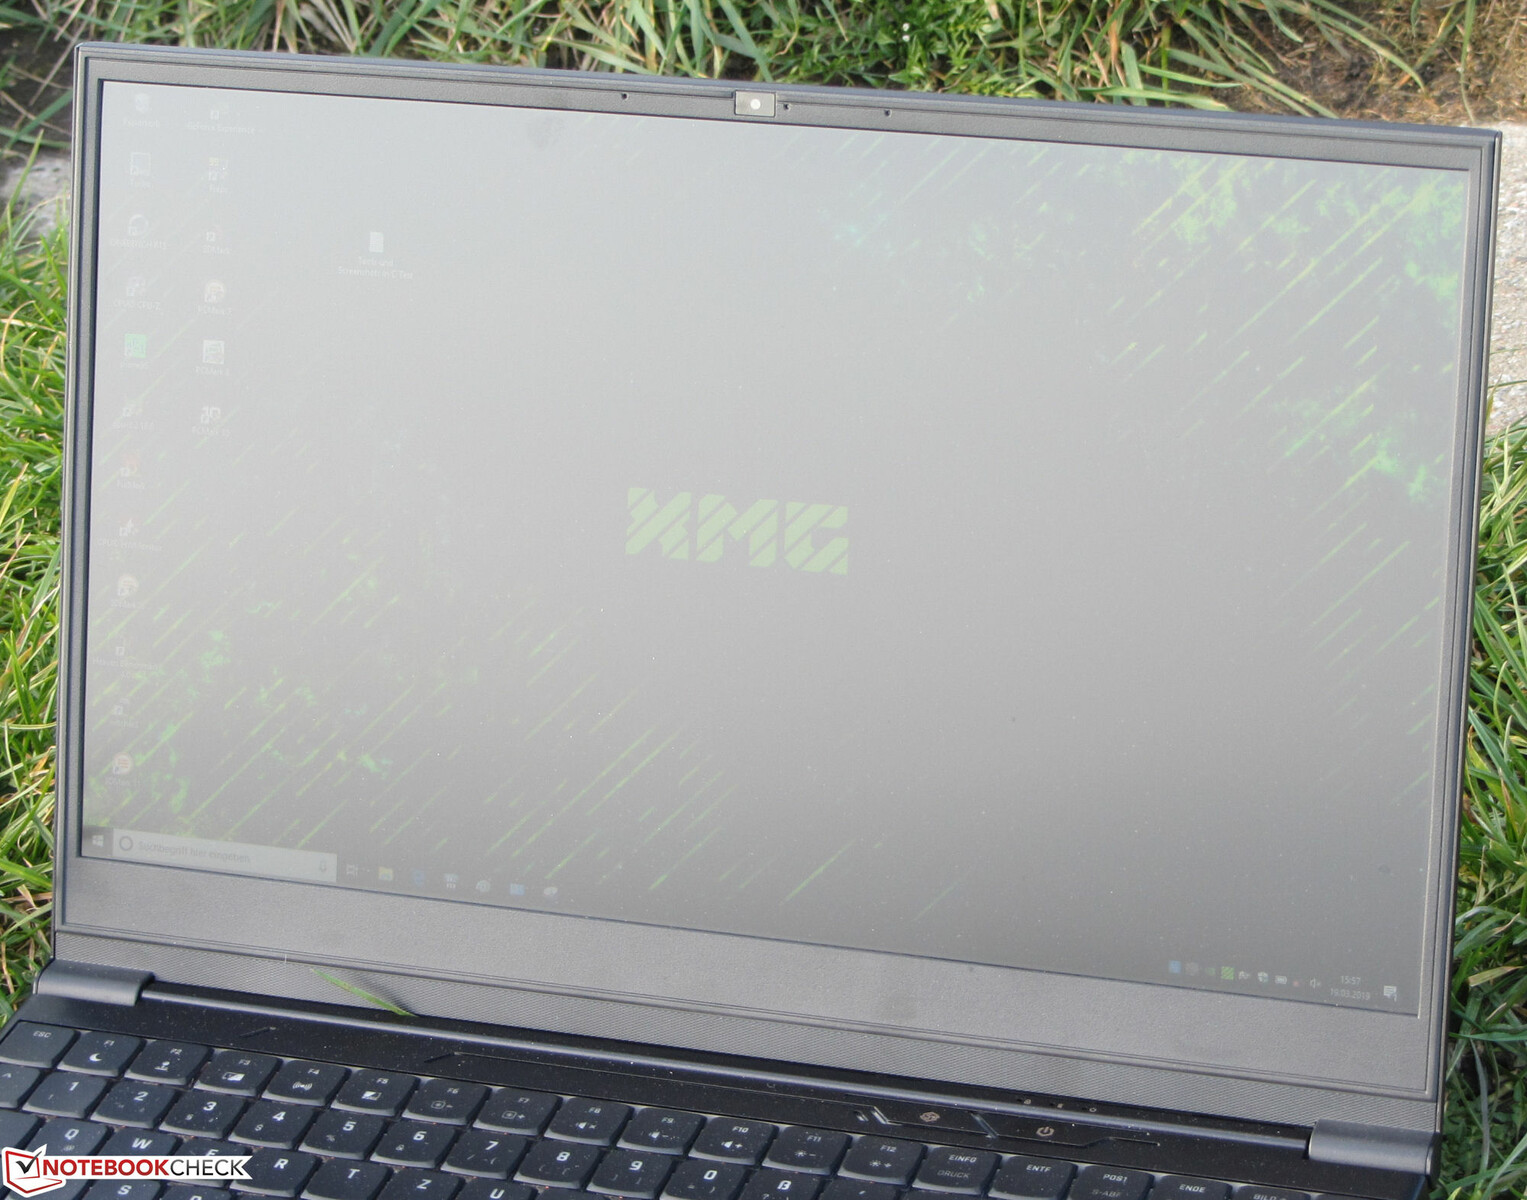
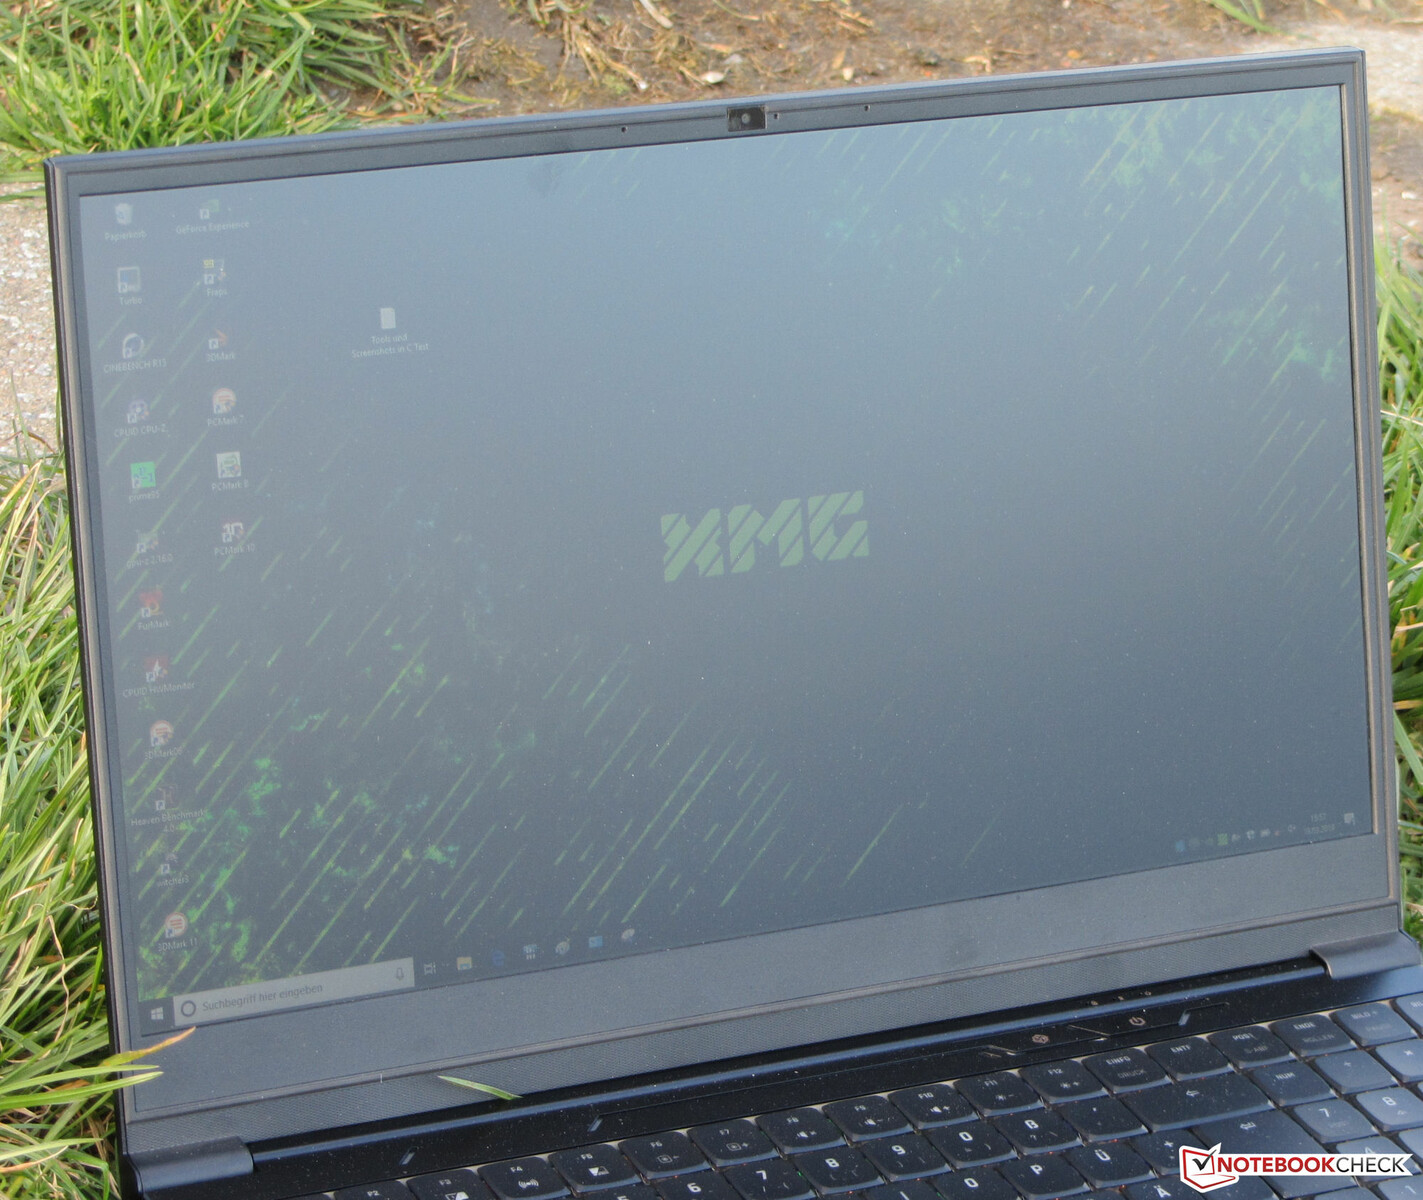
The IPS panel featured fairly wide viewing angles, and thus remained readable from all positions and angles. The display was clearly intended with indoor use in mind, and can only be used outdoors on overcast days or in the shade.

Performance
The XMG Neo 15 is a compact and thin 15.6-inch gaming notebook. It can be individually configured and customized to your liking, and should be capable of running all current games smoothly. Our particular review unit clocked in at around 2,400 Euros (~$2707) including tax, and it performed very admirably overall. Prices start at 1,750 Euros (~$1974).
Test Setup
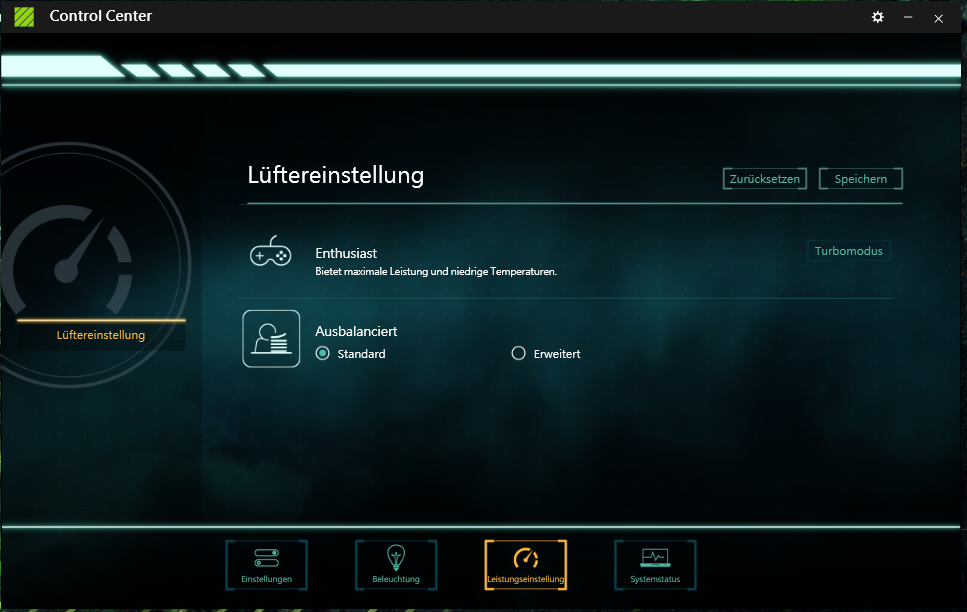
The included Control Center software allows you to select a fan profile. Choices include Balanced and Enthusiast. For the sake of our benchmarks and tests, we chose the Balanced profile. Nevertheless, a few benchmarks were also conducted with the Enthusiast profile selected and fan turbo activated. The results can be found in the tables below.
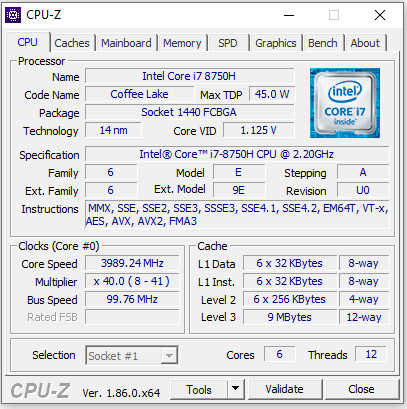
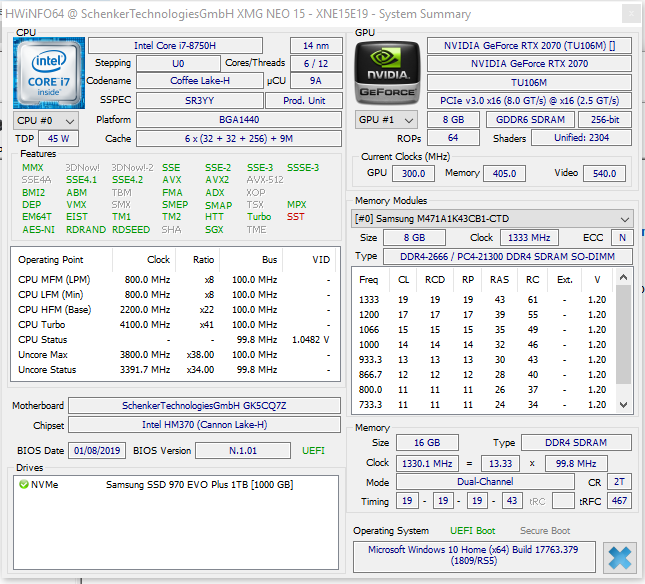
Processor
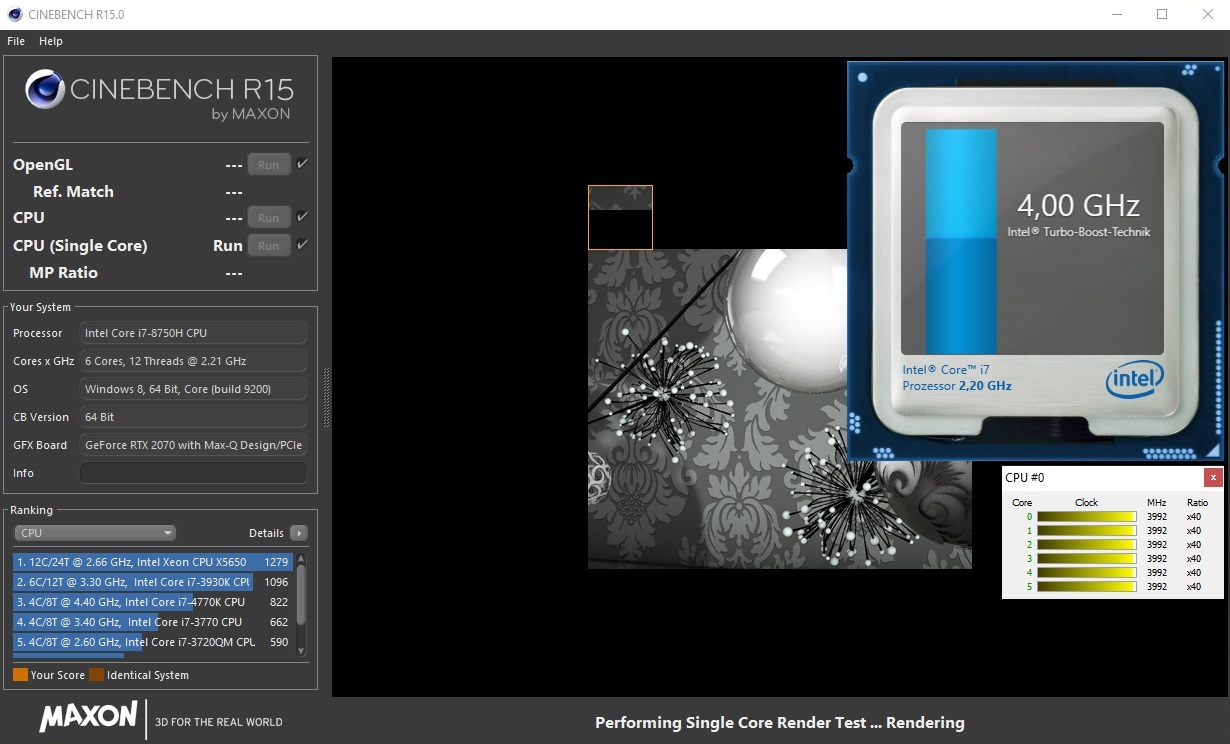
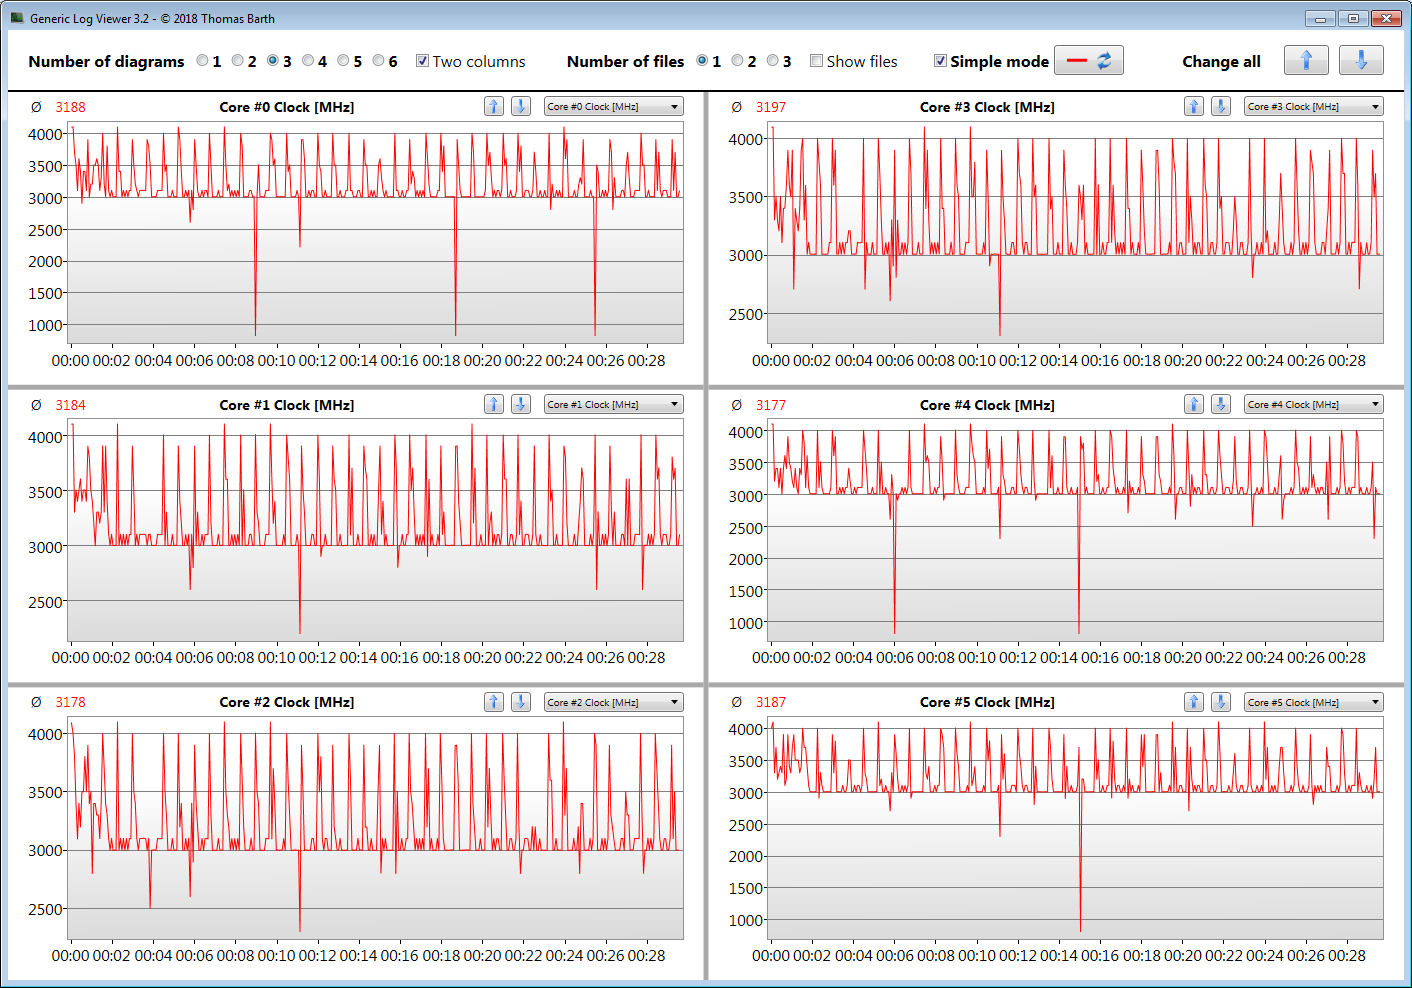
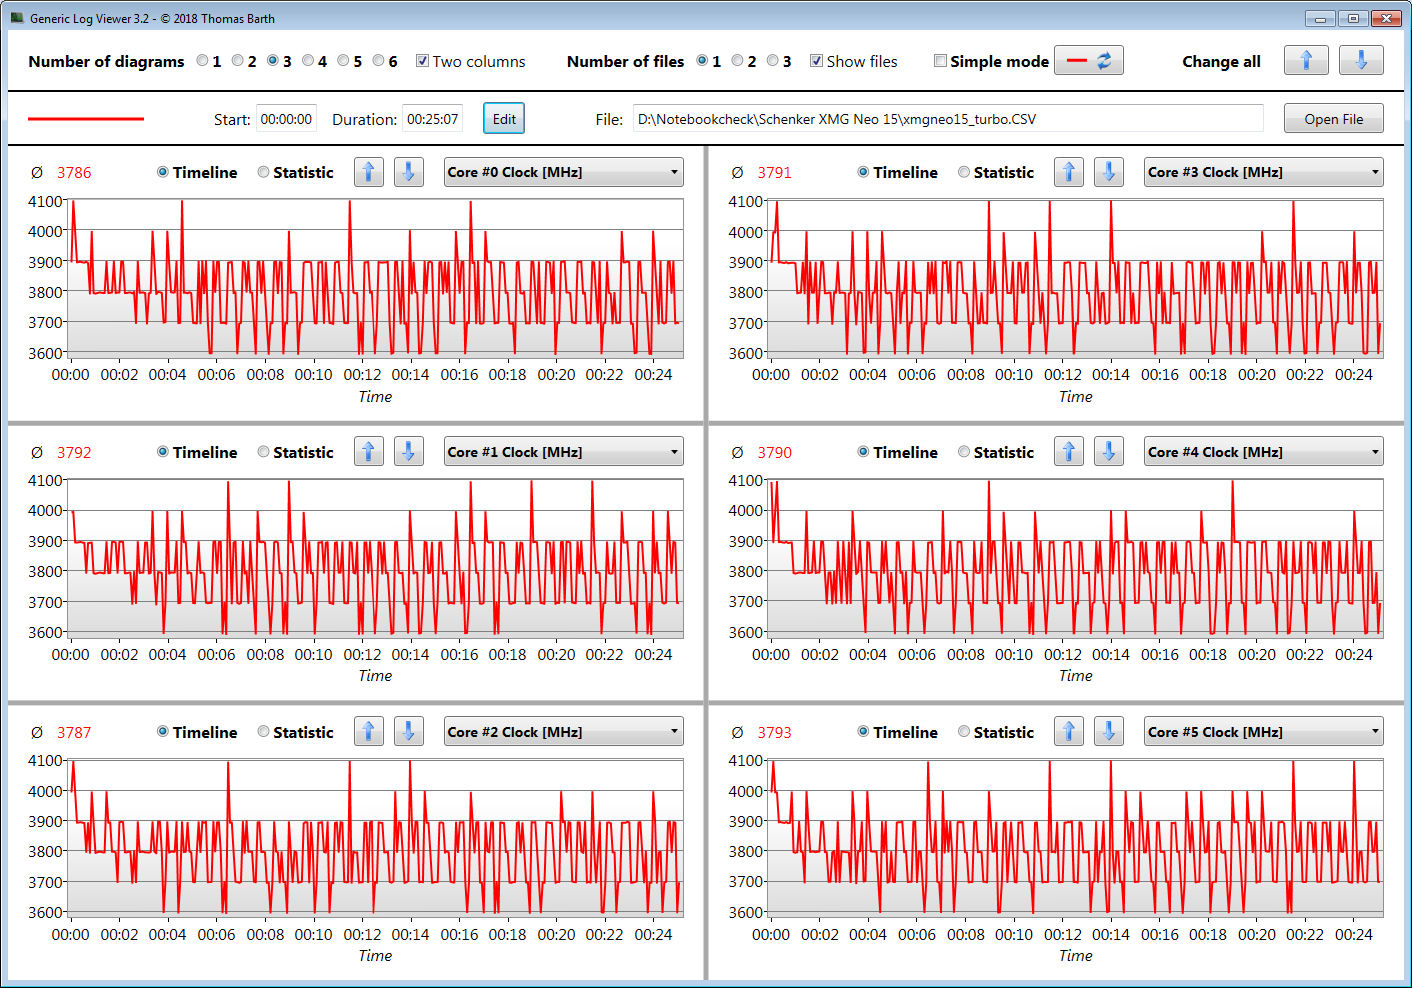
The Core i7-8750H (Coffee Lake) CPU can be found in many modern gaming notebooks. This mobile CPU is specified with a TDP of 45 W, runs at a base clock speed of 2.2 GHz, and can turbo boost up to 3.9 GHz on all six cores, 4 GHz on four cores, or 4.1 GHz on up to two cores.
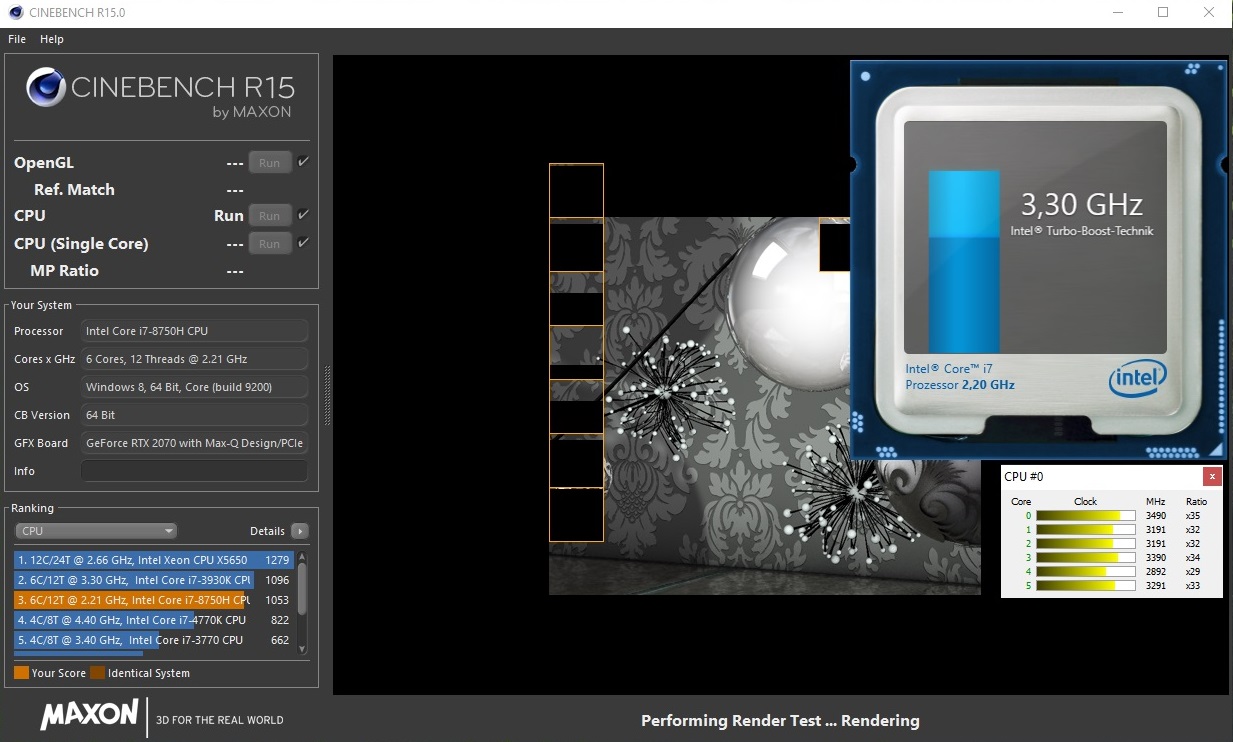
During our Cinebench multi-thread test the CPU ran at between 2.5 and 3.9 GHz (3.9 GHz with fan turbo activated). The single thread benchmarks were performed at between 3.9 and 4.1 GHz regardless of fan turbo setting. On battery, the CPU ran at 2.8-2.9 GHz (multi-thread) and 2.7-4.1 GHz (single thread).
We run Cinebench R15 multi-thread in a 30-minute loop in order to determine long-term turbo boost frequencies on mains. The scores dropped continuously between the first and fourth iteration but remained consistent afterwards, and settled at around 960-1,000 points. CPU turbo was applied throughout the test albeit only slightly. As such, the XMG Neo performed worse than its own predecessor that was equipped with the same CPU.
With fan turbo activated the CPU ran at higher clock speeds, and the results were much more akin to the Gigabyte Aero 15-X9.
| Cinebench R15 | |
| CPU Single 64Bit | |
| Average of class Gaming (188.8 - 350, n=103, last 2 years) | |
| Acer Predator Triton 500 | |
| MSI GS65 8RF-019DE Stealth Thin | |
| Razer Blade 15 RTX 2070 Max-Q | |
| Schenker XMG Neo 15 Turing | |
| Schenker XMG Neo 15 Turing (Lüfter-Turbo) | |
| Schenker XMG Neo 15 | |
| Asus Zephyrus S GX531GS | |
| Gigabyte Aero 15-X9 | |
| CPU Multi 64Bit | |
| Average of class Gaming (1578 - 6330, n=102, last 2 years) | |
| Schenker XMG Neo 15 Turing (Lüfter-Turbo) | |
| Gigabyte Aero 15-X9 | |
| Schenker XMG Neo 15 | |
| Asus Zephyrus S GX531GS | |
| Schenker XMG Neo 15 Turing | |
| MSI GS65 8RF-019DE Stealth Thin | |
| Acer Predator Triton 500 | |
| Razer Blade 15 RTX 2070 Max-Q | |
| Cinebench R10 | |
| Rendering Single 32Bit | |
| Average of class Gaming (7457 - 12575, n=9, last 2 years) | |
| Schenker XMG Neo 15 Turing | |
| Gigabyte Aero 15-X9 | |
| Rendering Multiple CPUs 32Bit | |
| Average of class Gaming (42932 - 102066, n=9, last 2 years) | |
| Gigabyte Aero 15-X9 | |
| Schenker XMG Neo 15 Turing | |
| Cinebench R20 | |
| CPU (Single Core) | |
| Average of class Gaming (622 - 913, n=103, last 2 years) | |
| Schenker XMG Neo 15 Turing | |
| CPU (Multi Core) | |
| Average of class Gaming (4029 - 16433, n=103, last 2 years) | |
| Schenker XMG Neo 15 Turing | |
| Geekbench 3 | |
| 32 Bit Multi-Core Score | |
| Schenker XMG Neo 15 Turing | |
| Gigabyte Aero 15-X9 | |
| 32 Bit Single-Core Score | |
| Schenker XMG Neo 15 Turing | |
| Gigabyte Aero 15-X9 | |
| Geekbench 4.4 | |
| 64 Bit Multi-Core Score | |
| Average of class Gaming (89200 - 101054, n=3, last 2 years) | |
| Schenker XMG Neo 15 Turing | |
| Gigabyte Aero 15-X9 | |
| 64 Bit Single-Core Score | |
| Average of class Gaming (9335 - 9775, n=3, last 2 years) | |
| Schenker XMG Neo 15 Turing | |
| Gigabyte Aero 15-X9 | |
| Mozilla Kraken 1.1 - Total | |
| Gigabyte Aero 15-X9 (Edge 44) | |
| Razer Blade 15 RTX 2070 Max-Q (Edge 44.17763.1.0) | |
| Schenker XMG Neo 15 Turing (Edge 44) | |
| Average of class Gaming (391 - 590, n=100, last 2 years) | |
| Octane V2 - Total Score | |
| Average of class Gaming (93292 - 139447, n=26, last 2 years) | |
| Schenker XMG Neo 15 Turing (Edge 44) | |
| Gigabyte Aero 15-X9 (Edge 44) | |
| Razer Blade 15 RTX 2070 Max-Q (Edge 44.17763.1.0) | |
| JetStream 1.1 - 1.1 Total | |
| Average of class Gaming (549 - 647, n=2, last 2 years) | |
| Razer Blade 15 RTX 2070 Max-Q (Edge 44.17763.1.0) | |
| Schenker XMG Neo 15 Turing (Edge 44) | |
| Gigabyte Aero 15-X9 (Edge 44) | |
* ... smaller is better
System Performance
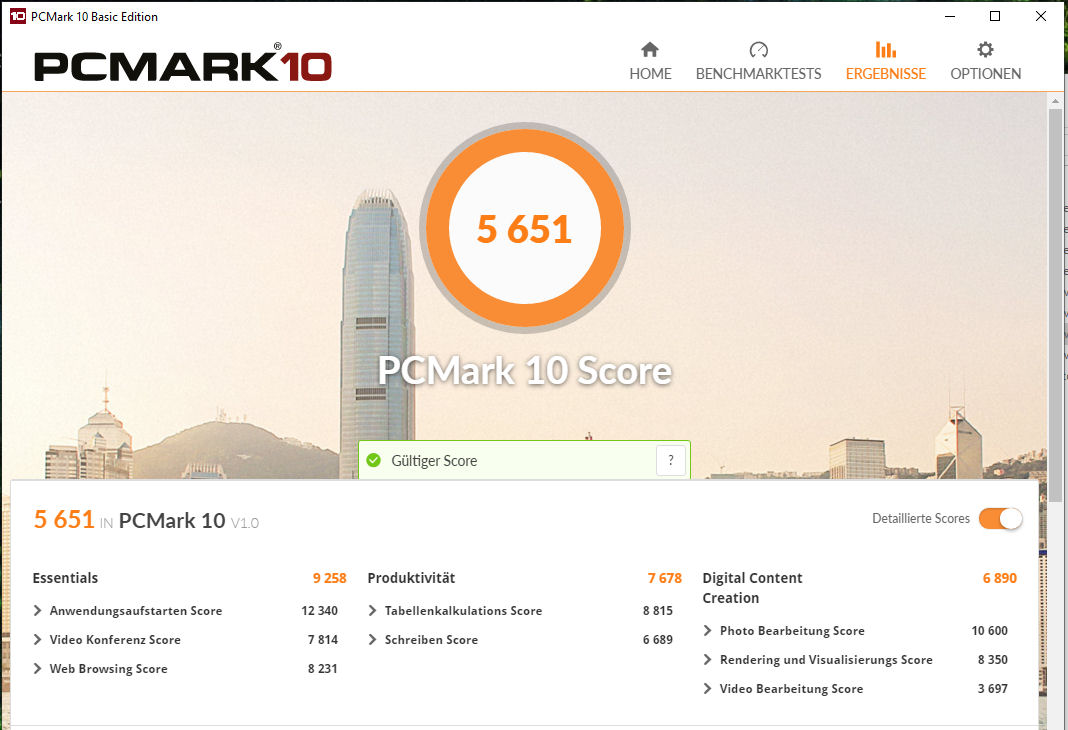
Overall system performance was very smooth, and we did not encounter any problems. The 15.6-inch notebook was very fast, and its Core i7-8750H should run applications other than games perfectly fine for many years to come. The dedicated GPU allows you to run games. The PCMark benchmark results were very good.
| PCMark 7 Score | 6802 points | |
| PCMark 8 Home Score Accelerated v2 | 4582 points | |
| PCMark 8 Creative Score Accelerated v2 | 5288 points | |
| PCMark 8 Work Score Accelerated v2 | 5679 points | |
| PCMark 10 Score | 5651 points | |
Help | ||
Storage Devices
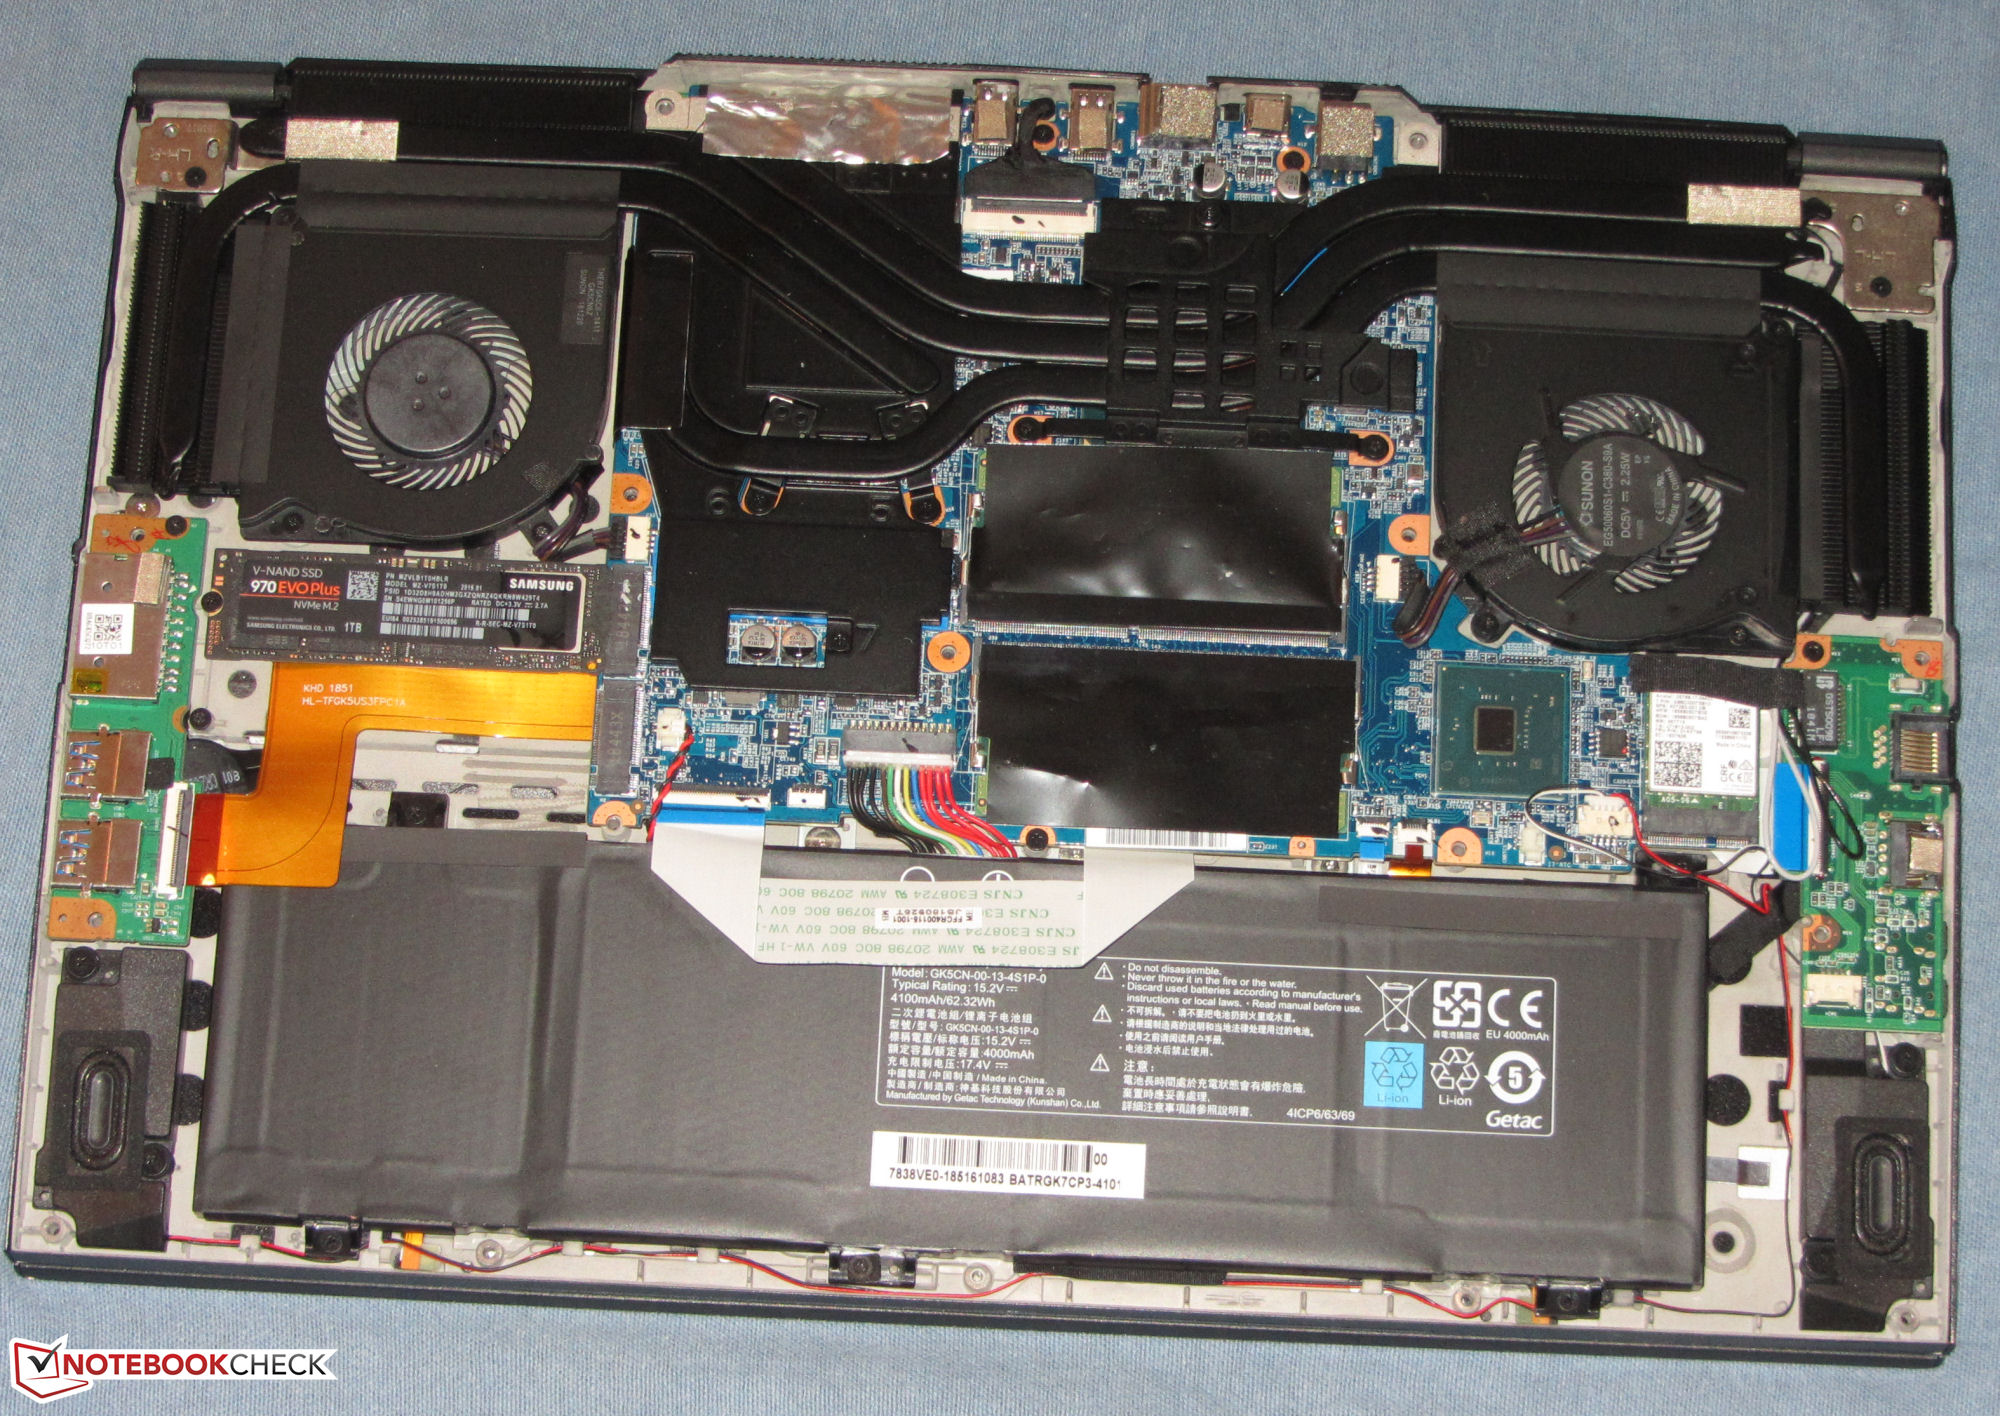
The 1 TB M.2-2280 NVMe SSD was made by Samsung. Thanks to its PCIe 3.0 x4 connection it was very fast. 896 GB were available to the user after first boot. The rest is taken up by the Windows installation and the recovery partition.
Storage can be expanded. A second M.2-2280 slot can be found on the inside. Both M.2 slots support RAID 0/1. The predecessor also featured a single 2.5-inch hard disk drive bay, which the current model lacks. Instead, this space is taken up by the larger internal battery.

| Schenker XMG Neo 15 Turing Samsung SSD 970 EVO Plus 1TB | Gigabyte Aero 15-X9 Intel SSD 760p SSDPEKKW010T8 | Razer Blade 15 RTX 2070 Max-Q Samsung SSD PM981 MZVLB512HAJQ | Acer Predator Triton 500 2x WDC PC SN720 SDAPNTW-256G-1014 (RAID 0) | MSI GS65 8RF-019DE Stealth Thin Samsung SSD PM981 MZVLB512HAJQ | Asus Zephyrus S GX531GS WDC PC SN520 SDAPNUW-512G | Schenker XMG Neo 15 Samsung SSD 970 Pro 1TB | |
|---|---|---|---|---|---|---|---|
| CrystalDiskMark 5.2 / 6 | 9% | 4% | 25% | 4% | -11% | 8% | |
| Write 4K (MB/s) | 92.5 | 97.1 5% | 93.9 2% | 93.6 1% | 95.3 3% | 98.2 6% | 100.5 9% |
| Read 4K (MB/s) | 40.45 | 53.7 33% | 40.56 0% | 38.82 -4% | 40.13 -1% | 39.43 -3% | 48.64 20% |
| Write Seq (MB/s) | 1197 | 1526 27% | 1468 23% | 2455 105% | 1883 57% | 1386 16% | 1456 22% |
| Read Seq (MB/s) | 1018 | 2020 98% | 1540 51% | 2107 107% | 1322 30% | 1100 8% | 1278 26% |
| Write 4K Q32T1 (MB/s) | 288.6 | 285.6 -1% | 293.5 2% | 298.7 3% | 309.9 7% | 270.3 -6% | 298.1 3% |
| Read 4K Q32T1 (MB/s) | 332 | 321.8 -3% | 346 4% | 338.7 2% | 353.7 7% | 340.3 3% | 348.7 5% |
| Write Seq Q32T1 (MB/s) | 3317 | 1533 -54% | 1941 -41% | 2902 -13% | 1919 -42% | 1454 -56% | 2742 -17% |
| Read Seq Q32T1 (MB/s) | 3515 | 2351 -33% | 3266 -7% | 3536 1% | 2466 -30% | 1681 -52% | 3389 -4% |
GPU Performance
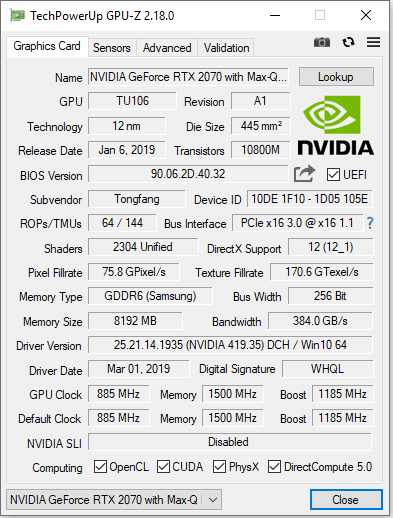
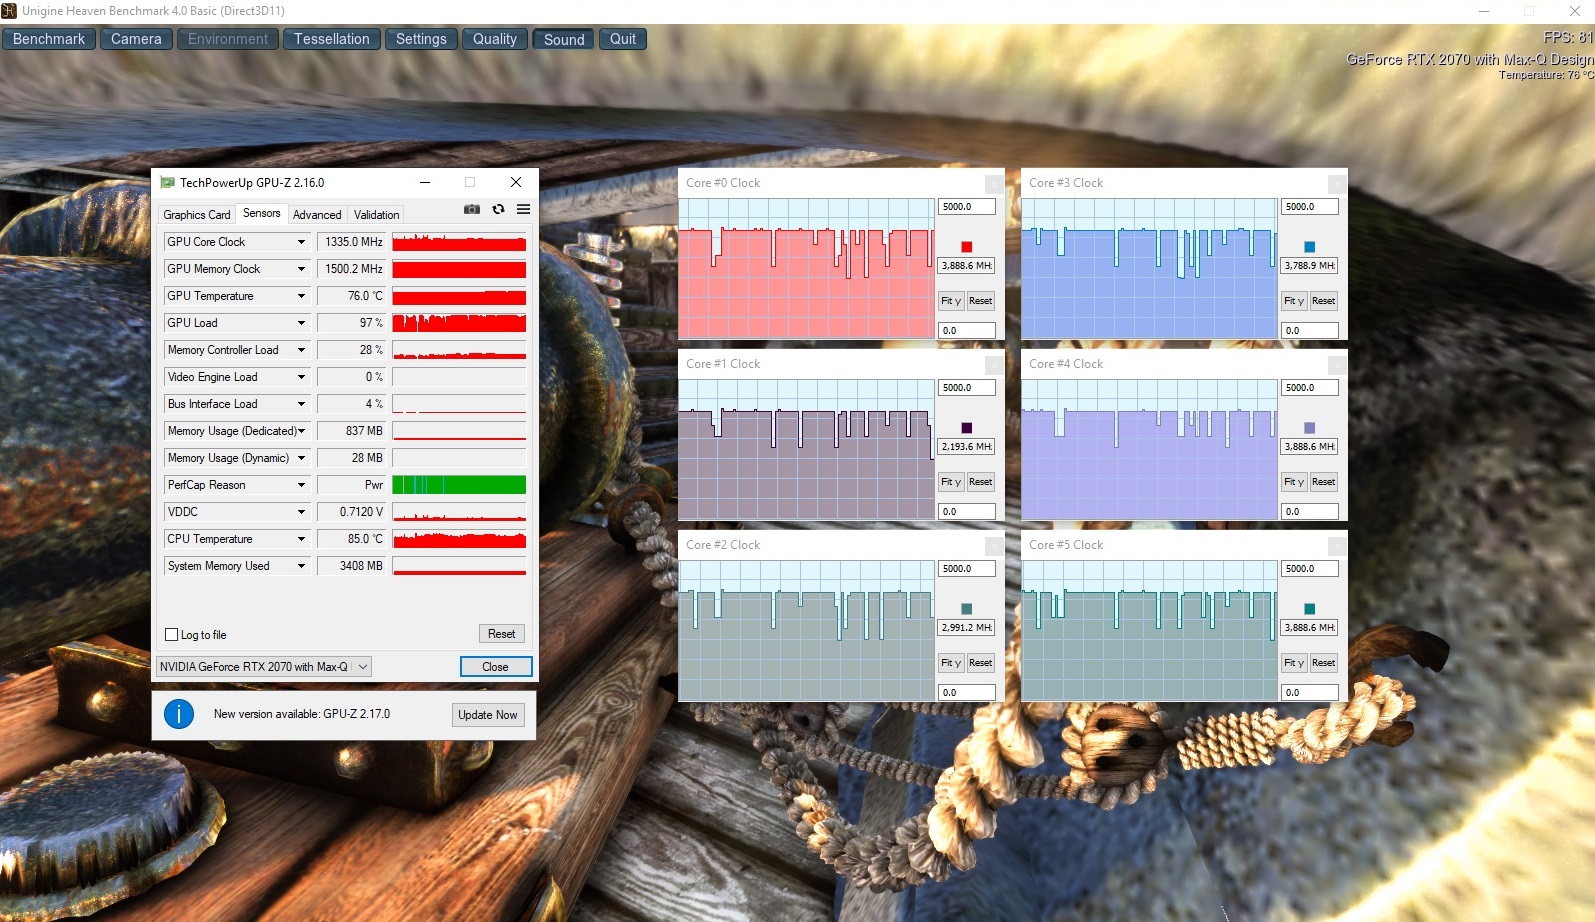
The XMG Neo 15 features a GeForce RTX 2070 Max-Q. This more energy efficient version of the regular RTX 2070 is primarily aimed at thin and light notebooks. Our particular review unit ran at short burst clocks speeds of up to 1,770 MHz, and an average long-term clock speed of 1,335 MHz. The GPU has access to 8 GB of fast GDDR6 VRAM.
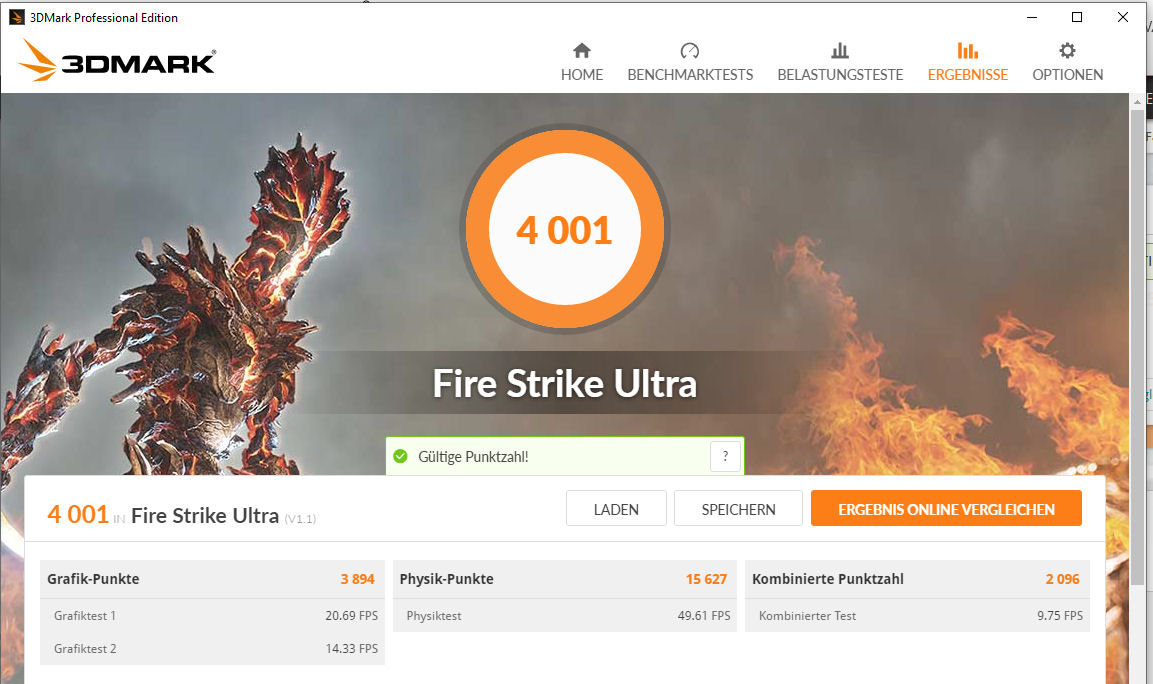
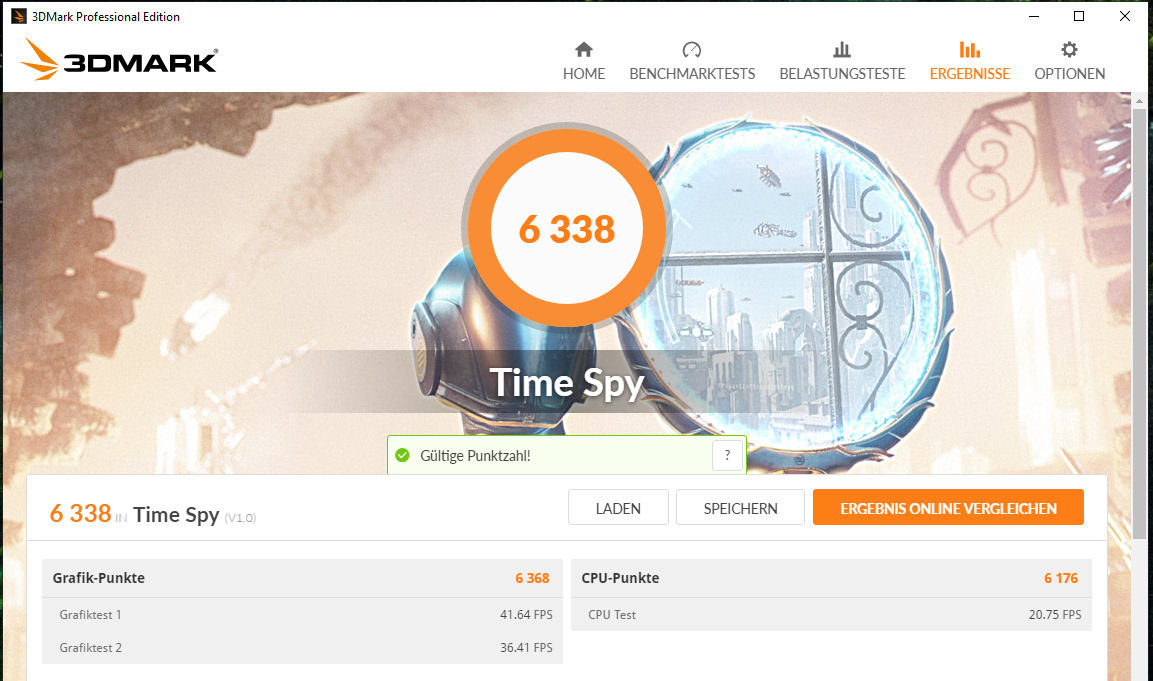
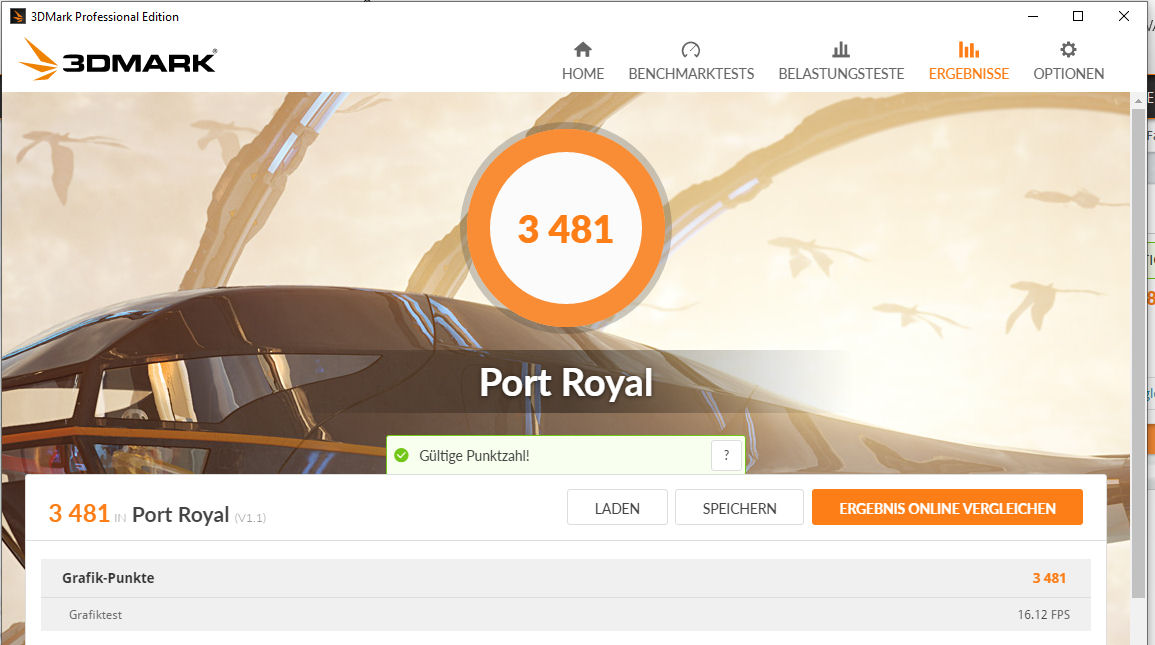
In 3DMark, the results were at a level expected of this GPU. The XMG Neo performed almost identically to its direct competitors, the Gigabyte Aero 15-X9 and the Razer Blade 15. The performance gains with activated fan turbo mode were negligible and not worth mentioning.
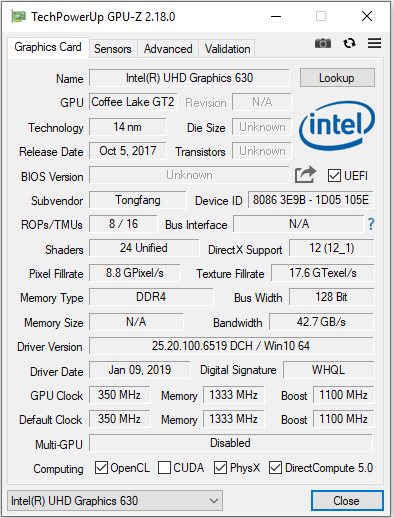
Thanks to support for Nvidia Optimus, the laptop also utilizes Intel's integrated UHD Graphics 630 GPU to save energy.
| 3DMark 06 Standard Score | 35375 points | |
| 3DMark 11 Performance | 17617 points | |
| 3DMark Ice Storm Standard Score | 110428 points | |
| 3DMark Cloud Gate Standard Score | 35086 points | |
| 3DMark Fire Strike Score | 15180 points | |
| 3DMark Time Spy Score | 6338 points | |
Help | ||
| 3DMark | |
| 1920x1080 Fire Strike Graphics | |
| Average of class Gaming (18629 - 62849, n=112, last 2 years) | |
| Razer Blade 15 RTX 2070 Max-Q | |
| Gigabyte Aero 15-X9 | |
| Schenker XMG Neo 15 Turing (Lüfter-Turbo) | |
| Schenker XMG Neo 15 Turing | |
| MSI GS65 8RF-019DE Stealth Thin | |
| Schenker XMG Neo 15 | |
| 2560x1440 Time Spy Graphics | |
| Average of class Gaming (6387 - 26212, n=112, last 2 years) | |
| Razer Blade 15 RTX 2070 Max-Q | |
| Gigabyte Aero 15-X9 | |
| Schenker XMG Neo 15 Turing (Lüfter-Turbo) | |
| Schenker XMG Neo 15 Turing | |
| 3DMark 11 - 1280x720 Performance GPU | |
| Average of class Gaming (21841 - 80022, n=103, last 2 years) | |
| Acer Predator Triton 500 | |
| Razer Blade 15 RTX 2070 Max-Q | |
| Gigabyte Aero 15-X9 | |
| Schenker XMG Neo 15 Turing (Lüfter-Turbo) | |
| Schenker XMG Neo 15 Turing | |
| MSI GS65 8RF-019DE Stealth Thin | |
| Asus Zephyrus S GX531GS | |
| Schenker XMG Neo 15 | |
Gaming Performance
We did not experience any problems running games. This particular combination of CPU and GPU was more than capable of running all games from our database. All current games ran smoothly in FHD with high or even maximum details. Resolutions higher than FHD are supported on external displays, however they will require reduced details.
Just like in 3DMark, the XMG Neo 15 was outperformed slightly by the Razer Blade 15. The reason why the Gigabyte Aero 15-X9 performed worse than the other two can be found in its single channel RAM interface. Adding a second RAM module to the Aero 15 would almost certainly improve performance to a level akin to its competitors.
| The Witcher 3 - 1920x1080 Ultra Graphics & Postprocessing (HBAO+) | |
| Average of class Gaming (104.7 - 240, n=7, last 2 years) | |
| Acer Predator Triton 500 | |
| Razer Blade 15 RTX 2070 Max-Q | |
| Schenker XMG Neo 15 Turing | |
| Gigabyte Aero 15-X9 | |
| MSI GS65 8RF-019DE Stealth Thin | |
| Asus Zephyrus S GX531GS | |
| Schenker XMG Neo 15 | |
| BioShock Infinite - 1920x1080 Ultra Preset, DX11 (DDOF) | |
| Razer Blade 15 RTX 2070 Max-Q | |
| Schenker XMG Neo 15 Turing | |
| Gigabyte Aero 15-X9 | |
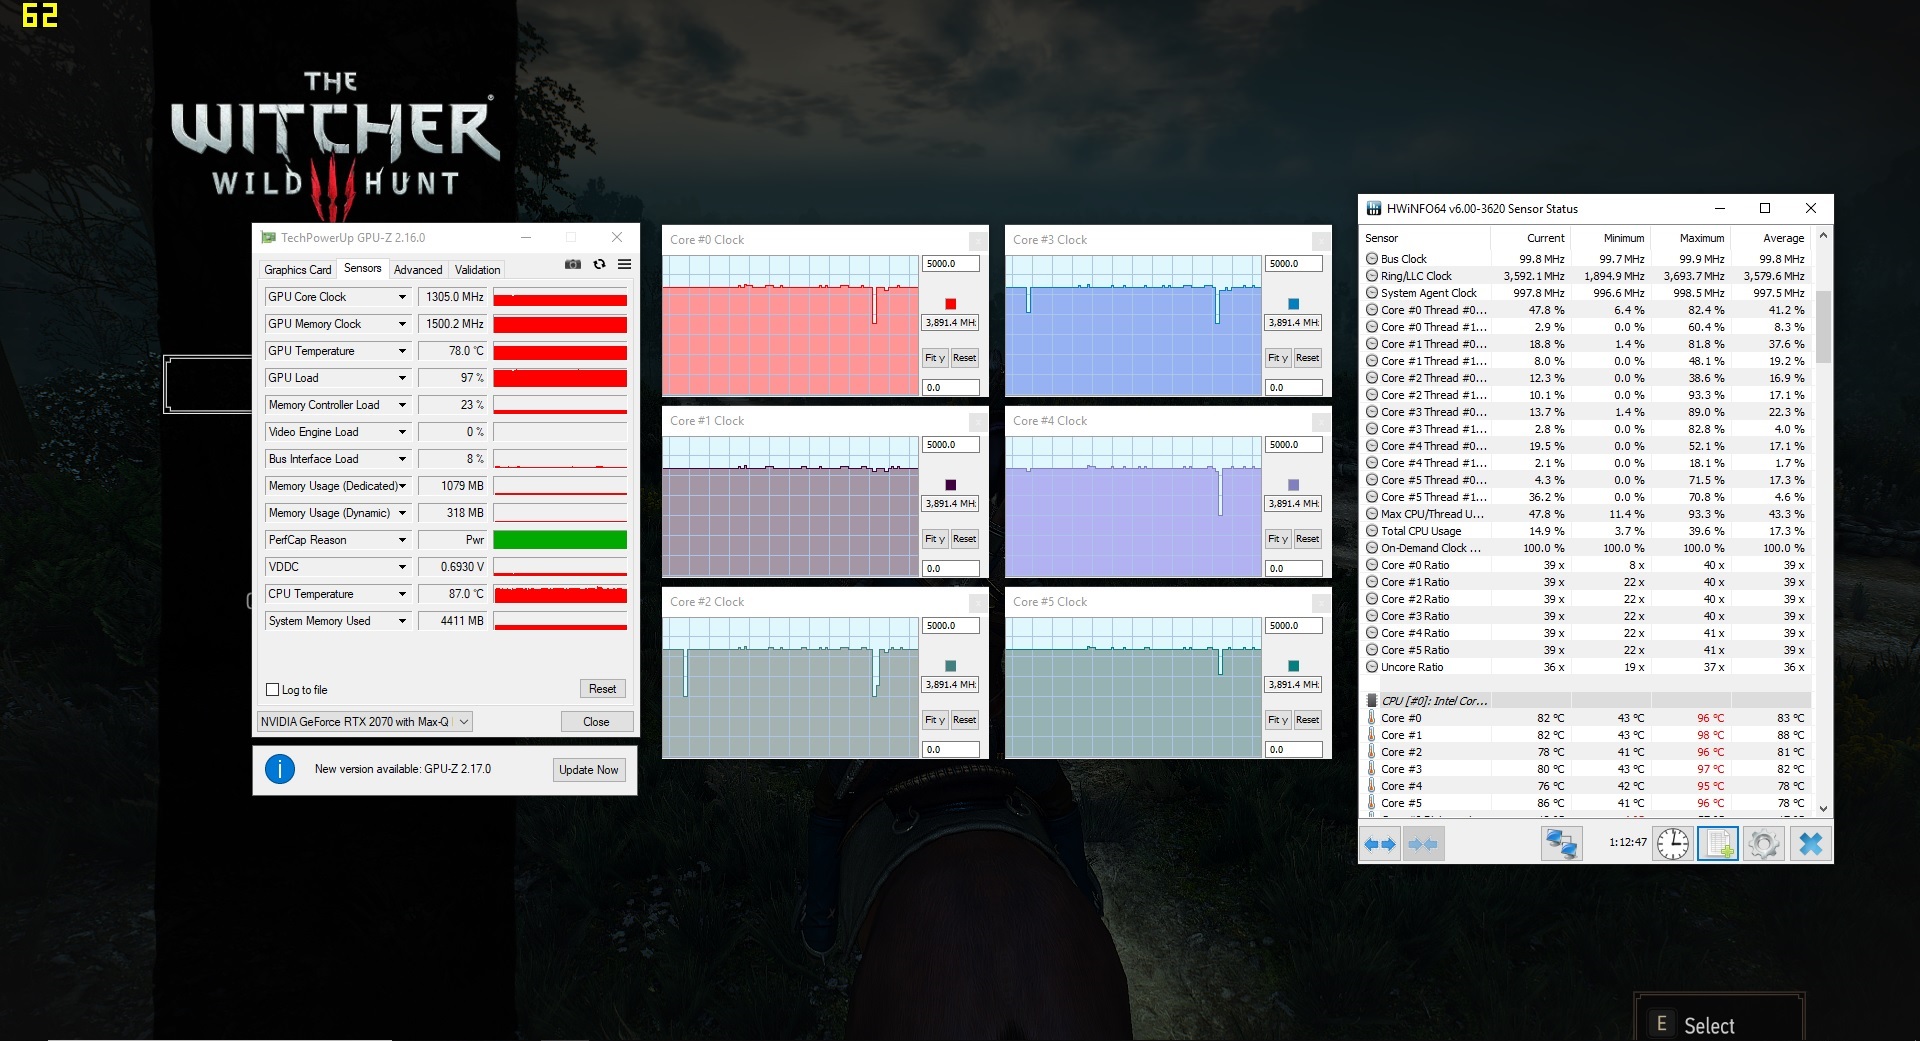
We run Witcher 3 in a 60-minute loop in FHD with maximum details in order to determine the effects of long-term gaming load on frame rates. The avatar remains stationary throughout the entire test. Frame rates dropped slightly over time but remained well within a more than acceptable scope. We found no evidence of frame drops.
| low | med. | high | ultra | |
|---|---|---|---|---|
| BioShock Infinite (2013) | 299.4 | 248.7 | 248 | 148.5 |
| The Witcher 3 (2015) | 269.2 | 200.6 | 121.7 | 63.8 |
| X-Plane 11.11 (2018) | 97.2 | 84.6 | 72.7 | |
| Apex Legends (2019) | 143.7 | 143 | 115.9 | 115.8 |
| Far Cry New Dawn (2019) | 108 | 92 | 88 | 79 |
| Metro Exodus (2019) | 123.2 | 77.2 | 57.3 | 46.6 |
| Anthem (2019) | 100.8 | 87.8 | 77.9 | 73.6 |
| Dirt Rally 2.0 (2019) | 221.2 | 150.8 | 126.7 | 72.3 |
| The Division 2 (2019) | 146 | 107 | 88 | 70 |
Emissions
System Noise
In theory, the XMG Neo can be completely silent when idle. However, this rarely ever happened, and the fans were running at their lowest speed setting producing an acceptable level of noise most of the time. Things go awry under load very quickly, though. With up to 55 dB(A) during our stress test and around 53 dB(A) while running our Witcher 3 test the device was very loud. Thus, a headset is an absolute must when gaming. With fan turbo activated the fan ran at full speed.
Despite its high level of noise the Neo 15 was slightly less obtrusive than its predecessor. On the other hand, the Aero 15-X9 - which features the same CPU and GPU - is living proof that a more quiet gaming experience is possible.
Noise level
| Idle |
| 30 / 32 / 35 dB(A) |
| Load |
| 47 / 55 dB(A) |
 | ||
30 dB silent 40 dB(A) audible 50 dB(A) loud |
||
min: | ||
| Schenker XMG Neo 15 Turing GeForce RTX 2070 Max-Q, i7-8750H | Gigabyte Aero 15-X9 GeForce RTX 2070 Max-Q, i7-8750H | Razer Blade 15 RTX 2070 Max-Q GeForce RTX 2070 Max-Q, i7-8750H | Acer Predator Triton 500 GeForce RTX 2080 Max-Q, i7-8750H | MSI GS65 8RF-019DE Stealth Thin GeForce GTX 1070 Max-Q, i7-8750H | Asus Zephyrus S GX531GS GeForce GTX 1070 Max-Q, i7-8750H | Schenker XMG Neo 15 GeForce GTX 1060 Mobile, i7-8750H | |
|---|---|---|---|---|---|---|---|
| Noise | 4% | 14% | 6% | 8% | -3% | -4% | |
| off / environment * (dB) | 30 | 30 -0% | 28.8 4% | 29 3% | 30 -0% | 29 3% | 29 3% |
| Idle Minimum * (dB) | 30 | 32 -7% | 28.8 4% | 30 -0% | 30 -0% | 33 -10% | 29 3% |
| Idle Average * (dB) | 32 | 34 -6% | 28.8 10% | 32 -0% | 31 3% | 34 -6% | 35 -9% |
| Idle Maximum * (dB) | 35 | 36 -3% | 29.4 16% | 34 3% | 34 3% | 40 -14% | 40 -14% |
| Load Average * (dB) | 47 | 42 11% | 35.7 24% | 44 6% | 43 9% | 47 -0% | 50 -6% |
| Witcher 3 ultra * (dB) | 53 | 44 17% | 42.5 20% | 46 13% | 42 21% | 51 4% | 53 -0% |
| Load Maximum * (dB) | 55 | 48 13% | 45 18% | 47 15% | 44 20% | 53 4% | 58 -5% |
* ... smaller is better
Temperature
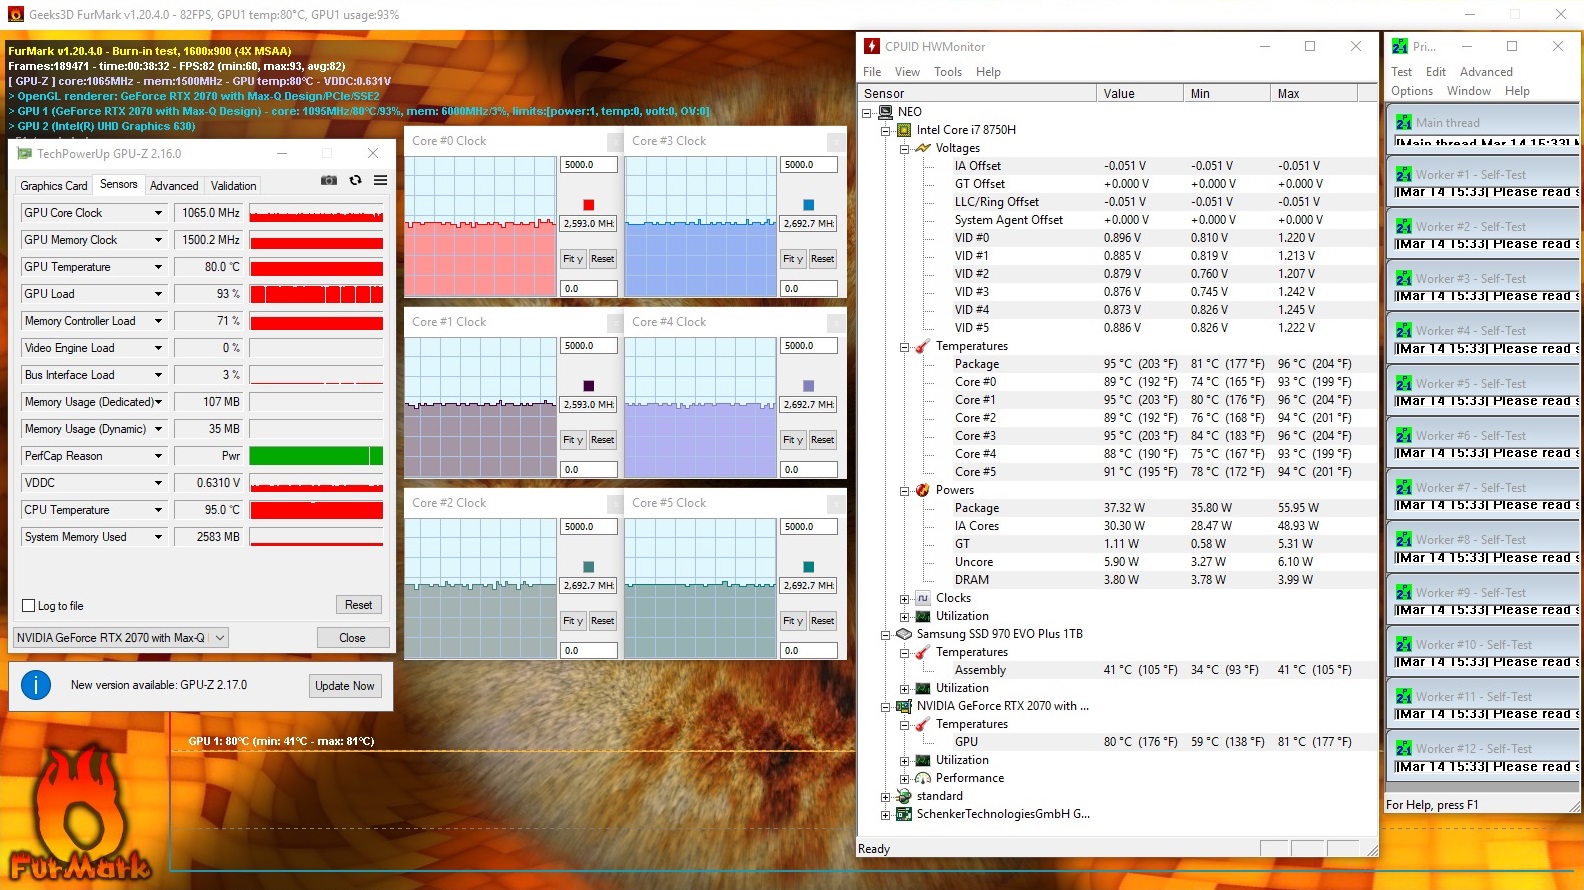
Our stress test (Prime95 and FurMark running simultaneously for at least one hour) was completed differently on mains and on battery. When connected to power, the CPU and GPU ran at 2.6-2.7 GHz and 1,065 MHz, respectively. On battery, the CPU ran at just 2.3 GHz while the GPU was throttled to its base clock speed of just 300 MHz.
Temperatures were very high under load, and we found several spots of more than 60 °C (140 °F). They were somewhat lower when running Witcher 3 for a full hour in FHD with maximum details but still significantly too high to be used on the lap. When idle, temperatures were hardly perceptible and low.
Keep in mind that our stress test is an extreme load scenario that is rarely ever encountered in the real world. We use this test in order to test for potential stability issues.
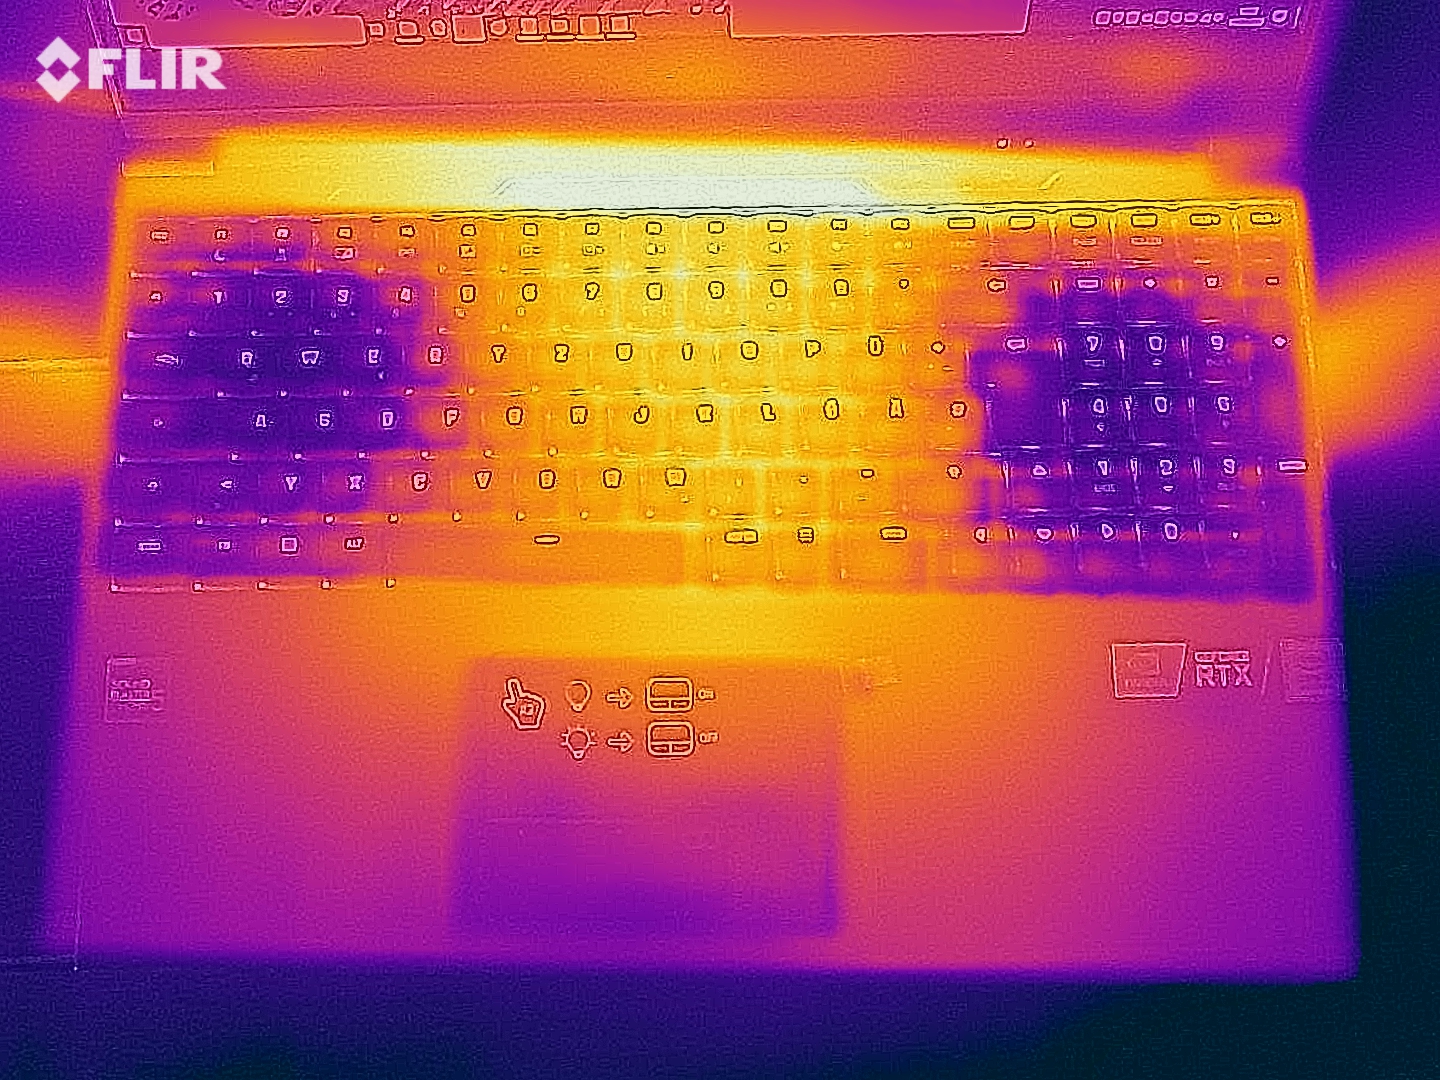
(-) The maximum temperature on the upper side is 58 °C / 136 F, compared to the average of 40.4 °C / 105 F, ranging from 21.2 to 68.8 °C for the class Gaming.
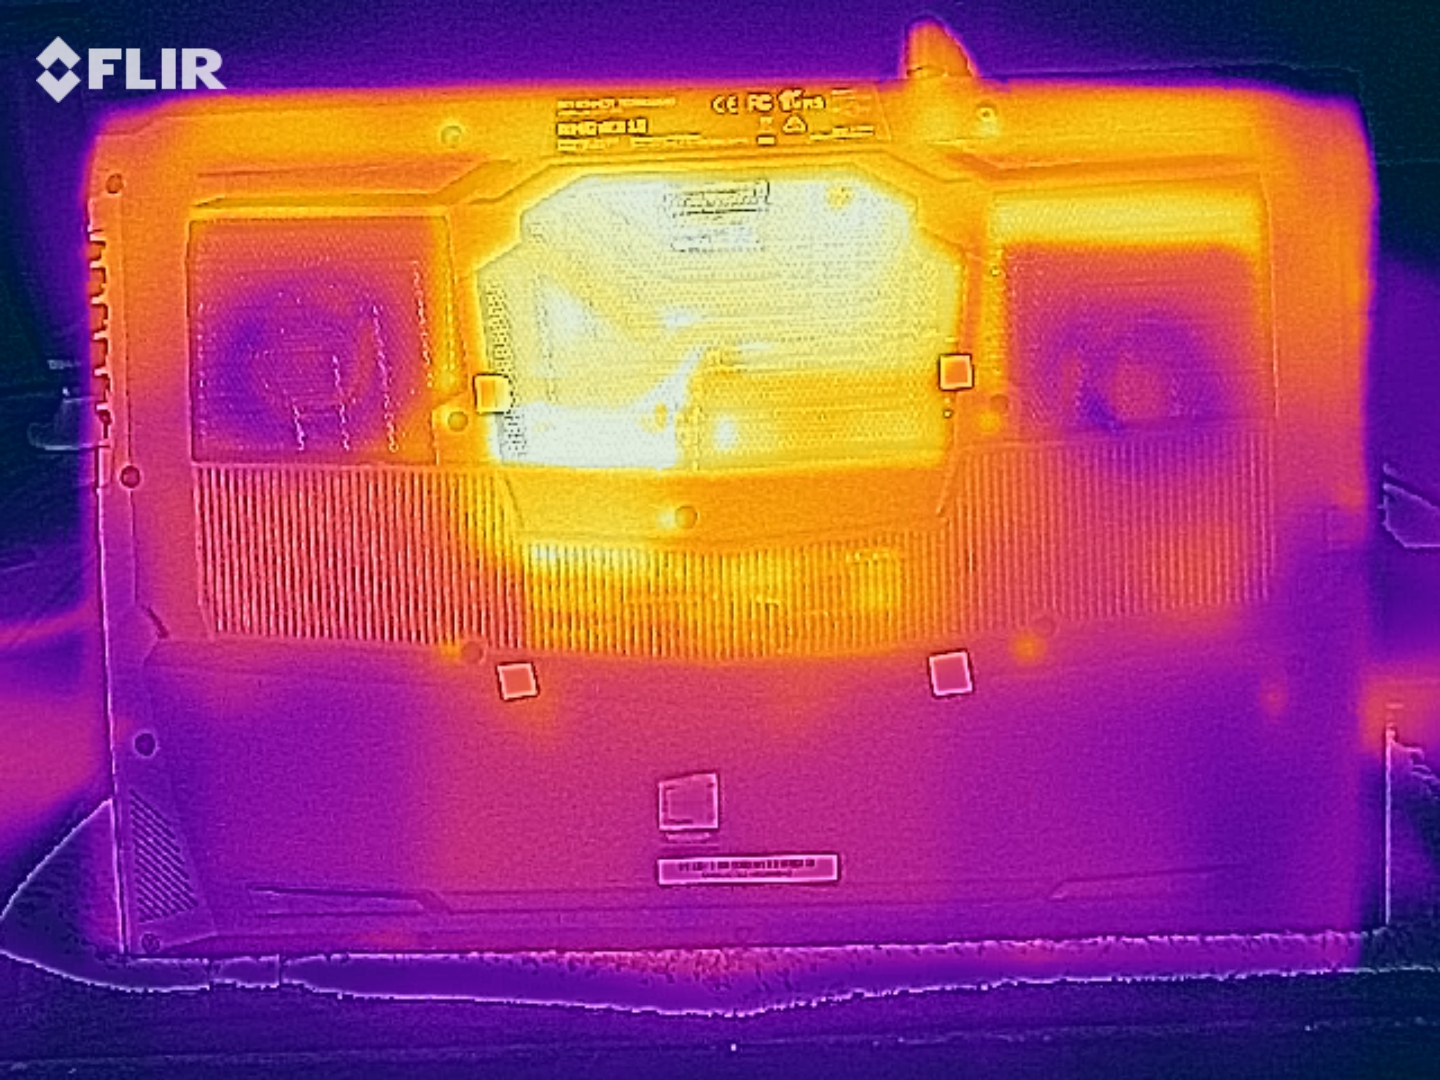
(-) The bottom heats up to a maximum of 68 °C / 154 F, compared to the average of 43.2 °C / 110 F
(+) In idle usage, the average temperature for the upper side is 27.7 °C / 82 F, compared to the device average of 33.9 °C / 93 F.
(-) Playing The Witcher 3, the average temperature for the upper side is 43.8 °C / 111 F, compared to the device average of 33.9 °C / 93 F.
(-) The palmrests and touchpad can get very hot to the touch with a maximum of 42 °C / 107.6 F.
(-) The average temperature of the palmrest area of similar devices was 28.8 °C / 83.8 F (-13.2 °C / -23.8 F).
| Schenker XMG Neo 15 Turing GeForce RTX 2070 Max-Q, i7-8750H | Gigabyte Aero 15-X9 GeForce RTX 2070 Max-Q, i7-8750H | Razer Blade 15 RTX 2070 Max-Q GeForce RTX 2070 Max-Q, i7-8750H | Acer Predator Triton 500 GeForce RTX 2080 Max-Q, i7-8750H | MSI GS65 8RF-019DE Stealth Thin GeForce GTX 1070 Max-Q, i7-8750H | Asus Zephyrus S GX531GS GeForce GTX 1070 Max-Q, i7-8750H | Schenker XMG Neo 15 GeForce GTX 1060 Mobile, i7-8750H | |
|---|---|---|---|---|---|---|---|
| Heat | 7% | 18% | 4% | 16% | 6% | 4% | |
| Maximum Upper Side * (°C) | 58 | 56 3% | 49 16% | 49 16% | 49 16% | 54 7% | 56 3% |
| Maximum Bottom * (°C) | 68 | 66 3% | 49 28% | 58 15% | 63 7% | 60 12% | 68 -0% |
| Idle Upper Side * (°C) | 30 | 27 10% | 25.4 15% | 33 -10% | 24 20% | 30 -0% | 28 7% |
| Idle Bottom * (°C) | 31 | 27 13% | 27.2 12% | 33 -6% | 25 19% | 30 3% | 29 6% |
* ... smaller is better
Speakers
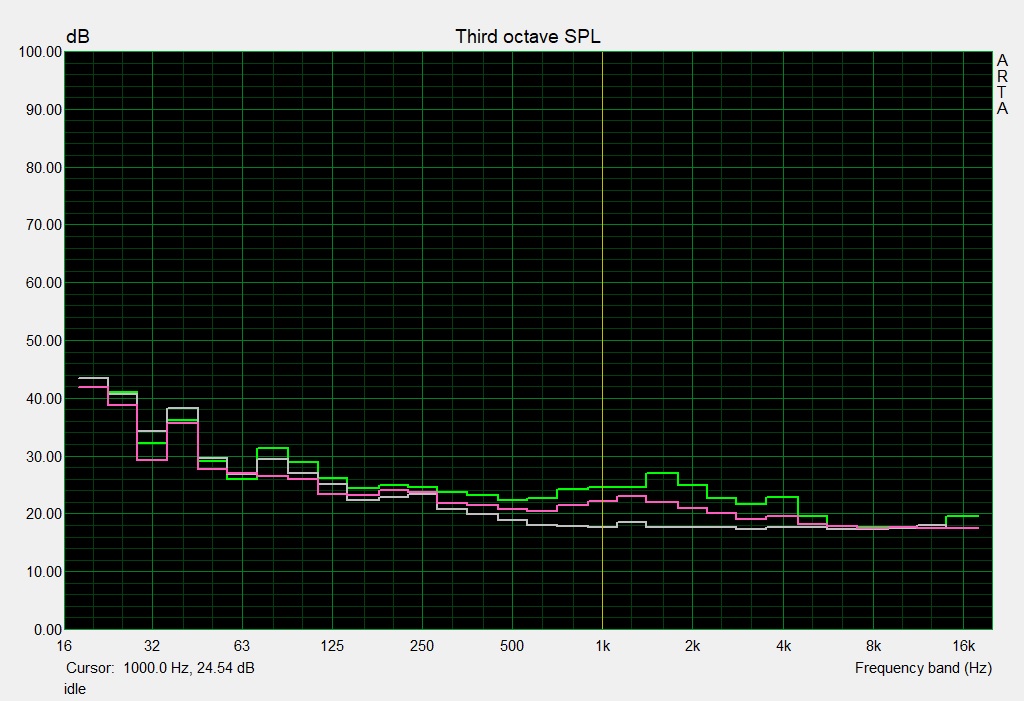
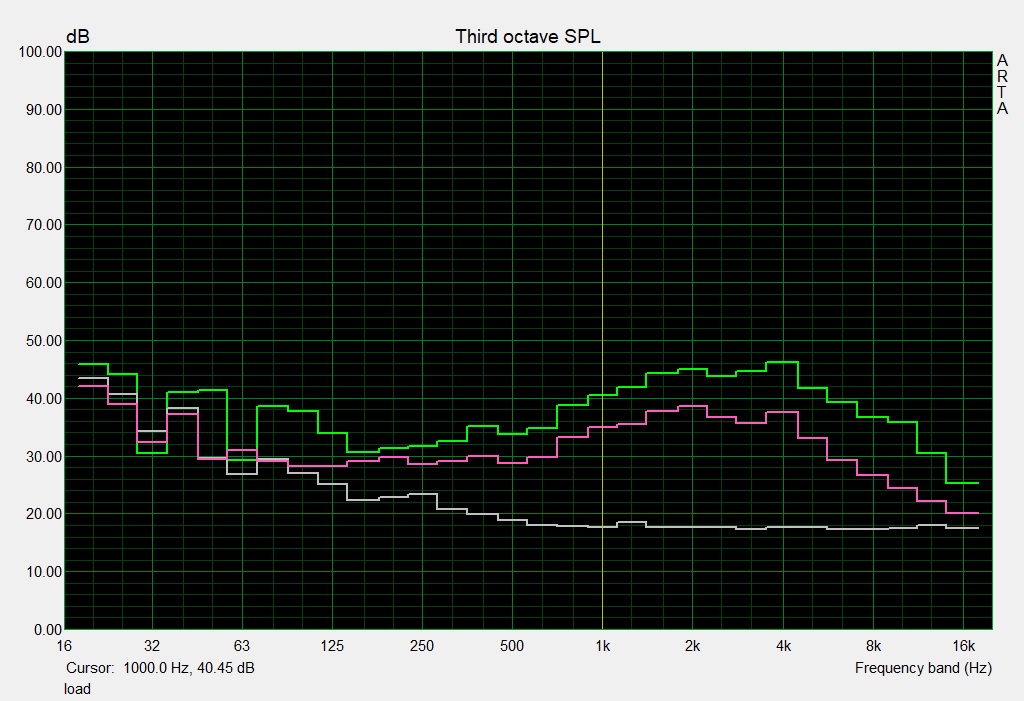
Schenker XMG Neo 15 Turing audio analysis
(±) | speaker loudness is average but good (74 dB)
Bass 100 - 315 Hz
(-) | nearly no bass - on average 19.6% lower than median
(-) | bass is not linear (16% delta to prev. frequency)
Mids 400 - 2000 Hz
(±) | higher mids - on average 6.2% higher than median
(+) | mids are linear (3.8% delta to prev. frequency)
Highs 2 - 16 kHz
(+) | balanced highs - only 1.8% away from median
(±) | linearity of highs is average (7.6% delta to prev. frequency)
Overall 100 - 16.000 Hz
(±) | linearity of overall sound is average (22.3% difference to median)
Compared to same class
» 80% of all tested devices in this class were better, 6% similar, 14% worse
» The best had a delta of 6%, average was 18%, worst was 132%
Compared to all devices tested
» 65% of all tested devices were better, 6% similar, 29% worse
» The best had a delta of 4%, average was 23%, worst was 134%
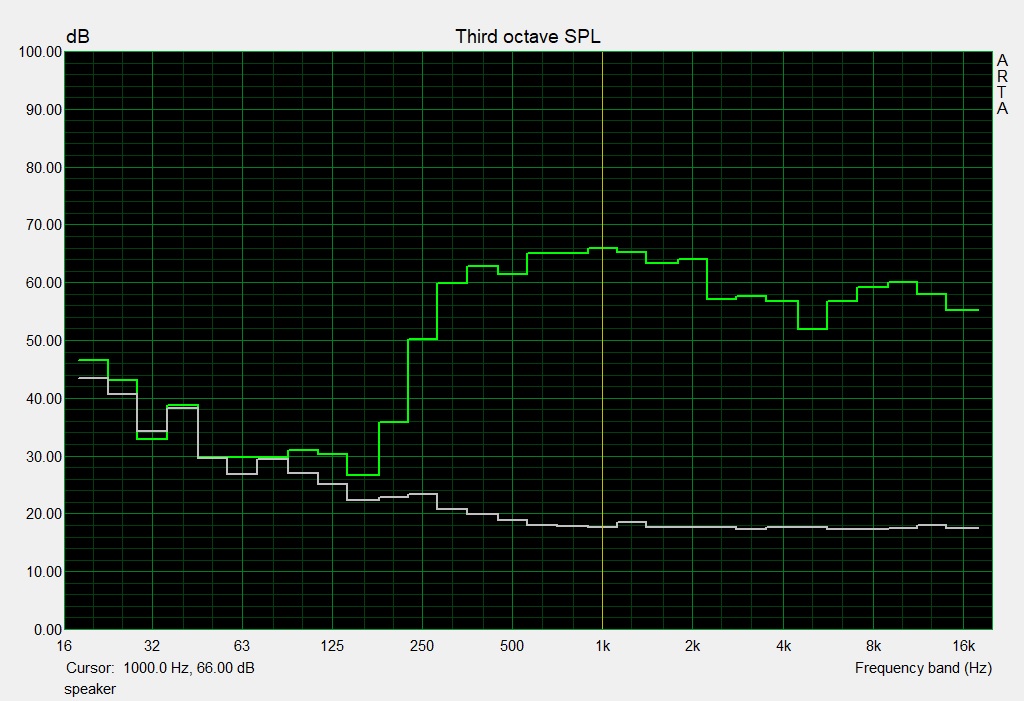
Gigabyte Aero 15-X9 audio analysis
(±) | speaker loudness is average but good (81 dB)
Bass 100 - 315 Hz
(±) | reduced bass - on average 14% lower than median
(±) | linearity of bass is average (13.7% delta to prev. frequency)
Mids 400 - 2000 Hz
(±) | higher mids - on average 6.2% higher than median
(±) | linearity of mids is average (7.9% delta to prev. frequency)
Highs 2 - 16 kHz
(+) | balanced highs - only 4.4% away from median
(±) | linearity of highs is average (9.7% delta to prev. frequency)
Overall 100 - 16.000 Hz
(±) | linearity of overall sound is average (17.5% difference to median)
Compared to same class
» 49% of all tested devices in this class were better, 12% similar, 39% worse
» The best had a delta of 6%, average was 18%, worst was 132%
Compared to all devices tested
» 34% of all tested devices were better, 8% similar, 58% worse
» The best had a delta of 4%, average was 23%, worst was 134%
Energy Management
Power Consumption
Maximum power consumption when idle was 21 W, and thus at the same level as other competitors such as the Gigabyte Aero 15-X9. The Razer Blade 15, equipped with the same CPU and GPU, was more efficient. Power consumption peaked at 183 W during our stress test, and dropped to just 135 W when running Witcher 3. The power supply is rated at 180 W.
| Off / Standby | |
| Idle | |
| Load |
|
Key:
min: | |
| Schenker XMG Neo 15 Turing GeForce RTX 2070 Max-Q, i7-8750H | Gigabyte Aero 15-X9 GeForce RTX 2070 Max-Q, i7-8750H | Razer Blade 15 RTX 2070 Max-Q GeForce RTX 2070 Max-Q, i7-8750H | Acer Predator Triton 500 GeForce RTX 2080 Max-Q, i7-8750H | MSI GS65 8RF-019DE Stealth Thin GeForce GTX 1070 Max-Q, i7-8750H | Asus Zephyrus S GX531GS GeForce GTX 1070 Max-Q, i7-8750H | Schenker XMG Neo 15 GeForce GTX 1060 Mobile, i7-8750H | |
|---|---|---|---|---|---|---|---|
| Power Consumption | -5% | 5% | -21% | 11% | -26% | 10% | |
| Idle Minimum * (Watt) | 13 | 16 -23% | 10.4 20% | 16 -23% | 7 46% | 17 -31% | 10 23% |
| Idle Average * (Watt) | 16 | 18 -13% | 14.6 9% | 22 -38% | 11 31% | 20 -25% | 13 19% |
| Idle Maximum * (Watt) | 21 | 23 -10% | 16.3 22% | 32 -52% | 20 5% | 29 -38% | 18 14% |
| Load Average * (Watt) | 84 | 88 -5% | 88.5 -5% | 89 -6% | 98 -17% | 112 -33% | 95 -13% |
| Witcher 3 ultra * (Watt) | 135 | 120 11% | 155.4 -15% | 147 -9% | 132 2% | 152 -13% | 114 16% |
| Load Maximum * (Watt) | 183 | 167 9% | 182.4 -0% | 173 5% | 182 1% | 211 -15% | 179 2% |
* ... smaller is better
Battery Life
In our real-world Wi-Fi test, the XMG Neo 15 ran for 5:04 hours. In this test, we simulate a load scenario typical for browsing the web. The power plan is set to Balanced and display brightness normalized to 150 nits. In our video test, the notebook powered off after just 4:52 hours. In this test, we run the Big Buck Bunny short film (H.264, FHD) in a loop with the power plan set to Power Saver, all wireless communication modules disabled, and display brightness once again normalized to 150 nits.
Overall, the XMG Neo 15 ran a bit longer than its predecessor thanks to its larger battery (62.3 Wh vs. 46.7 Wh). In order to fit this larger battery, the 2.5-inch hard disk drive slot had to be sacrificed, and a hard disk can thus no longer be installed in the notebook.
| Schenker XMG Neo 15 Turing GeForce RTX 2070 Max-Q, i7-8750H, 62.3 Wh | Gigabyte Aero 15-X9 GeForce RTX 2070 Max-Q, i7-8750H, 94.24 Wh | Razer Blade 15 RTX 2070 Max-Q GeForce RTX 2070 Max-Q, i7-8750H, 80 Wh | Acer Predator Triton 500 GeForce RTX 2080 Max-Q, i7-8750H, 82 Wh | MSI GS65 8RF-019DE Stealth Thin GeForce GTX 1070 Max-Q, i7-8750H, 82 Wh | Asus Zephyrus S GX531GS GeForce GTX 1070 Max-Q, i7-8750H, 50 Wh | Schenker XMG Neo 15 GeForce GTX 1060 Mobile, i7-8750H, 46.7 Wh | |
|---|---|---|---|---|---|---|---|
| Battery runtime | 41% | 29% | -23% | 12% | -51% | 0% | |
| Reader / Idle (h) | 6.9 | 9.2 33% | 11.4 65% | 5.6 -19% | 8.5 23% | 3.6 -48% | 6.7 -3% |
| H.264 (h) | 4.9 | 6.1 24% | 5.9 20% | 4.8 -2% | |||
| WiFi v1.3 (h) | 5.1 | 6.4 25% | 6.5 27% | 3.2 -37% | 6 18% | 2.6 -49% | 4.4 -14% |
| Load (h) | 1.6 | 2.9 81% | 1.5 -6% | 1.4 -13% | 1.4 -13% | 0.7 -56% | 1.9 19% |
Pros
Cons
Verdict
The Schenker XMG Neo 15 remains a fairly compact 15.6-inch gaming notebook and is thus a direct competitor to the Gigabyte Aero 15-X9 and the Razer Blade 15. It ticks all the boxes for a gaming notebook. All current games can be enjoyed smoothly on its matte FHD display in high or even maximum details.
Schenker’s XMG Neo 15 is a well-made thin gaming notebook. However, it cannot keep up with its direct competitors, the Aero 15-X9 and the Blade 15.
It also features an RGB-backlit mechanical keyboard as well as a 144 Hz IPS panel with wide viewing angles, short response times, a high contrast ratio, and a decent color accuracy out of the box. That said, display brightness should be higher, especially considering the Neo’s price.
The system ran very smoothly and fast thanks to its blazingly fast NVMe SSD. The SSD can be swapped if necessary. A secondary M.2-2280 slot is available, however the 2.5-inch HDD slot is missing due to the larger internal battery. In return, battery life is slightly longer than before. Battery life was okay for a gaming notebook.
There are a few noteworthy drawbacks, though. For example, its very high temperatures and the wall of noise under load. That said, its competitors are not necessarily much better in these regards. Wi-Fi performance was sub-optimal, and the notebook lacked modern connectivity features such as Thunderbolt 3.
Schenker XMG Neo 15 Turing
- 04/09/2019 v6 (old)
Sascha Mölck
Price comparison

