Acer Predator Triton 500 (i7-8750H, RTX 2080 Max-Q) Laptop Review

Attentive readers might have already discovered the Triton 500 in our performance test of Nvidia's mobile Turing chips. After we already evaluated the gaming capabilities and the performance in the synthetic benchmarks in detail (see GPU page), we now run the full test.
With its slim case, the Triton 500 is targeting gamers who are fond of traveling and often carry along their notebook. The 15-inch device competes against other thin-and-light notebooks such as the MSI GS65 8RF, the Asus Zephyrus S GX531GS (each with a GTX 1070 Max-Q) and the new versions of the Razer Blade 15 and Gigabyte Aero 15 (each with an RTX 2070 Max-Q). Currently Acer does not offer the latter graphics card for the Triton 500, so buyers have to decide between the GeForce RTX 2060 and the significantly faster RTX 2080 Max-Q.
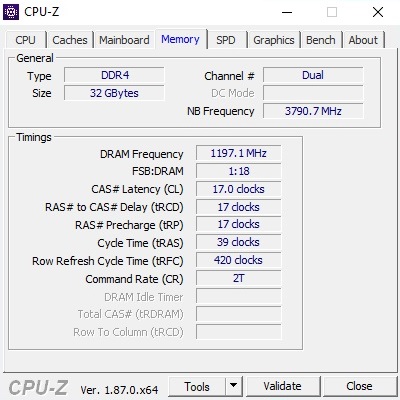
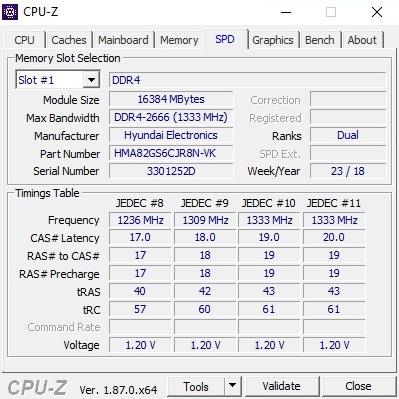
As processor, there is either the Core i5-8300H quad-code model or the Core i7-8750H hexa-core. While the working memory ranges between 8 and 16 GB DDR4-RAM, our US review unit was equipped with 32 GB RAM (however, this should not have any effect on the benchmarks and the evaluation). The storage solution of our test unit consisted of two M.2-SSDs in a RAID-0 configuration and a total capacity of 512 GB. As we expect for a current gaming notebook, there is also a G-Sync capable 144-Hz panel on board.
Case
While the Triton 700 from 2017, which also measured 15.6 inches, was only able to convince us to a limited extent with its wide display bezels and the unusual placement of the input devices, the Triton 500 offers a much better impression even at first glance. This begins with the extremely slim display bezels that reduce the footprint of the notebook from 39.3 x 26.6 cm (15.5 x 10.5 in) to 35.9 x 25.5 cm (14.1 x 10 in). Not only does this make the device look better, but it is also easier to carry.
In terms of the weight, instead of 2.39 kg (5.27 lb), the Triton 500 only weighs 2.14 kg (4.72 lb) which is also a relief on your arms. A small drawback of the slimming regimen is the mediocre stability. Particularly the lid turns out to be not very warp-resistant. However, this is a problem that various competitors also struggle with.
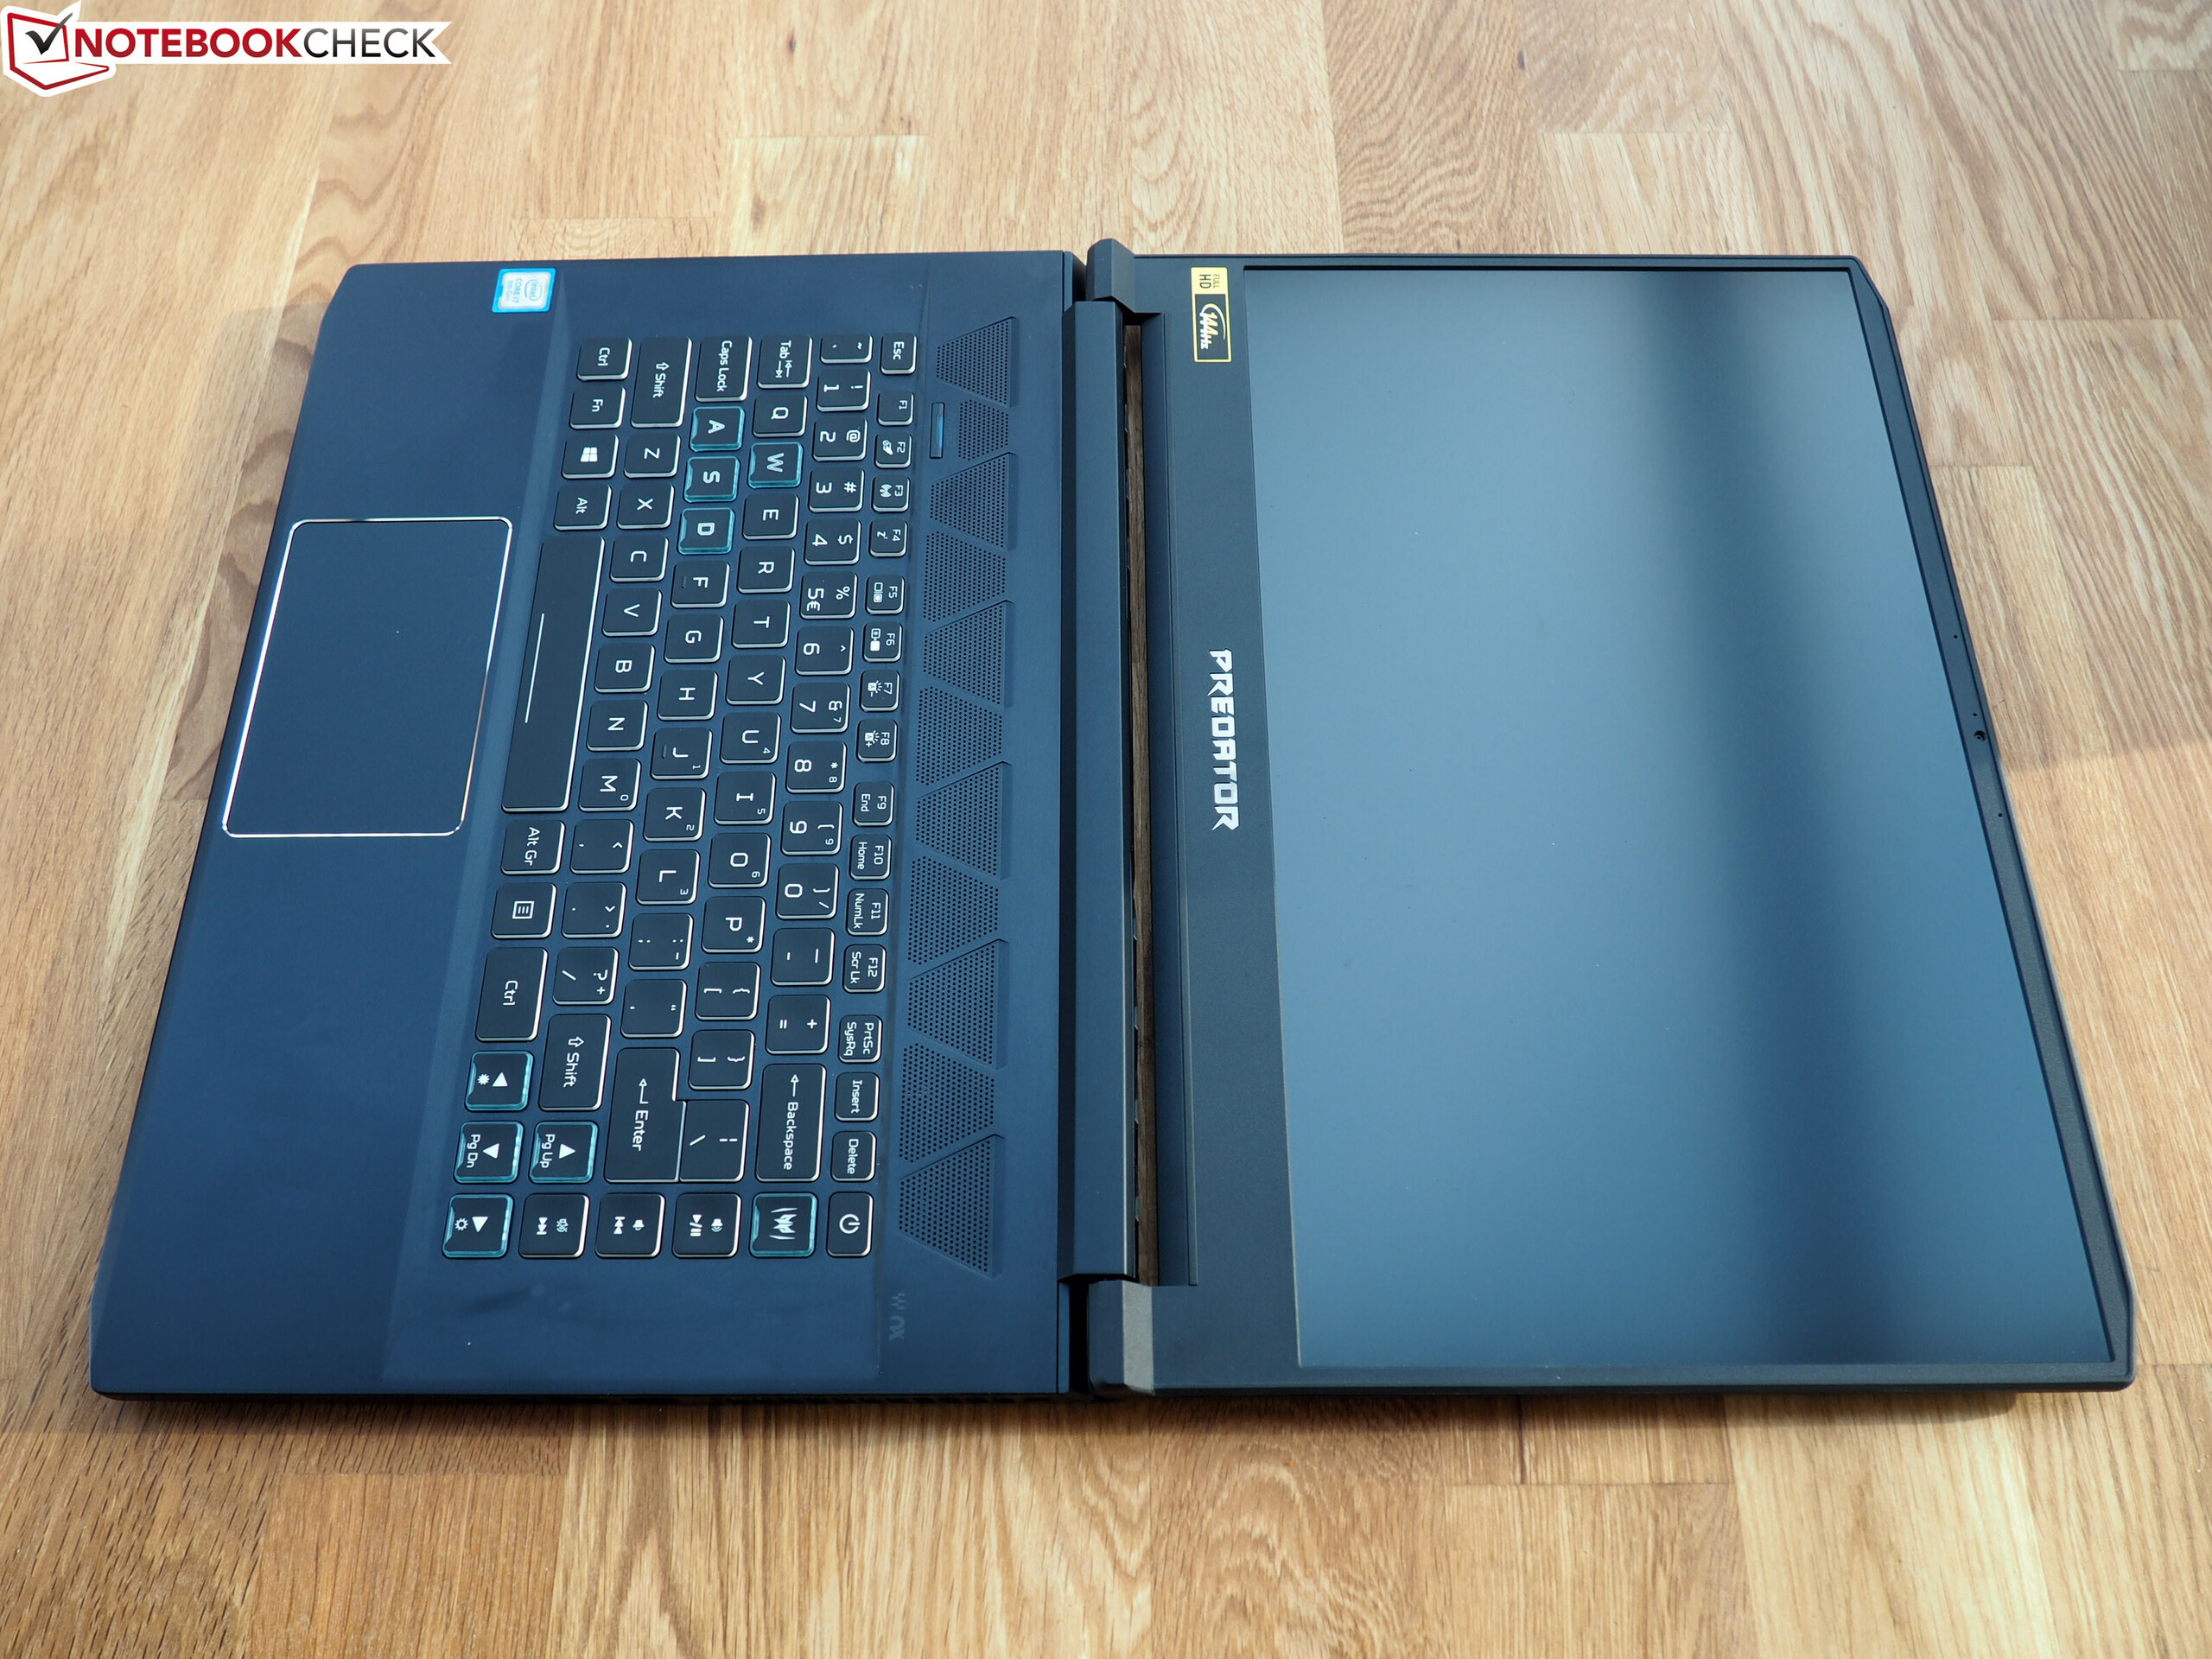
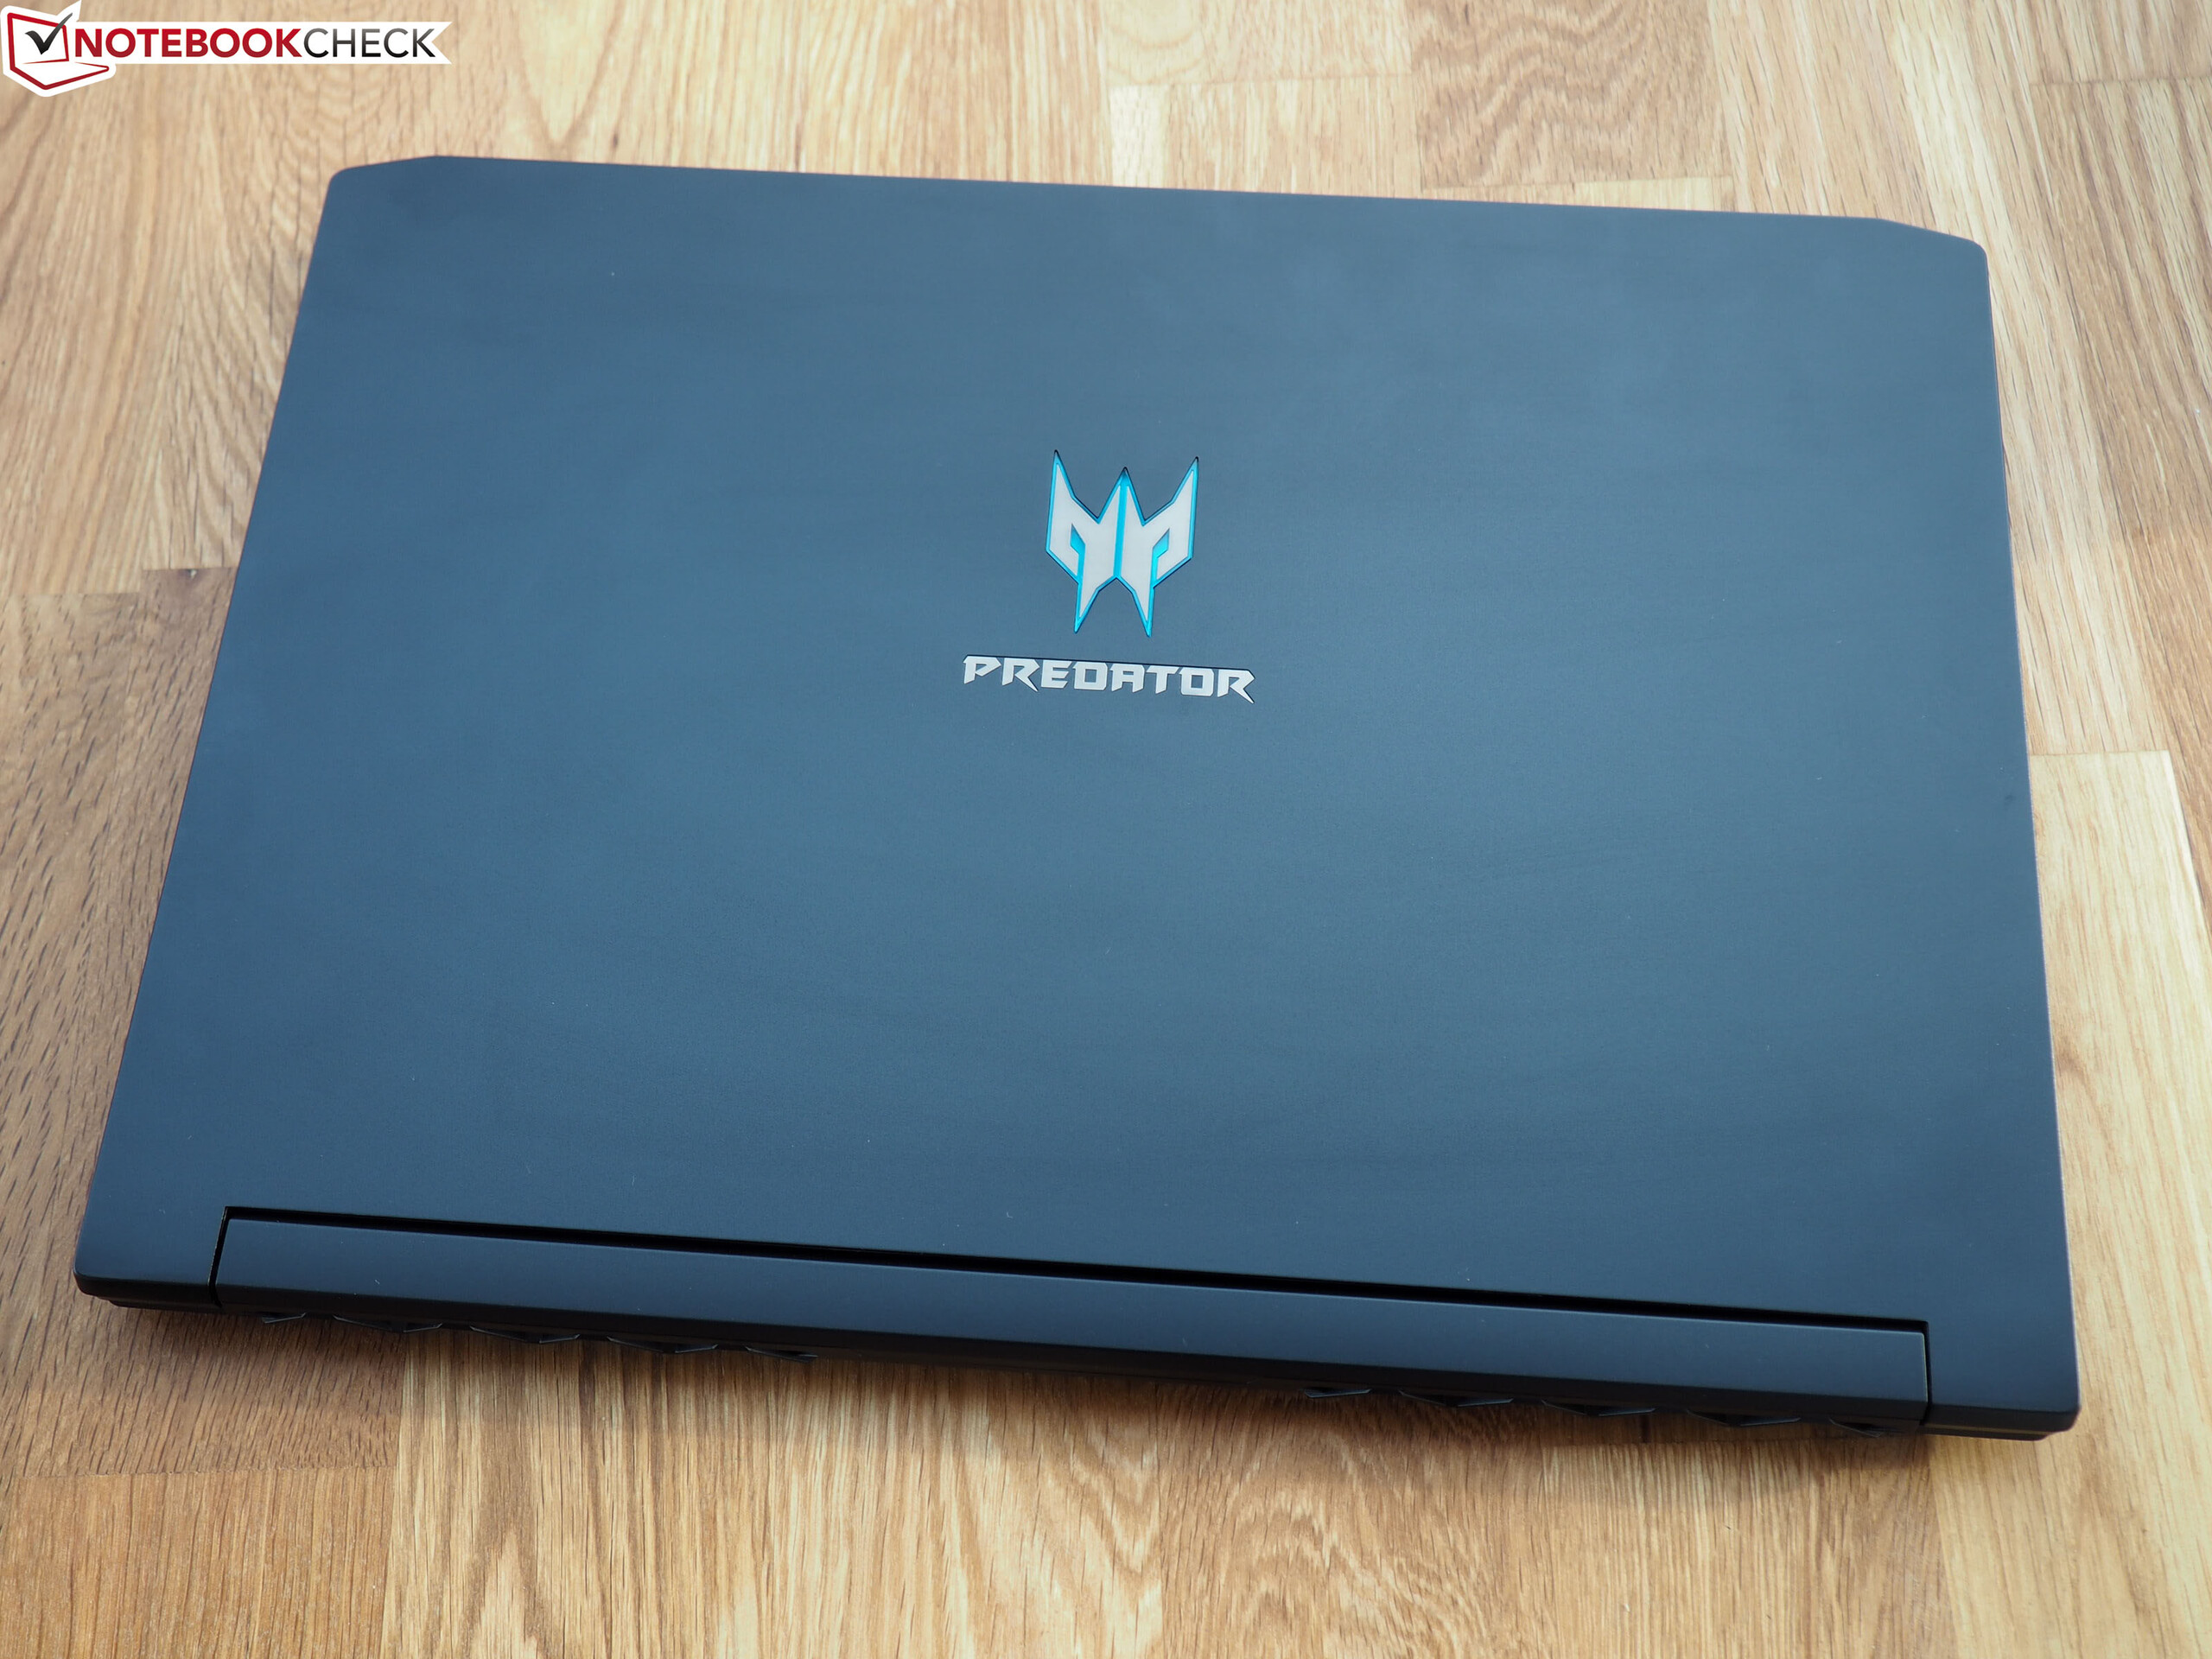
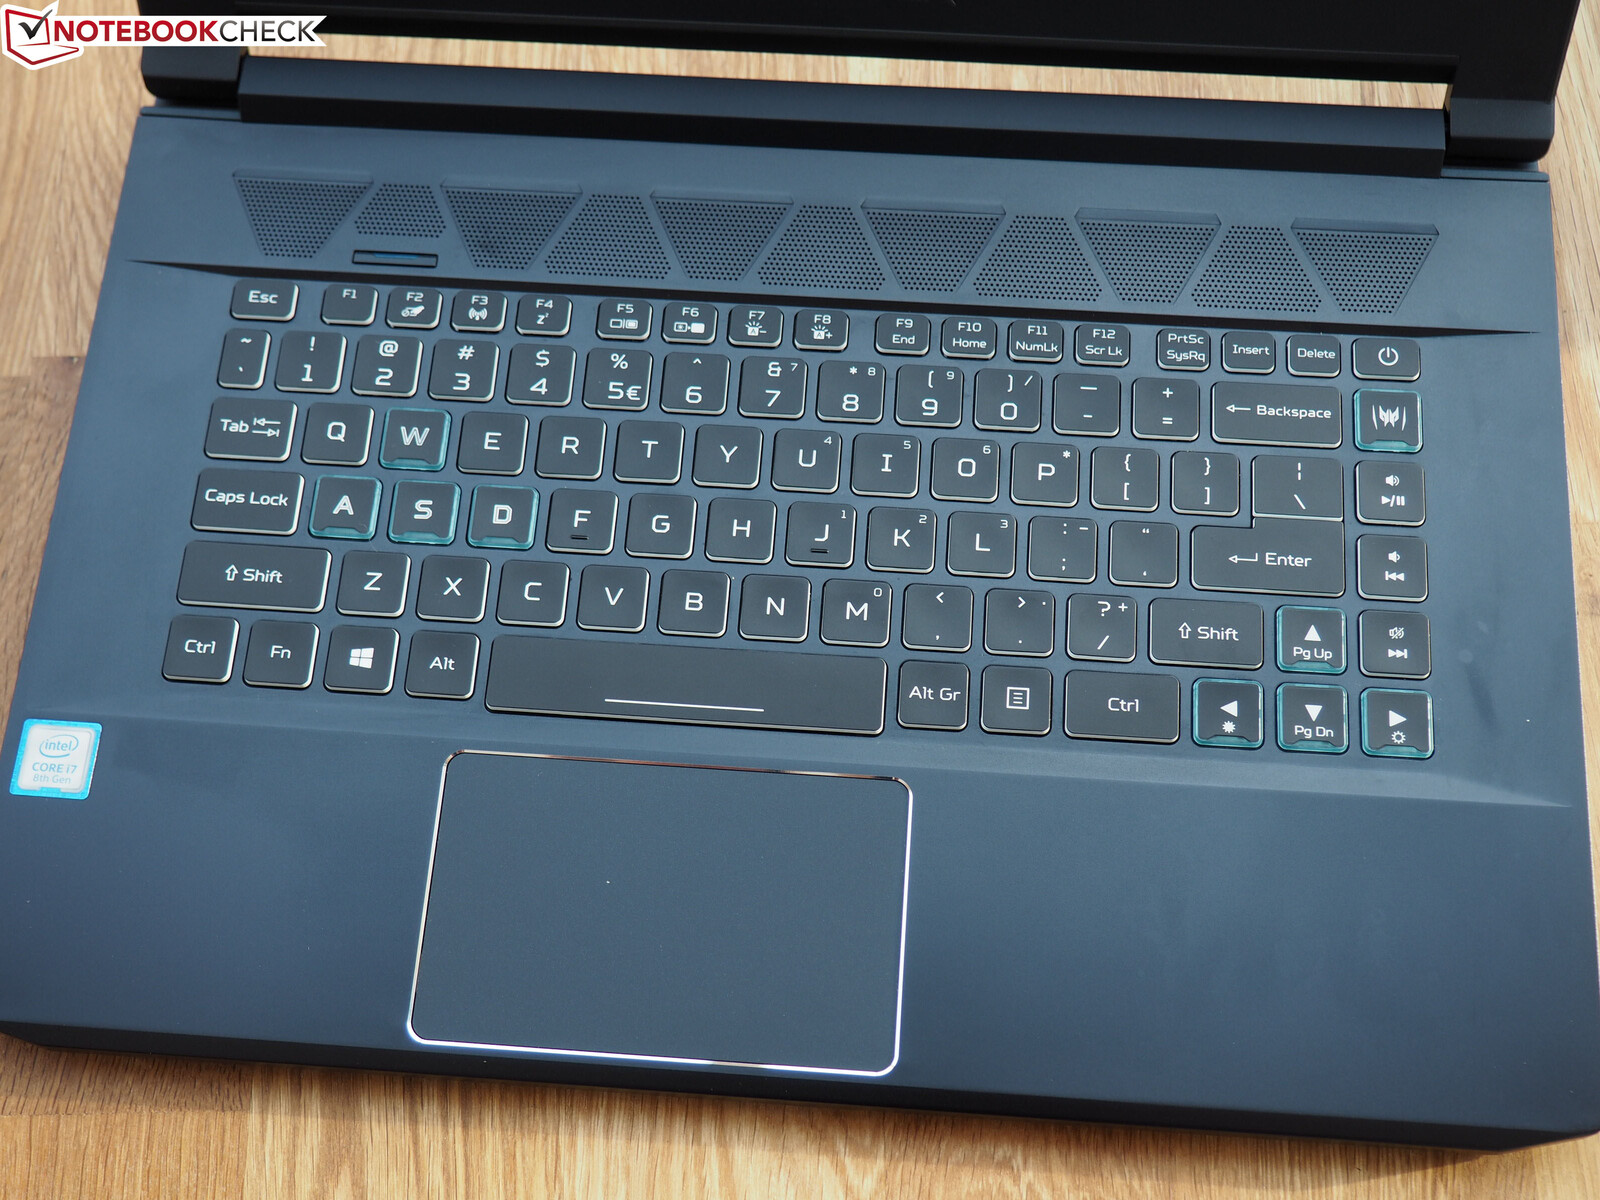
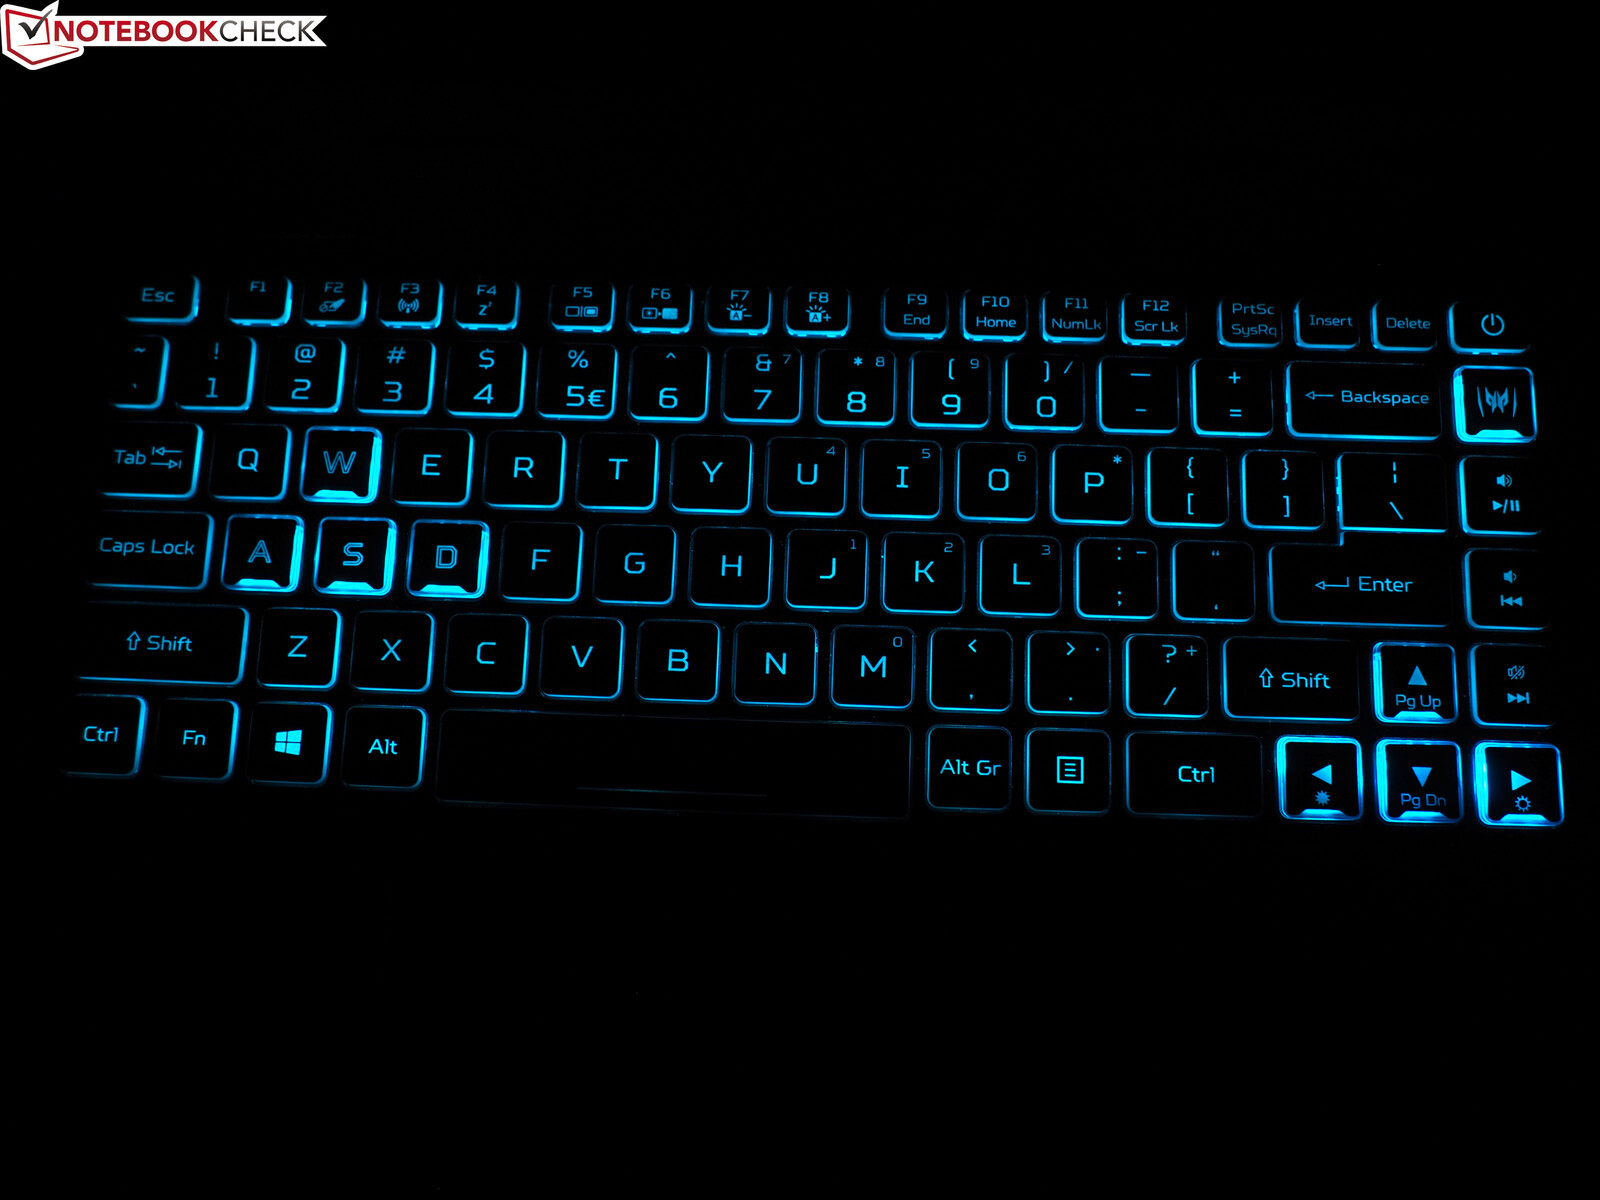
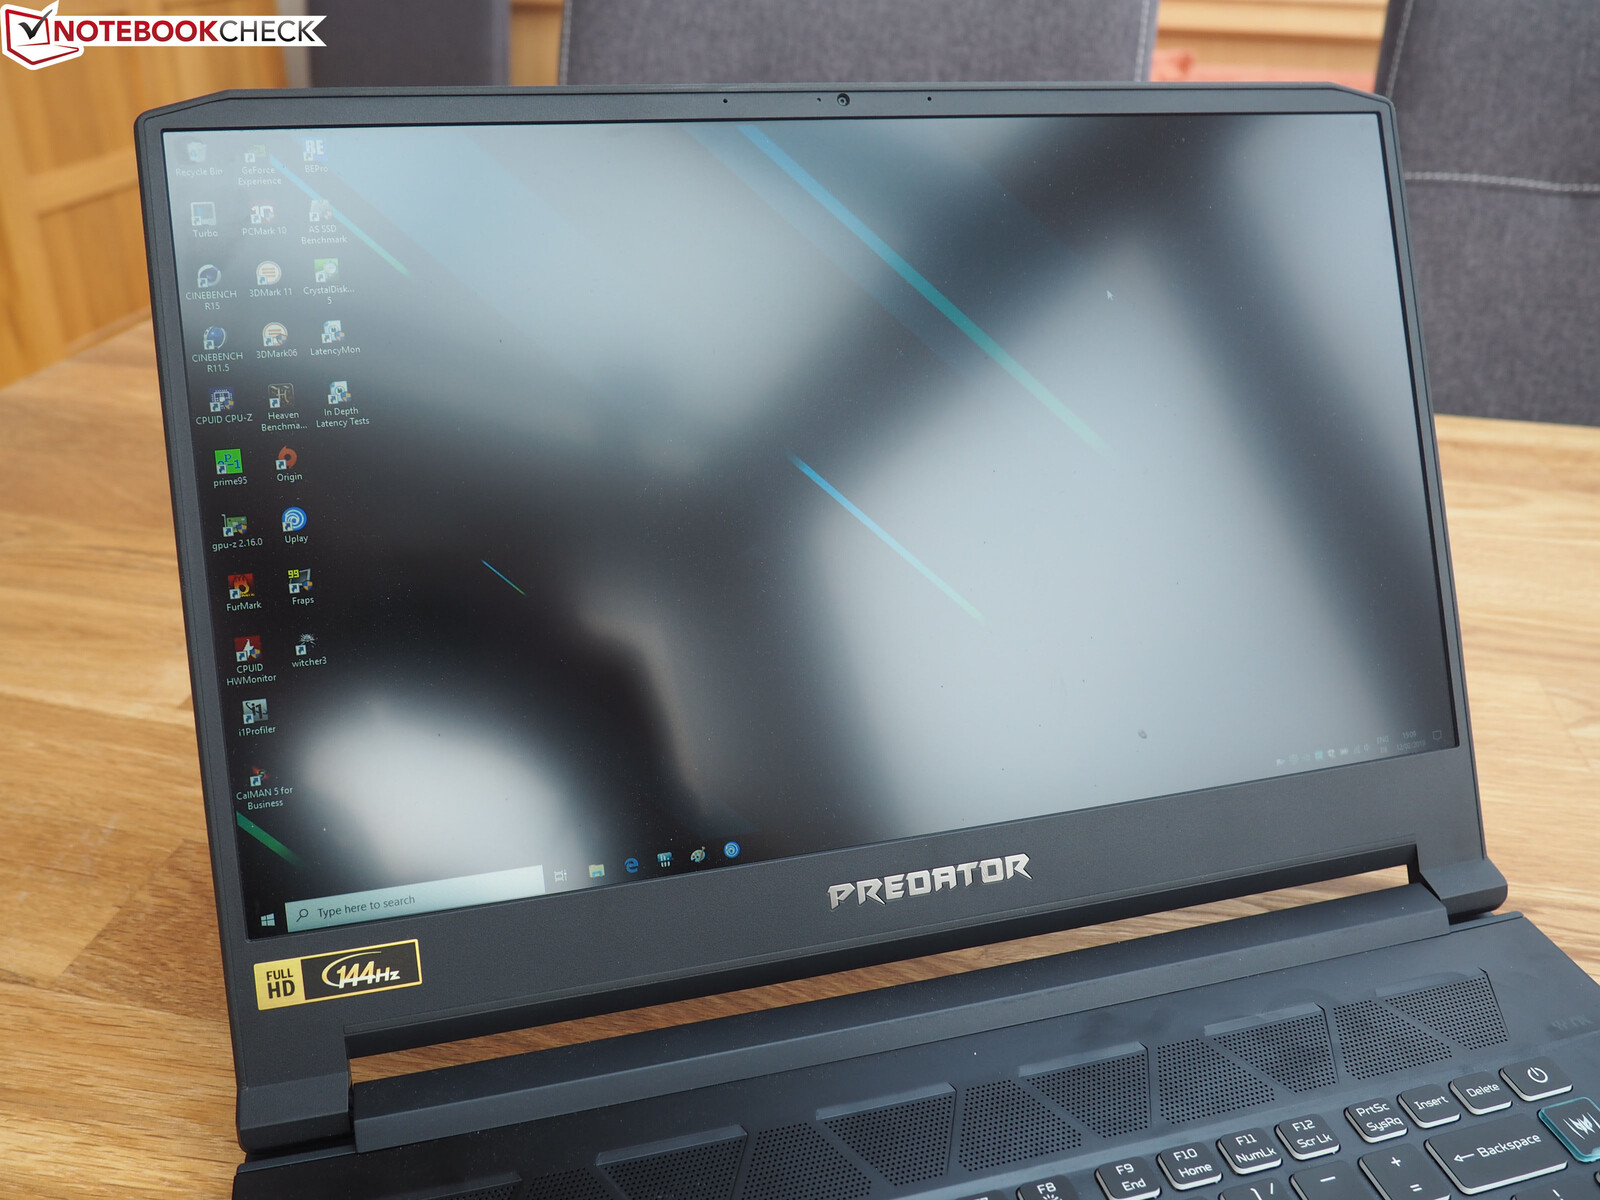
In terms of the workmanship, the 15-incher does not show any weaknesses. In our test unit, the transitions between most surfaces were very clean. Thanks to the use of metal, the Triton 500 also looks very high-quality. The elegant, and at the same time subtle, design also earns some positive marks. With the exception of the blue border around the logo on the lid and the blue-colored cooling elements, Acer forgoes all the color gimmicks. Only when you turn it on, does the Triton 500 show its real nature, with the arrow keys and the WASD area being emphasized by the blue illumination.
Acer could still improve a bit on the hinges. Although it is laudable that the display can be opened to a whole 180°, the display lid drops down fairly quickly in our shake test. However, the case makes a good impression overall.
Equipment
Connections
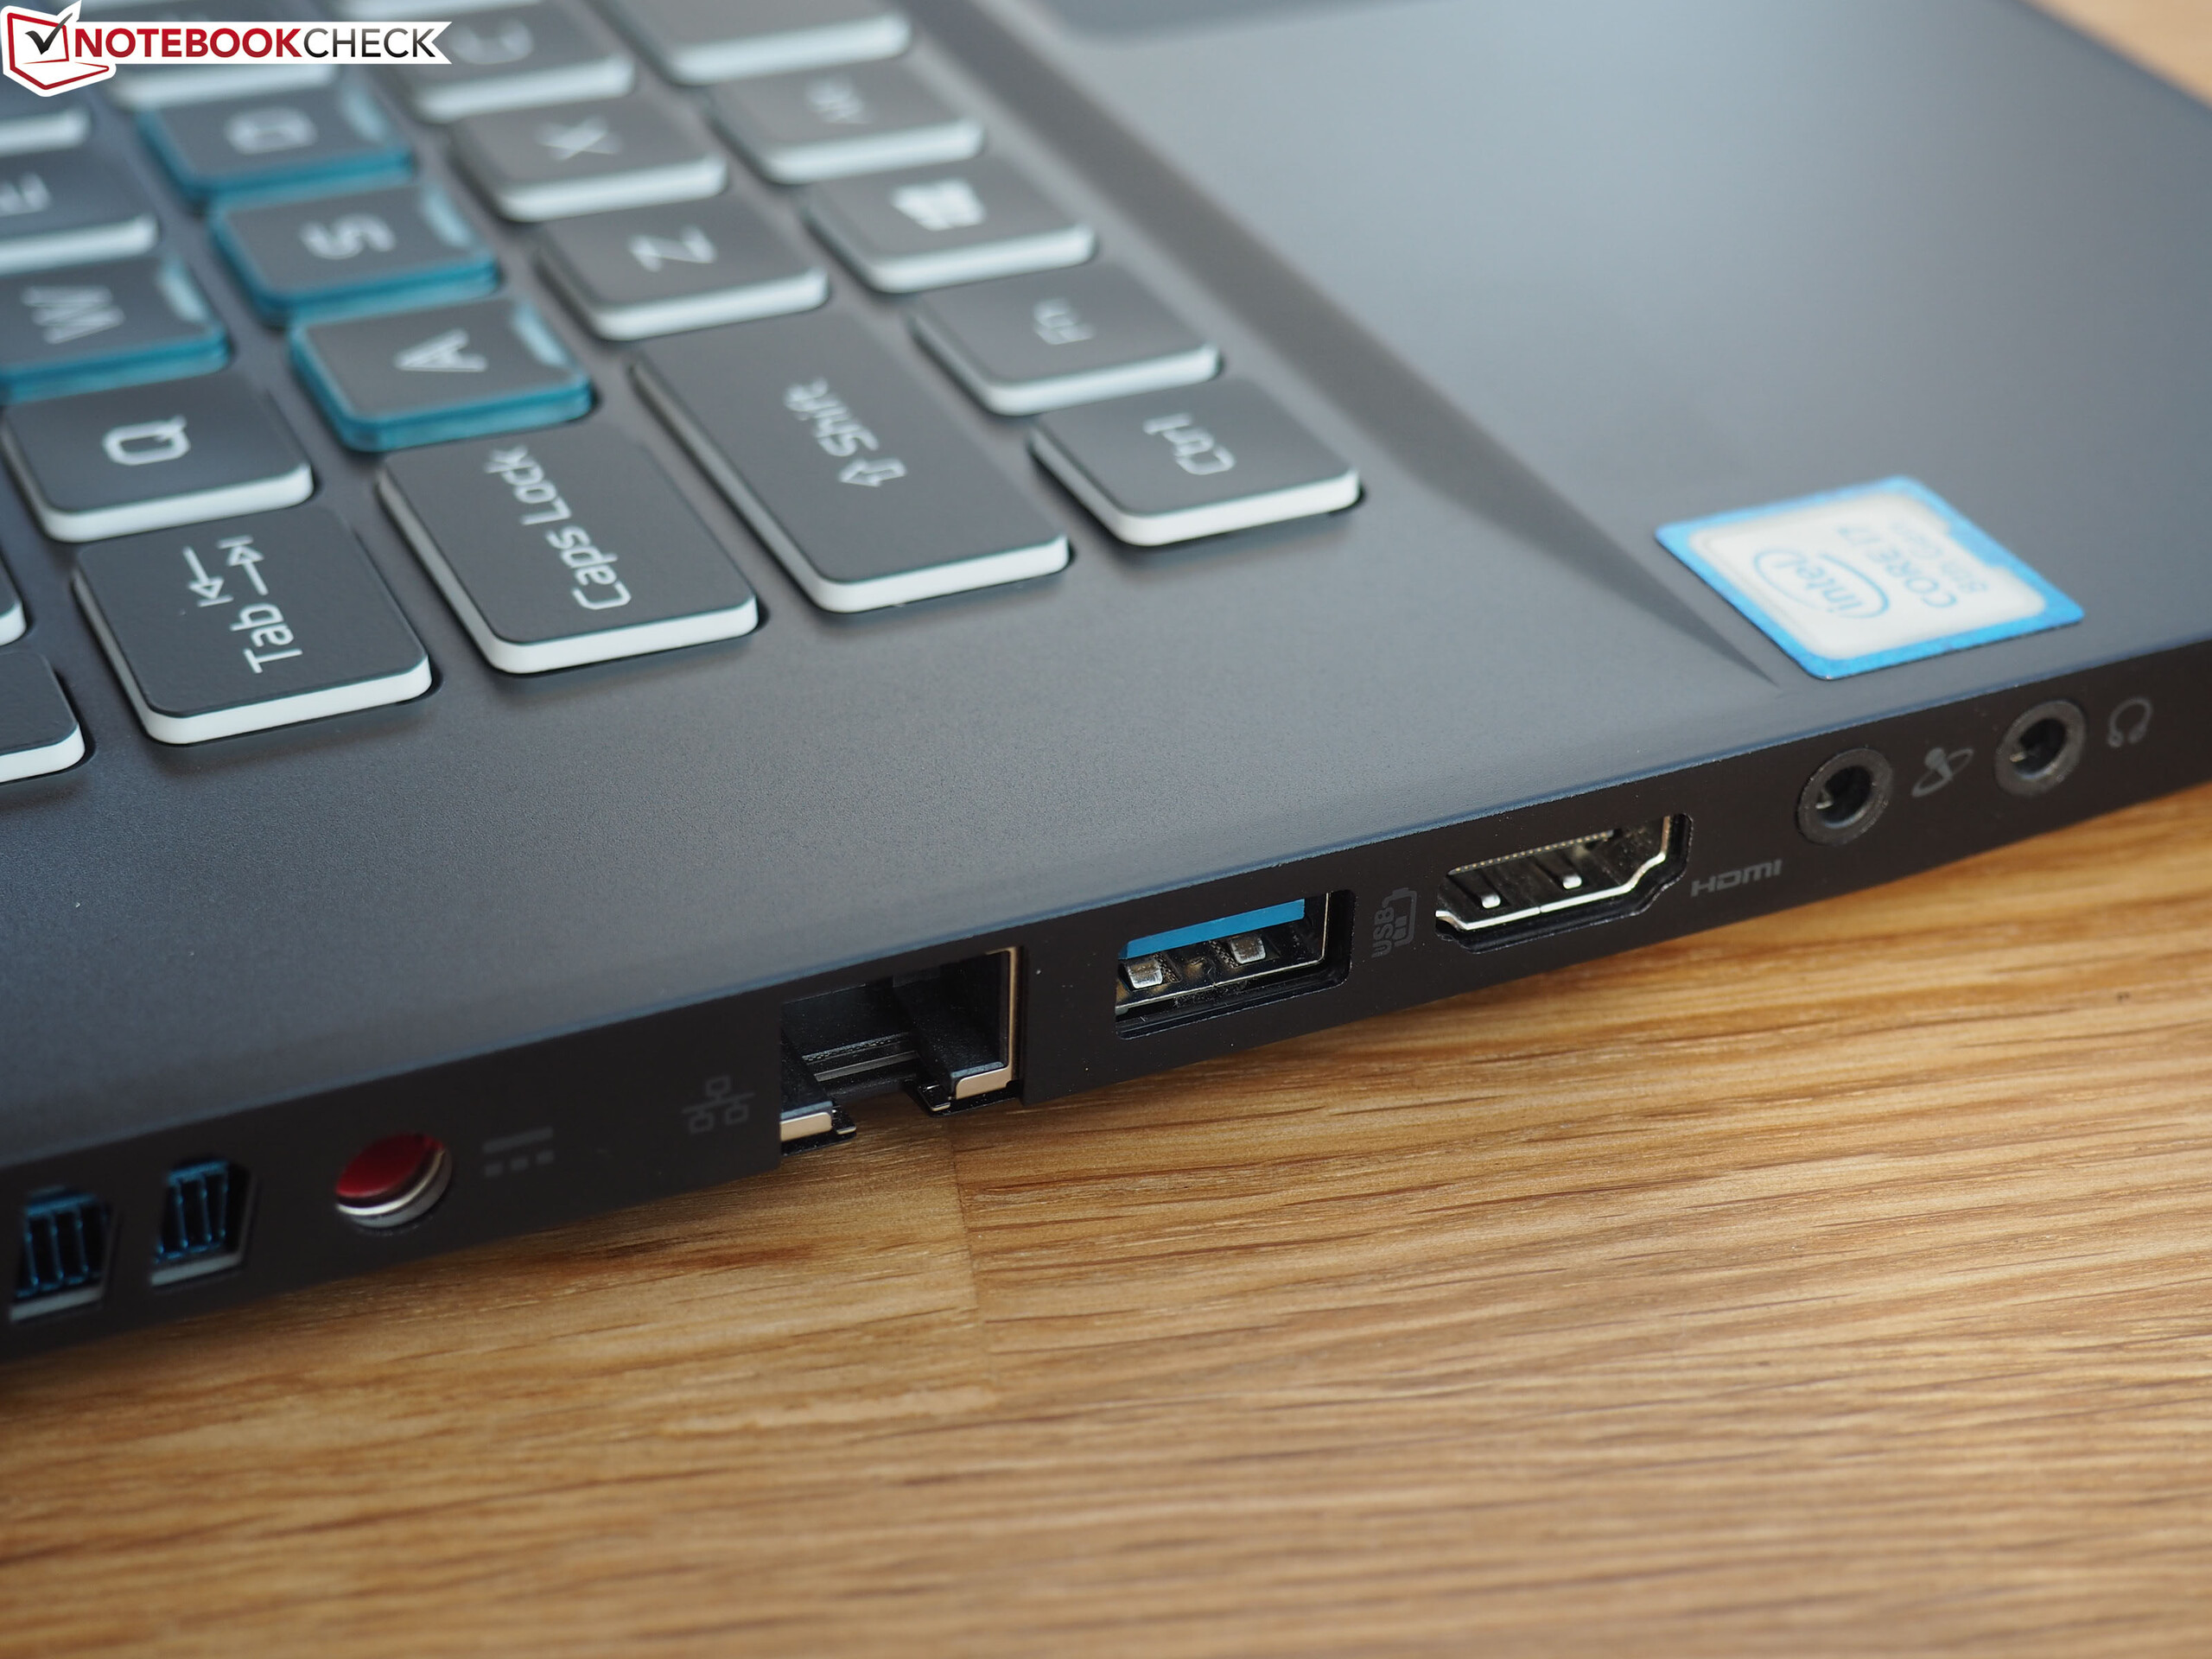
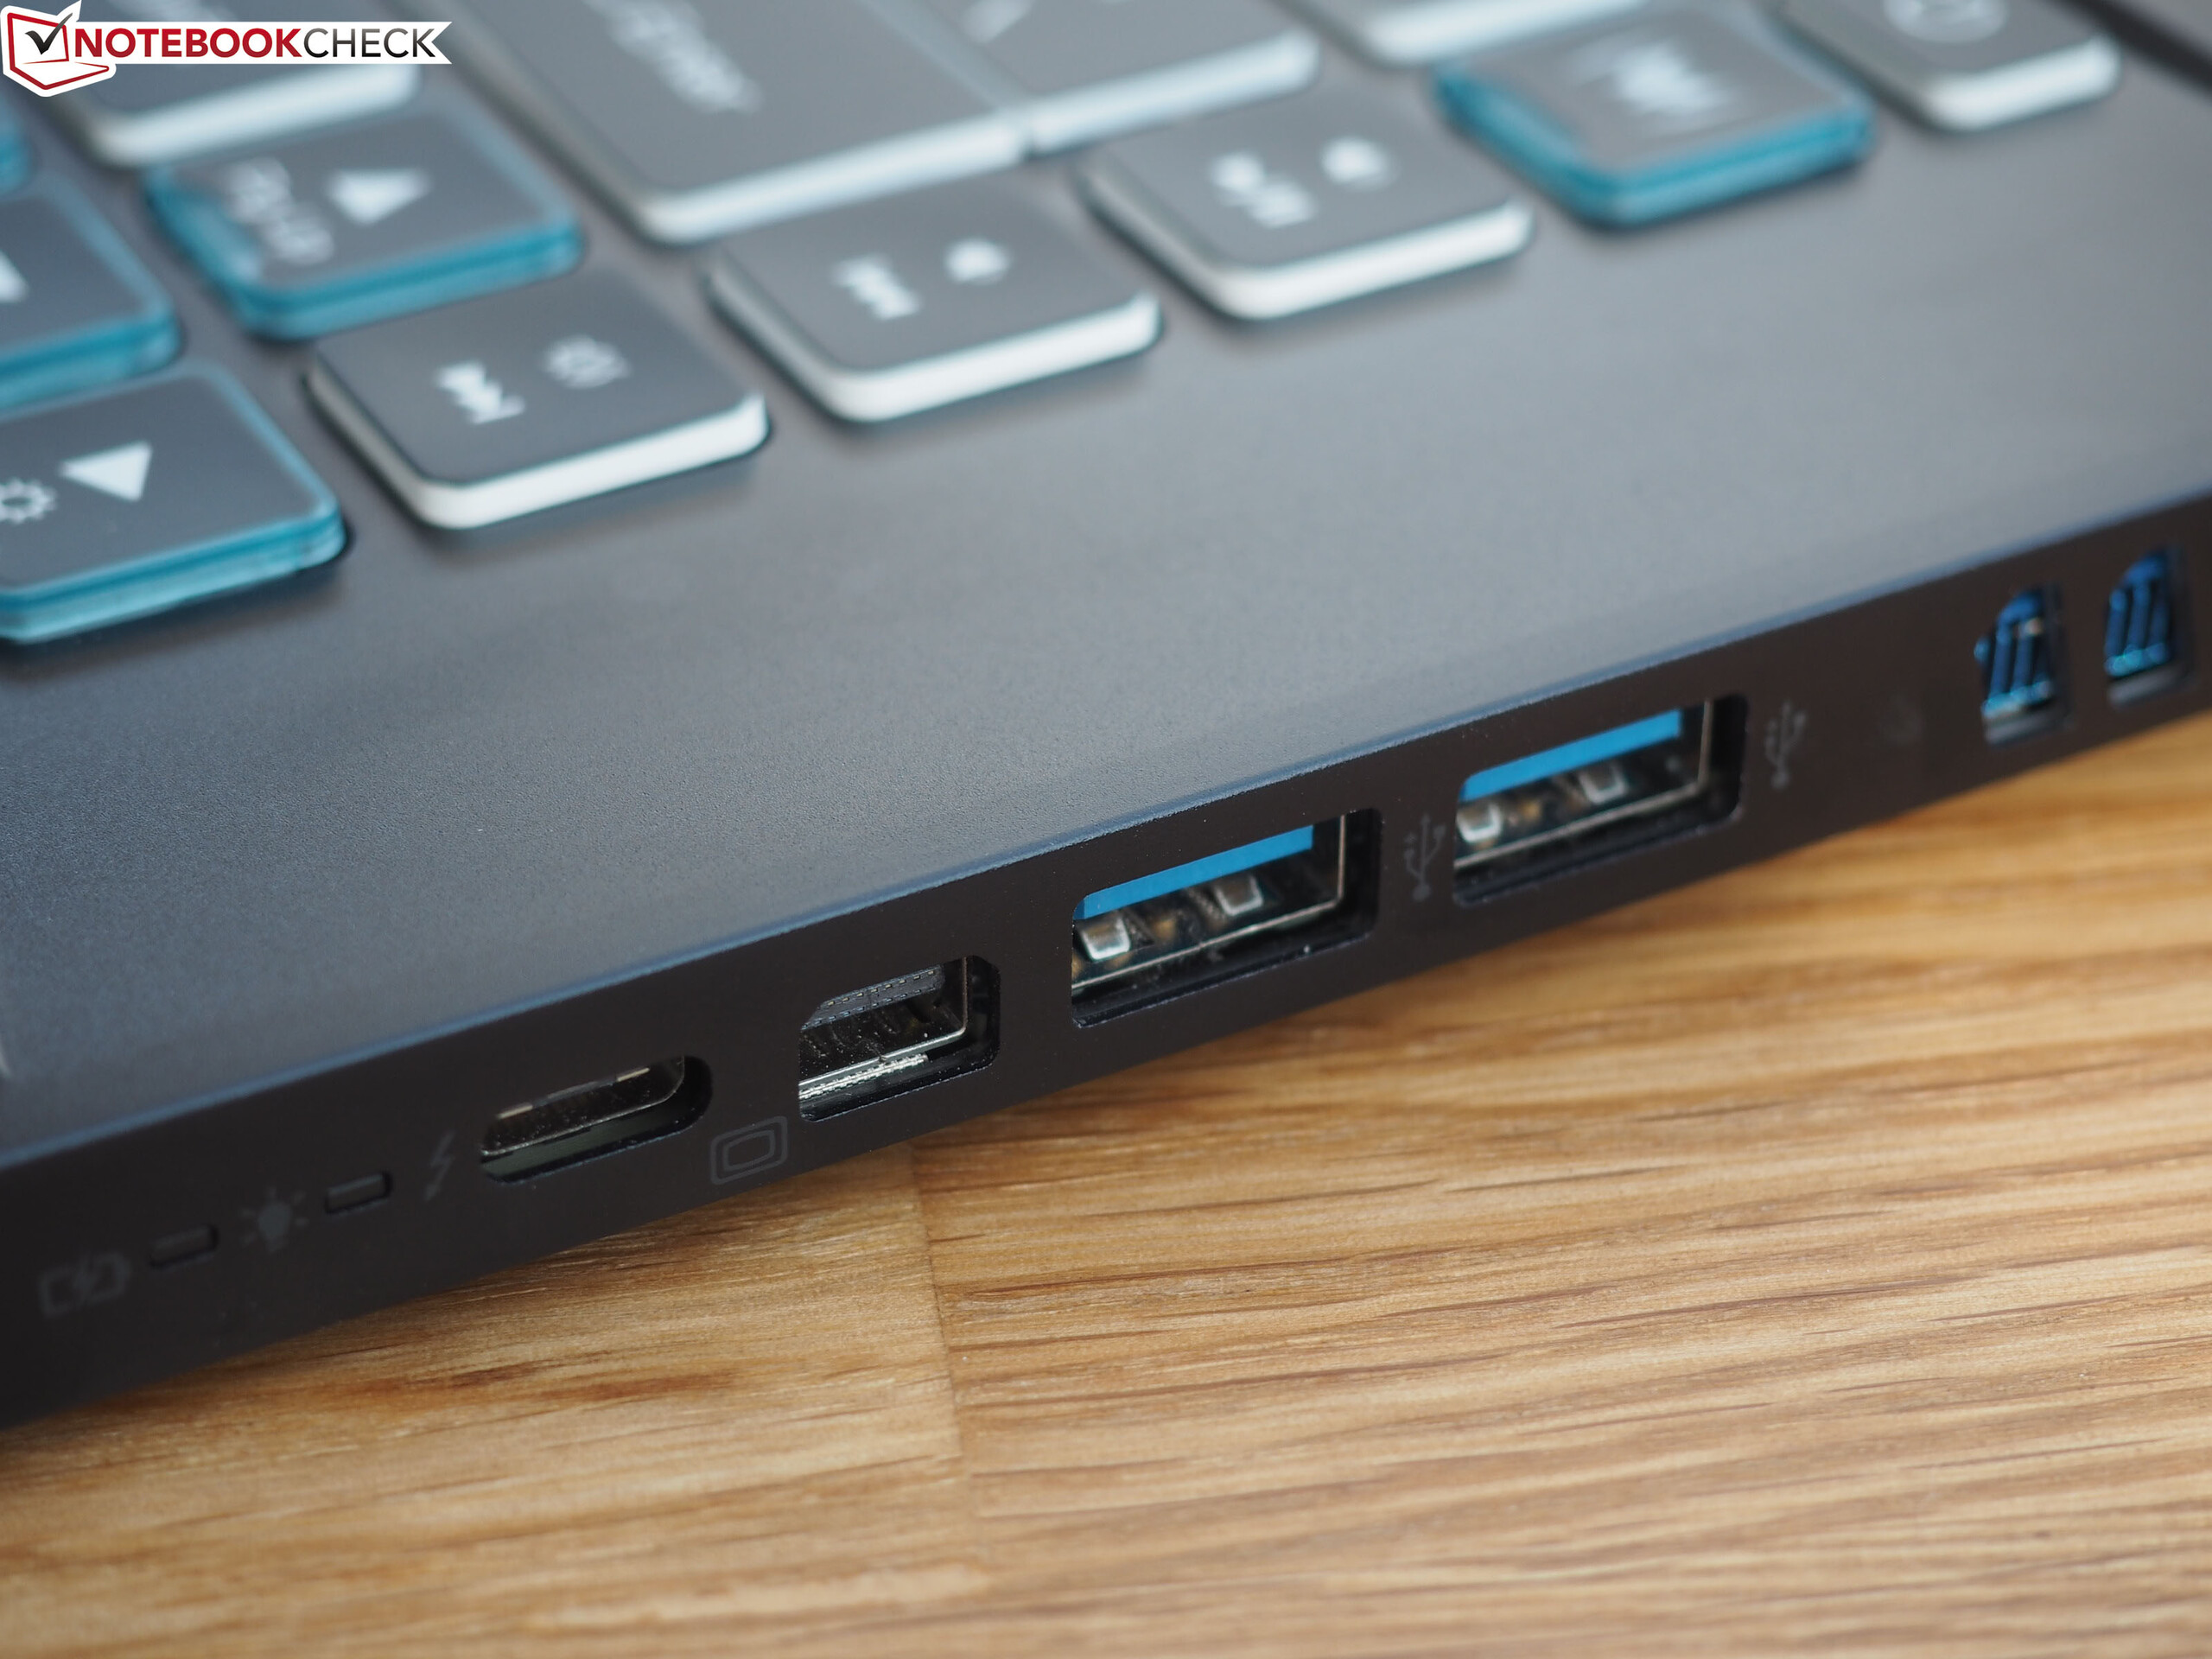
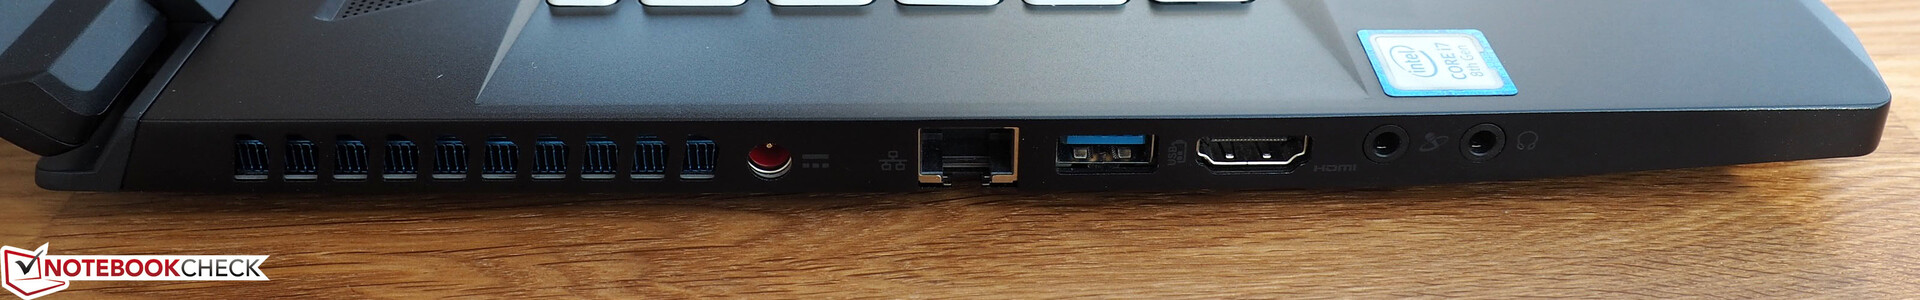
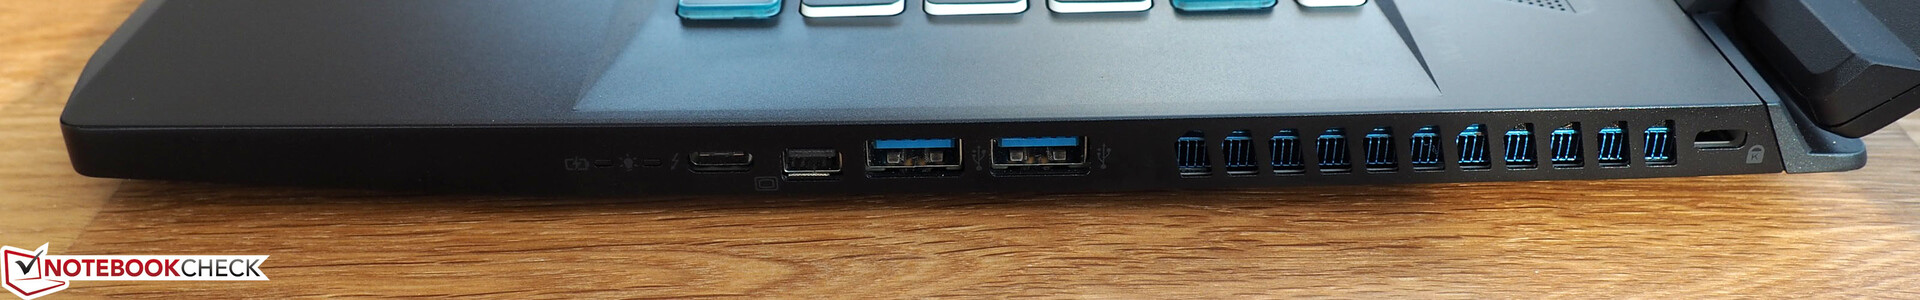
The word "good" is also fitting for the connection equipment. Acer has equipped the Triton 500 with almost all the connections you could hope for in a gaming notebook in 2019. Despite its slim height of 1.8 cm (0.6 in), the 15-inch notebook offers an RJ45 port. Buyers should also be satisfied with three classic USB-3.0 ports (Type-A) and one modern Thunderbolt-3 port (Type-C). External displays can either be connected via the HDMI port or the mini-DisplayPort connection. In addition, there are two audio connections (headphones + microphone) and an opening for Kensington locks. On the other hand, it is unfortunate that Acer has foregone a card reader.
The positioning of the connections is also a bit unfortunate. Since many of the ports are positioned in the front half of the case, this can create some obstacles to moving a mouse around.
Communication
Acer did not fall asleep in terms of the WLAN performance. With the Killer Wireless-AC 1550i, a brand-new Wi-Fi chip handles the wireless connections. In our WLAN test (at 1 m distance from the Linksys EA8500 reference router), the Triton 500 reached almost 700 Mb/s when sending as well as receiving – which is a very good result that is at the same level as the competitors.
Accessories
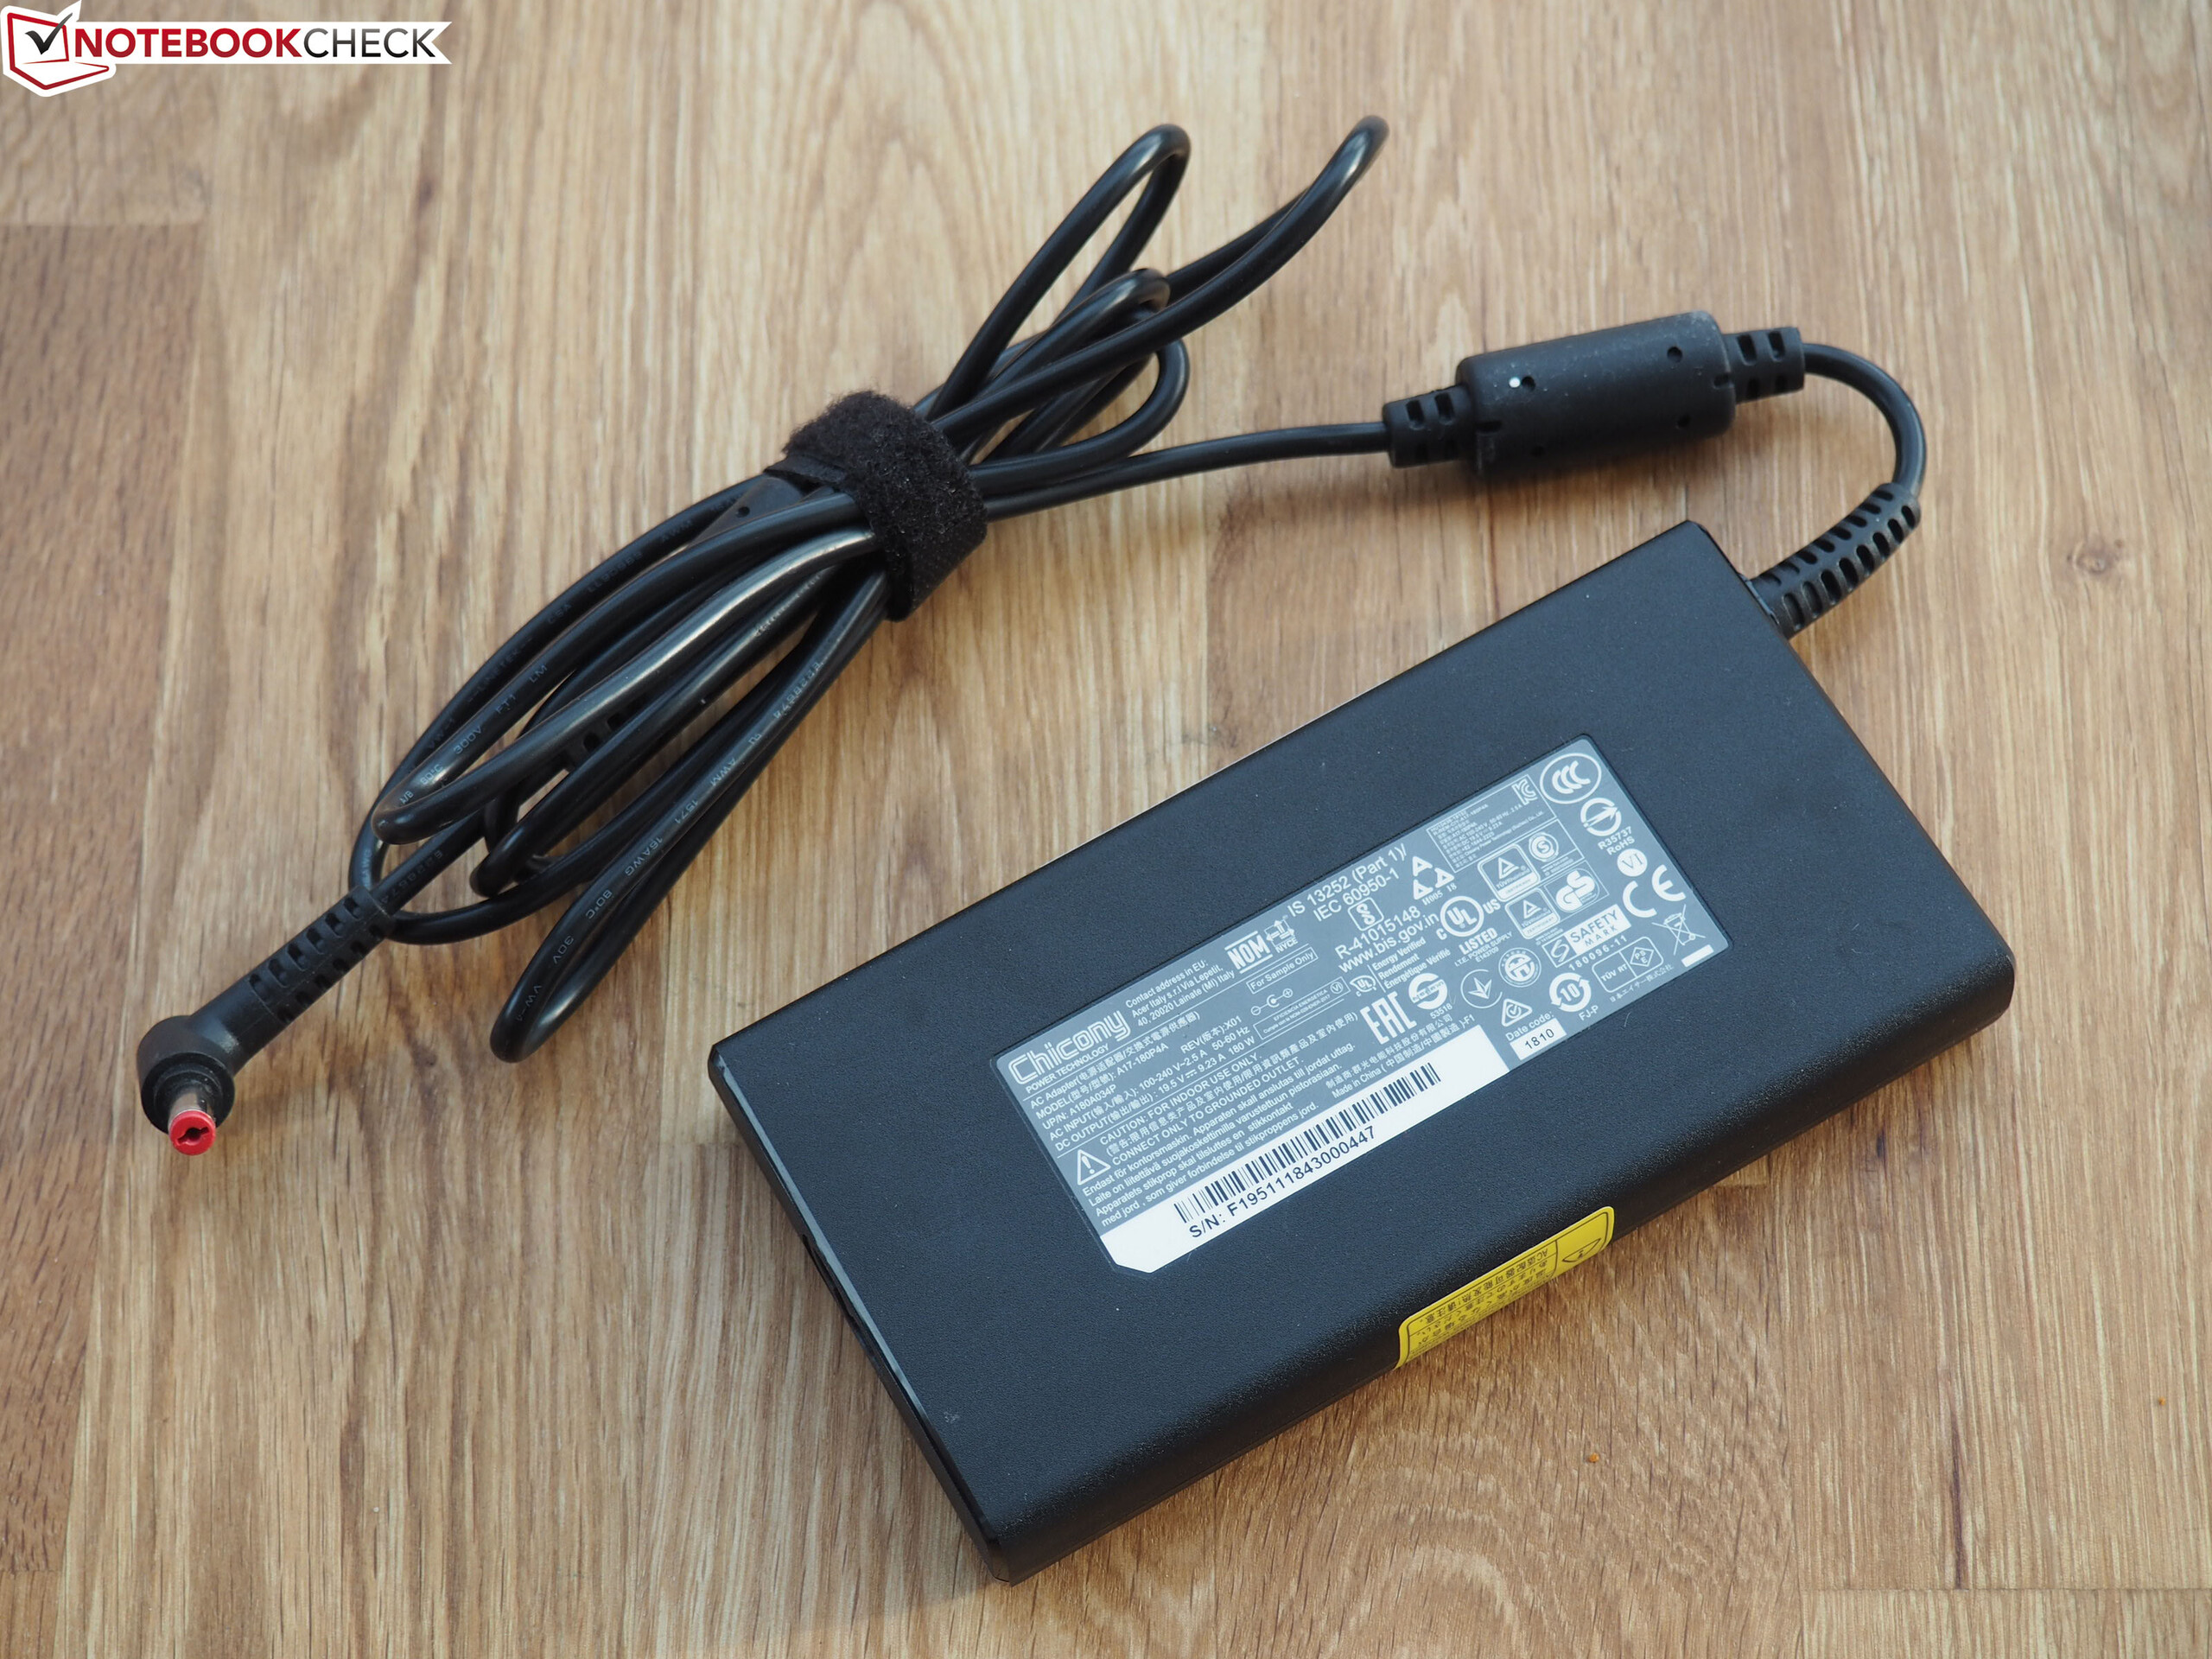
In terms of the accessories, our test unit only included a power supply. At a size of about 14 x 7.5 x 2 cm (5.5 x 3 x 0.8 in), the power supply turned out to be surprisingly compact, while the offered power is also limited. 180 watt is borderline even for a Max-Q notebook. For comparison, the Aero 15 X9 with the weaker RTX 2070 Max-Q includes a 230-watt power supply.
Maintenance
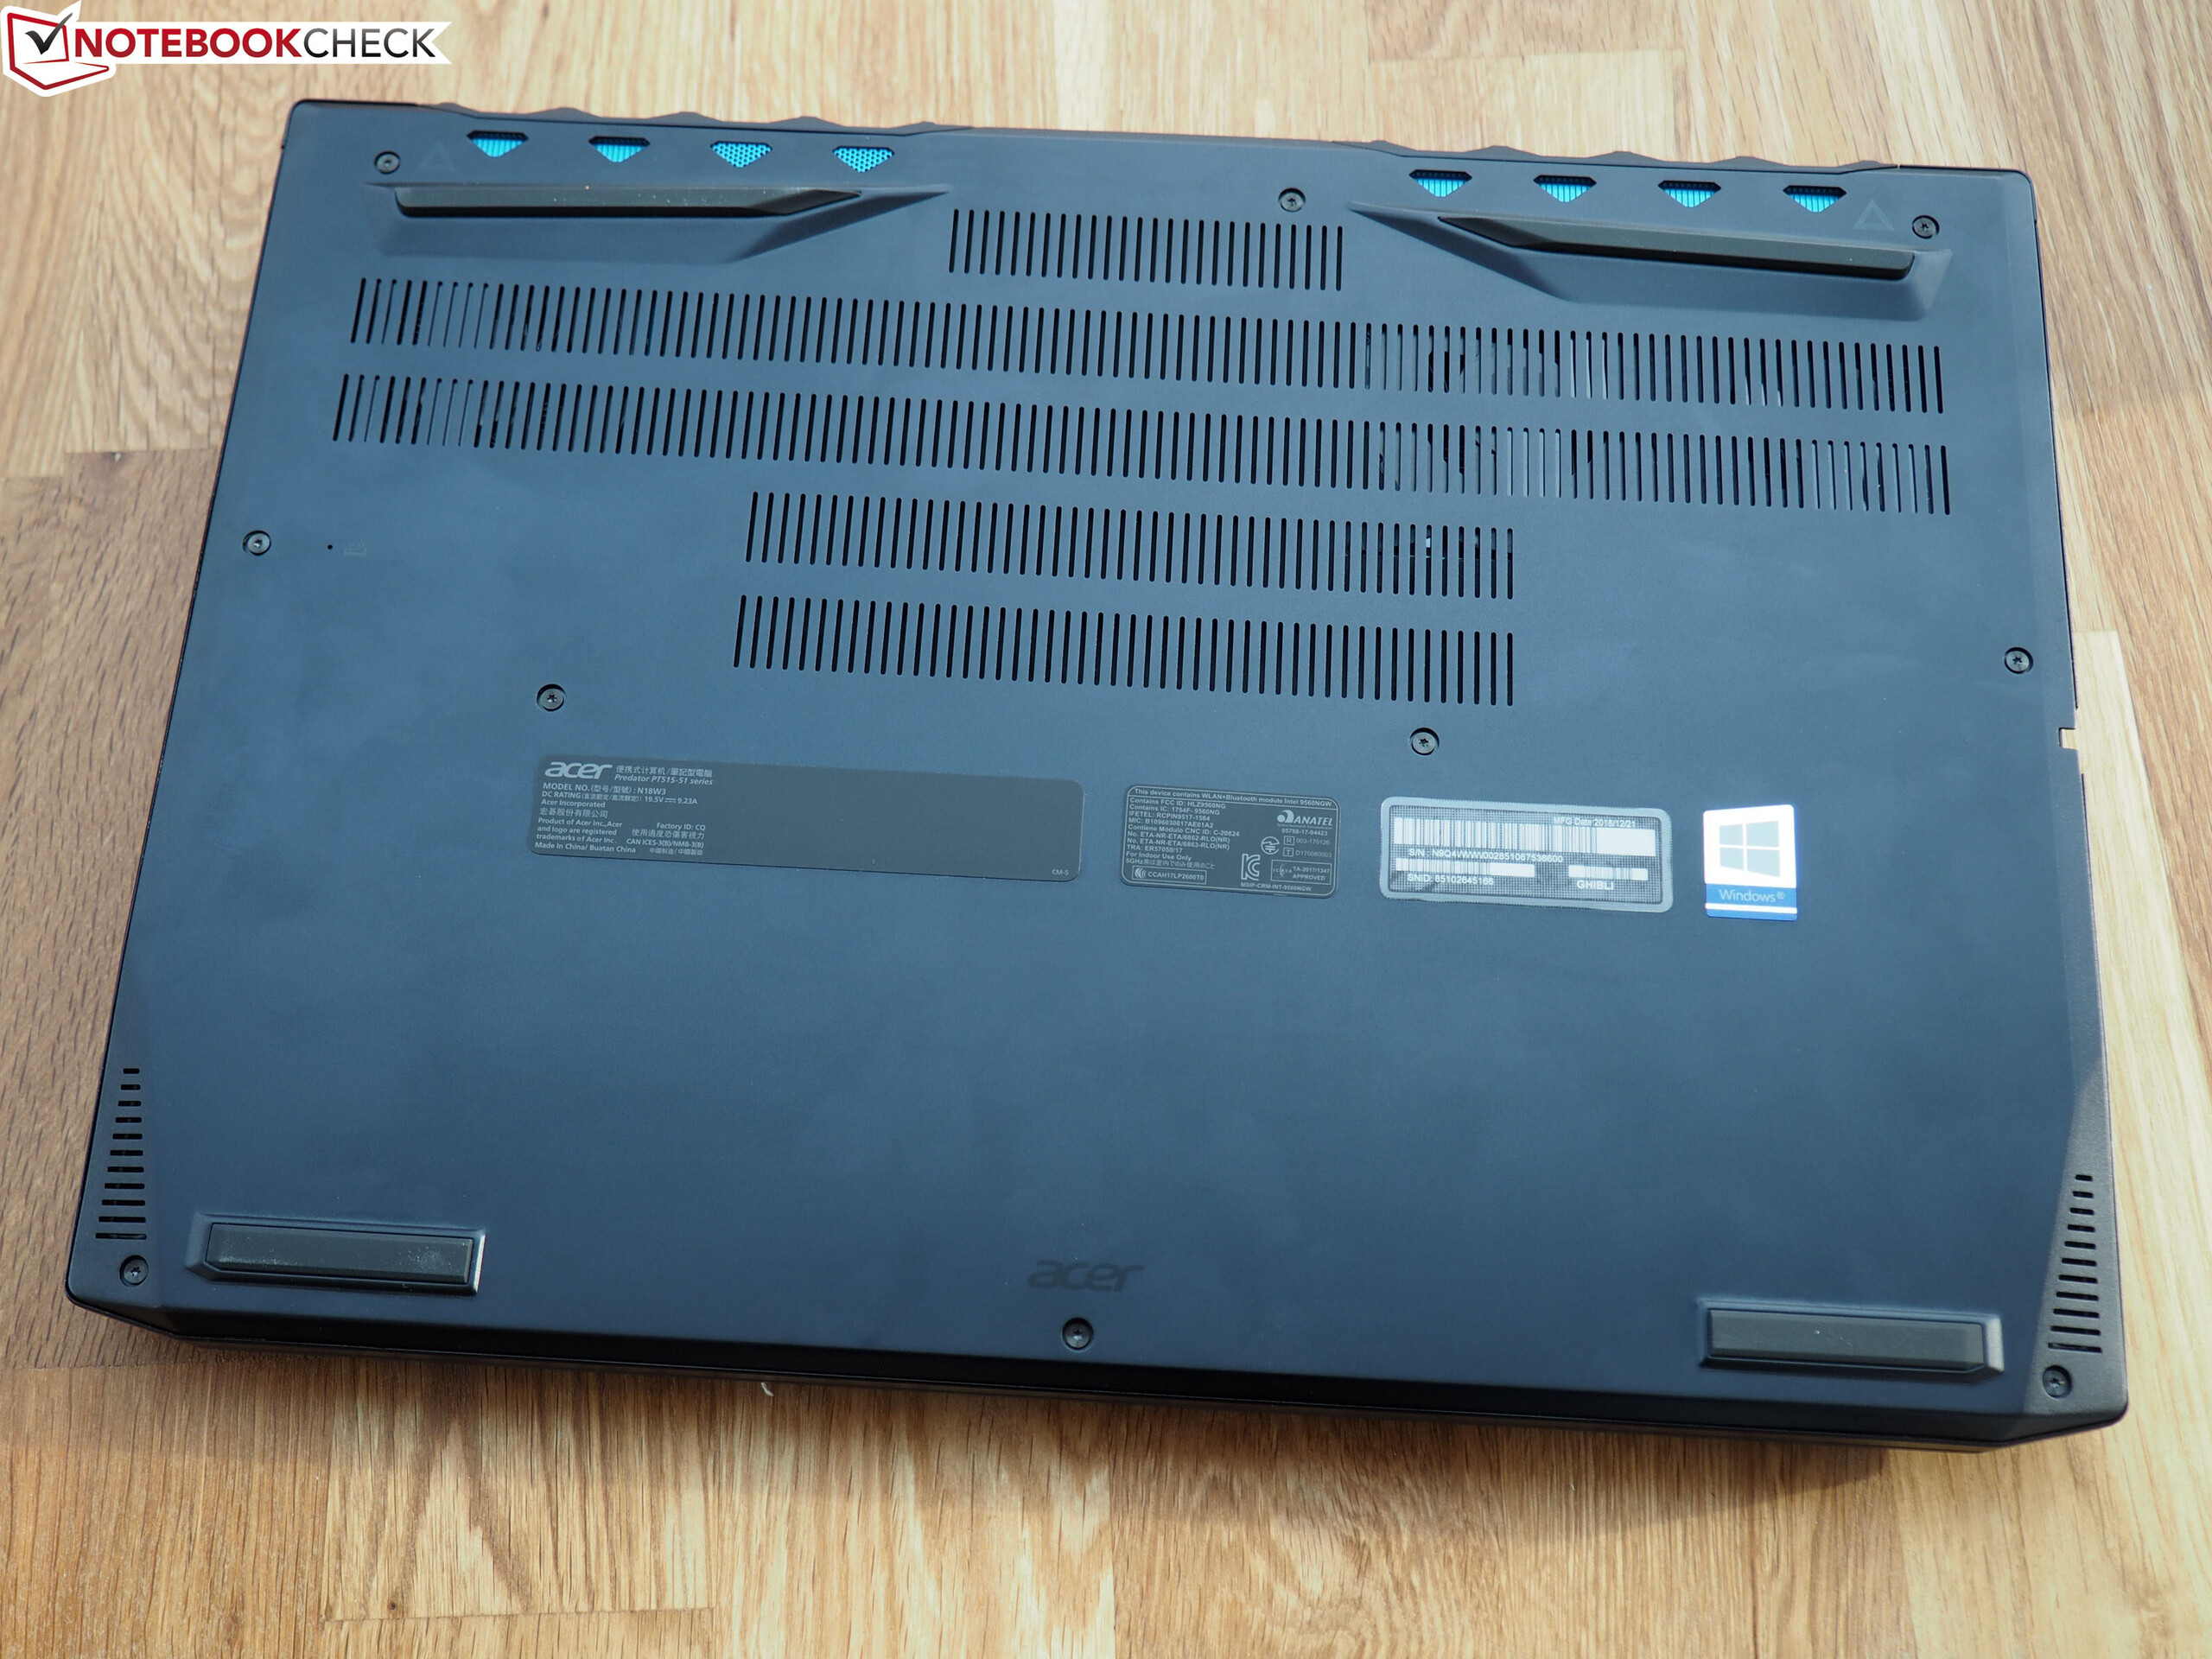
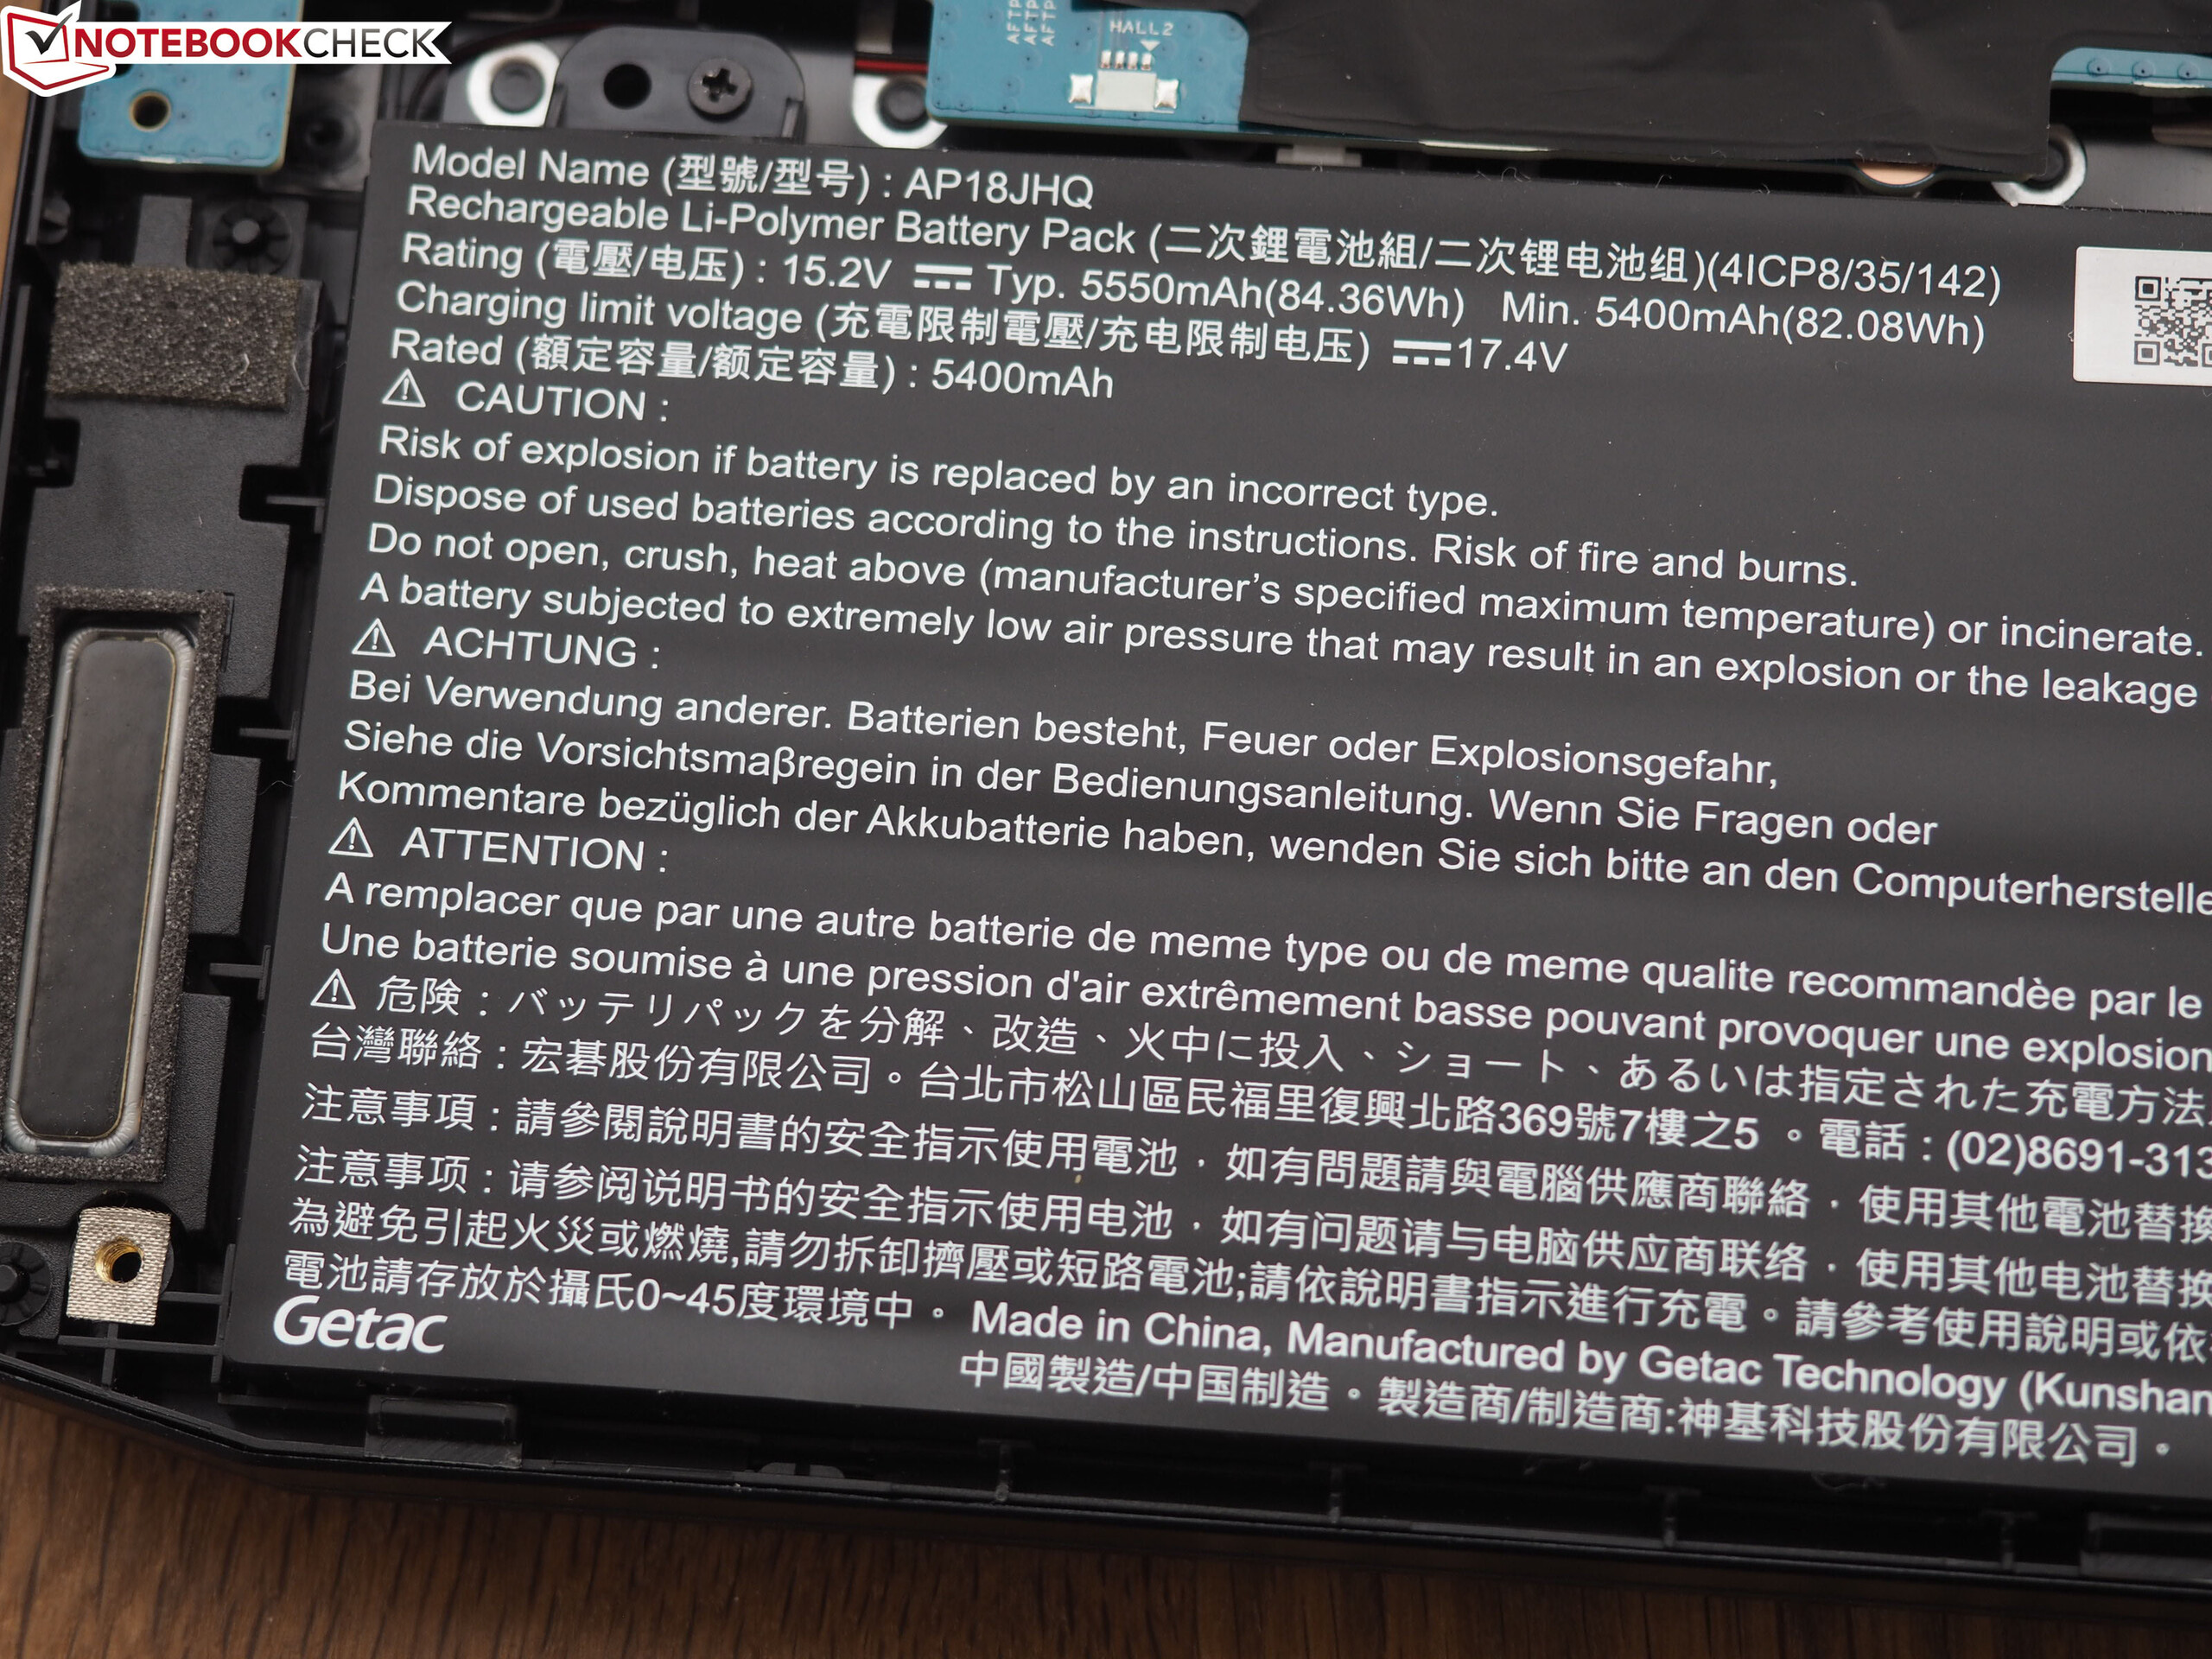
The limited maintenance is one of the largest disadvantages of the Triton 500. If you remove the 10 Torx screws from the case bottom and lift the bottom plate out of its bracing, you only get access to the fans, the Wi-Fi module, and the battery. The rest of the components are either covered by a black foil, or they are even on the other side of the motherboard.
The insides remind us strikingly of the MSI GS65, which could also hardly be maintained. The Razer Blade 15 and the Gigabyte Aero 15 show how this can be done much better, allowing access to the working memory and the storage solution. The same was also the case for the Acer Triton 700 earlier.

Warranty
The warranty lasts for two years. Please see our Guarantees, Return policies and Warranties article for country-specific information.
Input Devices
Keyboard
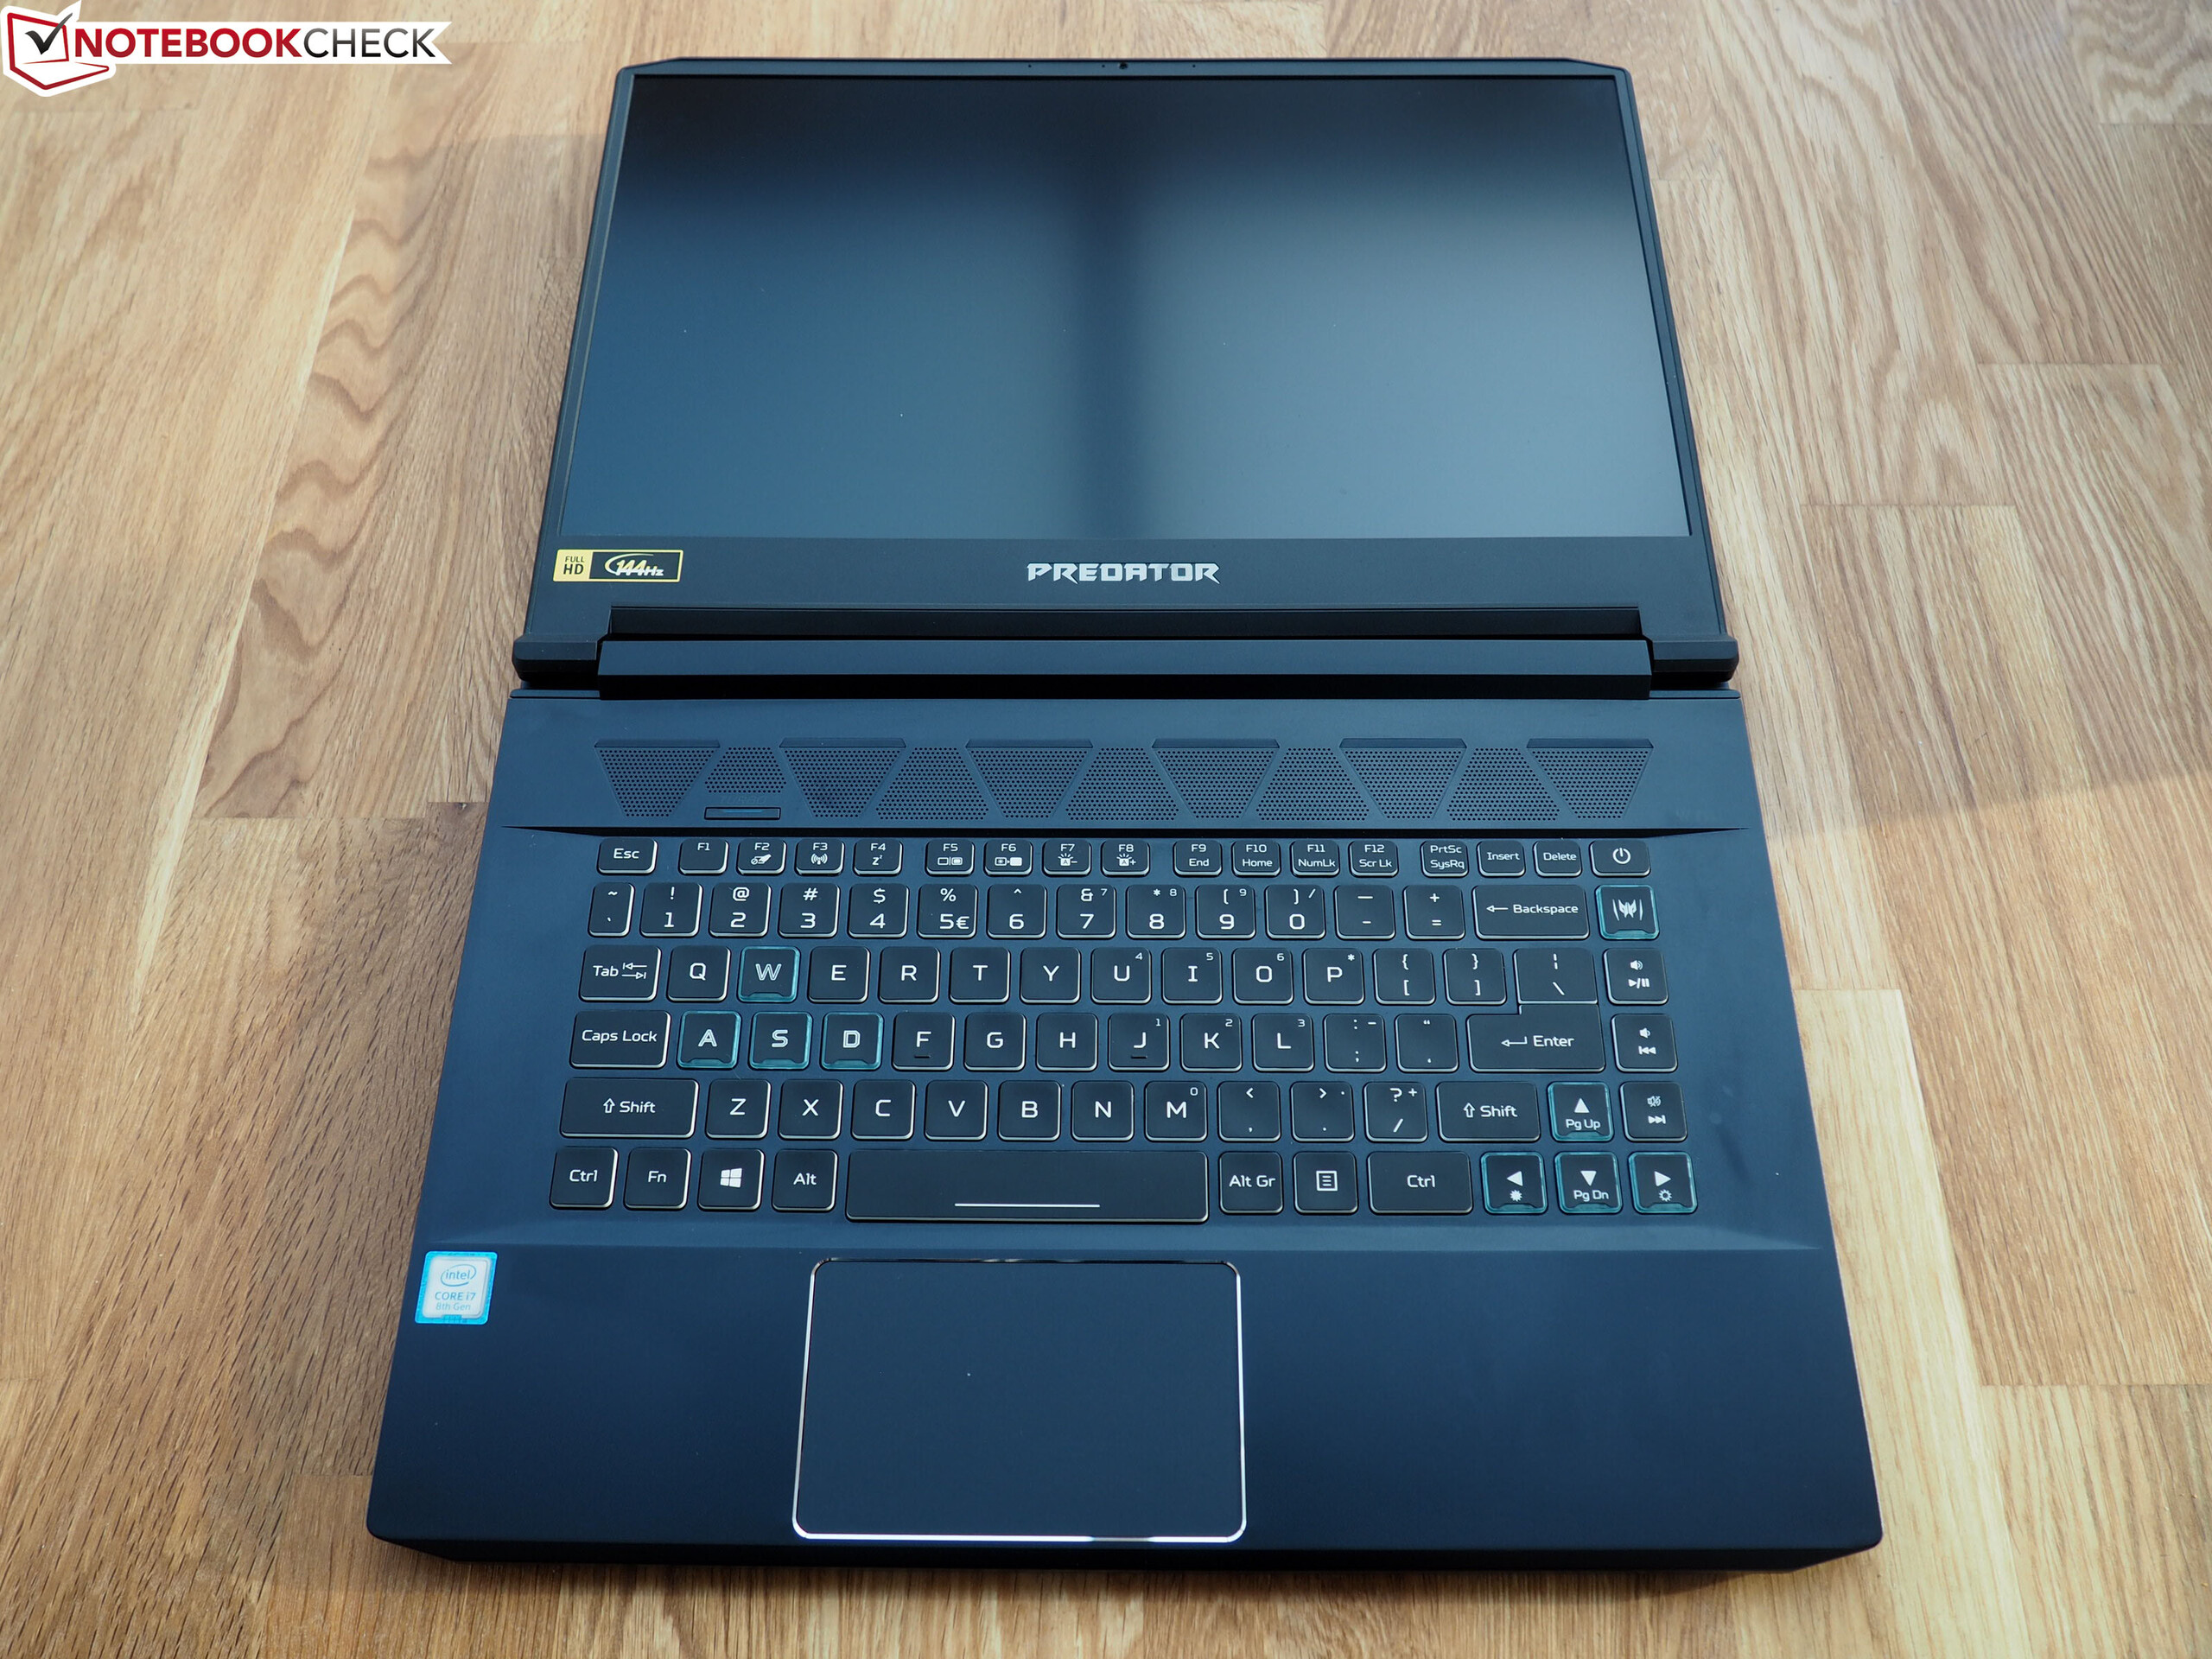
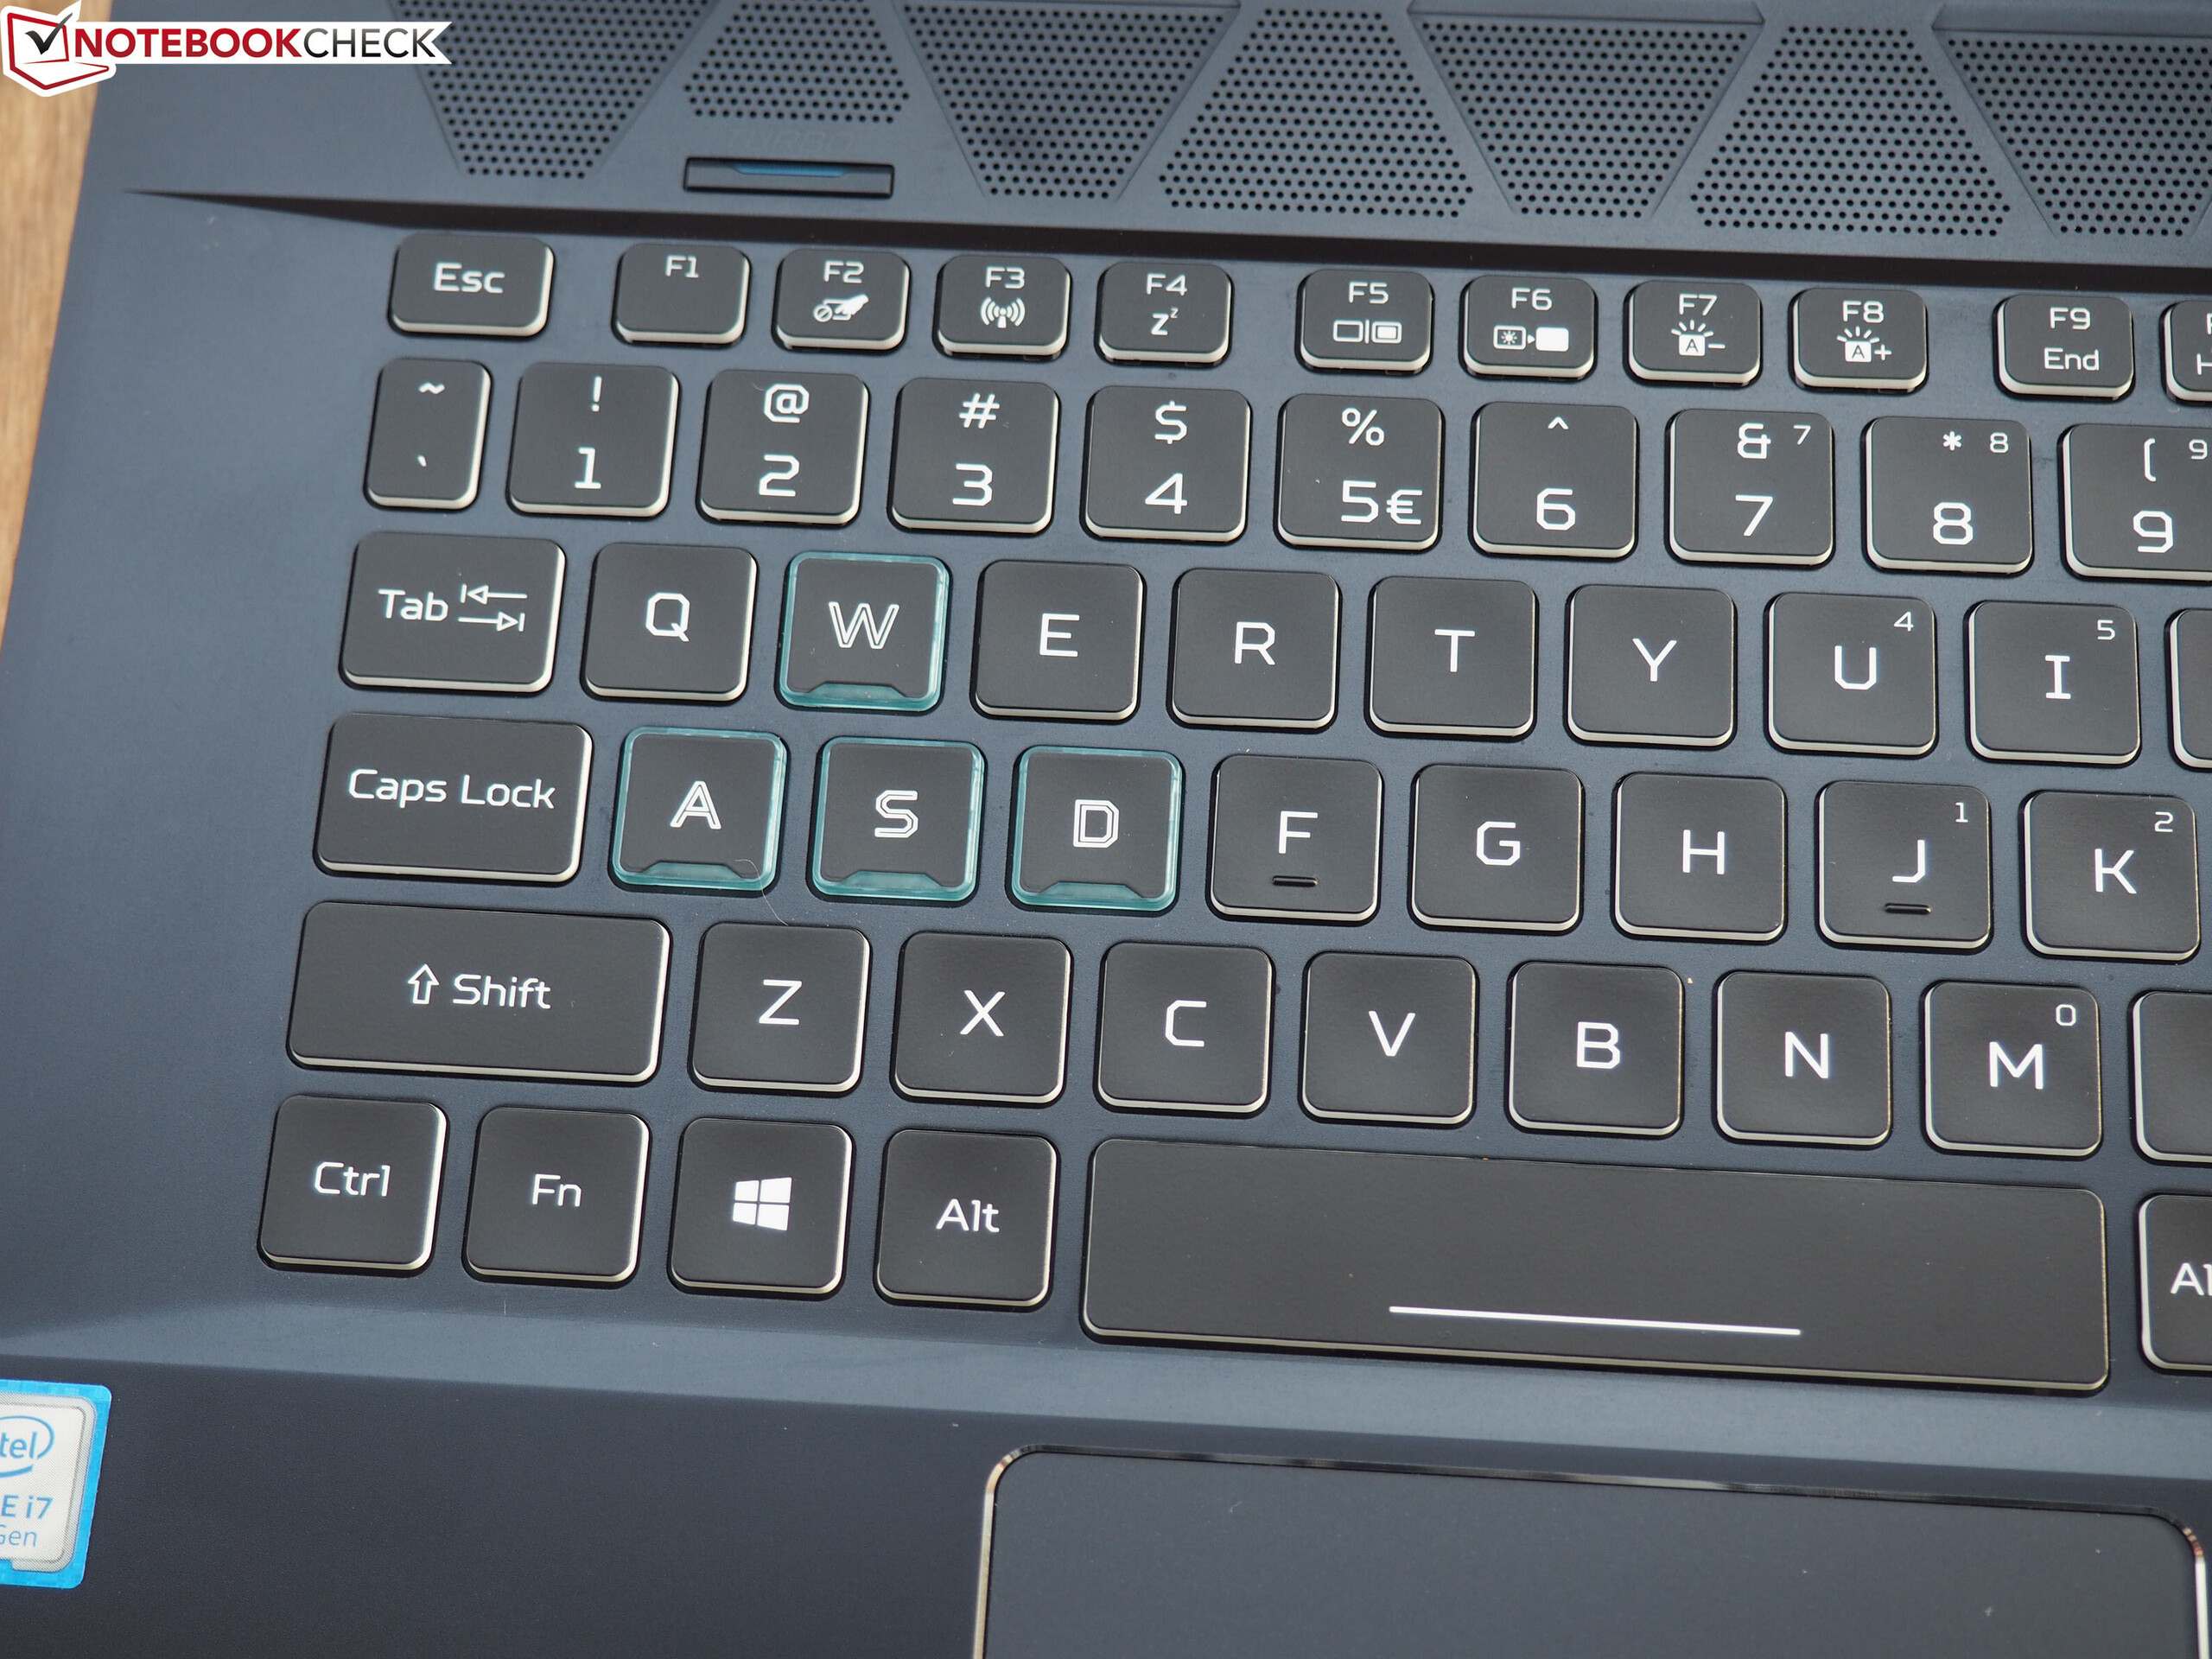
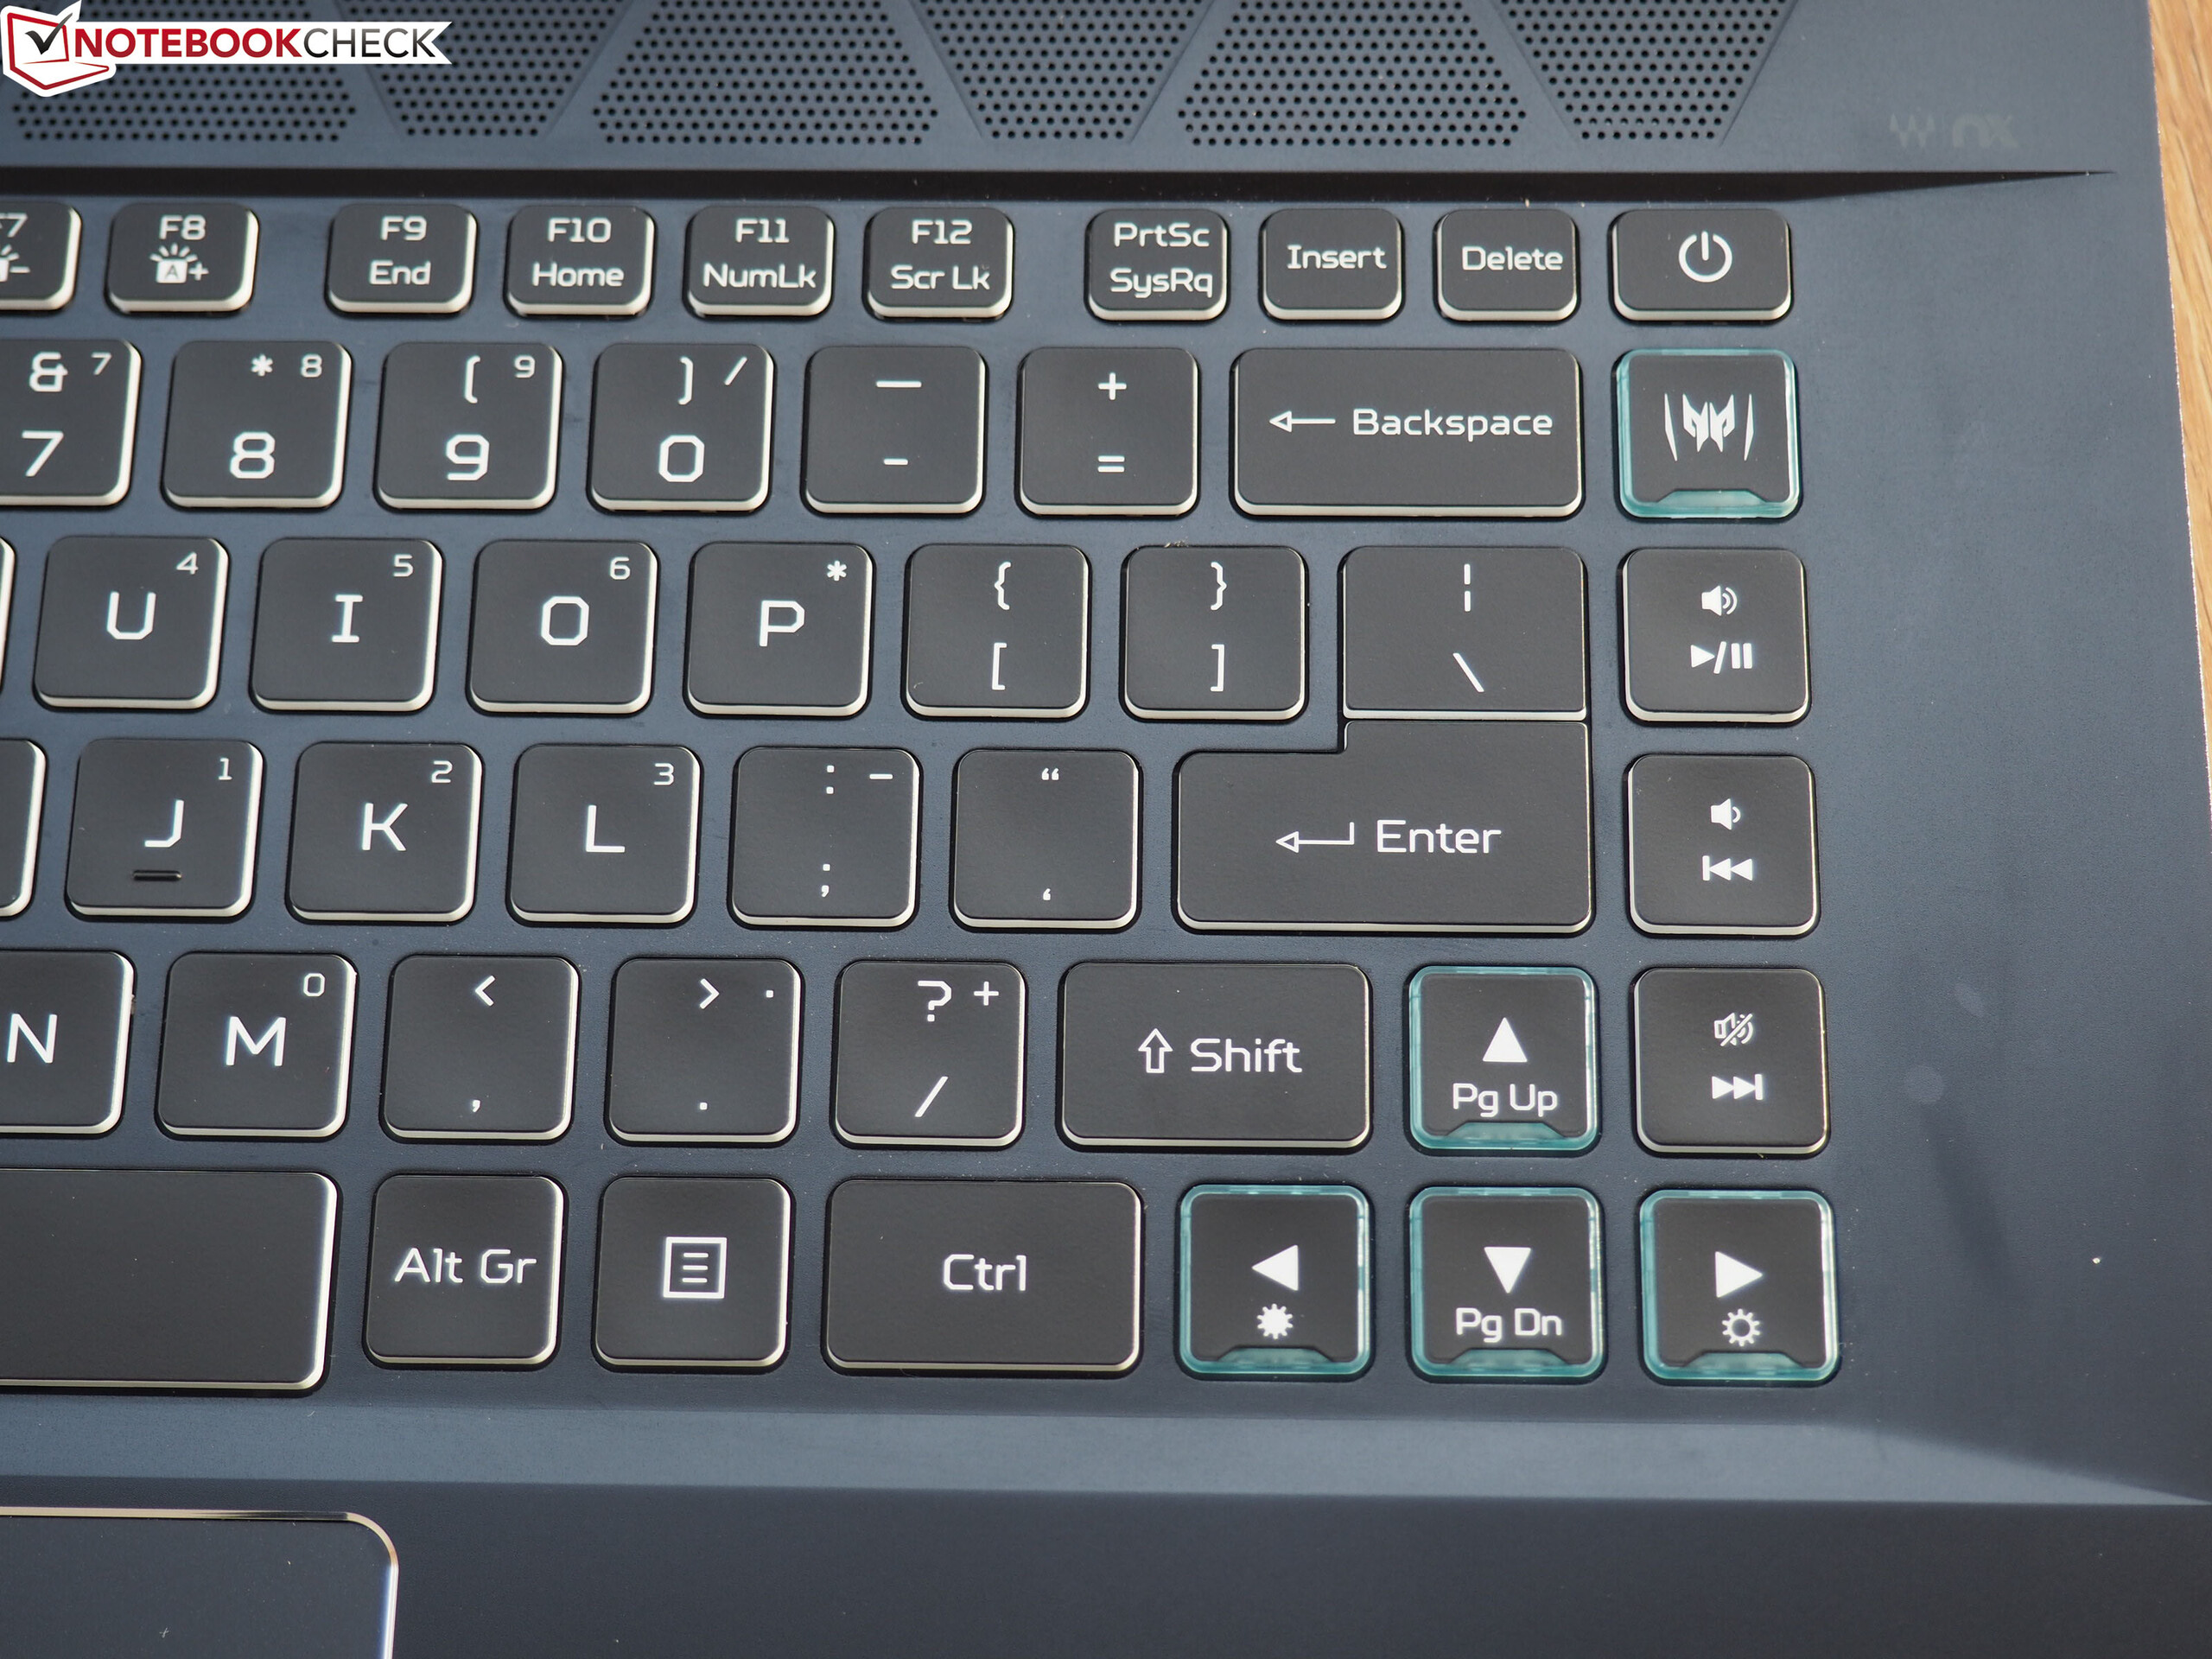
The input devices do not need to hide behind the competitors. As the keyboard, there is a chiclet model that has keys that are framed in white and can be easily identified even without the illumination (adjustable in several steps). Whether the lack of a number block is an advantage or disadvantage is a matter of taste. We would call the typing experience "good," even if it does not reach the level of a mechanical keyboard.
By the way, there is a special key between the fan vents on the top that activates the fan turbo. However, due to the enormous noise development, you might not want to use it much.
Touchpad
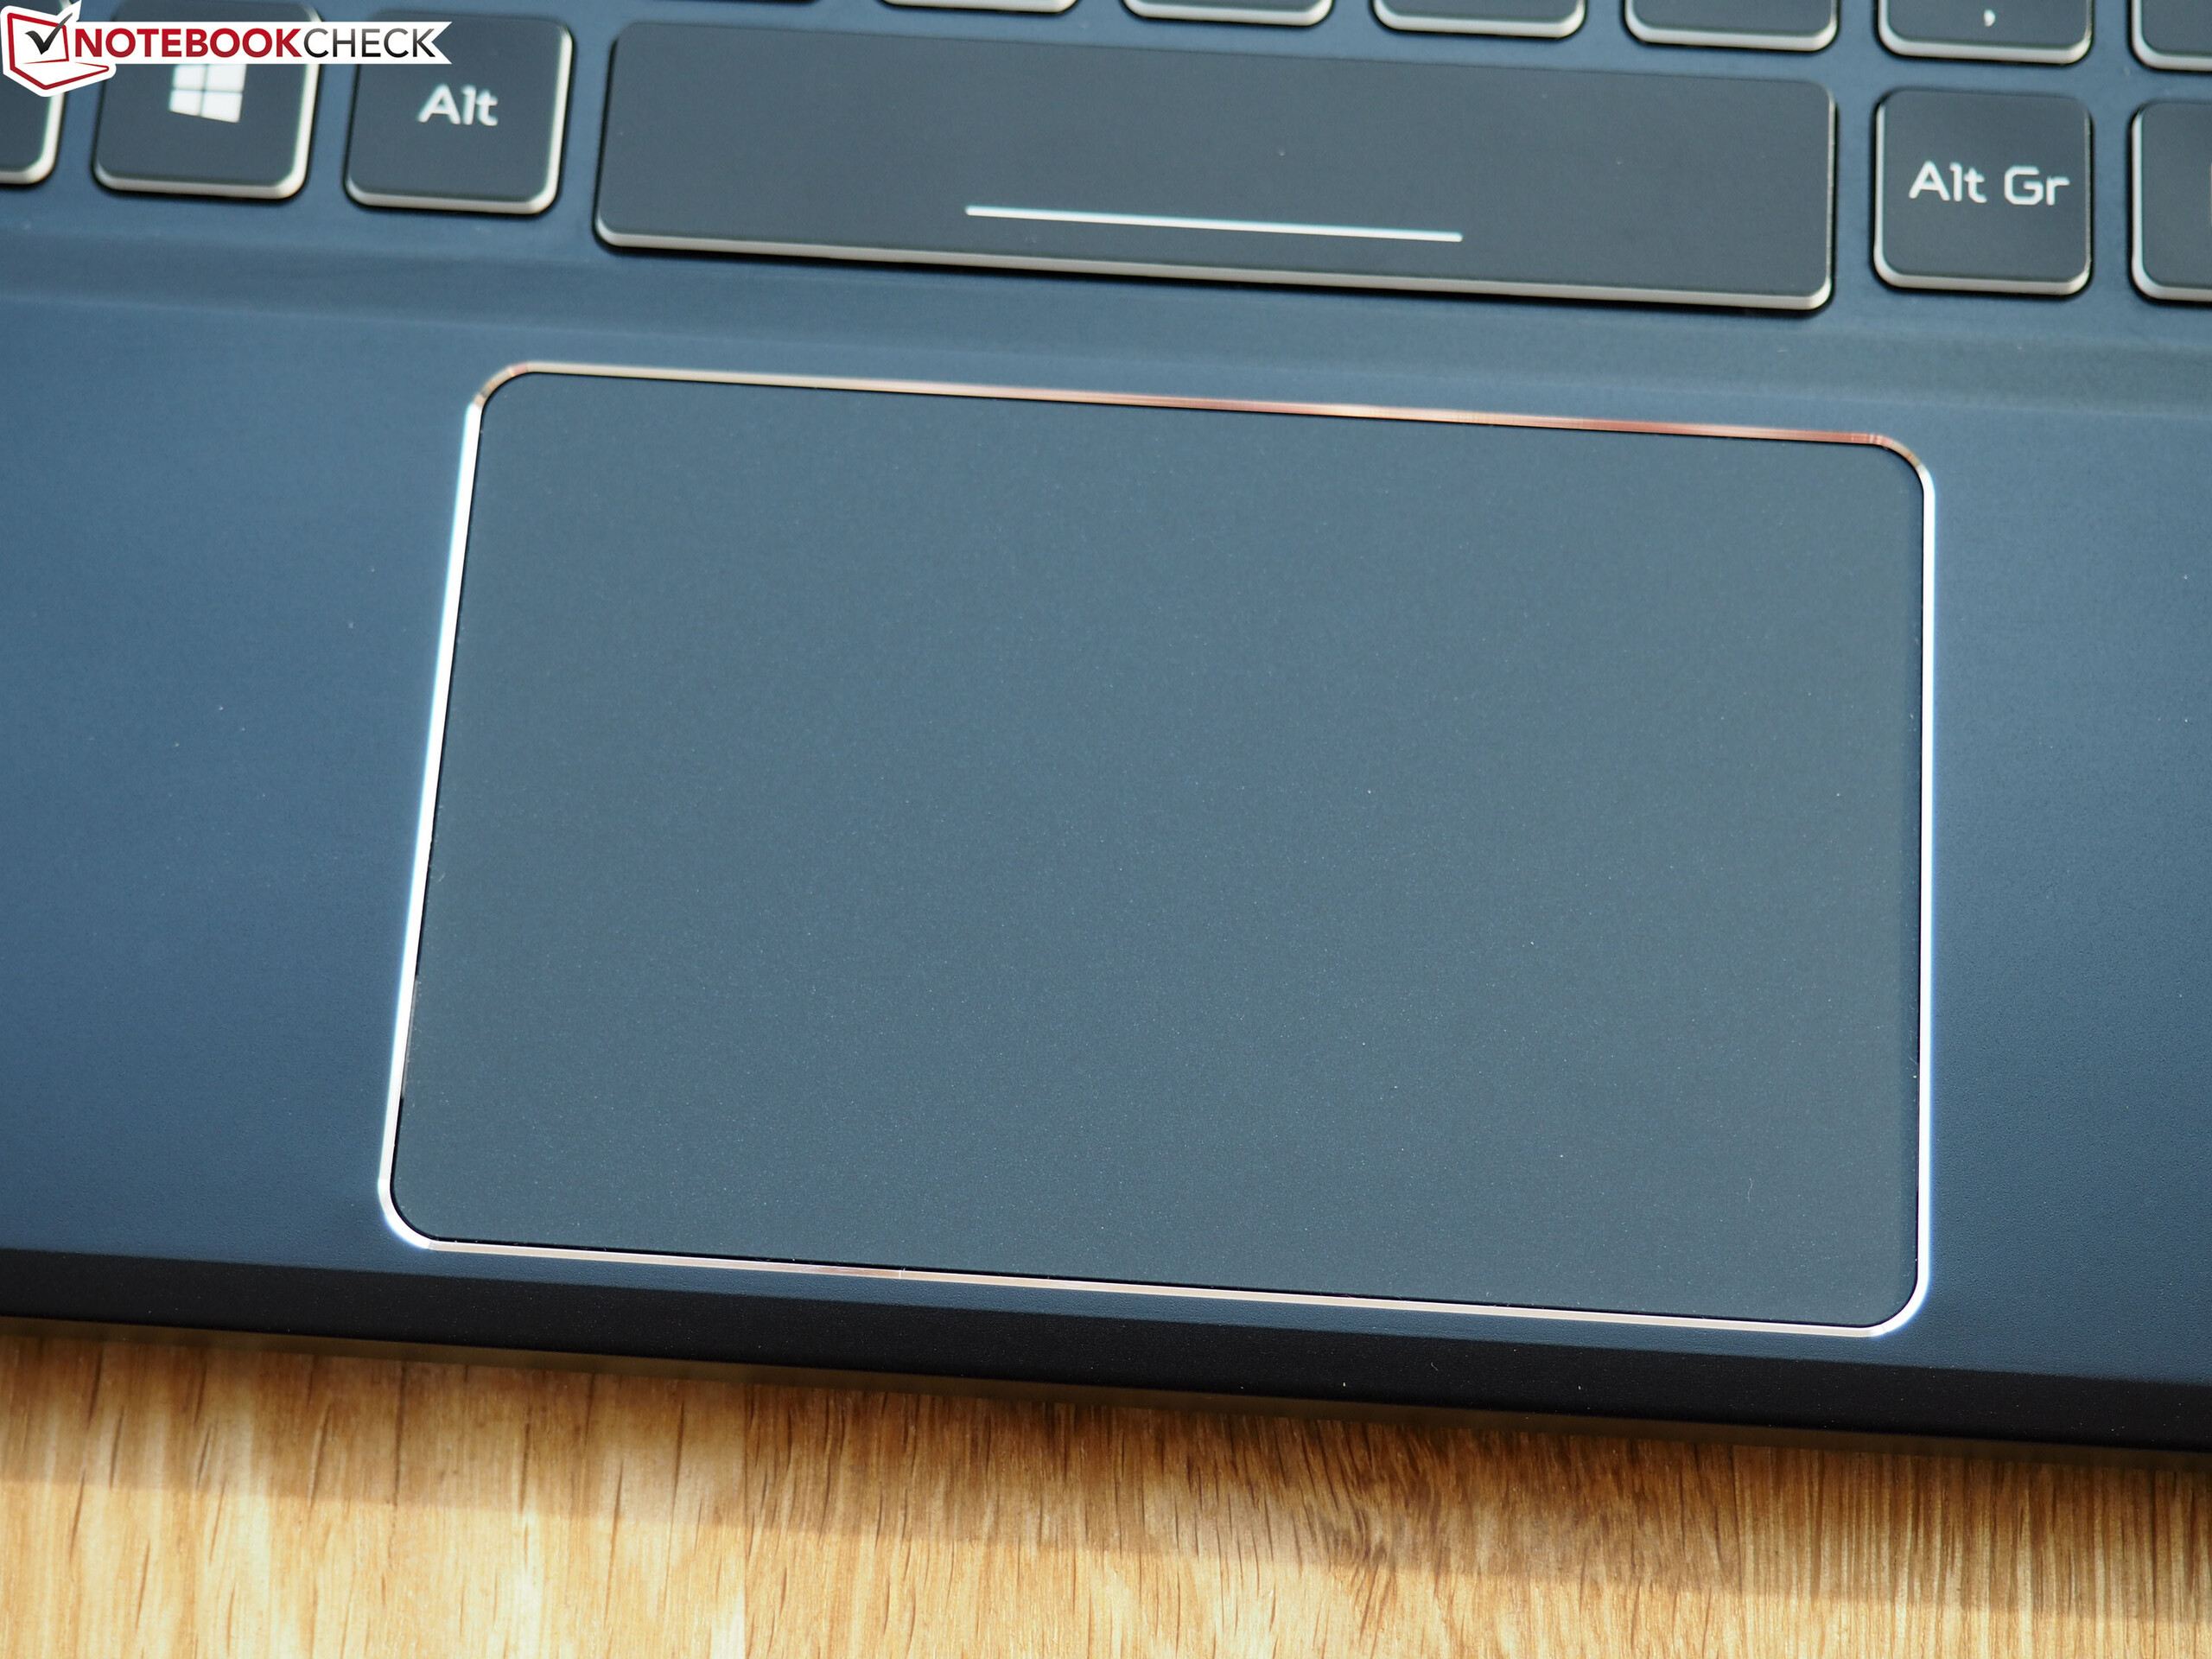
While the touchpad of the Triton 700 that resembled glass was hardly usable and quite annoying in practice, Acer has equipped the Triton 500 with a significantly more conventional model that - as is the case in most laptops - is placed below the keyboard instead of above. The smooth finish ensures great sliding characteristics. There is also hardly anything to complain about in terms of the precision. We particularly like the multi-touch support. Two-finger gestures such as zooming and scrolling work very smoothly. The size of the touchpad is about 10.6 x 6.6 cm (~4.2 x 2.6 in).
Display
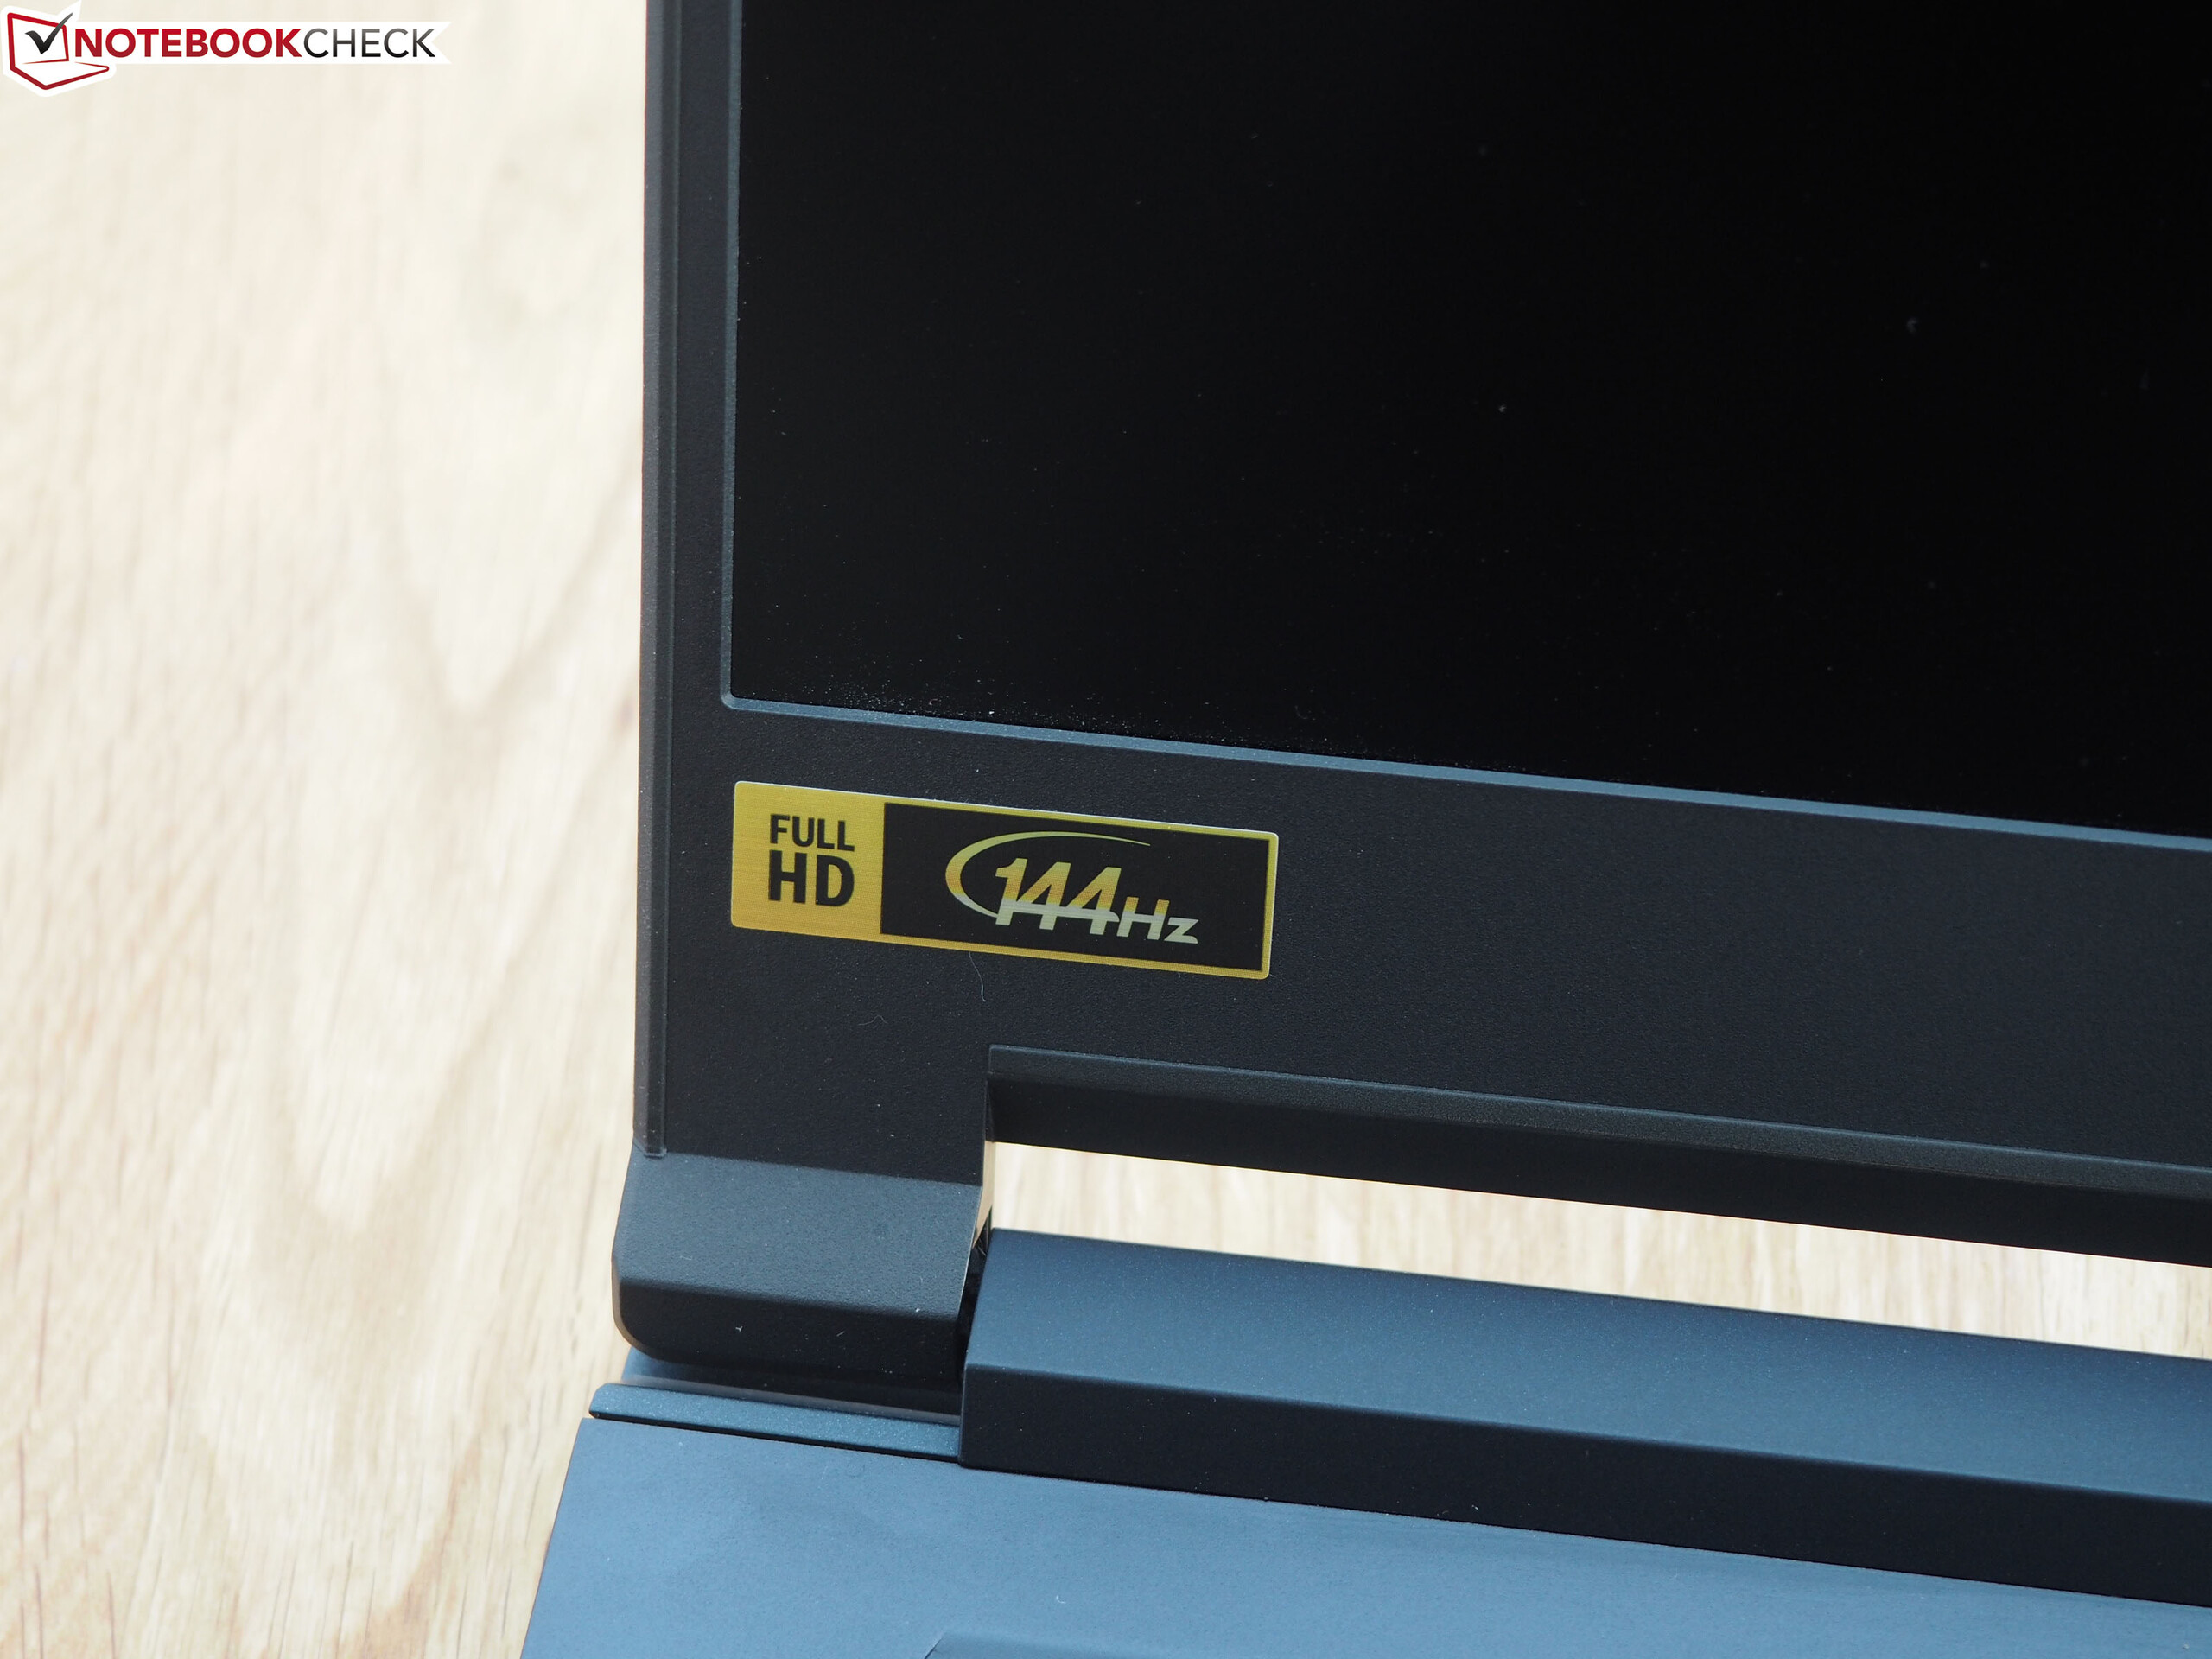
Like most of the gaming competitors, the Triton 500 is equipped with a Full HD IPS display. 144 Hz and G-Sync ensure an extremely smooth image - provided there are the corresponding FPS values. The panel used in our test unit is called AU Optronics B156HAN08.2 and is therefore slightly different than that of the Triton 700 (B156HAN04.2).
| |||||||||||||||||||||||||
Brightness Distribution: 89 %
Center on Battery: 304 cd/m²
Contrast: 1126:1 (Black: 0.27 cd/m²)
ΔE ColorChecker Calman: 4.66 | ∀{0.5-29.43 Ø4.71}
calibrated: 1.72
ΔE Greyscale Calman: 5.53 | ∀{0.09-98 Ø4.96}
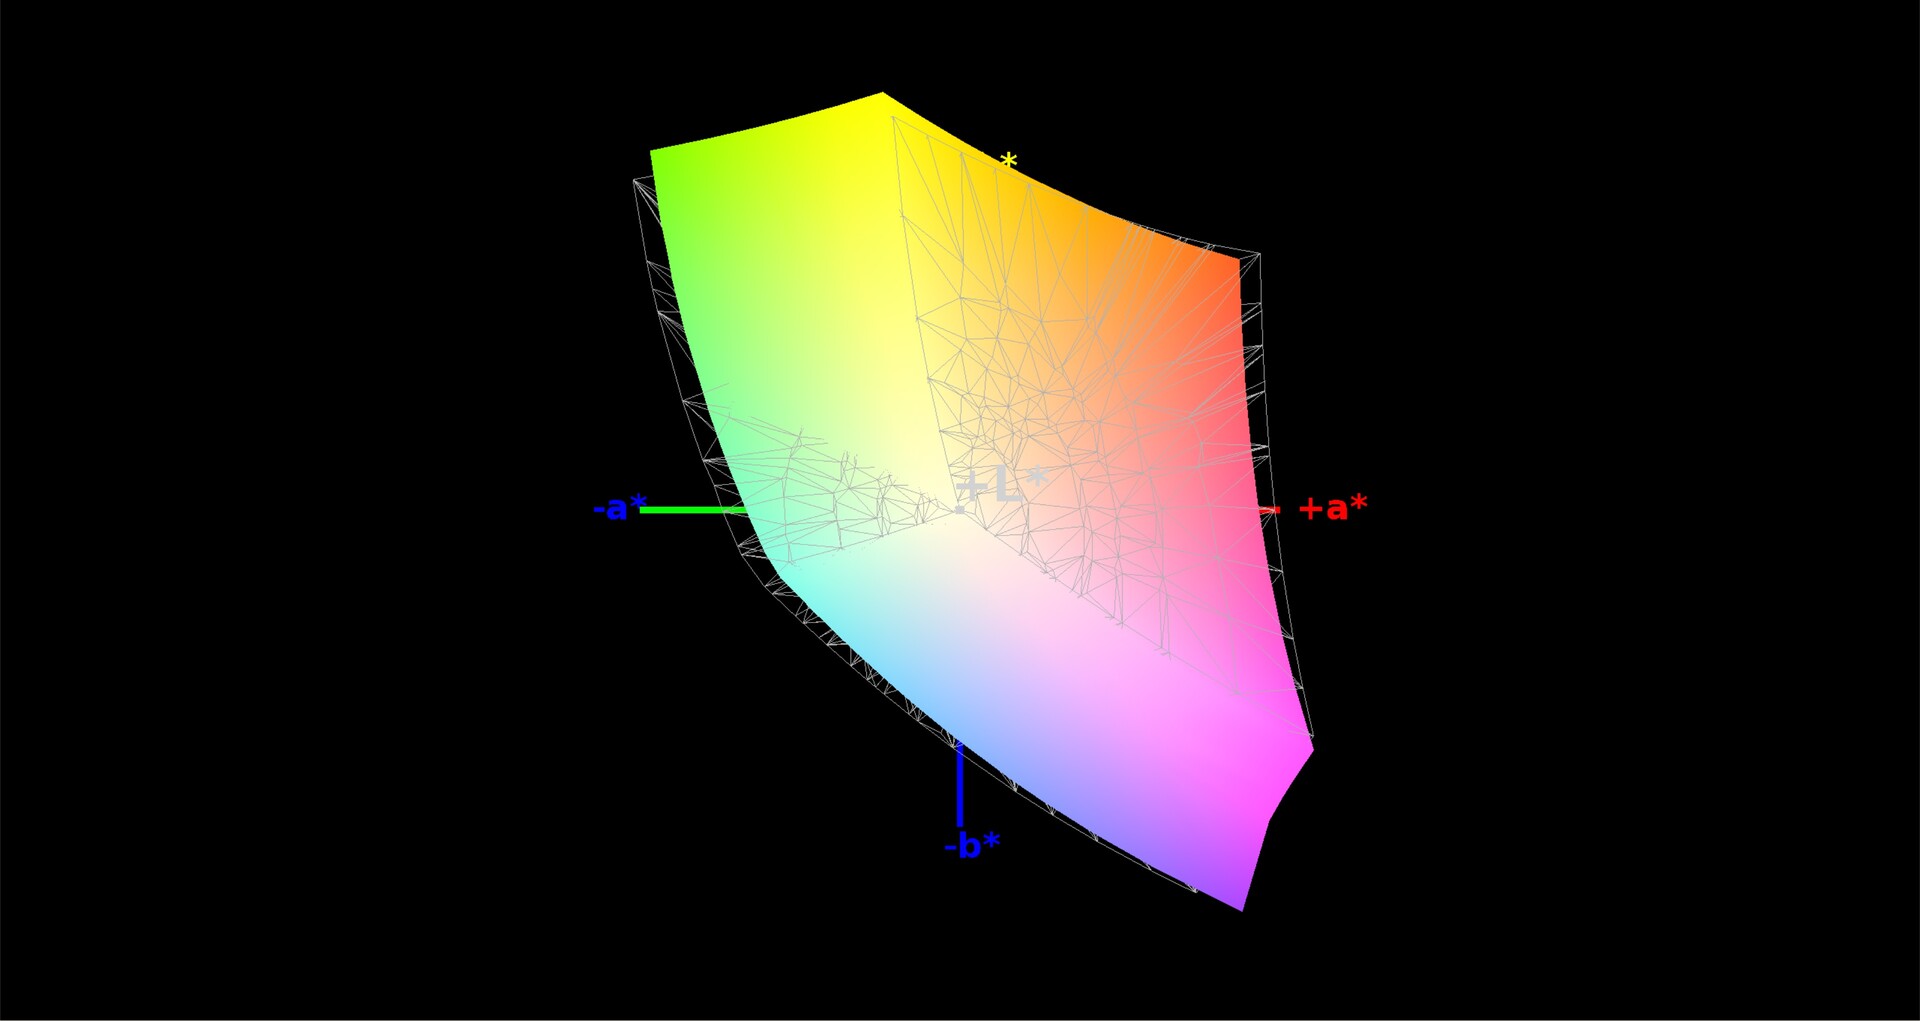
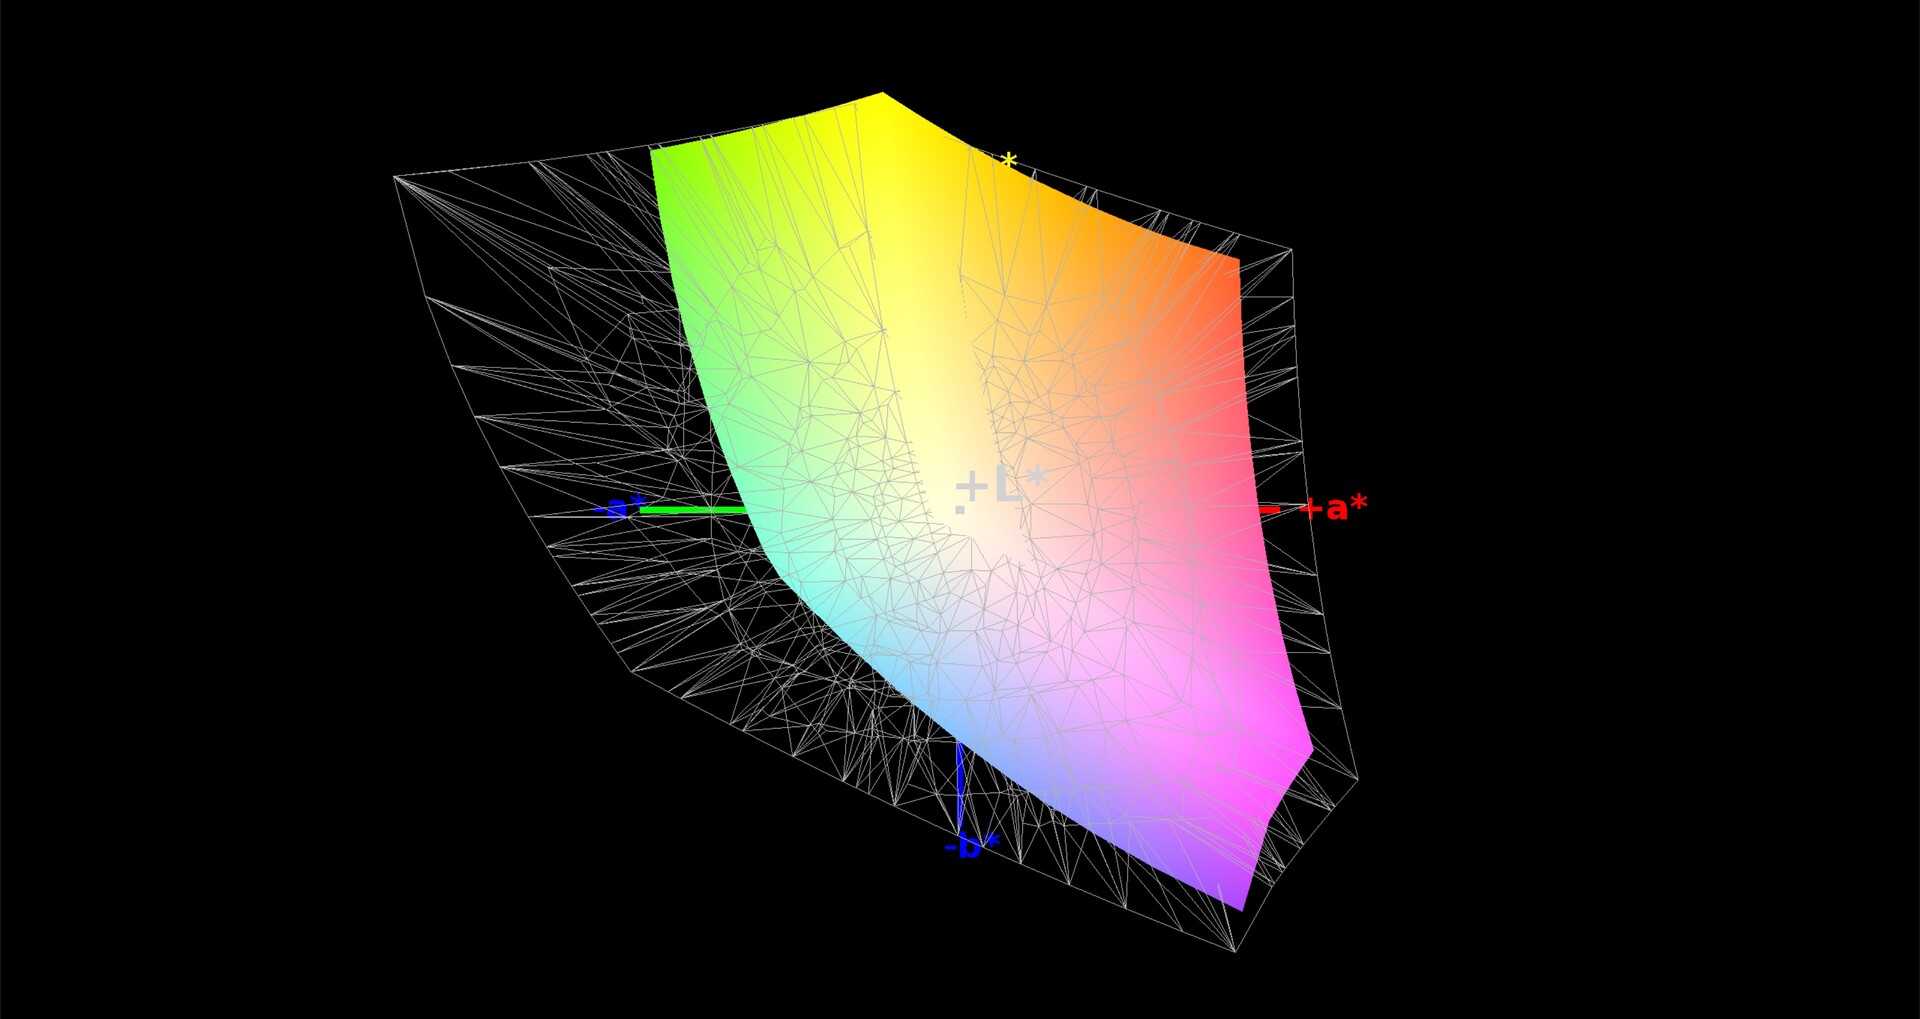
93% sRGB (Argyll 1.6.3 3D)
60% AdobeRGB 1998 (Argyll 1.6.3 3D)
65.7% AdobeRGB 1998 (Argyll 3D)
92.6% sRGB (Argyll 3D)
64.2% Display P3 (Argyll 3D)
Gamma: 2.5
CCT: 8028 K
| Acer Predator Triton 500 AU Optronics B156HAN08.2 (AUO82ED), IPS, 1920x1080 | Gigabyte Aero 15-X9 LGD05C0, IPS, 1920x1080 | Razer Blade 15 RTX 2070 Max-Q LG Philips LGD05C0, IPS, 1920x1080 | MSI GS65 8RF-019DE Stealth Thin AU Optronics B156HAN08.0 (AUO80ED), IPS, 1920x1080 | Asus Zephyrus S GX531GS AU Optronics B156HAN08.2 (AUO82ED), IPS, 1920x1080 | |
|---|---|---|---|---|---|
| Display | -1% | 2% | 1% | 1% | |
| Display P3 Coverage (%) | 64.2 | 63.5 -1% | 65.3 2% | 66.2 3% | 66.7 4% |
| sRGB Coverage (%) | 92.6 | 93.1 1% | 94.9 2% | 92.1 -1% | 91.2 -2% |
| AdobeRGB 1998 Coverage (%) | 65.7 | 64.5 -2% | 66.3 1% | 67.2 2% | 66.7 2% |
| Response Times | -63% | -57% | -67% | 9% | |
| Response Time Grey 50% / Grey 80% * (ms) | 8 ? | 16.4 ? -105% | 16.8 ? -110% | 17.6 ? -120% | 7.4 ? 7% |
| Response Time Black / White * (ms) | 11.2 ? | 13.6 ? -21% | 11.6 ? -4% | 12.8 ? -14% | 10 ? 11% |
| PWM Frequency (Hz) | |||||
| Screen | 15% | 7% | 14% | 11% | |
| Brightness middle (cd/m²) | 304 | 250 -18% | 314.7 4% | 254 -16% | 294 -3% |
| Brightness (cd/m²) | 299 | 235 -21% | 312 4% | 262 -12% | 275 -8% |
| Brightness Distribution (%) | 89 | 85 -4% | 90 1% | 89 0% | 84 -6% |
| Black Level * (cd/m²) | 0.27 | 0.29 -7% | 0.38 -41% | 0.22 19% | 0.24 11% |
| Contrast (:1) | 1126 | 862 -23% | 828 -26% | 1155 3% | 1225 9% |
| Colorchecker dE 2000 * | 4.66 | 1.46 69% | 2.56 45% | 2.37 49% | 2.57 45% |
| Colorchecker dE 2000 max. * | 9.65 | 2.47 74% | 4.89 49% | 4.71 51% | 4.88 49% |
| Colorchecker dE 2000 calibrated * | 1.72 | 1.71 1% | 1.84 -7% | 2.14 -24% | |
| Greyscale dE 2000 * | 5.53 | 1.27 77% | 3.4 39% | 1.58 71% | 2.41 56% |
| Gamma | 2.5 88% | 2.4 92% | 2.3 96% | 2.48 89% | 2.5 88% |
| CCT | 8028 81% | 6749 96% | 6435 101% | 6785 96% | 6370 102% |
| Color Space (Percent of AdobeRGB 1998) (%) | 60 | 60 0% | 60.7 1% | 60 0% | 59 -2% |
| Color Space (Percent of sRGB) (%) | 93 | 93 0% | 94.6 2% | 92 -1% | 91 -2% |
| Total Average (Program / Settings) | -16% /
1% | -16% /
-2% | -17% /
2% | 7% /
9% |
* ... smaller is better
The measured values are definitely impressive. A contrast of almost 1130:1 is just as good for an IPS panel as a black value of 0.27 cd/m². While a brightness of about 300 cd/m² is also decent, it could have been more for improving readability outdoors.
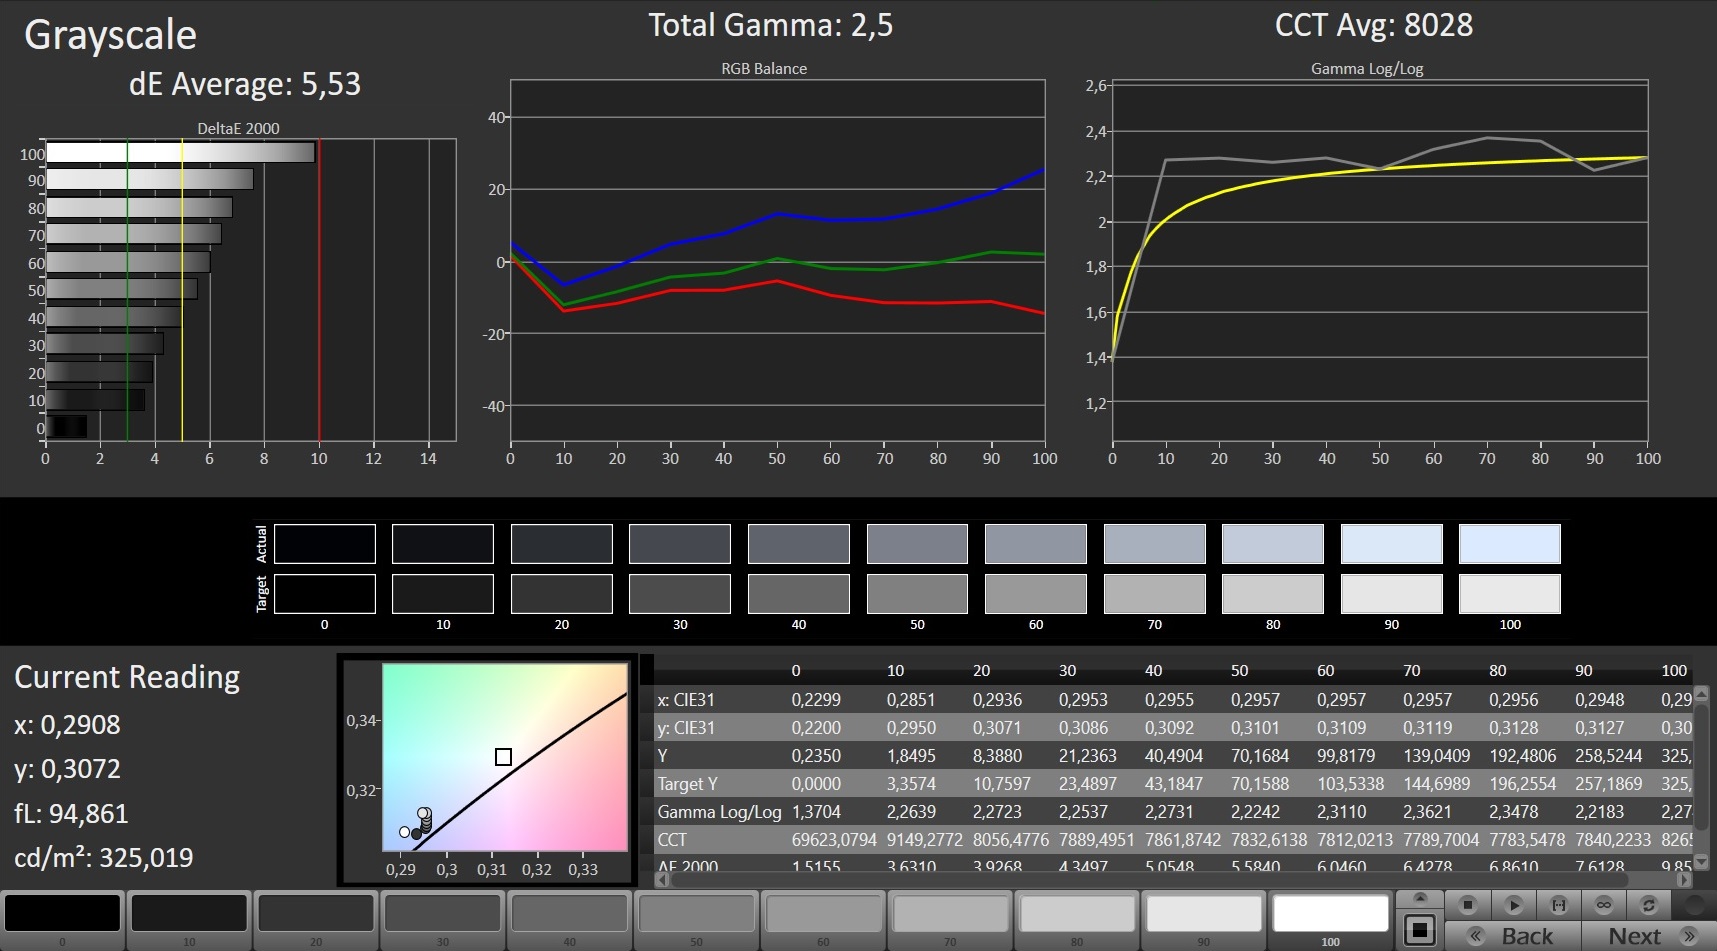
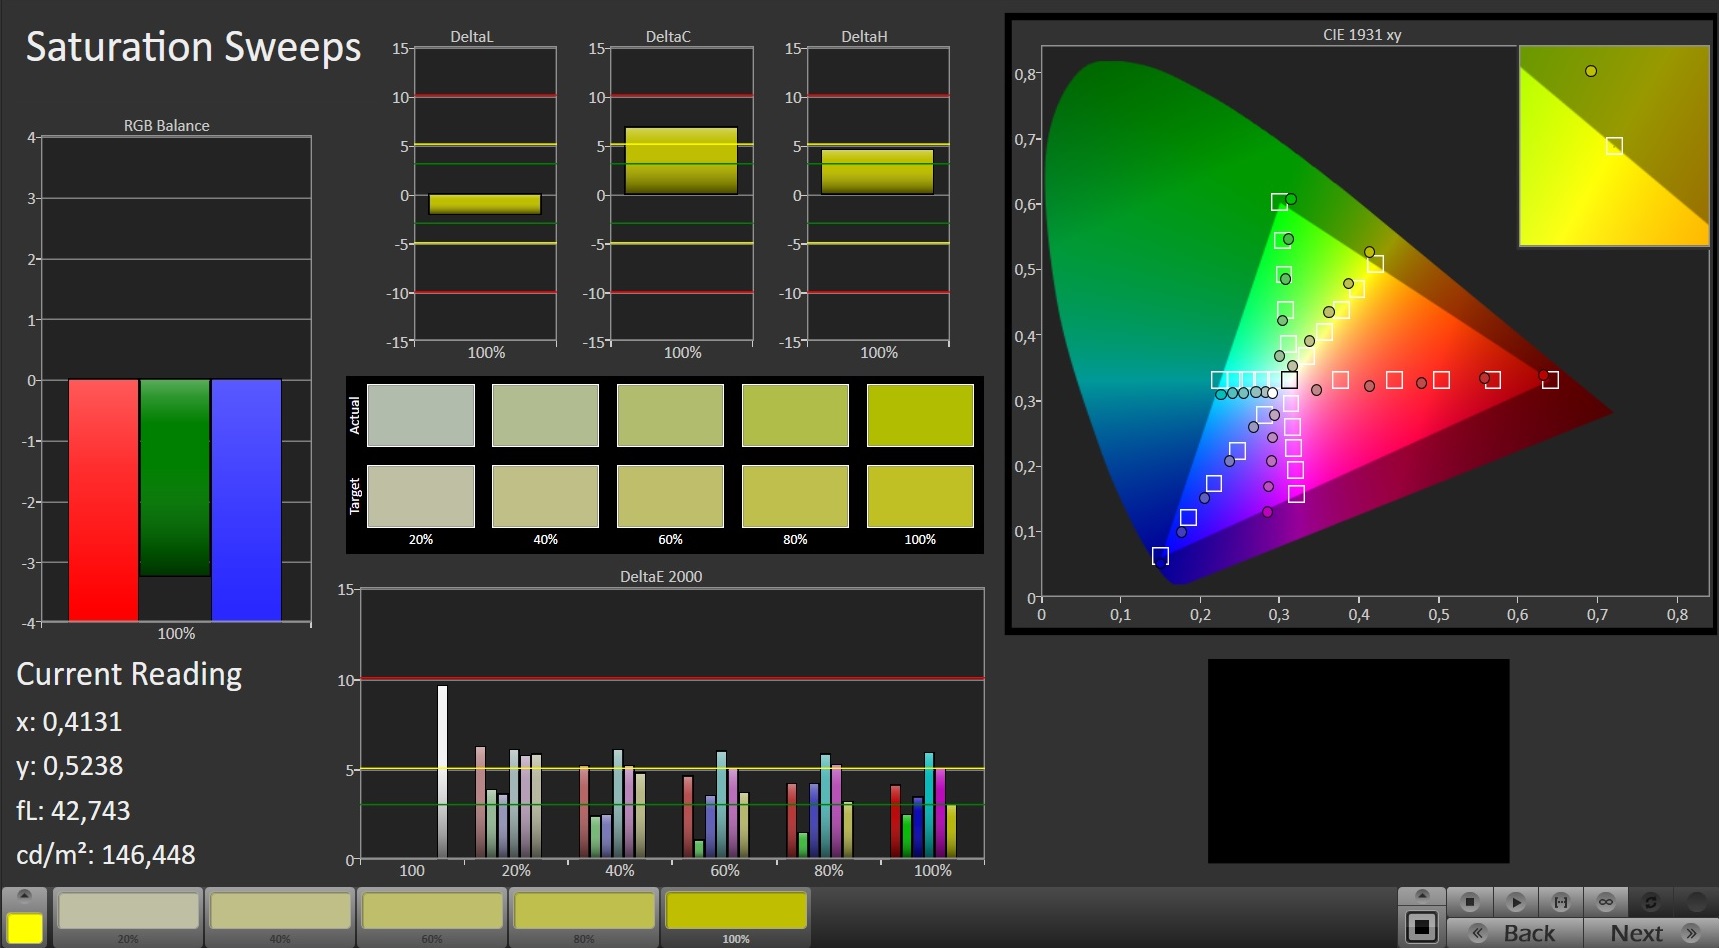
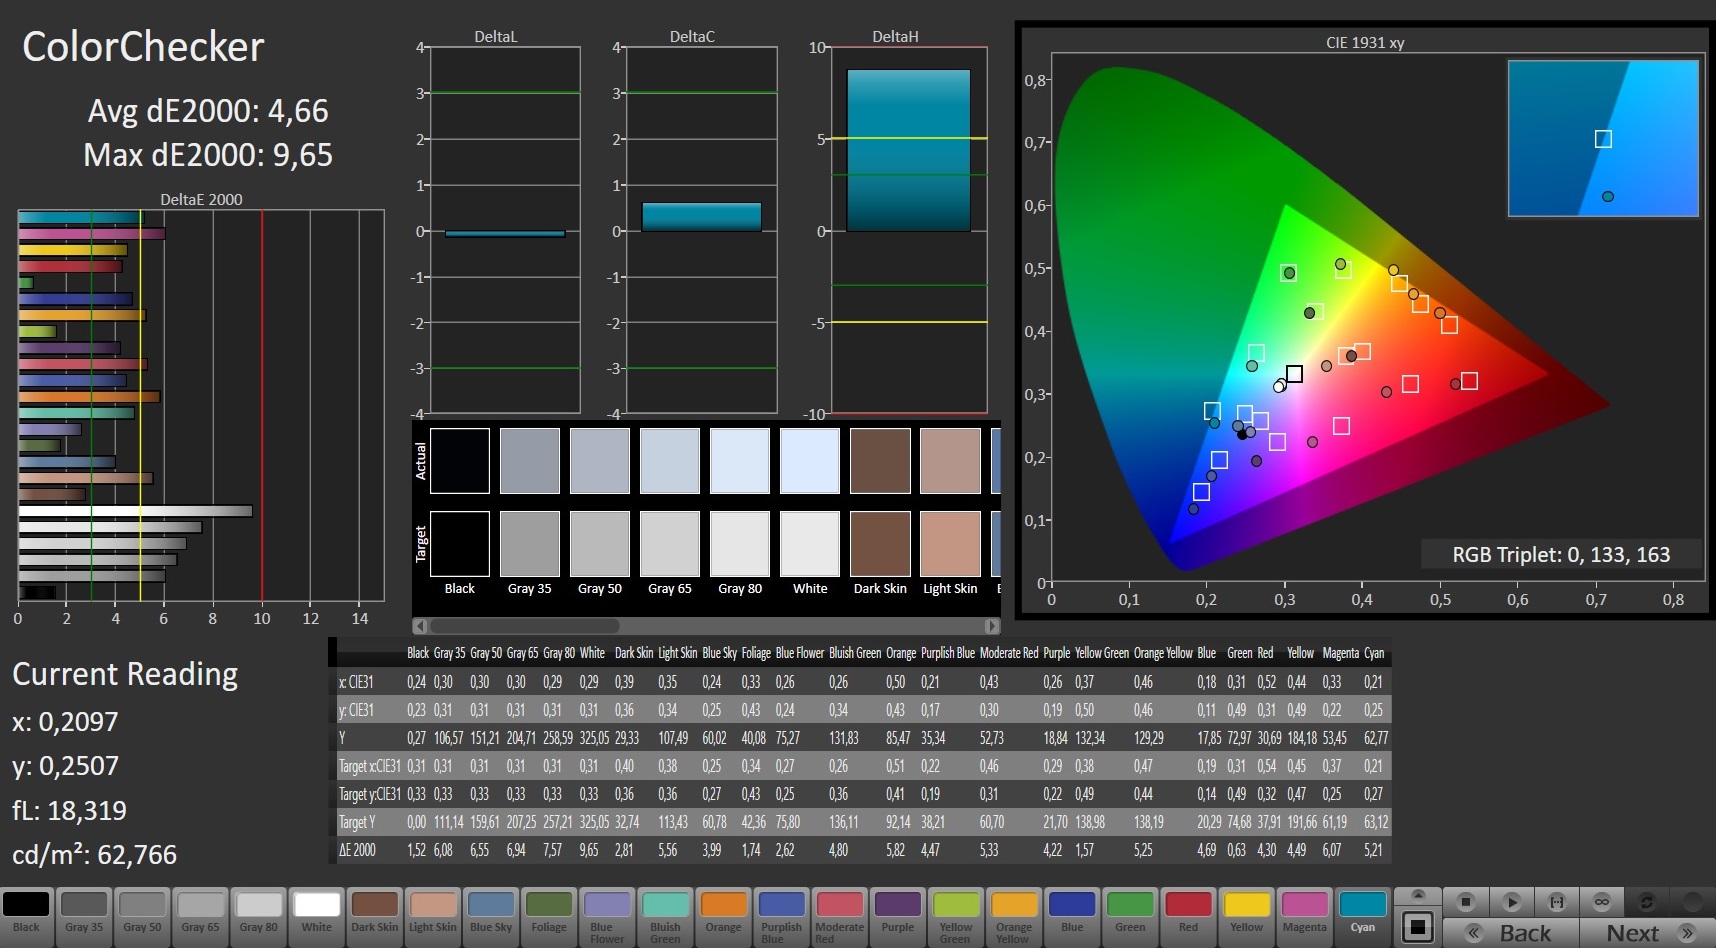
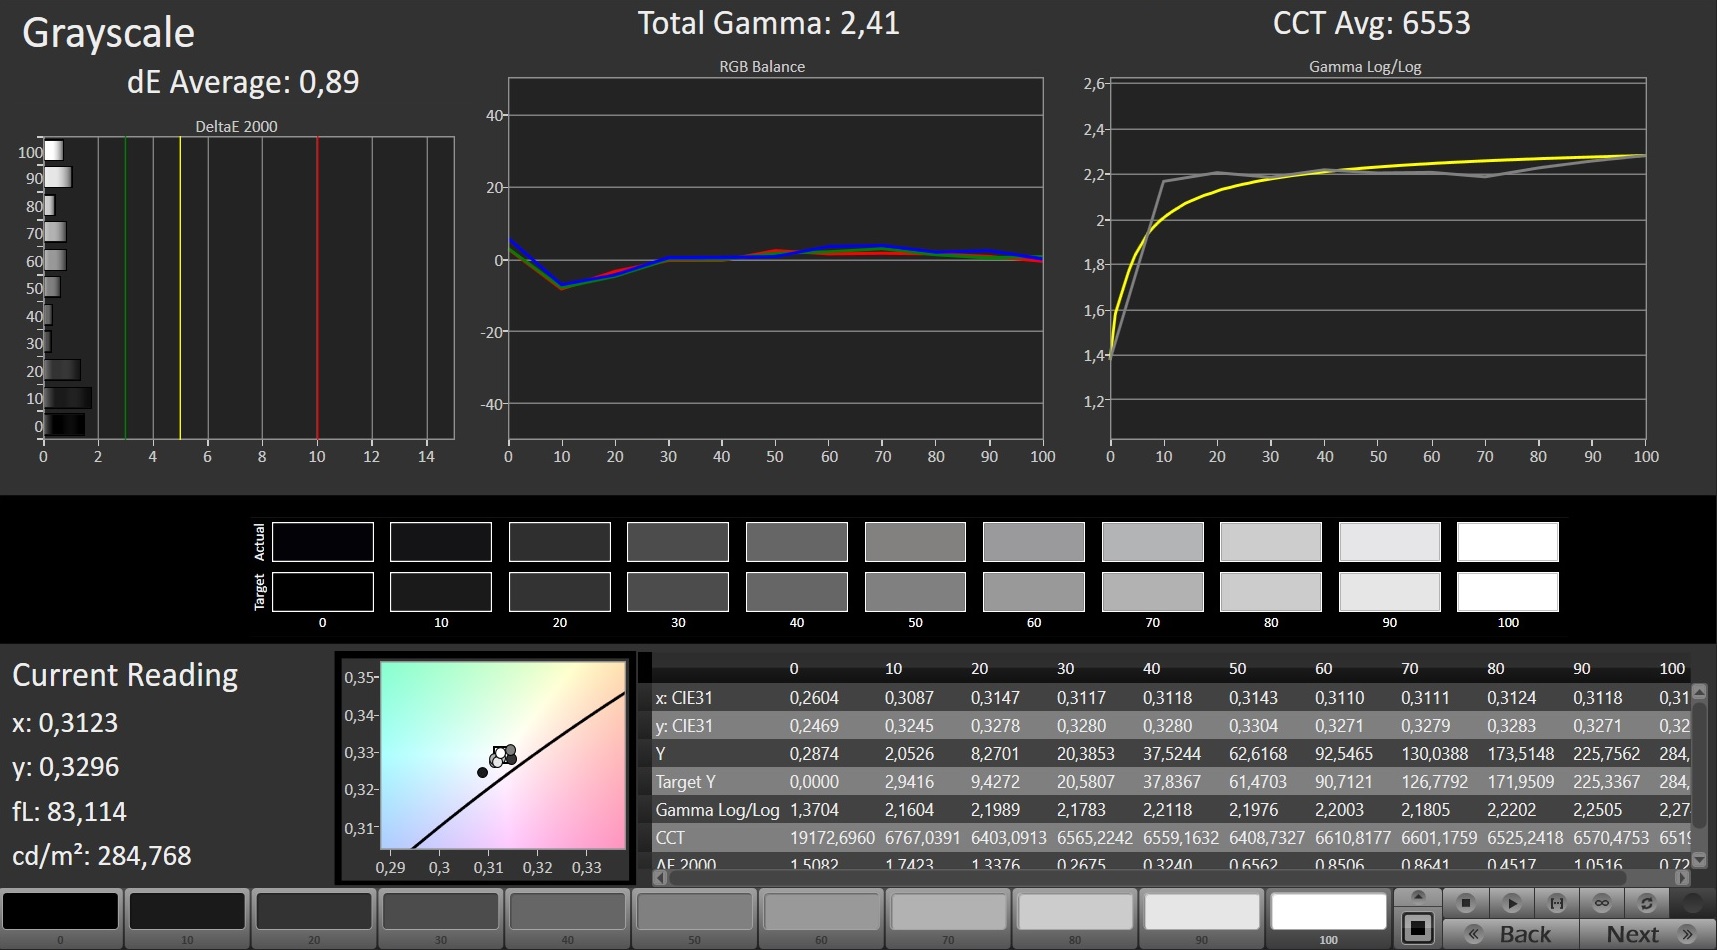
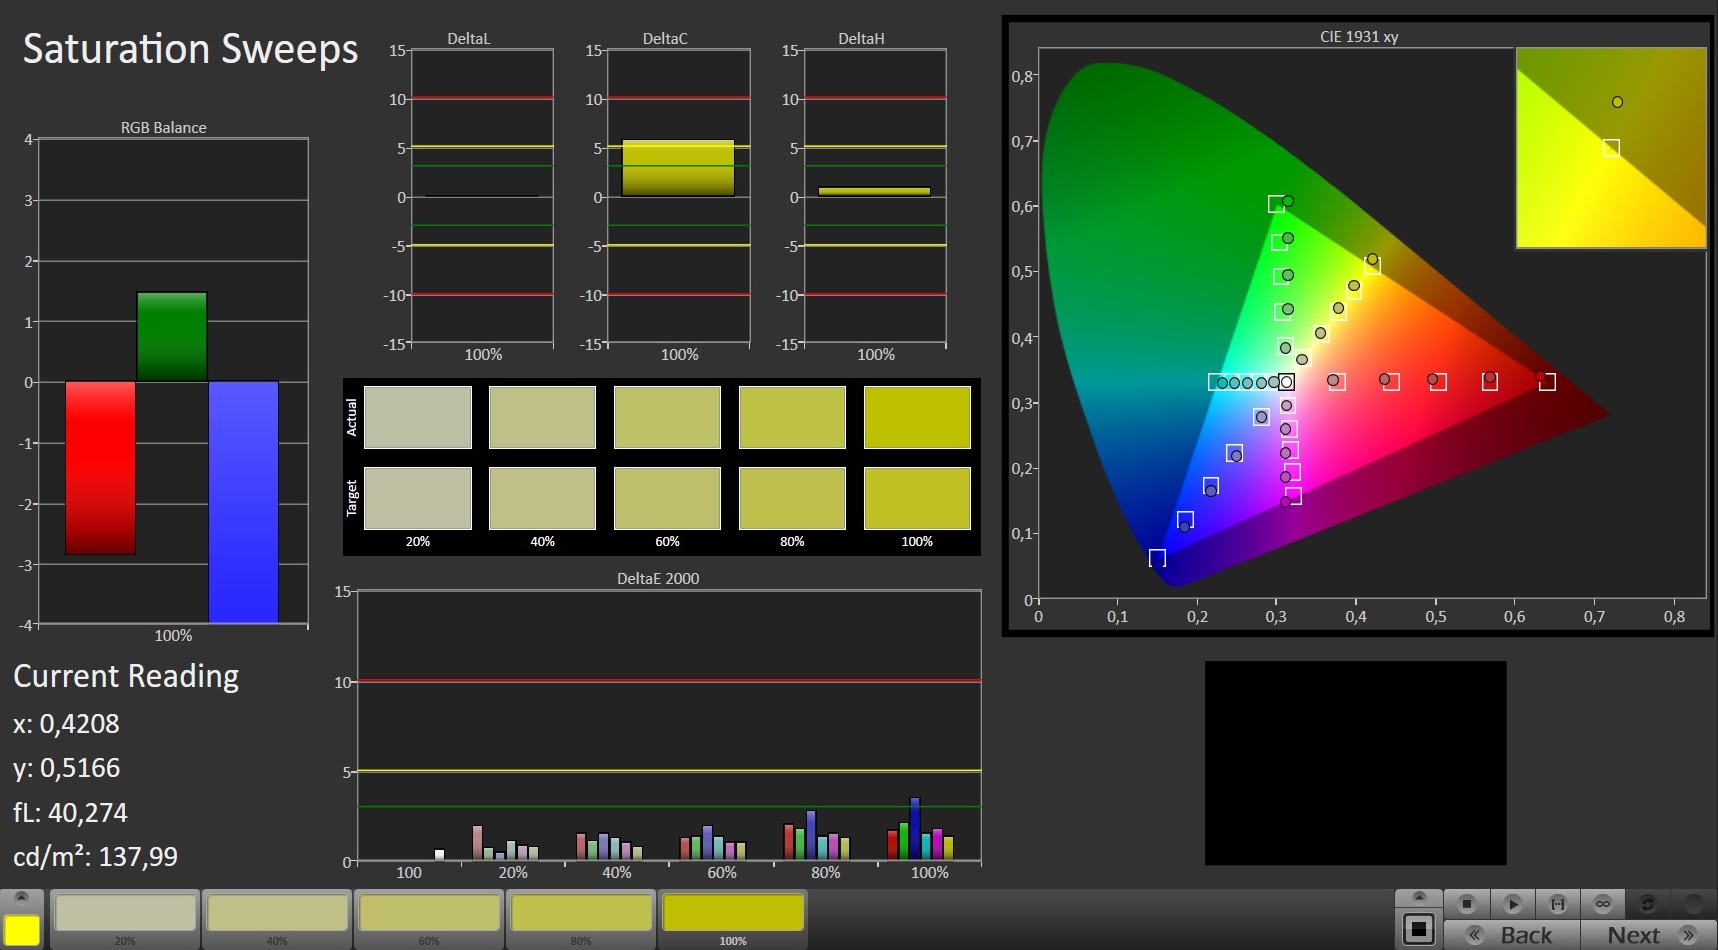
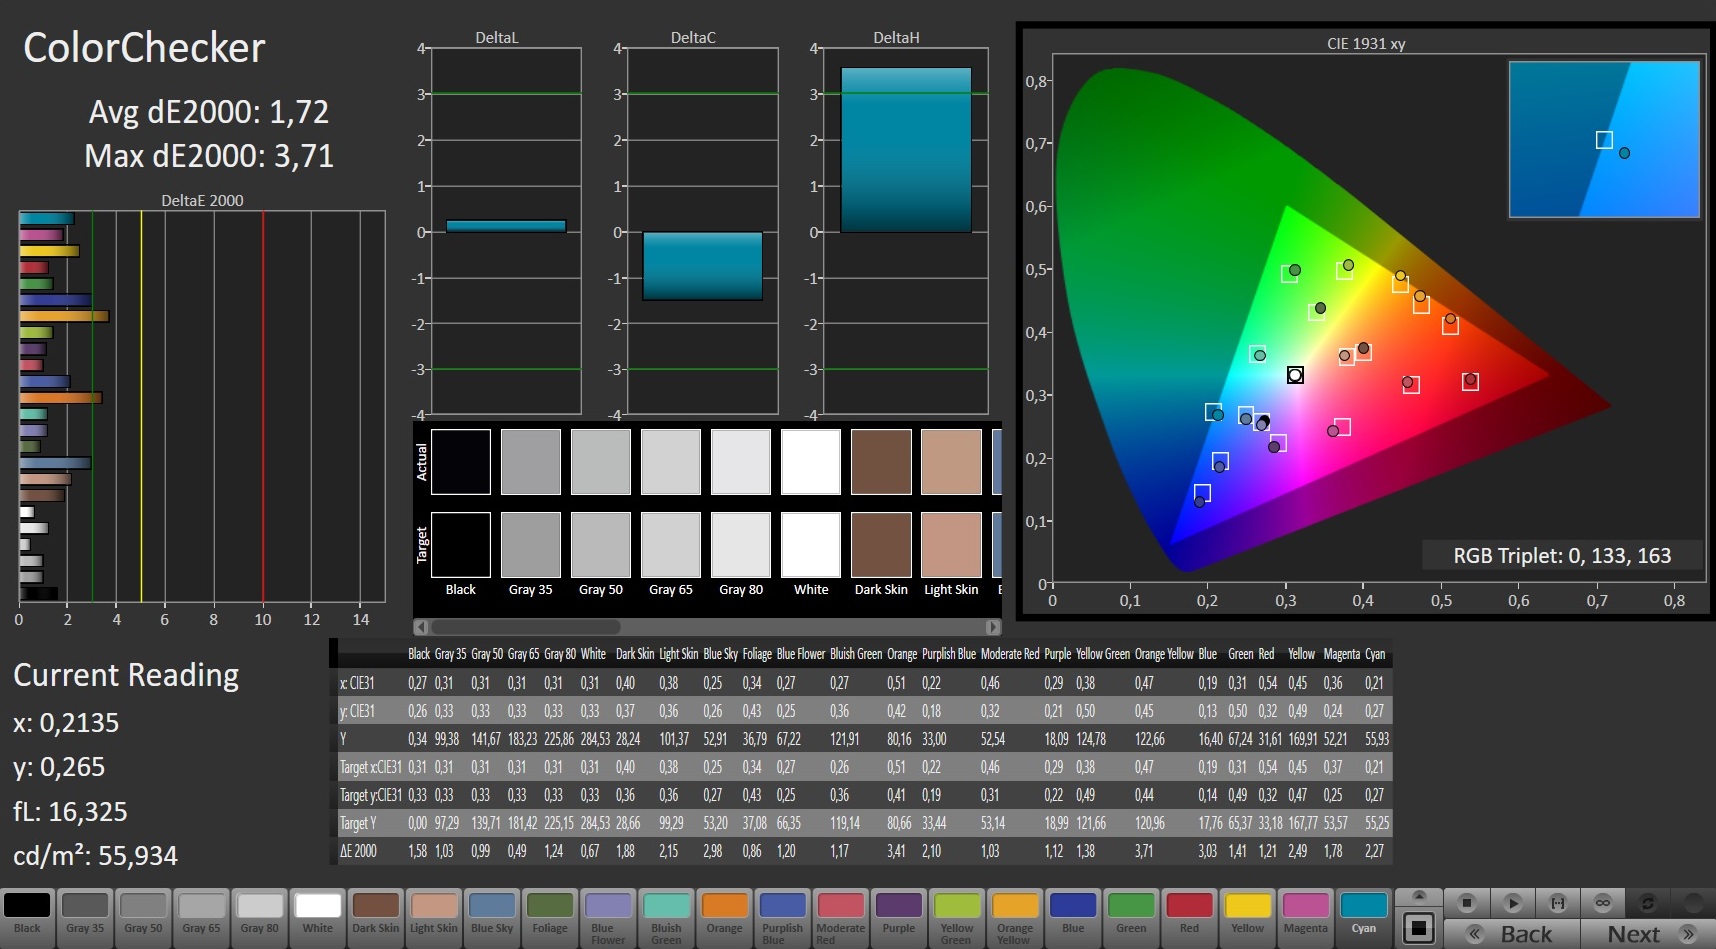
The color accuracy of the 15-inch screen ranges in the middle of the field. The blue tint that is there can be removed via calibration or by using the linked ICC file. In terms of the color space, we measured 93% sRGB and 60% AdobeRGB, which is completely sufficient from a gaming and multimedia perspective.
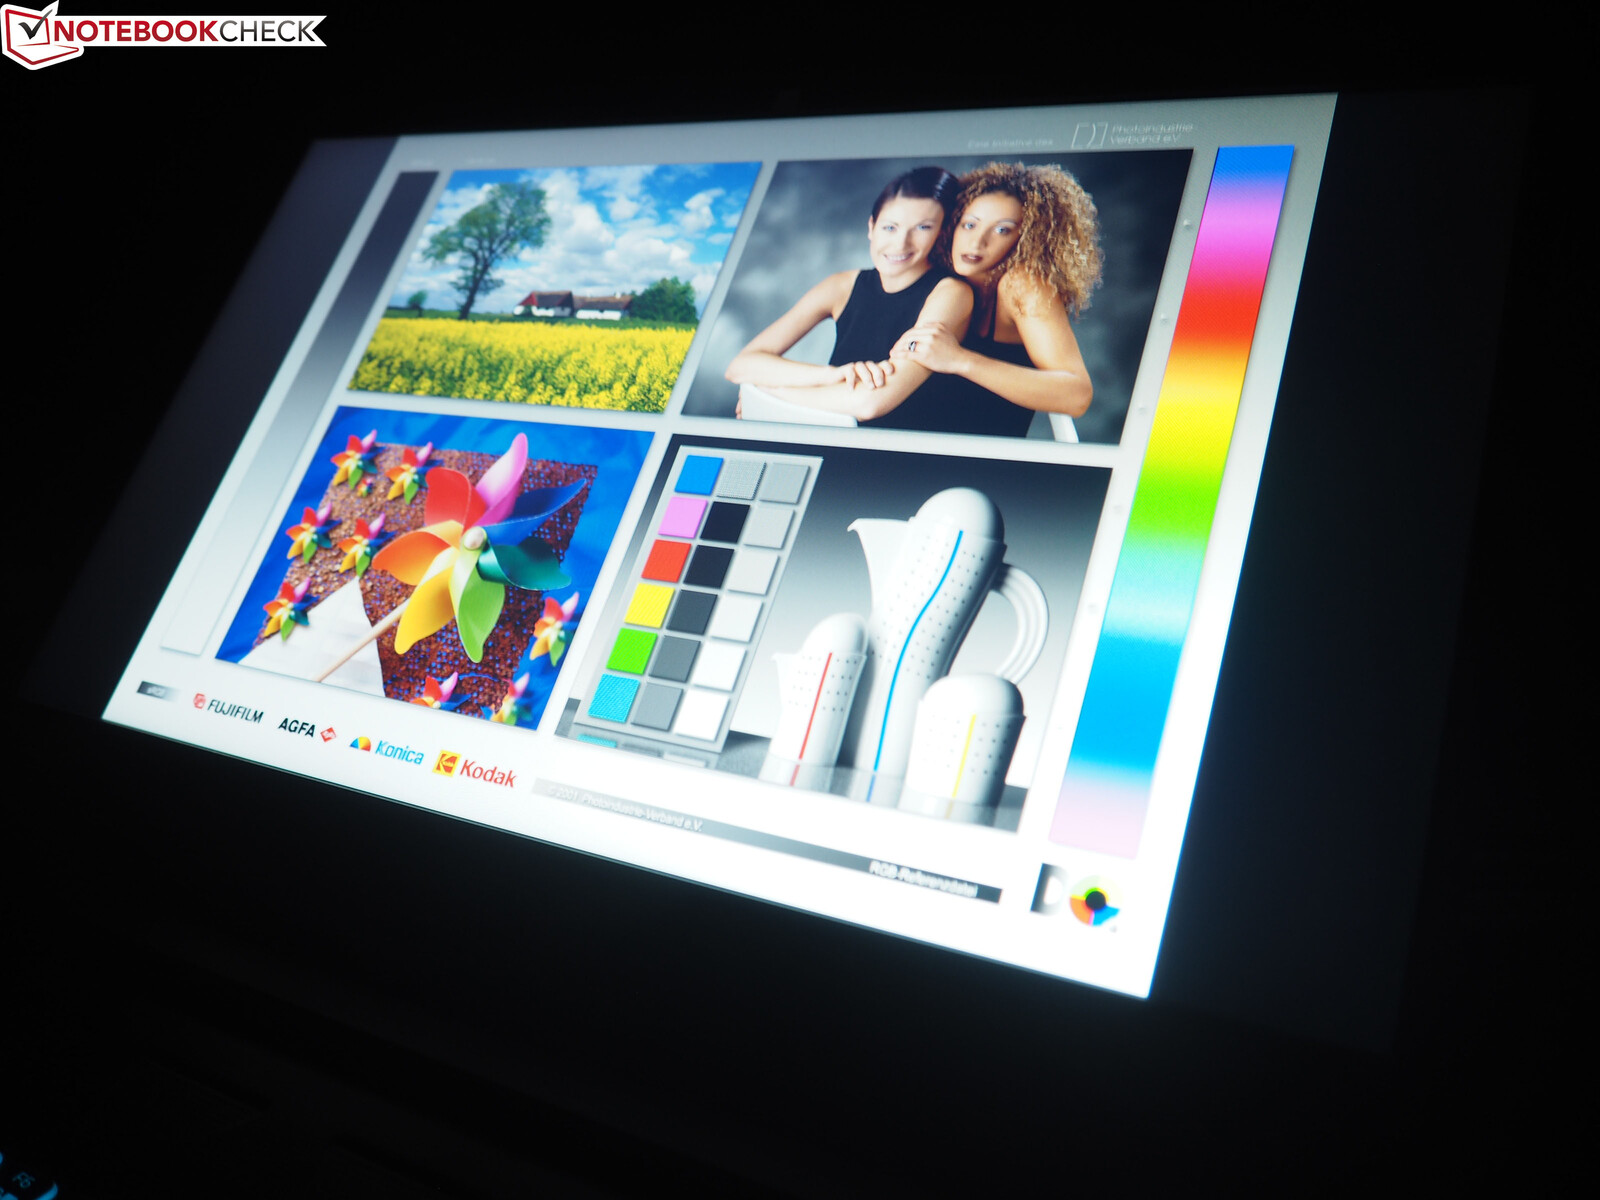
As is typical for IPS panels, the viewing-angle stability is good, so that sitting at an angle from the screen will not pose a problem. The response time also gives no reason for complaint. At first glance, 8 ms gray-to-gray points to a TN panel.
Display Response Times
| ↔ Response Time Black to White | ||
|---|---|---|
| 11.2 ms ... rise ↗ and fall ↘ combined | ↗ 6 ms rise | 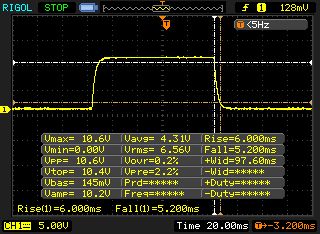 |
| ↘ 5.2 ms fall | ||
| The screen shows good response rates in our tests, but may be too slow for competitive gamers. In comparison, all tested devices range from 0.1 (minimum) to 240 (maximum) ms. » 30 % of all devices are better. This means that the measured response time is better than the average of all tested devices (19.8 ms). | ||
| ↔ Response Time 50% Grey to 80% Grey | ||
| 8 ms ... rise ↗ and fall ↘ combined | ↗ 4 ms rise | 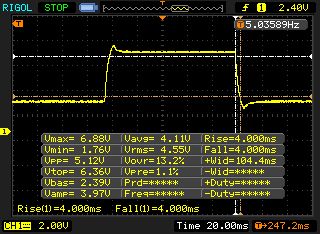 |
| ↘ 4 ms fall | ||
| The screen shows fast response rates in our tests and should be suited for gaming. In comparison, all tested devices range from 0.165 (minimum) to 636 (maximum) ms. » 21 % of all devices are better. This means that the measured response time is better than the average of all tested devices (31 ms). | ||
Screen Flickering / PWM (Pulse-Width Modulation)
| Screen flickering / PWM not detected |  | ||
In comparison: 52 % of all tested devices do not use PWM to dim the display. If PWM was detected, an average of 7757 (minimum: 5 - maximum: 343500) Hz was measured. | |||
Performance
The hexa-core CPU and the high-end GPU promise ample power for current games. Fitting to that, Acer has equipped it with a fast SSD duo and more than sufficient RAM for the next few years.
Processor
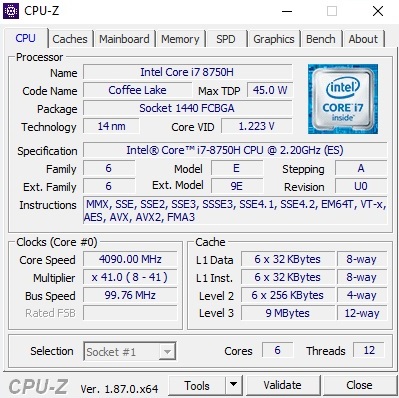
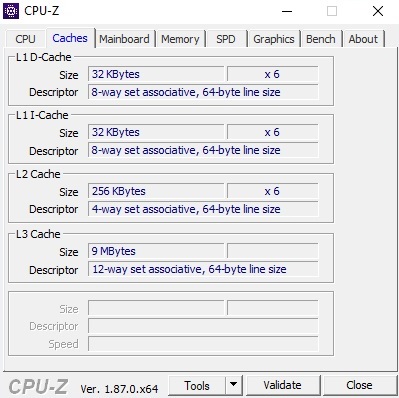
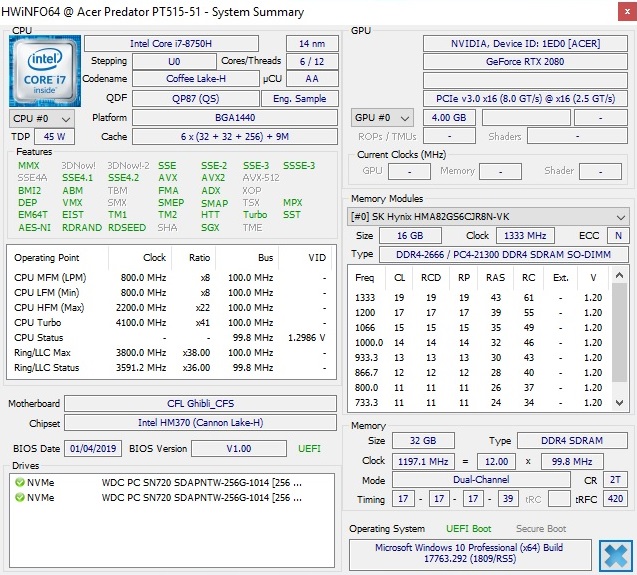
The more-expensive models of the Triton 500 have an Intel Core i7-8750H with six cores that are able to operate on up to 12 threads in parallel via Hyper-Threading.
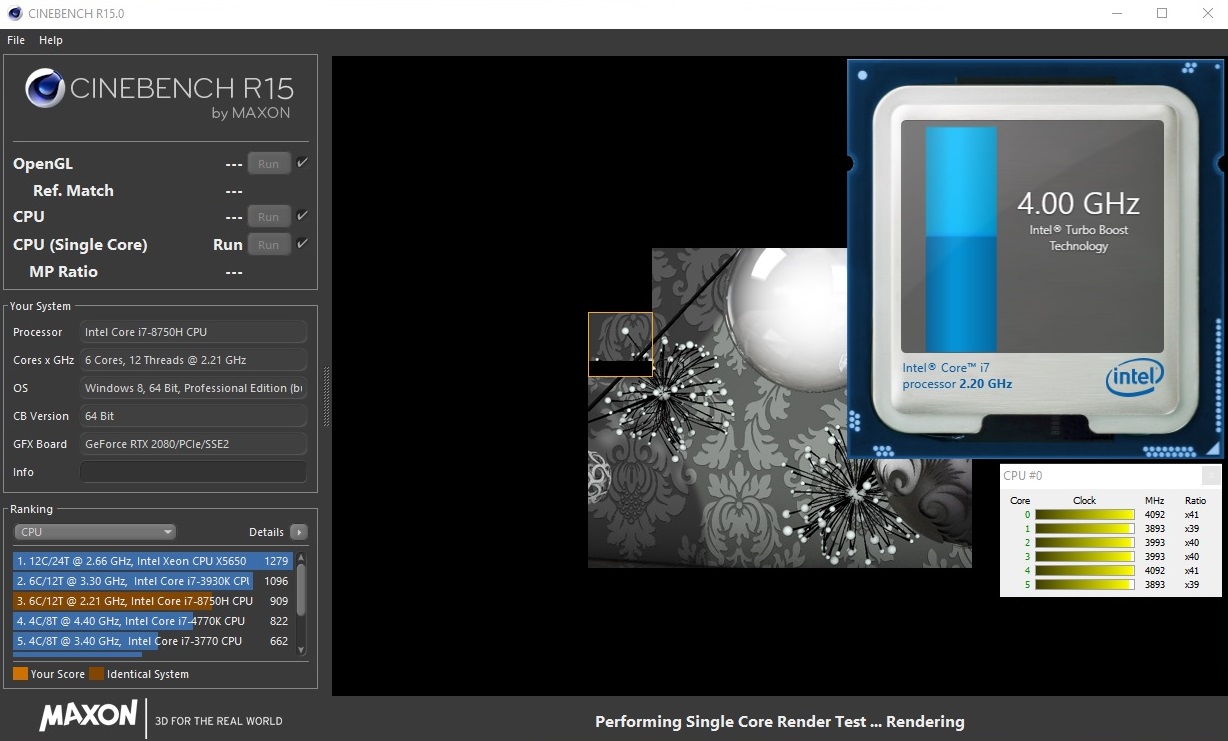
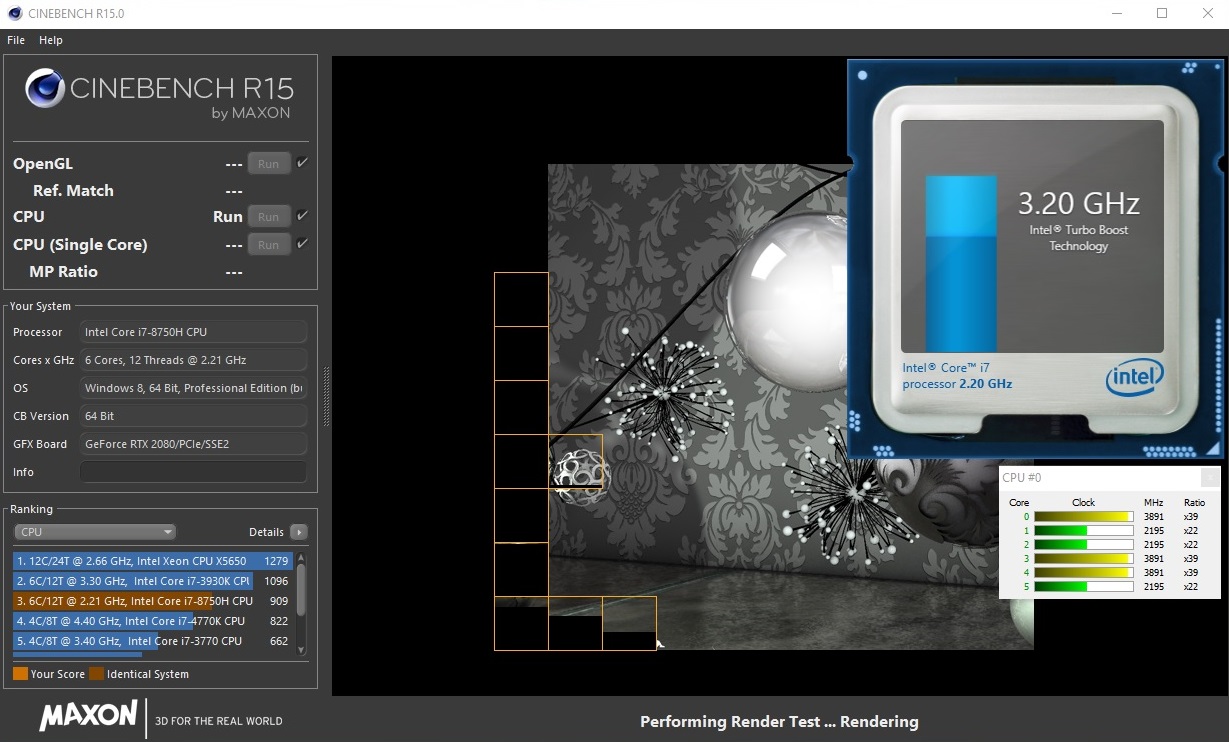
The standard clock speed is 2.2 GHz, which can be increased up to 4.1 GHz via Turbo Boost. However, the Core i7-8750H only reaches this value in single-core load. In multi-core scenarios, the clock speed varies between 1.7 and 3.9 GHz, which indicates temporary throttling. But if you look for the "Config TDP Level" item in the Windows power-saving options (hiding under the "Intel Dynamic Platform and Thermal Framework Settings") and adjust the setting to 2.2 GHz, you can prevent the throttling (at least in most applications). The clock speed will then vary between 2.2 and 3.9 GHz.
According to our endurance test with Cinebench R15, the performance settles at the level of the MSI GS65. The Asus Zephyrus S fares slightly better, whereas the Razer Blade 15 comes in last in terms of the CPU. The following chart lists the results after a cold start without previous load.
System Performance
The SSD RAID helps the Triton 500 to place first among the comparison devices in the system tests. The 15-inch notebook manages a first-rate 5883 points in PCMark 10. Subjectively, Windows also boots up very fast and is very responsive. The load times in (well-optimized) games are pleasantly short.
Storage Solution
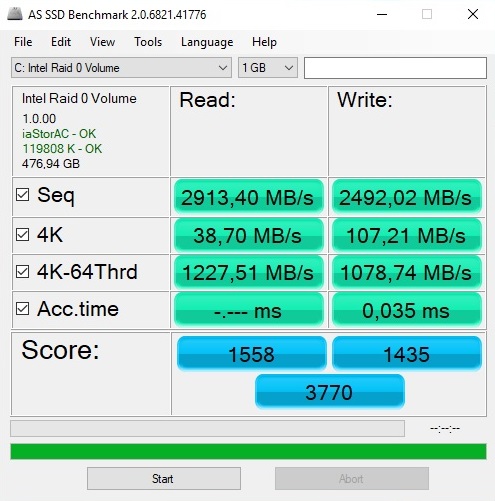
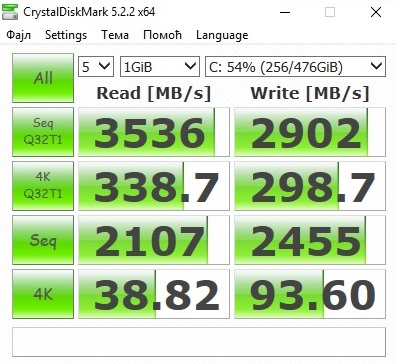
As we mentioned before, Acer has combined two 256 GB PCIe SSDs into a lightning-fast RAID assembly. The two NVMe drives from WDC (PC SN720 model) together achieve more than 2000 MB/s during sequential reading and writing. While the single Western Digital SSD of the Asus GX531 is significantly slower, the Samsung SSDs of the Razer Blade 15 and the MSI GS65 achieve similar overall scores in the AS SSD benchmark despite slower sequential values.
| Acer Predator Triton 500 2x WDC PC SN720 SDAPNTW-256G-1014 (RAID 0) | Gigabyte Aero 15-X9 Intel SSD 760p SSDPEKKW010T8 | Razer Blade 15 RTX 2070 Max-Q Samsung SSD PM981 MZVLB512HAJQ | MSI GS65 8RF-019DE Stealth Thin Samsung SSD PM981 MZVLB512HAJQ | Asus Zephyrus S GX531GS WDC PC SN520 SDAPNUW-512G | |
|---|---|---|---|---|---|
| AS SSD | -16% | 1% | -3% | -21% | |
| Score Total (Points) | 3770 | 2722 -28% | 4079 8% | 4122 9% | 3294 -13% |
| Seq Write (MB/s) | 2492 | 1471 -41% | 1822 -27% | 1834 -26% | 1261 -49% |
| Seq Read (MB/s) | 2913 | 2113 -27% | 1840 -37% | 1266 -57% | 903 -69% |
| 4K Write (MB/s) | 107.2 | 107.1 0% | 110.7 3% | 107.2 0% | 103.6 -3% |
| 4K Read (MB/s) | 38.7 | 55 42% | 52.3 35% | 48.94 26% | 40.02 3% |
| Score Write (Points) | 1435 | 957 -33% | 2010 40% | 2051 43% | 1515 6% |
| Score Read (Points) | 1558 | 1180 -24% | 1362 -13% | 1346 -14% | 1161 -25% |

Graphics Card
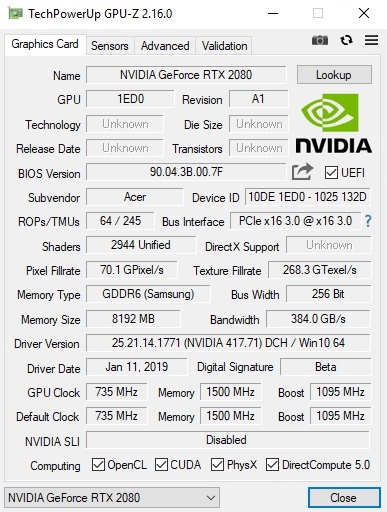
The GeForce RTX 2080 Max-Q is currently the second most-powerful graphics card from Nvidia's Turing portfolio for notebooks. Compared to the regular RTX 2080, mainly the clock speeds were reduced. Instead of 1380 - 1590 MHz (150 watts TDP), it is only 735 - 1095 MHz (80 watts TDP) in the Max-Q version. The amount of shader units remains identical at 2944. The video storage also includes the usual 8 GB GDDR6, but with a speed of only 6 GHz instead of 7 GHz.
As our performance test has brought to light, due to the strongly reduced clock speed, the performance follows more the GeForce RTX 2070 than the RTX 2080, which makes its labeling appear a bit unfortunate, particularly since not all shops list the Max-Q ending on their product pages (even the box of the notebook only says "RTX 2080").
| 3DMark 11 Performance | 20149 points | |
Help | ||
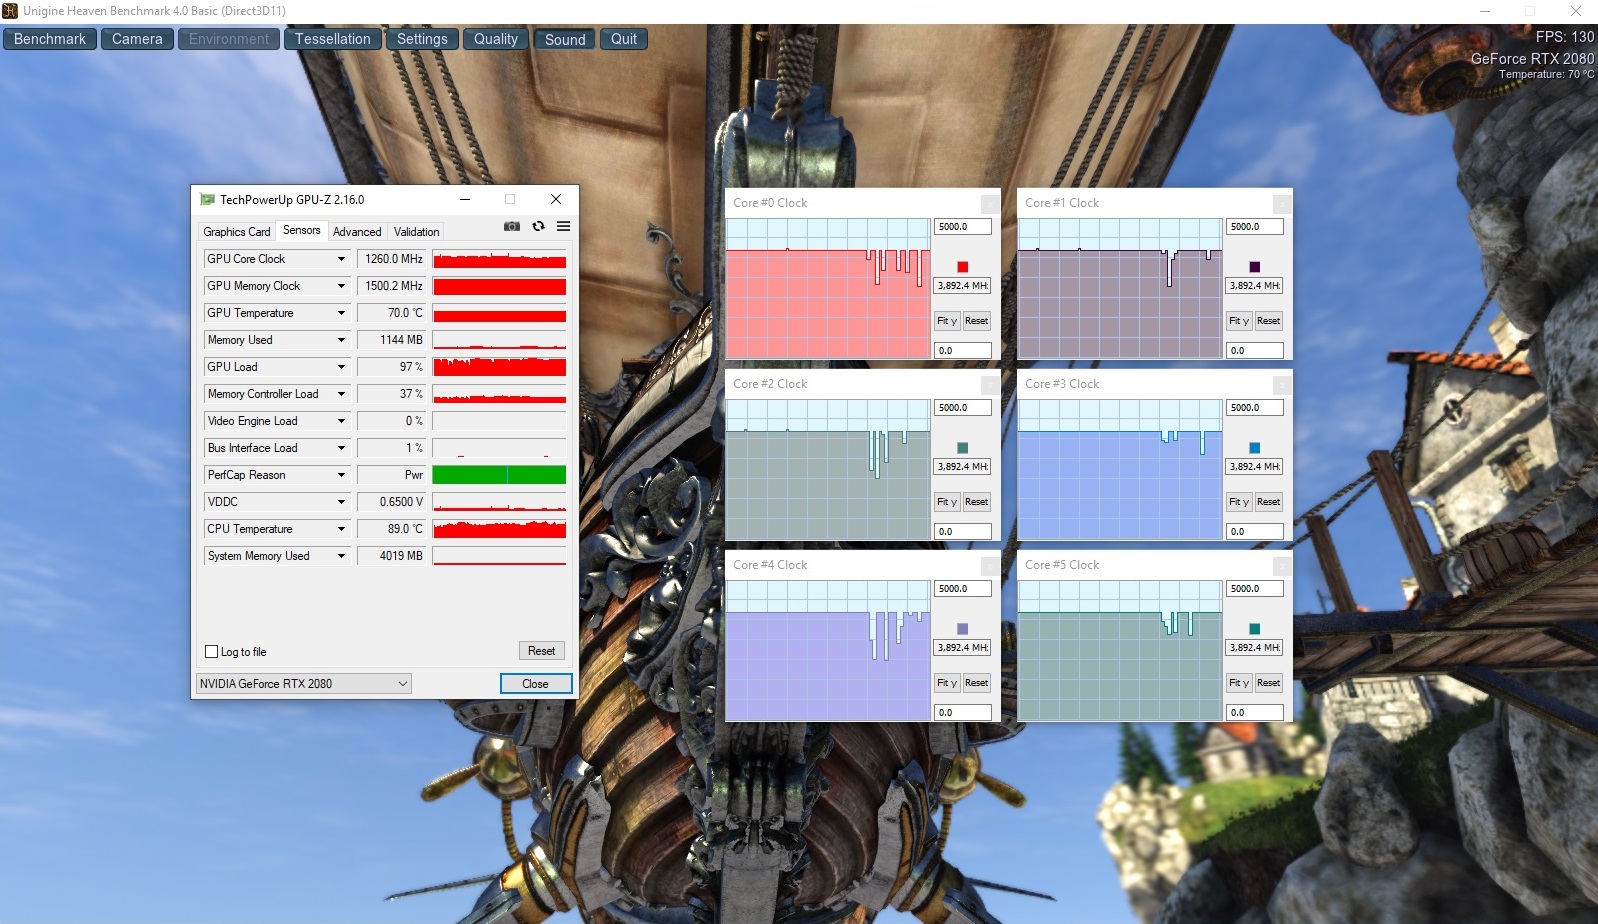
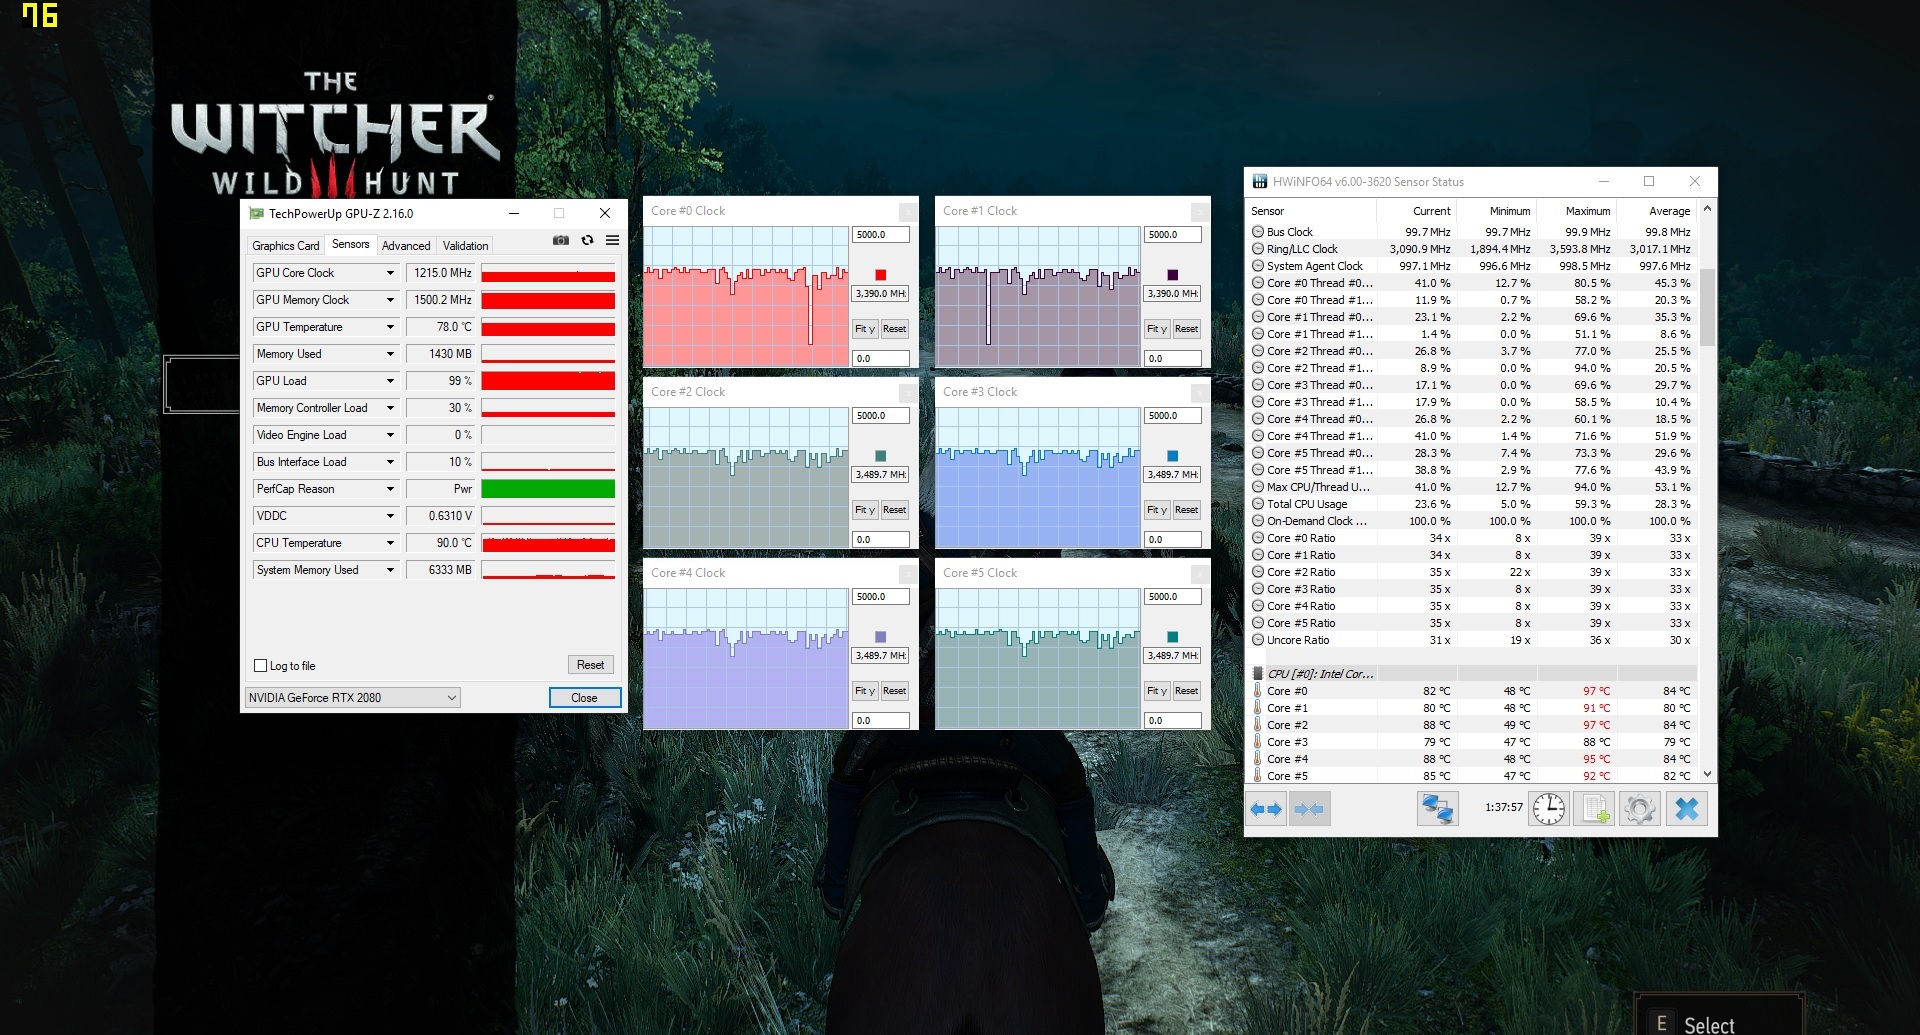
During the 60-minute test with The Witcher 3 (Full HD, Ultra), the behavior of the Triton 500 remained inconspicuous. Thanks to GPU Boost, which works similarly to Intel's Turbo Boost, the GeForce RTX 2080 Max-Q settled at 1215 MHz and 78 °C (172 °F) on average. The CPU ranged between 80 and 90 °C (176-194 °F).
Gaming Performance
Max-Q or not, as long as you only use 1920x1080 pixels, the GeForce RTX 2080 is able to power any modern game smoothly with high to maximum details and activated edge smoothing. Since it achieves more than 60 FPS in many games, the 144 Hz of the display is also often used to the full extent.
| The Witcher 3 | |
| 1920x1080 High Graphics & Postprocessing (Nvidia HairWorks Off) | |
| Average of class Gaming (341 - 404, n=2, last 2 years) | |
| Acer Predator Triton 500 | |
| Razer Blade 15 RTX 2070 Max-Q | |
| MSI GS65 8RF-019DE Stealth Thin | |
| Asus Zephyrus S GX531GS | |
| Gigabyte Aero 15-X9 | |
| 1920x1080 Ultra Graphics & Postprocessing (HBAO+) | |
| Average of class Gaming (104.7 - 240, n=7, last 2 years) | |
| Acer Predator Triton 500 | |
| Razer Blade 15 RTX 2070 Max-Q | |
| Gigabyte Aero 15-X9 | |
| MSI GS65 8RF-019DE Stealth Thin | |
| Asus Zephyrus S GX531GS | |
| low | med. | high | ultra | |
|---|---|---|---|---|
| The Witcher 3 (2015) | 136 | 76.5 | ||
| Battlefield 1 (2016) | 134 | 129 | ||
| Assassin´s Creed Origins (2017) | 65 | 62 |
Emissions
System Noise
The noise development is neither particularly high nor low. During idle operation, the Triton 500 is mostly pleasantly quiet (30-34 dB) or even completely silent. However, from time to time the fans rev up powerfully, as we also know from other notebooks.
Under load, we measured between 44 and 47 dB. This makes the 15-inch notebook quieter than the Asus GX531GS but louder than the Razer Blade 15. The MSI GS65 8RF and the Gigabyte Aero 15 X9 produce a comparable noise level.
Noise level
| Idle |
| 30 / 32 / 34 dB(A) |
| Load |
| 44 / 47 dB(A) |
 | ||
30 dB silent 40 dB(A) audible 50 dB(A) loud |
||
min: | ||
| Acer Predator Triton 500 GeForce RTX 2080 Max-Q, i7-8750H | Gigabyte Aero 15-X9 GeForce RTX 2070 Max-Q, i7-8750H | Razer Blade 15 RTX 2070 Max-Q GeForce RTX 2070 Max-Q, i7-8750H | MSI GS65 8RF-019DE Stealth Thin GeForce GTX 1070 Max-Q, i7-8750H | Asus Zephyrus S GX531GS GeForce GTX 1070 Max-Q, i7-8750H | Average of class Gaming | |
|---|---|---|---|---|---|---|
| Noise | -2% | 9% | 2% | -9% | 7% | |
| off / environment * (dB) | 29 | 30 -3% | 28.8 1% | 30 -3% | 29 -0% | 24.1 ? 17% |
| Idle Minimum * (dB) | 30 | 32 -7% | 28.8 4% | 30 -0% | 33 -10% | 26 ? 13% |
| Idle Average * (dB) | 32 | 34 -6% | 28.8 10% | 31 3% | 34 -6% | 27.4 ? 14% |
| Idle Maximum * (dB) | 34 | 36 -6% | 29.4 14% | 34 -0% | 40 -18% | 30.1 ? 11% |
| Load Average * (dB) | 44 | 42 5% | 35.7 19% | 43 2% | 47 -7% | 43.6 ? 1% |
| Witcher 3 ultra * (dB) | 46 | 44 4% | 42.5 8% | 42 9% | 51 -11% | |
| Load Maximum * (dB) | 47 | 48 -2% | 45 4% | 44 6% | 53 -13% | 54.2 ? -15% |
* ... smaller is better
Temperature
Like most gaming laptops, the Triton 500 also becomes fairly warm in 3D operation. After 60 minutes of the stress test with the FurMark and Prime95 tools, we measured up to 58 °C (136 °F) at the bottom of the case, which speaks against gaming sessions on your lap. At the same time, the top only warmed up to a maximum of 49 °C (120 °F).
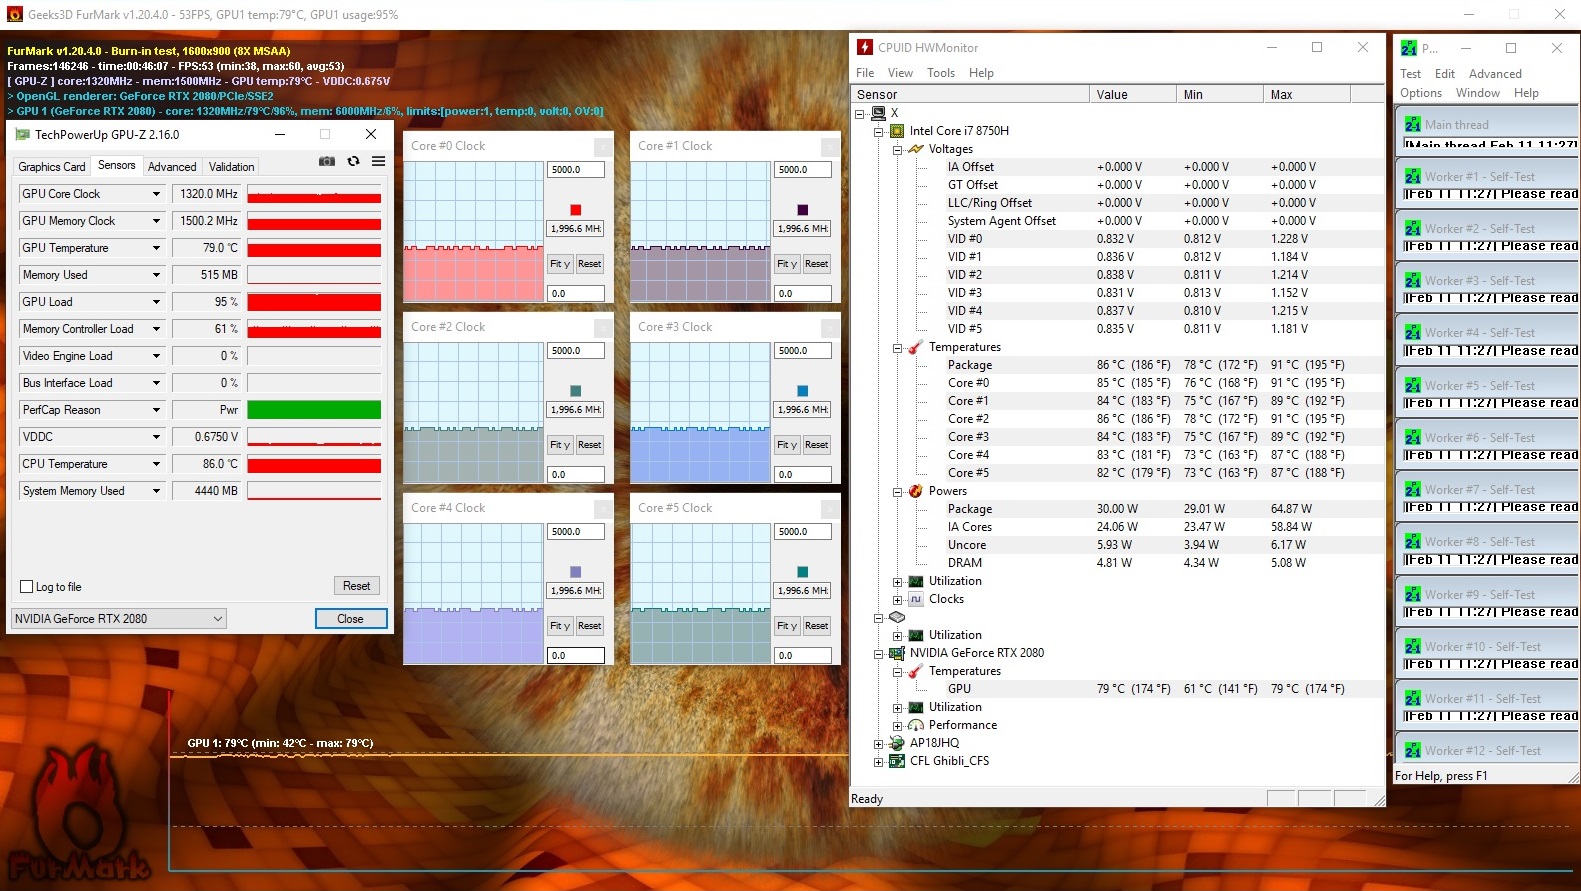
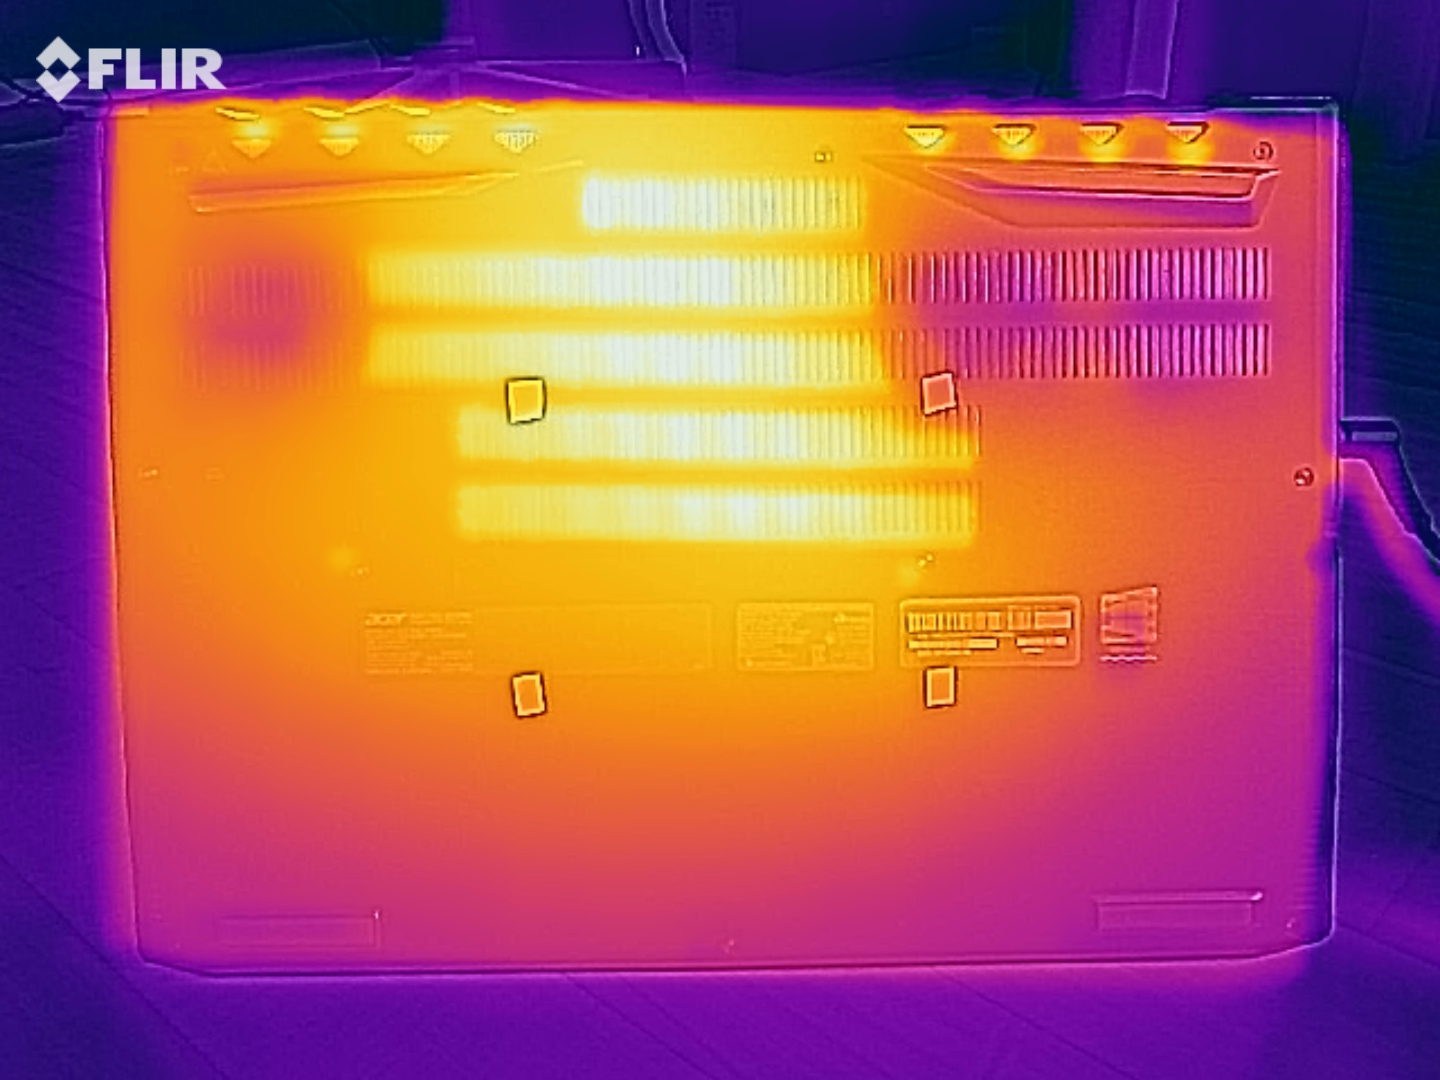
Inside the case, the situation is much less restrained. However, a maximum of 79 °C (174 °F) for the GPU and up to 91 °C (196 °F) for the (slightly throttled) CPU are still not critical.
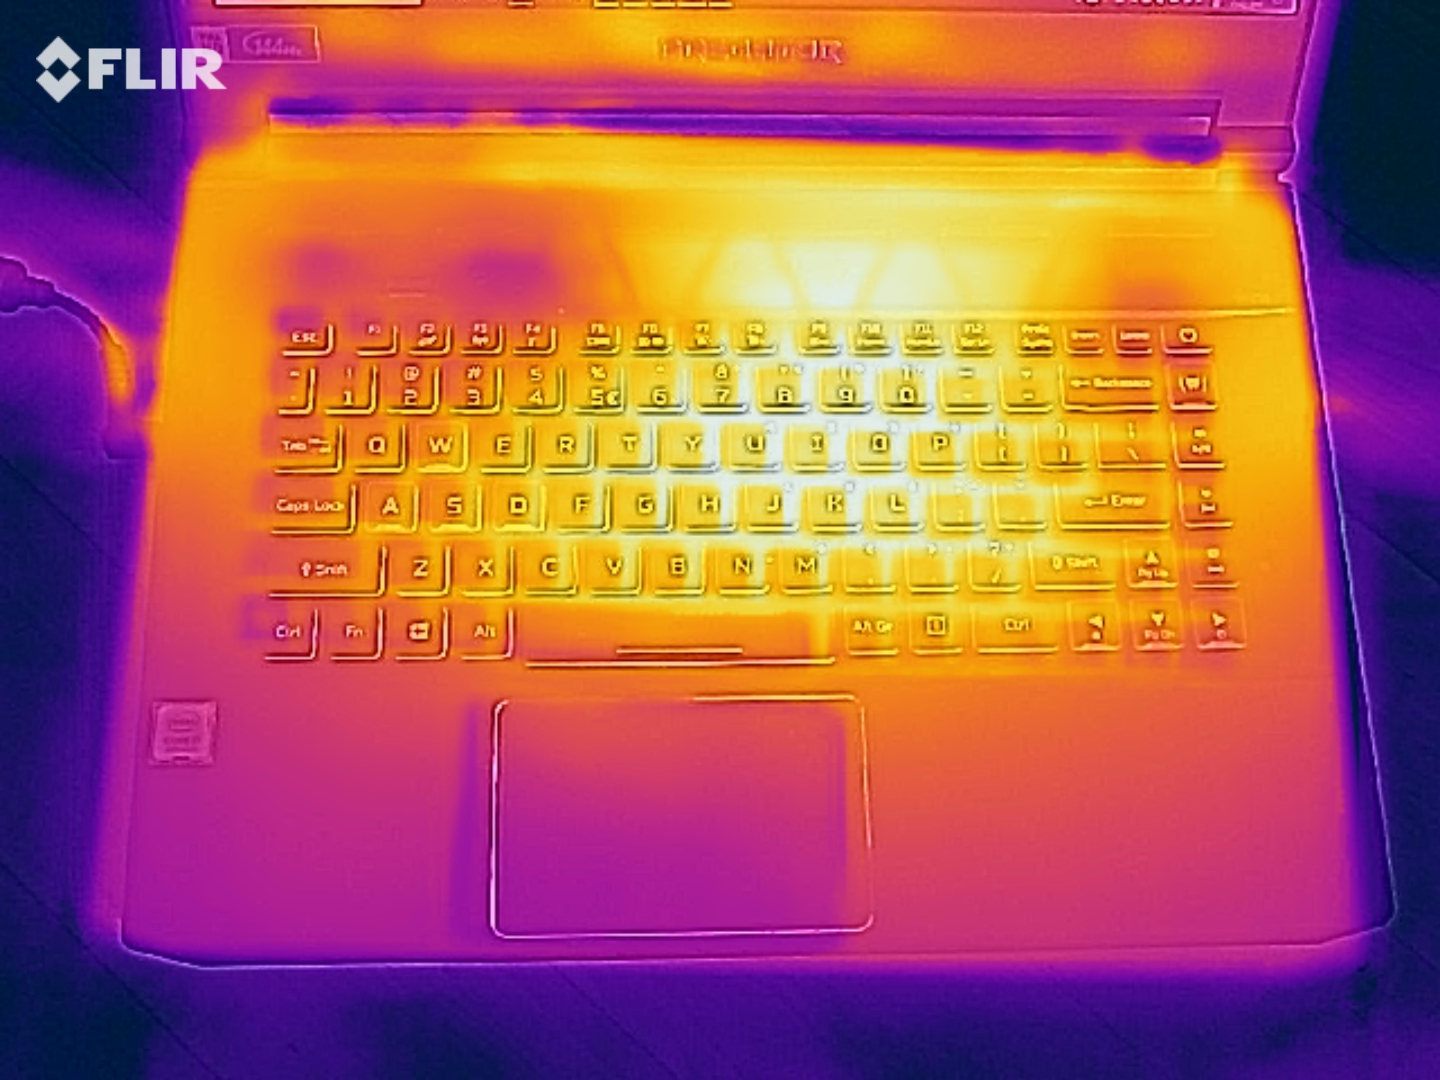
(-) The maximum temperature on the upper side is 49 °C / 120 F, compared to the average of 40.4 °C / 105 F, ranging from 21.2 to 68.8 °C for the class Gaming.
(-) The bottom heats up to a maximum of 58 °C / 136 F, compared to the average of 43.2 °C / 110 F
(+) In idle usage, the average temperature for the upper side is 30.2 °C / 86 F, compared to the device average of 33.9 °C / 93 F.
(-) Playing The Witcher 3, the average temperature for the upper side is 42.8 °C / 109 F, compared to the device average of 33.9 °C / 93 F.
(±) The palmrests and touchpad can get very hot to the touch with a maximum of 39 °C / 102.2 F.
(-) The average temperature of the palmrest area of similar devices was 28.8 °C / 83.8 F (-10.2 °C / -18.4 F).
| Acer Predator Triton 500 GeForce RTX 2080 Max-Q, i7-8750H | Gigabyte Aero 15-X9 GeForce RTX 2070 Max-Q, i7-8750H | Razer Blade 15 RTX 2070 Max-Q GeForce RTX 2070 Max-Q, i7-8750H | MSI GS65 8RF-019DE Stealth Thin GeForce GTX 1070 Max-Q, i7-8750H | Asus Zephyrus S GX531GS GeForce GTX 1070 Max-Q, i7-8750H | Average of class Gaming | |
|---|---|---|---|---|---|---|
| Heat | 2% | 14% | 11% | 1% | 7% | |
| Maximum Upper Side * (°C) | 49 | 56 -14% | 49 -0% | 49 -0% | 54 -10% | 45.2 ? 8% |
| Maximum Bottom * (°C) | 58 | 66 -14% | 49 16% | 63 -9% | 60 -3% | 48.1 ? 17% |
| Idle Upper Side * (°C) | 33 | 27 18% | 25.4 23% | 24 27% | 30 9% | 31 ? 6% |
| Idle Bottom * (°C) | 33 | 27 18% | 27.2 18% | 25 24% | 30 9% | 34.2 ? -4% |
* ... smaller is better
Speakers
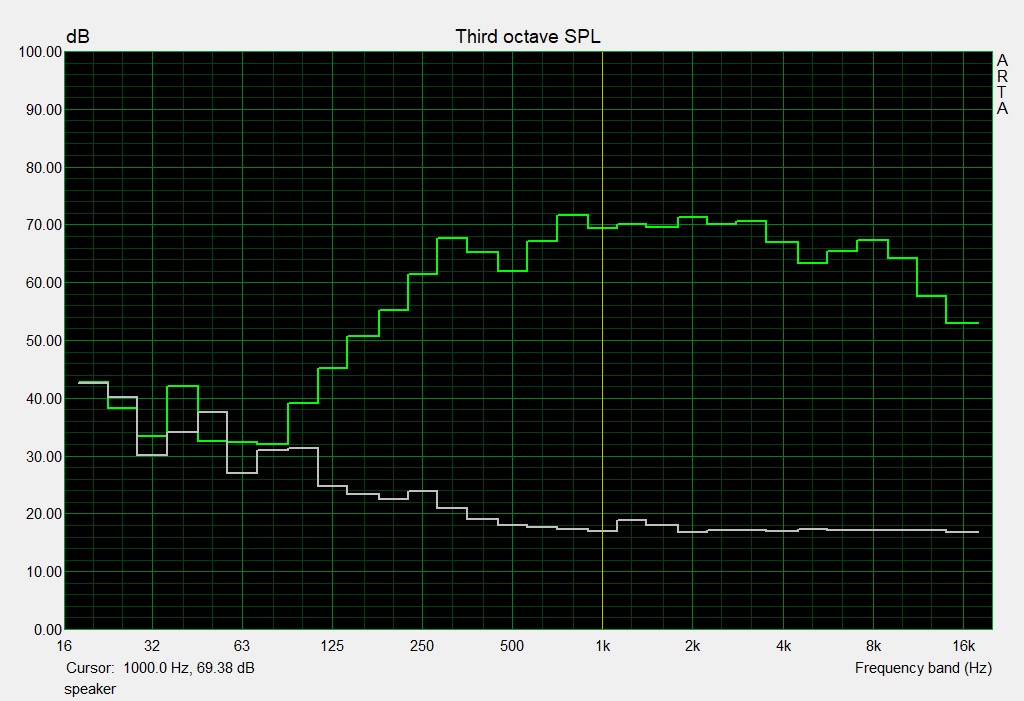
According to our audio analysis, the sound system is in parts significantly better than that of the Triton 700. Acer has selected two speakers that are positioned in the case front. With a maximum level of 81 dB, the 15-incher is suited for small to medium-sized rooms. The sound image is halfway balanced, even if there are still the weaknesses in terms of precision and bass that are typical for notebooks.
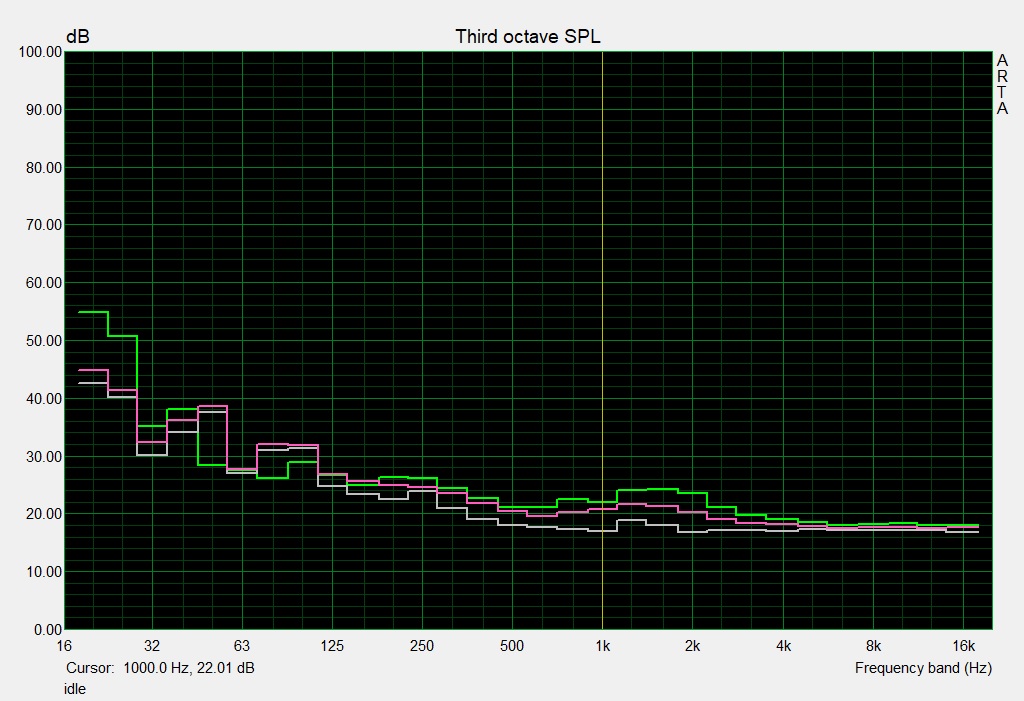
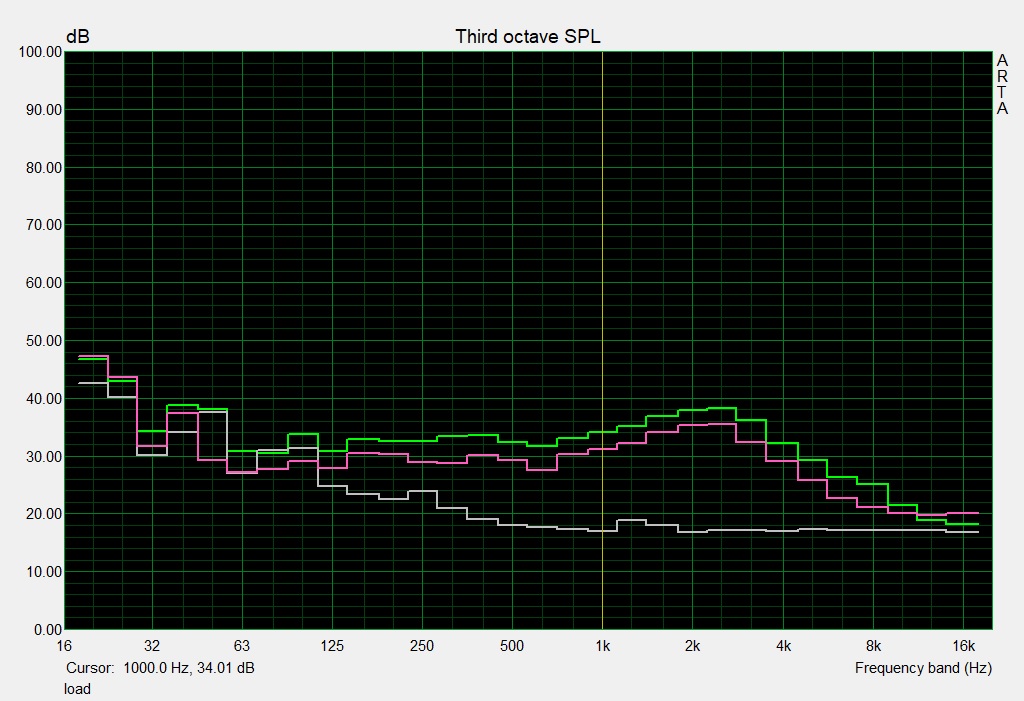
Acer Predator Triton 500 audio analysis
(±) | speaker loudness is average but good (81 dB)
Bass 100 - 315 Hz
(±) | reduced bass - on average 13% lower than median
(±) | linearity of bass is average (12.3% delta to prev. frequency)
Mids 400 - 2000 Hz
(+) | balanced mids - only 3.8% away from median
(+) | mids are linear (5.3% delta to prev. frequency)
Highs 2 - 16 kHz
(+) | balanced highs - only 2.3% away from median
(+) | highs are linear (4.7% delta to prev. frequency)
Overall 100 - 16.000 Hz
(+) | overall sound is linear (14.5% difference to median)
Compared to same class
» 27% of all tested devices in this class were better, 7% similar, 66% worse
» The best had a delta of 6%, average was 18%, worst was 132%
Compared to all devices tested
» 18% of all tested devices were better, 4% similar, 77% worse
» The best had a delta of 4%, average was 23%, worst was 134%
Acer Predator Triton 700 audio analysis
(+) | speakers can play relatively loud (83 dB)
Bass 100 - 315 Hz
(-) | nearly no bass - on average 15.2% lower than median
(±) | linearity of bass is average (10.1% delta to prev. frequency)
Mids 400 - 2000 Hz
(±) | higher mids - on average 8% higher than median
(+) | mids are linear (6.7% delta to prev. frequency)
Highs 2 - 16 kHz
(+) | balanced highs - only 2% away from median
(+) | highs are linear (4.9% delta to prev. frequency)
Overall 100 - 16.000 Hz
(±) | linearity of overall sound is average (19.9% difference to median)
Compared to same class
» 70% of all tested devices in this class were better, 6% similar, 24% worse
» The best had a delta of 6%, average was 18%, worst was 132%
Compared to all devices tested
» 51% of all tested devices were better, 7% similar, 42% worse
» The best had a delta of 4%, average was 23%, worst was 134%
Power Management
Power Consumption
Although the Triton 500 is destined as a mobile companion, Acer left out the graphics switching. With Nvidia's Optimus technology, not only would the power consumption be lower (at least in idle mode), but the battery life would also benefit. Our measurements confirm that a 180-watt power supply is quite sufficient for the RTX 2080 Max-Q. During the stress test, the 15-inch notebook drew a maximum of 173 watts from the outlet (about 147 watts during The Witcher 3). During idle, this was between 16 and 32 watts, depending on the power-saving mode and display brightness.
| Off / Standby | |
| Idle | |
| Load |
|
Key:
min: | |
| Acer Predator Triton 500 GeForce RTX 2080 Max-Q, i7-8750H | Gigabyte Aero 15-X9 GeForce RTX 2070 Max-Q, i7-8750H | Razer Blade 15 RTX 2070 Max-Q GeForce RTX 2070 Max-Q, i7-8750H | MSI GS65 8RF-019DE Stealth Thin GeForce GTX 1070 Max-Q, i7-8750H | Asus Zephyrus S GX531GS GeForce GTX 1070 Max-Q, i7-8750H | Average of class Gaming | |
|---|---|---|---|---|---|---|
| Power Consumption | 11% | 18% | 23% | -7% | -4% | |
| Idle Minimum * (Watt) | 16 | 16 -0% | 10.4 35% | 7 56% | 17 -6% | 13 ? 19% |
| Idle Average * (Watt) | 22 | 18 18% | 14.6 34% | 11 50% | 20 9% | 19 ? 14% |
| Idle Maximum * (Watt) | 32 | 23 28% | 16.3 49% | 20 37% | 29 9% | 24.6 ? 23% |
| Load Average * (Watt) | 89 | 88 1% | 88.5 1% | 98 -10% | 112 -26% | 110.7 ? -24% |
| Witcher 3 ultra * (Watt) | 147 | 120 18% | 155.4 -6% | 132 10% | 152 -3% | |
| Load Maximum * (Watt) | 173 | 167 3% | 182.4 -5% | 182 -5% | 211 -22% | 259 ? -50% |
* ... smaller is better
Battery Life
The battery life only does justice to such a traveler-friendly device to a limited extent. Even though a maximum of 5.5 hours is not a total loss for a gaming notebook, if there had been graphics switching, the Triton 500 would have been able to last significantly longer, as we can see for example with the Razer Blade 15 and the MSI GS65, which have batteries that also reach about 80 Wh. In the realistic WLAN test (medium brightness) the 15-inch notebook achieved around 3 hours.
| Acer Predator Triton 500 GeForce RTX 2080 Max-Q, i7-8750H, 82 Wh | Gigabyte Aero 15-X9 GeForce RTX 2070 Max-Q, i7-8750H, 94.24 Wh | Razer Blade 15 RTX 2070 Max-Q GeForce RTX 2070 Max-Q, i7-8750H, 80 Wh | MSI GS65 8RF-019DE Stealth Thin GeForce GTX 1070 Max-Q, i7-8750H, 82 Wh | Asus Zephyrus S GX531GS GeForce GTX 1070 Max-Q, i7-8750H, 50 Wh | Average of class Gaming | |
|---|---|---|---|---|---|---|
| Battery runtime | 90% | 71% | 47% | -35% | 59% | |
| Reader / Idle (h) | 5.6 | 9.2 64% | 11.4 104% | 8.5 52% | 3.6 -36% | 8.27 ? 48% |
| WiFi v1.3 (h) | 3.2 | 6.4 100% | 6.5 103% | 6 88% | 2.6 -19% | 7.11 ? 122% |
| Load (h) | 1.4 | 2.9 107% | 1.5 7% | 1.4 0% | 0.7 -50% | 1.502 ? 7% |
| H.264 (h) | 6.1 | 5.9 | 8.32 ? |
Verdict
Pros
Cons
The Acer Predator Triton 500 just misses a "very good" evaluation. The 15-inch notebook fulfills almost all the criteria that distinguish a modern gaming notebook. In addition to the slim display bezels and slim case, we should also mention the 144-Hz panel here that scores with G-Sync.
The Triton 500 also does not lack performance. Our tested version with a Core i7-8750H and GeForce RTX 2080 Max-Q can effortlessly handle any current game at Full HD resolution.
However, it is incomprehensible to us why Acer did not use graphics switching. In terms of mobility, Optimus would absolutely offer itself as an advantage. We see additional weaknesses in terms of the maintenance. The design of the insides is such that buyers can hardly access any components at all (keywords: storage solution and RAM).
Despite all that, the Triton 500 is significantly more successful in our opinion than the old Triton 700.
Update 22.03.19.: According to some forum-posts you can switch between G-Sync and Optimus in the BIOS. If this is true, one of the biggest points of criticism would be elimiminated.
Acer Predator Triton 500
- 02/14/2019 v6 (old)
Florian Glaser
Price comparison

