Nvidia GeForce RTX 2060, RTX 2070 & RTX 2080 Laptop GPUs Performance Review

Instead of concentrating on improving raw power, Nvidia has switched its attention elsewhere with the Turing generation of its GeForce graphics cards. The first RTX GPUs bring raytracing to the masses, but there are currently hardly any programs, benchmarks or games that take advantage of this new technology or any with which we can use to assess its performance.
Our article primarily serves to differentiate the performance between the new RTX laptop GPUs. We will conduct several 3DMark tests and Battlefield V benchmarks. We will also include other games that support raytracing and DLSS in the coming days and weeks. You can find the corresponding benchmarks on our games page, where you can also see detailed GPU specifications and compare GPUs against each other.
Test Systems
We have chosen five test systems to assess the performance of the new RTX laptop GPUs. We have three versions of the Schenker XMG Ultra 15 that are equipped with different GPUs, while we also have a Gigabyte Aero 15 X9 and an Acer Triton 500, which have Max-Q versions of the RTX 2070 and RTX 2080. We have included an overview below of the differences between our test systems too.
| Laptop | Schenker XMG Ultra 15 | Schenker XMG Ultra 15 | Schenker XMG Ultra 15 | Gigabyte Aero 15 X9 | Acer Triton 500 |
|---|---|---|---|---|---|
| Processor | Intel Core i7-9700K | Intel Core i7-9700K | Intel Core i7-9700K | Intel Core i7-8750H | Intel Core i7-8750H |
| RAM | 16 GB DDR4 | 16 GB DDR4 | 16 GB DDR4 | 16 GB DDR4 | 32 GB DDR4 |
| SSD | 500 GB SSD | 500 GB SSD | 500 GB SSD | 1 TB SSD | 500 GB SSD |
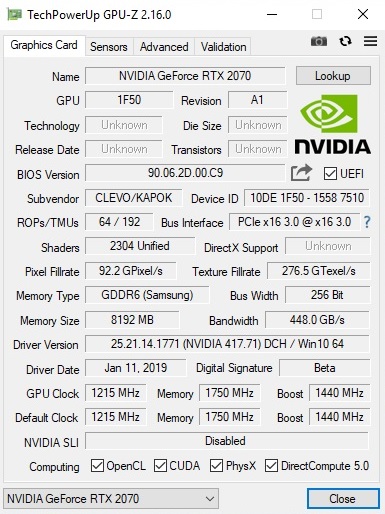
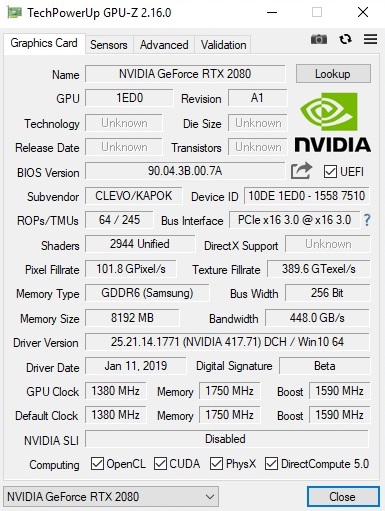
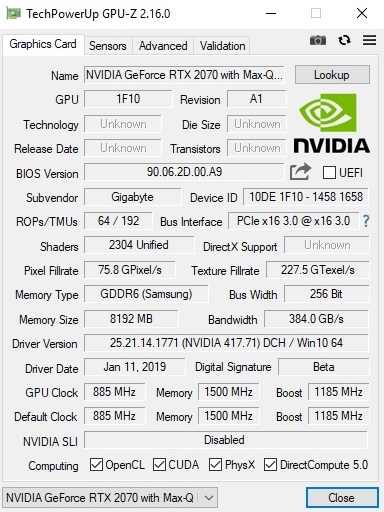
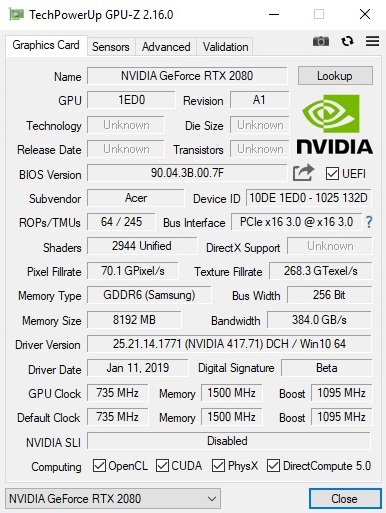
| Graphics Card | GeForce RTX 2060 | GeForce RTX 2070 | GeForce RTX 2080 | GeForce RTX 2070 Max-Q | GeForce RTX 2080 Max-Q |
| Shader Units | 1,920 | 2,304 | 2,944 | 2,304 | 2,944 |
| Base clock speed | 960 MHz | 1,215 MHz | 1,380 MHz | 885 MHz | 735 MHz |
| Boost clock speed | 1,200 MHz | 1,440 MHz | 1,590 MHz | 1,185 MHz | 1,095 MHz |
| VRAM | 6 GB GDDR6 | 8 GB GDDR6 | 8 GB GDDR6 | 8 GB GDDR6 | 8 GB GDDR6 |
| Memory Bus | 192-Bit | 256-Bit | 256-Bit | 256-Bit | 256-Bit |
| VRAM clock speed | 7,000 MHz | 7,000 MHz | 7,000 MHz | 6,000 MHz | 6,000 MHz |
| Drivers | ForceWare 417.71 | ForceWare 417.71 | ForceWare 417.71 | ForceWare 417.71 | ForceWare 417.71 |
Please keep in mind that the Max-Q GPUs are more power-efficient, and slower, versions of the regular RTX graphics cards. The RTX Max-Q GPUs are designed for more compact systems with limited cooling options.

Synthetic Benchmarks
DirectX 11
While synthetic benchmarks have limited utility in assessing a GPU’s strengths in applications or games, they are useful for creating a basic ranking of various GPUs and comparing their expected performance.
We start with 3DMark and its DirectX 11-based Fire Strike benchmark, which has long been one of our go-to tests for laptops reviews. We have included the results below for the 1080p benchmark and have included some GTX 10 series-based laptops to give a clearer idea of the level at which these RTX graphics cards perform.
All the RTX GPUs scored at least 10% more than their GTX predecessors, with the RTX 2060 finishing a whopping 36% ahead of the GTX 1060. It is worth noting that our GTX-equipped comparison devices are also powered by older CPUs, which will marginally affect the scores that they achieve.
| 3DMark - 1920x1080 Fire Strike Graphics | |
| Schenker XMG Ultra 15 | |
| Schenker XMG Ultra 17 | |
| Acer Triton 500 | |
| Schenker XMG Ultra 15 | |
| Alienware 15 R3 Max-Q | |
| Acer Predator Helios 500 PH517-51-79BY | |
| Gigabyte Aero 15 X9 (Dual Channel) | |
| Gigabyte Aero 15 X9 (Single Channel) | |
| Schenker XMG Ultra 15 | |
| HP Omen 15-dc0015ng | |
| Asus Zephyrus S GX531GM | |
DirectX 12
The gaps between the RTX and GTX GPUs increased in the DirectX 12-based Time Spy benchmark, which we ran at 1440p. The Turing architecture generally opens up a 30% lead over its Pascal counterparts in this benchmark, although the RTX 2060 scored almost 60% higher than the GTX 1060 and 5 points more than the GTX 1070. Moreover, the RTX 2070 scored 6% more than the GTX 1080, while the RTX 2080 is, perhaps unsurprisingly, the new front-runner.
| 3DMark - 2560x1440 Time Spy Graphics | |
| Schenker XMG Ultra 15 | |
| Acer Triton 500 | |
| Schenker XMG Ultra 15 | |
| Schenker XMG Ultra 17 | |
| Alienware 15 R3 Max-Q | |
| Gigabyte Aero 15 X9 (Single Channel) | |
| Gigabyte Aero 15 X9 (Dual Channel) | |
| Schenker XMG Ultra 15 | |
| Acer Predator Helios 500 PH517-51-79BY | |
| HP Omen 15-dc0015ng | |
| Asus Zephyrus S GX531GM | |
Raytracing
We also subjected our RTX-equipped laptops to the 3DMark Port Royal test, which is one of the first widely available benchmarks that supports raytracing.
The order of our comparison table is somewhat predictable, although the RTX 2080 Max-Q finished only 4% ahead of the RTX 2070. While our table just displays the scores for each GPU, the benchmark is almost unplayable on the RTX 2060, with most scenes running at under 10 FPS. Likewise, the RTX 2070 manages around 20 FPS, which is not fluent either. Even the RTX 2080 only averaged about 30 FPS, which is reasonably playable but shows just how demanding raytracing is.
By contrast, all the RTX GPUs can handle raytracing in Battlefield V comfortably, which we will cover in greater detail shortly. Please note that you must have the Windows 10 October 2018 Update installed to run the Port Royal benchmark on the RTX GPUs. You may have to initiate this update manually with laptops like the Gigabyte Aero 15, for example.
| 3DMark - 2560x1440 Port Royal Graphics | |
| Schenker XMG Ultra 15 | |
| Acer Triton 500 | |
| Schenker XMG Ultra 15 | |
| Gigabyte Aero 15 X9 (Single Channel) | |
| Gigabyte Aero 15 X9 (Dual Channel) | |
| Schenker XMG Ultra 15 | |
Gaming Benchmarks
Full HD: 1920x1080
All the GTX 10 and RTX 20 series GPUs handle Battlefield V at 1080p with ease, just as they did with the Fire Strike benchmark. 1080p is not necessarily a good indicator of how each GPU performs either as they are pushing out such high frame rates that the CPU ends up being a bottleneck. Nevertheless, all the RTX GPUs can play Battlefield V at 1080p on the Ultra preset smoothly and with no issues.
| Battlefield V - 1920x1080 Ultra Preset | |
| Schenker XMG Ultra 15 | |
| Schenker XMG Ultra 15 | |
| Acer Triton 500 | |
| Acer Predator Triton 700 | |
| Asus G752VS | |
| Alienware 17 R4 | |
| Schenker XMG Ultra 15 | |
| Gigabyte Aero 15 X9 (Dual Channel) | |
| Gigabyte Aero 15 X9 (Single Channel) | |
| MSI GT62VR | |
QHD: 2560x1440
The RTX GPUs all render Battlefield V at over 70 FPS in 1440p on the Ultra preset too. CPUs still appear to be affecting frame rates though, as demonstrated by the difference between the RTX 2070 and the RTX 2080 Max-Q. The latter theoretically should achieve better frame rates than the RTX 2070, but its weaker Core i7-8750H CPU appears to be holding it back.
| Battlefield V - 2560x1440 Ultra Preset | |
| Schenker XMG Ultra 15 | |
| Schenker XMG Ultra 15 | |
| Acer Triton 500 | |
| Alienware 17 R4 | |
| Acer Predator Triton 700 | |
| Gigabyte Aero 15 X9 (Single Channel) | |
| Asus G752VS | |
| Schenker XMG Ultra 15 | |
| Gigabyte Aero 15 X9 (Dual Channel) | |
| MSI GT62VR | |
UHD: 3840x2160
The RTX 2080 comes into its own at 4K. It is the only GPU on our comparison table that averages more than 60 FPS in Battlefield V on the Ultra preset and achieves over 30% higher frame rates than the GTX 1080. The RTX 2070 averages 52 FPS by comparison, which is 26% more than the GTX 1070 manages. The most worthwhile upgrade is again from the GTX 1060 to the RTX 2060, with the latter achieving 50% higher frame rates, which is the difference between borderline unplayable and a good gaming experience.
| Battlefield V - 3840x2160 Ultra Preset | |
| Schenker XMG Ultra 15 | |
| Acer Triton 500 | |
| Schenker XMG Ultra 15 | |
| Alienware 17 R4 | |
| Acer Predator Triton 700 | |
| Gigabyte Aero 15 X9 (Single Channel) | |
| Gigabyte Aero 15 X9 (Dual Channel) | |
| Schenker XMG Ultra 15 | |
| Asus G752VS | |
| MSI GT62VR | |
Raytracing
We were positively surprised by the performance of the RTX GPUs when we activated DXR. Even though there are some graphics errors and we only noticed image improvements if we knew where to look, the degree to which Battlefield V is already optimised is impressive. The main improvements are with lighting and reflections, which Nvidia focuses heavily on in its Battlefield V promotional video.
However, you must currently compromise with on-screen resolution to achieve playable frame rates. DXR reduces frame rates by almost 50%, so raytracing at 4K is out of the question at present. 1,440p is not that playable either, but all the RTX GPUs averaged more than 40 FPS at 1080p on the Ultra preset. Interestingly, the RTX 2070 Max-Q fell 7% short of the RTX 2060 at these settings, although we suspect that the difference in CPU performance (and single channel memory) is also playing its part here.
| Battlefield V - 1920x1080 Ultra Preset DXR | |
| Schenker XMG Ultra 15 | |
| Acer Triton 500 | |
| Schenker XMG Ultra 15 | |
| Schenker XMG Ultra 15 | |
| Gigabyte Aero 15 X9 (Dual Channel) | |
| Gigabyte Aero 15 X9 (Single Channel) | |
Verdict
The Turing architecture brings not only the usual increase in performance but also a promising technology. Raytracing remains in its infancy and hardly any applications or games support it, but its potential is already there to see, as demonstrated in Battlefield V. You must currently compromise on resolution though, which may be a deal breaker for some gamers. Only time will tell whether Nvidia has backed the wrong horse.
The best value for money RTX laptop GPU is currently the GeForce RTX 2060, in our opinion. The graphics card is not powerful enough to deliver raytracing at playable frame rates, but it is a considerable upgrade over the GTX 1060 and is on par with the GTX 1070. The RTX 2080 and the RTX 2070 are noticeable improvements on their predecessors too, but not to the same extent as the RTX 2060 is.
We are disappointed with the RTX Max-Q GPUs though. The RTX 2070 Max-Q in the Gigabyte Aero 15 is only as fast as an RTX 2060 and occasionally achieved worse results in our tests. Hence, the naming of the RTX 2070 Max-Q is slightly misleading, mainly as it is unlikely that Nvidia will release an RTX 2060 Max-Q. We appreciate that our results may be slightly distorted by the standard RTX GPUs being paired with more powerful 9th generation Intel Core CPUs, but we would have expected better results from the RTX Max-Q GPUs, nonetheless.
A significant shortcoming of the Turing architecture chips is Nvidia’s pricing. The laptops equipped with RTX GPUs will likely cost considerably more than their GTX 10-series counterparts (unofficial information), which may cause potential buyers to opt for the Pascal generation cards instead, at least until prices come down.

