Notebook reviews with NVIDIA GeForce RTX 2080 Max-Q graphics card
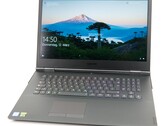
Lenovo Legion Y740-17IRHg with a GeForce RTX 2080 Max-Q in Review
Gamers rejoice! The Lenovo Legion Y740-17 offers great gaming performance and various RGB elements to complement the design. In this review, we will try to find out whether there are any drawbacks by looking at numerous measurements and benchmarks.
Intel Core i7-9750H, NVIDIA GeForce RTX 2080 Max-Q, 17.3", 3 kgDell Alienware m17 R2 Laptop Review: Making Core i9 Worthwhile
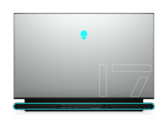
The redesigned Alienware m17 R2 crams both a Core i9-9980HK CPU and GeForce RTX 2080 Max-Q GPU in the thinnest chassis yet for the venerable series. We had anticipated lukewarm performance to keep thermals in check, but the system surprised us with its faster-than-average speeds even for a high-end gaming laptop.
Intel Core i9-9980HK, NVIDIA GeForce RTX 2080 Max-Q, 17.3", 2.6 kgAsus ROG Zephyrus S GX701GXR laptop review: Slim gaming laptop scores points with a fast 300 Hz display
The hardware of the Zephyrus S GX701GXR runs all current games smoothly on the matte 300 Hz IPS display. The laptop offers expansion/upgrade possibilities only to a very limited extent.
Intel Core i7-9750H, NVIDIA GeForce RTX 2080 Max-Q, 17.3", 2.7 kgRazer Blade Pro 17 4K UHD 120 Hz Laptop Review: Finally, a 17-inch 4K Display With Almost No Ghosting
The AU Optronics B173ZAN03.3 panel makes its debut on the Razer laptop to offer both faster refresh rates and faster black-white response times than any 17.3-inch laptop before it. The end result is a better 4K gaming experience than what other 17.3-inch laptops currently have to offer.
Intel Core i7-9750H, NVIDIA GeForce RTX 2080 Max-Q, 17.3", 2.8 kgThe Area-51m mini-me: Dell Alienware m15 R2 Laptop Review
If you've ever wanted the 17.3-inch Alienware Area-51m desktop replacement but wished it was smaller, then the 15.6-inch Alienware m15 R2 should fit the bill. The new model is a complete design overhaul of last year's Alienware m15 R1 that unfortunately feels more like a lateral step sideways instead of a big leap forward.
Intel Core i7-9750H, NVIDIA GeForce RTX 2080 Max-Q, 15.6", 2.2 kgSchenker Key 16: Intel Core i7-8750H, 16.10", 2.2 kg
Review » Schenker Key 16 (Clevo P960EN-K) Review: The slim notebook pleases with a lot of computing power
Origin PC EVO16-S i7-9750H RTX 2080 Max-Q: Intel Core i7-9750H, 16.10", 2.1 kg
Review » Origin PC EVO16-S (Clevo P960RD) Review: A Rare 16.1-inch Gaming Laptop
MSI GS75 Stealth 9SG: Intel Core i7-9750H, 17.30", 2.3 kg
Review » MSI GS75 Stealth 9SG Laptop Review: A slim and powerful gaming laptop with good battery life
Razer Blade Pro 17 RTX 2080 Max-Q: Intel Core i7-9750H, 17.30", 2.8 kg
Review » So much better than before: Razer Blade Pro 17 Laptop Review
MSI GS65 Stealth 9SG: Intel Core i7-9750H, 15.60", 2 kg
Review » MSI GS65 Stealth 9SG (i7-9750H, RTX 2080 Max-Q) Laptop Review
Razer Blade 15 RTX 2080 Max-Q: Intel Core i7-9750H, 15.60", 2.2 kg
Review » Razer Blade 15 Advanced Model (i7-9750H, RTX 2080 Max-Q, 240 Hz) Laptop Review
Alienware m17 P37E: Intel Core i9-8950HK, 17.30", 2.6 kg
Review » Alienware m17 (i9-8950HK, RTX 2080 Max-Q, 4K UHD) Laptop Review
Asus Zephyrus S GX531GX: Intel Core i7-8750H, 15.60", 2.1 kg
Review » Asus Zephyrus S GX531GX (i7-8750H, RTX 2080 Max-Q) Laptop Review
MSI GS75 8SG Stealth: Intel Core i7-8750H, 17.30", 2.3 kg
Review » MSI GS75 8SG Stealth (i7-8750H, RTX 2080 Max-Q) Laptop Review
Gigabyte Aero 15-Y9: Intel Core i9-8950HK, 15.60", 2.1 kg
Review » Gigabyte Aero 15-Y9 (i9-8950HK, RTX 2080 Max-Q) Laptop Review
Lenovo Legion Y740-17ICH: Intel Core i7-8750H, 17.30", 2.8 kg
Review » Lenovo Legion Y740-17ICH (i7-8750H, RTX 2080 Max-Q) Laptop Review
Asus Zephyrus S GX701GX: Intel Core i7-8750H, 17.30", 2.6 kg
Review » Asus ROG Zephyrus S GX701GX (i7-8750H, RTX 2080 Max-Q) Laptop Review
Acer Predator Triton 500: Intel Core i7-8750H, 15.60", 2.1 kg
Review » Acer Predator Triton 500 (i7-8750H, RTX 2080 Max-Q) Laptop Review
Asus Zephyrus S GX701GXR-HG113R: Intel Core i7-9750H, 17.30", 2.6 kg
External Review » Asus Zephyrus S GX701GXR-HG113R
HP Omen X 2S 15-dg0004ur: Intel Core i9-9880H, 15.60", 2.5 kg
External Review » HP Omen X 2S 15-dg0004ur
Lenovo Legion Y740-17IRHg-81UJ001VGE: Intel Core i7-9750H, 17.30", 3 kg
External Review » Lenovo Legion Y740-17IRHg-81UJ001VGE
Alienware m15 R2-N00AWm15R210: Intel Core i7-9750H, 15.60", 2.2 kg
External Review » Alienware m15 R2-N00AWm15R210
MSI P75 Creator 9SG-1013NL: Intel Core i9-9880H, 17.30", 2.3 kg
External Review » MSI P75 Creator 9SG-1013NL
MSI GS65 Stealth 9SG: Intel Core i7-9750H, 15.60", 2 kg
External Review » MSI GS65 Stealth 9SG
Asus ROG Zephyrus S GX701GXR: Intel Core i7-9750H, 17.30", 2.7 kg
External Review » Asus ROG Zephyrus S GX701GXR
Alienware m17 R2, i7-9750H, RTX 2080 Max-Q: Intel Core i7-9750H, 17.30", 2.6 kg
External Review » Alienware m17 R2, i7-9750H, RTX 2080 Max-Q
HP Omen X2S 15-dg0901ng: Intel Core i7-9750H, 15.60", 2.5 kg
External Review » HP Omen X2S 15-dg0901ng
MSI GT76 Titan 9SG-225ID: Intel Core i9-9900K, 17.30", 4.2 kg
External Review » MSI GT76 Titan 9SG-225ID
Asus Zephyrus S GX531GXR-AZ044R: Intel Core i7-9750H, 15.60", 2.1 kg
External Review » Asus Zephyrus S GX531GXR-AZ044R
Acer Predator Triton 500 PT515-51-75C9: Intel Core i7-9750H, 15.60", 2.1 kg
External Review » Acer Predator Triton 500 PT515-51-75C9
Alienware m17 R2-C7XD9: Intel Core i9-9980HK, 17.30", 2.6 kg
External Review » Alienware m17 R2-C7XD9
HP Omen 15-dh0009ng: Intel Core i7-9750H, 15.60", 2.6 kg
External Review » HP Omen 15-dh0009ng
Asus Zephyrus S GX701GXR-H6081R: Intel Core i7-9750H, 17.30", 2.7 kg
External Review » Asus Zephyrus S GX701GXR-H6081R
Alienware m15 R2 P87F: Intel Core i7-9750H, 15.60", 2.2 kg
External Review » Alienware m15 R2 P87F
Lenovo Legion Y740-15ICHg-81UH0020GE: Intel Core i7-9750H, 15.60", 2.2 kg
External Review » Lenovo Legion Y740-15ICHg-81UH0020GE
Origin PC EVO16-S i7-9750H RTX 2080 Max-Q: Intel Core i7-9750H, 16.10", 2.1 kg
External Review » Origin PC EVO16-S i7-9750H RTX 2080 Max-Q
Asus ROG Zephyrus S GX701-EV020T: Intel Core i7-8750H, 17.30", 2.7 kg
External Review » Asus ROG Zephyrus S GX701-EV020T
Acer Predator Triton 500 PT515-51-74JA: Intel Core i7-8750H, 15.60", 2 kg
External Review » Acer Predator Triton 500 PT515-51-74JA
Razer Blade 15 RTX 2080 Max-Q, Core i7-8750H: Intel Core i7-8750H, 15.60", 2.1 kg
External Review » Razer Blade 15 RTX 2080 Max-Q, Core i7-8750H
Origin PC EVO17-S 2019 (i7-9750H, RTX 2080 Max-Q): Intel Core i7-9750H, 17.30", 2.5 kg
External Review » Origin PC EVO17-S 2019 (i7-9750H, RTX 2080 Max-Q)
Asus ROG Zephyrus S GX701GXR-EV013R: Intel Core i7-9750H, 17.30", 2.7 kg
External Review » Asus ROG Zephyrus S GX701GXR-EV013R
MSI GS65 Stealth-666: Intel Core i9-9880H, 15.60", 2 kg
External Review » MSI GS65 Stealth-666
MSI GS75 Stealth 9SG: Intel Core i7-9750H, 17.30", 2.3 kg
External Review » MSI GS75 Stealth 9SG
Razer Blade Pro 17 RTX 2080 Max-Q: Intel Core i7-9750H, 17.30", 2.8 kg
External Review » Razer Blade Pro 17 RTX 2080 Max-Q
Origin PC EVO16-S (i7-8750H, RTX 2080 Max-Q): Intel Core i7-8750H, 16.10", 2.1 kg
External Review » Origin PC EVO16-S (i7-8750H, RTX 2080 Max-Q)
Asus Zephyrus S GX701GX-EV021R: Intel Core i7-8750H, 17.30", 2.7 kg
External Review » Asus Zephyrus S GX701GX-EV021R
Acer ConceptD 7: Intel Core i7-9750H, 15.60", 2.1 kg
External Review » Acer ConceptD 7
MSI GS65 8SG-005: Intel Core i7-8750H, 15.60", 1.9 kg
External Review » MSI GS65 8SG-005
Alienware m15-565K7: Intel Core i9-8950HK, 15.60", 2.2 kg
External Review » Alienware m15-565K7
Alienware m17 P37E: Intel Core i9-8950HK, 17.30", 2.6 kg
External Review » Alienware m17 P37E
Razer Blade 15 RTX 2080 Max-Q: Intel Core i7-9750H, 15.60", 2.2 kg
External Review » Razer Blade 15 RTX 2080 Max-Q
Lenovo Legion Y740-17ICHg-81HH001NGE: Intel Core i7-8750H, 17.30", 2.9 kg
External Review » Lenovo Legion Y740-17ICHg-81HH001NGE
Asus Zephyrus S GX531GX: Intel Core i7-8750H, 15.60", 2.1 kg
External Review » Asus Zephyrus S GX531GX
Asus Zephyrus S GX701GX-EV064T: Intel Core i7-8750H, 17.30", 2.6 kg
External Review » Asus Zephyrus S GX701GX-EV064T
Gigabyte Aero 15-Y9: Intel Core i9-8950HK, 15.60", 2.1 kg
External Review » Gigabyte Aero 15-Y9
Asus Zephyrus S GX531GX-ES036R: Intel Core i7-8750H, 15.60", 2.1 kg
External Review » Asus Zephyrus S GX531GX-ES036R
Gigabyte Aero 15 Y9-9UK4720P: Intel Core i9-8950HK, 15.60", 2 kg
External Review » Gigabyte Aero 15 Y9-9UK4720P
Acer Predator Triton 500: Intel Core i7-8750H, 15.60", 2.1 kg
External Review » Acer Predator Triton 500
Lenovo Legion Y740-17ICH: Intel Core i7-8750H, 17.30", 2.8 kg
External Review » Lenovo Legion Y740-17ICH
Asus Zephyrus S GX701GX: Intel Core i7-8750H, 17.30", 2.6 kg
External Review » Asus Zephyrus S GX701GX
MSI GS65 8SG-055: Intel Core i7-8750H, 15.60", 1.9 kg
External Review » MSI GS65 8SG-055
MSI GS75 8SG Stealth: Intel Core i7-8750H, 17.30", 2.3 kg
External Review » MSI GS75 8SG Stealth
Lenovo Legion Y740-17IRHg-81UJ001VGE: Intel Core i7-9750H, 17.30", 3 kg
» Enough performance for the latest games - Lenovo Legion Y740-17IRHg in review
Alienware m17 R2 P41E: Intel Core i9-9980HK, 17.30", 2.6 kg
» Alienware m17 R2 comes with the same Core i9 CPU as the XPS 15 and MacBook Pro 15, runs it 30 percent faster