MSI GS65 Stealth 9SG (i7-9750H, RTX 2080 Max-Q) Laptop Review
MSI has refreshed its GS65 series for 2019 with new Intel 9th gen CPUs and Nvidia Turing GPUs to replace last year's SKUs equipped with Intel 8th gen CPUs and Nvidia Pascal GPUs. The latest configurations range from the Core i7-9750H up to the Core i9-9880H with GeForce RTX 2060 graphics up to the RTX 2080 Max-Q. Display options include only 144 Hz or 240 Hz at 1080p with no 4K UHD as of this writing.
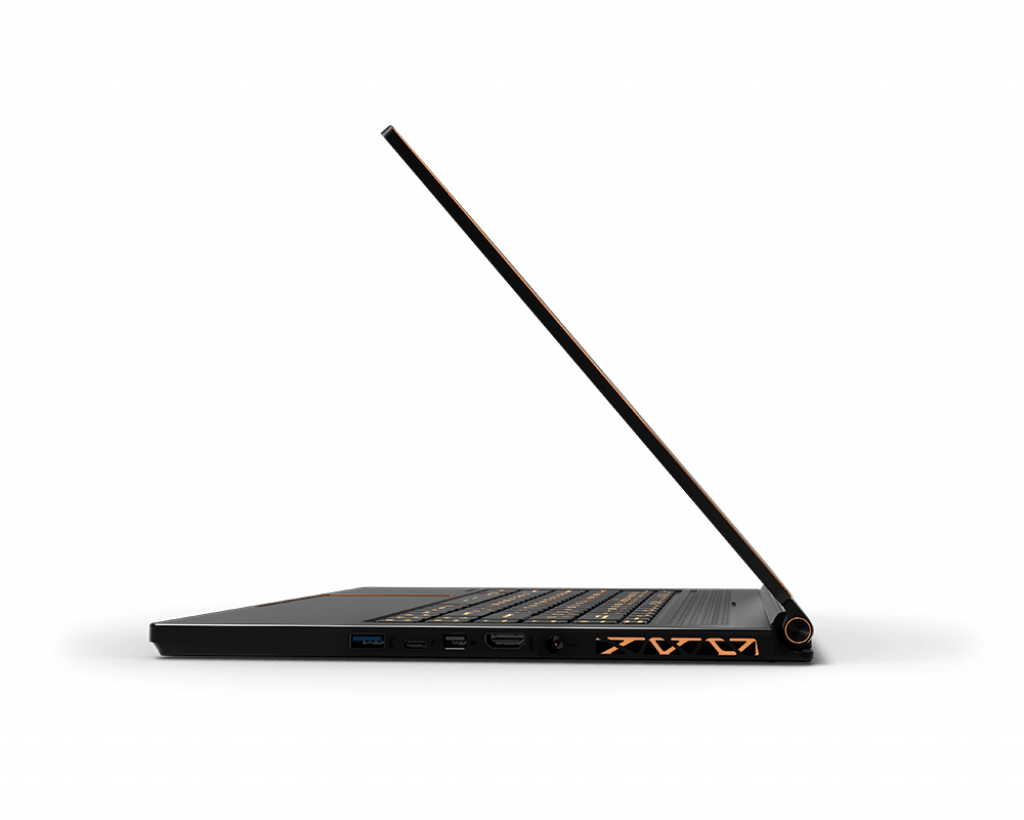
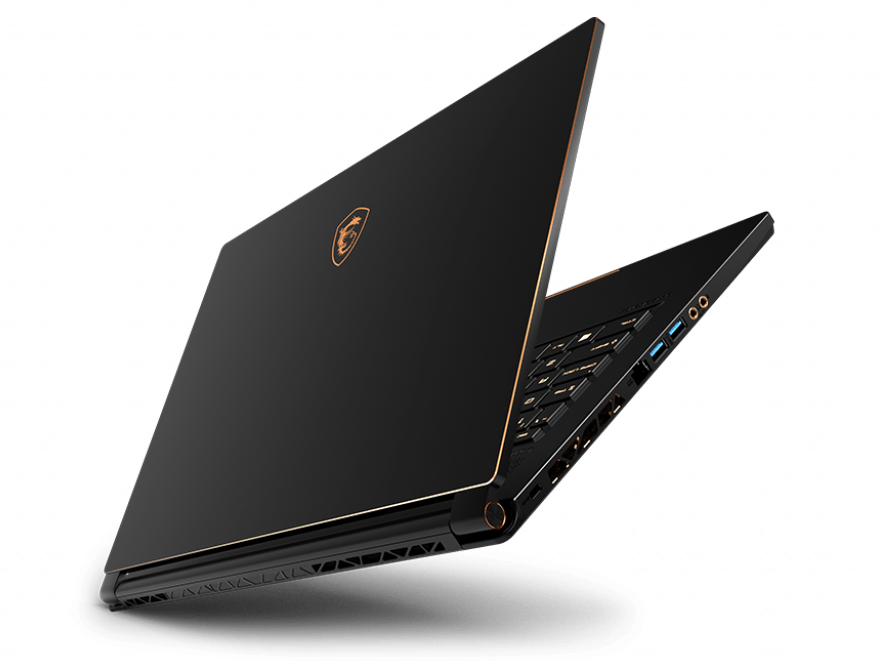
Other than the above changes, the new GS65 9SG/9SF/9SE SKUs are visually identical to last year's 8RE/8RF with only a few notable exceptions that we will detail below. We recommend checking out our earlier reviews on the GS65 8RE and 8RF for more information on the chassis and its features as nearly all our comments still apply here.
The GS65 9SG test unit we have today carries a Core i7-9750H with RTX 2080 Max-Q graphics, 240 Hz IPS display, and a 512 GB NVMe SSD for $3000 USD on Xotic PC. Of course, lesser SKUs are available for up to $1000 less. Direct competitors include other super-thin gaming laptops like the Razer Blade 15, Asus Zephyrus S GX531, Aorus 15, Lenovo Legion Y740, Alienware m15, and the Acer Predator Helios 500. Users who want more budget offerings can still look at the entry-level MSI GP or GF series or the Asus TUF FX505DY series.
More MSI GS reviews:
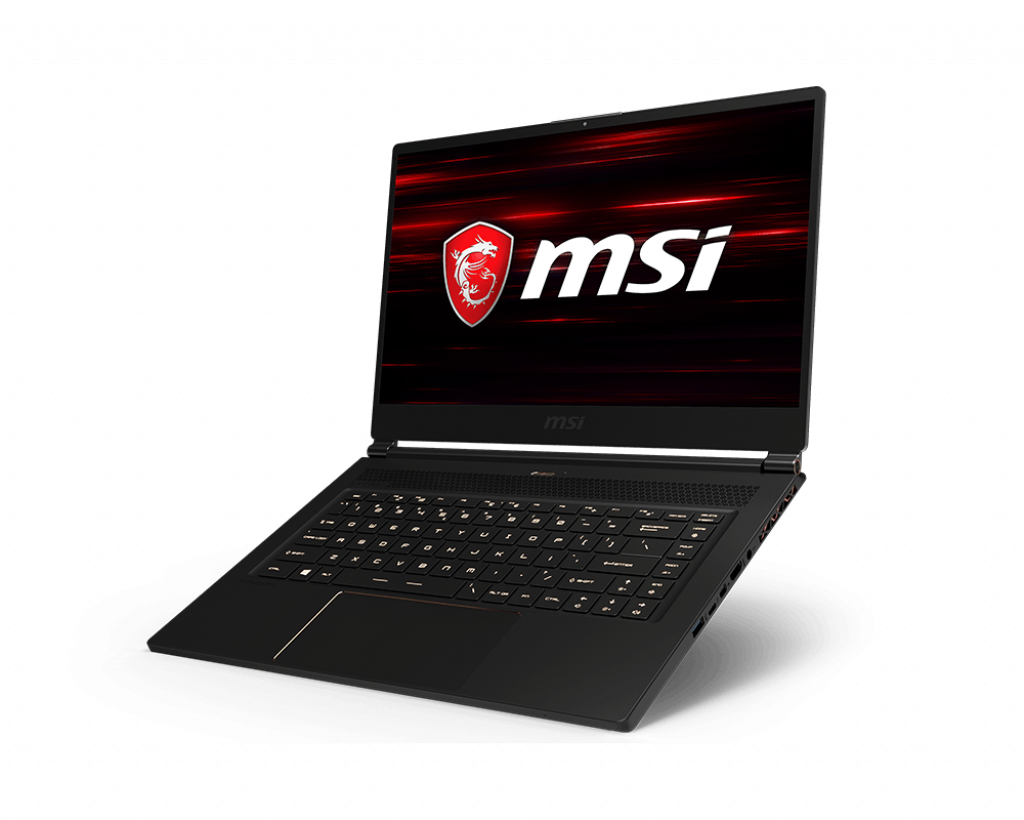
Case

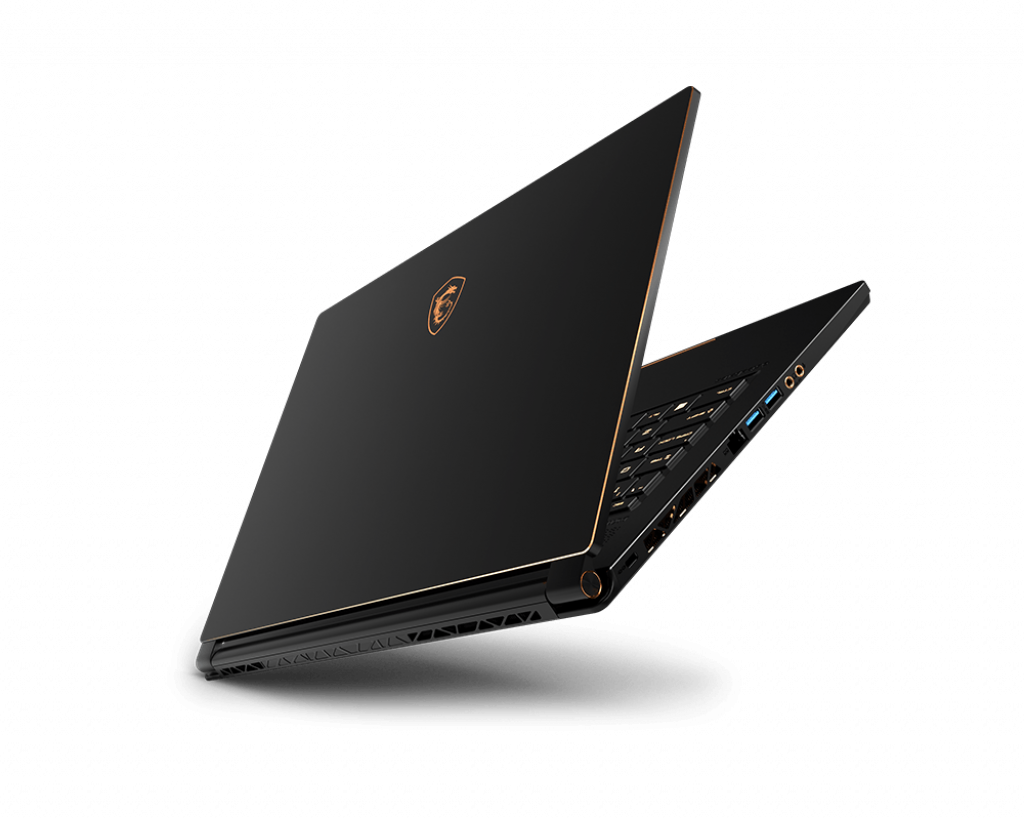
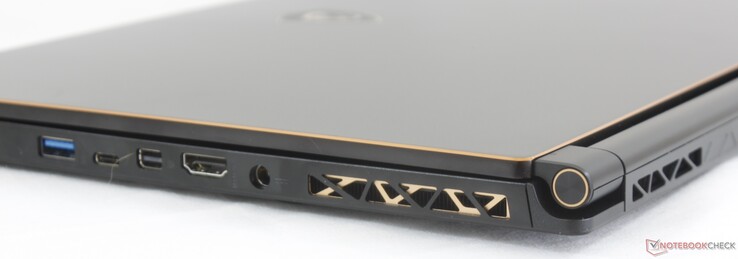
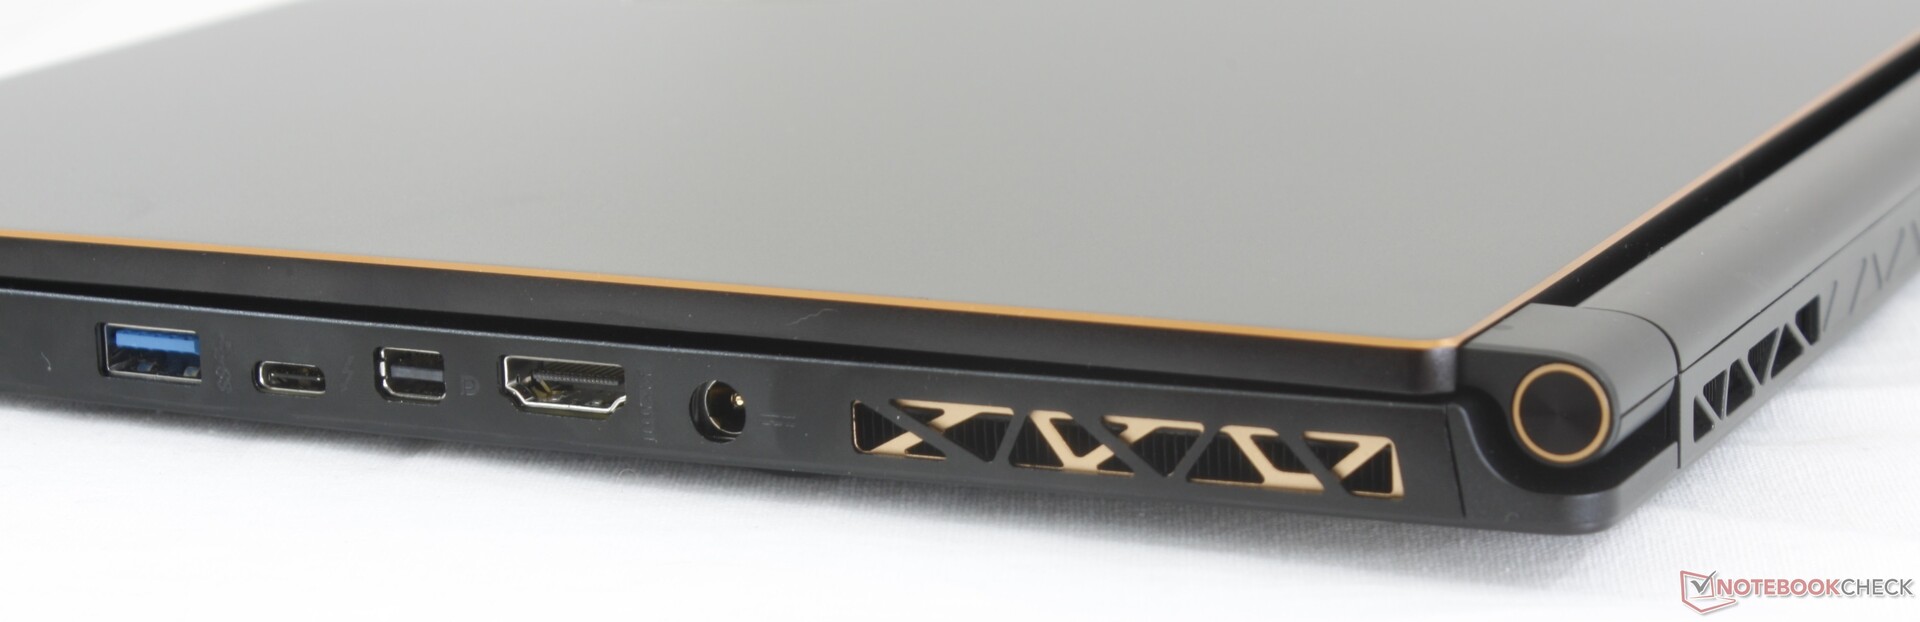
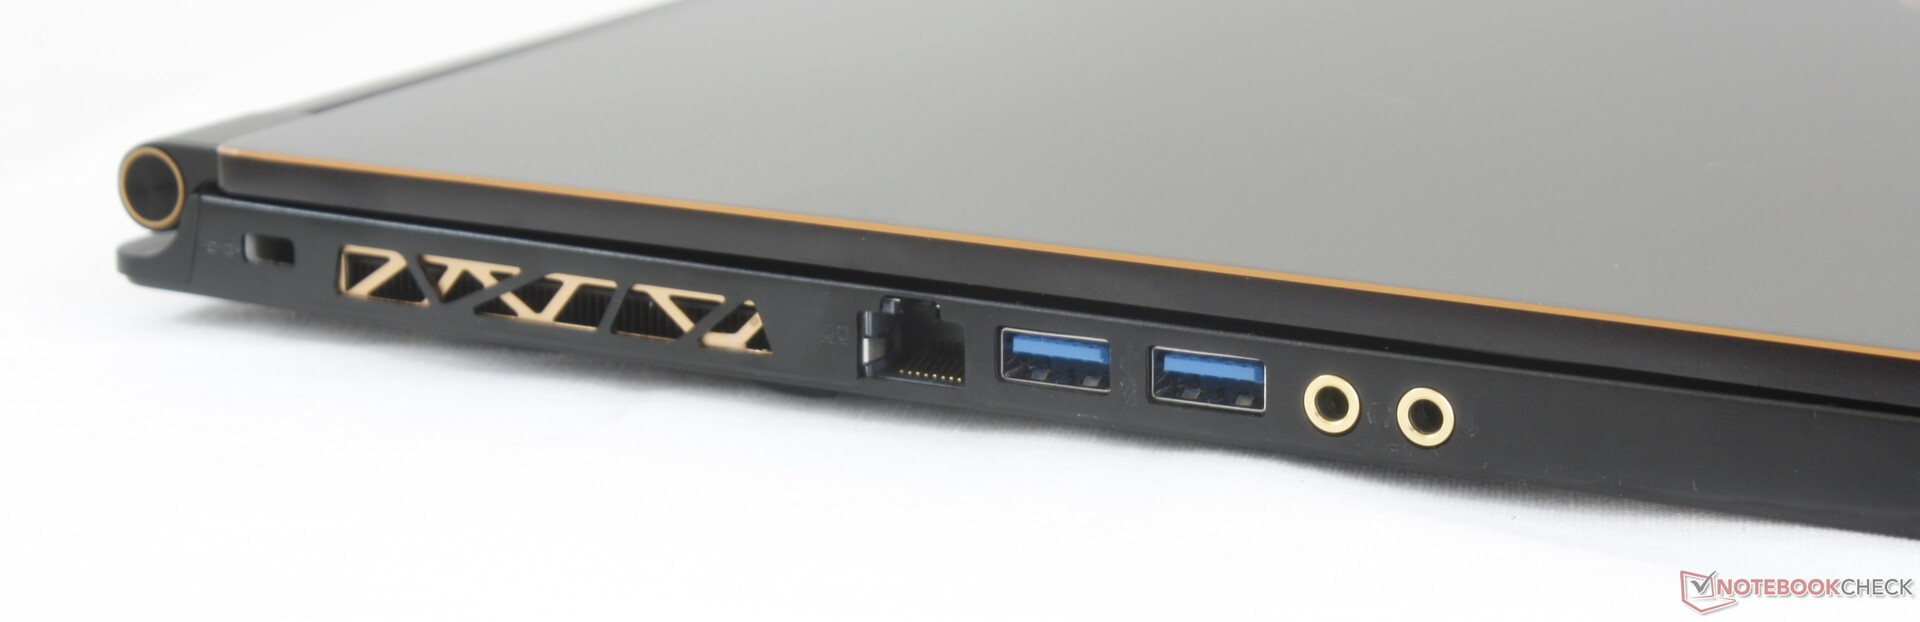
Connectivity
Communication
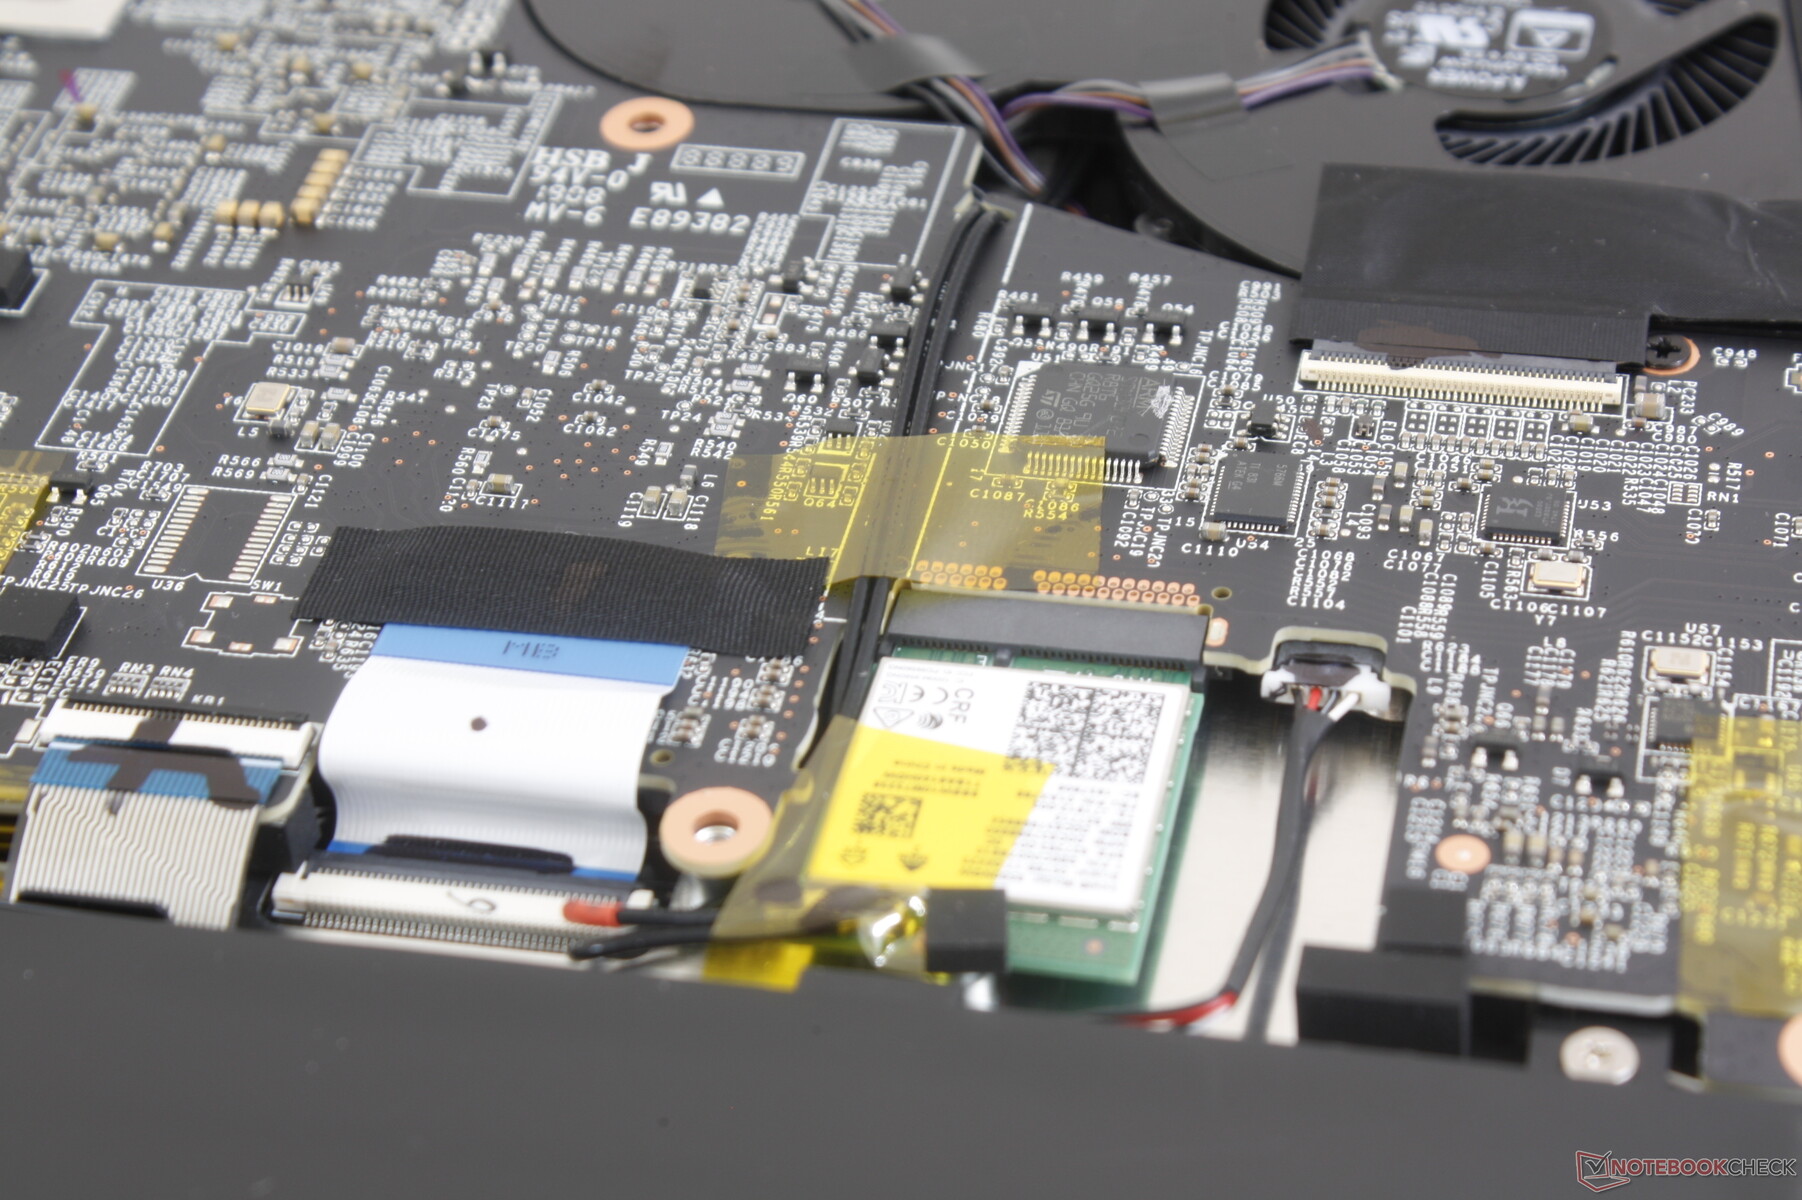
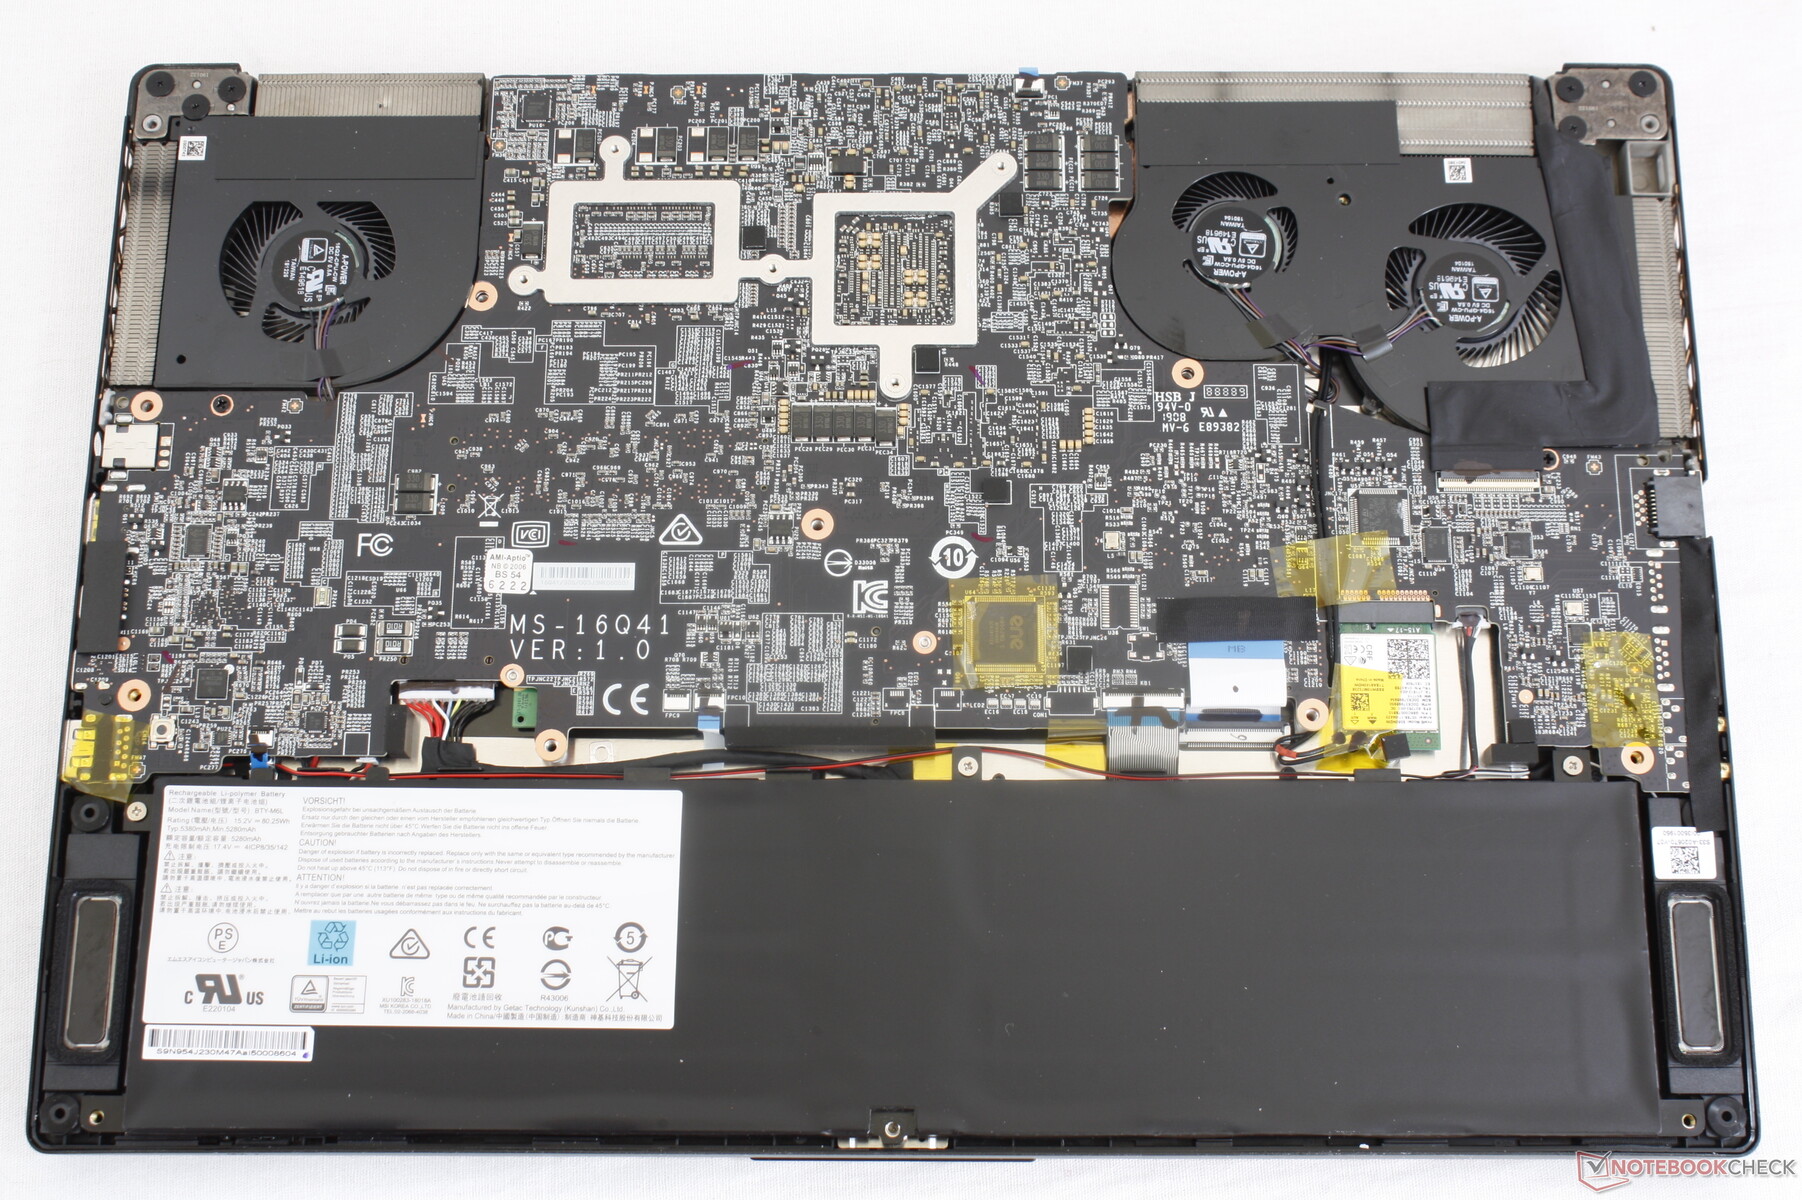
Maintenance
Warranty
The standard one-year limited manufacturer warranty applies. Users who register their laptops within 30 days of purchase will also receive one year of accidental damage coverage. Xotic PC also offers one-year warranty on any customized components with extended warranty options if desired.
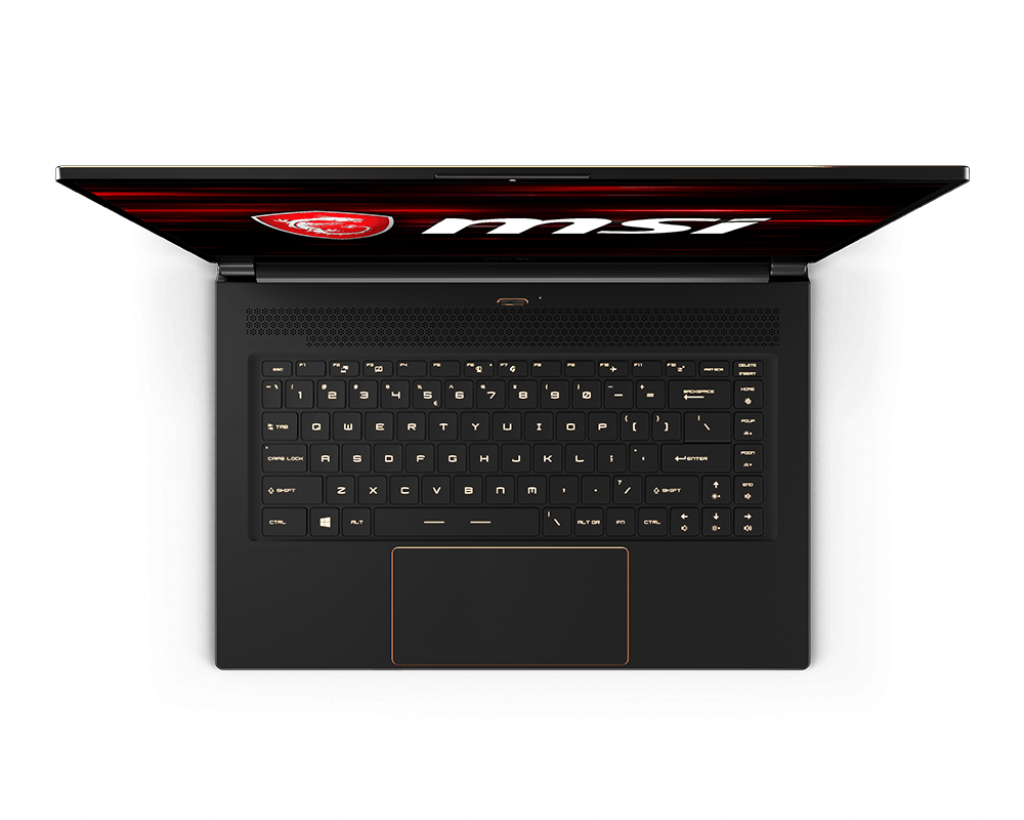
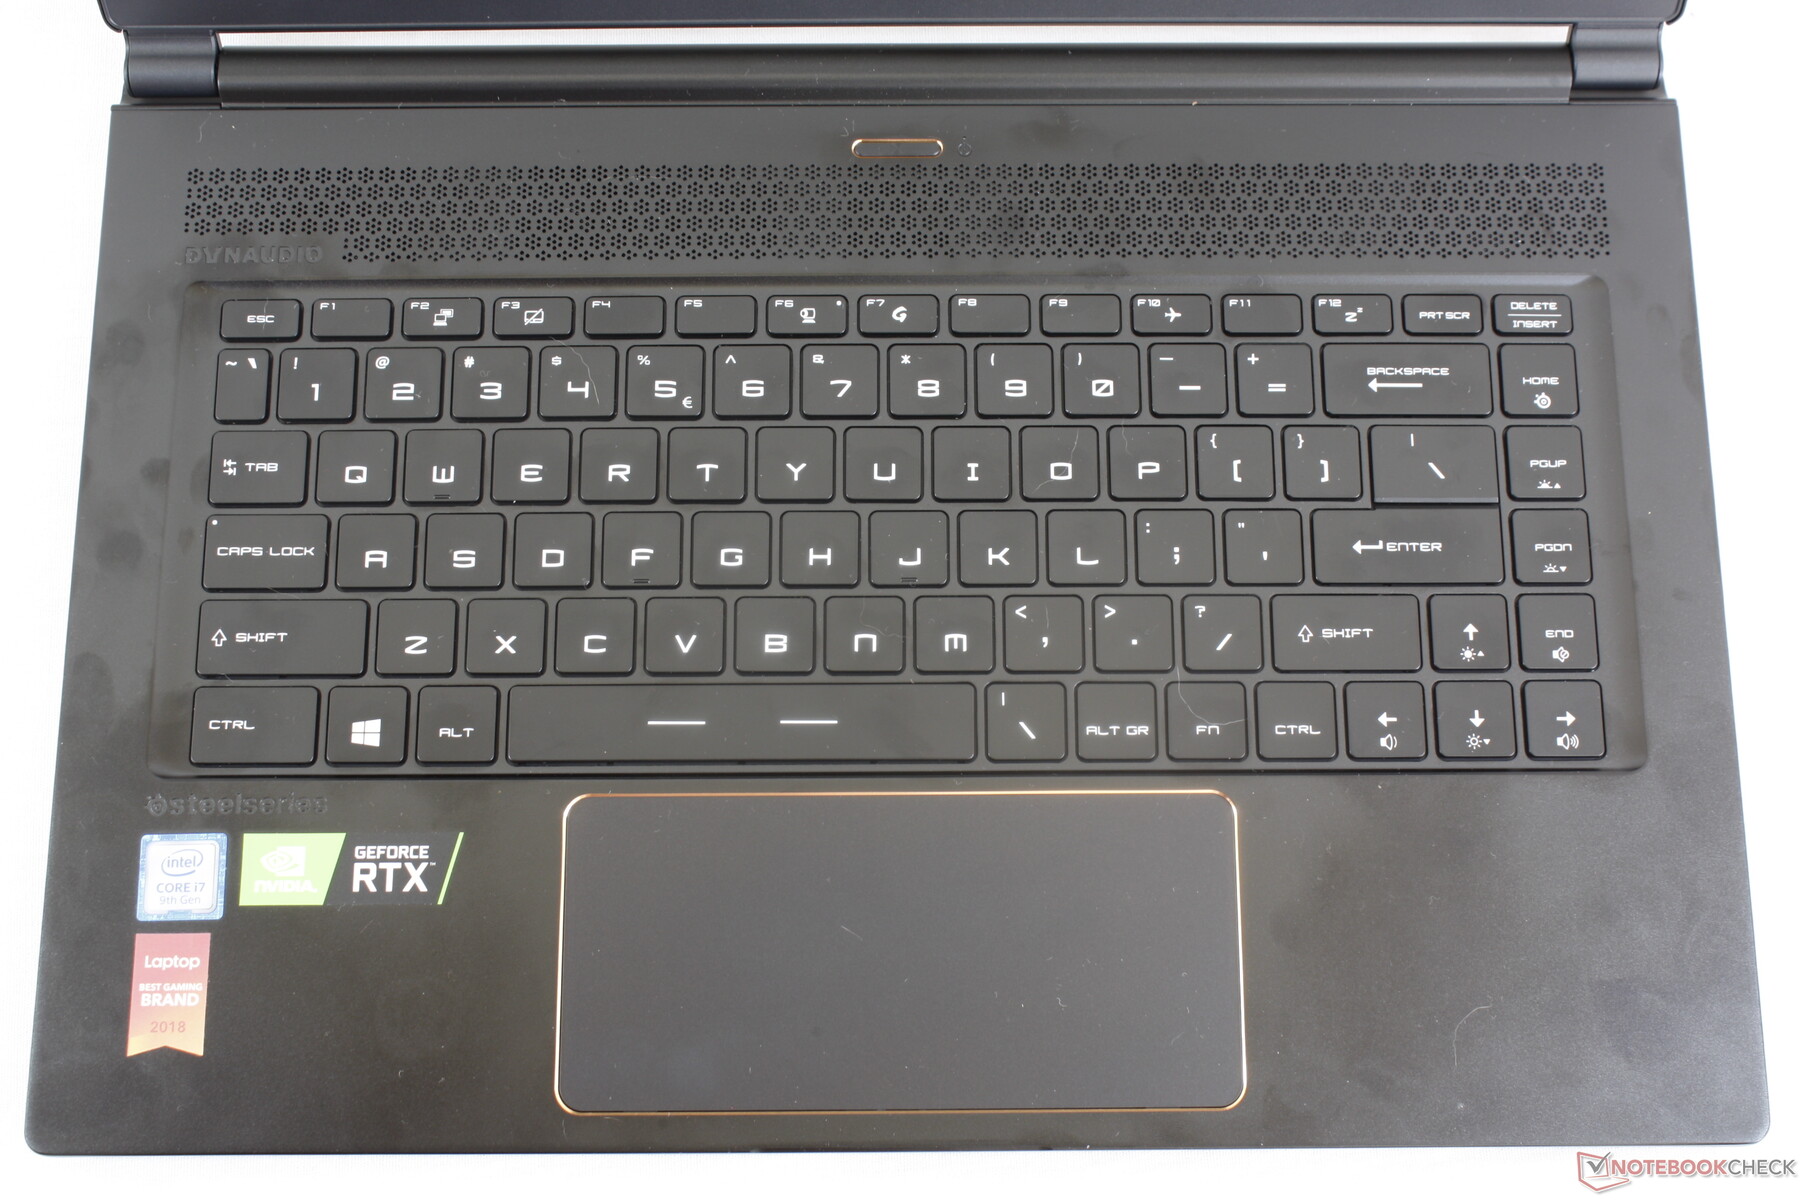
Input Devices
Touchpad
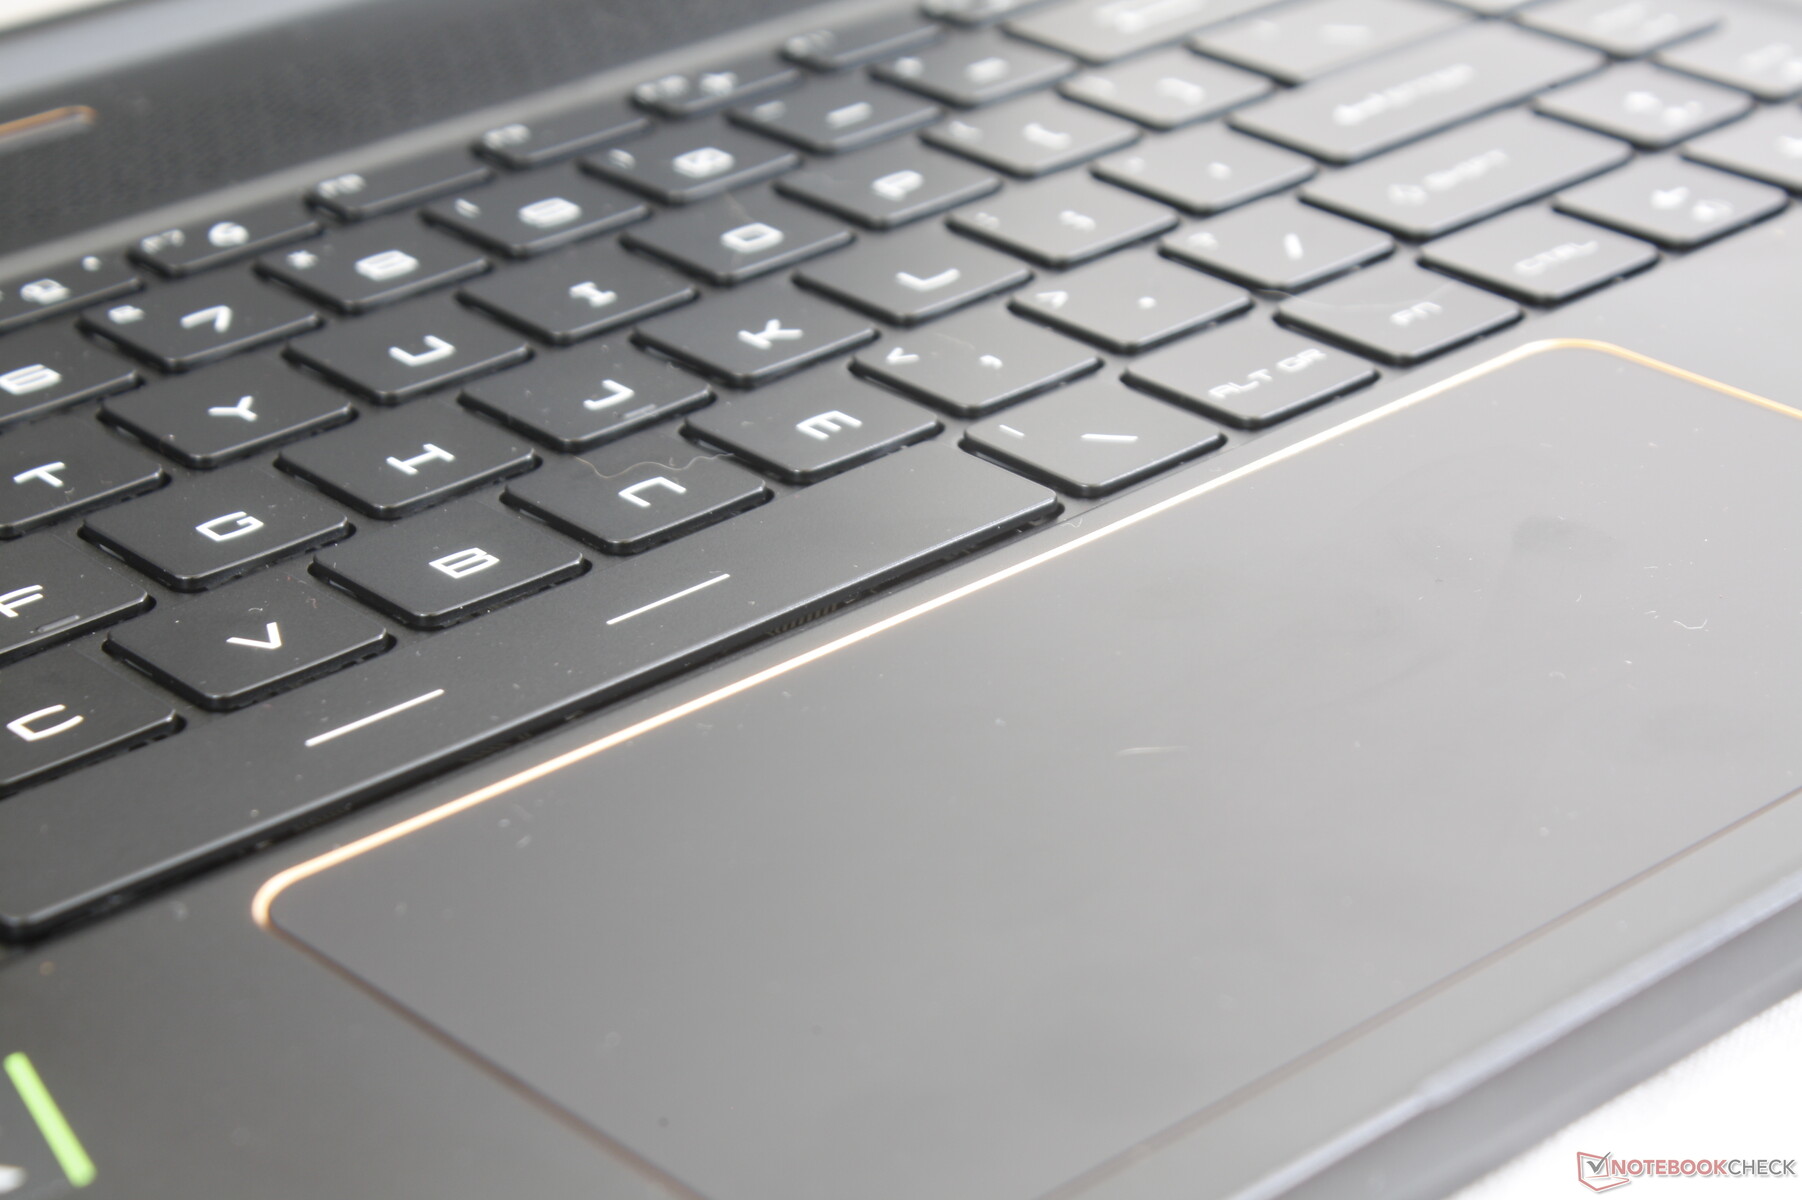
The Precision-enabled clickpad has increased in surface area from 10.5 x 7 cm on last year's GS65 8RF to 14 x 6.5 cm on this latest iteration. This is definitely the easiest way to tell the difference between a GS65 with 8th gen Intel versus a GS65 with 9th gen Intel. Everything else remains identical including the per-key RGB keyboard and textures of the keys and clickpad. The integrated mouse keys offer moderate feedback with an audible click when pressed. Expect fingerprints to accumulate quickly.
Display
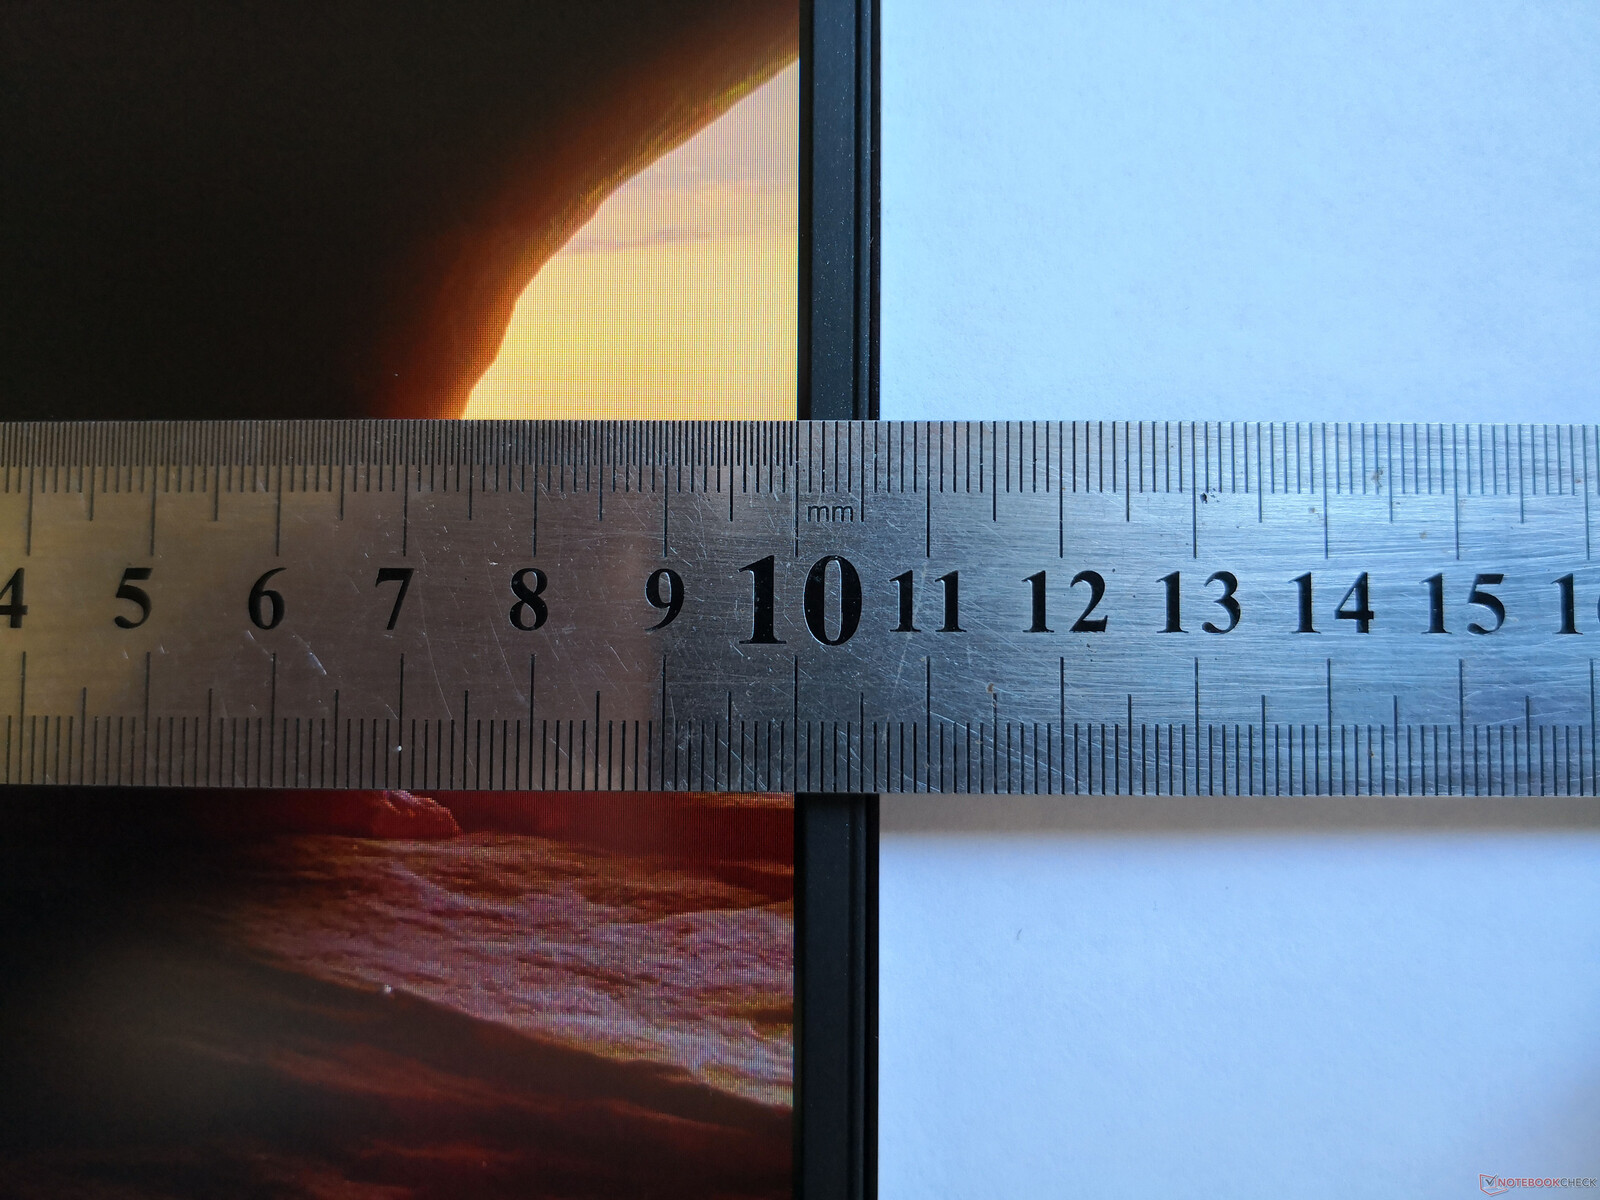
Two display options are available: 144 Hz or 240 Hz. Both are FHD IPS panels with no OLED, 4K UHD, or touchscreen features to speak of. Our particular test unit is equipped with a 240 Hz panel that just so happens to be the same 240 Hz Sharp LQ156M1JW03 panel as found on the latest Razer Blade 15. Thus, these two systems share very similar response times, contrast ratios, gamut, and screen clarity. Even the brightness of the two displays are very close at just under 300 nits. All of our comments on the 240 Hz Blade 15 display apply here on our MSI GS65. In short, it's hard to go back to 60 Hz once you become accustomed to 144 Hz or 240 Hz displays.
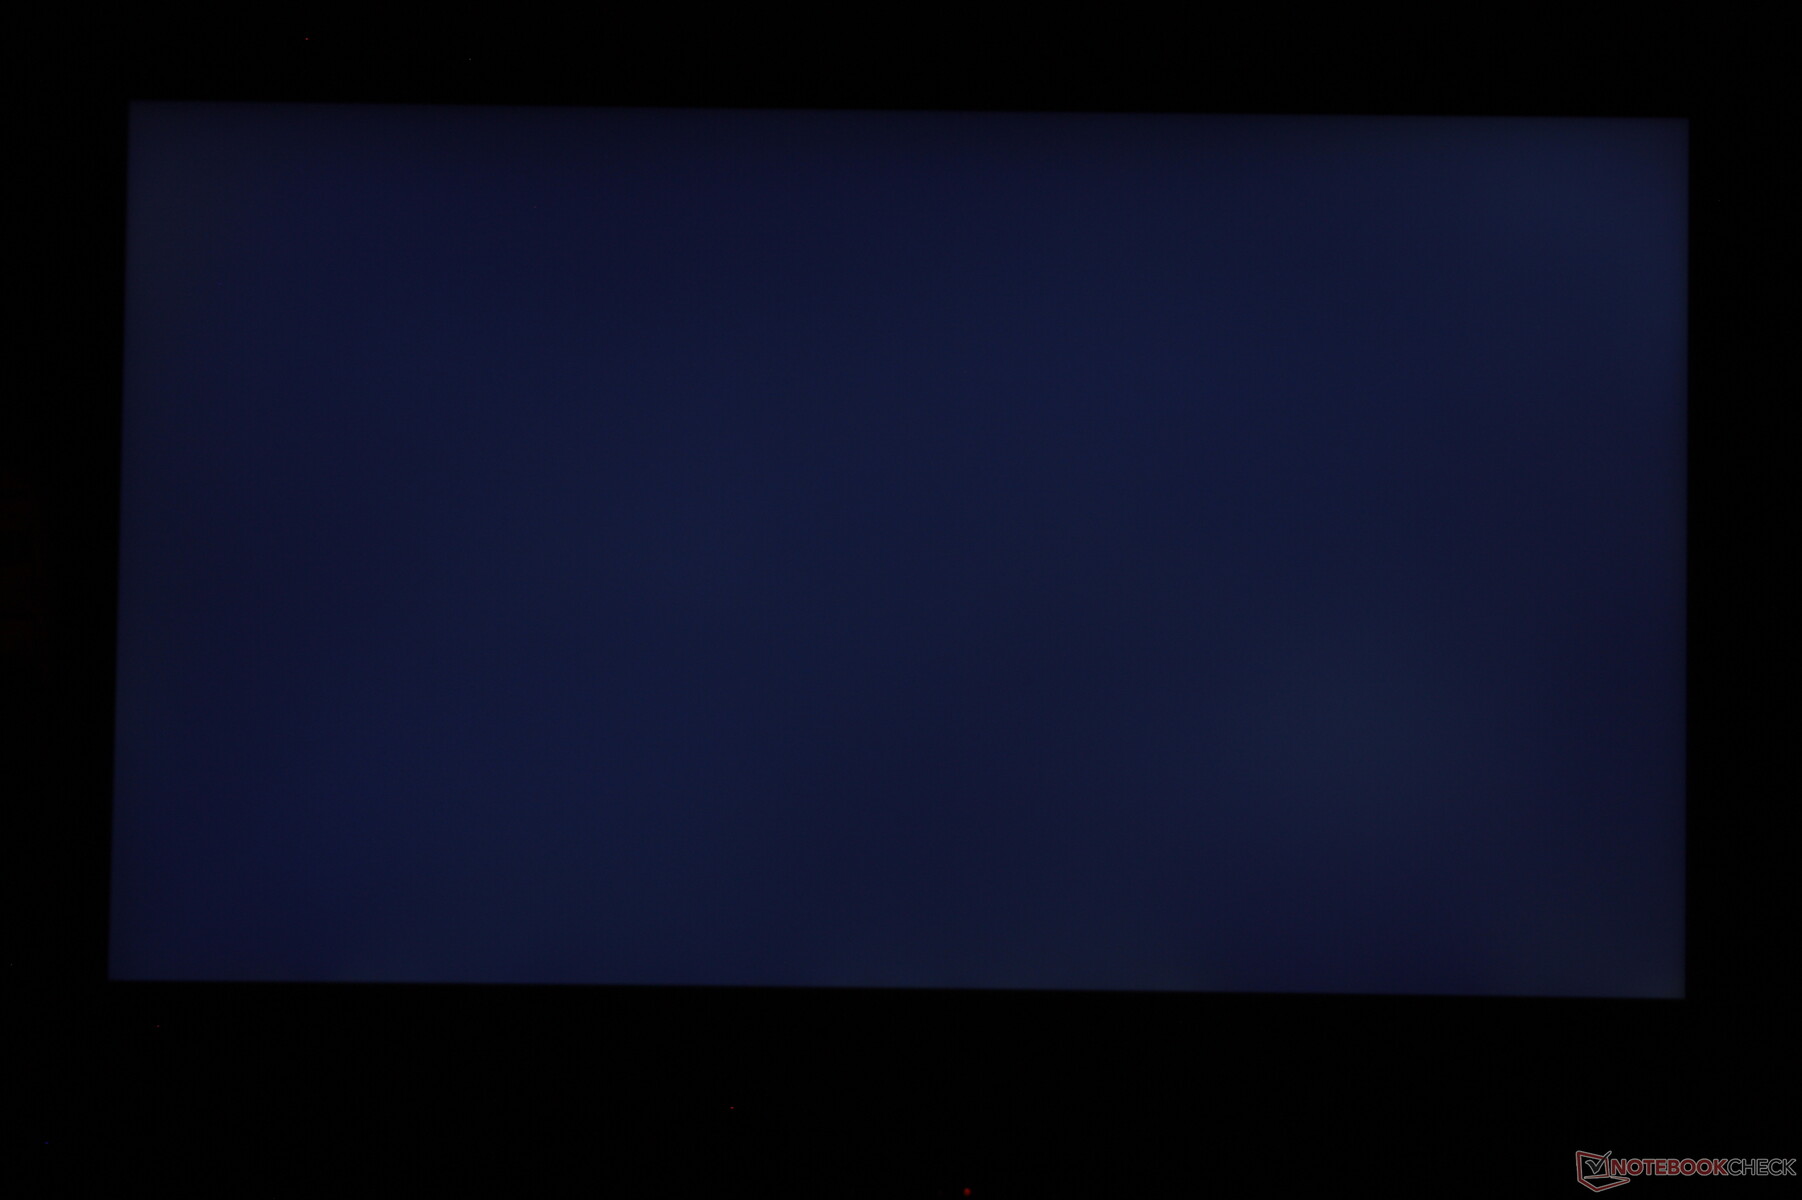
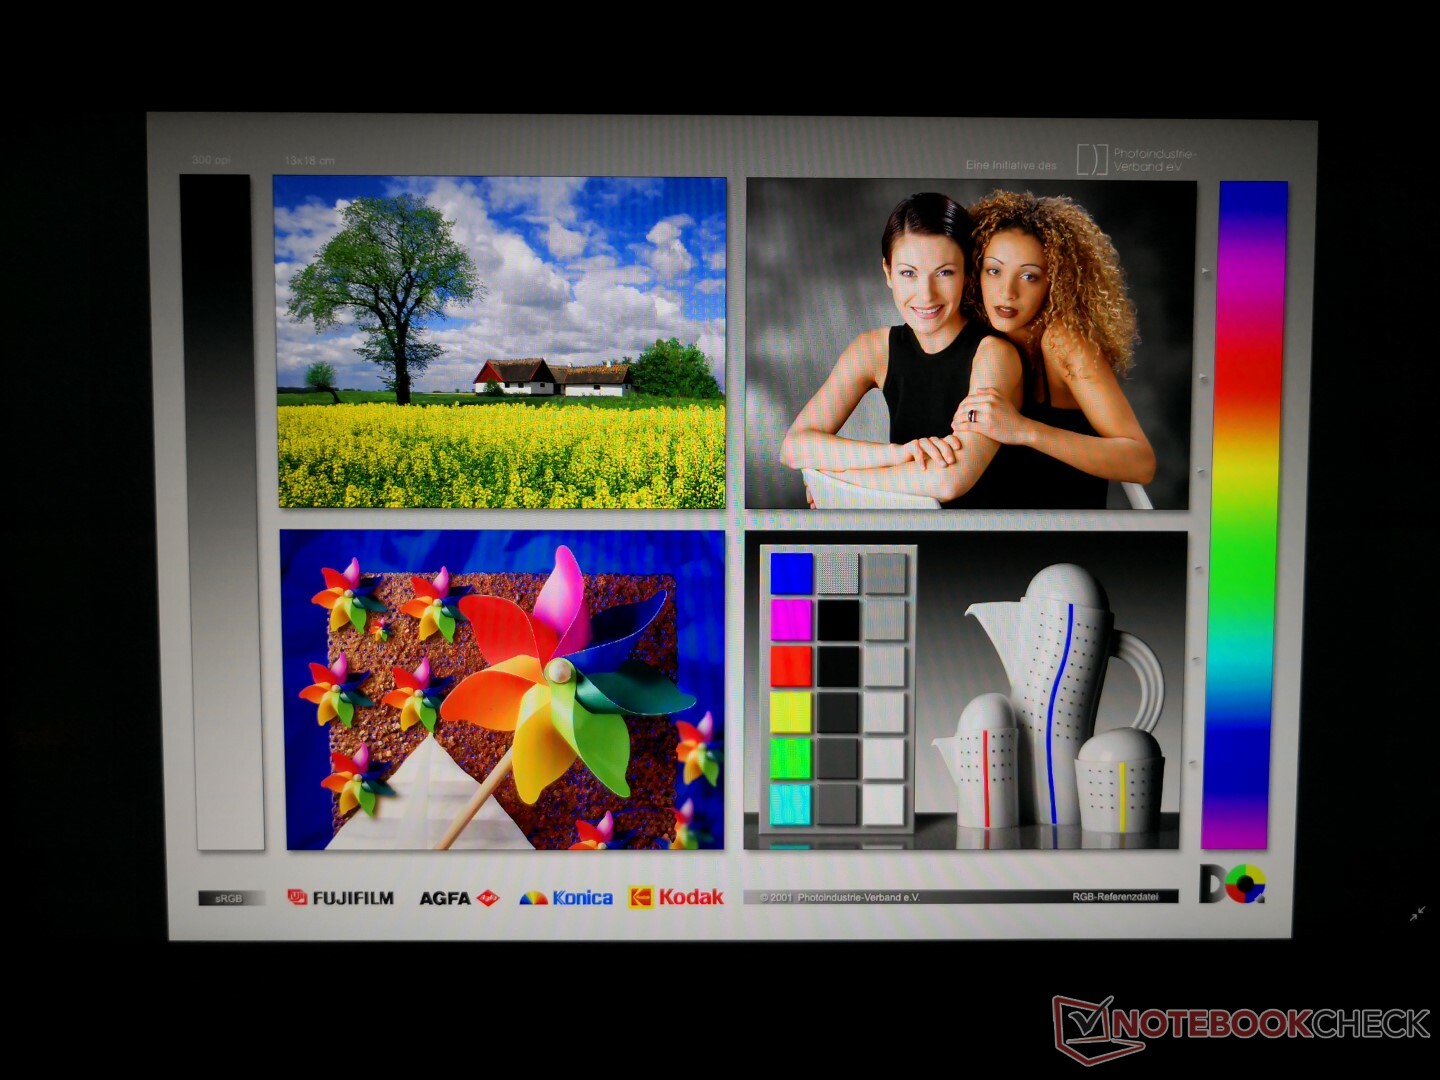
We're surprised to find essentially no uneven backlight bleeding on our test unit. Most IPS displays have at least some uneven bleeding around the corners or edges of the screen, but this is not the case here. Texts and images are also crisp with no major graininess issues commonly associated with matte panels.


| |||||||||||||||||||||||||
Brightness Distribution: 90 %
Center on Battery: 282.3 cd/m²
Contrast: 882:1 (Black: 0.32 cd/m²)
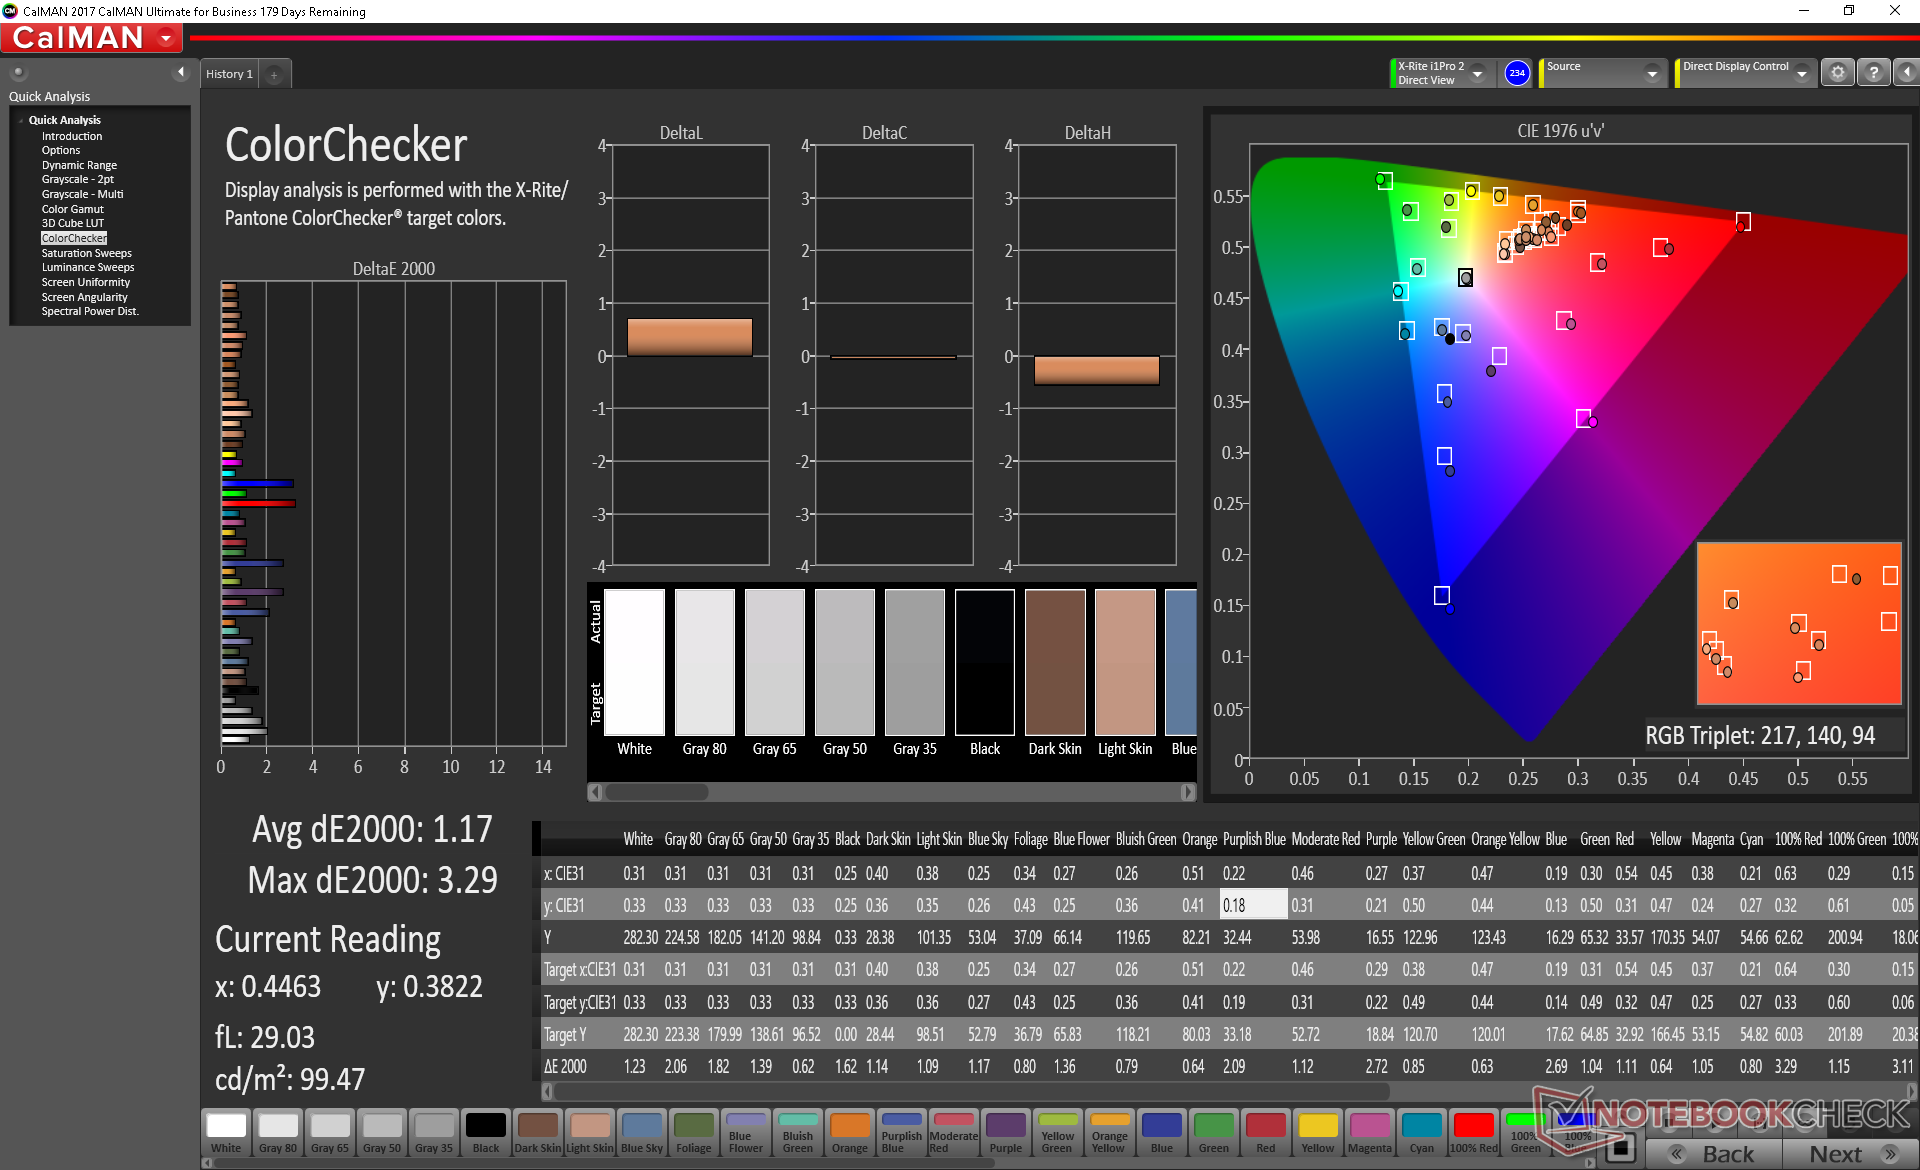
ΔE ColorChecker Calman: 1.17 | ∀{0.5-29.43 Ø4.72}
calibrated: 1.06
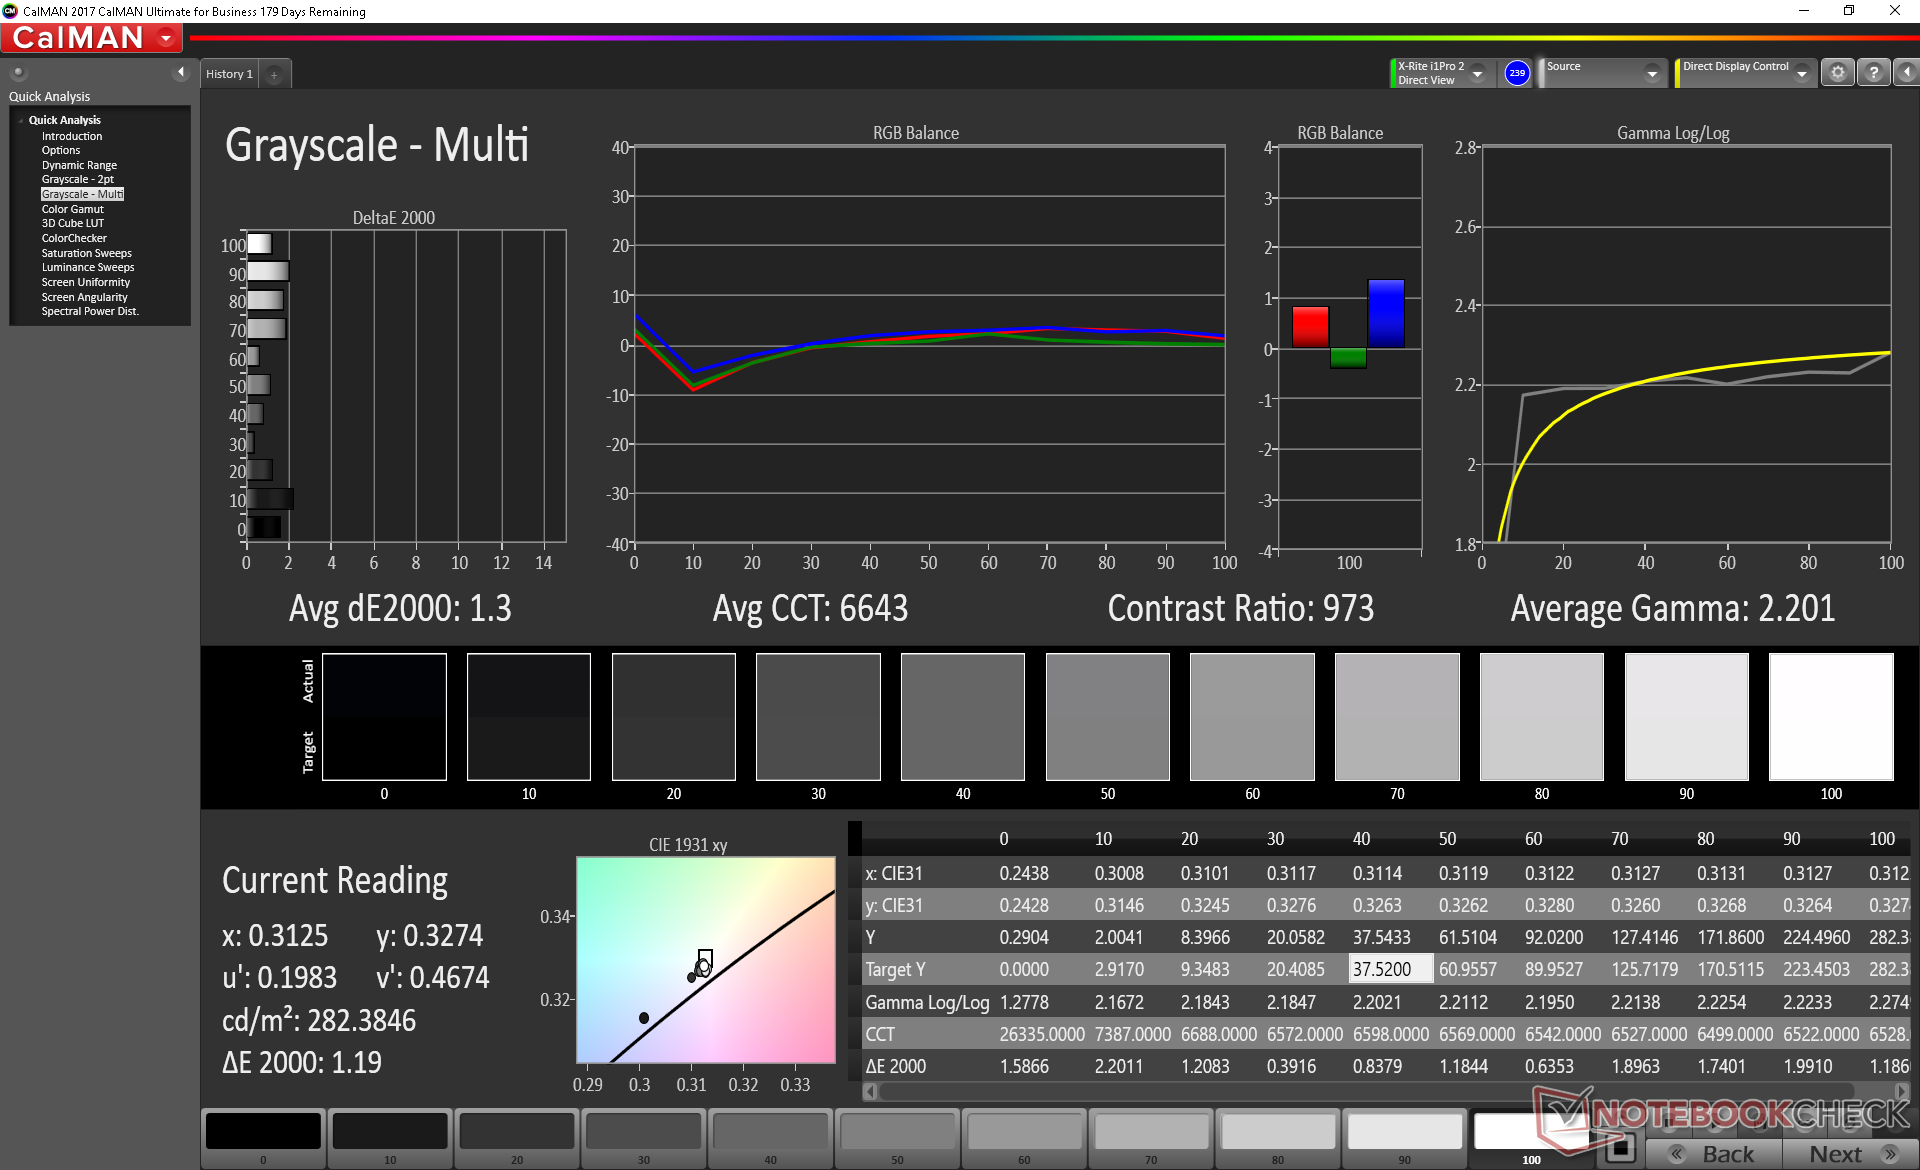
ΔE Greyscale Calman: 1.3 | ∀{0.09-98 Ø4.97}
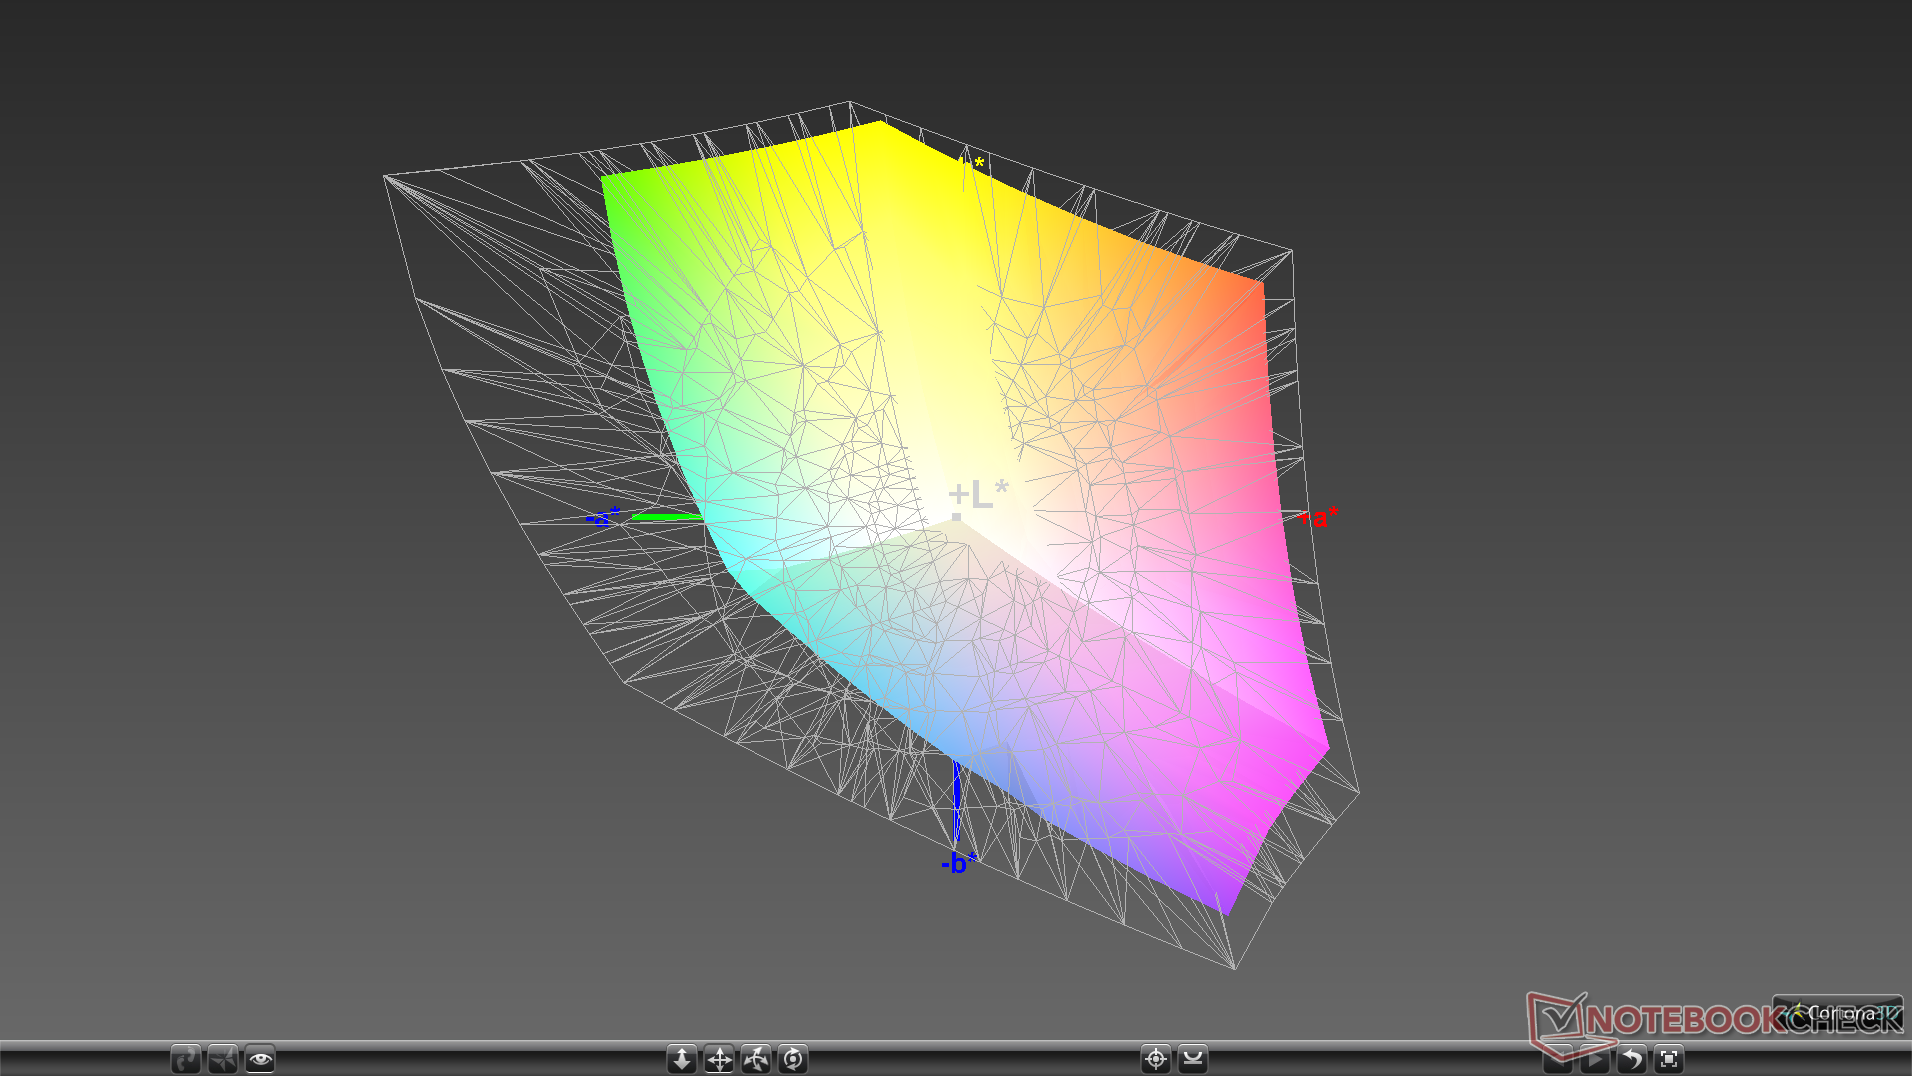
97.5% sRGB (Argyll 1.6.3 3D)
63.8% AdobeRGB 1998 (Argyll 1.6.3 3D)
68.9% AdobeRGB 1998 (Argyll 3D)
97.5% sRGB (Argyll 3D)
67.6% Display P3 (Argyll 3D)
Gamma: 2.2
CCT: 6643 K
| MSI GS65 Stealth 9SG Sharp LQ156M1JW03 (SHP14C5), IPS, 15.6", 1920x1080 | Razer Blade 15 RTX 2080 Max-Q Sharp LQ156M1JW03 (SHP14C5), IPS, 15.6", 1920x1080 | Lenovo Legion Y740-15ICHg LP156WFG-SPB2, IPS, 15.6", 1920x1080 | Asus Zephyrus S GX531GX AU Optronics B156HAN08.2, IPS, 15.6", 1920x1080 | Gigabyte Aero 15 Classic-XA Sharp LQ156M1JW03 (SHP14C5), IGZO, 15.6", 1920x1080 | MSI GS65 8RF-019DE Stealth Thin AU Optronics B156HAN08.0 (AUO80ED), IPS, 15.6", 1920x1080 | |
|---|---|---|---|---|---|---|
| Display | -0% | -6% | -4% | -3% | -3% | |
| Display P3 Coverage (%) | 67.6 | 66.9 -1% | 63.5 -6% | 65.6 -3% | 65.3 -3% | 66.2 -2% |
| sRGB Coverage (%) | 97.5 | 98.1 1% | 92.4 -5% | 92.2 -5% | 95.5 -2% | 92.1 -6% |
| AdobeRGB 1998 Coverage (%) | 68.9 | 68.5 -1% | 64.7 -6% | 66.9 -3% | 66.5 -3% | 67.2 -2% |
| Response Times | 10% | -24% | 35% | -3% | -18% | |
| Response Time Grey 50% / Grey 80% * (ms) | 13.6 ? | 12.8 ? 6% | 18.8 ? -38% | 7 ? 49% | 15.2 ? -12% | 17.6 ? -29% |
| Response Time Black / White * (ms) | 12 ? | 10.4 ? 13% | 13.2 ? -10% | 9.6 ? 20% | 11.2 ? 7% | 12.8 ? -7% |
| PWM Frequency (Hz) | 23260 ? | 23810 ? | 23580 ? | |||
| Screen | -10% | -53% | -44% | -36% | -19% | |
| Brightness middle (cd/m²) | 282.3 | 293 4% | 320.4 13% | 323.6 15% | 266 -6% | 254 -10% |
| Brightness (cd/m²) | 269 | 270 0% | 298 11% | 315 17% | 248 -8% | 262 -3% |
| Brightness Distribution (%) | 90 | 87 -3% | 85 -6% | 91 1% | 89 -1% | 89 -1% |
| Black Level * (cd/m²) | 0.32 | 0.29 9% | 0.42 -31% | 0.29 9% | 0.31 3% | 0.22 31% |
| Contrast (:1) | 882 | 1010 15% | 763 -13% | 1116 27% | 858 -3% | 1155 31% |
| Colorchecker dE 2000 * | 1.17 | 1.69 -44% | 3.21 -174% | 3.31 -183% | 2.78 -138% | 2.37 -103% |
| Colorchecker dE 2000 max. * | 3.29 | 3.37 -2% | 5.54 -68% | 5.74 -74% | 5.96 -81% | 4.71 -43% |
| Colorchecker dE 2000 calibrated * | 1.06 | 1.24 -17% | 2.36 -123% | 2.73 -158% | 0.91 14% | 1.84 -74% |
| Greyscale dE 2000 * | 1.3 | 2.3 -77% | 3.6 -177% | 2.9 -123% | 3.58 -175% | 1.58 -22% |
| Gamma | 2.2 100% | 2.3 96% | 2.27 97% | 2.29 96% | 2.46 89% | 2.48 89% |
| CCT | 6643 98% | 6758 96% | 6503 100% | 6765 96% | 7186 90% | 6785 96% |
| Color Space (Percent of AdobeRGB 1998) (%) | 63.8 | 63 -1% | 59 -8% | 59.7 -6% | 62 -3% | 60 -6% |
| Color Space (Percent of sRGB) (%) | 97.5 | 98.5 1% | 92 -6% | 91.8 -6% | 96 -2% | 92 -6% |
| Total Average (Program / Settings) | 0% /
-6% | -28% /
-40% | -4% /
-26% | -14% /
-26% | -13% /
-16% |
* ... smaller is better
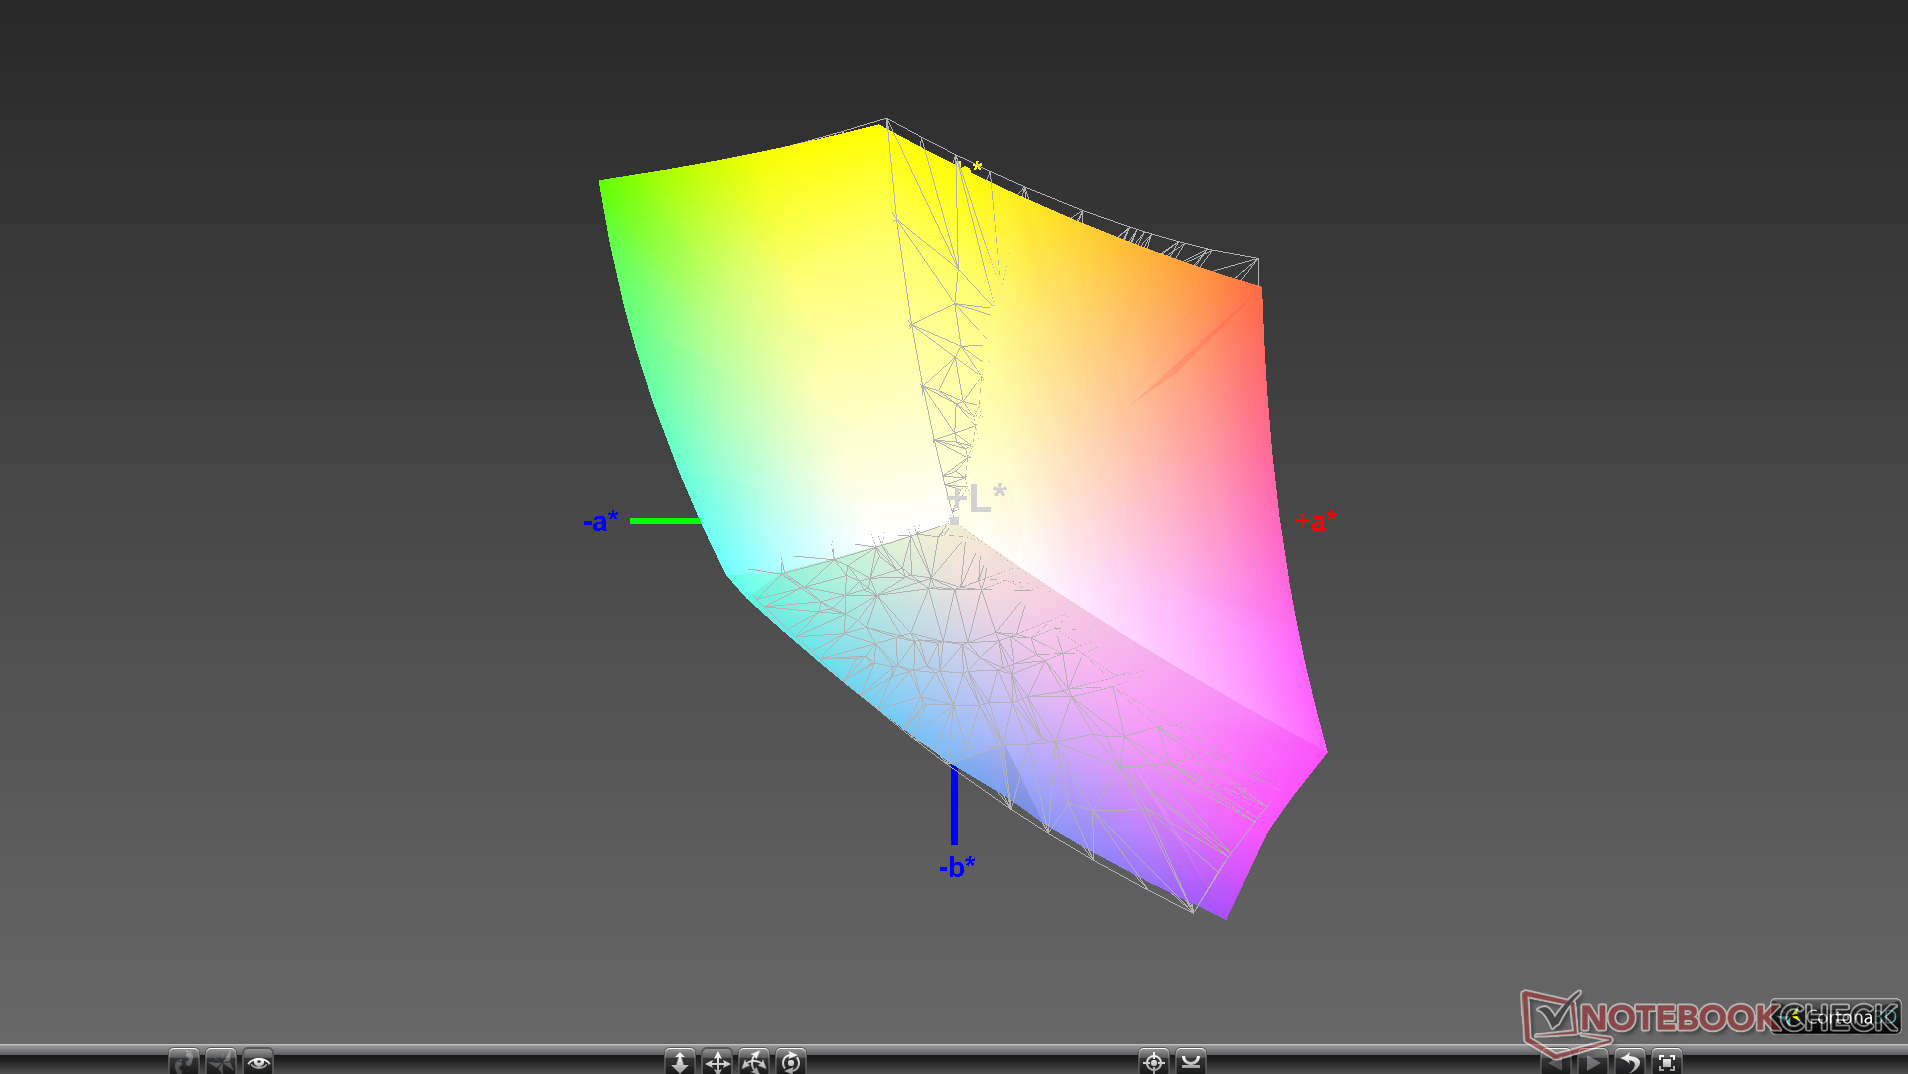
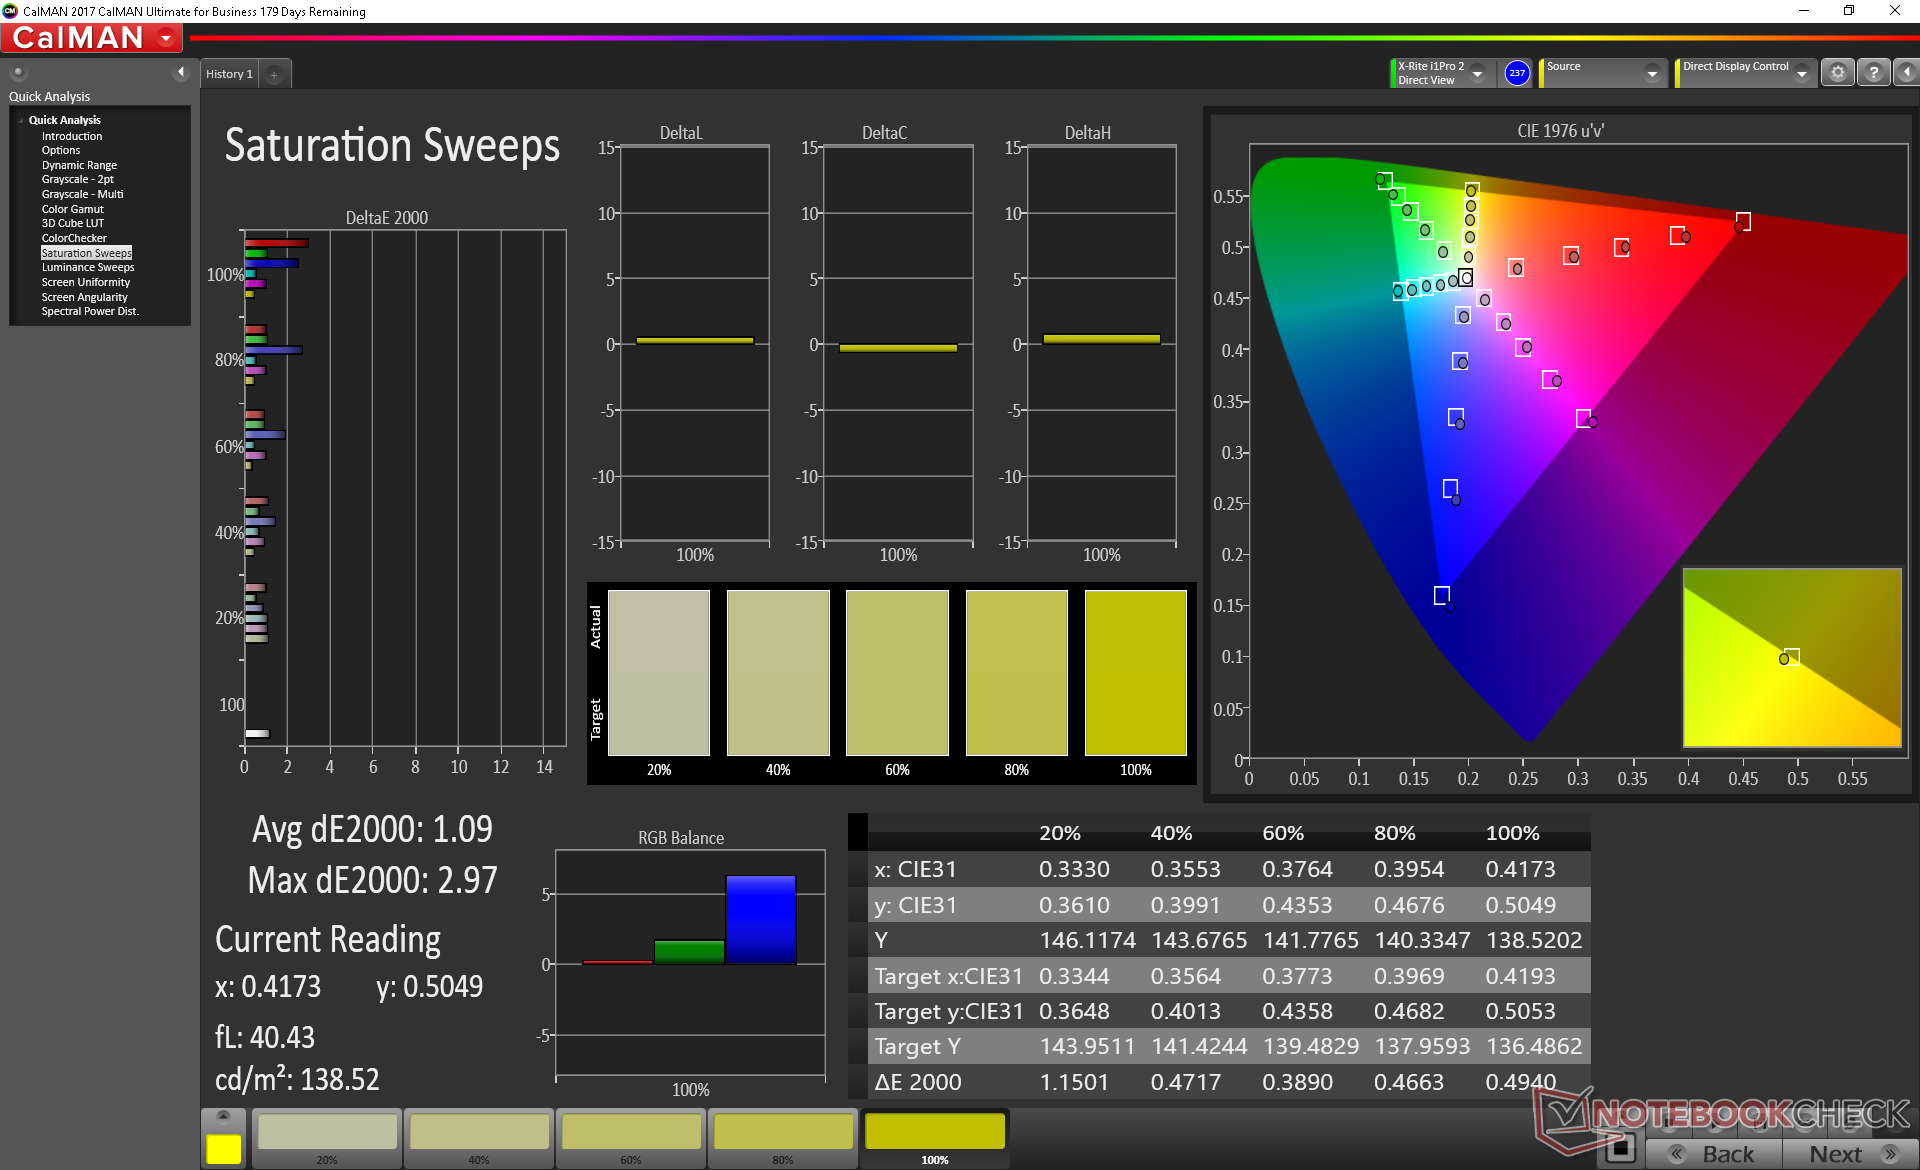
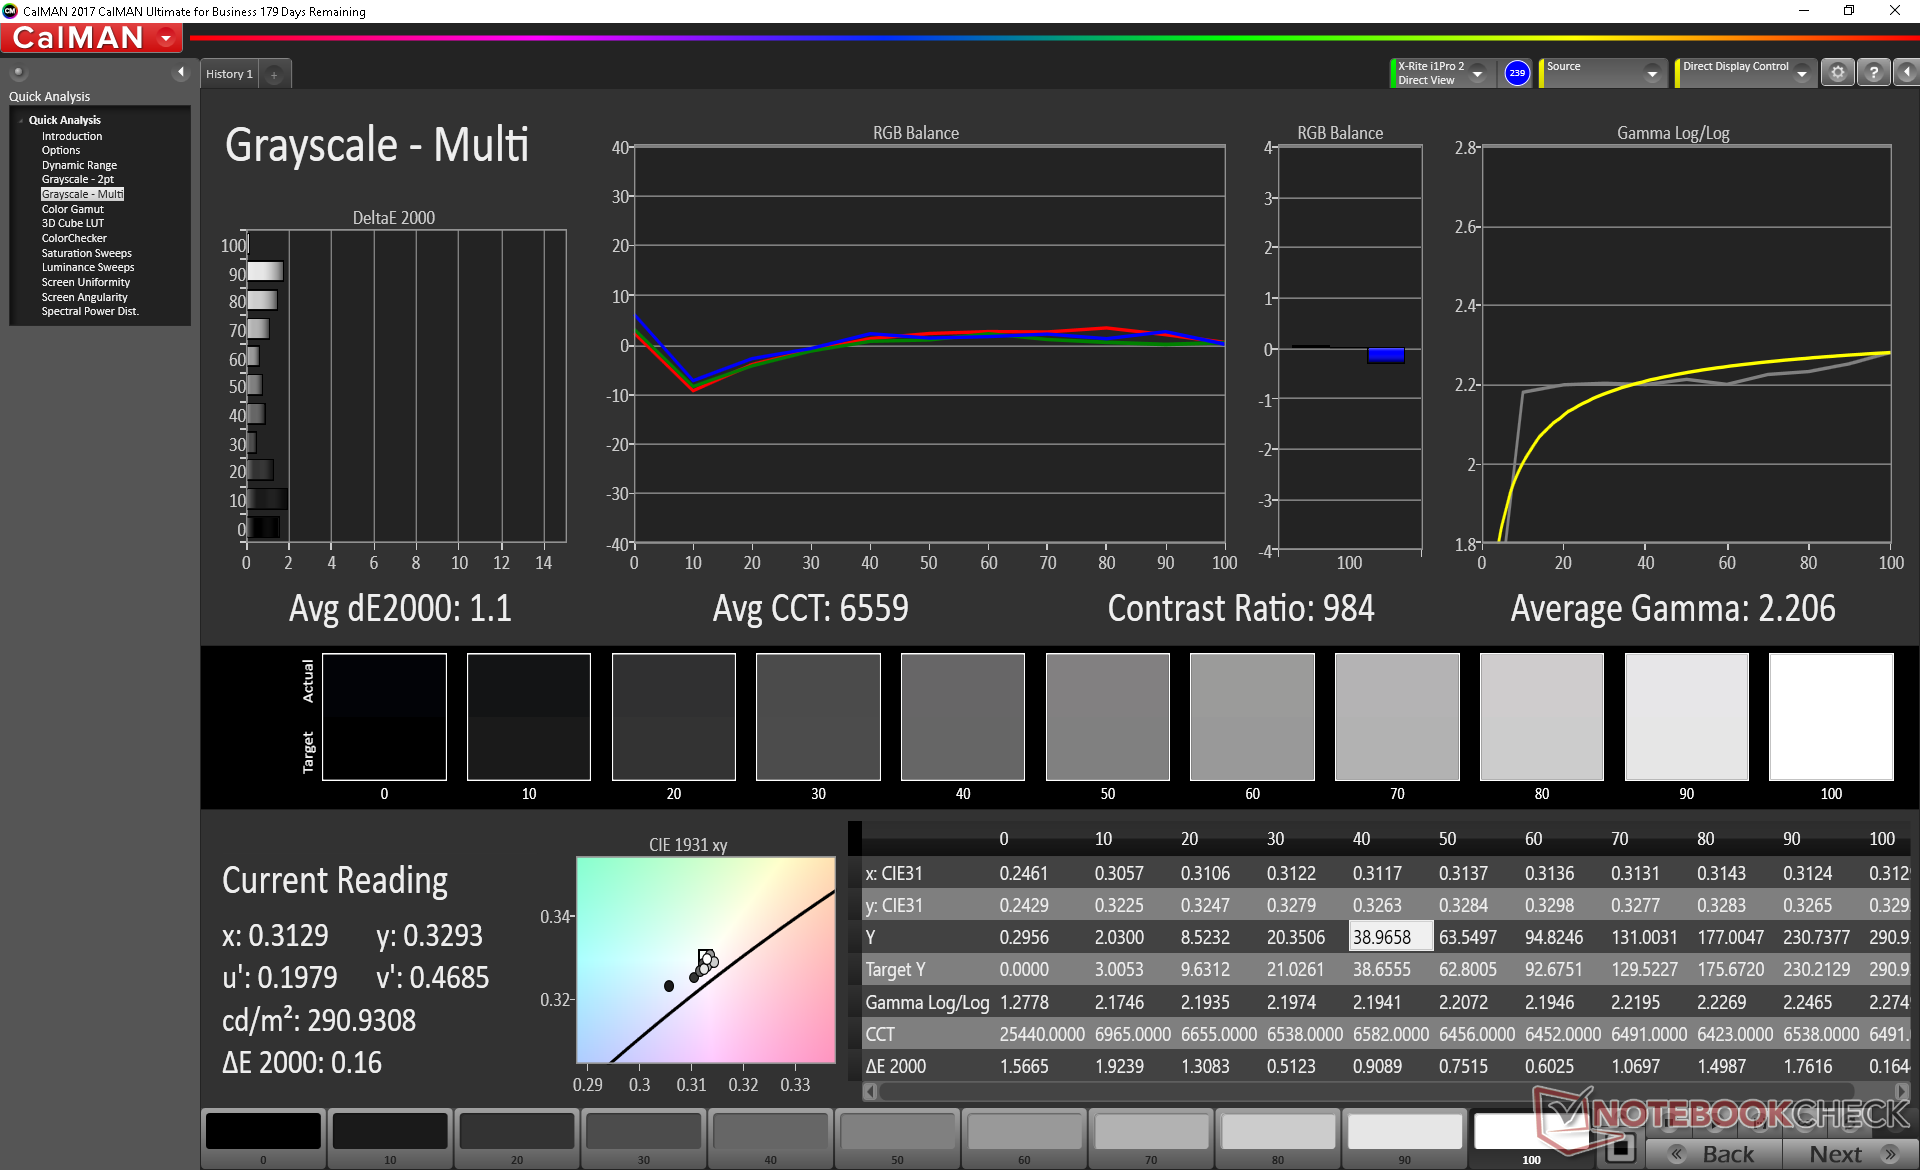
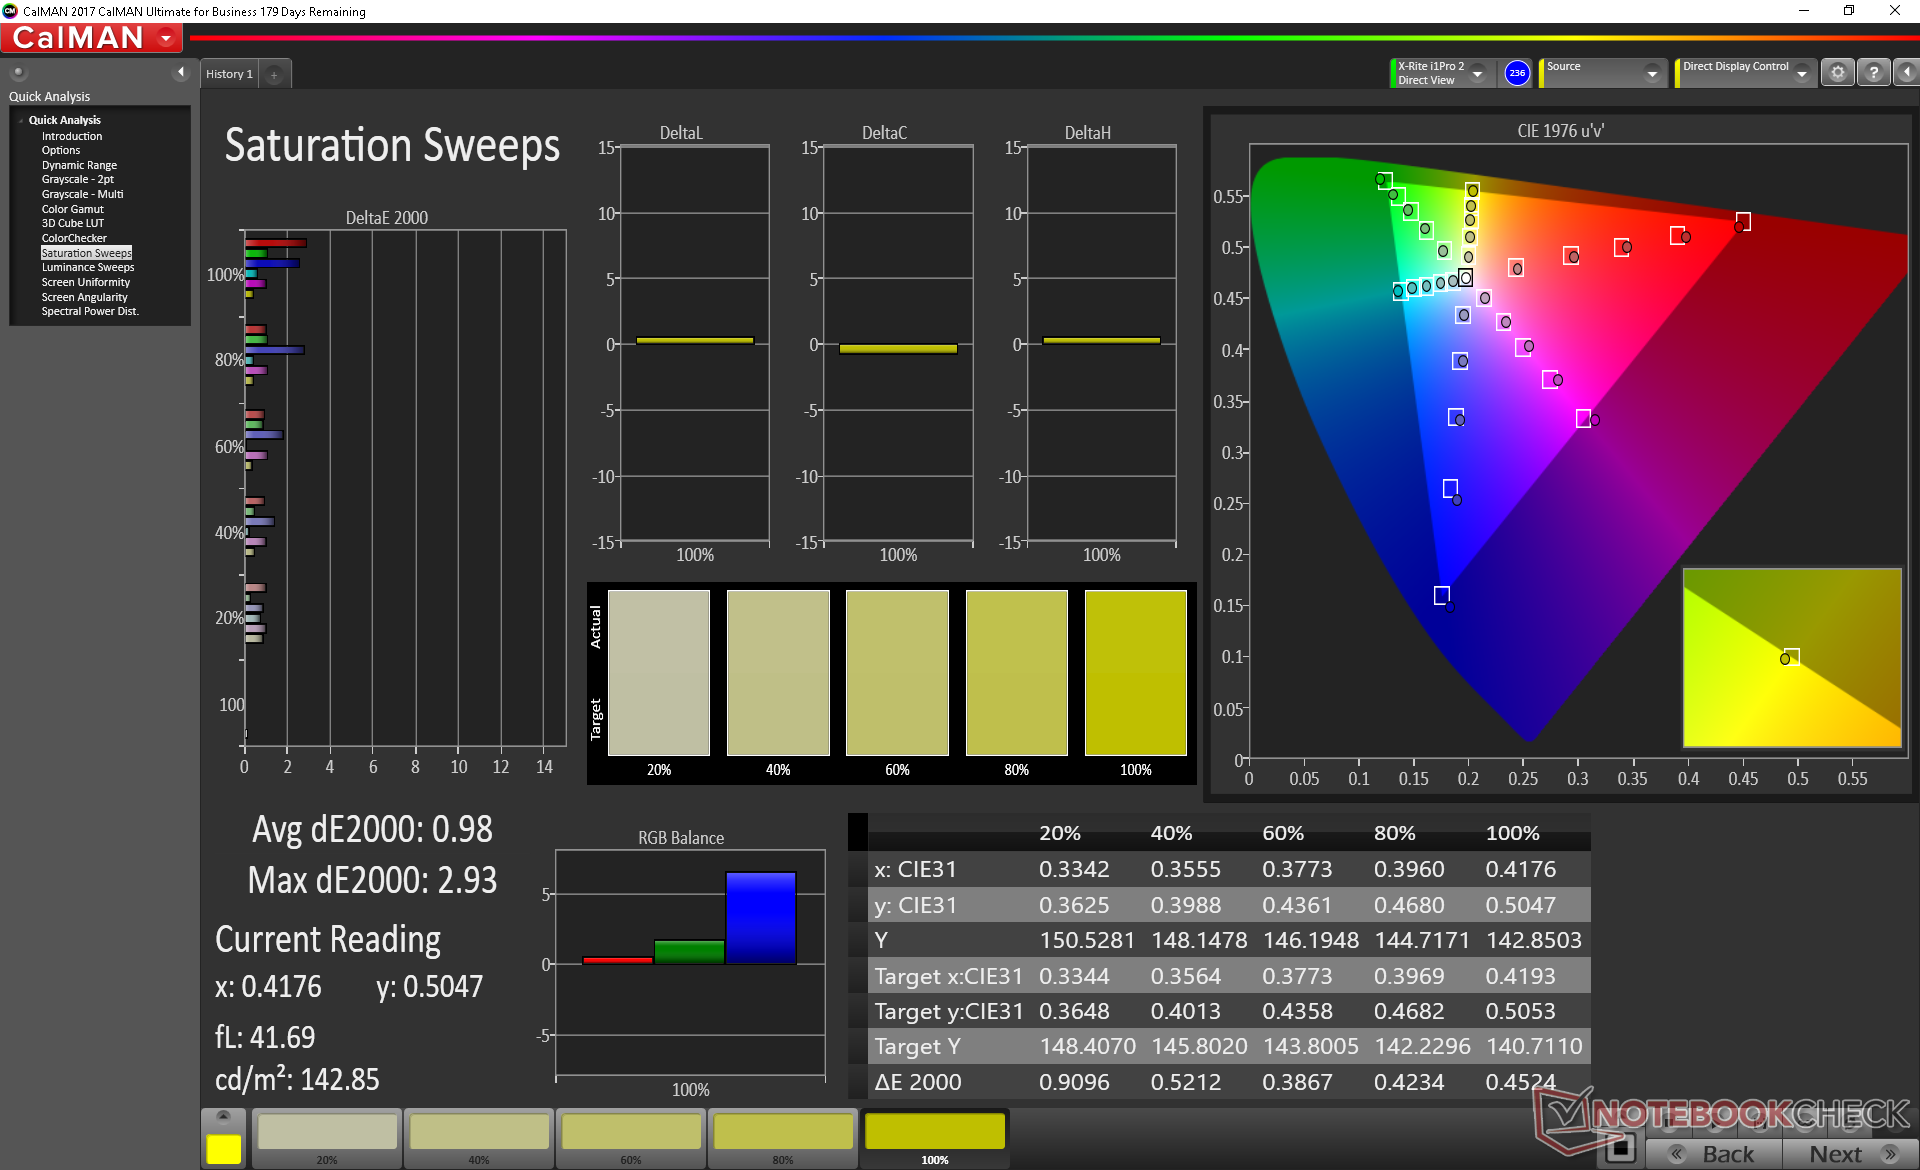
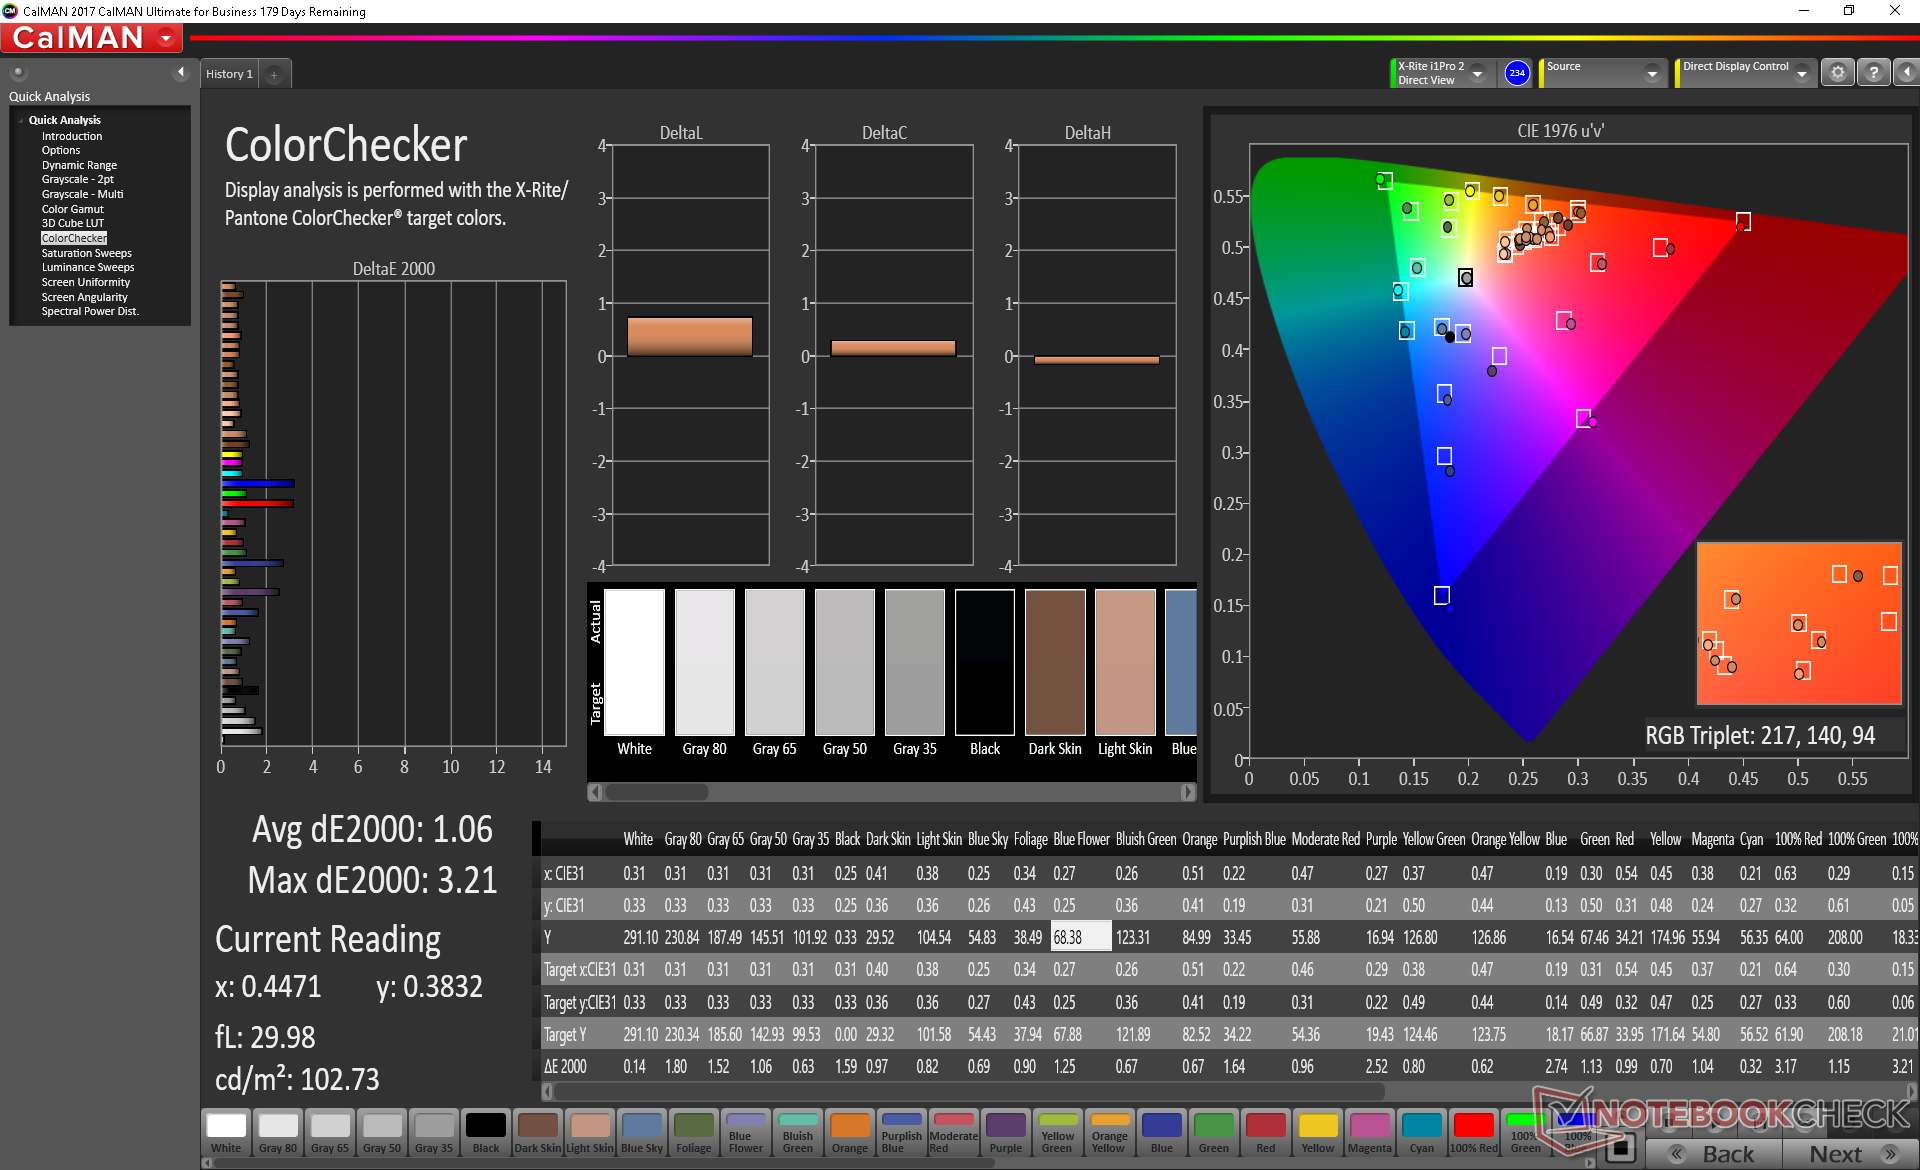
Further measurements with an X-Rite colorimeter show a very accurate panel out of the box. Average DeltaE grayscale and color values sit at just 1.3 and 1.17, respectively, to show that no end-user calibration is necessary for sRGB. If we are to nitpick, both Red and Blue are represented less accurately than all other primary or secondary tested colors, but you'd be hard pressed to notice even with a trained eye.
Display Response Times
| ↔ Response Time Black to White | ||
|---|---|---|
| 12 ms ... rise ↗ and fall ↘ combined | ↗ 7.6 ms rise | 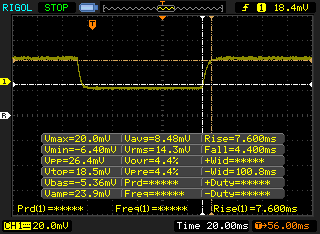 |
| ↘ 4.4 ms fall | ||
| The screen shows good response rates in our tests, but may be too slow for competitive gamers. In comparison, all tested devices range from 0.1 (minimum) to 240 (maximum) ms. » 32 % of all devices are better. This means that the measured response time is better than the average of all tested devices (19.8 ms). | ||
| ↔ Response Time 50% Grey to 80% Grey | ||
| 13.6 ms ... rise ↗ and fall ↘ combined | ↗ 8 ms rise | 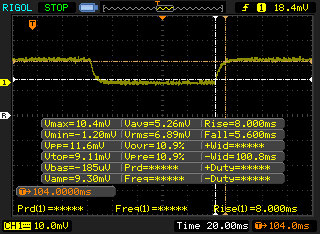 |
| ↘ 5.6 ms fall | ||
| The screen shows good response rates in our tests, but may be too slow for competitive gamers. In comparison, all tested devices range from 0.165 (minimum) to 636 (maximum) ms. » 27 % of all devices are better. This means that the measured response time is better than the average of all tested devices (31 ms). | ||
Screen Flickering / PWM (Pulse-Width Modulation)
| Screen flickering / PWM detected | 23260 Hz | ≤ 19 % brightness setting | 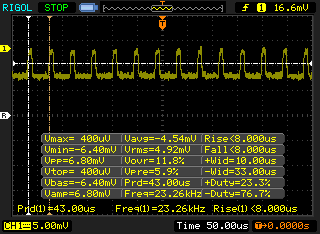 |
The display backlight flickers at 23260 Hz (worst case, e.g., utilizing PWM) Flickering detected at a brightness setting of 19 % and below. There should be no flickering or PWM above this brightness setting. The frequency of 23260 Hz is quite high, so most users sensitive to PWM should not notice any flickering. In comparison: 52 % of all tested devices do not use PWM to dim the display. If PWM was detected, an average of 7750 (minimum: 5 - maximum: 343500) Hz was measured. | |||
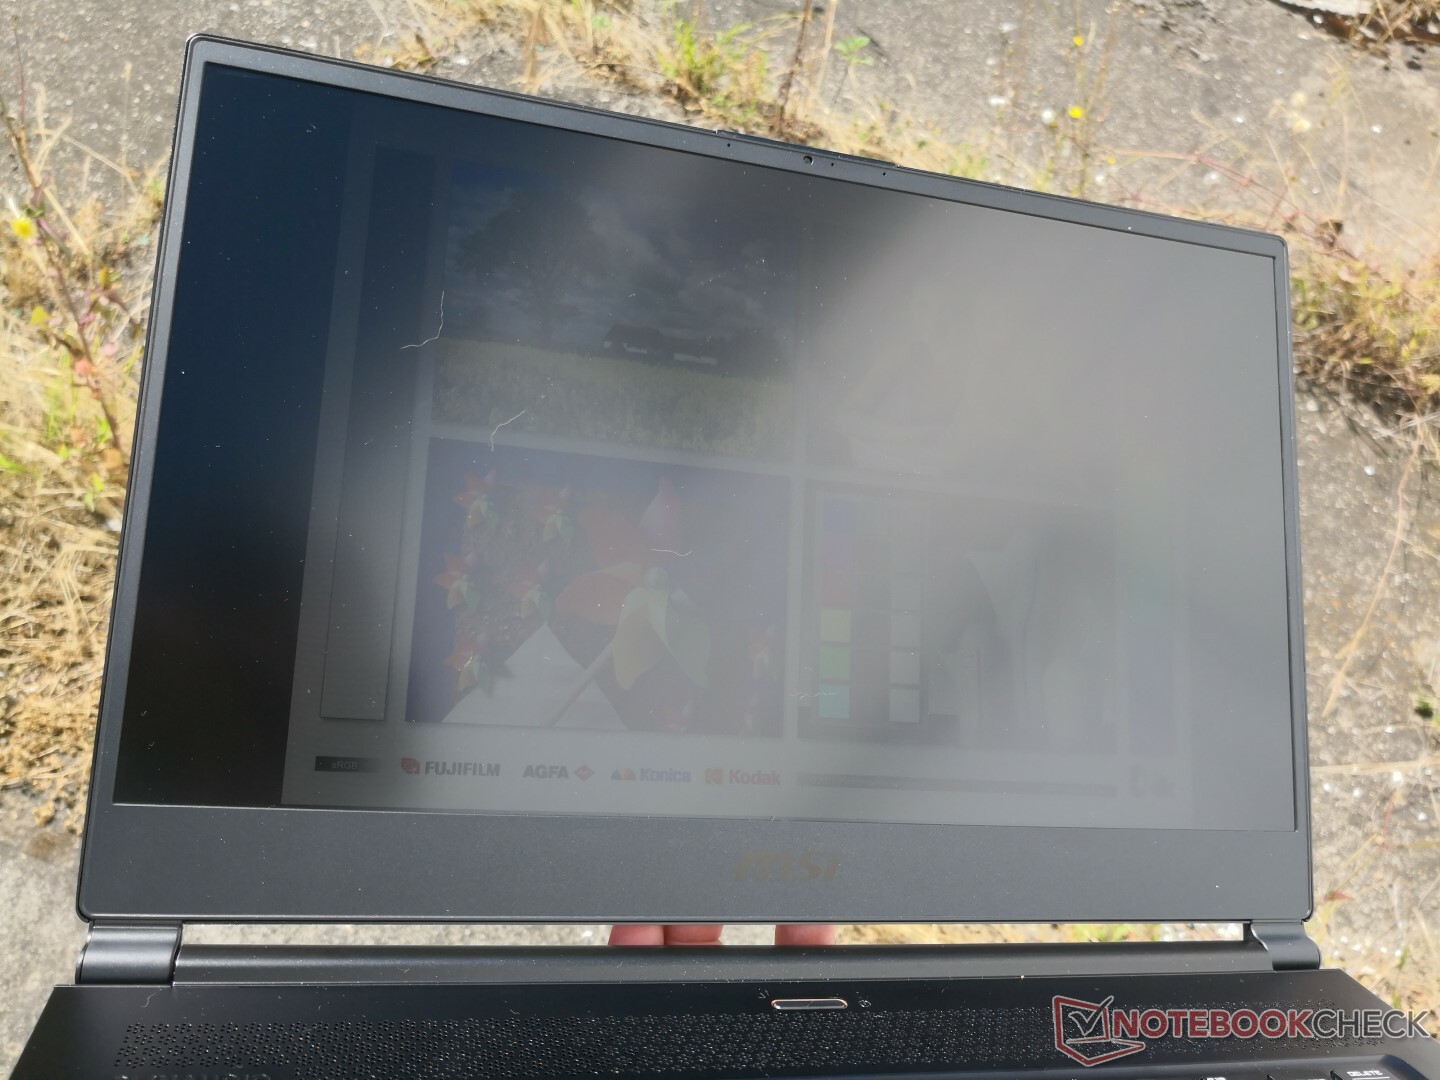
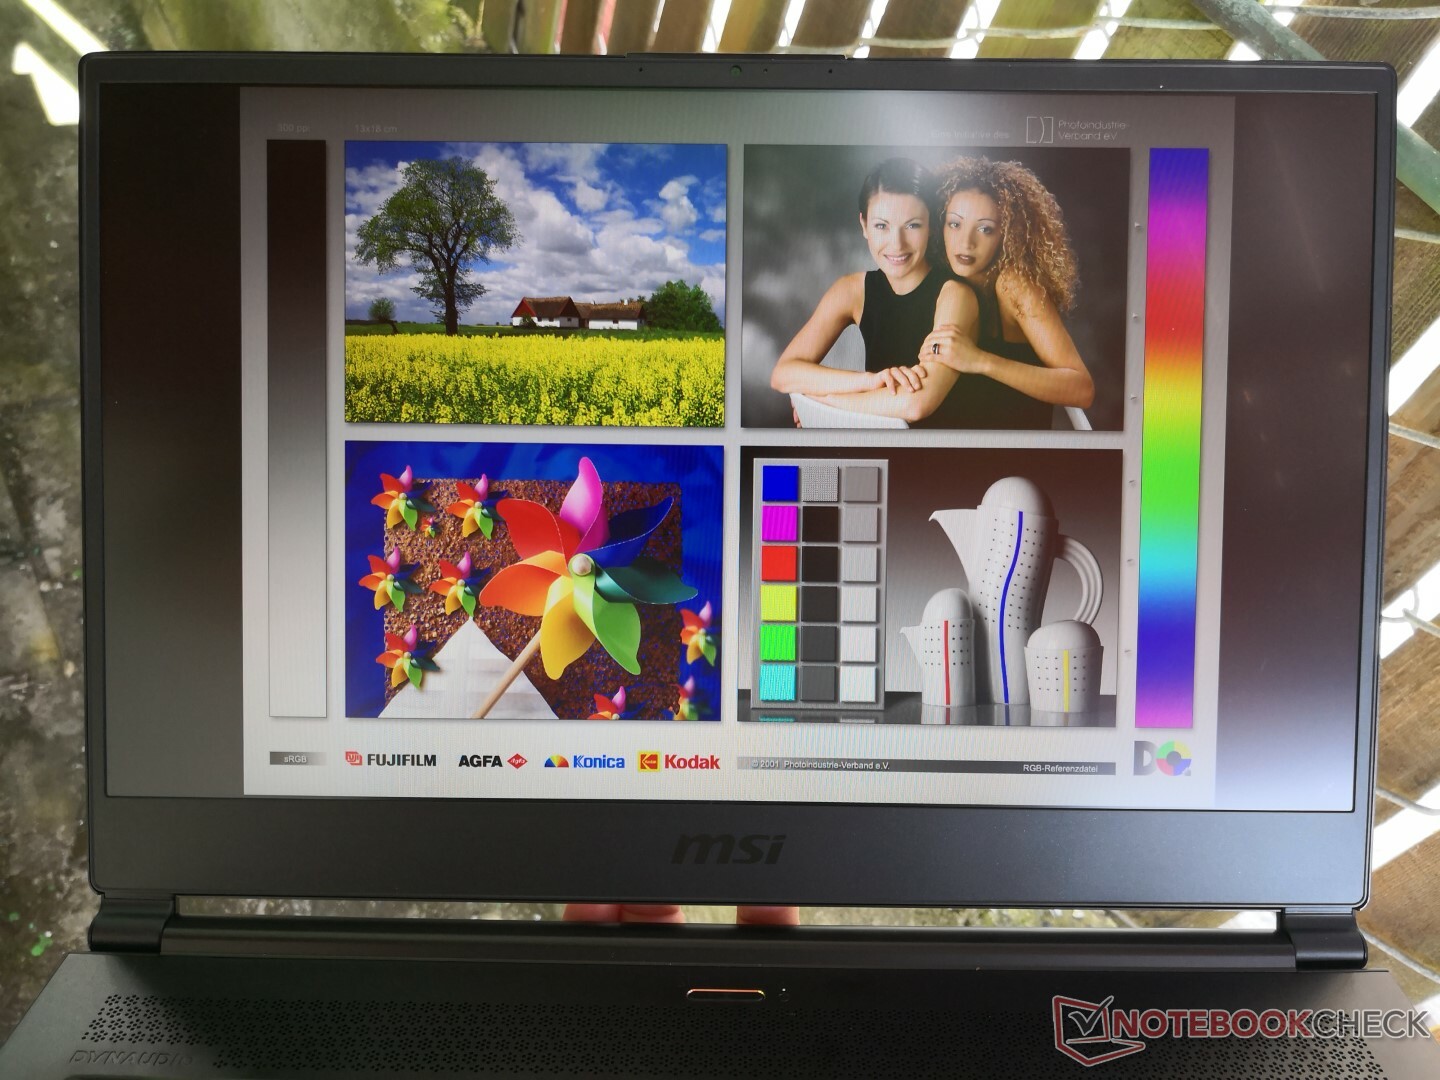
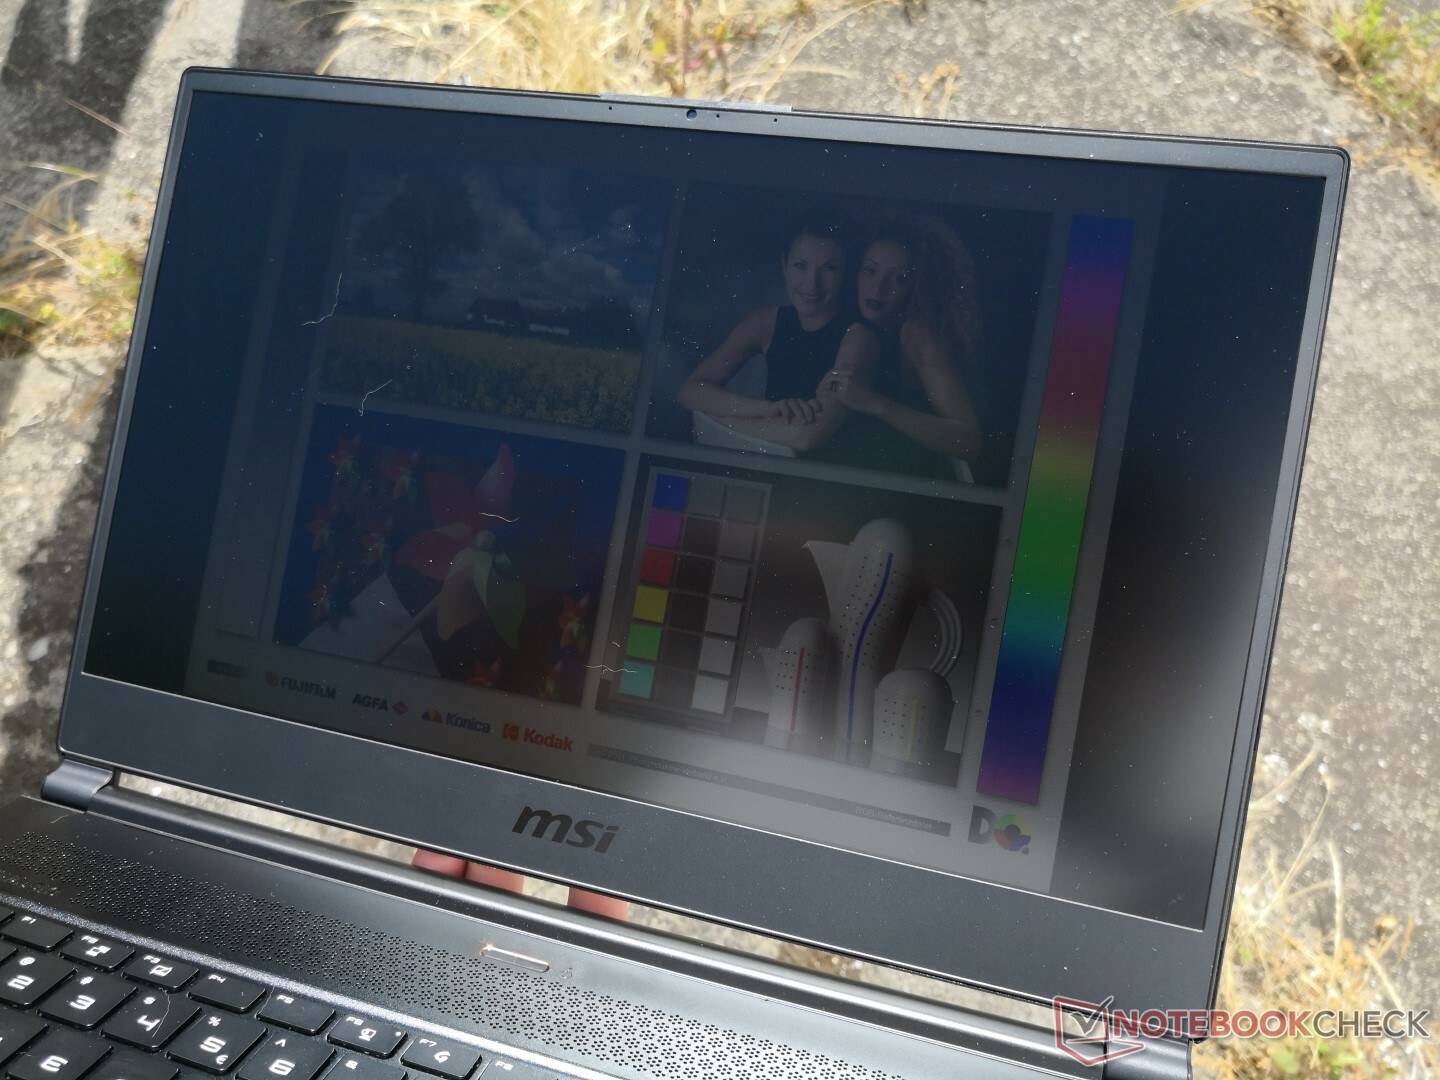
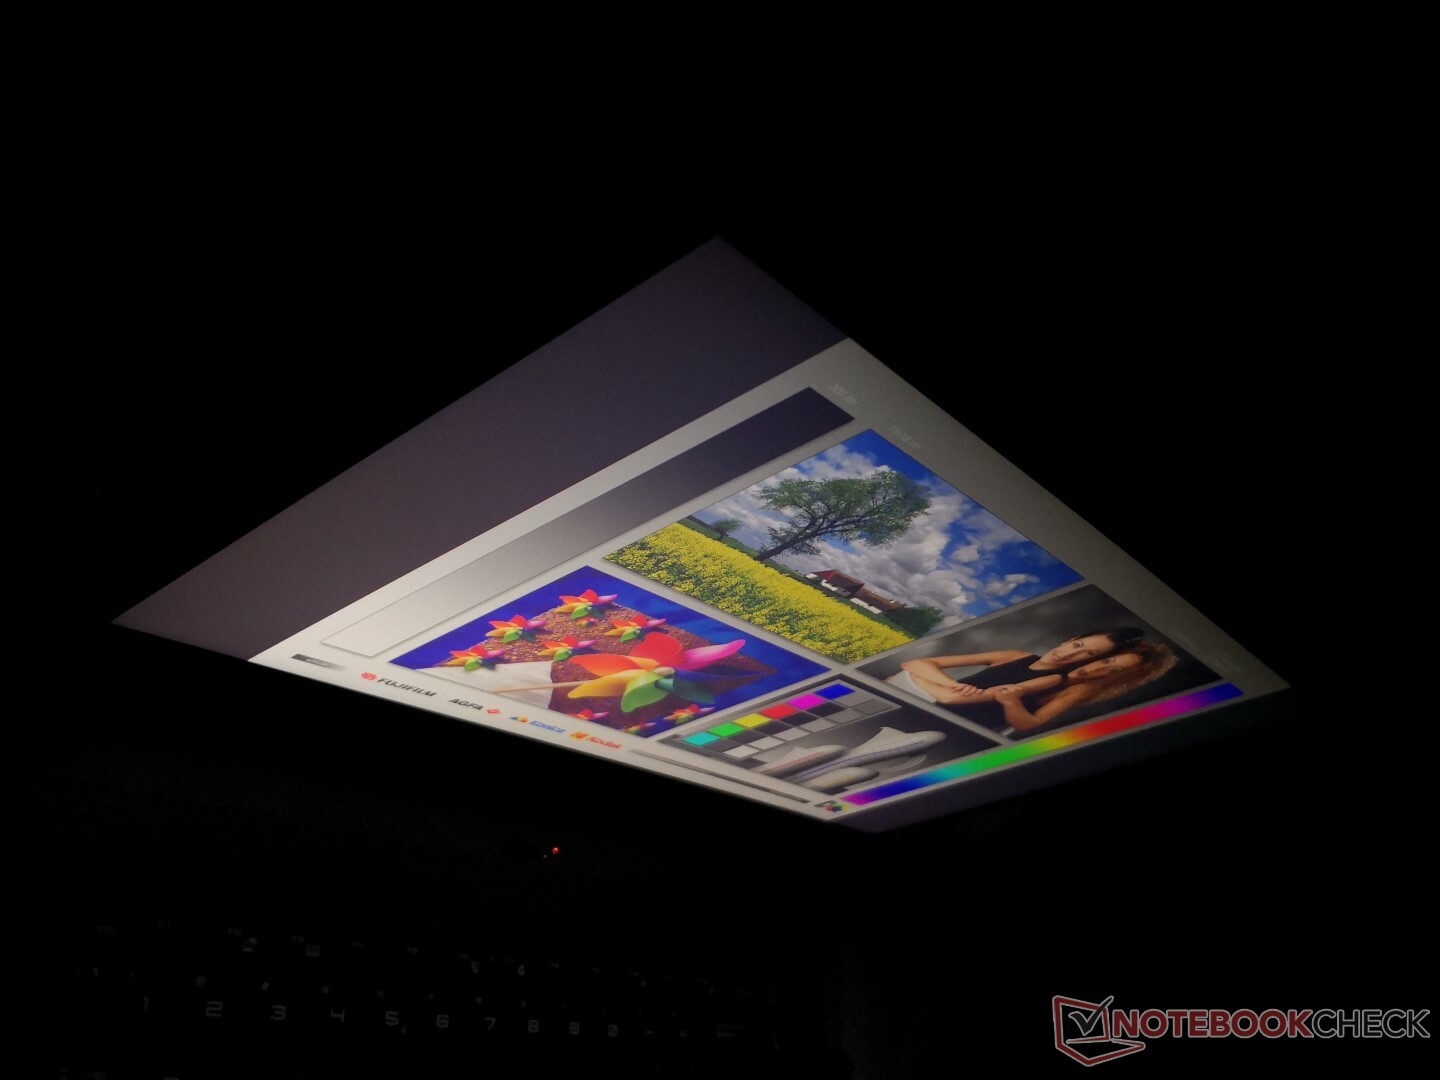
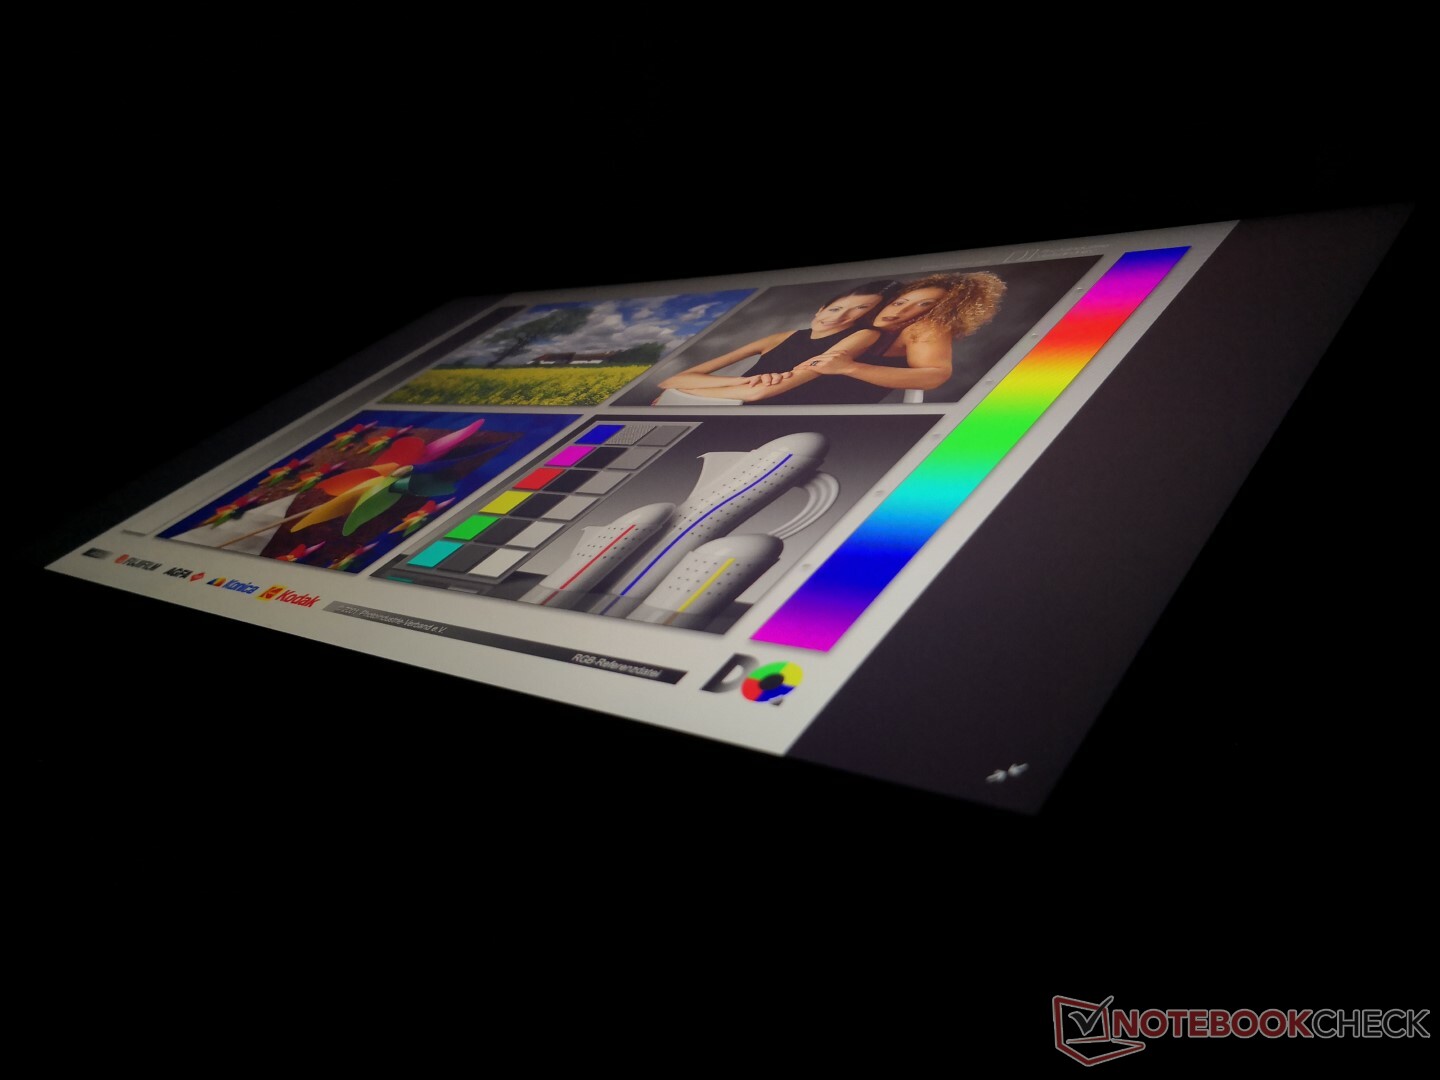
Outdoor visibility is similar to the Blade 15. In other words, expect to squint if working under sunlight or on a cloudy day. Most Ultrabooks, like the XPS 15 or MacBook Pro 15, have brighter displays than what is offered here. Viewing angles are otherwise excellent with only slight impact to contrast levels if viewing from abnormally obtuse angles.
Performance
Processor
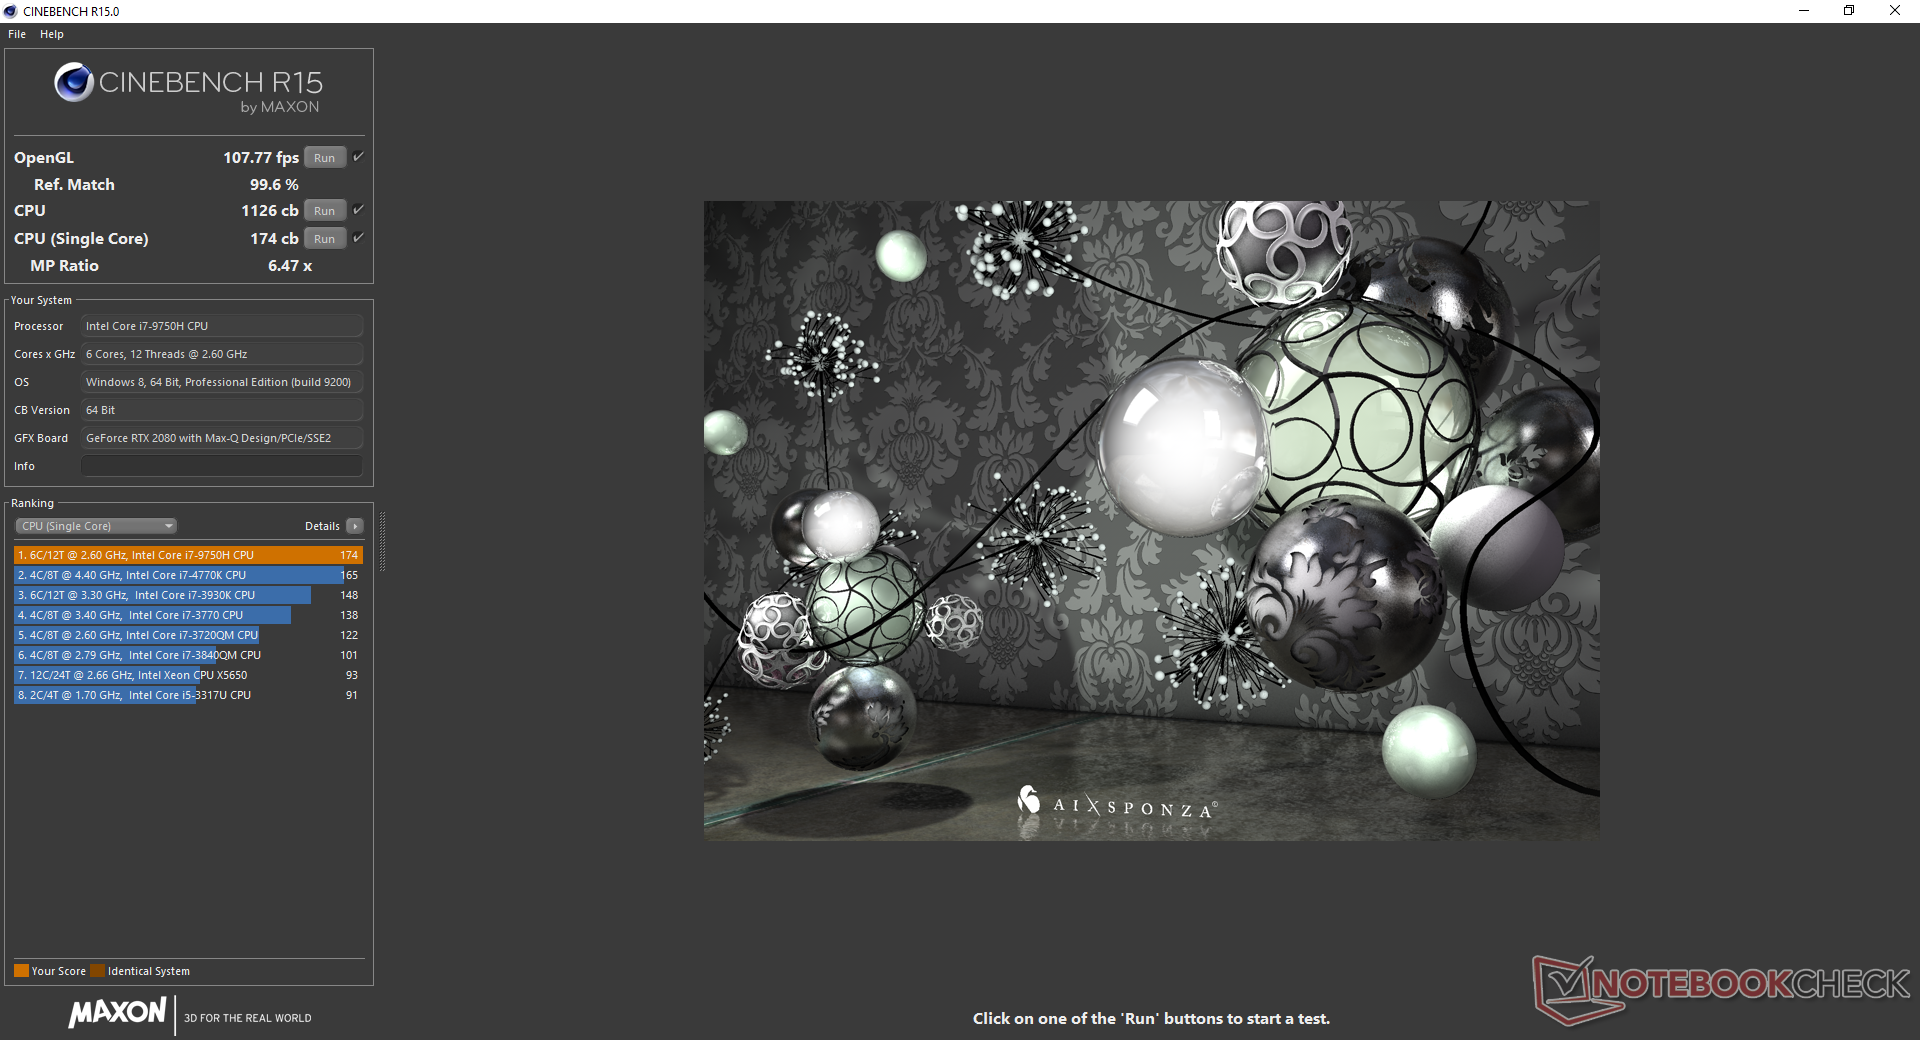
Multi-thread CPU performance is about 11 percent faster than the Core i7-8750H as found on last year's GS65 8RE. Our newer GS65 9SG is able to maintain faster Turbo Boost clock rates as well and so it remains faster even after accounting for any throttling. Performance is also slightly better than on the Zephyrus S GX502GW equipped with the same i7-9750H CPU due to poorer Turbo Boost sustainability on the Asus.
There are some small dips in performance throughout the stress test, however, as shown by our graph below. This could simply be due to background activity as performance eventually jumps back up to normal. There are, after all, pre-loaded apps like Dragon Center and Norton Anti-Virus. The stability of the system is not affected.
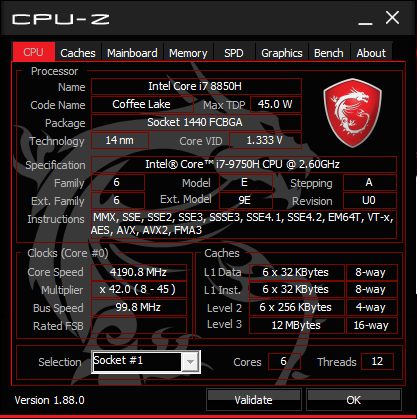
See our dedicated page on the Core i9-9750H for more technical information and benchmarks.
| Cinebench R10 | |
| Rendering Multiple CPUs 32Bit | |
| MSI GE75 9SG | |
| Average Intel Core i7-9750H (28251 - 36304, n=13) | |
| MSI GF62VR 7RF-877 | |
| Asus ROG Zephyrus G15 GA502DU | |
| Rendering Single 32Bit | |
| MSI GE75 9SG | |
| Average Intel Core i7-9750H (6659 - 7214, n=13) | |
| MSI GF62VR 7RF-877 | |
| Asus ROG Zephyrus G15 GA502DU | |
| wPrime 2.10 - 1024m | |
| MSI GF63 8RC-040XPL | |
| MSI GF62VR 7RF-877 | |
| Asus ROG Zephyrus G15 GA502DU | |
| Average Intel Core i7-9750H (n=1) | |
| MSI GE75 9SG | |
* ... smaller is better
System Performance
PCMark benchmarks rank our GS65 in the same ballpark as other high-performance ultrathin laptops including the new Gigabyte Aero 15 Classic. We didn't experience any software or hardware issues during our time with the test unit.
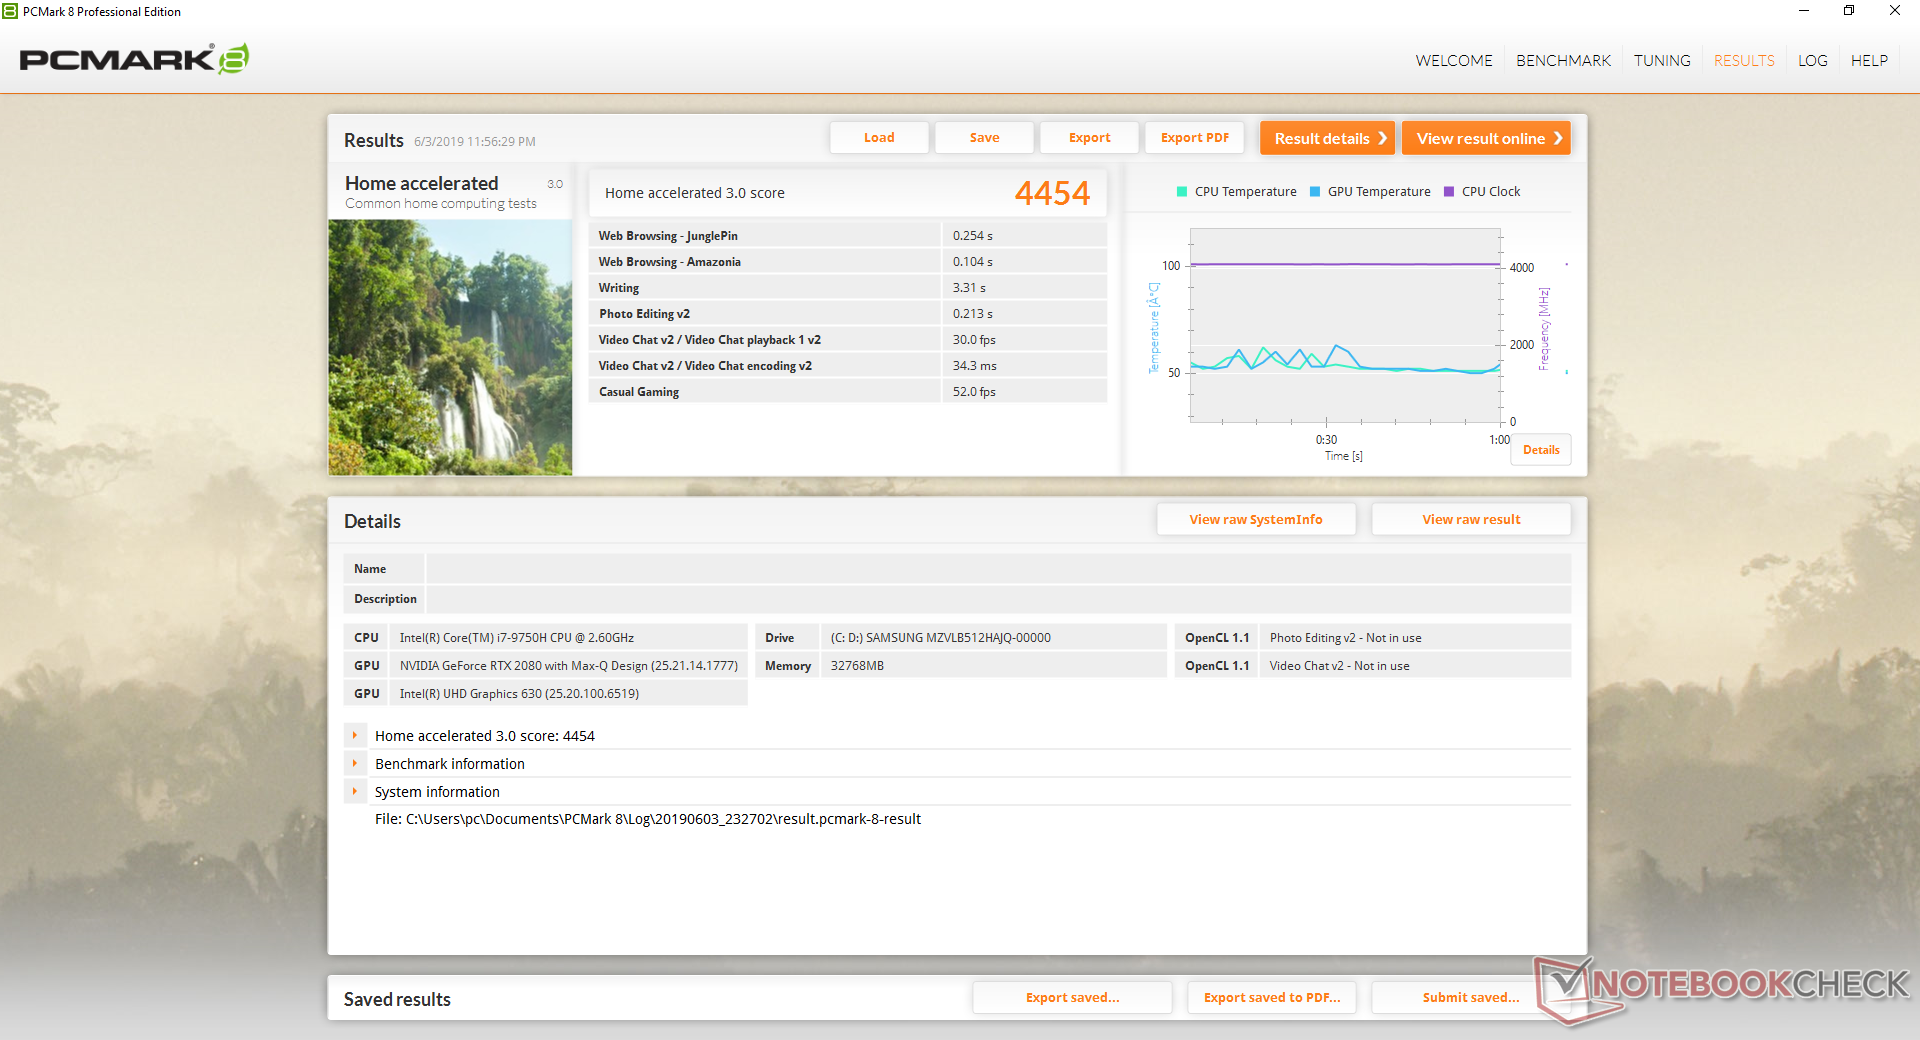
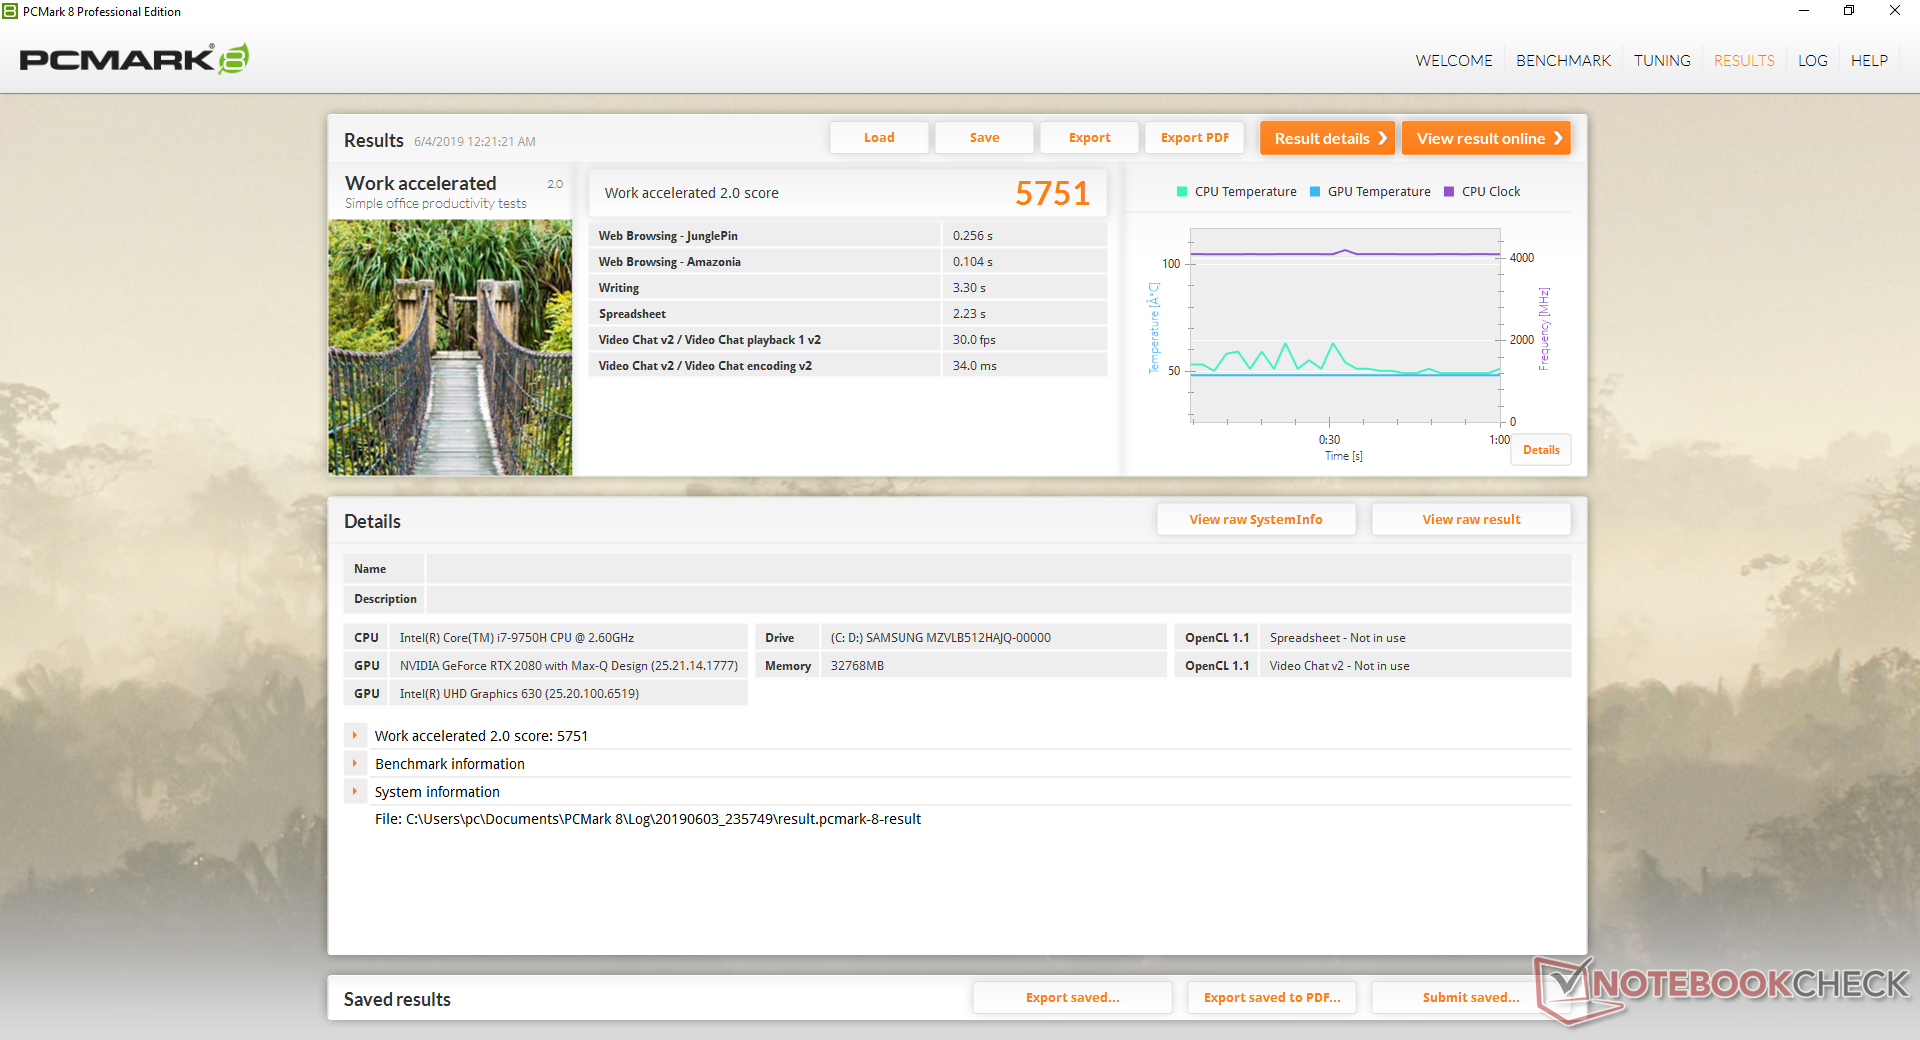
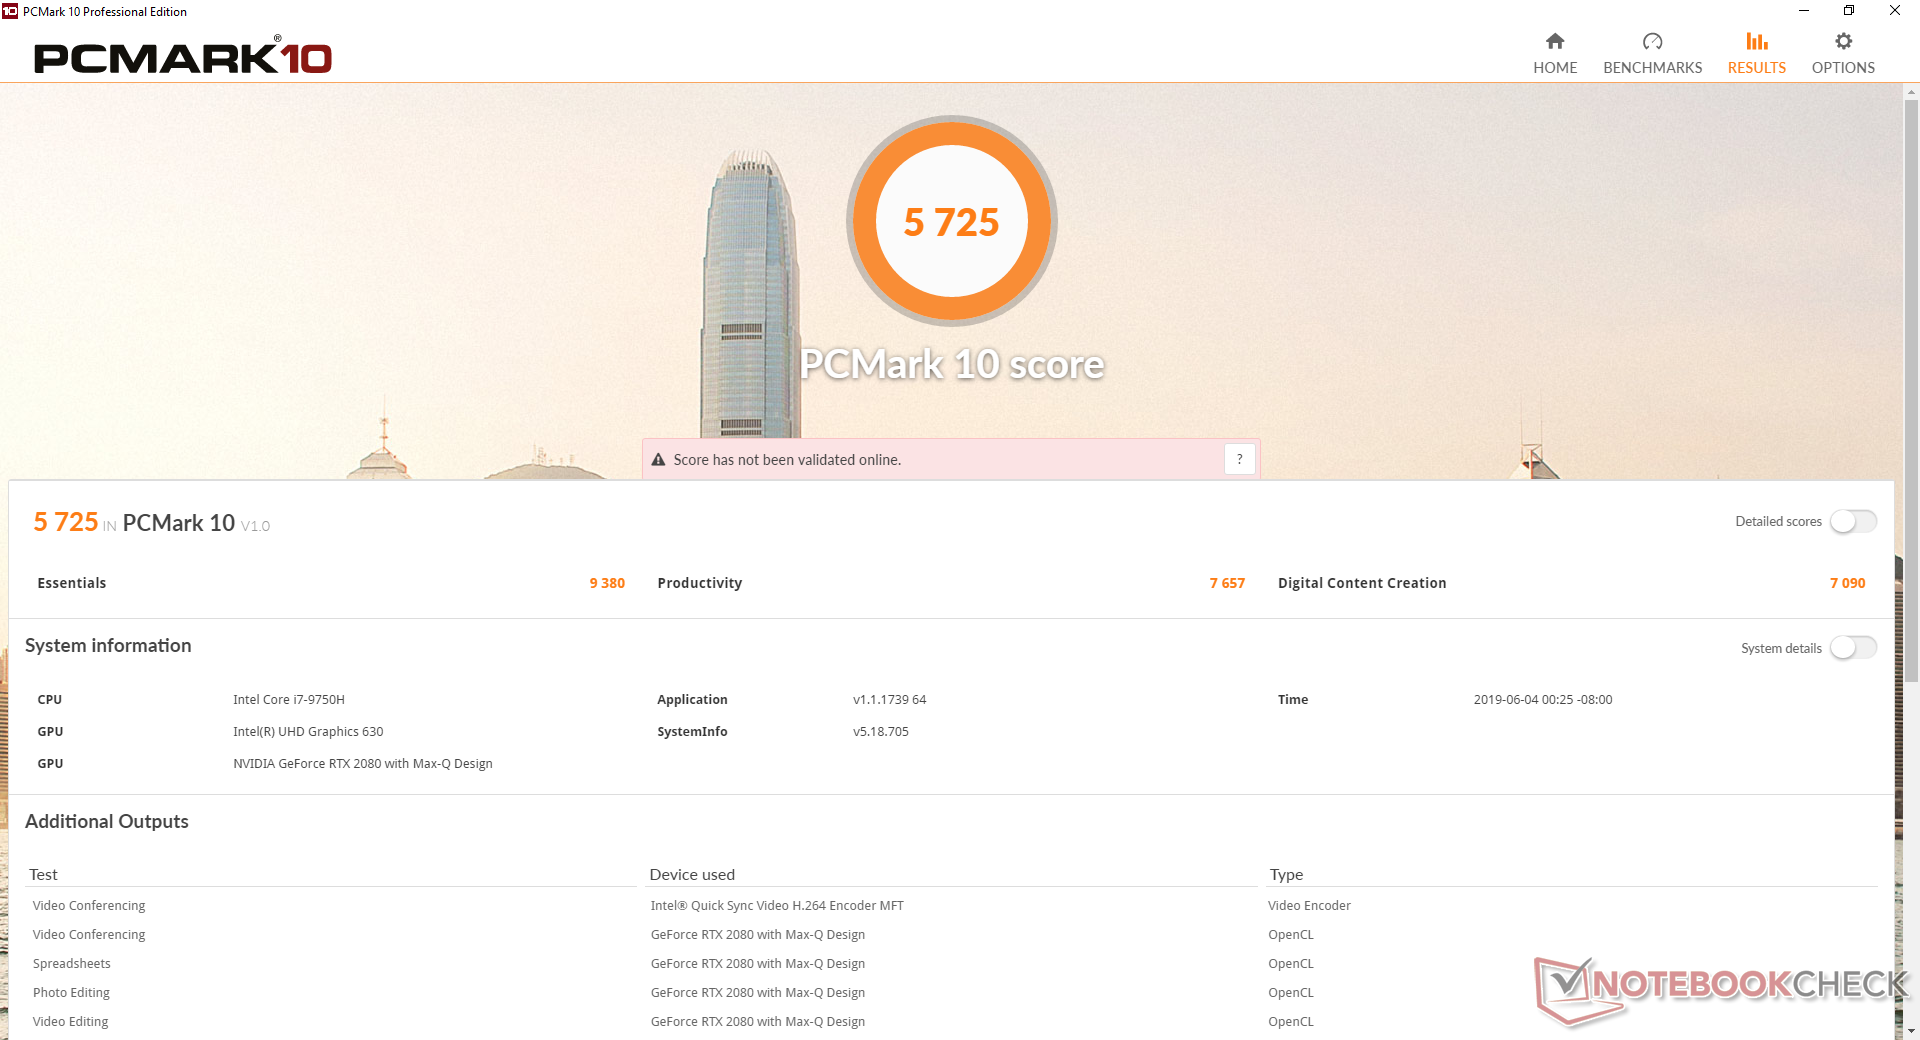
| PCMark 8 Home Score Accelerated v2 | 4454 points | |
| PCMark 8 Work Score Accelerated v2 | 5751 points | |
| PCMark 10 Score | 5725 points | |
Help | ||
Storage Devices
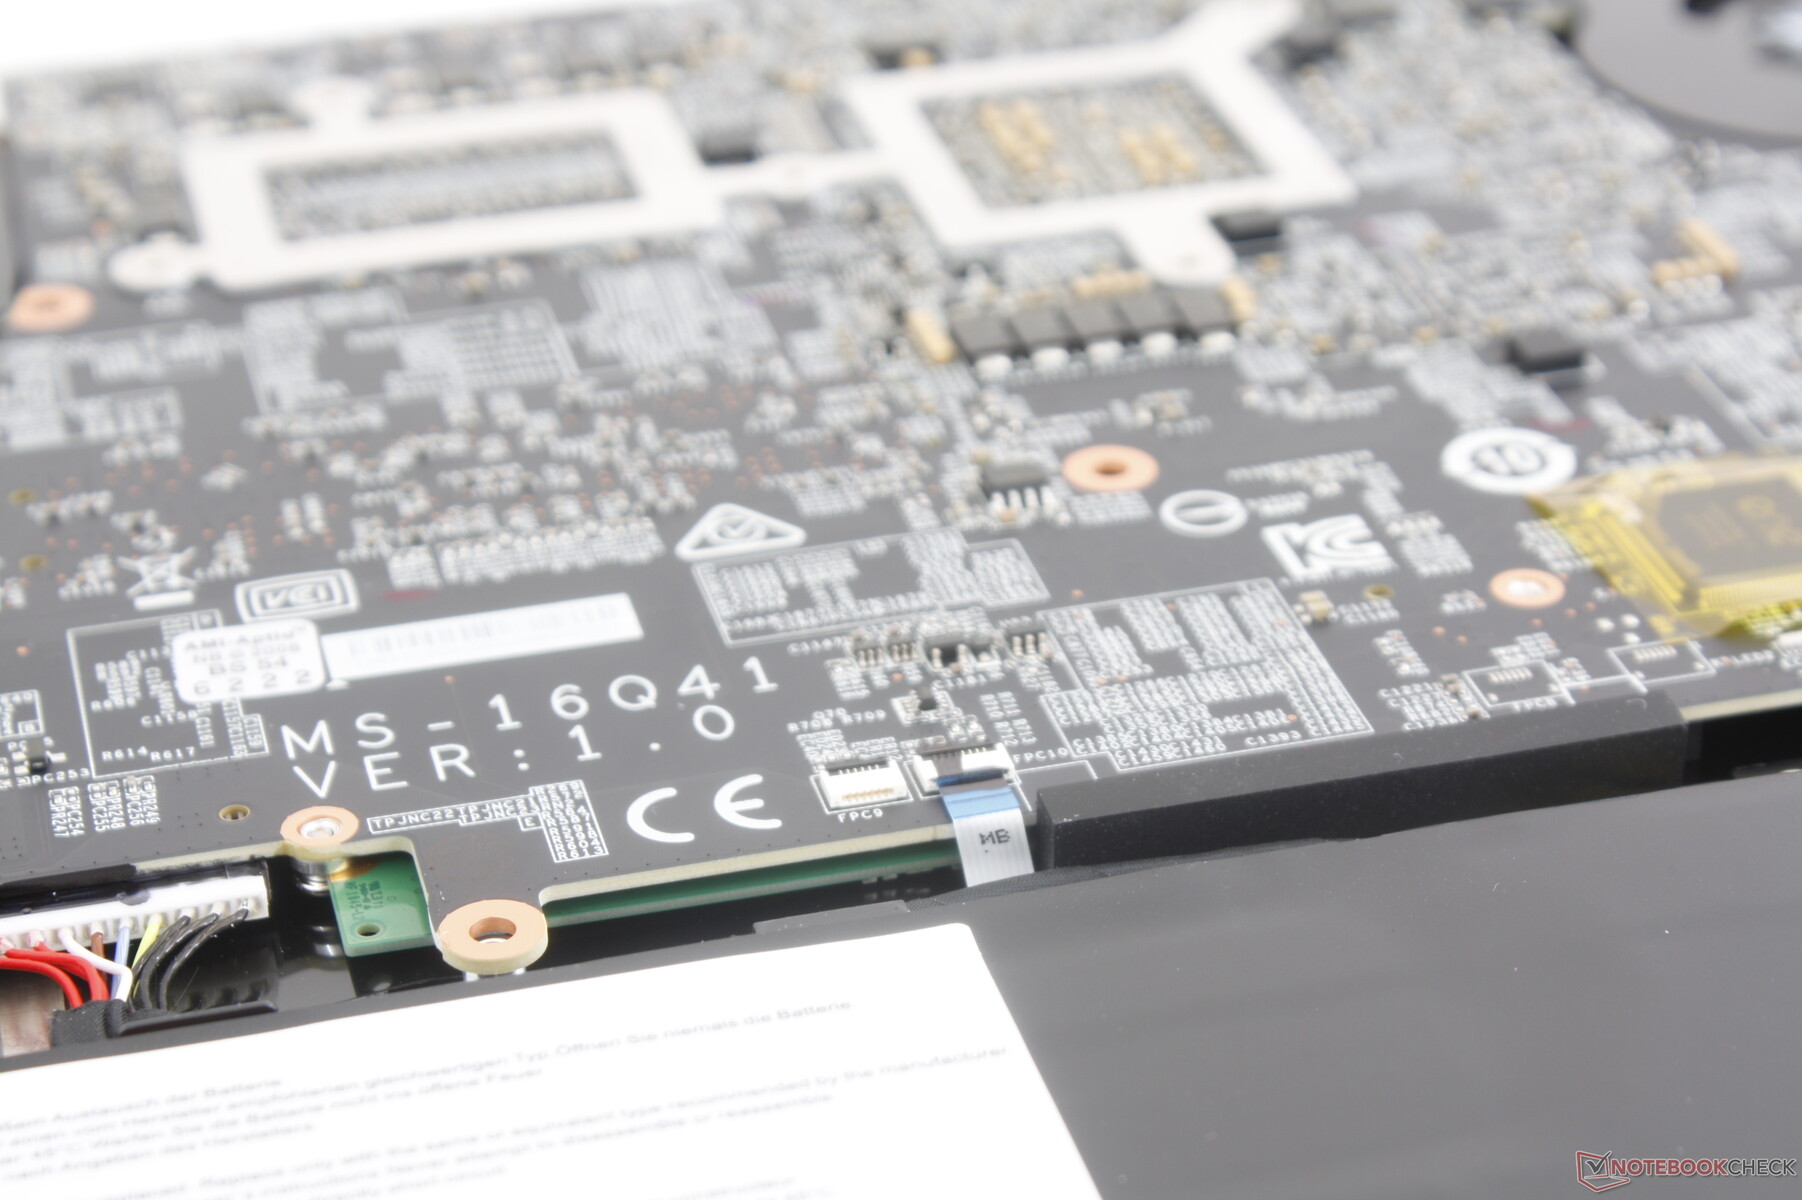
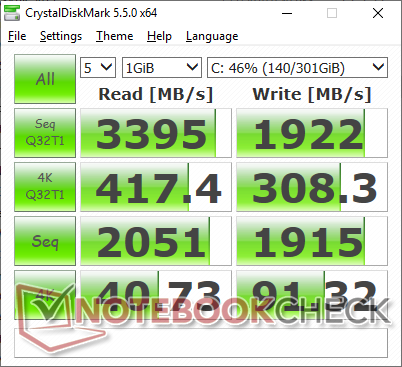
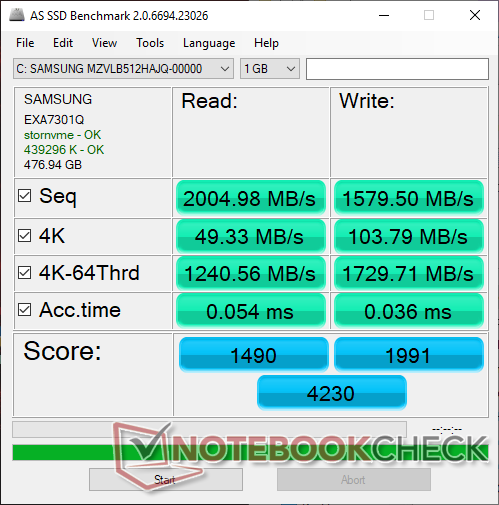
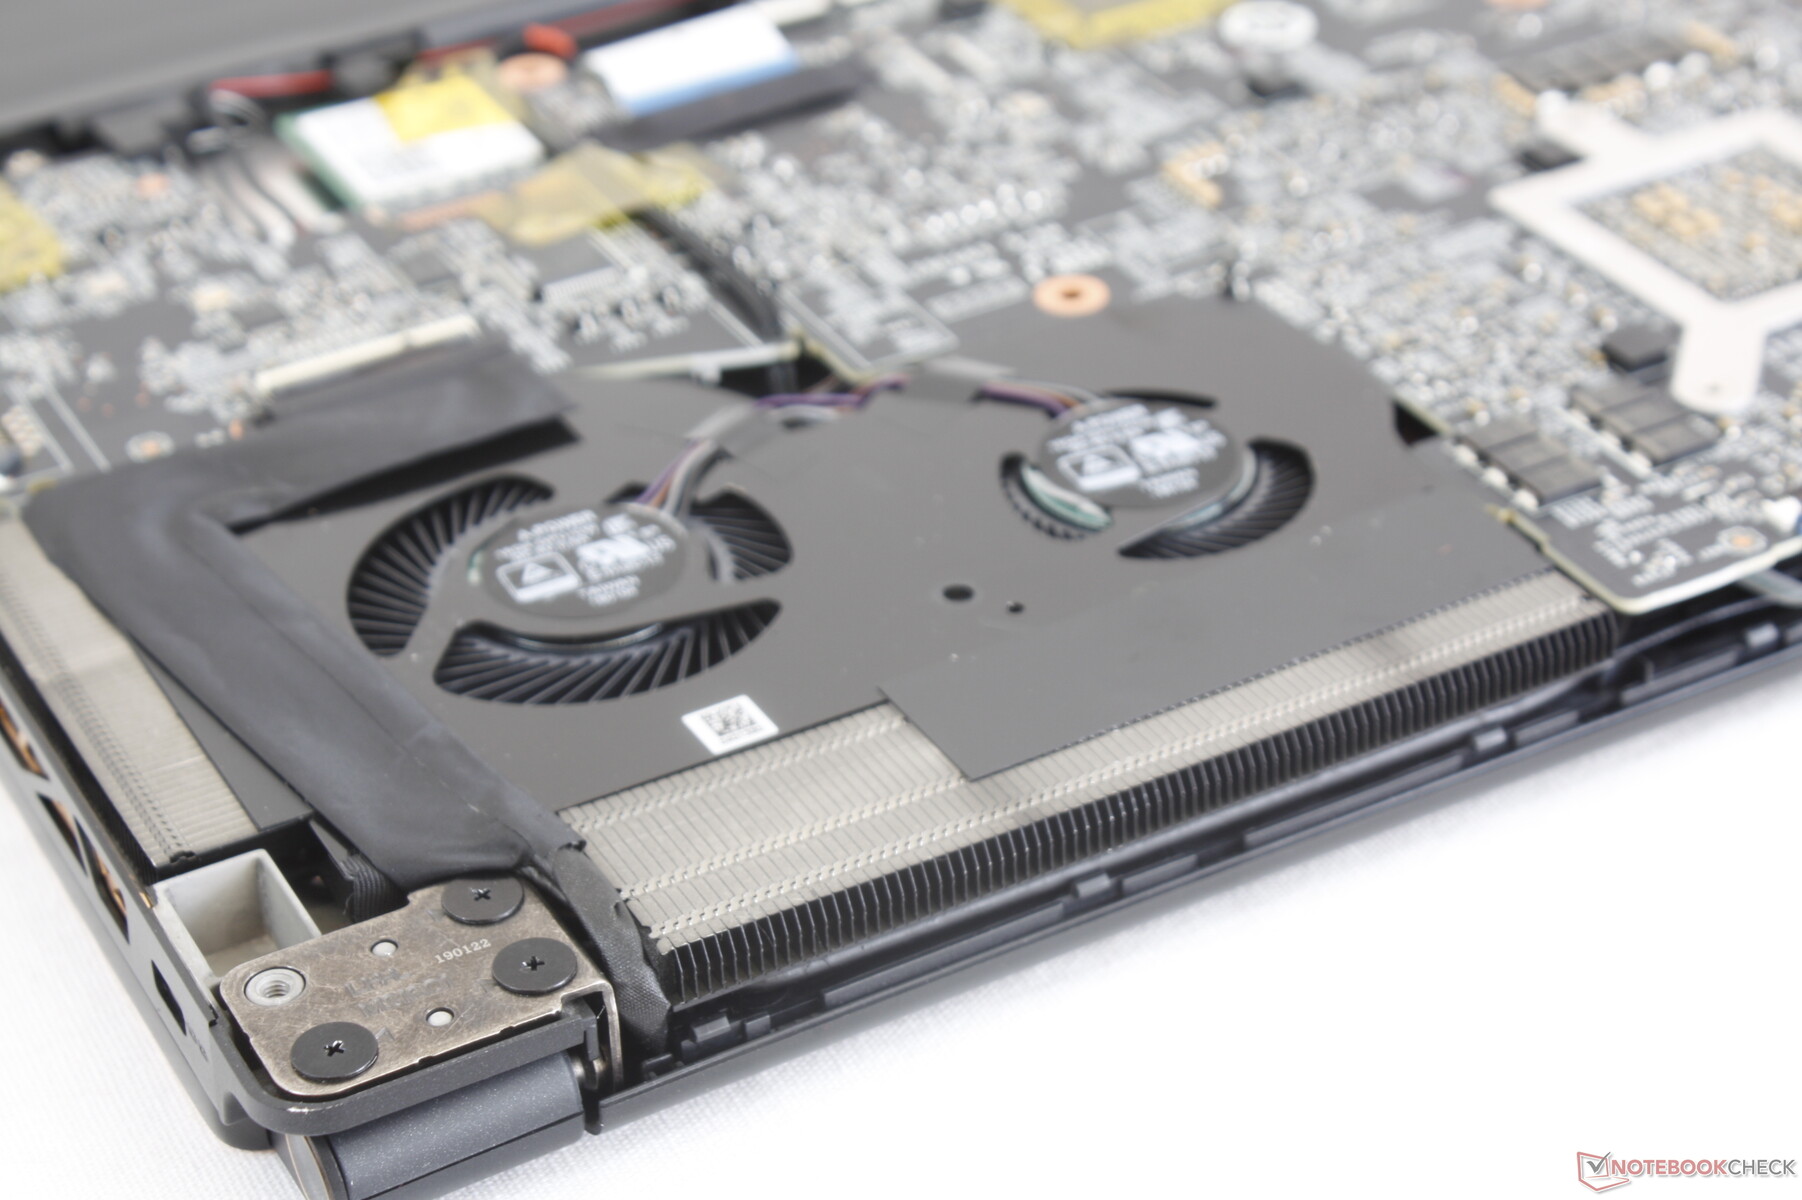
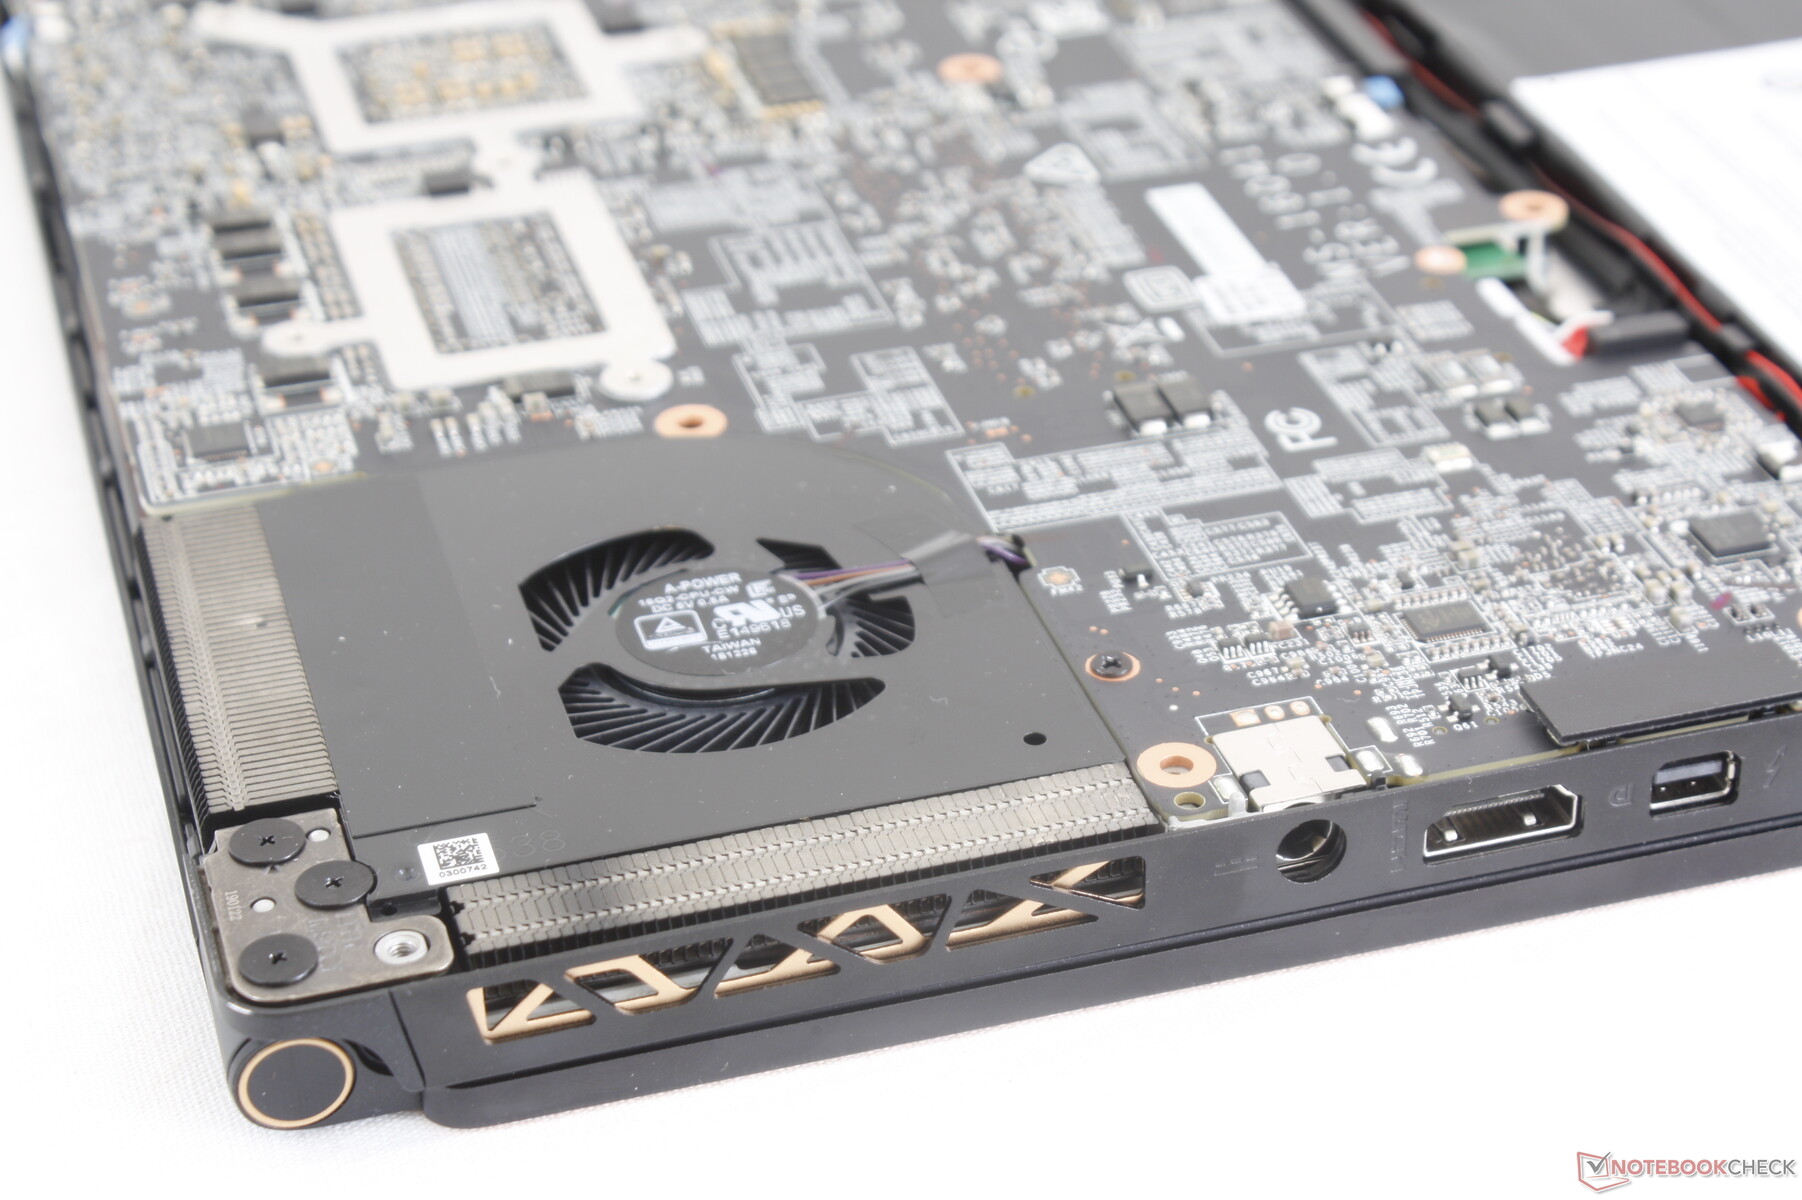
Two internal M.2 NVMe slots are available, but they continue to be more difficult to access than on most other laptops since they sit underneath the motherboard. Our particular test unit comes with a 512 GB Samsung SSD PM981 which is exactly the same SSD as found on last year's GS65 8RF. The Samsung PM981 series offers some of the fastest and most balanced read and write rates when compared to alternatives from Toshiba, Lite-On, or Intel.
See our growing table of HDDs and SSDs for more benchmark comparisons.
| MSI GS65 Stealth 9SG Samsung SSD PM981 MZVLB512HAJQ | Razer Blade 15 RTX 2080 Max-Q Samsung SSD PM981 MZVLB512HAJQ | Lenovo Legion Y740-15ICHg Samsung SSD PM981 MZVLB256HAHQ | Asus Zephyrus S GX531GX Intel SSD 660p SSDPEKNW512G8 | MSI GS65 8RF-019DE Stealth Thin Samsung SSD PM981 MZVLB512HAJQ | Gigabyte Aero 15 Classic-XA Intel SSD 760p SSDPEKKW512G8 | |
|---|---|---|---|---|---|---|
| AS SSD | -5% | -23% | -42% | -6% | -21% | |
| Seq Read (MB/s) | 2005 | 1832 -9% | 1953 -3% | 1239 -38% | 1266 -37% | 2517 26% |
| Seq Write (MB/s) | 1580 | 1864 18% | 1629 3% | 920 -42% | 1834 16% | 924 -42% |
| 4K Read (MB/s) | 49.33 | 52.1 6% | 33.2 -33% | 45.74 -7% | 48.94 -1% | 59.1 20% |
| 4K Write (MB/s) | 103.8 | 108.3 4% | 88.1 -15% | 95.7 -8% | 107.2 3% | 126.5 22% |
| 4K-64 Read (MB/s) | 1241 | 1159 -7% | 757 -39% | 322 -74% | 1170 -6% | 876 -29% |
| 4K-64 Write (MB/s) | 1730 | 1807 4% | 1501 -13% | 722 -58% | 1760 2% | 922 -47% |
| Access Time Read * (ms) | 0.054 | 0.05 7% | 0.077 -43% | 0.073 -35% | 0.073 -35% | 0.042 22% |
| Access Time Write * (ms) | 0.036 | 0.034 6% | 0.043 -19% | 0.047 -31% | 0.035 3% | 0.065 -81% |
| Score Read (Points) | 1490 | 1394 -6% | 985 -34% | 492 -67% | 1346 -10% | 1186 -20% |
| Score Write (Points) | 1991 | 2102 6% | 1752 -12% | 910 -54% | 2051 3% | 1141 -43% |
| Score Total (Points) | 4230 | 4221 0% | 3230 -24% | 1654 -61% | 4122 -3% | 2870 -32% |
| Copy ISO MB/s (MB/s) | 3025 | 2083 -31% | 1872 -38% | 1236 -59% | 2086 -31% | |
| Copy Program MB/s (MB/s) | 713 | 496.5 -30% | 478.2 -33% | 703 -1% | 454.2 -36% | |
| Copy Game MB/s (MB/s) | 1554 | 977 -37% | 1165 -25% | 812 -48% | 1141 -27% |
* ... smaller is better

GPU Performance
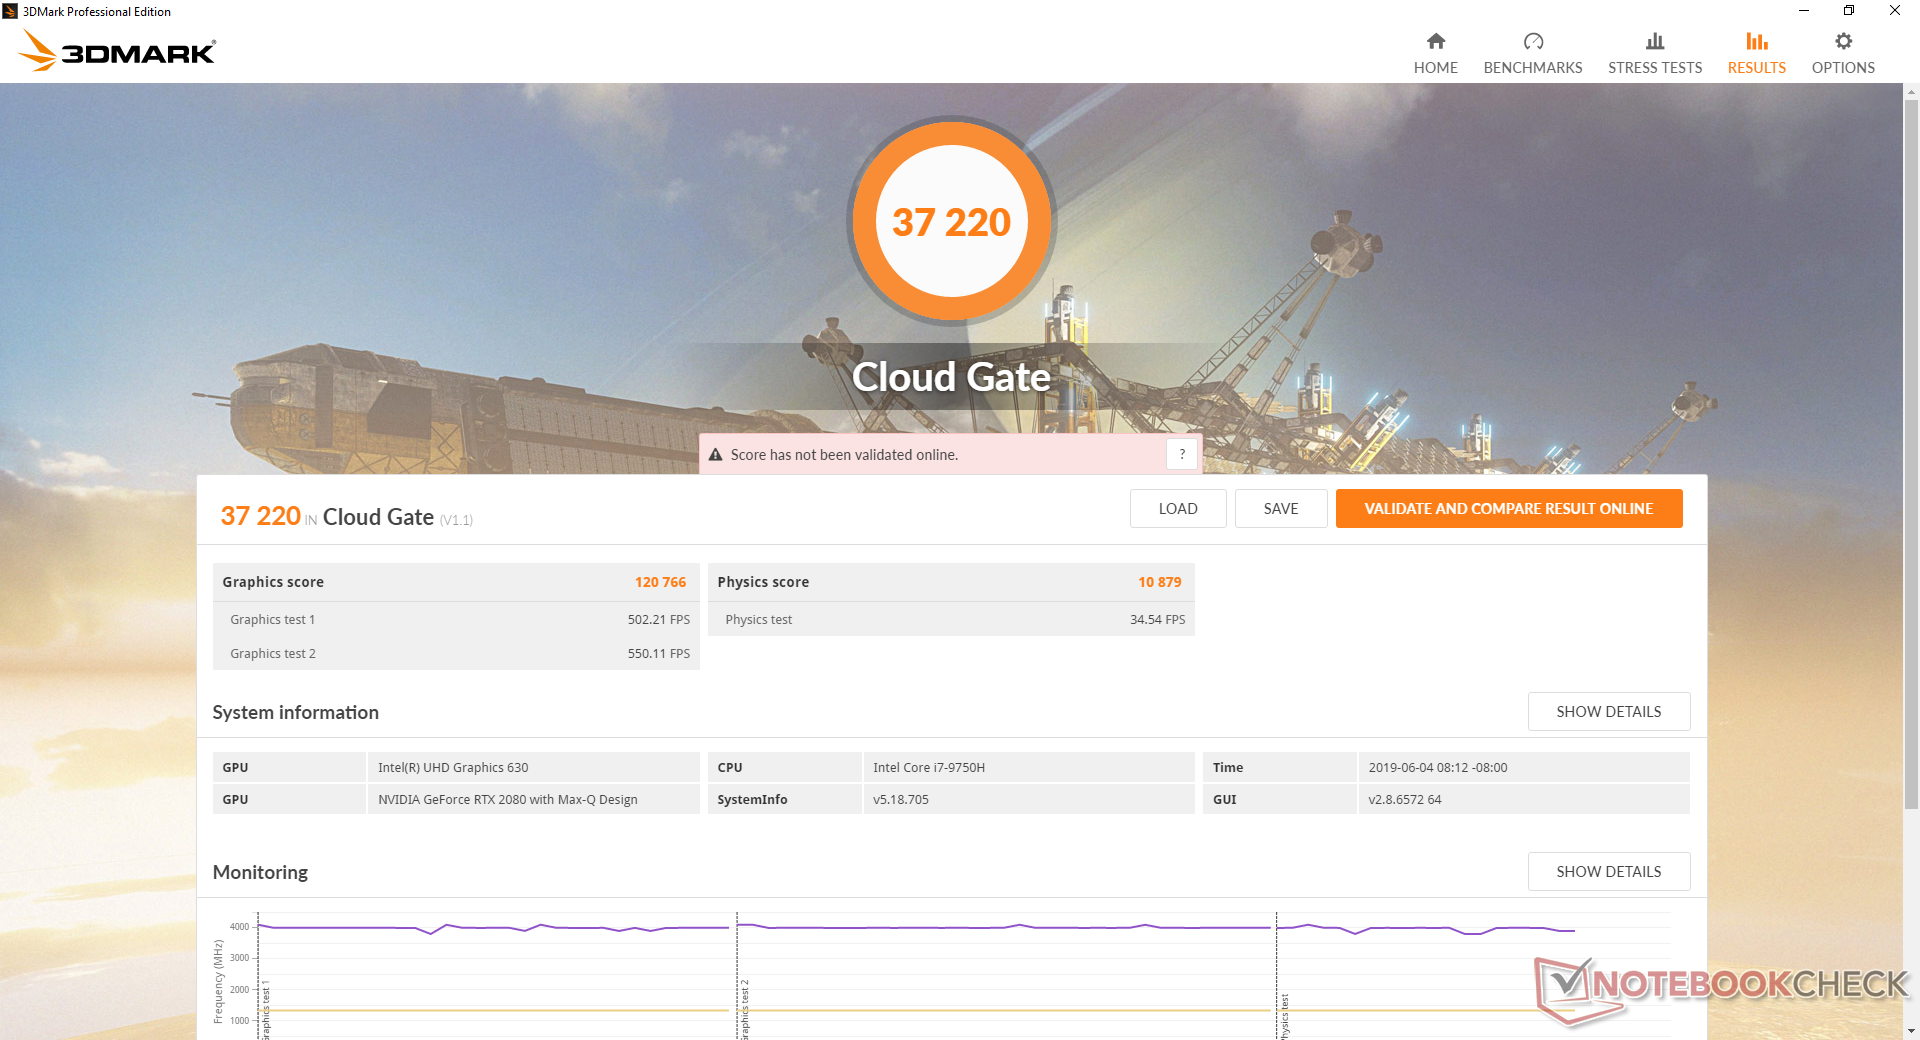
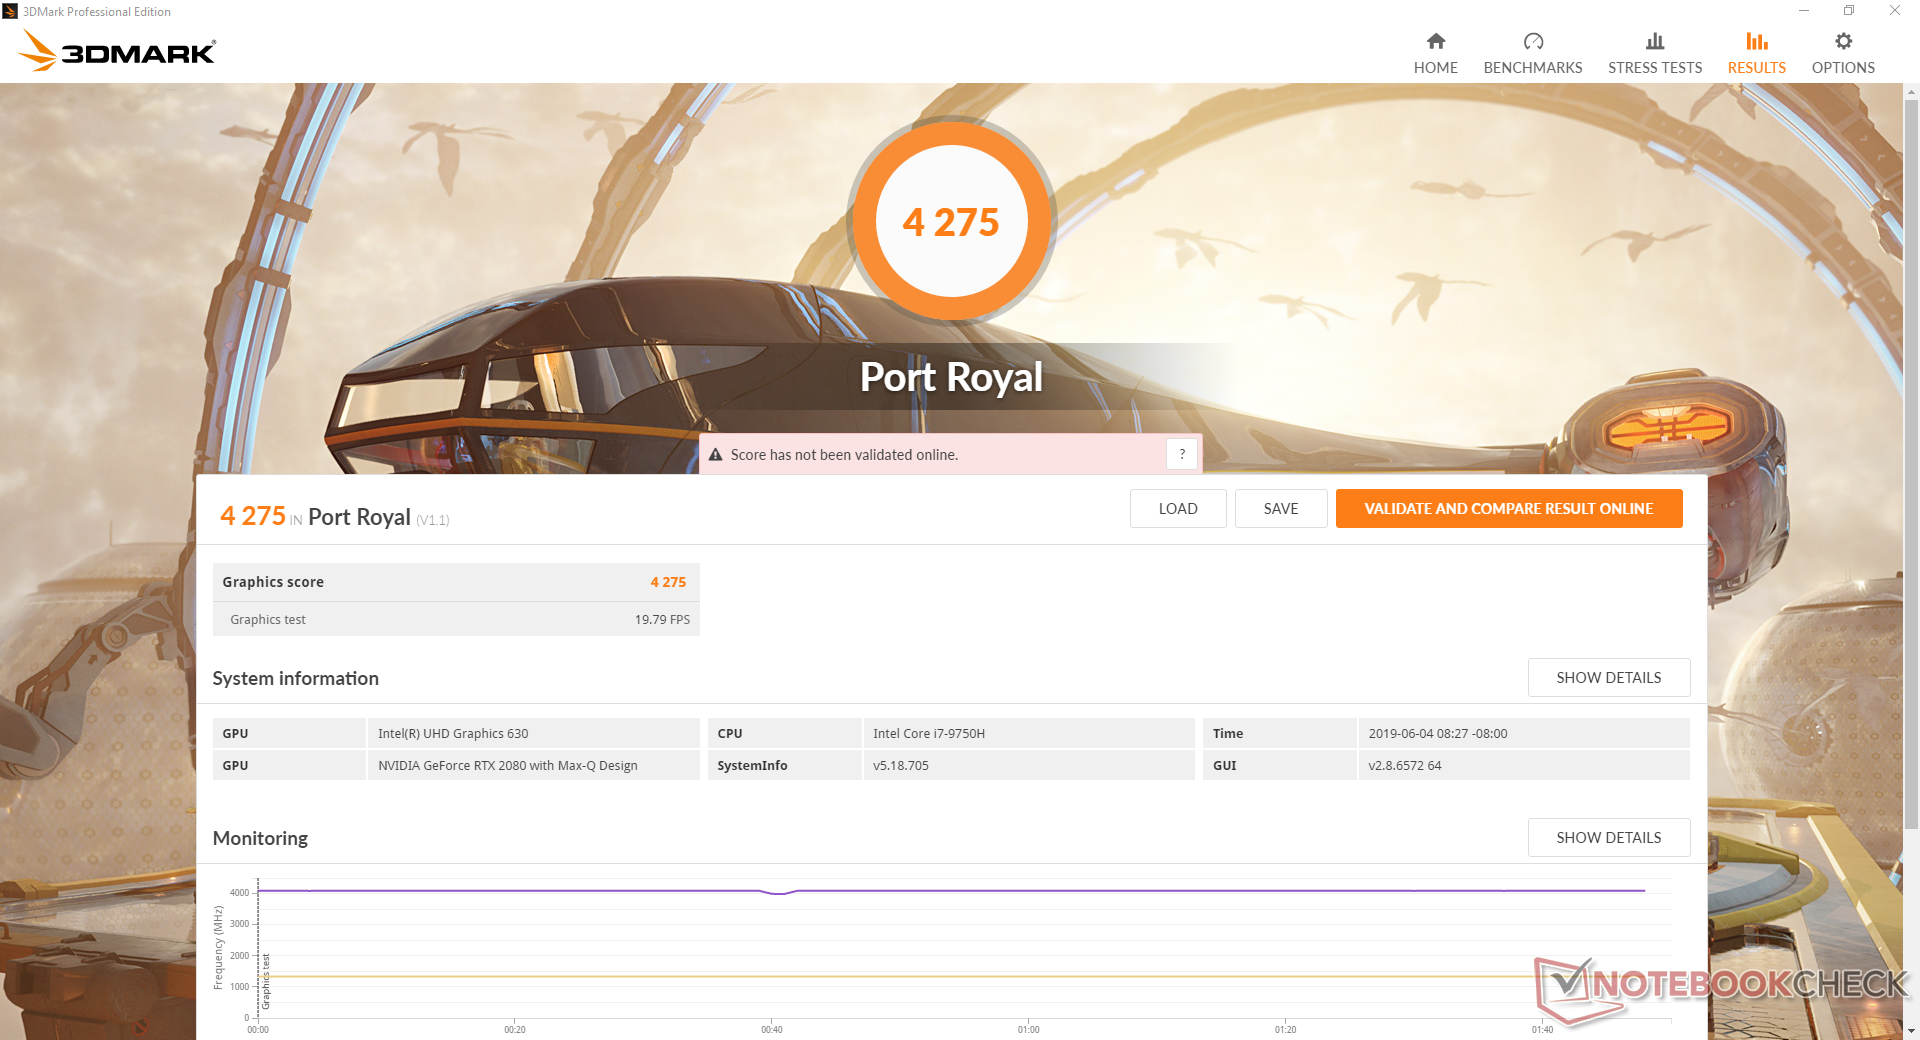
The RTX 2080 Max-Q is a powerful GPU, but it may not be as powerful as you think. We've already proven that the performance delta between the RTX 2070 Max-Q and RTX 2080 Max-Q is quite small when compared to the delta between the GTX 1070 Max-Q and GTX 1080 Max-Q and this remains true on the new GS65 9SG. Its RTX 2080 Max-Q is merely 4 to 8 percent faster than the RTX 2070 Max-Q in the Razer Blade 15. Still, owners can expect a performance level very similar to the standard non-Max-Q RTX 2070 for laptops.
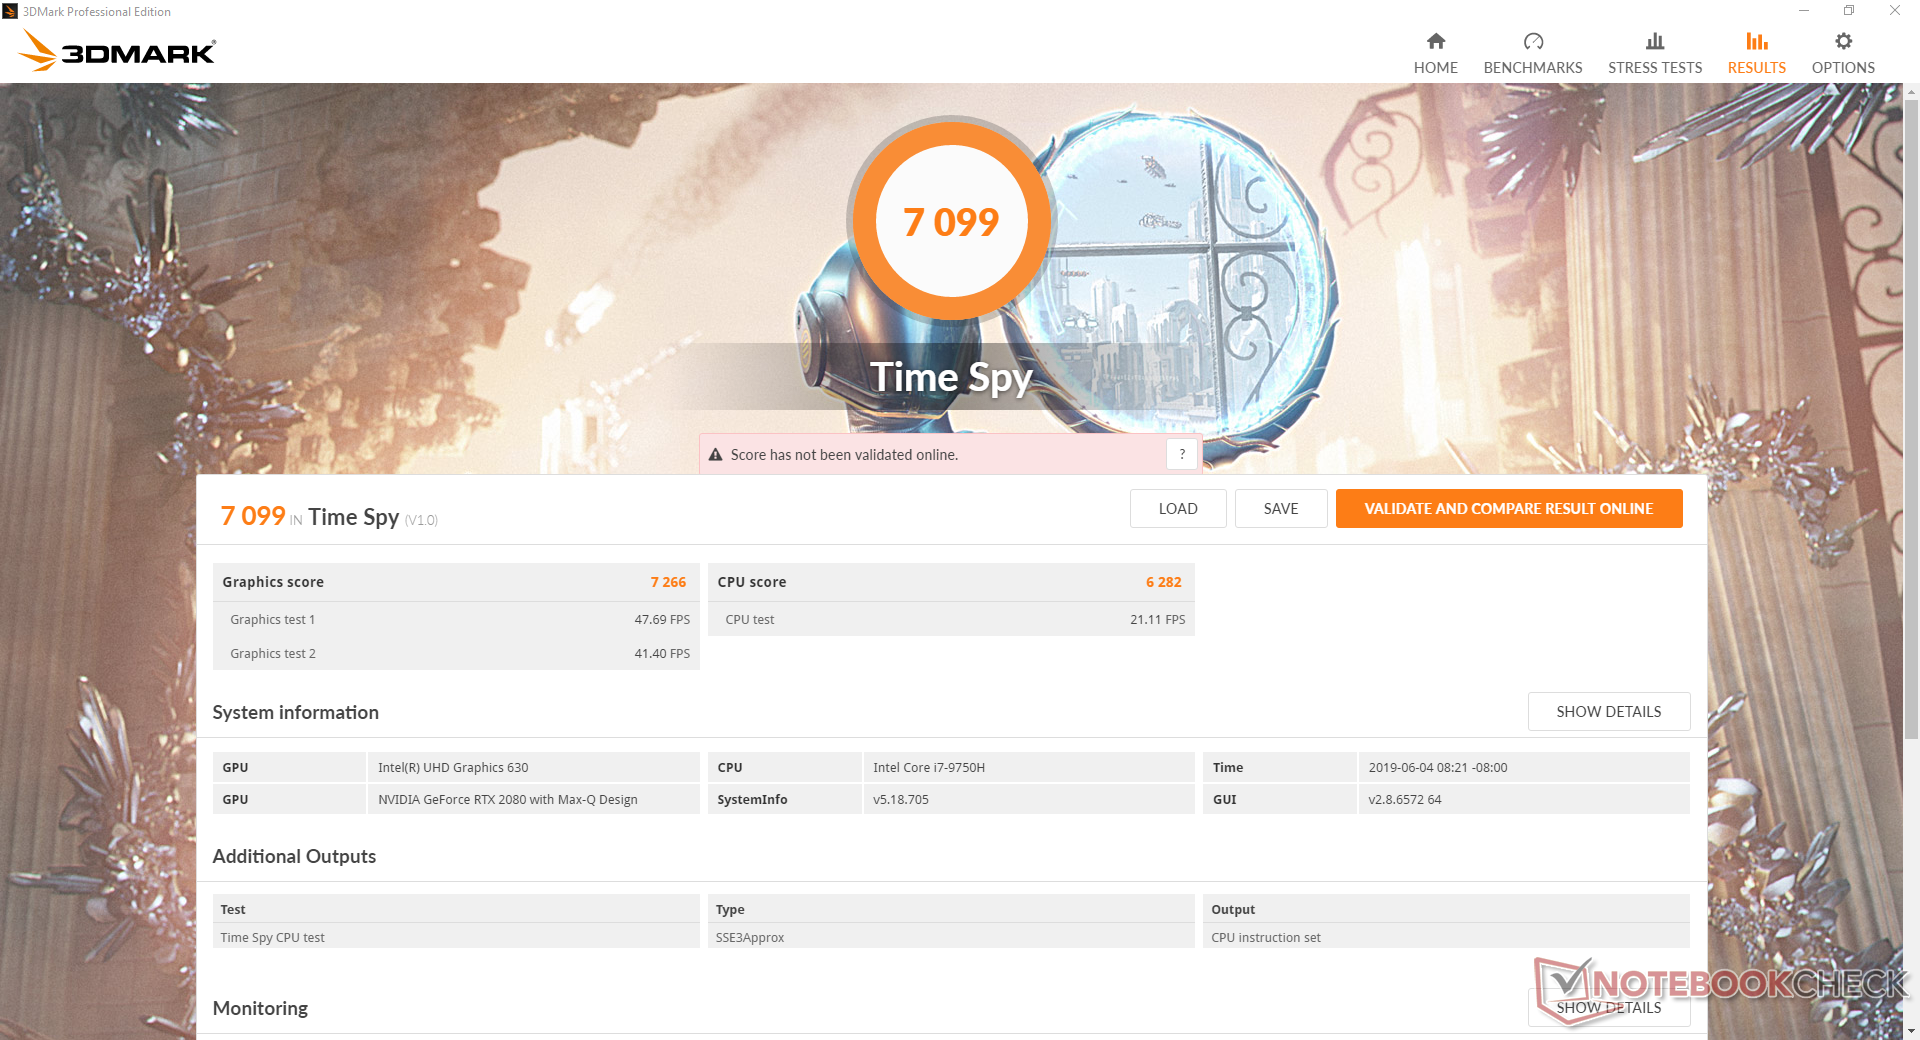
Running the system on maximum fan speed (Cooler Boost mode) will not increase GPU performance. A Time Spy run on Cooler Boost mode returns Physics and Graphics scores of 6690 and 7143, respectively, compared to 6282 and 7266 points when on the standard Balanced Mode.
Interestingly, the Asus Zephyrus S GX531GX with the same RTX 2080 Max-Q GPU is able to outperform our MSI by about 12 percent albeit at the cost of louder fan noise.
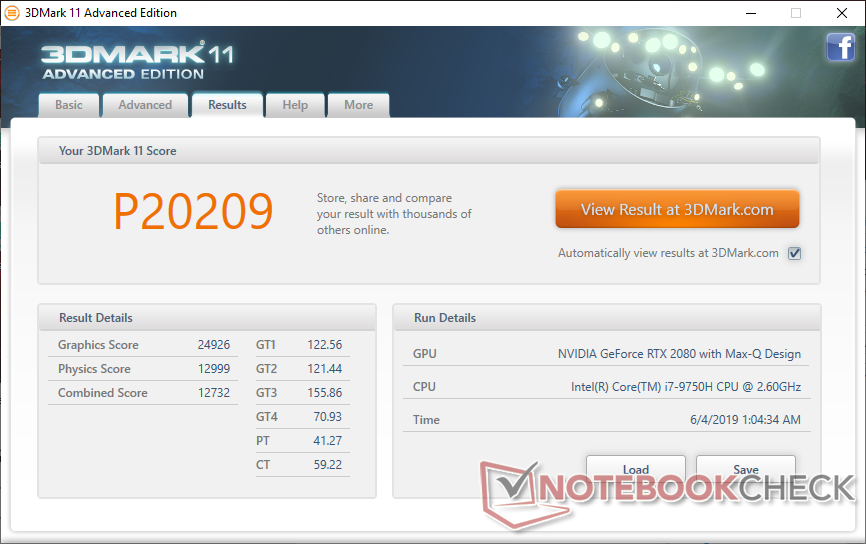
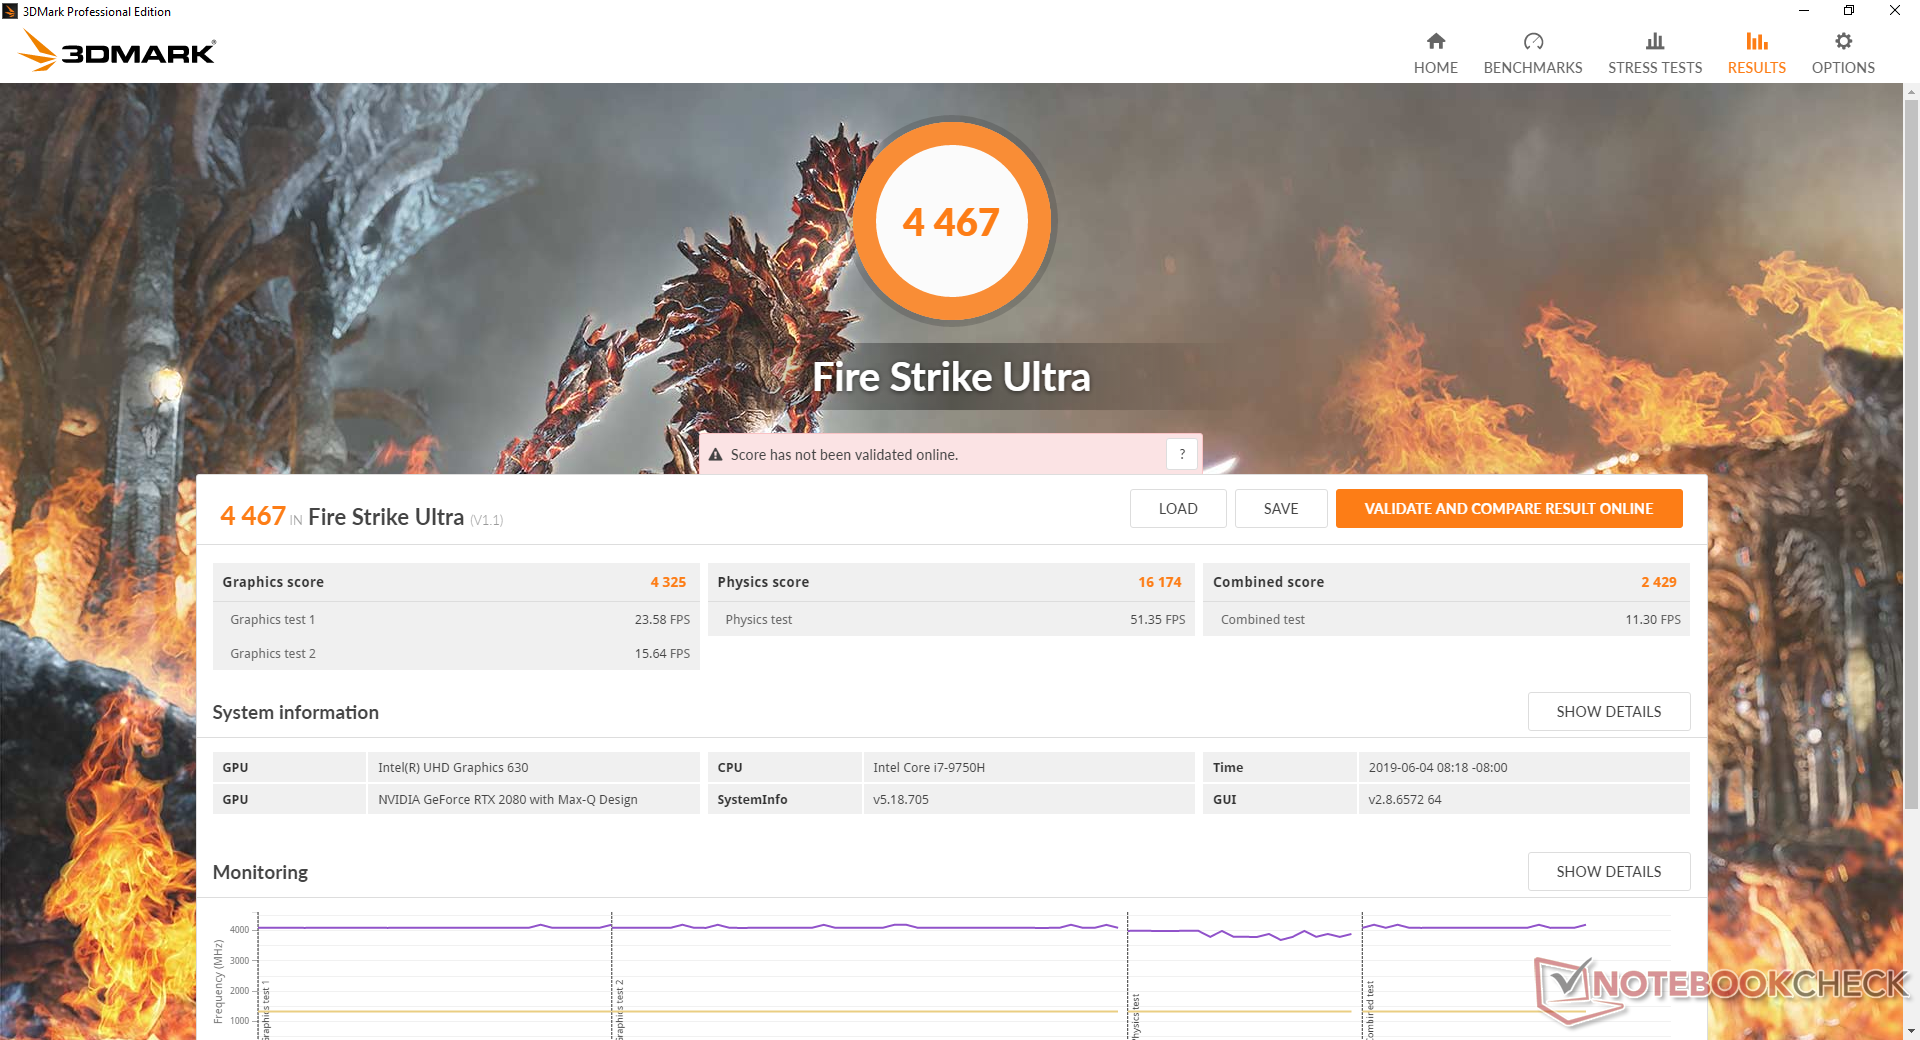
| 3DMark 11 Performance | 20209 points | |
| 3DMark Cloud Gate Standard Score | 37220 points | |
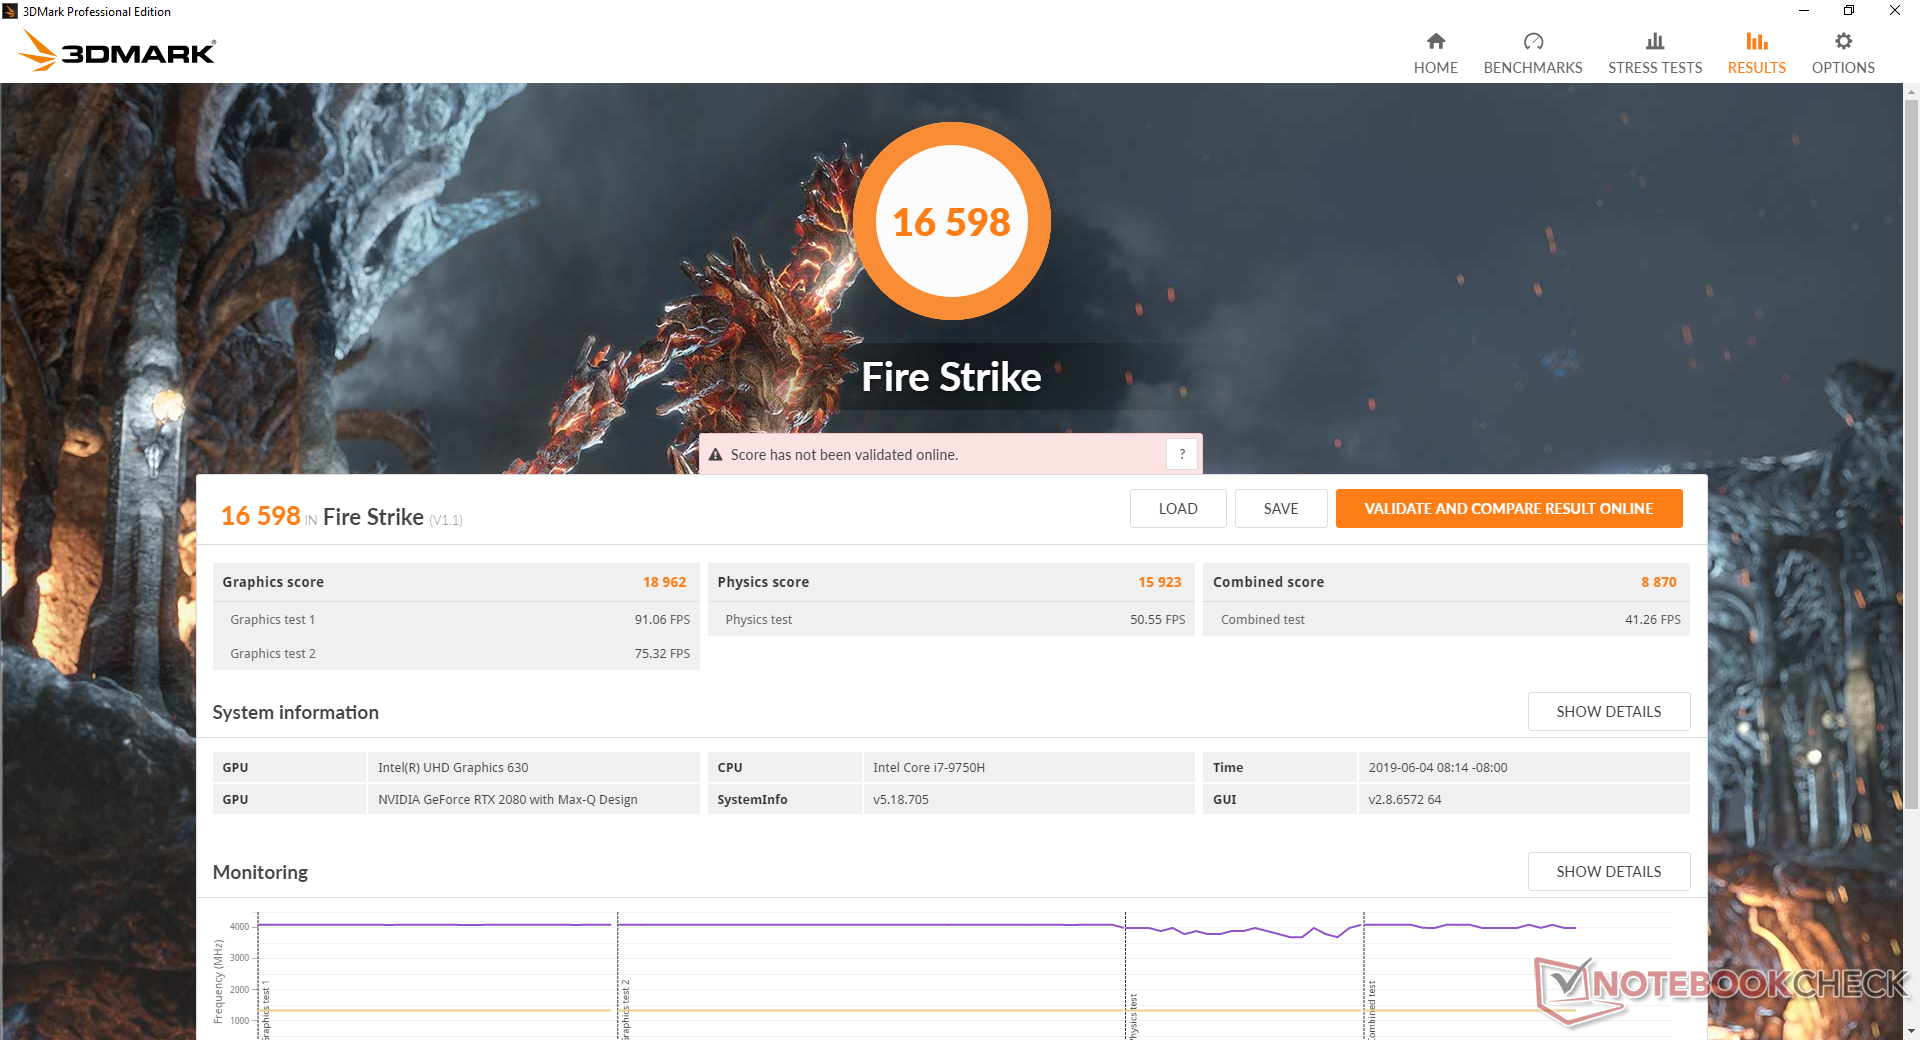
| 3DMark Fire Strike Score | 16598 points | |
| 3DMark Time Spy Score | 7099 points | |
Help | ||
Gaming Performance
As suggested by the 3DMark results above, real-world gaming performance is close to the RTX 2070 for laptops. All the latest titles should run without a hitch especially at the "low" native resolution of 1080p.
What users shouldn't expect, however is reaching a stable 240 FPS at 1080p on most modern titles. While possible on Fortnite and Rocket League at Medium settings, users should instead aim for stable frame rates that are divisors of 240 to reduce or eliminate tearing. Users would still be able to exploit the advantages of a native 240 Hz panel this way without reaching 240 FPS.
Idling on Witcher 3 shows no recurring frame dips to suggest no interrupting background activity when gaming.
See our dedicated page on the GeForce RTX 2080 Max-Q for more technical information and benchmark comparisons.
| Shadow of the Tomb Raider - 1920x1080 Highest Preset AA:T | |
| MSI RTX 2080 Gaming X Trio | |
| MSI GE75 9SG | |
| Average NVIDIA GeForce RTX 2080 Max-Q (71 - 105, n=8) | |
| MSI GS65 Stealth 9SG | |
| Asus Zephyrus S GX502GW | |
| Acer Nitro 5 AN515-42-R6V0 | |
| low | med. | high | ultra | |
|---|---|---|---|---|
| BioShock Infinite (2013) | 306.4 | 273 | 254.1 | 156.9 |
| The Witcher 3 (2015) | 279 | 216 | 125.5 | 66.9 |
| Rise of the Tomb Raider (2016) | 223.3 | 176.7 | 139.8 | 108.6 |
| Shadow of the Tomb Raider (2018) | 133 | 102 | 97 | 84 |
Emissions
System Noise
The fans are always active no matter the onscreen load at about 30.5 dB(A) against a background of 28.3 dB(A). This is fortunately quiet enough to be easily ignored if working in a typical home or office environment. Fan pulsing is not an issue when browsing or video streaming especially if set to Eco or Comfort modes.
Gaming induces a constant fan noise of 46 dB(A) to be louder than what we recorded on last year's GS65 with GTX 1070 Max-Q graphics. While not the quietest laptop, it's also not the loudest; the Zephyrus S GX531, Gigabyte Aero 15, and MSI GE75 each reach over 50 dB(A) when under the same gaming loads.
Our test unit exhibits no coil while or electronic noise.
| MSI GS65 Stealth 9SG GeForce RTX 2080 Max-Q, i7-9750H | Razer Blade 15 RTX 2080 Max-Q GeForce RTX 2080 Max-Q, i7-9750H | MSI GS65 8RF-019DE Stealth Thin GeForce GTX 1070 Max-Q, i7-8750H | Asus Zephyrus S GX531GX GeForce RTX 2080 Max-Q, i7-8750H | Gigabyte Aero 15 Classic-XA GeForce RTX 2070 Max-Q, i7-9750H | MSI GE75 9SG GeForce RTX 2080 Mobile, i9-9880H | |
|---|---|---|---|---|---|---|
| Noise | 7% | -0% | -8% | -12% | -4% | |
| off / environment * (dB) | 28.3 | 28.3 -0% | 30 -6% | 28.7 -1% | 30 -6% | 28.2 -0% |
| Idle Minimum * (dB) | 30.4 | 28.8 5% | 30 1% | 29.8 2% | 31 -2% | 30.4 -0% |
| Idle Average * (dB) | 30.5 | 28.8 6% | 31 -2% | 32.4 -6% | 34 -11% | 30.4 -0% |
| Idle Maximum * (dB) | 30.6 | 29 5% | 34 -11% | 38 -24% | 39 -27% | 33.4 -9% |
| Load Average * (dB) | 37.6 | 33.5 11% | 43 -14% | 38.2 -2% | 46 -22% | 37.1 1% |
| Witcher 3 ultra * (dB) | 46 | 45 2% | 42 9% | 56.6 -23% | 53 -15% | 54.2 -18% |
| Load Maximum * (dB) | 55.1 | 45.2 18% | 44 20% | 56.6 -3% | 55 -0% | 56.4 -2% |
* ... smaller is better
Noise level
| Idle |
| 30.4 / 30.5 / 30.6 dB(A) |
| Load |
| 37.6 / 55.1 dB(A) |
 | ||
30 dB silent 40 dB(A) audible 50 dB(A) loud |
||
min: | ||
Temperature
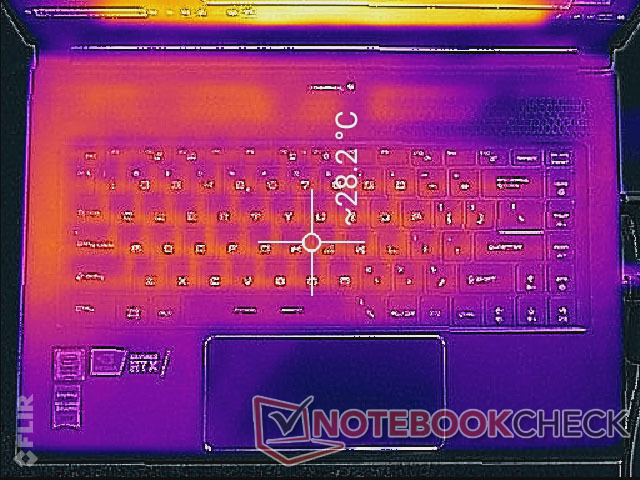
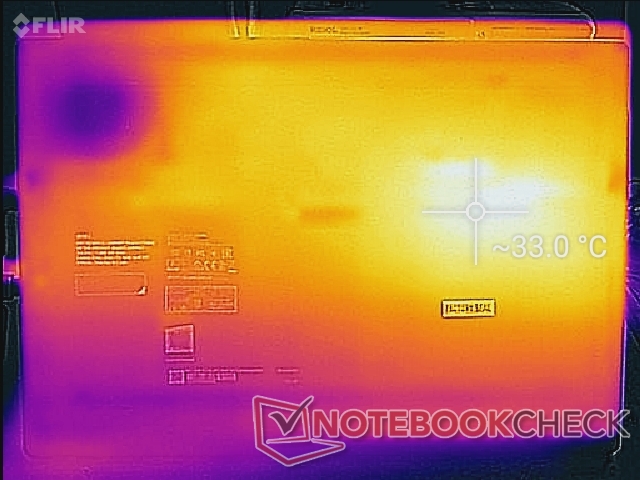
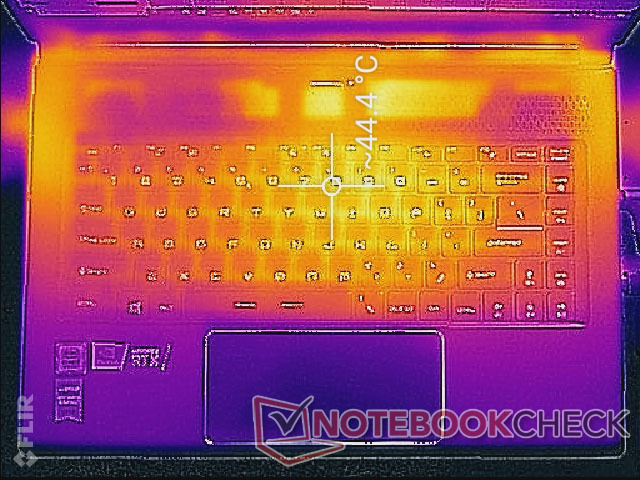
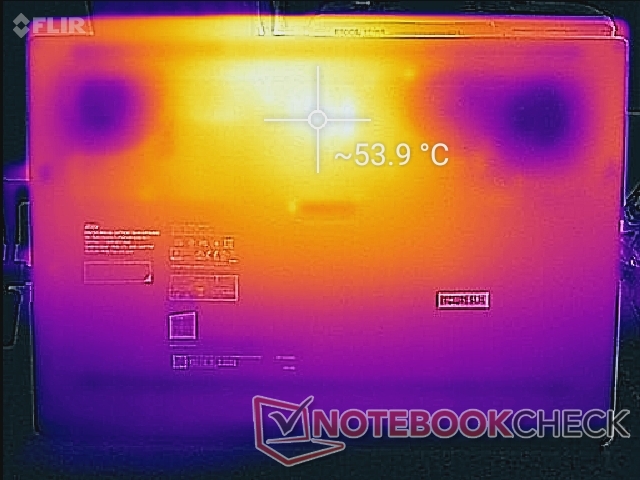
Surface temperatures when idling are cool on the top and warm on the bottom. We're able to record a temperature of 33 C on the bottom just from sitting on the desktop screen. It's not irksome, but definitely noticeable when using the laptop on one's lap.
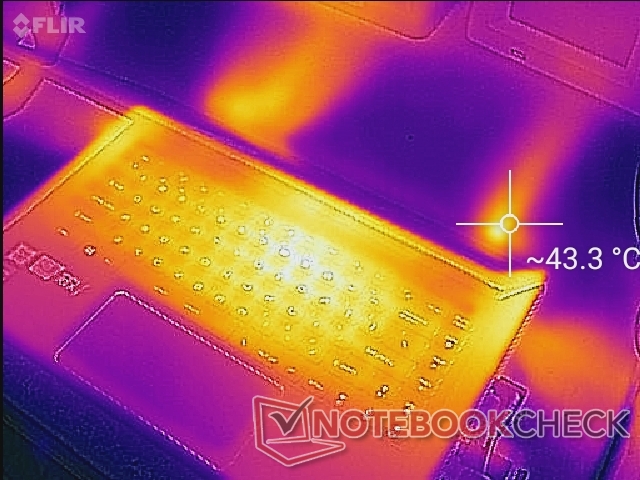
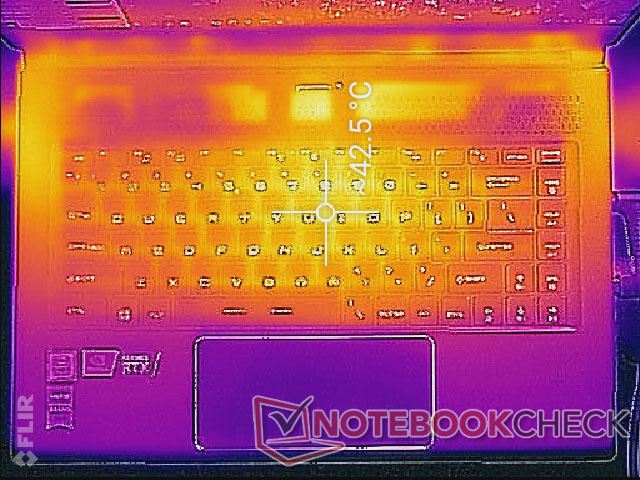
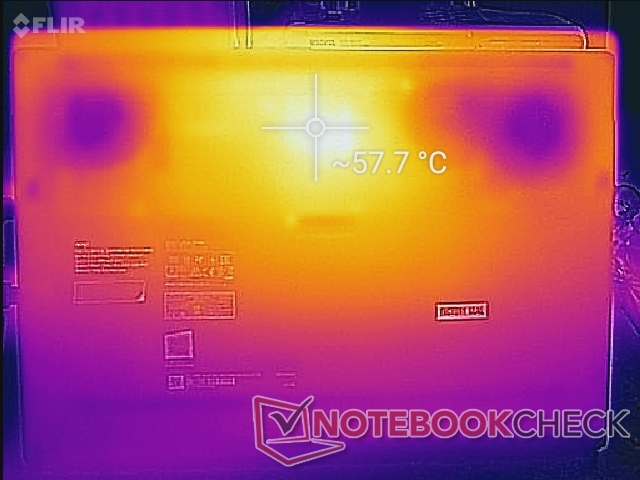
Gaming loads will bump the hot spots near the center of the keyboard to as high as 44 C. The WASD keys become warmer as well since the GS65 does not pull in cool air from the edges of the keyboard to keep the WASD keys cool. The Blade 15, for example, takes this approach to keep the WASD fingers cool while the Zephyrus GX531 avoids the heat issue completely by moving the entire keyboard forward. It's definitely something MSI could improve upon for future iterations of the GS series.
Stress Test
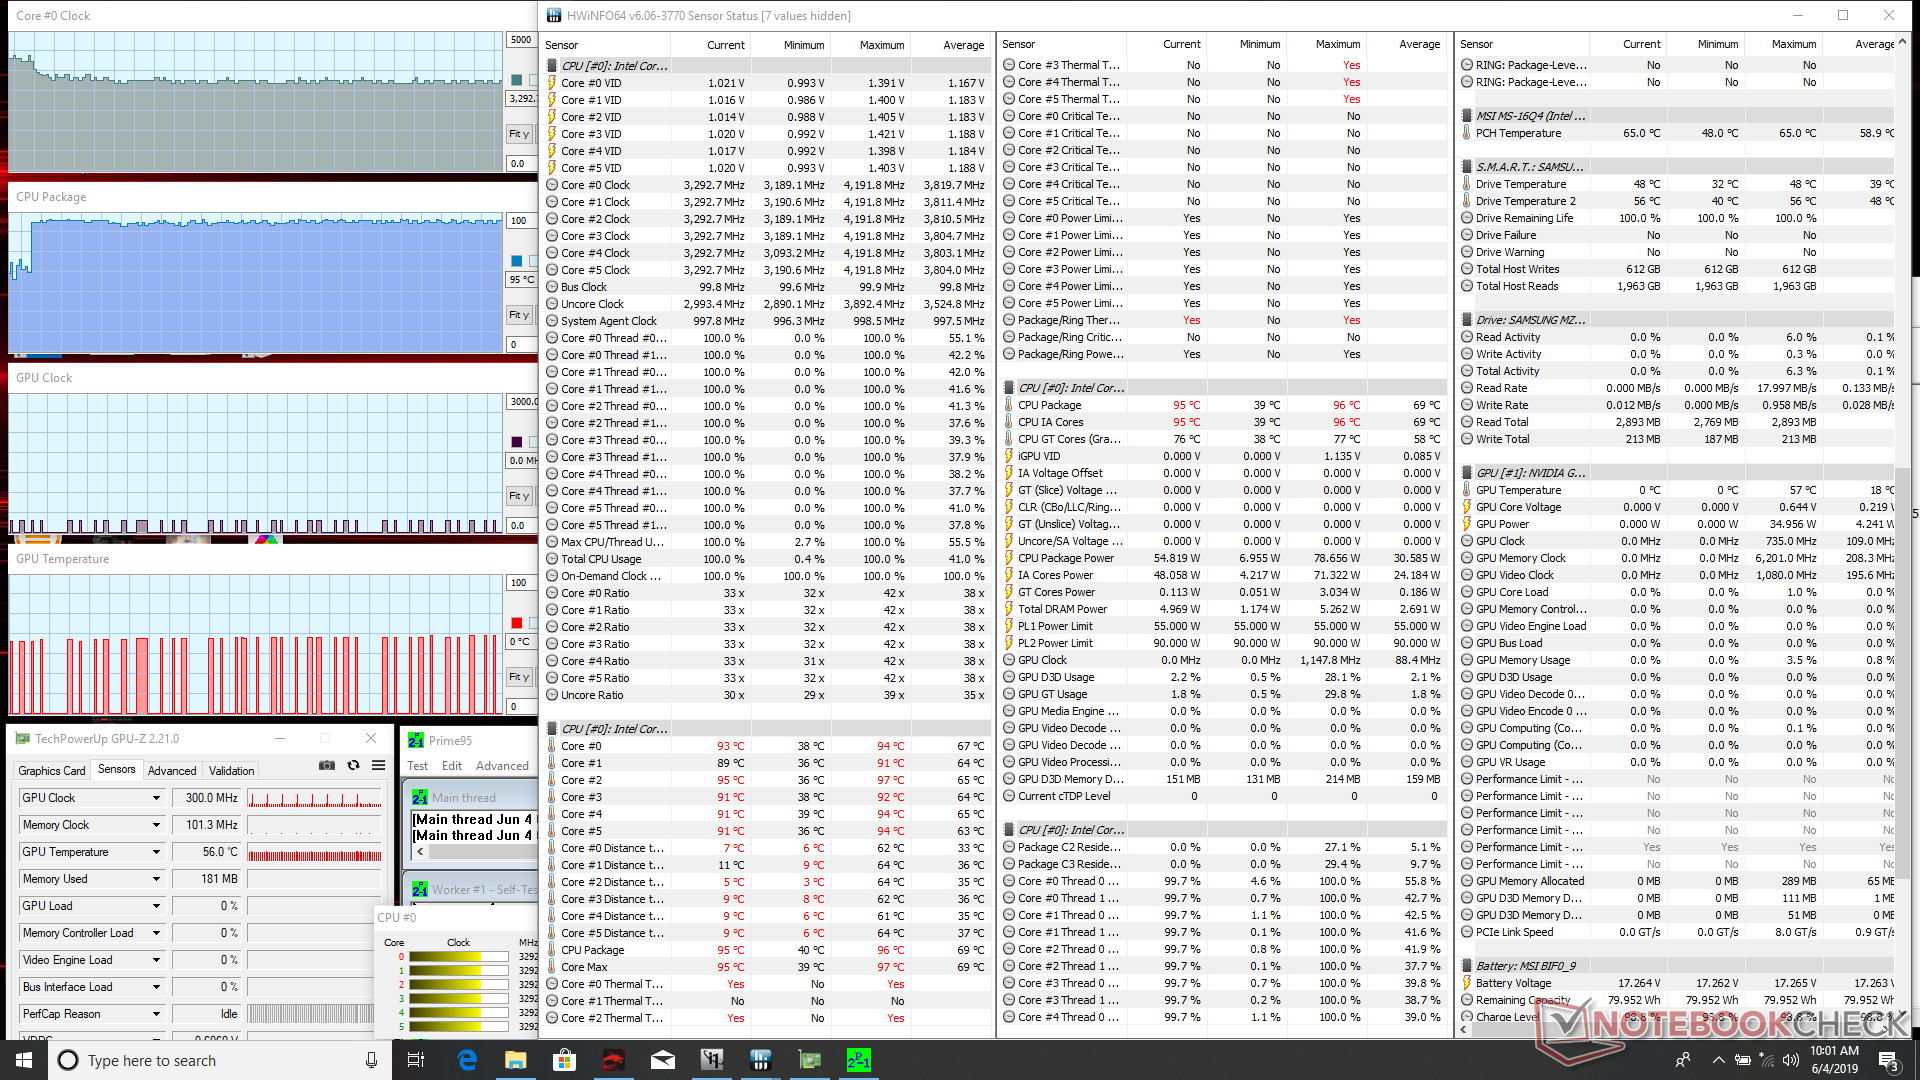
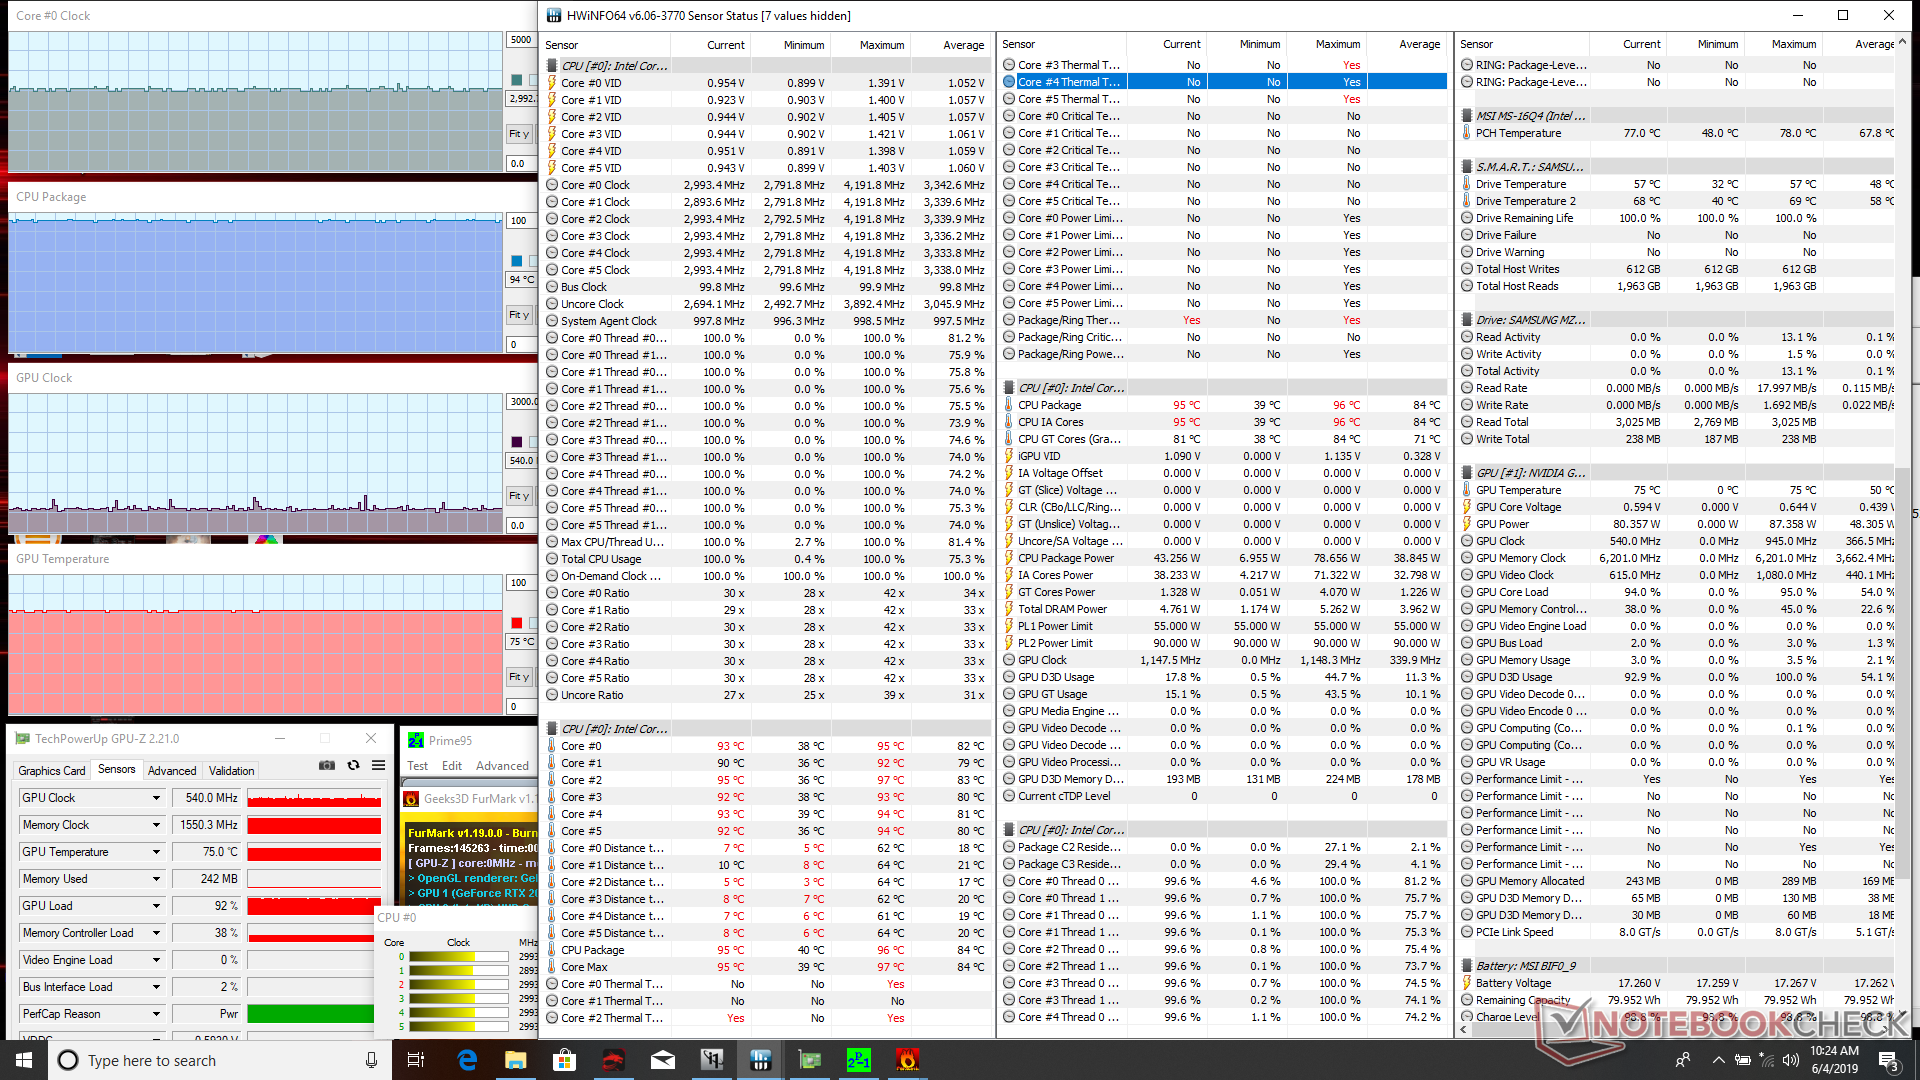
We stress the laptop with synthetic loads to identify for any potential throttling or stability issues. When running Prime95 load, the CPU would initially boost up to 4.0 GHz before immediately falling and stabilizing at the 3.2 to 3.3 GHz range. A look at the core temperature tells us why: at 94 C, higher clock rates would be unsustainable. Still, the 3.2 to 3.3 GHz range is at least +600 MHz above the base clock rate of the Core i7-9750H for a respectable level of reliable Turbo Boost. If running both Prime95 and FurMark simultaneously, CPU and GPU temperatures stabilize at 94 C and 75 C, respectively.
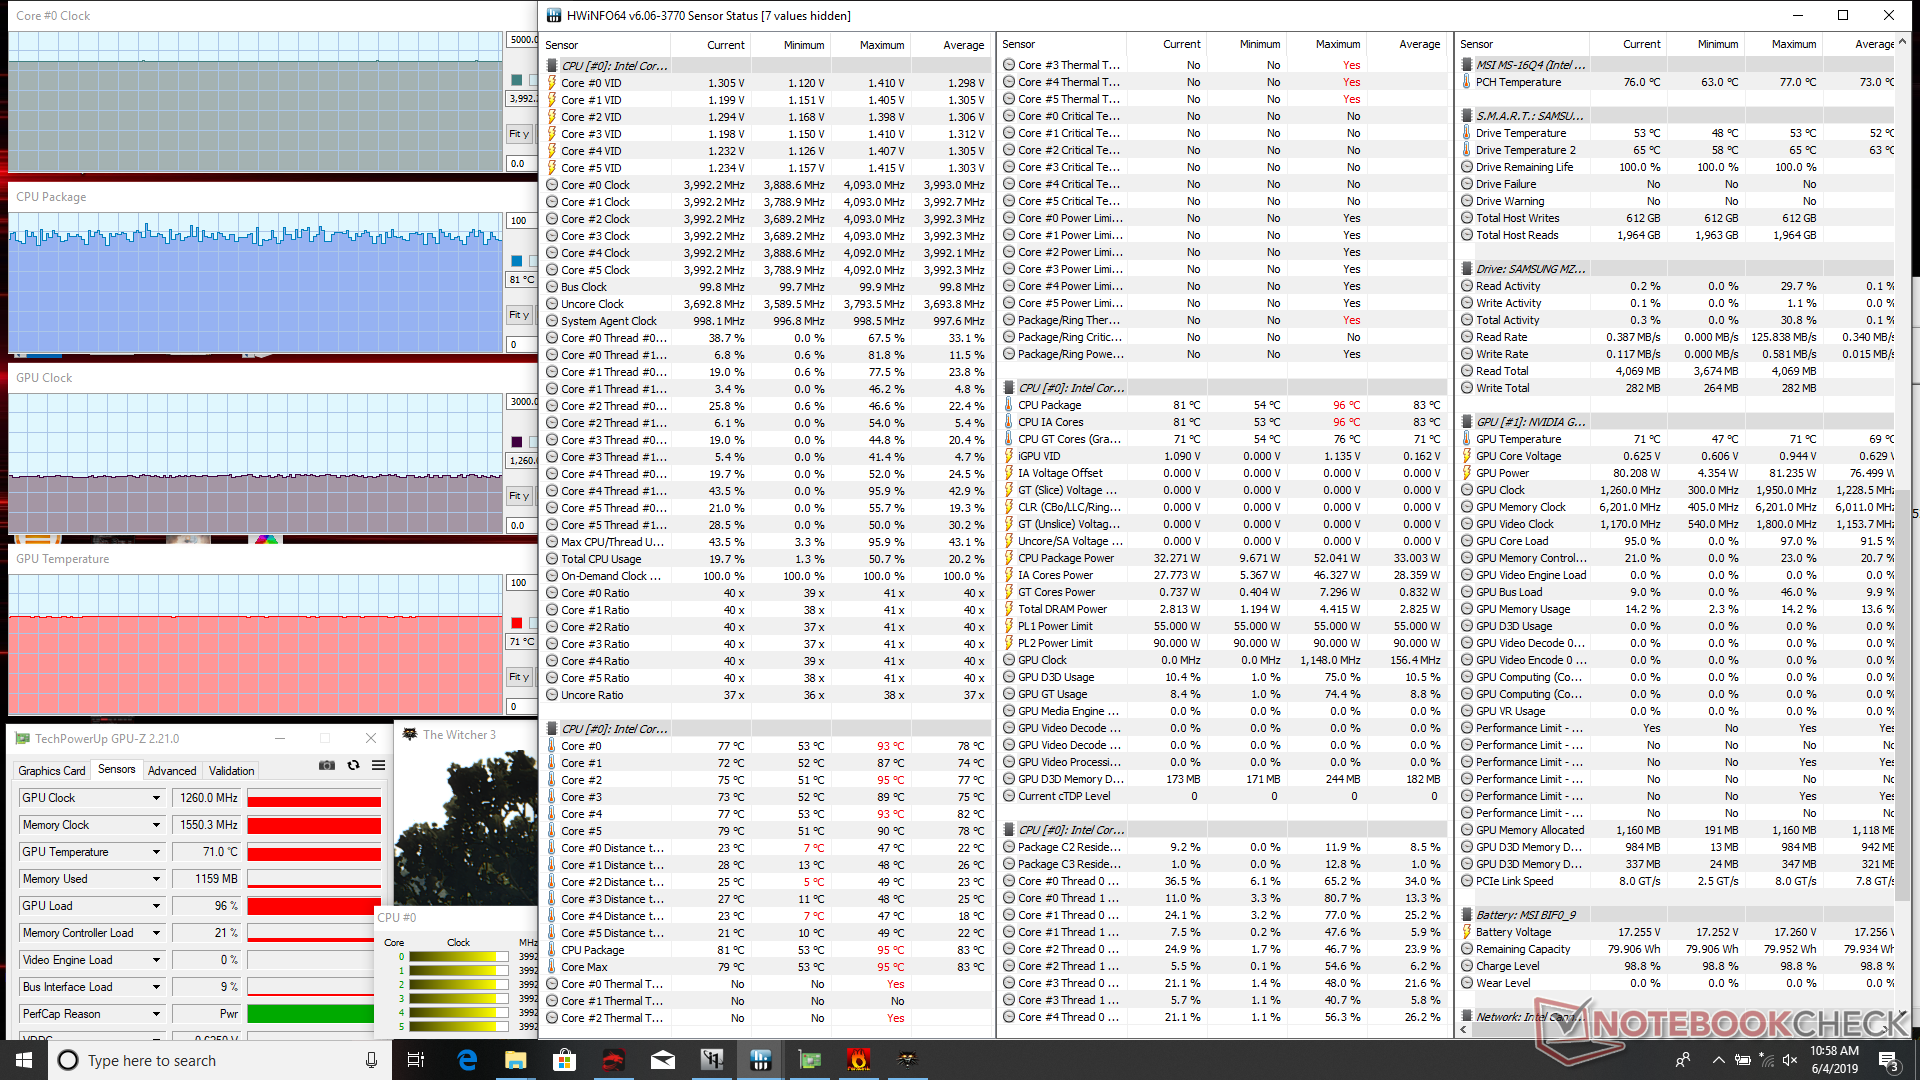
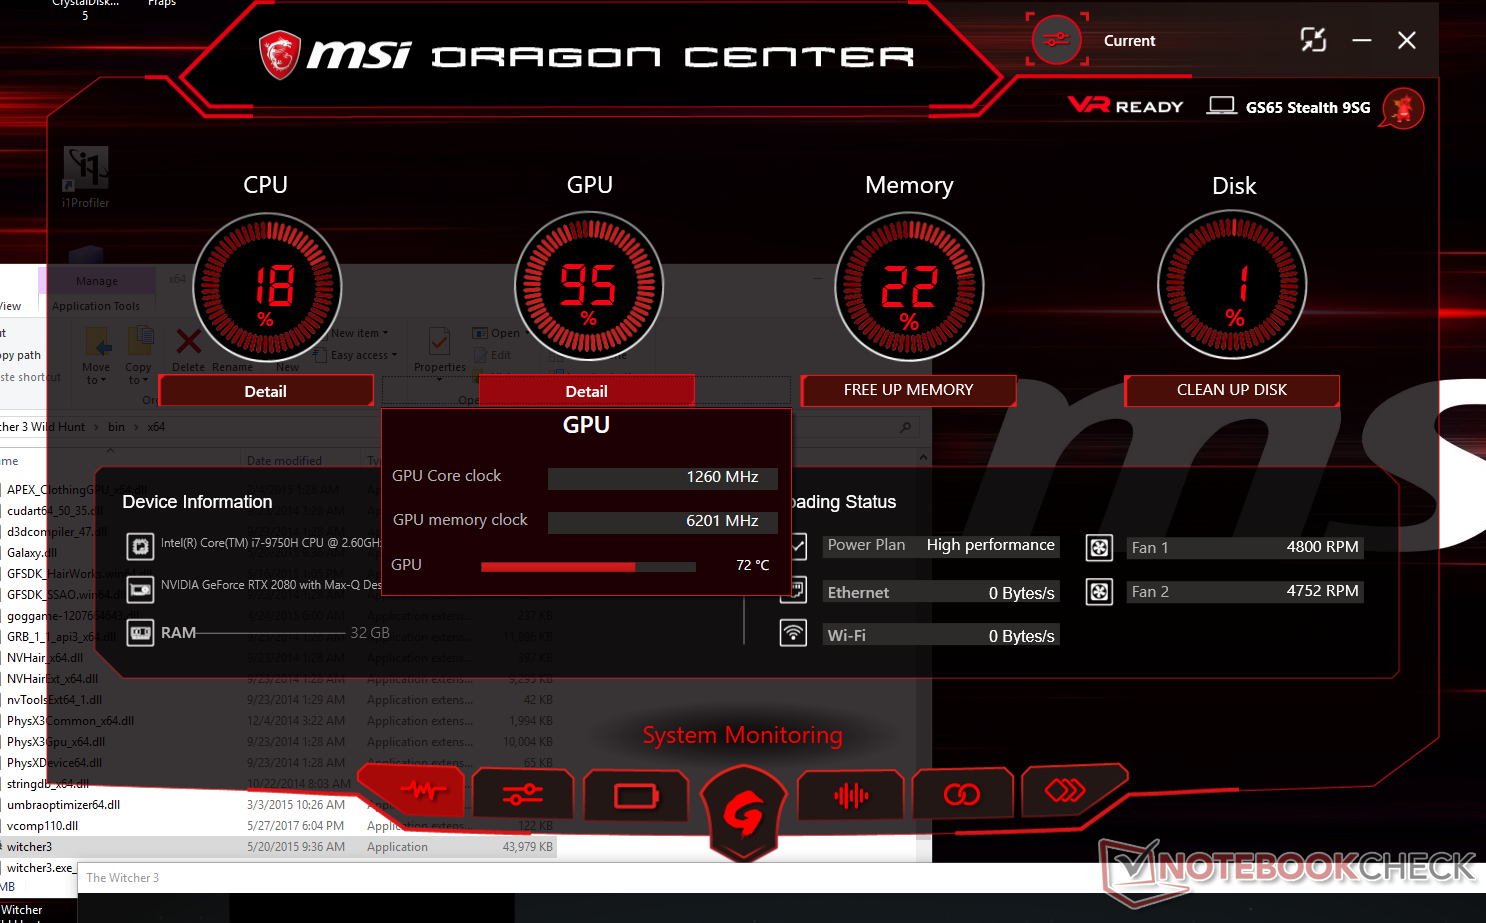
Running Witcher 3 is more representative of real-world loads. The CPU and GPU stabilize at lower temperatures of 81 C and 71 C, respectively, which is still quite warm even for a super-thin gaming laptop. The Zephyrus S GX531GX with the i7-8750H CPU and same RTX 2080 Max-Q GPU, for example, stabilize at 76 C and 66 C, respectively, under the same gaming load. Engaging "Cooler Boost" mode on the GS65 will cause the CPU and GPU to stabilize at cooler core temperatures of about 75 C and 64 C, respectively, at the cost of significantly louder fan noise.
Running on batteries will impact performance. The "Turbo" and "Sport" system profiles in Dragon Center are automatically disabled when running on batteries. Thus, users are limited to just "Eco" and "Comfort" modes. Running 3DMark 11 on batteries returns Physics and Graphics scores of 9771 and 4246 points, respectively, compared to 12999 and 24926 points when on mains.
| CPU Clock (GHz) | GPU Clock (MHz) | Average CPU Temperature (°C) | Average GPU Temperature (°C) | |
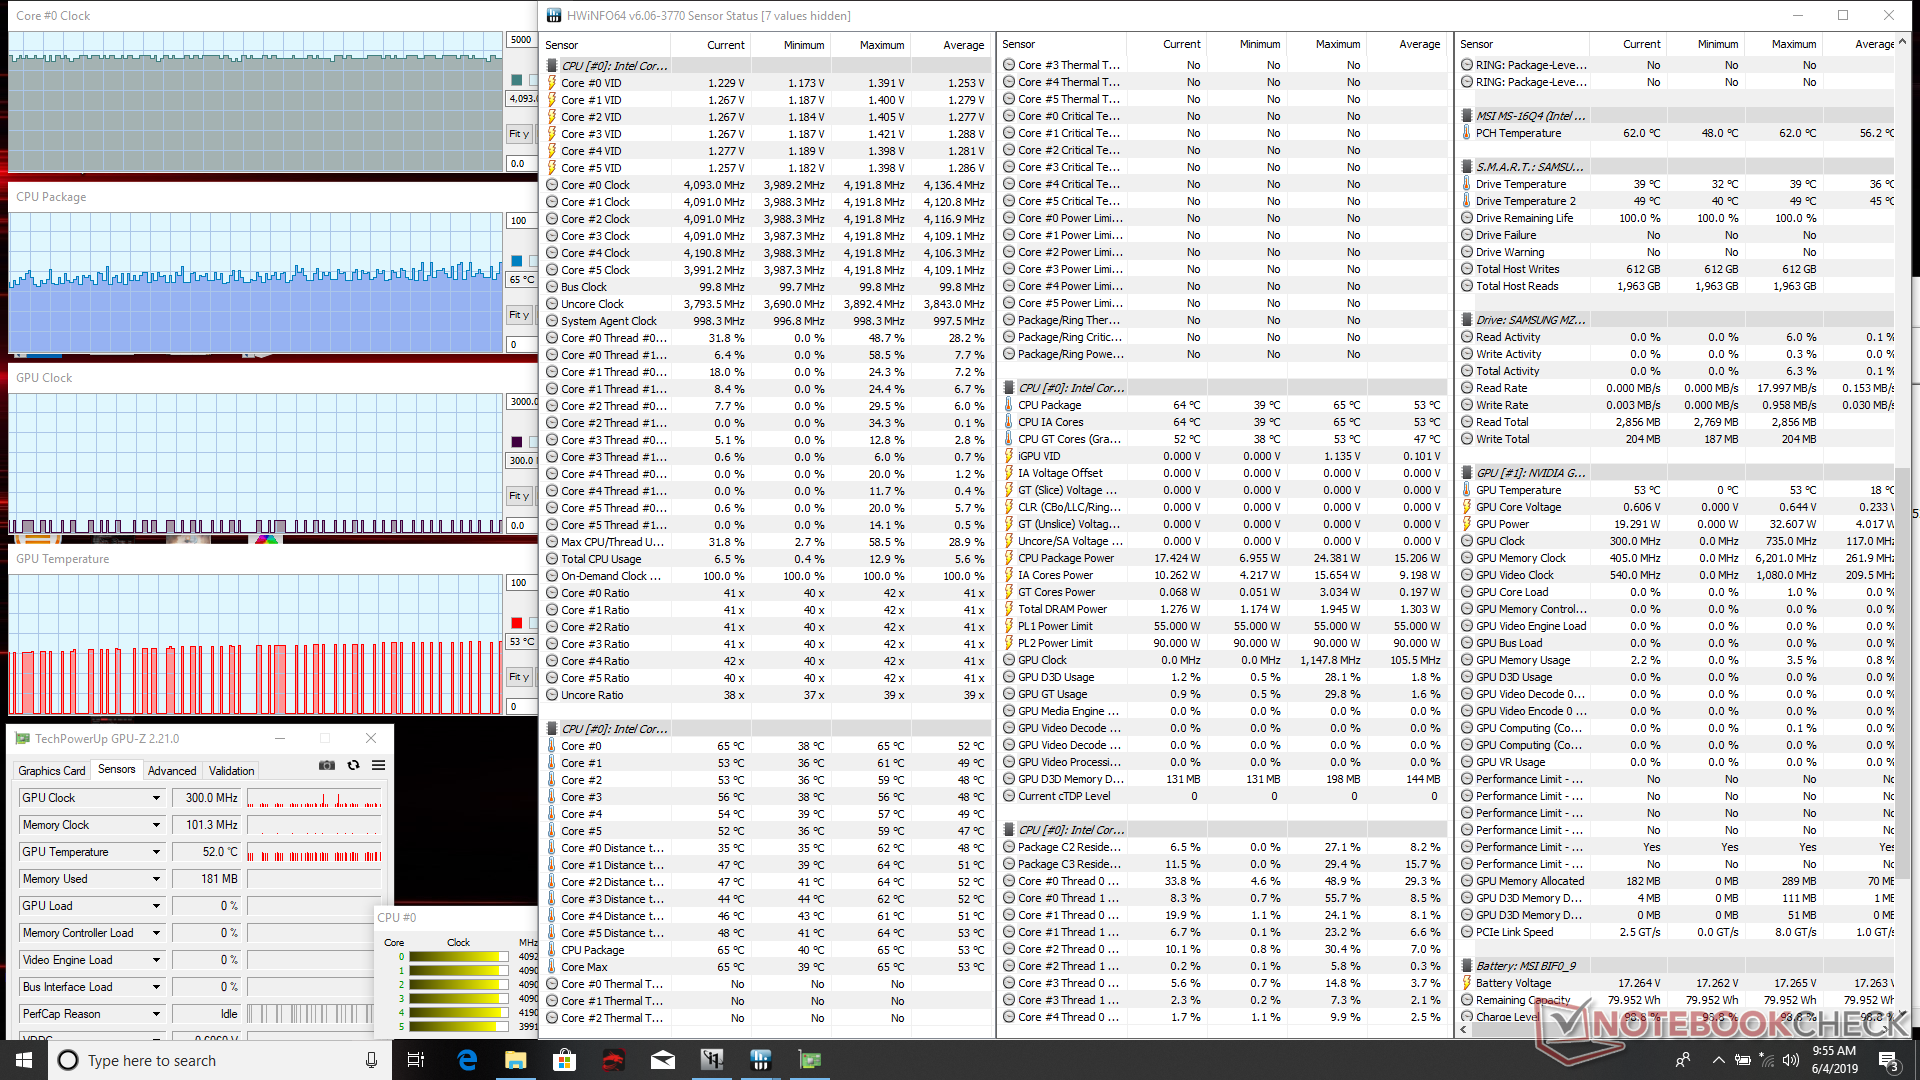
| System Idle | -- | -- | 65 | 53 |
| Prime95 Stress | 3.2 - 3.3 | -- | 95 | -- |
| Prime95 + FurMark Stress | 3.0 | 540 | 94 | 75 |
| Witcher 3 Stress | 4.0 | 1260 | ~81 | 71 |
(-) The maximum temperature on the upper side is 45.6 °C / 114 F, compared to the average of 40.4 °C / 105 F, ranging from 21.2 to 68.8 °C for the class Gaming.
(-) The bottom heats up to a maximum of 53.8 °C / 129 F, compared to the average of 43.2 °C / 110 F
(+) In idle usage, the average temperature for the upper side is 27.1 °C / 81 F, compared to the device average of 33.9 °C / 93 F.
(±) Playing The Witcher 3, the average temperature for the upper side is 35.2 °C / 95 F, compared to the device average of 33.9 °C / 93 F.
(+) The palmrests and touchpad are cooler than skin temperature with a maximum of 29 °C / 84.2 F and are therefore cool to the touch.
(±) The average temperature of the palmrest area of similar devices was 28.8 °C / 83.8 F (-0.2 °C / -0.4 F).
Speakers


MSI GS65 Stealth 9SG audio analysis
(+) | speakers can play relatively loud (89.4 dB)
Bass 100 - 315 Hz
(-) | nearly no bass - on average 22.7% lower than median
(±) | linearity of bass is average (9% delta to prev. frequency)
Mids 400 - 2000 Hz
(±) | higher mids - on average 7% higher than median
(+) | mids are linear (6.4% delta to prev. frequency)
Highs 2 - 16 kHz
(+) | balanced highs - only 2.7% away from median
(±) | linearity of highs is average (10.6% delta to prev. frequency)
Overall 100 - 16.000 Hz
(±) | linearity of overall sound is average (23.1% difference to median)
Compared to same class
» 84% of all tested devices in this class were better, 4% similar, 12% worse
» The best had a delta of 6%, average was 18%, worst was 132%
Compared to all devices tested
» 69% of all tested devices were better, 5% similar, 26% worse
» The best had a delta of 4%, average was 23%, worst was 134%
Apple MacBook 12 (Early 2016) 1.1 GHz audio analysis
(+) | speakers can play relatively loud (83.6 dB)
Bass 100 - 315 Hz
(±) | reduced bass - on average 11.3% lower than median
(±) | linearity of bass is average (14.2% delta to prev. frequency)
Mids 400 - 2000 Hz
(+) | balanced mids - only 2.4% away from median
(+) | mids are linear (5.5% delta to prev. frequency)
Highs 2 - 16 kHz
(+) | balanced highs - only 2% away from median
(+) | highs are linear (4.5% delta to prev. frequency)
Overall 100 - 16.000 Hz
(+) | overall sound is linear (10.2% difference to median)
Compared to same class
» 7% of all tested devices in this class were better, 2% similar, 91% worse
» The best had a delta of 5%, average was 18%, worst was 53%
Compared to all devices tested
» 5% of all tested devices were better, 1% similar, 94% worse
» The best had a delta of 4%, average was 23%, worst was 134%
Energy Management
Power Consumption
Idling on desktop draws anywhere between 18 W and 29 W compared to just 7 W to 20 W on last year's GS65 8RF. Background activity during measurement is likely the cause of the discrepancy since battery life is otherwise identical between the two systems as our next section will show.
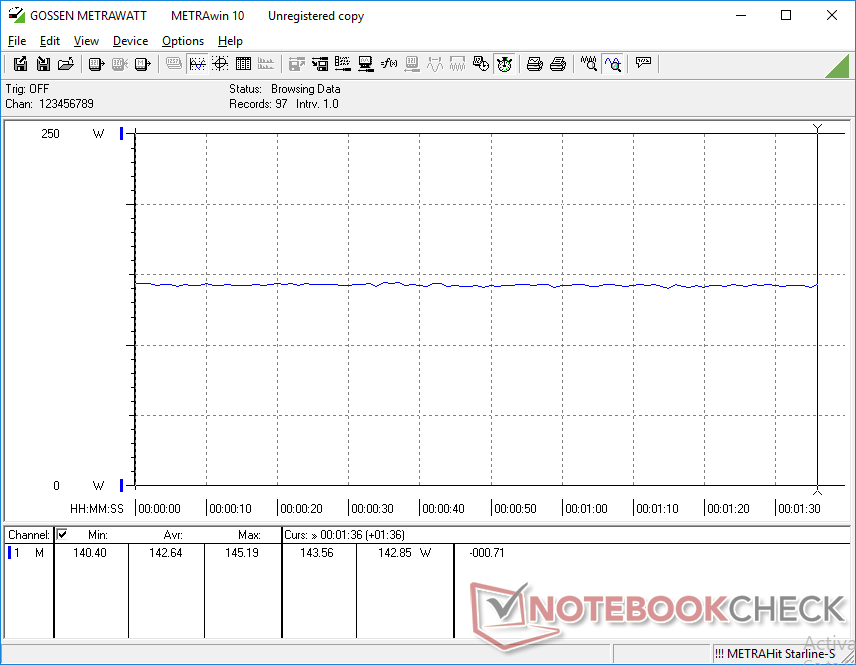
When gaming, the GS65 9SG demands 143 W compared to 132 W on the GS65 8RF with GTX 1070 Max-Q graphics. It's an 8 percent increase in power consumption for a 29 to 54 percent increase in graphics power — a definite boost to performance-per-Watt.
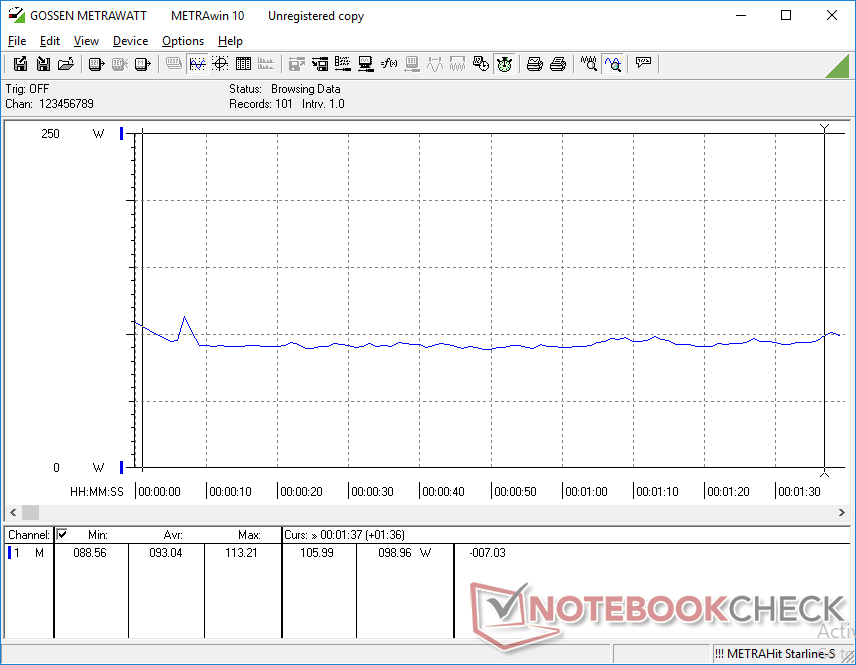
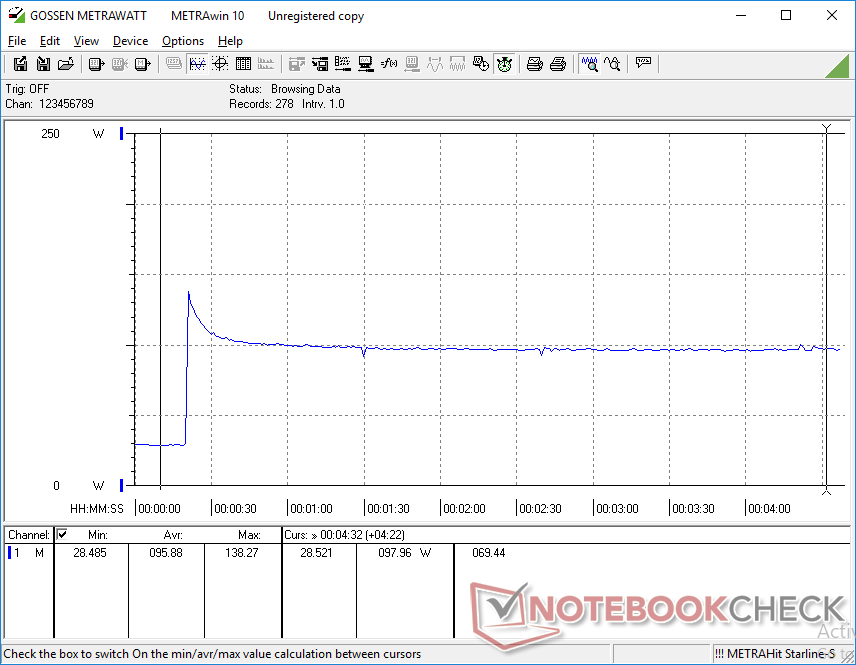
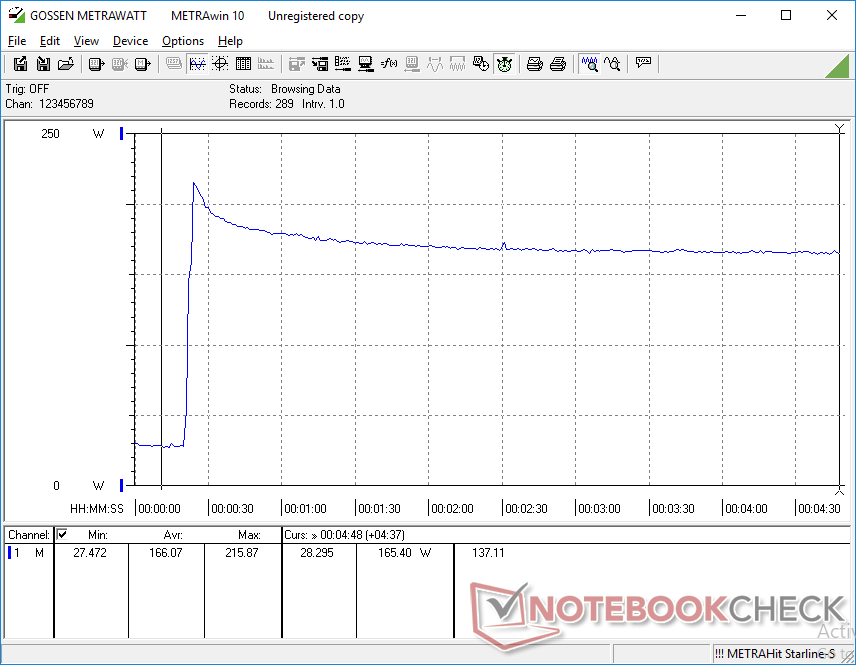
When running Prime95, power consumption will spike up to 138 W before immediately falling and stabilizing at 98 W as shown by our graph below. This behavior mirrors our stress test and CineBench loop test observations from above. At most, we're able to record a consumption of 215.9 W from the small-medium (~15.4 x 7.4 x 3 cm) 230 W AC adapter when running both Prime95 and FurMark simultaneously.
| Off / Standby | |
| Idle | |
| Load |
|
Key:
min: | |
| MSI GS65 Stealth 9SG i7-9750H, GeForce RTX 2080 Max-Q, Samsung SSD PM981 MZVLB512HAJQ, IPS, 1920x1080, 15.6" | Razer Blade 15 RTX 2080 Max-Q i7-9750H, GeForce RTX 2080 Max-Q, Samsung SSD PM981 MZVLB512HAJQ, IPS, 1920x1080, 15.6" | MSI GS65 8RF-019DE Stealth Thin i7-8750H, GeForce GTX 1070 Max-Q, Samsung SSD PM981 MZVLB512HAJQ, IPS, 1920x1080, 15.6" | Lenovo Legion Y740-15ICHg i7-8750H, GeForce RTX 2070 Max-Q, Samsung SSD PM981 MZVLB256HAHQ, IPS, 1920x1080, 15.6" | Aorus 15 W9 i7-8750H, GeForce RTX 2060 Mobile, Intel SSD 760p SSDPEKKW512G8, IPS, 1920x1080, 15.6" | MSI GE75 9SG i9-9880H, GeForce RTX 2080 Mobile, Samsung SSD PM981 MZVLB1T0HALR, AHVA, 1920x1080, 17.3" | |
|---|---|---|---|---|---|---|
| Power Consumption | 14% | 27% | -2% | 7% | -10% | |
| Idle Minimum * (Watt) | 18.3 | 12.5 32% | 7 62% | 22.9 -25% | 18 2% | 13.9 24% |
| Idle Average * (Watt) | 22 | 15.3 30% | 11 50% | 27.2 -24% | 20 9% | 18.8 15% |
| Idle Maximum * (Watt) | 28.8 | 20.7 28% | 20 31% | 27.5 5% | 28 3% | 23.1 20% |
| Load Average * (Watt) | 93 | 90.2 3% | 98 -5% | 83.4 10% | 87 6% | 112.3 -21% |
| Witcher 3 ultra * (Watt) | 142.6 | 162 -14% | 132 7% | 143.6 -1% | 135 5% | 231 -62% |
| Load Maximum * (Watt) | 215.9 | 209.3 3% | 182 16% | 160.5 26% | 175 19% | 291.5 -35% |
* ... smaller is better
Battery Life
Runtimes are identical to last year's GS65 8RF even though CPU and GPU performance is greater. Users can expect 6 hours of constant WLAN use when set to the Balanced profile with the integrated GPU active.
Charging from empty to full capacity is slower than expected at 2 to 2.5 hours compared to just 1.5 hours on most other laptops.
| MSI GS65 Stealth 9SG i7-9750H, GeForce RTX 2080 Max-Q, 82 Wh | Razer Blade 15 RTX 2080 Max-Q i7-9750H, GeForce RTX 2080 Max-Q, 80 Wh | Lenovo Legion Y740-15ICHg i7-8750H, GeForce RTX 2070 Max-Q, 57 Wh | Alienware m15 GTX 1070 Max-Q i7-8750H, GeForce GTX 1070 Max-Q, 90 Wh | MSI GS65 8RF-019DE Stealth Thin i7-8750H, GeForce GTX 1070 Max-Q, 82 Wh | Asus Zephyrus S GX531GX i7-8750H, GeForce RTX 2080 Max-Q, 50 Wh | |
|---|---|---|---|---|---|---|
| Battery runtime | 10% | -53% | 28% | 0% | -50% | |
| WiFi v1.3 (h) | 6 | 6.6 10% | 2.8 -53% | 7.7 28% | 6 0% | 3 -50% |
| Reader / Idle (h) | 15.9 | 3.9 | 10.5 | 8.5 | ||
| Load (h) | 1.7 | 0.8 | 1.7 | 1.4 |
Pros
Cons
Verdict

If you want the best gaming experience from the GS65, then there's no question that the 240 Hz display SKU with RTX 2080 Max-Q graphics is going to deliver. Everything we praised and criticized about the GS65 in the past still apply here for this latest 2019 refresh including the lightweight design, difficult serviceability, respectable battery life, and mediocre rigidity.
For the best bang for the buck, however, the 240 Hz display and the RTX 2080 Max-Q GPU may not be the best option. The difference between the base 144 Hz panel and the faster 240 Hz panel is difficult to notice while the RTX 2080 Max-Q is merely up to 8 percent faster than the RTX 2070 Max-Q. You can save yourself nearly $900 USD by going with the 144 Hz, RTX 2070 Max-Q, and i7-8750H SKU instead of the 240 Hz, RTX 2080 Max-Q, and i7-9750H SKU without sacrificing all that much gaming performance.
The RTX 2080 Max-Q is less than 10 percent faster than the RTX 2070 Max-Q and yet it costs about $500 more. It's a high price to pay if you want the fastest GPU performance possible from the GS65 series.
MSI GS65 Stealth 9SG
- 09/20/2019 v7 (old)
Allen Ngo
Price comparison
