Notebookcheck Logo

MSI RTX 2080 Gaming X Trio Desktop Graphics Card Review

Pricey, but fast! Both the GeForce RTX 2080 and the GeForce RTX 2070 have the same amount of VRAM. However, the RTX 2080 offers somewhat more performance than the RTX 2070. We have run a bevy of benchmarks using the Turing-based GPU from MSI to assess its performance. Continue reading our review to find out whether or not the MSI RTX 2080 Gaming X Trio is worth buying.
GPU-Z
GPU-Z

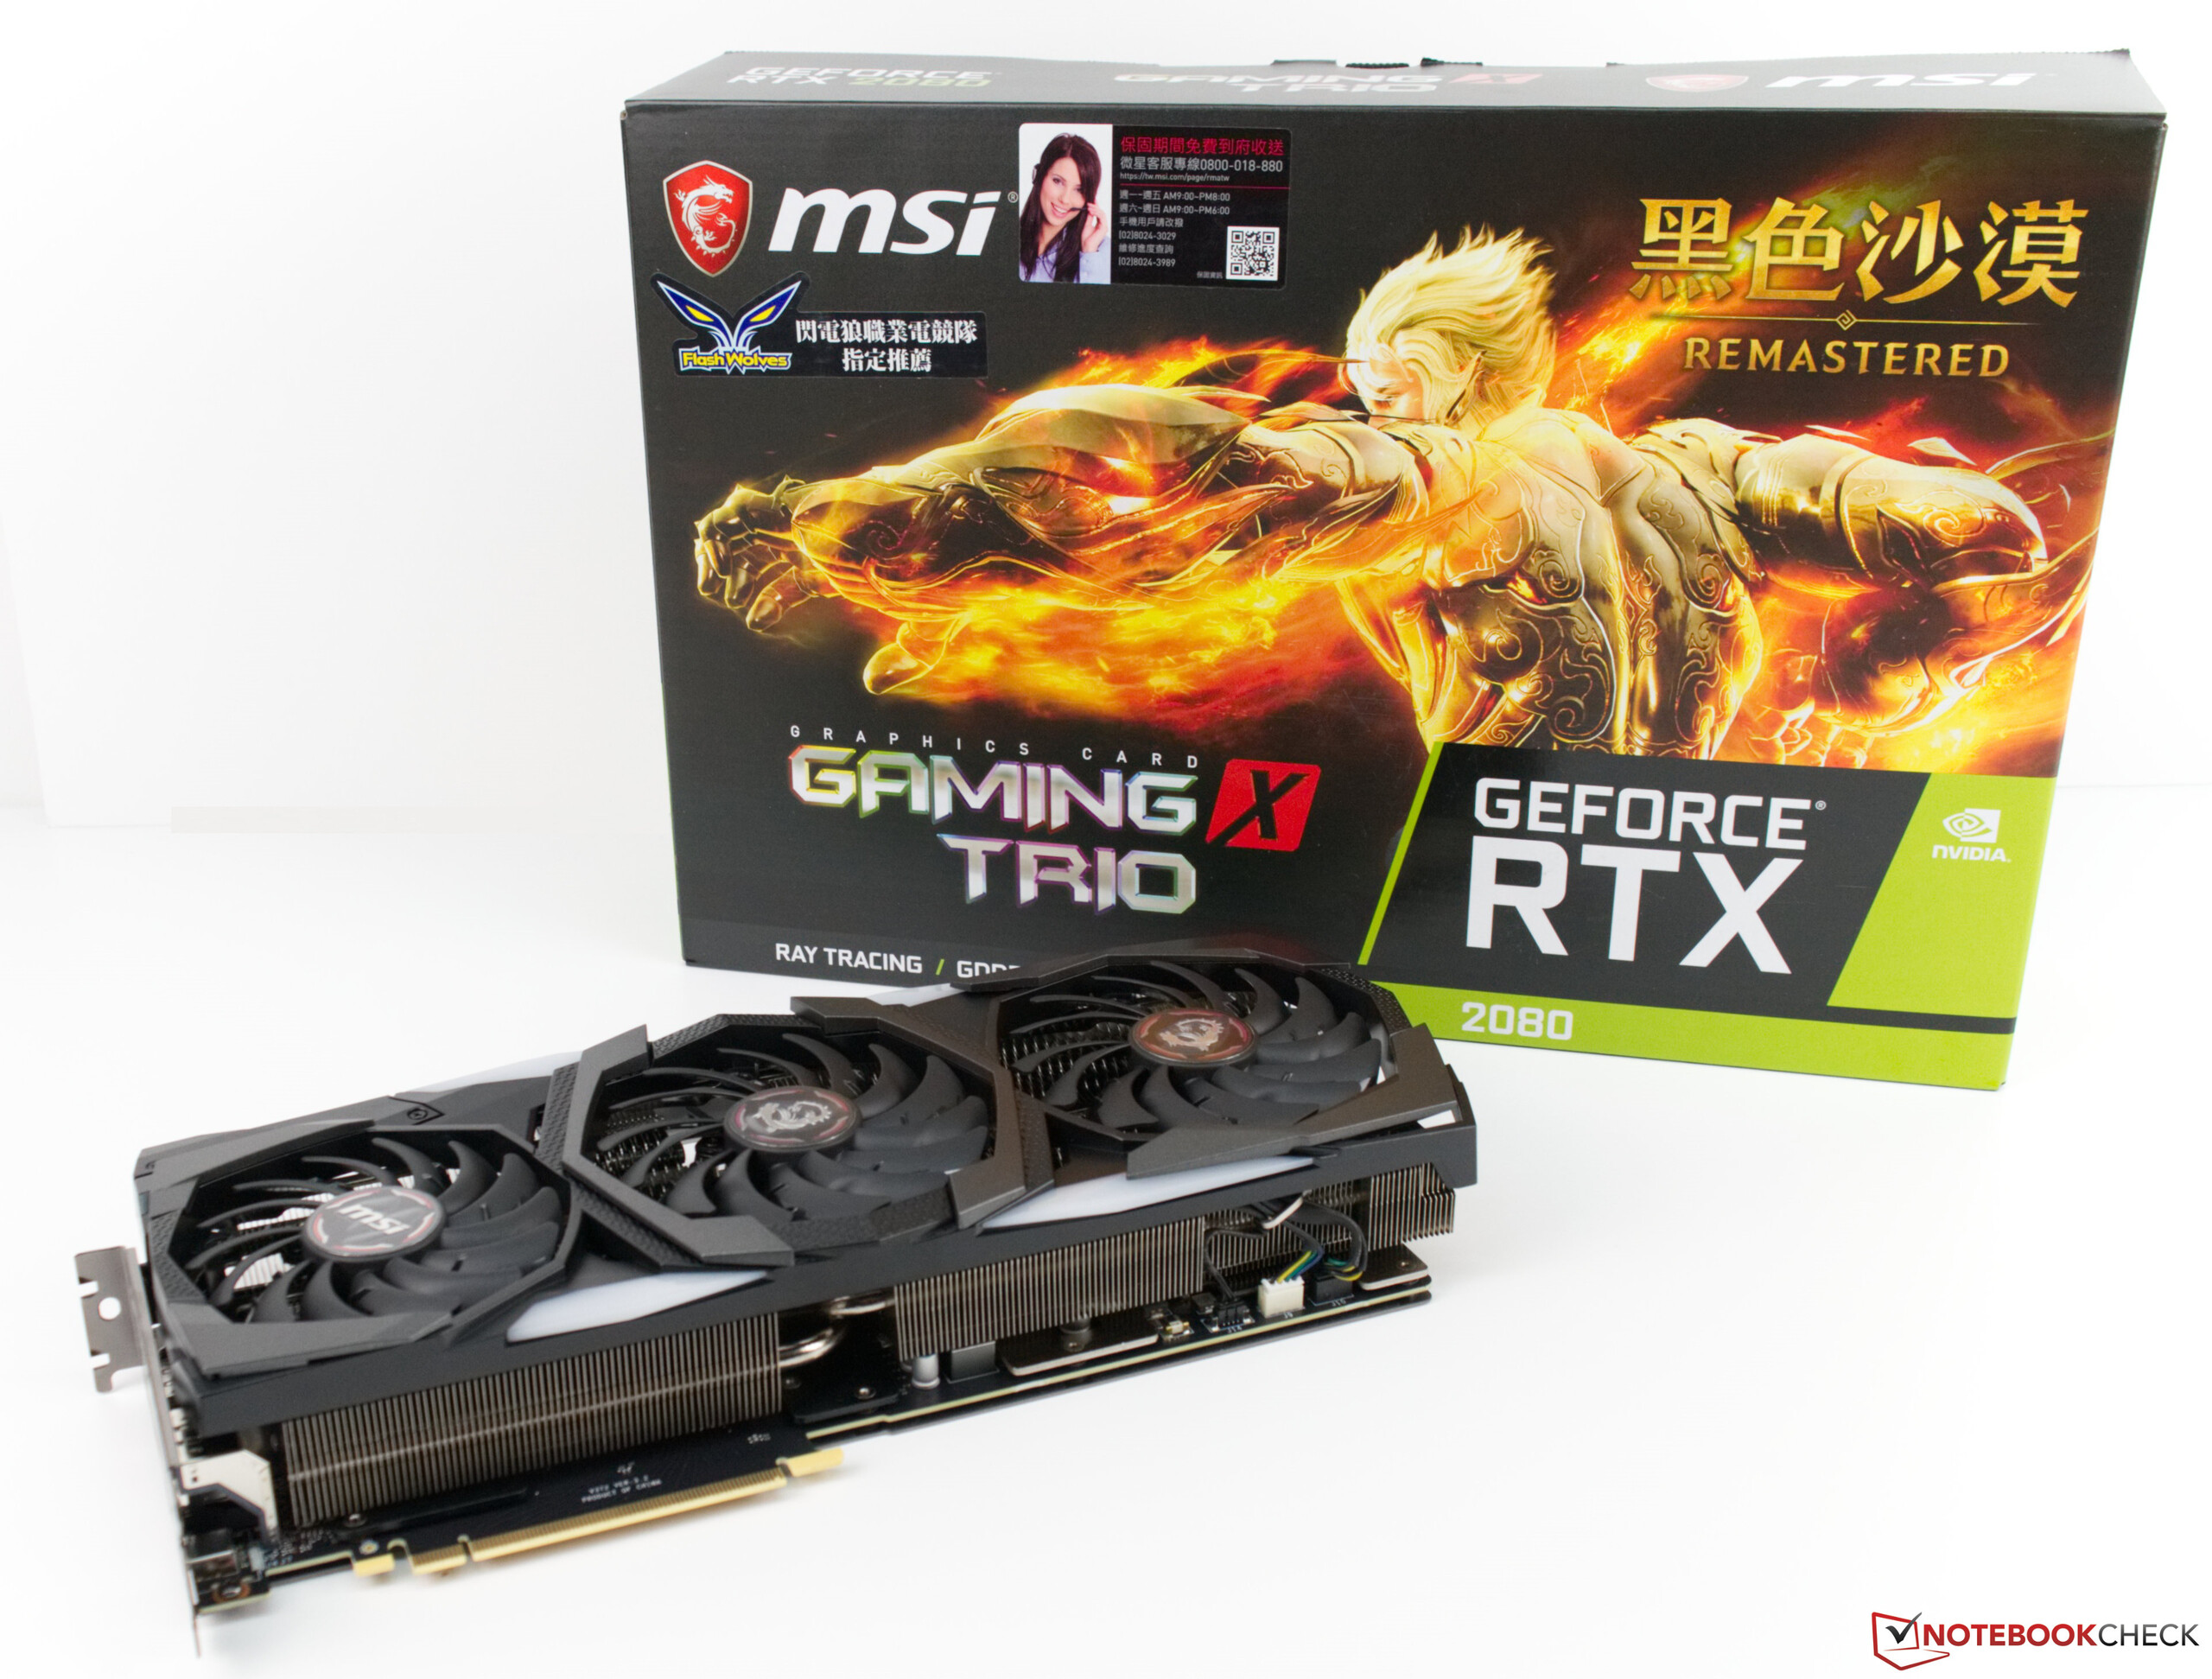
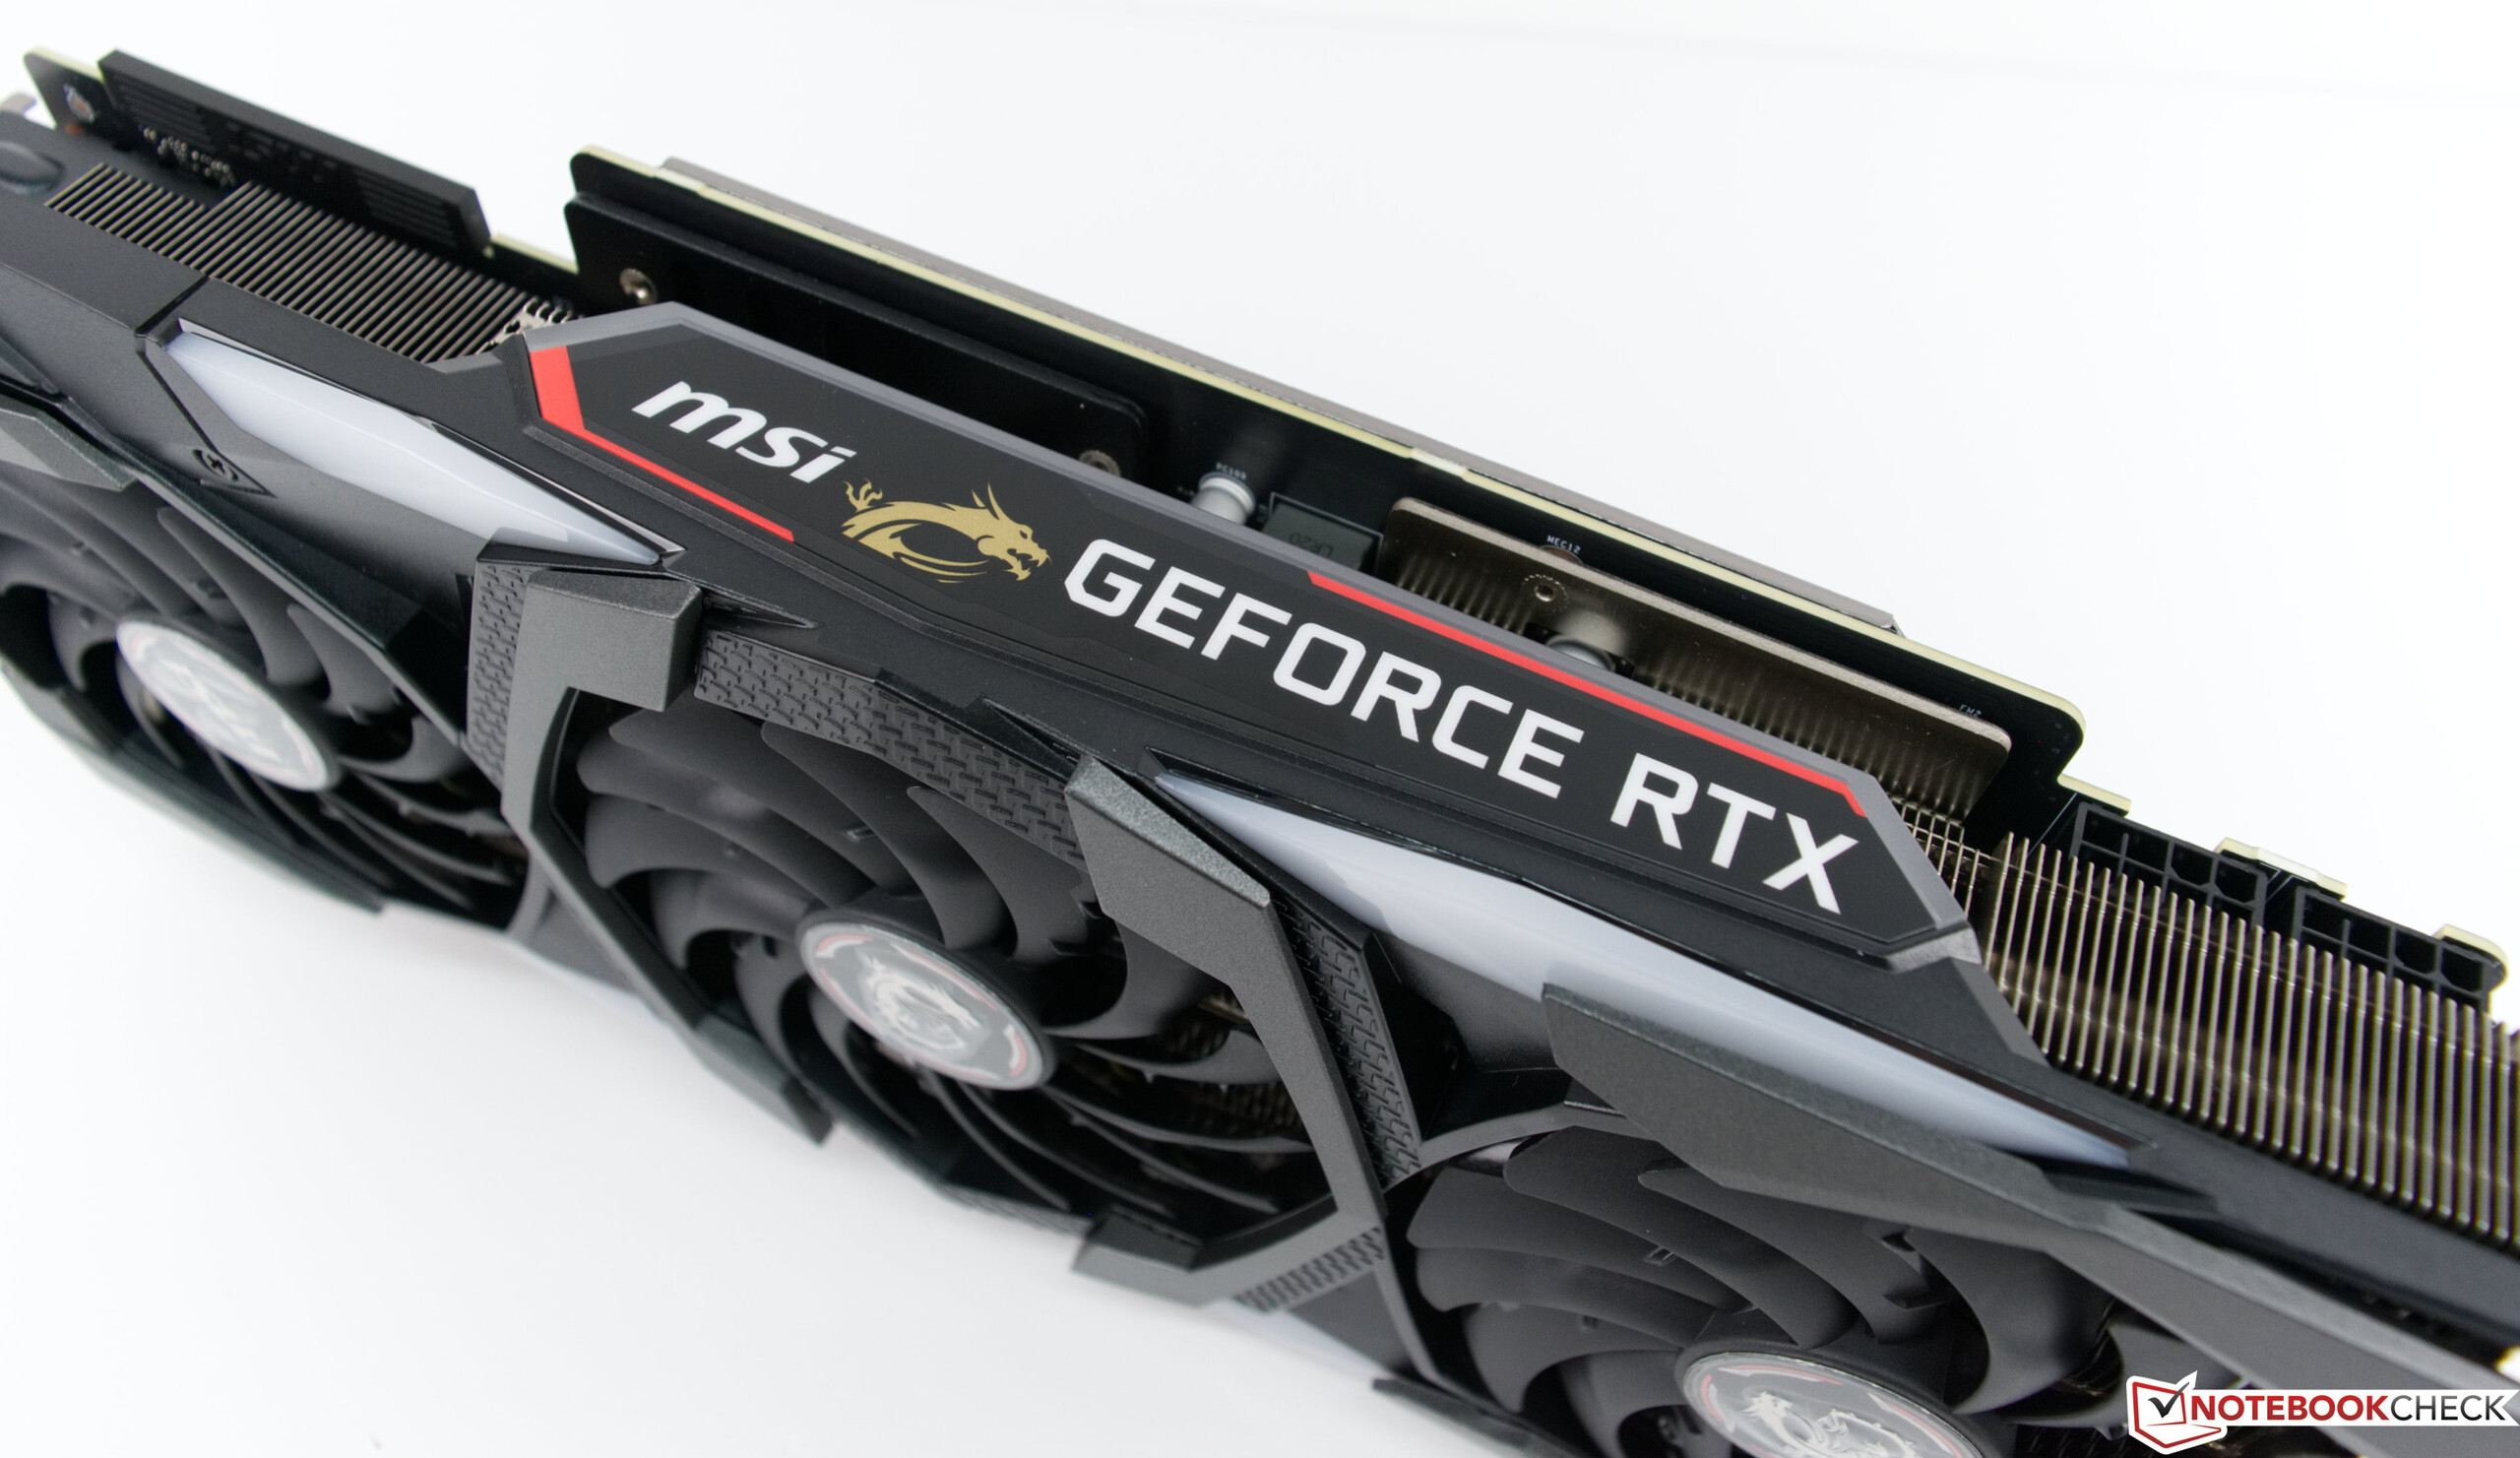
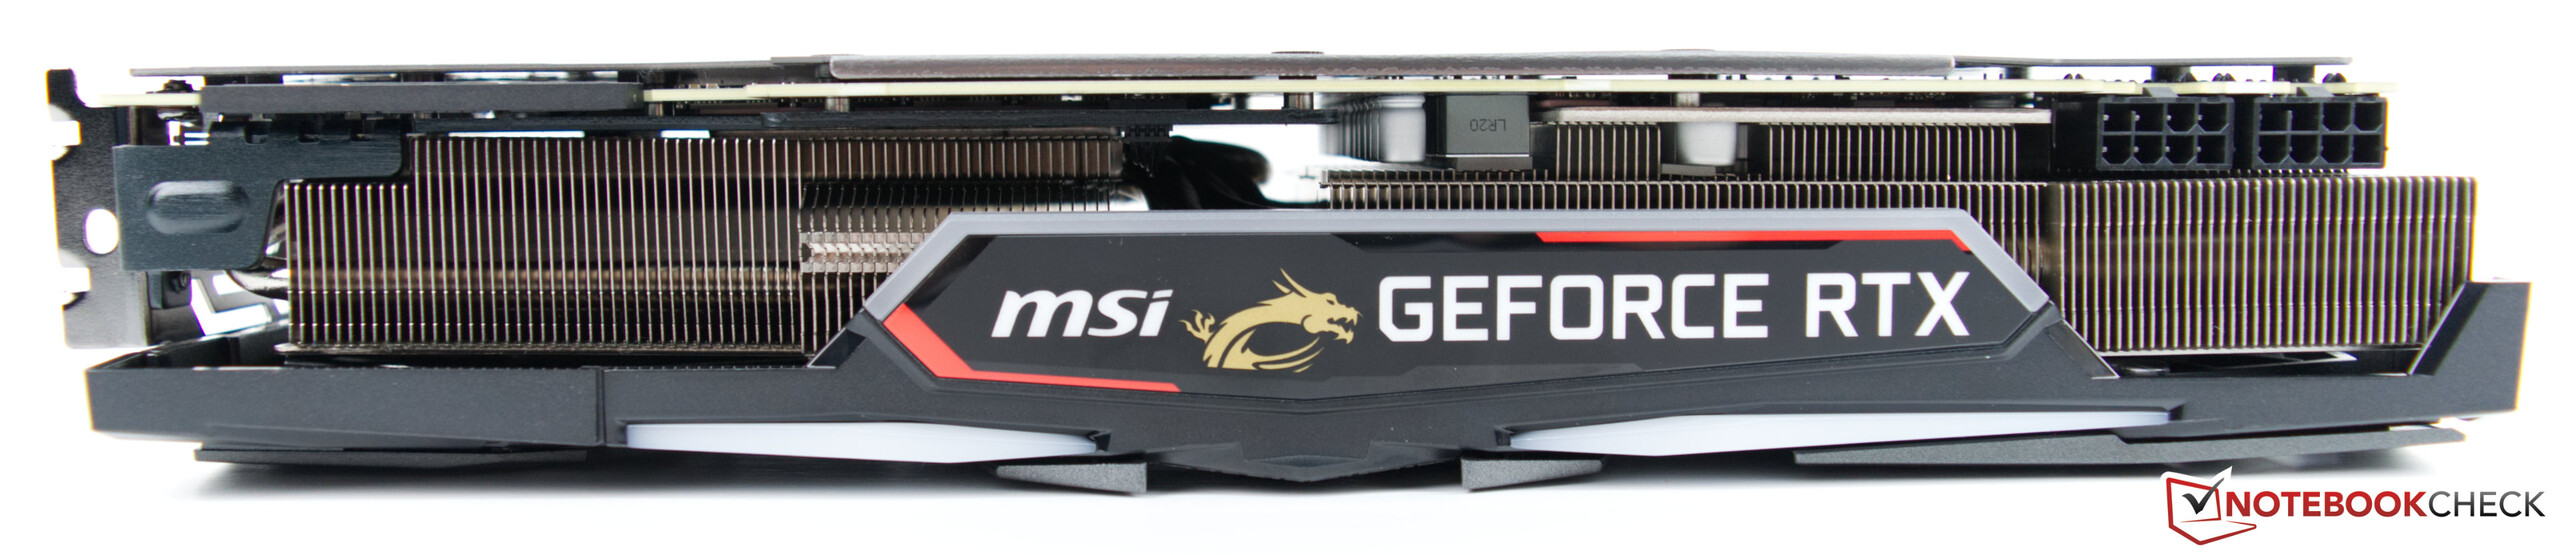
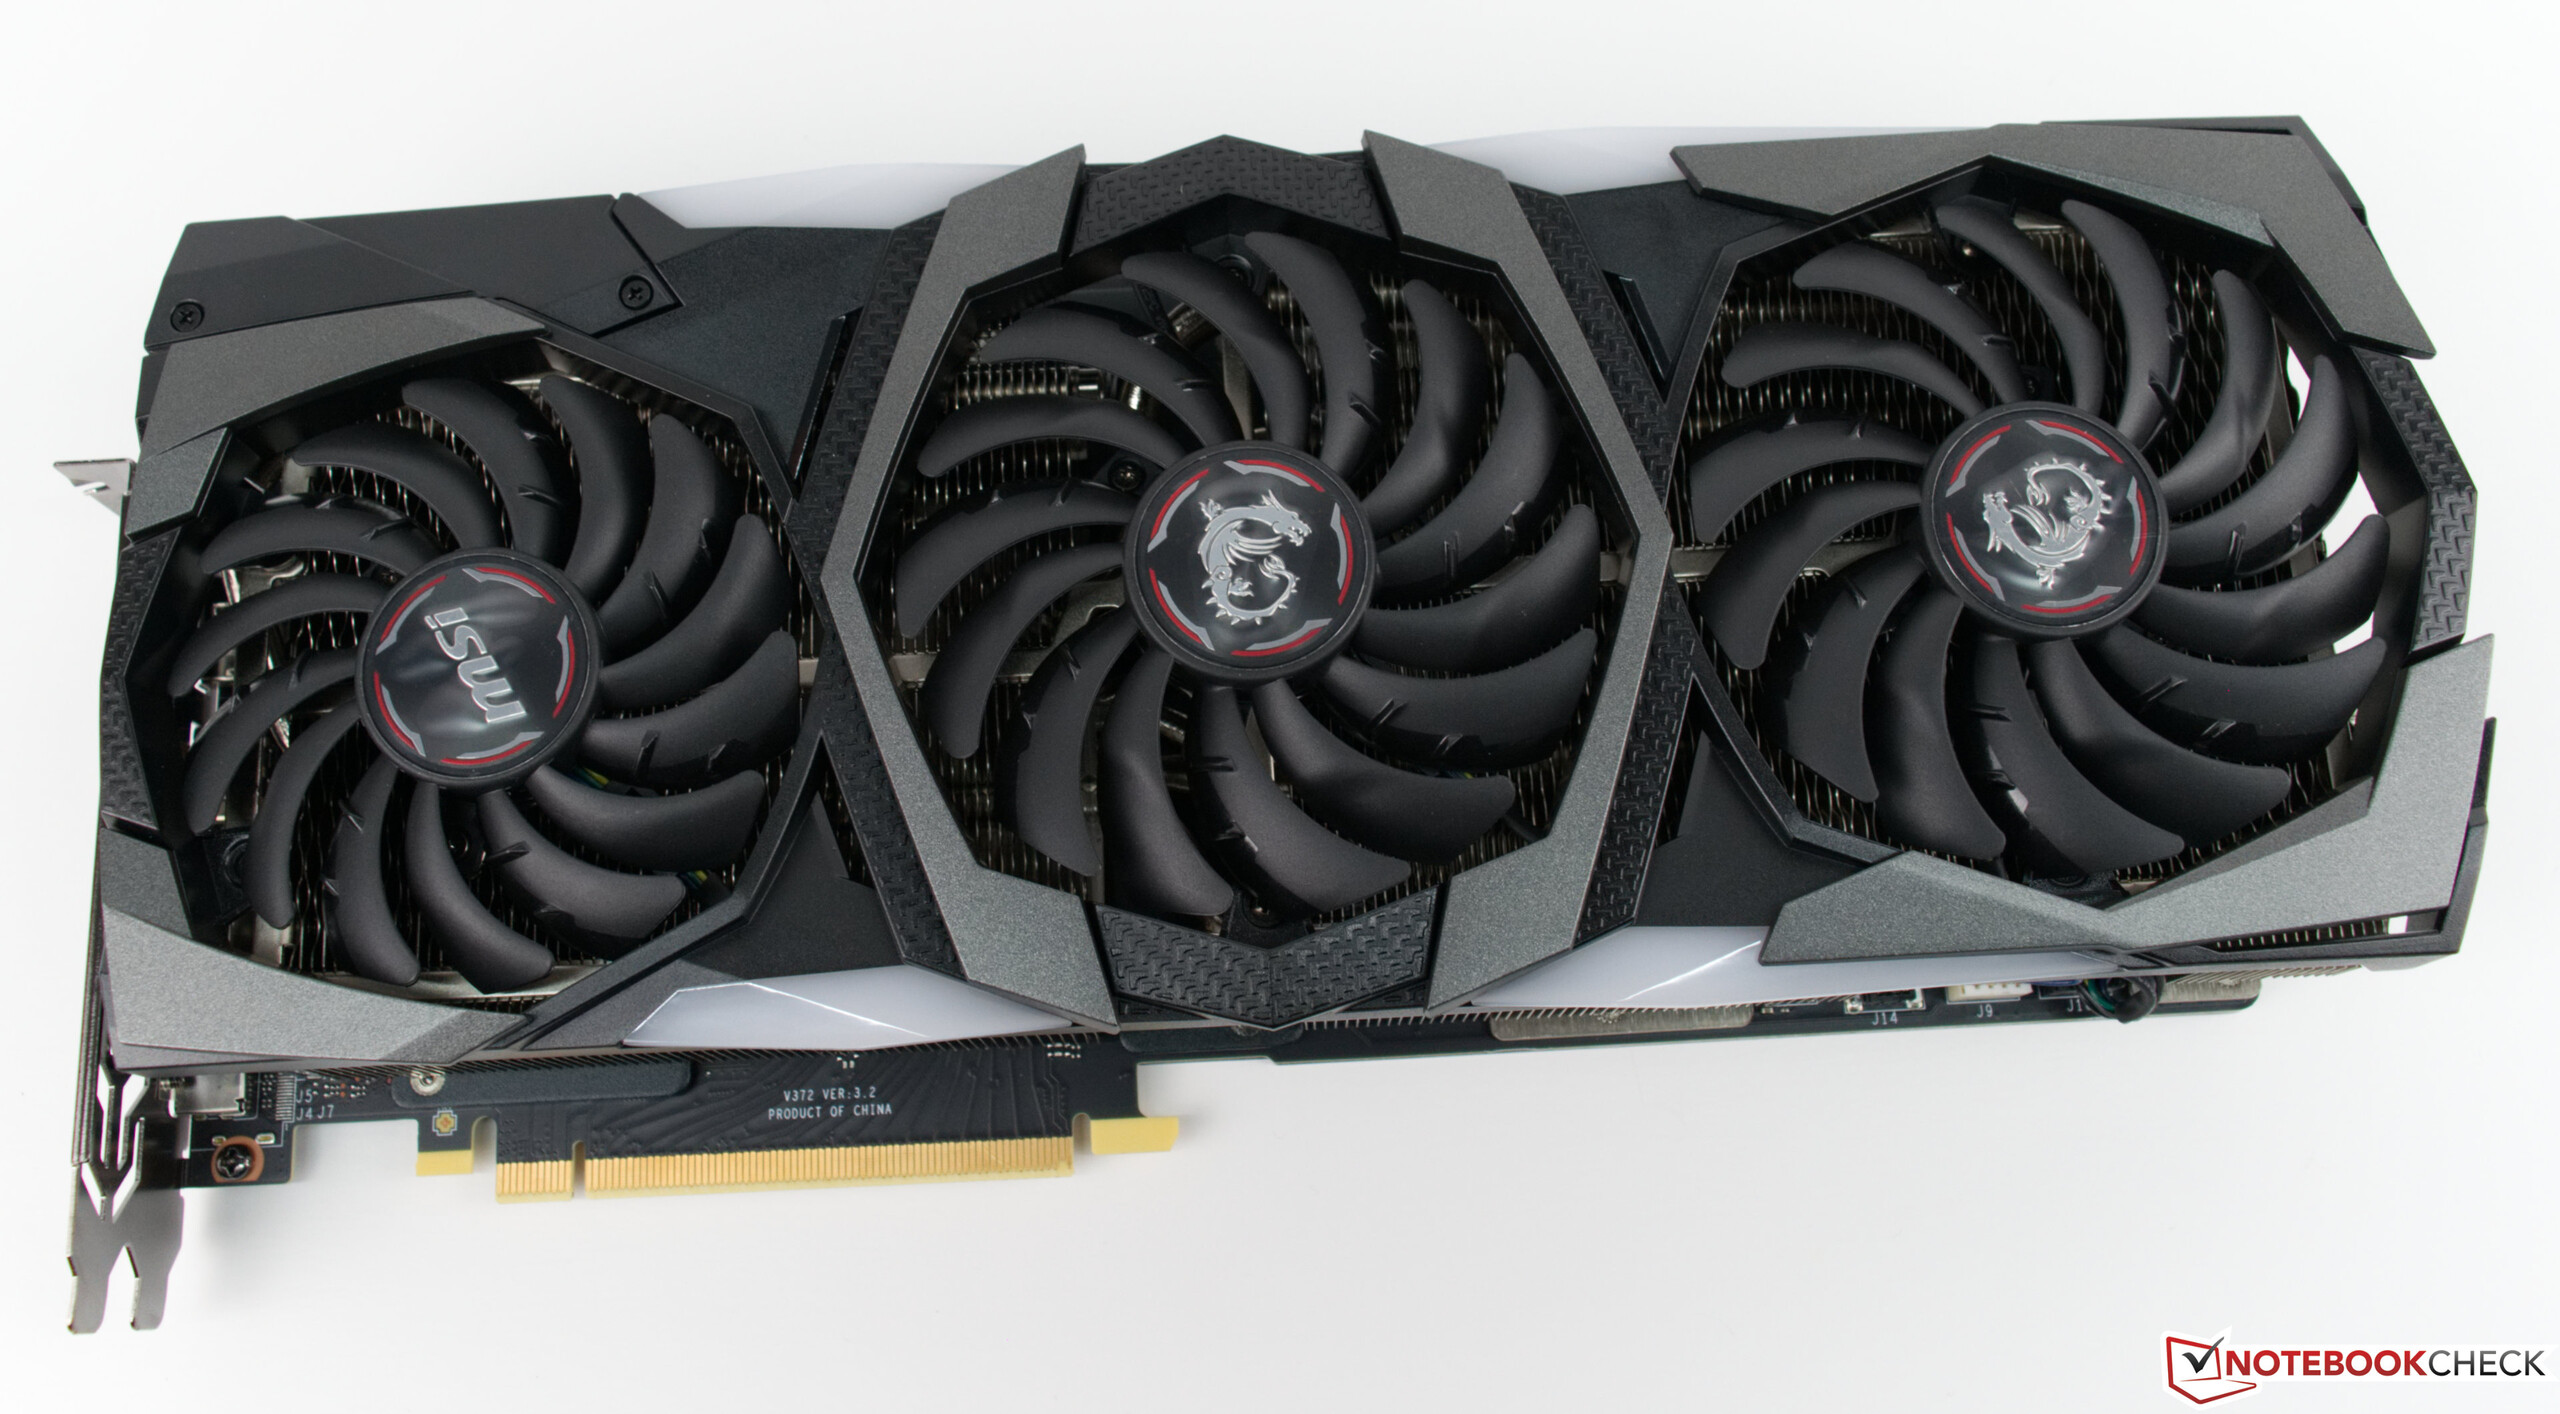
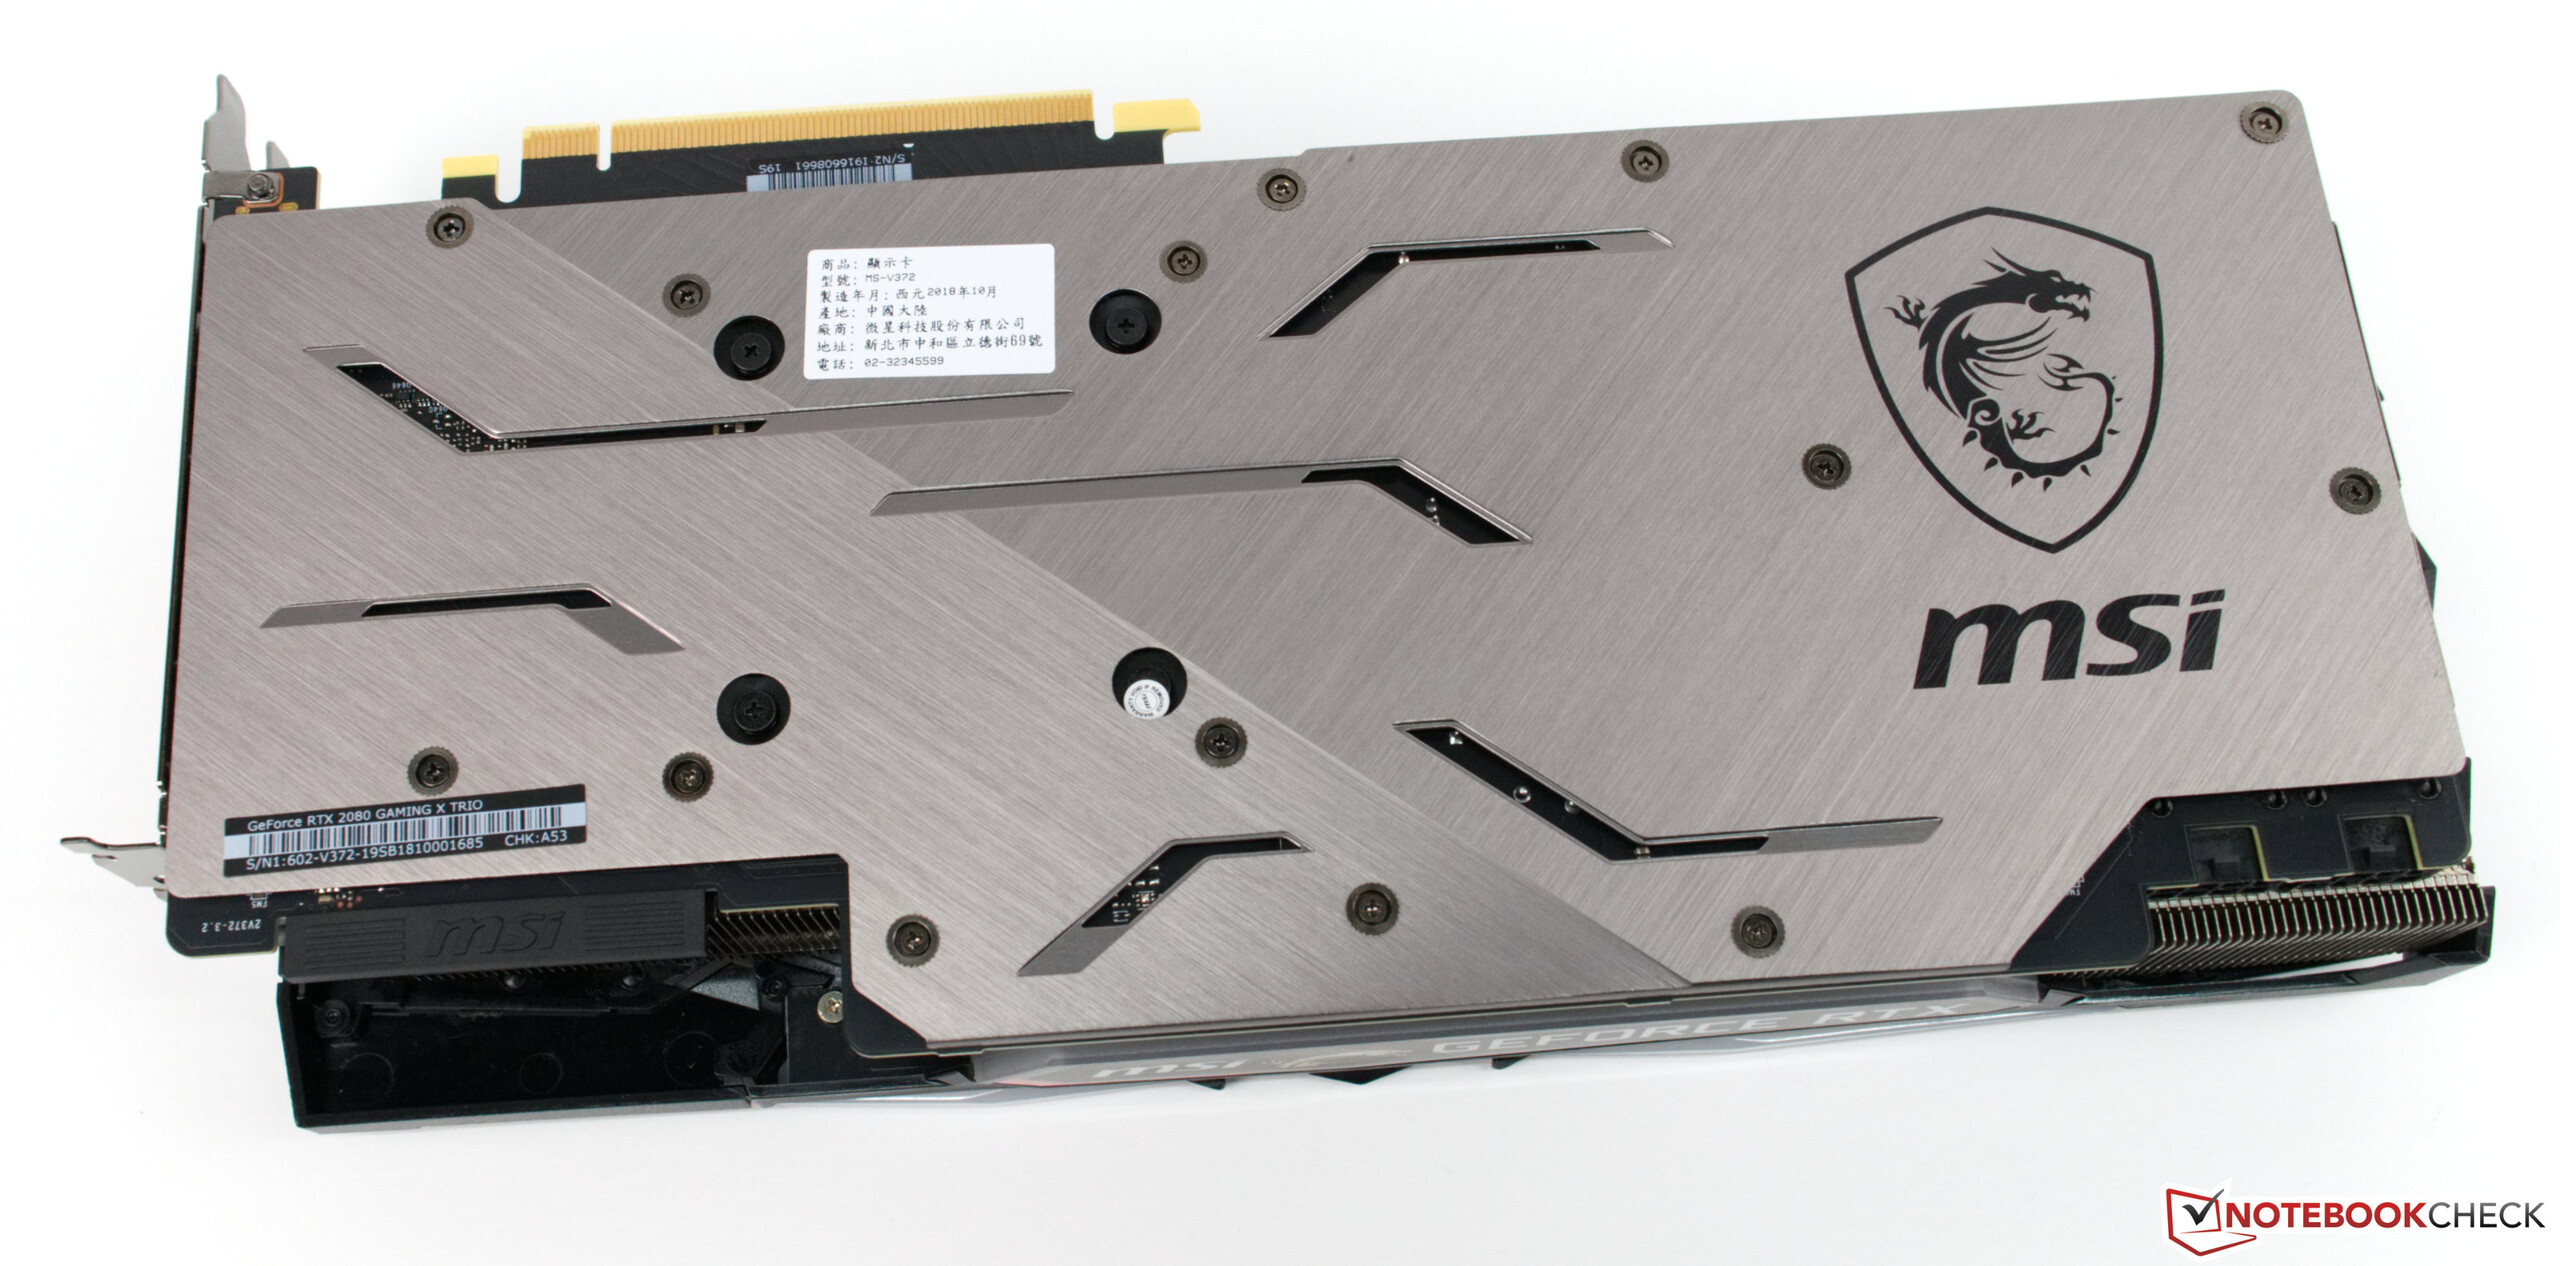
The MSI RTX 2080 Gaming X Trio is the third GPU that we have received from the Taiwanese manufacturer MSI. We are going to thoroughly review this graphics card. MSI’s RTX 2080 has a custom board design and a proprietary cooling solution. The video card also features an increased TDP of 260 watts, which gives it a nice boost in performance when compared to the reference model.

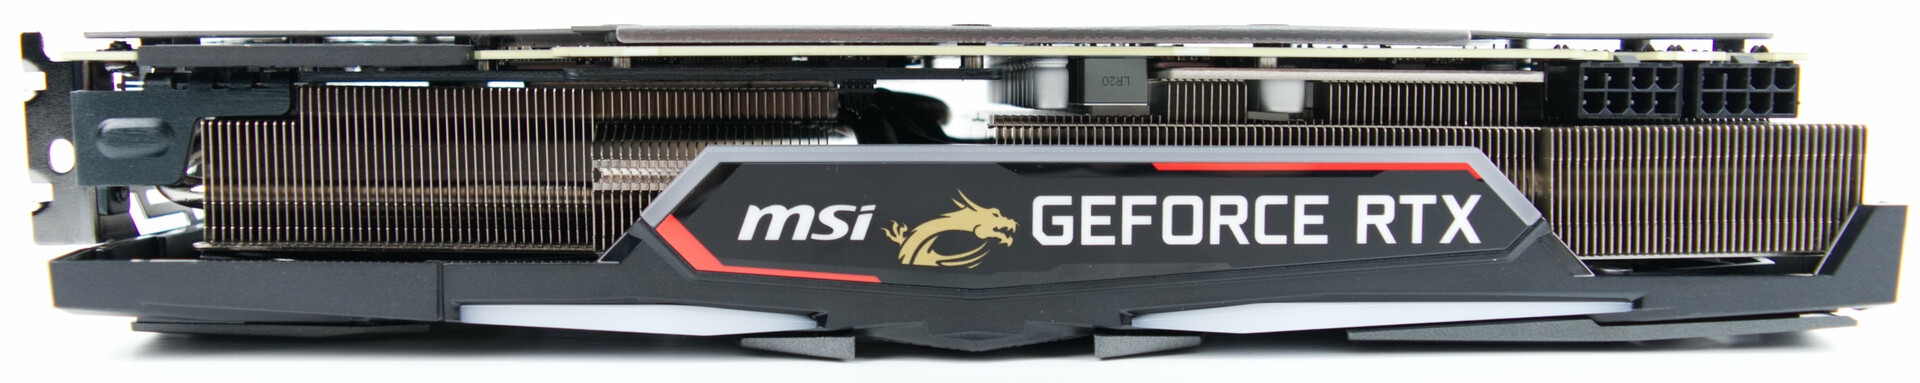
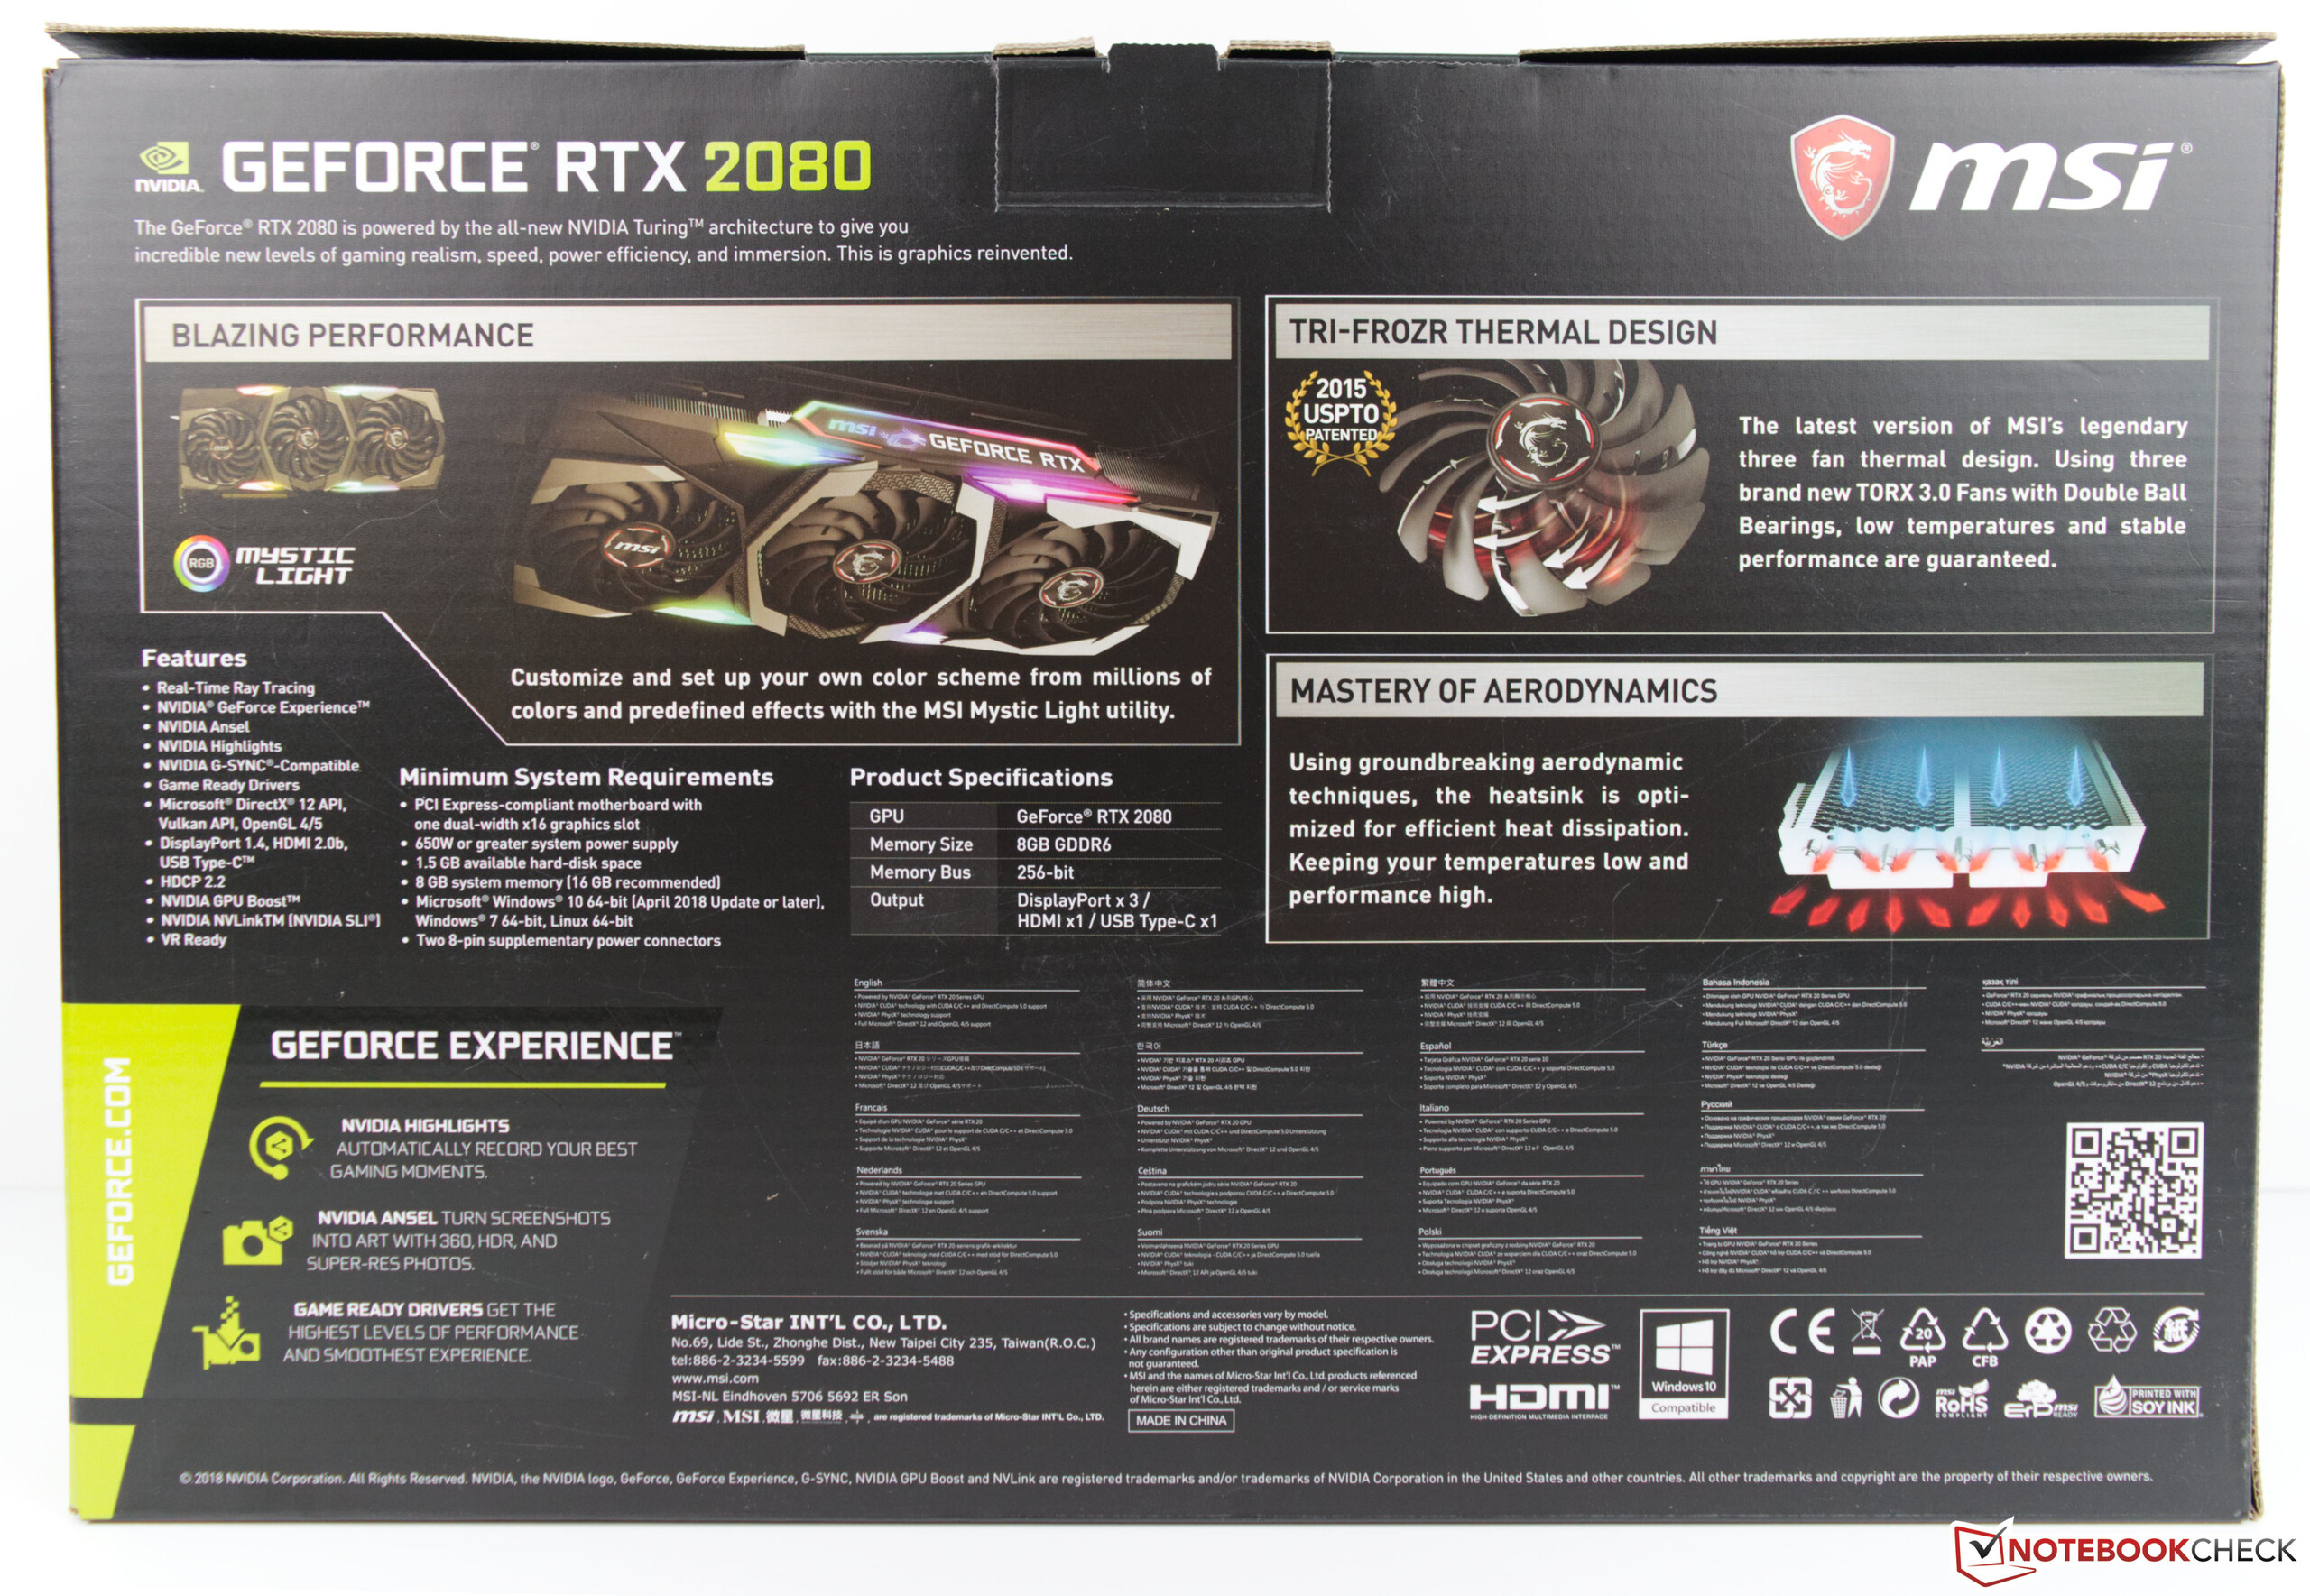
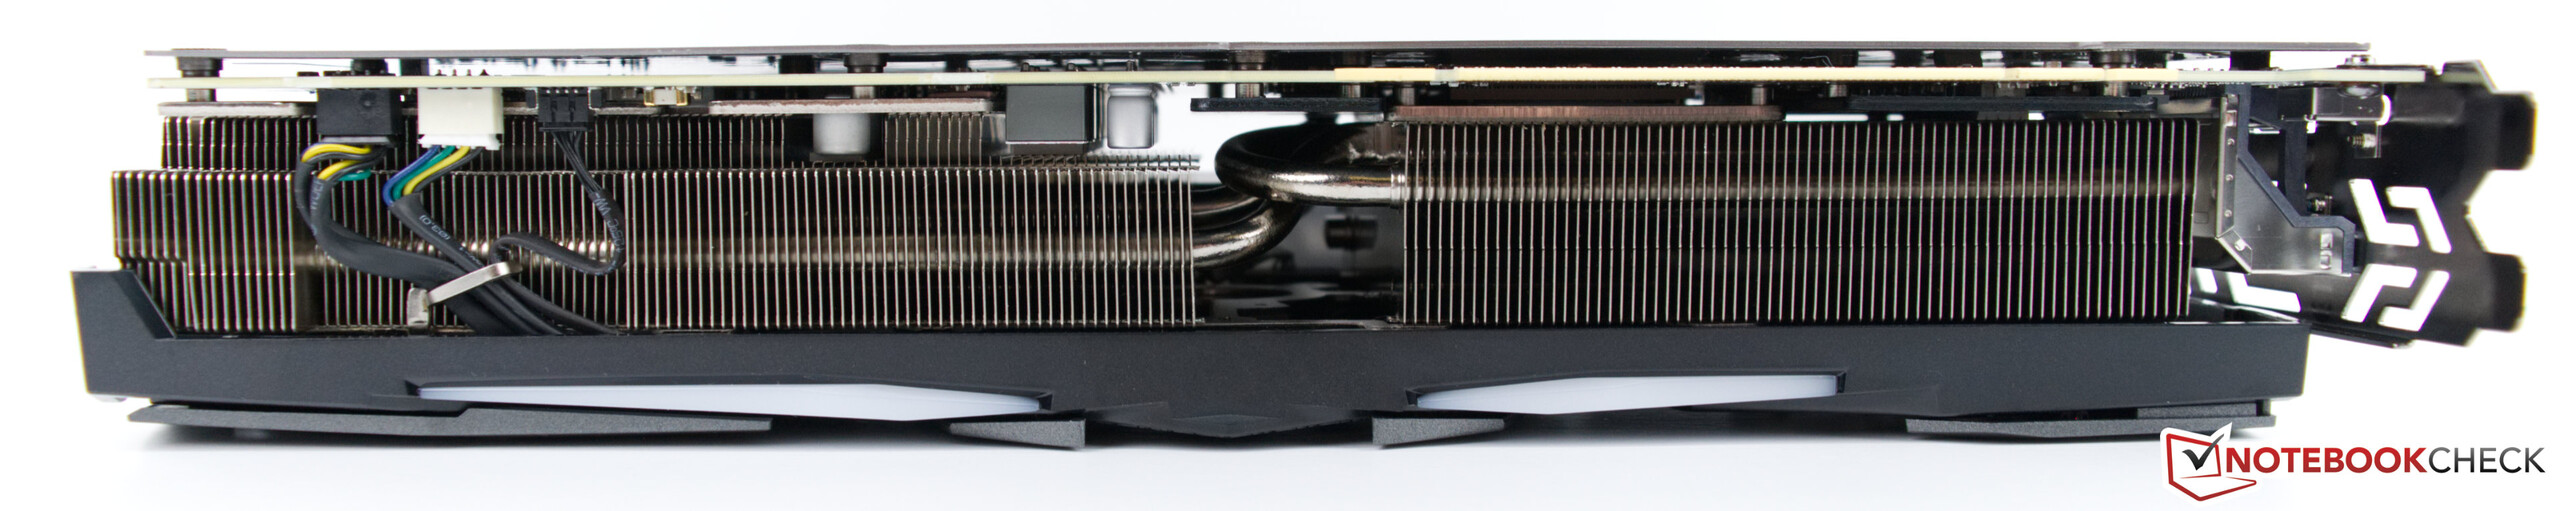
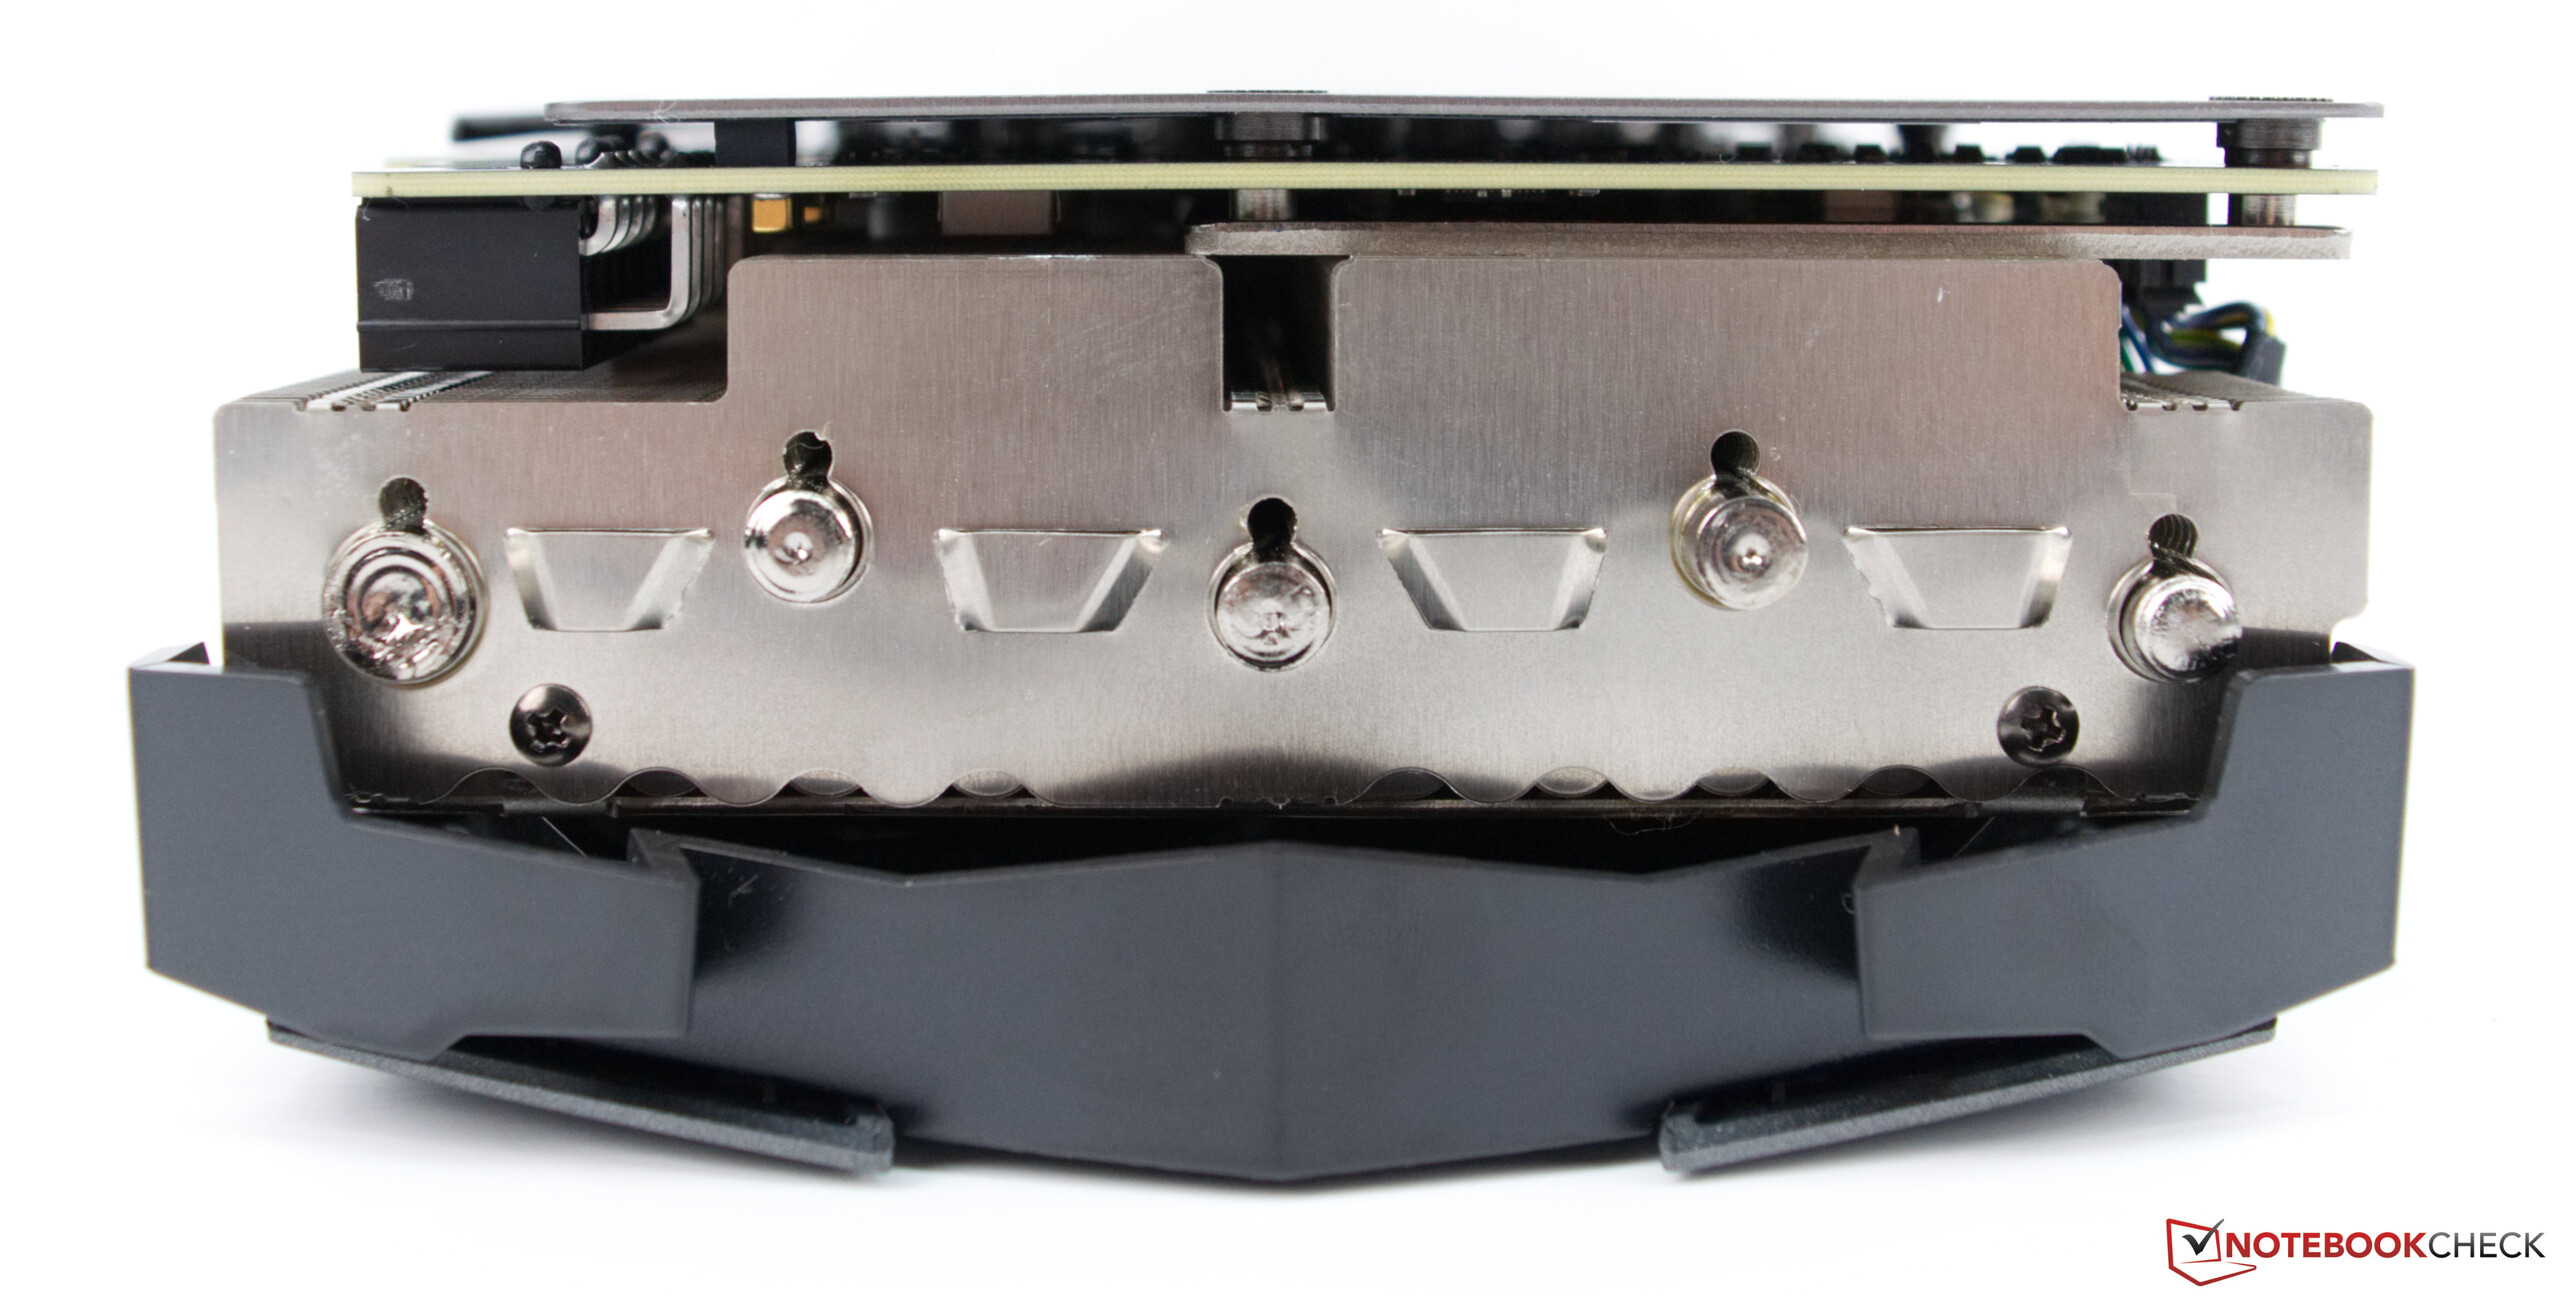
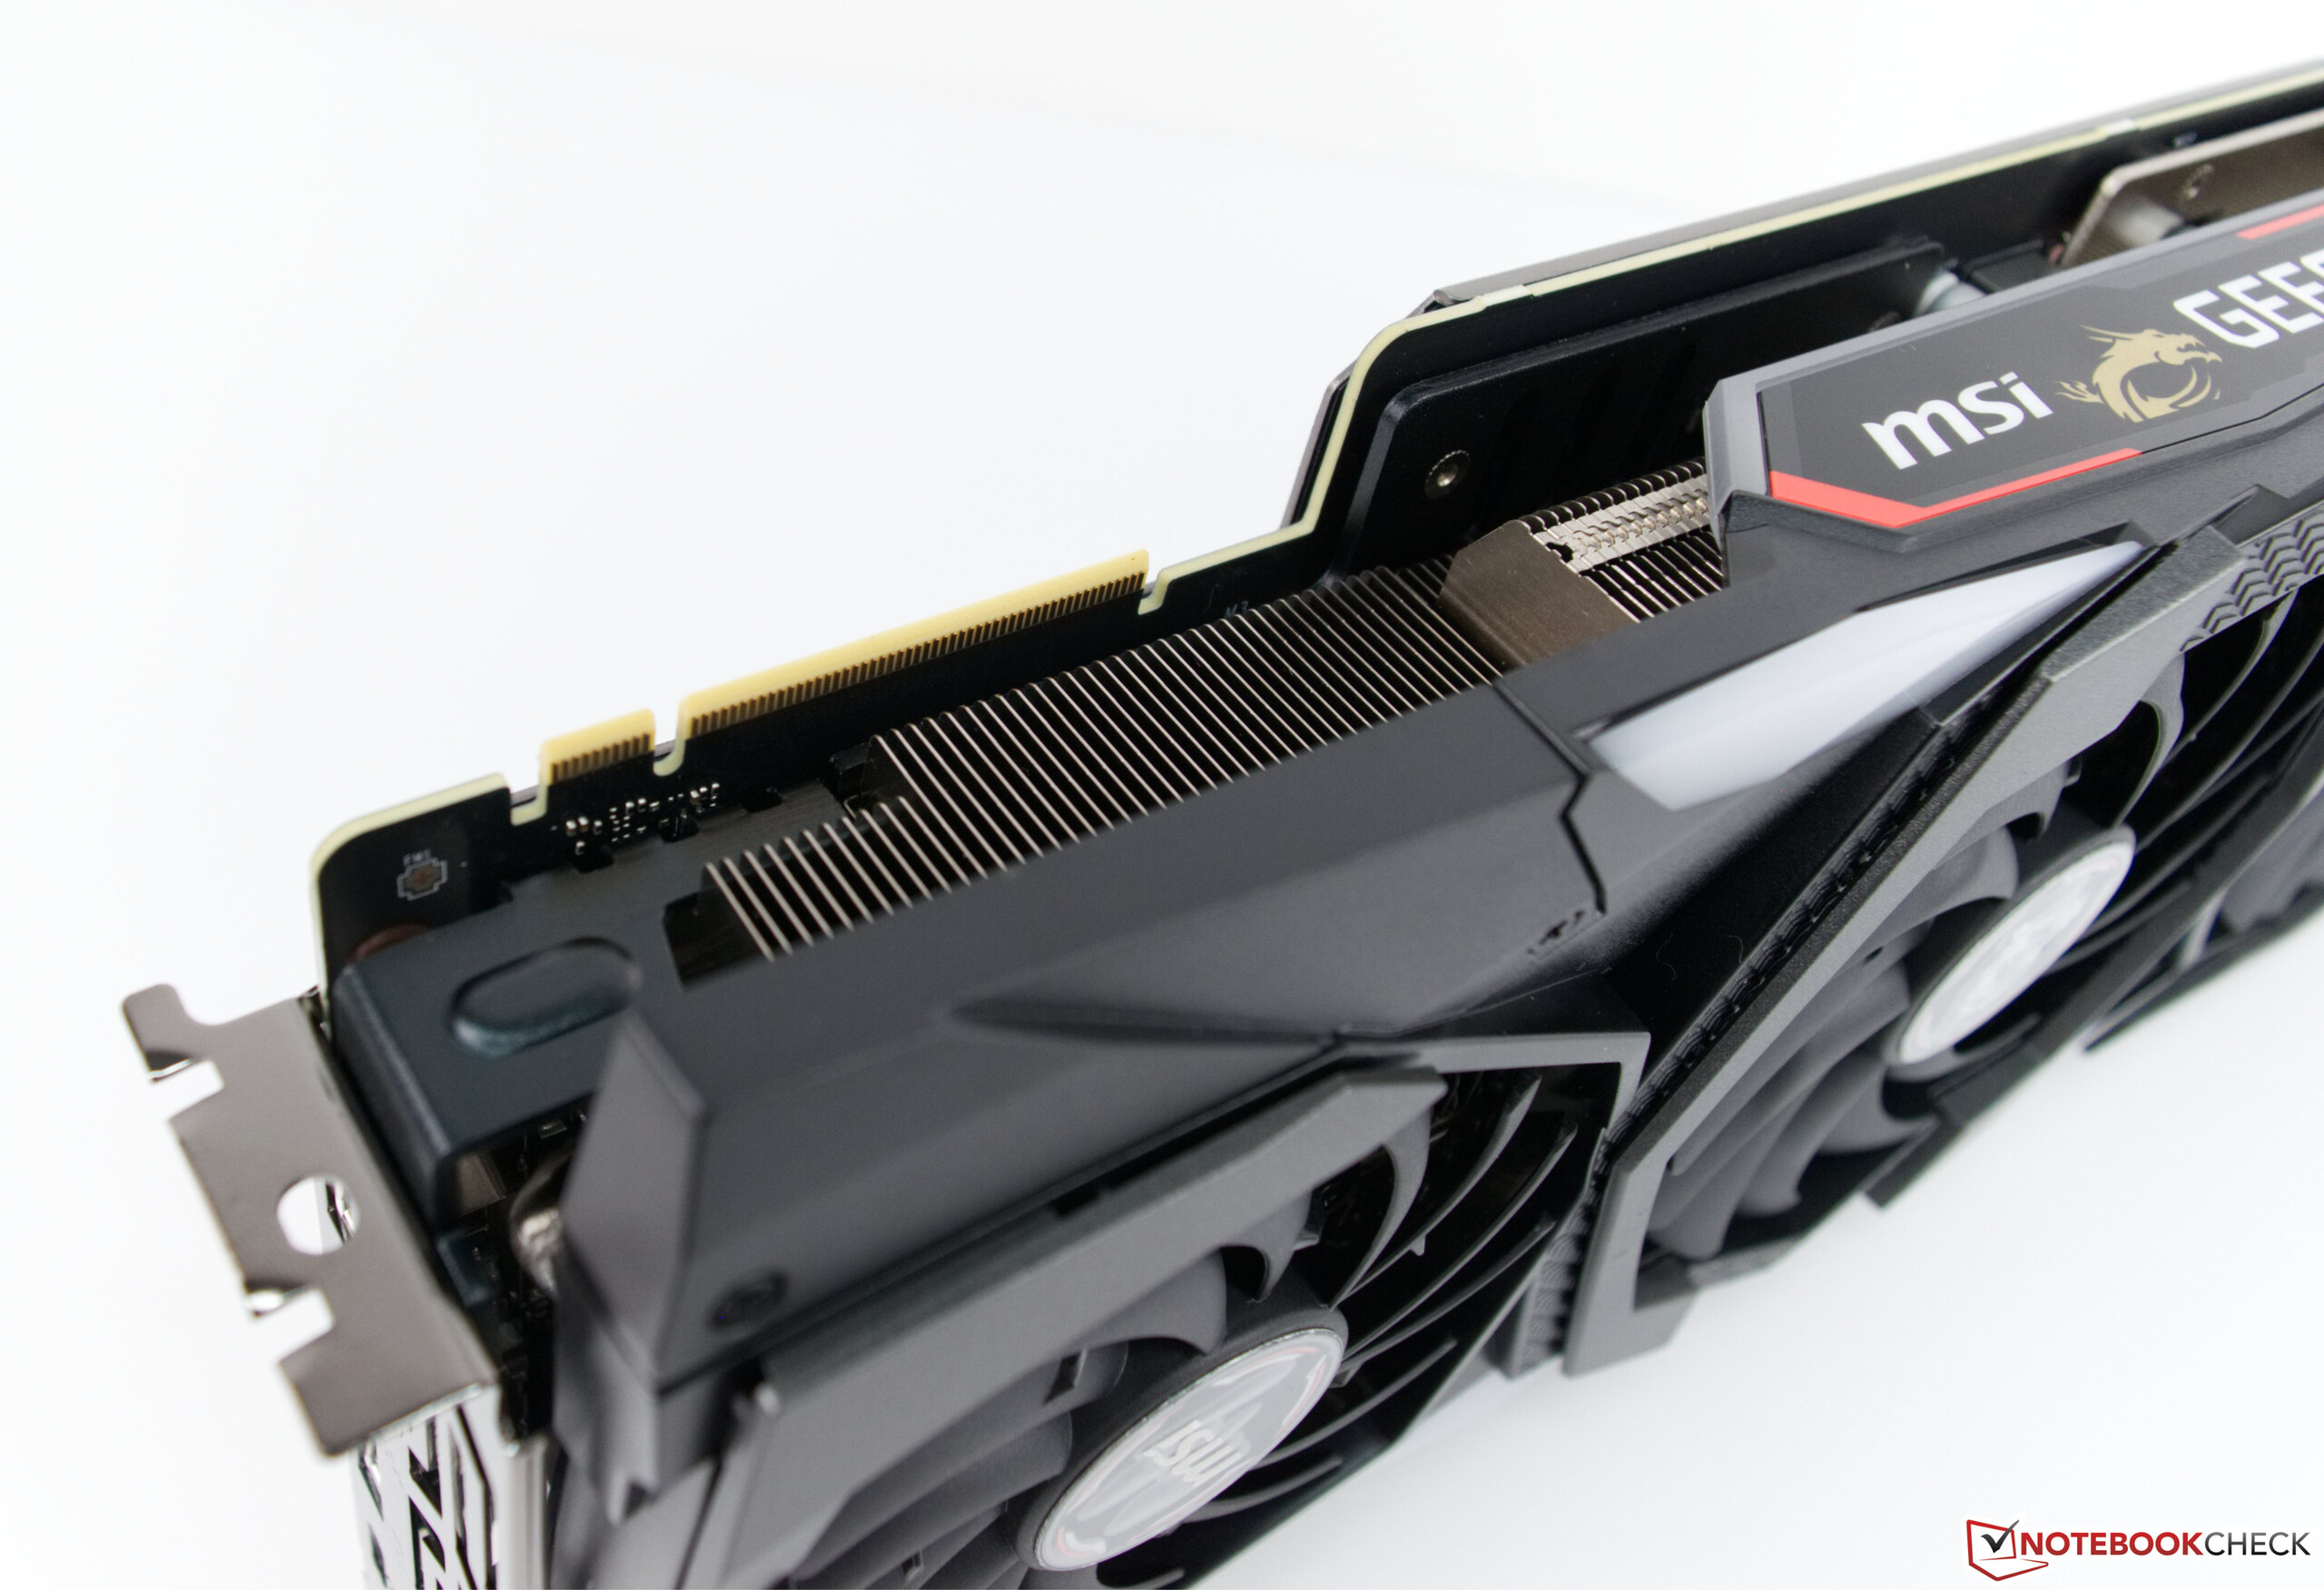
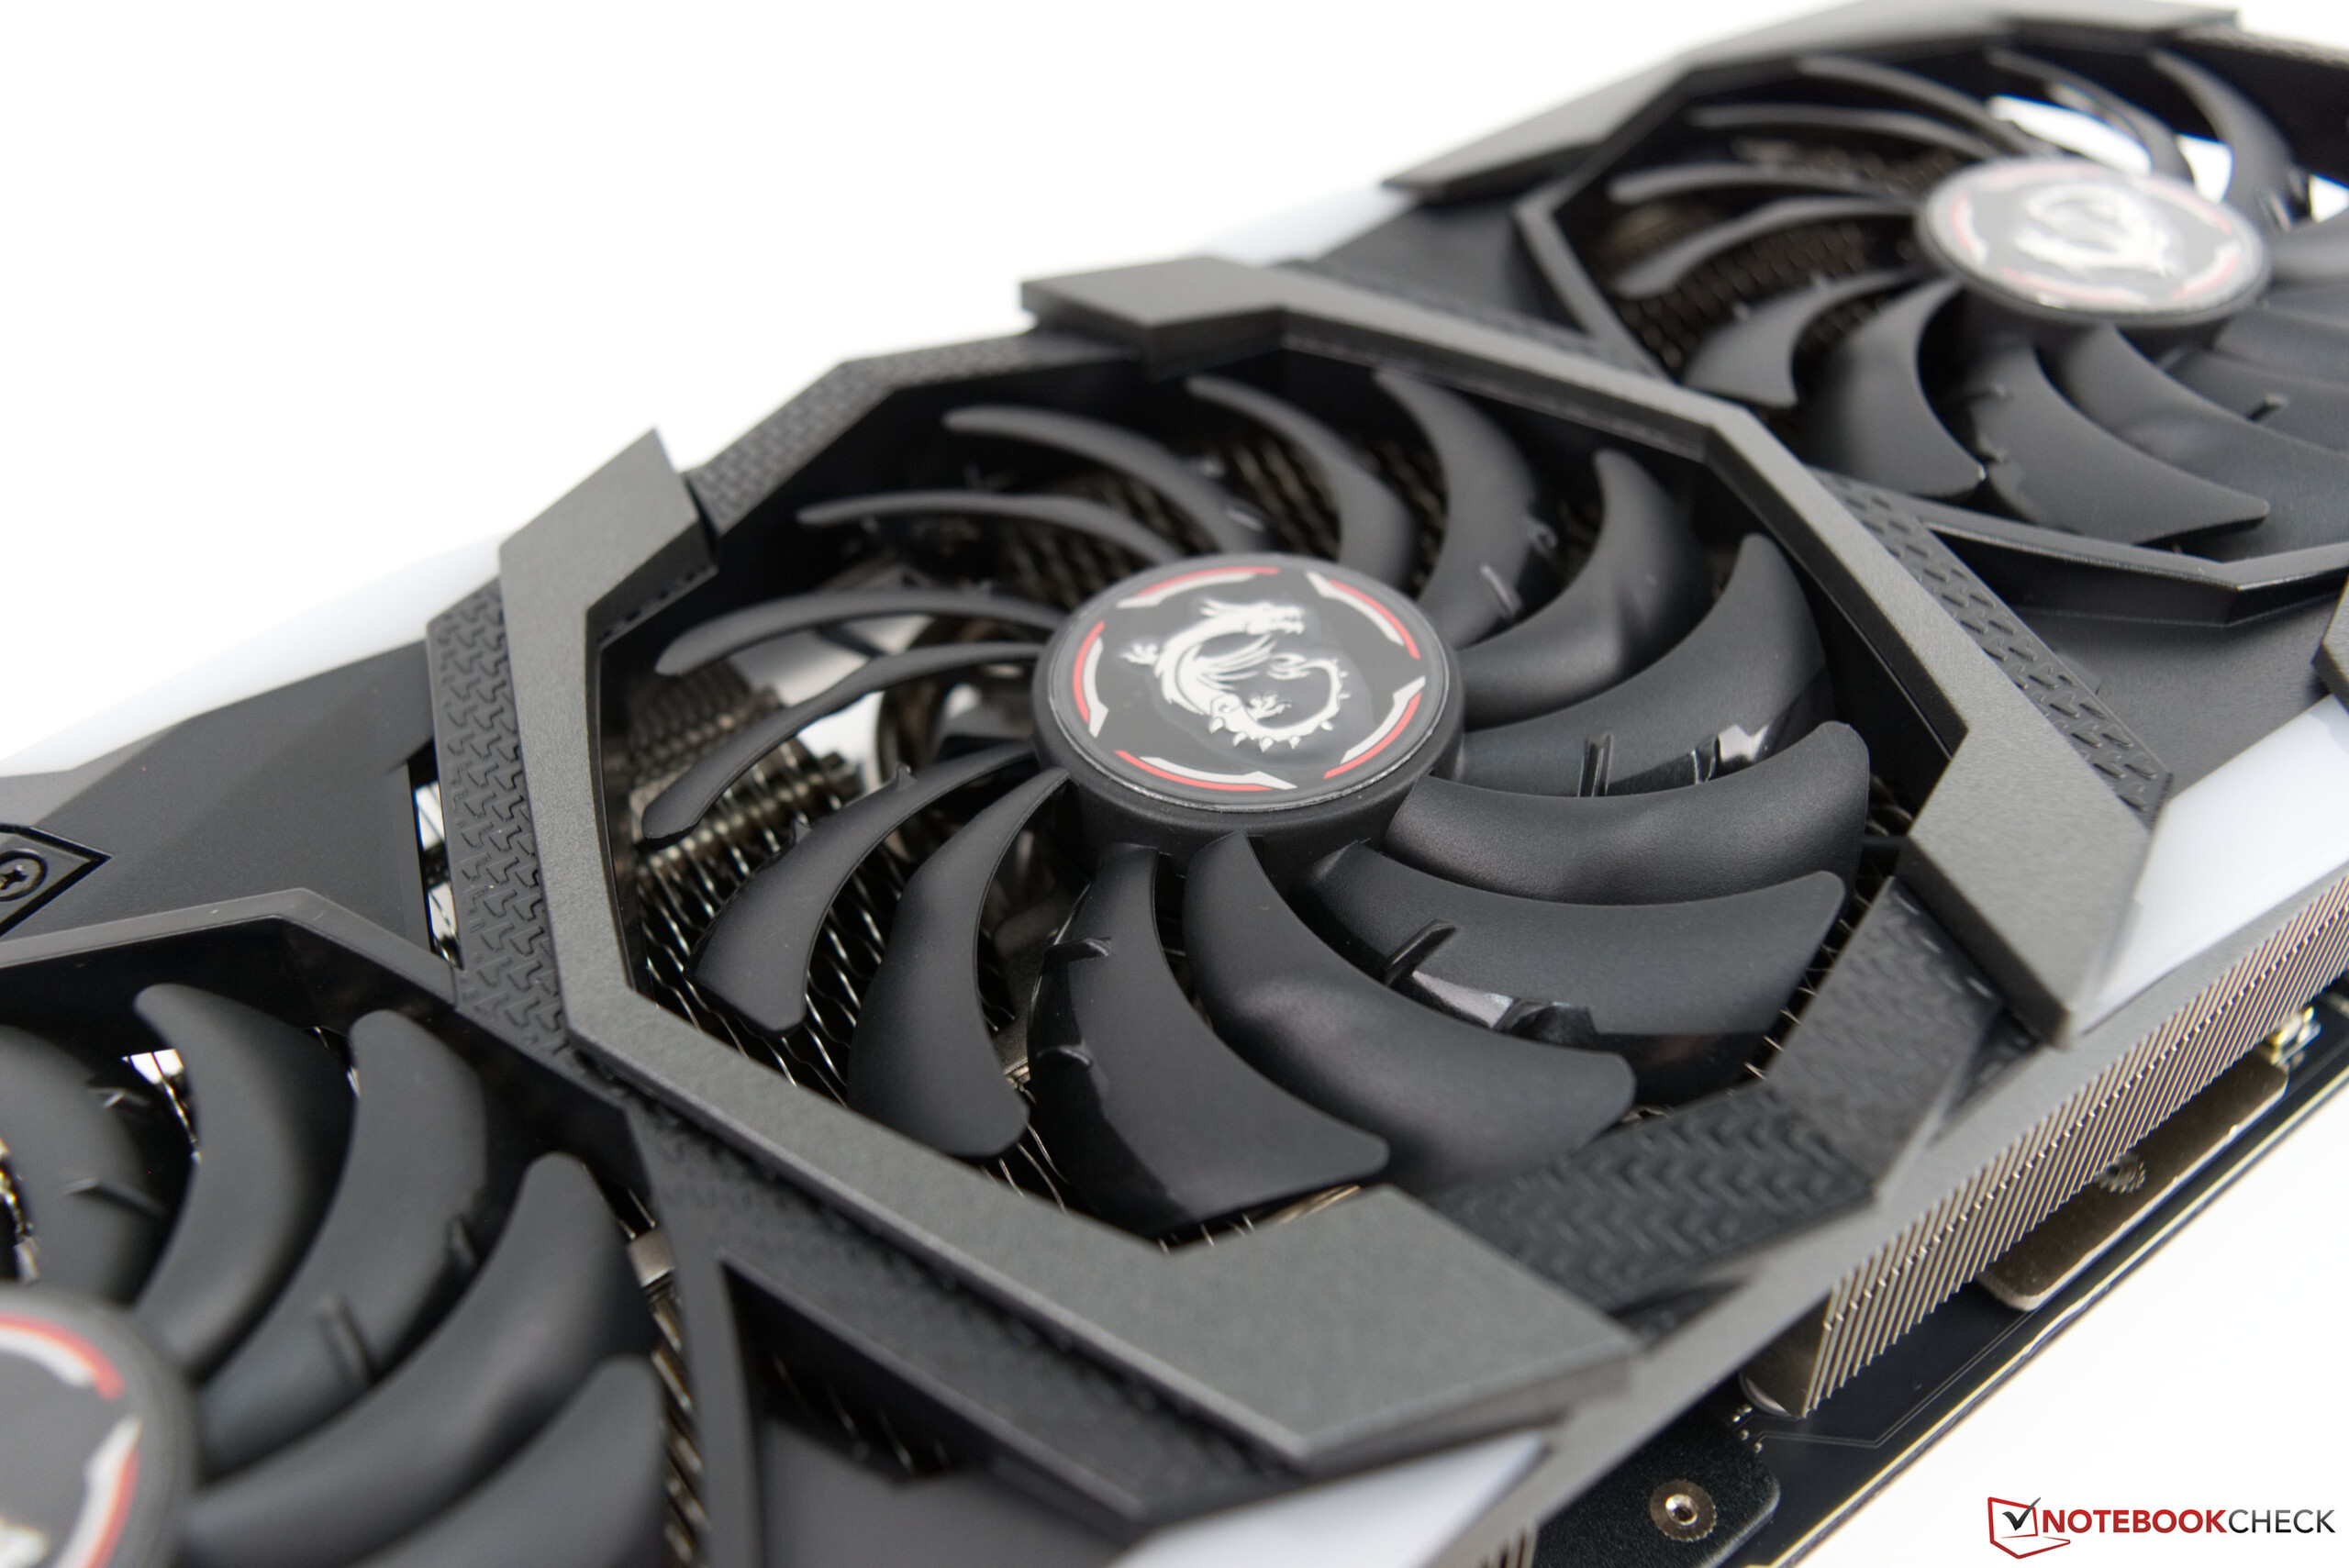
The Tri-Frozr cooling solution consists of three axial fans, which provide a constant supply of fresh air to a massive heatsink. This is why the GPU requires at least 3 slots. The three fans feature an axial design that helps accelerate the flow of air before it reaches the heatsink and the double-row ball bearings ensure that the cooling system will last for a very long time. The video card also comes with MSI’s Mystic RGB lighting, which can look very good in the right case.

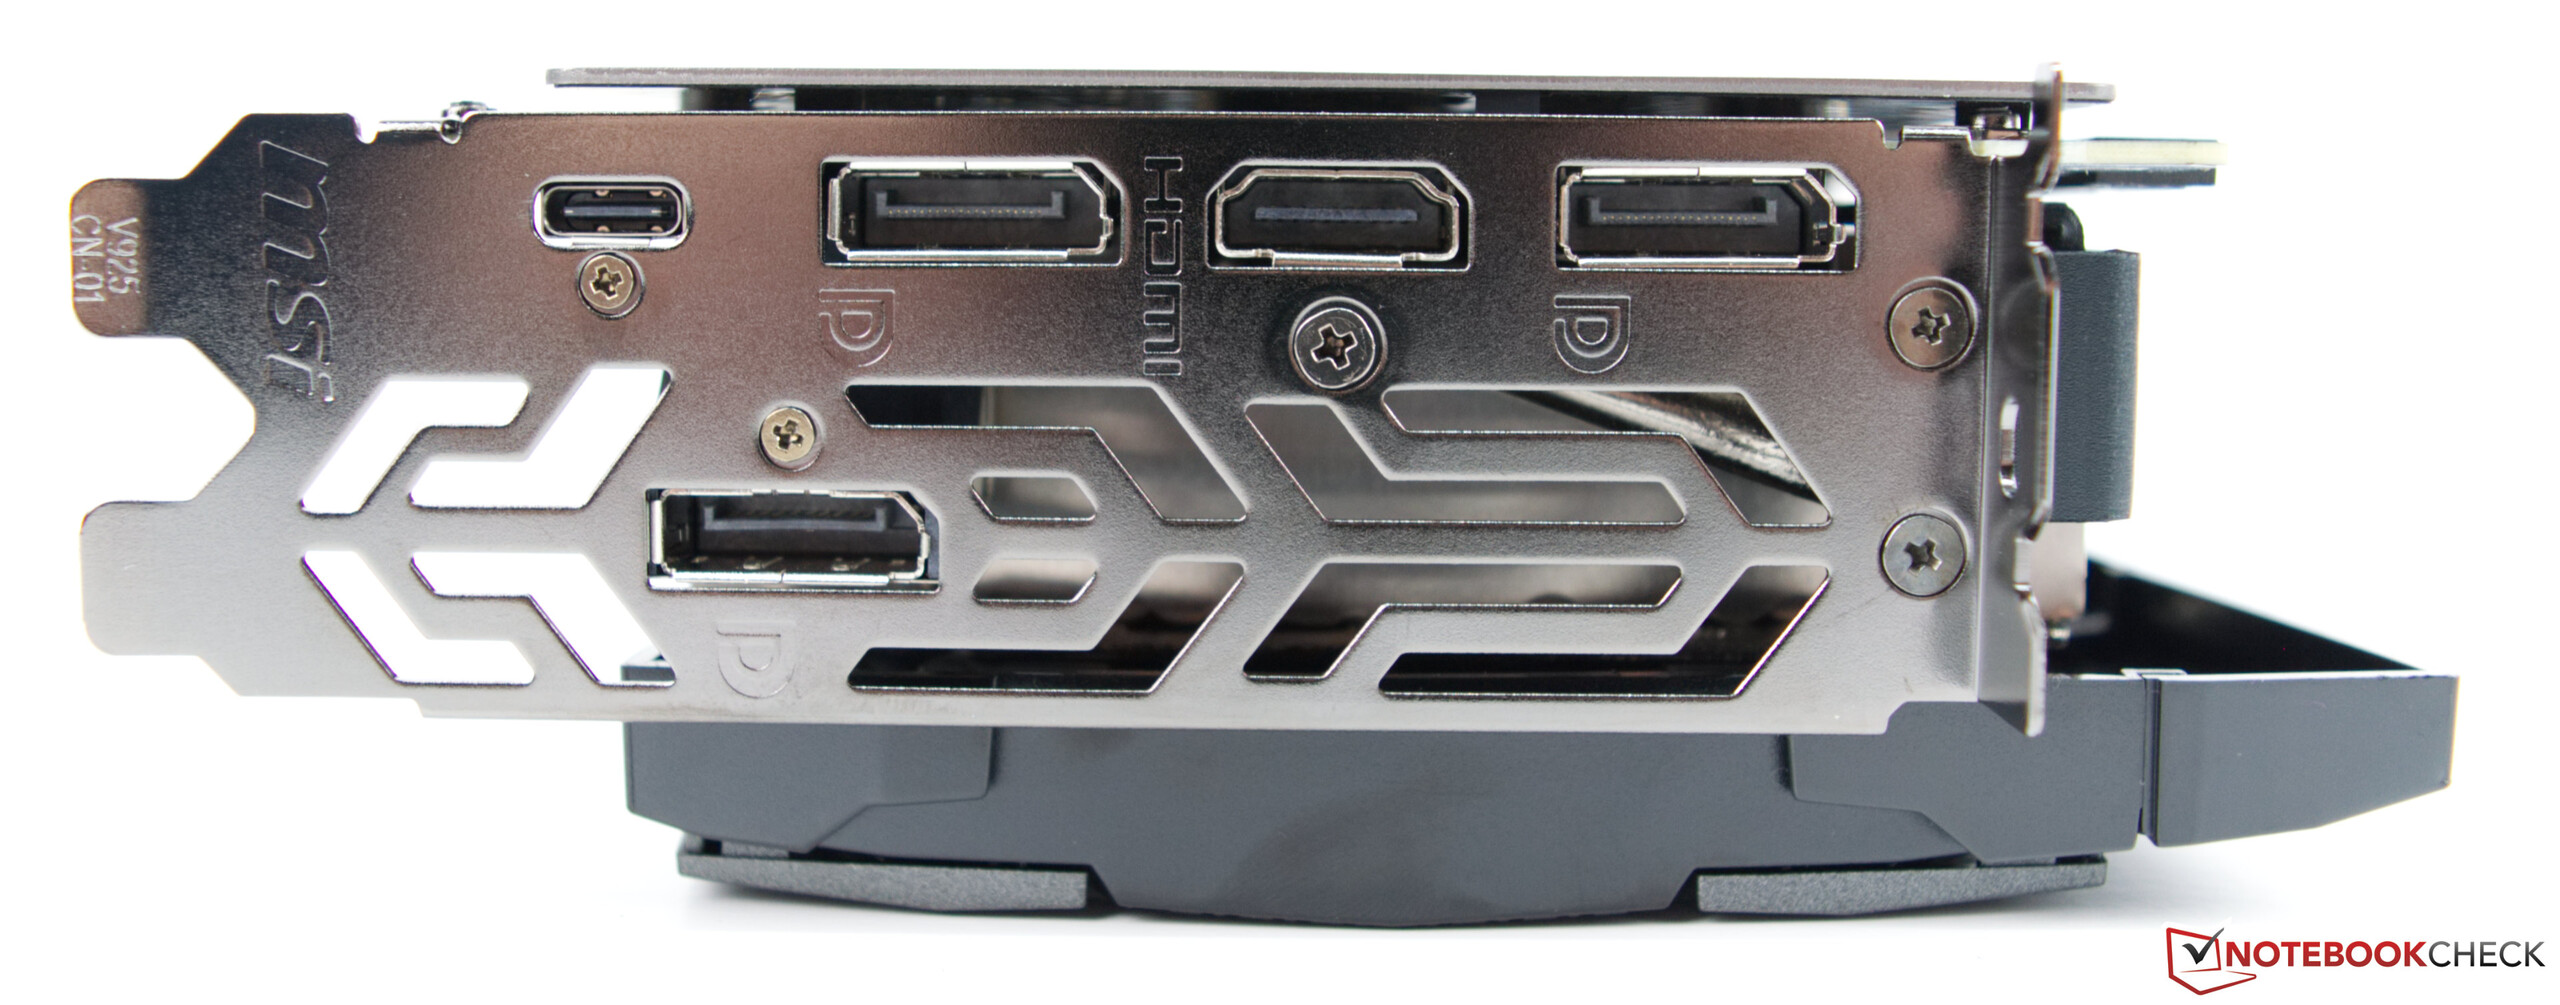
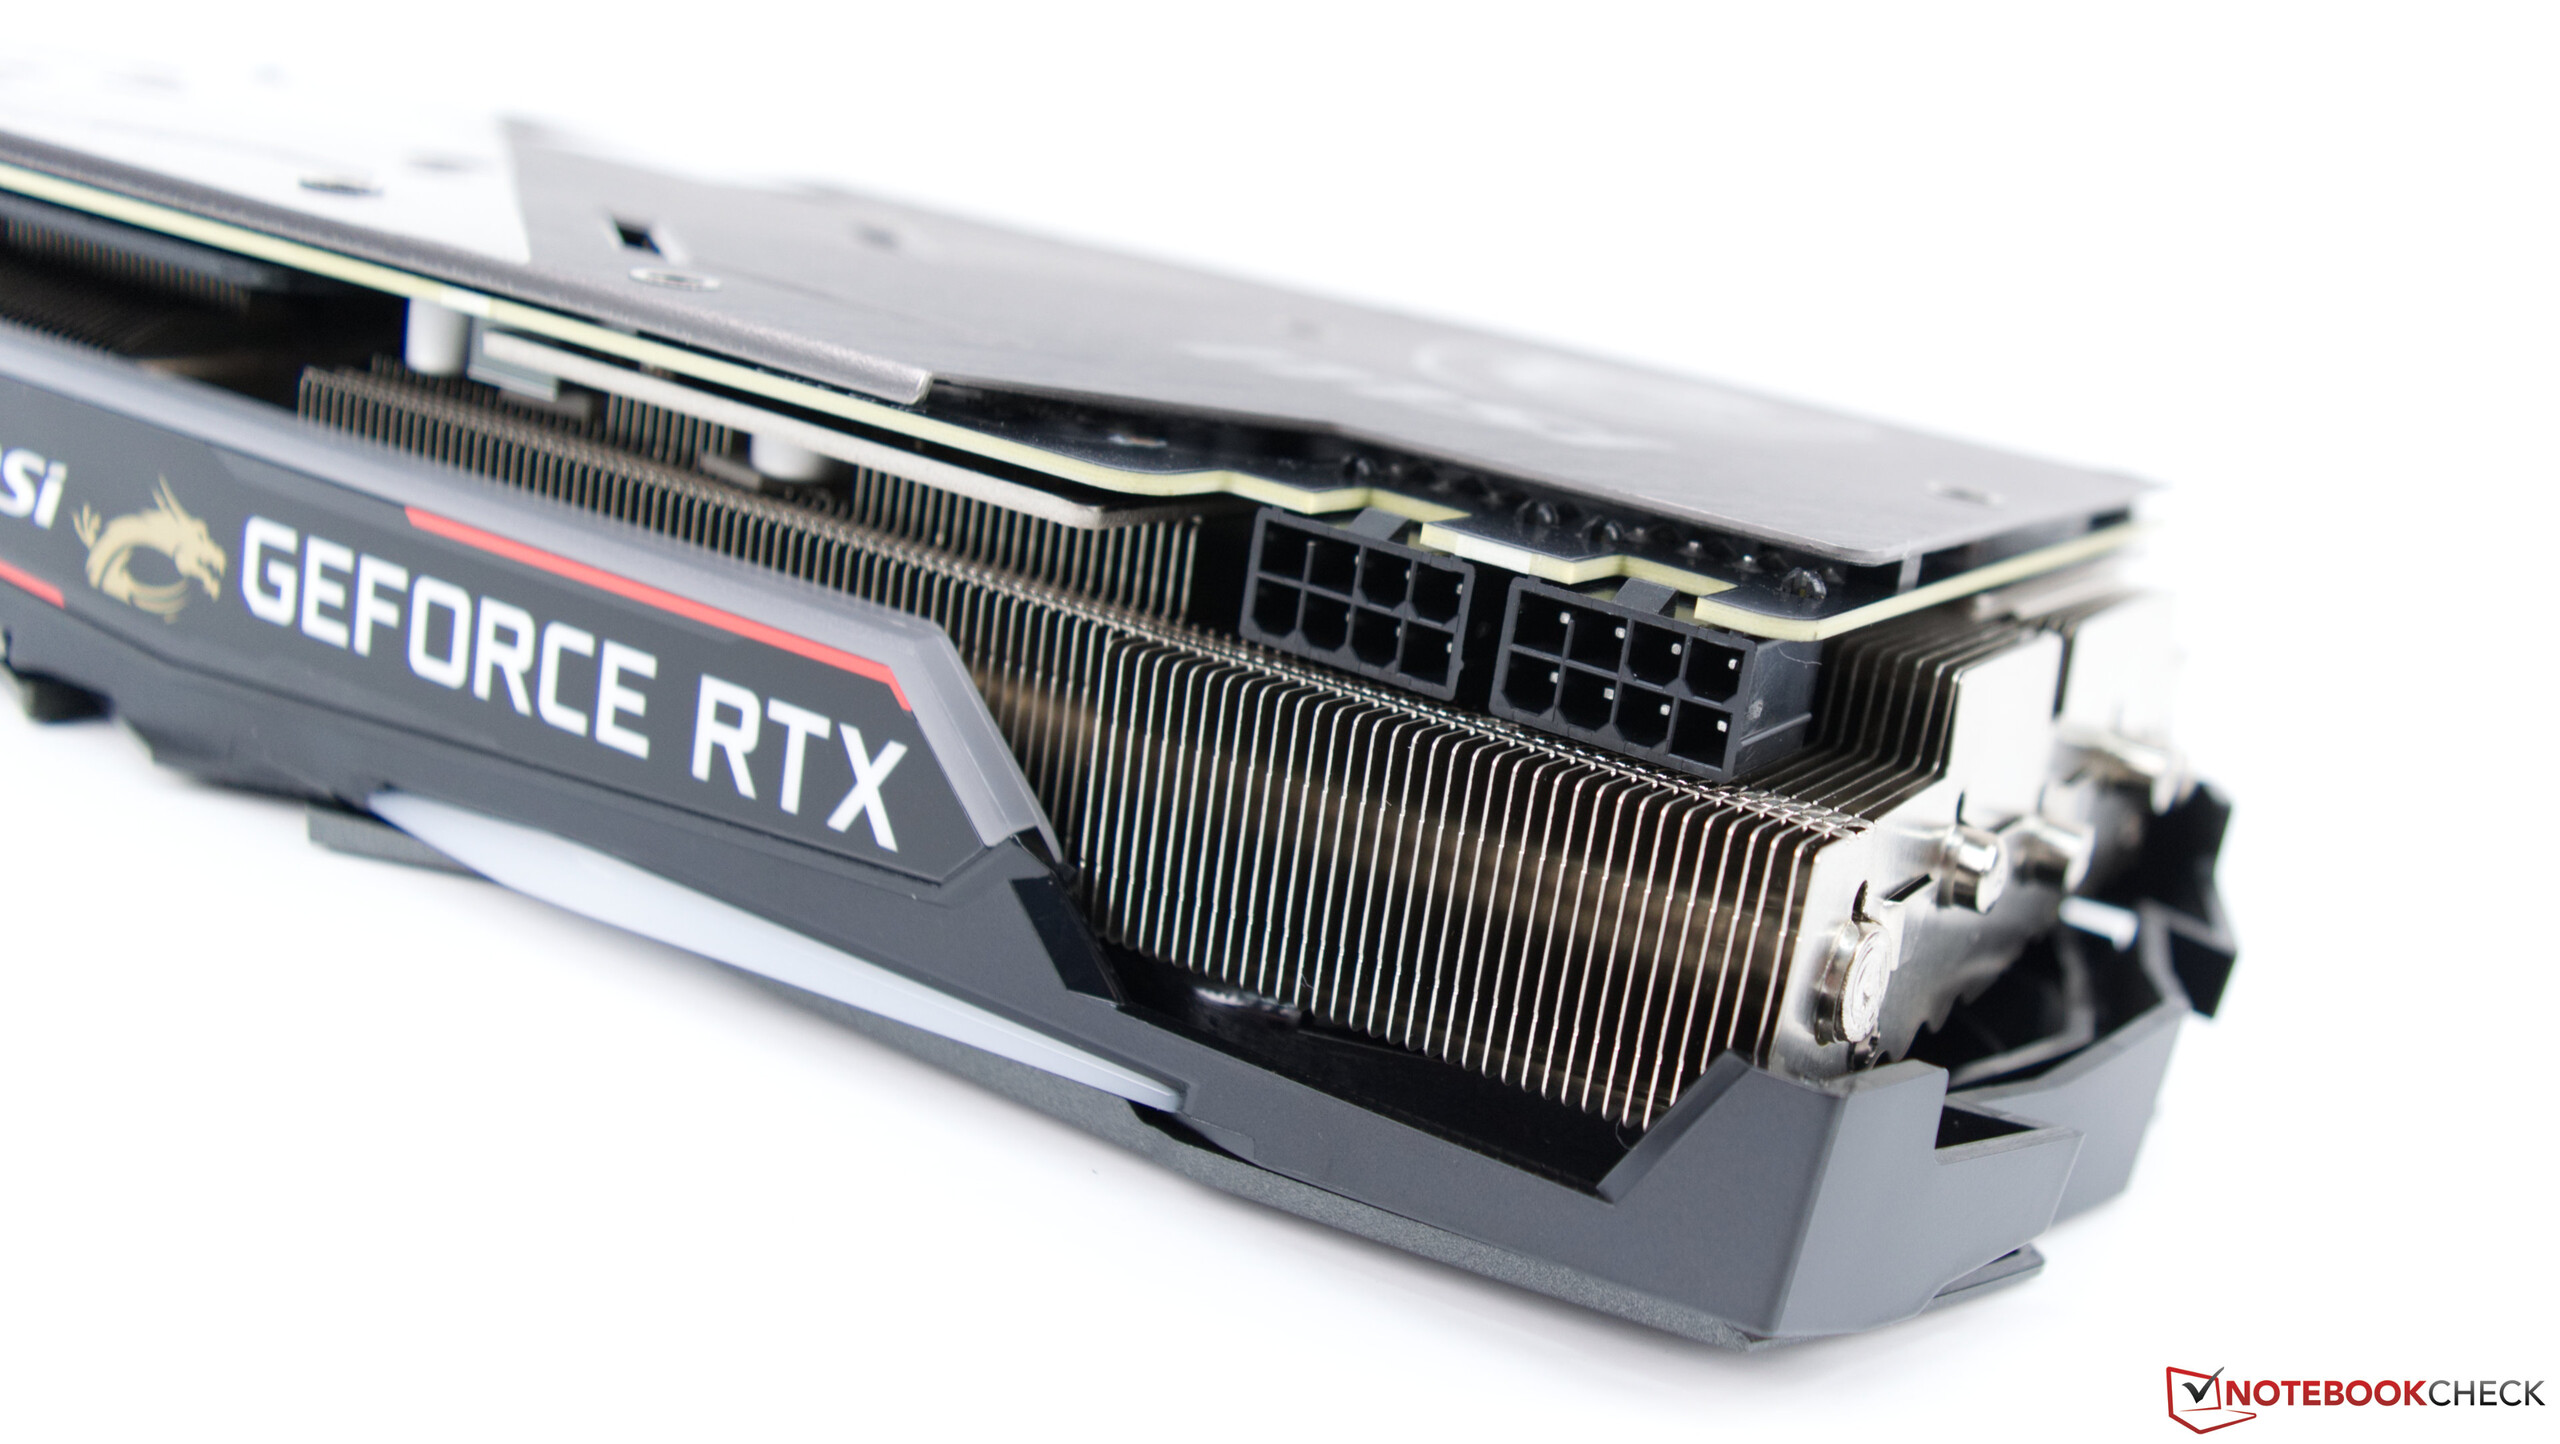
The MSI RTX 2080 Gaming X Trio has three DisplayPort 1.4 connectors, an HDMI 2.0b port and a USB Type-C port for VR devices. The GPU requires two 8-pin power connectors.

MSI RTX 2080 Gaming X Trio

GPU specifications in overview

Specifications RTX 2060 RTX 2070 MSI RTX 2080 RTX 2080 RTX 2080 Ti GTX 1080
Chip TU106 TU106 TU104 TU104 TU102 GP104
Manufacturing process 12 nm 12 nm 12 nm 12 nm 12 nm 16 nm
Shader units 1.920 2.304 2944 2.944 4.352 2.560
Texture Units 120 144 184 184 272 160
Tensor Cores 240 288 368 368 544 -
RT Cores 30 36 46 46 68 -
GPU Base Clock 1.365 MHz 1.410 MHz 1.515 MHz 1.515 MHz 1.350 MHz 1.607 MHz
GPU Boost Clock 1.680 MHz 1.620 MHz 1.860 MHz 1.710 MHz 1.545 MHz 1.733 MHz
Memory Interface 192 Bit 256 Bit 256 Bit 256 Bit 352 Bit 256 Bit
Memory Bandwidth 336 GB/s 448 GB/s 448 GB/s 448 GB/s 616 GB/s 320,3 GB/s
Memory Capacity 6 GB GDDR6 8 GB GDDR6 8 GB GDDR6 8 GB GDDR6 11 GB GDDR6 8 GB GDDR5X
TDP (in watts) 160 W 175 W 260 W 215 W 250 W 180 W

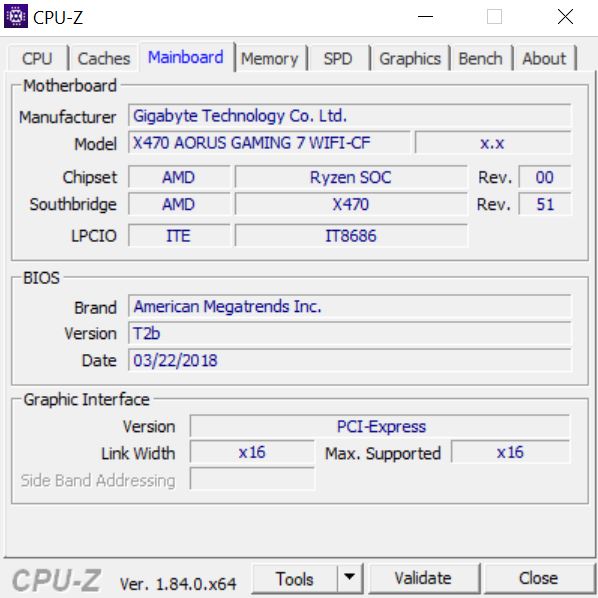
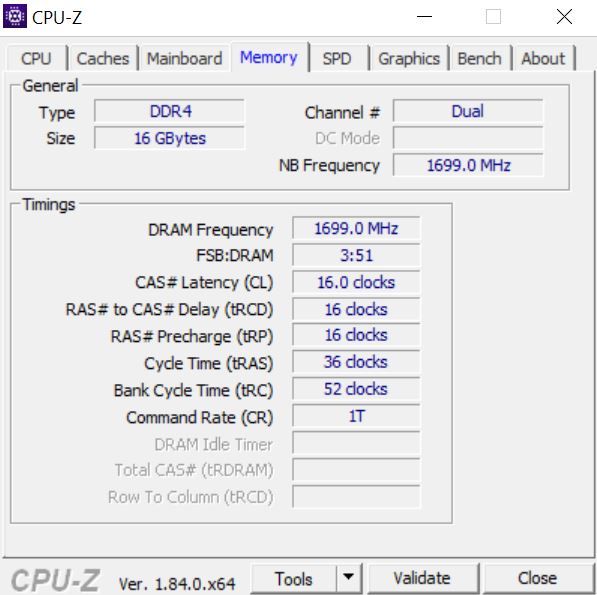
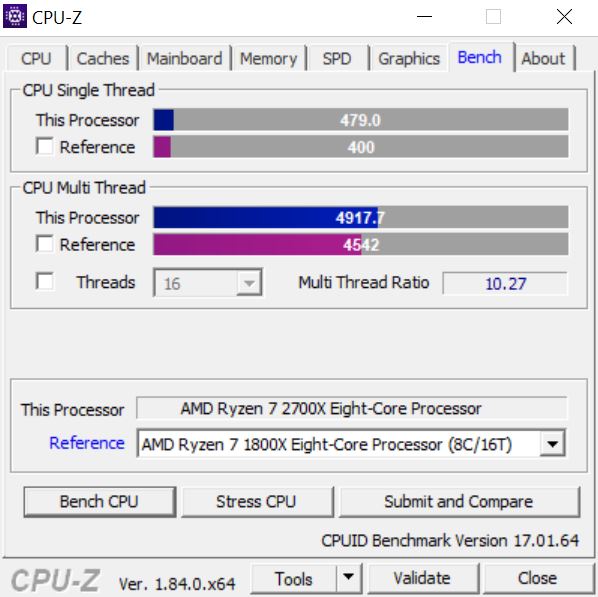
The Test Bench - Based on the Ryzen 7 2700X

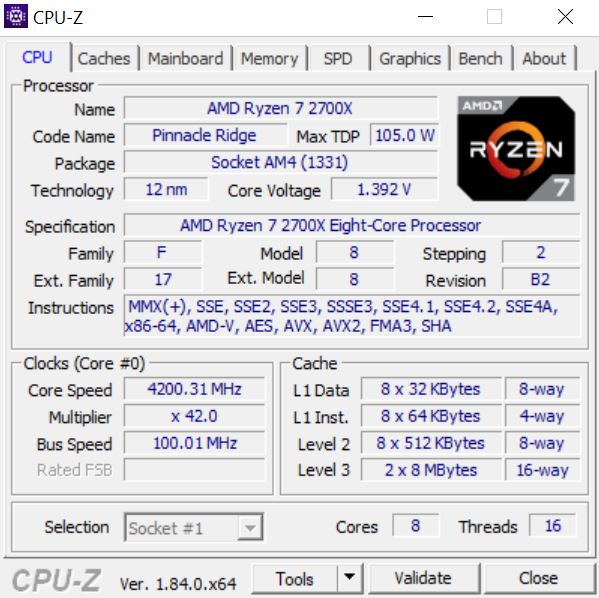
Our test bench is based on a current AMD platform. The Gigabyte X470 Aorus Gaming 7 Wi-Fi serves as the motherboard. The CPU, which is known as the AMD Ryzen 7 2700X, offers a lot of performance. The system is cooled by an all-in-one water cooler from Be Quiet (Silent Loop 280mm). 16 GB of 3400 MHz RAM comes from G-Skill. The Acer Predator XB321HK does not represent a bottleneck, thanks to its 4K resolution. We are very grateful to AMD for providing us with the above-mentioned system. 

AMD RYZEN 7 2700X
Gigabyte X470 Aorus Gaming 7 WiFi
G-Skill Sniper X DDR4 3.400 MHz
Case Corsair Carbide Air 540 ATX Cube
CPU AMD RYZEN 7 2700X
CPU cooler Be Quiet Silent Loop 280mm
RAM G-Skill Sniper X 16 GB DDR4 3.400 MHz
Motherboard Gigabyte X470 Aorus Gaming 7 WiFi
Monitor Acer Predator XB321HK 4K
SSD ADATA SP900 M.2 SSD
HDD 2 TB Western Digital (for games)
OS Microsoft Windows 10 Professional 64-Bit (Version 1809)
Drivers Nvidia 418.91
CPU-Z
CPU-Z
CPU-Z
CPU-Z
CPU-Z
CPU-Z
CPU-Z

The Core Clocks of the MSI RTX 2080 Gaming X Trio

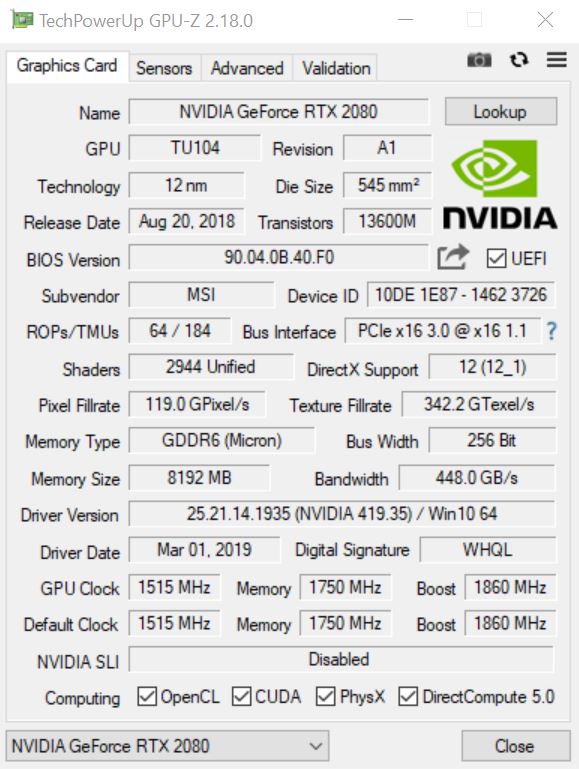
The MSI RTX 2080 Gaming X Trio has the same base core clock (1365 MHz) as Nvidia’s reference model. However, when it comes to the boost clock, there is some difference. MSI’s graphics card has a higher boost frequency, thanks to an increased TDP (up to 260 watts). The MSI RTX 2080 Gaming X Trio comes with a boost clock of 1830 MHz, whereas the reference model has a boost clock of 1515 MHz and a TDP of 215 watts. The maximum TDP of Nvidia’s Founders Edition card is 225 watts and the maximum boost frequency is 1800 MHz. 

Just like the reference model, the MSI RTX 2080 Gaming X Trio has 8 GB of GDDR6 VRAM that is clocked at an effective frequency of 14 GHz.

At least on paper, the MSI RTX 2080 Gaming X Trio looks better than the GeForce RTX 2080 Founders Edition. The Asus ROG Strix GeForce RTX 2080 OC is also on the same level as the MSI RTX 2080 Gaming X Trio.

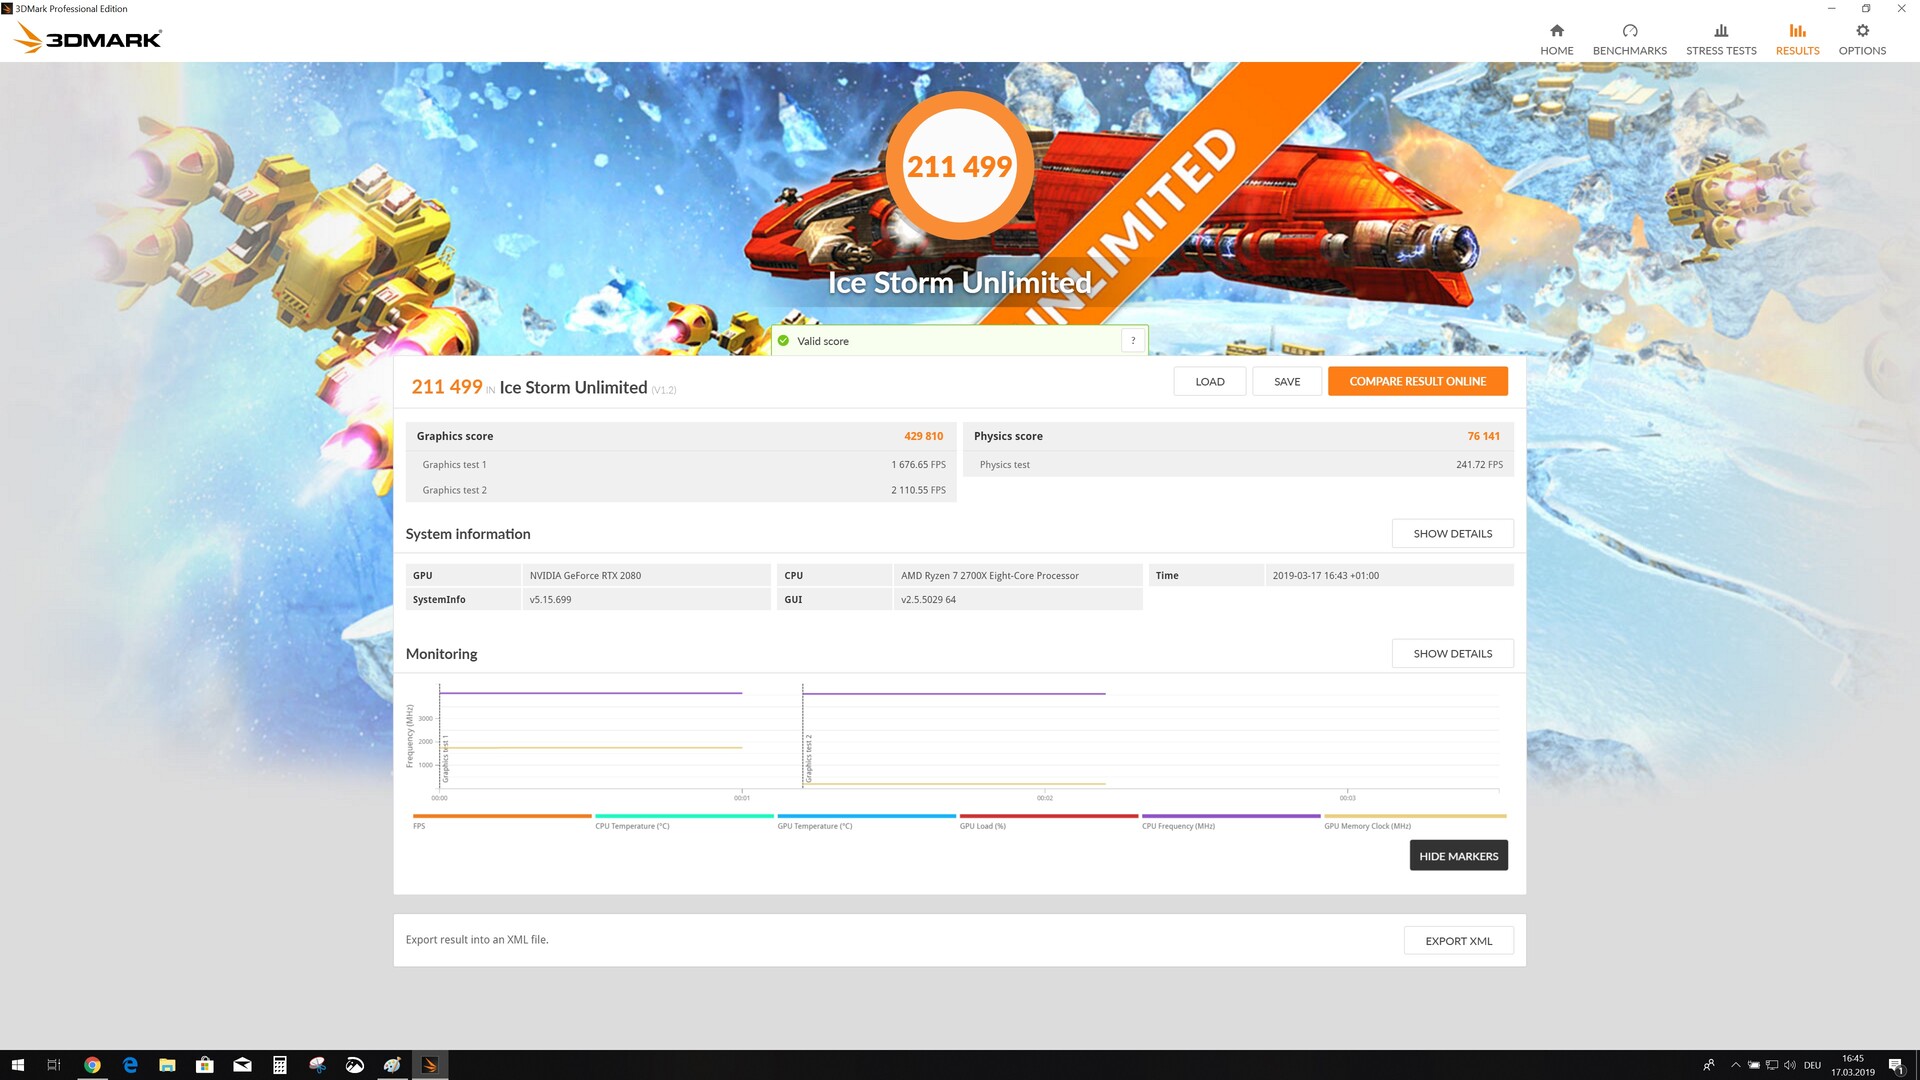
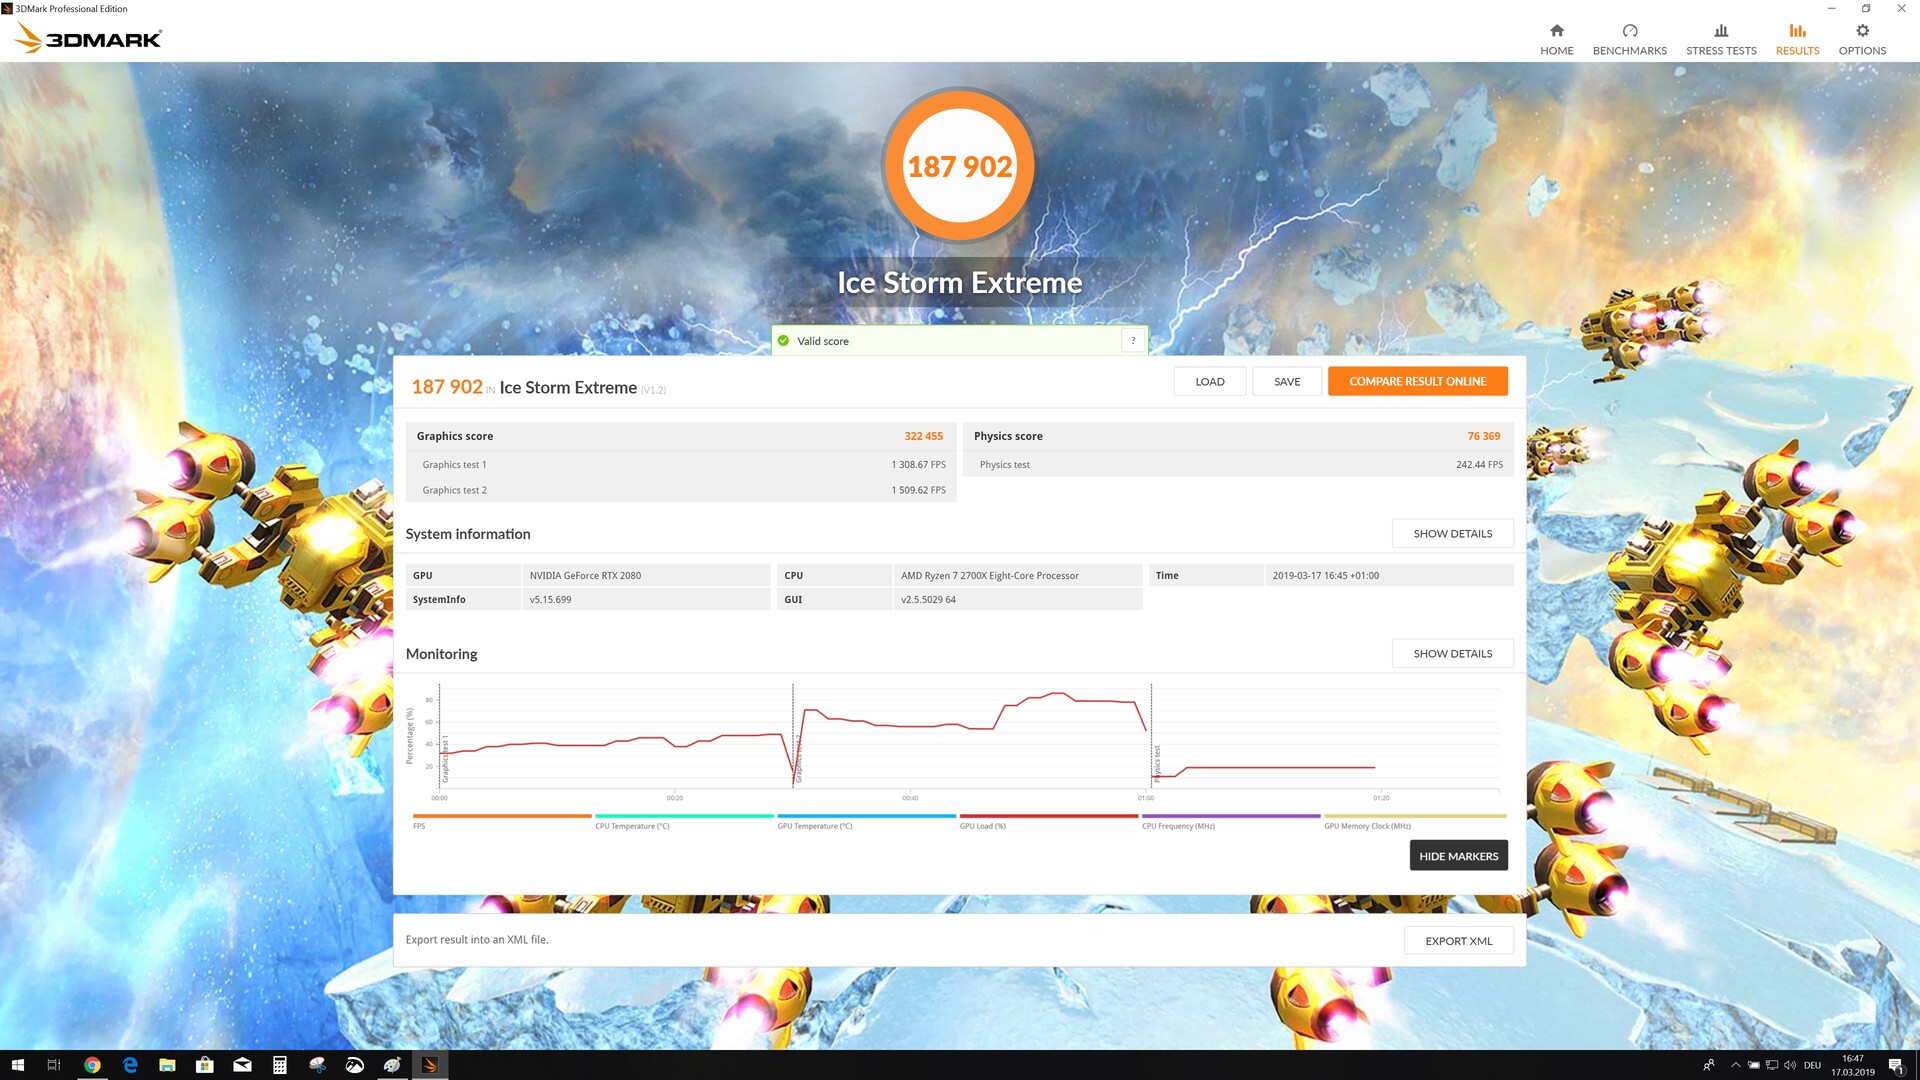
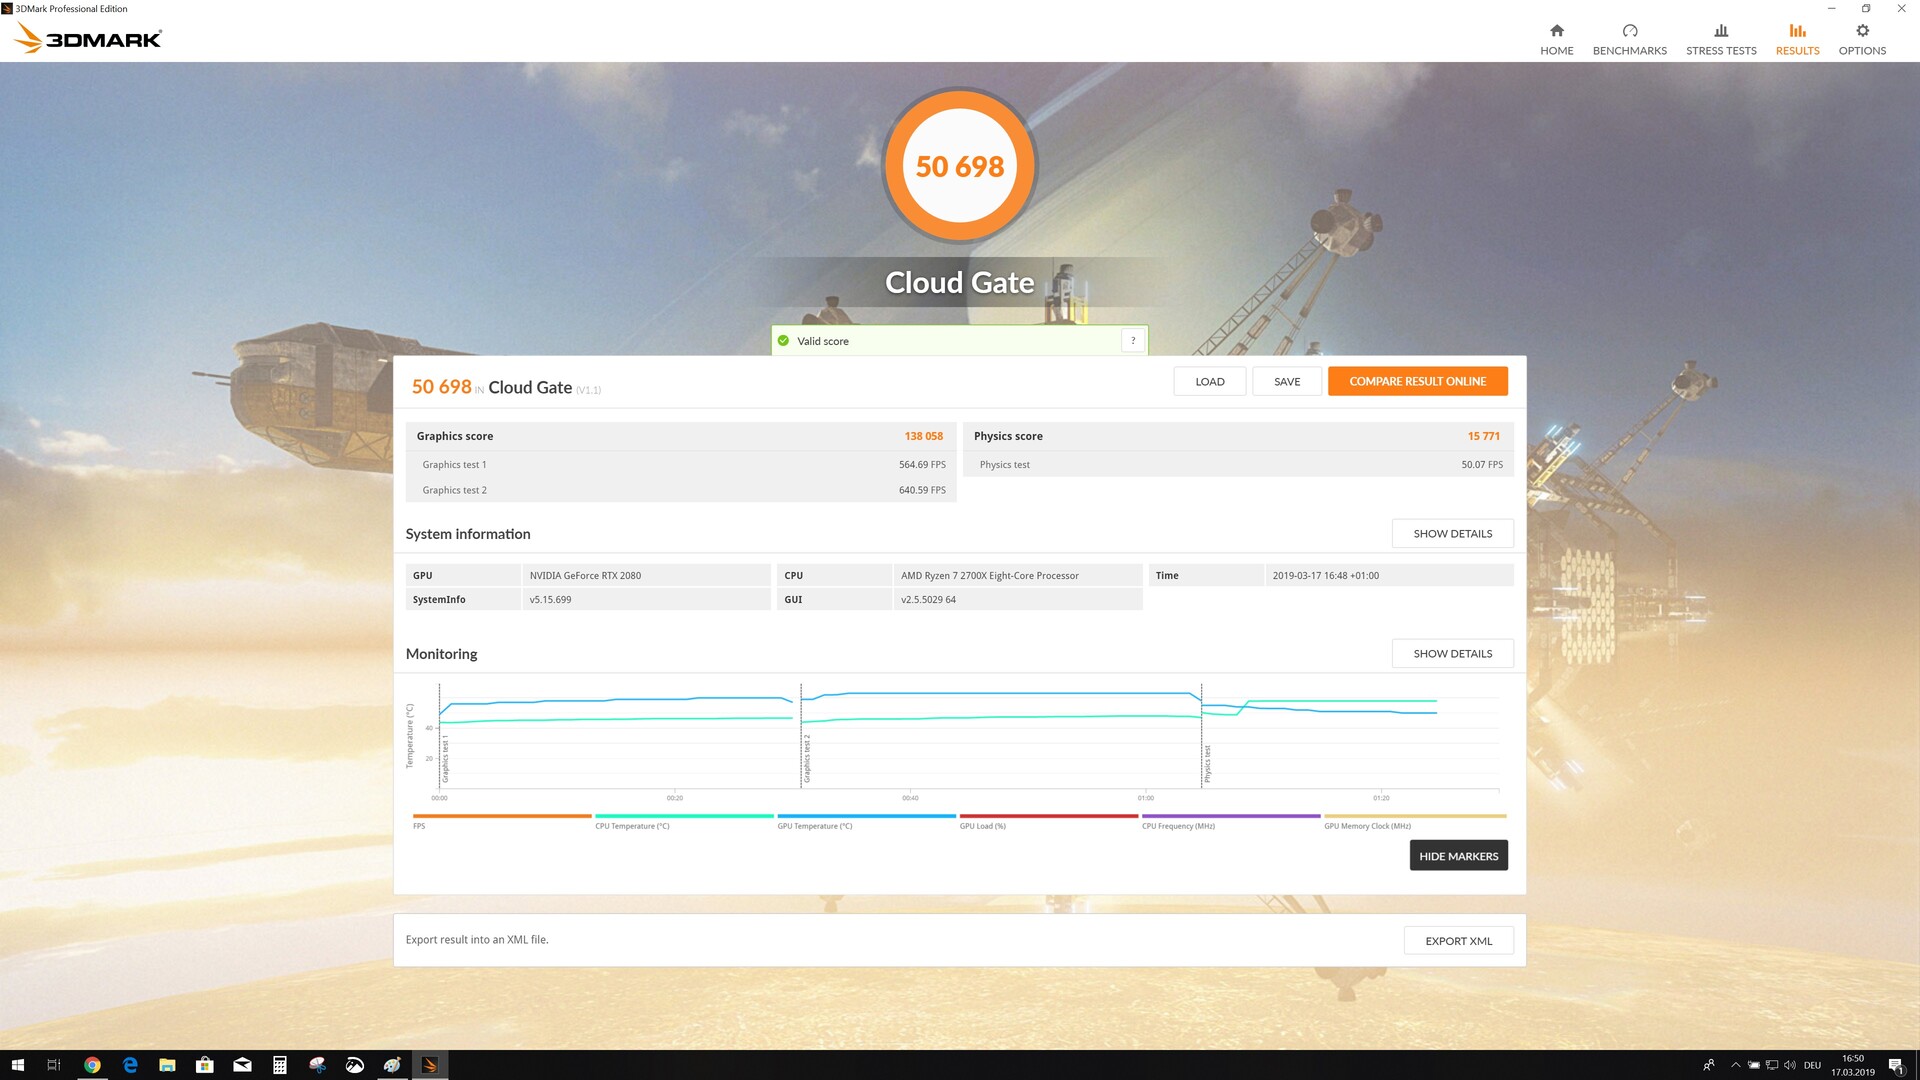
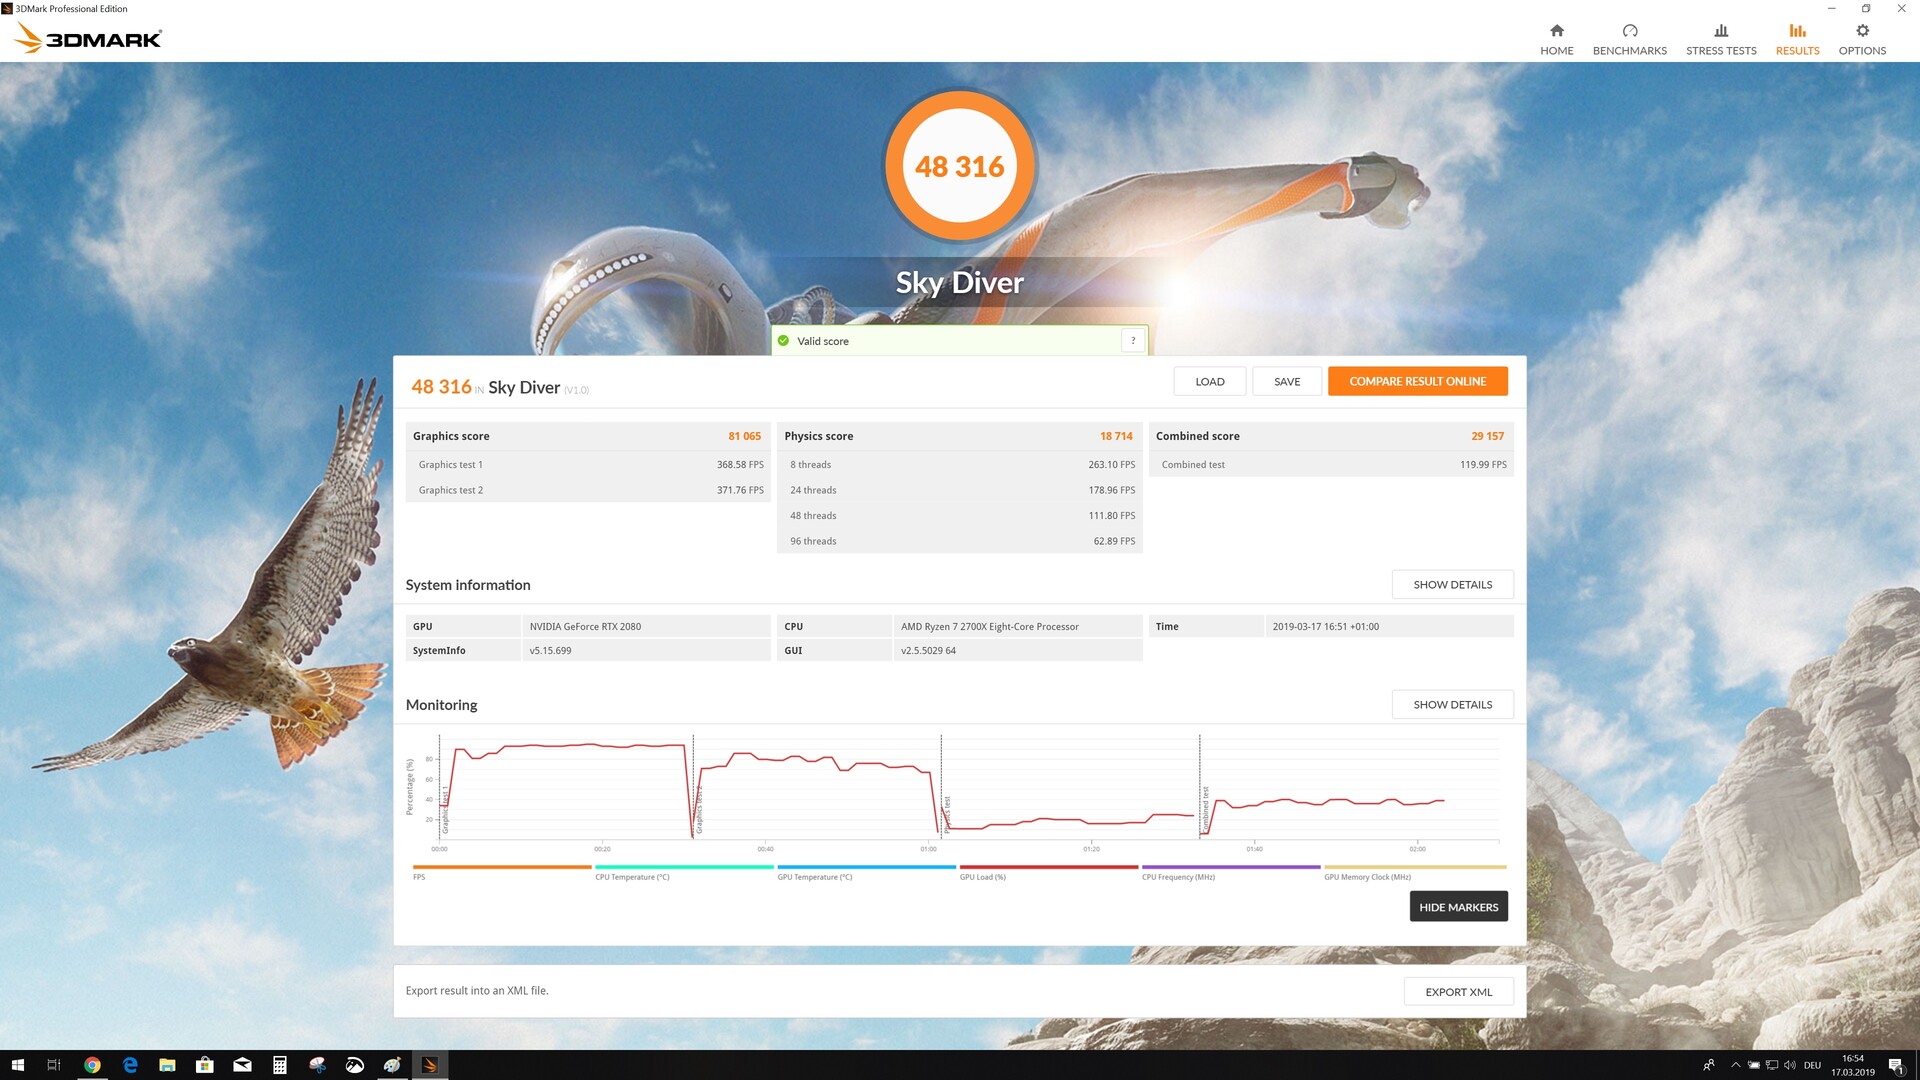
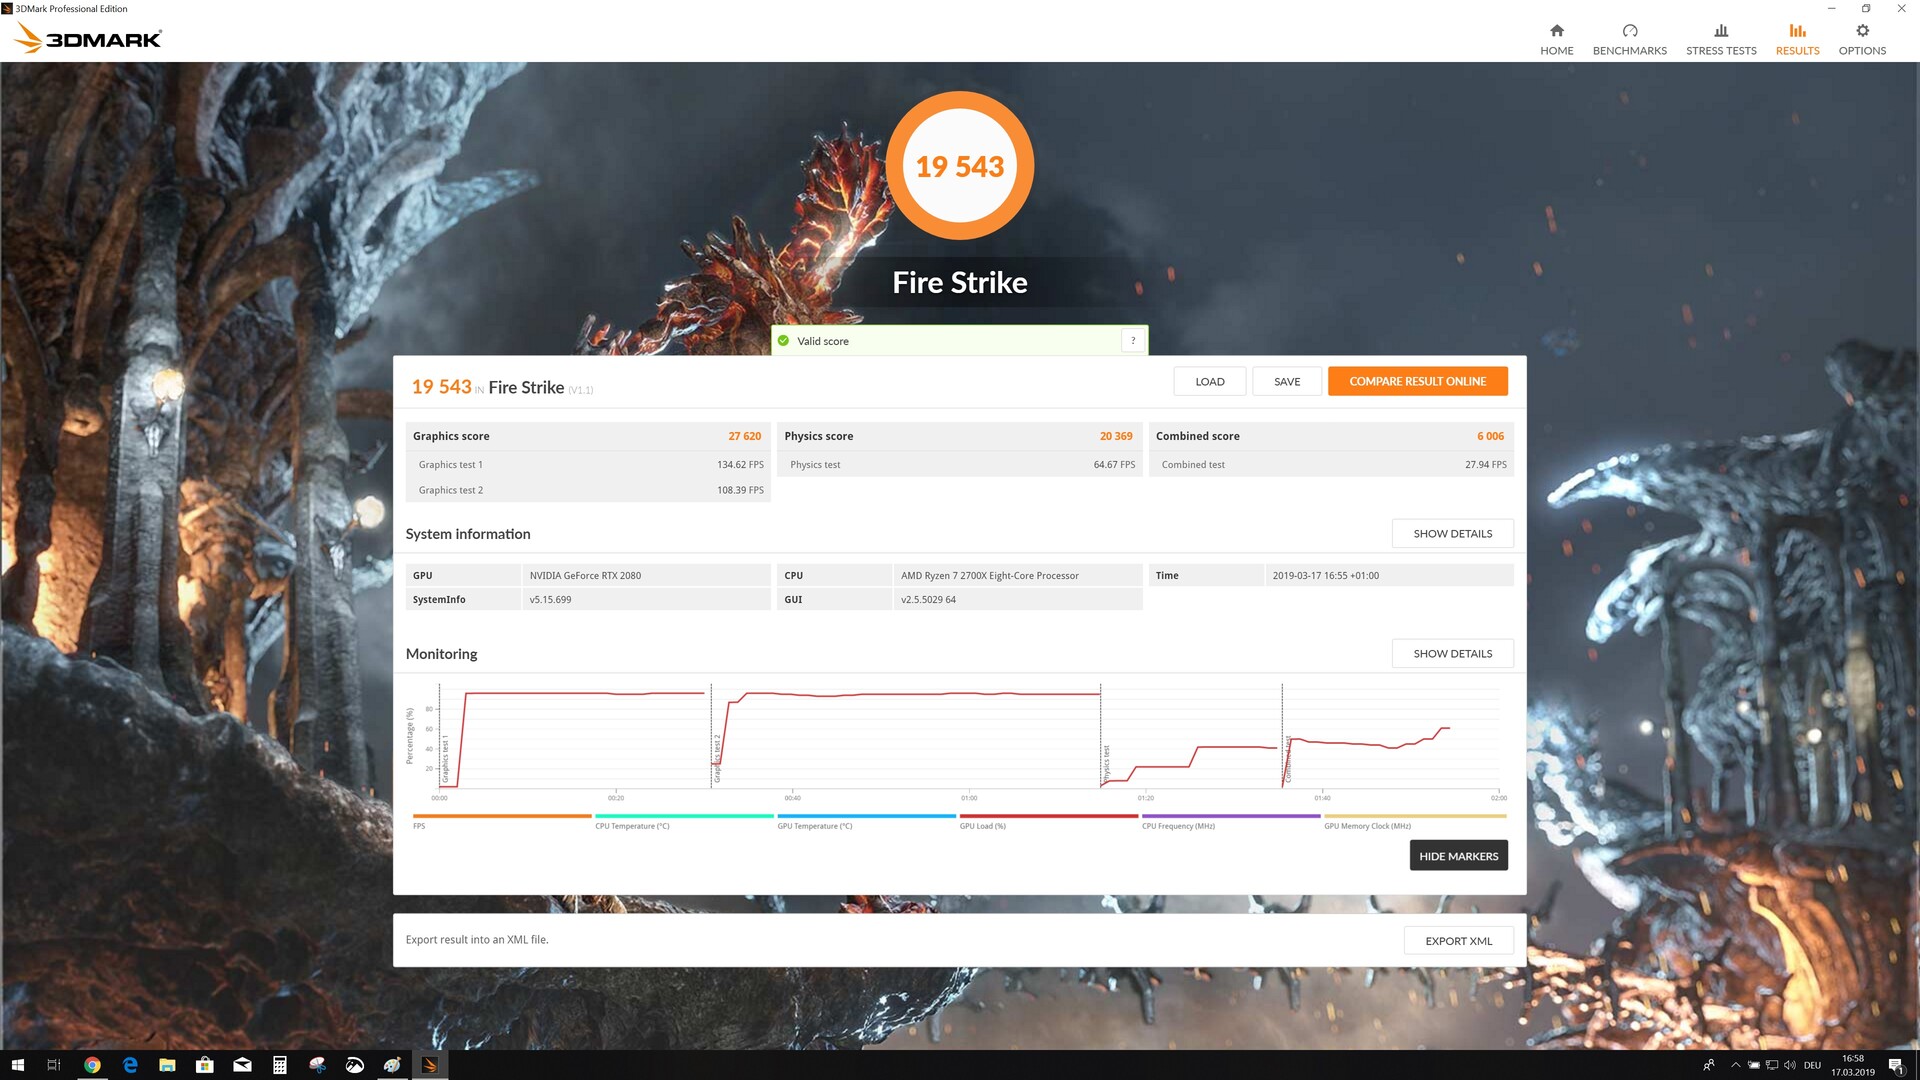
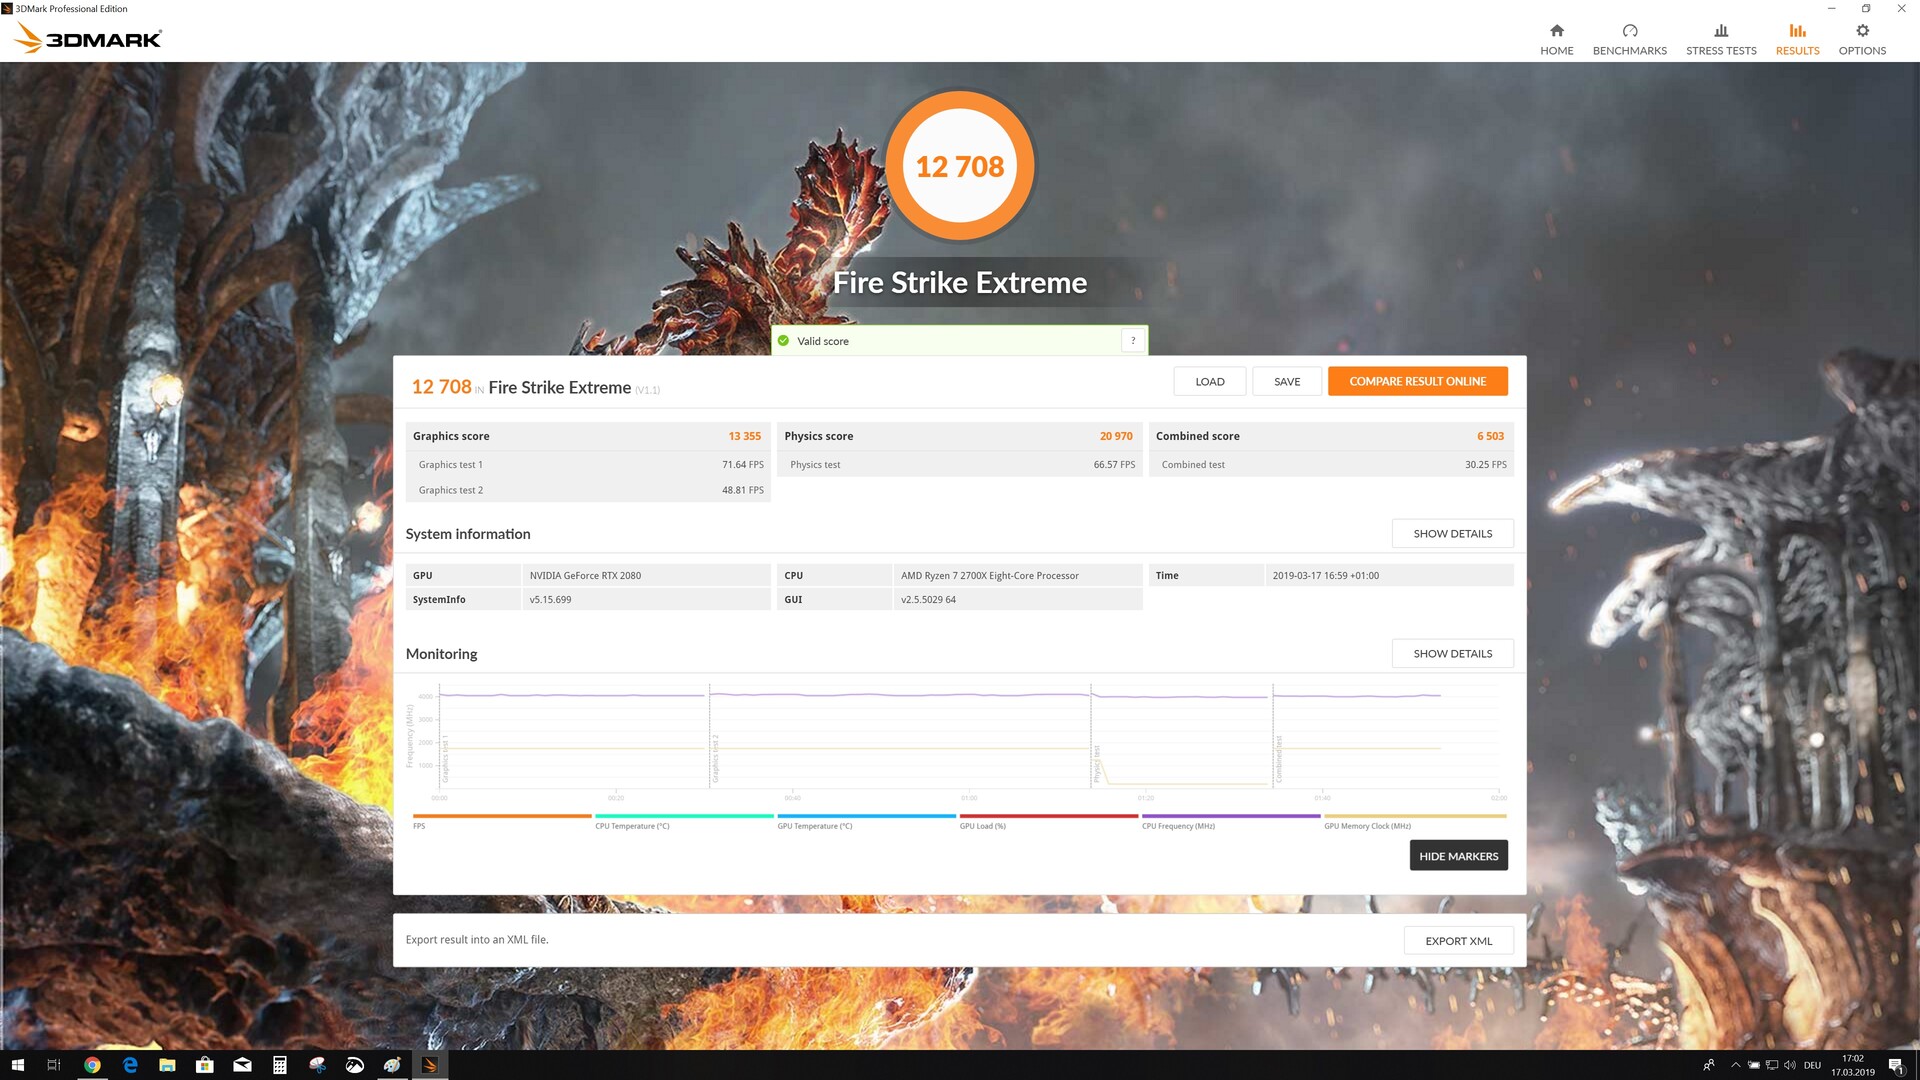
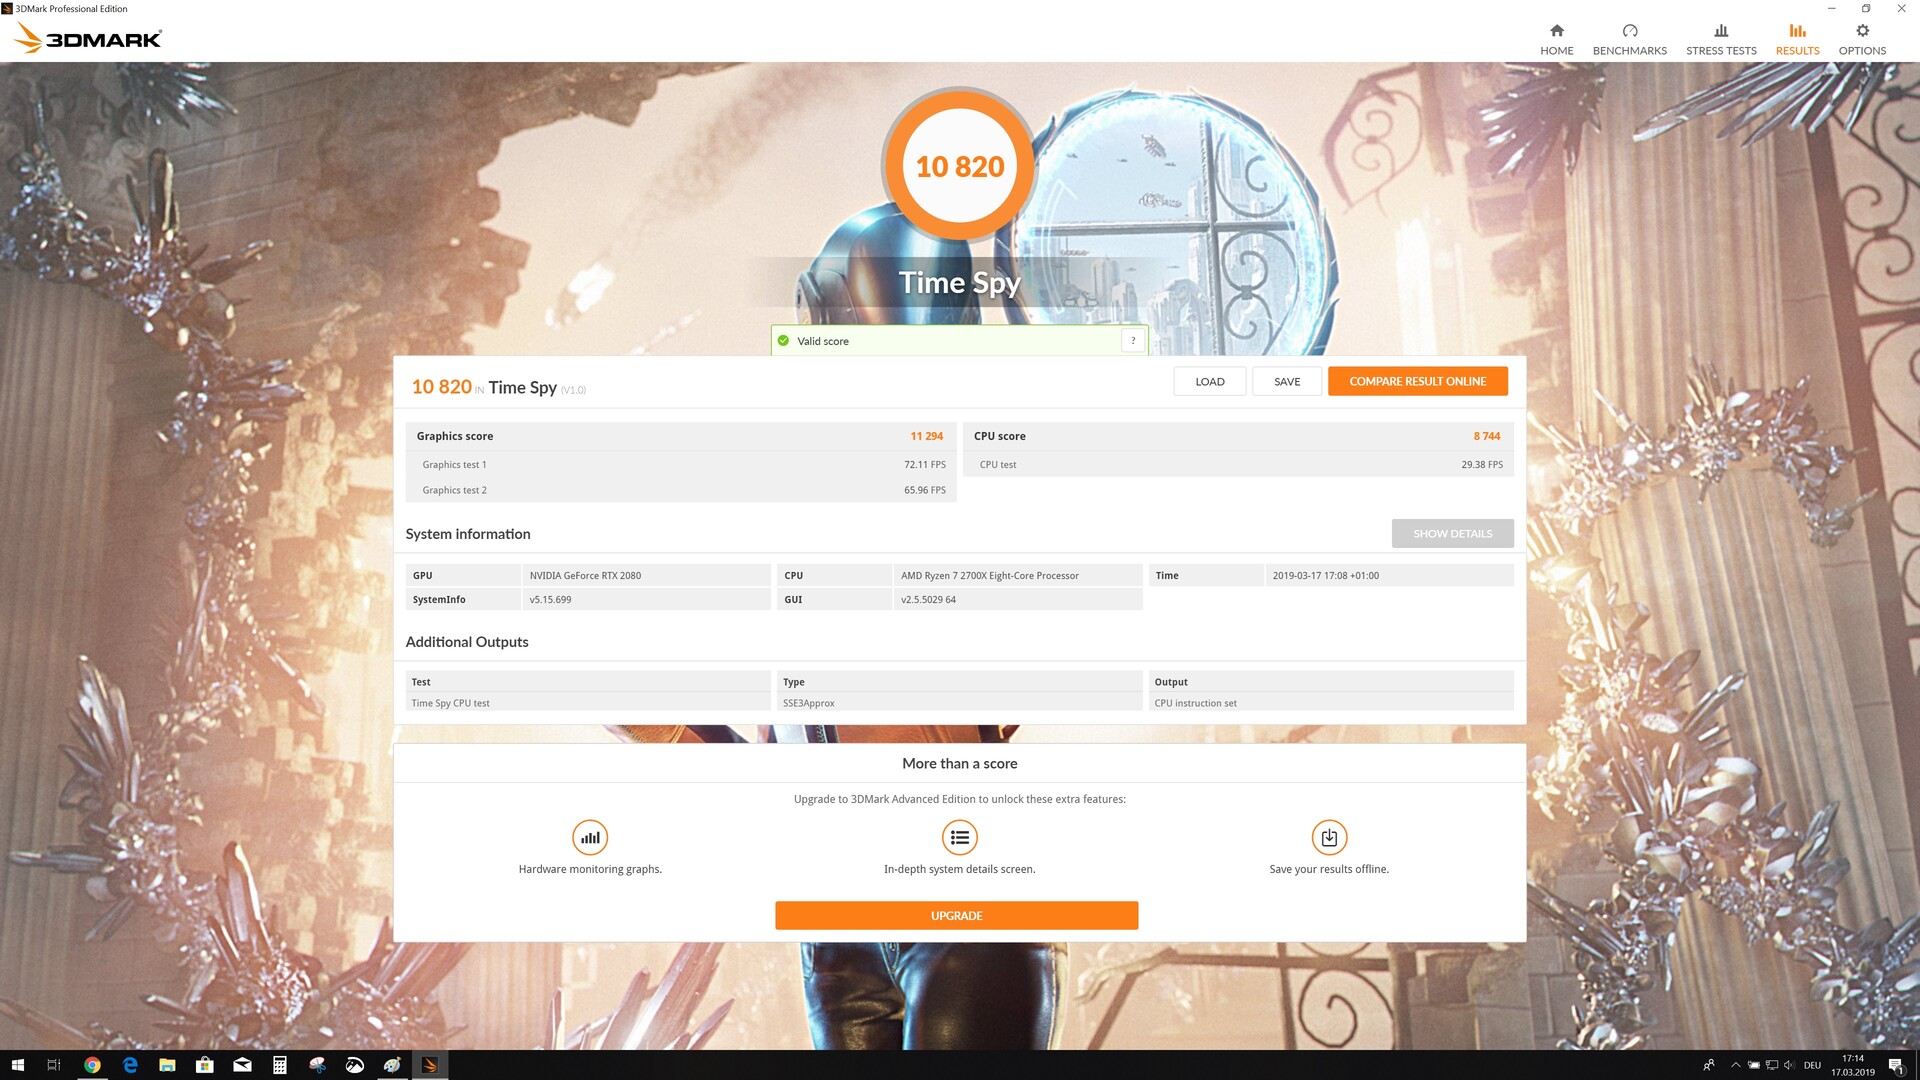
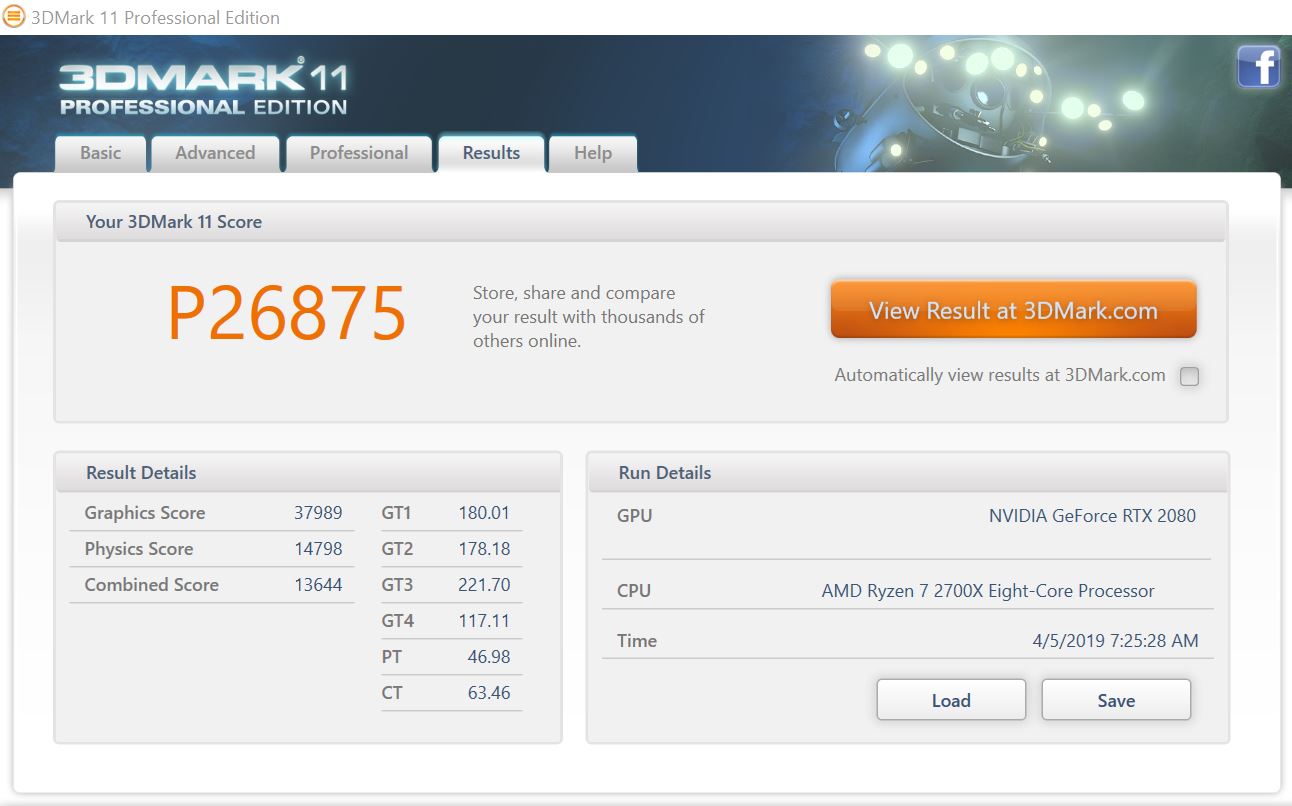
Synthetic Benchmarks

All of the RTX 2080 models that we have tested perform very similarly in the synthetic benchmarks. Here, the battle between MSI and Asus is concluded without either GPU being a clear winner. When compared to the Pascal-based GPUs, the MSI RTX 2080 Gaming X Trio is beaten by a small margin by the GeForce GTX 1080 Ti. The recently released AMD Radeon VII easily beats most GPUs from Nvidia.

When compared to the MSI RTX 2070 Gaming Z 8G, the MSI RTX 2080 Gaming X Trio is 20% faster. We observed a similar gap in performance between the MSI RTX 2060 Gaming Z 6G and the MSI RTX 2070 Gaming Z 8G.

3DMark Ice Storm
3DMark Ice Storm Unlimited
3DMark Ice Storm Extreme
3DMark Cloud Gate
3DMark Sky Diver
3DMark Fire Strike
3DMark Fire Strike Extreme
3DMark Fire Strike Ultra
3DMark Time Spy
3DMark 11
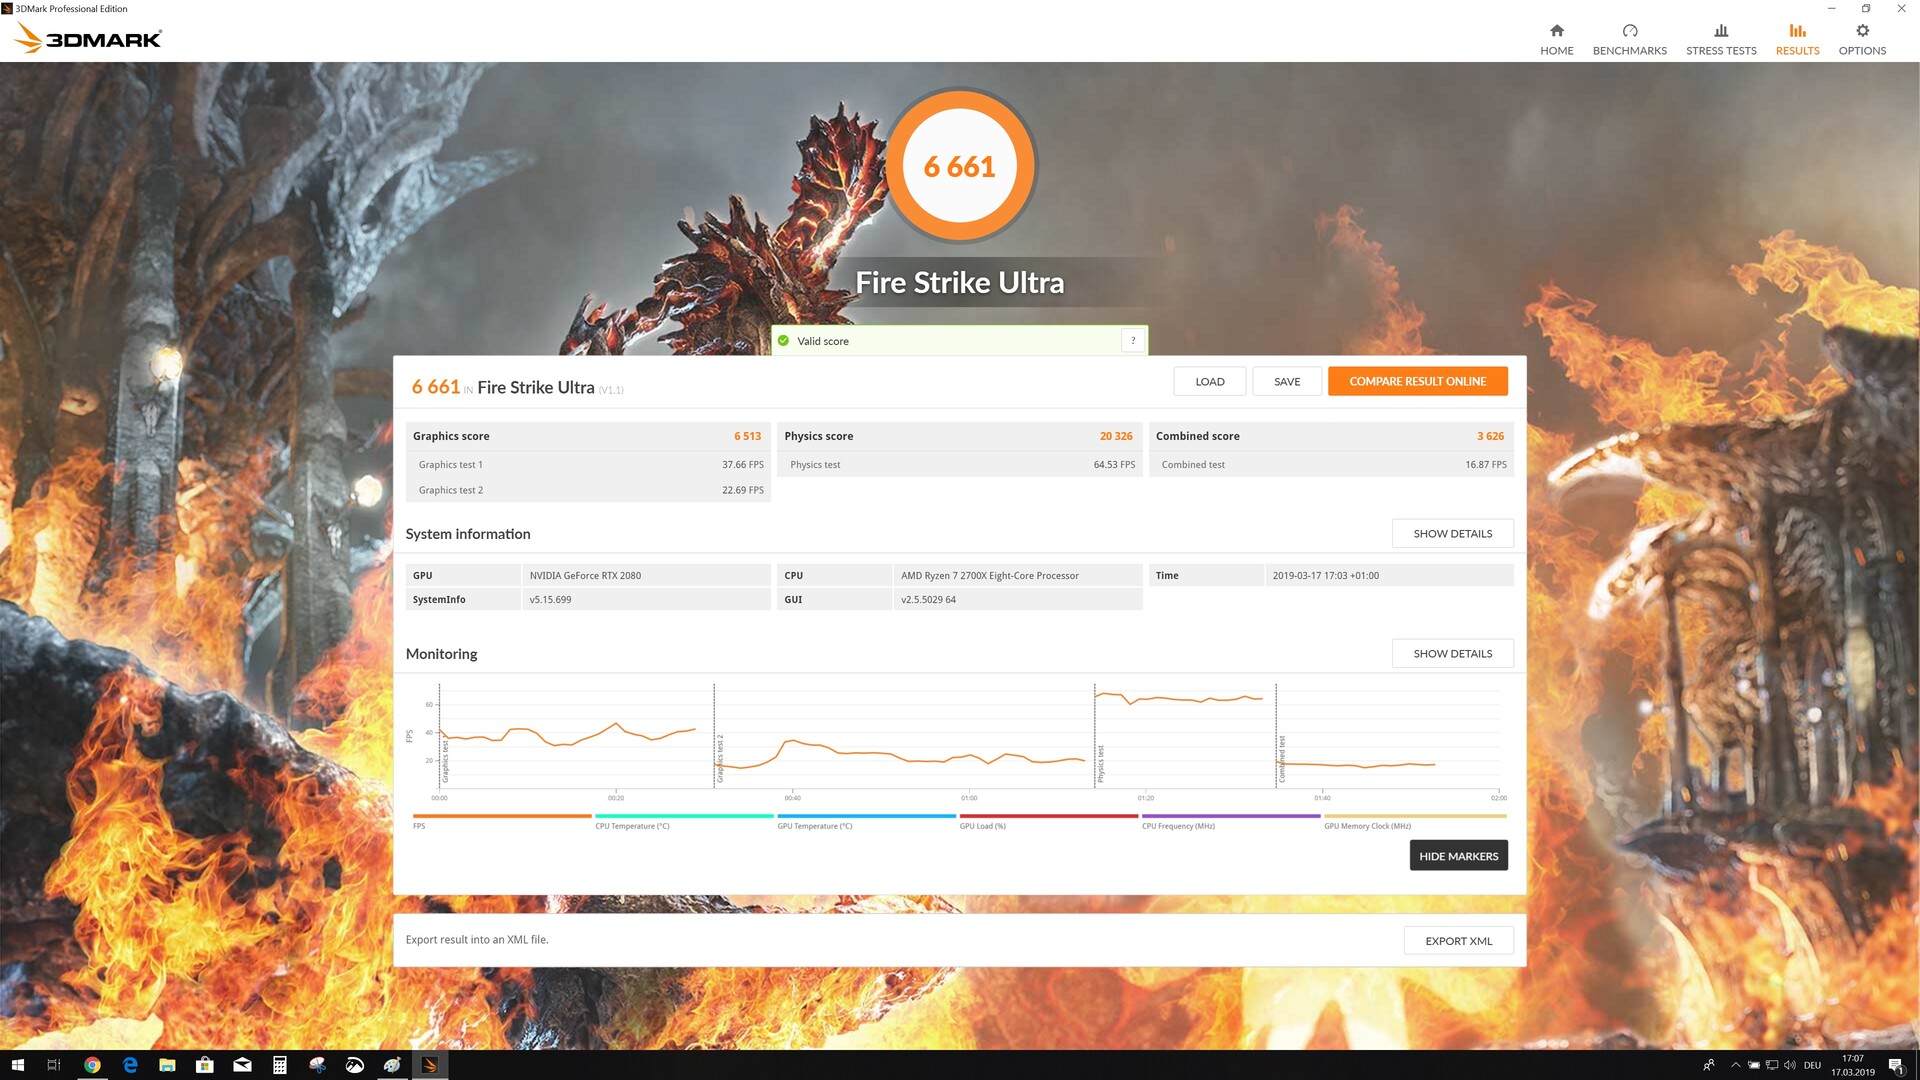
3DMark - 3840x2160 Fire Strike Ultra Graphics
Nvidia Titan RTX
NVIDIA Titan RTX
8625 Points +32%
NVIDIA Titan X Pascal
6911 Points +6%
AMD Radeon VII
AMD Radeon VII
6837 Points +5%
Nvidia GeForce GTX 1080 Ti Founders Edition
NVIDIA GeForce GTX 1080 Ti (Desktop)
6722 Points +3%
MSI RTX 2080 Gaming X Trio
NVIDIA GeForce RTX 2080 (Desktop)
6513 Points
Asus ROG Strix RTX 2080 OC
NVIDIA GeForce RTX 2080 (Desktop)
6379 Points -2%
Asus ROG Strix RTX 2070 OC
NVIDIA GeForce RTX 2070 (Desktop)
5501 Points -16%
MSI RTX 2070 Gaming Z 8G
NVIDIA GeForce RTX 2070 (Desktop)
5450 Points -16%
AMD Radeon RX Vega 64
5441 Points -16%
Nvidia GeForce GTX 1080 Founders Edition
NVIDIA GeForce GTX 1080 (Desktop)
4841 Points -26%
MSI RTX 2060 Gaming Z 6G
NVIDIA GeForce RTX 2060 (Desktop)
4244 Points -35%
Nvidia GeForce GTX 1070 Founders Edition
NVIDIA GeForce GTX 1070 (Desktop)
4126 Points -37%
XFX AMD Radeon RX 590 OC+ 8 GB
AMD Radeon RX 590 (Desktop)
3702 Points -43%
Asus ROG Strix RX 580 8 GB
AMD Radeon RX 580 (Desktop)
3140 Points -52%
3DMark 11 - 1280x720 Performance GPU
Nvidia Titan RTX
NVIDIA Titan RTX
43461 Points +14%
Asus ROG Strix RTX 2080 OC
NVIDIA GeForce RTX 2080 (Desktop)
39651 Points +4%
Nvidia GeForce GTX 1080 Ti Founders Edition
NVIDIA GeForce GTX 1080 Ti (Desktop)
38959 Points +3%
MSI RTX 2080 Gaming X Trio
NVIDIA GeForce RTX 2080 (Desktop)
37989 Points
AMD Radeon VII
AMD Radeon VII
37881 Points 0%
MSI Gaming X GeForce GTX 1080 Desktop PC
NVIDIA GeForce GTX 1080 (Desktop)
32126 Points -15%
Asus ROG Strix RTX 2070 OC
NVIDIA GeForce RTX 2070 (Desktop)
31595 Points -17%
MSI RTX 2070 Gaming Z 8G
NVIDIA GeForce RTX 2070 (Desktop)
31260 Points -18%
Nvidia GeForce GTX 1080 Founders Edition
NVIDIA GeForce GTX 1080 (Desktop)
29443 Points -22%
AMD Radeon RX Vega 64
29285 Points -23%
NVIDIA Titan X Pascal
27632 Points -27%
MSI RTX 2060 Gaming Z 6G
NVIDIA GeForce RTX 2060 (Desktop)
26413 Points -30%
Nvidia GeForce GTX 1070 Founders Edition
NVIDIA GeForce GTX 1070 (Desktop)
23990 Points -37%
XFX AMD Radeon RX 590 OC+ 8 GB
AMD Radeon RX 590 (Desktop)
23202 Points -39%
Asus ROG Strix RX 580 8 GB
AMD Radeon RX 580 (Desktop)
18587 Points -51%
Unigine Heaven 4.0 - Extreme Preset DX11
Nvidia Titan RTX
NVIDIA Titan RTX
207.2 fps +17%
Nvidia GeForce GTX 1080 Ti Founders Edition
NVIDIA GeForce GTX 1080 Ti (Desktop)
180 fps +2%
MSI RTX 2080 Gaming X Trio
NVIDIA GeForce RTX 2080 (Desktop)
176.5 fps
Asus ROG Strix RTX 2080 OC
NVIDIA GeForce RTX 2080 (Desktop)
175.8 fps 0%
MSI RTX 2070 Gaming Z 8G
NVIDIA GeForce RTX 2070 (Desktop)
149.3 fps -15%
Asus ROG Strix RTX 2070 OC
NVIDIA GeForce RTX 2070 (Desktop)
148.1 fps -16%
MSI Gaming X GeForce GTX 1080 Desktop PC
NVIDIA GeForce GTX 1080 (Desktop)
147.4 fps -16%
AMD Radeon VII
AMD Radeon VII
140.3 fps -21%
Nvidia GeForce GTX 1080 Founders Edition
NVIDIA GeForce GTX 1080 (Desktop)
137.7 fps -22%
MSI RTX 2060 Gaming Z 6G
NVIDIA GeForce RTX 2060 (Desktop)
124.1 fps -30%
Nvidia GeForce GTX 1070 Founders Edition
NVIDIA GeForce GTX 1070 (Desktop)
117 fps -34%
Desktop PC
NVIDIA GeForce GTX 1060 (Desktop)
84.3 fps -52%
XFX AMD Radeon RX 590 OC+ 8 GB
AMD Radeon RX 590 (Desktop)
76.1 fps -57%
Asus ROG Strix RX 580 8 GB
AMD Radeon RX 580 (Desktop)
66.7 fps -62%
Unigine Valley 1.0 - 1920x1080 Extreme HD DirectX AA:x8
Nvidia GeForce GTX 1080 Ti Founders Edition
NVIDIA GeForce GTX 1080 Ti (Desktop)
138 fps +15%
Nvidia Titan RTX
NVIDIA Titan RTX
135 fps +13%
Asus ROG Strix RTX 2080 OC
NVIDIA GeForce RTX 2080 (Desktop)
123.3 fps +3%
MSI RTX 2080 Gaming X Trio
NVIDIA GeForce RTX 2080 (Desktop)
119.6 fps
Asus ROG Strix RTX 2070 OC
NVIDIA GeForce RTX 2070 (Desktop)
113.1 fps -5%
MSI RTX 2070 Gaming Z 8G
NVIDIA GeForce RTX 2070 (Desktop)
111.5 fps -7%
MSI Gaming X GeForce GTX 1080 Desktop PC
NVIDIA GeForce GTX 1080 (Desktop)
109.8 (43min - 218max) fps -8%
AMD Radeon VII
AMD Radeon VII
108.5 fps -9%
Nvidia GeForce GTX 1080 Founders Edition
NVIDIA GeForce GTX 1080 (Desktop)
106.9 fps -11%
Nvidia GeForce GTX 1070 Founders Edition
NVIDIA GeForce GTX 1070 (Desktop)
92.6 fps -23%
MSI RTX 2060 Gaming Z 6G
NVIDIA GeForce RTX 2060 (Desktop)
91.2 fps -24%
XFX AMD Radeon RX 590 OC+ 8 GB
AMD Radeon RX 590 (Desktop)
57.3 fps -52%
Asus ROG Strix RX 580 8 GB
AMD Radeon RX 580 (Desktop)
53.8 fps -55%

Gaming Benchmarks - RTX 2080 achieves great results

The Witcher 3 - Frame times (Ultra preset)
The Witcher 3 - Fame rates (Ultra preset)

The MSI RTX 2080 Gaming X Trio and the Asus ROG Strix RTX 2080 OC also battle it out in the gaming benchmarks. Here, both GPUs offer very similar performance with MSI occasionally beating Asus and vice versa. We did not encounter any problems while running benchmarks. Almost all titles are playable in UHD. In a few titles such as Metro Exodus, Monsterhunter World and Kingdom Come Deliverance, the frame rates sometimes fall below 40 FPS, which makes these titles feel stuttery. However, even the Nvidia Titan RTX can only achieve an average frame rate of 49 FPS in Kingdom Come Deliverance, which is not an earth-shattering improvement. In absolute terms, here the Nvidia Titan RTX is 25% faster than the MSI RTX 2080 Gaming X Trio. However, the Titan GPU costs three times as much as the MSI RTX 2080 Gaming X Trio.

All in all, the gaming benchmarks look very good. We did not encounter any anomalies during the benchmarking process.

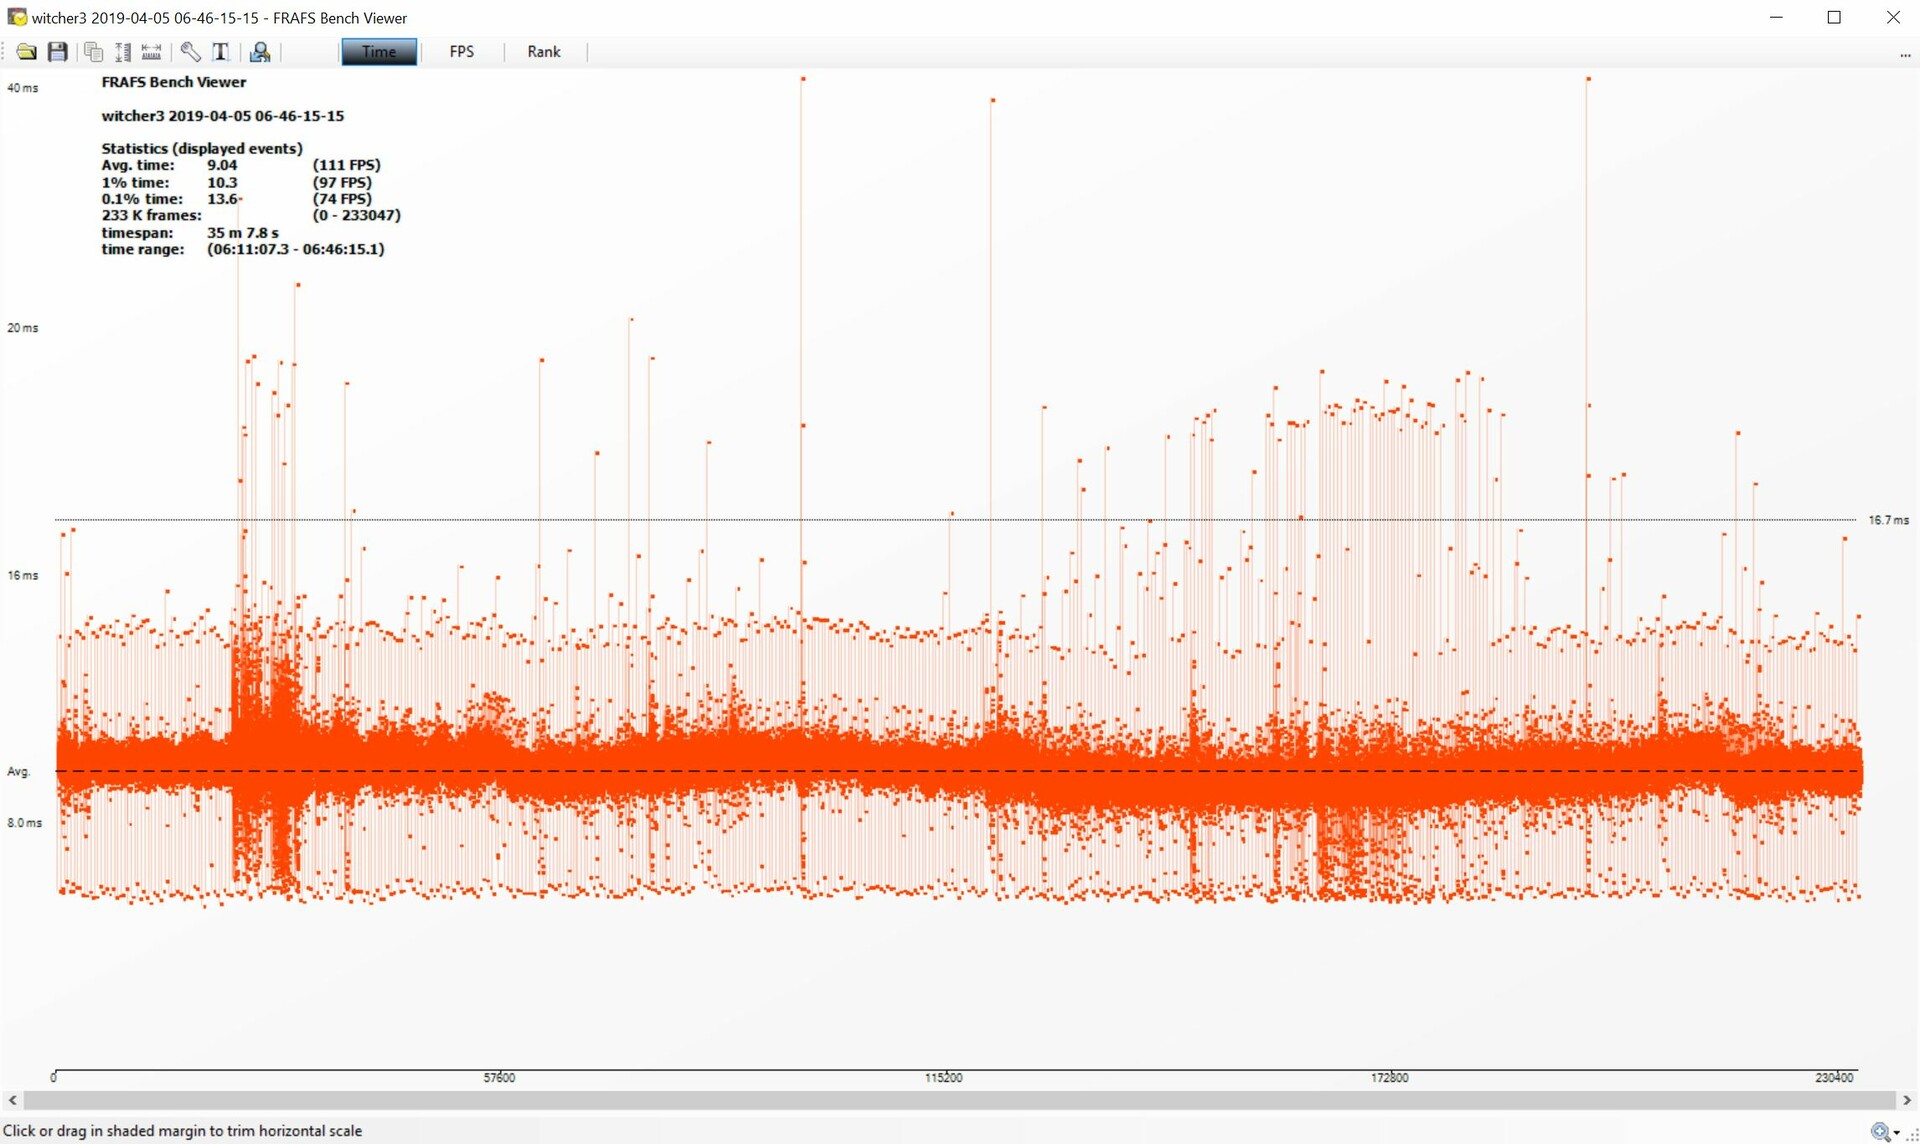
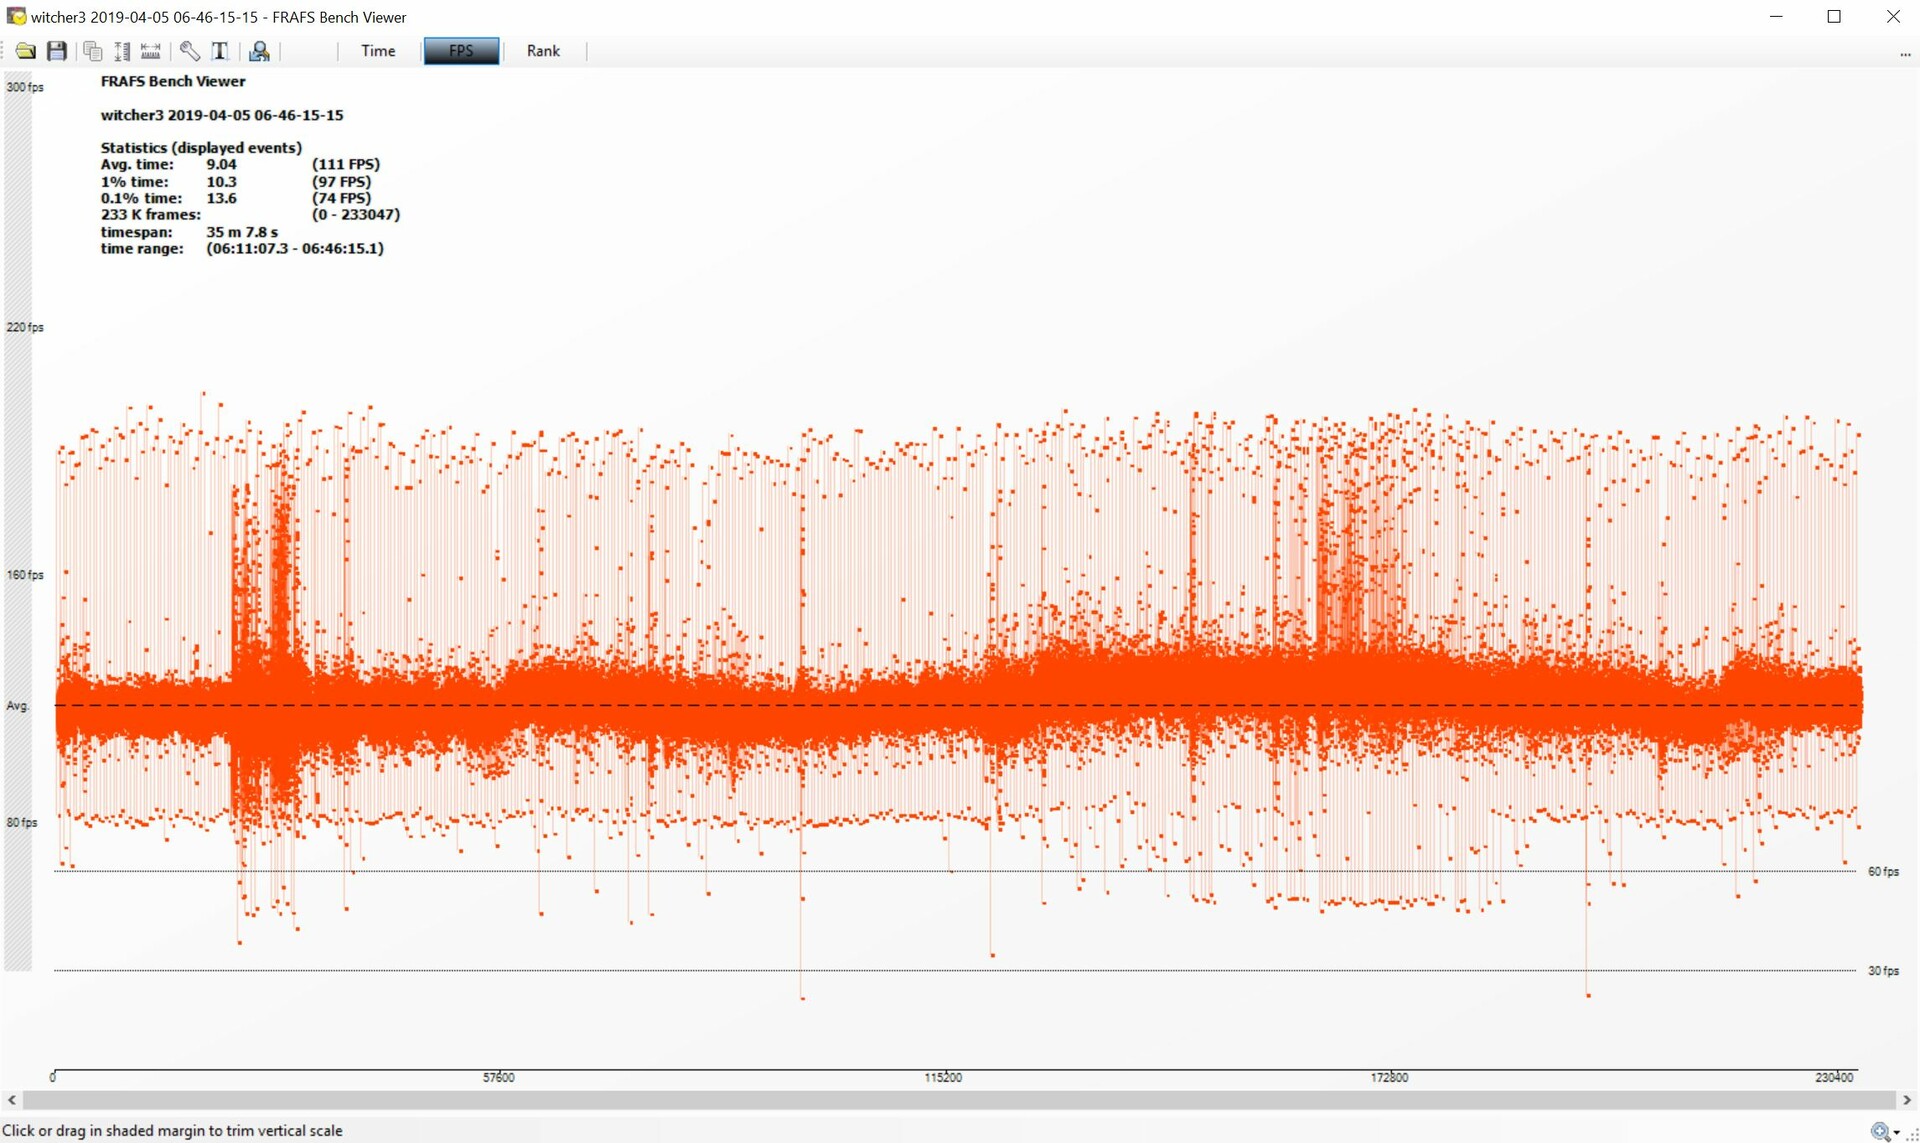
We use the video game known as The Witcher 3 to examine how well the graphics card performs under load. We run the game on ultra settings and record both the frame rate and the frame time. When compared to the MSI RTX 2070 Gaming Z 8G, the frame time performance of the MSI RTX 2080 Gaming X Trio looks somewhat worse. All in all, there are a few anomalies that have very little impact on the actual gaming experience. A very similar image emerges when we take a look at the frame rate performance. The frame rates stay at about 100 FPS most of the time and there are no considerable drops in performance to speak about. This is why we give a positive assessment to the triple-fan cooling solution.

The Witcher 3 - Fame rates (Ultra preset)

05101520253035404550556065707580859095100105110115Tooltip
MSI RTX 2080 Gaming X Trio GeForce RTX 2080 (Desktop), R7 2700X: Ø110.6 (101-117)
Call of Duty Black Ops 4
1920x1080 Very High / On
NVIDIA Titan RTX
NVIDIA Titan RTX, R7 2700X, ADATA Premier Pro SP900NS38 512 GB
200 (159min - 238max) fps +13%
NVIDIA GeForce RTX 2080 (Desktop)
GeForce RTX 2080 (Desktop), R7 2700X
177 (140min - 204max) fps
NVIDIA GeForce RTX 2080 (Desktop)
GeForce RTX 2080 (Desktop), R7 2700X
175 (130min - 216max) fps -1%
AMD Radeon RX Vega 64
RX Vega 64, R7 2700X
166.2 (125min - 210max) fps -6%
NVIDIA Titan X Pascal
Titan X Pascal, TR 1950X, Samsung SM951 MZHPV512HDGL m.2 PCI-e
160.9 (120min - 196max) fps -9%
NVIDIA GeForce RTX 2070 (Desktop)
GeForce RTX 2070 (Desktop), R7 2700X
153 (116min - 189max) fps -14%
NVIDIA GeForce RTX 2070 (Desktop)
GeForce RTX 2070 (Desktop), R7 2700X
149 (117min - 184max) fps -16%
AMD Radeon VII
Radeon VII, R7 2700X
146 (115min - 198max) fps -18%
NVIDIA GeForce RTX 2060 (Desktop)
GeForce RTX 2060 (Desktop), R7 2700X
133 (60min - 170max) fps -25%
AMD Radeon RX 590 (Desktop)
Radeon RX 590, R7 2700X
115.3 (86min - 143max) fps -35%
NVIDIA GeForce GTX 1060 (Desktop)
GeForce GTX 1060 (Desktop), 6700K
75.1 (56min) fps -58%
3840x2160 Very High / On
NVIDIA Titan RTX
NVIDIA Titan RTX, R7 2700X, ADATA Premier Pro SP900NS38 512 GB
88 (66min - 109max) fps +38%
NVIDIA GeForce RTX 2080 (Desktop)
GeForce RTX 2080 (Desktop), R7 2700X
68 (52min - 86max) fps +6%
NVIDIA GeForce RTX 2080 (Desktop)
GeForce RTX 2080 (Desktop), R7 2700X
64 (48min - 79max) fps
NVIDIA Titan X Pascal
Titan X Pascal, TR 1950X, Samsung SM951 MZHPV512HDGL m.2 PCI-e
62.6 (44min - 79max) fps -2%
AMD Radeon RX Vega 64
RX Vega 64, R7 2700X
58.8 (43min - 78max) fps -8%
AMD Radeon VII
Radeon VII, R7 2700X
58.1 (39min - 74max) fps -9%
NVIDIA GeForce RTX 2070 (Desktop)
GeForce RTX 2070 (Desktop), R7 2700X
53 (39min - 69max) fps -17%
NVIDIA GeForce RTX 2070 (Desktop)
GeForce RTX 2070 (Desktop), R7 2700X
47.4 (31min - 64max) fps -26%
NVIDIA GeForce RTX 2060 (Desktop)
GeForce RTX 2060 (Desktop), R7 2700X
39.7 (25min - 55max) fps -38%
AMD Radeon RX 590 (Desktop)
Radeon RX 590, R7 2700X
39 (33min - 47max) fps -39%
NVIDIA GeForce GTX 1060 (Desktop)
GeForce GTX 1060 (Desktop), 6700K
23.7 (15min) fps -63%
Assassin´s Creed Odyssey
1920x1080 Ultra High Preset
NVIDIA Titan RTX
NVIDIA Titan RTX, R7 2700X, ADATA Premier Pro SP900NS38 512 GB
79 fps +16%
NVIDIA GeForce RTX 2080 (Desktop)
GeForce RTX 2080 (Desktop), R7 2700X
68 (31min - 121max) fps 0%
NVIDIA GeForce RTX 2080 (Desktop)
GeForce RTX 2080 (Desktop), R7 2700X
68 fps
NVIDIA Titan X Pascal
Titan X Pascal, TR 1950X, Samsung SM951 MZHPV512HDGL m.2 PCI-e
67 (30min - 125max) fps -1%
NVIDIA GeForce RTX 2070 (Desktop)
GeForce RTX 2070 (Desktop), R7 2700X
64 (30min - 111max) fps -6%
AMD Radeon VII
Radeon VII, R7 2700X
63 fps -7%
NVIDIA GeForce RTX 2070 (Desktop)
GeForce RTX 2070 (Desktop), R7 2700X
61 fps -10%
NVIDIA GeForce RTX 2060 (Desktop)
GeForce RTX 2060 (Desktop), R7 2700X
56 fps -18%
AMD Radeon RX Vega 64
RX Vega 64, R7 2700X
50 (25min - 75max) fps -26%
AMD Radeon RX 590 (Desktop)
Radeon RX 590, R7 2700X
39 (23min - 60max) fps -43%
NVIDIA GeForce GTX 1060 (Desktop)
GeForce GTX 1060 (Desktop), 6700K
38 (27min) fps -44%
AMD Radeon RX 580 (Desktop)
Radeon RX 580, R7 2700X
33 (23min - 79max) fps -51%
3840x2160 Ultra High Preset
NVIDIA Titan RTX
NVIDIA Titan RTX, R7 2700X, ADATA Premier Pro SP900NS38 512 GB
52 fps +27%
AMD Radeon VII
Radeon VII, R7 2700X
44 fps +7%
NVIDIA GeForce RTX 2080 (Desktop)
GeForce RTX 2080 (Desktop), R7 2700X
41 fps
NVIDIA GeForce RTX 2080 (Desktop)
GeForce RTX 2080 (Desktop), R7 2700X
40 (19min - 86max) fps -2%
NVIDIA Titan X Pascal
Titan X Pascal, TR 1950X, Samsung SM951 MZHPV512HDGL m.2 PCI-e
38 (24min - 67max) fps -7%
NVIDIA GeForce RTX 2070 (Desktop)
GeForce RTX 2070 (Desktop), R7 2700X
36 fps -12%
NVIDIA GeForce RTX 2070 (Desktop)
GeForce RTX 2070 (Desktop), R7 2700X
36 (25min - 63max) fps -12%
AMD Radeon RX Vega 64
RX Vega 64, R7 2700X
29 (5min - 64max) fps -29%
NVIDIA GeForce RTX 2060 (Desktop)
GeForce RTX 2060 (Desktop), R7 2700X
28 fps -32%
AMD Radeon RX 590 (Desktop)
Radeon RX 590, R7 2700X
19 (16min - 26max) fps -54%
NVIDIA GeForce GTX 1060 (Desktop)
GeForce GTX 1060 (Desktop), 6700K
18 (14min) fps -56%
AMD Radeon RX 580 (Desktop)
Radeon RX 580, R7 2700X
17 (14min - 24max) fps -59%
FIFA 19
1920x1080 Ultra Preset AA:4x MS
AMD Radeon RX Vega 64
RX Vega 64, R7 2700X
287.8 (267min - 331max) fps +26%
AMD Radeon RX 580 (Desktop)
Radeon RX 580, R7 2700X
252.5 (234min - 279max) fps +11%
NVIDIA GeForce GTX 1060 (Desktop)
GeForce GTX 1060 (Desktop), 6700K
251 (229min) fps +10%
NVIDIA Titan RTX
NVIDIA Titan RTX, R7 2700X, ADATA Premier Pro SP900NS38 512 GB
251 (233min - 258max) fps +10%
AMD Radeon RX 590 (Desktop)
Radeon RX 590, R7 2700X
243.6 (223min - 252max) fps +7%
NVIDIA GeForce RTX 2080 (Desktop)
GeForce RTX 2080 (Desktop), R7 2700X
232.9 (223min - 249max) fps +2%
NVIDIA GeForce RTX 2080 (Desktop)
GeForce RTX 2080 (Desktop), R7 2700X
228 (218min - 235max) fps
AMD Radeon VII
Radeon VII, R7 2700X
227 (225min - 229max) fps 0%
NVIDIA Titan X Pascal
Titan X Pascal, TR 1950X, Samsung SM951 MZHPV512HDGL m.2 PCI-e
221 (8min, 235P1 - 200max) fps -3%
NVIDIA GeForce RTX 2070 (Desktop)
GeForce RTX 2070 (Desktop), R7 2700X
219 (207min - 244max) fps -4%
NVIDIA GeForce RTX 2070 (Desktop)
GeForce RTX 2070 (Desktop), R7 2700X
218.4 (212min - 233max) fps -4%
NVIDIA GeForce RTX 2060 (Desktop)
GeForce RTX 2060 (Desktop), R7 2700X
186.2 (176min - 203max) fps -18%
3840x2160 Ultra Preset AA:4x MS
NVIDIA Titan RTX
NVIDIA Titan RTX, R7 2700X, ADATA Premier Pro SP900NS38 512 GB
213 (203min - 231max) fps +5%
NVIDIA GeForce RTX 2080 (Desktop)
GeForce RTX 2080 (Desktop), R7 2700X
212.4 (196min - 218max) fps +5%
AMD Radeon VII
Radeon VII, R7 2700X
208 (198min - 217max) fps +2%
NVIDIA Titan X Pascal
Titan X Pascal, TR 1950X, Samsung SM951 MZHPV512HDGL m.2 PCI-e
206.7 (186min - 226max) fps +2%
NVIDIA GeForce RTX 2070 (Desktop)
GeForce RTX 2070 (Desktop), R7 2700X
203 (187min - 226max) fps 0%
NVIDIA GeForce RTX 2080 (Desktop)
GeForce RTX 2080 (Desktop), R7 2700X
203 (196min - 219max) fps
NVIDIA GeForce RTX 2070 (Desktop)
GeForce RTX 2070 (Desktop), R7 2700X
174 (171min - 178max) fps -14%
AMD Radeon RX Vega 64
RX Vega 64, R7 2700X
161.4 (148min - 181max) fps -20%
NVIDIA GeForce RTX 2060 (Desktop)
GeForce RTX 2060 (Desktop), R7 2700X
151.2 (146min - 155max) fps -26%
NVIDIA GeForce GTX 1060 (Desktop)
GeForce GTX 1060 (Desktop), 6700K
99.7 (90min) fps -51%
AMD Radeon RX 580 (Desktop)
Radeon RX 580, R7 2700X
97.6 (82min - 112max) fps -52%
AMD Radeon RX 590 (Desktop)
Radeon RX 590, R7 2700X
95.6 (83min - 101max) fps -53%
Forza Horizon 4
1920x1080 Ultra Preset AA:2xMS
NVIDIA GeForce RTX 2080 (Desktop)
GeForce RTX 2080 (Desktop), R7 2700X
139 fps
NVIDIA Titan RTX
NVIDIA Titan RTX, R7 2700X, ADATA Premier Pro SP900NS38 512 GB
132 fps -5%
AMD Radeon VII
Radeon VII, R7 2700X
130 fps -6%
NVIDIA GeForce RTX 2080 (Desktop)
GeForce RTX 2080 (Desktop), R7 2700X
125 fps -10%
AMD Radeon RX Vega 64
RX Vega 64, R7 2700X
121 fps -13%
NVIDIA GeForce RTX 2070 (Desktop)
GeForce RTX 2070 (Desktop), R7 2700X
113 fps -19%
NVIDIA Titan X Pascal
Titan X Pascal, TR 1950X, Samsung SM951 MZHPV512HDGL m.2 PCI-e
112 fps -19%
NVIDIA GeForce RTX 2070 (Desktop)
GeForce RTX 2070 (Desktop), R7 2700X
107 fps -23%
NVIDIA GeForce RTX 2060 (Desktop)
GeForce RTX 2060 (Desktop), R7 2700X
105 fps -24%
AMD Radeon RX 590 (Desktop)
Radeon RX 590, R7 2700X
91 fps -35%
AMD Radeon RX 580 (Desktop)
Radeon RX 580, R7 2700X
78 fps -44%
NVIDIA GeForce GTX 1060 (Desktop)
GeForce GTX 1060 (Desktop), 6700K
73 (63min) fps -47%
3840x2160 Ultra Preset AA:2xMS
NVIDIA Titan RTX
NVIDIA Titan RTX, R7 2700X, ADATA Premier Pro SP900NS38 512 GB
90 fps +7%
NVIDIA GeForce RTX 2080 (Desktop)
GeForce RTX 2080 (Desktop), R7 2700X
84 fps
NVIDIA GeForce RTX 2080 (Desktop)
GeForce RTX 2080 (Desktop), R7 2700X
77 fps -8%
AMD Radeon VII
Radeon VII, R7 2700X
77 fps -8%
NVIDIA Titan X Pascal
Titan X Pascal, TR 1950X, Samsung SM951 MZHPV512HDGL m.2 PCI-e
73 fps -13%
NVIDIA GeForce RTX 2070 (Desktop)
GeForce RTX 2070 (Desktop), R7 2700X
65 fps -23%
AMD Radeon RX Vega 64
RX Vega 64, R7 2700X
62 fps -26%
NVIDIA GeForce RTX 2070 (Desktop)
GeForce RTX 2070 (Desktop), R7 2700X
60 fps -29%
NVIDIA GeForce RTX 2060 (Desktop)
GeForce RTX 2060 (Desktop), R7 2700X
59 fps -30%
AMD Radeon RX 590 (Desktop)
Radeon RX 590, R7 2700X
46 fps -45%
AMD Radeon RX 580 (Desktop)
Radeon RX 580, R7 2700X
39 fps -54%
NVIDIA GeForce GTX 1060 (Desktop)
GeForce GTX 1060 (Desktop), 6700K
38 (32min) fps -55%
F1 2018
1920x1080 Ultra High Preset AA:T AF:16x
NVIDIA Titan RTX
NVIDIA Titan RTX, R7 2700X, ADATA Premier Pro SP900NS38 512 GB
143 (117min - 164max) fps +1%
NVIDIA GeForce RTX 2080 (Desktop)
GeForce RTX 2080 (Desktop), R7 2700X
142 (119min - 162max) fps
NVIDIA GeForce RTX 2080 (Desktop)
GeForce RTX 2080 (Desktop), R7 2700X
141 (117min - 160max) fps -1%
AMD Radeon VII
Radeon VII, R7 2700X
133 (106min - 154max) fps -6%
NVIDIA GeForce RTX 2070 (Desktop)
GeForce RTX 2070 (Desktop), R7 2700X
127 (108min - 143max) fps -11%
NVIDIA GeForce RTX 2070 (Desktop)
GeForce RTX 2070 (Desktop), R7 2700X
121 (107min - 139max) fps -15%
NVIDIA Titan X Pascal
Titan X Pascal, TR 1950X, Samsung SM951 MZHPV512HDGL m.2 PCI-e
117 (87min - 141max) fps -18%
NVIDIA GeForce RTX 2060 (Desktop)
GeForce RTX 2060 (Desktop), R7 2700X
112 (103min - 124max) fps -21%
AMD Radeon RX Vega 64
RX Vega 64, R7 2700X
86 (68min - 108max) fps -39%
AMD Radeon RX 590 (Desktop)
Radeon RX 590, R7 2700X
84 (64min - 100max) fps -41%
AMD Radeon RX 580 (Desktop)
Radeon RX 580, R7 2700X
73 (62min - 88max) fps -49%
NVIDIA GeForce GTX 1060 (Desktop)
GeForce GTX 1060 (Desktop), 6700K
69 (59min) fps -51%
3840x2160 Ultra High Preset AA:T AF:16x
NVIDIA Titan RTX
NVIDIA Titan RTX, R7 2700X, ADATA Premier Pro SP900NS38 512 GB
99 (89min - 109max) fps +27%
NVIDIA GeForce RTX 2080 (Desktop)
GeForce RTX 2080 (Desktop), R7 2700X
78 (69min - 89max) fps
NVIDIA GeForce RTX 2080 (Desktop)
GeForce RTX 2080 (Desktop), R7 2700X
77 (53min - 85max) fps -1%
NVIDIA Titan X Pascal
Titan X Pascal, TR 1950X, Samsung SM951 MZHPV512HDGL m.2 PCI-e
74 (63min - 83max) fps -5%
AMD Radeon VII
Radeon VII, R7 2700X
71 (63min - 82max) fps -9%
NVIDIA GeForce RTX 2070 (Desktop)
GeForce RTX 2070 (Desktop), R7 2700X
65 (55min - 73max) fps -17%
NVIDIA GeForce RTX 2070 (Desktop)
GeForce RTX 2070 (Desktop), R7 2700X
62 (34min - 70max) fps -21%
NVIDIA GeForce RTX 2060 (Desktop)
GeForce RTX 2060 (Desktop), R7 2700X
55 (49min - 61max) fps -29%
AMD Radeon RX Vega 64
RX Vega 64, R7 2700X
49 (42min - 55max) fps -37%
AMD Radeon RX 590 (Desktop)
Radeon RX 590, R7 2700X
39 (34min - 45max) fps -50%
NVIDIA GeForce GTX 1060 (Desktop)
GeForce GTX 1060 (Desktop), 6700K
32 (29min) fps -59%
Monster Hunter World
1920x1080 Highest Preset (Image Quality High)
NVIDIA Titan RTX
NVIDIA Titan RTX, R7 2700X, ADATA Premier Pro SP900NS38 512 GB
136 (95min - 157max) fps +18%
NVIDIA GeForce RTX 2080 (Desktop)
GeForce RTX 2080 (Desktop), R7 2700X
116.5 (89min - 145max) fps +1%
NVIDIA GeForce RTX 2080 (Desktop)
GeForce RTX 2080 (Desktop), R7 2700X
115 (90min - 146max) fps
NVIDIA Titan X Pascal
Titan X Pascal, TR 1950X, Samsung SM951 MZHPV512HDGL m.2 PCI-e
104.4 (84min - 128max) fps -9%
NVIDIA GeForce RTX 2070 (Desktop)
GeForce RTX 2070 (Desktop), R7 2700X
97.7 (75min - 117max) fps -15%
NVIDIA GeForce RTX 2070 (Desktop)
GeForce RTX 2070 (Desktop), R7 2700X
97.6 (74min - 116max) fps -15%
AMD Radeon VII
Radeon VII, R7 2700X
94 (75min - 119max) fps -18%
NVIDIA GeForce RTX 2060 (Desktop)
GeForce RTX 2060 (Desktop), R7 2700X
86 (67min - 105max) fps -25%
AMD Radeon RX Vega 64
RX Vega 64, R7 2700X
85.2 (61min - 109max) fps -26%
AMD Radeon RX 590 (Desktop)
Radeon RX 590, R7 2700X
57.8 (48min - 69max) fps -50%
AMD Radeon RX 580 (Desktop)
Radeon RX 580, R7 2700X
49.6 (41min - 58max) fps -57%
NVIDIA GeForce GTX 1060 (Desktop)
GeForce GTX 1060 (Desktop), 6700K
46.8 (39min) fps -59%
3840x2160 Highest Preset (Image Quality High)
NVIDIA Titan RTX
NVIDIA Titan RTX, R7 2700X, ADATA Premier Pro SP900NS38 512 GB
54 (46min - 64max) fps +40%
NVIDIA GeForce RTX 2080 (Desktop)
GeForce RTX 2080 (Desktop), R7 2700X
38.6 (33min - 46max) fps
NVIDIA GeForce RTX 2080 (Desktop)
GeForce RTX 2080 (Desktop), R7 2700X
38.2 (33min - 43max) fps -1%
NVIDIA Titan X Pascal
Titan X Pascal, TR 1950X, Samsung SM951 MZHPV512HDGL m.2 PCI-e
35.4 (32min - 44max) fps -8%
AMD Radeon VII
Radeon VII, R7 2700X
33.5 (29min - 41max) fps -13%
NVIDIA GeForce RTX 2070 (Desktop)
GeForce RTX 2070 (Desktop), R7 2700X
32.3 (28min - 38max) fps -16%
NVIDIA GeForce RTX 2070 (Desktop)
GeForce RTX 2070 (Desktop), R7 2700X
31.2 (27min - 37max) fps -19%
AMD Radeon RX Vega 64
RX Vega 64, R7 2700X
28.9 (26min - 34max) fps -25%
NVIDIA GeForce RTX 2060 (Desktop)
GeForce RTX 2060 (Desktop), R7 2700X
27.5 (24min - 32max) fps -29%
AMD Radeon RX 590 (Desktop)
Radeon RX 590, R7 2700X
17.9 (16min - 21max) fps -54%
AMD Radeon RX 580 (Desktop)
Radeon RX 580, R7 2700X
15.9 (14min - 19max) fps -59%
NVIDIA GeForce GTX 1060 (Desktop)
GeForce GTX 1060 (Desktop), 6700K
14.9 (13min) fps -61%
Far Cry 5
1920x1080 Ultra Preset AA:T
NVIDIA GeForce RTX 2080 (Desktop)
GeForce RTX 2080 (Desktop), R7 2700X
107 (82min - 145max) fps
NVIDIA GeForce RTX 2070 (Desktop)
GeForce RTX 2070 (Desktop), R7 2700X
105 (83min - 140max) fps -2%
NVIDIA GeForce RTX 2080 (Desktop)
GeForce RTX 2080 (Desktop), R7 2700X
105 (81min - 140max) fps -2%
NVIDIA Titan RTX
NVIDIA Titan RTX, R7 2700X, ADATA Premier Pro SP900NS38 512 GB
103 (77min - 137max) fps -4%
NVIDIA GeForce RTX 2070 (Desktop)
GeForce RTX 2070 (Desktop), R7 2700X
103 (78min - 136max) fps -4%
AMD Radeon RX Vega 64
RX Vega 64, R7 2700X
99 (78min - 124max) fps -7%
NVIDIA GeForce RTX 2060 (Desktop)
GeForce RTX 2060 (Desktop), R7 2700X
94 (72min - 124max) fps -12%
AMD Radeon VII
Radeon VII, R7 2700X
91 (70min - 120max) fps -15%
NVIDIA Titan X Pascal
Titan X Pascal, TR 1950X, Samsung SM951 MZHPV512HDGL m.2 PCI-e
80 (64min - 107max) fps -25%
AMD Radeon RX 590 (Desktop)
Radeon RX 590, R7 2700X
74 (67min - 88max) fps -31%
NVIDIA GeForce GTX 1060 (Desktop)
GeForce GTX 1060 (Desktop), 6700K
70 (60min) fps -35%
AMD Radeon RX 580 (Desktop)
Radeon RX 580, R7 2700X
68 (60min - 81max) fps -36%
3840x2160 Ultra Preset AA:T
NVIDIA Titan RTX
NVIDIA Titan RTX, R7 2700X, ADATA Premier Pro SP900NS38 512 GB
75 (61min - 89max) fps +27%
NVIDIA GeForce RTX 2080 (Desktop)
GeForce RTX 2080 (Desktop), R7 2700X
59 (53min - 71max) fps
AMD Radeon VII
Radeon VII, R7 2700X
59 (50min - 75max) fps 0%
NVIDIA GeForce RTX 2080 (Desktop)
GeForce RTX 2080 (Desktop), R7 2700X
58 (52min - 69max) fps -2%
NVIDIA Titan X Pascal
Titan X Pascal, TR 1950X, Samsung SM951 MZHPV512HDGL m.2 PCI-e
53 (46min - 64max) fps -10%
NVIDIA GeForce RTX 2070 (Desktop)
GeForce RTX 2070 (Desktop), R7 2700X
49 (43min - 58max) fps -17%
NVIDIA GeForce RTX 2070 (Desktop)
GeForce RTX 2070 (Desktop), R7 2700X
48 (41min - 57max) fps -19%
AMD Radeon RX Vega 64
RX Vega 64, R7 2700X
44 (37min - 56max) fps -25%
NVIDIA GeForce RTX 2060 (Desktop)
GeForce RTX 2060 (Desktop), R7 2700X
41 (37min - 49max) fps -31%
AMD Radeon RX 580 (Desktop)
Radeon RX 580, R7 2700X
26 (22min - 33max) fps -56%
AMD Radeon RX 590 (Desktop)
Radeon RX 590, R7 2700X
24 (21min - 29max) fps -59%
NVIDIA GeForce GTX 1060 (Desktop)
GeForce GTX 1060 (Desktop), 6700K
23 (20min) fps -61%
The Crew 2
1920x1080 Ultra Preset
NVIDIA GeForce GTX 1060 (Desktop)
GeForce GTX 1060 (Desktop), 6700K
60 (59min) fps 0%
NVIDIA Titan X Pascal
Titan X Pascal, TR 1950X, Samsung SM951 MZHPV512HDGL m.2 PCI-e
60 fps 0%
AMD Radeon RX 580 (Desktop)
Radeon RX 580, R7 2700X
60 fps 0%
NVIDIA GeForce RTX 2070 (Desktop)
GeForce RTX 2070 (Desktop), R7 2700X
60 fps 0%
NVIDIA GeForce RTX 2080 (Desktop)
GeForce RTX 2080 (Desktop), R7 2700X
60 fps 0%
AMD Radeon RX 590 (Desktop)
Radeon RX 590, R7 2700X
60 fps 0%
NVIDIA Titan RTX
NVIDIA Titan RTX, R7 2700X, ADATA Premier Pro SP900NS38 512 GB
60 fps 0%
NVIDIA GeForce RTX 2060 (Desktop)
GeForce RTX 2060 (Desktop), R7 2700X
60 fps 0%
NVIDIA GeForce RTX 2070 (Desktop)
GeForce RTX 2070 (Desktop), R7 2700X
60 fps 0%
NVIDIA GeForce RTX 2080 (Desktop)
GeForce RTX 2080 (Desktop), R7 2700X
60 fps
AMD Radeon VII
Radeon VII, R7 2700X
60 fps 0%
3840x2160 Ultra Preset
NVIDIA GeForce RTX 2080 (Desktop)
GeForce RTX 2080 (Desktop), R7 2700X
60 fps 0%
NVIDIA Titan RTX
NVIDIA Titan RTX, R7 2700X, ADATA Premier Pro SP900NS38 512 GB
60 fps 0%
NVIDIA GeForce RTX 2080 (Desktop)
GeForce RTX 2080 (Desktop), R7 2700X
60 fps
NVIDIA GeForce RTX 2070 (Desktop)
GeForce RTX 2070 (Desktop), R7 2700X
56 fps -7%
NVIDIA Titan X Pascal
Titan X Pascal, TR 1950X, Samsung SM951 MZHPV512HDGL m.2 PCI-e
49.7 (44min - 58max) fps -17%
NVIDIA GeForce RTX 2070 (Desktop)
GeForce RTX 2070 (Desktop), R7 2700X
42.4 fps -29%
AMD Radeon VII
Radeon VII, R7 2700X
41 fps -32%
NVIDIA GeForce RTX 2060 (Desktop)
GeForce RTX 2060 (Desktop), R7 2700X
35.3 fps -41%
AMD Radeon RX 580 (Desktop)
Radeon RX 580, R7 2700X
28 fps -53%
AMD Radeon RX 590 (Desktop)
Radeon RX 590, R7 2700X
26.8 fps -55%
NVIDIA GeForce GTX 1060 (Desktop)
GeForce GTX 1060 (Desktop), 6700K
24.4 (21min) fps -59%
Assassin´s Creed Origins
1920x1080 Ultra High Preset
NVIDIA GeForce RTX 2080 (Desktop)
GeForce RTX 2080 (Desktop), R7 2700X
87 fps +1%
NVIDIA Titan RTX
NVIDIA Titan RTX, R7 2700X, ADATA Premier Pro SP900NS38 512 GB
87 fps +1%
NVIDIA GeForce RTX 2080 (Desktop)
GeForce RTX 2080 (Desktop), R7 2700X
86 fps
NVIDIA GeForce RTX 2070 (Desktop)
GeForce RTX 2070 (Desktop), R7 2700X
83 fps -3%
NVIDIA GeForce RTX 2070 (Desktop)
GeForce RTX 2070 (Desktop), R7 2700X
83 fps -3%
NVIDIA GeForce GTX 1080 Ti (Desktop)
GeForce GTX 1080 Ti, 4790K, Samsung SSD 840 Pro 256GB MZ7PD256HAFV-0Z000
79 (42min - 124max) fps -8%
NVIDIA GeForce RTX 2060 (Desktop)
GeForce RTX 2060 (Desktop), R7 2700X
78 fps -9%
AMD Radeon RX Vega 64
RX Vega 64, R7 2700X
63 fps -27%
AMD Radeon VII
Radeon VII, R7 2700X
63 fps -27%
NVIDIA GeForce GTX 1060 (Desktop)
GeForce GTX 1060 (Desktop), 6700K
57 (26min) fps -34%
AMD Radeon RX 590 (Desktop)
Radeon RX 590, R7 2700X
53 fps -38%
AMD Radeon RX 580 (Desktop)
Radeon RX 580, R7 2700X
45 fps -48%
3840x2160 Ultra High Preset
NVIDIA Titan RTX
NVIDIA Titan RTX, R7 2700X, ADATA Premier Pro SP900NS38 512 GB
65 fps +25%
NVIDIA GeForce RTX 2080 (Desktop)
GeForce RTX 2080 (Desktop), R7 2700X
52 fps
NVIDIA GeForce RTX 2080 (Desktop)
GeForce RTX 2080 (Desktop), R7 2700X
51 fps -2%
NVIDIA GeForce GTX 1080 Ti (Desktop)
GeForce GTX 1080 Ti, 4790K, Samsung SSD 840 Pro 256GB MZ7PD256HAFV-0Z000
49 (31min - 84max) fps -6%
AMD Radeon VII
Radeon VII, R7 2700X
49 fps -6%
NVIDIA GeForce RTX 2070 (Desktop)
GeForce RTX 2070 (Desktop), R7 2700X
46 fps -12%
NVIDIA GeForce RTX 2070 (Desktop)
GeForce RTX 2070 (Desktop), R7 2700X
46 fps -12%
NVIDIA GeForce RTX 2060 (Desktop)
GeForce RTX 2060 (Desktop), R7 2700X
39 fps -25%
AMD Radeon RX Vega 64
RX Vega 64, R7 2700X
33 fps -37%
AMD Radeon RX 590 (Desktop)
Radeon RX 590, R7 2700X
25 fps -52%
NVIDIA GeForce GTX 1060 (Desktop)
GeForce GTX 1060 (Desktop), 6700K
23 (13min) fps -56%
AMD Radeon RX 580 (Desktop)
Radeon RX 580, R7 2700X
21 fps -60%
Kingdom Come: Deliverance
1920x1080 Ultra High Preset
NVIDIA GeForce RTX 2080 (Desktop)
GeForce RTX 2080 (Desktop), R7 2700X
83.3 (58min - 103max) fps +7%
NVIDIA GeForce RTX 2070 (Desktop)
GeForce RTX 2070 (Desktop), R7 2700X
79.8 (61min - 100max) fps +2%
NVIDIA Titan RTX
NVIDIA Titan RTX, R7 2700X, ADATA Premier Pro SP900NS38 512 GB
79 (61min - 108max) fps +1%
NVIDIA GeForce RTX 2080 (Desktop)
GeForce RTX 2080 (Desktop), R7 2700X
78 (53min - 100max) fps
NVIDIA GeForce RTX 2070 (Desktop)
GeForce RTX 2070 (Desktop), R7 2700X
77.9 (58min - 99max) fps 0%
NVIDIA GeForce GTX 1080 Ti (Desktop)
GeForce GTX 1080 Ti, 4790K, Samsung SSD 840 Pro 256GB MZ7PD256HAFV-0Z000
73 (53min - 92max) fps -6%
AMD Radeon RX Vega 64
RX Vega 64, R7 2700X
72.9 (55min - 90max) fps -7%
AMD Radeon VII
Radeon VII, R7 2700X
71 (51min - 95max) fps -9%
NVIDIA GeForce RTX 2060 (Desktop)
GeForce RTX 2060 (Desktop), R7 2700X
70 (50min - 83max) fps -10%
AMD Radeon RX 590 (Desktop)
Radeon RX 590, R7 2700X
54.6 (43min - 65max) fps -30%
NVIDIA GeForce GTX 1060 (Desktop)
GeForce GTX 1060 (Desktop), 6700K
50.2 (42min) fps -36%
AMD Radeon RX 580 (Desktop)
Radeon RX 580, R7 2700X
49.6 (39min - 58max) fps -36%
3840x2160 Ultra High Preset
NVIDIA Titan RTX
NVIDIA Titan RTX, R7 2700X, ADATA Premier Pro SP900NS38 512 GB
49 (41min - 56max) fps +25%
NVIDIA GeForce RTX 2080 (Desktop)
GeForce RTX 2080 (Desktop), R7 2700X
39.1 (32min - 44max) fps
NVIDIA GeForce RTX 2080 (Desktop)
GeForce RTX 2080 (Desktop), R7 2700X
38.5 (32min - 44max) fps -2%
AMD Radeon RX Vega 64
RX Vega 64, R7 2700X
36.5 (31min - 40max) fps -7%
NVIDIA GeForce GTX 1080 Ti (Desktop)
GeForce GTX 1080 Ti, 4790K, Samsung SSD 840 Pro 256GB MZ7PD256HAFV-0Z000
31 (24min - 36max) fps -21%
NVIDIA GeForce RTX 2070 (Desktop)
GeForce RTX 2070 (Desktop), R7 2700X
31 (26min - 35max) fps -21%
AMD Radeon VII
Radeon VII, R7 2700X
30.8 (25min - 35max) fps -21%
NVIDIA GeForce RTX 2070 (Desktop)
GeForce RTX 2070 (Desktop), R7 2700X
30.7 (26min - 34max) fps -21%
NVIDIA GeForce RTX 2060 (Desktop)
GeForce RTX 2060 (Desktop), R7 2700X
25 (21min - 29max) fps -36%
AMD Radeon RX 590 (Desktop)
Radeon RX 590, R7 2700X
17 (13min - 20max) fps -57%
AMD Radeon RX 580 (Desktop)
Radeon RX 580, R7 2700X
15.8 (13min - 18max) fps -60%
NVIDIA GeForce GTX 1060 (Desktop)
GeForce GTX 1060 (Desktop), 6700K
14.8 (12min) fps -62%
Fortnite
1920x1080 Epic Preset
NVIDIA GeForce RTX 2080 (Desktop)
GeForce RTX 2080 (Desktop), R7 2700X
165.3 fps +12%
NVIDIA GeForce GTX 1080 Ti (Desktop)
GeForce GTX 1080 Ti, 4790K, Samsung SSD 840 Pro 256GB MZ7PD256HAFV-0Z000
163 (148min - 180max) fps +11%
NVIDIA GeForce RTX 2070 (Desktop)
GeForce RTX 2070 (Desktop), R7 2700X
155.9 (129min - 182max) fps +6%
NVIDIA GeForce RTX 2080 (Desktop)
GeForce RTX 2080 (Desktop), R7 2700X
147 (115min - 180max) fps
NVIDIA GeForce RTX 2060 (Desktop)
GeForce RTX 2060 (Desktop), R7 2700X
141 (118min - 156max) fps -4%
NVIDIA GeForce RTX 2070 (Desktop)
GeForce RTX 2070 (Desktop), R7 2700X
135.6 (111min - 161max) fps -8%
NVIDIA Titan RTX
NVIDIA Titan RTX, R7 2700X, ADATA Premier Pro SP900NS38 512 GB
134 (100min - 197max) fps -9%
AMD Radeon VII
Radeon VII, R7 2700X
114 (97min - 125max) fps -22%
AMD Radeon RX 590 (Desktop)
Radeon RX 590, R7 2700X
95.8 (83min - 106max) fps -35%
NVIDIA GeForce GTX 1060 (Desktop)
GeForce GTX 1060 (Desktop), 6700K
90.8 (84min) fps -38%
AMD Radeon RX 580 (Desktop)
Radeon RX 580, R7 2700X
80.7 fps -45%
3840x2160 Epic Preset
NVIDIA Titan RTX
NVIDIA Titan RTX, R7 2700X, ADATA Premier Pro SP900NS38 512 GB
74 (59min - 87max) fps +12%
NVIDIA GeForce RTX 2080 (Desktop)
GeForce RTX 2080 (Desktop), R7 2700X
66 (58min - 71max) fps
NVIDIA GeForce RTX 2080 (Desktop)
GeForce RTX 2080 (Desktop), R7 2700X
63.6 fps -4%
NVIDIA GeForce RTX 2070 (Desktop)
GeForce RTX 2070 (Desktop), R7 2700X
53.3 (43min - 62max) fps -19%
NVIDIA GeForce RTX 2070 (Desktop)
GeForce RTX 2070 (Desktop), R7 2700X
53.2 (46min - 60max) fps -19%
NVIDIA GeForce GTX 1080 Ti (Desktop)
GeForce GTX 1080 Ti, 4790K, Samsung SSD 840 Pro 256GB MZ7PD256HAFV-0Z000
51.4 (49min - 54max) fps -22%
AMD Radeon VII
Radeon VII, R7 2700X
44.4 (40min - 50max) fps -33%
NVIDIA GeForce RTX 2060 (Desktop)
GeForce RTX 2060 (Desktop), R7 2700X
38 (32min - 42max) fps -42%
AMD Radeon RX 590 (Desktop)
Radeon RX 590, R7 2700X
28.7 (26min - 31max) fps -57%
NVIDIA GeForce GTX 1060 (Desktop)
GeForce GTX 1060 (Desktop), 6700K
26.4 (25min) fps -60%
AMD Radeon RX 580 (Desktop)
Radeon RX 580, R7 2700X
23.3 fps -65%
Final Fantasy XV Benchmark
1920x1080 High Quality
NVIDIA Titan RTX
NVIDIA Titan RTX, R7 2700X, ADATA Premier Pro SP900NS38 512 GB
112 (65min - 172max) fps +17%
NVIDIA GeForce RTX 2080 (Desktop)
GeForce RTX 2080 (Desktop), R7 2700X
96.6 (54min - 142max) fps +1%
NVIDIA GeForce RTX 2080 (Desktop)
GeForce RTX 2080 (Desktop), R7 2700X
96.1 fps
NVIDIA GeForce GTX 1080 Ti (Desktop)
GeForce GTX 1080 Ti, 4790K, Samsung SSD 840 Pro 256GB MZ7PD256HAFV-0Z000
92 fps -4%
NVIDIA GeForce RTX 2070 (Desktop)
GeForce RTX 2070 (Desktop), R7 2700X
85.7 (48min - 130max) fps -11%
NVIDIA GeForce RTX 2070 (Desktop)
GeForce RTX 2070 (Desktop), R7 2700X
83.5 (36min - 125max) fps -13%
NVIDIA GeForce RTX 2060 (Desktop)
GeForce RTX 2060 (Desktop), R7 2700X
72.6 (31min - 114max) fps -24%
NVIDIA GeForce GTX 1080 (Desktop)
GeForce GTX 1080 (Desktop), 4790K, Samsung SSD 840 Pro 256GB MZ7PD256HAFV-0Z000
69 fps -28%
AMD Radeon RX Vega 64
RX Vega 64, R7 2700X
58.5 (23min - 92max) fps -39%
AMD Radeon RX Vega 64
RX Vega 64, R7 2700X
58.5 (23min - 92max) fps -39%
NVIDIA GeForce GTX 1060 (Desktop)
GeForce GTX 1060 (Desktop), 6700K
43.4 (12min) fps -55%
AMD Radeon RX 590 (Desktop)
Radeon RX 590, R7 2700X
43.3 (25min - 66max) fps -55%
AMD Radeon RX 580 (Desktop)
Radeon RX 580, R7 2700X
37.3 (16min - 59max) fps -61%
3840x2160 High Quality
NVIDIA Titan RTX
NVIDIA Titan RTX, R7 2700X, ADATA Premier Pro SP900NS38 512 GB
58 (39min - 87max) fps +31%
NVIDIA GeForce RTX 2080 (Desktop)
GeForce RTX 2080 (Desktop), R7 2700X
44.5 (21min - 63max) fps +1%
NVIDIA GeForce RTX 2080 (Desktop)
GeForce RTX 2080 (Desktop), R7 2700X
44.2 fps
NVIDIA GeForce GTX 1080 Ti (Desktop)
GeForce GTX 1080 Ti, 4790K, Samsung SSD 840 Pro 256GB MZ7PD256HAFV-0Z000
42.3 (31min - 64max) fps -4%
NVIDIA GeForce RTX 2070 (Desktop)
GeForce RTX 2070 (Desktop), R7 2700X
38.3 (21min - 57max) fps -13%
NVIDIA GeForce RTX 2070 (Desktop)
GeForce RTX 2070 (Desktop), R7 2700X
38.2 (21min - 56max) fps -14%
NVIDIA GeForce RTX 2060 (Desktop)
GeForce RTX 2060 (Desktop), R7 2700X
30.8 (13min - 45max) fps -30%
NVIDIA GeForce GTX 1080 (Desktop)
GeForce GTX 1080 (Desktop), 4790K, Samsung SSD 840 Pro 256GB MZ7PD256HAFV-0Z000
30.4 (22min - 44max) fps -31%
AMD Radeon RX Vega 64
RX Vega 64, R7 2700X
27.9 (20min - 42max) fps -37%
AMD Radeon RX Vega 64
RX Vega 64, R7 2700X
27.9 (20min - 42max) fps -37%
AMD Radeon RX 590 (Desktop)
Radeon RX 590, R7 2700X
19.6 (14min - 29max) fps -56%
NVIDIA GeForce GTX 1060 (Desktop)
GeForce GTX 1060 (Desktop), 6700K
18.4 fps -58%
AMD Radeon RX 580 (Desktop)
Radeon RX 580, R7 2700X
16.9 (8min - 26max) fps -62%
Destiny 2
1920x1080 Highest Preset AA:SM AF:16x
NVIDIA GeForce RTX 2080 (Desktop)
GeForce RTX 2080 (Desktop), R7 2700X
169.2 fps +16%
NVIDIA GeForce GTX 1080 Ti (Desktop)
GeForce GTX 1080 Ti, 4790K, Samsung SSD 840 Pro 256GB MZ7PD256HAFV-0Z000
158 (8.3P1) fps +8%
NVIDIA GeForce RTX 2070 (Desktop)
GeForce RTX 2070 (Desktop), R7 2700X
157 fps +7%
NVIDIA Titan RTX
NVIDIA Titan RTX, R7 2700X, ADATA Premier Pro SP900NS38 512 GB
154 fps +5%
NVIDIA GeForce RTX 2070 (Desktop)
GeForce RTX 2070 (Desktop), R7 2700X
150 fps +3%
NVIDIA GeForce RTX 2080 (Desktop)
GeForce RTX 2080 (Desktop), R7 2700X
146.1 fps
AMD Radeon VII
Radeon VII, R7 2700X
112 fps -23%
NVIDIA GeForce RTX 2060 (Desktop)
GeForce RTX 2060 (Desktop), R7 2700X
103 (42.1P1) fps -30%
NVIDIA GeForce GTX 1060 (Desktop)
GeForce GTX 1060 (Desktop), 6700K
86.9 (66min) fps -41%
3840x2160 Highest Preset AA:SM AF:16x
NVIDIA Titan RTX
NVIDIA Titan RTX, R7 2700X, ADATA Premier Pro SP900NS38 512 GB
94 fps +30%
NVIDIA GeForce RTX 2080 (Desktop)
GeForce RTX 2080 (Desktop), R7 2700X
72.4 fps
NVIDIA GeForce RTX 2080 (Desktop)
GeForce RTX 2080 (Desktop), R7 2700X
71.5 fps -1%
NVIDIA GeForce RTX 2070 (Desktop)
GeForce RTX 2070 (Desktop), R7 2700X
60 fps -17%
NVIDIA GeForce RTX 2070 (Desktop)
GeForce RTX 2070 (Desktop), R7 2700X
59.1 fps -18%
NVIDIA GeForce GTX 1080 Ti (Desktop)
GeForce GTX 1080 Ti, 4790K, Samsung SSD 840 Pro 256GB MZ7PD256HAFV-0Z000
51.5 (22.8P1) fps -29%
AMD Radeon VII
Radeon VII, R7 2700X
51 fps -30%
NVIDIA GeForce RTX 2060 (Desktop)
GeForce RTX 2060 (Desktop), R7 2700X
49.7 (38.2P1) fps -31%
NVIDIA GeForce GTX 1060 (Desktop)
GeForce GTX 1060 (Desktop), 6700K
21.7 (20min) fps -70%
Far Cry Primal
1920x1080 Ultra Preset AA:SM
NVIDIA GeForce GTX 1080 Ti (Desktop)
GeForce GTX 1080 Ti, 4790K, Samsung SSD 840 Pro 256GB MZ7PD256HAFV-0Z000
121 (81min - 149max) fps +34%
NVIDIA GeForce GTX 1080 (Desktop)
GeForce GTX 1080 (Desktop), 4790K, Samsung SSD 840 Pro 256GB MZ7PD256HAFV-0Z000
107 (82min - 125max) fps +19%
NVIDIA GeForce GTX 1080 (Desktop)
GeForce GTX 1080 (Desktop), 4790K, Samsung SSD 840 Pro 256GB MZ7PD256HAFV-0Z000
106 (80min - 125max) fps +18%
NVIDIA GeForce RTX 2080 (Desktop)
GeForce RTX 2080 (Desktop), R7 2700X
97 (69min - 113max) fps +8%
AMD Radeon RX Vega 64
RX Vega 64, R7 2700X
96 (67min - 113max) fps +7%
NVIDIA GeForce RTX 2070 (Desktop)
GeForce RTX 2070 (Desktop), R7 2700X
95 (64min - 113max) fps +6%
NVIDIA GeForce RTX 2070 (Desktop)
GeForce RTX 2070 (Desktop), R7 2700X
94 (64min - 110max) fps +4%
AMD Radeon VII
Radeon VII, R7 2700X
94 (67min - 112max) fps +4%
NVIDIA GeForce RTX 2060 (Desktop)
GeForce RTX 2060 (Desktop), R7 2700X
91 (66min - 109max) fps +1%
NVIDIA GeForce GTX 1070 (Desktop)
GeForce GTX 1070 (Desktop), 4790K, Samsung SSD 840 Pro 256GB MZ7PD256HAFV-0Z000
90 (72min - 105max) fps 0%
NVIDIA GeForce RTX 2080 (Desktop)
GeForce RTX 2080 (Desktop), R7 2700X
90 (65min - 107max) fps
NVIDIA Titan RTX
NVIDIA Titan RTX, R7 2700X, ADATA Premier Pro SP900NS38 512 GB
88 (63min - 105max) fps -2%
AMD Radeon RX 590 (Desktop)
Radeon RX 590, R7 2700X
68 (54min - 86max) fps -24%
AMD Radeon RX 580 (Desktop)
Radeon RX 580, R7 2700X
60 (47min - 75max) fps -33%
3840x2160 High Preset AA:SM
NVIDIA Titan RTX
NVIDIA Titan RTX, R7 2700X, ADATA Premier Pro SP900NS38 512 GB
88 (72min - 99max) fps +24%
NVIDIA GeForce RTX 2080 (Desktop)
GeForce RTX 2080 (Desktop), R7 2700X
71 (65min - 78max) fps
AMD Radeon VII
Radeon VII, R7 2700X
69 (61min - 76max) fps -3%
NVIDIA GeForce RTX 2080 (Desktop)
GeForce RTX 2080 (Desktop), R7 2700X
68 (63min - 75max) fps -4%
NVIDIA GeForce GTX 1080 Ti (Desktop)
GeForce GTX 1080 Ti, 4790K, Samsung SSD 840 Pro 256GB MZ7PD256HAFV-0Z000
64 (59min - 70max) fps -10%
NVIDIA GeForce RTX 2070 (Desktop)
GeForce RTX 2070 (Desktop), R7 2700X
59 (53min - 64max) fps -17%
NVIDIA GeForce RTX 2070 (Desktop)
GeForce RTX 2070 (Desktop), R7 2700X
59 (54min - 64max) fps -17%
NVIDIA GeForce GTX 1080 (Desktop)
GeForce GTX 1080 (Desktop), 4790K, Samsung SSD 840 Pro 256GB MZ7PD256HAFV-0Z000
50 (46min - 54max) fps -30%
NVIDIA GeForce RTX 2060 (Desktop)
GeForce RTX 2060 (Desktop), R7 2700X
50 (46min - 55max) fps -30%
NVIDIA GeForce GTX 1080 (Desktop)
GeForce GTX 1080 (Desktop), 4790K, Samsung SSD 840 Pro 256GB MZ7PD256HAFV-0Z000
49 (46min - 53max) fps -31%
AMD Radeon RX Vega 64
RX Vega 64, R7 2700X
49 (45min - 54max) fps -31%
NVIDIA GeForce GTX 1070 (Desktop)
GeForce GTX 1070 (Desktop), 4790K, Samsung SSD 840 Pro 256GB MZ7PD256HAFV-0Z000
38 (36min - 42max) fps -46%
AMD Radeon RX 590 (Desktop)
Radeon RX 590, R7 2700X
34 (31min - 37max) fps -52%
AMD Radeon RX 580 (Desktop)
Radeon RX 580, R7 2700X
30 (28min - 33max) fps -58%
The Witcher 3
1920x1080 Ultra Graphics & Postprocessing (HBAO+)
NVIDIA Titan RTX
NVIDIA Titan RTX, R7 2700X, ADATA Premier Pro SP900NS38 512 GB
128 (111min - 142max) fps +17%
NVIDIA GeForce RTX 2080 (Desktop)
GeForce RTX 2080 (Desktop), R7 2700X
109 (94min - 120max) fps
NVIDIA GeForce RTX 2080 (Desktop)
GeForce RTX 2080 (Desktop), R7 2700X
103.4 (81min - 119max) fps -5%
NVIDIA GeForce GTX 1080 Ti (Desktop)
GeForce GTX 1080 Ti, 4790K, Samsung SSD 840 Pro 256GB MZ7PD256HAFV-0Z000
98 (83min - 112max) fps -10%
NVIDIA GeForce RTX 2070 (Desktop)
GeForce RTX 2070 (Desktop), R7 2700X
89.9 (81min - 101max) fps -18%
NVIDIA GeForce RTX 2070 (Desktop)
GeForce RTX 2070 (Desktop), R7 2700X
87 (72min - 100max) fps -20%
NVIDIA GeForce GTX 1080 (Desktop)
GeForce GTX 1080 (Desktop), 4790K, Samsung SSD 840 Pro 256GB MZ7PD256HAFV-0Z000
82 (70min - 90max) fps -25%
AMD Radeon RX Vega 64
RX Vega 64, R7 2700X
77 (67min - 84max) fps -29%
NVIDIA GeForce GTX 1080 (Desktop)
GeForce GTX 1080 (Desktop), 4790K, Samsung SSD 840 Pro 256GB MZ7PD256HAFV-0Z000
76.4 (64min - 85max) fps -30%
AMD Radeon VII
Radeon VII, R7 2700X
75 (65min - 83max) fps -31%
NVIDIA GeForce RTX 2060 (Desktop)
GeForce RTX 2060 (Desktop), R7 2700X
72.7 (61min - 82max) fps -33%
NVIDIA GeForce GTX 1070 (Desktop)
GeForce GTX 1070 (Desktop), 4790K, Samsung SSD 840 Pro 256GB MZ7PD256HAFV-0Z000
62 fps -43%
AMD Radeon RX 590 (Desktop)
Radeon RX 590, R7 2700X
50.8 (42min - 57max) fps -53%
AMD Radeon RX 580 (Desktop)
Radeon RX 580, R7 2700X
41.8 (35min - 46max) fps -62%
3840x2160 High Graphics & Postprocessing (Nvidia HairWorks Off)
NVIDIA Titan RTX
NVIDIA Titan RTX, R7 2700X, ADATA Premier Pro SP900NS38 512 GB
102 (90min - 110max) fps +31%
NVIDIA GeForce RTX 2080 (Desktop)
GeForce RTX 2080 (Desktop), R7 2700X
78 (69min - 87max) fps
NVIDIA GeForce RTX 2080 (Desktop)
GeForce RTX 2080 (Desktop), R7 2700X
73.8 (66min - 81max) fps -5%
NVIDIA GeForce GTX 1080 Ti (Desktop)
GeForce GTX 1080 Ti, 4790K, Samsung SSD 840 Pro 256GB MZ7PD256HAFV-0Z000
72 (61min - 79max) fps -8%
NVIDIA GeForce RTX 2070 (Desktop)
GeForce RTX 2070 (Desktop), R7 2700X
64.3 (59min - 70max) fps -18%
NVIDIA GeForce RTX 2070 (Desktop)
GeForce RTX 2070 (Desktop), R7 2700X
61.8 (52min - 69max) fps -21%
NVIDIA GeForce GTX 1080 (Desktop)
GeForce GTX 1080 (Desktop), 4790K, Samsung SSD 840 Pro 256GB MZ7PD256HAFV-0Z000
56.5 (49min - 61max) fps -28%
NVIDIA GeForce GTX 1080 (Desktop)
GeForce GTX 1080 (Desktop), 4790K, Samsung SSD 840 Pro 256GB MZ7PD256HAFV-0Z000
55 fps -29%
AMD Radeon VII
Radeon VII, R7 2700X
54.3 (50min - 59max) fps -30%
NVIDIA GeForce RTX 2060 (Desktop)
GeForce RTX 2060 (Desktop), R7 2700X
51.3 (44min - 58max) fps -34%
AMD Radeon RX Vega 64
RX Vega 64, R7 2700X
49.1 (44min - 54max) fps -37%
NVIDIA GeForce GTX 1070 (Desktop)
GeForce GTX 1070 (Desktop), 4790K, Samsung SSD 840 Pro 256GB MZ7PD256HAFV-0Z000
43 fps -45%
AMD Radeon RX 590 (Desktop)
Radeon RX 590, R7 2700X
31.6 (26min - 34max) fps -59%
AMD Radeon RX 580 (Desktop)
Radeon RX 580, R7 2700X
24.9 (20min - 27max) fps -68%
Watch Dogs 2
1920x1080 Ultra Preset
NVIDIA Titan RTX
NVIDIA Titan RTX, R7 2700X, ADATA Premier Pro SP900NS38 512 GB
100 (75min - 119max) fps +15%
NVIDIA GeForce GTX 1080 Ti (Desktop)
GeForce GTX 1080 Ti, 4790K, Samsung SSD 840 Pro 256GB MZ7PD256HAFV-0Z000
93 (71min - 107max) fps +7%
NVIDIA GeForce RTX 2080 (Desktop)
GeForce RTX 2080 (Desktop), R7 2700X
88.1 (70min - 103max) fps +2%
NVIDIA GeForce RTX 2080 (Desktop)
GeForce RTX 2080 (Desktop), R7 2700X
86.6 (70min - 99max) fps
NVIDIA GeForce RTX 2070 (Desktop)
GeForce RTX 2070 (Desktop), R7 2700X
78.3 (63min - 91max) fps -10%
NVIDIA GeForce RTX 2070 (Desktop)
GeForce RTX 2070 (Desktop), R7 2700X
76 (59min - 87max) fps -12%
NVIDIA GeForce GTX 1080 (Desktop)
GeForce GTX 1080 (Desktop), 4790K, Samsung SSD 840 Pro 256GB MZ7PD256HAFV-0Z000
73.5 (58min - 90max) fps -15%
AMD Radeon RX Vega 64
RX Vega 64, R7 2700X
68.2 (56min - 78max) fps -21%
NVIDIA GeForce RTX 2060 (Desktop)
GeForce RTX 2060 (Desktop), R7 2700X
66 (51min - 75max) fps -24%
AMD Radeon VII
Radeon VII, R7 2700X
55 fps -36%
AMD Radeon RX 590 (Desktop)
Radeon RX 590, R7 2700X
46.1 (37min - 53max) fps -47%
NVIDIA GeForce GTX 1060 (Desktop)
GeForce GTX 1060 (Desktop), 6700K
45.7 (36min) fps -47%
AMD Radeon RX 580 (Desktop)
Radeon RX 580, R7 2700X
40.4 (32min - 46max) fps -53%
3840x2160 High Preset
NVIDIA Titan RTX
NVIDIA Titan RTX, R7 2700X, ADATA Premier Pro SP900NS38 512 GB
70 (63min - 78max) fps +28%
NVIDIA GeForce GTX 1080 Ti (Desktop)
GeForce GTX 1080 Ti, 4790K, Samsung SSD 840 Pro 256GB MZ7PD256HAFV-0Z000
56.1 (50min - 62max) fps +2%
NVIDIA GeForce RTX 2080 (Desktop)
GeForce RTX 2080 (Desktop), R7 2700X
55.6 (51min - 62max) fps +1%
NVIDIA GeForce RTX 2080 (Desktop)
GeForce RTX 2080 (Desktop), R7 2700X
54.8 (49min - 61max) fps
NVIDIA GeForce RTX 2070 (Desktop)
GeForce RTX 2070 (Desktop), R7 2700X
47 (63min - 91max) fps -14%
NVIDIA GeForce GTX 1080 (Desktop)
GeForce GTX 1080 (Desktop), 4790K, Samsung SSD 840 Pro 256GB MZ7PD256HAFV-0Z000
46.7 (42min - 52max) fps -15%
NVIDIA GeForce RTX 2070 (Desktop)
GeForce RTX 2070 (Desktop), R7 2700X
45.9 (42min - 51max) fps -16%
AMD Radeon VII
Radeon VII, R7 2700X
39 fps -29%
NVIDIA GeForce RTX 2060 (Desktop)
GeForce RTX 2060 (Desktop), R7 2700X
38.5 (35min - 43max) fps -30%
AMD Radeon RX Vega 64
RX Vega 64, R7 2700X
36.9 (32min - 42max) fps -33%
NVIDIA GeForce GTX 1060 (Desktop)
GeForce GTX 1060 (Desktop), 6700K
25.1 (23min) fps -54%
AMD Radeon RX 590 (Desktop)
Radeon RX 590, R7 2700X
25.1 (22min - 28max) fps -54%
AMD Radeon RX 580 (Desktop)
Radeon RX 580, R7 2700X
22.6 (20min - 26max) fps -59%
Battlefield 1
1920x1080 Ultra Preset AA:T
NVIDIA GeForce GTX 1080 Ti (Desktop)
GeForce GTX 1080 Ti, 4790K, Samsung SSD 840 Pro 256GB MZ7PD256HAFV-0Z000
158 (141min - 166max) fps +7%
NVIDIA Titan RTX
NVIDIA Titan RTX, R7 2700X, ADATA Premier Pro SP900NS38 512 GB
154.2 (141min - 162max) fps +5%
NVIDIA GeForce RTX 2080 (Desktop)
GeForce RTX 2080 (Desktop), R7 2700X
154.1 (137min - 166max) fps +5%
NVIDIA GeForce GTX 1080 (Desktop)
GeForce GTX 1080 (Desktop), 4790K, Samsung SSD 840 Pro 256GB MZ7PD256HAFV-0Z000
148 (133min - 157max) fps +1%
NVIDIA GeForce GTX 1080 (Desktop)
GeForce GTX 1080 (Desktop), 4790K, Samsung SSD 840 Pro 256GB MZ7PD256HAFV-0Z000
147 (132min - 155max) fps 0%
NVIDIA GeForce RTX 2080 (Desktop)
GeForce RTX 2080 (Desktop), R7 2700X
147 (126min - 157max) fps
AMD Radeon RX Vega 64
RX Vega 64, R7 2700X
145.1 (131min - 167max) fps -1%
NVIDIA GeForce RTX 2070 (Desktop)
GeForce RTX 2070 (Desktop), R7 2700X
141.3 (126min - 152max) fps -4%
AMD Radeon VII
Radeon VII, R7 2700X
138 (127min - 144max) fps -6%
NVIDIA GeForce RTX 2070 (Desktop)
GeForce RTX 2070 (Desktop), R7 2700X
137.3 (116min - 147max) fps -7%
NVIDIA GeForce RTX 2060 (Desktop)
GeForce RTX 2060 (Desktop), R7 2700X
133 (120min - 147max) fps -10%
AMD Radeon RX 590 (Desktop)
Radeon RX 590, R7 2700X
98.6 (85min - 108max) fps -33%
NVIDIA GeForce GTX 1060 (Desktop)
GeForce GTX 1060 (Desktop), 6700K
94.6 (82min) fps -36%
3840x2160 High Preset AA:T
NVIDIA Titan RTX
NVIDIA Titan RTX, R7 2700X, ADATA Premier Pro SP900NS38 512 GB
111.8 (104min - 118max) fps +27%
NVIDIA GeForce RTX 2080 (Desktop)
GeForce RTX 2080 (Desktop), R7 2700X
90 (82min - 93max) fps +2%
NVIDIA GeForce RTX 2080 (Desktop)
GeForce RTX 2080 (Desktop), R7 2700X
88 (79min - 93max) fps
AMD Radeon VII
Radeon VII, R7 2700X
82 fps -7%
NVIDIA GeForce GTX 1080 Ti (Desktop)
GeForce GTX 1080 Ti, 4790K, Samsung SSD 840 Pro 256GB MZ7PD256HAFV-0Z000
76.7 (69min - 80max) fps -13%
NVIDIA GeForce RTX 2070 (Desktop)
GeForce RTX 2070 (Desktop), R7 2700X
75.8 (70min - 79max) fps -14%
NVIDIA GeForce RTX 2070 (Desktop)
GeForce RTX 2070 (Desktop), R7 2700X
75.7 (66min - 79max) fps -14%
NVIDIA GeForce GTX 1080 (Desktop)
GeForce GTX 1080 (Desktop), 4790K, Samsung SSD 840 Pro 256GB MZ7PD256HAFV-0Z000
70.7 (66min - 73max) fps -20%
NVIDIA GeForce GTX 1080 (Desktop)
GeForce GTX 1080 (Desktop), 4790K, Samsung SSD 840 Pro 256GB MZ7PD256HAFV-0Z000
70.6 (64min - 74max) fps -20%
AMD Radeon RX Vega 64
RX Vega 64, R7 2700X
65.2 (58min - 71max) fps -26%
NVIDIA GeForce RTX 2060 (Desktop)
GeForce RTX 2060 (Desktop), R7 2700X
59.8 (56min - 63max) fps -32%
AMD Radeon RX 590 (Desktop)
Radeon RX 590, R7 2700X
43.2 (38min - 46max) fps -51%
NVIDIA GeForce GTX 1060 (Desktop)
GeForce GTX 1060 (Desktop), 6700K
39.2 (34min) fps -55%
The Division
1920x1080 Ultra Preset AF:16x
NVIDIA Titan RTX
NVIDIA Titan RTX, R7 2700X, ADATA Premier Pro SP900NS38 512 GB
163 fps +24%
NVIDIA GeForce RTX 2080 (Desktop)
GeForce RTX 2080 (Desktop), R7 2700X
131.1 fps
NVIDIA GeForce GTX 1080 Ti (Desktop)
GeForce GTX 1080 Ti, 4790K, Samsung SSD 840 Pro 256GB MZ7PD256HAFV-0Z000
130 (75min - 180max) fps -1%
NVIDIA GeForce RTX 2080 (Desktop)
GeForce RTX 2080 (Desktop), R7 2700X
129.8 fps -1%
NVIDIA GeForce RTX 2070 (Desktop)
GeForce RTX 2070 (Desktop), R7 2700X
113.2 fps -14%
NVIDIA GeForce RTX 2070 (Desktop)
GeForce RTX 2070 (Desktop), R7 2700X
112 fps -15%
AMD Radeon RX Vega 64
RX Vega 64, R7 2700X
102.3 fps -22%
NVIDIA GeForce GTX 1080 (Desktop)
GeForce GTX 1080 (Desktop), 4790K, Samsung SSD 840 Pro 256GB MZ7PD256HAFV-0Z000
102 (54min - 135max) fps -22%
NVIDIA GeForce GTX 1080 (Desktop)
GeForce GTX 1080 (Desktop), 4790K, Samsung SSD 840 Pro 256GB MZ7PD256HAFV-0Z000
95 (55min - 125max) fps -28%
NVIDIA GeForce RTX 2060 (Desktop)
GeForce RTX 2060 (Desktop), R7 2700X
95 fps -28%
AMD Radeon VII
Radeon VII, R7 2700X
91 fps -31%
NVIDIA GeForce GTX 1070 (Desktop)
GeForce GTX 1070 (Desktop), 4790K, Samsung SSD 840 Pro 256GB MZ7PD256HAFV-0Z000
80.6 (41min - 108max) fps -39%
AMD Radeon RX 590 (Desktop)
Radeon RX 590, R7 2700X
70.6 fps -46%
AMD Radeon RX 580 (Desktop)
Radeon RX 580, R7 2700X
58.8 fps -55%
3840x2160 High Preset AF:8x
NVIDIA Titan RTX
NVIDIA Titan RTX, R7 2700X, ADATA Premier Pro SP900NS38 512 GB
91 fps +27%
NVIDIA GeForce RTX 2080 (Desktop)
GeForce RTX 2080 (Desktop), R7 2700X
71.7 fps
NVIDIA GeForce RTX 2080 (Desktop)
GeForce RTX 2080 (Desktop), R7 2700X
69.1 fps -4%
NVIDIA GeForce GTX 1080 Ti (Desktop)
GeForce GTX 1080 Ti, 4790K, Samsung SSD 840 Pro 256GB MZ7PD256HAFV-0Z000
65 (31min - 89max) fps -9%
AMD Radeon VII
Radeon VII, R7 2700X
60 fps -16%
NVIDIA GeForce RTX 2070 (Desktop)
GeForce RTX 2070 (Desktop), R7 2700X
58.6 fps -18%
NVIDIA GeForce RTX 2070 (Desktop)
GeForce RTX 2070 (Desktop), R7 2700X
58.3 fps -19%
NVIDIA GeForce GTX 1080 (Desktop)
GeForce GTX 1080 (Desktop), 4790K, Samsung SSD 840 Pro 256GB MZ7PD256HAFV-0Z000
51.2 (24min - 62max) fps -29%
AMD Radeon RX Vega 64
RX Vega 64, R7 2700X
50.6 fps -29%
NVIDIA GeForce RTX 2060 (Desktop)
GeForce RTX 2060 (Desktop), R7 2700X
49 fps -32%
NVIDIA GeForce GTX 1080 (Desktop)
GeForce GTX 1080 (Desktop), 4790K, Samsung SSD 840 Pro 256GB MZ7PD256HAFV-0Z000
48.5 (19min - 65max) fps -32%
NVIDIA GeForce GTX 1070 (Desktop)
GeForce GTX 1070 (Desktop), 4790K, Samsung SSD 840 Pro 256GB MZ7PD256HAFV-0Z000
39.7 (17min - 52max) fps -45%
AMD Radeon RX 590 (Desktop)
Radeon RX 590, R7 2700X
36.1 fps -50%
AMD Radeon RX 580 (Desktop)
Radeon RX 580, R7 2700X
30.9 fps -57%
For Honor
1920x1080 Extreme Preset AA:T AF:16x
NVIDIA Titan RTX
NVIDIA Titan RTX, R7 2700X, ADATA Premier Pro SP900NS38 512 GB
213 (107min - 286max) fps +26%
NVIDIA GeForce GTX 1080 Ti (Desktop)
GeForce GTX 1080 Ti, 4790K, Samsung SSD 840 Pro 256GB MZ7PD256HAFV-0Z000
173 (115min - 240max) fps +2%
NVIDIA GeForce RTX 2080 (Desktop)
GeForce RTX 2080 (Desktop), R7 2700X
172.6 fps +2%
NVIDIA GeForce RTX 2080 (Desktop)
GeForce RTX 2080 (Desktop), R7 2700X
169.7 (120min - 227max) fps
NVIDIA GeForce RTX 2070 (Desktop)
GeForce RTX 2070 (Desktop), R7 2700X
148.7 (110min - 192max) fps -12%
NVIDIA GeForce RTX 2070 (Desktop)
GeForce RTX 2070 (Desktop), R7 2700X
141.6 (95min - 199max) fps -17%
NVIDIA GeForce GTX 1080 (Desktop)
GeForce GTX 1080 (Desktop), 4790K, Samsung SSD 840 Pro 256GB MZ7PD256HAFV-0Z000
138 (77min - 198max) fps -19%
AMD Radeon RX Vega 64
RX Vega 64, R7 2700X
127.7 (106min - 167max) fps -25%
NVIDIA GeForce RTX 2060 (Desktop)
GeForce RTX 2060 (Desktop), R7 2700X
122 (72min - 171max) fps -28%
AMD Radeon VII
Radeon VII, R7 2700X
121 fps -29%
NVIDIA GeForce GTX 1070 (Desktop)
GeForce GTX 1070 (Desktop), 4790K, Samsung SSD 840 Pro 256GB MZ7PD256HAFV-0Z000
111 (50min - 148max) fps -35%
AMD Radeon RX 590 (Desktop)
Radeon RX 590, R7 2700X
91 (71min - 118max) fps -46%
AMD Radeon RX 580 (Desktop)
Radeon RX 580, R7 2700X
82 (65min - 110max) fps -52%
NVIDIA GeForce GTX 1060 (Desktop)
GeForce GTX 1060 (Desktop), 6700K
78.7 (47min) fps -54%
3840x2160 High Preset AA:T AF:8x
NVIDIA Titan RTX
NVIDIA Titan RTX, R7 2700X, ADATA Premier Pro SP900NS38 512 GB
101 (68min - 127max) fps +32%
NVIDIA GeForce RTX 2080 (Desktop)
GeForce RTX 2080 (Desktop), R7 2700X
77.6 (47min - 92max) fps +1%
NVIDIA GeForce GTX 1080 Ti (Desktop)
GeForce GTX 1080 Ti, 4790K, Samsung SSD 840 Pro 256GB MZ7PD256HAFV-0Z000
77 (58min - 131max) fps 0%
NVIDIA GeForce RTX 2080 (Desktop)
GeForce RTX 2080 (Desktop), R7 2700X
76.8 (56min - 96max) fps
AMD Radeon VII
Radeon VII, R7 2700X
64 fps -17%
NVIDIA GeForce RTX 2070 (Desktop)
GeForce RTX 2070 (Desktop), R7 2700X
63.2 (46min - 76max) fps -18%
NVIDIA GeForce GTX 1080 (Desktop)
GeForce GTX 1080 (Desktop), 4790K, Samsung SSD 840 Pro 256GB MZ7PD256HAFV-0Z000
54.9 (42min - 65max) fps -29%
NVIDIA GeForce RTX 2070 (Desktop)
GeForce RTX 2070 (Desktop), R7 2700X
53.7 (43min - 67max) fps -30%
NVIDIA GeForce RTX 2060 (Desktop)
GeForce RTX 2060 (Desktop), R7 2700X
53 (39min - 63max) fps -31%
AMD Radeon RX Vega 64
RX Vega 64, R7 2700X
49 (40min - 58max) fps -36%
NVIDIA GeForce GTX 1070 (Desktop)
GeForce GTX 1070 (Desktop), 4790K, Samsung SSD 840 Pro 256GB MZ7PD256HAFV-0Z000
43.9 (36min - 56max) fps -43%
AMD Radeon RX 590 (Desktop)
Radeon RX 590, R7 2700X
35.2 (28min - 41max) fps -54%
NVIDIA GeForce GTX 1060 (Desktop)
GeForce GTX 1060 (Desktop), 6700K
33.4 (26min) fps -57%
AMD Radeon RX 580 (Desktop)
Radeon RX 580, R7 2700X
33 (27min - 40max) fps -57%
Ghost Recon Wildlands
1920x1080 Ultra Preset AA:T AF:16x
NVIDIA Titan RTX
NVIDIA Titan RTX, R7 2700X, ADATA Premier Pro SP900NS38 512 GB
86 (70min - 96max) fps +16%
NVIDIA GeForce RTX 2080 (Desktop)
GeForce RTX 2080 (Desktop), R7 2700X
74 (62min - 84max) fps 0%
NVIDIA GeForce RTX 2080 (Desktop)
GeForce RTX 2080 (Desktop), R7 2700X
73.9 (44min - 83max) fps
NVIDIA GeForce GTX 1080 Ti (Desktop)
GeForce GTX 1080 Ti, 4790K, Samsung SSD 840 Pro 256GB MZ7PD256HAFV-0Z000
70.3 (62min - 78max) fps -5%
NVIDIA GeForce RTX 2070 (Desktop)
GeForce RTX 2070 (Desktop), R7 2700X
65 (56min - 73max) fps -12%
NVIDIA GeForce RTX 2070 (Desktop)
GeForce RTX 2070 (Desktop), R7 2700X
64.1 (55min - 73max) fps -13%
NVIDIA GeForce RTX 2060 (Desktop)
GeForce RTX 2060 (Desktop), R7 2700X
56 (49min - 63max) fps -24%
AMD Radeon RX Vega 64
RX Vega 64, R7 2700X
53 (43min - 60max) fps -28%
NVIDIA GeForce GTX 1070 (Desktop)
GeForce GTX 1070 (Desktop), 4790K, Samsung SSD 840 Pro 256GB MZ7PD256HAFV-0Z000
50.2 (43min - 58max) fps -32%
AMD Radeon VII
Radeon VII, R7 2700X
49 fps -34%
AMD Radeon RX 590 (Desktop)
Radeon RX 590, R7 2700X
41.3 (34min - 48max) fps -44%
NVIDIA GeForce GTX 1060 (Desktop)
GeForce GTX 1060 (Desktop), 6700K
40.2 (35min) fps -46%
AMD Radeon RX 580 (Desktop)
Radeon RX 580, R7 2700X
35 (29min - 41max) fps -53%
3840x2160 Ultra Preset AA:T AF:16x
NVIDIA Titan RTX
NVIDIA Titan RTX, R7 2700X, ADATA Premier Pro SP900NS38 512 GB
49 (42min - 55max) fps +26%
NVIDIA GeForce RTX 2080 (Desktop)
GeForce RTX 2080 (Desktop), R7 2700X
38.9 (34min - 44max) fps
NVIDIA GeForce GTX 1080 Ti (Desktop)
GeForce GTX 1080 Ti, 4790K, Samsung SSD 840 Pro 256GB MZ7PD256HAFV-0Z000
36 (29min - 43max) fps -7%
NVIDIA GeForce RTX 2070 (Desktop)
GeForce RTX 2070 (Desktop), R7 2700X
32.6 (28min - 37max) fps -16%
Doom
1920x1080 Ultra Preset AA:SM
NVIDIA GeForce GTX 1080 Ti (Desktop)
GeForce GTX 1080 Ti, 4790K, Samsung SSD 840 Pro 256GB MZ7PD256HAFV-0Z000
200 fps +43%
NVIDIA GeForce GTX 1080 Ti (Desktop)
GeForce GTX 1080 Ti, 4790K, Samsung SSD 840 Pro 256GB MZ7PD256HAFV-0Z000
162 fps +15%
NVIDIA GeForce GTX 1080 (Desktop)
GeForce GTX 1080 (Desktop), 4790K, Samsung SSD 840 Pro 256GB MZ7PD256HAFV-0Z000
160 (136min - 199max) fps +14%
NVIDIA GeForce RTX 2080 (Desktop)
GeForce RTX 2080 (Desktop), R7 2700X
150.3 fps +7%
NVIDIA GeForce RTX 2070 (Desktop)
GeForce RTX 2070 (Desktop), R7 2700X
150 (109min - 191max) fps +7%
NVIDIA Titan RTX
NVIDIA Titan RTX, R7 2700X, ADATA Premier Pro SP900NS38 512 GB
144 (97min - 198max) fps +3%
NVIDIA GeForce RTX 2080 (Desktop)
GeForce RTX 2080 (Desktop), R7 2700X
140.3 (101min - 196max) fps
NVIDIA GeForce RTX 2070 (Desktop)
GeForce RTX 2070 (Desktop), R7 2700X
139.6 (104min - 195max) fps 0%
NVIDIA GeForce RTX 2060 (Desktop)
GeForce RTX 2060 (Desktop), R7 2700X
139.5 (94min - 195max) fps -1%
NVIDIA GeForce GTX 1080 (Desktop)
GeForce GTX 1080 (Desktop), 4790K, Samsung SSD 840 Pro 256GB MZ7PD256HAFV-0Z000
137 (112min - 191max) fps -2%
NVIDIA GeForce GTX 1070 (Desktop)
GeForce GTX 1070 (Desktop), 4790K, Samsung SSD 840 Pro 256GB MZ7PD256HAFV-0Z000
134 (111min - 173max) fps -4%
AMD Radeon RX 590 (Desktop)
Radeon RX 590, R7 2700X
92.1 (70min - 125max) fps -34%
3840x2160 High Preset AA:FX
NVIDIA Titan RTX
NVIDIA Titan RTX, R7 2700X, ADATA Premier Pro SP900NS38 512 GB
140 (102min - 184max) fps +19%
NVIDIA GeForce RTX 2080 (Desktop)
GeForce RTX 2080 (Desktop), R7 2700X
117.7 (87min - 151max) fps
NVIDIA GeForce RTX 2080 (Desktop)
GeForce RTX 2080 (Desktop), R7 2700X
115.1 fps -2%
NVIDIA GeForce GTX 1080 Ti (Desktop)
GeForce GTX 1080 Ti, 4790K, Samsung SSD 840 Pro 256GB MZ7PD256HAFV-0Z000
99 fps -16%
NVIDIA GeForce GTX 1080 Ti (Desktop)
GeForce GTX 1080 Ti, 4790K, Samsung SSD 840 Pro 256GB MZ7PD256HAFV-0Z000
96 fps -18%
NVIDIA GeForce RTX 2070 (Desktop)
GeForce RTX 2070 (Desktop), R7 2700X
93 (75min - 119max) fps -21%
NVIDIA GeForce RTX 2070 (Desktop)
GeForce RTX 2070 (Desktop), R7 2700X
91.1 (76min - 116max) fps -23%
NVIDIA GeForce RTX 2060 (Desktop)
GeForce RTX 2060 (Desktop), R7 2700X
78.7 (66min - 98max) fps -33%
NVIDIA GeForce GTX 1080 (Desktop)
GeForce GTX 1080 (Desktop), 4790K, Samsung SSD 840 Pro 256GB MZ7PD256HAFV-0Z000
72 (62min - 91max) fps -39%
NVIDIA GeForce GTX 1080 (Desktop)
GeForce GTX 1080 (Desktop), 4790K, Samsung SSD 840 Pro 256GB MZ7PD256HAFV-0Z000
56.5 fps -52%
NVIDIA GeForce GTX 1070 (Desktop)
GeForce GTX 1070 (Desktop), 4790K, Samsung SSD 840 Pro 256GB MZ7PD256HAFV-0Z000
48.6 (42min - 60max) fps -59%
AMD Radeon RX 590 (Desktop)
Radeon RX 590, R7 2700X
36.6 (30min - 46max) fps -69%
GTA V
1920x1080 Highest Settings possible AA:4xMSAA + FX AF:16x
NVIDIA GeForce RTX 2080 (Desktop)
GeForce RTX 2080 (Desktop), R7 2700X
132.5 fps +14%
NVIDIA Titan RTX
NVIDIA Titan RTX, R7 2700X, ADATA Premier Pro SP900NS38 512 GB
125.1 fps +8%
NVIDIA GeForce RTX 2080 (Desktop)
GeForce RTX 2080 (Desktop), R7 2700X
116 (6.8min, 83.3P1 - 147max) fps
AMD Radeon VII
Radeon VII, R7 2700X
115 fps -1%
NVIDIA GeForce RTX 2070 (Desktop)
GeForce RTX 2070 (Desktop), R7 2700X
110.5 fps -5%
NVIDIA GeForce RTX 2070 (Desktop)
GeForce RTX 2070 (Desktop), R7 2700X
107.5 fps -7%
NVIDIA GeForce RTX 2060 (Desktop)
GeForce RTX 2060 (Desktop), R7 2700X
100.5 fps -13%
NVIDIA GeForce GTX 1080 (Desktop)
GeForce GTX 1080 (Desktop), 4790K, Samsung SSD 840 Pro 256GB MZ7PD256HAFV-0Z000
86 (44min - 161max) fps -26%
NVIDIA GeForce GTX 1080 Ti (Desktop)
GeForce GTX 1080 Ti, 4790K, Samsung SSD 840 Pro 256GB MZ7PD256HAFV-0Z000
85 fps -27%
NVIDIA GeForce GTX 1080 (Desktop)
GeForce GTX 1080 (Desktop), 4790K, Samsung SSD 840 Pro 256GB MZ7PD256HAFV-0Z000
80 (32min - 158max) fps -31%
NVIDIA GeForce GTX 1070 (Desktop)
GeForce GTX 1070 (Desktop), 4790K, Samsung SSD 840 Pro 256GB MZ7PD256HAFV-0Z000
73 fps -37%
AMD Radeon RX 590 (Desktop)
Radeon RX 590, R7 2700X
61.9 fps -47%
3840x2160 High/On (Advanced Graphics Off) AA:FX AF:8x
NVIDIA Titan RTX
NVIDIA Titan RTX, R7 2700X, ADATA Premier Pro SP900NS38 512 GB
140.6 fps +58%
NVIDIA GeForce RTX 2080 (Desktop)
GeForce RTX 2080 (Desktop), R7 2700X
124 fps +39%
NVIDIA GeForce RTX 2070 (Desktop)
GeForce RTX 2070 (Desktop), R7 2700X
111.9 fps +26%
NVIDIA GeForce GTX 1080 Ti (Desktop)
GeForce GTX 1080 Ti, 4790K, Samsung SSD 840 Pro 256GB MZ7PD256HAFV-0Z000
97.8 fps +10%
NVIDIA GeForce RTX 2080 (Desktop)
GeForce RTX 2080 (Desktop), R7 2700X
89 (9.54min, 62.5P1 - 139max) fps
AMD Radeon VII
Radeon VII, R7 2700X
81 fps -9%
NVIDIA GeForce RTX 2070 (Desktop)
GeForce RTX 2070 (Desktop), R7 2700X
79.9 fps -10%
NVIDIA GeForce GTX 1080 (Desktop)
GeForce GTX 1080 (Desktop), 4790K, Samsung SSD 840 Pro 256GB MZ7PD256HAFV-0Z000
73.9 (39min - 222max) fps -17%
NVIDIA GeForce GTX 1080 (Desktop)
GeForce GTX 1080 (Desktop), 4790K, Samsung SSD 840 Pro 256GB MZ7PD256HAFV-0Z000
71.2 (11.6min - 170max) fps -20%
NVIDIA GeForce RTX 2060 (Desktop)
GeForce RTX 2060 (Desktop), R7 2700X
66.7 fps -25%
NVIDIA GeForce GTX 1070 (Desktop)
GeForce GTX 1070 (Desktop), 4790K, Samsung SSD 840 Pro 256GB MZ7PD256HAFV-0Z000
59.1 fps -34%
AMD Radeon RX 590 (Desktop)
Radeon RX 590, R7 2700X
41.4 fps -53%
Battlefield 4 - 3840x2160 High Preset
NVIDIA Titan RTX
NVIDIA Titan RTX, R7 2700X, ADATA Premier Pro SP900NS38 512 GB
159 fps +27%
NVIDIA GeForce RTX 2080 (Desktop)
GeForce RTX 2080 (Desktop), R7 2700X
125.4 (111min - 151max) fps
NVIDIA GeForce RTX 2080 (Desktop)
GeForce RTX 2080 (Desktop), R7 2700X
121 fps -4%
NVIDIA GeForce GTX 1080 Ti (Desktop)
GeForce GTX 1080 Ti, 4790K, Samsung SSD 840 Pro 256GB MZ7PD256HAFV-0Z000
117 (105min - 137max) fps -7%
NVIDIA GeForce RTX 2070 (Desktop)
GeForce RTX 2070 (Desktop), R7 2700X
102.3 fps -18%
NVIDIA GeForce RTX 2070 (Desktop)
GeForce RTX 2070 (Desktop), R7 2700X
102 fps -19%
NVIDIA GeForce GTX 1080 (Desktop)
GeForce GTX 1080 (Desktop), 4790K, Samsung SSD 840 Pro 256GB MZ7PD256HAFV-0Z000
90 fps -28%
AMD Radeon RX Vega 64
RX Vega 64, R7 2700X
77 (70min - 92max) fps -39%
AMD Radeon VII
Radeon VII, R7 2700X
70.4 (57min - 86max) fps -44%
NVIDIA GeForce GTX 1070 (Desktop)
GeForce GTX 1070 (Desktop), 4790K, Samsung SSD 840 Pro 256GB MZ7PD256HAFV-0Z000
69.8 (61min - 83max) fps -44%
NVIDIA GeForce RTX 2060 (Desktop)
GeForce RTX 2060 (Desktop), R7 2700X
55.4 (48min - 67max) fps -56%
AMD Radeon RX 590 (Desktop)
Radeon RX 590, R7 2700X
51 (45min - 61max) fps -59%
Hitman 2
1920x1080 Ultra AF:16x
AMD Radeon VII
Radeon VII, R7 2700X
82 (60min - 116max) fps +4%
NVIDIA GeForce RTX 2060 (Desktop)
GeForce RTX 2060 (Desktop), R7 2700X
79.9 (61min - 117max) fps +1%
NVIDIA GeForce RTX 2080 (Desktop)
GeForce RTX 2080 (Desktop), R7 2700X
79 (60min - 114max) fps
AMD Radeon RX Vega 64
RX Vega 64, R7 2700X
78.2 (58min - 110max) fps -1%
NVIDIA GeForce RTX 2070 (Desktop)
GeForce RTX 2070 (Desktop), R7 2700X
77.9 (60min - 112max) fps -1%
NVIDIA Titan RTX
NVIDIA Titan RTX, R7 2700X, ADATA Premier Pro SP900NS38 512 GB
75 (55min - 107max) fps -5%
AMD Radeon RX 590 (Desktop)
Radeon RX 590, R7 2700X
71 (55min - 89max) fps -10%
NVIDIA GeForce GTX 1060 (Desktop)
GeForce GTX 1060 (Desktop), 6700K
66.3 (51min) fps -16%
NVIDIA Titan X Pascal
Titan X Pascal, TR 1950X, Samsung SM951 MZHPV512HDGL m.2 PCI-e
64.4 (47min - 90max) fps -18%
3840x2160 Ultra AF:16x
NVIDIA Titan RTX
NVIDIA Titan RTX, R7 2700X, ADATA Premier Pro SP900NS38 512 GB
75 (54min - 106max) fps +25%
NVIDIA GeForce RTX 2080 (Desktop)
GeForce RTX 2080 (Desktop), R7 2700X
60 (46min - 71max) fps
AMD Radeon VII
Radeon VII, R7 2700X
52.9 (45min - 61max) fps -12%
NVIDIA Titan X Pascal
Titan X Pascal, TR 1950X, Samsung SM951 MZHPV512HDGL m.2 PCI-e
52.7 (37min - 59max) fps -12%
AMD Radeon RX Vega 64
RX Vega 64, R7 2700X
47.4 (41min - 55max) fps -21%
NVIDIA GeForce RTX 2070 (Desktop)
GeForce RTX 2070 (Desktop), R7 2700X
47.3 (38min - 57max) fps -21%
NVIDIA GeForce RTX 2060 (Desktop)
GeForce RTX 2060 (Desktop), R7 2700X
40.7 (35min - 50max) fps -32%
AMD Radeon RX 590 (Desktop)
Radeon RX 590, R7 2700X
30.1 (25min - 35max) fps -50%
NVIDIA GeForce GTX 1060 (Desktop)
GeForce GTX 1060 (Desktop), 6700K
24.4 (20min) fps -59%
Battlefield V
1920x1080 Ultra Preset
NVIDIA Titan RTX
NVIDIA Titan RTX, R7 2700X, ADATA Premier Pro SP900NS38 512 GB
160.4 (129min - 168max) fps +11%
NVIDIA GeForce RTX 2080 (Desktop)
GeForce RTX 2080 (Desktop), R7 2700X
145 (79min - 185max) fps
AMD Radeon RX Vega 64
RX Vega 64, R7 2700X
138.7 (112min - 194max) fps -4%
NVIDIA Titan X Pascal
Titan X Pascal, TR 1950X, Samsung SM951 MZHPV512HDGL m.2 PCI-e
137 (111min - 170max) fps -6%
AMD Radeon VII
Radeon VII, R7 2700X
127 (94min - 187max) fps -12%
NVIDIA GeForce RTX 2070 (Desktop)
GeForce RTX 2070 (Desktop), R7 2700X
126.8 (69min - 171max) fps -13%
NVIDIA GeForce RTX 2060 (Desktop)
GeForce RTX 2060 (Desktop), R7 2700X
119.1 (94min - 167max) fps -18%
AMD Radeon RX 590 (Desktop)
Radeon RX 590, R7 2700X
99.6 (78min - 154max) fps -31%
3840x2160 Ultra Preset
NVIDIA Titan RTX
NVIDIA Titan RTX, R7 2700X, ADATA Premier Pro SP900NS38 512 GB
97.3 (62min - 147max) fps +28%
NVIDIA GeForce RTX 2080 (Desktop)
GeForce RTX 2080 (Desktop), R7 2700X
76 (54min - 115max) fps
AMD Radeon VII
Radeon VII, R7 2700X
73 (59min - 115max) fps -4%
NVIDIA Titan X Pascal
Titan X Pascal, TR 1950X, Samsung SM951 MZHPV512HDGL m.2 PCI-e
71.2 (57min - 104max) fps -6%
NVIDIA GeForce RTX 2070 (Desktop)
GeForce RTX 2070 (Desktop), R7 2700X
62.6 (46min - 93max) fps -18%
AMD Radeon RX Vega 64
RX Vega 64, R7 2700X
60.3 (49min - 98max) fps -21%
NVIDIA GeForce RTX 2060 (Desktop)
GeForce RTX 2060 (Desktop), R7 2700X
53.1 (43min - 80max) fps -30%
AMD Radeon RX 590 (Desktop)
Radeon RX 590, R7 2700X
39.6 (32min - 66max) fps -48%
Farming Simulator 19
1920x1080 Very High Preset
NVIDIA Titan RTX
NVIDIA Titan RTX, R7 2700X, ADATA Premier Pro SP900NS38 512 GB
125 (106min - 167max) fps +1%
NVIDIA GeForce RTX 2080 (Desktop)
GeForce RTX 2080 (Desktop), R7 2700X
124 (109min - 167max) fps
NVIDIA GeForce RTX 2060 (Desktop)
GeForce RTX 2060 (Desktop), R7 2700X
122.4 (108min - 163max) fps -1%
NVIDIA GeForce RTX 2070 (Desktop)
GeForce RTX 2070 (Desktop), R7 2700X
120.7 (108min - 159max) fps -3%
AMD Radeon VII
Radeon VII, R7 2700X
111 (99min - 144max) fps -10%
AMD Radeon RX Vega 64
RX Vega 64, R7 2700X
100 (72min - 144max) fps -19%
NVIDIA Titan X Pascal
Titan X Pascal, TR 1950X, Samsung SM951 MZHPV512HDGL m.2 PCI-e
99.2 (87min - 130max) fps -20%
AMD Radeon RX 590 (Desktop)
Radeon RX 590, R7 2700X
69 (44min - 117max) fps -44%
3840x2160 Very High Preset
NVIDIA Titan RTX
NVIDIA Titan RTX, R7 2700X, ADATA Premier Pro SP900NS38 512 GB
112 (89min - 160max) fps +35%
NVIDIA Titan X Pascal
Titan X Pascal, TR 1950X, Samsung SM951 MZHPV512HDGL m.2 PCI-e
89.1 (74min - 122max) fps +7%
NVIDIA GeForce RTX 2080 (Desktop)
GeForce RTX 2080 (Desktop), R7 2700X
83 (63min - 149max) fps
NVIDIA GeForce RTX 2070 (Desktop)
GeForce RTX 2070 (Desktop), R7 2700X
72 (55min - 125max) fps -13%
NVIDIA GeForce RTX 2060 (Desktop)
GeForce RTX 2060 (Desktop), R7 2700X
54.9 (42min - 98max) fps -34%
AMD Radeon VII
Radeon VII, R7 2700X
51.1 (38min - 94max) fps -38%
AMD Radeon RX Vega 64
RX Vega 64, R7 2700X
41.5 (33min - 69max) fps -50%
AMD Radeon RX 590 (Desktop)
Radeon RX 590, R7 2700X
23 (17min - 47max) fps -72%
Darksiders III
1920x1080 Epic
NVIDIA Titan RTX
NVIDIA Titan RTX, R7 2700X, ADATA Premier Pro SP900NS38 512 GB
131 (69min - 164max) fps +2%
NVIDIA GeForce RTX 2080 (Desktop)
GeForce RTX 2080 (Desktop), R7 2700X
129 (66min - 164max) fps
NVIDIA GeForce RTX 2070 (Desktop)
GeForce RTX 2070 (Desktop), R7 2700X
121.1 (67min - 144max) fps -6%
AMD Radeon VII
Radeon VII, R7 2700X
119 (58min - 142max) fps -8%
NVIDIA GeForce RTX 2060 (Desktop)
GeForce RTX 2060 (Desktop), R7 2700X
110 (71min - 125max) fps -15%
NVIDIA Titan X Pascal
Titan X Pascal, TR 1950X, Samsung SM951 MZHPV512HDGL m.2 PCI-e
106.1 (52min - 138max) fps -18%
AMD Radeon RX Vega 64
RX Vega 64, R7 2700X
99.4 (48min - 116max) fps -23%
AMD Radeon RX 590 (Desktop)
Radeon RX 590, R7 2700X
68.2 (50min - 76max) fps -47%
3840x2160 Epic
NVIDIA Titan RTX
NVIDIA Titan RTX, R7 2700X, ADATA Premier Pro SP900NS38 512 GB
74 (57min - 84max) fps +28%
NVIDIA GeForce RTX 2080 (Desktop)
GeForce RTX 2080 (Desktop), R7 2700X
57.6 (47min - 65max) fps
NVIDIA Titan X Pascal
Titan X Pascal, TR 1950X, Samsung SM951 MZHPV512HDGL m.2 PCI-e
54.6 (40min - 62max) fps -5%
NVIDIA GeForce RTX 2070 (Desktop)
GeForce RTX 2070 (Desktop), R7 2700X
45.9 (40min - 52max) fps -20%
AMD Radeon VII
Radeon VII, R7 2700X
44.2 (35min - 50max) fps -23%
AMD Radeon RX Vega 64
RX Vega 64, R7 2700X
35.8 (31min - 40max) fps -38%
NVIDIA GeForce RTX 2060 (Desktop)
GeForce RTX 2060 (Desktop), R7 2700X
34.9 (31min - 40max) fps -39%
AMD Radeon RX 590 (Desktop)
Radeon RX 590, R7 2700X
23.1 (20min - 26max) fps -60%
Just Cause 4
1920x1080 Very High / On AA:SM AF:16x
NVIDIA Titan RTX
NVIDIA Titan RTX, R7 2700X, ADATA Premier Pro SP900NS38 512 GB
151 (144min - 159max) fps +23%
NVIDIA GeForce RTX 2080 (Desktop)
GeForce RTX 2080 (Desktop), R7 2700X
123 (115min - 131max) fps
NVIDIA Titan X Pascal
Titan X Pascal, TR 1950X, Samsung SM951 MZHPV512HDGL m.2 PCI-e
105.7 (97min - 114max) fps -14%
NVIDIA GeForce RTX 2070 (Desktop)
GeForce RTX 2070 (Desktop), R7 2700X
105.5 (97min - 112max) fps -14%
AMD Radeon VII
Radeon VII, R7 2700X
101 (93min - 113max) fps -18%
NVIDIA GeForce RTX 2060 (Desktop)
GeForce RTX 2060 (Desktop), R7 2700X
93 (86min - 103max) fps -24%
AMD Radeon RX Vega 64
RX Vega 64, R7 2700X
92.3 (85min - 101max) fps -25%
AMD Radeon RX 590 (Desktop)
Radeon RX 590, R7 2700X
69.4 (63min - 74max) fps -44%
3840x2160 Very High / On AA:SM AF:16x
NVIDIA Titan RTX
NVIDIA Titan RTX, R7 2700X, ADATA Premier Pro SP900NS38 512 GB
67 (63min - 72max) fps +34%
NVIDIA GeForce RTX 2080 (Desktop)
GeForce RTX 2080 (Desktop), R7 2700X
50 (47min - 53max) fps
NVIDIA Titan X Pascal
Titan X Pascal, TR 1950X, Samsung SM951 MZHPV512HDGL m.2 PCI-e
48.1 (44min - 51max) fps -4%
AMD Radeon VII
Radeon VII, R7 2700X
45.7 (42min - 49max) fps -9%
NVIDIA GeForce RTX 2070 (Desktop)
GeForce RTX 2070 (Desktop), R7 2700X
43.2 (36min - 47max) fps -14%
NVIDIA GeForce RTX 2060 (Desktop)
GeForce RTX 2060 (Desktop), R7 2700X
37.4 (30min - 41max) fps -25%
AMD Radeon RX Vega 64
RX Vega 64, R7 2700X
36.4 (33min - 41max) fps -27%
AMD Radeon RX 590 (Desktop)
Radeon RX 590, R7 2700X
25.8 (23min - 28max) fps -48%
Apex Legends
1920x1080 Maximum Settings AA:TS AF:16x
NVIDIA GeForce RTX 2070 (Desktop)
GeForce RTX 2070 (Desktop), R7 2700X
144 (143min - 145max) fps 0%
NVIDIA GeForce RTX 2080 (Desktop)
GeForce RTX 2080 (Desktop), R7 2700X
144 (142min - 145max) fps
NVIDIA GeForce RTX 2060 (Desktop)
GeForce RTX 2060 (Desktop), R7 2700X
139 (126min - 145max) fps -3%
AMD Radeon RX Vega 64
RX Vega 64, R7 2700X
131 (122min - 144max) fps -9%
AMD Radeon RX 590 (Desktop)
Radeon RX 590, R7 2700X
96 (88min - 110max) fps -33%
3840x2160 Maximum Settings AA:TS AF:16x
NVIDIA GeForce RTX 2080 (Desktop)
GeForce RTX 2080 (Desktop), R7 2700X
82 (60min - 87max) fps
NVIDIA GeForce RTX 2070 (Desktop)
GeForce RTX 2070 (Desktop), R7 2700X
80 (73min - 93max) fps -2%
AMD Radeon RX Vega 64
RX Vega 64, R7 2700X
52.1 (46min - 65max) fps -36%
NVIDIA GeForce RTX 2060 (Desktop)
GeForce RTX 2060 (Desktop), R7 2700X
52 (48min - 60max) fps -37%
AMD Radeon RX 590 (Desktop)
Radeon RX 590, R7 2700X
36.3 (32min - 46max) fps -56%
Far Cry New Dawn
1920x1080 Ultra Preset
NVIDIA GeForce RTX 2080 (Desktop)
GeForce RTX 2080 (Desktop), R7 2700X
92 (65min - 147max) fps
NVIDIA GeForce RTX 2070 (Desktop)
GeForce RTX 2070 (Desktop), R7 2700X
90 (65min - 138max) fps -2%
NVIDIA GeForce RTX 2060 (Desktop)
GeForce RTX 2060 (Desktop), R7 2700X
88 (66min - 125max) fps -4%
AMD Radeon RX Vega 64
RX Vega 64, R7 2700X
85 (62min - 130max) fps -8%
AMD Radeon VII
Radeon VII, R7 2700X
83 (59min - 128max) fps -10%
AMD Radeon RX 590 (Desktop)
Radeon RX 590, R7 2700X
76 (58min - 102max) fps -17%
3840x2160 Ultra Preset
NVIDIA GeForce RTX 2080 (Desktop)
GeForce RTX 2080 (Desktop), R7 2700X
62 (52min - 76max) fps
AMD Radeon VII
Radeon VII, R7 2700X
61 (50min - 80max) fps -2%
NVIDIA GeForce RTX 2070 (Desktop)
GeForce RTX 2070 (Desktop), R7 2700X
51 (43min - 61max) fps -18%
AMD Radeon RX Vega 64
RX Vega 64, R7 2700X
47 (38min - 60max) fps -24%
NVIDIA GeForce RTX 2060 (Desktop)
GeForce RTX 2060 (Desktop), R7 2700X
42 (35min - 52max) fps -32%
AMD Radeon RX 590 (Desktop)
Radeon RX 590, R7 2700X
31 (25min - 38max) fps -50%
Metro Exodus
1920x1080 Ultra Quality AF:16x
NVIDIA GeForce RTX 2080 (Desktop)
GeForce RTX 2080 (Desktop), R7 2700X
74.2 (38min - 122max) fps
AMD Radeon VII
Radeon VII, R7 2700X
67.2 (36min - 104max) fps -9%
NVIDIA GeForce RTX 2070 (Desktop)
GeForce RTX 2070 (Desktop), R7 2700X
60.4 (32min - 94max) fps -19%
AMD Radeon RX Vega 64
RX Vega 64, R7 2700X
56.4 (30min - 87max) fps -24%
NVIDIA GeForce RTX 2060 (Desktop)
GeForce RTX 2060 (Desktop), R7 2700X
52.7 (29min - 82max) fps -29%
AMD Radeon RX 590 (Desktop)
Radeon RX 590, R7 2700X
37.9 (21min - 58max) fps -49%
3840x2160 Ultra Quality AF:16x
AMD Radeon RX Vega 64
RX Vega 64, R7 2700X
45.7 (26min - 67max) fps +18%
NVIDIA GeForce RTX 2080 (Desktop)
GeForce RTX 2080 (Desktop), R7 2700X
38.6 (25min - 58max) fps
AMD Radeon VII
Radeon VII, R7 2700X
37.4 (25min - 50max) fps -3%
NVIDIA GeForce RTX 2070 (Desktop)
GeForce RTX 2070 (Desktop), R7 2700X
31.9 (21min - 45max) fps -17%
NVIDIA GeForce RTX 2060 (Desktop)
GeForce RTX 2060 (Desktop), R7 2700X
26.3 (17min - 38max) fps -32%
AMD Radeon RX 590 (Desktop)
Radeon RX 590, R7 2700X
19.3 (13min - 26max) fps -50%
Anthem - 1920x1080 Ultra Preset
NVIDIA GeForce RTX 2080 (Desktop)
GeForce RTX 2080 (Desktop), R7 2700X
97 (77min - 137max) fps
AMD Radeon RX Vega 64
RX Vega 64, R7 2700X
93 (76min - 118max) fps -4%
NVIDIA GeForce RTX 2070 (Desktop)
GeForce RTX 2070 (Desktop), R7 2700X
91 (75min - 115max) fps -6%
AMD Radeon VII
Radeon VII, R7 2700X
90.5 (70min - 125max) fps -7%
NVIDIA GeForce RTX 2060 (Desktop)
GeForce RTX 2060 (Desktop), R7 2700X
88 (56min - 109max) fps -9%
AMD Radeon RX 590 (Desktop)
Radeon RX 590, R7 2700X
80 (67min - 97max) fps -18%
Dirt Rally 2.0
1920x1080 Ultra Preset AA:T AF:16x
NVIDIA GeForce RTX 2080 (Desktop)
GeForce RTX 2080 (Desktop), R7 2700X
109 (101min - 120max) fps
AMD Radeon VII
Radeon VII, R7 2700X
106.5 (99min - 121max) fps -2%
NVIDIA GeForce RTX 2070 (Desktop)
GeForce RTX 2070 (Desktop), R7 2700X
93.2 (86min - 104max) fps -14%
AMD Radeon RX Vega 64
RX Vega 64, R7 2700X
89.7 (82min - 100max) fps -18%
NVIDIA GeForce RTX 2060 (Desktop)
GeForce RTX 2060 (Desktop), R7 2700X
84.4 (77min - 93max) fps -23%
AMD Radeon RX 590 (Desktop)
Radeon RX 590, R7 2700X
62.3 (55min - 67max) fps -43%
3840x2160 Ultra Preset AA:T AF:16x
NVIDIA GeForce RTX 2080 (Desktop)
GeForce RTX 2080 (Desktop), R7 2700X
56.7 (53min - 63max) fps
AMD Radeon VII
Radeon VII, R7 2700X
52.5 (48min - 57max) fps -7%
NVIDIA GeForce RTX 2070 (Desktop)
GeForce RTX 2070 (Desktop), R7 2700X
45.9 (43min - 50max) fps -19%
AMD Radeon RX Vega 64
RX Vega 64, R7 2700X
41.5 (38min - 46max) fps -27%
NVIDIA GeForce RTX 2060 (Desktop)
GeForce RTX 2060 (Desktop), R7 2700X
39.9 (37min - 44max) fps -30%
AMD Radeon RX 590 (Desktop)
Radeon RX 590, R7 2700X
29.7 (27min - 32max) fps -48%
The Division 2
1920x1080 Ultra Preset
NVIDIA GeForce RTX 2080 (Desktop)
GeForce RTX 2080 (Desktop), R7 2700X
106 fps
NVIDIA GeForce RTX 2070 (Desktop)
GeForce RTX 2070 (Desktop), R7 2700X
95 fps -10%
NVIDIA GeForce RTX 2060 (Desktop)
GeForce RTX 2060 (Desktop), R7 2700X
85 fps -20%
AMD Radeon RX Vega 64
RX Vega 64, R7 2700X
78 fps -26%
AMD Radeon RX 590 (Desktop)
Radeon RX 590, R7 2700X
60 fps -43%
3840x2160 Ultra Preset
NVIDIA GeForce RTX 2080 (Desktop)
GeForce RTX 2080 (Desktop), R7 2700X
50 fps
NVIDIA GeForce RTX 2070 (Desktop)
GeForce RTX 2070 (Desktop), R7 2700X
40 fps -20%
NVIDIA GeForce RTX 2060 (Desktop)
GeForce RTX 2060 (Desktop), R7 2700X
33 fps -34%
AMD Radeon RX Vega 64
RX Vega 64, R7 2700X
32 fps -36%
AMD Radeon RX 590 (Desktop)
Radeon RX 590, R7 2700X
23 fps -54%
low med. high ultraQHD4K
Battlefield 4 (2013) 200 200 200 200 125.4
GTA V (2015) 162 145 125 116 89
The Witcher 3 (2015) 301 263 182 109 78
Rainbow Six Siege (2015) 298.5 257.8 241.9 238 139.8
Rise of the Tomb Raider (2016) 263 196 182 162 77
Far Cry Primal (2016) 119 108 98 90 71
The Division (2016) 265.4 227.6 159.4 131.1 71.7
Doom (2016) 157.1 155.5 139.6 140.3 117.7
Overwatch (2016) 300 300 300 158 143
Deus Ex Mankind Divided (2016) 154 142.8 125.3 83.1 55.1
Battlefield 1 (2016) 193 175 159 147 88
Watch Dogs 2 (2016) 141.3 127.6 110 86.6 54.8
For Honor (2017) 300.6 222 214.8 169.7 76.8
Ghost Recon Wildlands (2017) 144.7 128.4 120 73.9 53.8
Rocket League (2017) 247.8 248.1 242.5 146.3
Dirt 4 (2017) 312 249 216 161 100
Playerunknown's Battlegrounds (PUBG) (2017) 278 222 166 181 74
Destiny 2 (2017) 146.8 146.4 146.3 146.1 130.5 72.4
Assassin´s Creed Origins (2017) 114 104 101 86 79 52
Call of Duty WWII (2017) 249 246 187 167 142 89
Fortnite (2018) 223 180 163 147 128 66
Final Fantasy XV Benchmark (2018) 163.1 125.5 96.1 44.2
Kingdom Come: Deliverance (2018) 141 125 96 78 70 39.1
Far Cry 5 (2018) 133 117 113 107 99 59
The Crew 2 (2018) 60 60 69 60 60 60
Monster Hunter World (2018) 144 137 135 115 78 38.6
F1 2018 (2018) 242 219 160 142 120 78
Shadow of the Tomb Raider (2018) 129 116 115 110 90 48
FIFA 19 (2018) 264 260 239 228 212 203
Forza Horizon 4 (2018) 179 159 157 139 118 84
Assassin´s Creed Odyssey (2018) 111 104 91 68 58 41
Call of Duty Black Ops 4 (2018) 225 190 182 177 123 64
Hitman 2 (2018) 90 90 84 79 80 60
Fallout 76 (2018) 60 60 60 60 60 60
Battlefield V (2018) 190 163 155 145 125 76
Farming Simulator 19 (2018) 192 141 134 124 123 83
Darksiders III (2018) 217 146 139 129 110 57.6
Just Cause 4 (2018) 200 165 129 123 88 50
Apex Legends (2019) 143 144 144 144 138 82
Far Cry New Dawn (2019) 118 105 102 92 89 62
Metro Exodus (2019) 242.4 108.8 87.9 74.2 59.6 38.6
Anthem (2019) 113 105 102 97 89 53.4
Dirt Rally 2.0 (2019) 206 159 153 109 87 56.7
The Division 2 (2019) 177 147 124 106 85 50
Anno 1800 (2019) 93 93 77 43.3 42.8 32.3
Rage 2 (2019) 259 149 130 131 89 44.7

Compute Performance

Those who do not specifically need expensive Quadro GPUs from Nvidia can utilize conventional desktop graphics cards for professional work. However, when compared to the supported Quadro GPUs, such video cards fall far, far behind.

The compute performance of the MSI RTX 2080 Gaming X Trio is on an expected level. Depending on the benchmark, the MSI RTX 2080 Gaming X Trio is up to 24% faster than the MSI RTX 2070 Gaming Z 8G. The AMD Radeon VII has no trouble keeping up with the RTX 2080 and sometimes even beats it by a considerable margin. However, occasionally the opposite is true, because from time to time the 7-nm GPU from AMD is trounced by the MSI RTX 2070 Gaming Z 8G.

The Nvidia Titan RTX is on top most of the time. However, this GPU is not designed solely for gaming and represents a sort of link between the GeForce and Quadro series.

LuxMark v2.0 64Bit
Room GPUs-only
NVIDIA Titan RTX
AMD Ryzen 7 2700X
4643 Samples/s +34%
AMD Radeon VII
AMD Ryzen 7 2700X
3477 Samples/s +1%
NVIDIA GeForce RTX 2080 (Desktop)
AMD Ryzen 7 2700X
3453 Samples/s
NVIDIA GeForce RTX 2080 (Desktop)
AMD Ryzen 7 2700X
3423 Samples/s -1%
NVIDIA GeForce RTX 2070 (Desktop)
AMD Ryzen 7 2700X
3333 Samples/s -3%
NVIDIA GeForce RTX 2070 (Desktop)
AMD Ryzen 7 2700X
3300 Samples/s -4%
NVIDIA GeForce GTX 1080 Ti (Desktop)
Intel Core i7-4790K
3050 Samples/s -12%
NVIDIA GeForce RTX 2060 (Desktop)
AMD Ryzen 7 2700X
2586 Samples/s -25%
NVIDIA GeForce GTX 1070 (Desktop)
Intel Core i7-4790K
2474 Samples/s -28%
NVIDIA GeForce GTX 1080 (Desktop)
Intel Core i7-4790K
2327 Samples/s -33%
NVIDIA GeForce GTX 1080 (Desktop)
Intel Core i7-4790K
2136 Samples/s -38%
AMD Radeon RX 590 (Desktop)
AMD Ryzen 7 2700X
1996 Samples/s -42%
Sala GPUs-only
NVIDIA Titan RTX
AMD Ryzen 7 2700X
10799 Samples/s +36%
NVIDIA GeForce RTX 2080 (Desktop)
AMD Ryzen 7 2700X
7928 Samples/s
NVIDIA GeForce RTX 2080 (Desktop)
AMD Ryzen 7 2700X
7886 Samples/s -1%
NVIDIA GeForce RTX 2070 (Desktop)
AMD Ryzen 7 2700X
7293 Samples/s -8%
NVIDIA GeForce RTX 2070 (Desktop)
AMD Ryzen 7 2700X
7179 Samples/s -9%
AMD Radeon VII
AMD Ryzen 7 2700X
6869 Samples/s -13%
NVIDIA GeForce GTX 1080 Ti (Desktop)
Intel Core i7-4790K
6600 Samples/s -17%
NVIDIA GeForce RTX 2060 (Desktop)
AMD Ryzen 7 2700X
5655 Samples/s -29%
NVIDIA GeForce GTX 1070 (Desktop)
Intel Core i7-4790K
5012 Samples/s -37%
NVIDIA GeForce GTX 1080 (Desktop)
Intel Core i7-4790K
4791 Samples/s -40%
NVIDIA GeForce GTX 1080 (Desktop)
Intel Core i7-4790K
4708 Samples/s -41%
AMD Radeon RX 590 (Desktop)
AMD Ryzen 7 2700X
4084 Samples/s -48%
ComputeMark v2.1
1024x600 Normal, QJuliaRayTrace
NVIDIA Titan RTX
AMD Ryzen 7 2700X
9418 Points +29%
NVIDIA GeForce GTX 1080 Ti (Desktop)
Intel Core i7-4790K
7938 Points +9%
NVIDIA GeForce RTX 2080 (Desktop)
AMD Ryzen 7 2700X
7283 Points
NVIDIA GeForce RTX 2080 (Desktop)
AMD Ryzen 7 2700X
7122 Points -2%
NVIDIA GeForce GTX 1080 (Desktop)
Intel Core i7-4790K
6555 Points -10%
NVIDIA GeForce GTX 1080 (Desktop)
Intel Core i7-4790K
6191 Points -15%
NVIDIA GeForce RTX 2070 (Desktop)
AMD Ryzen 7 2700X
6038 Points -17%
AMD Radeon VII
AMD Ryzen 7 2700X
5878 Points -19%
NVIDIA GeForce RTX 2070 (Desktop)
AMD Ryzen 7 2700X
5747 Points -21%
NVIDIA GeForce RTX 2060 (Desktop)
AMD Ryzen 7 2700X
4903 Points -33%
NVIDIA GeForce GTX 1070 (Desktop)
Intel Core i7-4790K
4761 Points -35%
AMD Radeon RX 590 (Desktop)
AMD Ryzen 7 2700X
3299 Points -55%
1024x600 Normal, Mandel Scalar
AMD Radeon VII
AMD Ryzen 7 2700X
6312 Points +39%
NVIDIA Titan RTX
AMD Ryzen 7 2700X
5977 Points +32%
NVIDIA GeForce GTX 1080 Ti (Desktop)
Intel Core i7-4790K
4949 Points +9%
NVIDIA GeForce RTX 2080 (Desktop)
AMD Ryzen 7 2700X
4526 Points
NVIDIA GeForce RTX 2080 (Desktop)
AMD Ryzen 7 2700X
4427 Points -2%
NVIDIA GeForce GTX 1080 (Desktop)
Intel Core i7-4790K
4080 Points -10%
NVIDIA GeForce RTX 2070 (Desktop)
AMD Ryzen 7 2700X
3662 Points -19%
NVIDIA GeForce GTX 1080 (Desktop)
Intel Core i7-4790K
3646 Points -19%
NVIDIA GeForce RTX 2070 (Desktop)
AMD Ryzen 7 2700X
3514 Points -22%
AMD Radeon RX 590 (Desktop)
AMD Ryzen 7 2700X
3312 Points -27%
NVIDIA GeForce RTX 2060 (Desktop)
AMD Ryzen 7 2700X
2982 Points -34%
NVIDIA GeForce GTX 1070 (Desktop)
Intel Core i7-4790K
2861 Points -37%
1024x600 Normal, Mandel Vector
NVIDIA Titan RTX
AMD Ryzen 7 2700X
4944 Points +27%
AMD Radeon VII
AMD Ryzen 7 2700X
4714 Points +21%
NVIDIA GeForce GTX 1080 Ti (Desktop)
Intel Core i7-4790K
4391 Points +13%
NVIDIA GeForce RTX 2080 (Desktop)
AMD Ryzen 7 2700X
3892 Points
NVIDIA GeForce RTX 2080 (Desktop)
AMD Ryzen 7 2700X
3865 Points -1%
NVIDIA GeForce GTX 1080 (Desktop)
Intel Core i7-4790K
3630 Points -7%
NVIDIA GeForce RTX 2070 (Desktop)
AMD Ryzen 7 2700X
3316 Points -15%
NVIDIA GeForce GTX 1080 (Desktop)
Intel Core i7-4790K
3284 Points -16%
NVIDIA GeForce RTX 2070 (Desktop)
AMD Ryzen 7 2700X
3169 Points -19%
AMD Radeon RX 590 (Desktop)
AMD Ryzen 7 2700X
2802 Points -28%
NVIDIA GeForce RTX 2060 (Desktop)
AMD Ryzen 7 2700X
2800 Points -28%
NVIDIA GeForce GTX 1070 (Desktop)
Intel Core i7-4790K
2706 Points -30%
1024x600 Normal, Fluid 2DTexArr
NVIDIA Titan RTX
AMD Ryzen 7 2700X
3691 Points +49%
NVIDIA GeForce RTX 2080 (Desktop)
AMD Ryzen 7 2700X
2506 Points +1%
NVIDIA GeForce RTX 2080 (Desktop)
AMD Ryzen 7 2700X
2482 Points
NVIDIA GeForce RTX 2070 (Desktop)
AMD Ryzen 7 2700X
2407 Points -3%
AMD Radeon VII
AMD Ryzen 7 2700X
2248 Points -9%
NVIDIA GeForce RTX 2070 (Desktop)
AMD Ryzen 7 2700X
2221 Points -11%
NVIDIA GeForce GTX 1080 Ti (Desktop)
Intel Core i7-4790K
2092 Points -16%
NVIDIA GeForce RTX 2060 (Desktop)
AMD Ryzen 7 2700X
1801 Points -27%
NVIDIA GeForce GTX 1080 (Desktop)
Intel Core i7-4790K
1775 Points -28%
NVIDIA GeForce GTX 1080 (Desktop)
Intel Core i7-4790K
1758 Points -29%
NVIDIA GeForce GTX 1070 (Desktop)
Intel Core i7-4790K
1390 Points -44%
AMD Radeon RX 590 (Desktop)
AMD Ryzen 7 2700X
1140 Points -54%
1024x600 Normal, Fluid 3DTex
NVIDIA Titan RTX
AMD Ryzen 7 2700X
3877 Points +50%
AMD Radeon VII
AMD Ryzen 7 2700X
3646 Points +41%
NVIDIA GeForce RTX 2080 (Desktop)
AMD Ryzen 7 2700X
2588 Points
NVIDIA GeForce RTX 2080 (Desktop)
AMD Ryzen 7 2700X
2564 Points -1%
NVIDIA GeForce RTX 2070 (Desktop)
AMD Ryzen 7 2700X
2536 Points -2%
NVIDIA GeForce RTX 2070 (Desktop)
AMD Ryzen 7 2700X
2380 Points -8%
NVIDIA GeForce GTX 1080 Ti (Desktop)
Intel Core i7-4790K
2275 Points -12%
NVIDIA GeForce RTX 2060 (Desktop)
AMD Ryzen 7 2700X
1889 Points -27%
NVIDIA GeForce GTX 1080 (Desktop)
Intel Core i7-4790K
1767 Points -32%
NVIDIA GeForce GTX 1080 (Desktop)
Intel Core i7-4790K
1730 Points -33%
NVIDIA GeForce GTX 1070 (Desktop)
Intel Core i7-4790K
1402 Points -46%
AMD Radeon RX 590 (Desktop)
AMD Ryzen 7 2700X
1239 Points -52%
1024x600 Normal, Score
NVIDIA Titan RTX
AMD Ryzen 7 2700X
27907 Points +34%
AMD Radeon VII
AMD Ryzen 7 2700X
22798 Points +10%
NVIDIA GeForce GTX 1080 Ti (Desktop)
Intel Core i7-4790K
21646 Points +4%
NVIDIA GeForce RTX 2080 (Desktop)
AMD Ryzen 7 2700X
20771 Points
NVIDIA GeForce RTX 2080 (Desktop)
AMD Ryzen 7 2700X
20484 Points -1%
NVIDIA GeForce GTX 1080 (Desktop)
Intel Core i7-4790K
17806 Points -14%
NVIDIA GeForce RTX 2070 (Desktop)
AMD Ryzen 7 2700X
17690 Points -15%
NVIDIA GeForce RTX 2070 (Desktop)
AMD Ryzen 7 2700X
17031 Points -18%
NVIDIA GeForce GTX 1080 (Desktop)
Intel Core i7-4790K
16610 Points -20%
NVIDIA GeForce RTX 2060 (Desktop)
AMD Ryzen 7 2700X
14375 Points -31%
NVIDIA GeForce GTX 1070 (Desktop)
Intel Core i7-4790K
13121 Points -37%
AMD Radeon RX 590 (Desktop)
AMD Ryzen 7 2700X
11791 Points -43%
SPECviewperf 13
Solidworks (sw-04)
NVIDIA Titan RTX
AMD Ryzen 7 2700X
132.9 fps +33%
NVIDIA GeForce RTX 2080 (Desktop)
AMD Ryzen 7 2700X
100.3 fps
AMD Radeon VII
AMD Ryzen 7 2700X
95.1 fps -5%
NVIDIA GeForce RTX 2070 (Desktop)
AMD Ryzen 7 2700X
86.7 fps -14%
NVIDIA GeForce RTX 2060 (Desktop)
AMD Ryzen 7 2700X
83.4 fps -17%
AMD Radeon RX 590 (Desktop)
AMD Ryzen 7 2700X
82.9 fps -17%
NVIDIA Titan X Pascal
AMD Ryzen Threadripper 1950X
82.1 fps -18%
AMD Radeon RX 580 (Desktop)
AMD Ryzen 7 2700X
78.8 fps -21%
Siemens NX (snx-03)
NVIDIA Titan RTX
AMD Ryzen 7 2700X
462.4 fps +2031%
NVIDIA Titan X Pascal
AMD Ryzen Threadripper 1950X
370.9 fps +1609%
AMD Radeon RX 590 (Desktop)
AMD Ryzen 7 2700X
44.18 fps +104%
AMD Radeon RX 580 (Desktop)
AMD Ryzen 7 2700X
38.19 fps +76%
AMD Radeon VII
AMD Ryzen 7 2700X
37.03 fps +71%
NVIDIA GeForce RTX 2080 (Desktop)
AMD Ryzen 7 2700X
21.7 fps
NVIDIA GeForce RTX 2070 (Desktop)
AMD Ryzen 7 2700X
15.6 fps -28%
NVIDIA GeForce RTX 2060 (Desktop)
AMD Ryzen 7 2700X
14.99 fps -31%
Showcase (showcase-02)
NVIDIA Titan RTX
AMD Ryzen 7 2700X
192 fps
NVIDIA Titan X Pascal
AMD Ryzen Threadripper 1950X
136.8 fps
NVIDIA GeForce RTX 2060 (Desktop)
AMD Ryzen 7 2700X
101.6 fps
AMD Radeon RX 580 (Desktop)
AMD Ryzen 7 2700X
72.2 fps
AMD Radeon RX 590 (Desktop)
AMD Ryzen 7 2700X
72.2 fps
Medical (medical-02)
NVIDIA Titan RTX
AMD Ryzen 7 2700X
89.3 fps +26%
AMD Radeon VII
AMD Ryzen 7 2700X
77.9 fps +10%
NVIDIA Titan X Pascal
AMD Ryzen Threadripper 1950X
71.4 fps +1%
NVIDIA GeForce RTX 2080 (Desktop)
AMD Ryzen 7 2700X
71 fps
NVIDIA GeForce RTX 2070 (Desktop)
AMD Ryzen 7 2700X
57.7 fps -19%
NVIDIA GeForce RTX 2060 (Desktop)
AMD Ryzen 7 2700X
49.1 fps -31%
AMD Radeon RX 590 (Desktop)
AMD Ryzen 7 2700X
27.9 fps -61%
AMD Radeon RX 580 (Desktop)
AMD Ryzen 7 2700X
26.86 fps -62%
Maya (maya-05)
NVIDIA Titan RTX
AMD Ryzen 7 2700X
367.8 fps
NVIDIA GeForce RTX 2070 (Desktop)
AMD Ryzen 7 2700X
275.3 fps
NVIDIA GeForce RTX 2060 (Desktop)
AMD Ryzen 7 2700X
247 fps
NVIDIA Titan X Pascal
AMD Ryzen Threadripper 1950X
236.5 fps
AMD Radeon VII
AMD Ryzen 7 2700X
212.6 fps
AMD Radeon RX 590 (Desktop)
AMD Ryzen 7 2700X
151 fps
AMD Radeon RX 580 (Desktop)
AMD Ryzen 7 2700X
147.4 fps
Energy (energy-02)
NVIDIA Titan RTX
AMD Ryzen 7 2700X
51.9 fps
AMD Radeon VII
AMD Ryzen 7 2700X
35.05 fps
NVIDIA Titan X Pascal
AMD Ryzen Threadripper 1950X
32.46 fps
NVIDIA GeForce RTX 2070 (Desktop)
AMD Ryzen 7 2700X
22.33 fps
AMD Radeon RX 590 (Desktop)
AMD Ryzen 7 2700X
8.98 fps
AMD Radeon RX 580 (Desktop)
AMD Ryzen 7 2700X
8.45 fps
NVIDIA GeForce RTX 2060 (Desktop)
AMD Ryzen 7 2700X
7.62 fps
Creo (creo-02)
NVIDIA Titan RTX
AMD Ryzen 7 2700X
307.6 fps +40%
NVIDIA GeForce RTX 2080 (Desktop)
AMD Ryzen 7 2700X
220.3 fps
NVIDIA Titan X Pascal
AMD Ryzen Threadripper 1950X
185.2 fps -16%
NVIDIA GeForce RTX 2070 (Desktop)
AMD Ryzen 7 2700X
184.2 fps -16%
NVIDIA GeForce RTX 2060 (Desktop)
AMD Ryzen 7 2700X
169.8 fps -23%
AMD Radeon VII
AMD Ryzen 7 2700X
115.7 fps -47%
AMD Radeon RX 590 (Desktop)
AMD Ryzen 7 2700X
90 fps -59%
AMD Radeon RX 580 (Desktop)
AMD Ryzen 7 2700X
80.1 fps -64%
Catia (catia-05)
NVIDIA Titan RTX
AMD Ryzen 7 2700X
260.4 fps
AMD Radeon VII
AMD Ryzen 7 2700X
239.2 fps
AMD Radeon RX 590 (Desktop)
AMD Ryzen 7 2700X
168.9 fps
NVIDIA Titan X Pascal
AMD Ryzen Threadripper 1950X
161.4 fps
AMD Radeon RX 580 (Desktop)
AMD Ryzen 7 2700X
158 fps
NVIDIA GeForce RTX 2070 (Desktop)
AMD Ryzen 7 2700X
118.6 fps
NVIDIA GeForce RTX 2060 (Desktop)
AMD Ryzen 7 2700X
108.2 fps
3ds Max (3dsmax-06)
NVIDIA Titan RTX
AMD Ryzen 7 2700X
268.7 fps
NVIDIA GeForce RTX 2070 (Desktop)
AMD Ryzen 7 2700X
207.3 fps
NVIDIA GeForce RTX 2060 (Desktop)
AMD Ryzen 7 2700X
184.4 fps
AMD Radeon VII
AMD Ryzen 7 2700X
168.5 fps
NVIDIA Titan X Pascal
AMD Ryzen Threadripper 1950X
153.4 fps
AMD Radeon RX 590 (Desktop)
AMD Ryzen 7 2700X
120.4 fps
AMD Radeon RX 580 (Desktop)
AMD Ryzen 7 2700X
115.7 fps
SPECviewperf 12
1900x1060 Solidworks (sw-03)
NVIDIA Titan RTX
AMD Ryzen 7 2700X
139.6 fps +99%
NVIDIA Titan X Pascal
AMD Ryzen Threadripper 1950X
77.1 fps +10%
AMD Radeon VII
AMD Ryzen 7 2700X
75.9 fps +8%
NVIDIA GeForce GTX 1080 Ti (Desktop)
Intel Core i7-4790K
75.4 fps +8%
AMD Radeon RX 590 (Desktop)
AMD Ryzen 7 2700X
70.4 fps 0%
NVIDIA GeForce RTX 2080 (Desktop)
AMD Ryzen 7 2700X
70.1 fps
NVIDIA GeForce RTX 2080 (Desktop)
AMD Ryzen 7 2700X
69.5 fps -1%
NVIDIA GeForce GTX 1080 (Desktop)
Intel Core i7-4790K
67.7 fps -3%
AMD Radeon RX 580 (Desktop)
AMD Ryzen 7 2700X
66 fps -6%
NVIDIA GeForce RTX 2070 (Desktop)
AMD Ryzen 7 2700X
61 fps -13%
NVIDIA GeForce RTX 2070 (Desktop)
AMD Ryzen 7 2700X
60.6 fps -14%
NVIDIA GeForce RTX 2060 (Desktop)
AMD Ryzen 7 2700X
57.6 fps -18%
1900x1060 Siemens NX (snx-02)
NVIDIA Titan RTX
AMD Ryzen 7 2700X
256.3 fps +2022%
NVIDIA Titan X Pascal
AMD Ryzen Threadripper 1950X
206.8 fps +1612%
AMD Radeon RX 590 (Desktop)
AMD Ryzen 7 2700X
24.87 fps +106%
AMD Radeon RX 580 (Desktop)
AMD Ryzen 7 2700X
21.27 fps +76%
AMD Radeon VII
AMD Ryzen 7 2700X
20.54 fps +70%
NVIDIA GeForce RTX 2080 (Desktop)
AMD Ryzen 7 2700X
12.08 fps
NVIDIA GeForce RTX 2080 (Desktop)
AMD Ryzen 7 2700X
11.74 fps -3%
NVIDIA GeForce GTX 1080 Ti (Desktop)
Intel Core i7-4790K
10.2 fps -16%
NVIDIA GeForce GTX 1080 (Desktop)
Intel Core i7-4790K
8.67 fps -28%
NVIDIA GeForce RTX 2070 (Desktop)
AMD Ryzen 7 2700X
8.63 fps -29%
NVIDIA GeForce RTX 2070 (Desktop)
AMD Ryzen 7 2700X
8.56 fps -29%
NVIDIA GeForce RTX 2060 (Desktop)
AMD Ryzen 7 2700X
8.35 fps -31%
1900x1060 Showcase (showcase-01)
NVIDIA Titan RTX
AMD Ryzen 7 2700X
191.6 fps
NVIDIA GeForce GTX 1080 Ti (Desktop)
Intel Core i7-4790K
155.2 fps
NVIDIA GeForce RTX 2080 (Desktop)
AMD Ryzen 7 2700X
137.9 fps
NVIDIA Titan X Pascal
AMD Ryzen Threadripper 1950X
137 fps
NVIDIA GeForce RTX 2070 (Desktop)
AMD Ryzen 7 2700X
128.2 fps
NVIDIA GeForce GTX 1080 (Desktop)
Intel Core i7-4790K
112 fps
NVIDIA GeForce RTX 2060 (Desktop)
AMD Ryzen 7 2700X
101 fps
AMD Radeon RX 580 (Desktop)
AMD Ryzen 7 2700X
72.3 fps
AMD Radeon RX 590 (Desktop)
AMD Ryzen 7 2700X
72.1 fps
1900x1060 Medical (medical-01)
NVIDIA Titan RTX
AMD Ryzen 7 2700X
87 fps +94%
NVIDIA Titan X Pascal
AMD Ryzen Threadripper 1950X
79.6 fps +77%
NVIDIA GeForce GTX 1080 Ti (Desktop)
Intel Core i7-4790K
59.8 fps +33%
AMD Radeon VII
AMD Ryzen 7 2700X
52.3 fps +17%
NVIDIA GeForce GTX 1080 (Desktop)
Intel Core i7-4790K
45.6 fps +2%
NVIDIA GeForce RTX 2080 (Desktop)
AMD Ryzen 7 2700X
45.26 fps +1%
NVIDIA GeForce RTX 2080 (Desktop)
AMD Ryzen 7 2700X
44.89 fps
NVIDIA GeForce RTX 2070 (Desktop)
AMD Ryzen 7 2700X
41.41 fps -8%
NVIDIA GeForce RTX 2070 (Desktop)
AMD Ryzen 7 2700X
39.61 fps -12%
NVIDIA GeForce RTX 2060 (Desktop)
AMD Ryzen 7 2700X
35.22 fps -22%
AMD Radeon RX 590 (Desktop)
AMD Ryzen 7 2700X
33.92 fps -24%
AMD Radeon RX 580 (Desktop)
AMD Ryzen 7 2700X
31.76 fps -29%
1900x1060 Maya (maya-04)
NVIDIA GeForce GTX 1080 Ti (Desktop)
Intel Core i7-4790K
194.5 fps +31%
NVIDIA GeForce GTX 1080 (Desktop)
Intel Core i7-4790K
163 fps +10%
NVIDIA GeForce RTX 2080 (Desktop)
AMD Ryzen 7 2700X
150.4 fps +1%
NVIDIA GeForce RTX 2080 (Desktop)
AMD Ryzen 7 2700X
148.7 fps
NVIDIA GeForce RTX 2070 (Desktop)
AMD Ryzen 7 2700X
148.6 fps 0%
NVIDIA GeForce RTX 2070 (Desktop)
AMD Ryzen 7 2700X
146.2 fps -2%
NVIDIA Titan RTX
AMD Ryzen 7 2700X
132.8 fps -11%
NVIDIA GeForce RTX 2060 (Desktop)
AMD Ryzen 7 2700X
127.4 fps -14%
AMD Radeon VII
AMD Ryzen 7 2700X
88.1 fps -41%
NVIDIA Titan X Pascal
AMD Ryzen Threadripper 1950X
79.7 fps -46%
AMD Radeon RX 590 (Desktop)
AMD Ryzen 7 2700X
66.2 fps -55%
AMD Radeon RX 580 (Desktop)
AMD Ryzen 7 2700X
61.5 fps -59%
1900x1060 Energy (energy-01)
NVIDIA Titan RTX
AMD Ryzen 7 2700X
28.12 fps +125%
NVIDIA Titan X Pascal
AMD Ryzen Threadripper 1950X
19.78 fps +58%
AMD Radeon VII
AMD Ryzen 7 2700X
16.63 fps +33%
NVIDIA GeForce GTX 1080 Ti (Desktop)
Intel Core i7-4790K
14.8 fps +18%
NVIDIA GeForce RTX 2080 (Desktop)
AMD Ryzen 7 2700X
12.52 fps
NVIDIA GeForce RTX 2080 (Desktop)
AMD Ryzen 7 2700X
12.38 fps -1%
NVIDIA GeForce RTX 2070 (Desktop)
AMD Ryzen 7 2700X
11.61 fps -7%
NVIDIA GeForce RTX 2070 (Desktop)
AMD Ryzen 7 2700X
11.27 fps -10%
NVIDIA GeForce GTX 1080 (Desktop)
Intel Core i7-4790K
10.4 fps -17%
NVIDIA GeForce RTX 2060 (Desktop)
AMD Ryzen 7 2700X
9.19 fps -27%
AMD Radeon RX 580 (Desktop)
AMD Ryzen 7 2700X
6.02 fps -52%
AMD Radeon RX 590 (Desktop)
AMD Ryzen 7 2700X
5.95 fps -52%
1900x1060 Creo (creo-01)
NVIDIA Titan RTX
AMD Ryzen 7 2700X
106.3 fps +102%
NVIDIA Titan X Pascal
AMD Ryzen Threadripper 1950X
75.4 fps +44%
NVIDIA GeForce GTX 1080 Ti (Desktop)
Intel Core i7-4790K
67.7 fps +29%
NVIDIA GeForce GTX 1080 (Desktop)
Intel Core i7-4790K
60.9 fps +16%
AMD Radeon VII
AMD Ryzen 7 2700X
55.4 fps +6%
NVIDIA GeForce RTX 2080 (Desktop)
AMD Ryzen 7 2700X
52.5 fps
NVIDIA GeForce RTX 2080 (Desktop)
AMD Ryzen 7 2700X
52.1 fps -1%
AMD Radeon RX 590 (Desktop)
AMD Ryzen 7 2700X
49.01 fps -7%
NVIDIA GeForce RTX 2070 (Desktop)
AMD Ryzen 7 2700X
45.67 fps -13%
NVIDIA GeForce RTX 2070 (Desktop)
AMD Ryzen 7 2700X
45.56 fps -13%
AMD Radeon RX 580 (Desktop)
AMD Ryzen 7 2700X
45 fps -14%
NVIDIA GeForce RTX 2060 (Desktop)
AMD Ryzen 7 2700X
44.45 fps -15%
1900x1060 Catia (catia-04)
NVIDIA Titan RTX
AMD Ryzen 7 2700X
178.1 fps +63%
AMD Radeon VII
AMD Ryzen 7 2700X
159.1 fps +45%
AMD Radeon RX 590 (Desktop)
AMD Ryzen 7 2700X
123.5 fps +13%
NVIDIA GeForce RTX 2080 (Desktop)
AMD Ryzen 7 2700X
109.4 fps
NVIDIA GeForce GTX 1080 Ti (Desktop)
Intel Core i7-4790K
109.1 fps 0%
AMD Radeon RX 580 (Desktop)
AMD Ryzen 7 2700X
109.1 fps 0%
NVIDIA GeForce RTX 2080 (Desktop)
AMD Ryzen 7 2700X
107.5 fps -2%
NVIDIA Titan X Pascal
AMD Ryzen Threadripper 1950X
100.3 fps -8%
NVIDIA GeForce GTX 1080 (Desktop)
Intel Core i7-4790K
86.3 fps -21%
NVIDIA GeForce RTX 2070 (Desktop)
AMD Ryzen 7 2700X
83 fps -24%
NVIDIA GeForce RTX 2070 (Desktop)
AMD Ryzen 7 2700X
81.9 fps -25%
NVIDIA GeForce RTX 2060 (Desktop)
AMD Ryzen 7 2700X
74.8 fps -32%
1900x1060 3ds Max (3dsmax-05)
NVIDIA Titan RTX
AMD Ryzen 7 2700X
268.2 fps +15%
NVIDIA GeForce RTX 2080 (Desktop)
AMD Ryzen 7 2700X
234.1 fps
NVIDIA GeForce RTX 2070 (Desktop)
AMD Ryzen 7 2700X
207.2 fps -11%
NVIDIA GeForce RTX 2060 (Desktop)
AMD Ryzen 7 2700X
183.6 fps -22%
NVIDIA GeForce RTX 2080 (Desktop)
AMD Ryzen 7 2700X
176.2 fps -25%
AMD Radeon VII
AMD Ryzen 7 2700X
166.9 fps -29%
NVIDIA GeForce RTX 2070 (Desktop)
AMD Ryzen 7 2700X
166.5 fps -29%
NVIDIA Titan X Pascal
AMD Ryzen Threadripper 1950X
151.9 fps -35%
NVIDIA GeForce GTX 1080 Ti (Desktop)
Intel Core i7-4790K
128.2 fps -45%
AMD Radeon RX 590 (Desktop)
AMD Ryzen 7 2700X
120.3 fps -49%
AMD Radeon RX 580 (Desktop)
AMD Ryzen 7 2700X
115.5 fps -51%
SiSoft Sandra 2016
Image Processing
AMD Radeon VII
AMD Ryzen 7 2700X
2800 MPix/s +103%
NVIDIA GeForce RTX 2080 (Desktop)
AMD Ryzen 7 2700X
1380 MPix/s
NVIDIA GeForce RTX 2070 (Desktop)
AMD Ryzen 7 2700X
1150 MPix/s -17%
NVIDIA GeForce RTX 2060 (Desktop)
AMD Ryzen 7 2700X
912 MPix/s -34%
GP Cryptography (Higher Security AES256+SHA2-512)
NVIDIA GeForce RTX 2080 (Desktop)
AMD Ryzen 7 2700X
101.8 GB/s
AMD Radeon VII
AMD Ryzen 7 2700X
99.2 GB/s -3%
NVIDIA GeForce RTX 2070 (Desktop)
AMD Ryzen 7 2700X
75.4 GB/s -26%
NVIDIA GeForce RTX 2060 (Desktop)
AMD Ryzen 7 2700X
63.8 GB/s -37%
GP Financial Analysis (FP High/Double Precision)
AMD Radeon VII
AMD Ryzen 7 2700X
1130 KOPT/s +609%
NVIDIA GeForce RTX 2080 (Desktop)
AMD Ryzen 7 2700X
159.4 KOPT/s
NVIDIA GeForce RTX 2070 (Desktop)
AMD Ryzen 7 2700X
121.3 KOPT/s -24%
NVIDIA GeForce RTX 2060 (Desktop)
AMD Ryzen 7 2700X
99.1 KOPT/s -38%

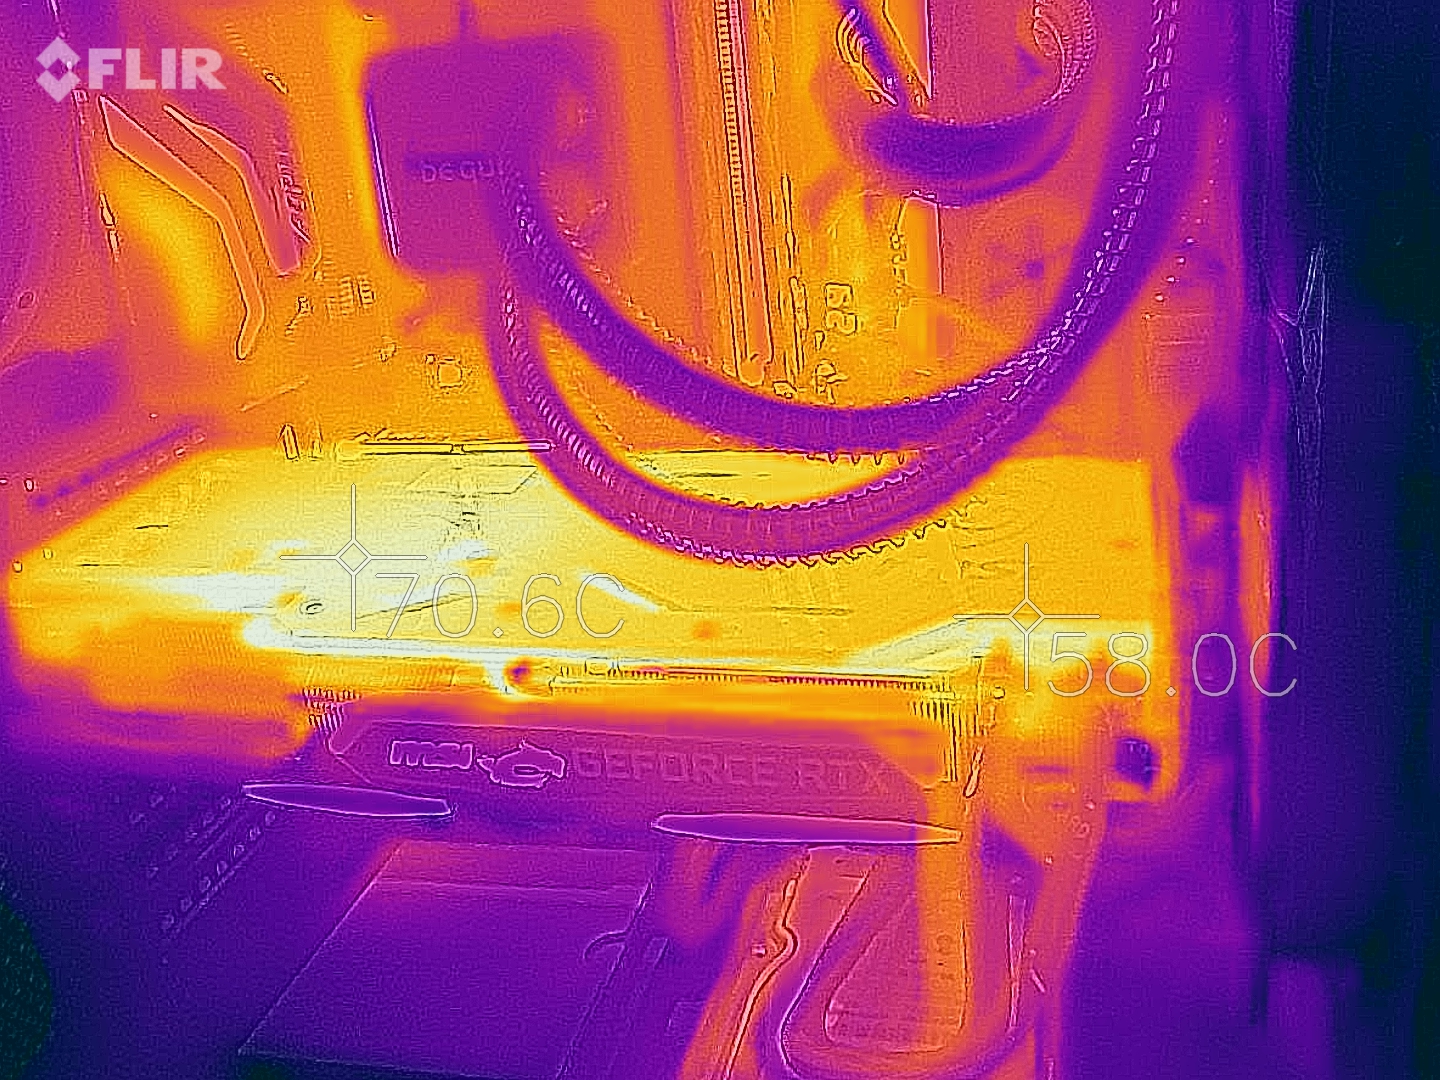
Emissions of the MSI RTX 2080 Gaming X Trio

MSI RTX 2080 Gaming X Trio during the stress test

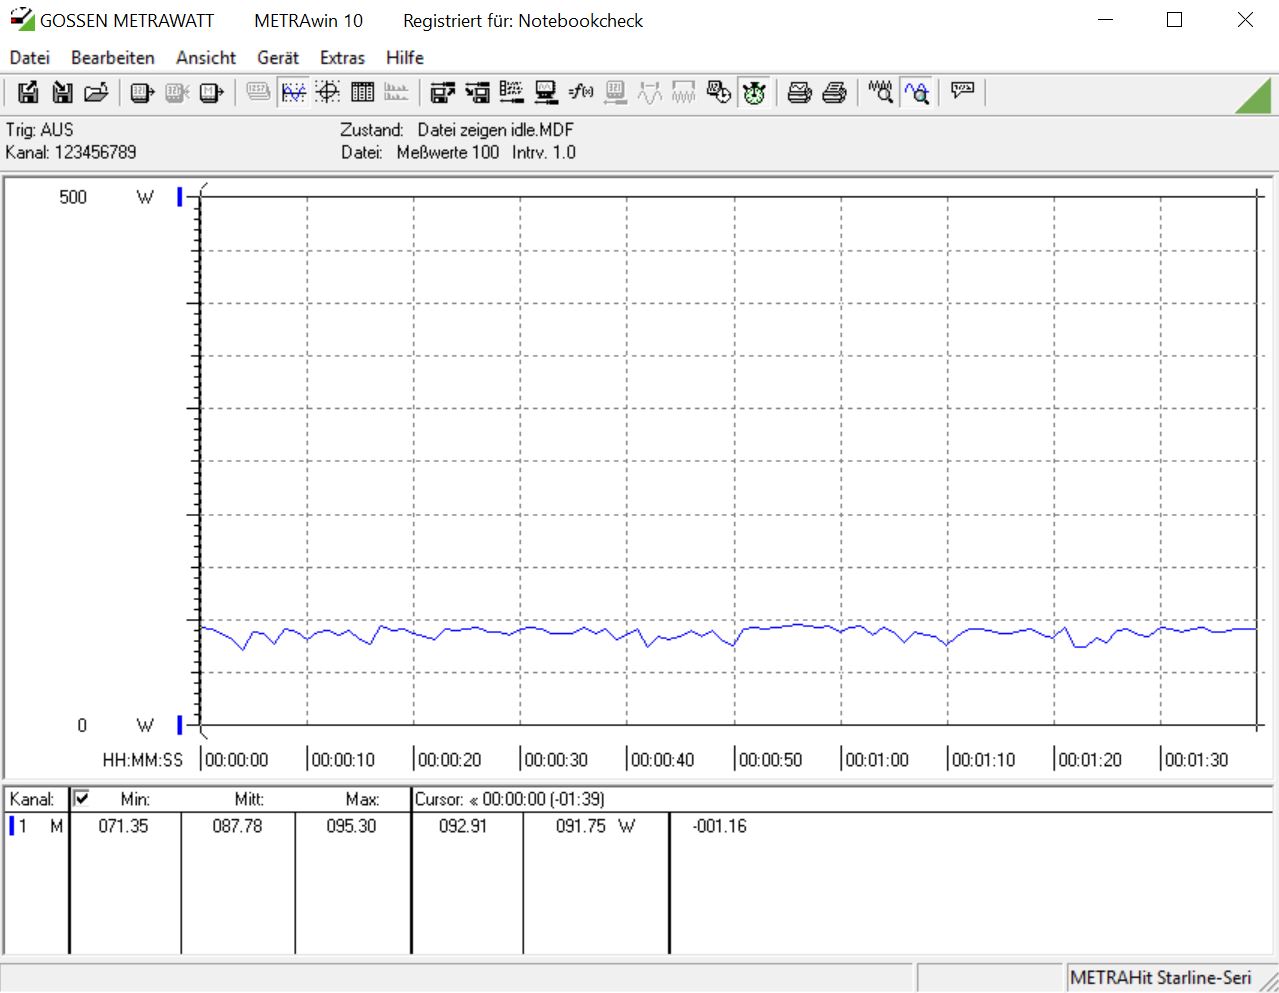
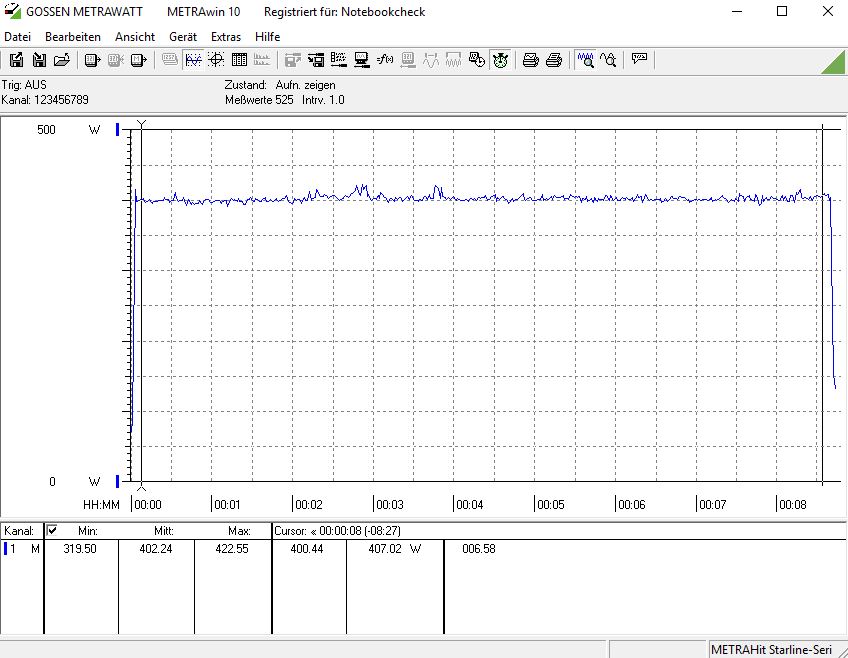
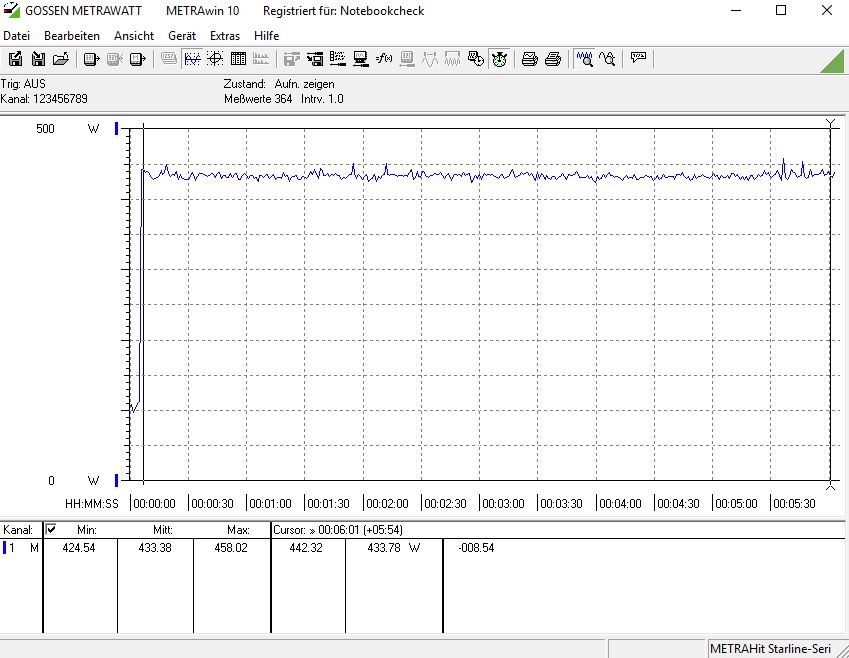
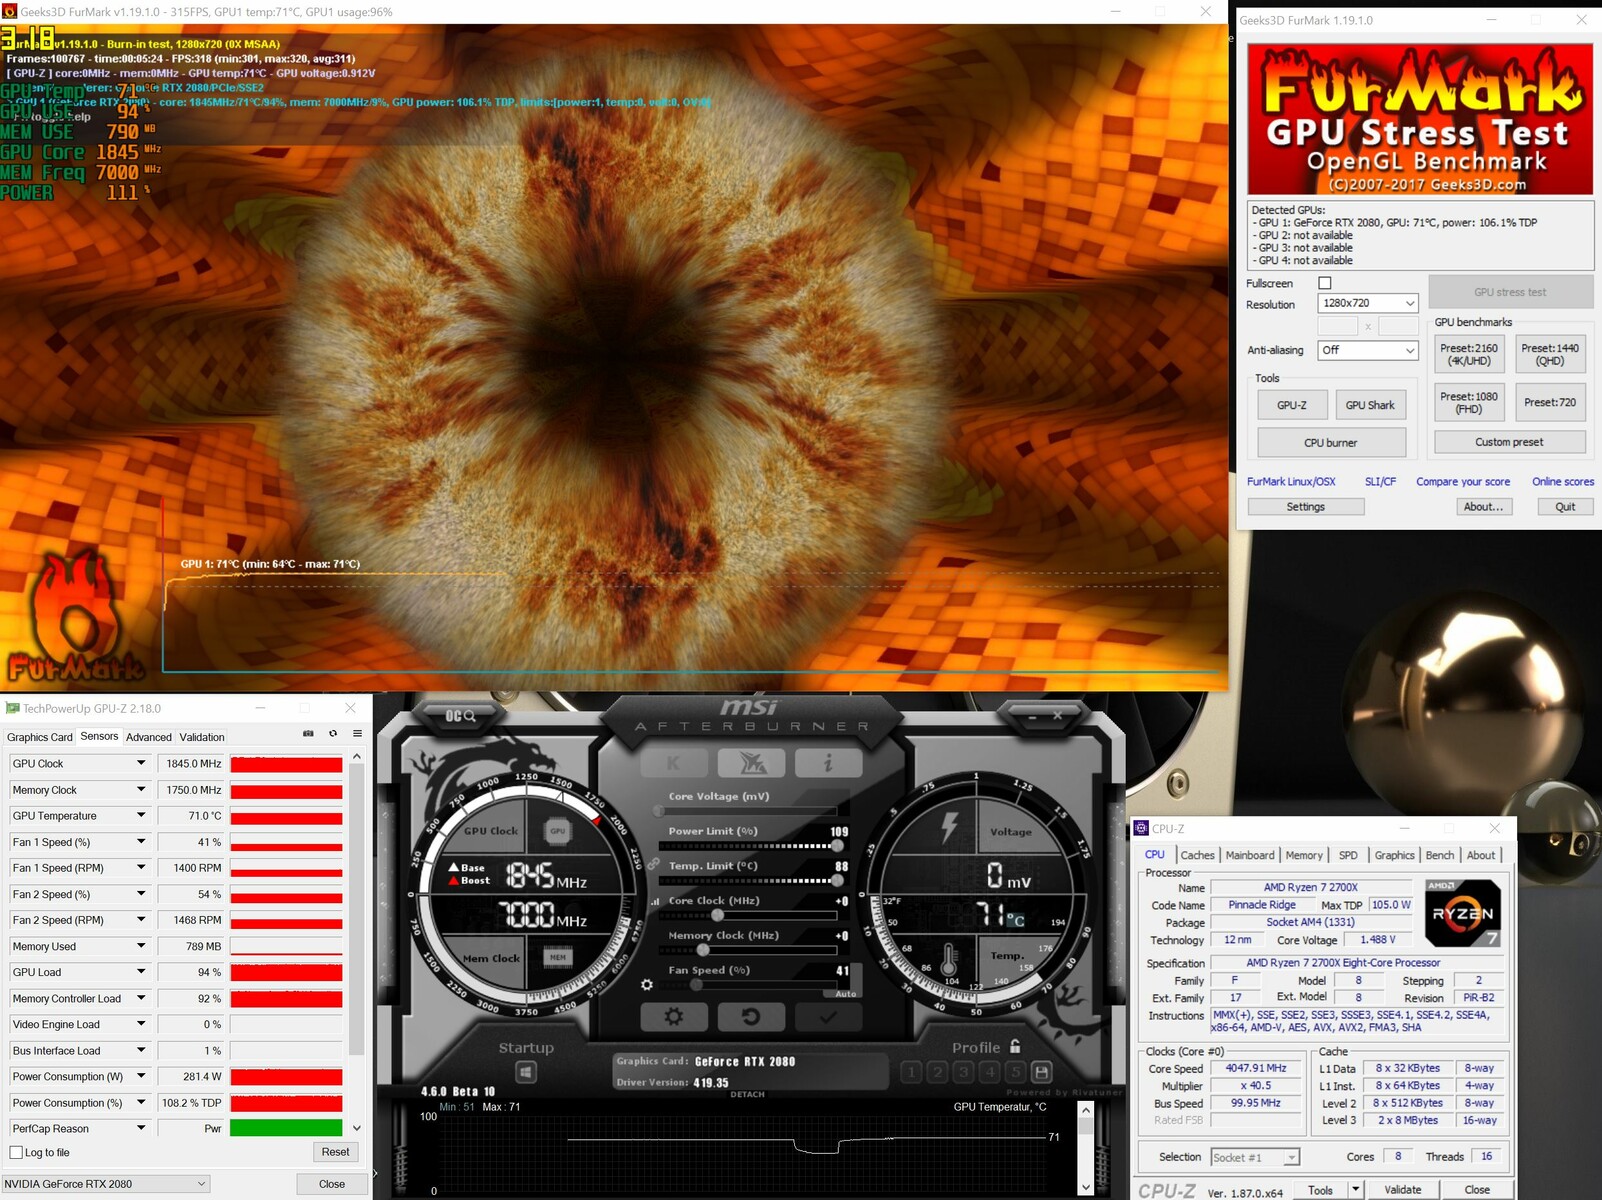
Under load, the emissions look quite bad, due to a high maximum TDP of 260 watts. When idle, the system draws 88 watts, which is normal when compared to the MSI RTX 2070 Gaming Z 8G and the MSI RTX 2060 Gaming Z 6G. During the stress test with FurMark, the energy consumption rises up to 402 watts. However, when we raised the power target from 100% to 109%, the average power consumption reached 433 watts, with the maximum power draw amounting to 460 watts. When gaming, the system drew about 405 watts.

The comparison chart shows that the MSI RTX 2080 Gaming X Trio is a power hog. The MSI RTX 2070 Gaming Z 8G needed considerably less power with the same test bench. Nevertheless, thanks to a very high performance, the MSI RTX 2080 Gaming X Trio can still be described as energy-efficient. Only the AMD Radeon RX Vega 64 and the Nvidia Titan RTX consume more energy.

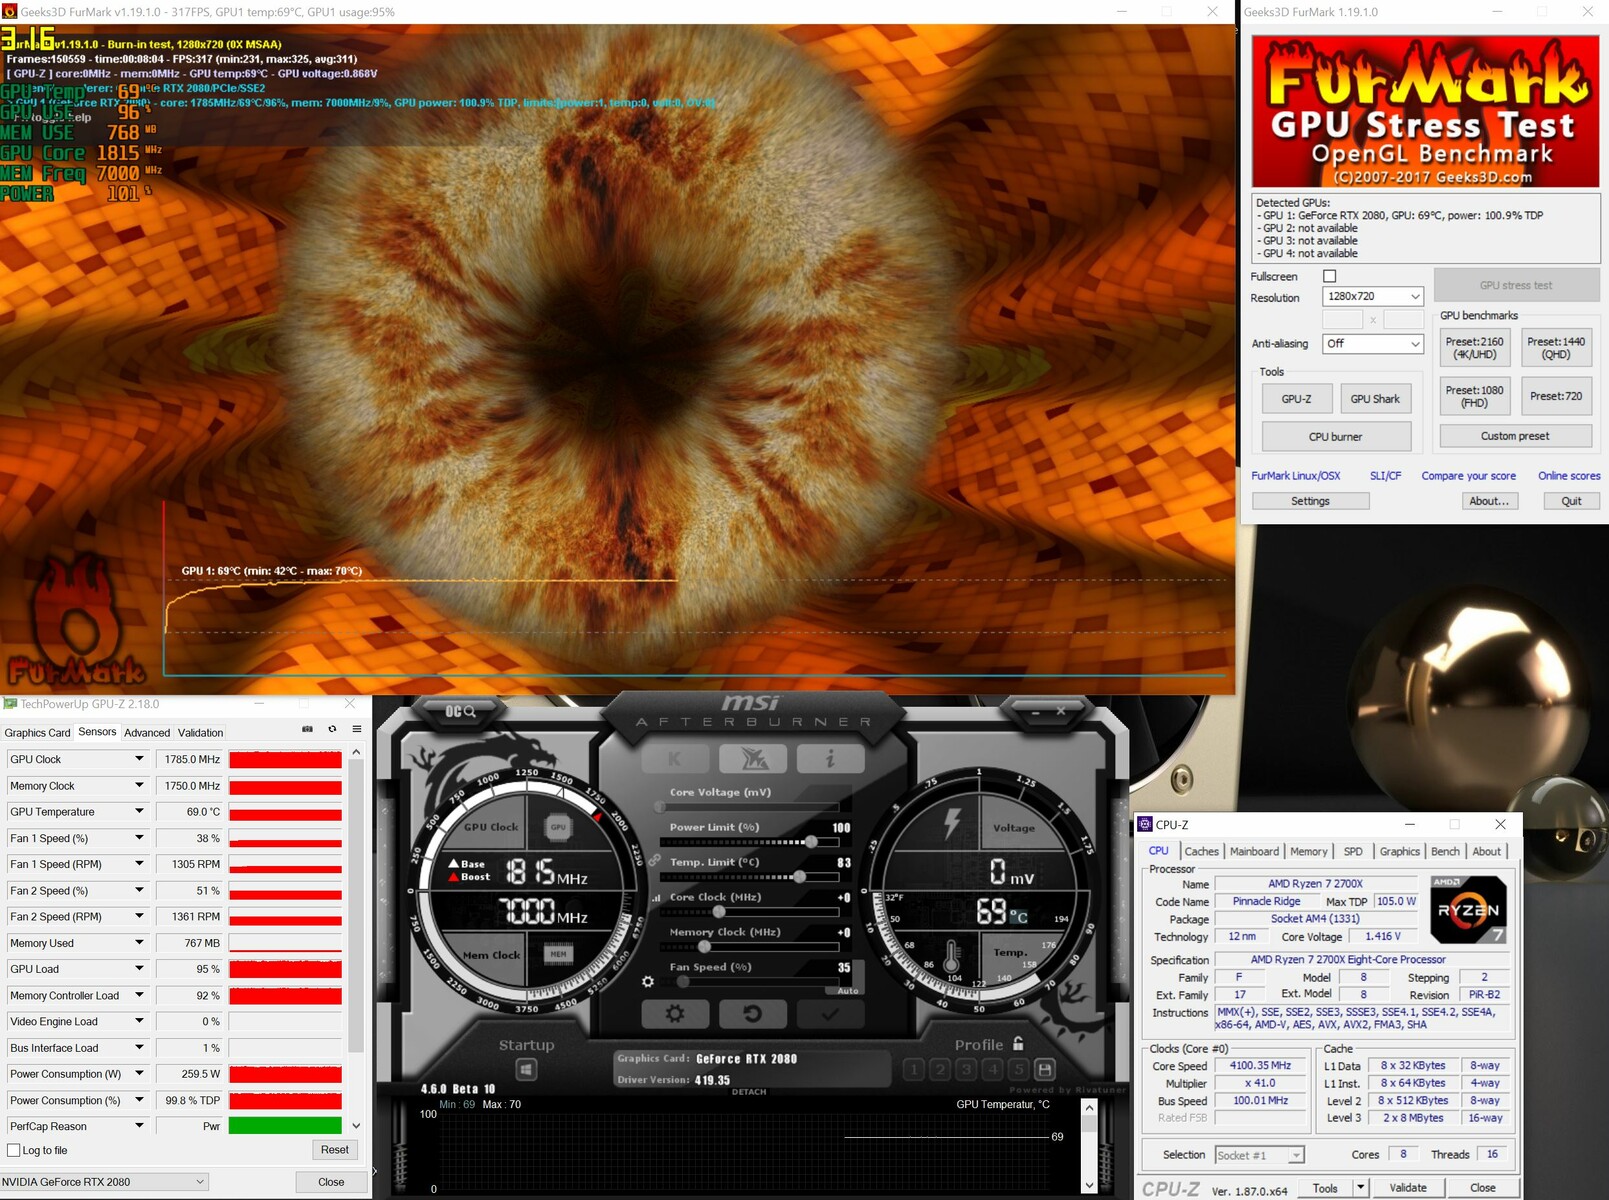
During normal use, we did not observe any thermal issues (PT 100%). The temperatures peaked at 69 °C (156.2 °F) during our stress test. When we raised the power limit to 109%, the temperatures reached 71 °C (159.8 °F). The MSI RTX 2080 Gaming X Trio is far from hitting its temperature limit. This means that the GPU should not be throttling due to overheating. All in all, the Tri-Frozr cooling system works very well, which is why the graphics card does not overheat and does not become too loud. The GPU produces only a slight hum. When compared to the MSI RTX 2070 Gaming Z 8G, the MSI RTX 2080 Gaming X Trio is actually somewhat quieter, which becomes apparent once you take a look at the fan speeds.

System power consumption at idle
System power consumption (FurMark PT 100%)
System power consumption (FurMark PT 109%)
System power consumption (while gaming - The Witcher 3 on ultra)
Stress test with FurMark (PT 100%)
Stress test with FurMark (PT 111%)
 
 
Power Consumption - 1920x1080 The Witcher 3 ultra (external Monitor)
Nvidia Titan RTX
NVIDIA Titan RTX, AMD Ryzen 7 2700X
437.4 (432min - 452max) Watt * -8%
AMD Radeon RX Vega 64
AMD Radeon RX Vega 64, AMD Ryzen 7 2700X (Idle: 74.3 W)
408 Watt * -1%
MSI RTX 2080 Gaming X Trio
NVIDIA GeForce RTX 2080 (Desktop), AMD Ryzen 7 2700X (Idle: 87.78 W)
404.7 (389min - 421max) Watt *
Nvidia GeForce GTX 1080 Ti Founders Edition
NVIDIA GeForce GTX 1080 Ti (Desktop), Intel Core i7-4790K (88 fps, Idle: 70.3 W)
358 Watt * +12%
XFX AMD Radeon RX 590 OC+ 8 GB
AMD Radeon RX 590 (Desktop), AMD Ryzen 7 2700X
346.9 (326min - 364max) Watt * +14%
MSI RTX 2070 Gaming Z 8G
NVIDIA GeForce RTX 2070 (Desktop), AMD Ryzen 7 2700X (Idle: 73.3 W)
342.9 (329min - 355max) Watt * +15%
AMD Radeon VII
AMD Radeon VII, AMD Ryzen 7 2700X (Idle: 81.39 W)
339 (306min - 359max) Watt * +16%
MSI Gaming X GeForce GTX 1080 Desktop PC
NVIDIA GeForce GTX 1080 (Desktop), Intel Core i7-4790K (Idle: 71.1 W)
331 Watt * +18%
Asus ROG Strix RTX 2070 OC
NVIDIA GeForce RTX 2070 (Desktop), AMD Ryzen 7 2700X
329 Watt * +19%
Nvidia GeForce GTX 1080 Founders Edition
NVIDIA GeForce GTX 1080 (Desktop), Intel Core i7-4790K (Idle: 68.3 W)
294 Watt * +27%
MSI RTX 2060 Gaming Z 6G
NVIDIA GeForce RTX 2060 (Desktop), AMD Ryzen 7 2700X (Idle: 74.66 W)
288.8 (284min - 299max) Watt * +29%
Nvidia GeForce GTX 1070 Founders Edition
NVIDIA GeForce GTX 1070 (Desktop), Intel Core i7-4790K (Idle: 68 W)
243 Watt * +40%

* ... smaller is better

Overclocking - not a lot of potential

Unlike the MSI RTX 2070 Gaming Z 8G, the MSI RTX 2080 Gaming X Trio has much less overclocking potential. We were only able to increase the core clock by 90 MHz and the memory speed by 900 MHz. The small model (MSI RTX 2070 Gaming Z 8G) could sustain much higher overclocks. A lot of this can be explained by the fact that the MSI RTX 2080 Gaming X Trio uses VRAM from Micron, whereas the MSI RTX 2070 Gaming Z 8G utilizes VRAM from Samsung, which offers somewhat more room for overclocking. However, there are no guarantees when it comes to overclocking because you never know what kind of chip you are going to get.

The great cooling solution gives us a hint that there is still quite a bit more room for overclocking. That being said, the MSI RTX 2080 Gaming X Trio comes with a factory overclock. This is why it has an advantage over the reference model. The power target of the MSI RTX 2080 Gaming X Trio can be increased by 9%, which raises the maximum TDP to 283 watts.

We can see the results of manual overclocking reflected in the benchmarks. However, there is no significant boost in performance to speak about. Anyway, we do not recommend overclocking the graphics card, because it comes with a factory overclock as it is. Moreover, it is a very powerful GPU from the RTX 2080 series.

3DMark 11 (GPU + 90 MHz, VRAM + 900 MHz)
3DMark Fire Strike (GPU + 90 MHz, VRAM + 900 MHz)

Pros

+ great performance across the board (suitable for 4K gaming)
+ 8 GB of GDDR6 VRAM
+ good cooling solution
+ quiet under load
+ good build-quality
+ RGB lighting

Cons

- high TDP (higher than RTX 2080 Ti)
- high price

Verdict - future-proof, but expensive

MSI RTX 2080 Gaming X Trio - provided courtesy of: MSI Taiwan

Currently, the MSI RTX 2080 Gaming X Trio retails for 840 Euros ($946). If you spend some time searching on the Internet, you can find cheaper RTX 2080 GPUs. However, these graphics cards do not offer the same level of performance as the MSI RTX 2080 Gaming X Trio. MSI’s video card comes with an increased TDP (260 watts), which is why the GPU can achieve a higher boost clock of up to 1860 MHz. When it comes to VRAM, there is some room for debate, because both the MSI RTX 2080 Gaming X Trio and the MSI RTX 2070 Gaming Z 8G have the same 8 GB of GDDR6 video memory and the same effective memory frequency of 14 GHz. Having said that, we did not encounter any issues related to the amount and speed of video memory during our review.

The MSI RTX 2080 Gaming X Trio features the Tri-Frozr cooling system, which remains quiet even under load. All in all, there are three axial fans (2x 100 mm, 1x 90 mm).

When compared directly to the Asus ROG Strix RTX 2080 OC, both GPUs are on the same level. There is no clear winner in this battle of the two RTX 2080 graphics cards.

The MSI RTX 2080 Gaming X Trio is powerful enough for running modern games in 4K. The increased TDP and the good cooling solution earn some additional Brownie points for the GPU and contribute to a boost in performance.

So who should get the MSI RTX 2080 Gaming X Trio? This question is not easy to answer. This GPU is primarily intended for 4K gaming and those who currently game in 1080p or 1440p can do just fine without the MSI RTX 2080 Gaming X Trio. For such gamers something like the MSI RTX 2070 Gaming Z 8G or the MSI RTX 2060 Gaming Z 6G should suffice.

static version load dynamic
Loading comments
Comment on this article
Please share our article, every link counts!
> Expert Reviews and News on Laptops, Smartphones and Tech Innovations > Reviews > MSI RTX 2080 Gaming X Trio Desktop Graphics Card Review
Sebastian Bade, 2019-04-10 (Update: 2019-06-27)