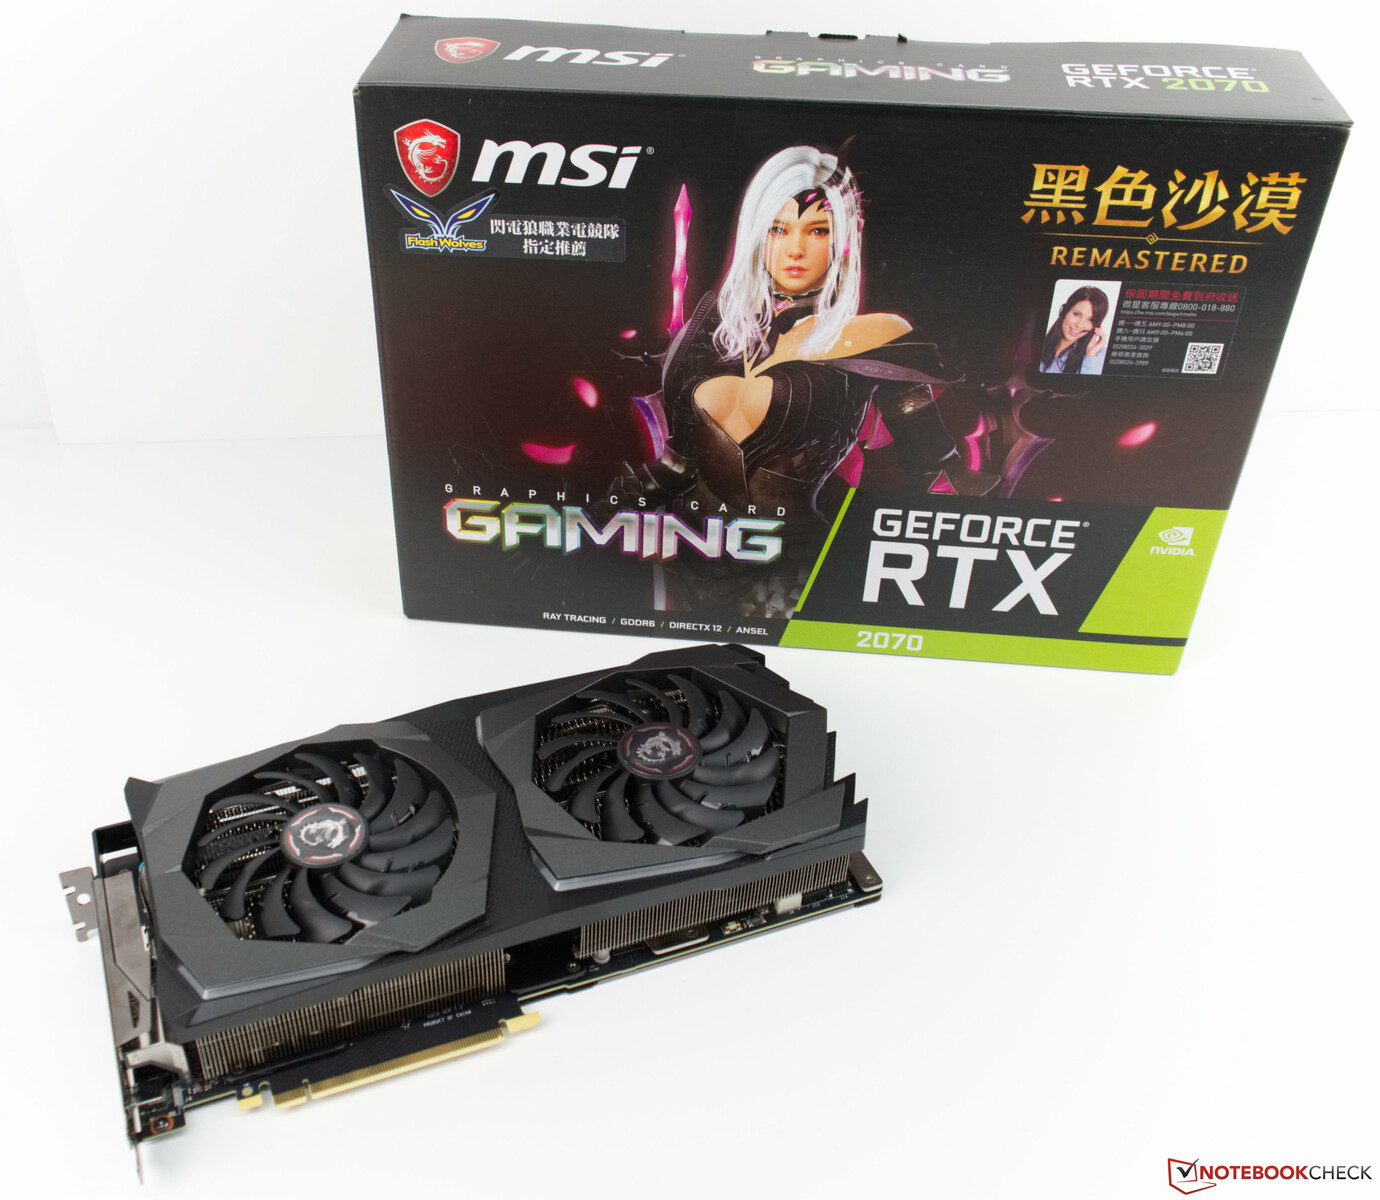
MSI RTX 2070 Gaming Z 8G Desktop GPU review
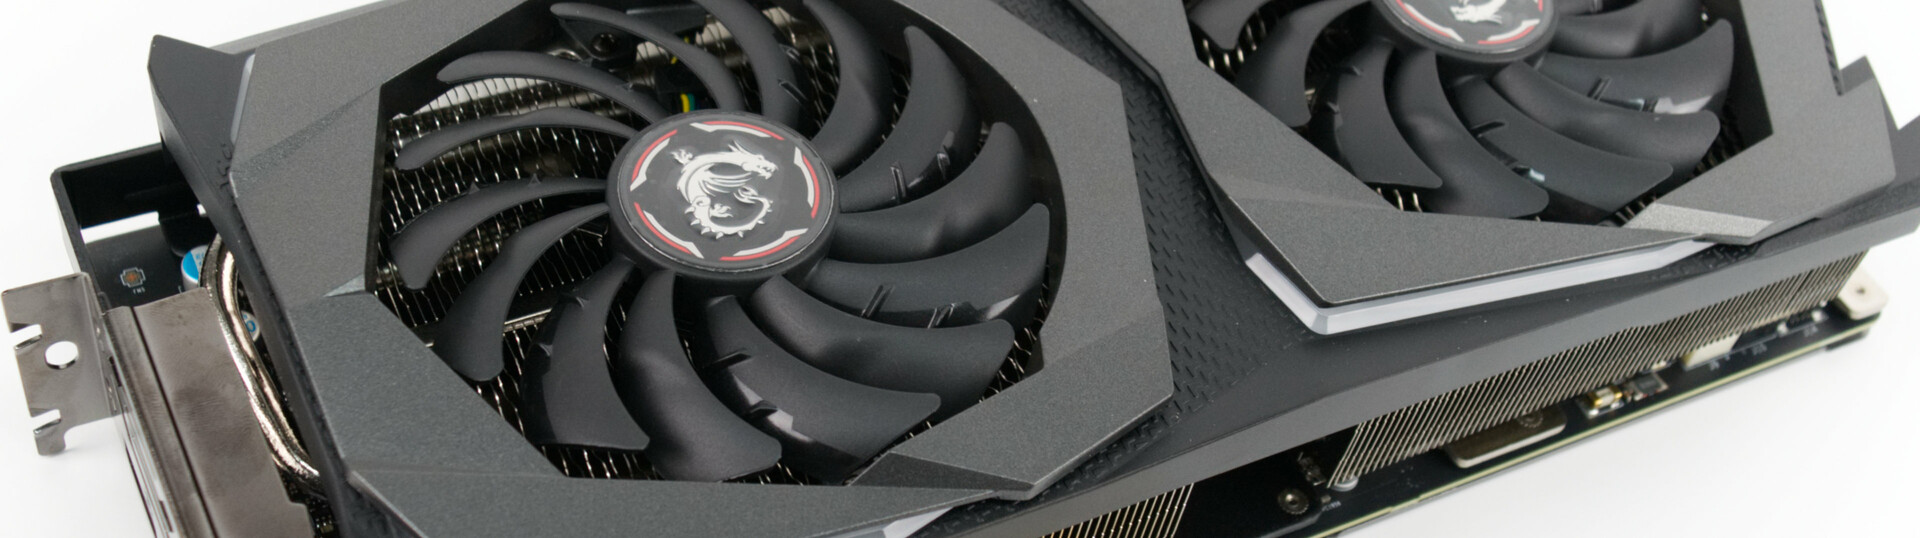
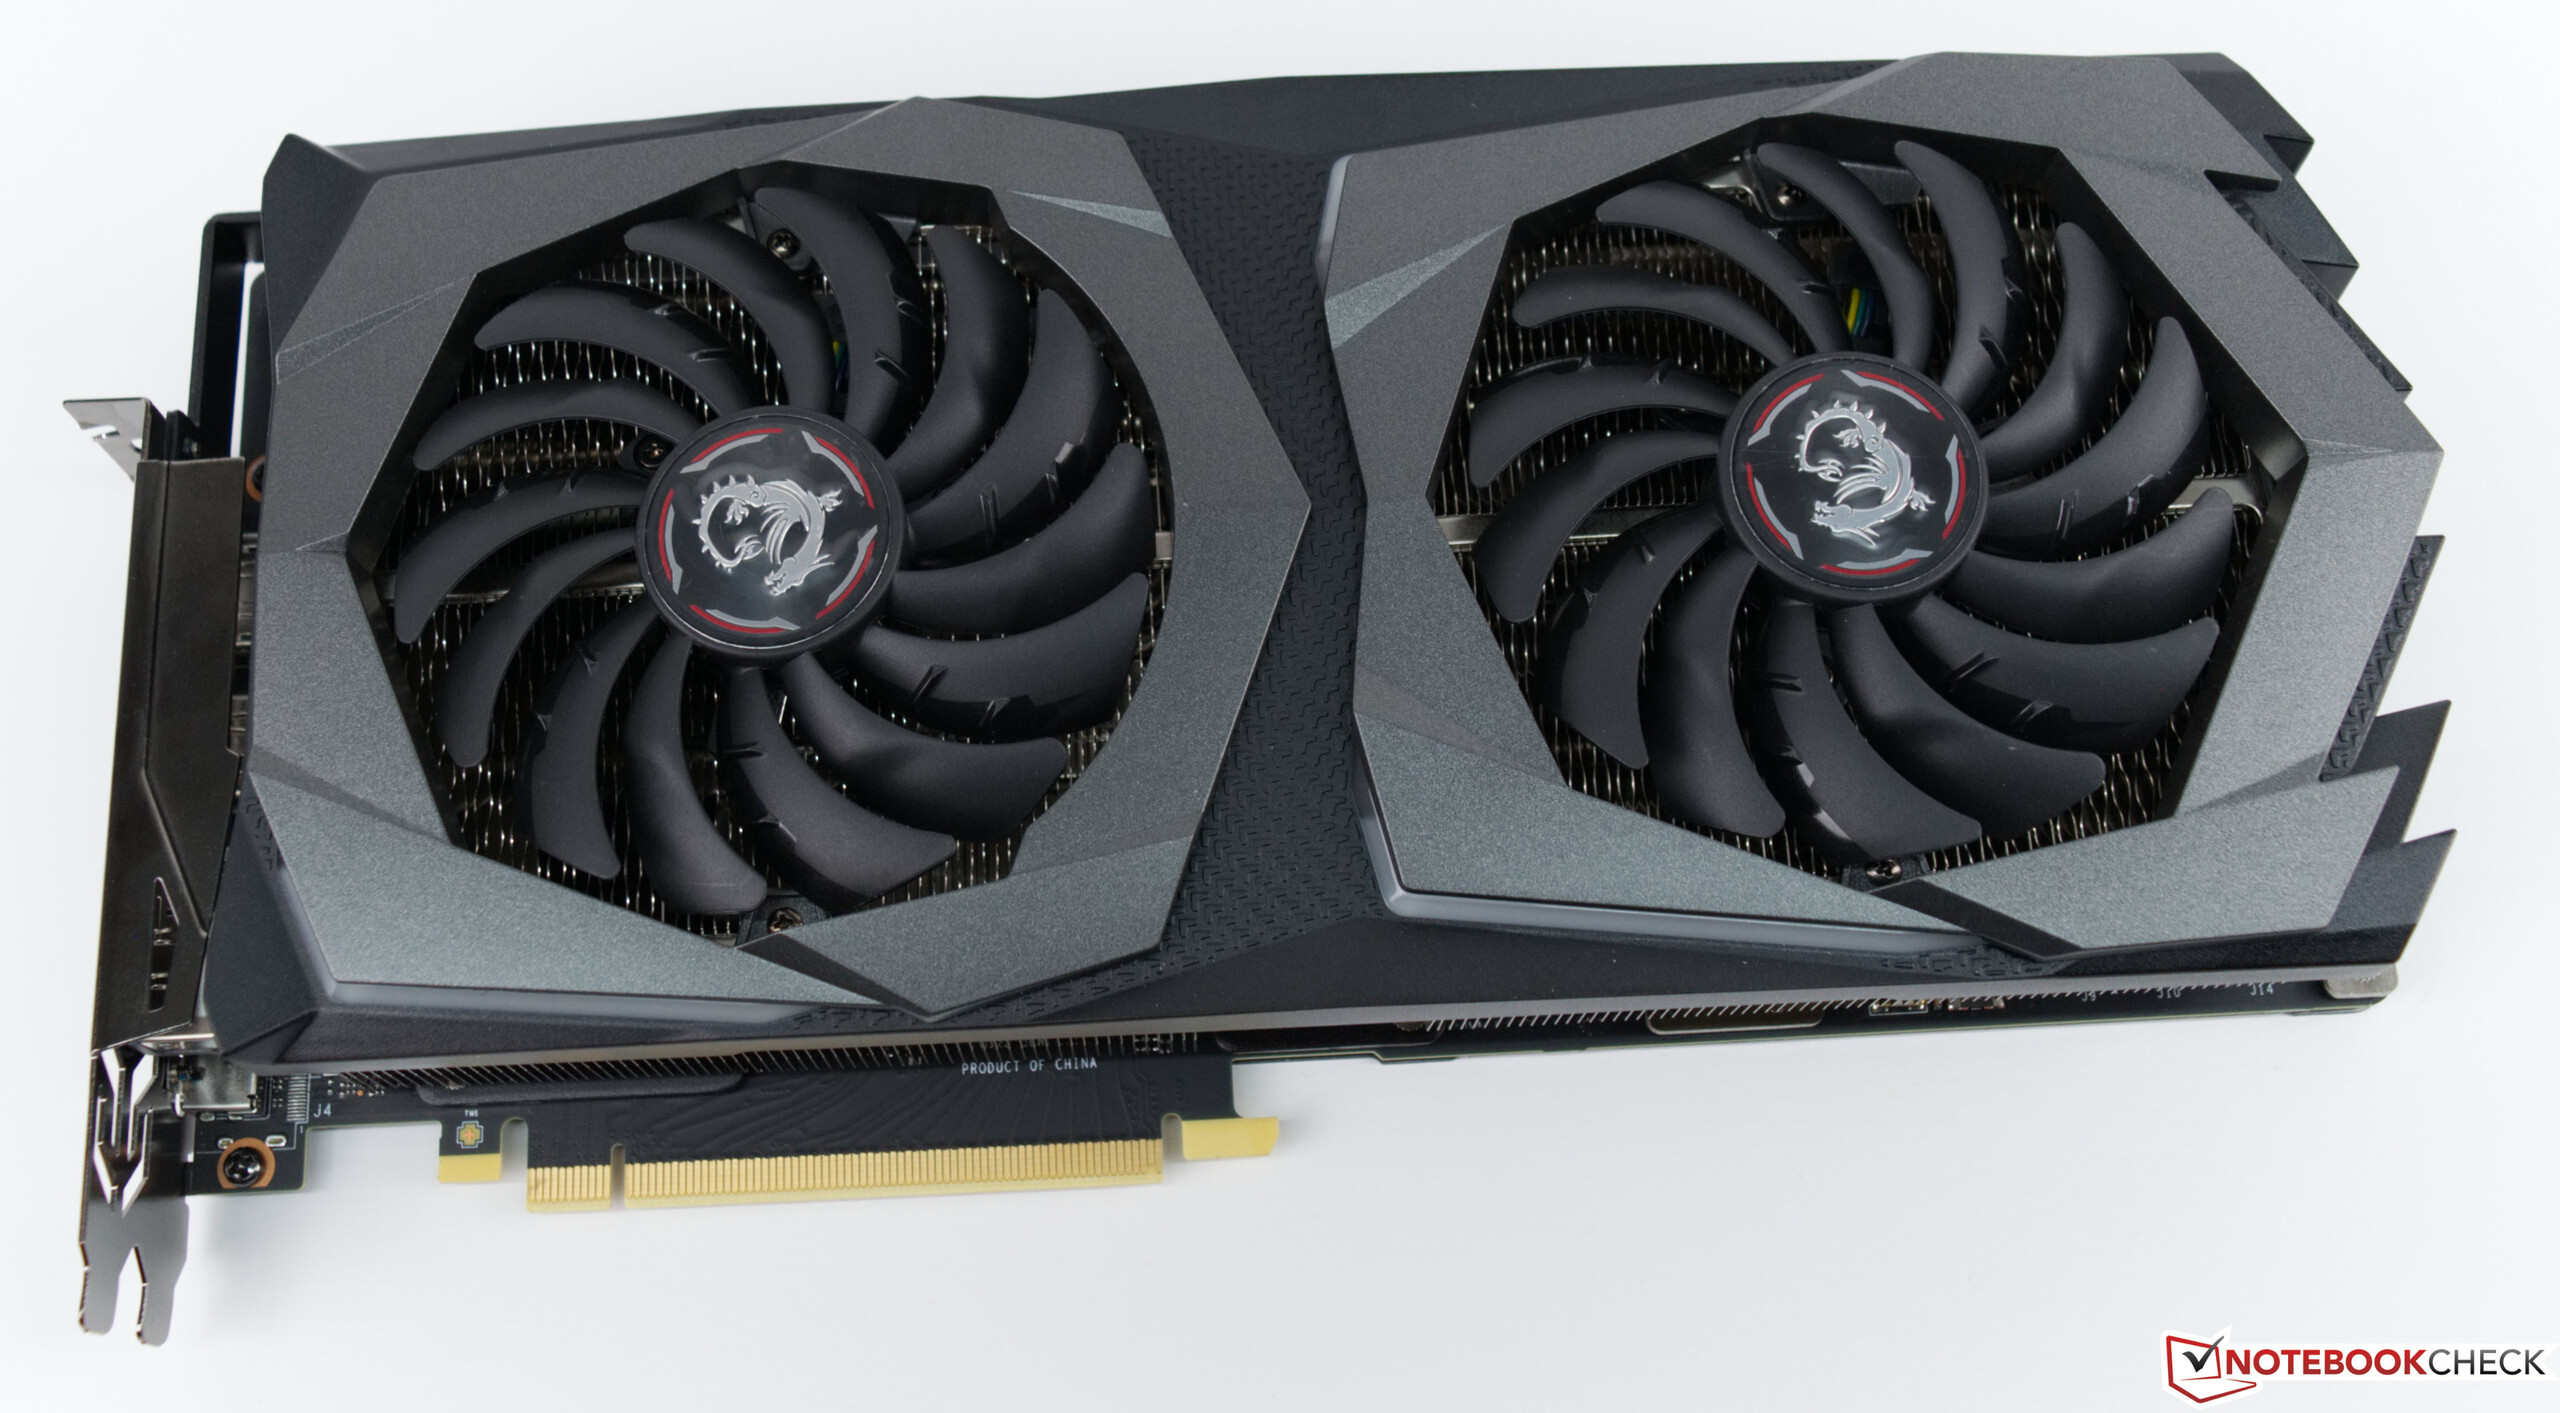
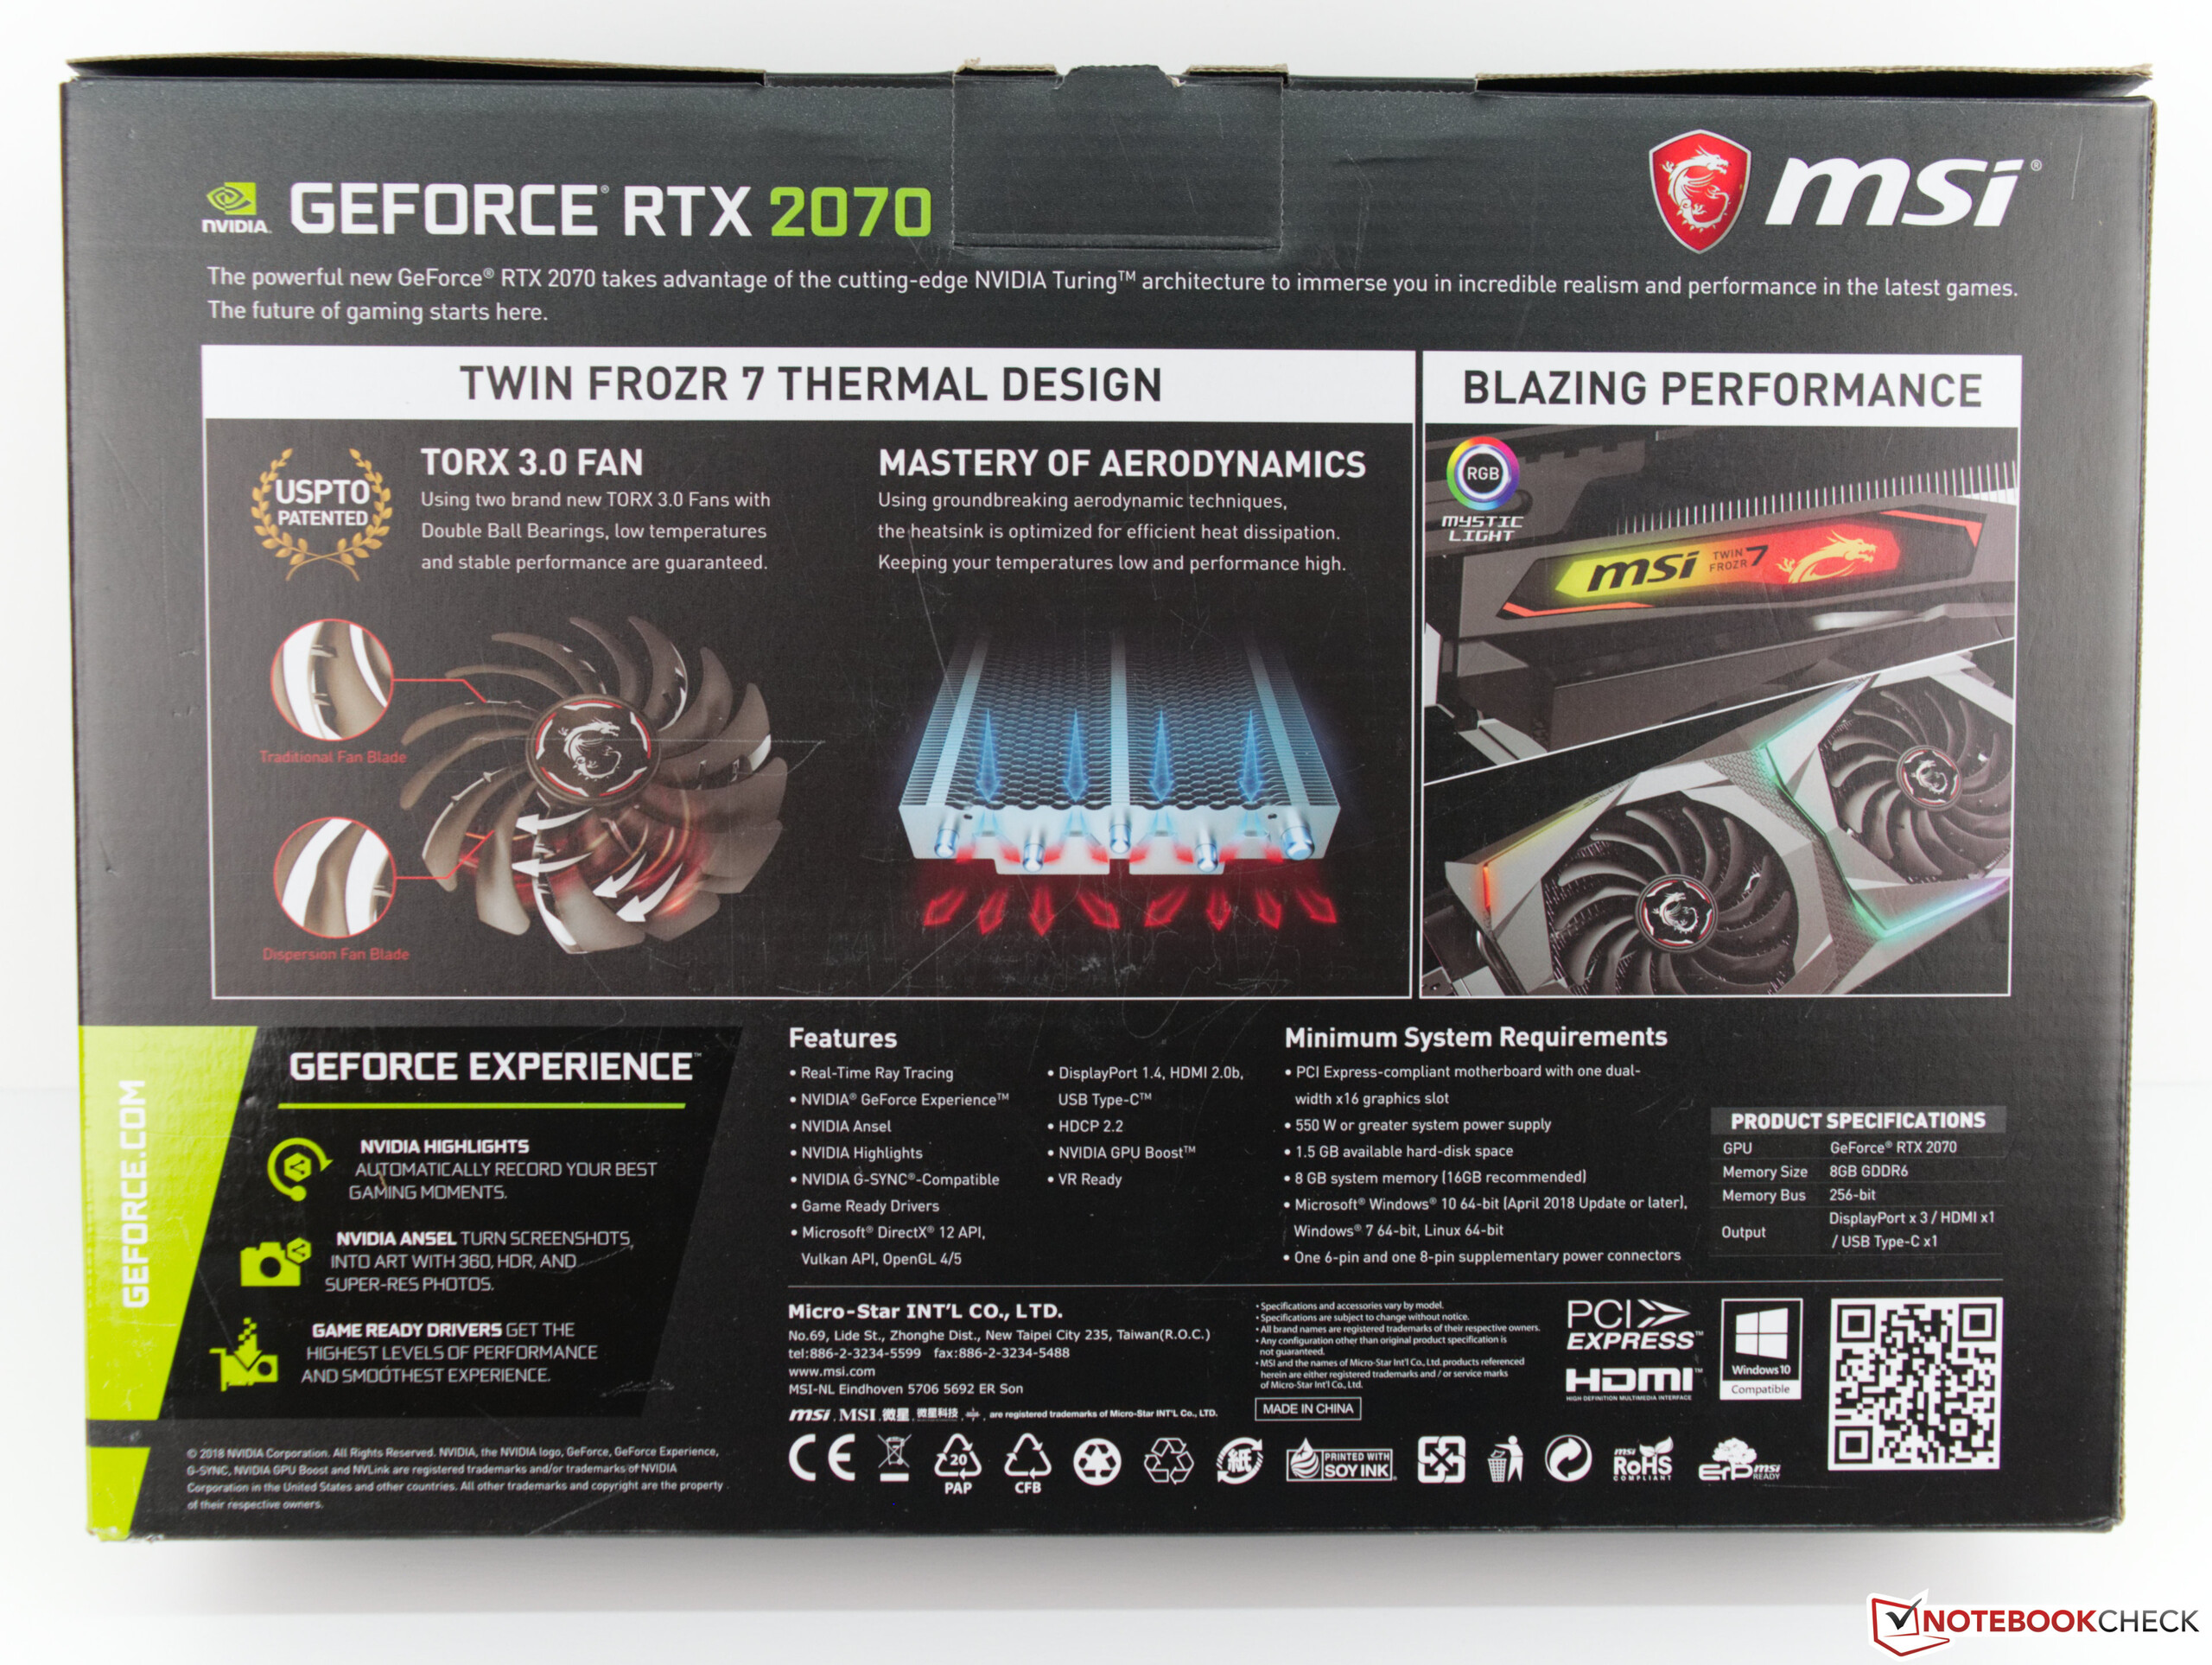
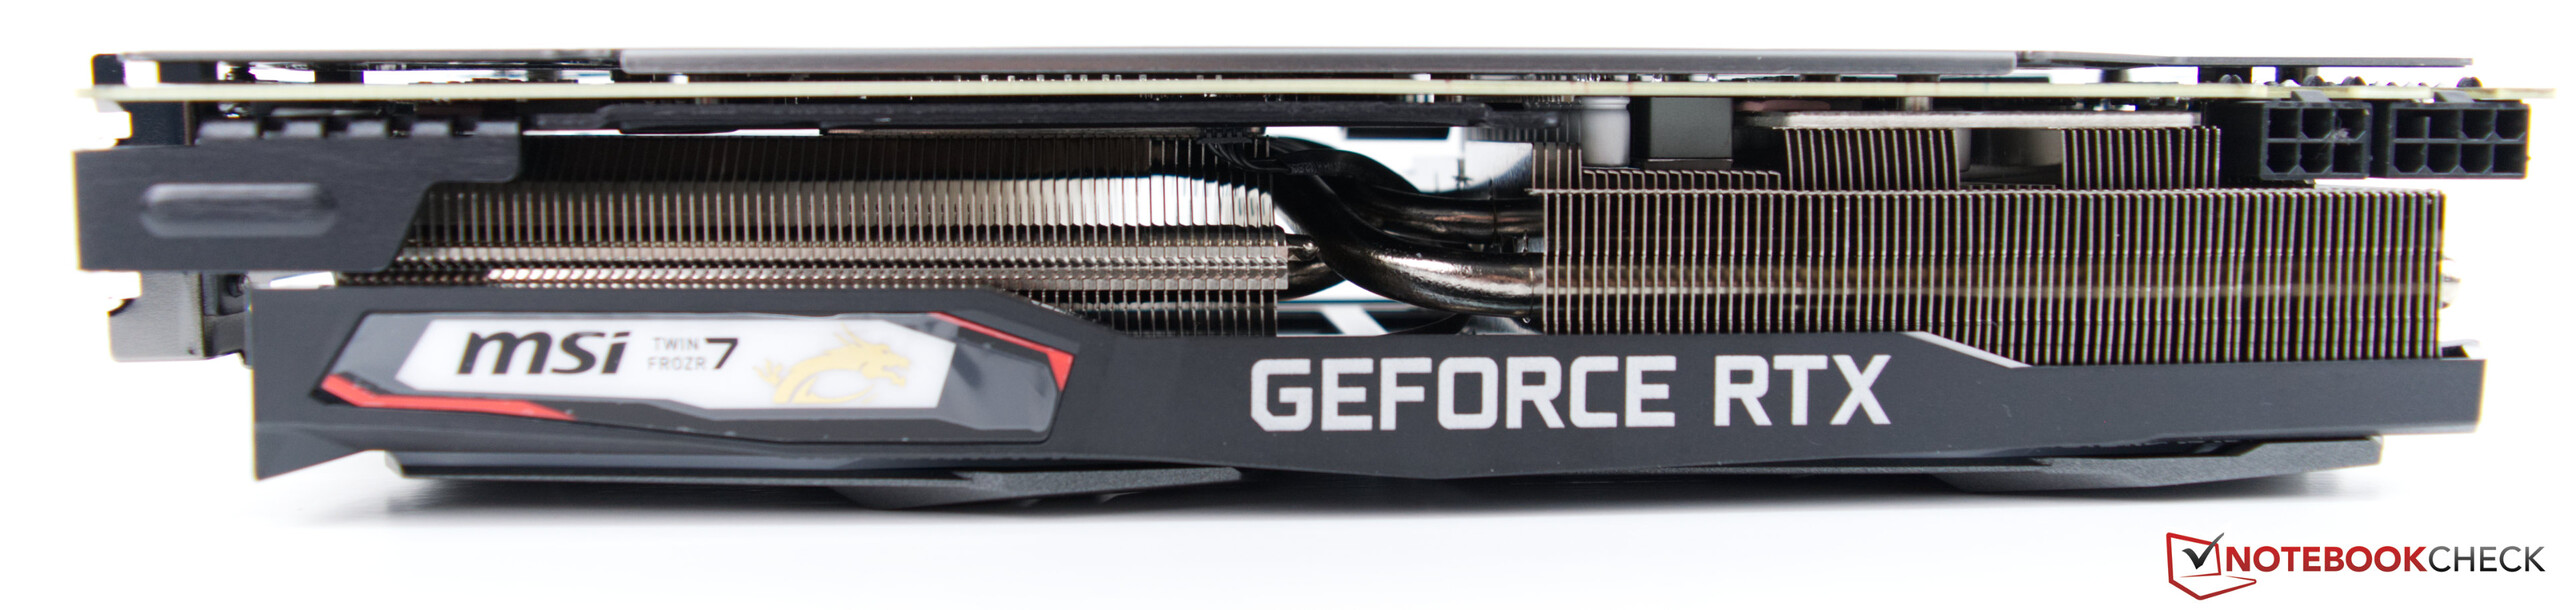
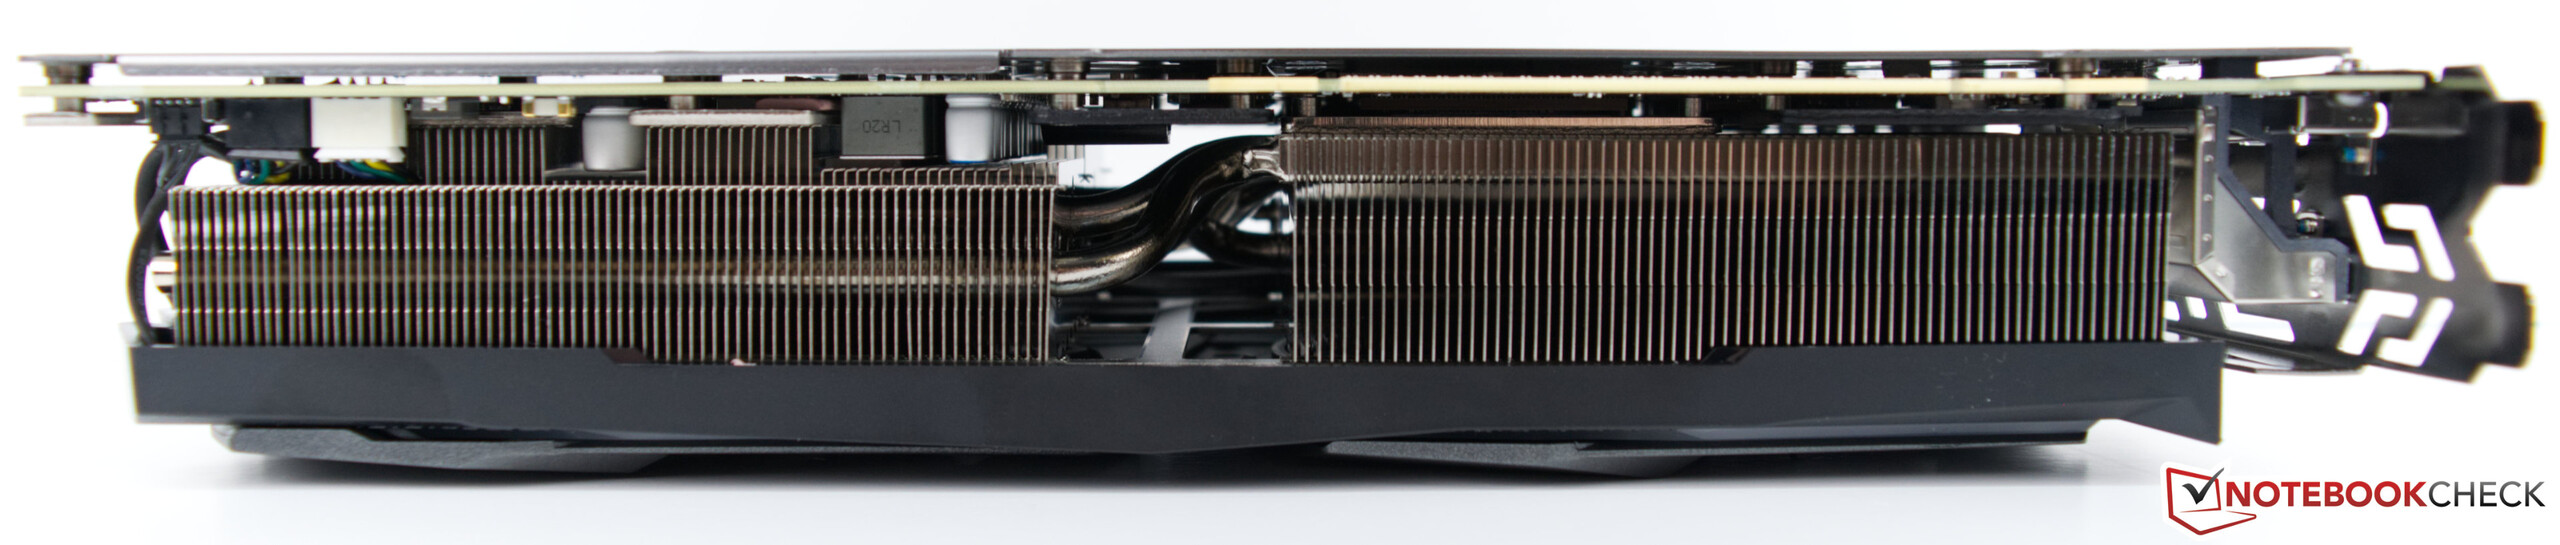
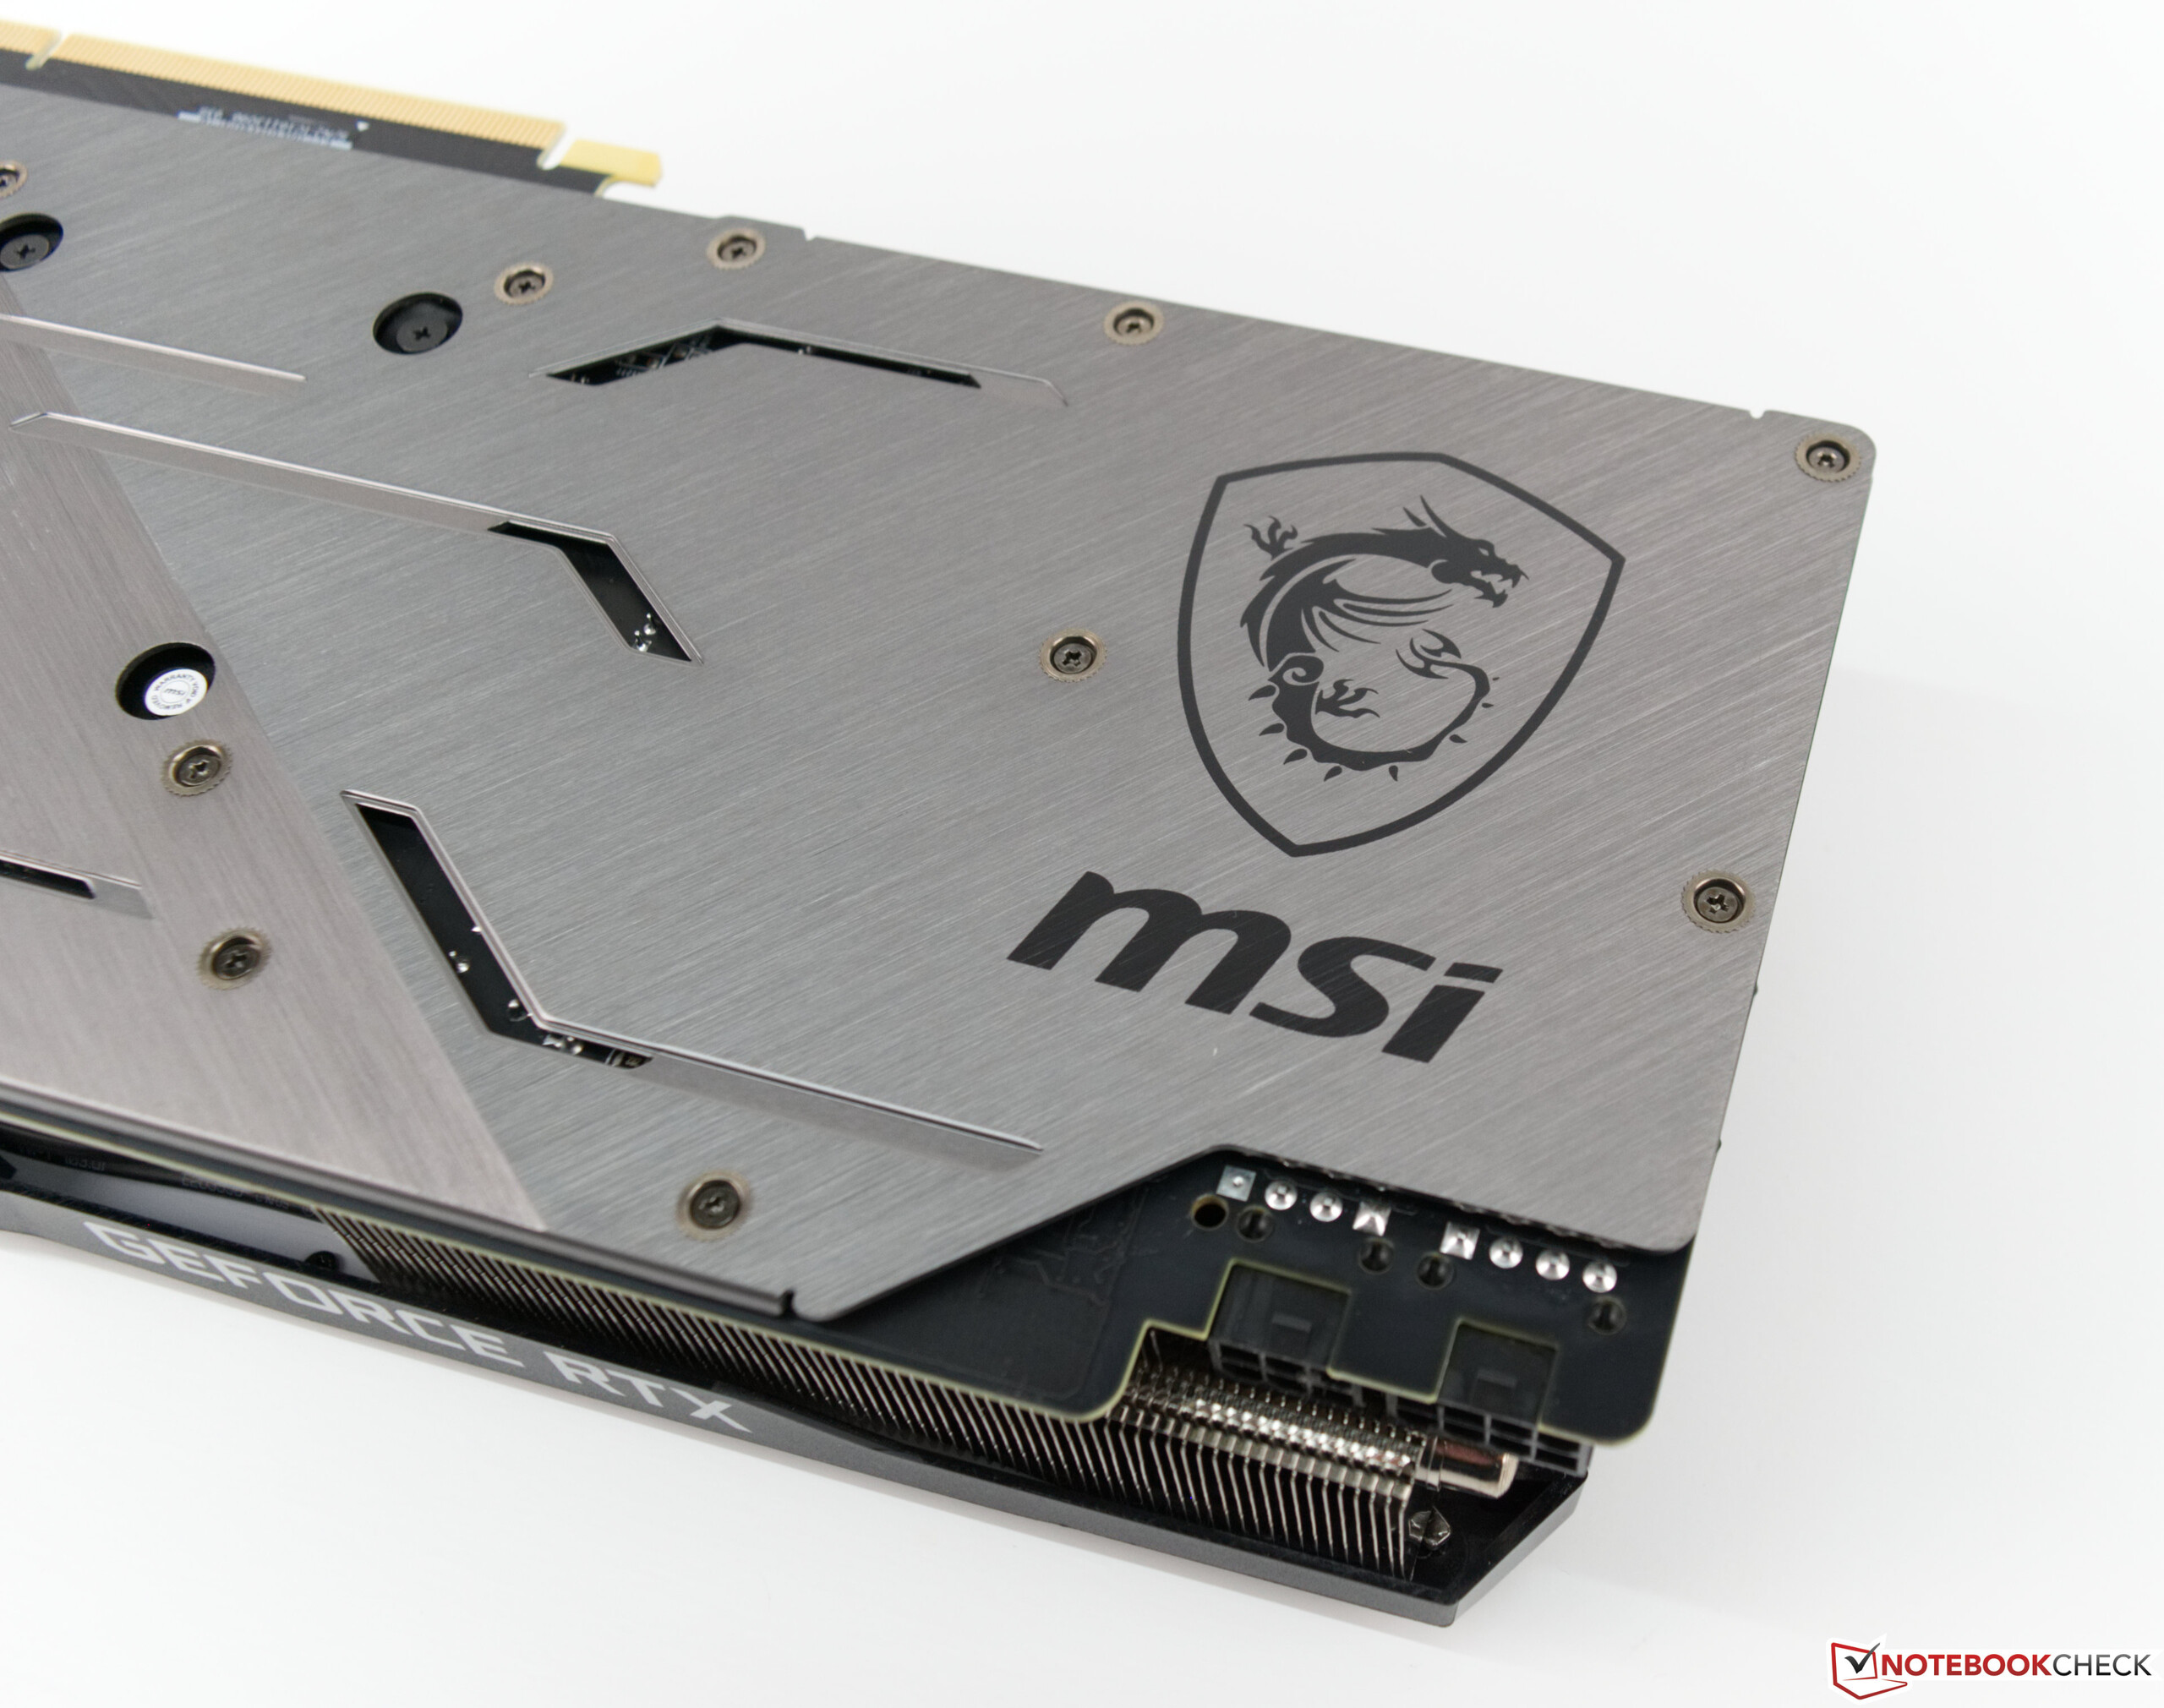
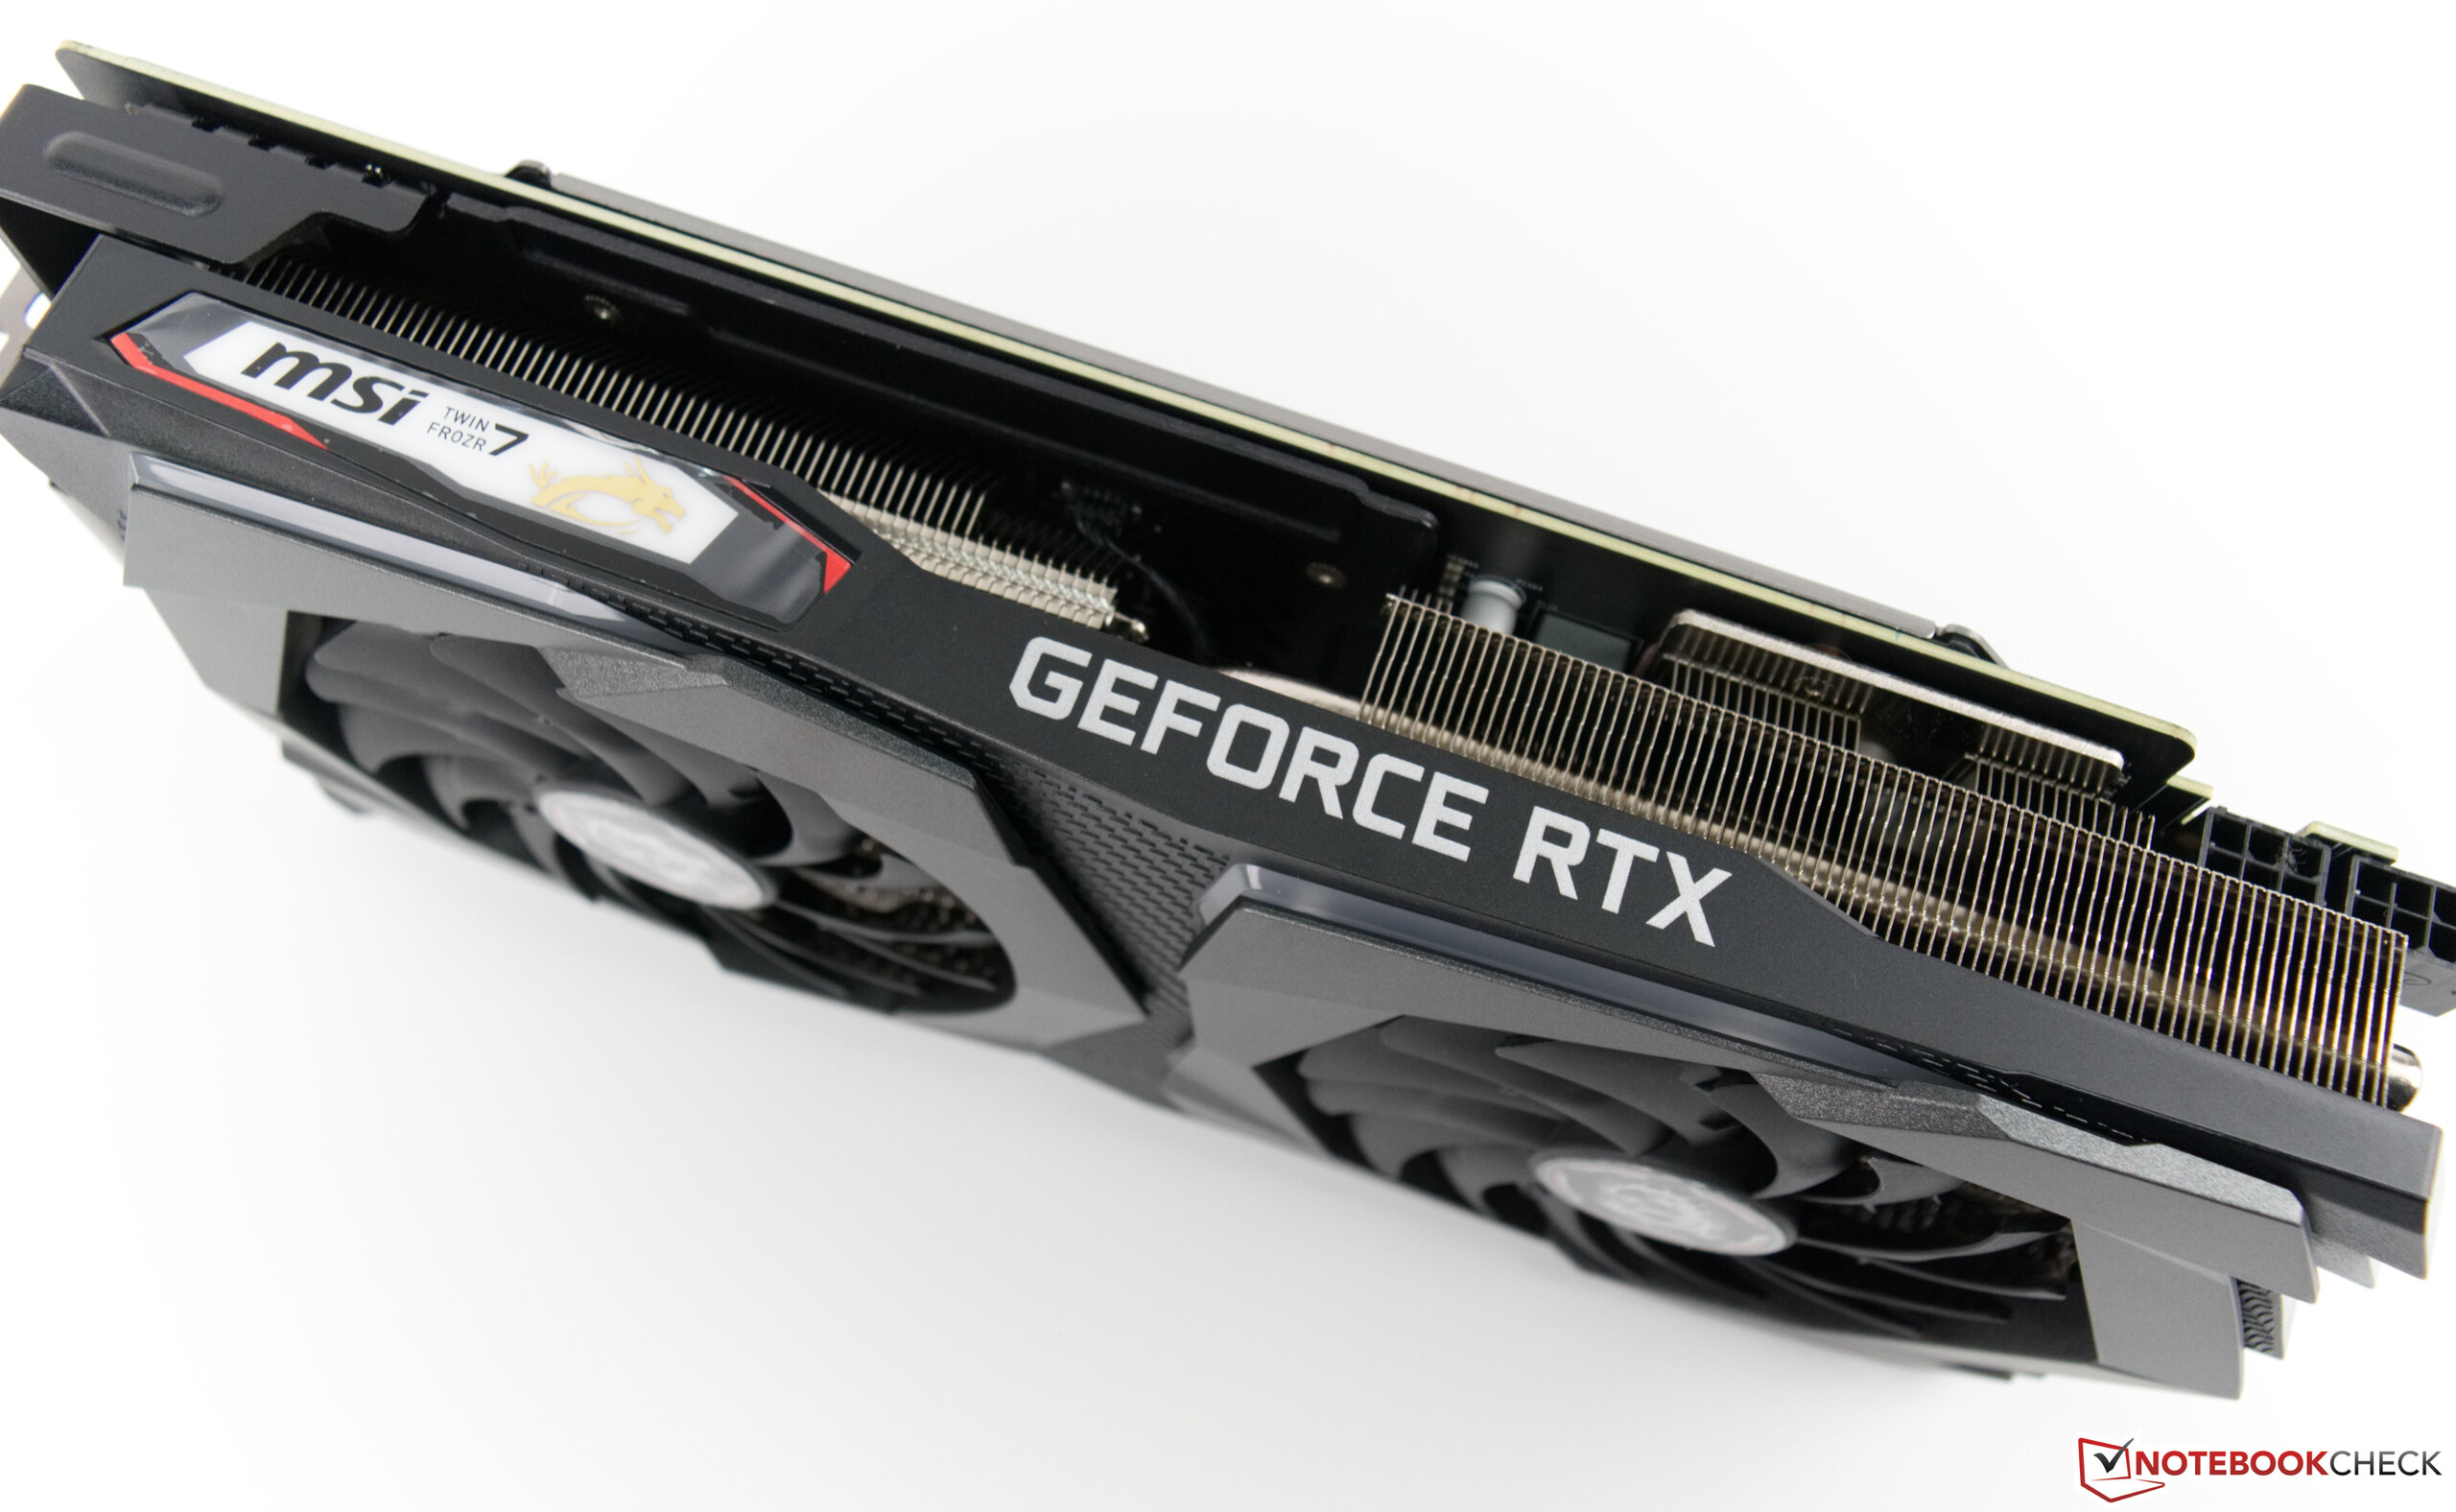
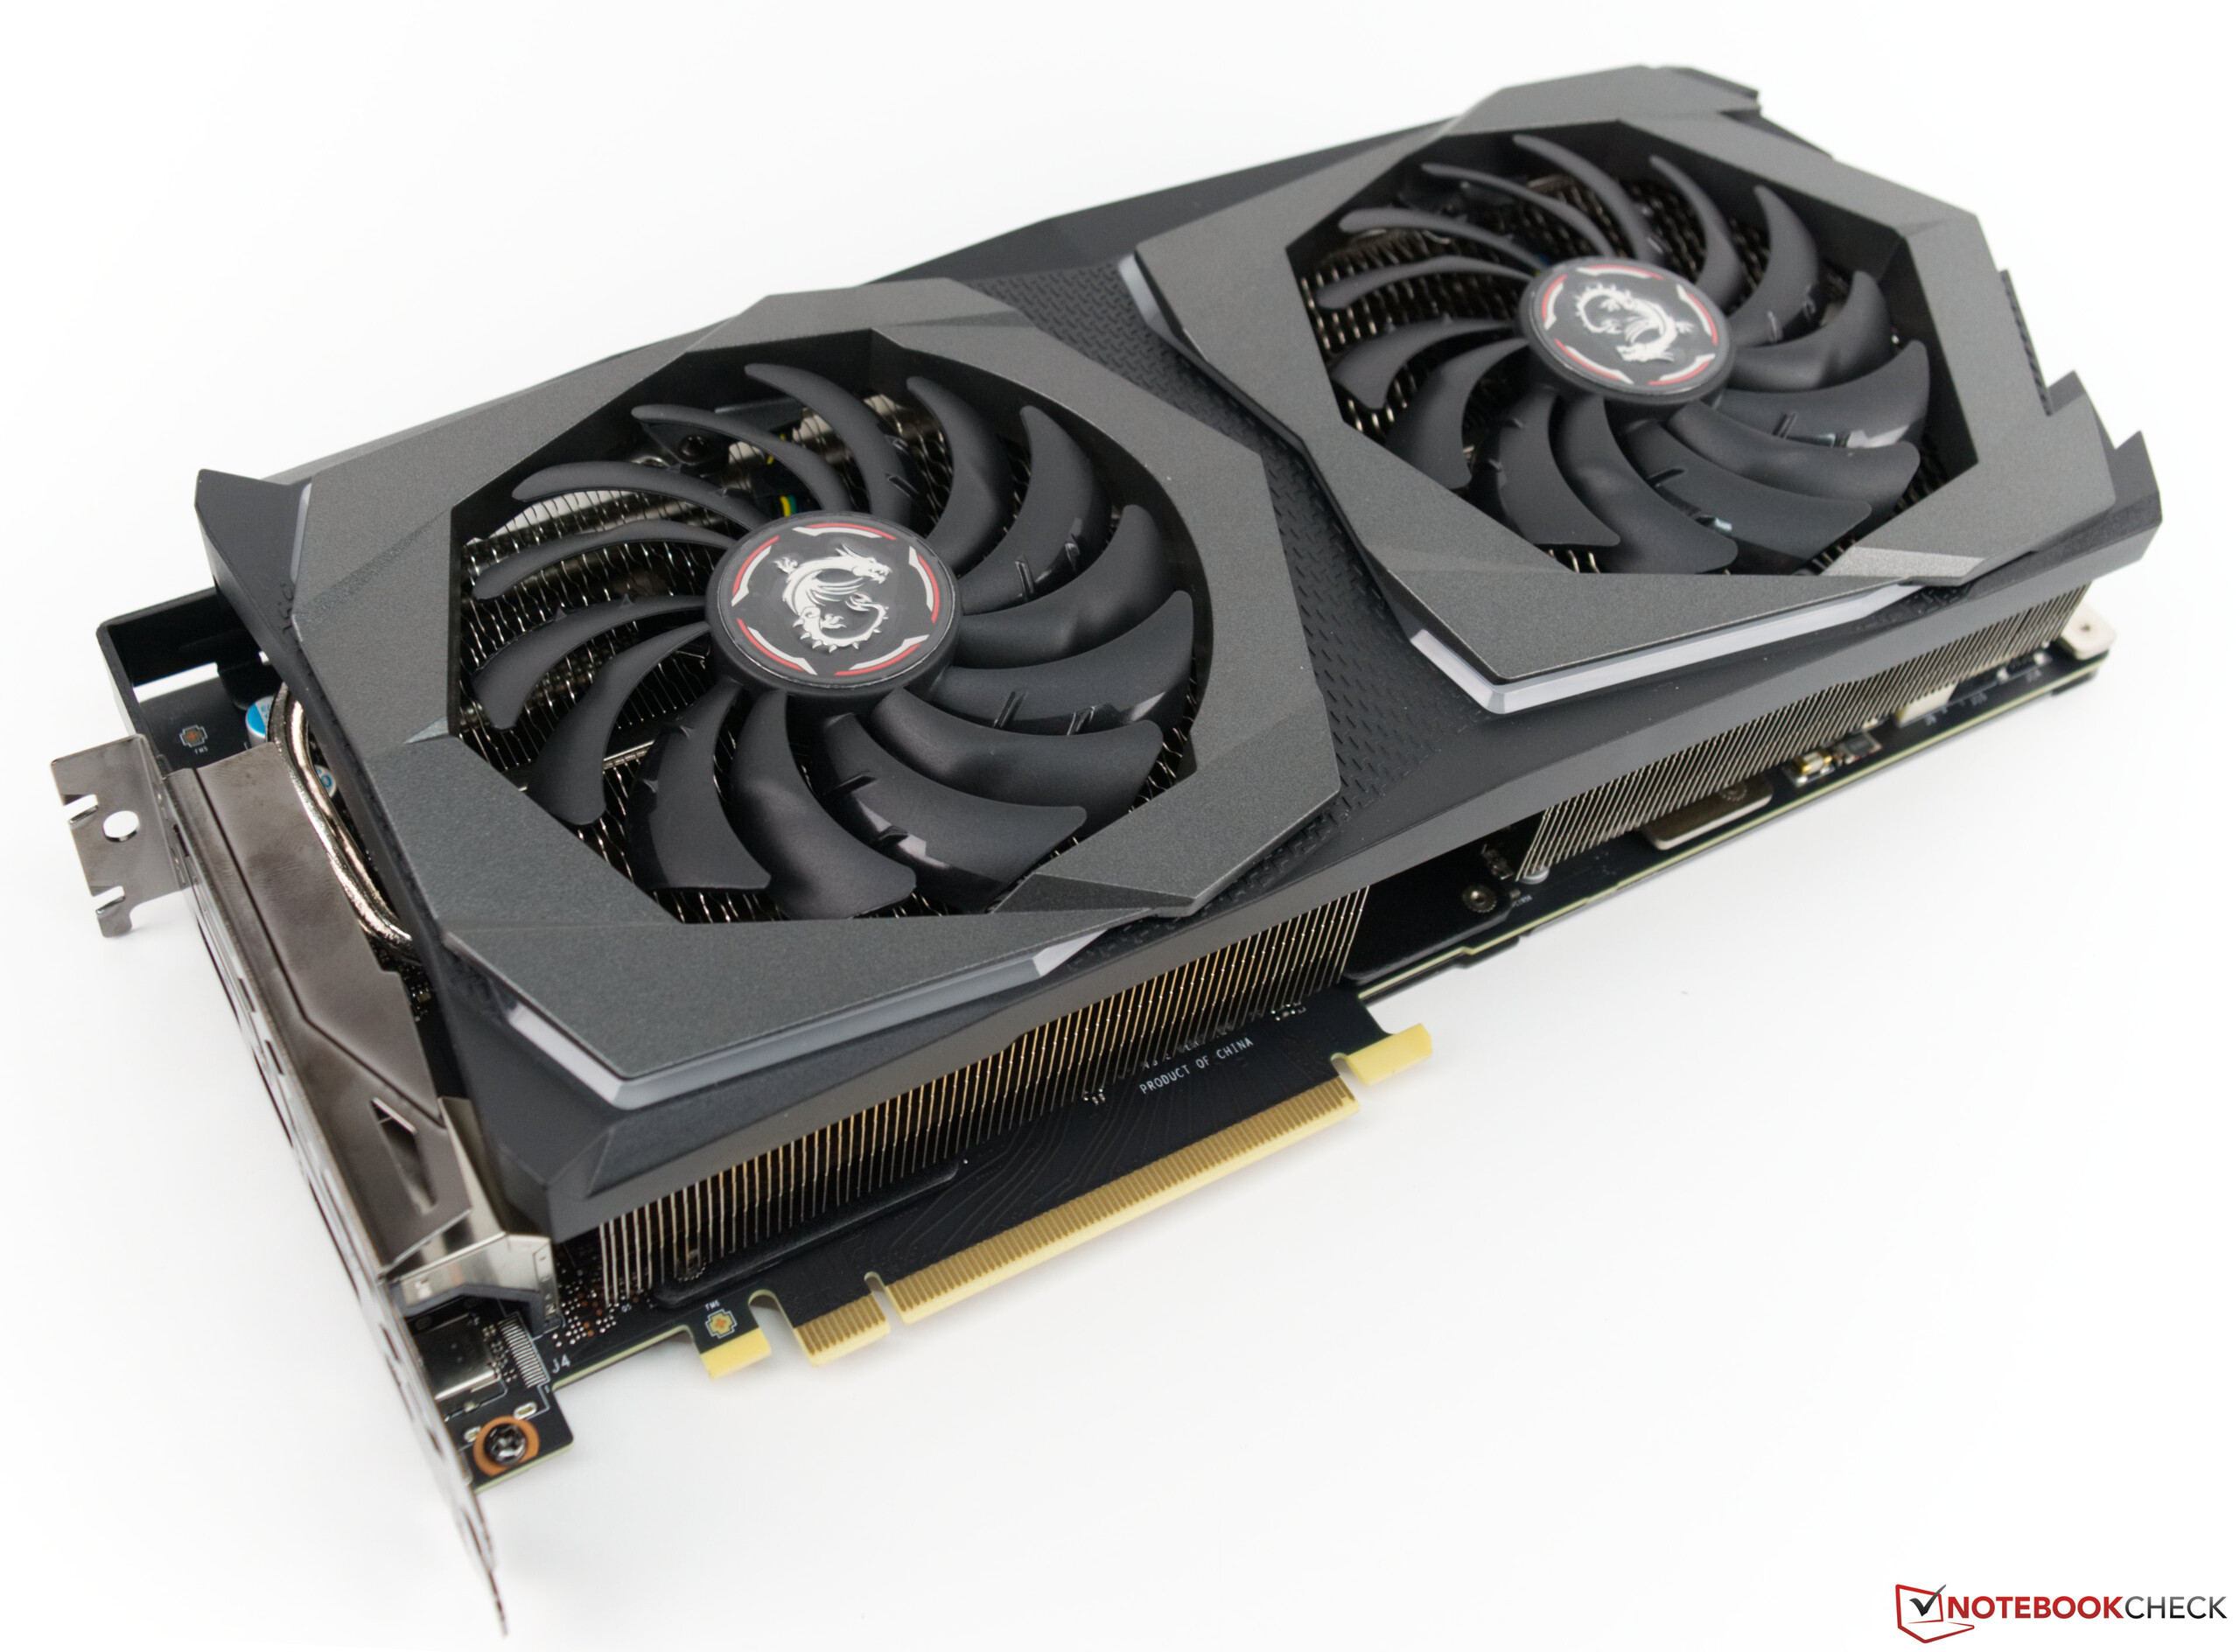
With the MSI RTX 2070 Gaming Z 8G we have the opportunity to check out another GPU from the new Turing generation from Nvidia. As with the Asus ROG RTX Strix 2070 OC, the MSI card is not based on the reference PCB design from Nvidia, rather they have developed their own layout and additionally added their own cooler to cater for the higher demands placed on it. This is because the MSI RTX 2070 Gaming Z 8G comes with a significantly higher TDP rating. The Twin-Frozr cooler contains two axial fans and, due to its bulk, takes up 2.5 slots.
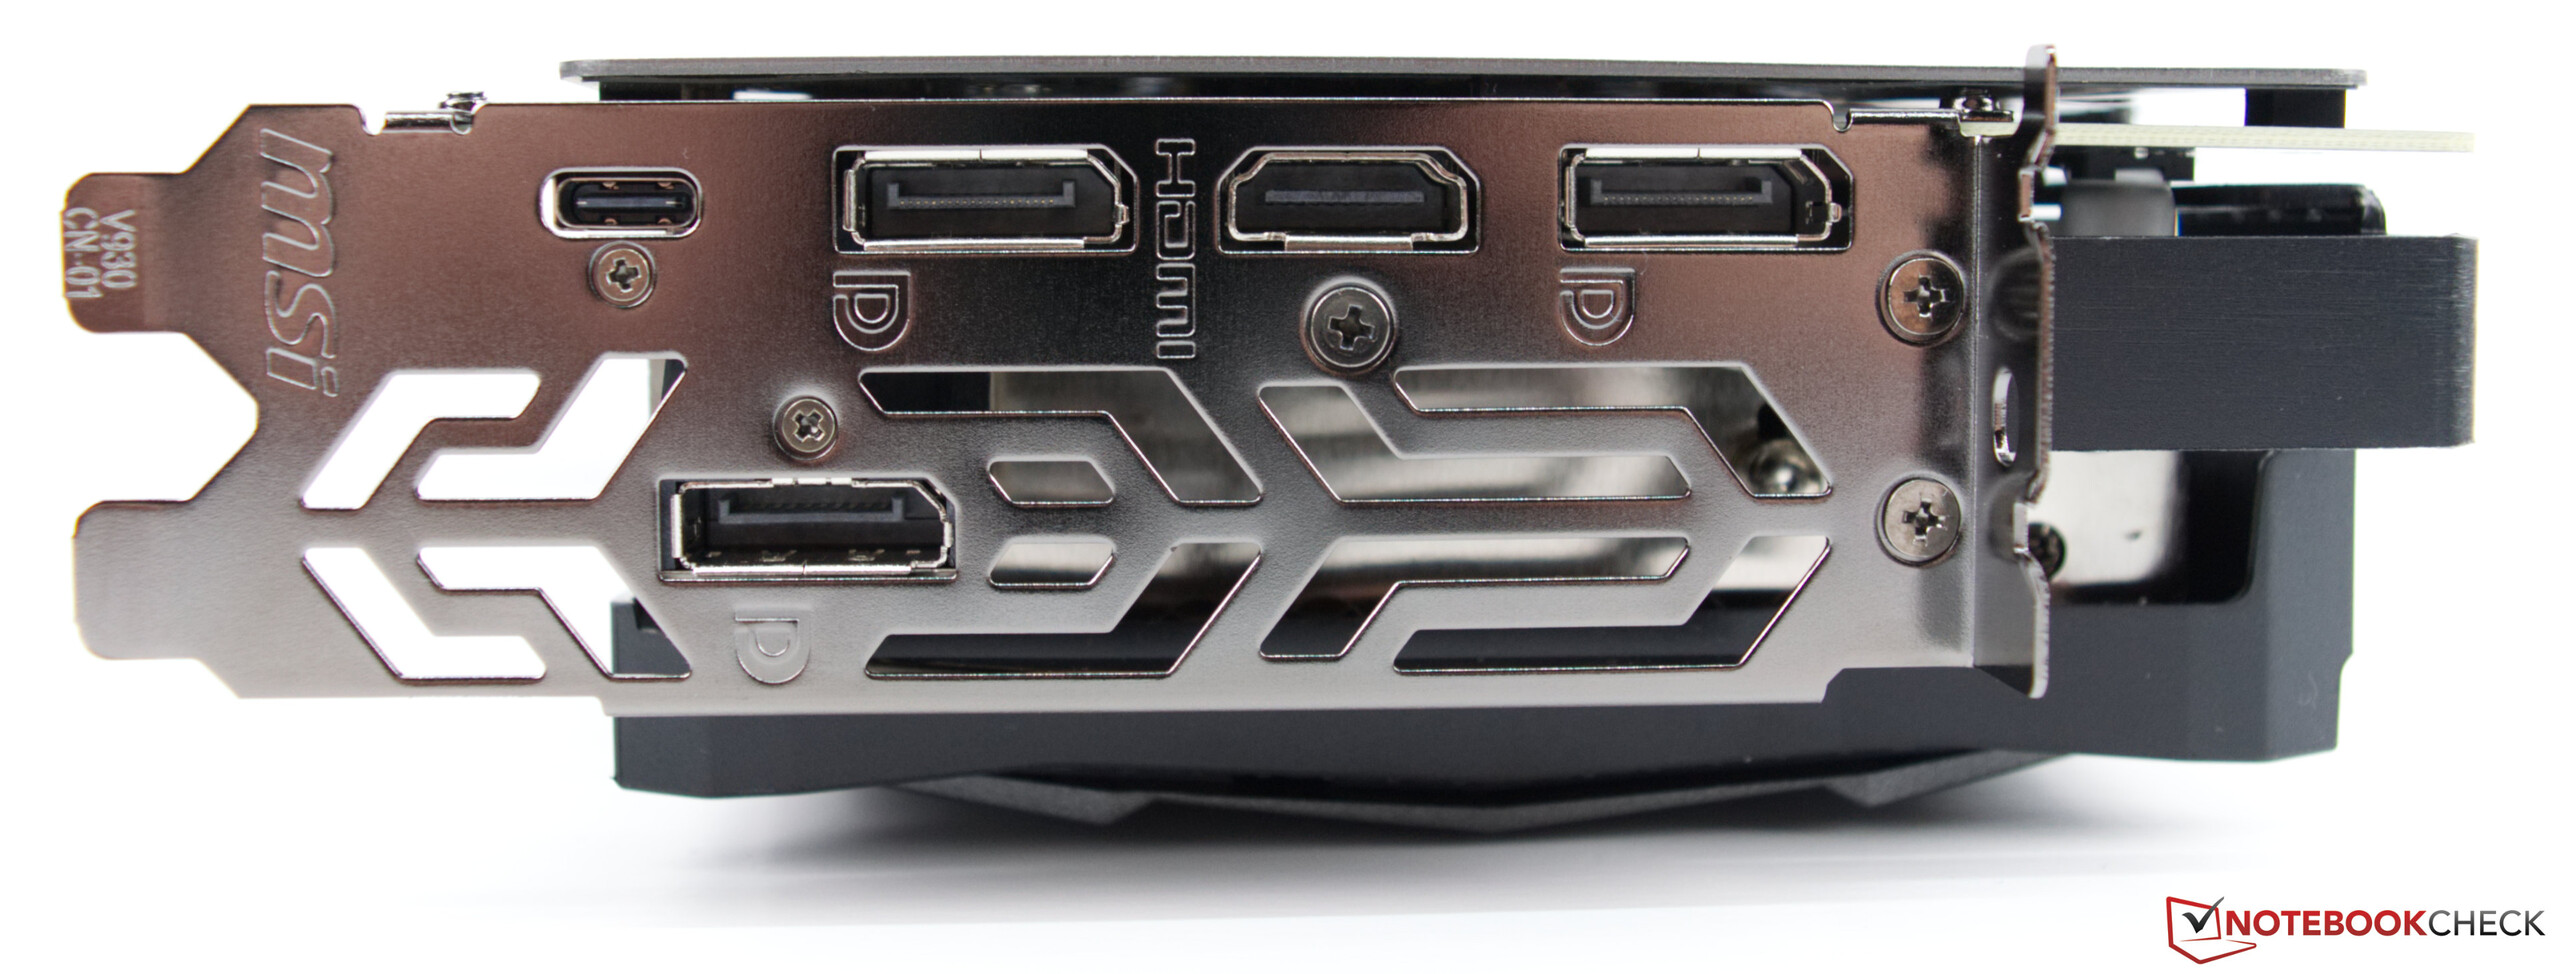
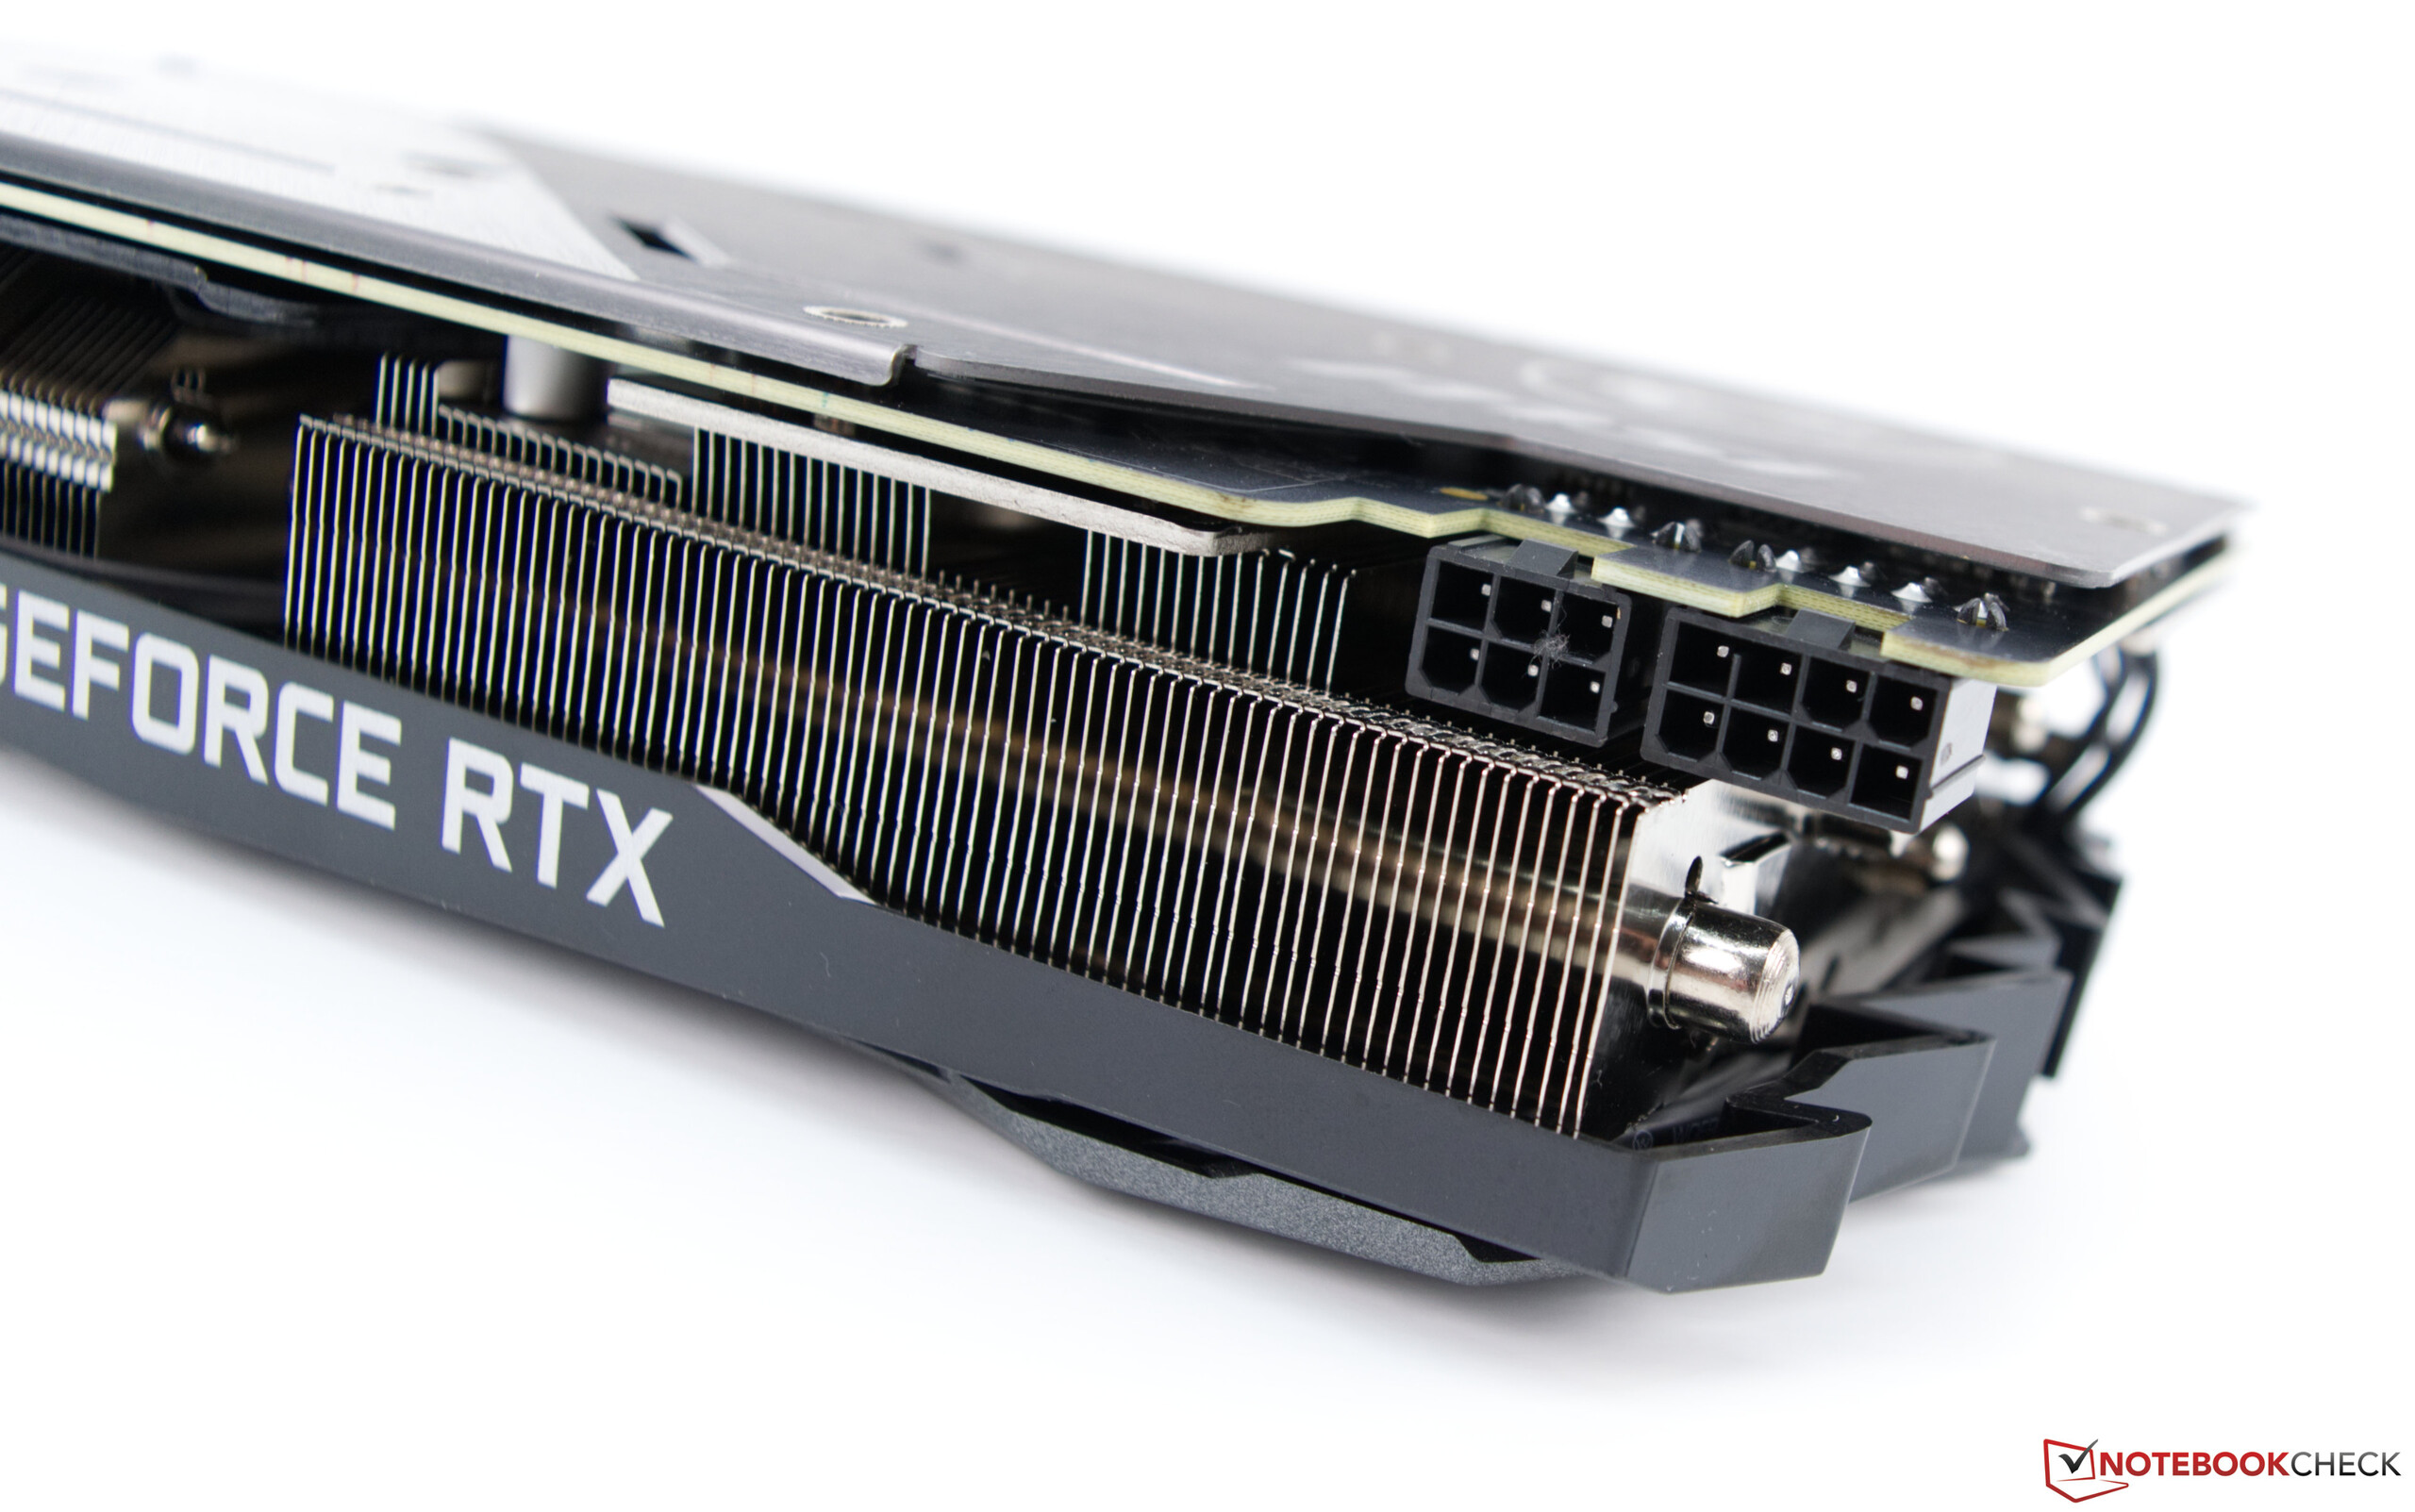
For external connectivity, the MSI RTX 2070 Gaming Z 8G features the following ports: 3 x Displayport (1.4) 1 x HDMI (2.0b) and 1 x USB Type-C. Internally, the card also requires two PCI-E power connectors (6 + 8 pin).
GPU Specification Overview
| Spezifikationen | RTX 2060 | MSI RTX 2070 | RTX 2070 | RTX 2080 | RTX 2080 Ti | GTX 1070 |
| Chip | TU106 | TU106 | TU106 | TU104 | TU102 | GP104 |
| Manufactured | 12 nm | 12 nm | 12 nm | 12 nm | 12 nm | 16 nm |
| Shader | 1.920 | 2.304 | 2.304 | 2.944 | 4.352 | 1.920 |
| Texture Units | 120 | 144 | 144 | 184 | 272 | 120 |
| Tensor Cores | 240 | 288 | 288 | 368 | 544 | - |
| RT Cores | 30 | 36 | 36 | 46 | 68 | - |
| GPU Base Clock | 1.365 MHz | 1.410 MHz | 1.410 MHz | 1.515 MHz | 1.350 MHz | 1.506 MHz |
| GPU Boost Clock | 1.680 MHz | 1.830 MHz | 1.620 MHz | 1.710 MHz | 1.545 MHz | 1.683 MHz |
| Memory Bus | 192 Bit | 256 Bit | 256 Bit | 256 Bit | 352 Bit | 256 Bit |
| Memory Bandwidth | 336 GB/s | 448 GB/s | 448 GB/s | 448 GB/s | 616 GB/s | 256,3 GB/s |
| Memory Size | 6 GB GDDR6 | 8 GB GDDR6 | 8 GB GDDR6 | 8 GB GDDR6 | 11 GB GDDR6 | 8 GB GDDR5 |
| Power (Watt) | 160 W | 225 W | 175 W | 215 W | 250 W | 150 W |
The Test System - Based on Ryzen 7 2700X
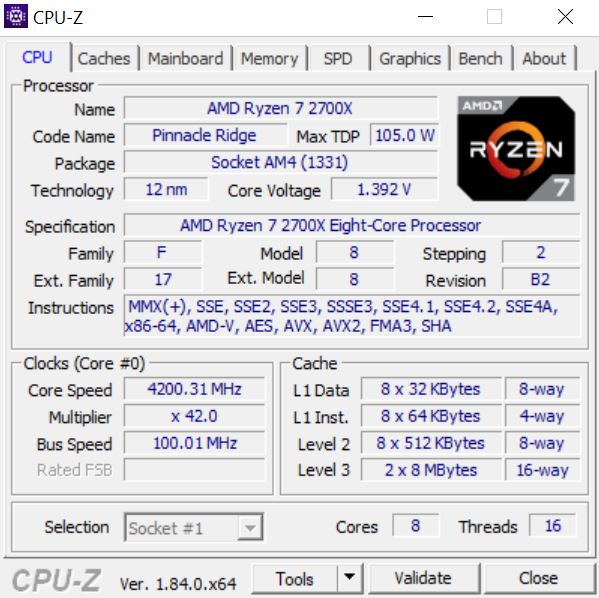
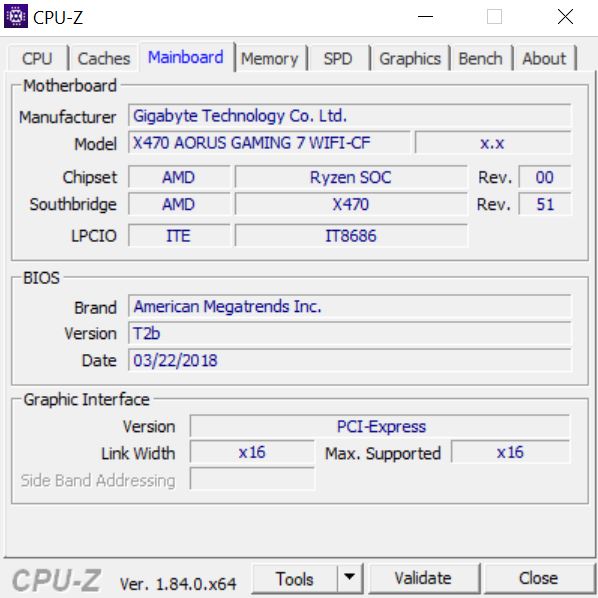
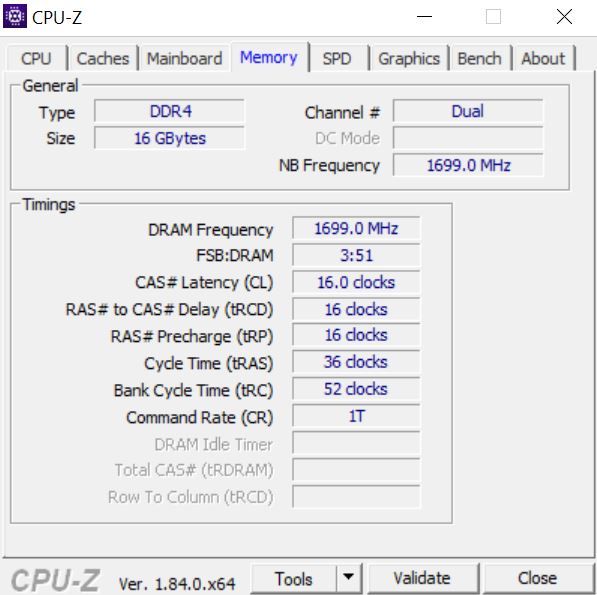
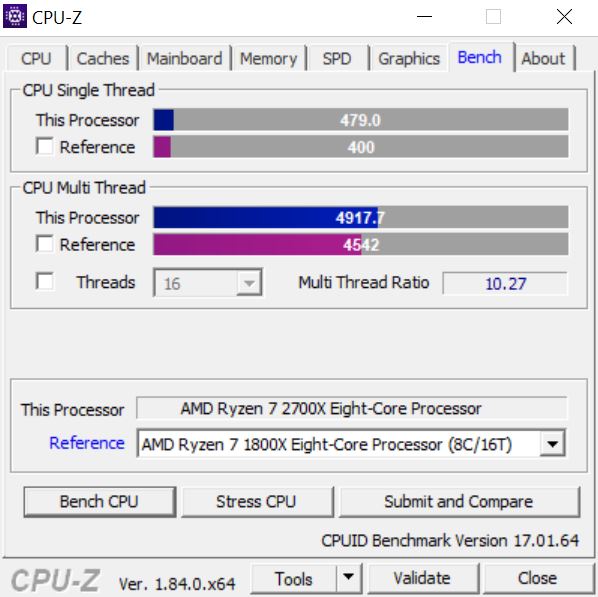
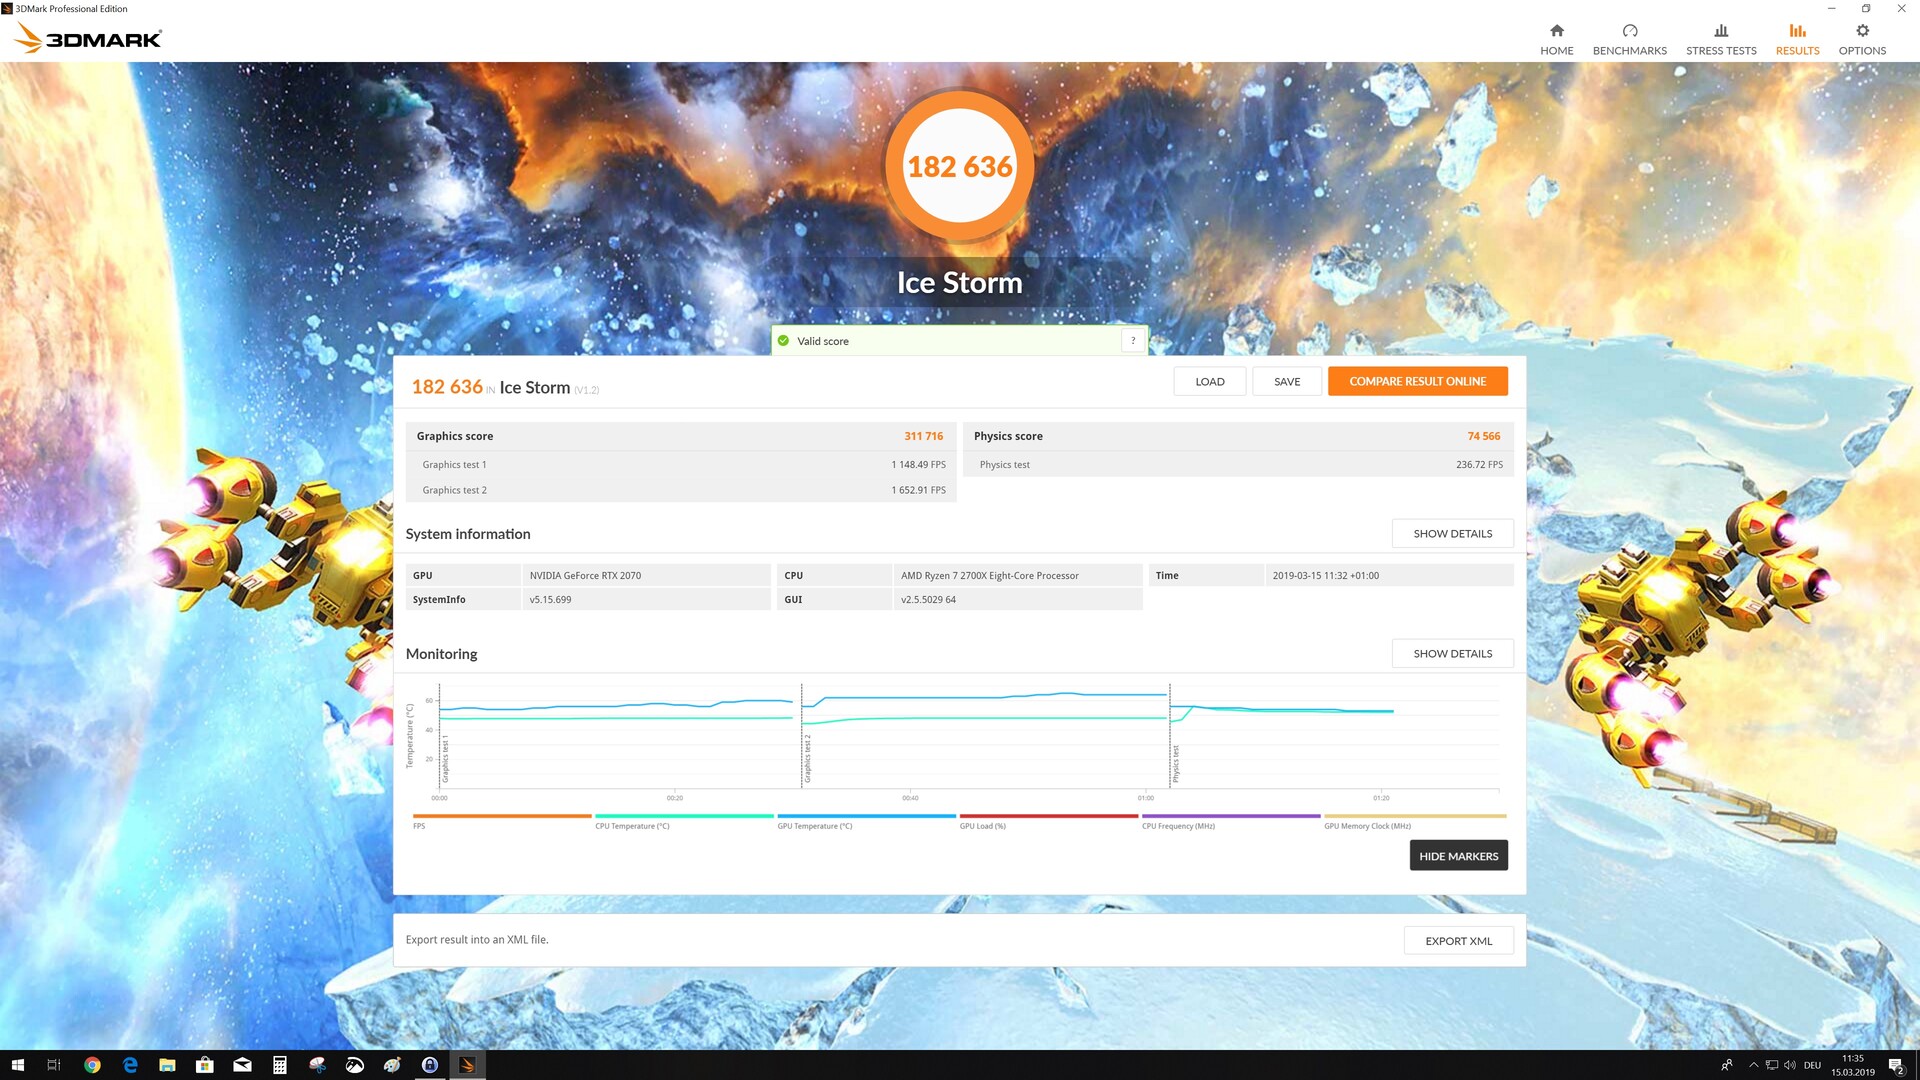
For our test system we are using a current AMD platform based on the Gigabyte X470 Aorus Gaming 7 WiFi. The CPU, an AMD RYZEN 7 2700X, offers good performance and for cooling we are using an AIO (Be Quiet Silent Loop 280mm). The 16GB of RAM is from G-Skill and clocked at 3,400 MHz. The Acer Predator XB321HK means we can also test in UHD territory. A big thank-you to AMD for providing the test platform.
| Case | Corsair Carbide Air 540 ATX Cube |
| CPU | AMD RYZEN 7 2700X |
| CPU cooler | Be Quiet Silent Loop 280mm |
| RAM | G-Skill Sniper X 16 GB DDR4 3.400 MHz |
| Mainboard | Gigabyte X470 Aorus Gaming 7 WiFi |
| Monitor | Acer Predator XB321HK 4K |
| SSD | ADATA SP900 M.2 SSD |
| HDD | 2 TB Western Digital (for games) |
| OS | Microsoft Windows 10 Professional 64-Bit (Version 1809) |
| Driver | Nvidia 418.91 |


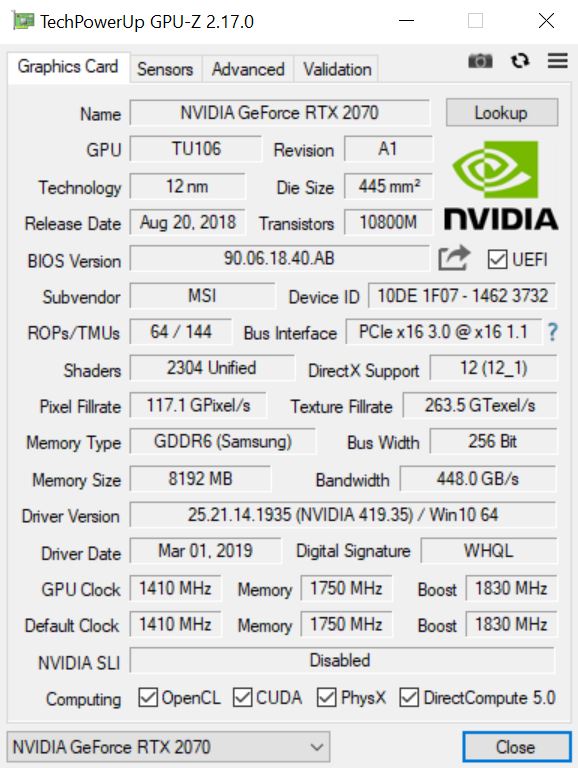
Clock Rates of the MSI RTX 2070 Gaming Z 8G
The MSI RTX 2070 Gaming Z 8G features a base clock of 1,410 MHz and is therefore at the same level as the Nvidia reference model. With its boost clock however the MSI card distances itself from the reference model as it is able to clock to 1,830 MHz. Due to its higher TDP rating, the MSI RTX 2070 Gaming Z 8G simply has more headroom in order to be able to extract more performance from the Turing GPU. VRAM is unchanged from the reference model and so the MSI RTX 2070 Gaming Z 8G is clocked at an effective 14 Ghz.
Compared to the reference model, the MSI RTX 2070 Gaming Z 8G has somewhat worse power consumption figures due to its higher TDP rating of 225 watts, but it's worth noting that even the GeForce RTX 2070 Foundation Edition also has power consumption figures slightly over reference values.
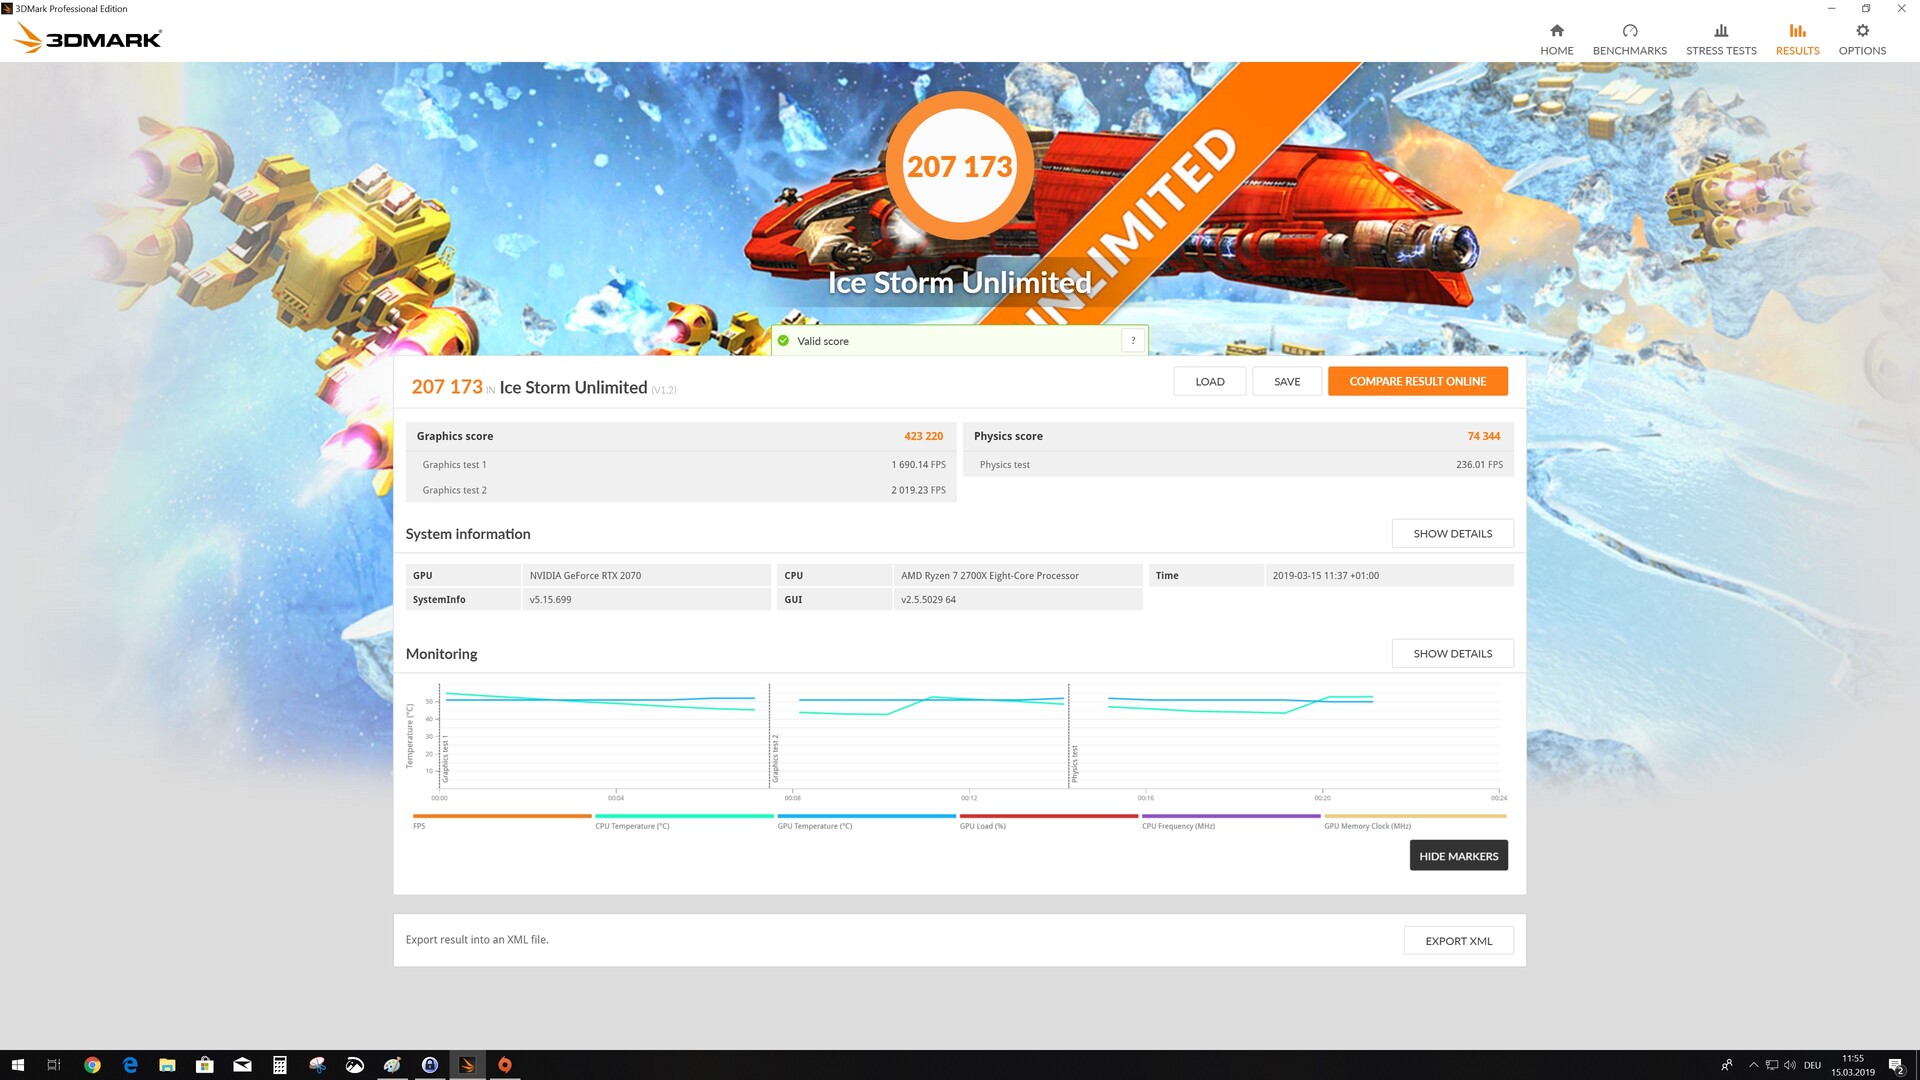
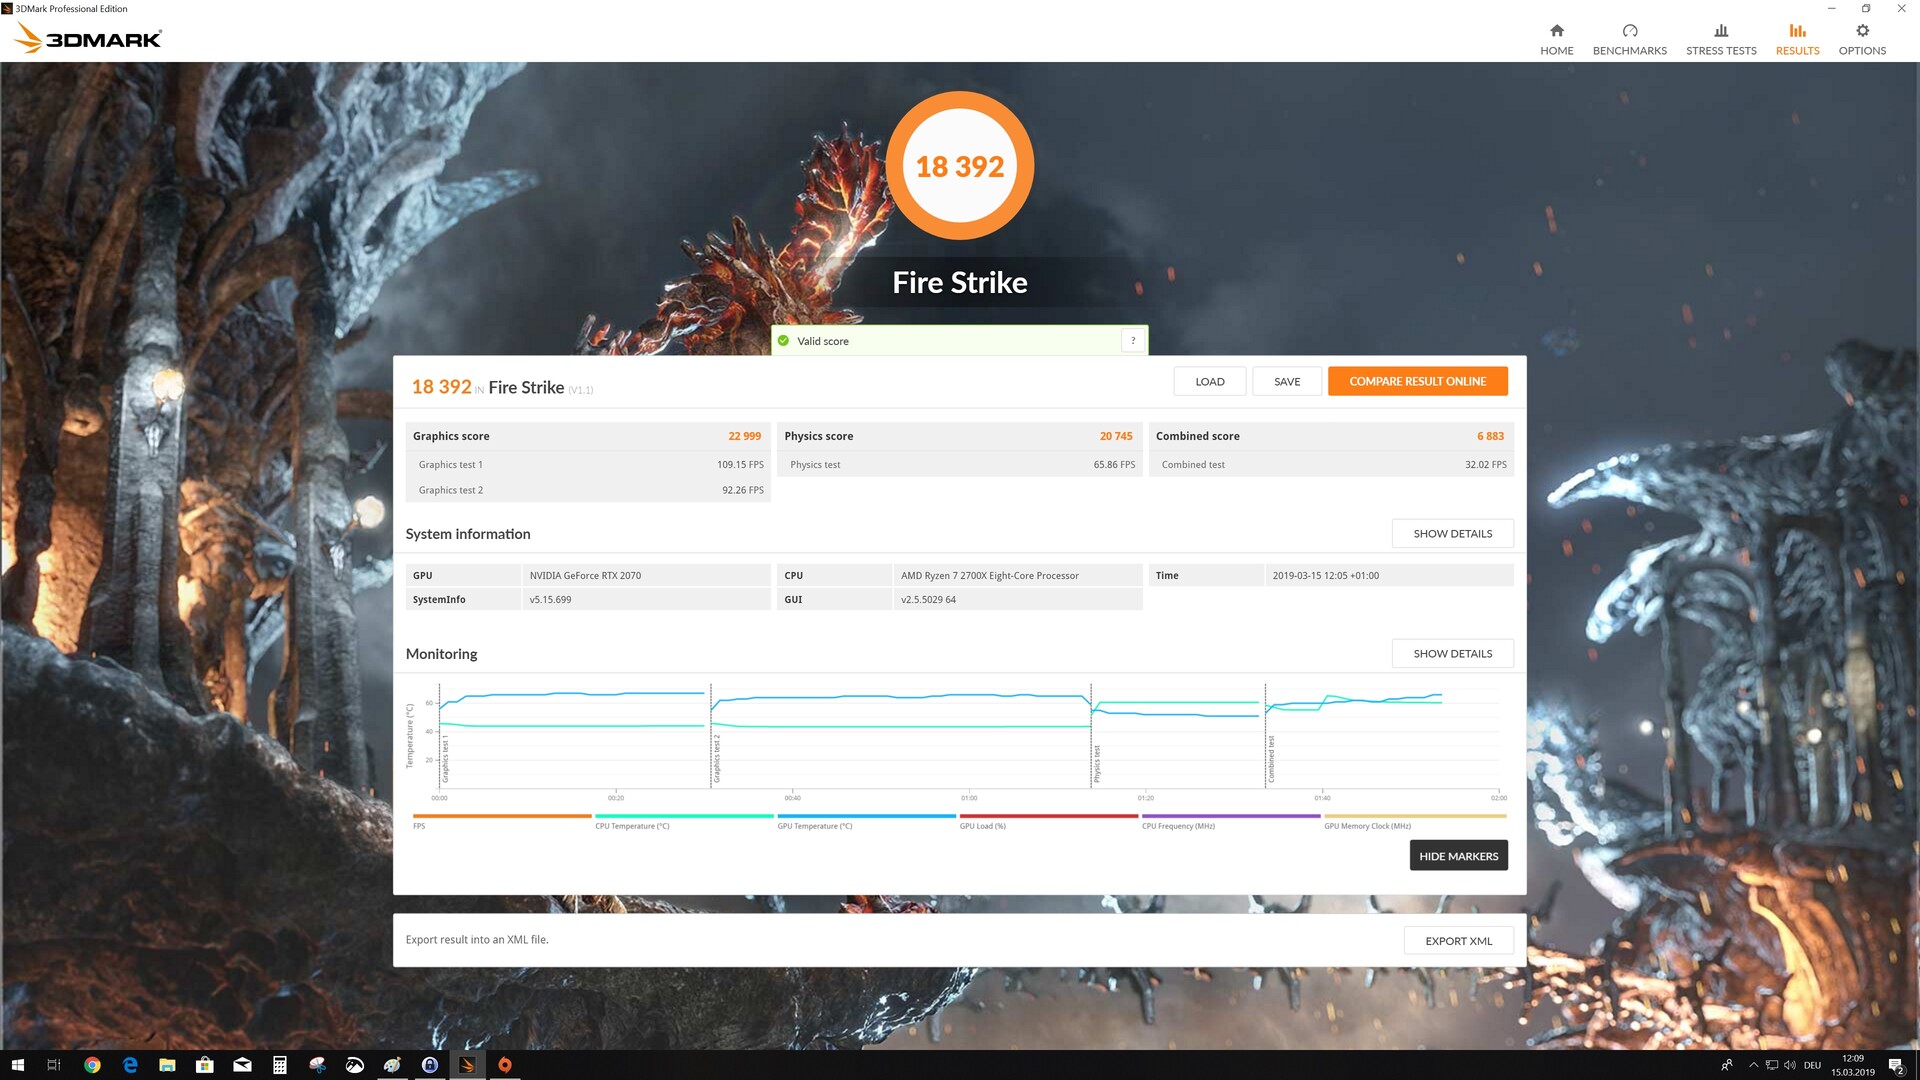
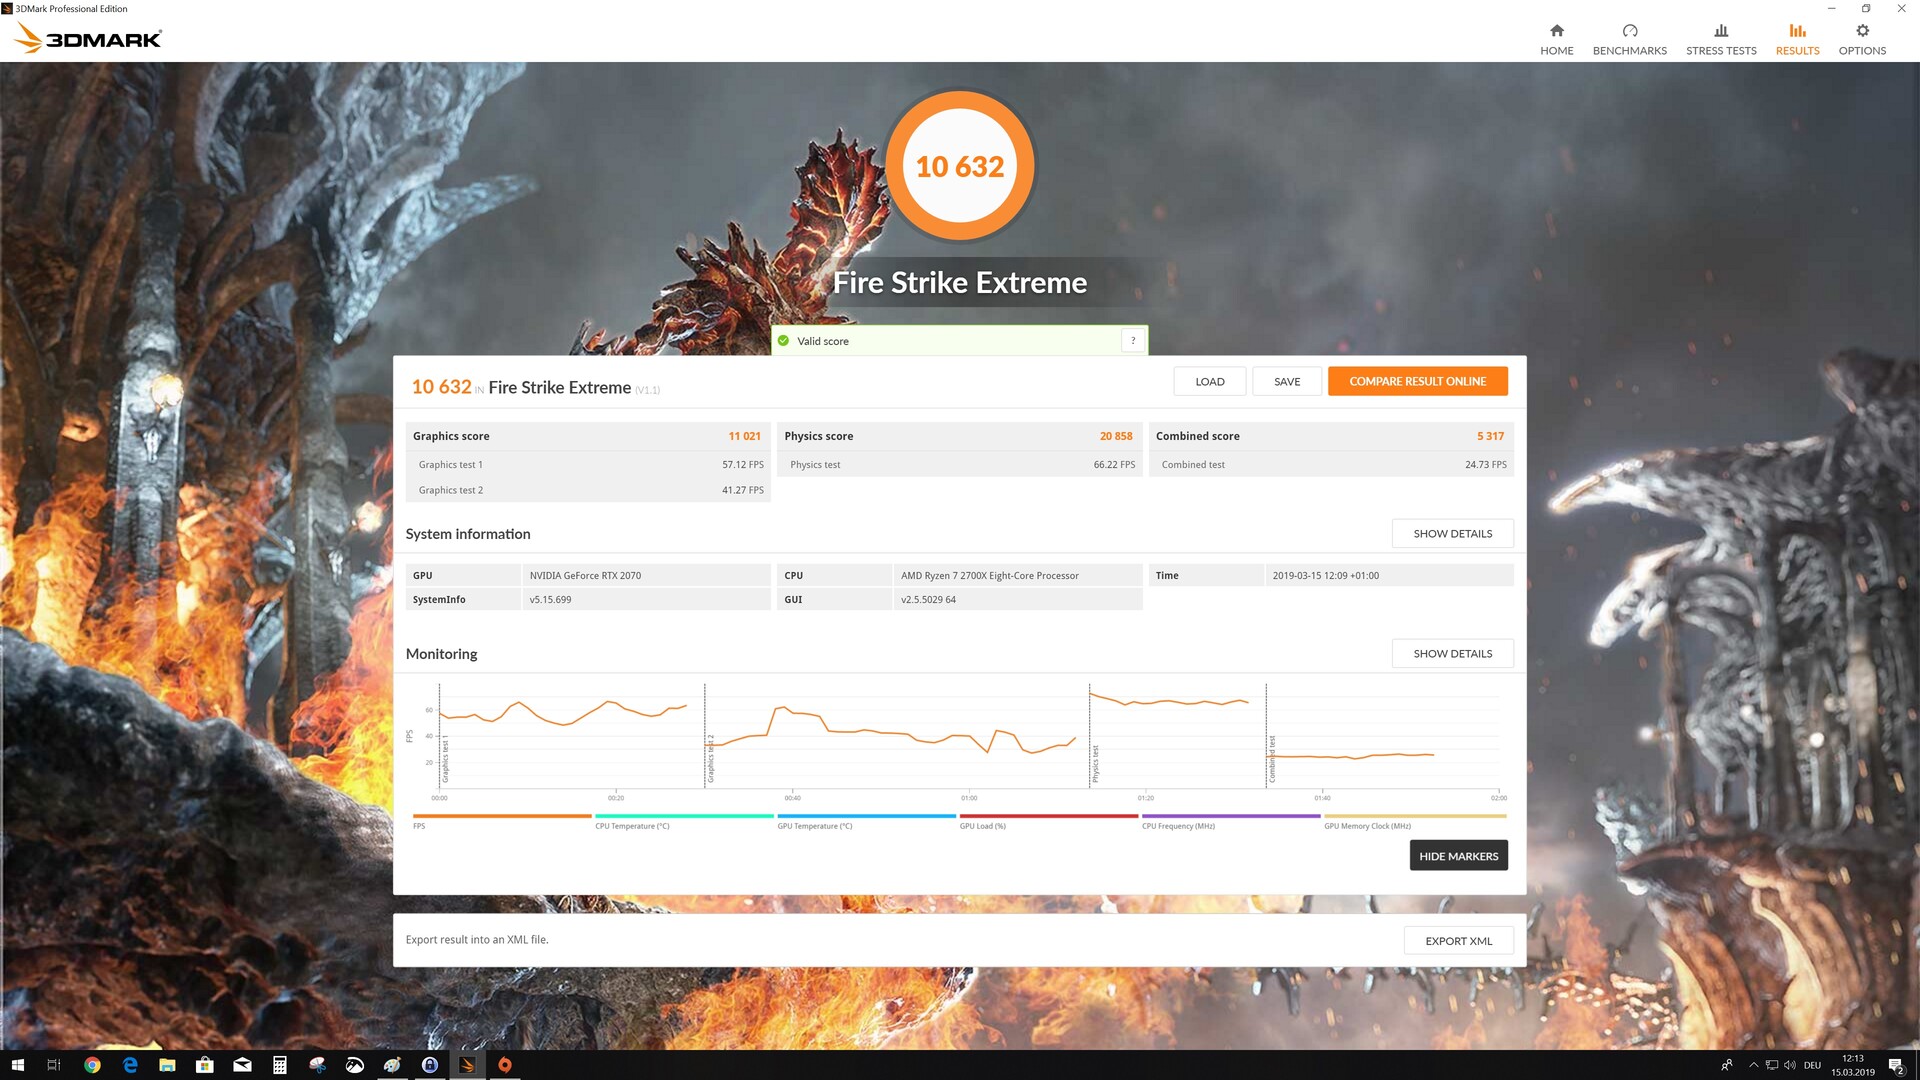
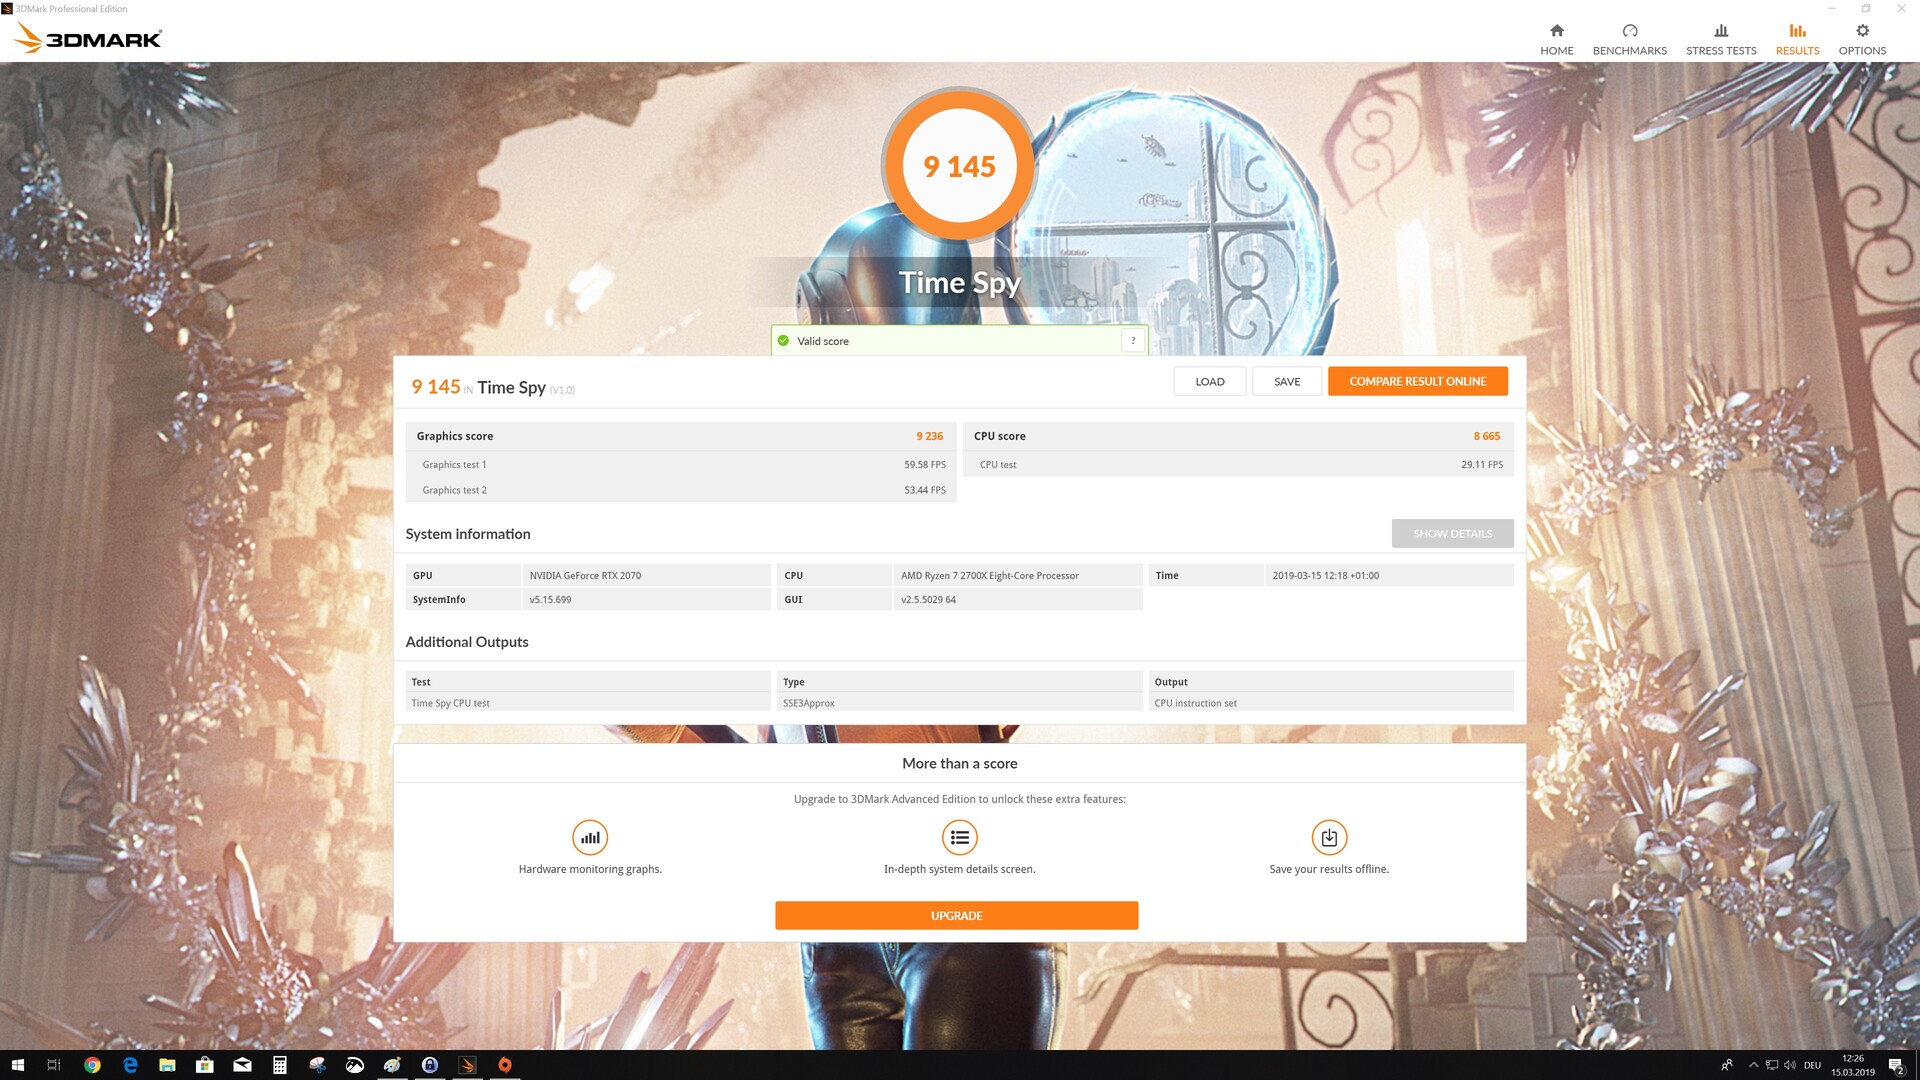
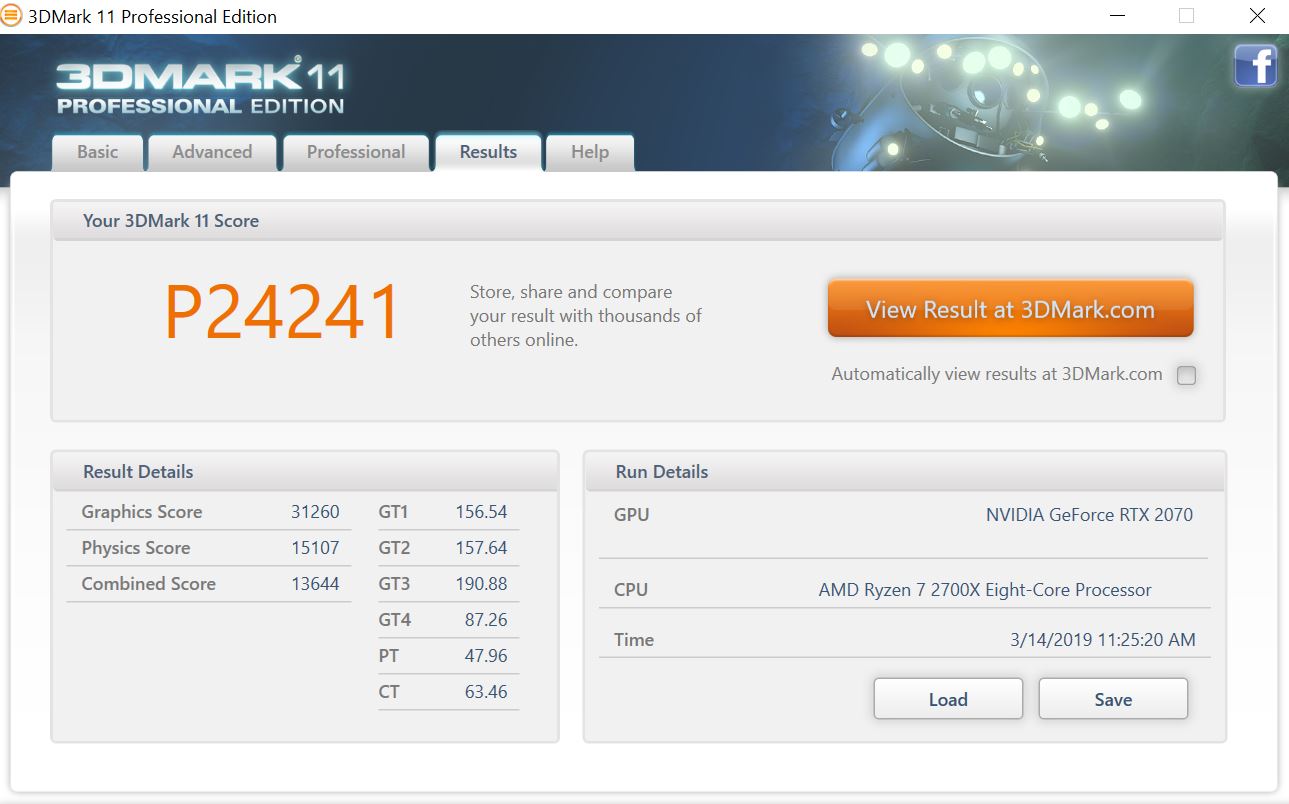
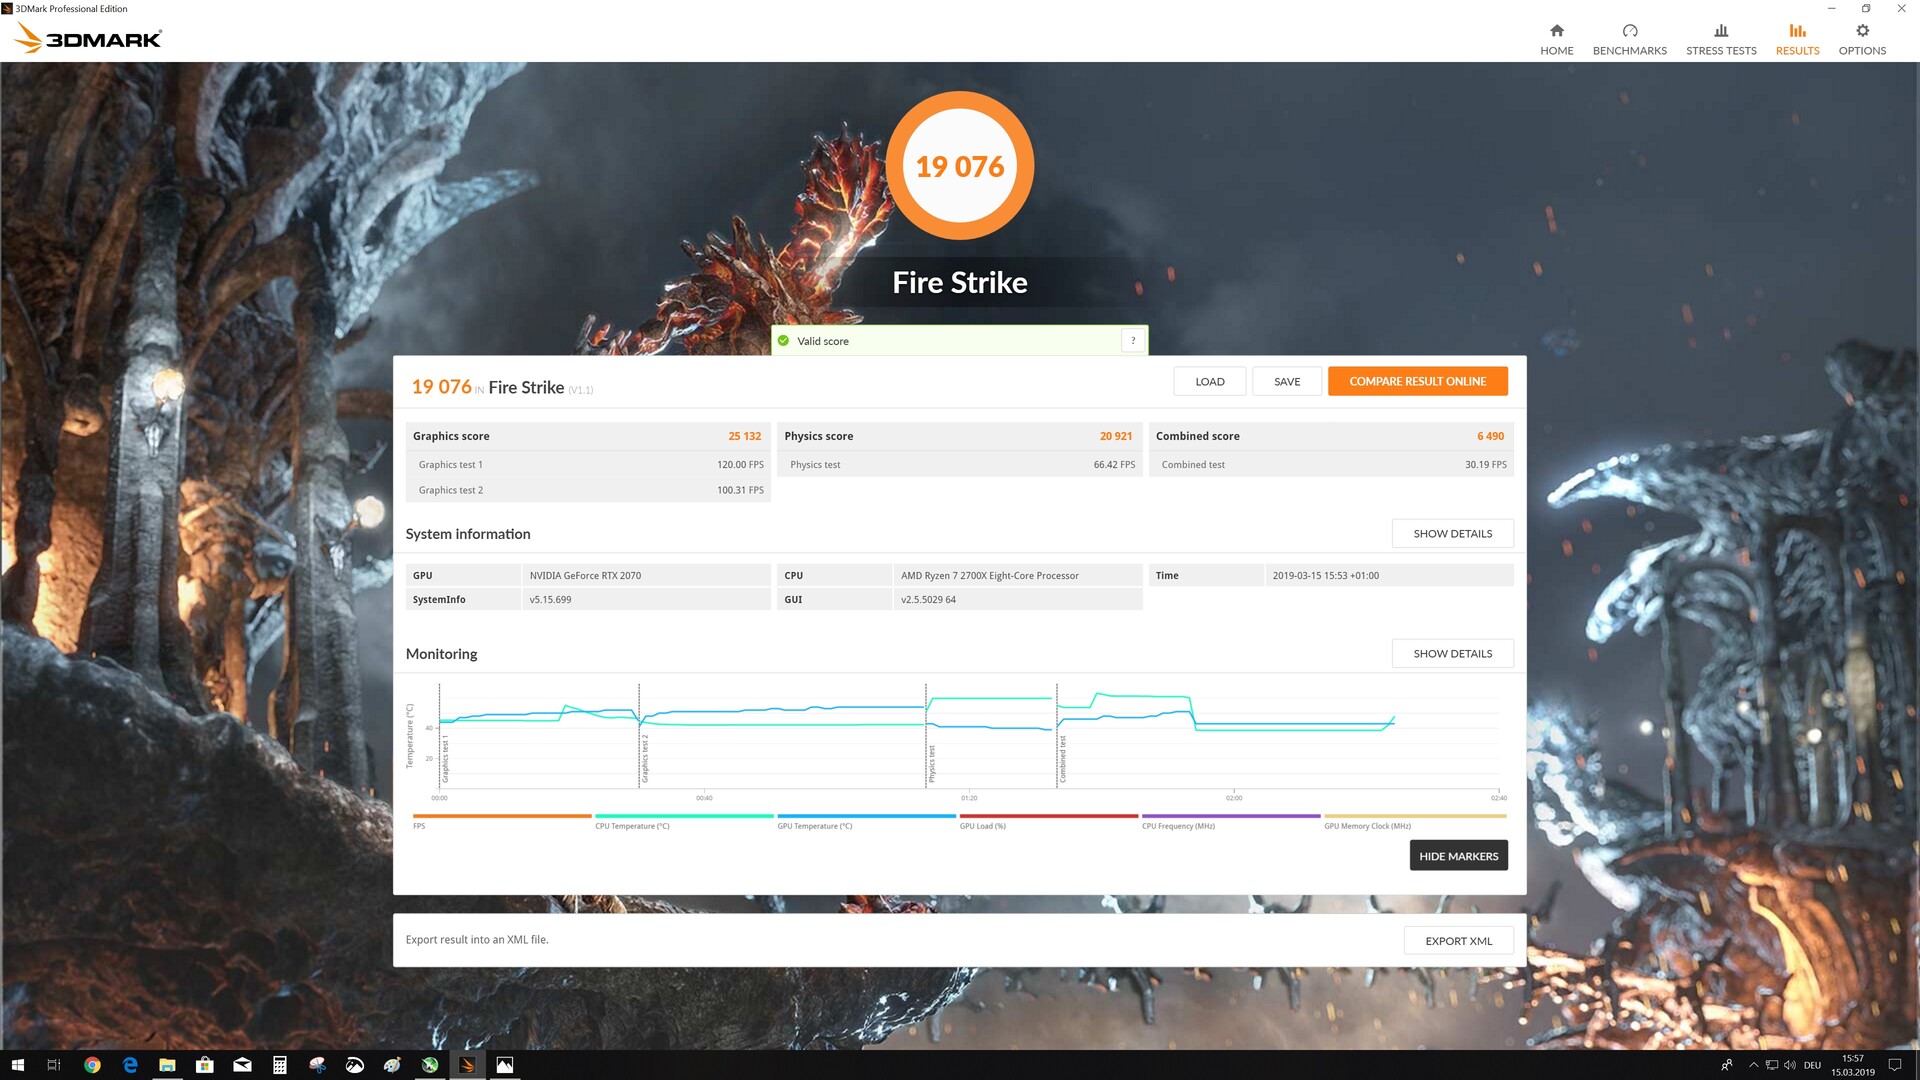
Synthetic Benchmarks
The synthetic benchmark results of the MSI RTX 2070 Gaming Z 8G are in line with those of the Asus ROG RTX Strix 2070 OC - both cards deliver nearly identical performance. Directly compared to the GeForce RTX 2080 the GeForce RTX 2070 is at a disadvantage of between 20 and 25 percent. Compared to the GeForce GTX 1080 Ti or AMD's current 7nm GPU, the AMD Radeon VII, the performance deficit is similar. In an in-house battle against the MSI RTX 2060 Gaming Z 6G, the MSI RTX 2070 Gaming Z 8G pulls out a lead of up to 20 percent.
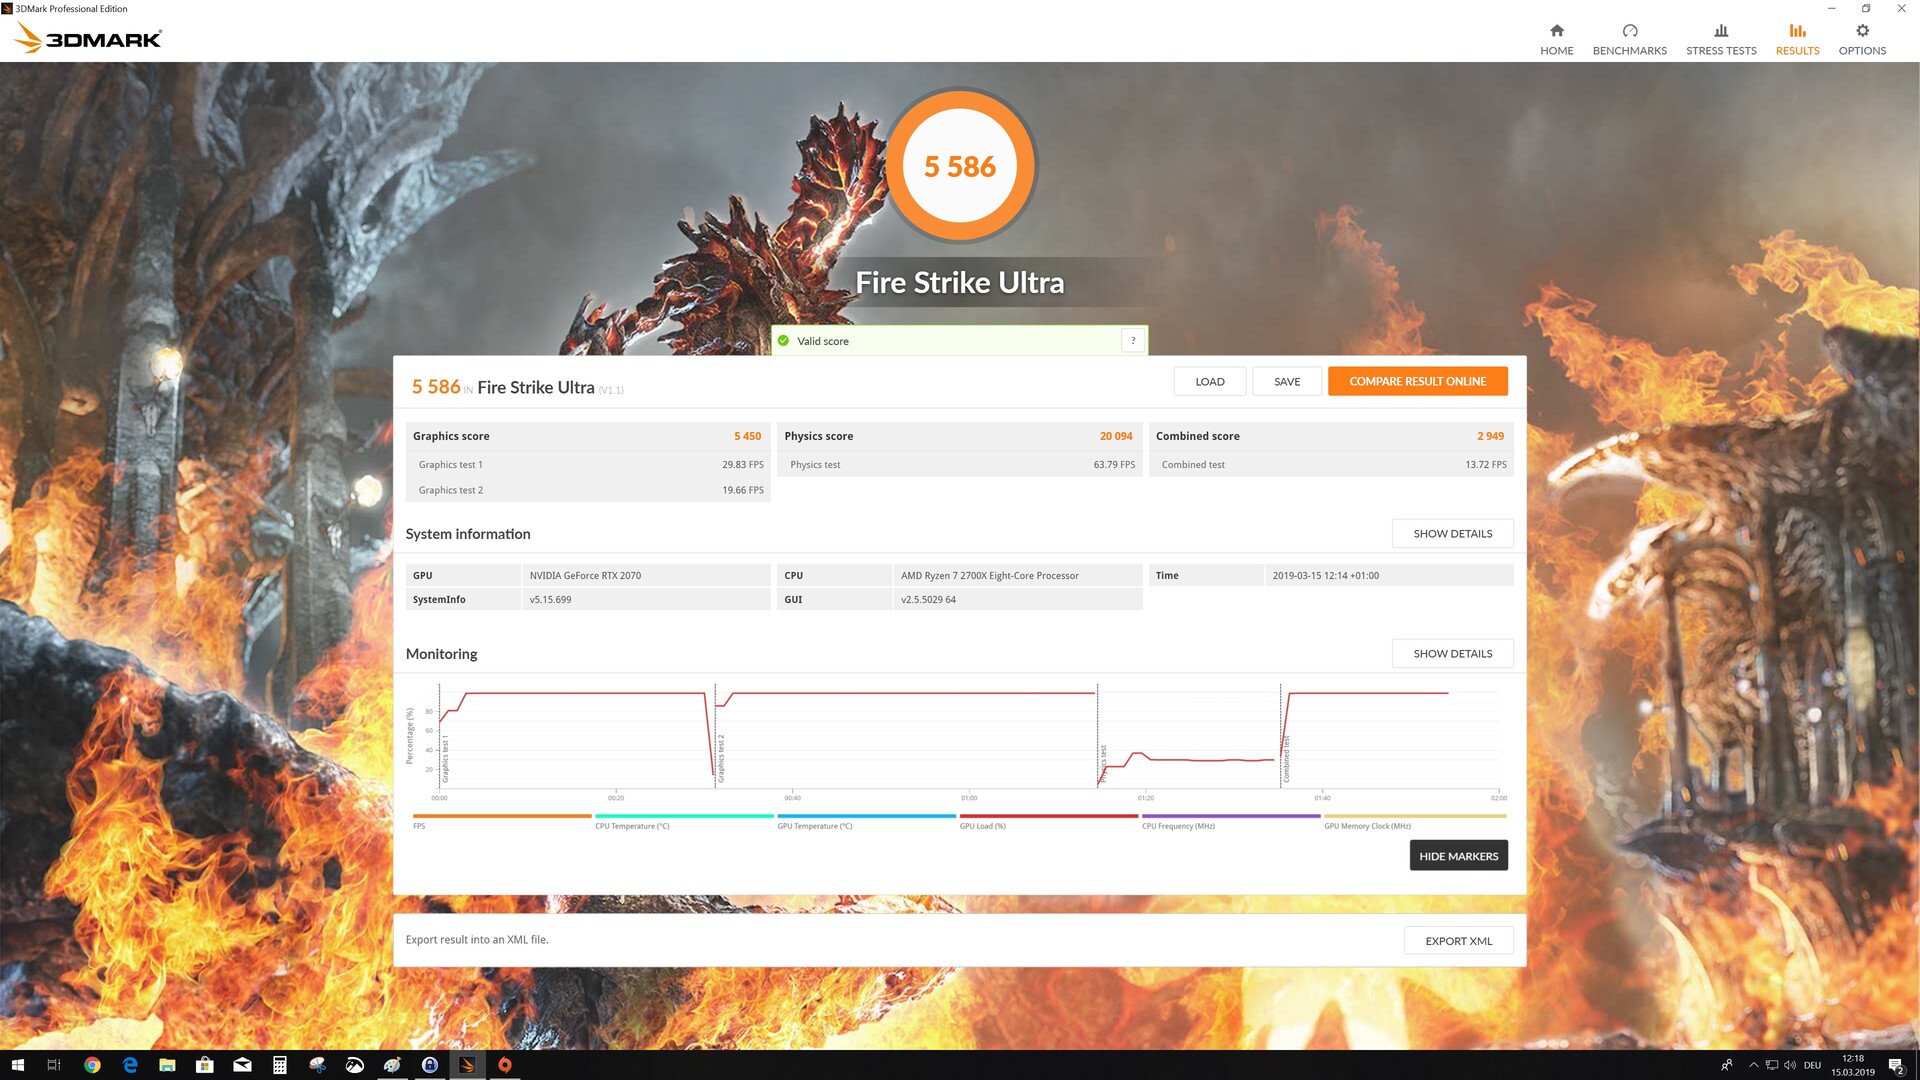
| 3DMark - 3840x2160 Fire Strike Ultra Graphics | |
| Nvidia Titan RTX | |
| NVIDIA Titan X Pascal | |
| AMD Radeon VII | |
| Nvidia GeForce GTX 1080 Ti Founders Edition | |
| MSI RTX 2080 Gaming X Trio | |
| Asus ROG Strix RTX 2070 OC | |
| MSI RTX 2070 Gaming Z 8G | |
| AMD Radeon RX Vega 64 | |
| Nvidia GeForce GTX 1080 Founders Edition | |
| MSI RTX 2060 Gaming Z 6G | |
| Nvidia GeForce GTX 1070 Founders Edition | |
| XFX AMD Radeon RX 590 OC+ 8 GB | |
| Asus ROG Strix RX 580 8 GB | |
| 3DMark 11 - 1280x720 Performance GPU | |
| Nvidia Titan RTX | |
| Nvidia GeForce GTX 1080 Ti Founders Edition | |
| MSI RTX 2080 Gaming X Trio | |
| AMD Radeon VII | |
| MSI Gaming X GeForce GTX 1080 Desktop PC | |
| Asus ROG Strix RTX 2070 OC | |
| MSI RTX 2070 Gaming Z 8G | |
| Nvidia GeForce GTX 1080 Founders Edition | |
| AMD Radeon RX Vega 64 | |
| NVIDIA Titan X Pascal | |
| MSI RTX 2060 Gaming Z 6G | |
| Nvidia GeForce GTX 1070 Founders Edition | |
| XFX AMD Radeon RX 590 OC+ 8 GB | |
| Asus ROG Strix RX 580 8 GB | |
| Unigine Heaven 4.0 - Extreme Preset DX11 | |
| Nvidia Titan RTX | |
| Nvidia GeForce GTX 1080 Ti Founders Edition | |
| MSI RTX 2080 Gaming X Trio | |
| MSI RTX 2070 Gaming Z 8G | |
| Asus ROG Strix RTX 2070 OC | |
| MSI Gaming X GeForce GTX 1080 Desktop PC | |
| AMD Radeon VII | |
| Nvidia GeForce GTX 1080 Founders Edition | |
| MSI RTX 2060 Gaming Z 6G | |
| Nvidia GeForce GTX 1070 Founders Edition | |
| Desktop PC | |
| XFX AMD Radeon RX 590 OC+ 8 GB | |
| Asus ROG Strix RX 580 8 GB | |
| Unigine Valley 1.0 - 1920x1080 Extreme HD DirectX AA:x8 | |
| Nvidia GeForce GTX 1080 Ti Founders Edition | |
| Nvidia Titan RTX | |
| MSI RTX 2080 Gaming X Trio | |
| Asus ROG Strix RTX 2070 OC | |
| MSI RTX 2070 Gaming Z 8G | |
| MSI Gaming X GeForce GTX 1080 Desktop PC | |
| AMD Radeon VII | |
| Nvidia GeForce GTX 1080 Founders Edition | |
| Nvidia GeForce GTX 1070 Founders Edition | |
| MSI RTX 2060 Gaming Z 6G | |
| XFX AMD Radeon RX 590 OC+ 8 GB | |
| Asus ROG Strix RX 580 8 GB | |
Game Benchmarks - RTX 2070 with 8 GB GDDR6 VRAM
In the in-game benchmarks, the MSI RTX 2070 Gaming Z 8G makes a good impression. All current titles were playable at 1080p and 1440p with maximum details. This was however also possible with the MSI RTX 2060 Gaming Z 6G. The difference in comparison to the RTX 2060 only becomes noticeable at resolutions above 1440p. Many of the tested games also performed well on the MSI RTX 2070 Gaming Z 8G at 2160p, however there were situations in some games, mainly recent releases, where frame drops were encountered which meant that enjoyable, fluid gameplay was not possible due to the fact that more than 50 FPS was not possible.
In comparison to the new AMD Radeon VII, the MSI RTX 2070 Gaming Z 8G lagged behind, sometimes significantly. Especially at higher resolutions (2160p) the AMD card was able to stretch out a larger lead. Here it seems the 16GB of HBM2 VRAM made its presence known, even if we didn't encounter any problems with the 8GB of GDDR6 VRAM of the MSI RTX 2070 Gaming Z 8G during testing.
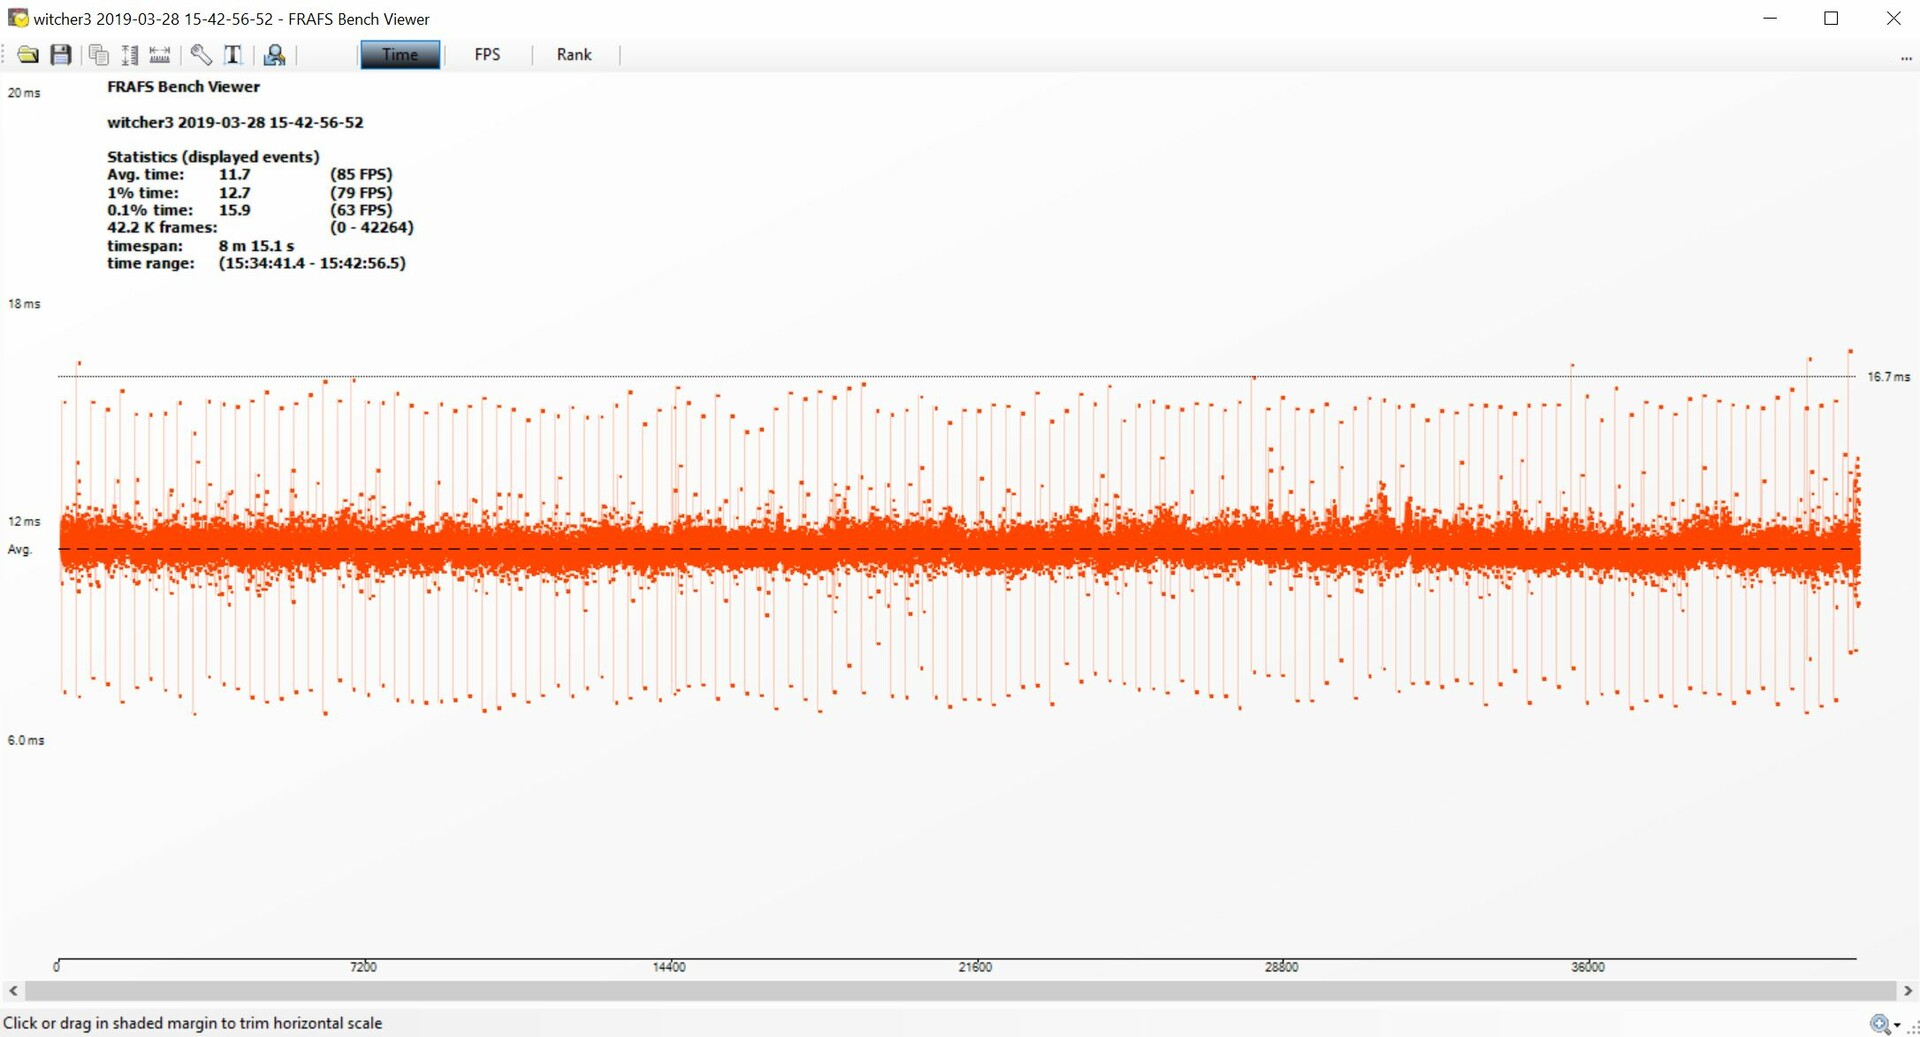
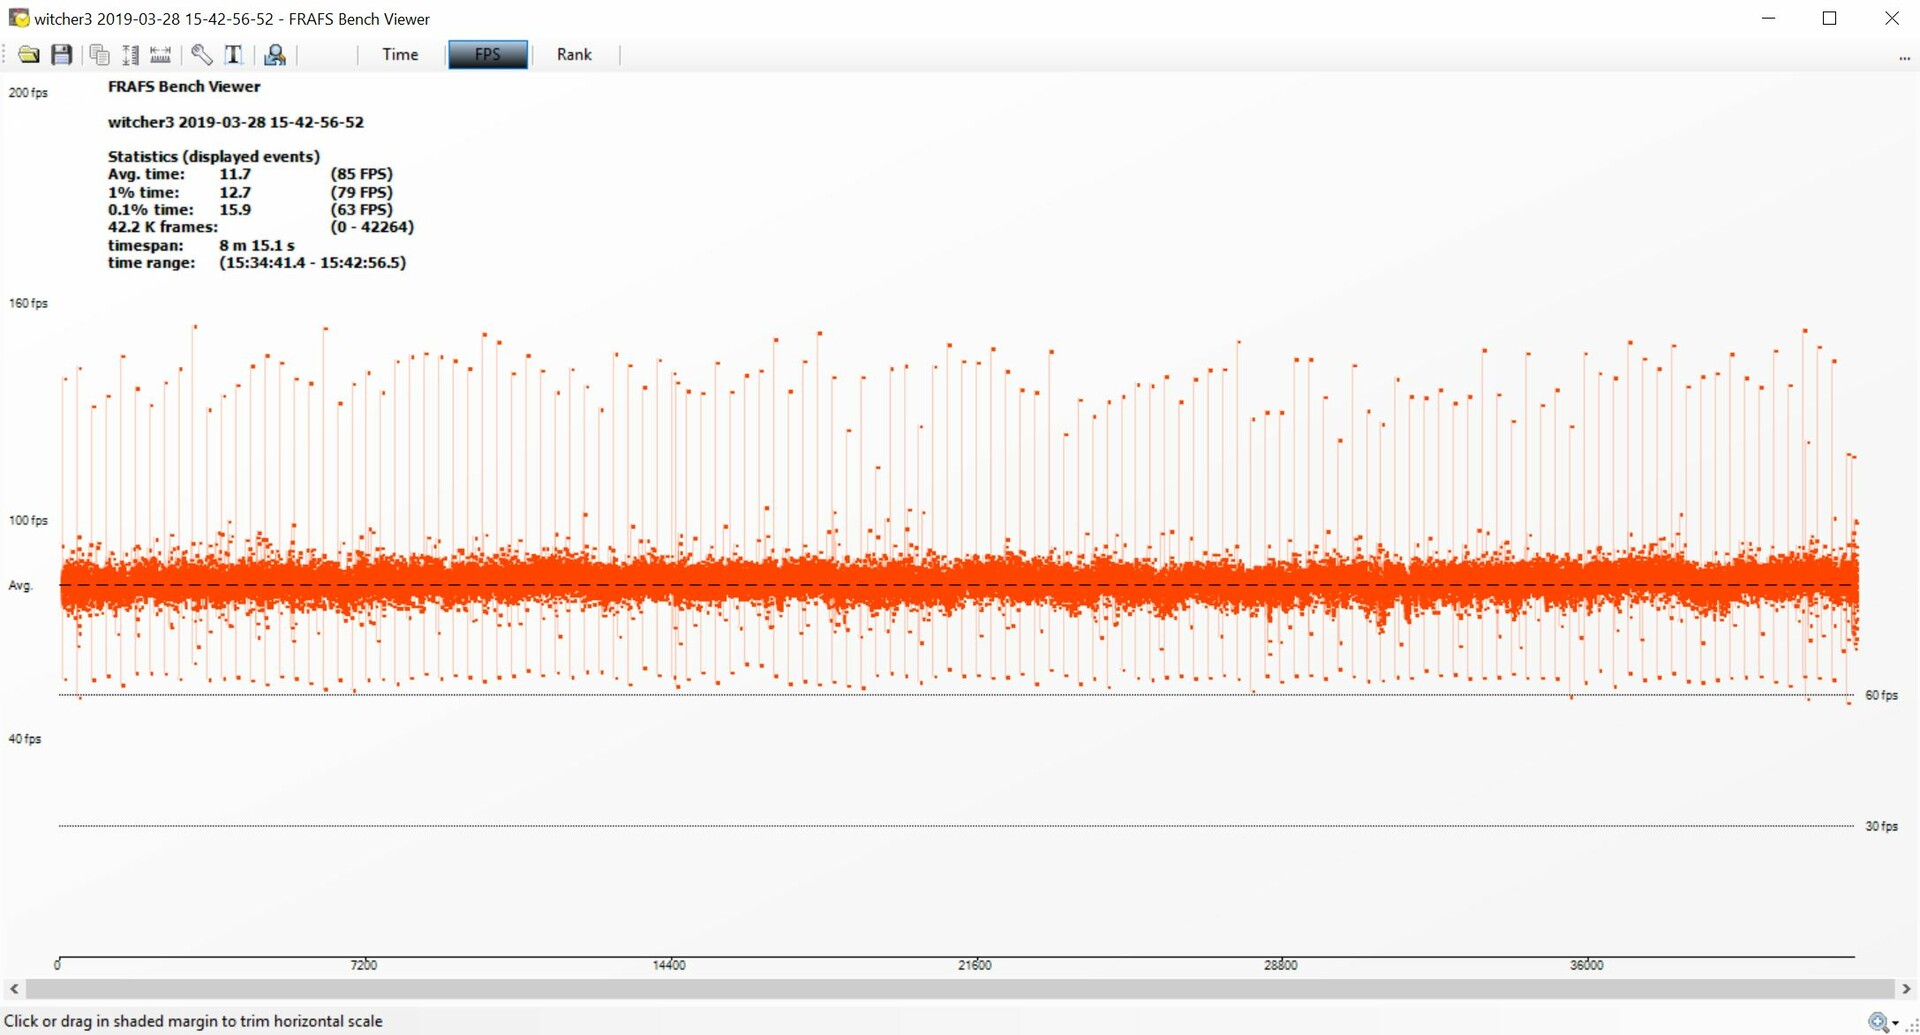
By looking at the frame rate charts, which we measured in The Witcher 3 (Ultra preset), it was very clear that even with a long gaming session no drops in performance should be expected. Well over 60 FPS was achieved most of the time, and the frame times also show no signs of problems - a smooth gameplay experience can be expected.
The Witcher 3 Frame Rates Ultra Preset
| Call of Duty Black Ops 4 | |
| 1920x1080 Very High / On | |
| NVIDIA Titan RTX | |
| NVIDIA GeForce RTX 2080 (Desktop) | |
| AMD Radeon RX Vega 64 | |
| NVIDIA Titan X Pascal | |
| NVIDIA GeForce RTX 2070 (Desktop) | |
| NVIDIA GeForce RTX 2070 (Desktop) | |
| AMD Radeon VII | |
| NVIDIA GeForce RTX 2060 (Desktop) | |
| AMD Radeon RX 590 (Desktop) | |
| NVIDIA GeForce GTX 1060 (Desktop) | |
| 3840x2160 Very High / On | |
| NVIDIA Titan RTX | |
| NVIDIA GeForce RTX 2080 (Desktop) | |
| NVIDIA Titan X Pascal | |
| AMD Radeon RX Vega 64 | |
| AMD Radeon VII | |
| NVIDIA GeForce RTX 2070 (Desktop) | |
| NVIDIA GeForce RTX 2070 (Desktop) | |
| NVIDIA GeForce RTX 2060 (Desktop) | |
| AMD Radeon RX 590 (Desktop) | |
| NVIDIA GeForce GTX 1060 (Desktop) | |
| Assassin´s Creed Odyssey | |
| 1920x1080 Ultra High Preset | |
| NVIDIA Titan RTX | |
| NVIDIA GeForce RTX 2080 (Desktop) | |
| NVIDIA Titan X Pascal | |
| NVIDIA GeForce RTX 2070 (Desktop) | |
| AMD Radeon VII | |
| NVIDIA GeForce RTX 2070 (Desktop) | |
| NVIDIA GeForce RTX 2060 (Desktop) | |
| AMD Radeon RX Vega 64 | |
| AMD Radeon RX 590 (Desktop) | |
| NVIDIA GeForce GTX 1060 (Desktop) | |
| AMD Radeon RX 580 (Desktop) | |
| 3840x2160 Ultra High Preset | |
| NVIDIA Titan RTX | |
| AMD Radeon VII | |
| NVIDIA GeForce RTX 2080 (Desktop) | |
| NVIDIA Titan X Pascal | |
| NVIDIA GeForce RTX 2070 (Desktop) | |
| NVIDIA GeForce RTX 2070 (Desktop) | |
| AMD Radeon RX Vega 64 | |
| NVIDIA GeForce RTX 2060 (Desktop) | |
| AMD Radeon RX 590 (Desktop) | |
| NVIDIA GeForce GTX 1060 (Desktop) | |
| AMD Radeon RX 580 (Desktop) | |
| FIFA 19 | |
| 1920x1080 Ultra Preset AA:4x MS | |
| AMD Radeon RX Vega 64 | |
| AMD Radeon RX 580 (Desktop) | |
| NVIDIA GeForce GTX 1060 (Desktop) | |
| NVIDIA Titan RTX | |
| AMD Radeon RX 590 (Desktop) | |
| NVIDIA GeForce RTX 2080 (Desktop) | |
| AMD Radeon VII | |
| NVIDIA Titan X Pascal | |
| NVIDIA GeForce RTX 2070 (Desktop) | |
| NVIDIA GeForce RTX 2070 (Desktop) | |
| NVIDIA GeForce RTX 2060 (Desktop) | |
| 3840x2160 Ultra Preset AA:4x MS | |
| NVIDIA Titan RTX | |
| AMD Radeon VII | |
| NVIDIA Titan X Pascal | |
| NVIDIA GeForce RTX 2070 (Desktop) | |
| NVIDIA GeForce RTX 2080 (Desktop) | |
| NVIDIA GeForce RTX 2070 (Desktop) | |
| AMD Radeon RX Vega 64 | |
| NVIDIA GeForce RTX 2060 (Desktop) | |
| NVIDIA GeForce GTX 1060 (Desktop) | |
| AMD Radeon RX 580 (Desktop) | |
| AMD Radeon RX 590 (Desktop) | |
| Forza Horizon 4 | |
| 1920x1080 Ultra Preset AA:2xMS | |
| NVIDIA GeForce RTX 2080 (Desktop) | |
| NVIDIA Titan RTX | |
| AMD Radeon VII | |
| AMD Radeon RX Vega 64 | |
| NVIDIA GeForce RTX 2070 (Desktop) | |
| NVIDIA Titan X Pascal | |
| NVIDIA GeForce RTX 2070 (Desktop) | |
| NVIDIA GeForce RTX 2060 (Desktop) | |
| AMD Radeon RX 590 (Desktop) | |
| AMD Radeon RX 580 (Desktop) | |
| NVIDIA GeForce GTX 1060 (Desktop) | |
| 3840x2160 Ultra Preset AA:2xMS | |
| NVIDIA Titan RTX | |
| NVIDIA GeForce RTX 2080 (Desktop) | |
| AMD Radeon VII | |
| NVIDIA Titan X Pascal | |
| NVIDIA GeForce RTX 2070 (Desktop) | |
| AMD Radeon RX Vega 64 | |
| NVIDIA GeForce RTX 2070 (Desktop) | |
| NVIDIA GeForce RTX 2060 (Desktop) | |
| AMD Radeon RX 590 (Desktop) | |
| AMD Radeon RX 580 (Desktop) | |
| NVIDIA GeForce GTX 1060 (Desktop) | |
| F1 2018 | |
| 1920x1080 Ultra High Preset AA:T AF:16x | |
| NVIDIA Titan RTX | |
| NVIDIA GeForce RTX 2080 (Desktop) | |
| AMD Radeon VII | |
| NVIDIA GeForce RTX 2070 (Desktop) | |
| NVIDIA GeForce RTX 2070 (Desktop) | |
| NVIDIA Titan X Pascal | |
| NVIDIA GeForce RTX 2060 (Desktop) | |
| AMD Radeon RX Vega 64 | |
| AMD Radeon RX 590 (Desktop) | |
| AMD Radeon RX 580 (Desktop) | |
| NVIDIA GeForce GTX 1060 (Desktop) | |
| 3840x2160 Ultra High Preset AA:T AF:16x | |
| NVIDIA Titan RTX | |
| NVIDIA GeForce RTX 2080 (Desktop) | |
| NVIDIA Titan X Pascal | |
| AMD Radeon VII | |
| NVIDIA GeForce RTX 2070 (Desktop) | |
| NVIDIA GeForce RTX 2070 (Desktop) | |
| NVIDIA GeForce RTX 2060 (Desktop) | |
| AMD Radeon RX Vega 64 | |
| AMD Radeon RX 590 (Desktop) | |
| NVIDIA GeForce GTX 1060 (Desktop) | |
| Monster Hunter World | |
| 1920x1080 Highest Preset (Image Quality High) | |
| NVIDIA Titan RTX | |
| NVIDIA GeForce RTX 2080 (Desktop) | |
| NVIDIA Titan X Pascal | |
| NVIDIA GeForce RTX 2070 (Desktop) | |
| NVIDIA GeForce RTX 2070 (Desktop) | |
| AMD Radeon VII | |
| NVIDIA GeForce RTX 2060 (Desktop) | |
| AMD Radeon RX Vega 64 | |
| AMD Radeon RX 590 (Desktop) | |
| AMD Radeon RX 580 (Desktop) | |
| NVIDIA GeForce GTX 1060 (Desktop) | |
| 3840x2160 Highest Preset (Image Quality High) | |
| NVIDIA Titan RTX | |
| NVIDIA GeForce RTX 2080 (Desktop) | |
| NVIDIA Titan X Pascal | |
| AMD Radeon VII | |
| NVIDIA GeForce RTX 2070 (Desktop) | |
| NVIDIA GeForce RTX 2070 (Desktop) | |
| AMD Radeon RX Vega 64 | |
| NVIDIA GeForce RTX 2060 (Desktop) | |
| AMD Radeon RX 590 (Desktop) | |
| AMD Radeon RX 580 (Desktop) | |
| NVIDIA GeForce GTX 1060 (Desktop) | |
| Far Cry 5 | |
| 1920x1080 Ultra Preset AA:T | |
| NVIDIA GeForce RTX 2080 (Desktop) | |
| NVIDIA GeForce RTX 2070 (Desktop) | |
| NVIDIA Titan RTX | |
| NVIDIA GeForce RTX 2070 (Desktop) | |
| AMD Radeon RX Vega 64 | |
| NVIDIA GeForce RTX 2060 (Desktop) | |
| AMD Radeon VII | |
| NVIDIA Titan X Pascal | |
| AMD Radeon RX 590 (Desktop) | |
| NVIDIA GeForce GTX 1060 (Desktop) | |
| AMD Radeon RX 580 (Desktop) | |
| 3840x2160 Ultra Preset AA:T | |
| NVIDIA Titan RTX | |
| NVIDIA GeForce RTX 2080 (Desktop) | |
| AMD Radeon VII | |
| NVIDIA Titan X Pascal | |
| NVIDIA GeForce RTX 2070 (Desktop) | |
| NVIDIA GeForce RTX 2070 (Desktop) | |
| AMD Radeon RX Vega 64 | |
| NVIDIA GeForce RTX 2060 (Desktop) | |
| AMD Radeon RX 580 (Desktop) | |
| AMD Radeon RX 590 (Desktop) | |
| NVIDIA GeForce GTX 1060 (Desktop) | |
| The Crew 2 | |
| 1920x1080 Ultra Preset | |
| NVIDIA GeForce GTX 1060 (Desktop) | |
| NVIDIA Titan X Pascal | |
| AMD Radeon RX 580 (Desktop) | |
| NVIDIA GeForce RTX 2070 (Desktop) | |
| AMD Radeon RX 590 (Desktop) | |
| NVIDIA Titan RTX | |
| NVIDIA GeForce RTX 2060 (Desktop) | |
| NVIDIA GeForce RTX 2070 (Desktop) | |
| NVIDIA GeForce RTX 2080 (Desktop) | |
| AMD Radeon VII | |
| 3840x2160 Ultra Preset | |
| NVIDIA Titan RTX | |
| NVIDIA GeForce RTX 2080 (Desktop) | |
| NVIDIA GeForce RTX 2070 (Desktop) | |
| NVIDIA Titan X Pascal | |
| NVIDIA GeForce RTX 2070 (Desktop) | |
| AMD Radeon VII | |
| NVIDIA GeForce RTX 2060 (Desktop) | |
| AMD Radeon RX 580 (Desktop) | |
| AMD Radeon RX 590 (Desktop) | |
| NVIDIA GeForce GTX 1060 (Desktop) | |
| Assassin´s Creed Origins | |
| 1920x1080 Ultra High Preset | |
| NVIDIA Titan RTX | |
| NVIDIA GeForce RTX 2080 (Desktop) | |
| NVIDIA GeForce RTX 2070 (Desktop) | |
| NVIDIA GeForce RTX 2070 (Desktop) | |
| NVIDIA GeForce GTX 1080 Ti (Desktop) | |
| NVIDIA GeForce RTX 2060 (Desktop) | |
| AMD Radeon RX Vega 64 | |
| AMD Radeon VII | |
| NVIDIA GeForce GTX 1060 (Desktop) | |
| AMD Radeon RX 590 (Desktop) | |
| AMD Radeon RX 580 (Desktop) | |
| 3840x2160 Ultra High Preset | |
| NVIDIA Titan RTX | |
| NVIDIA GeForce RTX 2080 (Desktop) | |
| NVIDIA GeForce GTX 1080 Ti (Desktop) | |
| AMD Radeon VII | |
| NVIDIA GeForce RTX 2070 (Desktop) | |
| NVIDIA GeForce RTX 2070 (Desktop) | |
| NVIDIA GeForce RTX 2060 (Desktop) | |
| AMD Radeon RX Vega 64 | |
| AMD Radeon RX 590 (Desktop) | |
| NVIDIA GeForce GTX 1060 (Desktop) | |
| AMD Radeon RX 580 (Desktop) | |
| Kingdom Come: Deliverance | |
| 1920x1080 Ultra High Preset | |
| NVIDIA GeForce RTX 2070 (Desktop) | |
| NVIDIA Titan RTX | |
| NVIDIA GeForce RTX 2080 (Desktop) | |
| NVIDIA GeForce RTX 2070 (Desktop) | |
| NVIDIA GeForce GTX 1080 Ti (Desktop) | |
| AMD Radeon RX Vega 64 | |
| AMD Radeon VII | |
| NVIDIA GeForce RTX 2060 (Desktop) | |
| AMD Radeon RX 590 (Desktop) | |
| NVIDIA GeForce GTX 1060 (Desktop) | |
| AMD Radeon RX 580 (Desktop) | |
| 3840x2160 Ultra High Preset | |
| NVIDIA Titan RTX | |
| NVIDIA GeForce RTX 2080 (Desktop) | |
| AMD Radeon RX Vega 64 | |
| NVIDIA GeForce GTX 1080 Ti (Desktop) | |
| NVIDIA GeForce RTX 2070 (Desktop) | |
| AMD Radeon VII | |
| NVIDIA GeForce RTX 2070 (Desktop) | |
| NVIDIA GeForce RTX 2060 (Desktop) | |
| AMD Radeon RX 590 (Desktop) | |
| AMD Radeon RX 580 (Desktop) | |
| NVIDIA GeForce GTX 1060 (Desktop) | |
| Fortnite | |
| 1920x1080 Epic Preset | |
| NVIDIA GeForce GTX 1080 Ti (Desktop) | |
| NVIDIA GeForce RTX 2070 (Desktop) | |
| NVIDIA GeForce RTX 2080 (Desktop) | |
| NVIDIA GeForce RTX 2060 (Desktop) | |
| NVIDIA GeForce RTX 2070 (Desktop) | |
| NVIDIA Titan RTX | |
| AMD Radeon VII | |
| AMD Radeon RX 590 (Desktop) | |
| NVIDIA GeForce GTX 1060 (Desktop) | |
| AMD Radeon RX 580 (Desktop) | |
| 3840x2160 Epic Preset | |
| NVIDIA Titan RTX | |
| NVIDIA GeForce RTX 2080 (Desktop) | |
| NVIDIA GeForce RTX 2070 (Desktop) | |
| NVIDIA GeForce RTX 2070 (Desktop) | |
| NVIDIA GeForce GTX 1080 Ti (Desktop) | |
| AMD Radeon VII | |
| NVIDIA GeForce RTX 2060 (Desktop) | |
| AMD Radeon RX 590 (Desktop) | |
| NVIDIA GeForce GTX 1060 (Desktop) | |
| AMD Radeon RX 580 (Desktop) | |
| Final Fantasy XV Benchmark | |
| 1920x1080 High Quality | |
| NVIDIA Titan RTX | |
| NVIDIA GeForce RTX 2080 (Desktop) | |
| NVIDIA GeForce GTX 1080 Ti (Desktop) | |
| NVIDIA GeForce RTX 2070 (Desktop) | |
| NVIDIA GeForce RTX 2070 (Desktop) | |
| NVIDIA GeForce RTX 2060 (Desktop) | |
| NVIDIA GeForce GTX 1080 (Desktop) | |
| AMD Radeon RX Vega 64 | |
| AMD Radeon RX Vega 64 | |
| NVIDIA GeForce GTX 1060 (Desktop) | |
| AMD Radeon RX 590 (Desktop) | |
| AMD Radeon RX 580 (Desktop) | |
| 3840x2160 High Quality | |
| NVIDIA Titan RTX | |
| NVIDIA GeForce RTX 2080 (Desktop) | |
| NVIDIA GeForce GTX 1080 Ti (Desktop) | |
| NVIDIA GeForce RTX 2070 (Desktop) | |
| NVIDIA GeForce RTX 2070 (Desktop) | |
| NVIDIA GeForce RTX 2060 (Desktop) | |
| NVIDIA GeForce GTX 1080 (Desktop) | |
| AMD Radeon RX Vega 64 | |
| AMD Radeon RX Vega 64 | |
| AMD Radeon RX 590 (Desktop) | |
| NVIDIA GeForce GTX 1060 (Desktop) | |
| AMD Radeon RX 580 (Desktop) | |
| Destiny 2 | |
| 1920x1080 Highest Preset AA:SM AF:16x | |
| NVIDIA GeForce GTX 1080 Ti (Desktop) | |
| NVIDIA GeForce RTX 2070 (Desktop) | |
| NVIDIA Titan RTX | |
| NVIDIA GeForce RTX 2070 (Desktop) | |
| NVIDIA GeForce RTX 2080 (Desktop) | |
| AMD Radeon VII | |
| NVIDIA GeForce RTX 2060 (Desktop) | |
| NVIDIA GeForce GTX 1060 (Desktop) | |
| 3840x2160 Highest Preset AA:SM AF:16x | |
| NVIDIA Titan RTX | |
| NVIDIA GeForce RTX 2080 (Desktop) | |
| NVIDIA GeForce RTX 2070 (Desktop) | |
| NVIDIA GeForce RTX 2070 (Desktop) | |
| NVIDIA GeForce GTX 1080 Ti (Desktop) | |
| AMD Radeon VII | |
| NVIDIA GeForce RTX 2060 (Desktop) | |
| NVIDIA GeForce GTX 1060 (Desktop) | |
| The Witcher 3 | |
| 1920x1080 Ultra Graphics & Postprocessing (HBAO+) | |
| NVIDIA Titan RTX | |
| NVIDIA GeForce RTX 2080 (Desktop) | |
| NVIDIA GeForce GTX 1080 Ti (Desktop) | |
| NVIDIA GeForce RTX 2070 (Desktop) | |
| NVIDIA GeForce RTX 2070 (Desktop) | |
| NVIDIA GeForce GTX 1080 (Desktop) | |
| AMD Radeon RX Vega 64 | |
| NVIDIA GeForce GTX 1080 (Desktop) | |
| AMD Radeon VII | |
| NVIDIA GeForce RTX 2060 (Desktop) | |
| NVIDIA GeForce GTX 1070 (Desktop) | |
| AMD Radeon RX 590 (Desktop) | |
| AMD Radeon RX 580 (Desktop) | |
| 3840x2160 High Graphics & Postprocessing (Nvidia HairWorks Off) | |
| NVIDIA Titan RTX | |
| NVIDIA GeForce RTX 2080 (Desktop) | |
| NVIDIA GeForce GTX 1080 Ti (Desktop) | |
| NVIDIA GeForce RTX 2070 (Desktop) | |
| NVIDIA GeForce RTX 2070 (Desktop) | |
| NVIDIA GeForce GTX 1080 (Desktop) | |
| NVIDIA GeForce GTX 1080 (Desktop) | |
| AMD Radeon VII | |
| NVIDIA GeForce RTX 2060 (Desktop) | |
| AMD Radeon RX Vega 64 | |
| NVIDIA GeForce GTX 1070 (Desktop) | |
| AMD Radeon RX 590 (Desktop) | |
| AMD Radeon RX 580 (Desktop) | |
| Watch Dogs 2 | |
| 1920x1080 Ultra Preset | |
| NVIDIA Titan RTX | |
| NVIDIA GeForce GTX 1080 Ti (Desktop) | |
| NVIDIA GeForce RTX 2080 (Desktop) | |
| NVIDIA GeForce RTX 2070 (Desktop) | |
| NVIDIA GeForce RTX 2070 (Desktop) | |
| NVIDIA GeForce GTX 1080 (Desktop) | |
| AMD Radeon RX Vega 64 | |
| NVIDIA GeForce RTX 2060 (Desktop) | |
| AMD Radeon VII | |
| AMD Radeon RX 590 (Desktop) | |
| NVIDIA GeForce GTX 1060 (Desktop) | |
| AMD Radeon RX 580 (Desktop) | |
| 3840x2160 High Preset | |
| NVIDIA Titan RTX | |
| NVIDIA GeForce GTX 1080 Ti (Desktop) | |
| NVIDIA GeForce RTX 2080 (Desktop) | |
| NVIDIA GeForce RTX 2070 (Desktop) | |
| NVIDIA GeForce GTX 1080 (Desktop) | |
| NVIDIA GeForce RTX 2070 (Desktop) | |
| AMD Radeon VII | |
| NVIDIA GeForce RTX 2060 (Desktop) | |
| AMD Radeon RX Vega 64 | |
| NVIDIA GeForce GTX 1060 (Desktop) | |
| AMD Radeon RX 590 (Desktop) | |
| AMD Radeon RX 580 (Desktop) | |
| Battlefield 1 | |
| 1920x1080 Ultra Preset AA:T | |
| NVIDIA GeForce GTX 1080 Ti (Desktop) | |
| NVIDIA Titan RTX | |
| NVIDIA GeForce GTX 1080 (Desktop) | |
| NVIDIA GeForce GTX 1080 (Desktop) | |
| NVIDIA GeForce RTX 2080 (Desktop) | |
| AMD Radeon RX Vega 64 | |
| NVIDIA GeForce RTX 2070 (Desktop) | |
| AMD Radeon VII | |
| NVIDIA GeForce RTX 2070 (Desktop) | |
| NVIDIA GeForce RTX 2060 (Desktop) | |
| AMD Radeon RX 590 (Desktop) | |
| NVIDIA GeForce GTX 1060 (Desktop) | |
| 3840x2160 High Preset AA:T | |
| NVIDIA Titan RTX | |
| NVIDIA GeForce RTX 2080 (Desktop) | |
| AMD Radeon VII | |
| NVIDIA GeForce GTX 1080 Ti (Desktop) | |
| NVIDIA GeForce RTX 2070 (Desktop) | |
| NVIDIA GeForce RTX 2070 (Desktop) | |
| NVIDIA GeForce GTX 1080 (Desktop) | |
| NVIDIA GeForce GTX 1080 (Desktop) | |
| AMD Radeon RX Vega 64 | |
| NVIDIA GeForce RTX 2060 (Desktop) | |
| AMD Radeon RX 590 (Desktop) | |
| NVIDIA GeForce GTX 1060 (Desktop) | |
| For Honor | |
| 1920x1080 Extreme Preset AA:T AF:16x | |
| NVIDIA Titan RTX | |
| NVIDIA GeForce GTX 1080 Ti (Desktop) | |
| NVIDIA GeForce RTX 2080 (Desktop) | |
| NVIDIA GeForce RTX 2070 (Desktop) | |
| NVIDIA GeForce RTX 2070 (Desktop) | |
| NVIDIA GeForce GTX 1080 (Desktop) | |
| AMD Radeon RX Vega 64 | |
| NVIDIA GeForce RTX 2060 (Desktop) | |
| AMD Radeon VII | |
| NVIDIA GeForce GTX 1070 (Desktop) | |
| AMD Radeon RX 590 (Desktop) | |
| AMD Radeon RX 580 (Desktop) | |
| NVIDIA GeForce GTX 1060 (Desktop) | |
| 3840x2160 High Preset AA:T AF:8x | |
| NVIDIA Titan RTX | |
| NVIDIA GeForce GTX 1080 Ti (Desktop) | |
| NVIDIA GeForce RTX 2080 (Desktop) | |
| AMD Radeon VII | |
| NVIDIA GeForce RTX 2070 (Desktop) | |
| NVIDIA GeForce GTX 1080 (Desktop) | |
| NVIDIA GeForce RTX 2070 (Desktop) | |
| NVIDIA GeForce RTX 2060 (Desktop) | |
| AMD Radeon RX Vega 64 | |
| NVIDIA GeForce GTX 1070 (Desktop) | |
| AMD Radeon RX 590 (Desktop) | |
| NVIDIA GeForce GTX 1060 (Desktop) | |
| AMD Radeon RX 580 (Desktop) | |
| Ghost Recon Wildlands | |
| 1920x1080 Ultra Preset AA:T AF:16x | |
| NVIDIA Titan RTX | |
| NVIDIA GeForce RTX 2080 (Desktop) | |
| NVIDIA GeForce GTX 1080 Ti (Desktop) | |
| NVIDIA GeForce RTX 2070 (Desktop) | |
| NVIDIA GeForce RTX 2070 (Desktop) | |
| NVIDIA GeForce RTX 2060 (Desktop) | |
| AMD Radeon RX Vega 64 | |
| NVIDIA GeForce GTX 1070 (Desktop) | |
| AMD Radeon VII | |
| AMD Radeon RX 590 (Desktop) | |
| NVIDIA GeForce GTX 1060 (Desktop) | |
| AMD Radeon RX 580 (Desktop) | |
| 3840x2160 Ultra Preset AA:T AF:16x | |
| NVIDIA Titan RTX | |
| NVIDIA GeForce RTX 2080 (Desktop) | |
| NVIDIA GeForce GTX 1080 Ti (Desktop) | |
| NVIDIA GeForce RTX 2070 (Desktop) | |
| GTA V | |
| 1920x1080 Highest AA:4xMSAA + FX AF:16x | |
| NVIDIA Titan RTX | |
| NVIDIA GeForce RTX 2080 (Desktop) | |
| AMD Radeon VII | |
| NVIDIA GeForce RTX 2070 (Desktop) | |
| NVIDIA GeForce RTX 2070 (Desktop) | |
| NVIDIA GeForce RTX 2060 (Desktop) | |
| NVIDIA GeForce GTX 1080 (Desktop) | |
| NVIDIA GeForce GTX 1080 Ti (Desktop) | |
| NVIDIA GeForce GTX 1080 (Desktop) | |
| NVIDIA GeForce GTX 1070 (Desktop) | |
| AMD Radeon RX 590 (Desktop) | |
| 3840x2160 High/On (Advanced Graphics Off) AA:FX AF:8x | |
| NVIDIA Titan RTX | |
| NVIDIA GeForce RTX 2070 (Desktop) | |
| NVIDIA GeForce GTX 1080 Ti (Desktop) | |
| NVIDIA GeForce RTX 2080 (Desktop) | |
| AMD Radeon VII | |
| NVIDIA GeForce RTX 2070 (Desktop) | |
| NVIDIA GeForce GTX 1080 (Desktop) | |
| NVIDIA GeForce GTX 1080 (Desktop) | |
| NVIDIA GeForce RTX 2060 (Desktop) | |
| NVIDIA GeForce GTX 1070 (Desktop) | |
| AMD Radeon RX 590 (Desktop) | |
| Hitman 2 | |
| 1920x1080 Ultra AF:16x | |
| AMD Radeon VII | |
| NVIDIA GeForce RTX 2060 (Desktop) | |
| NVIDIA GeForce RTX 2080 (Desktop) | |
| AMD Radeon RX Vega 64 | |
| NVIDIA GeForce RTX 2070 (Desktop) | |
| NVIDIA Titan RTX | |
| AMD Radeon RX 590 (Desktop) | |
| NVIDIA GeForce GTX 1060 (Desktop) | |
| NVIDIA Titan X Pascal | |
| 3840x2160 Ultra AF:16x | |
| NVIDIA Titan RTX | |
| NVIDIA GeForce RTX 2080 (Desktop) | |
| AMD Radeon VII | |
| NVIDIA Titan X Pascal | |
| AMD Radeon RX Vega 64 | |
| NVIDIA GeForce RTX 2070 (Desktop) | |
| NVIDIA GeForce RTX 2060 (Desktop) | |
| AMD Radeon RX 590 (Desktop) | |
| NVIDIA GeForce GTX 1060 (Desktop) | |
| Battlefield V | |
| 1920x1080 Ultra Preset | |
| NVIDIA Titan RTX | |
| NVIDIA GeForce RTX 2080 (Desktop) | |
| AMD Radeon RX Vega 64 | |
| NVIDIA Titan X Pascal | |
| AMD Radeon VII | |
| NVIDIA GeForce RTX 2070 (Desktop) | |
| NVIDIA GeForce RTX 2060 (Desktop) | |
| AMD Radeon RX 590 (Desktop) | |
| 3840x2160 Ultra Preset | |
| NVIDIA Titan RTX | |
| NVIDIA GeForce RTX 2080 (Desktop) | |
| AMD Radeon VII | |
| NVIDIA Titan X Pascal | |
| NVIDIA GeForce RTX 2070 (Desktop) | |
| AMD Radeon RX Vega 64 | |
| NVIDIA GeForce RTX 2060 (Desktop) | |
| AMD Radeon RX 590 (Desktop) | |
| Farming Simulator 19 | |
| 1920x1080 Very High Preset | |
| NVIDIA Titan RTX | |
| NVIDIA GeForce RTX 2080 (Desktop) | |
| NVIDIA GeForce RTX 2060 (Desktop) | |
| NVIDIA GeForce RTX 2070 (Desktop) | |
| AMD Radeon VII | |
| AMD Radeon RX Vega 64 | |
| NVIDIA Titan X Pascal | |
| AMD Radeon RX 590 (Desktop) | |
| 3840x2160 Very High Preset | |
| NVIDIA Titan RTX | |
| NVIDIA Titan X Pascal | |
| NVIDIA GeForce RTX 2080 (Desktop) | |
| NVIDIA GeForce RTX 2070 (Desktop) | |
| NVIDIA GeForce RTX 2060 (Desktop) | |
| AMD Radeon VII | |
| AMD Radeon RX Vega 64 | |
| AMD Radeon RX 590 (Desktop) | |
| Darksiders III | |
| 1920x1080 Epic | |
| NVIDIA Titan RTX | |
| NVIDIA GeForce RTX 2080 (Desktop) | |
| NVIDIA GeForce RTX 2070 (Desktop) | |
| AMD Radeon VII | |
| NVIDIA GeForce RTX 2060 (Desktop) | |
| NVIDIA Titan X Pascal | |
| AMD Radeon RX Vega 64 | |
| AMD Radeon RX 590 (Desktop) | |
| 3840x2160 Epic | |
| NVIDIA Titan RTX | |
| NVIDIA GeForce RTX 2080 (Desktop) | |
| NVIDIA Titan X Pascal | |
| NVIDIA GeForce RTX 2070 (Desktop) | |
| AMD Radeon VII | |
| AMD Radeon RX Vega 64 | |
| NVIDIA GeForce RTX 2060 (Desktop) | |
| AMD Radeon RX 590 (Desktop) | |
| Just Cause 4 | |
| 1920x1080 Very High / On AA:SM AF:16x | |
| NVIDIA Titan RTX | |
| NVIDIA GeForce RTX 2080 (Desktop) | |
| NVIDIA Titan X Pascal | |
| NVIDIA GeForce RTX 2070 (Desktop) | |
| AMD Radeon VII | |
| NVIDIA GeForce RTX 2060 (Desktop) | |
| AMD Radeon RX Vega 64 | |
| AMD Radeon RX 590 (Desktop) | |
| 3840x2160 Very High / On AA:SM AF:16x | |
| NVIDIA Titan RTX | |
| NVIDIA GeForce RTX 2080 (Desktop) | |
| NVIDIA Titan X Pascal | |
| AMD Radeon VII | |
| NVIDIA GeForce RTX 2070 (Desktop) | |
| NVIDIA GeForce RTX 2060 (Desktop) | |
| AMD Radeon RX Vega 64 | |
| AMD Radeon RX 590 (Desktop) | |
| Apex Legends | |
| 1920x1080 Maximum Settings AA:TS AF:16x | |
| NVIDIA GeForce RTX 2070 (Desktop) | |
| NVIDIA GeForce RTX 2080 (Desktop) | |
| NVIDIA GeForce RTX 2060 (Desktop) | |
| AMD Radeon RX Vega 64 | |
| AMD Radeon RX 590 (Desktop) | |
| 3840x2160 Maximum Settings AA:TS AF:16x | |
| NVIDIA GeForce RTX 2080 (Desktop) | |
| NVIDIA GeForce RTX 2070 (Desktop) | |
| AMD Radeon RX Vega 64 | |
| NVIDIA GeForce RTX 2060 (Desktop) | |
| AMD Radeon RX 590 (Desktop) | |
| Far Cry New Dawn | |
| 1920x1080 Ultra Preset | |
| NVIDIA GeForce RTX 2080 (Desktop) | |
| NVIDIA GeForce RTX 2070 (Desktop) | |
| NVIDIA GeForce RTX 2060 (Desktop) | |
| AMD Radeon RX Vega 64 | |
| AMD Radeon VII | |
| AMD Radeon RX 590 (Desktop) | |
| 3840x2160 Ultra Preset | |
| NVIDIA GeForce RTX 2080 (Desktop) | |
| AMD Radeon VII | |
| NVIDIA GeForce RTX 2070 (Desktop) | |
| AMD Radeon RX Vega 64 | |
| NVIDIA GeForce RTX 2060 (Desktop) | |
| AMD Radeon RX 590 (Desktop) | |
| Metro Exodus | |
| 1920x1080 Ultra Quality AF:16x | |
| NVIDIA GeForce RTX 2080 (Desktop) | |
| AMD Radeon VII | |
| NVIDIA GeForce RTX 2070 (Desktop) | |
| AMD Radeon RX Vega 64 | |
| NVIDIA GeForce RTX 2060 (Desktop) | |
| AMD Radeon RX 590 (Desktop) | |
| 3840x2160 Ultra Quality AF:16x | |
| AMD Radeon RX Vega 64 | |
| NVIDIA GeForce RTX 2080 (Desktop) | |
| AMD Radeon VII | |
| NVIDIA GeForce RTX 2070 (Desktop) | |
| NVIDIA GeForce RTX 2060 (Desktop) | |
| AMD Radeon RX 590 (Desktop) | |
| Anthem - 1920x1080 Ultra Preset | |
| NVIDIA GeForce RTX 2080 (Desktop) | |
| AMD Radeon RX Vega 64 | |
| NVIDIA GeForce RTX 2070 (Desktop) | |
| AMD Radeon VII | |
| NVIDIA GeForce RTX 2060 (Desktop) | |
| AMD Radeon RX 590 (Desktop) | |
| Dirt Rally 2.0 | |
| 1920x1080 Ultra Preset AA:T AF:16x | |
| NVIDIA GeForce RTX 2080 (Desktop) | |
| AMD Radeon VII | |
| NVIDIA GeForce RTX 2070 (Desktop) | |
| AMD Radeon RX Vega 64 | |
| NVIDIA GeForce RTX 2060 (Desktop) | |
| AMD Radeon RX 590 (Desktop) | |
| 3840x2160 Ultra Preset AA:T AF:16x | |
| NVIDIA GeForce RTX 2080 (Desktop) | |
| AMD Radeon VII | |
| NVIDIA GeForce RTX 2070 (Desktop) | |
| AMD Radeon RX Vega 64 | |
| NVIDIA GeForce RTX 2060 (Desktop) | |
| AMD Radeon RX 590 (Desktop) | |
| low | med. | high | ultra | QHD | 4K | |
|---|---|---|---|---|---|---|
| Battlefield 4 (2013) | 200 | 200 | 200 | 195.7 | 102.3 | |
| GTA V (2015) | 166.6 | 153.8 | 135.3 | 107.5 | 79.9 | |
| The Witcher 3 (2015) | 297.2 | 237.9 | 164.3 | 89.9 | 64.3 | |
| Rainbow Six Siege (2015) | 316.6 | 265 | 251.5 | 240.8 | 115.8 | |
| Rise of the Tomb Raider (2016) | 262 | 191.4 | 156.6 | 130.9 | 58.1 | |
| Far Cry Primal (2016) | 124 | 111 | 101 | 94 | 59 | |
| The Division (2016) | 253.6 | 213.4 | 134 | 113.2 | 58.6 | |
| Doom (2016) | 158.5 | 145 | 133 | 139.6 | 91.1 | |
| Overwatch (2016) | 299 | 299 | 216.8 | 205 | 168.1 | |
| Deus Ex Mankind Divided (2016) | 153.2 | 145 | 117 | 70.3 | 44.7 | |
| Battlefield 1 (2016) | 170.9 | 156.9 | 143.6 | 141.3 | 75.7 | |
| Watch Dogs 2 (2016) | 138.7 | 123.4 | 106.2 | 76 | 45.9 | |
| For Honor (2017) | 278.6 | 190.3 | 181.9 | 141.6 | 63.2 | |
| Ghost Recon Wildlands (2017) | 159.6 | 117 | 110 | 64.1 | 45.8 | |
| Rocket League (2017) | 248.4 | 249.5 | 240.1 | 127.9 | ||
| Dirt 4 (2017) | 310.7 | 243.4 | 208.5 | 131.8 | 78.6 | |
| Playerunknown's Battlegrounds (PUBG) (2017) | 270.6 | 211.2 | 209.8 | 147 | 60.6 | |
| Destiny 2 (2017) | 155.1 | 152.2 | 150.7 | 150 | 109.9 | 59.1 |
| Assassin´s Creed Origins (2017) | 113 | 102 | 98 | 83 | 71 | 46 |
| Call of Duty WWII (2017) | 248.8 | 249.9 | 164 | 144.6 | 118.9 | 73.2 |
| Fortnite (2018) | 179.1 | 145.2 | 161.5 | 135.6 | 100.2 | 53.2 |
| Final Fantasy XV Benchmark (2018) | 151.6 | 112.3 | 83.5 | 38.2 | ||
| Kingdom Come: Deliverance (2018) | 142.6 | 123.8 | 100.2 | 77.9 | 58 | 30.7 |
| Far Cry 5 (2018) | 127 | 114 | 109 | 103 | 88 | 48 |
| The Crew 2 (2018) | 60 | 60 | 60 | 60 | 60 | 42.4 |
| Monster Hunter World (2018) | 137 | 127.2 | 124.2 | 97.7 | 65.5 | 32.3 |
| F1 2018 (2018) | 223 | 207 | 163 | 127 | 101 | 65 |
| Shadow of the Tomb Raider (2018) | 136 | 114 | 110 | 104 | 74 | 40 |
| FIFA 19 (2018) | 274.7 | 246 | 227.3 | 218.4 | 210.5 | 174 |
| Forza Horizon 4 (2018) | 169 | 140 | 137 | 113 | 93 | 65 |
| Assassin´s Creed Odyssey (2018) | 111 | 101 | 85 | 64 | 53 | 36 |
| Call of Duty Black Ops 4 (2018) | 212.9 | 164.1 | 159.6 | 153 | 104.7 | 47.4 |
| Hitman 2 (2018) | 87.6 | 88.6 | 76.3 | 77.9 | 75.8 | 47.3 |
| Fallout 76 (2018) | 58.2 | 60 | 60 | 60 | 60 | 60 |
| Battlefield V (2018) | 162.3 | 142.1 | 138 | 126.8 | 103.1 | 62.6 |
| Farming Simulator 19 (2018) | 186 | 151.6 | 133.1 | 120.7 | 118.4 | 72 |
| Darksiders III (2018) | 226.8 | 141.6 | 130.5 | 121.1 | 89 | 45.9 |
| Just Cause 4 (2018) | 192.7 | 146.6 | 111.8 | 105.5 | 75.4 | 43.2 |
| Apex Legends (2019) | 144 | 144 | 144 | 144 | 138 | 80 |
| Far Cry New Dawn (2019) | 117 | 103 | 99 | 90 | 82 | 51 |
| Metro Exodus (2019) | 130.4 | 96.9 | 73.7 | 60.4 | 50.3 | 31.9 |
| Anthem (2019) | 104.6 | 98.1 | 96 | 91 | 77.1 | 44.9 |
| Dirt Rally 2.0 (2019) | 212.6 | 156 | 147 | 93.2 | 73.8 | 45.9 |
| The Division 2 (2019) | 169 | 137 | 115 | 95 | 69 | 40 |
| Anno 1800 (2019) | 85 | 85 | 71 | 40.6 | 37.8 | 25.5 |
| Rage 2 (2019) | 234 | 126 | 110 | 109 | 71 | 35.7 |
Compute Performance
In terms of compute performance, the MSI RTX 2070 Gaming Z 8G is also on the same level as the Asus ROG RTX Strix 2070 OC, even if the Asus model often managed to take first place. There was no noticeable performance difference between the two cards.
In the Luxmark Test there was a clear advantage to the Turing GPUs compared to the Pascal generation. Even with the GeForce GTX 1080 Ti, whilst faster in games, it came in well behind our test sample. In Computemark the old hierarchy was re-established and the RTX 2070 found itself again well behind the GTX 1080 Ti. AMD was in the mix also with the Radeon VII, which was able to in some cases beat out the Nvidia Titan RTX. The performance of the Radeon VII however was not consistent, being also beaten occasionally by the MSI RTX 2070 Gaming Z 8G.
The MSI RTX 2080 Gaming X trio are able to achieve a performance advantage of up to 30 percent over the MSI RTX 2070 Gaming Z 8G.
| SiSoft Sandra 2016 | |
| Image Processing | |
| AMD Radeon VII | |
| NVIDIA GeForce RTX 2080 (Desktop) | |
| NVIDIA GeForce RTX 2070 (Desktop) | |
| NVIDIA GeForce RTX 2060 (Desktop) | |
| GP Cryptography (Higher Security AES256+SHA2-512) | |
| NVIDIA GeForce RTX 2080 (Desktop) | |
| AMD Radeon VII | |
| NVIDIA GeForce RTX 2070 (Desktop) | |
| NVIDIA GeForce RTX 2060 (Desktop) | |
| GP Financial Analysis (FP High/Double Precision) | |
| AMD Radeon VII | |
| NVIDIA GeForce RTX 2080 (Desktop) | |
| NVIDIA GeForce RTX 2070 (Desktop) | |
| NVIDIA GeForce RTX 2060 (Desktop) | |
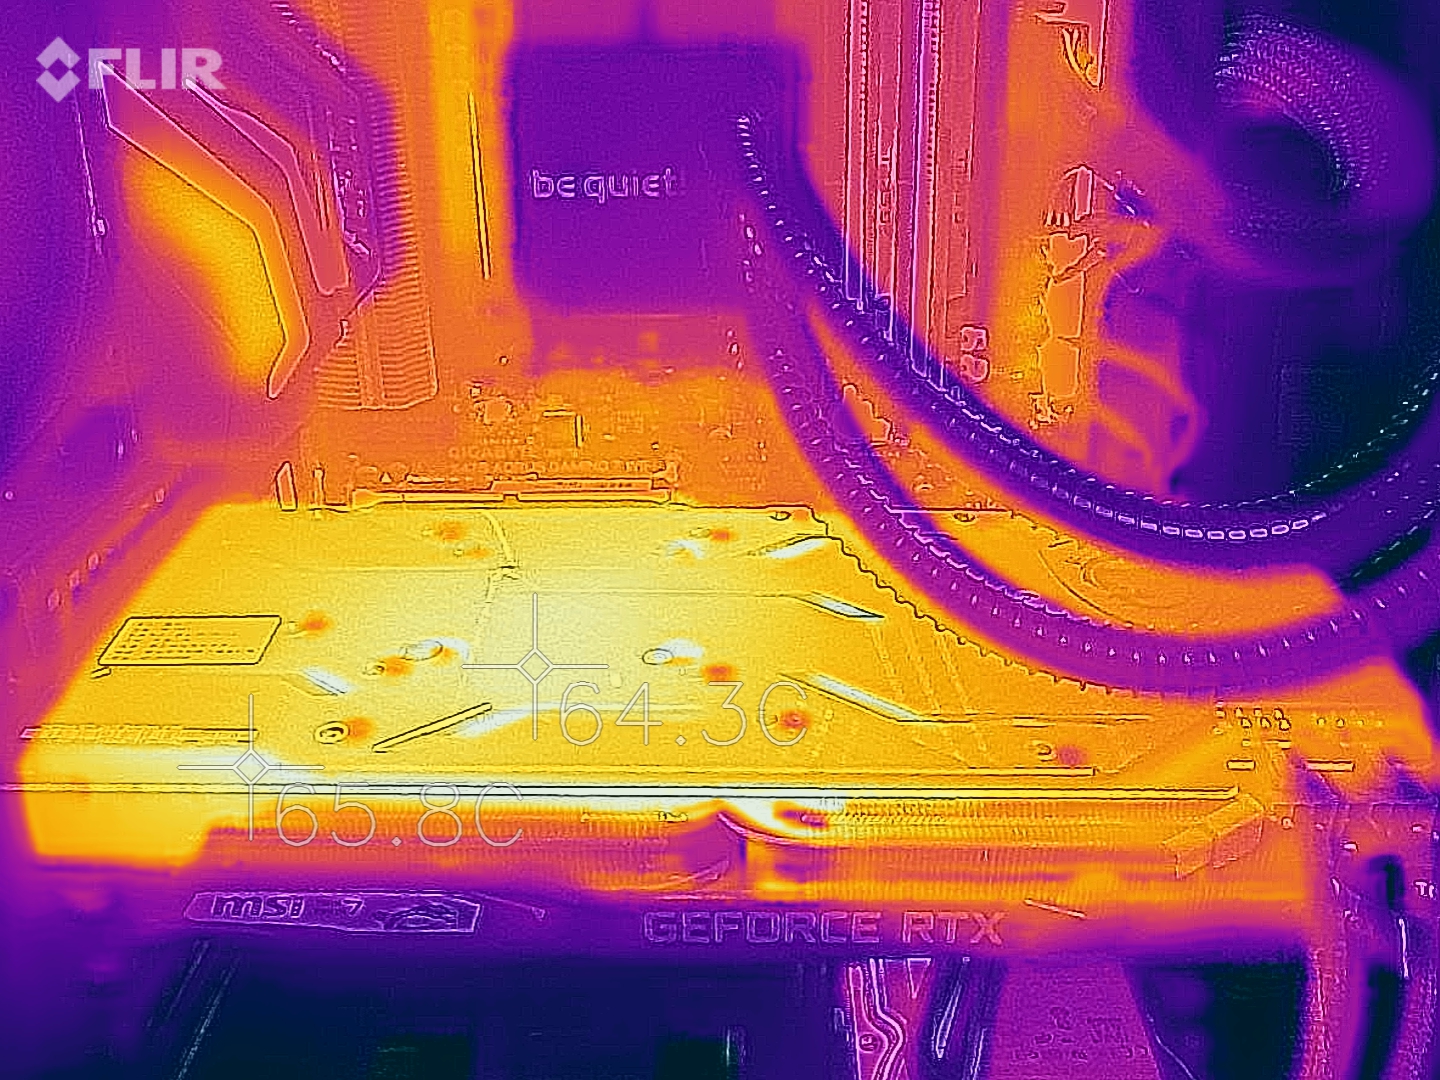
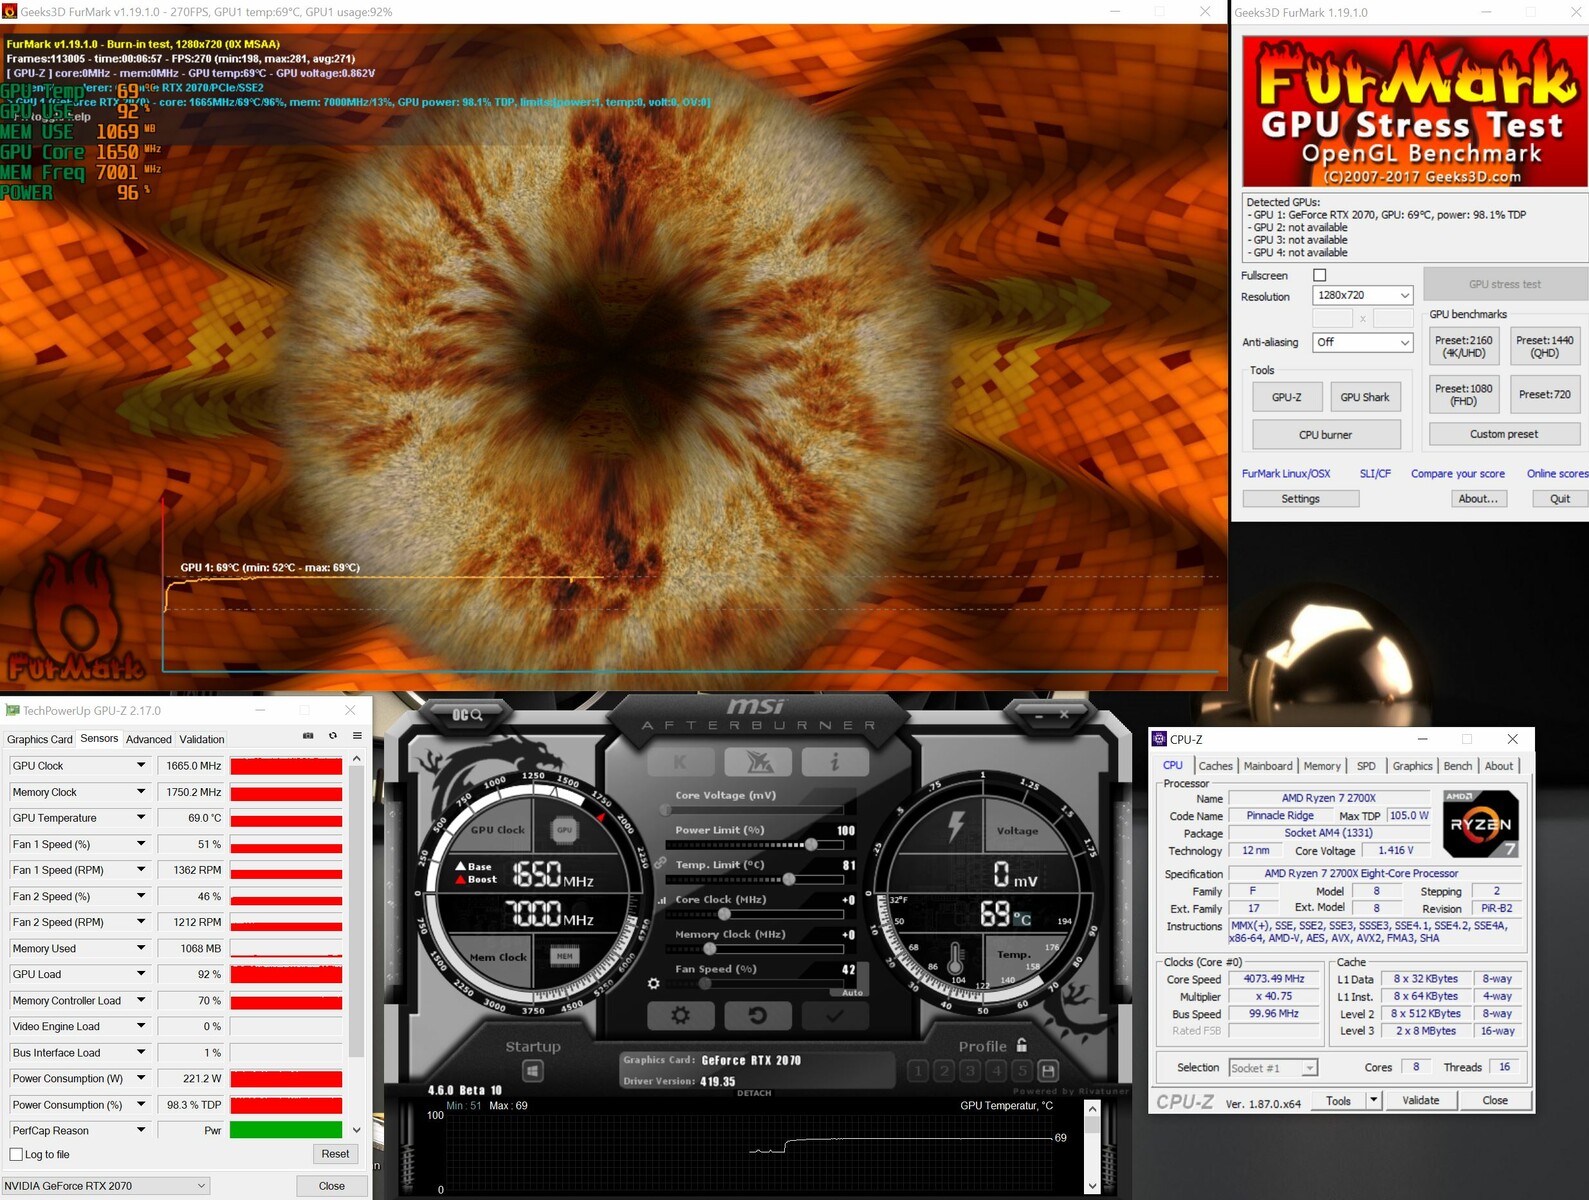
Noise and Heat - MSI RTX 2070 Gaming Z 8G
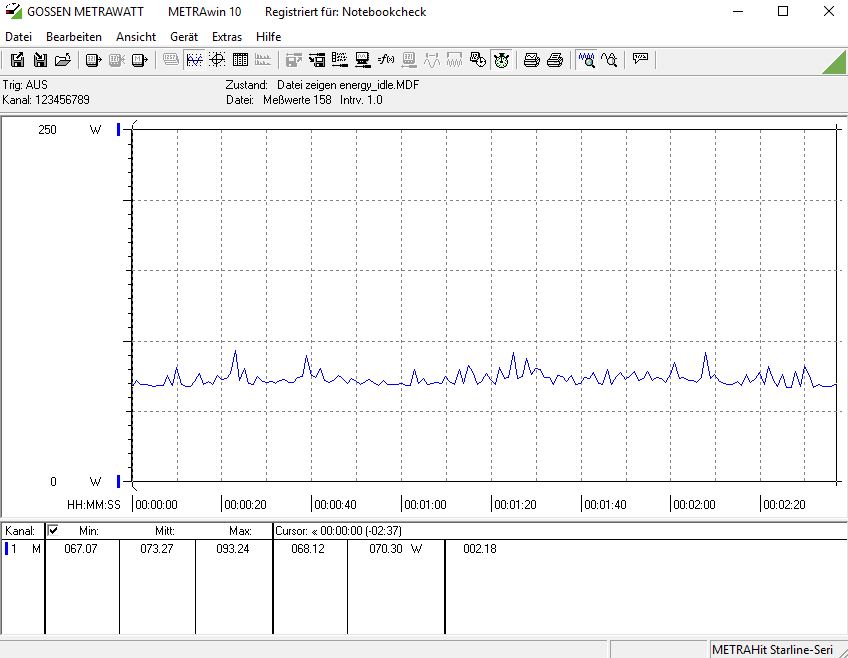
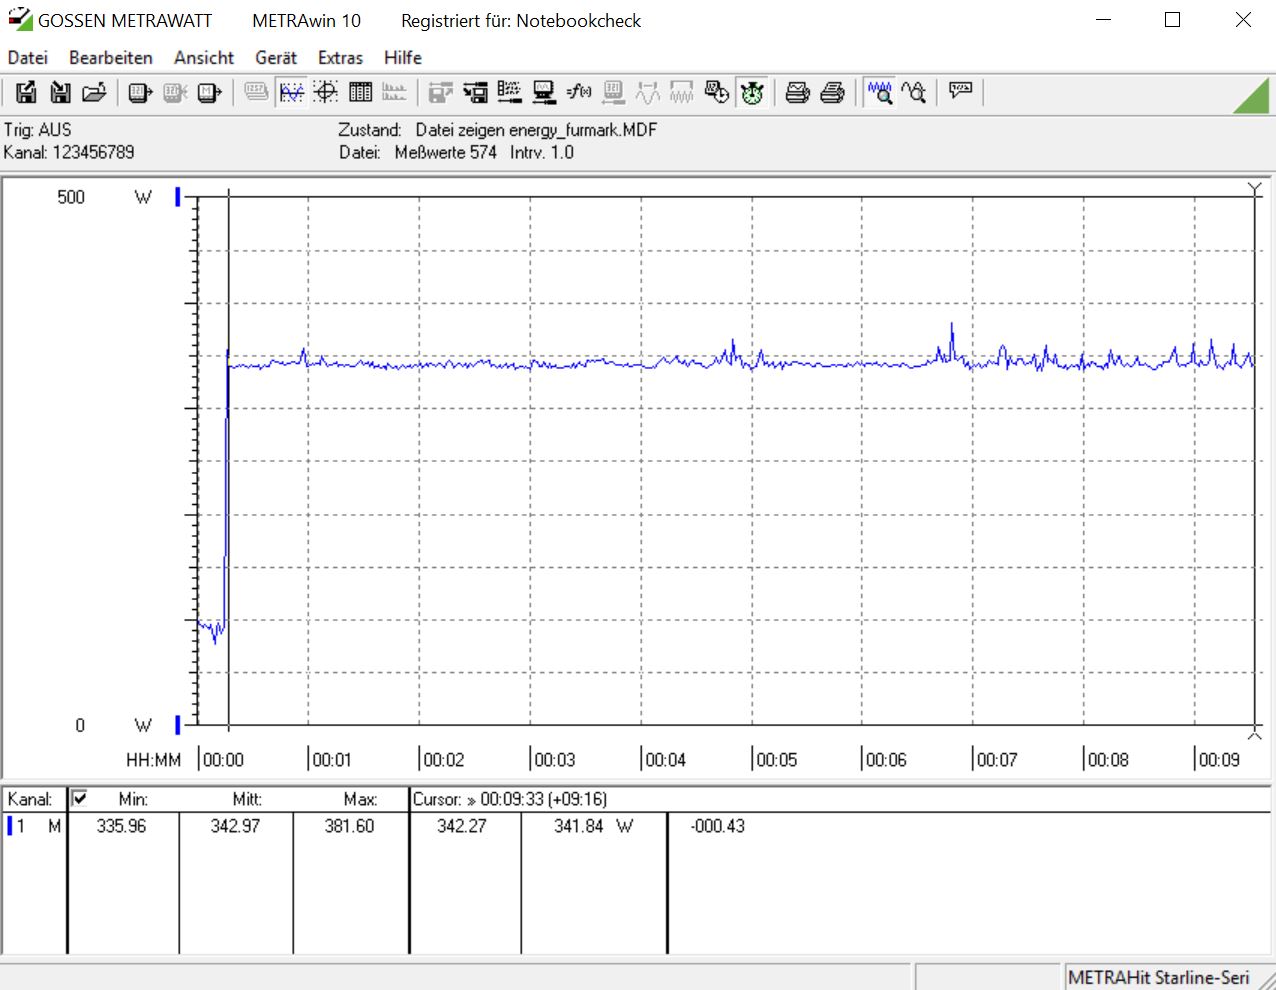
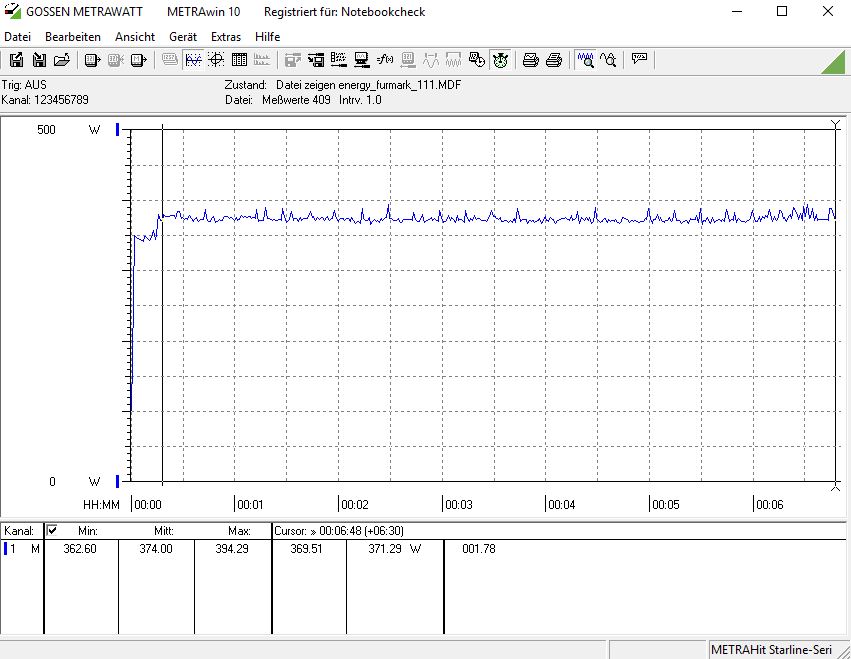
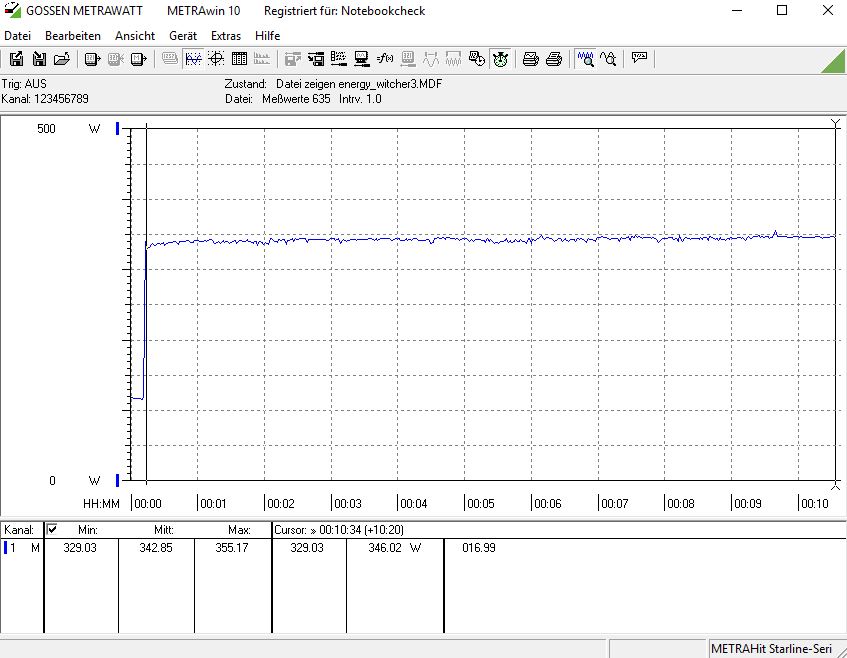
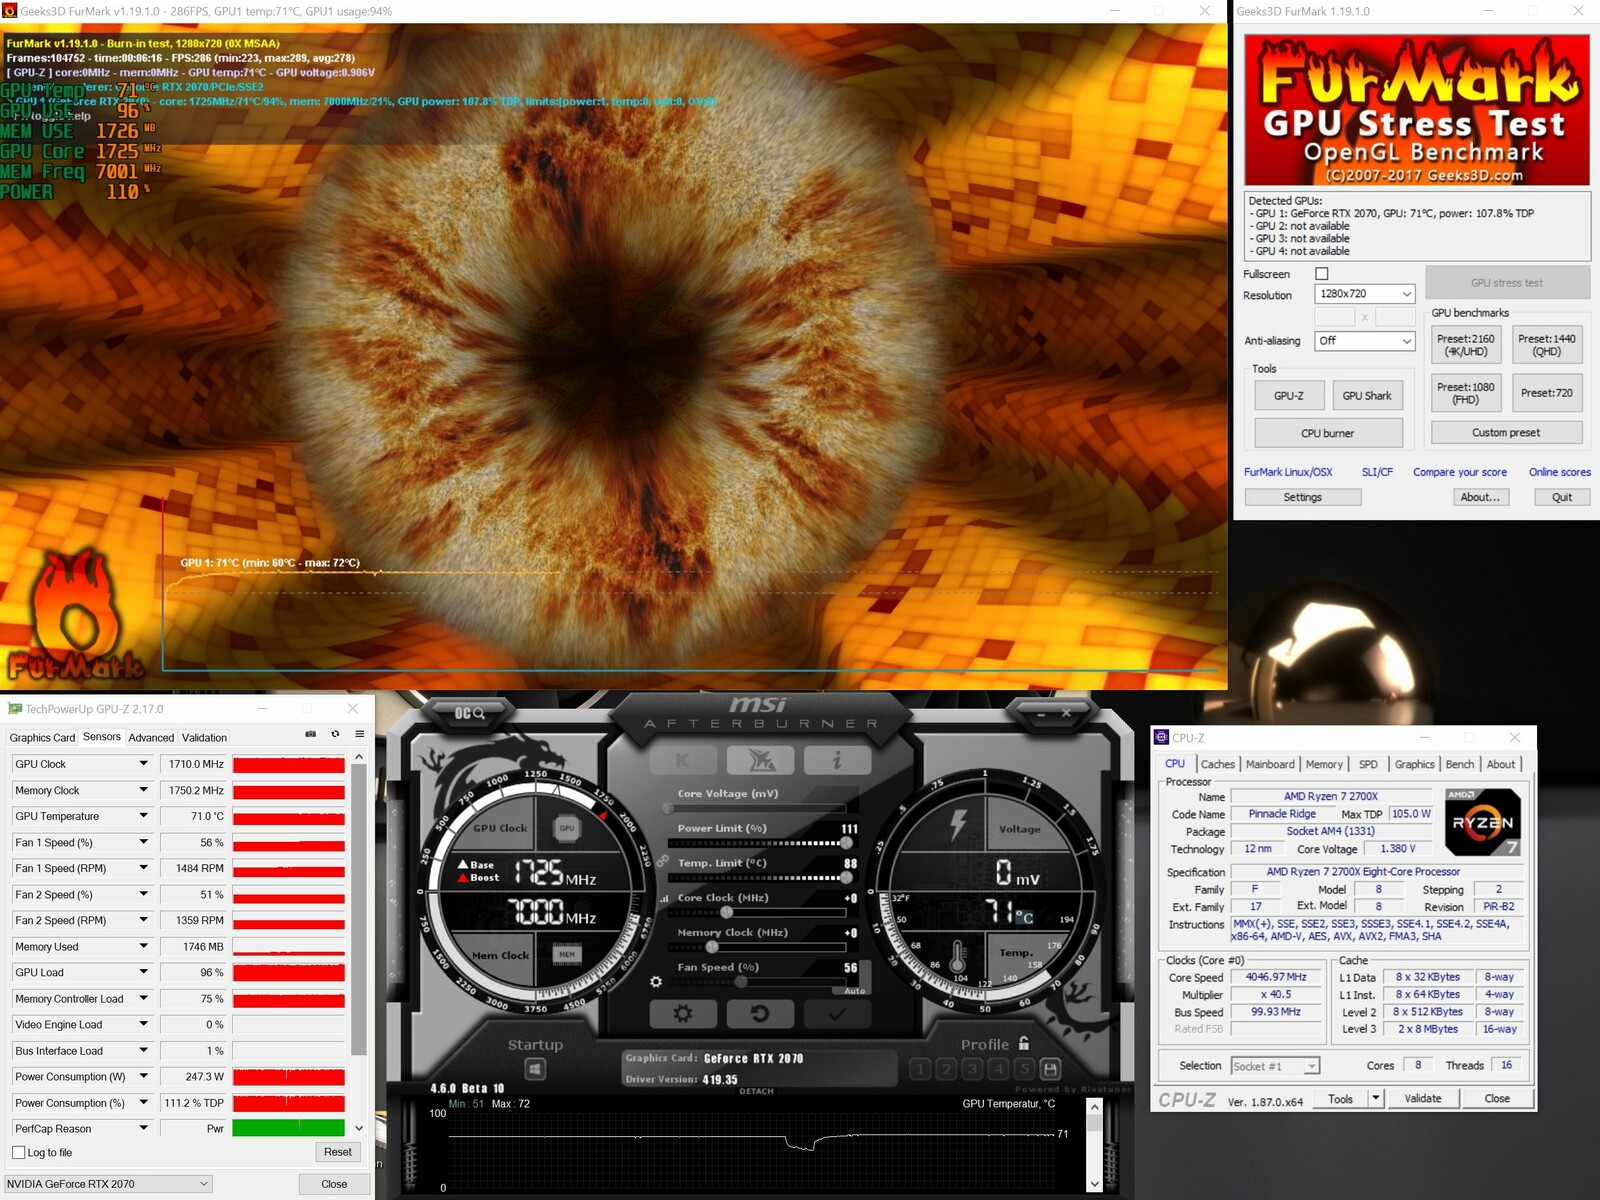
In terms of noise and heat levels, the MSI RTX 2070 Gaming Z 8G are, compared with other cards of the same level, very good. At idle, the test system was drawing 72 watts - exactly the same as the MSI RTX 2060 Gaming Z 6G. Under load in our stress test the consumption climbed to 343 watts. If we increased the 'Power Target' to 111 percent, the power consumption increased accordingly to 374 watts. During gaming, we measured on our test system power consumption of 343 watts - during this test, PT was left at 100 percent.
Looking at the comparison table, it is clear that the MSI RTX 2070 Gaming Z 8G runs very efficiently. The same test system equipped with an AMD Radeon RX 590 consumes the same amount of power and delivers significantly lower performance. In the duel against the AMD Radeon VII, the MSI RTX 2070 Gaming Z 8G lost only narrowly. An Nvidia GeForce RTX 2070 Founder's Edition should draw around 40 watts due to its lower TDP rating.
The temperatures of the MSI RTX 2070 Gaming Z 8G are somewhat higher when compared to the MSI RTX 2060 Gaming Z 6G, however at 69 °C (156.2 °F) under load, the temperature target (81 °C/177.8 °F) is still some distance away. Raising the PT to 111 percent resulted in a temperature increase of 2 °C (~3.6 °F), however, the large cooler did not seem fazed. The two fans spin at almost 1,500 rpm, which is approximately 56 percent of maximum speed. At these speeds, the noise levels were comfortably quiet. The card cannot be described as silent under load, however, the sound generated is not intrusive.
| Power Consumption - 1920x1080 The Witcher 3 ultra (external Monitor) | |
| Nvidia Titan RTX | |
| AMD Radeon RX Vega 64 (Idle: 74.3 W) | |
| MSI RTX 2080 Gaming X Trio (Idle: 87.78 W) | |
| Nvidia GeForce GTX 1080 Ti Founders Edition (88 fps, Idle: 70.3 W) | |
| XFX AMD Radeon RX 590 OC+ 8 GB | |
| MSI RTX 2070 Gaming Z 8G (Idle: 73.3 W) | |
| AMD Radeon VII (Idle: 81.39 W) | |
| Asus ROG Strix RTX 2070 OC | |
| Nvidia GeForce GTX 1080 Founders Edition (Idle: 68.3 W) | |
| MSI RTX 2060 Gaming Z 6G (Idle: 74.66 W) | |
| Nvidia GeForce GTX 1070 Founders Edition (Idle: 68 W) | |
* ... smaller is better
Overclocking - More Performance via Manual OC
Although the MSI RTX 2070 Gaming Z 8G already possesses a higher boost clock, we attempted to wring more performance out of the card. By manually raising the PT to 111 percent, the card was able to draw almost 250 watts (249.75 watts). With our sample, we were able to achieve a base clock increase of 120 Mhz. This resulted in a significantly higher boost clock, plus the VRAM also overclocked well with a 1,400 Mhz increase. The MSI RTX 2060 Gaming Z 6G was able to achieve similarly high results. With these settings, the card was problem-free and stable, and an increase of up to 15 percent, depending on game, was attained.
The large cooler offers sufficient surface area to account for the increased cooling requirements of the increased performance. With the maximum draw of 250 watts TDP there were no problems. Whether or not running this OC for a long period is sensible is for the individual to decide.

Pros
Cons
Verdict - Fast, Quiet and Efficient
600 Euros (~$674) - that is the going rate for anyone interested in an MSI RTX 2070 Gaming Z 8G. For this, customers do not receive an ordinary GeForce RTX 2070, but instead a card operating well above the manufacturer ratings. To achieve this, MSI have designed their own PCB and added their Twin-Frozr cooler to ensure temperatures are kept under control. RGB is of course a must at this price point, and MSI's Mystic-Light allows for easy integration in an existing MSI system.
With its 8GB of GDDR6 VRAM the MSI RTX 2070 Gaming Z 8G is more future-proof than the MSI RTX 2060 Gaming Z 6G, however it doesn't have an easy time of things in a performance comparison with modern games in UHD. Those who are not keen on lowering details and so resort to a lower resolution would also be well-served with an MSI RTX 2060 Gaming Z 6G. Of course, the MSI RTX 2070 Gaming Z 8G offers more performance - the figures speak for themselves - however it is not capable of 4K gaming without compromises.
With a higher TDP and a significantly higher boost than reference models, MSI is aiming to impress. The build quality and performance are good, however the price may shock.
As a result, it is going to be hard to find a target buyer market that is prepared to pay the premium given that cheaper models are available for less than 500 Euro (~$562). These do however only offer the standard TDP of 175 watts, same as the reference model from Nvidia. This means that their performance advantage margin over the MSI RTX 2060 Gaming Z 6G is significantly narrowed.
The direct duel between the Asus ROG RTX Strix 2070 OC and the MSI RTX 2070 Gaming Z 8G ended without a clear winner. Both cards are neck and neck in both the synthetic and in-game benchmarks. Even in terms of price, the cards are within spitting distance of each other. This means it is really down to individual taste in terms of which card to pick. Quite likely, the rest of the system will tip the scales one way or the other - if the buyer already has an MSI mainboard, they are more likely to decide on a GPU from the same manufacturer.
