|
|
Nvidia Titan RTX
Titan RTX, R7 2700X, ADATA Premier Pro SP900NS38 512 GB | |
MSI RTX 2080 Gaming X Trio
GeForce RTX 2080 (Desktop), R7 2700X | |
Nvidia GeForce RTX 2080 Super
GeForce RTX 2080 Super (Desktop), R7 2700X | |
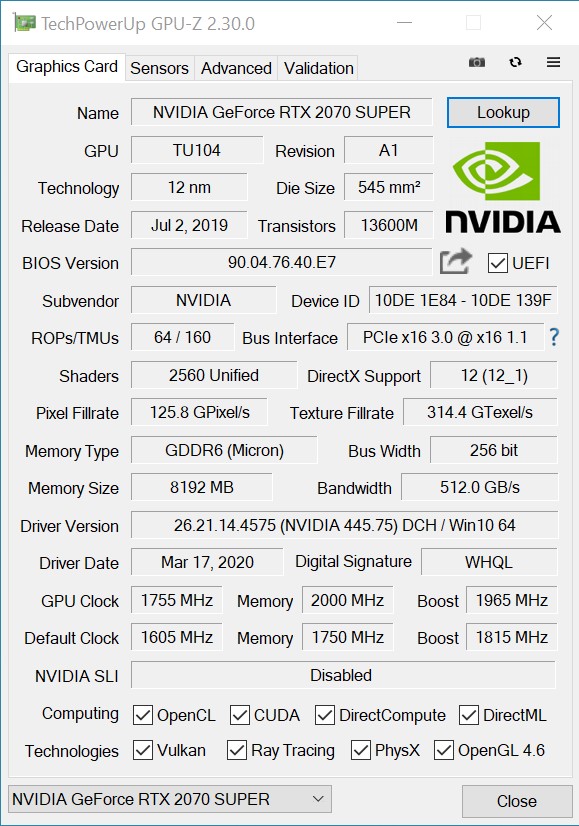
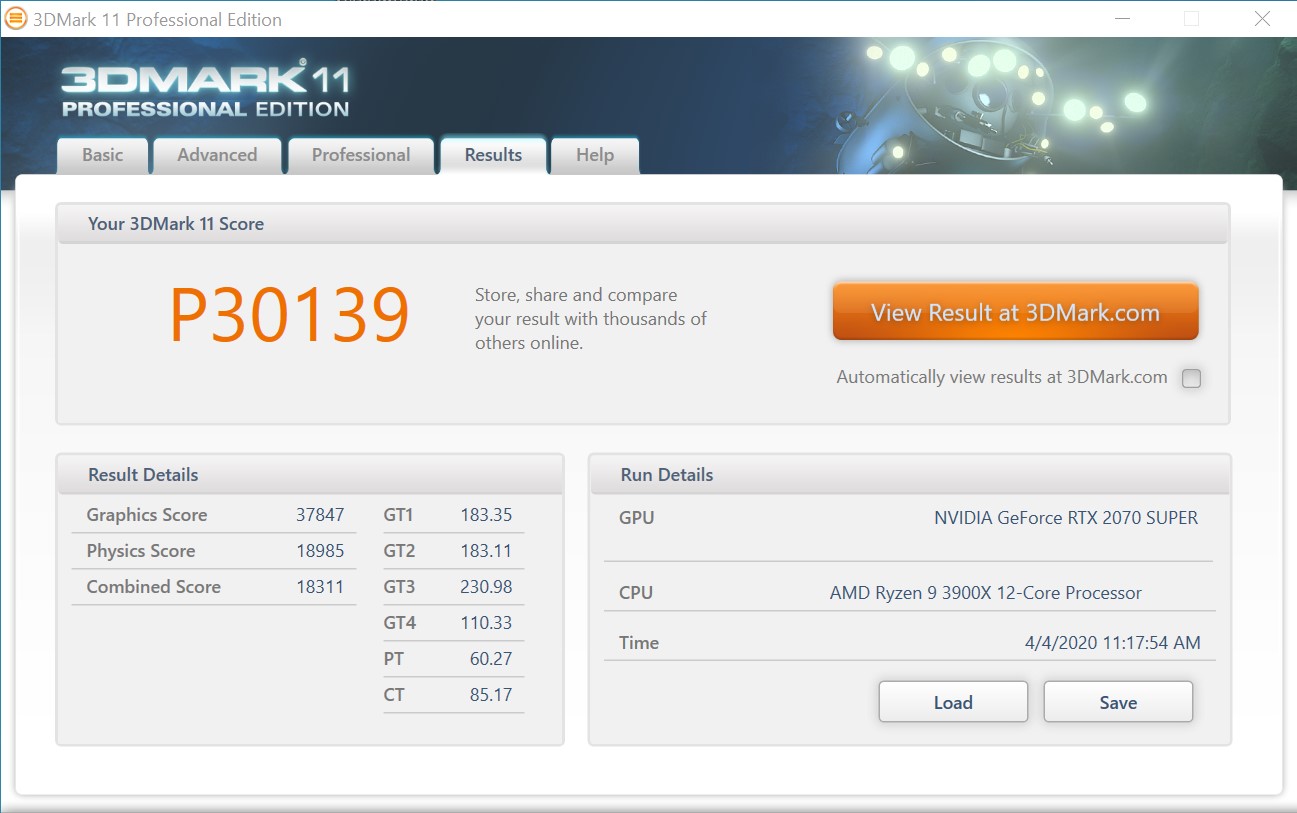
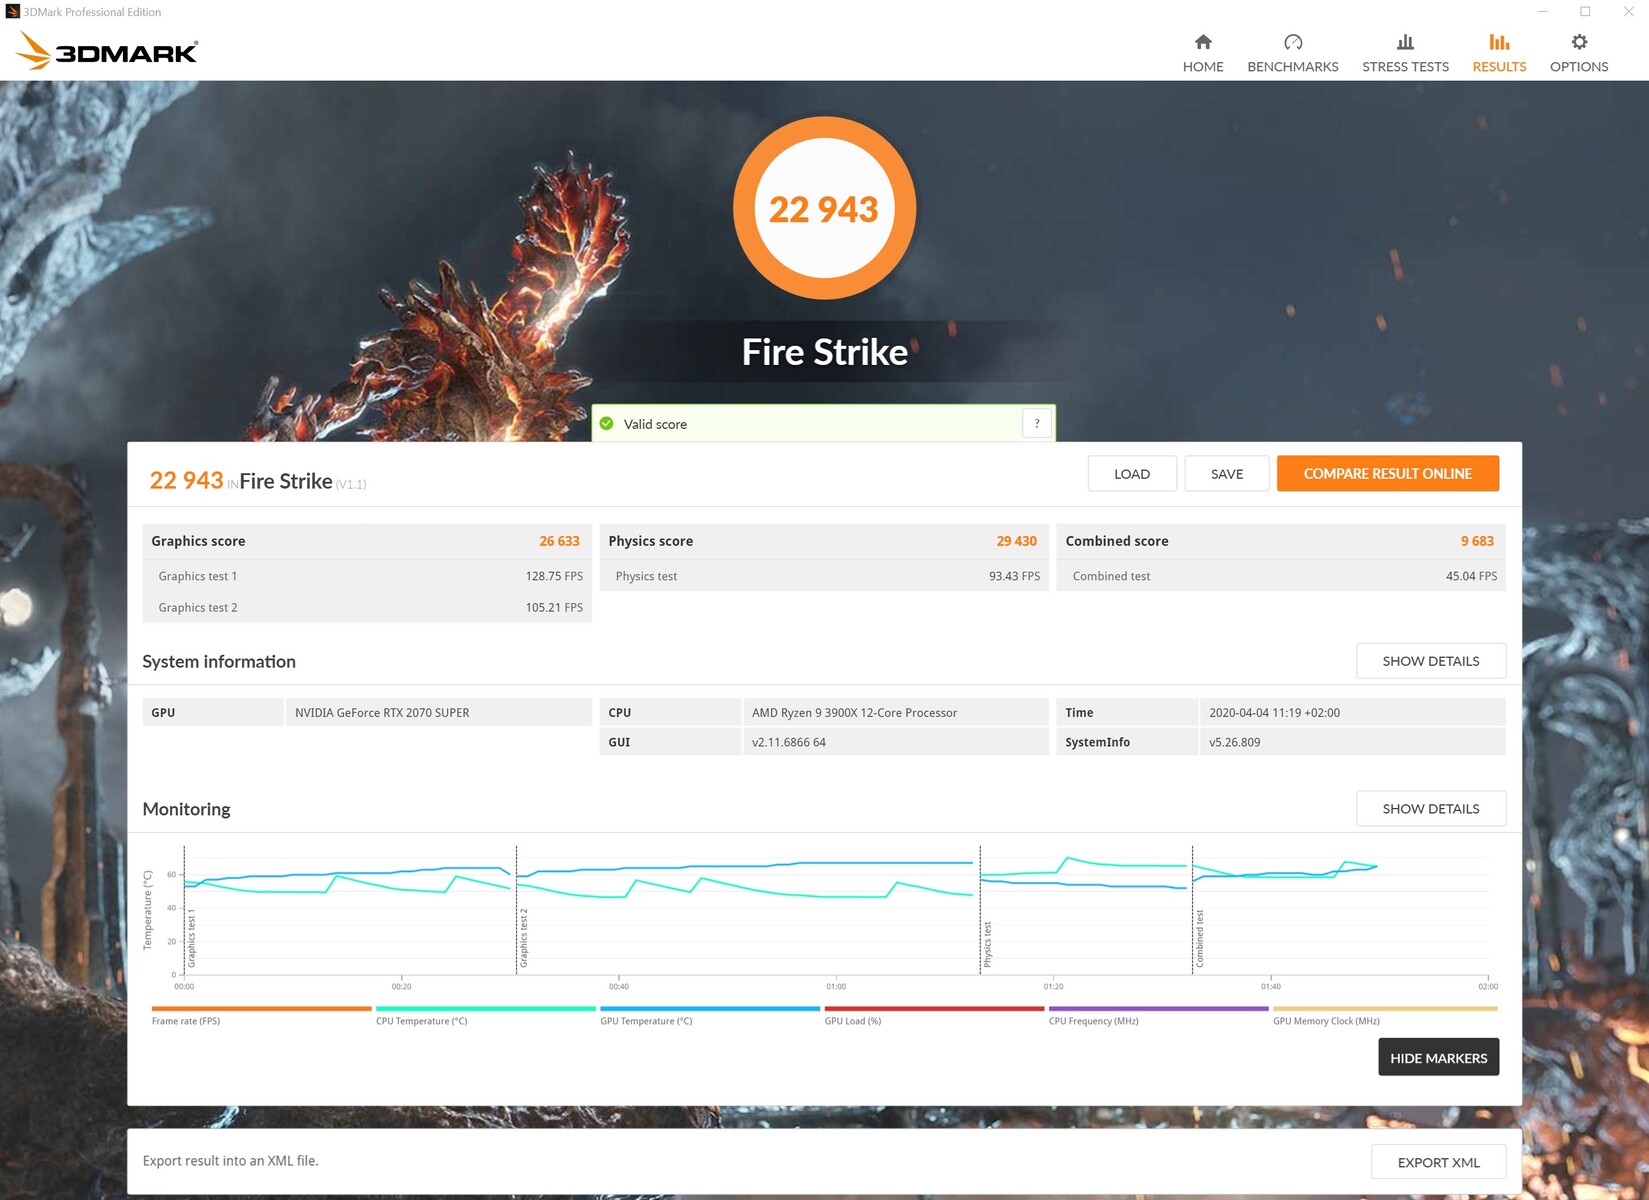
KFA2 GeForce RTX 2070 Super Work The Frames
GeForce RTX 2070 Super (Desktop), R9 3900X | |
MSI RTX 2070 Gaming Z 8G
GeForce RTX 2070 (Desktop), R7 2700X |
64 (30min - 111max) fps -3% |
Nvidia GeForce RTX 2070 Super
GeForce RTX 2070 Super (Desktop), R7 2700X | |
AMD Radeon VII
Radeon VII, R7 2700X | |
AMD Radeon RX 5700 XT
Radeon RX 5700 XT (Desktop), R7 2700X | |
Nvidia GeForce RTX 2060 Super
GeForce RTX 2060 Super (Desktop), R7 2700X | |
AMD Radeon RX 5700
Radeon RX 5700 (Desktop), R7 2700X | |
MSI RTX 2060 Gaming Z 6G
GeForce RTX 2060 (Desktop), R7 2700X | |
AMD Radeon RX Vega 64
RX Vega 64, R7 2700X |
50 (25min - 75max) fps -24% |
|
Nvidia Titan RTX
Titan RTX, R7 2700X, ADATA Premier Pro SP900NS38 512 GB | |
AMD Radeon VII
Radeon VII, R7 2700X | |
MSI RTX 2080 Gaming X Trio
GeForce RTX 2080 (Desktop), R7 2700X | |
Nvidia GeForce RTX 2080 Super
GeForce RTX 2080 Super (Desktop), R7 2700X | |
Nvidia GeForce RTX 2070 Super
GeForce RTX 2070 Super (Desktop), R7 2700X | |
KFA2 GeForce RTX 2070 Super Work The Frames
GeForce RTX 2070 Super (Desktop), R9 3900X | |
MSI RTX 2070 Gaming Z 8G
GeForce RTX 2070 (Desktop), R7 2700X |
36 (25min - 63max) fps -5% |
AMD Radeon RX 5700 XT
Radeon RX 5700 XT (Desktop), R7 2700X | |
Nvidia GeForce RTX 2060 Super
GeForce RTX 2060 Super (Desktop), R7 2700X | |
AMD Radeon RX 5700
Radeon RX 5700 (Desktop), R7 2700X | |
AMD Radeon RX Vega 64
RX Vega 64, R7 2700X |
29 (5min - 64max) fps -24% |
MSI RTX 2060 Gaming Z 6G
GeForce RTX 2060 (Desktop), R7 2700X | |
|
MSI RTX 2080 Gaming X Trio
GeForce RTX 2080 (Desktop), R7 2700X | |
Nvidia GeForce RTX 2080 Super
GeForce RTX 2080 Super (Desktop), R7 2700X | |
KFA2 GeForce RTX 2070 Super Work The Frames
GeForce RTX 2070 Super (Desktop), R9 3900X | |
Nvidia GeForce RTX 2070 Super
GeForce RTX 2070 Super (Desktop), R7 2700X | |
MSI RTX 2070 Gaming Z 8G
GeForce RTX 2070 (Desktop), R7 2700X |
53 (33min - 95max) fps -7% |
AMD Radeon RX 5700 XT
Radeon RX 5700 XT (Desktop), R7 2700X | |
Nvidia GeForce RTX 2060 Super
GeForce RTX 2060 Super (Desktop), R7 2700X | |
AMD Radeon RX 5700
Radeon RX 5700 (Desktop), R7 2700X | |
|
|
AMD Radeon RX Vega 64
RX Vega 64, R7 2700X |
287.8 (267min - 331max) fps |
AMD Radeon RX 5700 XT
Radeon RX 5700 XT (Desktop), R7 2700X |
276 (236min - 297max) fps |
AMD Radeon RX 5700
Radeon RX 5700 (Desktop), R7 2700X |
270 (253min - 295max) fps |
Nvidia GeForce RTX 2070 Super
GeForce RTX 2070 Super (Desktop), R7 2700X |
255 (237min - 267max) fps |
Nvidia GeForce RTX 2080 Super
GeForce RTX 2080 Super (Desktop), R7 2700X |
253 (237min - 270max) fps |
Nvidia Titan RTX
Titan RTX, R7 2700X, ADATA Premier Pro SP900NS38 512 GB |
251 (233min - 258max) fps |
MSI RTX 2080 Gaming X Trio
GeForce RTX 2080 (Desktop), R7 2700X |
228 (218min - 235max) fps |
AMD Radeon VII
Radeon VII, R7 2700X |
227 (225min - 229max) fps |
MSI RTX 2070 Gaming Z 8G
GeForce RTX 2070 (Desktop), R7 2700X |
218.4 (212min - 233max) fps |
Nvidia GeForce RTX 2060 Super
GeForce RTX 2060 Super (Desktop), R7 2700X |
216 (206min - 230max) fps |
MSI RTX 2060 Gaming Z 6G
GeForce RTX 2060 (Desktop), R7 2700X |
186.2 (176min - 203max) fps |
|
Nvidia Titan RTX
Titan RTX, R7 2700X, ADATA Premier Pro SP900NS38 512 GB |
213 (203min - 231max) fps |
AMD Radeon VII
Radeon VII, R7 2700X |
208 (198min - 217max) fps |
MSI RTX 2080 Gaming X Trio
GeForce RTX 2080 (Desktop), R7 2700X |
203 (196min - 219max) fps |
Nvidia GeForce RTX 2080 Super
GeForce RTX 2080 Super (Desktop), R7 2700X |
197 (184min - 208max) fps |
AMD Radeon RX 5700 XT
Radeon RX 5700 XT (Desktop), R7 2700X |
186 (171min - 206max) fps |
Nvidia GeForce RTX 2060 Super
GeForce RTX 2060 Super (Desktop), R7 2700X |
176 (170min - 187max) fps |
MSI RTX 2070 Gaming Z 8G
GeForce RTX 2070 (Desktop), R7 2700X |
174 (171min - 178max) fps |
Nvidia GeForce RTX 2070 Super
GeForce RTX 2070 Super (Desktop), R7 2700X |
172 (168min - 178max) fps |
AMD Radeon RX 5700
Radeon RX 5700 (Desktop), R7 2700X |
164 (149min - 180max) fps |
AMD Radeon RX Vega 64
RX Vega 64, R7 2700X |
161.4 (148min - 181max) fps |
MSI RTX 2060 Gaming Z 6G
GeForce RTX 2060 (Desktop), R7 2700X |
151.2 (146min - 155max) fps |
|
AMD Radeon RX 5700 XT
Radeon RX 5700 XT (Desktop), R7 2700X |
273 (254min - 300max) fps |
AMD Radeon RX 5700
Radeon RX 5700 (Desktop), R7 2700X |
267 (252min - 294max) fps |
Nvidia GeForce RTX 2070 Super
GeForce RTX 2070 Super (Desktop), R7 2700X |
255 (242min - 268max) fps |
Nvidia GeForce RTX 2080 Super
GeForce RTX 2080 Super (Desktop), R7 2700X |
249 (236min - 263max) fps |
MSI RTX 2080 Gaming X Trio
GeForce RTX 2080 (Desktop), R7 2700X |
212 (205min - 237max) fps |
Nvidia GeForce RTX 2060 Super
GeForce RTX 2060 Super (Desktop), R7 2700X |
211 (206min - 228max) fps |
MSI RTX 2070 Gaming Z 8G
GeForce RTX 2070 (Desktop), R7 2700X |
210.5 (190min - 234max) fps |
|
|
AMD Ryzen 9 3900X
Titan RTX, R9 3900X, Corsair MP600 | |
KFA2 GeForce RTX 2070 Super Work The Frames
GeForce RTX 2070 Super (Desktop), R9 3900X | |
AMD Radeon RX 5700 XT
Radeon RX 5700 XT (Desktop), R9 3900X | |
MSI RTX 2080 Gaming X Trio
GeForce RTX 2080 (Desktop), R7 2700X | |
AMD Radeon RX 5700 XT
Radeon RX 5700 XT (Desktop), R7 2700X | |
Nvidia GeForce RTX 2080 Super
GeForce RTX 2080 Super (Desktop), R7 2700X | |
Nvidia Titan RTX
Titan RTX, R7 2700X, ADATA Premier Pro SP900NS38 512 GB | |
AMD Radeon VII
Radeon VII, R7 2700X | |
Nvidia GeForce RTX 2070 Super
GeForce RTX 2070 Super (Desktop), R7 2700X | |
AMD Radeon RX Vega 64
RX Vega 64, R7 2700X | |
AMD Radeon RX 5700
Radeon RX 5700 (Desktop), R7 2700X | |
MSI RTX 2070 Gaming Z 8G
GeForce RTX 2070 (Desktop), R7 2700X | |
Nvidia GeForce RTX 2060 Super
GeForce RTX 2060 Super (Desktop), R7 2700X | |
MSI RTX 2060 Gaming Z 6G
GeForce RTX 2060 (Desktop), R7 2700X | |
|
AMD Ryzen 9 3900X
Titan RTX, R9 3900X, Corsair MP600 | |
Nvidia Titan RTX
Titan RTX, R7 2700X, ADATA Premier Pro SP900NS38 512 GB | |
KFA2 GeForce RTX 2070 Super Work The Frames
GeForce RTX 2070 Super (Desktop), R9 3900X | |
MSI RTX 2080 Gaming X Trio
GeForce RTX 2080 (Desktop), R7 2700X | |
Nvidia GeForce RTX 2080 Super
GeForce RTX 2080 Super (Desktop), R7 2700X | |
AMD Radeon RX 5700 XT
Radeon RX 5700 XT (Desktop), R7 2700X | |
AMD Radeon VII
Radeon VII, R7 2700X | |
Nvidia GeForce RTX 2070 Super
GeForce RTX 2070 Super (Desktop), R7 2700X | |
AMD Radeon RX 5700
Radeon RX 5700 (Desktop), R7 2700X | |
MSI RTX 2070 Gaming Z 8G
GeForce RTX 2070 (Desktop), R7 2700X | |
AMD Radeon RX Vega 64
RX Vega 64, R7 2700X | |
Nvidia GeForce RTX 2060 Super
GeForce RTX 2060 Super (Desktop), R7 2700X | |
MSI RTX 2060 Gaming Z 6G
GeForce RTX 2060 (Desktop), R7 2700X | |
|
AMD Ryzen 9 3900X
Titan RTX, R9 3900X, Corsair MP600 | |
KFA2 GeForce RTX 2070 Super Work The Frames
GeForce RTX 2070 Super (Desktop), R9 3900X | |
AMD Radeon RX 5700 XT
Radeon RX 5700 XT (Desktop), R7 2700X | |
MSI RTX 2080 Gaming X Trio
GeForce RTX 2080 (Desktop), R7 2700X | |
Nvidia GeForce RTX 2080 Super
GeForce RTX 2080 Super (Desktop), R7 2700X | |
Nvidia GeForce RTX 2070 Super
GeForce RTX 2070 Super (Desktop), R7 2700X | |
AMD Radeon RX 5700
Radeon RX 5700 (Desktop), R7 2700X | |
MSI RTX 2070 Gaming Z 8G
GeForce RTX 2070 (Desktop), R7 2700X | |
Nvidia GeForce RTX 2060 Super
GeForce RTX 2060 Super (Desktop), R7 2700X | |
|
|
Nvidia Titan RTX
Titan RTX, R7 2700X, ADATA Premier Pro SP900NS38 512 GB |
136 (95min - 157max) fps +28% |
MSI RTX 2080 Gaming X Trio
GeForce RTX 2080 (Desktop), R7 2700X |
115 (90min - 146max) fps +8% |
Nvidia GeForce RTX 2080 Super
GeForce RTX 2080 Super (Desktop), R7 2700X |
114 (83min - 136max) fps +8% |
Nvidia GeForce RTX 2070 Super
GeForce RTX 2070 Super (Desktop), R7 2700X |
108 (82min - 137max) fps +2% |
KFA2 GeForce RTX 2070 Super Work The Frames
GeForce RTX 2070 Super (Desktop), R9 3900X | |
MSI RTX 2070 Gaming Z 8G
GeForce RTX 2070 (Desktop), R7 2700X |
97.7 (75min - 117max) fps -8% |
AMD Radeon VII
Radeon VII, R7 2700X |
94 (75min - 119max) fps -11% |
Nvidia GeForce RTX 2060 Super
GeForce RTX 2060 Super (Desktop), R7 2700X |
93 (75min - 110max) fps -12% |
AMD Radeon RX 5700 XT
Radeon RX 5700 XT (Desktop), R7 2700X |
91 (76min - 109max) fps -14% |
MSI RTX 2060 Gaming Z 6G
GeForce RTX 2060 (Desktop), R7 2700X |
86 (67min - 105max) fps -19% |
AMD Radeon RX Vega 64
RX Vega 64, R7 2700X |
85.2 (61min - 109max) fps -20% |
AMD Radeon RX 5700
Radeon RX 5700 (Desktop), R7 2700X |
81 (68min - 99max) fps -24% |
|
Nvidia Titan RTX
Titan RTX, R7 2700X, ADATA Premier Pro SP900NS38 512 GB |
54 (46min - 64max) fps +51% |
MSI RTX 2080 Gaming X Trio
GeForce RTX 2080 (Desktop), R7 2700X |
38.6 (33min - 46max) fps +8% |
Nvidia GeForce RTX 2080 Super
GeForce RTX 2080 Super (Desktop), R7 2700X |
37.6 (32min - 44max) fps +5% |
KFA2 GeForce RTX 2070 Super Work The Frames
GeForce RTX 2070 Super (Desktop), R9 3900X | |
Nvidia GeForce RTX 2070 Super
GeForce RTX 2070 Super (Desktop), R7 2700X |
35 (30min - 40max) fps -2% |
AMD Radeon VII
Radeon VII, R7 2700X |
33.5 (29min - 41max) fps -6% |
MSI RTX 2070 Gaming Z 8G
GeForce RTX 2070 (Desktop), R7 2700X |
32.3 (28min - 38max) fps -10% |
AMD Radeon RX 5700 XT
Radeon RX 5700 XT (Desktop), R7 2700X |
29.6 (27min - 34max) fps -17% |
AMD Radeon RX Vega 64
RX Vega 64, R7 2700X |
28.9 (26min - 34max) fps -19% |
Nvidia GeForce RTX 2060 Super
GeForce RTX 2060 Super (Desktop), R7 2700X |
28.4 (24min - 33max) fps -20% |
AMD Radeon RX 5700
Radeon RX 5700 (Desktop), R7 2700X |
27.8 (25min - 32max) fps -22% |
MSI RTX 2060 Gaming Z 6G
GeForce RTX 2060 (Desktop), R7 2700X |
27.5 (24min - 32max) fps -23% |
|
MSI RTX 2080 Gaming X Trio
GeForce RTX 2080 (Desktop), R7 2700X |
78 (62min - 97max) fps +11% |
Nvidia GeForce RTX 2080 Super
GeForce RTX 2080 Super (Desktop), R7 2700X |
76 (62min - 92max) fps +8% |
Nvidia GeForce RTX 2070 Super
GeForce RTX 2070 Super (Desktop), R7 2700X |
71 (56min - 81max) fps +1% |
KFA2 GeForce RTX 2070 Super Work The Frames
GeForce RTX 2070 Super (Desktop), R9 3900X | |
MSI RTX 2070 Gaming Z 8G
GeForce RTX 2070 (Desktop), R7 2700X |
65.5 (55min - 78max) fps -7% |
AMD Radeon RX 5700 XT
Radeon RX 5700 XT (Desktop), R7 2700X |
58.7 (51min - 68max) fps -16% |
Nvidia GeForce RTX 2060 Super
GeForce RTX 2060 Super (Desktop), R7 2700X |
56.2 (47min - 66max) fps -20% |
AMD Radeon RX 5700
Radeon RX 5700 (Desktop), R7 2700X |
54.2 (48min - 63max) fps -23% |
|
|
AMD Ryzen 9 3900X
Titan RTX, R9 3900X, Corsair MP600 |
120 (94min - 159max) fps +9% |
AMD Radeon RX 5700 XT
Radeon RX 5700 XT (Desktop), R9 3900X |
110 (85min - 145max) fps 0% |
KFA2 GeForce RTX 2070 Super Work The Frames
GeForce RTX 2070 Super (Desktop), R9 3900X | |
MSI RTX 2080 Gaming X Trio
GeForce RTX 2080 (Desktop), R7 2700X |
107 (82min - 145max) fps -3% |
Nvidia Titan RTX
Titan RTX, R7 2700X, ADATA Premier Pro SP900NS38 512 GB |
103 (77min - 137max) fps -6% |
MSI RTX 2070 Gaming Z 8G
GeForce RTX 2070 (Desktop), R7 2700X |
103 (78min - 136max) fps -6% |
AMD Radeon RX Vega 64
RX Vega 64, R7 2700X |
99 (78min - 124max) fps -10% |
Nvidia GeForce RTX 2060 Super
GeForce RTX 2060 Super (Desktop), R7 2700X |
99 (75min - 131max) fps -10% |
Nvidia GeForce RTX 2070 Super
GeForce RTX 2070 Super (Desktop), R7 2700X |
99 (76min - 132max) fps -10% |
Nvidia GeForce RTX 2080 Super
GeForce RTX 2080 Super (Desktop), R7 2700X |
98 (78min - 130max) fps -11% |
AMD Radeon RX 5700 XT
Radeon RX 5700 XT (Desktop), R7 2700X |
96 (75min - 127max) fps -13% |
MSI RTX 2060 Gaming Z 6G
GeForce RTX 2060 (Desktop), R7 2700X |
94 (72min - 124max) fps -15% |
AMD Radeon VII
Radeon VII, R7 2700X |
91 (70min - 120max) fps -17% |
AMD Radeon RX 5700
Radeon RX 5700 (Desktop), R7 2700X |
84 (59min - 114max) fps -24% |
|
AMD Ryzen 9 3900X
Titan RTX, R9 3900X, Corsair MP600 |
78 (66min - 93max) fps +44% |
Nvidia Titan RTX
Titan RTX, R7 2700X, ADATA Premier Pro SP900NS38 512 GB |
75 (61min - 89max) fps +39% |
Nvidia GeForce RTX 2080 Super
GeForce RTX 2080 Super (Desktop), R7 2700X |
61 (53min - 70max) fps +13% |
MSI RTX 2080 Gaming X Trio
GeForce RTX 2080 (Desktop), R7 2700X |
59 (53min - 71max) fps +9% |
AMD Radeon VII
Radeon VII, R7 2700X |
59 (50min - 75max) fps +9% |
Nvidia GeForce RTX 2070 Super
GeForce RTX 2070 Super (Desktop), R7 2700X |
54 (48min - 65max) fps 0% |
KFA2 GeForce RTX 2070 Super Work The Frames
GeForce RTX 2070 Super (Desktop), R9 3900X | |
AMD Radeon RX 5700 XT
Radeon RX 5700 XT (Desktop), R7 2700X |
51 (44min - 66max) fps -6% |
MSI RTX 2070 Gaming Z 8G
GeForce RTX 2070 (Desktop), R7 2700X |
48 (41min - 57max) fps -11% |
Nvidia GeForce RTX 2060 Super
GeForce RTX 2060 Super (Desktop), R7 2700X |
45 (40min - 55max) fps -17% |
AMD Radeon RX 5700
Radeon RX 5700 (Desktop), R7 2700X |
45 (38min - 58max) fps -17% |
AMD Radeon RX Vega 64
RX Vega 64, R7 2700X |
44 (37min - 56max) fps -19% |
MSI RTX 2060 Gaming Z 6G
GeForce RTX 2060 (Desktop), R7 2700X |
41 (37min - 49max) fps -24% |
|
AMD Ryzen 9 3900X
Titan RTX, R9 3900X, Corsair MP600 |
113 (90min - 150max) fps +15% |
MSI RTX 2080 Gaming X Trio
GeForce RTX 2080 (Desktop), R7 2700X |
99 (80min - 122max) fps +1% |
KFA2 GeForce RTX 2070 Super Work The Frames
GeForce RTX 2070 Super (Desktop), R9 3900X | |
Nvidia GeForce RTX 2080 Super
GeForce RTX 2080 Super (Desktop), R7 2700X |
94 (75min - 123max) fps -4% |
Nvidia GeForce RTX 2070 Super
GeForce RTX 2070 Super (Desktop), R7 2700X |
91 (75min - 111max) fps -7% |
AMD Radeon RX 5700 XT
Radeon RX 5700 XT (Desktop), R7 2700X |
89 (75min - 104max) fps -9% |
MSI RTX 2070 Gaming Z 8G
GeForce RTX 2070 (Desktop), R7 2700X |
88 (77min - 102max) fps -10% |
Nvidia GeForce RTX 2060 Super
GeForce RTX 2060 Super (Desktop), R7 2700X |
83 (70min - 98max) fps -15% |
AMD Radeon RX 5700
Radeon RX 5700 (Desktop), R7 2700X |
80 (65min - 93max) fps -18% |
|
|
KFA2 GeForce RTX 2070 Super Work The Frames
GeForce RTX 2070 Super (Desktop), R9 3900X | |
Nvidia Titan RTX
Titan RTX, R7 2700X, ADATA Premier Pro SP900NS38 512 GB | |
MSI RTX 2080 Gaming X Trio
GeForce RTX 2080 (Desktop), R7 2700X | |
MSI RTX 2070 Gaming Z 8G
GeForce RTX 2070 (Desktop), R7 2700X | |
Nvidia GeForce RTX 2080 Super
GeForce RTX 2080 Super (Desktop), R7 2700X | |
Nvidia GeForce RTX 2070 Super
GeForce RTX 2070 Super (Desktop), R7 2700X | |
Nvidia GeForce RTX 2060 Super
GeForce RTX 2060 Super (Desktop), R7 2700X | |
MSI RTX 2060 Gaming Z 6G
GeForce RTX 2060 (Desktop), R7 2700X | |
AMD Radeon RX Vega 64
RX Vega 64, R7 2700X | |
AMD Radeon VII
Radeon VII, R7 2700X | |
AMD Radeon RX 5700
Radeon RX 5700 (Desktop), R7 2700X | |
AMD Radeon RX 5700 XT
Radeon RX 5700 XT (Desktop), R7 2700X | |
|
Nvidia Titan RTX
Titan RTX, R7 2700X, ADATA Premier Pro SP900NS38 512 GB | |
Nvidia GeForce RTX 2080 Super
GeForce RTX 2080 Super (Desktop), R7 2700X | |
MSI RTX 2080 Gaming X Trio
GeForce RTX 2080 (Desktop), R7 2700X | |
AMD Radeon VII
Radeon VII, R7 2700X | |
Nvidia GeForce RTX 2070 Super
GeForce RTX 2070 Super (Desktop), R7 2700X | |
KFA2 GeForce RTX 2070 Super Work The Frames
GeForce RTX 2070 Super (Desktop), R9 3900X | |
MSI RTX 2070 Gaming Z 8G
GeForce RTX 2070 (Desktop), R7 2700X | |
Nvidia GeForce RTX 2060 Super
GeForce RTX 2060 Super (Desktop), R7 2700X | |
MSI RTX 2060 Gaming Z 6G
GeForce RTX 2060 (Desktop), R7 2700X | |
AMD Radeon RX 5700 XT
Radeon RX 5700 XT (Desktop), R7 2700X | |
AMD Radeon RX 5700
Radeon RX 5700 (Desktop), R7 2700X | |
AMD Radeon RX Vega 64
RX Vega 64, R7 2700X | |
|
MSI RTX 2080 Gaming X Trio
GeForce RTX 2080 (Desktop), R7 2700X | |
Nvidia GeForce RTX 2080 Super
GeForce RTX 2080 Super (Desktop), R7 2700X | |
KFA2 GeForce RTX 2070 Super Work The Frames
GeForce RTX 2070 Super (Desktop), R9 3900X | |
Nvidia GeForce RTX 2070 Super
GeForce RTX 2070 Super (Desktop), R7 2700X | |
MSI RTX 2070 Gaming Z 8G
GeForce RTX 2070 (Desktop), R7 2700X | |
Nvidia GeForce RTX 2060 Super
GeForce RTX 2060 Super (Desktop), R7 2700X | |
AMD Radeon RX 5700 XT
Radeon RX 5700 XT (Desktop), R7 2700X | |
AMD Radeon RX 5700
Radeon RX 5700 (Desktop), R7 2700X | |
|
|
KFA2 GeForce RTX 2070 Super Work The Frames
GeForce RTX 2070 Super (Desktop), R9 3900X | |
Nvidia Titan RTX
Titan RTX, R7 2700X, ADATA Premier Pro SP900NS38 512 GB |
79 (61min - 108max) fps -10% |
Nvidia GeForce RTX 2080 Super
GeForce RTX 2080 Super (Desktop), R7 2700X |
79 (58min - 107max) fps -10% |
MSI RTX 2080 Gaming X Trio
GeForce RTX 2080 (Desktop), R7 2700X |
78 (53min - 100max) fps -11% |
Nvidia GeForce RTX 2070 Super
GeForce RTX 2070 Super (Desktop), R7 2700X |
78 (55min - 106max) fps -11% |
MSI RTX 2070 Gaming Z 8G
GeForce RTX 2070 (Desktop), R7 2700X |
77.9 (58min - 99max) fps -11% |
Nvidia GeForce RTX 2060 Super
GeForce RTX 2060 Super (Desktop), R7 2700X |
77 (50min - 100max) fps -12% |
AMD Radeon RX 5700 XT
Radeon RX 5700 XT (Desktop), R7 2700X |
73 (56min - 102max) fps -17% |
AMD Radeon RX Vega 64
RX Vega 64, R7 2700X |
72.9 (55min - 90max) fps -17% |
AMD Radeon VII
Radeon VII, R7 2700X |
71 (51min - 95max) fps -19% |
MSI RTX 2060 Gaming Z 6G
GeForce RTX 2060 (Desktop), R7 2700X |
70 (50min - 83max) fps -20% |
AMD Radeon RX 5700
Radeon RX 5700 (Desktop), R7 2700X |
64 (49min - 85max) fps -27% |
|
Nvidia Titan RTX
Titan RTX, R7 2700X, ADATA Premier Pro SP900NS38 512 GB |
49 (41min - 56max) fps +38% |
Nvidia GeForce RTX 2080 Super
GeForce RTX 2080 Super (Desktop), R7 2700X |
39.5 (32min - 44max) fps +11% |
MSI RTX 2080 Gaming X Trio
GeForce RTX 2080 (Desktop), R7 2700X |
39.1 (32min - 44max) fps +10% |
AMD Radeon RX Vega 64
RX Vega 64, R7 2700X |
36.5 (31min - 40max) fps +3% |
KFA2 GeForce RTX 2070 Super Work The Frames
GeForce RTX 2070 Super (Desktop), R9 3900X | |
Nvidia GeForce RTX 2070 Super
GeForce RTX 2070 Super (Desktop), R7 2700X |
35.4 (30min - 40max) fps 0% |
AMD Radeon VII
Radeon VII, R7 2700X |
30.8 (25min - 35max) fps -13% |
MSI RTX 2070 Gaming Z 8G
GeForce RTX 2070 (Desktop), R7 2700X |
30.7 (26min - 34max) fps -14% |
Nvidia GeForce RTX 2060 Super
GeForce RTX 2060 Super (Desktop), R7 2700X |
30 (24min - 34max) fps -15% |
AMD Radeon RX 5700 XT
Radeon RX 5700 XT (Desktop), R7 2700X |
29.6 (24min - 34max) fps -17% |
AMD Radeon RX 5700
Radeon RX 5700 (Desktop), R7 2700X |
26.2 (22min - 29max) fps -26% |
MSI RTX 2060 Gaming Z 6G
GeForce RTX 2060 (Desktop), R7 2700X |
25 (21min - 29max) fps -30% |
|
MSI RTX 2080 Gaming X Trio
GeForce RTX 2080 (Desktop), R7 2700X |
70 (55min - 83max) fps +5% |
Nvidia GeForce RTX 2080 Super
GeForce RTX 2080 Super (Desktop), R7 2700X |
70 (54min - 84max) fps +5% |
KFA2 GeForce RTX 2070 Super Work The Frames
GeForce RTX 2070 Super (Desktop), R9 3900X | |
Nvidia GeForce RTX 2070 Super
GeForce RTX 2070 Super (Desktop), R7 2700X |
65 (52min - 80max) fps -2% |
AMD Radeon RX 5700 XT
Radeon RX 5700 XT (Desktop), R7 2700X |
59 (49min - 68max) fps -11% |
Nvidia GeForce RTX 2060 Super
GeForce RTX 2060 Super (Desktop), R7 2700X |
58.1 (47min - 69max) fps -13% |
MSI RTX 2070 Gaming Z 8G
GeForce RTX 2070 (Desktop), R7 2700X |
58 (44min - 68max) fps -13% |
AMD Radeon RX 5700
Radeon RX 5700 (Desktop), R7 2700X |
52.2 (43min - 60max) fps -22% |
|
|
AMD Ryzen 9 3900X
Titan RTX, R9 3900X, Corsair MP600 | |
Nvidia Titan RTX
Titan RTX, R7 2700X, ADATA Premier Pro SP900NS38 512 GB |
112 (65min - 172max) fps +48% |
Nvidia GeForce RTX 2080 Super
GeForce RTX 2080 Super (Desktop), R7 2700X |
97 (50min - 151max) fps +28% |
MSI RTX 2080 Gaming X Trio
GeForce RTX 2080 (Desktop), R7 2700X | |
Nvidia GeForce RTX 2070 Super
GeForce RTX 2070 Super (Desktop), R7 2700X |
89 (45min - 141max) fps +18% |
MSI RTX 2070 Gaming Z 8G
GeForce RTX 2070 (Desktop), R7 2700X |
83.5 (36min - 125max) fps +11% |
Nvidia GeForce RTX 2060 Super
GeForce RTX 2060 Super (Desktop), R7 2700X |
79 (36min - 121max) fps +5% |
KFA2 GeForce RTX 2070 Super Work The Frames
GeForce RTX 2070 Super (Desktop), R9 3900X |
75.5 (49min - 135max) fps |
MSI RTX 2060 Gaming Z 6G
GeForce RTX 2060 (Desktop), R7 2700X |
72.6 (31min - 114max) fps -4% |
AMD Radeon RX 5700 XT
Radeon RX 5700 XT (Desktop), R7 2700X |
69 (34min - 112max) fps -9% |
AMD Radeon RX 5700
Radeon RX 5700 (Desktop), R7 2700X |
59.6 (18min - 102max) fps -21% |
AMD Radeon RX Vega 64
RX Vega 64, R7 2700X |
58.5 (23min - 92max) fps -23% |
AMD Radeon RX Vega 64
RX Vega 64, R7 2700X |
58.5 (23min - 92max) fps -23% |
|
AMD Ryzen 9 3900X
Titan RTX, R9 3900X, Corsair MP600 | |
Nvidia Titan RTX
Titan RTX, R7 2700X, ADATA Premier Pro SP900NS38 512 GB |
58 (39min - 87max) fps +41% |
Nvidia GeForce RTX 2080 Super
GeForce RTX 2080 Super (Desktop), R7 2700X |
46.4 (19min - 70max) fps +13% |
MSI RTX 2080 Gaming X Trio
GeForce RTX 2080 (Desktop), R7 2700X | |
KFA2 GeForce RTX 2070 Super Work The Frames
GeForce RTX 2070 Super (Desktop), R9 3900X | |
Nvidia GeForce RTX 2070 Super
GeForce RTX 2070 Super (Desktop), R7 2700X |
40.6 (17min - 58max) fps -1% |
MSI RTX 2070 Gaming Z 8G
GeForce RTX 2070 (Desktop), R7 2700X |
38.2 (21min - 56max) fps -7% |
Nvidia GeForce RTX 2060 Super
GeForce RTX 2060 Super (Desktop), R7 2700X |
35 (19min - 53max) fps -15% |
AMD Radeon RX 5700 XT
Radeon RX 5700 XT (Desktop), R7 2700X |
32.8 (6min - 51max) fps -20% |
MSI RTX 2060 Gaming Z 6G
GeForce RTX 2060 (Desktop), R7 2700X |
30.8 (13min - 45max) fps -25% |
AMD Radeon RX 5700
Radeon RX 5700 (Desktop), R7 2700X |
28.9 (18min - 45max) fps -30% |
AMD Radeon RX Vega 64
RX Vega 64, R7 2700X |
27.9 (20min - 42max) fps -32% |
AMD Radeon RX Vega 64
RX Vega 64, R7 2700X |
27.9 (20min - 42max) fps -32% |
|
|
KFA2 GeForce RTX 2070 Super Work The Frames
GeForce RTX 2070 Super (Desktop), R9 3900X | |
AMD Radeon RX Vega 64
RX Vega 64, R7 2700X |
96 (67min - 113max) fps -6% |
MSI RTX 2070 Gaming Z 8G
GeForce RTX 2070 (Desktop), R7 2700X |
94 (64min - 110max) fps -8% |
AMD Radeon VII
Radeon VII, R7 2700X |
94 (67min - 112max) fps -8% |
MSI RTX 2060 Gaming Z 6G
GeForce RTX 2060 (Desktop), R7 2700X |
91 (66min - 109max) fps -11% |
AMD Radeon RX 5700
Radeon RX 5700 (Desktop), R7 2700X |
91 (64min - 108max) fps -11% |
MSI RTX 2080 Gaming X Trio
GeForce RTX 2080 (Desktop), R7 2700X |
90 (65min - 107max) fps -12% |
Nvidia GeForce RTX 2060 Super
GeForce RTX 2060 Super (Desktop), R7 2700X |
90 (65min - 106max) fps -12% |
Nvidia GeForce RTX 2070 Super
GeForce RTX 2070 Super (Desktop), R7 2700X |
90 (64min - 106max) fps -12% |
Nvidia GeForce RTX 2080 Super
GeForce RTX 2080 Super (Desktop), R7 2700X |
90 (64min - 105max) fps -12% |
AMD Radeon RX 5700 XT
Radeon RX 5700 XT (Desktop), R7 2700X |
89 (60min - 106max) fps -13% |
Nvidia Titan RTX
Titan RTX, R7 2700X, ADATA Premier Pro SP900NS38 512 GB |
88 (63min - 105max) fps -14% |
|
Nvidia Titan RTX
Titan RTX, R7 2700X, ADATA Premier Pro SP900NS38 512 GB |
88 (72min - 99max) fps +35% |
Nvidia GeForce RTX 2080 Super
GeForce RTX 2080 Super (Desktop), R7 2700X |
74 (67min - 81max) fps +14% |
MSI RTX 2080 Gaming X Trio
GeForce RTX 2080 (Desktop), R7 2700X |
71 (65min - 78max) fps +9% |
AMD Radeon VII
Radeon VII, R7 2700X |
69 (61min - 76max) fps +6% |
KFA2 GeForce RTX 2070 Super Work The Frames
GeForce RTX 2070 Super (Desktop), R9 3900X | |
Nvidia GeForce RTX 2070 Super
GeForce RTX 2070 Super (Desktop), R7 2700X |
64 (59min - 71max) fps -2% |
MSI RTX 2070 Gaming Z 8G
GeForce RTX 2070 (Desktop), R7 2700X |
59 (54min - 64max) fps -9% |
AMD Radeon RX 5700 XT
Radeon RX 5700 XT (Desktop), R7 2700X |
59 (53min - 63max) fps -9% |
Nvidia GeForce RTX 2060 Super
GeForce RTX 2060 Super (Desktop), R7 2700X |
55 (50min - 61max) fps -15% |
AMD Radeon RX 5700
Radeon RX 5700 (Desktop), R7 2700X |
52 (47min - 56max) fps -20% |
MSI RTX 2060 Gaming Z 6G
GeForce RTX 2060 (Desktop), R7 2700X |
50 (46min - 55max) fps -23% |
AMD Radeon RX Vega 64
RX Vega 64, R7 2700X |
49 (45min - 54max) fps -25% |
|
|
AMD Ryzen 9 3900X
Titan RTX, R9 3900X, Corsair MP600 |
138 (125min - 151max) fps +39% |
Nvidia Titan RTX
Titan RTX, R7 2700X, ADATA Premier Pro SP900NS38 512 GB |
128 (111min - 142max) fps +29% |
MSI RTX 2080 Gaming X Trio
GeForce RTX 2080 (Desktop), R7 2700X |
109 (94min - 120max) fps +10% |
Nvidia GeForce RTX 2080 Super
GeForce RTX 2080 Super (Desktop), R7 2700X |
109 (81min - 123max) fps +10% |
KFA2 GeForce RTX 2070 Super Work The Frames
GeForce RTX 2070 Super (Desktop), R9 3900X |
99.4 (89min - 109max) fps |
Nvidia GeForce RTX 2070 Super
GeForce RTX 2070 Super (Desktop), R7 2700X |
97 (83min - 109max) fps -2% |
AMD Radeon RX 5700 XT
Radeon RX 5700 XT (Desktop), R9 3900X |
94 (86min - 103max) fps -5% |
AMD Radeon RX 5700 XT
Radeon RX 5700 XT (Desktop), R7 2700X |
92 (79min - 99max) fps -7% |
MSI RTX 2070 Gaming Z 8G
GeForce RTX 2070 (Desktop), R7 2700X |
89.9 (81min - 101max) fps -10% |
AMD Radeon RX 5700
Radeon RX 5700 (Desktop), R7 2700X |
80 (70min - 87max) fps -20% |
Nvidia GeForce RTX 2060 Super
GeForce RTX 2060 Super (Desktop), R7 2700X |
79 (67min - 89max) fps -21% |
AMD Radeon RX Vega 64
RX Vega 64, R7 2700X |
77 (67min - 84max) fps -23% |
AMD Radeon VII
Radeon VII, R7 2700X |
75 (65min - 83max) fps -25% |
MSI RTX 2060 Gaming Z 6G
GeForce RTX 2060 (Desktop), R7 2700X |
72.7 (61min - 82max) fps -27% |
|
Nvidia Titan RTX
Titan RTX, R7 2700X, ADATA Premier Pro SP900NS38 512 GB |
102 (90min - 110max) fps +53% |
AMD Ryzen 9 3900X
Titan RTX, R9 3900X, Corsair MP600 |
102 (95min - 110max) fps +53% |
Nvidia GeForce RTX 2080 Super
GeForce RTX 2080 Super (Desktop), R7 2700X |
79 (71min - 87max) fps +19% |
MSI RTX 2080 Gaming X Trio
GeForce RTX 2080 (Desktop), R7 2700X |
78 (69min - 87max) fps +17% |
Nvidia GeForce RTX 2070 Super
GeForce RTX 2070 Super (Desktop), R7 2700X |
68 (61min - 74max) fps +2% |
KFA2 GeForce RTX 2070 Super Work The Frames
GeForce RTX 2070 Super (Desktop), R9 3900X | |
MSI RTX 2070 Gaming Z 8G
GeForce RTX 2070 (Desktop), R7 2700X |
64.3 (59min - 70max) fps -3% |
Nvidia GeForce RTX 2060 Super
GeForce RTX 2060 Super (Desktop), R7 2700X |
57 (51min - 62max) fps -14% |
AMD Radeon VII
Radeon VII, R7 2700X |
54.3 (50min - 59max) fps -18% |
AMD Radeon RX 5700 XT
Radeon RX 5700 XT (Desktop), R7 2700X |
52.1 (47min - 57max) fps -22% |
MSI RTX 2060 Gaming Z 6G
GeForce RTX 2060 (Desktop), R7 2700X |
51.3 (44min - 58max) fps -23% |
AMD Radeon RX Vega 64
RX Vega 64, R7 2700X |
49.1 (44min - 54max) fps -26% |
AMD Radeon RX 5700
Radeon RX 5700 (Desktop), R7 2700X |
46.8 (42min - 51max) fps -30% |
|
|
Nvidia Titan RTX
Titan RTX, R7 2700X, ADATA Premier Pro SP900NS38 512 GB |
100 (75min - 119max) fps +24% |
Nvidia GeForce RTX 2080 Super
GeForce RTX 2080 Super (Desktop), R7 2700X |
87 (70min - 98max) fps +8% |
MSI RTX 2080 Gaming X Trio
GeForce RTX 2080 (Desktop), R7 2700X |
86.6 (70min - 99max) fps +7% |
KFA2 GeForce RTX 2070 Super Work The Frames
GeForce RTX 2070 Super (Desktop), R9 3900X | |
Nvidia GeForce RTX 2070 Super
GeForce RTX 2070 Super (Desktop), R7 2700X |
80 (61min - 91max) fps -1% |
MSI RTX 2070 Gaming Z 8G
GeForce RTX 2070 (Desktop), R7 2700X |
76 (59min - 87max) fps -6% |
Nvidia GeForce RTX 2060 Super
GeForce RTX 2060 Super (Desktop), R7 2700X |
74 (60min - 84max) fps -9% |
AMD Radeon RX Vega 64
RX Vega 64, R7 2700X |
68.2 (56min - 78max) fps -16% |
MSI RTX 2060 Gaming Z 6G
GeForce RTX 2060 (Desktop), R7 2700X |
66 (51min - 75max) fps -18% |
AMD Radeon VII
Radeon VII, R7 2700X | |
|
Nvidia Titan RTX
Titan RTX, R7 2700X, ADATA Premier Pro SP900NS38 512 GB |
70 (63min - 78max) fps +39% |
Nvidia GeForce RTX 2080 Super
GeForce RTX 2080 Super (Desktop), R7 2700X |
56.6 (52min - 63max) fps +13% |
MSI RTX 2080 Gaming X Trio
GeForce RTX 2080 (Desktop), R7 2700X |
54.8 (49min - 61max) fps +9% |
KFA2 GeForce RTX 2070 Super Work The Frames
GeForce RTX 2070 Super (Desktop), R9 3900X | |
Nvidia GeForce RTX 2070 Super
GeForce RTX 2070 Super (Desktop), R7 2700X |
49.7 (46min - 55max) fps -1% |
MSI RTX 2070 Gaming Z 8G
GeForce RTX 2070 (Desktop), R7 2700X |
45.9 (42min - 51max) fps -9% |
Nvidia GeForce RTX 2060 Super
GeForce RTX 2060 Super (Desktop), R7 2700X |
43.1 (39min - 48max) fps -14% |
AMD Radeon VII
Radeon VII, R7 2700X | |
MSI RTX 2060 Gaming Z 6G
GeForce RTX 2060 (Desktop), R7 2700X |
38.5 (35min - 43max) fps -23% |
AMD Radeon RX Vega 64
RX Vega 64, R7 2700X |
36.9 (32min - 42max) fps -27% |
|
|
Nvidia Titan RTX
Titan RTX, R7 2700X, ADATA Premier Pro SP900NS38 512 GB | |
Nvidia GeForce RTX 2080 Super
GeForce RTX 2080 Super (Desktop), R7 2700X | |
MSI RTX 2080 Gaming X Trio
GeForce RTX 2080 (Desktop), R7 2700X | |
AMD Radeon RX 5700 XT
Radeon RX 5700 XT (Desktop), R7 2700X | |
KFA2 GeForce RTX 2070 Super Work The Frames
GeForce RTX 2070 Super (Desktop), R9 3900X | |
AMD Radeon RX 5700
Radeon RX 5700 (Desktop), R7 2700X | |
Nvidia GeForce RTX 2070 Super
GeForce RTX 2070 Super (Desktop), R7 2700X | |
MSI RTX 2070 Gaming Z 8G
GeForce RTX 2070 (Desktop), R7 2700X | |
Nvidia GeForce RTX 2060 Super
GeForce RTX 2060 Super (Desktop), R7 2700X | |
AMD Radeon RX Vega 64
RX Vega 64, R7 2700X | |
MSI RTX 2060 Gaming Z 6G
GeForce RTX 2060 (Desktop), R7 2700X | |
AMD Radeon VII
Radeon VII, R7 2700X | |
|
Nvidia Titan RTX
Titan RTX, R7 2700X, ADATA Premier Pro SP900NS38 512 GB | |
MSI RTX 2080 Gaming X Trio
GeForce RTX 2080 (Desktop), R7 2700X | |
Nvidia GeForce RTX 2080 Super
GeForce RTX 2080 Super (Desktop), R7 2700X | |
KFA2 GeForce RTX 2070 Super Work The Frames
GeForce RTX 2070 Super (Desktop), R9 3900X | |
AMD Radeon RX 5700 XT
Radeon RX 5700 XT (Desktop), R7 2700X | |
Nvidia GeForce RTX 2070 Super
GeForce RTX 2070 Super (Desktop), R7 2700X | |
AMD Radeon VII
Radeon VII, R7 2700X | |
MSI RTX 2070 Gaming Z 8G
GeForce RTX 2070 (Desktop), R7 2700X | |
AMD Radeon RX 5700
Radeon RX 5700 (Desktop), R7 2700X | |
Nvidia GeForce RTX 2060 Super
GeForce RTX 2060 Super (Desktop), R7 2700X | |
AMD Radeon RX Vega 64
RX Vega 64, R7 2700X | |
MSI RTX 2060 Gaming Z 6G
GeForce RTX 2060 (Desktop), R7 2700X | |
|
|
Nvidia Titan RTX
Titan RTX, R7 2700X, ADATA Premier Pro SP900NS38 512 GB |
213 (107min - 286max) fps +37% |
Nvidia GeForce RTX 2080 Super
GeForce RTX 2080 Super (Desktop), R7 2700X |
169.8 (86min - 236max) fps +9% |
MSI RTX 2080 Gaming X Trio
GeForce RTX 2080 (Desktop), R7 2700X |
169.7 (120min - 227max) fps +9% |
AMD Radeon RX 5700 XT
Radeon RX 5700 XT (Desktop), R9 3900X |
160.5 (96min - 223max) fps +3% |
AMD Radeon RX 5700 XT
Radeon RX 5700 XT (Desktop), R7 2700X |
156.4 (113min - 227max) fps 0% |
KFA2 GeForce RTX 2070 Super Work The Frames
GeForce RTX 2070 Super (Desktop), R9 3900X |
156 (114min - 210max) fps |
Nvidia GeForce RTX 2070 Super
GeForce RTX 2070 Super (Desktop), R7 2700X |
152.5 (84min - 204max) fps -2% |
AMD Radeon RX 5700
Radeon RX 5700 (Desktop), R7 2700X |
143.5 (103min - 201max) fps -8% |
MSI RTX 2070 Gaming Z 8G
GeForce RTX 2070 (Desktop), R7 2700X |
141.6 (95min - 199max) fps -9% |
Nvidia GeForce RTX 2060 Super
GeForce RTX 2060 Super (Desktop), R7 2700X |
133.9 (88min - 191max) fps -14% |
AMD Radeon RX Vega 64
RX Vega 64, R7 2700X |
127.7 (106min - 167max) fps -18% |
MSI RTX 2060 Gaming Z 6G
GeForce RTX 2060 (Desktop), R7 2700X |
122 (72min - 171max) fps -22% |
AMD Radeon VII
Radeon VII, R7 2700X | |
|
Nvidia Titan RTX
Titan RTX, R7 2700X, ADATA Premier Pro SP900NS38 512 GB |
101 (68min - 127max) fps +44% |
Nvidia GeForce RTX 2080 Super
GeForce RTX 2080 Super (Desktop), R7 2700X |
78.8 (43min - 101max) fps +13% |
MSI RTX 2080 Gaming X Trio
GeForce RTX 2080 (Desktop), R7 2700X |
76.8 (56min - 96max) fps +10% |
KFA2 GeForce RTX 2070 Super Work The Frames
GeForce RTX 2070 Super (Desktop), R9 3900X | |
Nvidia GeForce RTX 2070 Super
GeForce RTX 2070 Super (Desktop), R7 2700X |
69 (43min - 83max) fps -1% |
AMD Radeon VII
Radeon VII, R7 2700X | |
AMD Radeon RX 5700 XT
Radeon RX 5700 XT (Desktop), R7 2700X |
63.5 (94min - 75max) fps -9% |
MSI RTX 2070 Gaming Z 8G
GeForce RTX 2070 (Desktop), R7 2700X |
63.2 (46min - 76max) fps -10% |
Nvidia GeForce RTX 2060 Super
GeForce RTX 2060 Super (Desktop), R7 2700X |
58.3 (43min - 71max) fps -17% |
AMD Radeon RX 5700
Radeon RX 5700 (Desktop), R7 2700X |
56.7 (46min - 67max) fps -19% |
MSI RTX 2060 Gaming Z 6G
GeForce RTX 2060 (Desktop), R7 2700X |
53 (39min - 63max) fps -24% |
AMD Radeon RX Vega 64
RX Vega 64, R7 2700X |
49 (40min - 58max) fps -30% |
|
|
Nvidia Titan RTX
Titan RTX, R7 2700X, ADATA Premier Pro SP900NS38 512 GB |
86 (70min - 96max) fps +25% |
Nvidia GeForce RTX 2080 Super
GeForce RTX 2080 Super (Desktop), R7 2700X |
74.8 (60min - 84max) fps +8% |
MSI RTX 2080 Gaming X Trio
GeForce RTX 2080 (Desktop), R7 2700X |
73.9 (44min - 83max) fps +7% |
KFA2 GeForce RTX 2070 Super Work The Frames
GeForce RTX 2070 Super (Desktop), R9 3900X | |
Nvidia GeForce RTX 2070 Super
GeForce RTX 2070 Super (Desktop), R7 2700X |
67.8 (53min - 76max) fps -2% |
AMD Radeon RX 5700 XT
Radeon RX 5700 XT (Desktop), R7 2700X |
64.8 (50min - 76max) fps -6% |
MSI RTX 2070 Gaming Z 8G
GeForce RTX 2070 (Desktop), R7 2700X |
64.1 (55min - 73max) fps -7% |
Nvidia GeForce RTX 2060 Super
GeForce RTX 2060 Super (Desktop), R7 2700X |
62.4 (40min - 72max) fps -10% |
AMD Radeon RX 5700
Radeon RX 5700 (Desktop), R7 2700X |
60.4 (50min - 69max) fps -12% |
MSI RTX 2060 Gaming Z 6G
GeForce RTX 2060 (Desktop), R7 2700X |
56 (49min - 63max) fps -19% |
AMD Radeon RX Vega 64
RX Vega 64, R7 2700X |
53 (43min - 60max) fps -23% |
AMD Radeon VII
Radeon VII, R7 2700X | |
|
Nvidia Titan RTX
Titan RTX, R7 2700X, ADATA Premier Pro SP900NS38 512 GB |
49 (42min - 55max) fps +40% |
Nvidia GeForce RTX 2080 Super
GeForce RTX 2080 Super (Desktop), R7 2700X |
39.1 (34min - 44max) fps +12% |
MSI RTX 2080 Gaming X Trio
GeForce RTX 2080 (Desktop), R7 2700X |
38.9 (34min - 44max) fps +11% |
Nvidia GeForce RTX 2070 Super
GeForce RTX 2070 Super (Desktop), R7 2700X |
35.3 (30min - 40max) fps +1% |
KFA2 GeForce RTX 2070 Super Work The Frames
GeForce RTX 2070 Super (Desktop), R9 3900X | |
AMD Radeon RX 5700 XT
Radeon RX 5700 XT (Desktop), R7 2700X |
34.7 (28min - 40max) fps -1% |
MSI RTX 2070 Gaming Z 8G
GeForce RTX 2070 (Desktop), R7 2700X |
32.6 (28min - 37max) fps -7% |
AMD Radeon RX 5700
Radeon RX 5700 (Desktop), R7 2700X |
31.4 (24min - 36max) fps -10% |
Nvidia GeForce RTX 2060 Super
GeForce RTX 2060 Super (Desktop), R7 2700X |
31 (27min - 35max) fps -11% |
|
|
Nvidia Titan RTX
Titan RTX, R7 2700X, ADATA Premier Pro SP900NS38 512 GB | |
MSI RTX 2080 Gaming X Trio
GeForce RTX 2080 (Desktop), R7 2700X |
116 (6.8min, 83.3P1 - 147max) fps +19% |
AMD Radeon VII
Radeon VII, R7 2700X | |
MSI RTX 2070 Gaming Z 8G
GeForce RTX 2070 (Desktop), R7 2700X | |
MSI RTX 2060 Gaming Z 6G
GeForce RTX 2060 (Desktop), R7 2700X | |
KFA2 GeForce RTX 2070 Super Work The Frames
GeForce RTX 2070 Super (Desktop), R9 3900X |
97.7 (5.29min, 62.5P1 - 188max) fps |
Nvidia GeForce RTX 2060 Super
GeForce RTX 2060 Super (Desktop), R7 2700X |
85 (6.02min, 58.8P1 - 158max) fps -13% |
Nvidia GeForce RTX 2070 Super
GeForce RTX 2070 Super (Desktop), R7 2700X |
84 (6.27min, 55.6P1 - 167max) fps -14% |
Nvidia GeForce RTX 2080 Super
GeForce RTX 2080 Super (Desktop), R7 2700X |
84 (5.88min, 58.8P1 - 161max) fps -14% |
AMD Radeon RX 5700
Radeon RX 5700 (Desktop), R7 2700X |
83 (6.93min, 52.6P1 - 165max) fps -15% |
AMD Radeon RX 5700 XT
Radeon RX 5700 XT (Desktop), R7 2700X |
81 (22min, 52.6P1 - 163max) fps -17% |
|
Nvidia Titan RTX
Titan RTX, R7 2700X, ADATA Premier Pro SP900NS38 512 GB | |
Nvidia GeForce RTX 2080 Super
GeForce RTX 2080 Super (Desktop), R7 2700X |
115 (14min, 90.9P1 - 198max) fps +28% |
Nvidia GeForce RTX 2070 Super
GeForce RTX 2070 Super (Desktop), R7 2700X |
102 (2.69min, 76.9P1 - 255max) fps +13% |
KFA2 GeForce RTX 2070 Super Work The Frames
GeForce RTX 2070 Super (Desktop), R9 3900X |
90.1 (4.17min, 66.7P1 - 182max) fps |
AMD Radeon RX 5700 XT
Radeon RX 5700 XT (Desktop), R7 2700X |
90 (14.2min, 71.4P1 - 270max) fps 0% |
MSI RTX 2080 Gaming X Trio
GeForce RTX 2080 (Desktop), R7 2700X |
89 (9.54min, 62.5P1 - 139max) fps -1% |
Nvidia GeForce RTX 2060 Super
GeForce RTX 2060 Super (Desktop), R7 2700X | |
AMD Radeon RX 5700
Radeon RX 5700 (Desktop), R7 2700X |
82 (13.1min, 66.7P1 - 128max) fps -9% |
AMD Radeon VII
Radeon VII, R7 2700X | |
MSI RTX 2070 Gaming Z 8G
GeForce RTX 2070 (Desktop), R7 2700X | |
MSI RTX 2060 Gaming Z 6G
GeForce RTX 2060 (Desktop), R7 2700X | |
|
|
KFA2 GeForce RTX 2070 Super Work The Frames
GeForce RTX 2070 Super (Desktop), R9 3900X |
92.3 (70min - 133max) fps |
AMD Radeon VII
Radeon VII, R7 2700X |
82 (60min - 116max) fps -11% |
AMD Radeon RX 5700 XT
Radeon RX 5700 XT (Desktop), R7 2700X |
81 (61min - 121max) fps -12% |
AMD Radeon RX 5700
Radeon RX 5700 (Desktop), R7 2700X |
80 (61min - 117max) fps -13% |
MSI RTX 2060 Gaming Z 6G
GeForce RTX 2060 (Desktop), R7 2700X |
79.9 (61min - 117max) fps -13% |
MSI RTX 2080 Gaming X Trio
GeForce RTX 2080 (Desktop), R7 2700X |
79 (60min - 114max) fps -14% |
Nvidia GeForce RTX 2060 Super
GeForce RTX 2060 Super (Desktop), R7 2700X |
79 (56min - 111max) fps -14% |
Nvidia GeForce RTX 2080 Super
GeForce RTX 2080 Super (Desktop), R7 2700X |
79 (59min - 113max) fps -14% |
AMD Radeon RX Vega 64
RX Vega 64, R7 2700X |
78.2 (58min - 110max) fps -15% |
MSI RTX 2070 Gaming Z 8G
GeForce RTX 2070 (Desktop), R7 2700X |
77.9 (60min - 112max) fps -16% |
Nvidia GeForce RTX 2070 Super
GeForce RTX 2070 Super (Desktop), R7 2700X |
77 (58min - 110max) fps -17% |
Nvidia Titan RTX
Titan RTX, R7 2700X, ADATA Premier Pro SP900NS38 512 GB |
75 (55min - 107max) fps -19% |
|
Nvidia Titan RTX
Titan RTX, R7 2700X, ADATA Premier Pro SP900NS38 512 GB |
75 (54min - 106max) fps +37% |
Nvidia GeForce RTX 2080 Super
GeForce RTX 2080 Super (Desktop), R7 2700X |
68 (51min - 86max) fps +24% |
MSI RTX 2080 Gaming X Trio
GeForce RTX 2080 (Desktop), R7 2700X |
60 (46min - 71max) fps +10% |
Nvidia GeForce RTX 2070 Super
GeForce RTX 2070 Super (Desktop), R7 2700X |
60 (43min - 76max) fps +10% |
KFA2 GeForce RTX 2070 Super Work The Frames
GeForce RTX 2070 Super (Desktop), R9 3900X | |
AMD Radeon VII
Radeon VII, R7 2700X |
52.9 (45min - 61max) fps -3% |
AMD Radeon RX 5700 XT
Radeon RX 5700 XT (Desktop), R7 2700X |
52.3 (43min - 66max) fps -4% |
AMD Radeon RX Vega 64
RX Vega 64, R7 2700X |
47.4 (41min - 55max) fps -13% |
MSI RTX 2070 Gaming Z 8G
GeForce RTX 2070 (Desktop), R7 2700X |
47.3 (38min - 57max) fps -14% |
AMD Radeon RX 5700
Radeon RX 5700 (Desktop), R7 2700X |
46.6 (36min - 57max) fps -15% |
Nvidia GeForce RTX 2060 Super
GeForce RTX 2060 Super (Desktop), R7 2700X |
45 (36min - 54max) fps -18% |
MSI RTX 2060 Gaming Z 6G
GeForce RTX 2060 (Desktop), R7 2700X |
40.7 (35min - 50max) fps -26% |
|
KFA2 GeForce RTX 2070 Super Work The Frames
GeForce RTX 2070 Super (Desktop), R9 3900X |
89.3 (69min - 113max) fps |
MSI RTX 2080 Gaming X Trio
GeForce RTX 2080 (Desktop), R7 2700X |
80 (60min - 111max) fps -10% |
AMD Radeon RX 5700 XT
Radeon RX 5700 XT (Desktop), R7 2700X |
80 (59min - 111max) fps -10% |
Nvidia GeForce RTX 2080 Super
GeForce RTX 2080 Super (Desktop), R7 2700X |
79 (60min - 114max) fps -12% |
AMD Radeon RX 5700
Radeon RX 5700 (Desktop), R7 2700X |
78 (59min - 102max) fps -13% |
Nvidia GeForce RTX 2070 Super
GeForce RTX 2070 Super (Desktop), R7 2700X |
77 (60min - 109max) fps -14% |
MSI RTX 2070 Gaming Z 8G
GeForce RTX 2070 (Desktop), R7 2700X |
75.8 (59min - 104max) fps -15% |
Nvidia GeForce RTX 2060 Super
GeForce RTX 2060 Super (Desktop), R7 2700X |
75 (57min - 105max) fps -16% |
|
|
Nvidia Titan RTX
Titan RTX, R7 2700X, ADATA Premier Pro SP900NS38 512 GB |
160.4 (129min - 168max) fps +72% |
MSI RTX 2080 Gaming X Trio
GeForce RTX 2080 (Desktop), R7 2700X |
145 (79min - 185max) fps +56% |
AMD Radeon RX Vega 64
RX Vega 64, R7 2700X |
138.7 (112min - 194max) fps +49% |
AMD Radeon VII
Radeon VII, R7 2700X |
127 (94min - 187max) fps +36% |
MSI RTX 2070 Gaming Z 8G
GeForce RTX 2070 (Desktop), R7 2700X |
126.8 (69min - 171max) fps +36% |
MSI RTX 2060 Gaming Z 6G
GeForce RTX 2060 (Desktop), R7 2700X |
119.1 (94min - 167max) fps +28% |
AMD Radeon RX 5700 XT
Radeon RX 5700 XT (Desktop), R7 2700X |
105 (81min - 150max) fps +13% |
Nvidia GeForce RTX 2080 Super
GeForce RTX 2080 Super (Desktop), R7 2700X |
101 (63min - 139max) fps +8% |
AMD Radeon RX 5700
Radeon RX 5700 (Desktop), R7 2700X |
97 (76min - 140max) fps +4% |
Nvidia GeForce RTX 2070 Super
GeForce RTX 2070 Super (Desktop), R7 2700X |
95 (77min - 133max) fps +2% |
KFA2 GeForce RTX 2070 Super Work The Frames
GeForce RTX 2070 Super (Desktop), R9 3900X |
93.2 (81min - 121max) fps |
Nvidia GeForce RTX 2060 Super
GeForce RTX 2060 Super (Desktop), R7 2700X |
87 (56min - 121max) fps -7% |
|
Nvidia Titan RTX
Titan RTX, R7 2700X, ADATA Premier Pro SP900NS38 512 GB |
97.3 (62min - 147max) fps +79% |
MSI RTX 2080 Gaming X Trio
GeForce RTX 2080 (Desktop), R7 2700X |
76 (54min - 115max) fps +40% |
AMD Radeon VII
Radeon VII, R7 2700X |
73 (59min - 115max) fps +34% |
MSI RTX 2070 Gaming Z 8G
GeForce RTX 2070 (Desktop), R7 2700X |
62.6 (46min - 93max) fps +15% |
AMD Radeon RX Vega 64
RX Vega 64, R7 2700X |
60.3 (49min - 98max) fps +11% |
AMD Radeon RX 5700 XT
Radeon RX 5700 XT (Desktop), R7 2700X |
59.5 (49min - 92max) fps +9% |
Nvidia GeForce RTX 2080 Super
GeForce RTX 2080 Super (Desktop), R7 2700X |
55.7 (33min - 81max) fps +2% |
KFA2 GeForce RTX 2070 Super Work The Frames
GeForce RTX 2070 Super (Desktop), R9 3900X | |
AMD Radeon RX 5700
Radeon RX 5700 (Desktop), R7 2700X |
53.5 (44min - 83max) fps -2% |
MSI RTX 2060 Gaming Z 6G
GeForce RTX 2060 (Desktop), R7 2700X |
53.1 (43min - 80max) fps -2% |
Nvidia GeForce RTX 2070 Super
GeForce RTX 2070 Super (Desktop), R7 2700X |
50.9 (41min - 73max) fps -6% |
Nvidia GeForce RTX 2060 Super
GeForce RTX 2060 Super (Desktop), R7 2700X |
46.5 (30min - 67max) fps -15% |
|
MSI RTX 2080 Gaming X Trio
GeForce RTX 2080 (Desktop), R7 2700X |
125 (98min - 175max) fps +50% |
MSI RTX 2070 Gaming Z 8G
GeForce RTX 2070 (Desktop), R7 2700X |
103.1 (62min - 149max) fps +24% |
AMD Radeon RX 5700 XT
Radeon RX 5700 XT (Desktop), R7 2700X |
89 (70min - 130max) fps +7% |
Nvidia GeForce RTX 2080 Super
GeForce RTX 2080 Super (Desktop), R7 2700X |
85 (43min - 122max) fps +2% |
KFA2 GeForce RTX 2070 Super Work The Frames
GeForce RTX 2070 Super (Desktop), R9 3900X |
83.1 (69min - 115max) fps |
AMD Radeon RX 5700
Radeon RX 5700 (Desktop), R7 2700X |
81 (64min - 122max) fps -3% |
Nvidia GeForce RTX 2070 Super
GeForce RTX 2070 Super (Desktop), R7 2700X |
78 (65min - 110max) fps -6% |
Nvidia GeForce RTX 2060 Super
GeForce RTX 2060 Super (Desktop), R7 2700X |
71 (45min - 101max) fps -15% |
|
|
KFA2 GeForce RTX 2070 Super Work The Frames
GeForce RTX 2070 Super (Desktop), R9 3900X |
151 (135min - 202max) fps |
Nvidia Titan RTX
Titan RTX, R7 2700X, ADATA Premier Pro SP900NS38 512 GB |
125 (106min - 167max) fps -17% |
MSI RTX 2080 Gaming X Trio
GeForce RTX 2080 (Desktop), R7 2700X |
124 (109min - 167max) fps -18% |
MSI RTX 2060 Gaming Z 6G
GeForce RTX 2060 (Desktop), R7 2700X |
122.4 (108min - 163max) fps -19% |
Nvidia GeForce RTX 2070 Super
GeForce RTX 2070 Super (Desktop), R7 2700X |
121 (107min - 161max) fps -20% |
MSI RTX 2070 Gaming Z 8G
GeForce RTX 2070 (Desktop), R7 2700X |
120.7 (108min - 159max) fps -20% |
Nvidia GeForce RTX 2060 Super
GeForce RTX 2060 Super (Desktop), R7 2700X |
118 (106min - 156max) fps -22% |
Nvidia GeForce RTX 2080 Super
GeForce RTX 2080 Super (Desktop), R7 2700X |
117 (101min - 154max) fps -23% |
AMD Radeon RX 5700 XT
Radeon RX 5700 XT (Desktop), R7 2700X |
116 (101min - 151max) fps -23% |
AMD Radeon VII
Radeon VII, R7 2700X |
111 (99min - 144max) fps -26% |
AMD Radeon RX Vega 64
RX Vega 64, R7 2700X |
100 (72min - 144max) fps -34% |
AMD Radeon RX 5700
Radeon RX 5700 (Desktop), R7 2700X |
94 (76min - 121max) fps -38% |
|
Nvidia Titan RTX
Titan RTX, R7 2700X, ADATA Premier Pro SP900NS38 512 GB |
112 (89min - 160max) fps +44% |
Nvidia GeForce RTX 2080 Super
GeForce RTX 2080 Super (Desktop), R7 2700X |
85 (64min - 144max) fps +9% |
MSI RTX 2080 Gaming X Trio
GeForce RTX 2080 (Desktop), R7 2700X |
83 (63min - 149max) fps +7% |
KFA2 GeForce RTX 2070 Super Work The Frames
GeForce RTX 2070 Super (Desktop), R9 3900X |
77.7 (57min - 147max) fps |
Nvidia GeForce RTX 2070 Super
GeForce RTX 2070 Super (Desktop), R7 2700X |
76 (56min - 135max) fps -2% |
MSI RTX 2070 Gaming Z 8G
GeForce RTX 2070 (Desktop), R7 2700X |
72 (55min - 125max) fps -7% |
Nvidia GeForce RTX 2060 Super
GeForce RTX 2060 Super (Desktop), R7 2700X |
65 (48min - 114max) fps -16% |
MSI RTX 2060 Gaming Z 6G
GeForce RTX 2060 (Desktop), R7 2700X |
54.9 (42min - 98max) fps -29% |
AMD Radeon RX 5700 XT
Radeon RX 5700 XT (Desktop), R7 2700X |
53.2 (39min - 102max) fps -32% |
AMD Radeon VII
Radeon VII, R7 2700X |
51.1 (38min - 94max) fps -34% |
AMD Radeon RX 5700
Radeon RX 5700 (Desktop), R7 2700X |
46.2 (35min - 91max) fps -41% |
AMD Radeon RX Vega 64
RX Vega 64, R7 2700X |
41.5 (33min - 69max) fps -47% |
|
KFA2 GeForce RTX 2070 Super Work The Frames
GeForce RTX 2070 Super (Desktop), R9 3900X |
132 (105min - 196max) fps |
MSI RTX 2080 Gaming X Trio
GeForce RTX 2080 (Desktop), R7 2700X |
123 (109min - 166max) fps -7% |
Nvidia GeForce RTX 2080 Super
GeForce RTX 2080 Super (Desktop), R7 2700X |
122 (106min - 162max) fps -8% |
MSI RTX 2070 Gaming Z 8G
GeForce RTX 2070 (Desktop), R7 2700X |
118.4 (101min - 160max) fps -10% |
Nvidia GeForce RTX 2070 Super
GeForce RTX 2070 Super (Desktop), R7 2700X |
118 (95min - 158max) fps -11% |
Nvidia GeForce RTX 2060 Super
GeForce RTX 2060 Super (Desktop), R7 2700X |
111 (91min - 154max) fps -16% |
AMD Radeon RX 5700 XT
Radeon RX 5700 XT (Desktop), R7 2700X |
93 (73min - 145max) fps -30% |
AMD Radeon RX 5700
Radeon RX 5700 (Desktop), R7 2700X |
87 (68min - 140max) fps -34% |
|
|
KFA2 GeForce RTX 2070 Super Work The Frames
GeForce RTX 2070 Super (Desktop), R9 3900X | |
Nvidia Titan RTX
Titan RTX, R7 2700X, ADATA Premier Pro SP900NS38 512 GB |
131 (69min - 164max) fps -6% |
MSI RTX 2080 Gaming X Trio
GeForce RTX 2080 (Desktop), R7 2700X |
129 (66min - 164max) fps -7% |
Nvidia GeForce RTX 2070 Super
GeForce RTX 2070 Super (Desktop), R7 2700X |
127 (67min - 150max) fps -9% |
Nvidia GeForce RTX 2080 Super
GeForce RTX 2080 Super (Desktop), R7 2700X |
124 (70min - 156max) fps -11% |
MSI RTX 2070 Gaming Z 8G
GeForce RTX 2070 (Desktop), R7 2700X |
121.1 (67min - 144max) fps -13% |
AMD Radeon RX 5700 XT
Radeon RX 5700 XT (Desktop), R7 2700X |
121 (52min - 160max) fps -13% |
AMD Radeon VII
Radeon VII, R7 2700X |
119 (58min - 142max) fps -14% |
MSI RTX 2060 Gaming Z 6G
GeForce RTX 2060 (Desktop), R7 2700X |
110 (71min - 125max) fps -21% |
Nvidia GeForce RTX 2060 Super
GeForce RTX 2060 Super (Desktop), R7 2700X |
108 (63min - 126max) fps -22% |
AMD Radeon RX 5700
Radeon RX 5700 (Desktop), R7 2700X |
103 (49min - 123max) fps -26% |
AMD Radeon RX Vega 64
RX Vega 64, R7 2700X |
99.4 (48min - 116max) fps -28% |
|
Nvidia Titan RTX
Titan RTX, R7 2700X, ADATA Premier Pro SP900NS38 512 GB |
74 (57min - 84max) fps +43% |
MSI RTX 2080 Gaming X Trio
GeForce RTX 2080 (Desktop), R7 2700X |
57.6 (47min - 65max) fps +12% |
Nvidia GeForce RTX 2080 Super
GeForce RTX 2080 Super (Desktop), R7 2700X |
55.3 (46min - 64max) fps +7% |
KFA2 GeForce RTX 2070 Super Work The Frames
GeForce RTX 2070 Super (Desktop), R9 3900X | |
Nvidia GeForce RTX 2070 Super
GeForce RTX 2070 Super (Desktop), R7 2700X |
51.3 (42min - 58max) fps -1% |
MSI RTX 2070 Gaming Z 8G
GeForce RTX 2070 (Desktop), R7 2700X |
45.9 (40min - 52max) fps -11% |
AMD Radeon VII
Radeon VII, R7 2700X |
44.2 (35min - 50max) fps -14% |
AMD Radeon RX 5700 XT
Radeon RX 5700 XT (Desktop), R7 2700X |
41.7 (34min - 47max) fps -19% |
Nvidia GeForce RTX 2060 Super
GeForce RTX 2060 Super (Desktop), R7 2700X |
41.6 (33min - 47max) fps -19% |
AMD Radeon RX 5700
Radeon RX 5700 (Desktop), R7 2700X |
37.1 (31min - 42max) fps -28% |
AMD Radeon RX Vega 64
RX Vega 64, R7 2700X |
35.8 (31min - 40max) fps -31% |
MSI RTX 2060 Gaming Z 6G
GeForce RTX 2060 (Desktop), R7 2700X |
34.9 (31min - 40max) fps -32% |
|
|
Nvidia Titan RTX
Titan RTX, R7 2700X, ADATA Premier Pro SP900NS38 512 GB |
151 (144min - 159max) fps +28% |
Nvidia GeForce RTX 2080 Super
GeForce RTX 2080 Super (Desktop), R7 2700X |
124 (115min - 132max) fps +5% |
MSI RTX 2080 Gaming X Trio
GeForce RTX 2080 (Desktop), R7 2700X |
123 (115min - 131max) fps +4% |
KFA2 GeForce RTX 2070 Super Work The Frames
GeForce RTX 2070 Super (Desktop), R9 3900X |
118 (110min - 126max) fps |
Nvidia GeForce RTX 2070 Super
GeForce RTX 2070 Super (Desktop), R7 2700X |
114 (106min - 121max) fps -3% |
AMD Radeon RX 5700 XT
Radeon RX 5700 XT (Desktop), R7 2700X |
106 (99min - 120max) fps -10% |
MSI RTX 2070 Gaming Z 8G
GeForce RTX 2070 (Desktop), R7 2700X |
105.5 (97min - 112max) fps -11% |
Nvidia GeForce RTX 2060 Super
GeForce RTX 2060 Super (Desktop), R7 2700X |
102 (94min - 109max) fps -14% |
AMD Radeon VII
Radeon VII, R7 2700X |
101 (93min - 113max) fps -14% |
MSI RTX 2060 Gaming Z 6G
GeForce RTX 2060 (Desktop), R7 2700X |
93 (86min - 103max) fps -21% |
AMD Radeon RX Vega 64
RX Vega 64, R7 2700X |
92.3 (85min - 101max) fps -22% |
AMD Radeon RX 5700
Radeon RX 5700 (Desktop), R7 2700X |
88 (27min - 102max) fps -25% |
|
Nvidia Titan RTX
Titan RTX, R7 2700X, ADATA Premier Pro SP900NS38 512 GB |
67 (63min - 72max) fps +41% |
Nvidia GeForce RTX 2080 Super
GeForce RTX 2080 Super (Desktop), R7 2700X |
53.4 (50min - 57max) fps +12% |
MSI RTX 2080 Gaming X Trio
GeForce RTX 2080 (Desktop), R7 2700X |
50 (47min - 53max) fps +5% |
Nvidia GeForce RTX 2070 Super
GeForce RTX 2070 Super (Desktop), R7 2700X |
48.6 (45min - 51max) fps +2% |
KFA2 GeForce RTX 2070 Super Work The Frames
GeForce RTX 2070 Super (Desktop), R9 3900X | |
AMD Radeon VII
Radeon VII, R7 2700X |
45.7 (42min - 49max) fps -4% |
AMD Radeon RX 5700 XT
Radeon RX 5700 XT (Desktop), R7 2700X |
44.1 (40min - 47max) fps -7% |
MSI RTX 2070 Gaming Z 8G
GeForce RTX 2070 (Desktop), R7 2700X |
43.2 (36min - 47max) fps -9% |
Nvidia GeForce RTX 2060 Super
GeForce RTX 2060 Super (Desktop), R7 2700X |
41 (38min - 44max) fps -14% |
AMD Radeon RX 5700
Radeon RX 5700 (Desktop), R7 2700X |
39.2 (36min - 42max) fps -18% |
MSI RTX 2060 Gaming Z 6G
GeForce RTX 2060 (Desktop), R7 2700X |
37.4 (30min - 41max) fps -21% |
AMD Radeon RX Vega 64
RX Vega 64, R7 2700X |
36.4 (33min - 41max) fps -24% |
|
Nvidia GeForce RTX 2080 Super
GeForce RTX 2080 Super (Desktop), R7 2700X |
93 (87min - 99max) fps +9% |
MSI RTX 2080 Gaming X Trio
GeForce RTX 2080 (Desktop), R7 2700X |
88 (81min - 92max) fps +3% |
Nvidia GeForce RTX 2070 Super
GeForce RTX 2070 Super (Desktop), R7 2700X |
86 (79min - 90max) fps +1% |
KFA2 GeForce RTX 2070 Super Work The Frames
GeForce RTX 2070 Super (Desktop), R9 3900X | |
AMD Radeon RX 5700 XT
Radeon RX 5700 XT (Desktop), R7 2700X |
84 (77min - 89max) fps -1% |
MSI RTX 2070 Gaming Z 8G
GeForce RTX 2070 (Desktop), R7 2700X |
75.4 (70min - 81max) fps -12% |
Nvidia GeForce RTX 2060 Super
GeForce RTX 2060 Super (Desktop), R7 2700X |
75 (70min - 80max) fps -12% |
AMD Radeon RX 5700
Radeon RX 5700 (Desktop), R7 2700X |
73 (67min - 78max) fps -14% |
|
|
KFA2 GeForce RTX 2070 Super Work The Frames
GeForce RTX 2070 Super (Desktop), R9 3900X | |
AMD Radeon RX 5700 XT
Radeon RX 5700 XT (Desktop), R9 3900X |
97 (69min - 147max) fps -1% |
MSI RTX 2080 Gaming X Trio
GeForce RTX 2080 (Desktop), R7 2700X |
92 (65min - 147max) fps -6% |
AMD Ryzen 9 3900X
Titan RTX, R9 3900X, Corsair MP600 |
92 (64min - 140max) fps -6% |
MSI RTX 2070 Gaming Z 8G
GeForce RTX 2070 (Desktop), R7 2700X |
90 (65min - 138max) fps -8% |
MSI RTX 2060 Gaming Z 6G
GeForce RTX 2060 (Desktop), R7 2700X |
88 (66min - 125max) fps -10% |
Nvidia GeForce RTX 2070 Super
GeForce RTX 2070 Super (Desktop), R7 2700X |
87 (63min - 135max) fps -11% |
Nvidia GeForce RTX 2080 Super
GeForce RTX 2080 Super (Desktop), R7 2700X |
86 (63min - 133max) fps -12% |
AMD Radeon RX Vega 64
RX Vega 64, R7 2700X |
85 (62min - 130max) fps -13% |
Nvidia GeForce RTX 2060 Super
GeForce RTX 2060 Super (Desktop), R7 2700X |
85 (63min - 134max) fps -13% |
AMD Radeon VII
Radeon VII, R7 2700X |
83 (59min - 128max) fps -15% |
AMD Radeon RX 5700
Radeon RX 5700 (Desktop), R7 2700X |
83 (60min - 132max) fps -15% |
AMD Radeon RX 5700 XT
Radeon RX 5700 XT (Desktop), R7 2700X |
79 (58min - 120max) fps -19% |
Nvidia Titan RTX 24 GB
Titan RTX, TR 2920X |
72 (51min - 112max) fps -27% |
|
AMD Ryzen 9 3900X
Titan RTX, R9 3900X, Corsair MP600 |
81 (68min - 98max) fps +45% |
Nvidia Titan RTX 24 GB
Titan RTX, TR 2920X |
68 (52min - 98max) fps +21% |
Nvidia GeForce RTX 2080 Super
GeForce RTX 2080 Super (Desktop), R7 2700X |
64 (54min - 81max) fps +14% |
MSI RTX 2080 Gaming X Trio
GeForce RTX 2080 (Desktop), R7 2700X |
62 (52min - 76max) fps +11% |
AMD Radeon VII
Radeon VII, R7 2700X |
61 (50min - 80max) fps +9% |
Nvidia GeForce RTX 2070 Super
GeForce RTX 2070 Super (Desktop), R7 2700X |
58 (48min - 72max) fps +4% |
AMD Radeon RX 5700 XT
Radeon RX 5700 XT (Desktop), R7 2700X |
56 (47min - 73max) fps 0% |
KFA2 GeForce RTX 2070 Super Work The Frames
GeForce RTX 2070 Super (Desktop), R9 3900X | |
MSI RTX 2070 Gaming Z 8G
GeForce RTX 2070 (Desktop), R7 2700X |
51 (43min - 61max) fps -9% |
AMD Radeon RX 5700
Radeon RX 5700 (Desktop), R7 2700X |
51 (42min - 67max) fps -9% |
Nvidia GeForce RTX 2060 Super
GeForce RTX 2060 Super (Desktop), R7 2700X |
50 (41min - 62max) fps -11% |
AMD Radeon RX Vega 64
RX Vega 64, R7 2700X |
47 (38min - 60max) fps -16% |
MSI RTX 2060 Gaming Z 6G
GeForce RTX 2060 (Desktop), R7 2700X |
42 (35min - 52max) fps -25% |
|
AMD Ryzen 9 3900X
Titan RTX, R9 3900X, Corsair MP600 |
97 (70min - 153max) fps +7% |
KFA2 GeForce RTX 2070 Super Work The Frames
GeForce RTX 2070 Super (Desktop), R9 3900X | |
MSI RTX 2080 Gaming X Trio
GeForce RTX 2080 (Desktop), R7 2700X |
89 (65min - 129max) fps -2% |
Nvidia GeForce RTX 2070 Super
GeForce RTX 2070 Super (Desktop), R7 2700X |
86 (61min - 125max) fps -5% |
AMD Radeon VII
Radeon VII, R7 2700X |
83 (59min - 127max) fps -9% |
Nvidia GeForce RTX 2080 Super
GeForce RTX 2080 Super (Desktop), R7 2700X |
83 (60min - 129max) fps -9% |
MSI RTX 2070 Gaming Z 8G
GeForce RTX 2070 (Desktop), R7 2700X |
82 (64min - 110max) fps -10% |
AMD Radeon RX 5700 XT
Radeon RX 5700 XT (Desktop), R7 2700X |
80 (58min - 122max) fps -12% |
AMD Radeon RX Vega 64
RX Vega 64, R7 2700X |
79 (61min - 110max) fps -13% |
Nvidia GeForce RTX 2060 Super
GeForce RTX 2060 Super (Desktop), R7 2700X |
79 (60min - 111max) fps -13% |
AMD Radeon RX 5700
Radeon RX 5700 (Desktop), R7 2700X |
79 (59min - 118max) fps -13% |
MSI RTX 2060 Gaming Z 6G
GeForce RTX 2060 (Desktop), R7 2700X |
76 (61min - 95max) fps -16% |
Nvidia Titan RTX 24 GB
Titan RTX, TR 2920X |
71 (51min - 112max) fps -22% |
|
|
AMD Ryzen 9 3900X
Titan RTX, R9 3900X, Corsair MP600 |
98.8 (49.5min - 151.52max) fps +41% |
Nvidia GeForce RTX 2080 Super
GeForce RTX 2080 Super (Desktop), R7 2700X |
76 (38.54min - 122.4max) fps +9% |
MSI RTX 2080 Gaming X Trio
GeForce RTX 2080 (Desktop), R7 2700X |
74.2 (38min - 122max) fps +6% |
Nvidia Titan RTX 24 GB
Titan RTX, TR 2920X |
73 (40min - 107max) fps +4% |
KFA2 GeForce RTX 2070 Super Work The Frames
GeForce RTX 2070 Super (Desktop), R9 3900X | |
Nvidia GeForce RTX 2070 Super
GeForce RTX 2070 Super (Desktop), R7 2700X |
67.8 (36min - 110max) fps -3% |
AMD Radeon VII
Radeon VII, R7 2700X |
67.2 (36min - 104max) fps -4% |
AMD Radeon RX 5700 XT
Radeon RX 5700 XT (Desktop), R7 2700X |
61 (36.09min - 86.1max) fps -13% |
MSI RTX 2070 Gaming Z 8G
GeForce RTX 2070 (Desktop), R7 2700X |
60.4 (32min - 94max) fps -14% |
Nvidia GeForce RTX 2060 Super
GeForce RTX 2060 Super (Desktop), R7 2700X |
58.9 (32min - 92max) fps -16% |
AMD Radeon RX 5700
Radeon RX 5700 (Desktop), R7 2700X |
58.6 (32.67min - 85.8max) fps -16% |
AMD Radeon RX Vega 64
RX Vega 64, R7 2700X |
56.4 (30min - 87max) fps -19% |
MSI RTX 2060 Gaming Z 6G
GeForce RTX 2060 (Desktop), R7 2700X |
52.7 (29min - 82max) fps -25% |
|
AMD Ryzen 9 3900X
Titan RTX, R9 3900X, Corsair MP600 |
53.7 (33.8min - 83.74max) fps +45% |
Nvidia Titan RTX 24 GB
Titan RTX, TR 2920X |
51.3 (33min - 76max) fps +39% |
AMD Radeon RX Vega 64
RX Vega 64, R7 2700X |
45.7 (26min - 67max) fps +24% |
Nvidia GeForce RTX 2080 Super
GeForce RTX 2080 Super (Desktop), R7 2700X |
40 (25.84min - 59.35max) fps +8% |
MSI RTX 2080 Gaming X Trio
GeForce RTX 2080 (Desktop), R7 2700X |
38.6 (25min - 58max) fps +4% |
AMD Radeon VII
Radeon VII, R7 2700X |
37.4 (25min - 50max) fps +1% |
KFA2 GeForce RTX 2070 Super Work The Frames
GeForce RTX 2070 Super (Desktop), R9 3900X | |
Nvidia GeForce RTX 2070 Super
GeForce RTX 2070 Super (Desktop), R7 2700X |
35 (23min - 51max) fps -5% |
MSI RTX 2070 Gaming Z 8G
GeForce RTX 2070 (Desktop), R7 2700X |
31.9 (21min - 45max) fps -14% |
Nvidia GeForce RTX 2060 Super
GeForce RTX 2060 Super (Desktop), R7 2700X |
29.7 (20min - 42max) fps -20% |
AMD Radeon RX 5700 XT
Radeon RX 5700 XT (Desktop), R7 2700X |
29.6 (20.7min - 36.64max) fps -20% |
AMD Radeon RX 5700
Radeon RX 5700 (Desktop), R7 2700X |
28.6 (19.67min - 36.24max) fps -23% |
MSI RTX 2060 Gaming Z 6G
GeForce RTX 2060 (Desktop), R7 2700X |
26.3 (17min - 38max) fps -29% |
|
AMD Ryzen 9 3900X
Titan RTX, R9 3900X, Corsair MP600 |
79.9 (42.08min - 131.72max) fps +40% |
Nvidia Titan RTX 24 GB
Titan RTX, TR 2920X |
69 (39min - 102max) fps +21% |
Nvidia GeForce RTX 2080 Super
GeForce RTX 2080 Super (Desktop), R7 2700X |
61 (35.51min - 95.82max) fps +7% |
MSI RTX 2080 Gaming X Trio
GeForce RTX 2080 (Desktop), R7 2700X |
59.6 (34min - 93max) fps +5% |
KFA2 GeForce RTX 2070 Super Work The Frames
GeForce RTX 2070 Super (Desktop), R9 3900X | |
AMD Radeon VII
Radeon VII, R7 2700X |
55.8 (33min - 81max) fps -2% |
AMD Radeon RX 5700 XT
Radeon RX 5700 XT (Desktop), R7 2700X |
54.5 (31.85min - 78.06max) fps -4% |
Nvidia GeForce RTX 2070 Super
GeForce RTX 2070 Super (Desktop), R7 2700X |
54.3 (32min - 83max) fps -5% |
MSI RTX 2070 Gaming Z 8G
GeForce RTX 2070 (Desktop), R7 2700X |
50.3 (30min - 76max) fps -12% |
AMD Radeon RX 5700
Radeon RX 5700 (Desktop), R7 2700X |
48.4 (28.7min - 68.51max) fps -15% |
Nvidia GeForce RTX 2060 Super
GeForce RTX 2060 Super (Desktop), R7 2700X |
46.5 (28min - 69max) fps -18% |
AMD Radeon RX Vega 64
RX Vega 64, R7 2700X |
45.7 (26min - 46max) fps -20% |
MSI RTX 2060 Gaming Z 6G
GeForce RTX 2060 (Desktop), R7 2700X |
41.5 (25min - 61max) fps -27% |
|
|
KFA2 GeForce RTX 2070 Super Work The Frames
GeForce RTX 2070 Super (Desktop), R9 3900X | |
MSI RTX 2080 Gaming X Trio
GeForce RTX 2080 (Desktop), R7 2700X |
97 (77min - 137max) fps -16% |
Nvidia GeForce RTX 2080 Super
GeForce RTX 2080 Super (Desktop), R7 2700X |
95 (76min - 122max) fps -18% |
AMD Radeon RX Vega 64
RX Vega 64, R7 2700X |
93 (76min - 118max) fps -20% |
Nvidia GeForce RTX 2070 Super
GeForce RTX 2070 Super (Desktop), R7 2700X |
93 (76min - 135max) fps -20% |
Nvidia Titan RTX 24 GB
Titan RTX, TR 2920X |
92 (76min - 124max) fps -21% |
MSI RTX 2070 Gaming Z 8G
GeForce RTX 2070 (Desktop), R7 2700X |
91 (75min - 115max) fps -22% |
AMD Radeon VII
Radeon VII, R7 2700X |
90.5 (70min - 125max) fps -22% |
Nvidia GeForce RTX 2060 Super
GeForce RTX 2060 Super (Desktop), R7 2700X |
89 (68min - 126max) fps -23% |
MSI RTX 2060 Gaming Z 6G
GeForce RTX 2060 (Desktop), R7 2700X |
88 (56min - 109max) fps -24% |
AMD Radeon RX 5700 XT
Radeon RX 5700 XT (Desktop), R7 2700X |
88 (69min - 121max) fps -24% |
AMD Radeon RX 5700
Radeon RX 5700 (Desktop), R7 2700X |
86 (65min - 122max) fps -26% |
|
KFA2 GeForce RTX 2070 Super Work The Frames
GeForce RTX 2070 Super (Desktop), R9 3900X | |
Nvidia Titan RTX 24 GB
Titan RTX, TR 2920X |
90 (74min - 121max) fps -17% |
MSI RTX 2080 Gaming X Trio
GeForce RTX 2080 (Desktop), R7 2700X |
89 (49min - 116max) fps -18% |
Nvidia GeForce RTX 2080 Super
GeForce RTX 2080 Super (Desktop), R7 2700X |
87 (55min - 114max) fps -19% |
AMD Radeon RX 5700 XT
Radeon RX 5700 XT (Desktop), R7 2700X |
84 (69min - 100max) fps -22% |
AMD Radeon VII
Radeon VII, R7 2700X |
82.8 (69min - 98max) fps -23% |
Nvidia GeForce RTX 2070 Super
GeForce RTX 2070 Super (Desktop), R7 2700X |
81 (60min - 107max) fps -25% |
MSI RTX 2070 Gaming Z 8G
GeForce RTX 2070 (Desktop), R7 2700X |
77.1 (64min - 95max) fps -29% |
AMD Radeon RX 5700
Radeon RX 5700 (Desktop), R7 2700X |
76 (65min - 87max) fps -30% |
AMD Radeon RX Vega 64
RX Vega 64, R7 2700X |
73 (62min - 85max) fps -32% |
Nvidia GeForce RTX 2060 Super
GeForce RTX 2060 Super (Desktop), R7 2700X |
72 (36min - 91max) fps -33% |
MSI RTX 2060 Gaming Z 6G
GeForce RTX 2060 (Desktop), R7 2700X |
66 (57min - 79max) fps -39% |
|
|
Nvidia Titan RTX 24 GB
Titan RTX, TR 2920X |
148 (132min - 164max) fps +26% |
Nvidia GeForce RTX 2080 Super
GeForce RTX 2080 Super (Desktop), R7 2700X |
129 (118min - 141max) fps +10% |
AMD Radeon RX 5700 XT
Radeon RX 5700 XT (Desktop), R7 2700X |
120 (109min - 136max) fps +3% |
KFA2 GeForce RTX 2070 Super Work The Frames
GeForce RTX 2070 Super (Desktop), R9 3900X |
117 (108min - 130max) fps |
Nvidia GeForce RTX 2070 Super
GeForce RTX 2070 Super (Desktop), R7 2700X |
115 (107min - 127max) fps -2% |
MSI RTX 2080 Gaming X Trio
GeForce RTX 2080 (Desktop), R7 2700X |
109 (101min - 120max) fps -7% |
AMD Radeon VII
Radeon VII, R7 2700X |
106.5 (99min - 121max) fps -9% |
AMD Radeon RX 5700
Radeon RX 5700 (Desktop), R7 2700X |
103 (83min - 119max) fps -12% |
MSI RTX 2070 Gaming Z 8G
GeForce RTX 2070 (Desktop), R7 2700X |
93.2 (86min - 104max) fps -20% |
Nvidia GeForce RTX 2060 Super
GeForce RTX 2060 Super (Desktop), R7 2700X |
93 (77min - 111max) fps -21% |
AMD Radeon RX Vega 64
RX Vega 64, R7 2700X |
89.7 (82min - 100max) fps -23% |
MSI RTX 2060 Gaming Z 6G
GeForce RTX 2060 (Desktop), R7 2700X |
84.4 (77min - 93max) fps -28% |
|
Nvidia Titan RTX 24 GB
Titan RTX, TR 2920X |
83 (77min - 92max) fps +54% |
Nvidia GeForce RTX 2080 Super
GeForce RTX 2080 Super (Desktop), R7 2700X |
63 (58min - 69max) fps +17% |
MSI RTX 2080 Gaming X Trio
GeForce RTX 2080 (Desktop), R7 2700X |
56.7 (53min - 63max) fps +5% |
KFA2 GeForce RTX 2070 Super Work The Frames
GeForce RTX 2070 Super (Desktop), R9 3900X | |
Nvidia GeForce RTX 2070 Super
GeForce RTX 2070 Super (Desktop), R7 2700X |
53.8 (50min - 59max) fps 0% |
AMD Radeon VII
Radeon VII, R7 2700X |
52.5 (48min - 57max) fps -3% |
AMD Radeon RX 5700 XT
Radeon RX 5700 XT (Desktop), R7 2700X |
49.9 (46min - 55max) fps -7% |
MSI RTX 2070 Gaming Z 8G
GeForce RTX 2070 (Desktop), R7 2700X |
45.9 (43min - 50max) fps -15% |
AMD Radeon RX 5700
Radeon RX 5700 (Desktop), R7 2700X |
43.4 (40min - 48max) fps -19% |
Nvidia GeForce RTX 2060 Super
GeForce RTX 2060 Super (Desktop), R7 2700X |
42.8 (39min - 51max) fps -21% |
AMD Radeon RX Vega 64
RX Vega 64, R7 2700X |
41.5 (38min - 46max) fps -23% |
MSI RTX 2060 Gaming Z 6G
GeForce RTX 2060 (Desktop), R7 2700X |
39.9 (37min - 44max) fps -26% |
|
Nvidia Titan RTX 24 GB
Titan RTX, TR 2920X |
132 (123min - 146max) fps +48% |
Nvidia GeForce RTX 2080 Super
GeForce RTX 2080 Super (Desktop), R7 2700X |
100 (94min - 110max) fps +12% |
KFA2 GeForce RTX 2070 Super Work The Frames
GeForce RTX 2070 Super (Desktop), R9 3900X | |
Nvidia GeForce RTX 2070 Super
GeForce RTX 2070 Super (Desktop), R7 2700X |
88 (83min - 97max) fps -2% |
AMD Radeon RX 5700 XT
Radeon RX 5700 XT (Desktop), R7 2700X |
88 (82min - 98max) fps -2% |
MSI RTX 2080 Gaming X Trio
GeForce RTX 2080 (Desktop), R7 2700X |
87 (82min - 95max) fps -3% |
AMD Radeon VII
Radeon VII, R7 2700X |
83.3 (78min - 91max) fps -7% |
AMD Radeon RX 5700
Radeon RX 5700 (Desktop), R7 2700X |
77 (69min - 88max) fps -14% |
MSI RTX 2070 Gaming Z 8G
GeForce RTX 2070 (Desktop), R7 2700X |
73.8 (70min - 81max) fps -17% |
Nvidia GeForce RTX 2060 Super
GeForce RTX 2060 Super (Desktop), R7 2700X |
71 (62min - 83max) fps -21% |
AMD Radeon RX Vega 64
RX Vega 64, R7 2700X |
69.3 (65min - 76max) fps -22% |
MSI RTX 2060 Gaming Z 6G
GeForce RTX 2060 (Desktop), R7 2700X |
64.9 (60min - 72max) fps -27% |
|
|
Nvidia Titan RTX 24 GB
Titan RTX, TR 2920X | |
MSI RTX 2080 Gaming X Trio
GeForce RTX 2080 (Desktop), R7 2700X | |
Nvidia GeForce RTX 2080 Super
GeForce RTX 2080 Super (Desktop), R7 2700X | |
KFA2 GeForce RTX 2070 Super Work The Frames
GeForce RTX 2070 Super (Desktop), R9 3900X | |
MSI RTX 2070 Gaming Z 8G
GeForce RTX 2070 (Desktop), R7 2700X | |
Nvidia GeForce RTX 2070 Super
GeForce RTX 2070 Super (Desktop), R7 2700X | |
AMD Radeon RX 5700 XT
Radeon RX 5700 XT (Desktop), R7 2700X |
88 (30.2min, 50P1) fps -8% |
MSI RTX 2060 Gaming Z 6G
GeForce RTX 2060 (Desktop), R7 2700X | |
Nvidia GeForce RTX 2060 Super
GeForce RTX 2060 Super (Desktop), R7 2700X | |
AMD Radeon RX Vega 64
RX Vega 64, R7 2700X | |
AMD Radeon RX 5700
Radeon RX 5700 (Desktop), R7 2700X |
78 (14.6min, 42.2P1) fps -19% |
|
Nvidia Titan RTX 24 GB
Titan RTX, TR 2920X | |
MSI RTX 2080 Gaming X Trio
GeForce RTX 2080 (Desktop), R7 2700X | |
Nvidia GeForce RTX 2080 Super
GeForce RTX 2080 Super (Desktop), R7 2700X | |
MSI RTX 2070 Gaming Z 8G
GeForce RTX 2070 (Desktop), R7 2700X | |
Nvidia GeForce RTX 2070 Super
GeForce RTX 2070 Super (Desktop), R7 2700X | |
KFA2 GeForce RTX 2070 Super Work The Frames
GeForce RTX 2070 Super (Desktop), R9 3900X | |
AMD Radeon RX 5700 XT
Radeon RX 5700 XT (Desktop), R7 2700X |
34.1 (16.9min, 21.4P1) fps -8% |
MSI RTX 2060 Gaming Z 6G
GeForce RTX 2060 (Desktop), R7 2700X | |
AMD Radeon RX Vega 64
RX Vega 64, R7 2700X | |
Nvidia GeForce RTX 2060 Super
GeForce RTX 2060 Super (Desktop), R7 2700X | |
AMD Radeon RX 5700
Radeon RX 5700 (Desktop), R7 2700X |
30 (2.5min, 24.3P1) fps -19% |
|
Nvidia Titan RTX 24 GB
Titan RTX, TR 2920X | |
MSI RTX 2080 Gaming X Trio
GeForce RTX 2080 (Desktop), R7 2700X | |
Nvidia GeForce RTX 2080 Super
GeForce RTX 2080 Super (Desktop), R7 2700X | |
MSI RTX 2070 Gaming Z 8G
GeForce RTX 2070 (Desktop), R7 2700X | |
Nvidia GeForce RTX 2070 Super
GeForce RTX 2070 Super (Desktop), R7 2700X | |
KFA2 GeForce RTX 2070 Super Work The Frames
GeForce RTX 2070 Super (Desktop), R9 3900X | |
AMD Radeon RX 5700 XT
Radeon RX 5700 XT (Desktop), R7 2700X |
64 (33.2min, 45.2P1) fps -4% |
MSI RTX 2060 Gaming Z 6G
GeForce RTX 2060 (Desktop), R7 2700X | |
Nvidia GeForce RTX 2060 Super
GeForce RTX 2060 Super (Desktop), R7 2700X | |
AMD Radeon RX Vega 64
RX Vega 64, R7 2700X | |
AMD Radeon RX 5700
Radeon RX 5700 (Desktop), R7 2700X |
56.9 (22.8min, 39.8P1) fps -15% |
|
|
Nvidia GeForce RTX 2080 Super
GeForce RTX 2080 Super (Desktop), R7 2700X |
35.1 (30min - 44max) fps +22% |
Nvidia Titan RTX 24 GB
Titan RTX, TR 2920X |
33 (27min - 40max) fps +15% |
MSI RTX 2080 Gaming X Trio
GeForce RTX 2080 (Desktop), R7 2700X |
32.3 (30min - 35max) fps +12% |
Nvidia GeForce RTX 2070 Super
GeForce RTX 2070 Super (Desktop), R7 2700X |
30.4 (24min - 34max) fps +6% |
KFA2 GeForce RTX 2070 Super Work The Frames
GeForce RTX 2070 Super (Desktop), R9 3900X | |
MSI RTX 2070 Gaming Z 8G
GeForce RTX 2070 (Desktop), R7 2700X |
25.5 (24min - 29max) fps -11% |
AMD Radeon RX 5700 XT
Radeon RX 5700 XT (Desktop), R7 2700X |
25.5 (24min - 28max) fps -11% |
Nvidia GeForce RTX 2060 Super
GeForce RTX 2060 Super (Desktop), R7 2700X |
25 (24min - 27max) fps -13% |
AMD Radeon RX 5700
Radeon RX 5700 (Desktop), R7 2700X |
20.4 (19min - 23max) fps -29% |
MSI RTX 2060 Gaming Z 6G
GeForce RTX 2060 (Desktop), R7 2700X |
19.8 (16min - 23max) fps -31% |
AMD Radeon RX Vega 64
RX Vega 64, R7 2700X |
14.8 (14min - 16max) fps -49% |
|
AMD Radeon RX 5700 XT
Radeon RX 5700 XT (Desktop), R9 3900X |
45 (37min - 58max) fps +1% |
KFA2 GeForce RTX 2070 Super Work The Frames
GeForce RTX 2070 Super (Desktop), R9 3900X | |
MSI RTX 2080 Gaming X Trio
GeForce RTX 2080 (Desktop), R7 2700X |
43.3 (38min - 59max) fps -2% |
Nvidia GeForce RTX 2070 Super
GeForce RTX 2070 Super (Desktop), R7 2700X |
42.1 (36min - 45max) fps -5% |
AMD Radeon RX 5700 XT
Radeon RX 5700 XT (Desktop), R7 2700X |
40.9 (35min - 53max) fps -8% |
MSI RTX 2070 Gaming Z 8G
GeForce RTX 2070 (Desktop), R7 2700X |
40.6 (35min - 49max) fps -9% |
MSI RTX 2060 Gaming Z 6G
GeForce RTX 2060 (Desktop), R7 2700X |
40.3 (36min - 46max) fps -9% |
Nvidia GeForce RTX 2060 Super
GeForce RTX 2060 Super (Desktop), R7 2700X |
40.3 (30min - 55max) fps -9% |
AMD Radeon RX 5700
Radeon RX 5700 (Desktop), R7 2700X |
38.9 (33min - 48max) fps -12% |
Nvidia GeForce RTX 2080 Super
GeForce RTX 2080 Super (Desktop), R7 2700X |
38.6 (31min - 47max) fps -13% |
Nvidia Titan RTX 24 GB
Titan RTX, TR 2920X |
33.9 (29min - 43max) fps -24% |
AMD Radeon RX Vega 64
RX Vega 64, R7 2700X |
33.1 (31min - 35max) fps -25% |
|
KFA2 GeForce RTX 2070 Super Work The Frames
GeForce RTX 2070 Super (Desktop), R9 3900X | |
MSI RTX 2080 Gaming X Trio
GeForce RTX 2080 (Desktop), R7 2700X |
42.8 (37min - 53max) fps -5% |
Nvidia GeForce RTX 2070 Super
GeForce RTX 2070 Super (Desktop), R7 2700X |
39.3 (30min - 39max) fps -13% |
AMD Radeon RX 5700 XT
Radeon RX 5700 XT (Desktop), R7 2700X |
38.6 (34min - 45max) fps -14% |
Nvidia GeForce RTX 2080 Super
GeForce RTX 2080 Super (Desktop), R7 2700X |
38 (33min - 47max) fps -16% |
MSI RTX 2070 Gaming Z 8G
GeForce RTX 2070 (Desktop), R7 2700X |
37.8 (31min - 45max) fps -16% |
Nvidia GeForce RTX 2060 Super
GeForce RTX 2060 Super (Desktop), R7 2700X |
37.5 (31min - 47max) fps -17% |
AMD Radeon RX 5700
Radeon RX 5700 (Desktop), R7 2700X |
37 (33min - 41max) fps -18% |
MSI RTX 2060 Gaming Z 6G
GeForce RTX 2060 (Desktop), R7 2700X |
34 (27min - 38max) fps -25% |
Nvidia Titan RTX 24 GB
Titan RTX, TR 2920X |
33.4 (28min - 43max) fps -26% |
AMD Radeon RX Vega 64
RX Vega 64, R7 2700X |
24.1 (22min - 26max) fps -47% |
|
|
Nvidia Titan RTX 24 GB
Titan RTX, TR 2920X | |
Nvidia GeForce RTX 2080 Super
GeForce RTX 2080 Super (Desktop), R7 2700X | |
MSI RTX 2080 Gaming X Trio
GeForce RTX 2080 (Desktop), R7 2700X | |
KFA2 GeForce RTX 2070 Super Work The Frames
GeForce RTX 2070 Super (Desktop), R9 3900X | |
Nvidia GeForce RTX 2070 Super
GeForce RTX 2070 Super (Desktop), R7 2700X | |
MSI RTX 2070 Gaming Z 8G
GeForce RTX 2070 (Desktop), R7 2700X | |
AMD Radeon RX 5700 XT
Radeon RX 5700 XT (Desktop), R7 2700X | |
Nvidia GeForce RTX 2060 Super
GeForce RTX 2060 Super (Desktop), R7 2700X | |
AMD Radeon RX Vega 64
RX Vega 64, R7 2700X | |
AMD Radeon RX 5700
Radeon RX 5700 (Desktop), R7 2700X | |
MSI RTX 2060 Gaming Z 6G
GeForce RTX 2060 (Desktop), R7 2700X | |
|
Nvidia Titan RTX 24 GB
Titan RTX, TR 2920X | |
KFA2 GeForce RTX 2070 Super Work The Frames
GeForce RTX 2070 Super (Desktop), R9 3900X | |
Nvidia GeForce RTX 2080 Super
GeForce RTX 2080 Super (Desktop), R7 2700X | |
MSI RTX 2080 Gaming X Trio
GeForce RTX 2080 (Desktop), R7 2700X | |
Nvidia GeForce RTX 2070 Super
GeForce RTX 2070 Super (Desktop), R7 2700X | |
MSI RTX 2070 Gaming Z 8G
GeForce RTX 2070 (Desktop), R7 2700X | |
AMD Radeon RX Vega 64
RX Vega 64, R7 2700X | |
Nvidia GeForce RTX 2060 Super
GeForce RTX 2060 Super (Desktop), R7 2700X | |
AMD Radeon RX 5700 XT
Radeon RX 5700 XT (Desktop), R7 2700X | |
MSI RTX 2060 Gaming Z 6G
GeForce RTX 2060 (Desktop), R7 2700X | |
|
Nvidia Titan RTX 24 GB
Titan RTX, TR 2920X | |
Nvidia GeForce RTX 2080 Super
GeForce RTX 2080 Super (Desktop), R7 2700X | |
MSI RTX 2080 Gaming X Trio
GeForce RTX 2080 (Desktop), R7 2700X | |
KFA2 GeForce RTX 2070 Super Work The Frames
GeForce RTX 2070 Super (Desktop), R9 3900X | |
Nvidia GeForce RTX 2070 Super
GeForce RTX 2070 Super (Desktop), R7 2700X | |
MSI RTX 2070 Gaming Z 8G
GeForce RTX 2070 (Desktop), R7 2700X | |
AMD Radeon RX Vega 64
RX Vega 64, R7 2700X | |
Nvidia GeForce RTX 2060 Super
GeForce RTX 2060 Super (Desktop), R7 2700X | |
AMD Radeon RX 5700 XT
Radeon RX 5700 XT (Desktop), R7 2700X | |
AMD Radeon RX 5700
Radeon RX 5700 (Desktop), R7 2700X | |
MSI RTX 2060 Gaming Z 6G
GeForce RTX 2060 (Desktop), R7 2700X | |
|
|
Nvidia Titan RTX 24 GB
Titan RTX, TR 2920X |
98 (87min - 111max) fps +31% |
Nvidia GeForce RTX 2080 Super
GeForce RTX 2080 Super (Desktop), R7 2700X |
79 (70min - 86max) fps +5% |
KFA2 GeForce RTX 2070 Super Work The Frames
GeForce RTX 2070 Super (Desktop), R9 3900X | |
Nvidia GeForce RTX 2070 Super
GeForce RTX 2070 Super (Desktop), R7 2700X |
69 (61min - 77max) fps -8% |
AMD Radeon RX 5700 XT
Radeon RX 5700 XT (Desktop), R7 2700X |
67 (60min - 74max) fps -11% |
AMD Radeon RX 5700
Radeon RX 5700 (Desktop), R7 2700X |
59 (53min - 64max) fps -21% |
Nvidia GeForce RTX 2060 Super
GeForce RTX 2060 Super (Desktop), R7 2700X |
58 (51min - 66max) fps -23% |
AMD Radeon RX Vega 64
RX Vega 64, R7 2700X |
54 (49min - 59max) fps -28% |
|
KFA2 GeForce RTX 2070 Super Work The Frames
GeForce RTX 2070 Super (Desktop), R9 3900X |
157 (138min - 179max) fps |
AMD Radeon RX 5700 XT
Radeon RX 5700 XT (Desktop), R9 3900X |
152 (129min - 171max) fps -3% |
Nvidia GeForce RTX 2080 Super
GeForce RTX 2080 Super (Desktop), R7 2700X |
145 (128min - 161max) fps -8% |
AMD Radeon RX 5700 XT
Radeon RX 5700 XT (Desktop), R7 2700X |
140 (120min - 156max) fps -11% |
Nvidia GeForce RTX 2070 Super
GeForce RTX 2070 Super (Desktop), R7 2700X |
137 (120min - 153max) fps -13% |
Nvidia Titan RTX 24 GB
Titan RTX, TR 2920X |
134 (112min - 152max) fps -15% |
AMD Radeon RX Vega 64
RX Vega 64, R7 2700X |
124 (113min - 135max) fps -21% |
AMD Radeon RX 5700
Radeon RX 5700 (Desktop), R7 2700X |
124 (107min - 140max) fps -21% |
Nvidia GeForce RTX 2060 Super
GeForce RTX 2060 Super (Desktop), R7 2700X |
121 (108min - 136max) fps -23% |
|
Nvidia Titan RTX 24 GB
Titan RTX, TR 2920X |
134 (111min - 152max) fps +9% |
Nvidia GeForce RTX 2080 Super
GeForce RTX 2080 Super (Desktop), R7 2700X |
124 (111min - 138max) fps +1% |
KFA2 GeForce RTX 2070 Super Work The Frames
GeForce RTX 2070 Super (Desktop), R9 3900X |
123 (109min - 137max) fps |
Nvidia GeForce RTX 2070 Super
GeForce RTX 2070 Super (Desktop), R7 2700X |
111 (100min - 125max) fps -10% |
AMD Radeon RX 5700 XT
Radeon RX 5700 XT (Desktop), R7 2700X |
109 (95min - 120max) fps -11% |
AMD Radeon RX 5700
Radeon RX 5700 (Desktop), R7 2700X |
99 (86min - 110max) fps -20% |
Nvidia GeForce RTX 2060 Super
GeForce RTX 2060 Super (Desktop), R7 2700X |
95 (86min - 107max) fps -23% |
AMD Radeon RX Vega 64
RX Vega 64, R7 2700X |
93 (85min - 102max) fps -24% |
|
|
Nvidia Titan RTX 24 GB
Titan RTX, TR 2920X |
135 (118min - 152max) fps +45% |
Nvidia GeForce RTX 2070 Super
GeForce RTX 2070 Super (Desktop), R9 3900X |
95 (83min - 109max) fps +2% |
Nvidia GeForce RTX 2080 Super
GeForce RTX 2080 Super (Desktop), R9 3900X |
95 (83min - 109max) fps +2% |
KFA2 GeForce RTX 2070 Super Work The Frames
GeForce RTX 2070 Super (Desktop), R9 3900X | |
AMD Radeon RX 5700 XT
Radeon RX 5700 XT (Desktop), R9 3900X |
83 (72min - 95max) fps -11% |
Nvidia GeForce RTX 2060 Super
GeForce RTX 2060 Super (Desktop), R9 3900X |
80 (70min - 91max) fps -14% |
|
Nvidia Titan RTX 24 GB
Titan RTX, TR 2920X |
92 (82min - 101max) fps +51% |
Nvidia GeForce RTX 2070 Super
GeForce RTX 2070 Super (Desktop), R9 3900X |
62 (54min - 69max) fps +2% |
Nvidia GeForce RTX 2080 Super
GeForce RTX 2080 Super (Desktop), R9 3900X |
62 (54min - 69max) fps +2% |
KFA2 GeForce RTX 2070 Super Work The Frames
GeForce RTX 2070 Super (Desktop), R9 3900X | |
AMD Radeon RX 5700 XT
Radeon RX 5700 XT (Desktop), R9 3900X |
53.4 (46min - 61max) fps -12% |
Nvidia GeForce RTX 2060 Super
GeForce RTX 2060 Super (Desktop), R9 3900X |
51.9 (46min - 58max) fps -15% |
|
Nvidia Titan RTX 24 GB
Titan RTX, TR 2920X |
47 (42min - 53max) fps +57% |
Nvidia GeForce RTX 2070 Super
GeForce RTX 2070 Super (Desktop), R9 3900X |
30.4 (26min - 35max) fps +2% |
Nvidia GeForce RTX 2080 Super
GeForce RTX 2080 Super (Desktop), R9 3900X |
30.4 (26min - 35max) fps +2% |
KFA2 GeForce RTX 2070 Super Work The Frames
GeForce RTX 2070 Super (Desktop), R9 3900X | |
AMD Radeon RX 5700 XT
Radeon RX 5700 XT (Desktop), R9 3900X |
26.3 (23min - 29max) fps -12% |
Nvidia GeForce RTX 2060 Super
GeForce RTX 2060 Super (Desktop), R9 3900X |
25.7 (22min - 29max) fps -14% |
|
|
AMD Ryzen 9 3900X
Titan RTX, R9 3900X, Corsair MP600 | |
Nvidia GeForce RTX 2080 Super
GeForce RTX 2080 Super (Desktop), R9 3900X | |
Nvidia GeForce RTX 2070 Super
GeForce RTX 2070 Super (Desktop), R9 3900X | |
KFA2 GeForce RTX 2070 Super Work The Frames
GeForce RTX 2070 Super (Desktop), R9 3900X | |
Nvidia Titan RTX 24 GB
Titan RTX, TR 2920X | |
AMD Radeon RX 5700 XT
Radeon RX 5700 XT (Desktop), R9 3900X | |
Nvidia GeForce RTX 2060 Super
GeForce RTX 2060 Super (Desktop), R9 3900X | |
|
AMD Ryzen 9 3900X
Titan RTX, R9 3900X, Corsair MP600 | |
Nvidia Titan RTX 24 GB
Titan RTX, TR 2920X | |
Nvidia GeForce RTX 2080 Super
GeForce RTX 2080 Super (Desktop), R9 3900X | |
Nvidia GeForce RTX 2070 Super
GeForce RTX 2070 Super (Desktop), R9 3900X | |
KFA2 GeForce RTX 2070 Super Work The Frames
GeForce RTX 2070 Super (Desktop), R9 3900X | |
AMD Radeon RX 5700 XT
Radeon RX 5700 XT (Desktop), R9 3900X | |
Nvidia GeForce RTX 2060 Super
GeForce RTX 2060 Super (Desktop), R9 3900X | |
|
Nvidia Titan RTX 24 GB
Titan RTX, TR 2920X | |
AMD Ryzen 9 3900X
Titan RTX, R9 3900X, Corsair MP600 | |
Nvidia GeForce RTX 2080 Super
GeForce RTX 2080 Super (Desktop), R9 3900X | |
KFA2 GeForce RTX 2070 Super Work The Frames
GeForce RTX 2070 Super (Desktop), R9 3900X | |
Nvidia GeForce RTX 2070 Super
GeForce RTX 2070 Super (Desktop), R9 3900X | |
AMD Radeon RX 5700 XT
Radeon RX 5700 XT (Desktop), R9 3900X | |
Nvidia GeForce RTX 2060 Super
GeForce RTX 2060 Super (Desktop), R9 3900X | |
|
|
AMD Ryzen 9 3900X
Titan RTX, R9 3900X, Corsair MP600 |
99 (31min - 148max) fps +5% |
KFA2 GeForce RTX 2070 Super Work The Frames
GeForce RTX 2070 Super (Desktop), R9 3900X | |
Nvidia GeForce RTX 2080 Super
GeForce RTX 2080 Super (Desktop), R9 3900X |
90 (31min - 124max) fps -4% |
Nvidia GeForce RTX 2070 Super
GeForce RTX 2070 Super (Desktop), R9 3900X |
88 (13min - 142max) fps -6% |
AMD Radeon RX 5700 XT
Radeon RX 5700 XT (Desktop), R9 3900X |
80 (35min - 125max) fps -15% |
Nvidia GeForce RTX 2060 Super
GeForce RTX 2060 Super (Desktop), R9 3900X |
71 (24min - 106max) fps -24% |
|
AMD Ryzen 9 3900X
Titan RTX, R9 3900X, Corsair MP600 |
78 (11min - 114max) fps +1% |
KFA2 GeForce RTX 2070 Super Work The Frames
GeForce RTX 2070 Super (Desktop), R9 3900X | |
Nvidia GeForce RTX 2070 Super
GeForce RTX 2070 Super (Desktop), R9 3900X |
68 (12min - 113max) fps -12% |
Nvidia GeForce RTX 2080 Super
GeForce RTX 2080 Super (Desktop), R9 3900X |
65 (18min - 97max) fps -16% |
AMD Radeon RX 5700 XT
Radeon RX 5700 XT (Desktop), R9 3900X |
58 (33min - 84max) fps -25% |
Nvidia GeForce RTX 2060 Super
GeForce RTX 2060 Super (Desktop), R9 3900X |
53 (16min - 75max) fps -31% |
|
AMD Ryzen 9 3900X
Titan RTX, R9 3900X, Corsair MP600 |
50 (40min - 69max) fps 0% |
KFA2 GeForce RTX 2070 Super Work The Frames
GeForce RTX 2070 Super (Desktop), R9 3900X | |
Nvidia GeForce RTX 2080 Super
GeForce RTX 2080 Super (Desktop), R9 3900X |
39 (32min - 55max) fps -22% |
Nvidia GeForce RTX 2070 Super
GeForce RTX 2070 Super (Desktop), R9 3900X |
37 (39min - 68max) fps -26% |
AMD Radeon RX 5700 XT
Radeon RX 5700 XT (Desktop), R9 3900X |
33 (25min - 44max) fps -34% |
Nvidia GeForce RTX 2060 Super
GeForce RTX 2060 Super (Desktop), R9 3900X |
30 (13min - 41max) fps -40% |
|
|
AMD Ryzen 9 3900X
Titan RTX, R9 3900X, Corsair MP600 | |
Nvidia GeForce RTX 2080 Super
GeForce RTX 2080 Super (Desktop), R9 3900X | |
Nvidia GeForce RTX 2070 Super
GeForce RTX 2070 Super (Desktop), R9 3900X | |
AMD Radeon RX 5700 XT
Radeon RX 5700 XT (Desktop), R9 3900X | |
KFA2 GeForce RTX 2070 Super Work The Frames
GeForce RTX 2070 Super (Desktop), R9 3900X | |
Nvidia GeForce RTX 2060 Super
GeForce RTX 2060 Super (Desktop), R9 3900X | |
|
|
AMD Ryzen 9 3900X
Titan RTX, R9 3900X, Corsair MP600 | |
Nvidia GeForce RTX 2080 Super
GeForce RTX 2080 Super (Desktop), R9 3900X | |
KFA2 GeForce RTX 2070 Super Work The Frames
GeForce RTX 2070 Super (Desktop), R9 3900X | |
Nvidia GeForce RTX 2070 Super
GeForce RTX 2070 Super (Desktop), R9 3900X | |
AMD Radeon RX 5700 XT
Radeon RX 5700 XT (Desktop), R9 3900X | |
Nvidia GeForce RTX 2060 Super
GeForce RTX 2060 Super (Desktop), R9 3900X | |
|
AMD Ryzen 9 3900X
Titan RTX, R9 3900X, Corsair MP600 | |
Nvidia GeForce RTX 2080 Super
GeForce RTX 2080 Super (Desktop), R9 3900X | |
Nvidia GeForce RTX 2070 Super
GeForce RTX 2070 Super (Desktop), R9 3900X | |
KFA2 GeForce RTX 2070 Super Work The Frames
GeForce RTX 2070 Super (Desktop), R9 3900X | |
Nvidia GeForce RTX 2060 Super
GeForce RTX 2060 Super (Desktop), R9 3900X | |
AMD Radeon RX 5700 XT
Radeon RX 5700 XT (Desktop), R9 3900X | |
|
AMD Ryzen 9 3900X
Titan RTX, R9 3900X, Corsair MP600 | |
Nvidia GeForce RTX 2080 Super
GeForce RTX 2080 Super (Desktop), R9 3900X | |
KFA2 GeForce RTX 2070 Super Work The Frames
GeForce RTX 2070 Super (Desktop), R9 3900X | |
Nvidia GeForce RTX 2070 Super
GeForce RTX 2070 Super (Desktop), R9 3900X | |
Nvidia GeForce RTX 2060 Super
GeForce RTX 2060 Super (Desktop), R9 3900X | |
AMD Radeon RX 5700 XT
Radeon RX 5700 XT (Desktop), R9 3900X | |
|
|
AMD Ryzen 9 3900X
Titan RTX, R9 3900X, Corsair MP600 |
93 (79min - 106max) fps +14% |
Nvidia GeForce RTX 2060 Super
GeForce RTX 2060 Super (Desktop), R9 3900X |
92 (76min - 107max) fps +12% |
Nvidia GeForce RTX 2080 Super
GeForce RTX 2080 Super (Desktop), R9 3900X |
92 (78min - 105max) fps +12% |
Nvidia GeForce RTX 2070 Super
GeForce RTX 2070 Super (Desktop), R9 3900X |
90 (77min - 103max) fps +10% |
AMD Radeon RX 5700 XT
Radeon RX 5700 XT (Desktop), R9 3900X |
88 (74min - 99max) fps +8% |
KFA2 GeForce RTX 2070 Super Work The Frames
GeForce RTX 2070 Super (Desktop), R9 3900X |
81.8 (65min - 103max) fps |
|
AMD Ryzen 9 3900X
Titan RTX, R9 3900X, Corsair MP600 |
91 (77min - 104max) fps +17% |
Nvidia GeForce RTX 2080 Super
GeForce RTX 2080 Super (Desktop), R9 3900X |
90 (76min - 103max) fps +15% |
Nvidia GeForce RTX 2070 Super
GeForce RTX 2070 Super (Desktop), R9 3900X |
83 (70min - 93max) fps +6% |
AMD Radeon RX 5700 XT
Radeon RX 5700 XT (Desktop), R9 3900X |
80 (72min - 88max) fps +2% |
KFA2 GeForce RTX 2070 Super Work The Frames
GeForce RTX 2070 Super (Desktop), R9 3900X | |
Nvidia GeForce RTX 2060 Super
GeForce RTX 2060 Super (Desktop), R9 3900X |
74 (66min - 82max) fps -5% |
|
AMD Ryzen 9 3900X
Titan RTX, R9 3900X, Corsair MP600 |
68 (61min - 75max) fps +35% |
Nvidia GeForce RTX 2080 Super
GeForce RTX 2080 Super (Desktop), R9 3900X |
56.5 (49min - 64max) fps +13% |
Nvidia GeForce RTX 2070 Super
GeForce RTX 2070 Super (Desktop), R9 3900X |
50.2 (43min - 56max) fps 0% |
KFA2 GeForce RTX 2070 Super Work The Frames
GeForce RTX 2070 Super (Desktop), R9 3900X | |
AMD Radeon RX 5700 XT
Radeon RX 5700 XT (Desktop), R9 3900X |
44.1 (36min - 50max) fps -12% |
Nvidia GeForce RTX 2060 Super
GeForce RTX 2060 Super (Desktop), R9 3900X |
42.9 (36min - 49max) fps -15% |
|
|
AMD Ryzen 9 3900X
Titan RTX, R9 3900X, Corsair MP600 |
122 (75min - 145max) fps +2% |
KFA2 GeForce RTX 2070 Super Work The Frames
GeForce RTX 2070 Super (Desktop), R9 3900X | |
Nvidia GeForce RTX 2080 Super
GeForce RTX 2080 Super (Desktop), R9 3900X |
118 (72min - 145max) fps -2% |
Nvidia GeForce RTX 2060 Super
GeForce RTX 2060 Super (Desktop), R9 3900X |
114 (72min - 140max) fps -5% |
AMD Radeon RX 5700 XT
Radeon RX 5700 XT (Desktop), R9 3900X |
108 (65min - 138max) fps -10% |
Nvidia GeForce RTX 2070 Super
GeForce RTX 2070 Super (Desktop), R9 3900X |
107 (66min - 140max) fps -11% |
|
AMD Ryzen 9 3900X
Titan RTX, R9 3900X, Corsair MP600 |
119 (75min - 145max) fps +23% |
Nvidia GeForce RTX 2080 Super
GeForce RTX 2080 Super (Desktop), R9 3900X |
107 (73min - 141max) fps +11% |
KFA2 GeForce RTX 2070 Super Work The Frames
GeForce RTX 2070 Super (Desktop), R9 3900X |
96.4 (73min - 114max) fps |
Nvidia GeForce RTX 2070 Super
GeForce RTX 2070 Super (Desktop), R9 3900X |
93 (67min - 107max) fps -4% |
Nvidia GeForce RTX 2060 Super
GeForce RTX 2060 Super (Desktop), R9 3900X |
82 (67min - 96max) fps -15% |
AMD Radeon RX 5700 XT
Radeon RX 5700 XT (Desktop), R9 3900X |
79 (65min - 92max) fps -18% |
|
AMD Ryzen 9 3900X
Titan RTX, R9 3900X, Corsair MP600 |
74 (63min - 85max) fps +8% |
KFA2 GeForce RTX 2070 Super Work The Frames
GeForce RTX 2070 Super (Desktop), R9 3900X | |
Nvidia GeForce RTX 2080 Super
GeForce RTX 2080 Super (Desktop), R9 3900X |
59.5 (51min - 70max) fps -14% |
Nvidia GeForce RTX 2070 Super
GeForce RTX 2070 Super (Desktop), R9 3900X |
49.8 (45min - 54max) fps -28% |
Nvidia GeForce RTX 2060 Super
GeForce RTX 2060 Super (Desktop), R9 3900X |
41.6 (36min - 48max) fps -40% |
AMD Radeon RX 5700 XT
Radeon RX 5700 XT (Desktop), R9 3900X |
40.2 (35min - 46max) fps -42% |
|
|
AMD Ryzen 9 3900X
Titan RTX, R9 3900X, Corsair MP600 |
76 (43min - 94max) fps +43% |
Nvidia GeForce RTX 2080 Super
GeForce RTX 2080 Super (Desktop), R9 3900X |
61 (36.7min, 41.7P1 - 75.8max) fps +15% |
Nvidia GeForce RTX 2070 Super
GeForce RTX 2070 Super (Desktop), R9 3900X |
54.6 (31.7min, 37P1 - 66.8max) fps +3% |
KFA2 GeForce RTX 2070 Super Work The Frames
GeForce RTX 2070 Super (Desktop), R9 3900X | |
AMD Radeon RX 5700 XT
Radeon RX 5700 XT (Desktop), R9 3900X |
51.5 (24.8min, 35.7P1 - 75.7max) fps -3% |
Nvidia GeForce RTX 2060 Super
GeForce RTX 2060 Super (Desktop), R9 3900X |
46.5 (27.7min, 32.3P1 - 56max) fps -12% |
|
AMD Ryzen 9 3900X
Titan RTX, R9 3900X, Corsair MP600 |
63 (40min - 86max) fps +43% |
Nvidia GeForce RTX 2080 Super
GeForce RTX 2080 Super (Desktop), R9 3900X |
50.6 (32.6min, 37P1 - 67.7max) fps +15% |
KFA2 GeForce RTX 2070 Super Work The Frames
GeForce RTX 2070 Super (Desktop), R9 3900X | |
Nvidia GeForce RTX 2070 Super
GeForce RTX 2070 Super (Desktop), R9 3900X |
43.3 (27.3min, 31.3P1 - 53.2max) fps -2% |
AMD Radeon RX 5700 XT
Radeon RX 5700 XT (Desktop), R9 3900X |
41.8 (1.958min, 31.3P1 - 59.9max) fps -5% |
Nvidia GeForce RTX 2060 Super
GeForce RTX 2060 Super (Desktop), R9 3900X |
37.6 (24.4min, 27.8P1 - 45.6max) fps -15% |
|
AMD Ryzen 9 3900X
Titan RTX, R9 3900X, Corsair MP600 |
41 (29min - 50max) fps +46% |
Nvidia GeForce RTX 2080 Super
GeForce RTX 2080 Super (Desktop), R9 3900X |
33 (23.7min, 25.6P1 - 40.5max) fps +18% |
Nvidia GeForce RTX 2070 Super
GeForce RTX 2070 Super (Desktop), R9 3900X |
28.7 (21.9min, 22.7P1 - 35.3max) fps +2% |
KFA2 GeForce RTX 2070 Super Work The Frames
GeForce RTX 2070 Super (Desktop), R9 3900X | |
AMD Radeon RX 5700 XT
Radeon RX 5700 XT (Desktop), R9 3900X |
27 (17.5min, 21.7P1 - 33.6max) fps -4% |
Nvidia GeForce RTX 2060 Super
GeForce RTX 2060 Super (Desktop), R9 3900X |
24.1 (17.5min, 19.2P1 - 29.5max) fps -14% |
|
|
AMD Radeon RX 5700 XT
Radeon RX 5700 XT (Desktop), R9 3900X |
121 (120min - 122max) fps +31% |
AMD Ryzen 9 3900X
Titan RTX, R9 3900X, Corsair MP600 |
119 (102min - 122max) fps +29% |
Nvidia GeForce RTX 2070 Super
GeForce RTX 2070 Super (Desktop), R9 3900X |
118 (103min - 122max) fps +27% |
Nvidia GeForce RTX 2080 Super
GeForce RTX 2080 Super (Desktop), R9 3900X |
111 (95min - 122max) fps +20% |
Nvidia GeForce RTX 2060 Super
GeForce RTX 2060 Super (Desktop), R9 3900X |
98 (73min - 109max) fps +6% |
KFA2 GeForce RTX 2070 Super Work The Frames
GeForce RTX 2070 Super (Desktop), R9 3900X |
92.6 (73min - 110max) fps |
|
AMD Ryzen 9 3900X
Titan RTX, R9 3900X, Corsair MP600 |
117 (92min - 122max) fps +50% |
Nvidia GeForce RTX 2070 Super
GeForce RTX 2070 Super (Desktop), R9 3900X |
106 (82min - 117max) fps +36% |
AMD Radeon RX 5700 XT
Radeon RX 5700 XT (Desktop), R9 3900X |
101 (94min - 106max) fps +29% |
Nvidia GeForce RTX 2080 Super
GeForce RTX 2080 Super (Desktop), R9 3900X |
90.2 (71min - 121max) fps +15% |
KFA2 GeForce RTX 2070 Super Work The Frames
GeForce RTX 2070 Super (Desktop), R9 3900X | |
Nvidia GeForce RTX 2060 Super
GeForce RTX 2060 Super (Desktop), R9 3900X |
77.7 (65min - 90max) fps -1% |
|
AMD Ryzen 9 3900X
Titan RTX, R9 3900X, Corsair MP600 |
81.7 (66min - 95max) fps +91% |
Nvidia GeForce RTX 2080 Super
GeForce RTX 2080 Super (Desktop), R9 3900X |
53.7 (44min - 67max) fps +25% |
Nvidia GeForce RTX 2070 Super
GeForce RTX 2070 Super (Desktop), R9 3900X |
49.8 (45min - 57max) fps +16% |
AMD Radeon RX 5700 XT
Radeon RX 5700 XT (Desktop), R9 3900X |
47.7 (43min - 62max) fps +11% |
KFA2 GeForce RTX 2070 Super Work The Frames
GeForce RTX 2070 Super (Desktop), R9 3900X | |
Nvidia GeForce RTX 2060 Super
GeForce RTX 2060 Super (Desktop), R9 3900X |
37.8 (32min - 47max) fps -12% |
|
|
AMD Ryzen 9 3900X
Titan RTX, R9 3900X, Corsair MP600 |
171 (150min - 207max) fps +36% |
Nvidia GeForce RTX 2080 Super
GeForce RTX 2080 Super (Desktop), R9 3900X |
142 (132min - 173max) fps +13% |
Nvidia GeForce RTX 2070 Super
GeForce RTX 2070 Super (Desktop), R9 3900X |
130 (115min - 155max) fps +3% |
KFA2 GeForce RTX 2070 Super Work The Frames
GeForce RTX 2070 Super (Desktop), R9 3900X |
126 (112min - 144max) fps |
AMD Radeon RX 5700 XT
Radeon RX 5700 XT (Desktop), R9 3900X |
112 (106min - 117max) fps -11% |
Nvidia GeForce RTX 2060 Super
GeForce RTX 2060 Super (Desktop), R9 3900X |
105 (98min - 114max) fps -17% |
|
AMD Ryzen 9 3900X
Titan RTX, R9 3900X, Corsair MP600 |
124 (109min - 136max) fps +51% |
Nvidia GeForce RTX 2080 Super
GeForce RTX 2080 Super (Desktop), R9 3900X |
96.6 (88min - 105max) fps +18% |
KFA2 GeForce RTX 2070 Super Work The Frames
GeForce RTX 2070 Super (Desktop), R9 3900X | |
Nvidia GeForce RTX 2070 Super
GeForce RTX 2070 Super (Desktop), R9 3900X |
79.7 (74min - 89max) fps -3% |
AMD Radeon RX 5700 XT
Radeon RX 5700 XT (Desktop), R9 3900X |
71.4 (68min - 76max) fps -13% |
Nvidia GeForce RTX 2060 Super
GeForce RTX 2060 Super (Desktop), R9 3900X |
71 (63min - 88max) fps -14% |
|
AMD Ryzen 9 3900X
Titan RTX, R9 3900X, Corsair MP600 |
61.8 (59min - 65max) fps +58% |
Nvidia GeForce RTX 2080 Super
GeForce RTX 2080 Super (Desktop), R9 3900X |
46.8 (44min - 50max) fps +20% |
Nvidia GeForce RTX 2070 Super
GeForce RTX 2070 Super (Desktop), R9 3900X |
40.5 (37min - 47max) fps +4% |
KFA2 GeForce RTX 2070 Super Work The Frames
GeForce RTX 2070 Super (Desktop), R9 3900X | |
AMD Radeon RX 5700 XT
Radeon RX 5700 XT (Desktop), R9 3900X |
33.6 (30min - 38max) fps -14% |
Nvidia GeForce RTX 2060 Super
GeForce RTX 2060 Super (Desktop), R9 3900X |
33.1 (31min - 36max) fps -15% |
|
|
AMD Ryzen 9 3900X
Titan RTX, R9 3900X, Corsair MP600 | |
Nvidia GeForce RTX 2080 Super
GeForce RTX 2080 Super (Desktop), R9 3900X | |
Nvidia GeForce RTX 2070 Super
GeForce RTX 2070 Super (Desktop), R9 3900X | |
KFA2 GeForce RTX 2070 Super Work The Frames
GeForce RTX 2070 Super (Desktop), R9 3900X | |
Nvidia GeForce RTX 2060 Super
GeForce RTX 2060 Super (Desktop), R9 3900X | |
AMD Radeon RX 5700 XT
Radeon RX 5700 XT (Desktop), R9 3900X | |
|
AMD Ryzen 9 3900X
Titan RTX, R9 3900X, Corsair MP600 | |
Nvidia GeForce RTX 2080 Super
GeForce RTX 2080 Super (Desktop), R9 3900X | |
Nvidia GeForce RTX 2070 Super
GeForce RTX 2070 Super (Desktop), R9 3900X | |
KFA2 GeForce RTX 2070 Super Work The Frames
GeForce RTX 2070 Super (Desktop), R9 3900X | |
AMD Radeon RX 5700 XT
Radeon RX 5700 XT (Desktop), R9 3900X | |
Nvidia GeForce RTX 2060 Super
GeForce RTX 2060 Super (Desktop), R9 3900X | |
|
AMD Ryzen 9 3900X
Titan RTX, R9 3900X, Corsair MP600 | |
Nvidia GeForce RTX 2080 Super
GeForce RTX 2080 Super (Desktop), R9 3900X | |
KFA2 GeForce RTX 2070 Super Work The Frames
GeForce RTX 2070 Super (Desktop), R9 3900X | |
Nvidia GeForce RTX 2070 Super
GeForce RTX 2070 Super (Desktop), R9 3900X | |
AMD Radeon RX 5700 XT
Radeon RX 5700 XT (Desktop), R9 3900X | |
Nvidia GeForce RTX 2060 Super
GeForce RTX 2060 Super (Desktop), R9 3900X | |