Nvidia GeForce RTX 2060 Super Review: The entry-level GPU finally comes with 8 GB of VRAM
The new graphics cards from the GeForce RTX SUPER series are supposed to keep the Navi-based GPUs in check by offering more performance. In this review, the RTX 2060S will have to compete against the RX 5700 from AMD. However, we also pitted the RTX 2060S against older RTX GPUs to see what it is capable of. The original RTX video cards have not been on the market very long. There is also the AMD Radeon VII to mention. However, according to rumors, it has been discontinued and will not be available anywhere soon enough.
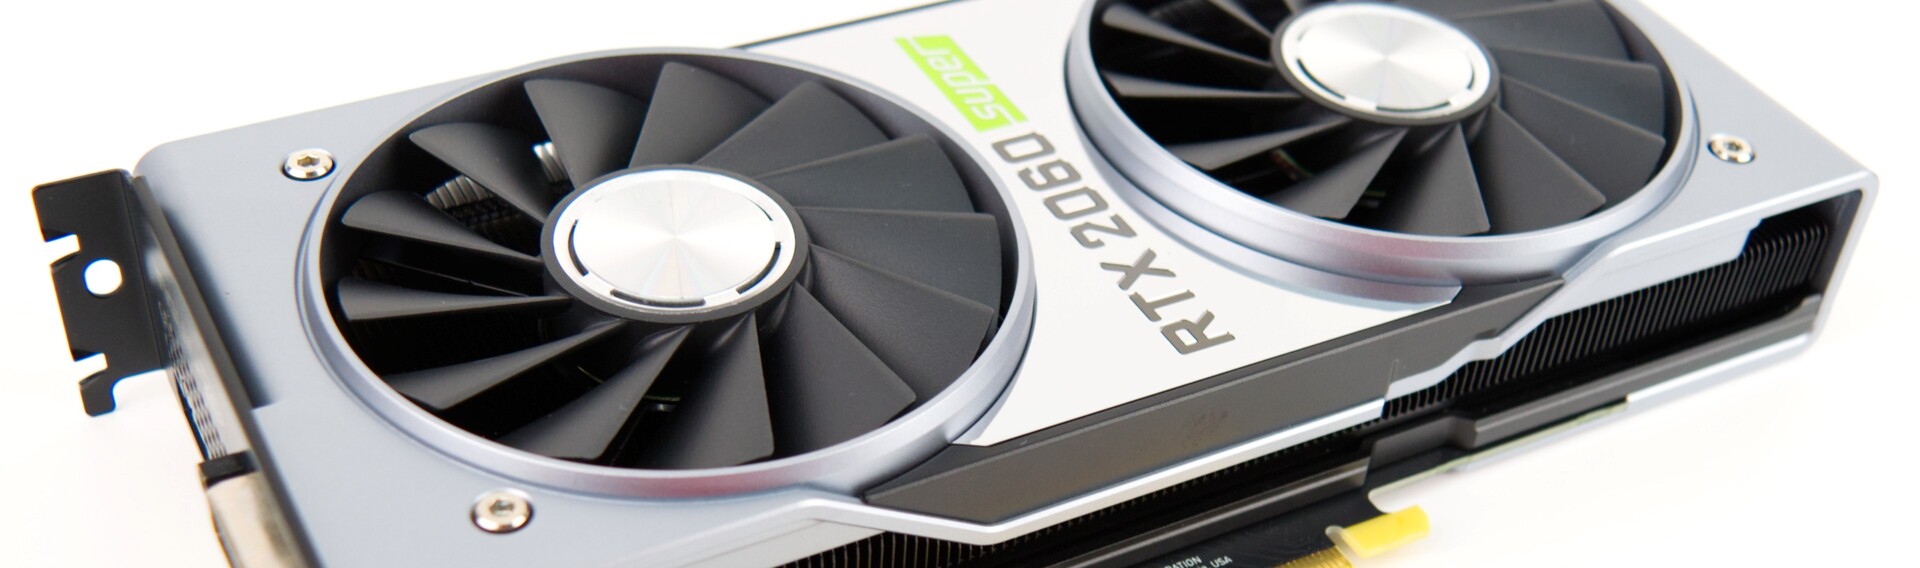
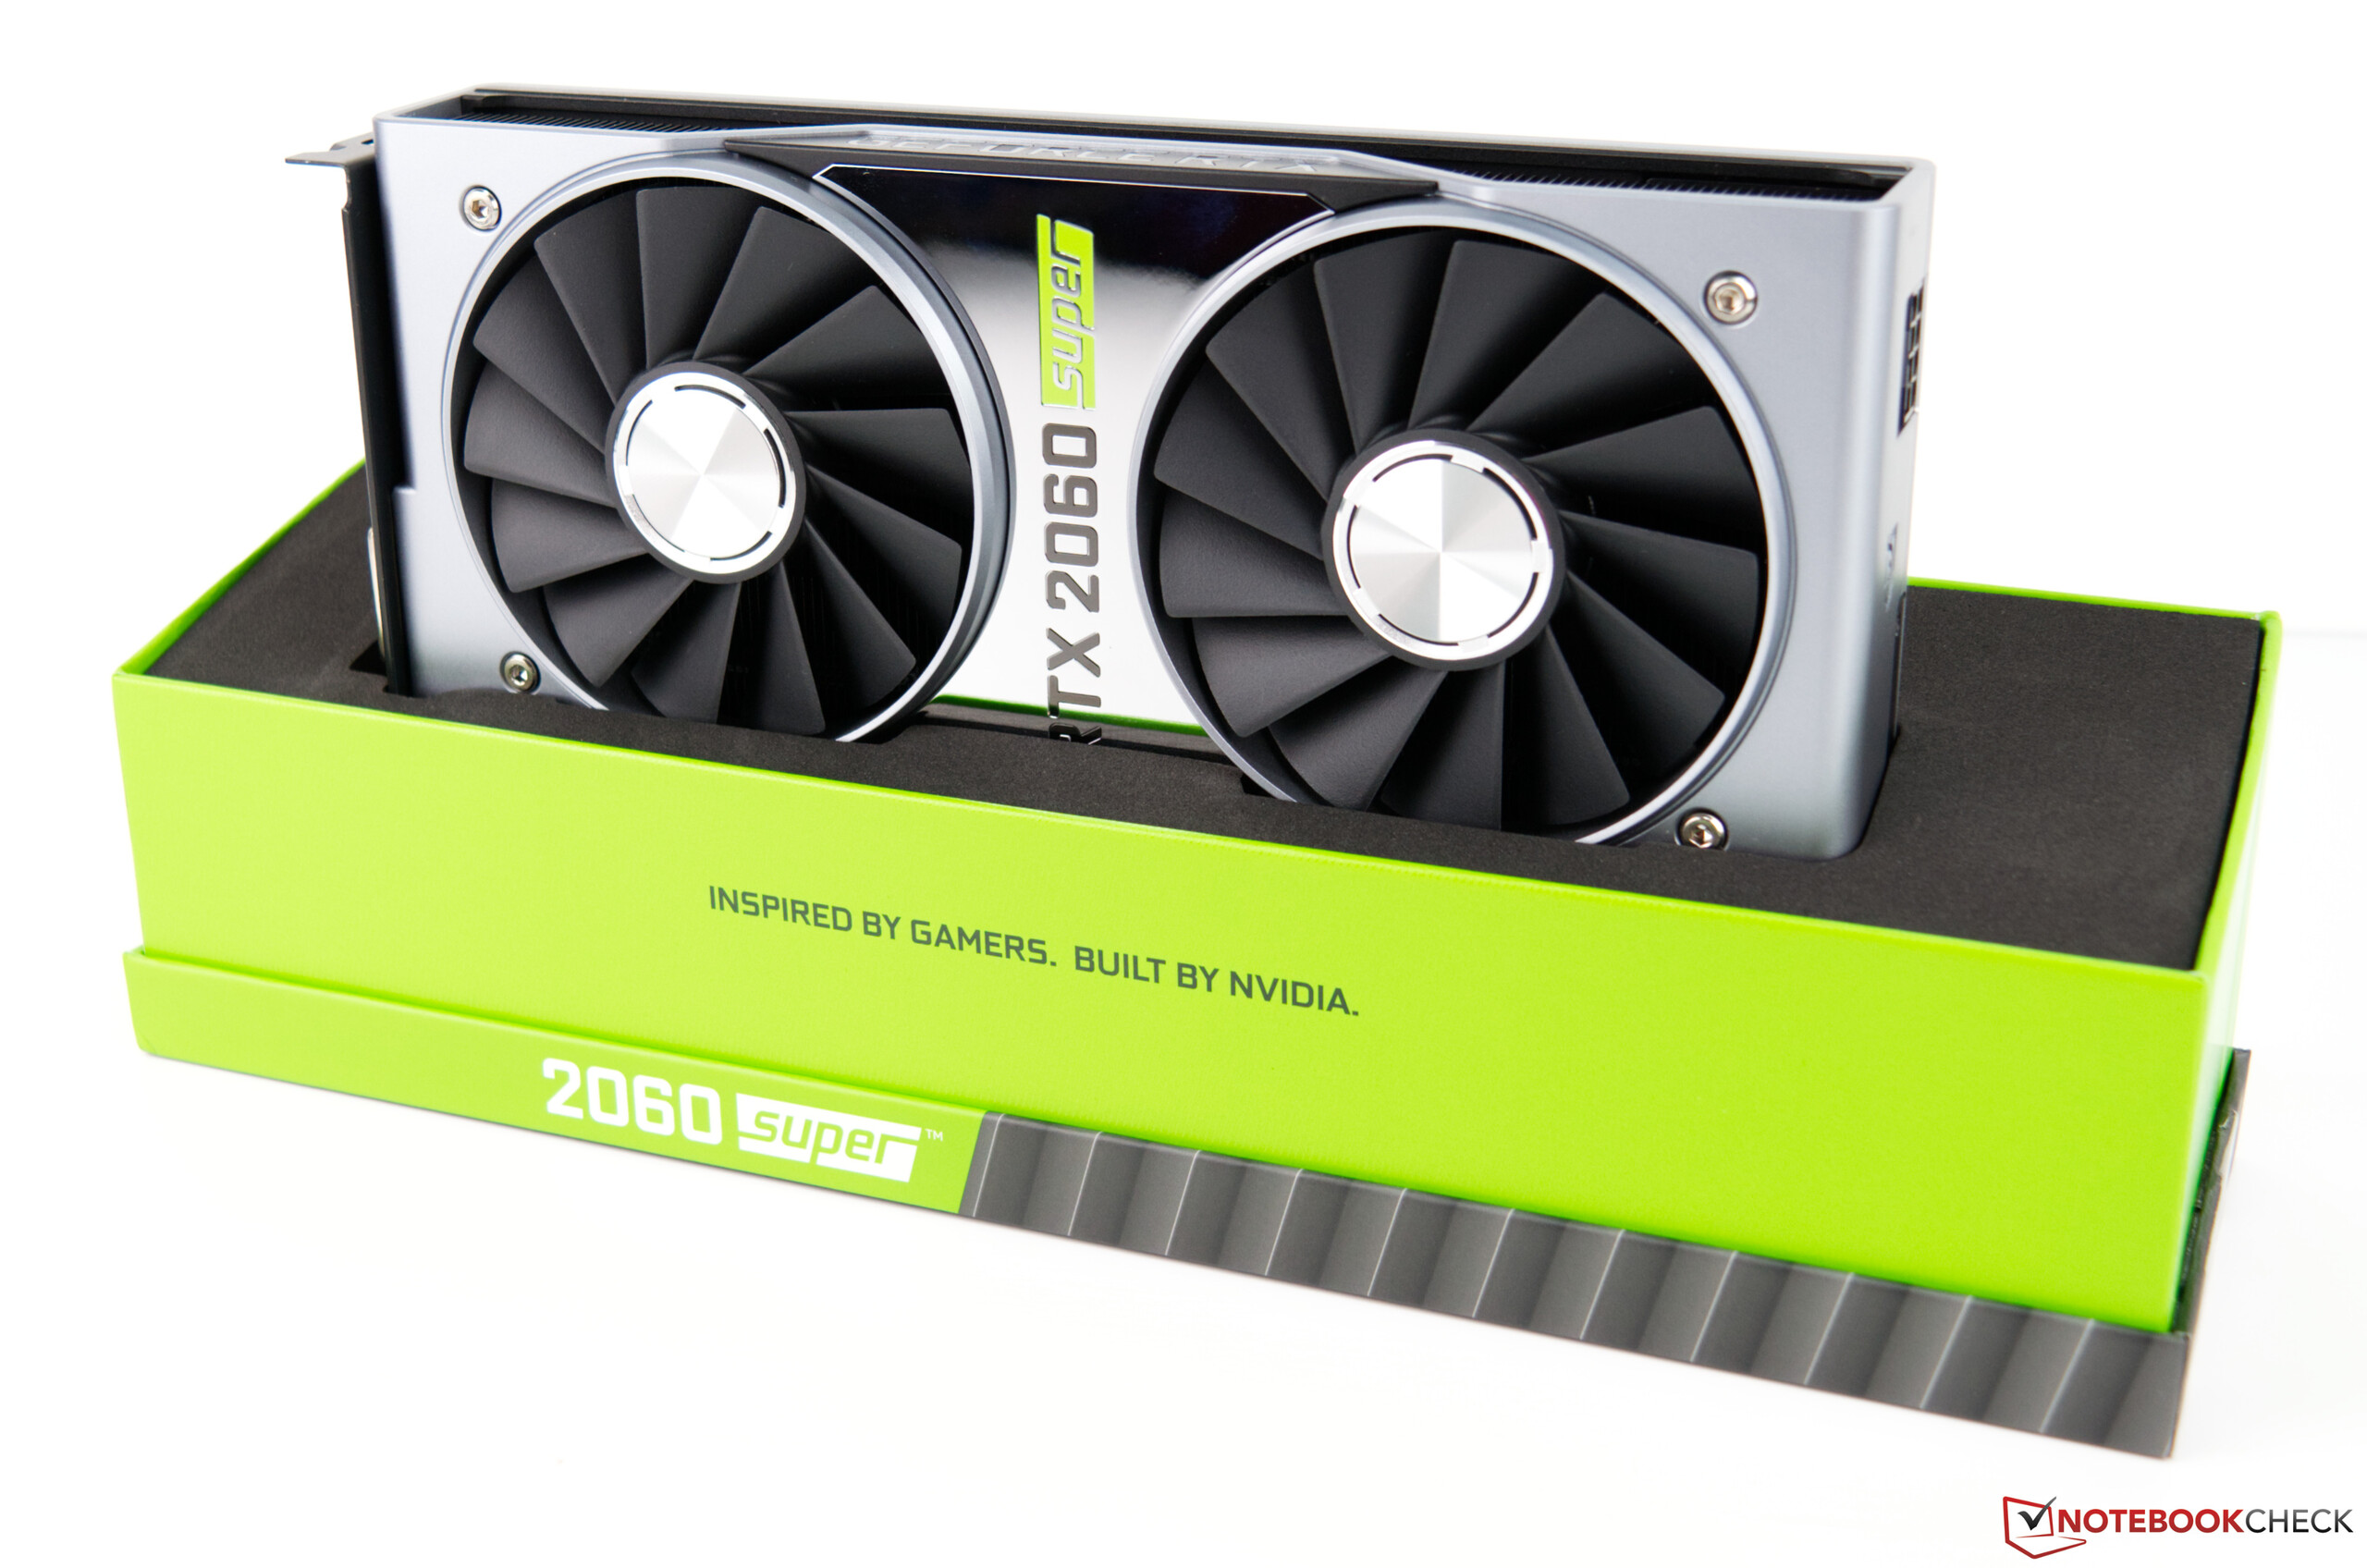
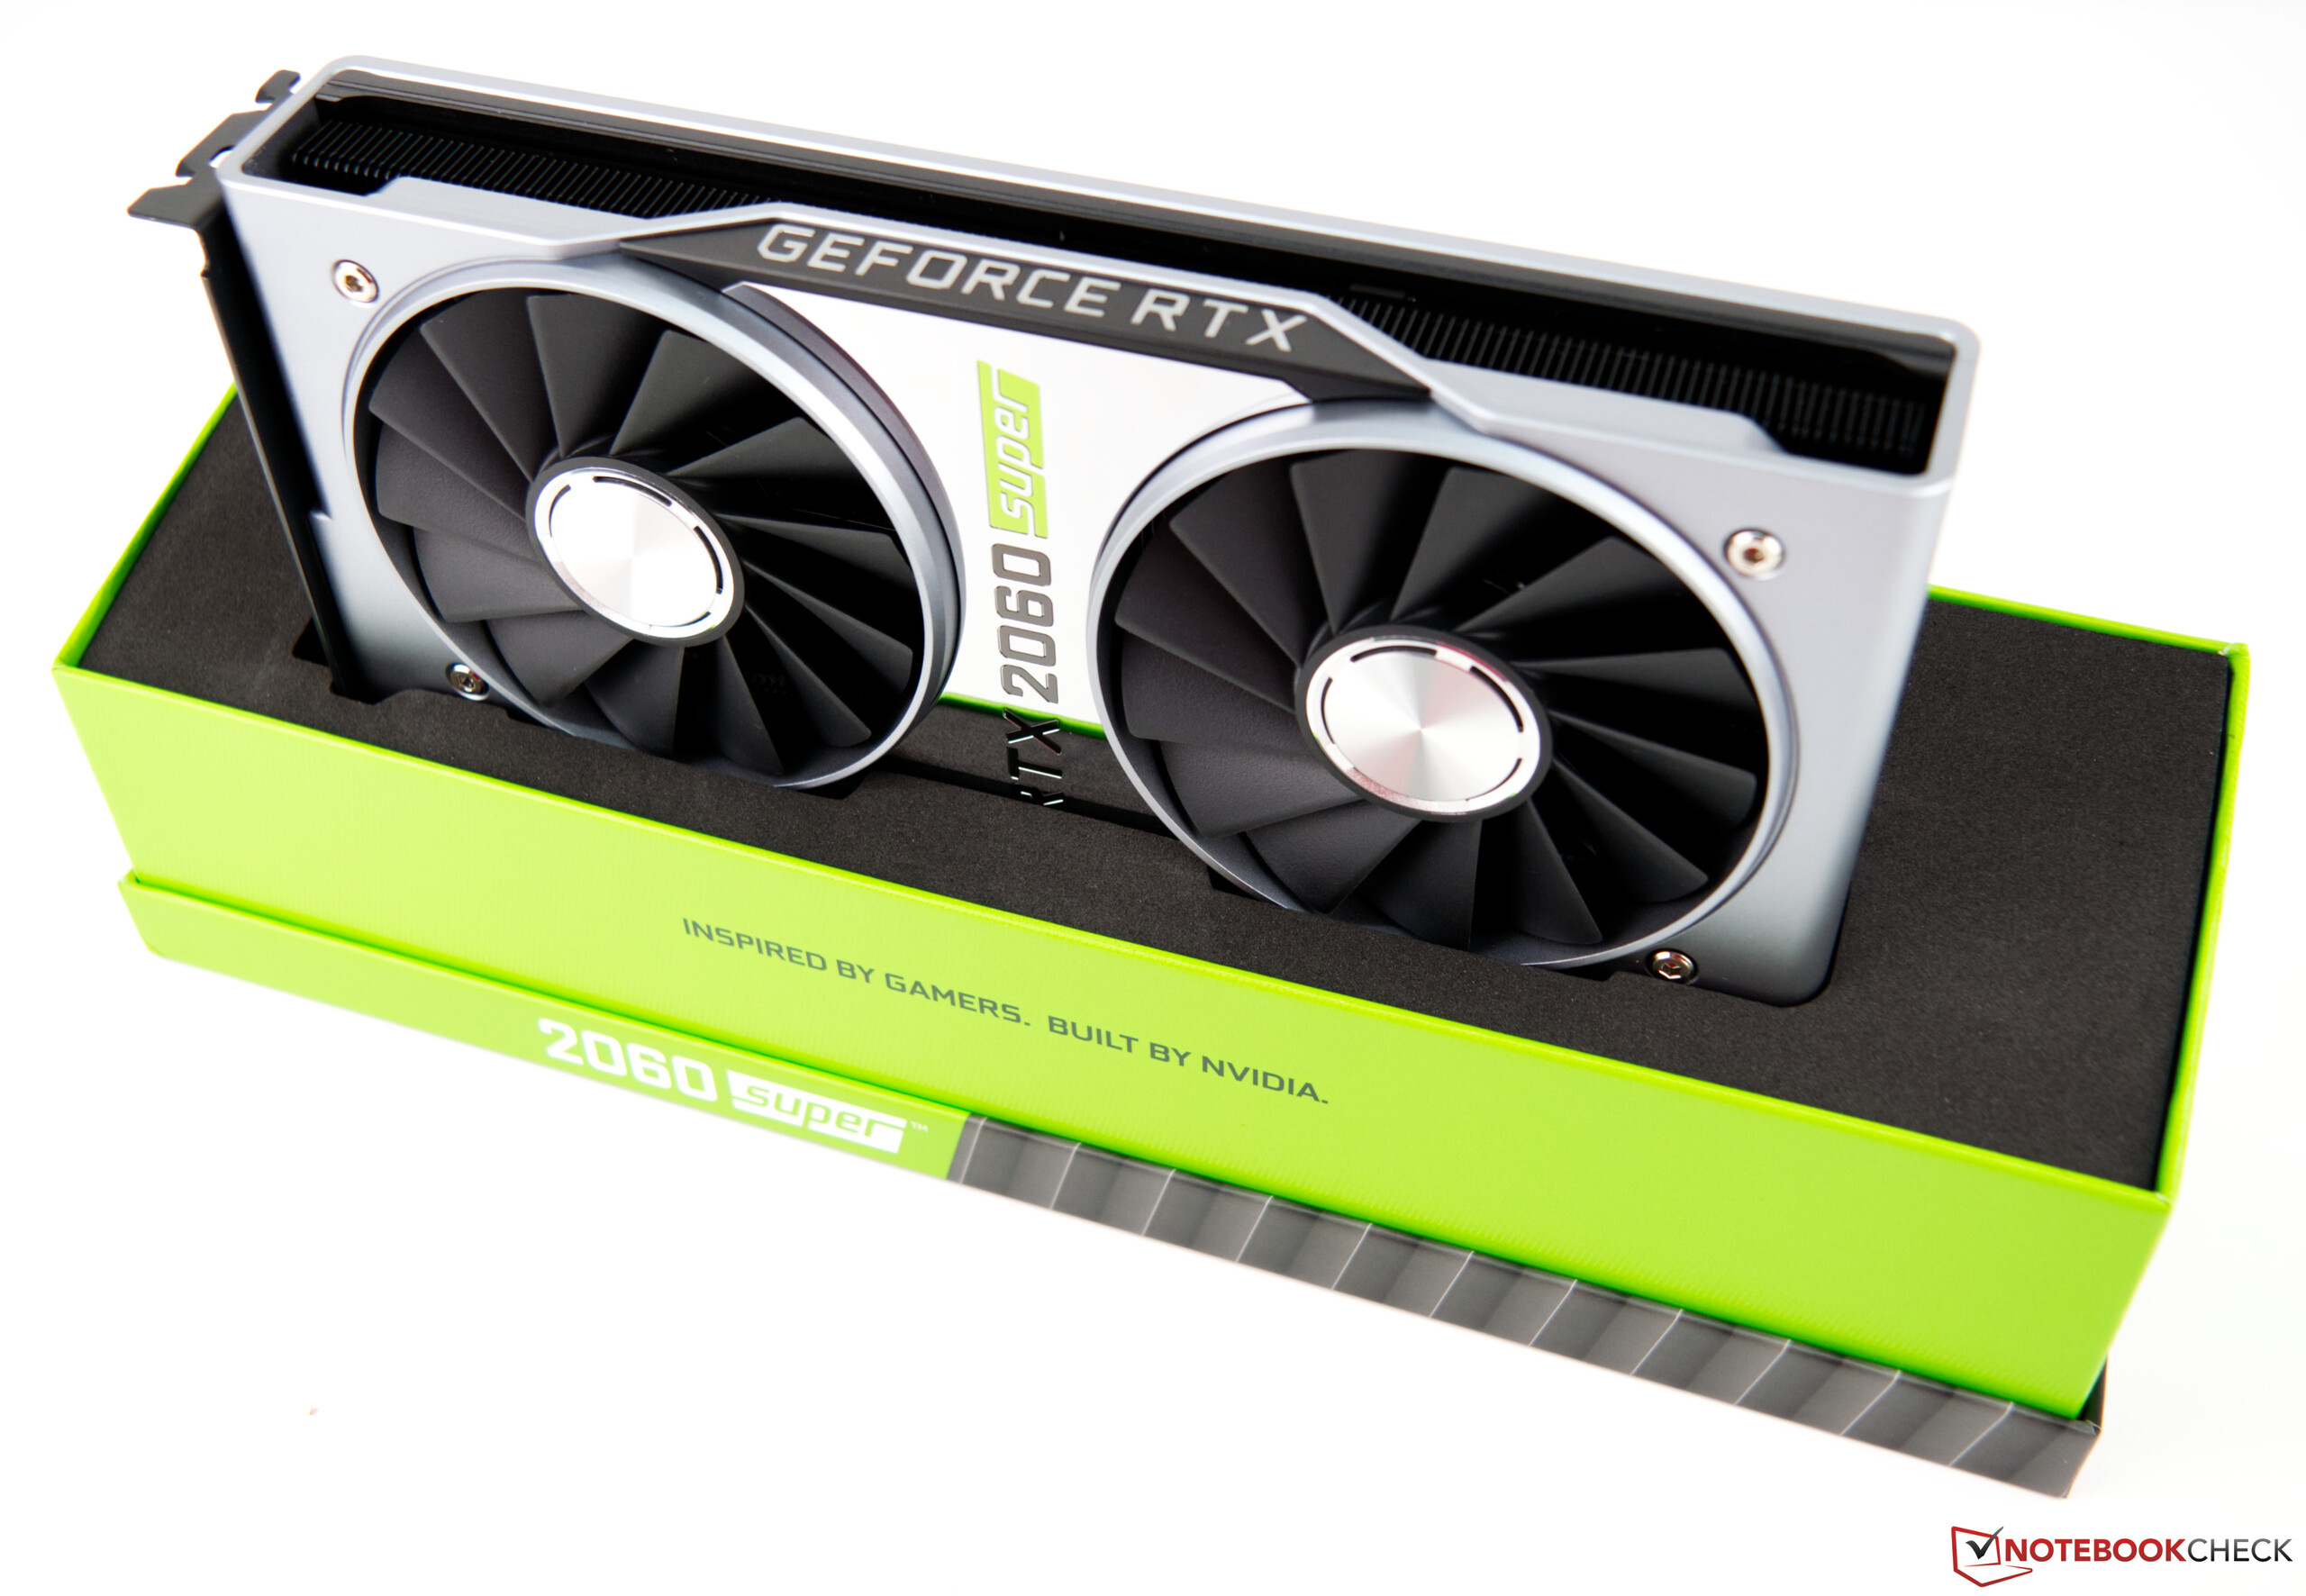
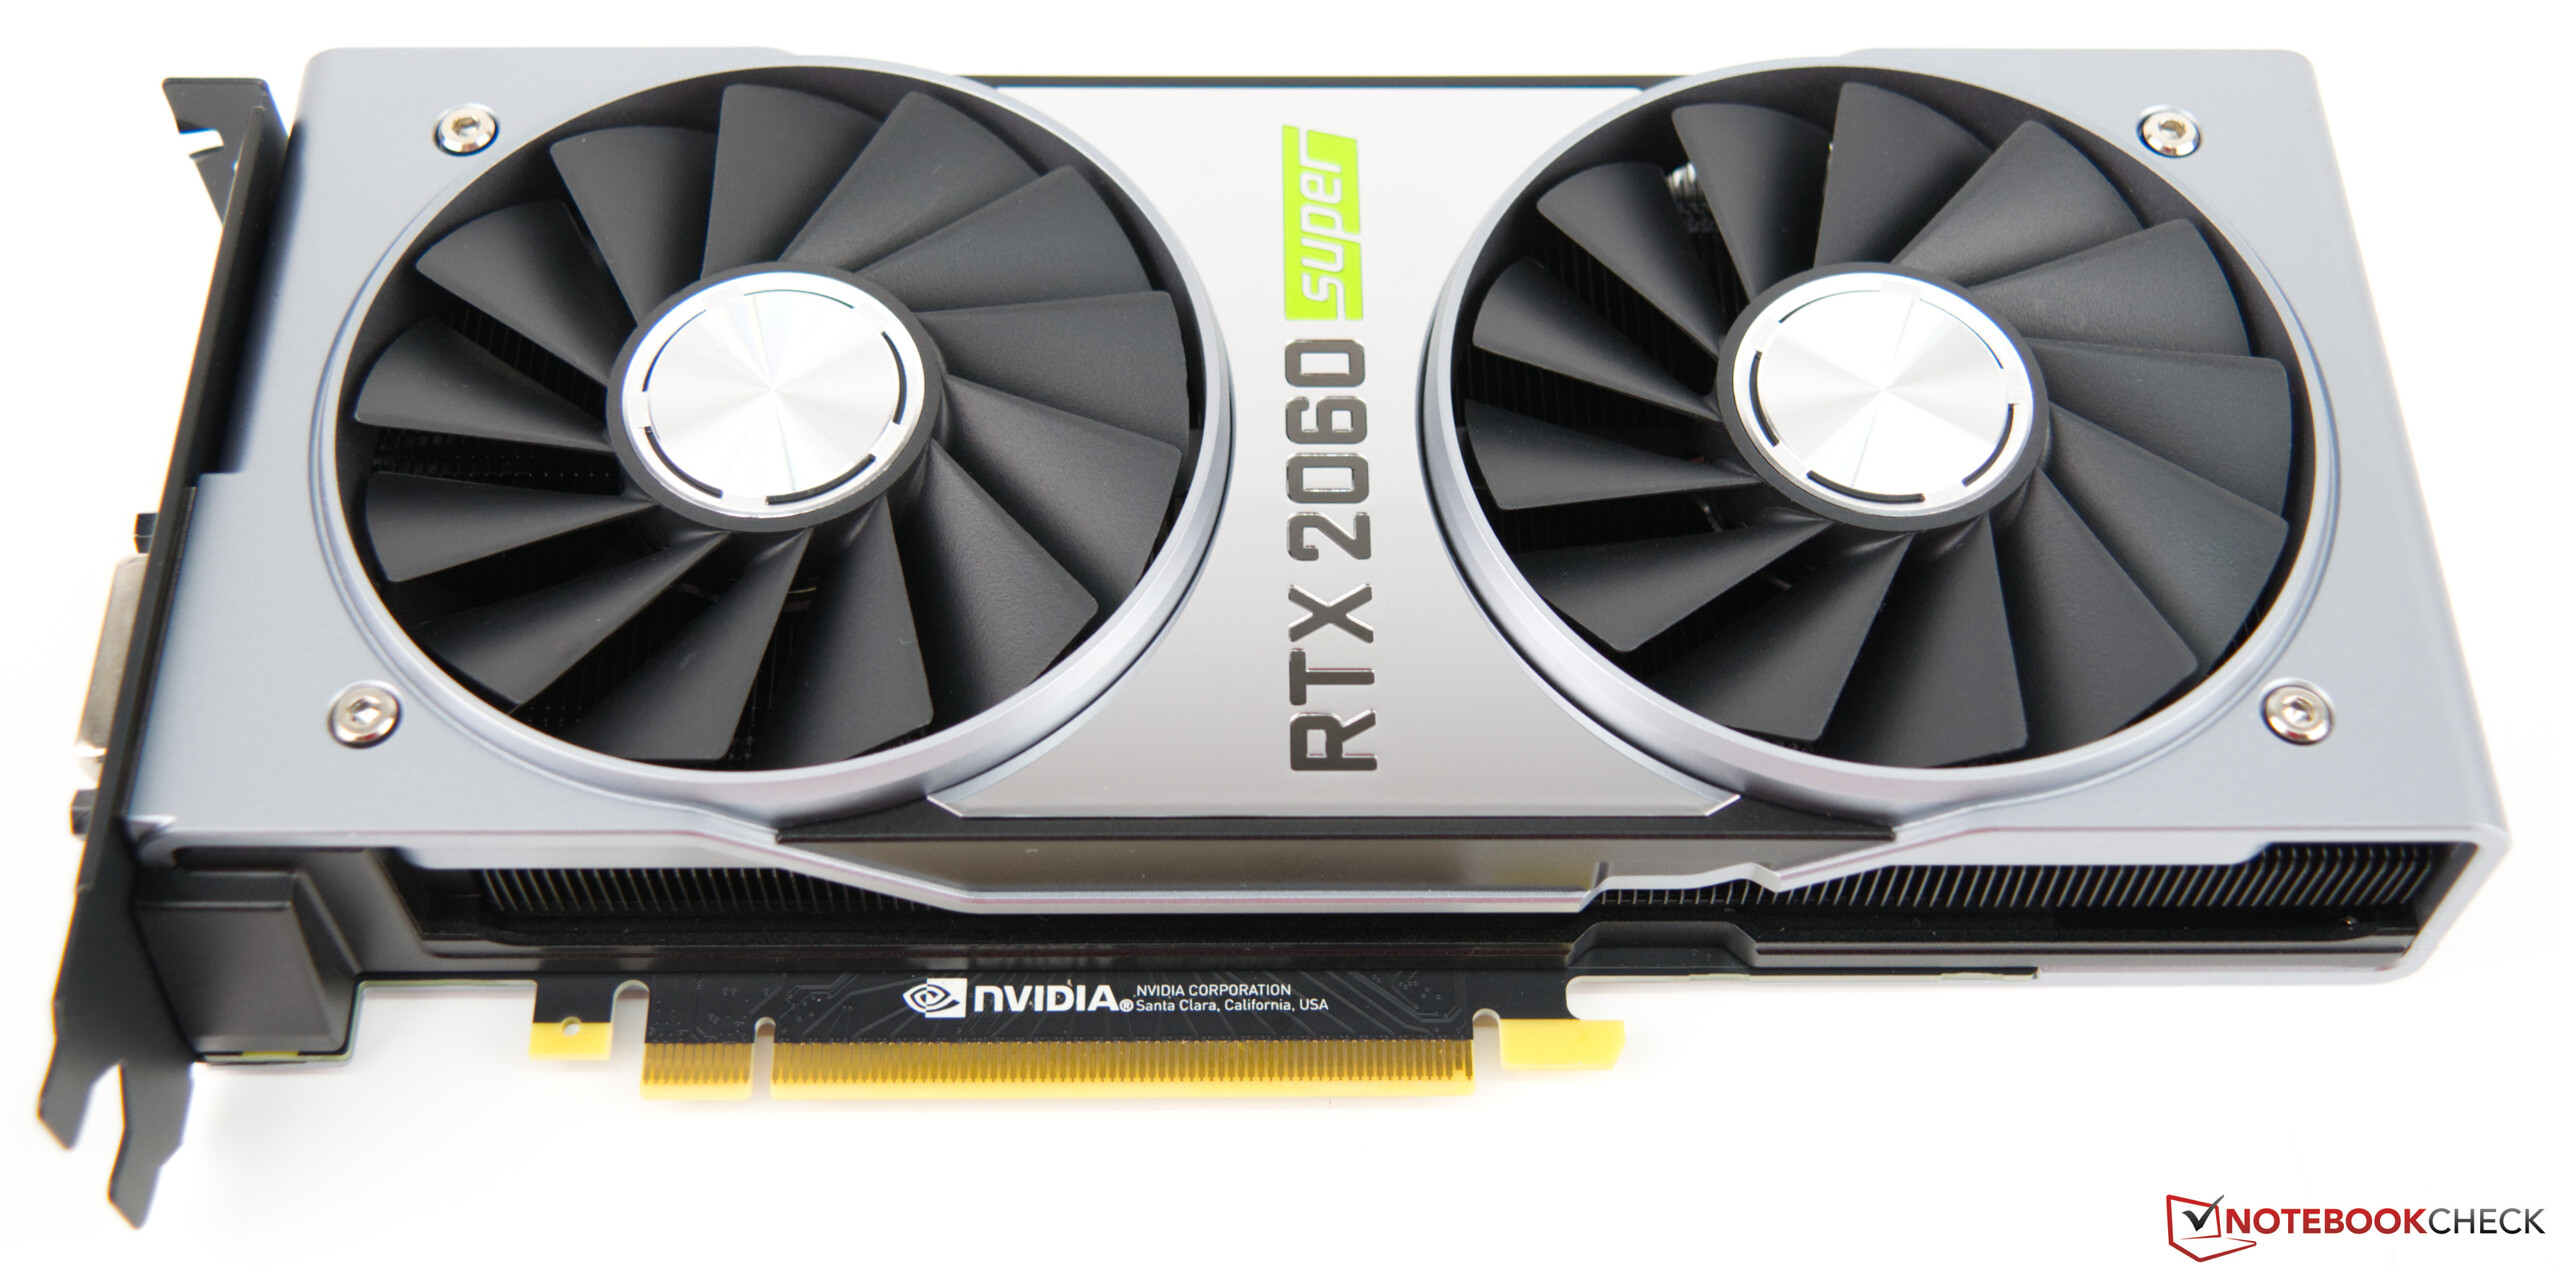
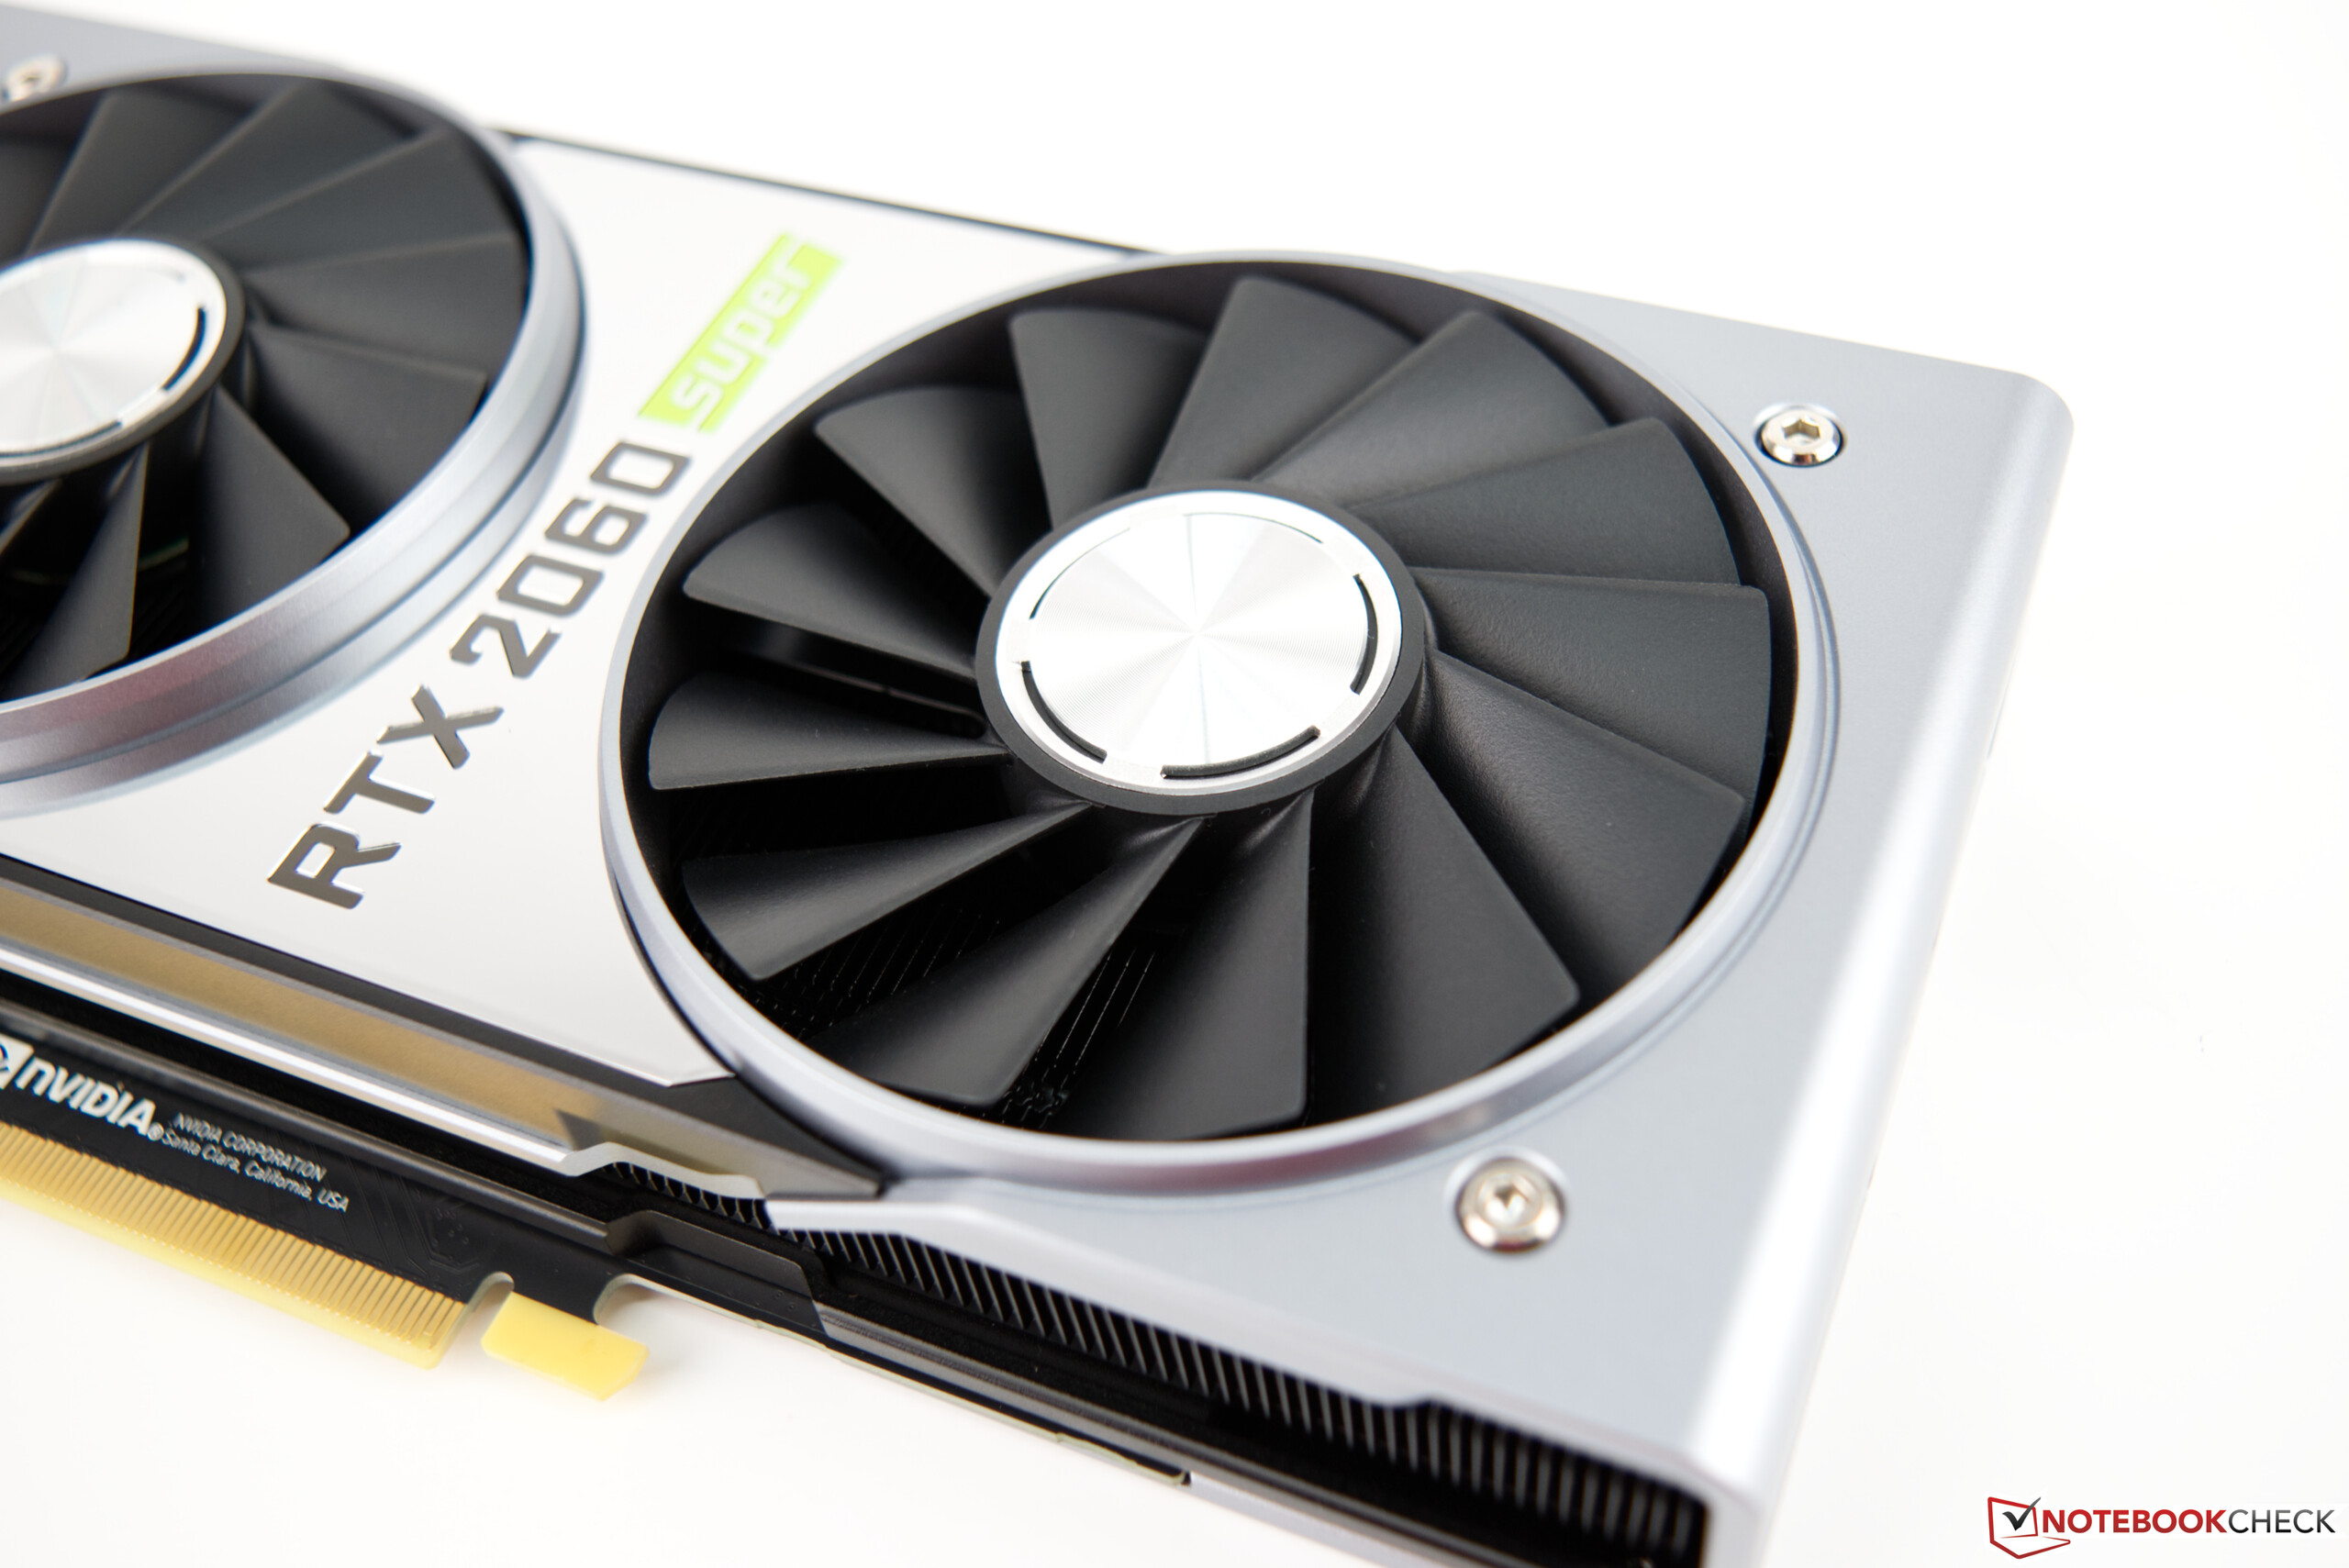
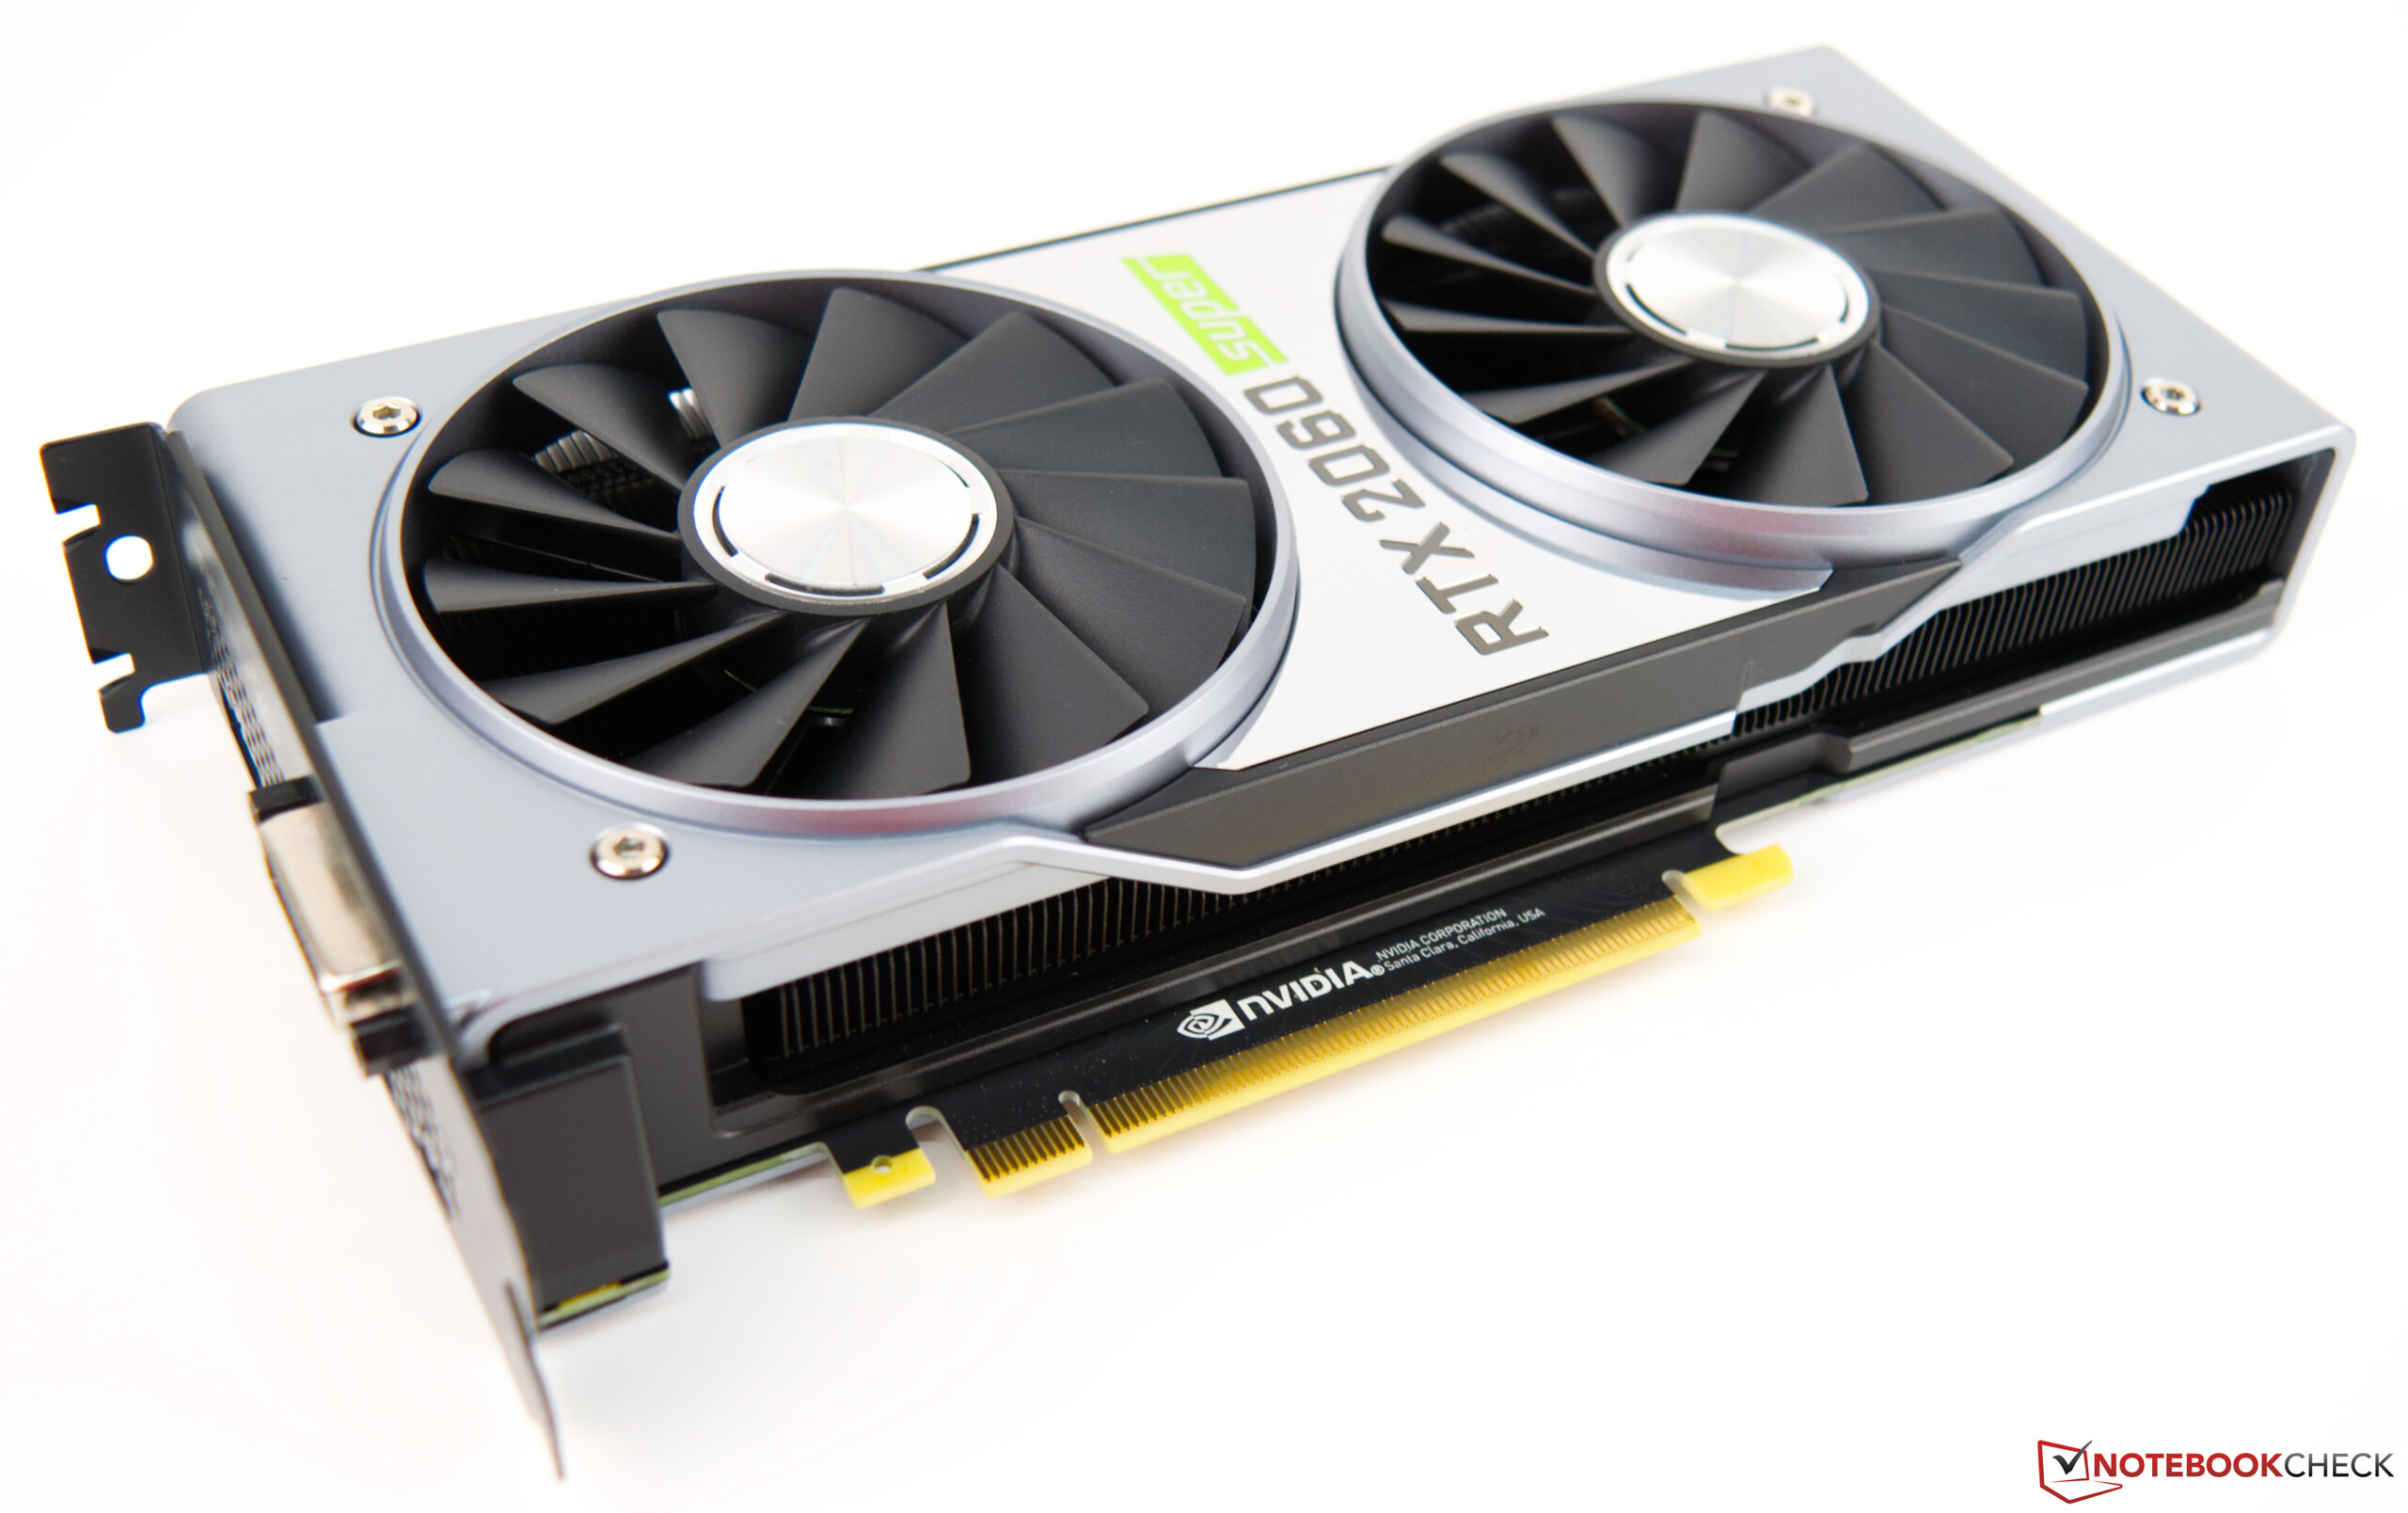
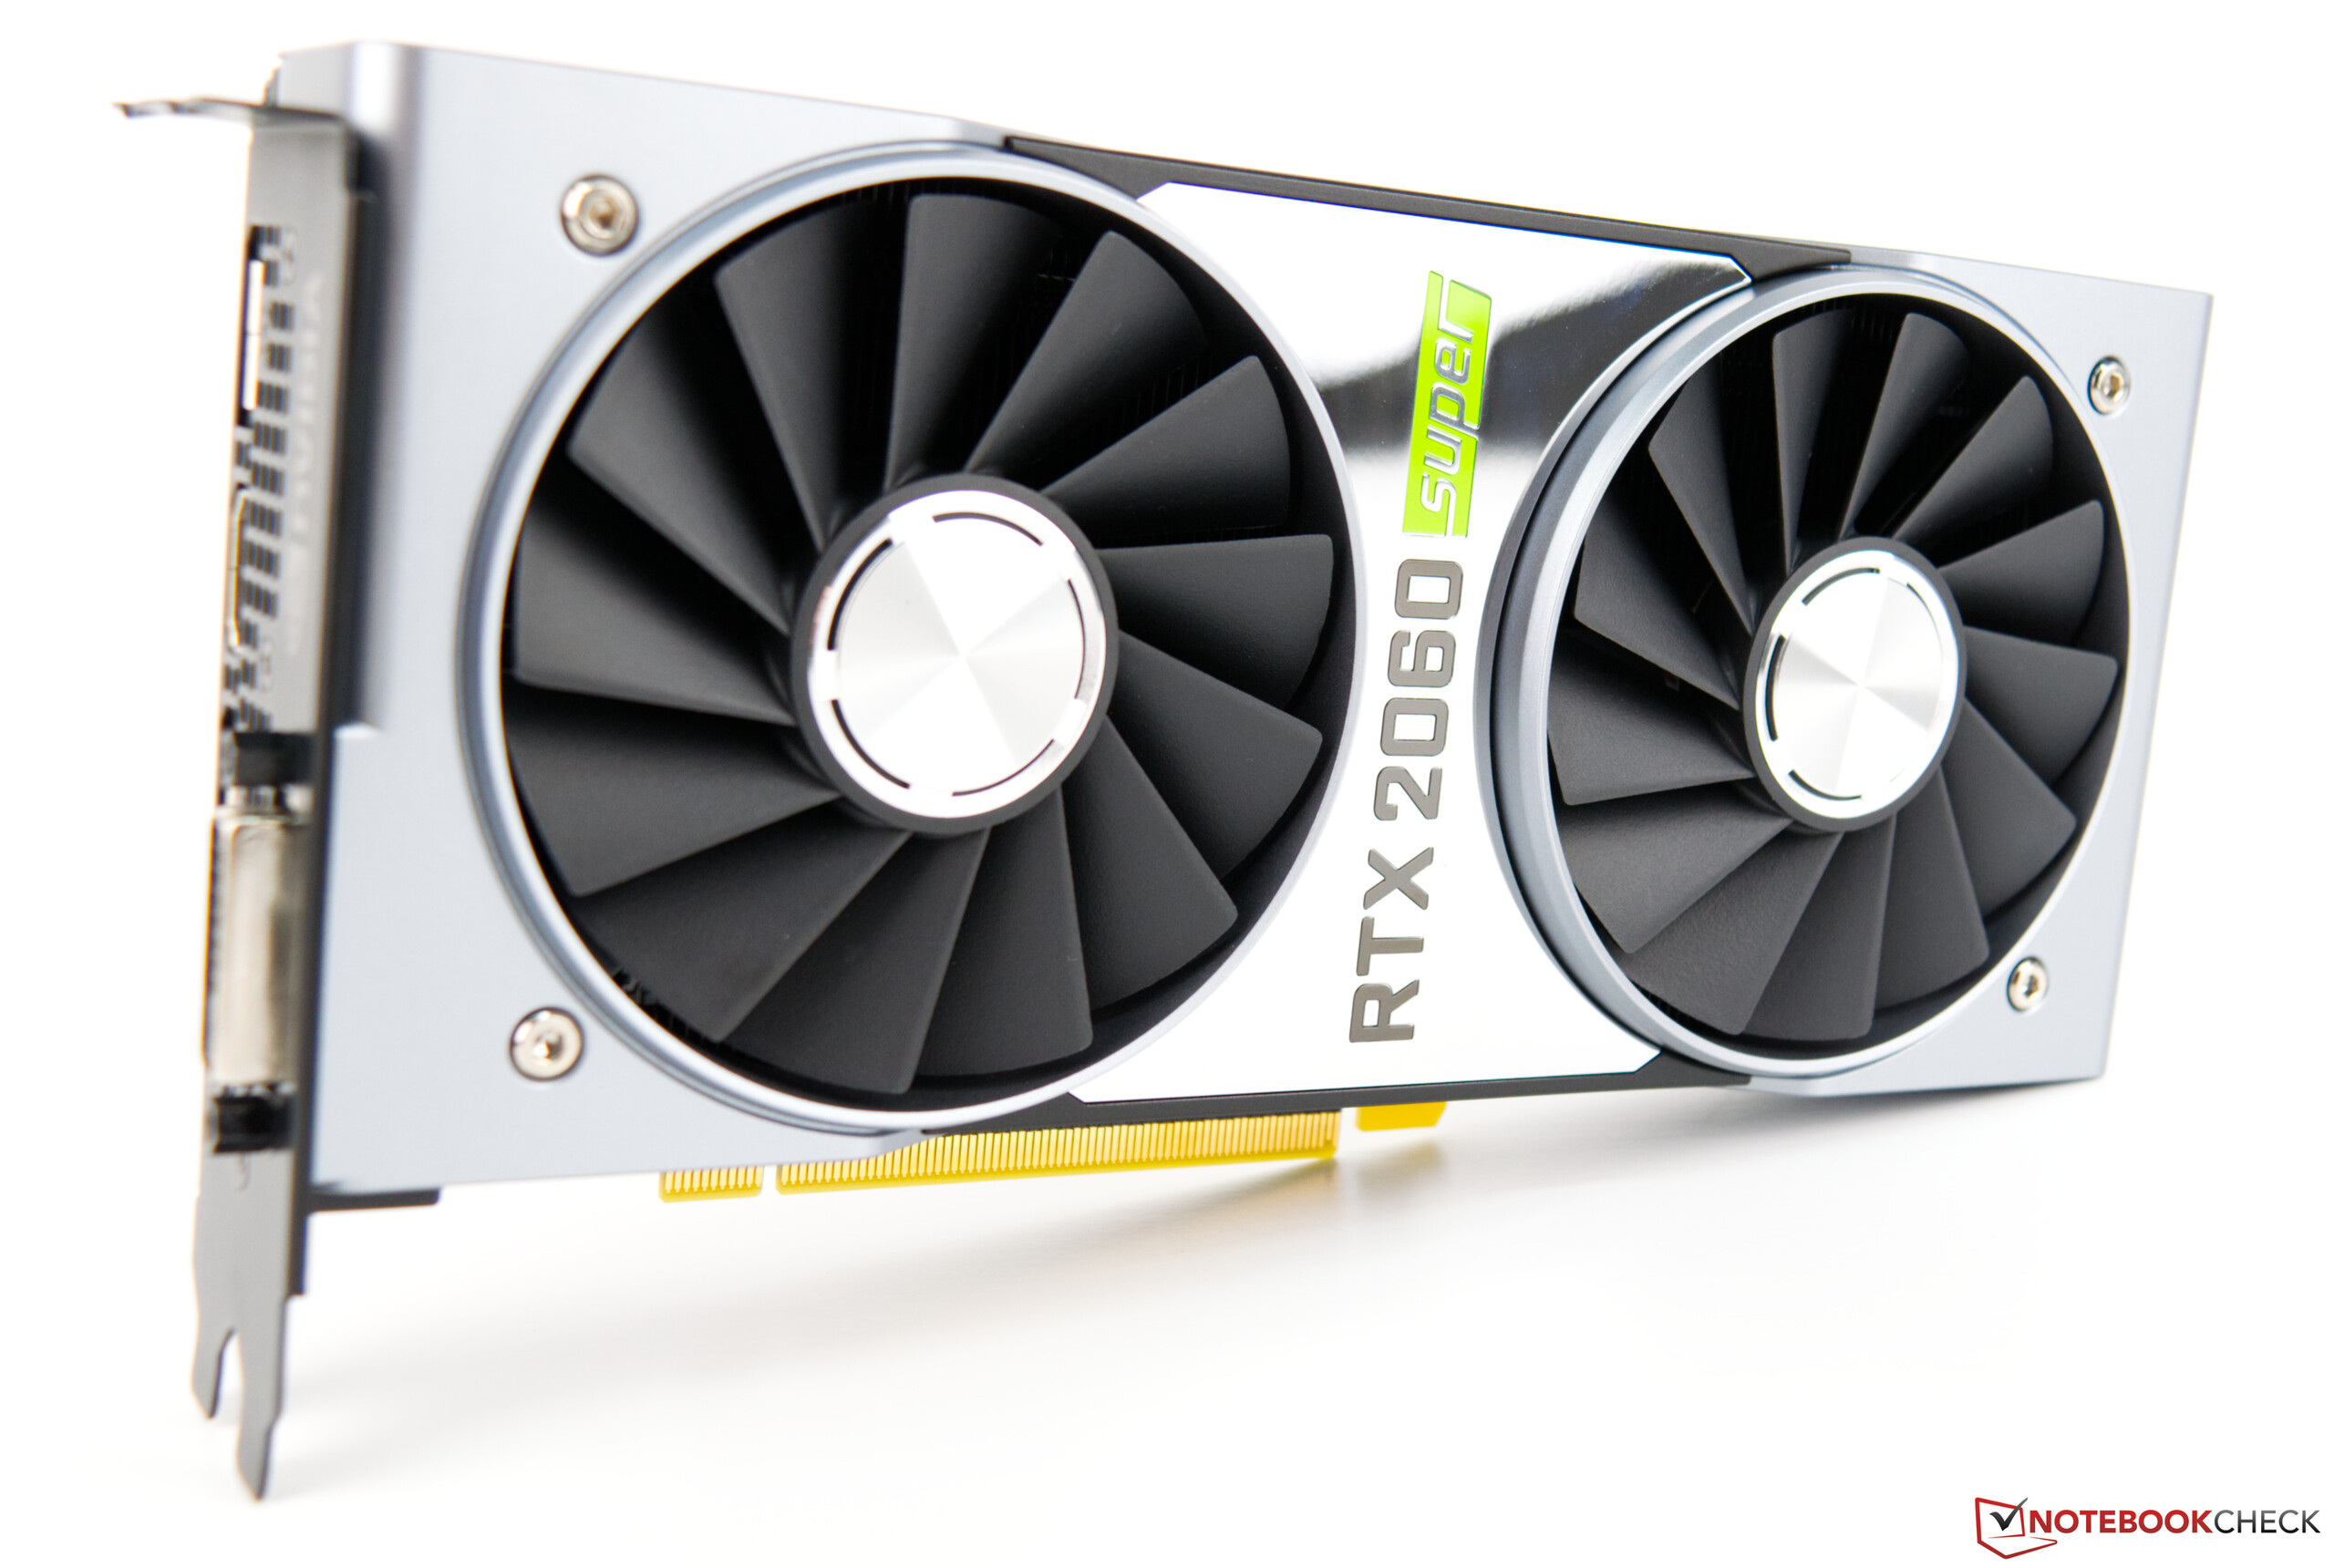
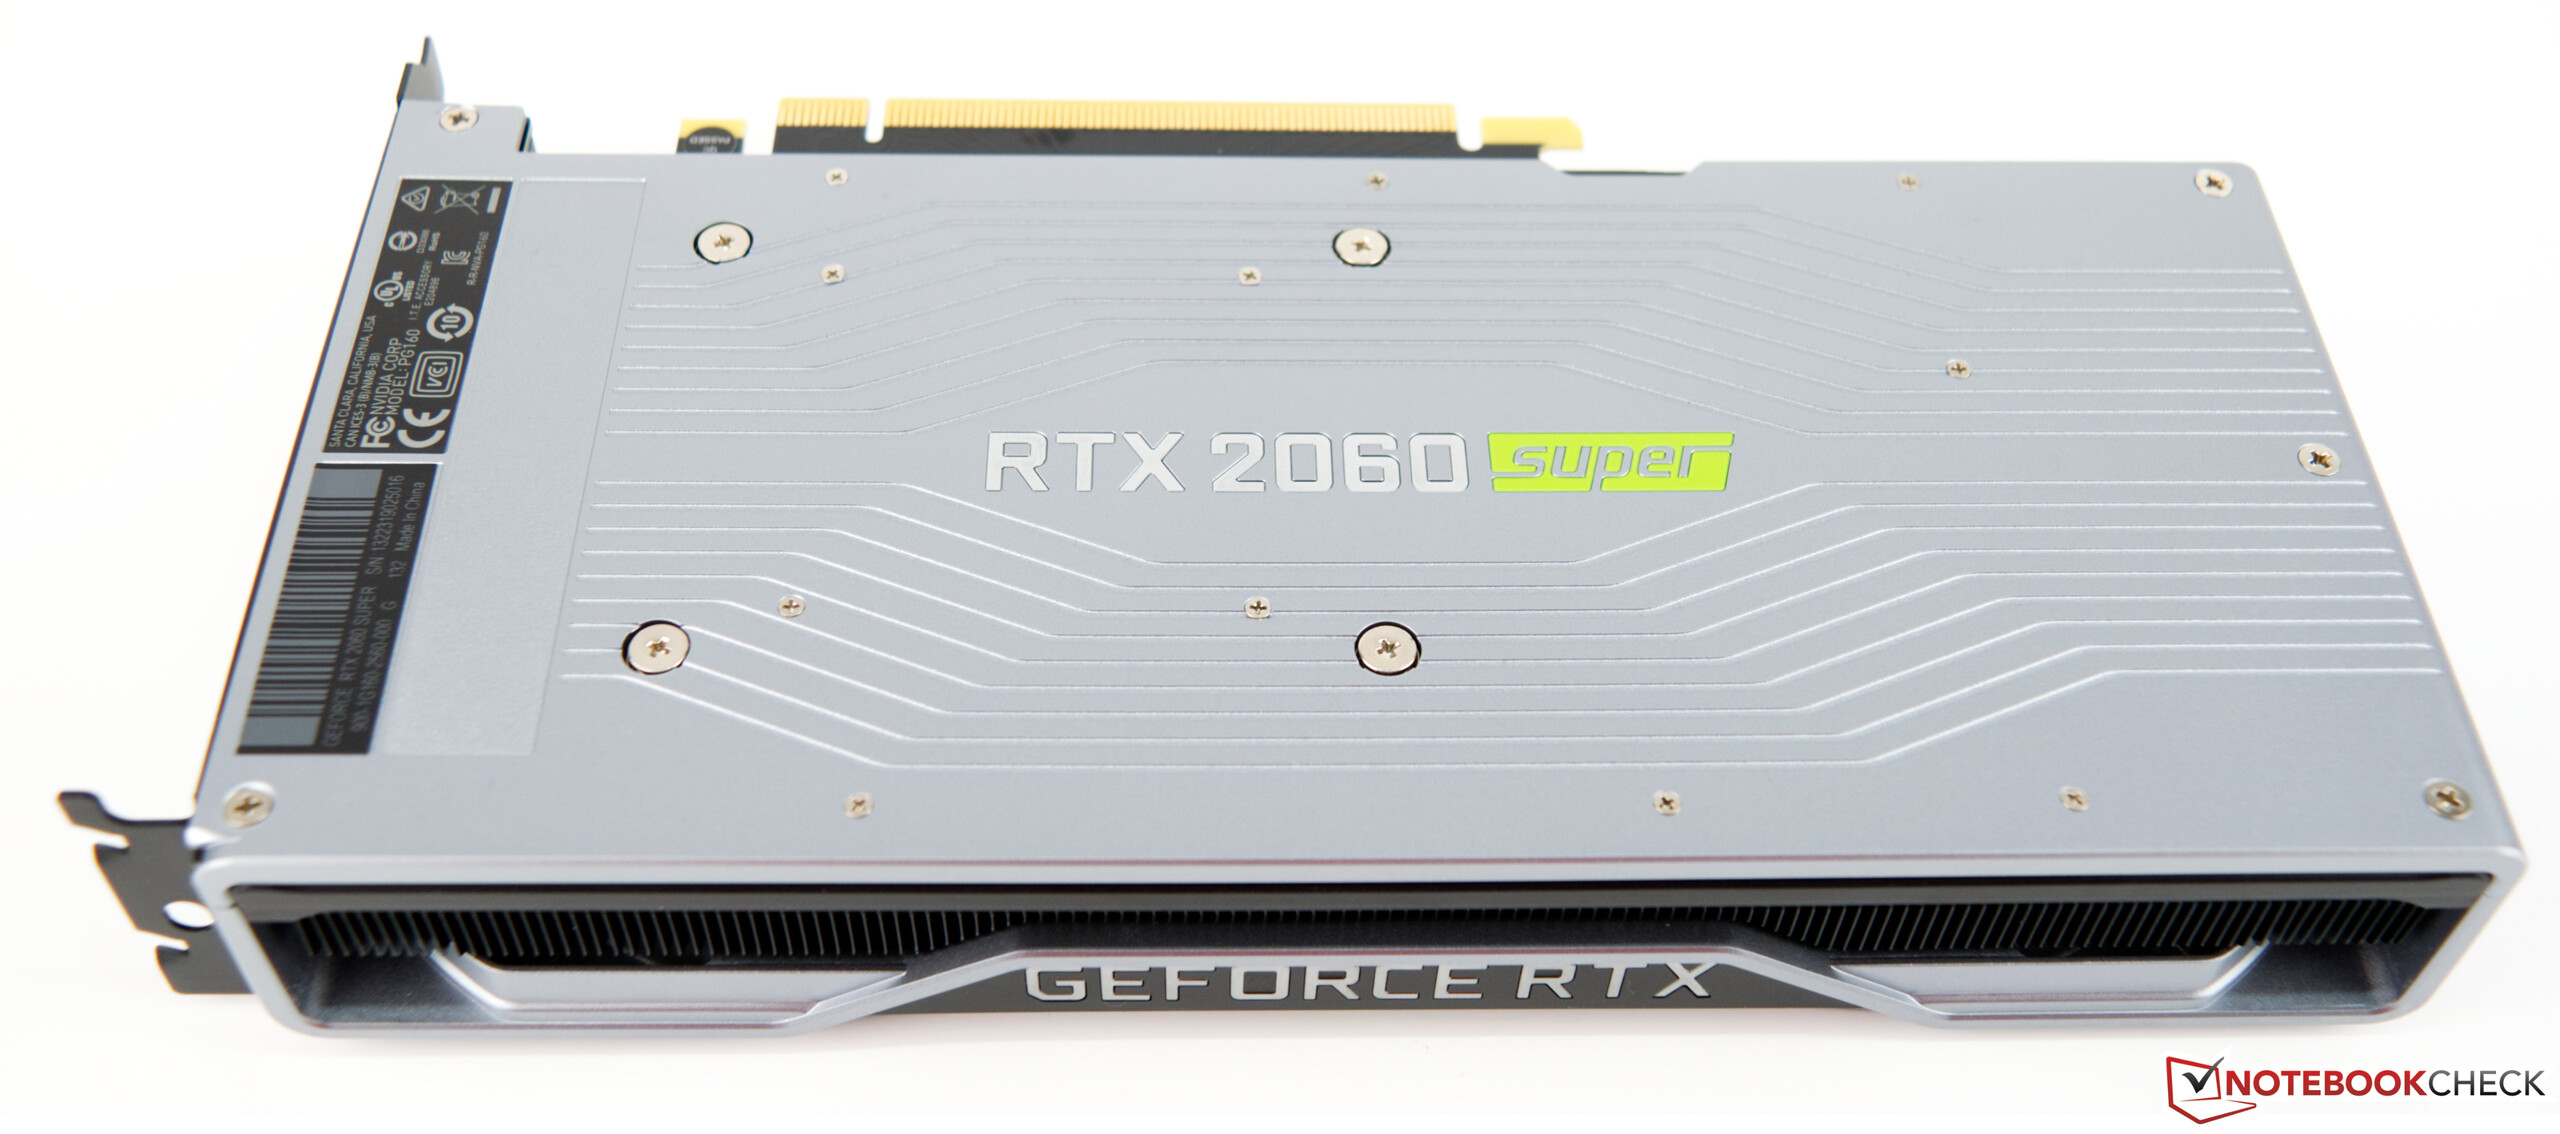
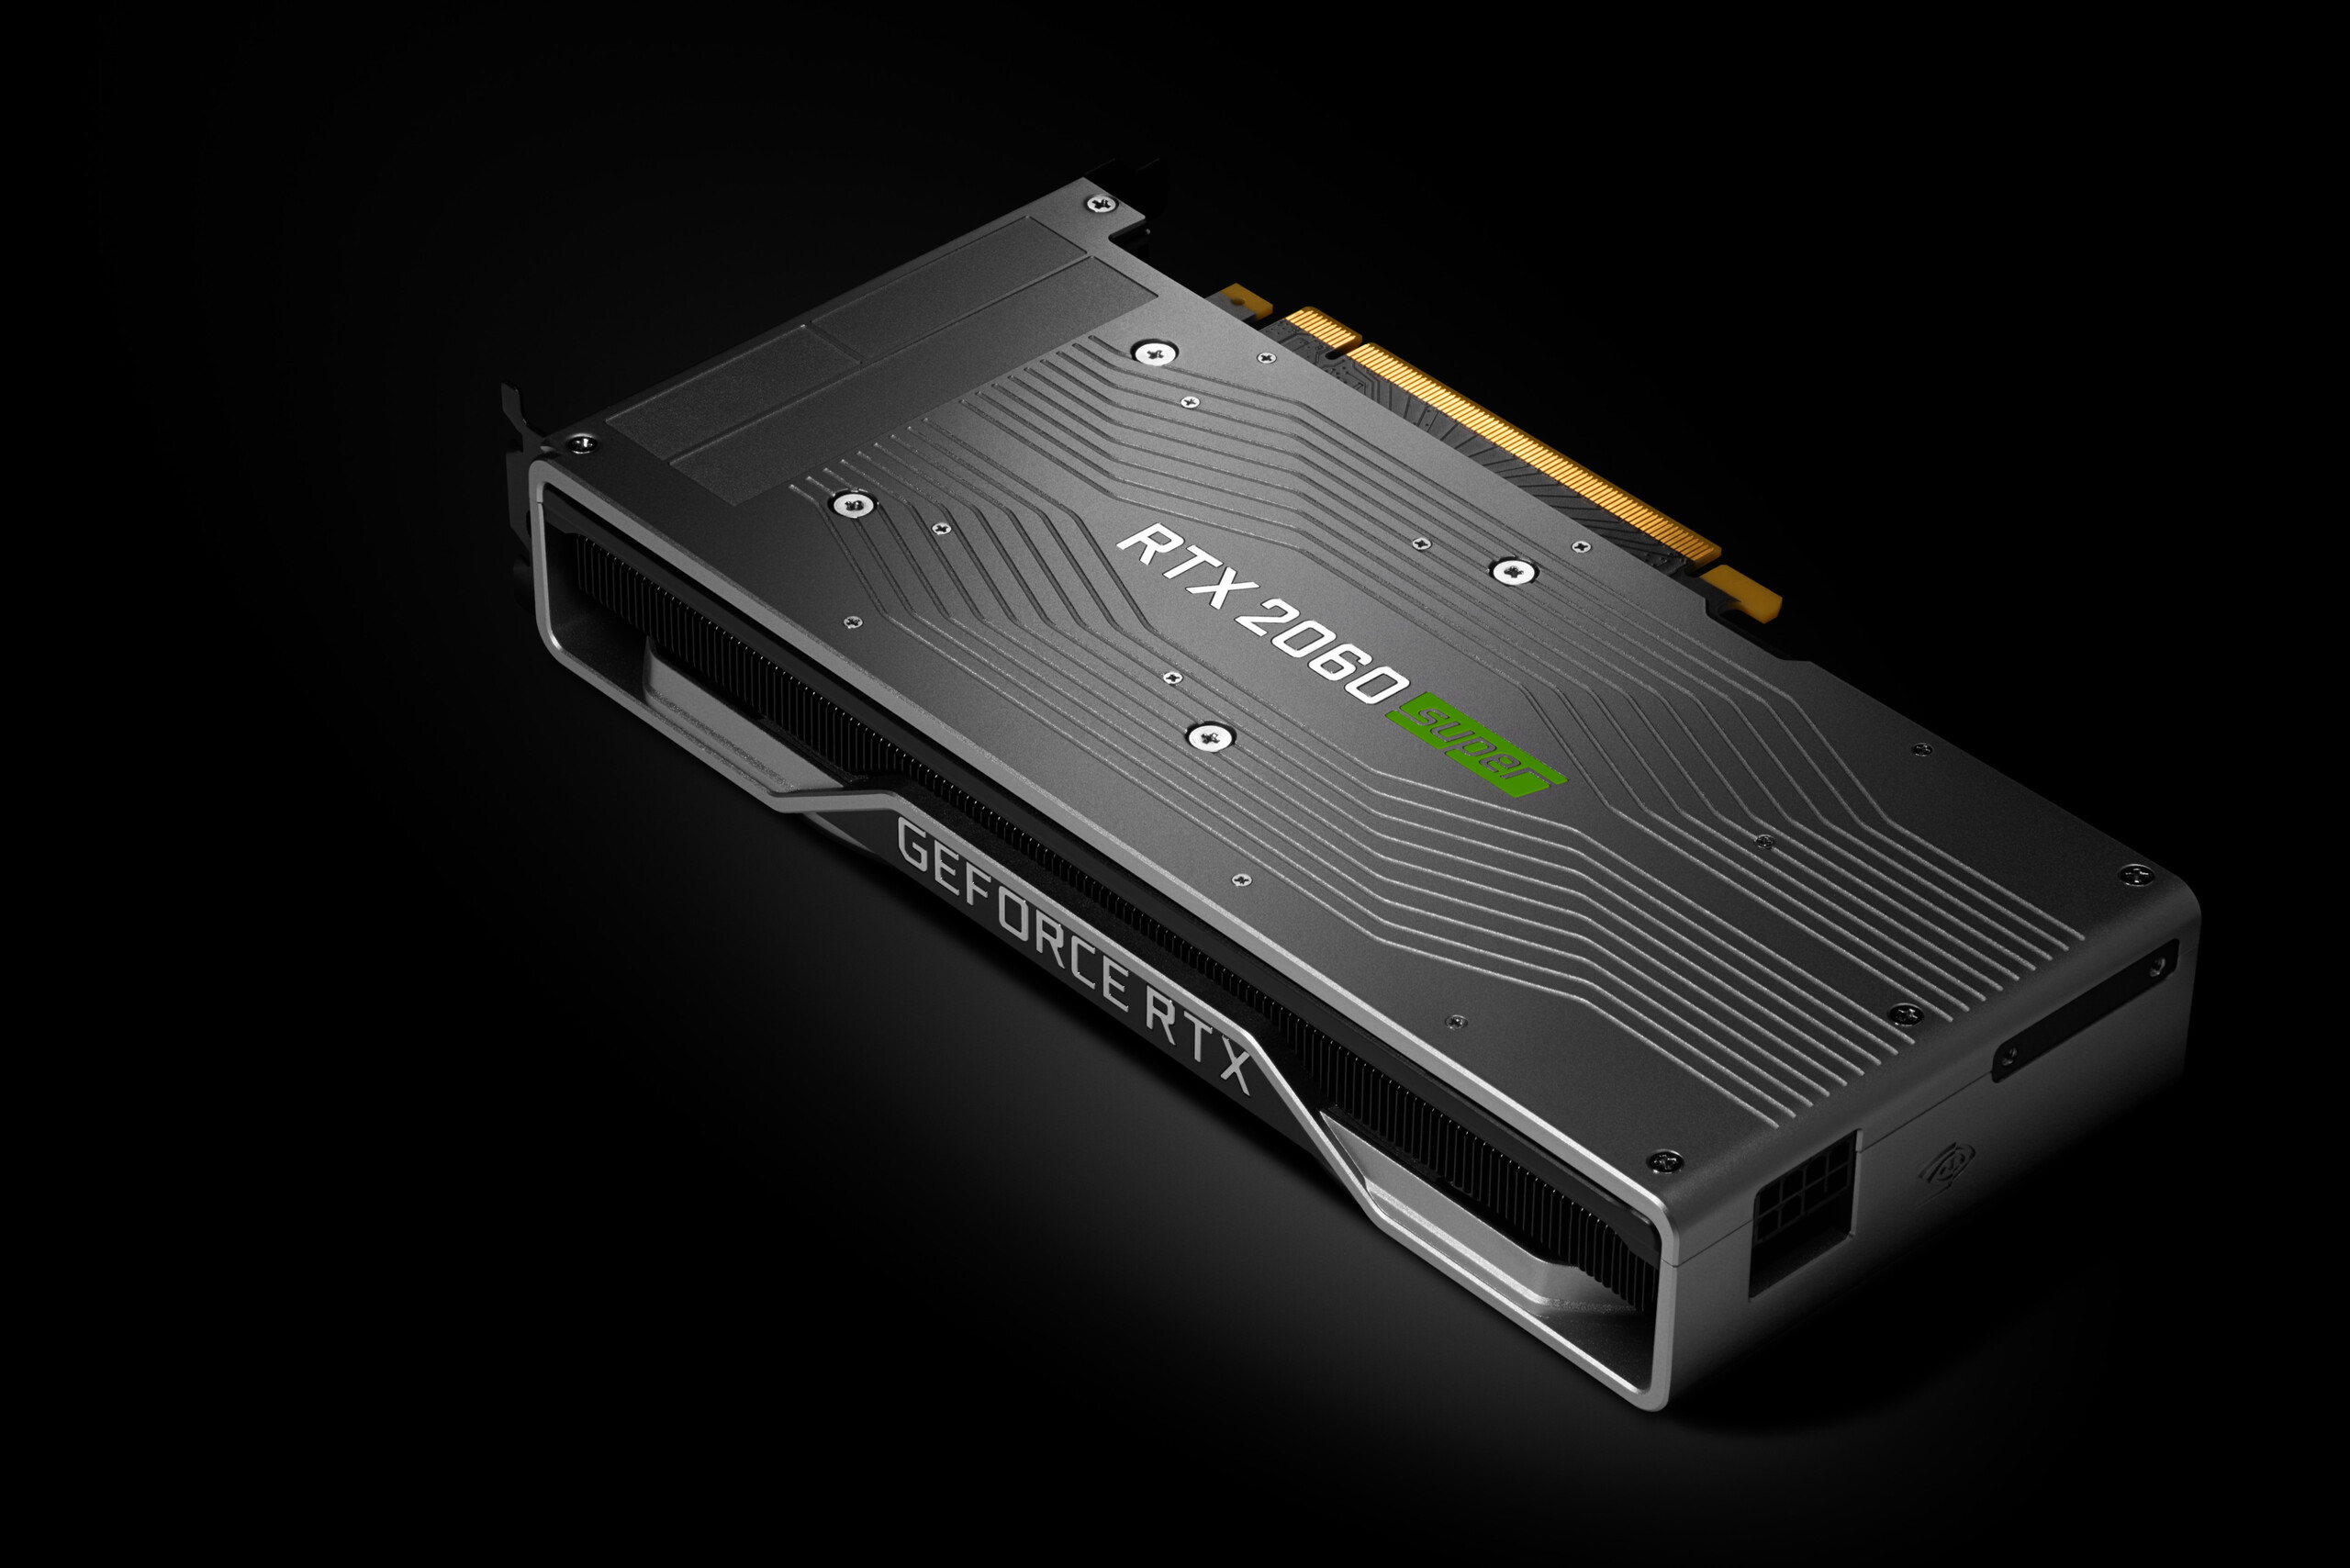
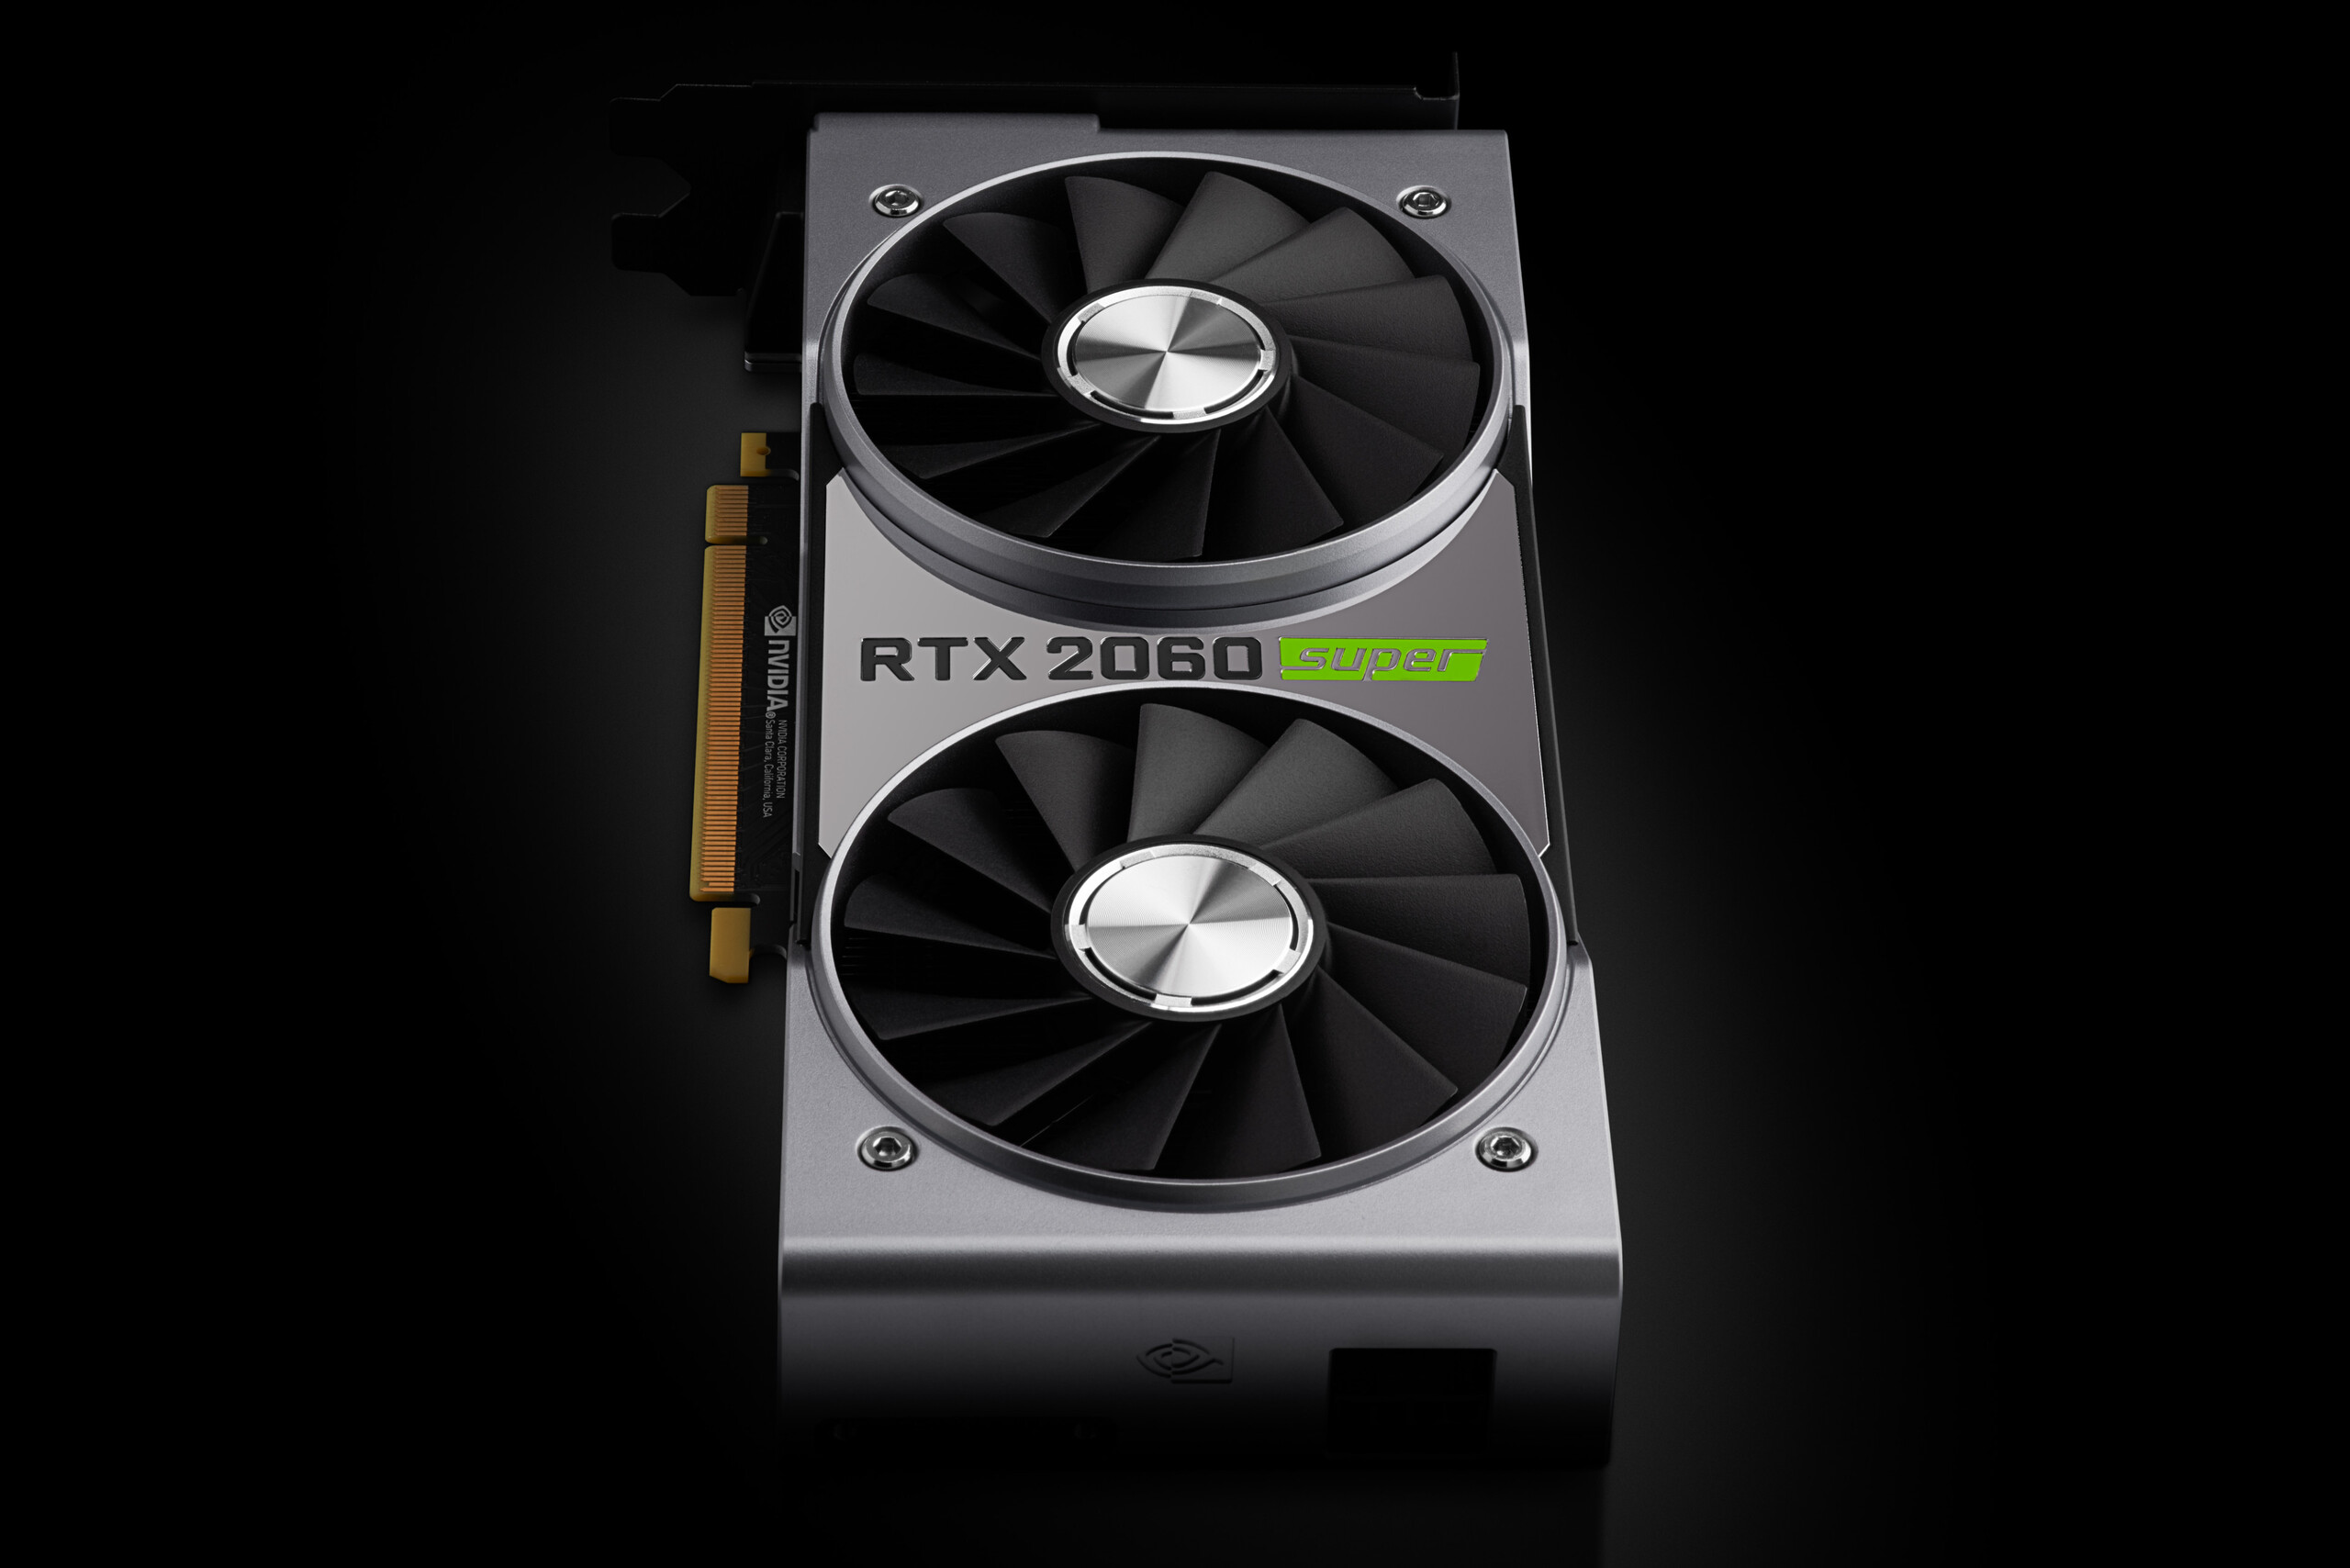
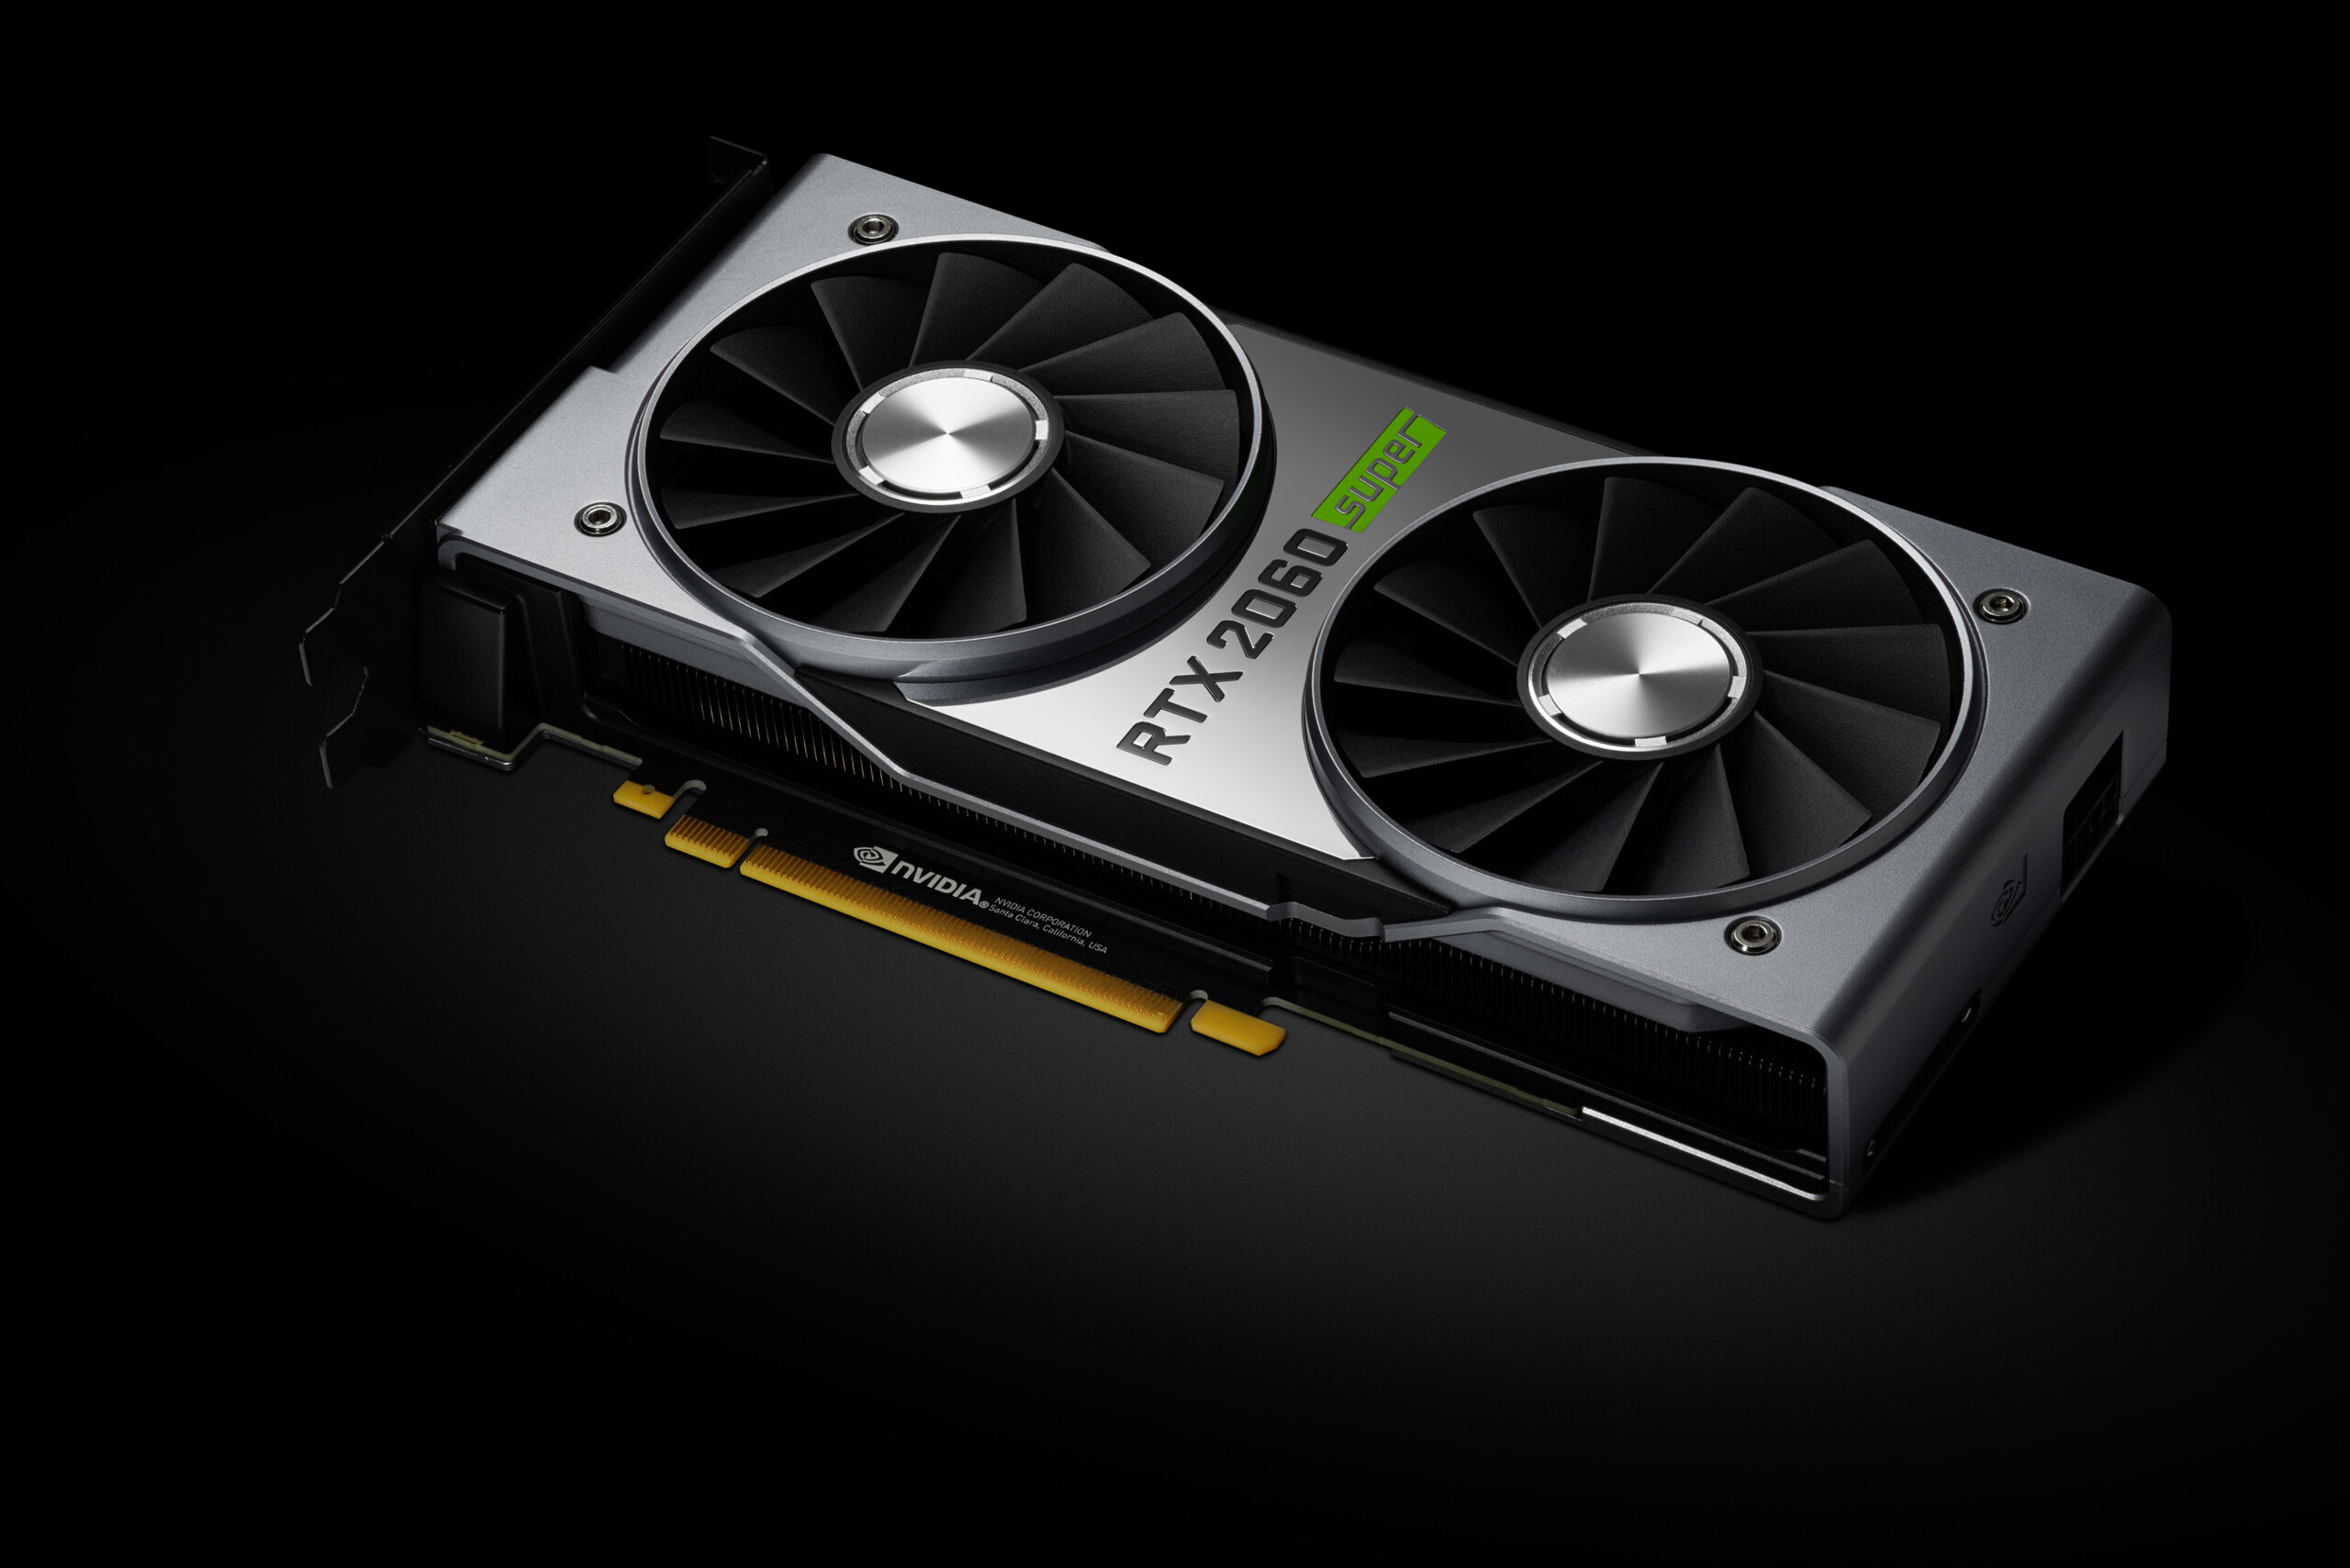
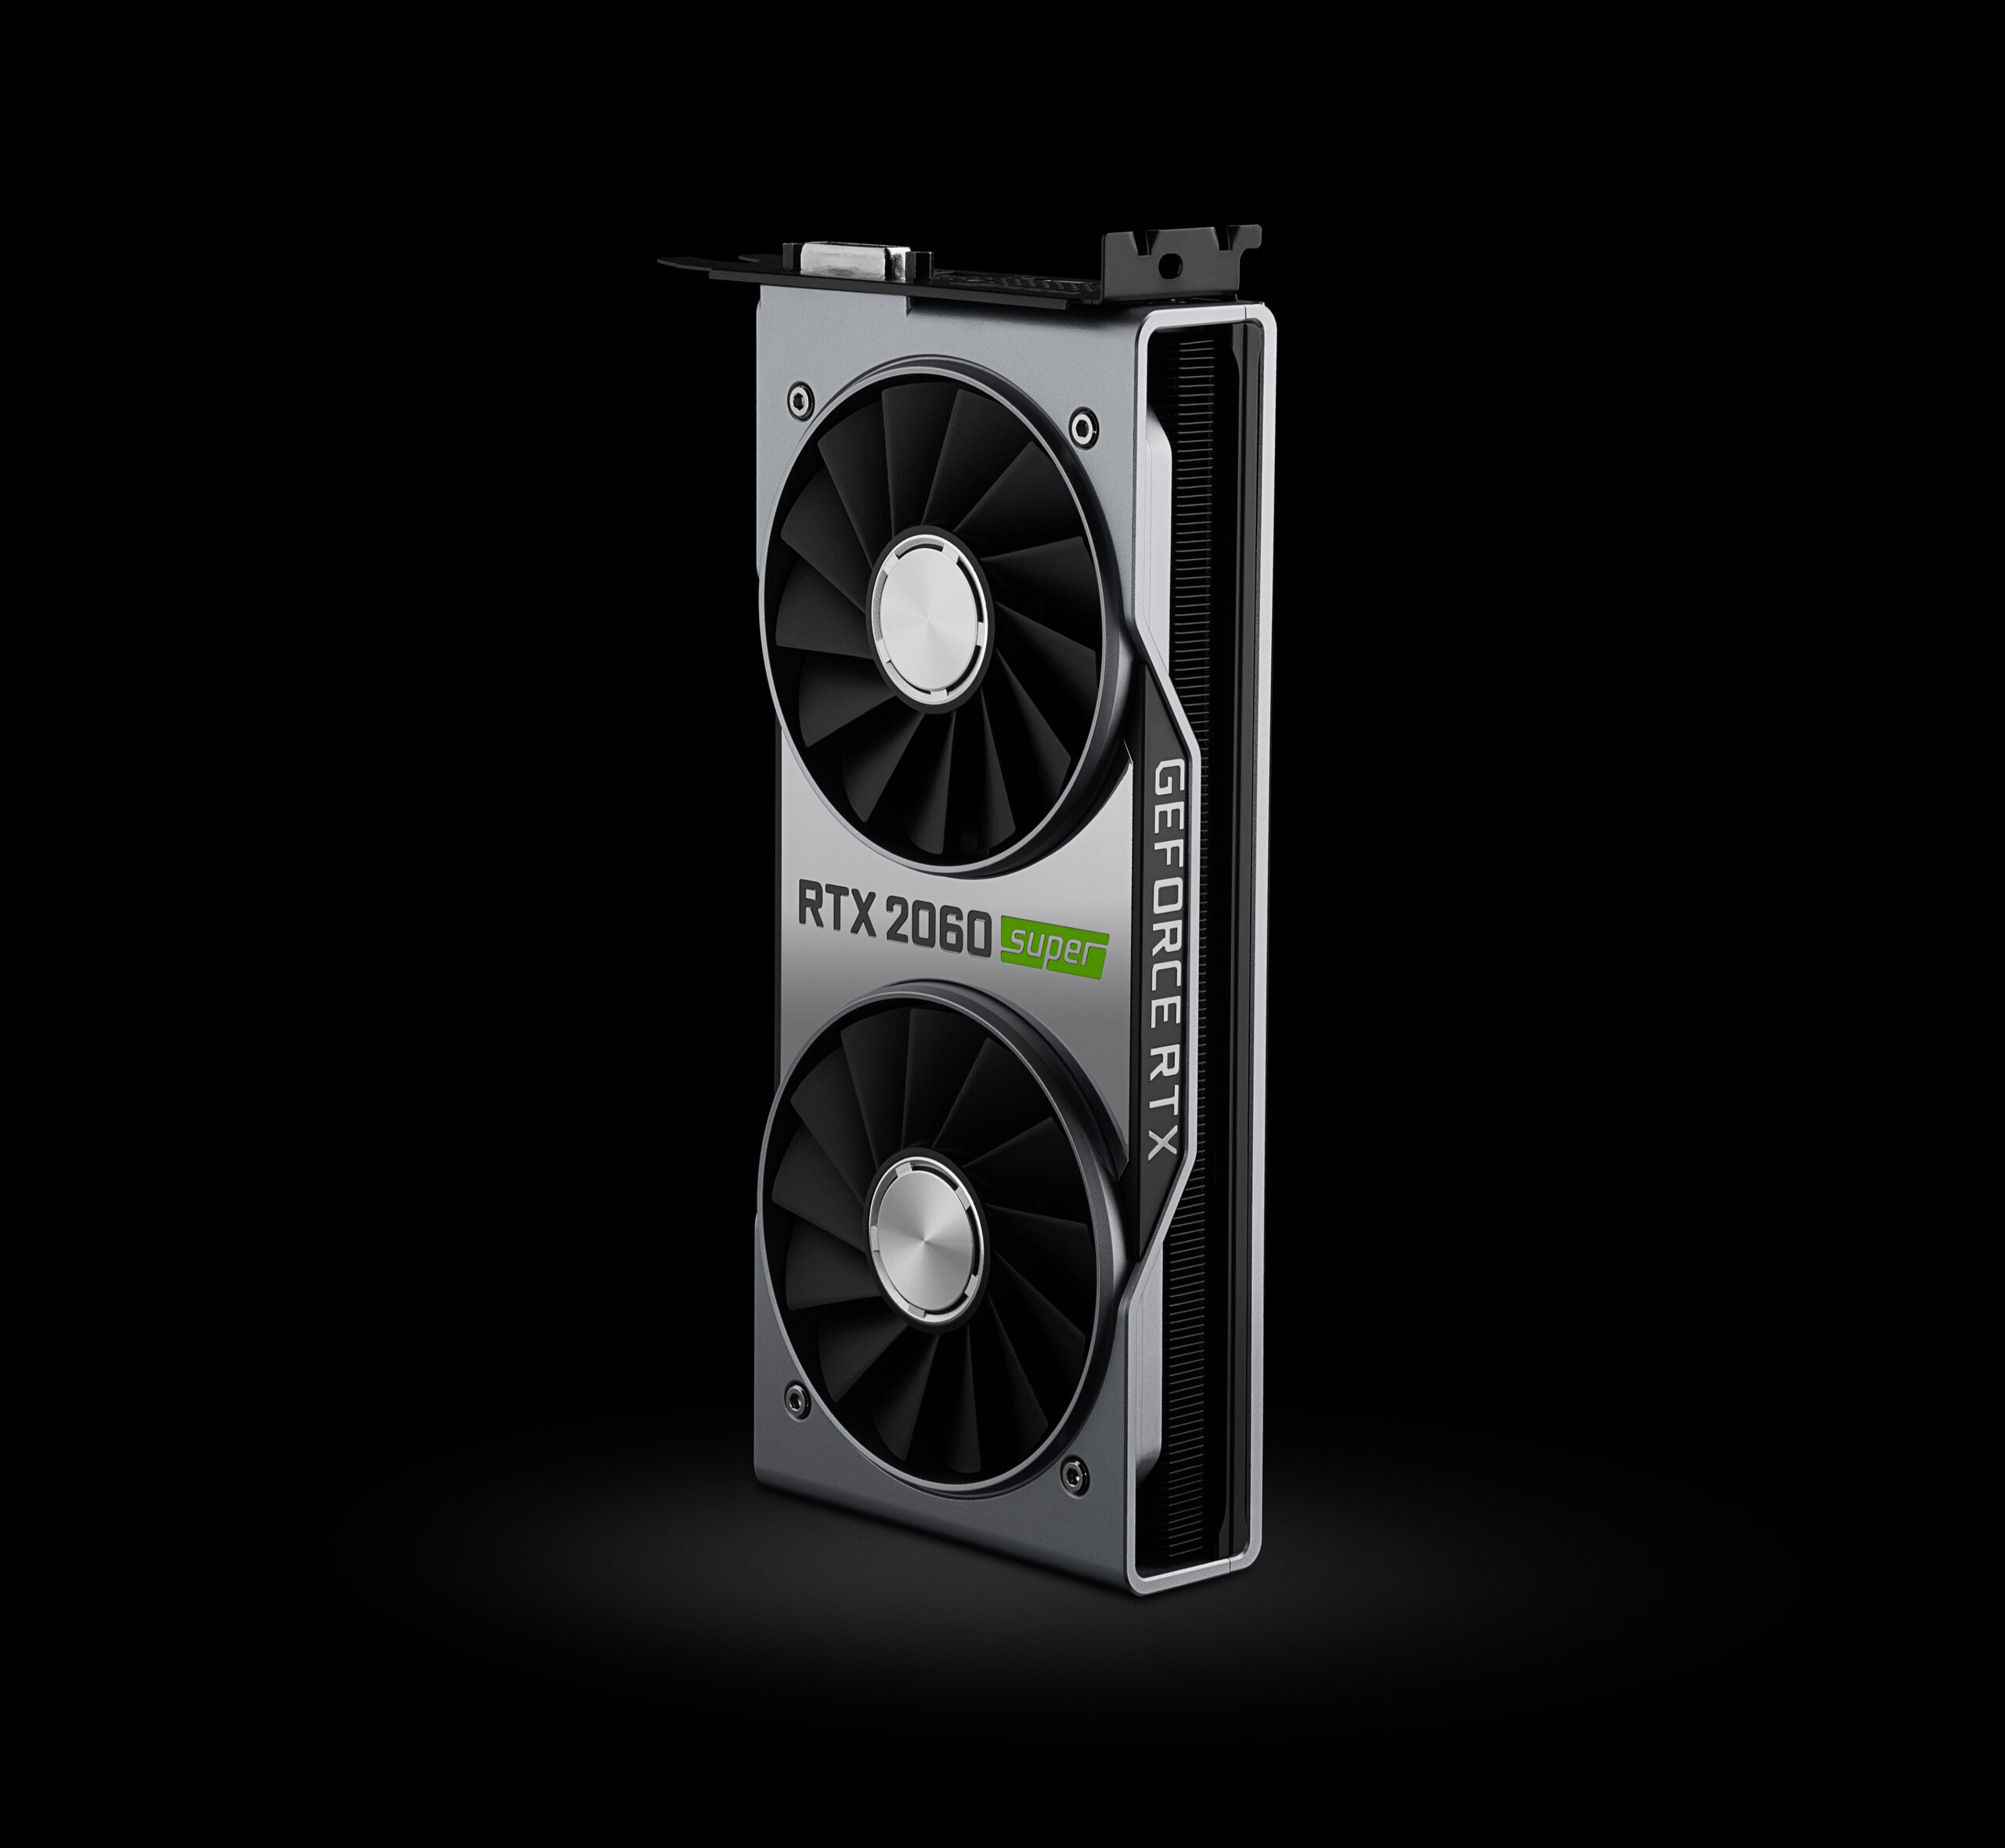
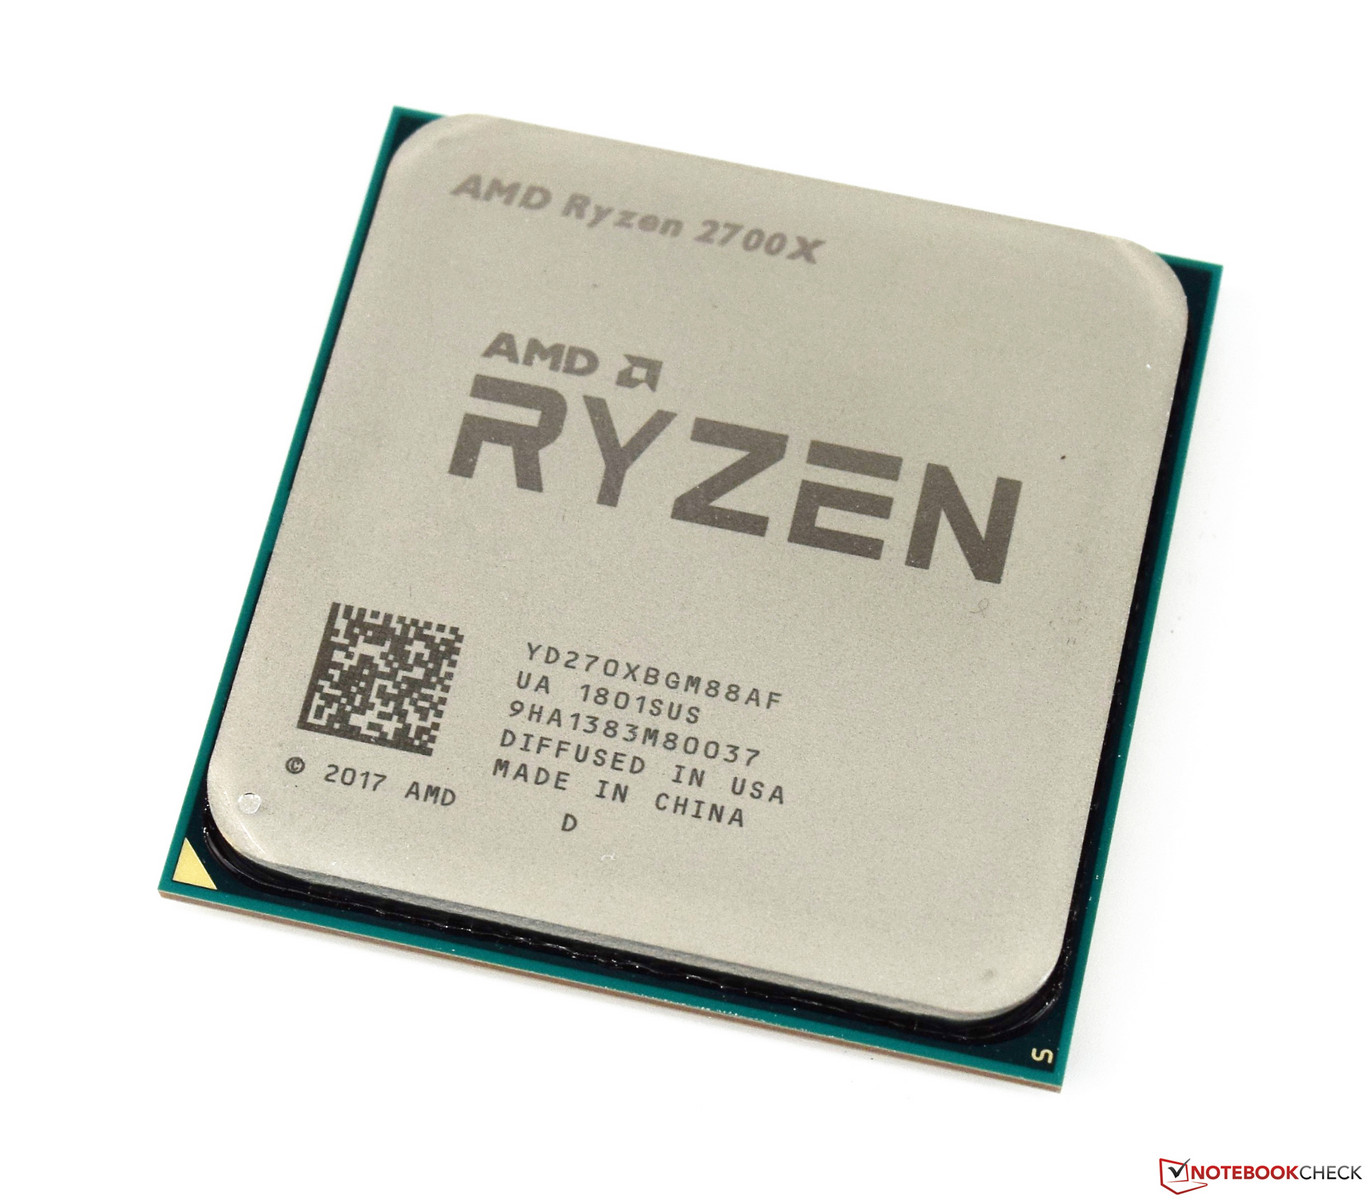
The Nvidia GeForce RTX 2060 Super Founders Edition is a reference model. There are no longer any cut-down versions of the RTX 2060S with lower specifications, which was the case with non-Super GPUs. Visually, there are no major changes. The word Super
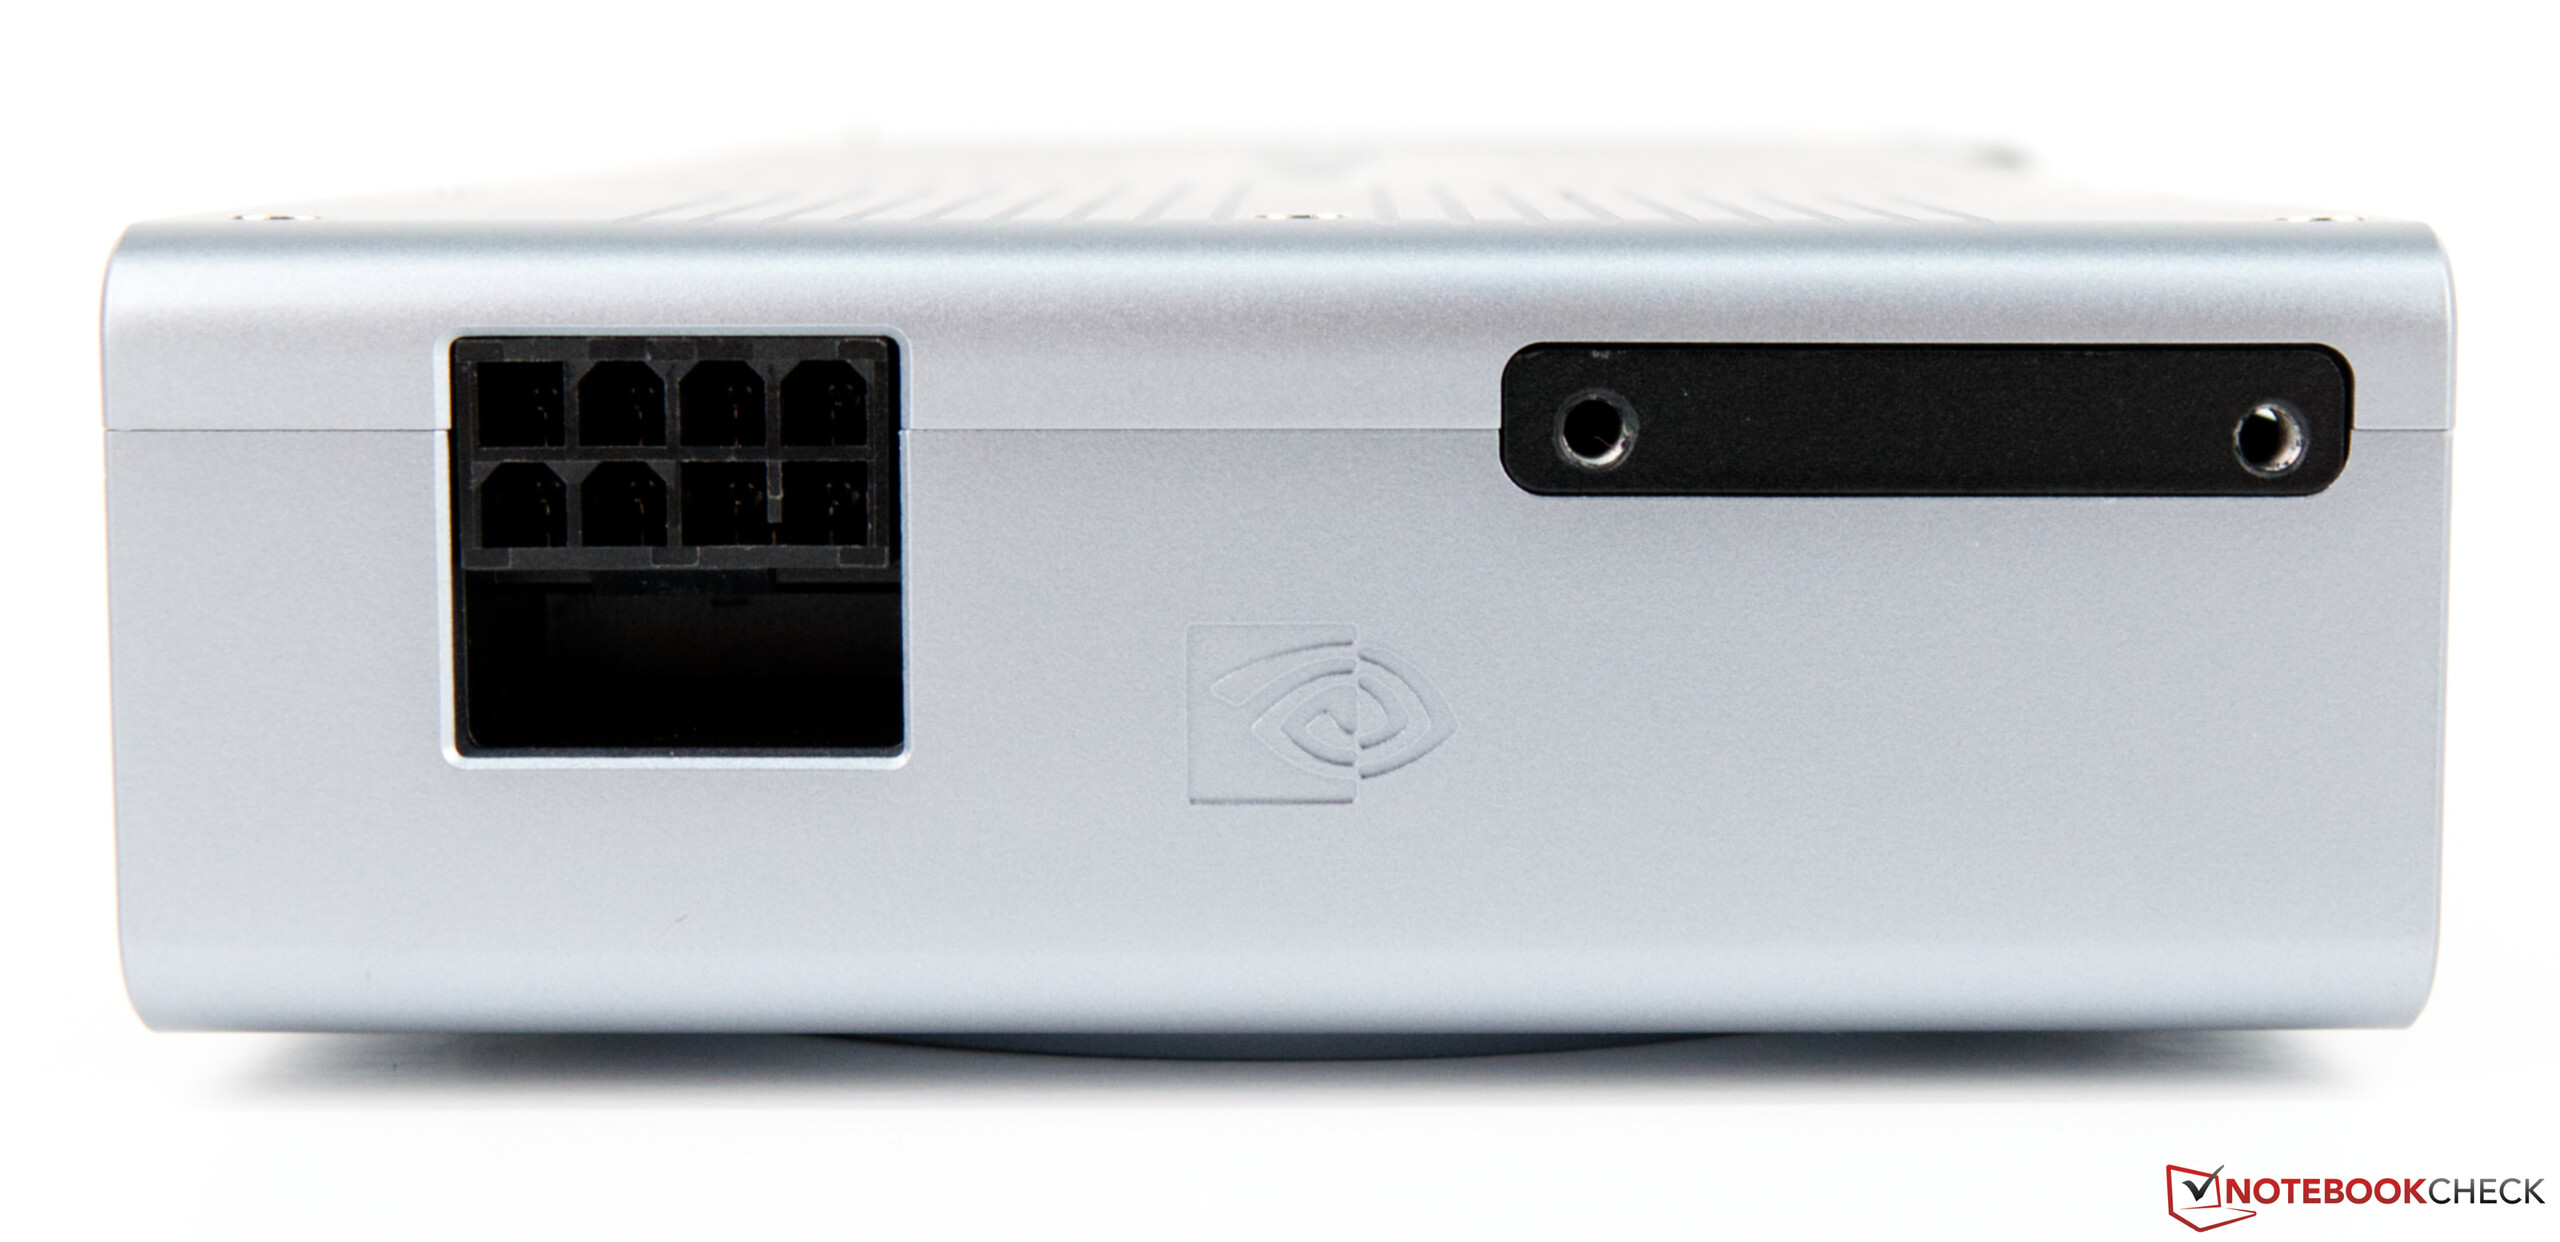
in green lettering adorns the backplate and the front of the GPU. The PCB and the dimensions of the RTX 2060S have not changed. The video card still features the same dual-fan cooling unit. All in all, the graphics card looks very compact and premium. There is an 8-pin connector on the back of the GPU. The GeForce RTX 2060 FE featured the same power connector.
The biggest difference, when compared to the predecessor model, is the amount of VRAM, which now amounts to 8 GB. The GPU now has a much bigger memory buffer. All in all, the PCB houses eight memory chips. The GPU is still built on the TU106 die, but now it has 2176 CUDA cores. Thanks to more RT and Tensor cores, there has been a slight improvement in ray-tracing performance. However, all of this came at a cost. The GeForce RTX 2060S draws 15 watts more than its predecessor and has a TDP of 175 watts. At the time of this review, the entry-level model in the RTX series retails for 419 Euros ($467).


The Turing-based GPU Specifications in Overview
| Specifications | RTX 2060 | RTX 2060S | RTX 2070 | RTX 2070S | RTX 2080 | RTX 2080S | RTX 2080 Ti | Titan RTX |
| Chip | TU106 | TU106 | TU106 | TU104 | TU104 | TU104 | TU102 | TU102 |
| Manufacturing process | 12 nm | 12 nm | 12 nm | 12 nm | 12 nm | 12 nm | 12 nm | 12 nm |
| CUDA cores | 1.920 | 2.176 | 2.304 | 2.560 | 2.944 | 3.072 | 4.352 | 4.608 |
| Texture Mapping Units | 120 | 136 | 144 | 160 | 184 | 192 | 272 | 288 |
| Tensor Cores | 240 | 272 | 288 | 320 | 368 | 384 | 544 | 572 |
| RT Cores | 30 | 34 | 36 | 40 | 46 | 48 | 68 | 72 |
| Base Clock | 1.365 MHz | 1.470 MHz | 1.410 MHz | 1.605 MHz | 1.515 MHz | 1.650 MHz | 1.350 MHz | 1.350 MHz |
| Boost Clock | 1.680 MHz | 1.650 MHz | 1.620 MHz | 1.770 MHz | 1.710 MHz | 1.815 MHz | 1.545 MHz | 1.770 MHz |
| Memory Bus Width | 192 Bit | 256 Bit | 256 Bit | 256 Bit | 256 Bit | 256 Bit | 352 Bit | 384 Bit |
| Memory Bandwidth | 336 GB/s | 448 GB/s | 448 GB/s | 448 GB/s | 448 GB/s | 496,1 GB/s | 616 GB/s | 672 GB/s |
| Memory Size | 6 GB GDDR6 | 8 GB GDDR6 | 8 GB GDDR6 | 8 GB GDDR6 | 8 GB GDDR6 | 8 GB GDDR6 | 11 GB GDDR6 | 24 GB GDDR6 |
| Power (in watts) | 160 W | 175 W | 175 W | 215 W | 215 W | 250 W | 250 W | 280 W |
The Test Bench - Based on the Ryzen 7 2700X
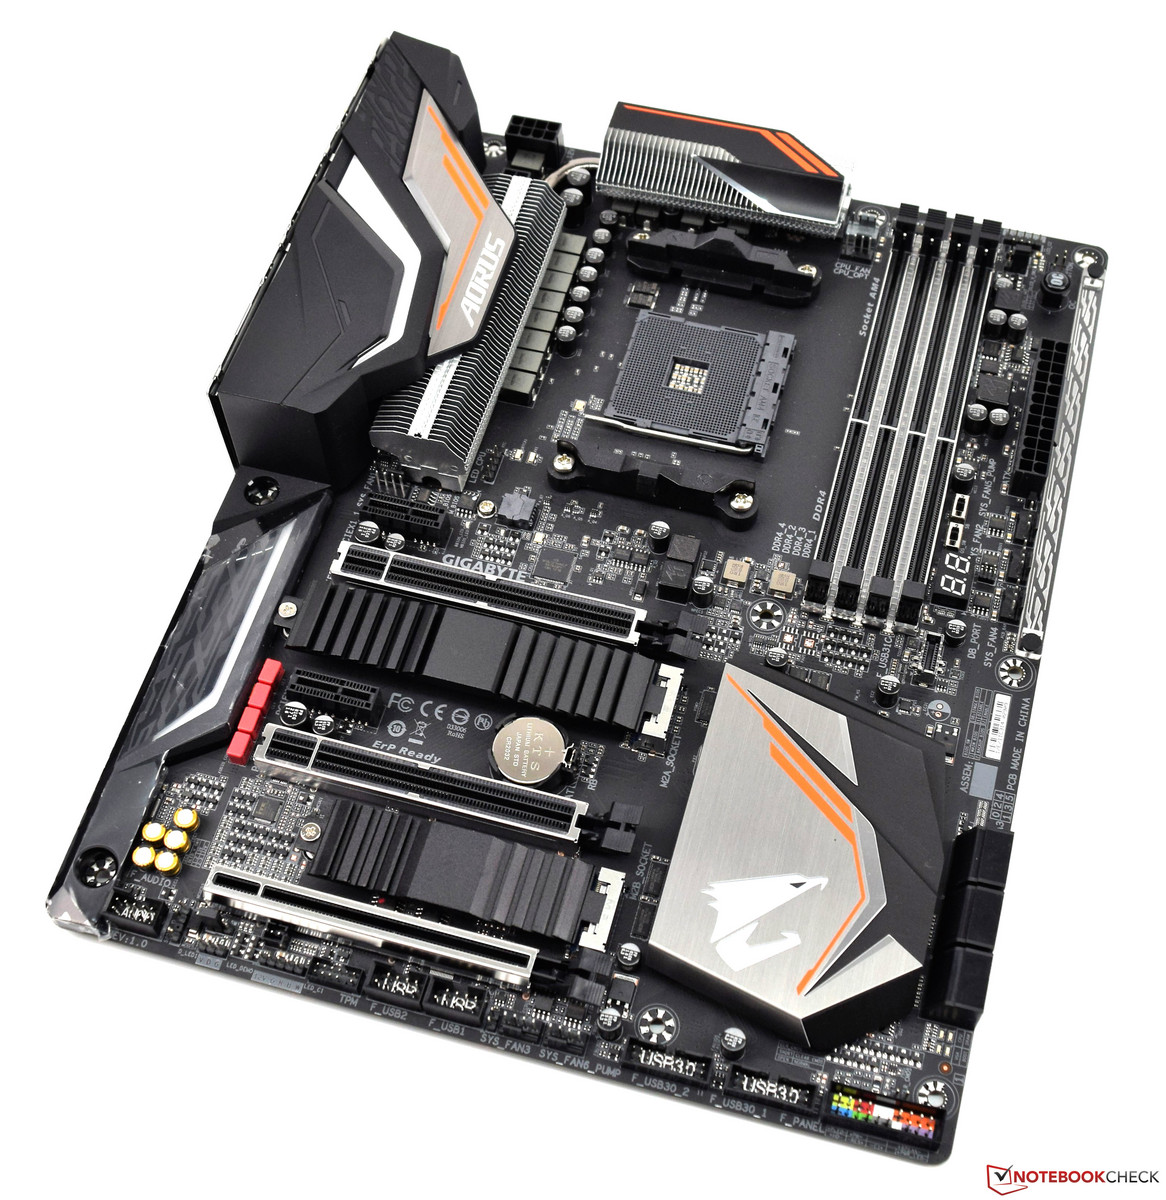
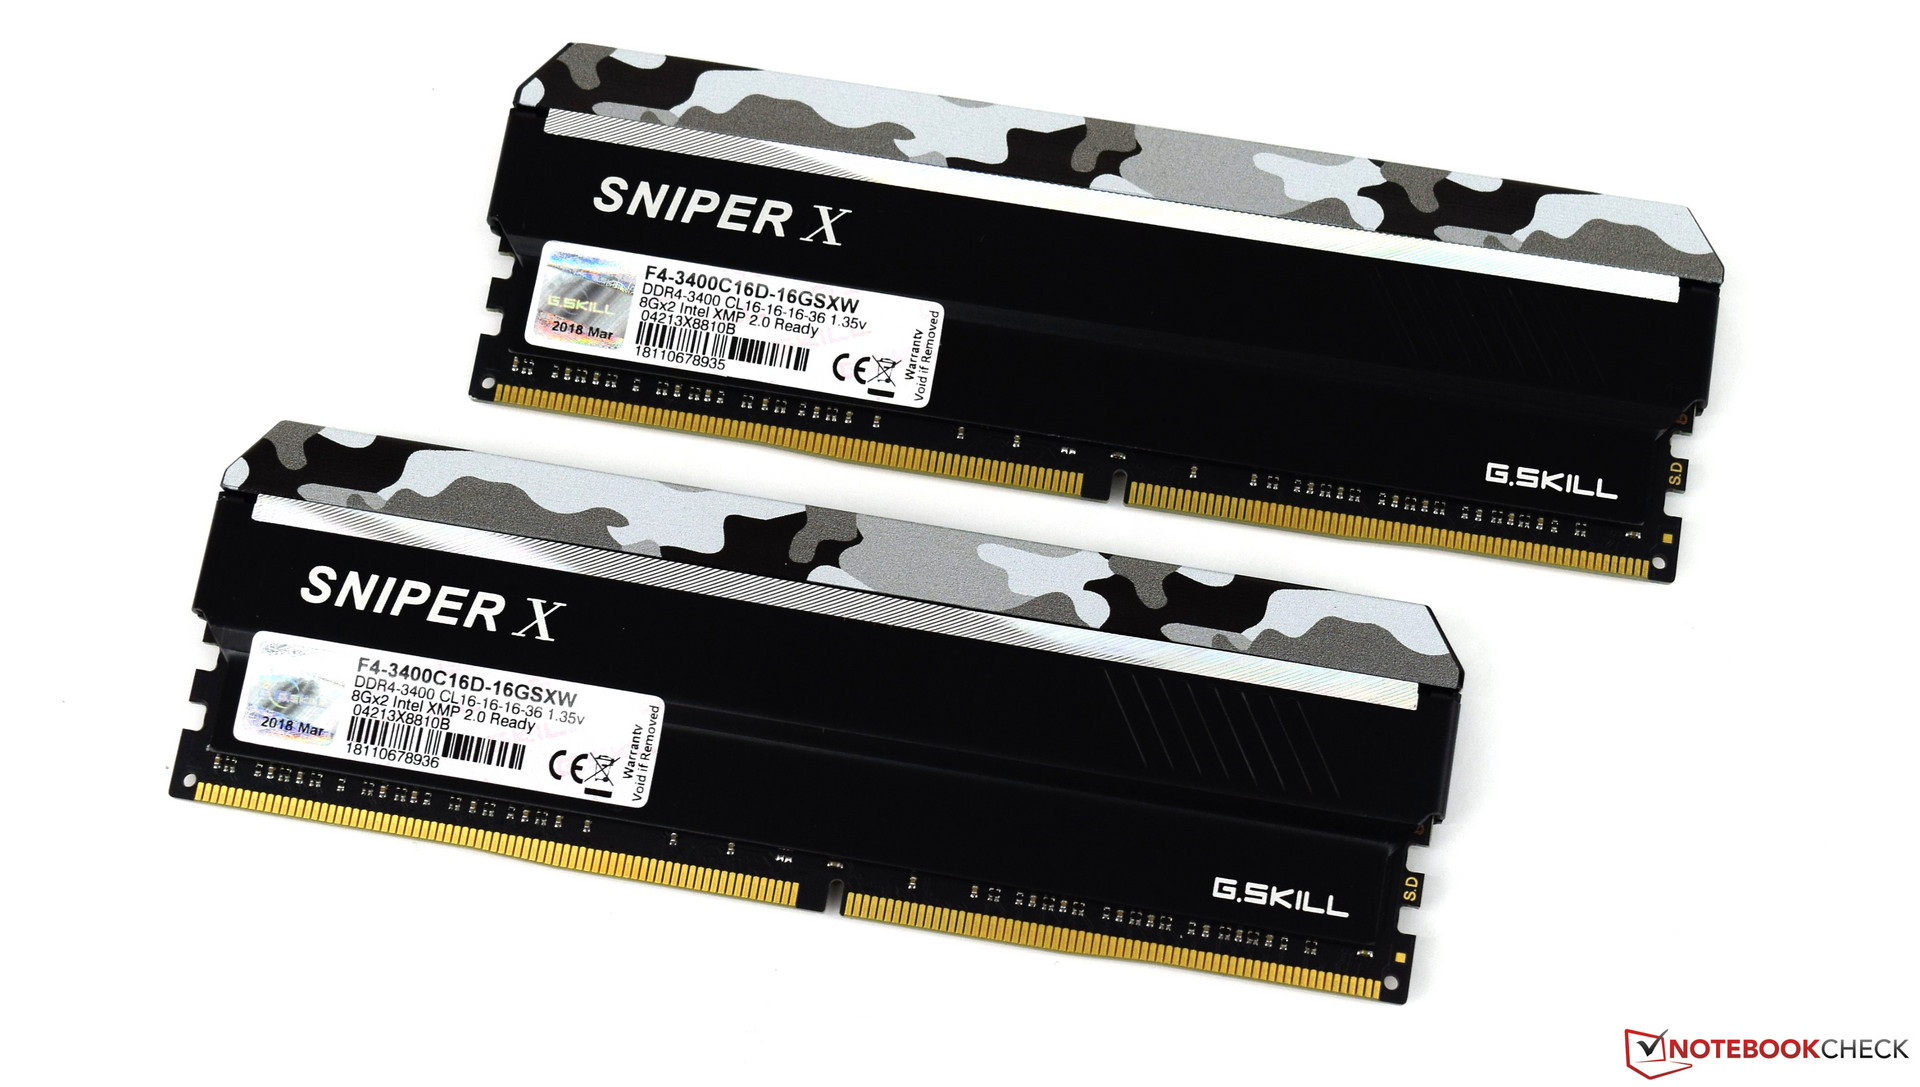
Our test bench is based on a current AMD platform. The Gigabyte X470 Aorus Gaming 7 Wi-Fi serves as the motherboard. The CPU, which is known as the AMD Ryzen 7 2700X, offers a lot of performance. The system is cooled by an all-in-one water cooler from Be Quiet (Silent Loop 280mm). The 16 GB of 3400 MHz RAM comes from G-Skill. The Acer Predator XB321HK does not represent a bottleneck, thanks to its 4K resolution. We are very grateful to AMD for providing us with the above-mentioned system.
| Case | Corsair Carbide Air 540 ATX Cube |
| CPU | AMD RYZEN 7 2700X |
| CPU Cooler | Be Quiet Silent Loop 280mm |
| RAM | G-Skill Sniper X 16 GB DDR4 3.400 MHz |
| Motherboard | Gigabyte X470 Aorus Gaming 7 WiFi |
| Monitor | Acer Predator XB321HK 4K |
| SSD | ADATA SP900 M.2 SSD 256GB (for the system) |
| SSD | Western Digital PC SN720 NVMe SSD 512GB (for games) |
| SSD | Crucial MX500 2TB (for games) |
| OS | Microsoft Windows 10 Professional 64-Bit (Version 1903) |
| Nvidia Drivers | 431.16 (10.07.2019) |
The Nvidia GeForce RTX 2060S in Overview
The NVIDIA GeForce RTX 2060 for desktops (also known as RTX 2060S) is a fast mid range graphics card in the GeForce Turing line-up. Compared to the older GeForce RTX 2060 (that still remains in the line-up), the Super version adds 256 shaders and a wider memory bus with more memory (now 8 GB GDDR6). It is still based on the same TU106 chip (now fully utilized) and currently has no mobile counterpart (opposed to the mobile RTX 2060). The mobile RTX 2060 refresh only got slightly revised clock speeds but no new name.
Features
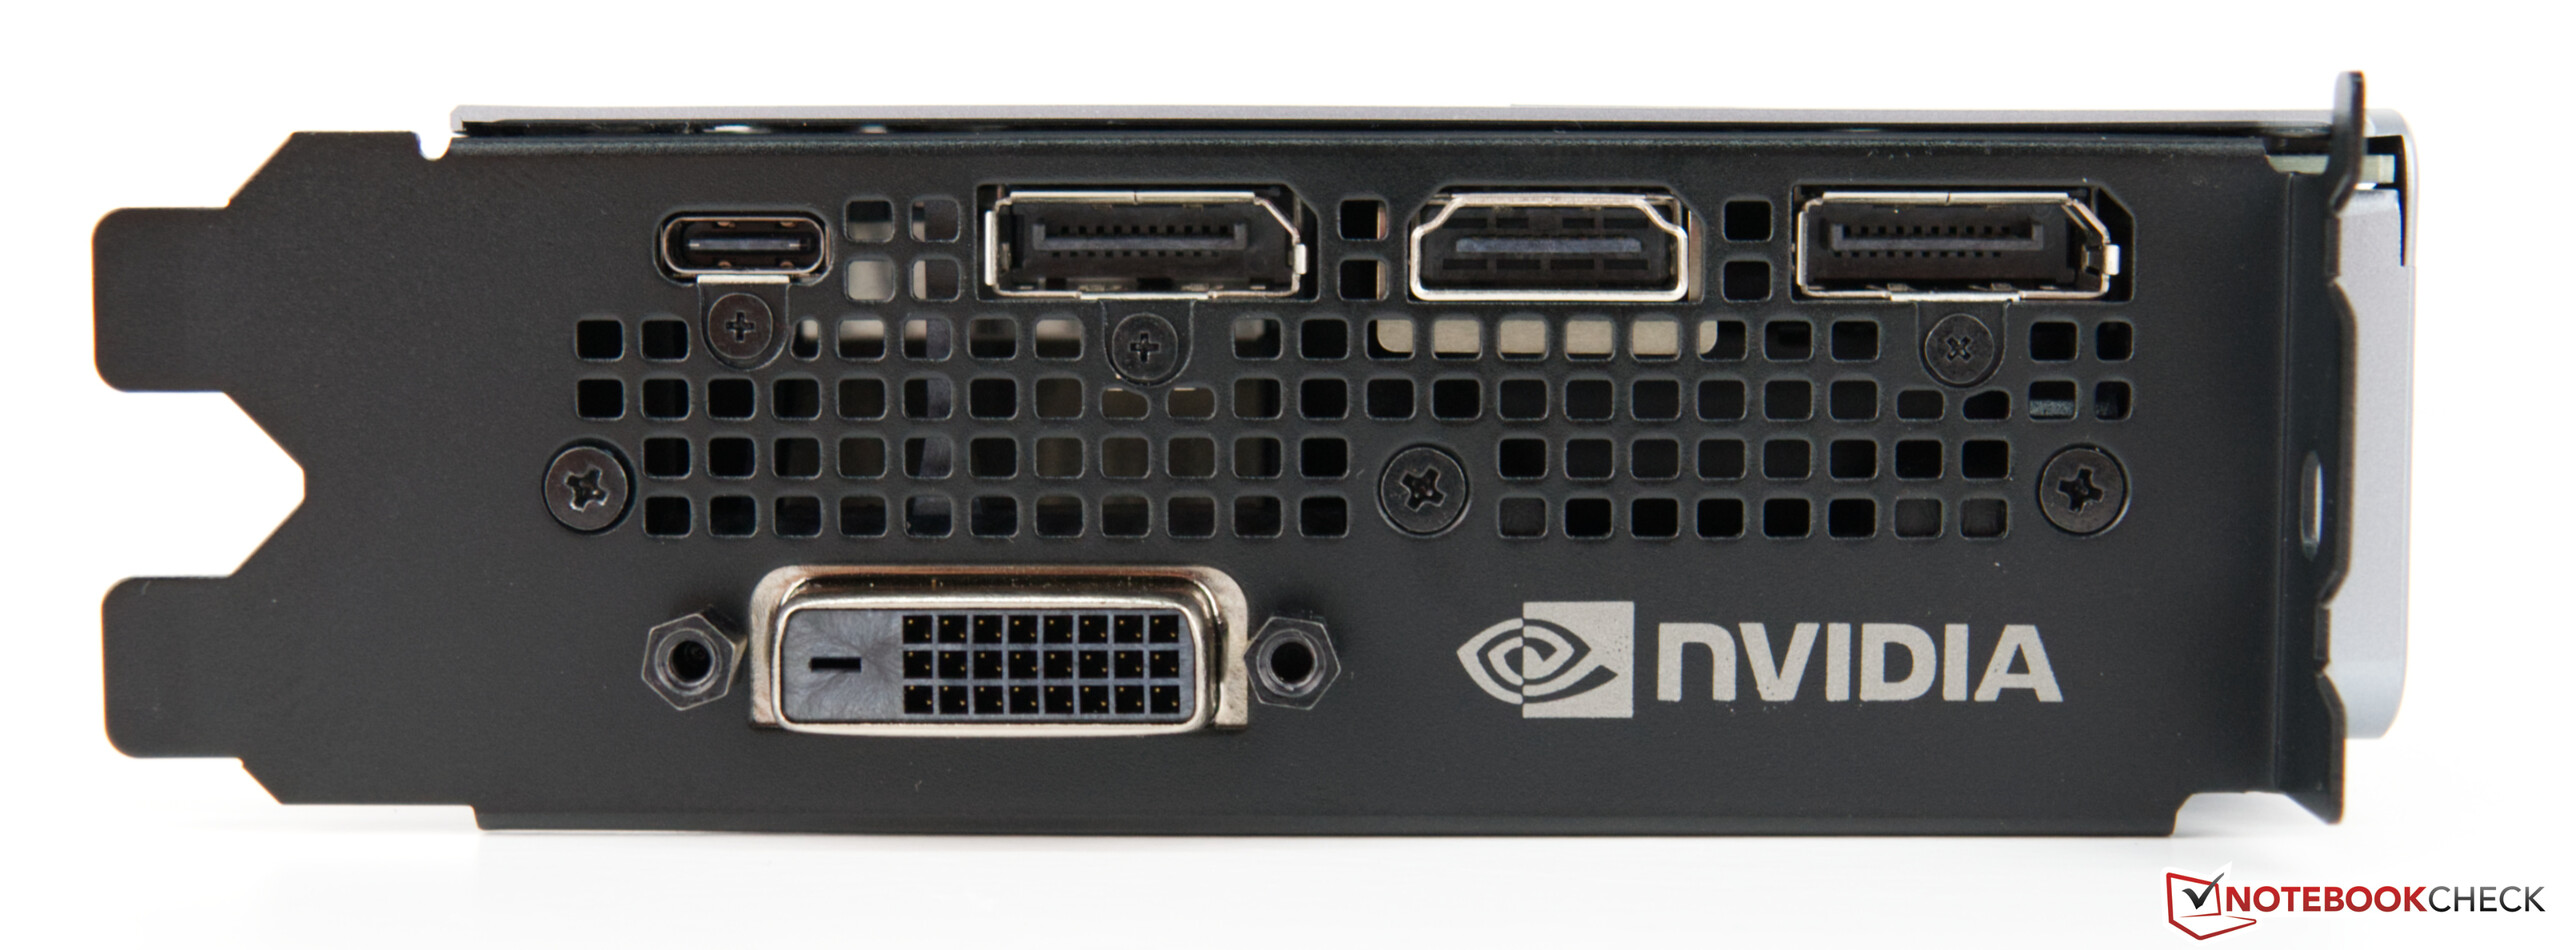
NVIDIA manufacturers the TU106 chip on a 12 nm FinFET process and includes features like Deep Learning Super Sampling (DLSS) and Real-Time Ray Tracing (RTRT), which should combine to create more realistic lighting effects than older GPUs based on the company's Pascal architecture (if the games supports it). The RTX 2060 is also DisplayPort 1.4 ready, while there is also support for HDMI 2.0b, HDR, Simultaneous Multi-Projection (SMP) and H.265 video en/decoding (PlayReady 3.0).
Performance
The average RTX 2060S performs slightly better than the old GeForce GTX 1080 and shows a clear improvement over the older RTX 2060. Therefore, the 2060 Super is positioned in the mid range and well suited for most games of 2018 in 1080p and 1440p. Compared to AMD, the RTX 2060 Super is positioned to run against the AMD RX 5700.
Power Requirements
NVIDIA specifies that the RTX 2060 Super should consume a maximum of 175 W and therefore 15 Watt more than the RTX 2060. In our tests the power consumption of the RTX 2060S was slightly lower than the old GTX 1080.
GeForce RTX 2000 Series
| ||||||||||||||||||||||||||||||||||||||||||||||||||||||||||
| Codename | Turing TU106 | |||||||||||||||||||||||||||||||||||||||||||||||||||||||||
| Architecture | Turing | |||||||||||||||||||||||||||||||||||||||||||||||||||||||||
| Pipelines | 2176 - unified | |||||||||||||||||||||||||||||||||||||||||||||||||||||||||
| Core Speed | 1470 - 1650 (Boost) MHz | |||||||||||||||||||||||||||||||||||||||||||||||||||||||||
| Memory Speed | 14000 MHz | |||||||||||||||||||||||||||||||||||||||||||||||||||||||||
| Memory Bus Width | 256 Bit | |||||||||||||||||||||||||||||||||||||||||||||||||||||||||
| Memory Type | GDDR6 | |||||||||||||||||||||||||||||||||||||||||||||||||||||||||
| Max. Amount of Memory | 8 GB | |||||||||||||||||||||||||||||||||||||||||||||||||||||||||
| Shared Memory | no | |||||||||||||||||||||||||||||||||||||||||||||||||||||||||
| API | DirectX 12_1, Shader 6.4, OpenGL 4.6 | |||||||||||||||||||||||||||||||||||||||||||||||||||||||||
| Power Consumption | 175 Watt | |||||||||||||||||||||||||||||||||||||||||||||||||||||||||
| Transistor Count | 10.8 Billion | |||||||||||||||||||||||||||||||||||||||||||||||||||||||||
| Man. Technology | 12 nm | |||||||||||||||||||||||||||||||||||||||||||||||||||||||||
| Features | DLSS, Raytraycing, VR Ready, G-SYNC, Vulkan, Multi Monitor, 550 Watt system power recommended | |||||||||||||||||||||||||||||||||||||||||||||||||||||||||
| Date of Announcement | 02.07.2019 | |||||||||||||||||||||||||||||||||||||||||||||||||||||||||
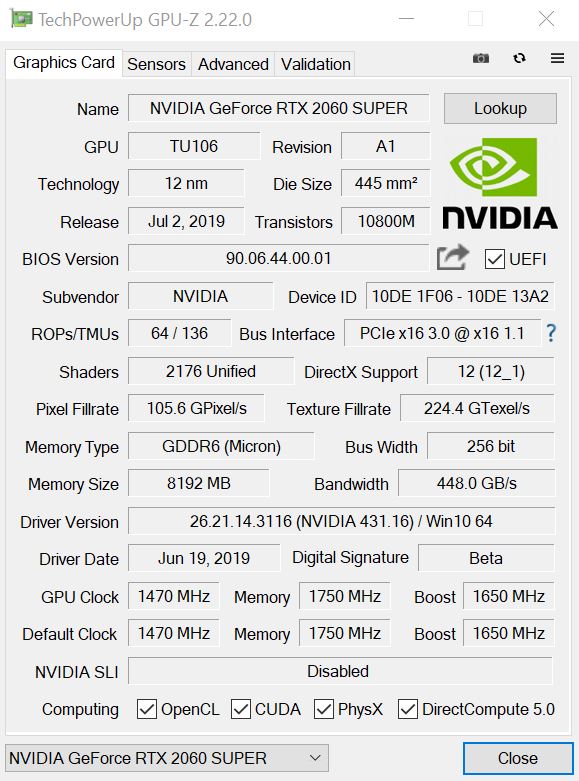
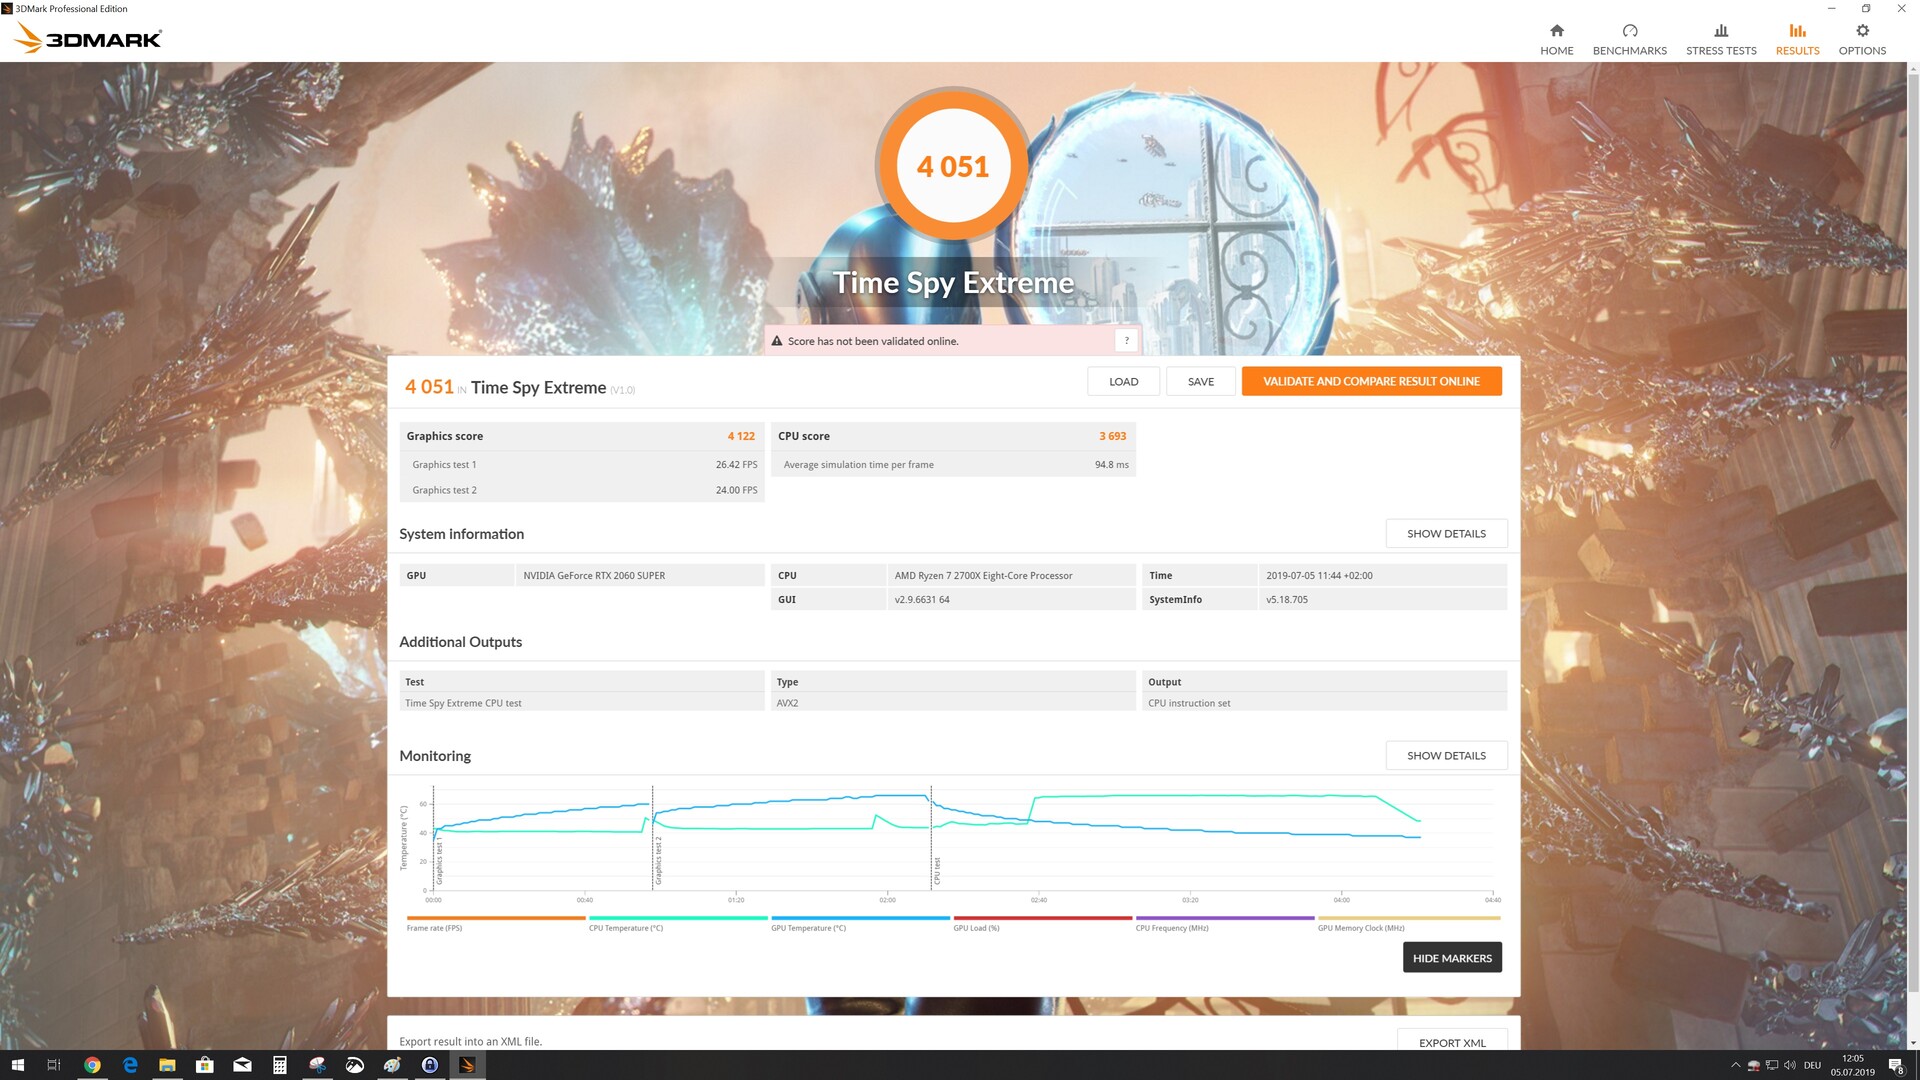
The Core Clocks of the Nvidia GeForce RTX 2060S
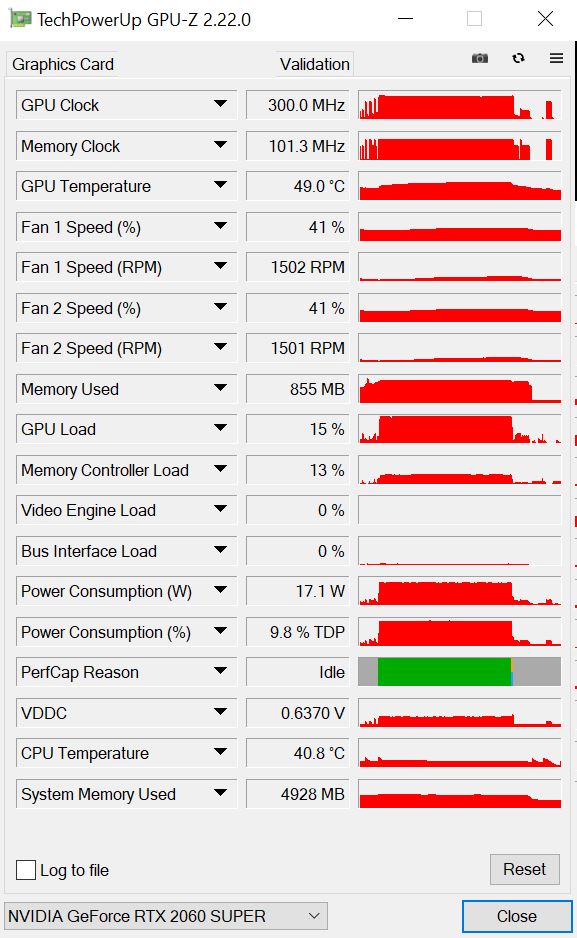
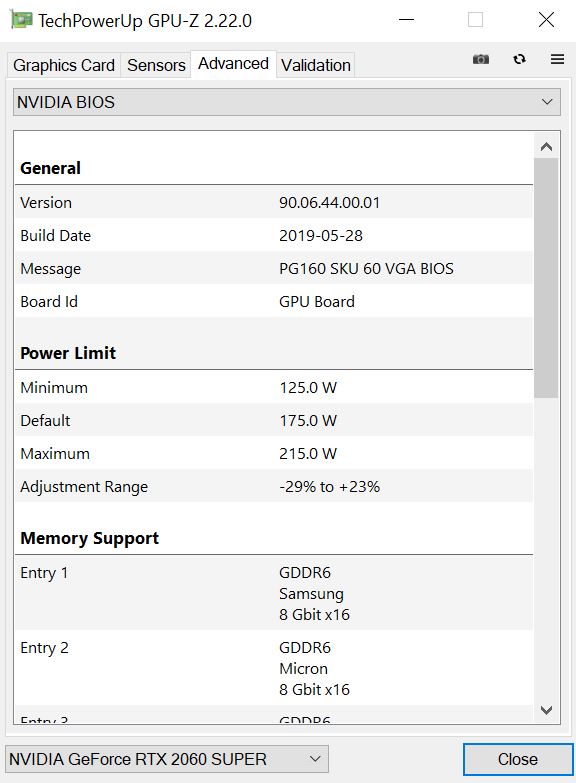
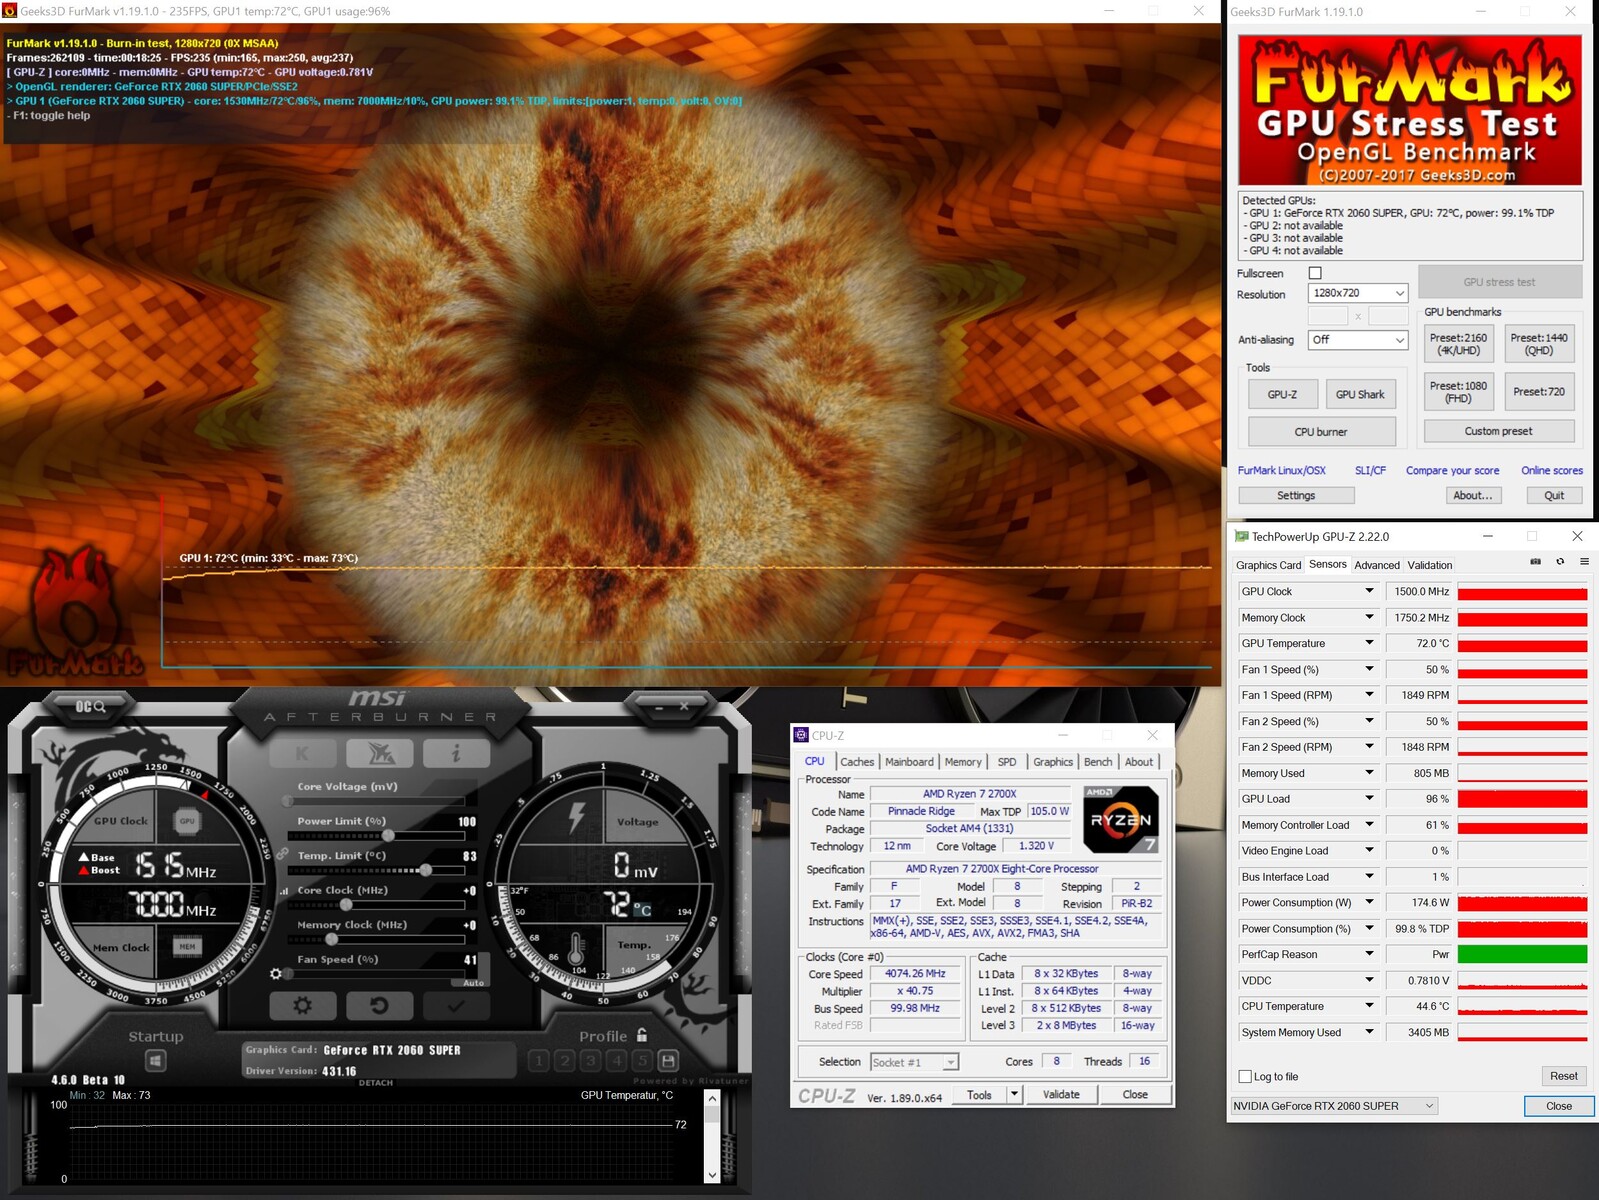
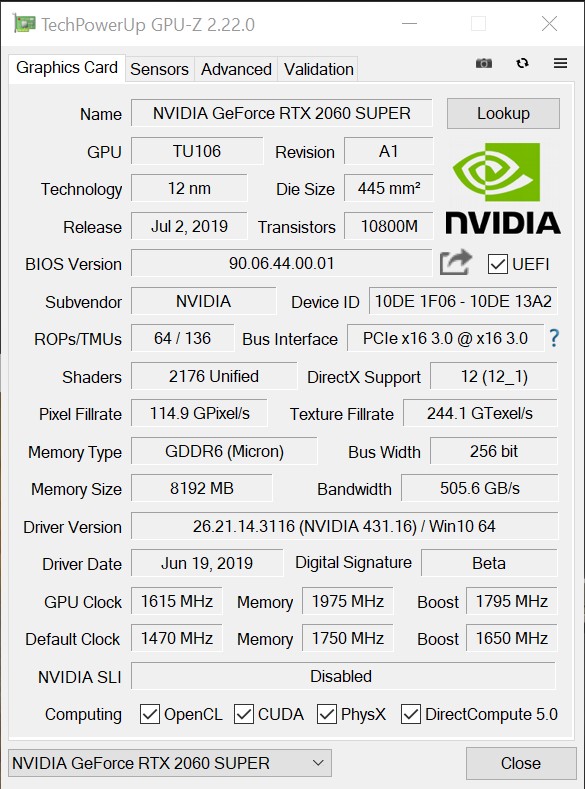
As can be seen from the table above, Nvidia has slightly increased the base clock of the GeForce RTX 2060S (1470 MHz). However, the boost clock is a little lower (1650 MHz) when compared to the RTX 2060. The power limit of the GPU amounts to 175 watts. It can be lowered by 29% or increased by 22%. Straight out of the box, the boost clock of the GeForce RTX 2060S is significantly higher than what the specifications sheet says. The GPU runs most of the time at 1800 MHz, at which point it hits the power limit, meaning that the core clocks cannot go any higher. The graphics card has 8 GB of VRAM, which operates at an effective frequency of 14 GHz.
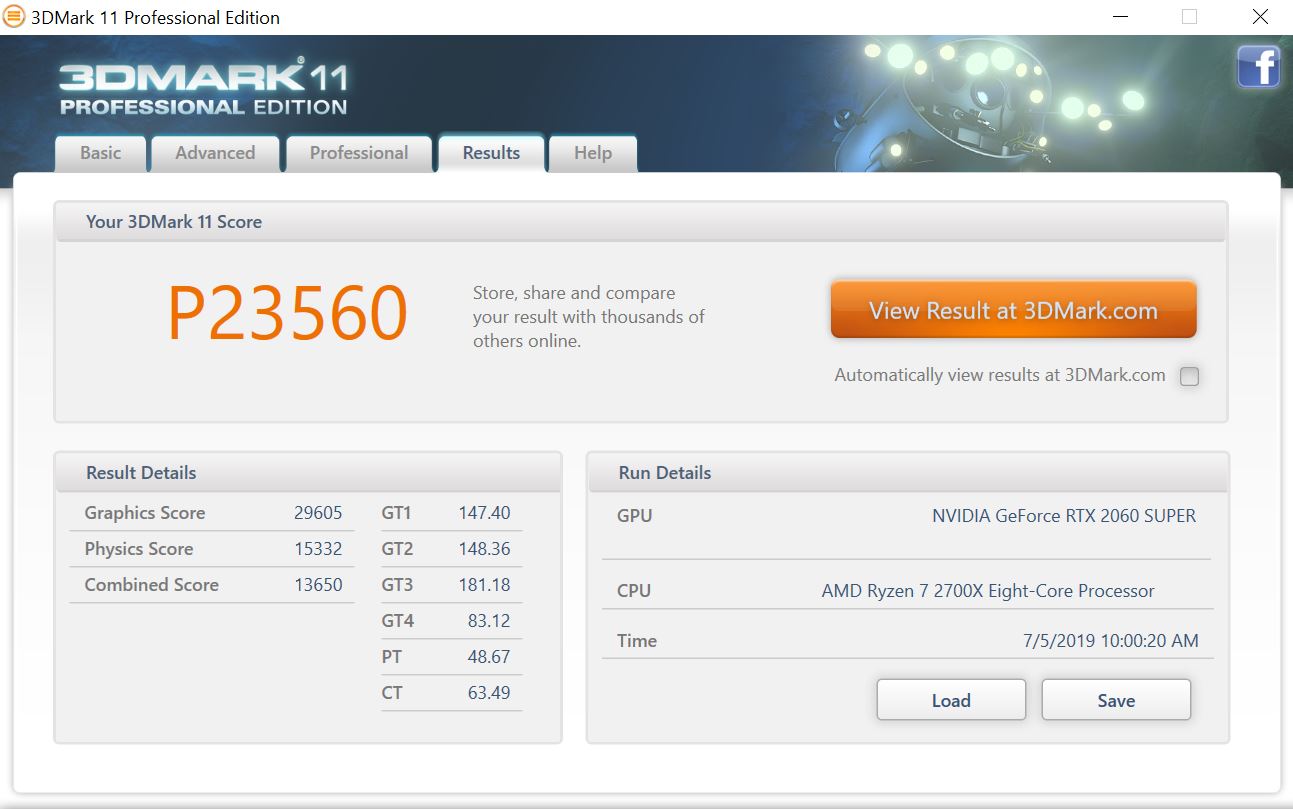
Synthetic Benchmarks
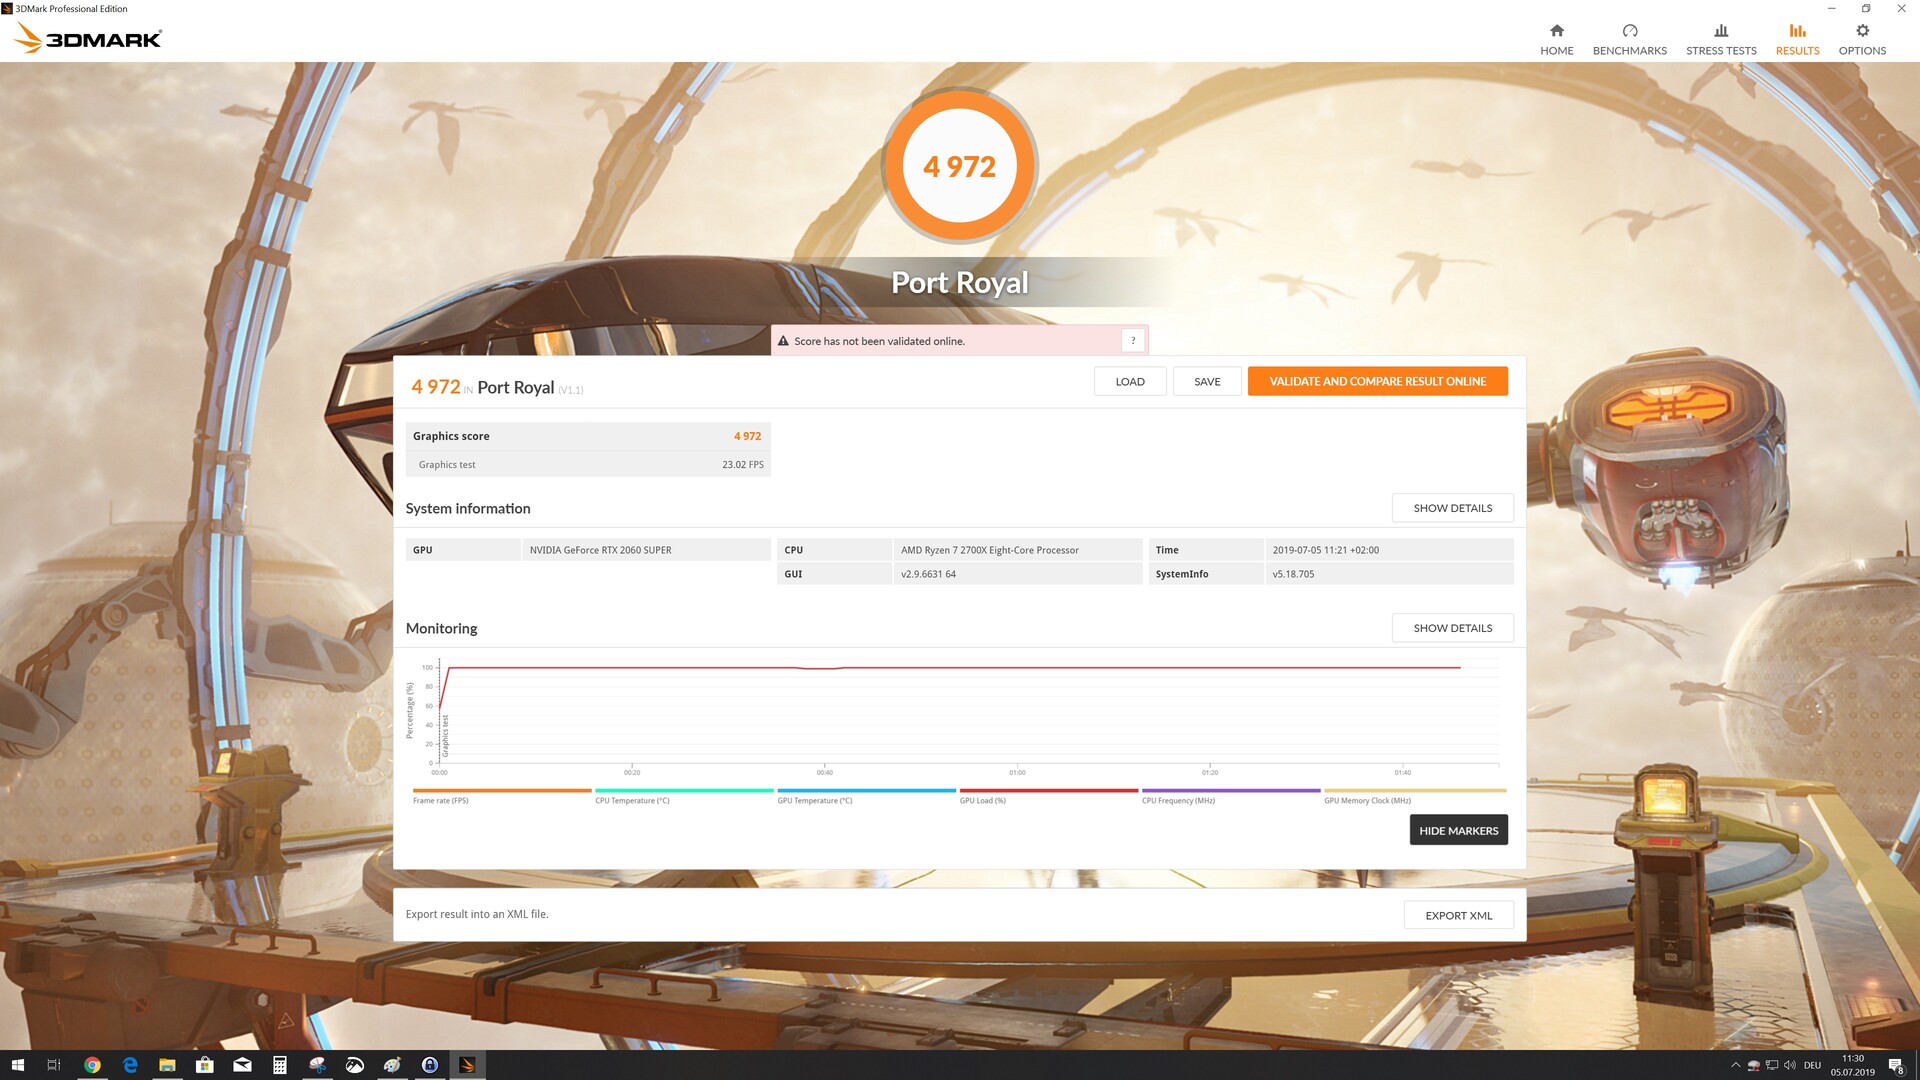
The synthetic benchmarks serve as proof positive that Nvidia’s plan is working out well. The RTX Super GPUs are exactly where they are supposed to be. What we are getting at here is that all the GPUs in our comparison chart are benchmarked using the same test bench. MSI graphics cards are factory-overclocked versions of the older Turing-based GPUs. Here, the differences in performance are somewhat lower.
With the Radeon VII, AMD can give the RTX 2080 a run for its money. However, this is likely to change as soon as the GeForce RTX 2080S comes out.
| 3DMark | |
| 1920x1080 Fire Strike Graphics | |
| Nvidia Titan RTX | |
| MSI RTX 2080 Gaming X Trio | |
| AMD Radeon VII | |
| Nvidia GeForce RTX 2070 Super | |
| MSI RTX 2070 Gaming Z 8G | |
| AMD Radeon RX 5700 | |
| AMD Radeon RX Vega 64 | |
| Nvidia GeForce RTX 2060 Super | |
| MSI RTX 2060 Gaming Z 6G | |
| Fire Strike Extreme Graphics | |
| Nvidia Titan RTX | |
| AMD Radeon VII | |
| MSI RTX 2080 Gaming X Trio | |
| Nvidia GeForce RTX 2070 Super | |
| MSI RTX 2070 Gaming Z 8G | |
| AMD Radeon RX 5700 | |
| AMD Radeon RX Vega 64 | |
| Nvidia GeForce RTX 2060 Super | |
| MSI RTX 2060 Gaming Z 6G | |
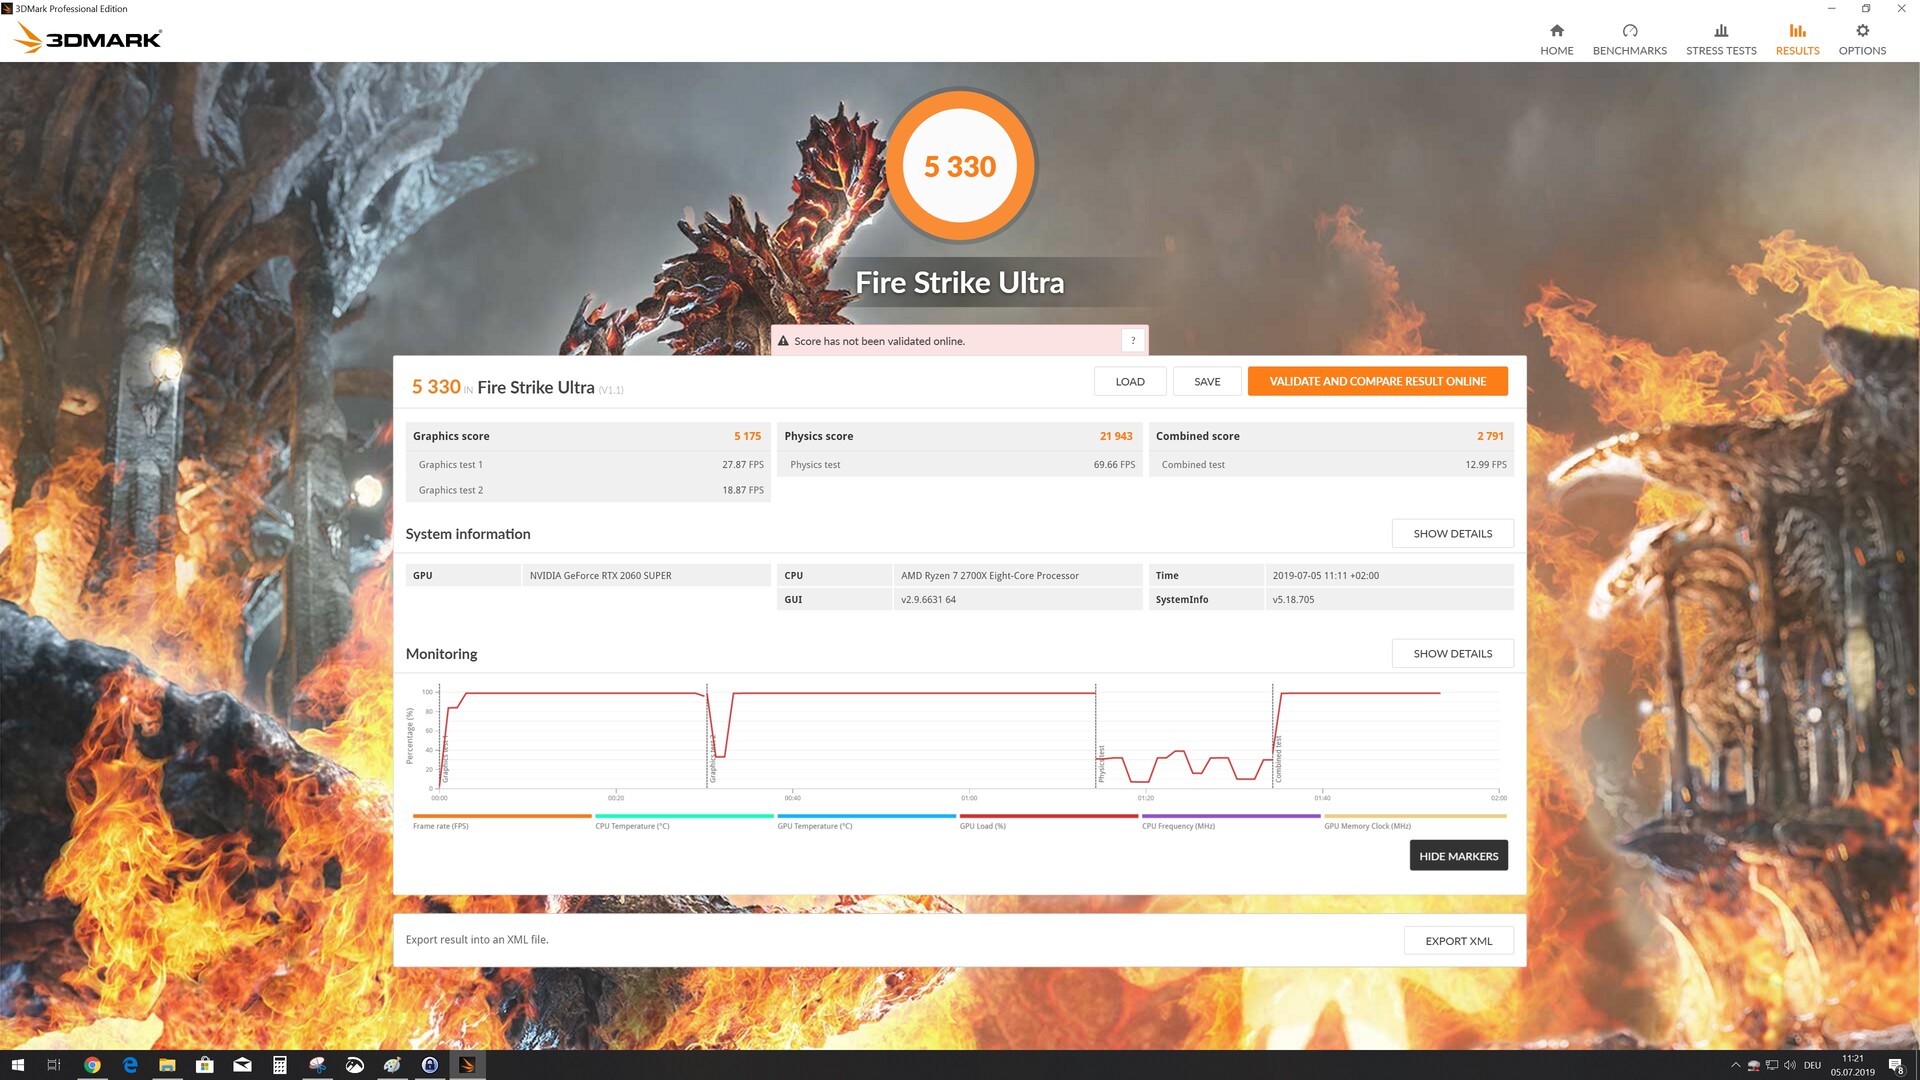
| 3840x2160 Fire Strike Ultra Graphics | |
| Nvidia Titan RTX | |
| AMD Radeon VII | |
| MSI RTX 2080 Gaming X Trio | |
| Nvidia GeForce RTX 2070 Super | |
| MSI RTX 2070 Gaming Z 8G | |
| AMD Radeon RX Vega 64 | |
| AMD Radeon RX 5700 | |
| Nvidia GeForce RTX 2060 Super | |
| MSI RTX 2060 Gaming Z 6G | |
| 2560x1440 Time Spy Graphics | |
| Nvidia Titan RTX | |
| MSI RTX 2080 Gaming X Trio | |
| Nvidia GeForce RTX 2070 Super | |
| MSI RTX 2070 Gaming Z 8G | |
| AMD Radeon VII | |
| Nvidia GeForce RTX 2060 Super | |
| MSI RTX 2060 Gaming Z 6G | |
| AMD Radeon RX 5700 | |
| AMD Radeon RX Vega 64 | |
| 3DMark 11 - 1280x720 Performance GPU | |
| Nvidia Titan RTX | |
| MSI RTX 2080 Gaming X Trio | |
| AMD Radeon VII | |
| Nvidia GeForce RTX 2070 Super | |
| AMD Radeon RX 5700 | |
| MSI RTX 2070 Gaming Z 8G | |
| Nvidia GeForce RTX 2060 Super | |
| AMD Radeon RX Vega 64 | |
| MSI RTX 2060 Gaming Z 6G | |
| Unigine Heaven 4.0 | |
| Extreme Preset OpenGL | |
| Nvidia Titan RTX | |
| MSI RTX 2080 Gaming X Trio | |
| Nvidia GeForce RTX 2070 Super | |
| MSI RTX 2070 Gaming Z 8G | |
| Nvidia GeForce RTX 2060 Super | |
| MSI RTX 2060 Gaming Z 6G | |
| AMD Radeon VII | |
| AMD Radeon RX 5700 | |
| Extreme Preset DX11 | |
| Nvidia Titan RTX | |
| MSI RTX 2080 Gaming X Trio | |
| Nvidia GeForce RTX 2070 Super | |
| MSI RTX 2070 Gaming Z 8G | |
| Nvidia GeForce RTX 2060 Super | |
| AMD Radeon VII | |
| MSI RTX 2060 Gaming Z 6G | |
| AMD Radeon RX 5700 | |
| Unigine Valley 1.0 | |
| 1920x1080 Extreme HD DirectX AA:x8 | |
| Nvidia Titan RTX | |
| MSI RTX 2080 Gaming X Trio | |
| Nvidia GeForce RTX 2070 Super | |
| MSI RTX 2070 Gaming Z 8G | |
| AMD Radeon VII | |
| Nvidia GeForce RTX 2060 Super | |
| AMD Radeon RX 5700 | |
| MSI RTX 2060 Gaming Z 6G | |
| 1920x1080 Extreme HD Preset OpenGL AA:x8 | |
| Nvidia Titan RTX | |
| MSI RTX 2080 Gaming X Trio | |
| Nvidia GeForce RTX 2070 Super | |
| MSI RTX 2070 Gaming Z 8G | |
| Nvidia GeForce RTX 2060 Super | |
| MSI RTX 2060 Gaming Z 6G | |
| AMD Radeon RX 5700 | |
| AMD Radeon VII | |
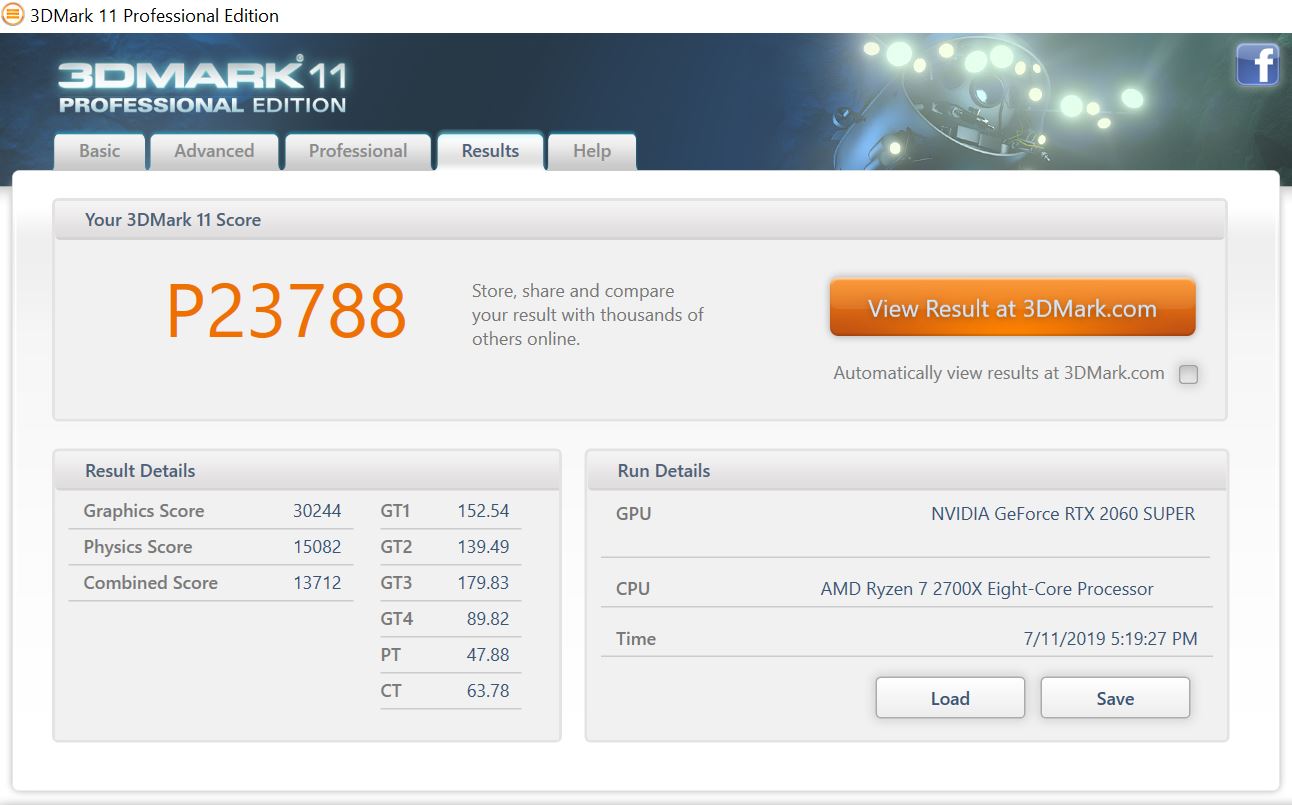
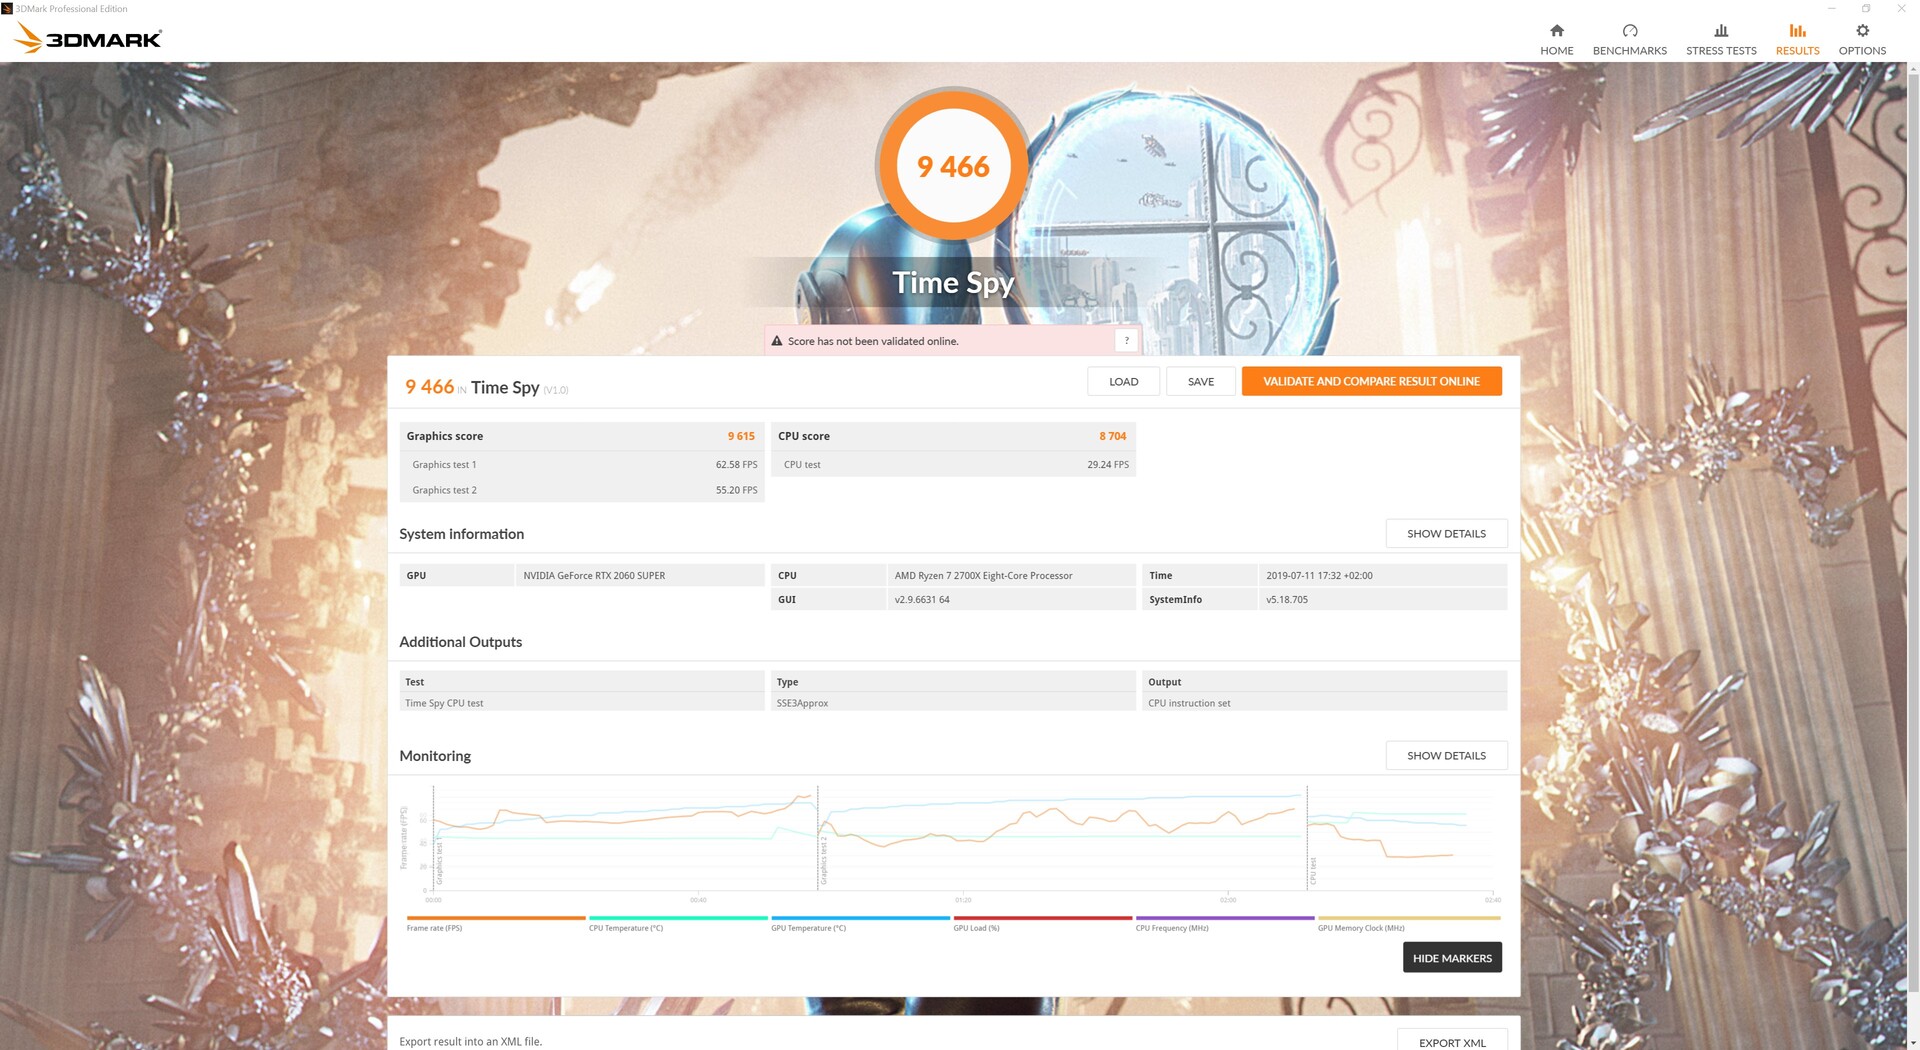
| 3DMark 05 Standard | 42852 points | |
| 3DMark 06 Standard Score | 34682 points | |
| 3DMark Vantage P Result | 62079 points | |
| 3DMark 11 Performance | 23560 points | |
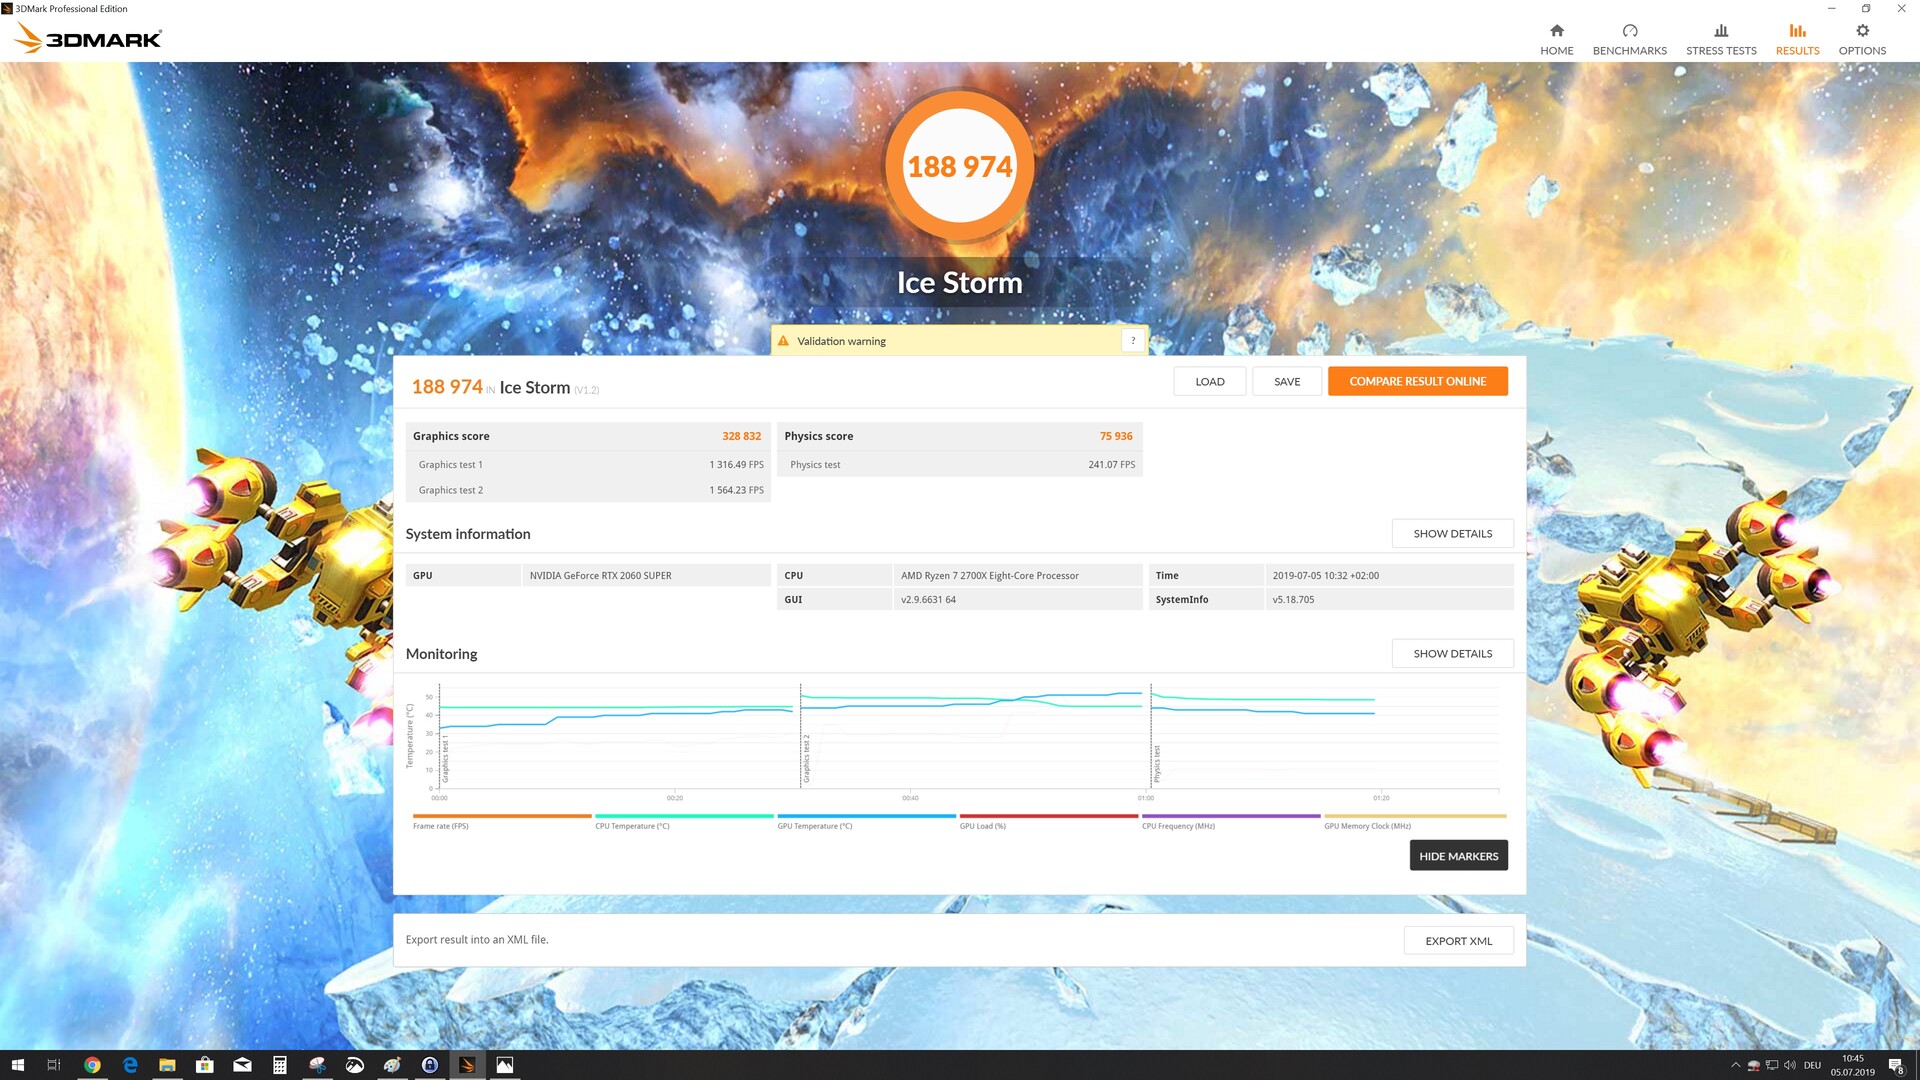
| 3DMark Ice Storm Standard Score | 188974 points | |
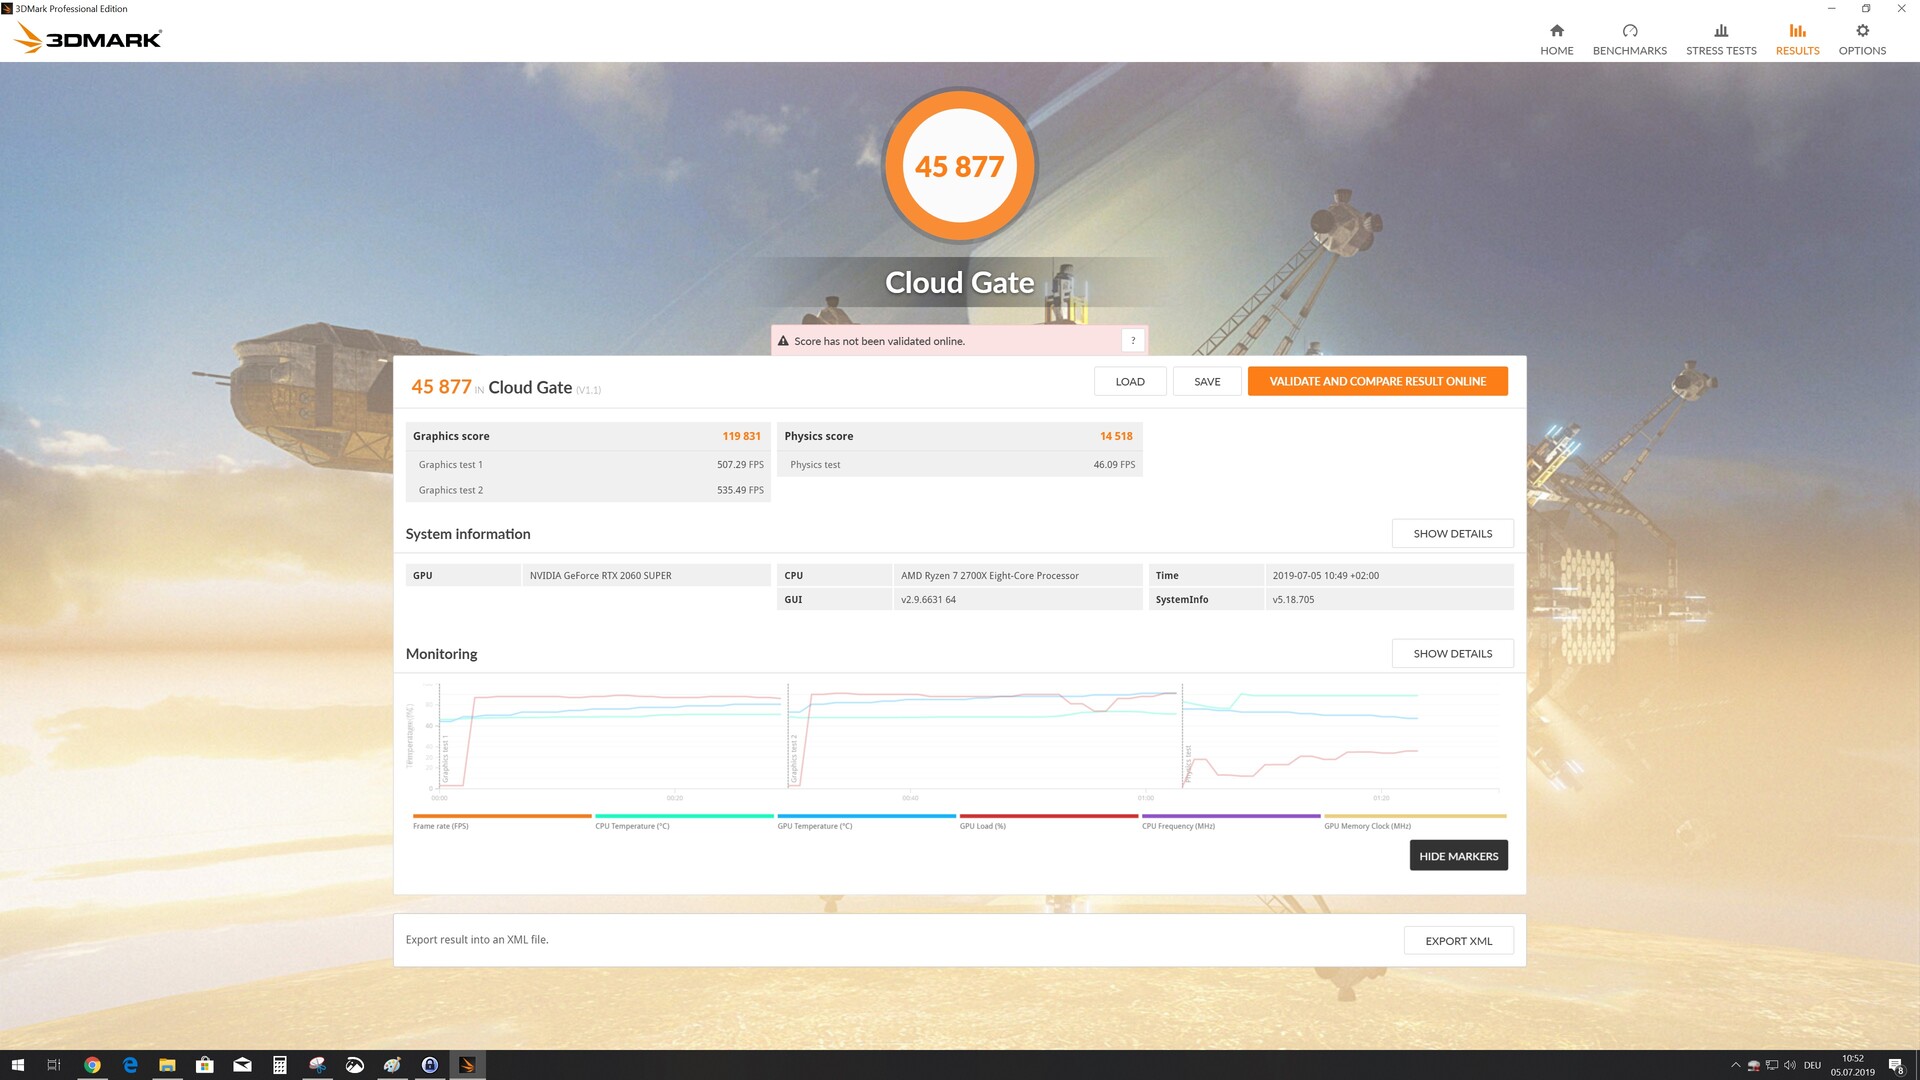
| 3DMark Cloud Gate Standard Score | 45877 points | |
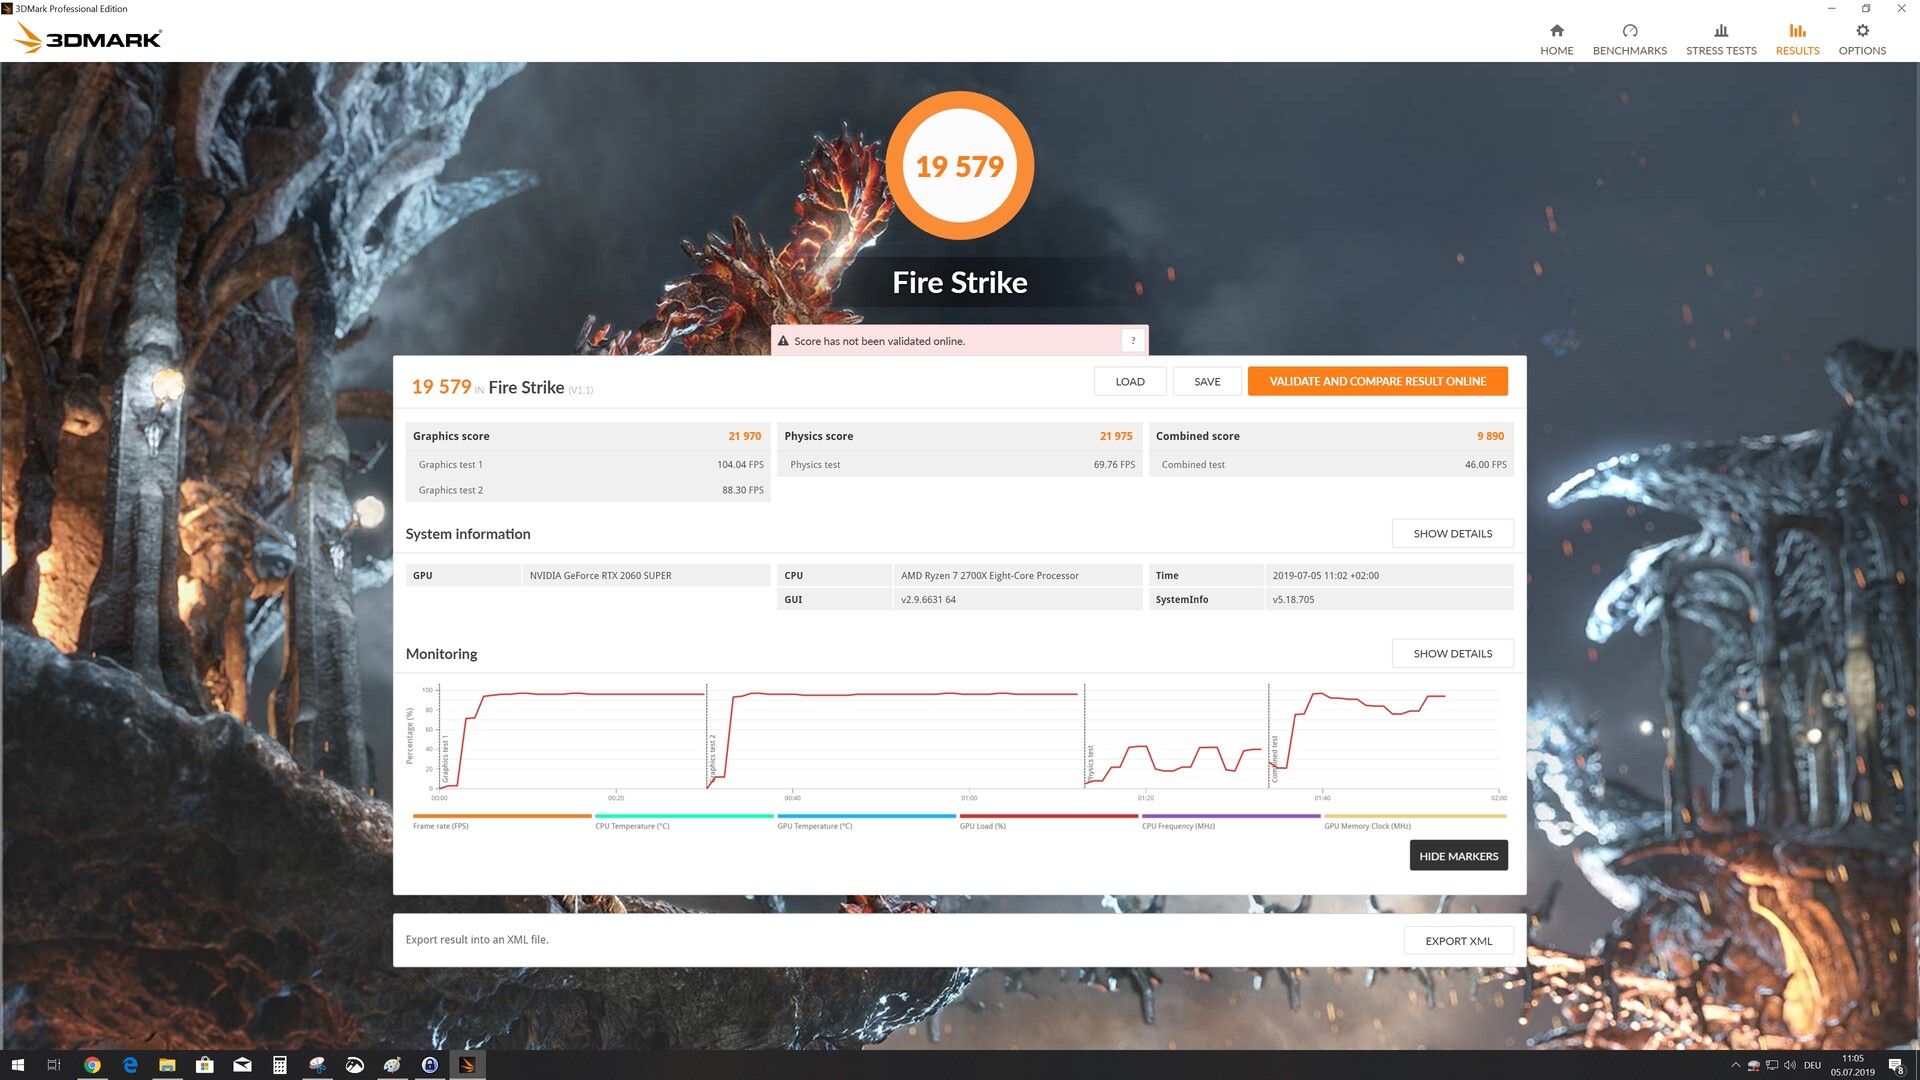
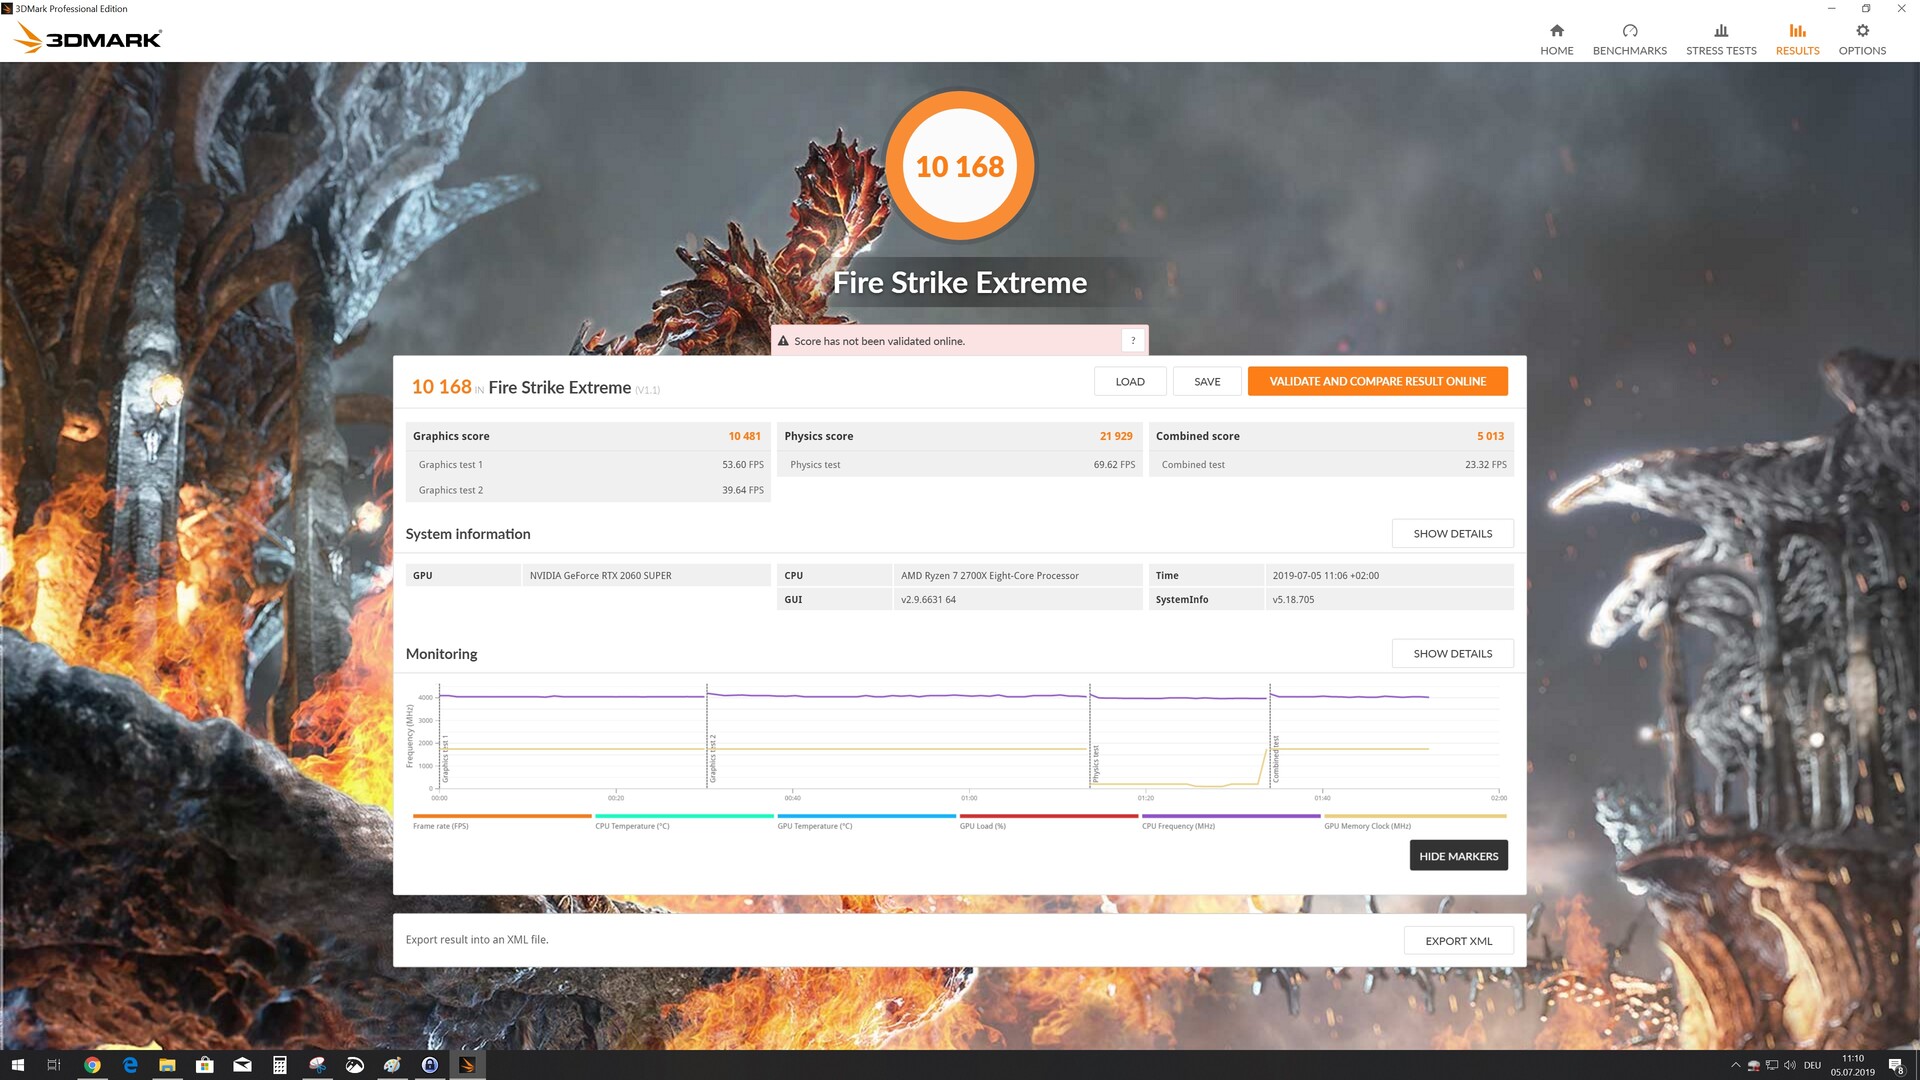
| 3DMark Fire Strike Score | 19579 points | |
| 3DMark Fire Strike Extreme Score | 10168 points | |
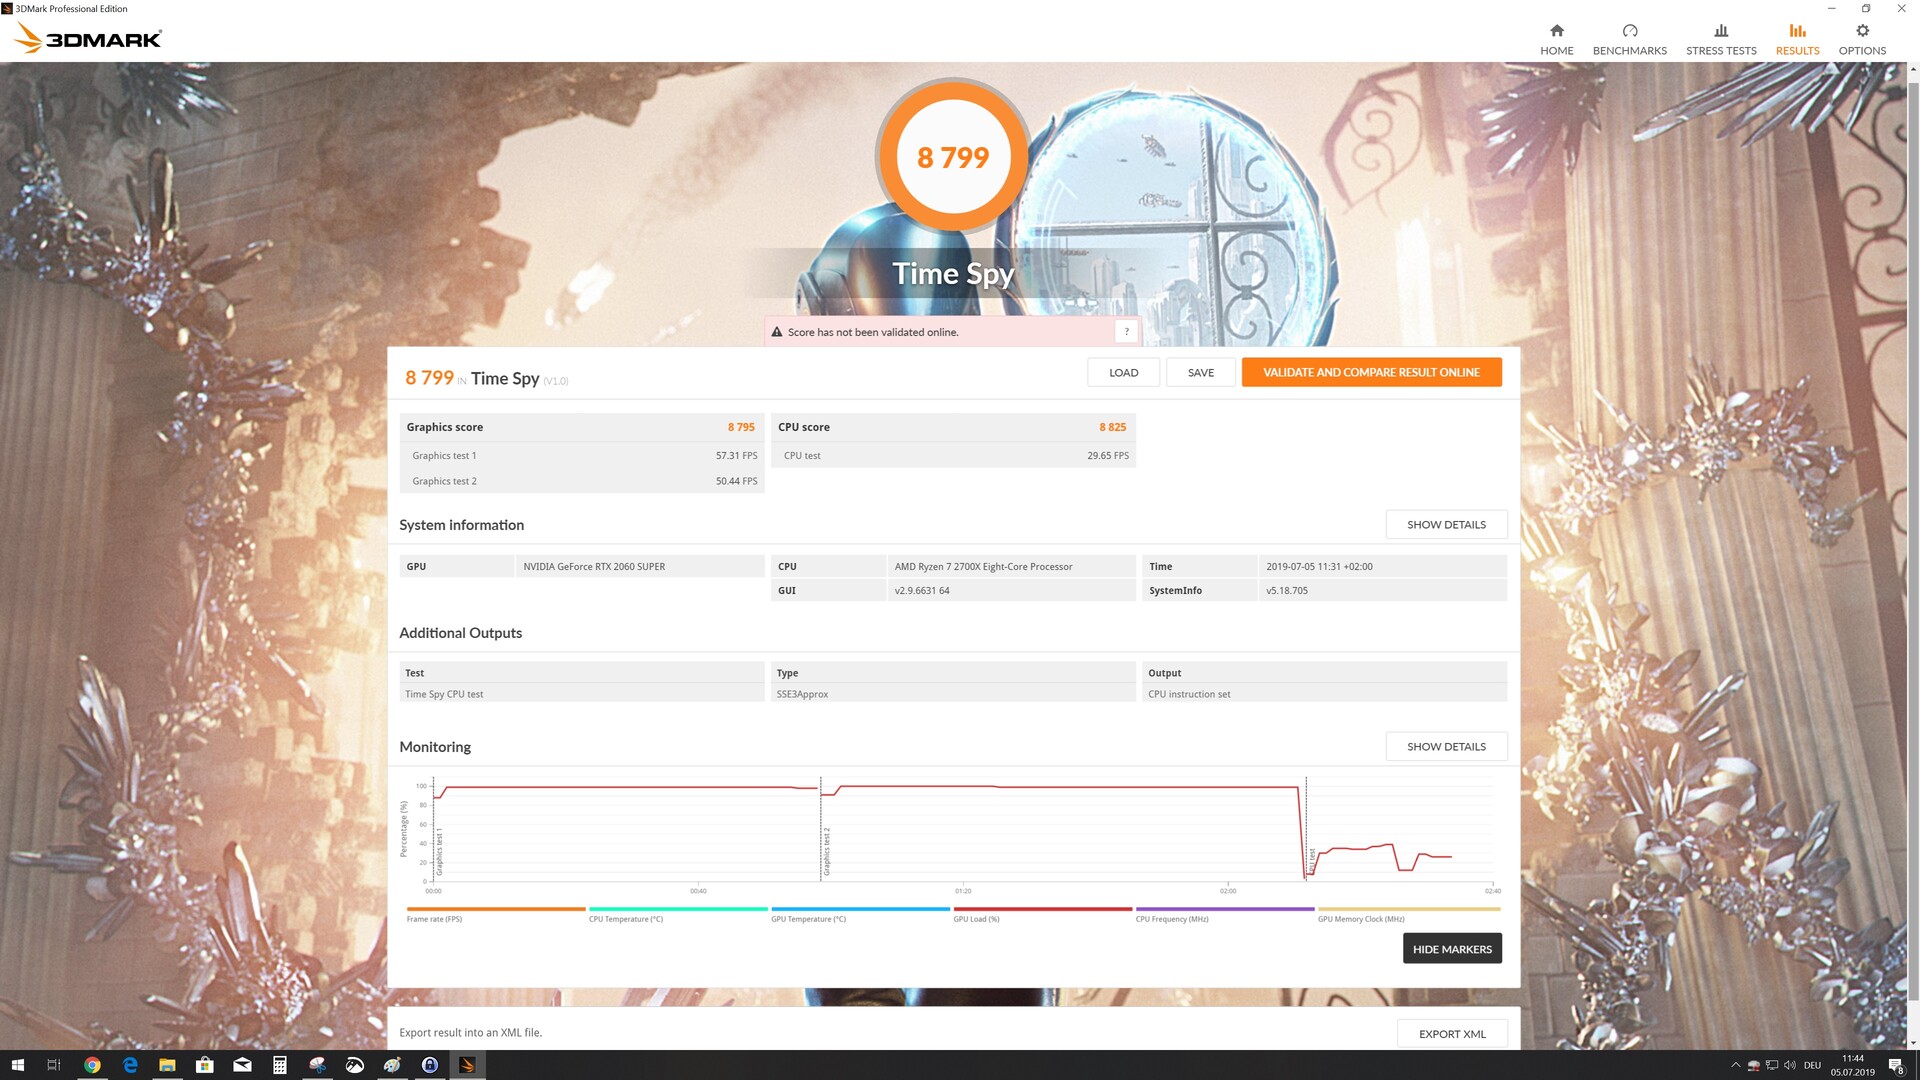
| 3DMark Time Spy Score | 8799 points | |
Help | ||
Gaming Benchmarks
The performance in gaming benchmarks is similar to what we saw in the synthetic benchmarks. Because the GeForce RTX 2060S features more VRAM, it is able to achieve higher frame rates on maximum settings. The MSI RTX 2070 beats the RTX 2060S only by a few percentage points. The performance of AMD’s GPUs depends heavily on the title. All in all, we have determined that the GeForce RTX 2060S is 10 – 20% faster than the RTX 2060 FE. Because we only have factory-overclocked GPUs from MSI on hand, the performance gap does not seem as wide. The RTX 2060S manages to beat the AMD Radeon RX 5700 most of the time.
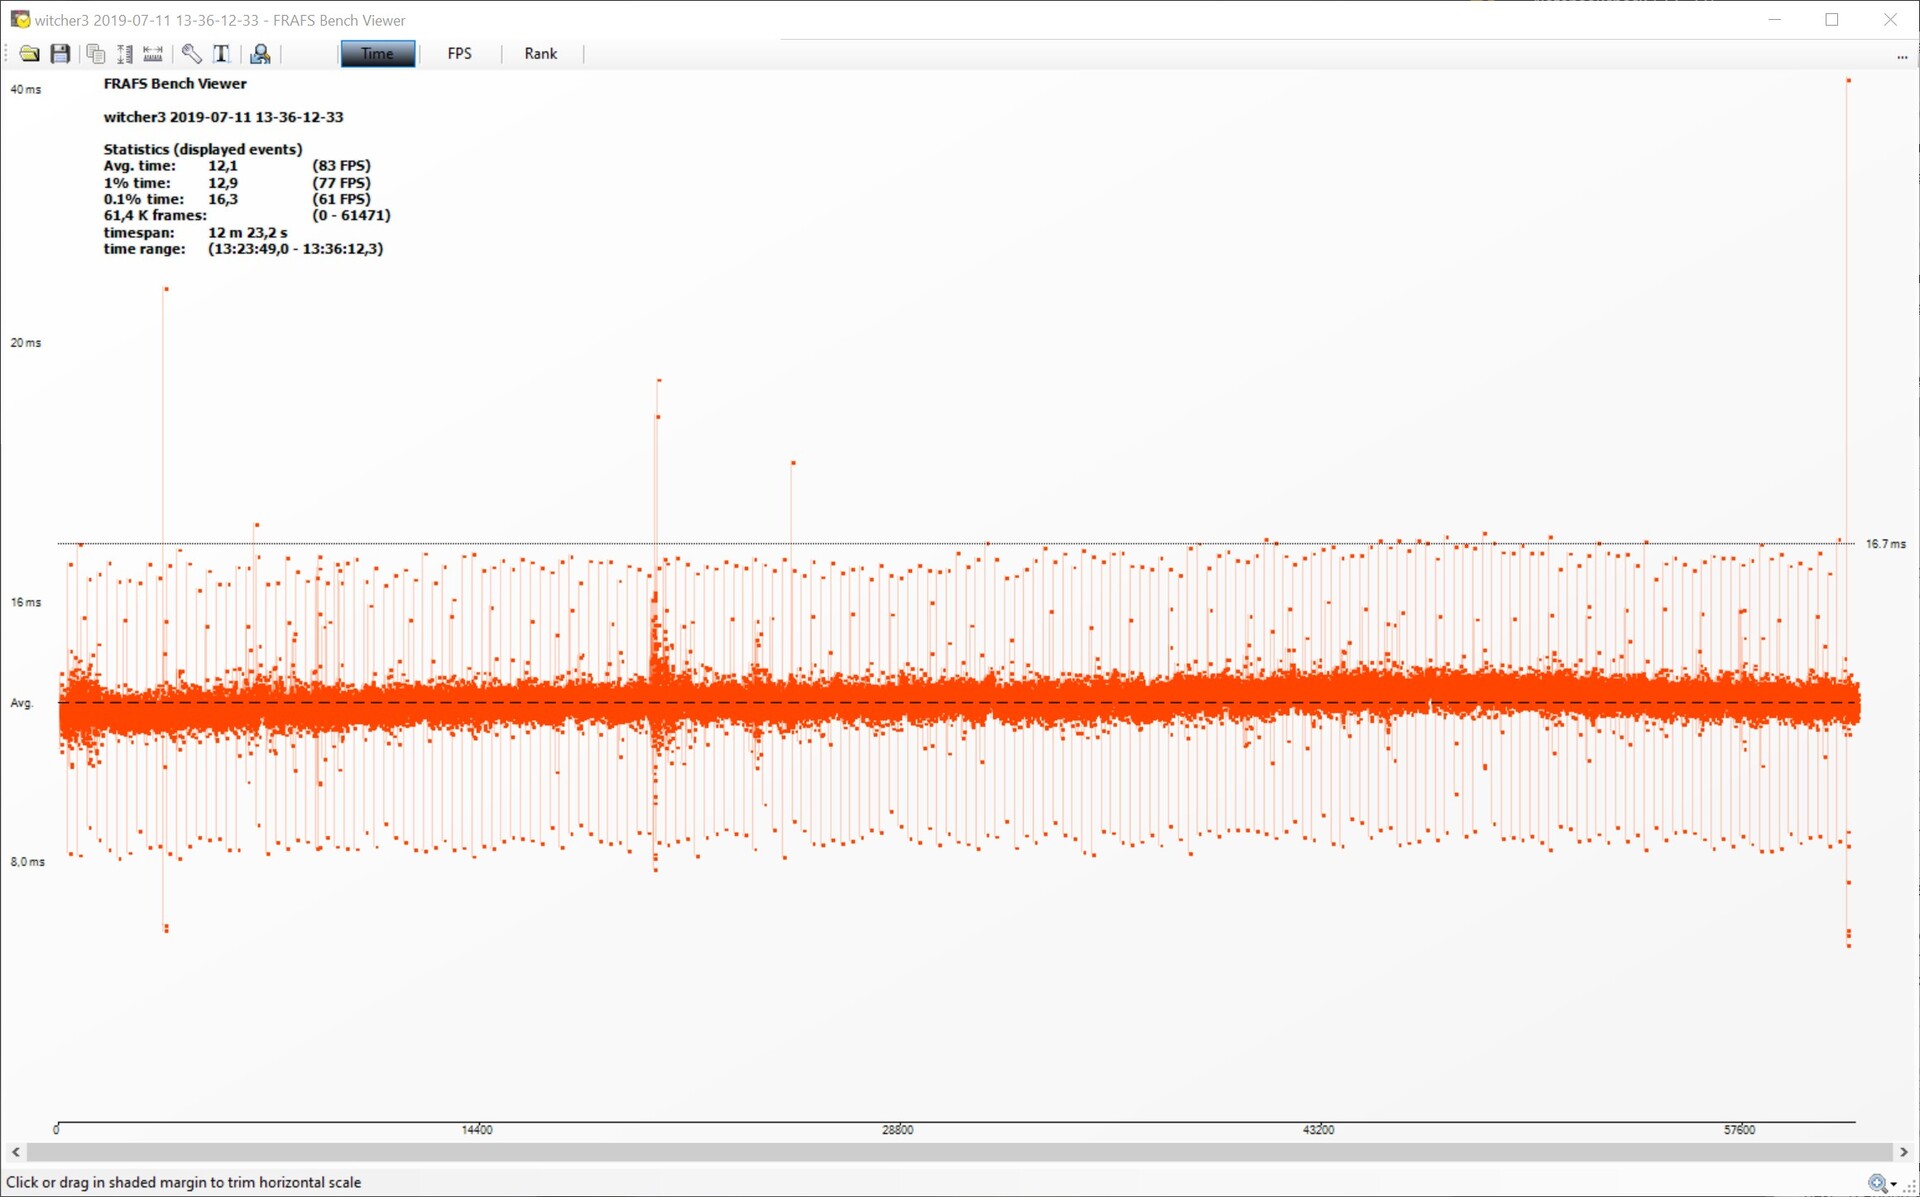
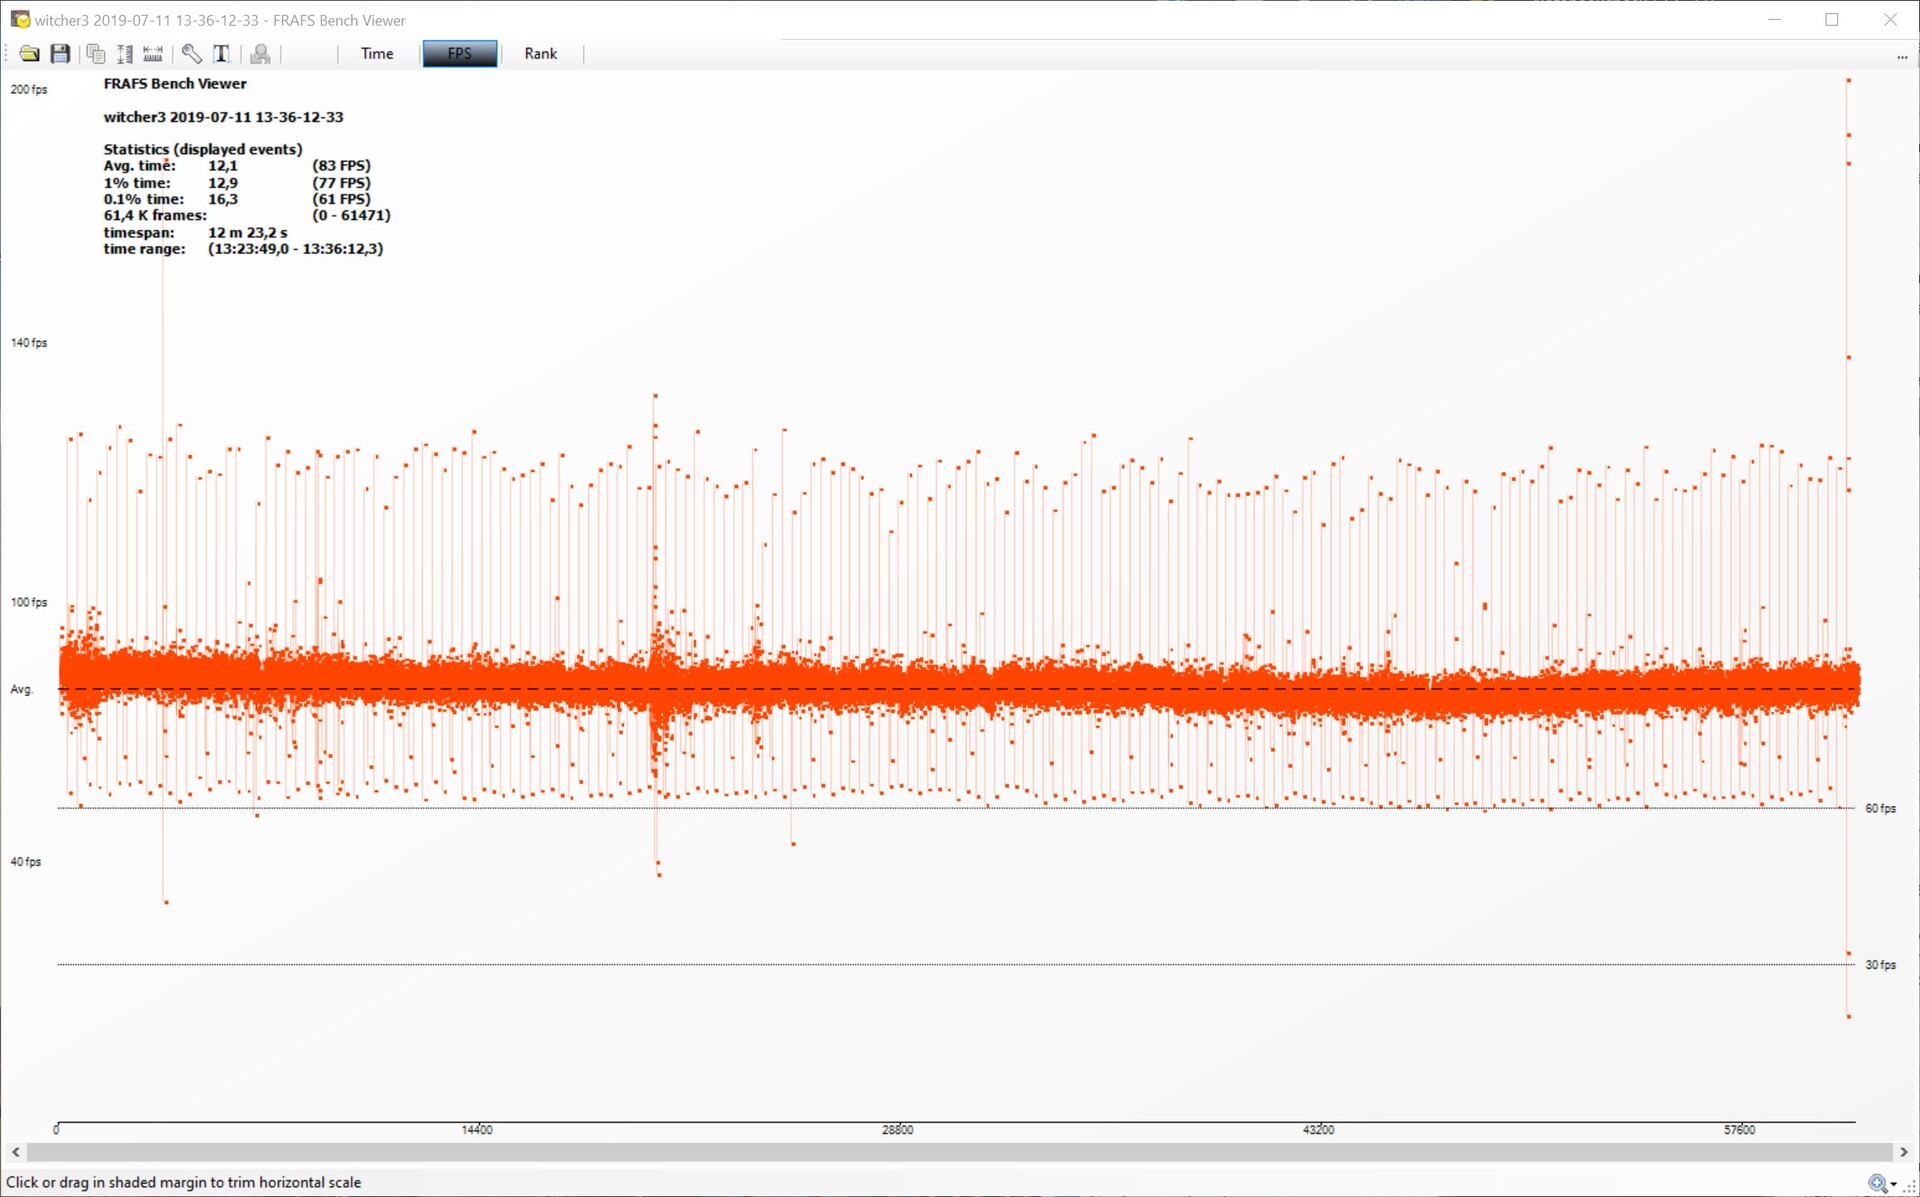
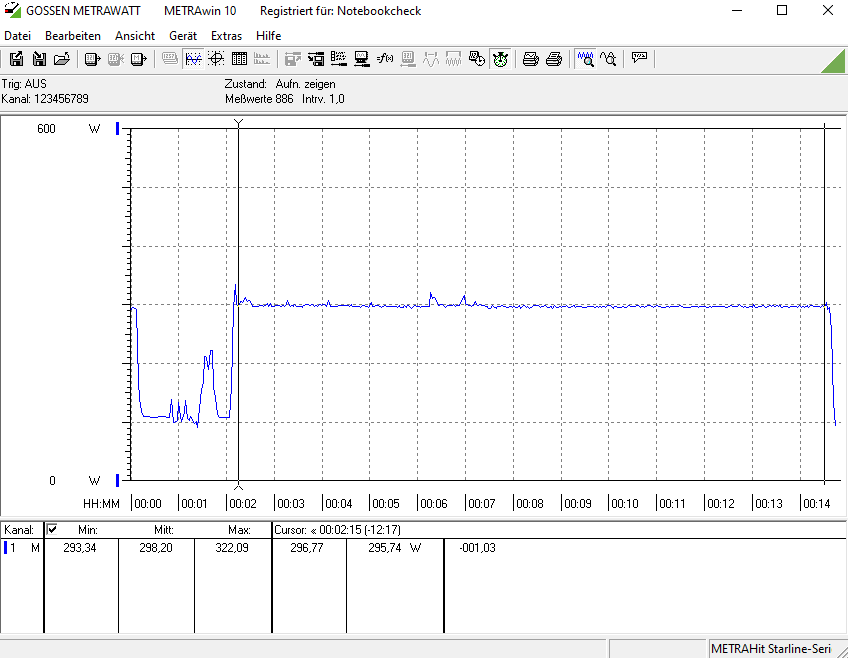
We use the video game titled the Witcher 3
to examine how well the graphics card performs under load. We run the game on ultra settings and record both the frame rate and the frame time. There are occasional spikes in the frame-time graph. However, these spikes should not be noticeable during actual gameplay. The frame rates were also very stable over a prolonged period of time. Thanks to an average frame rate of 83 FPS, the game should run very smoothly.
The Witcher 3 frame-time performance - Ultra preset
| Call of Duty Black Ops 4 | |
| 1920x1080 Very High / On | |
| Nvidia Titan RTX | |
| MSI RTX 2080 Gaming X Trio | |
| AMD Radeon RX Vega 64 | |
| Nvidia GeForce RTX 2070 Super | |
| MSI RTX 2070 Gaming Z 8G | |
| AMD Radeon VII | |
| Nvidia GeForce RTX 2060 Super | |
| MSI RTX 2060 Gaming Z 6G | |
| AMD Radeon RX 5700 | |
| 3840x2160 Very High / On | |
| Nvidia Titan RTX | |
| MSI RTX 2080 Gaming X Trio | |
| AMD Radeon RX Vega 64 | |
| AMD Radeon VII | |
| Nvidia GeForce RTX 2070 Super | |
| AMD Radeon RX 5700 | |
| Nvidia GeForce RTX 2060 Super | |
| MSI RTX 2070 Gaming Z 8G | |
| MSI RTX 2060 Gaming Z 6G | |
| 2560x1440 Very High / On | |
| MSI RTX 2080 Gaming X Trio | |
| Nvidia GeForce RTX 2070 Super | |
| MSI RTX 2070 Gaming Z 8G | |
| AMD Radeon RX 5700 | |
| Nvidia GeForce RTX 2060 Super | |
| Assassin´s Creed Odyssey | |
| 1920x1080 Ultra High Preset | |
| Nvidia Titan RTX | |
| MSI RTX 2080 Gaming X Trio | |
| MSI RTX 2070 Gaming Z 8G | |
| Nvidia GeForce RTX 2070 Super | |
| AMD Radeon VII | |
| Nvidia GeForce RTX 2060 Super | |
| AMD Radeon RX 5700 | |
| MSI RTX 2060 Gaming Z 6G | |
| AMD Radeon RX Vega 64 | |
| 3840x2160 Ultra High Preset | |
| Nvidia Titan RTX | |
| AMD Radeon VII | |
| MSI RTX 2080 Gaming X Trio | |
| Nvidia GeForce RTX 2070 Super | |
| MSI RTX 2070 Gaming Z 8G | |
| Nvidia GeForce RTX 2060 Super | |
| AMD Radeon RX 5700 | |
| AMD Radeon RX Vega 64 | |
| MSI RTX 2060 Gaming Z 6G | |
| 2560x1440 Ultra High Preset | |
| MSI RTX 2080 Gaming X Trio | |
| Nvidia GeForce RTX 2070 Super | |
| MSI RTX 2070 Gaming Z 8G | |
| Nvidia GeForce RTX 2060 Super | |
| AMD Radeon RX 5700 | |
| FIFA 19 | |
| 1920x1080 Ultra Preset AA:4x MS | |
| AMD Radeon RX Vega 64 | |
| AMD Radeon RX 5700 | |
| Nvidia GeForce RTX 2070 Super | |
| Nvidia Titan RTX | |
| MSI RTX 2080 Gaming X Trio | |
| AMD Radeon VII | |
| MSI RTX 2070 Gaming Z 8G | |
| Nvidia GeForce RTX 2060 Super | |
| MSI RTX 2060 Gaming Z 6G | |
| 3840x2160 Ultra Preset AA:4x MS | |
| Nvidia Titan RTX | |
| AMD Radeon VII | |
| MSI RTX 2080 Gaming X Trio | |
| Nvidia GeForce RTX 2060 Super | |
| MSI RTX 2070 Gaming Z 8G | |
| Nvidia GeForce RTX 2070 Super | |
| AMD Radeon RX 5700 | |
| AMD Radeon RX Vega 64 | |
| MSI RTX 2060 Gaming Z 6G | |
| 2560x1440 Ultra Preset AA:4x MS | |
| AMD Radeon RX 5700 | |
| Nvidia GeForce RTX 2070 Super | |
| MSI RTX 2080 Gaming X Trio | |
| Nvidia GeForce RTX 2060 Super | |
| MSI RTX 2070 Gaming Z 8G | |
| Forza Horizon 4 | |
| 1920x1080 Ultra Preset AA:2xMS | |
| MSI RTX 2080 Gaming X Trio | |
| Nvidia Titan RTX | |
| AMD Radeon VII | |
| Nvidia GeForce RTX 2070 Super | |
| AMD Radeon RX Vega 64 | |
| AMD Radeon RX 5700 | |
| MSI RTX 2070 Gaming Z 8G | |
| Nvidia GeForce RTX 2060 Super | |
| MSI RTX 2060 Gaming Z 6G | |
| 3840x2160 Ultra Preset AA:2xMS | |
| Nvidia Titan RTX | |
| MSI RTX 2080 Gaming X Trio | |
| AMD Radeon VII | |
| Nvidia GeForce RTX 2070 Super | |
| AMD Radeon RX 5700 | |
| MSI RTX 2070 Gaming Z 8G | |
| AMD Radeon RX Vega 64 | |
| Nvidia GeForce RTX 2060 Super | |
| MSI RTX 2060 Gaming Z 6G | |
| 2560x1440 Ultra Preset AA:2xMS | |
| MSI RTX 2080 Gaming X Trio | |
| Nvidia GeForce RTX 2070 Super | |
| AMD Radeon RX 5700 | |
| MSI RTX 2070 Gaming Z 8G | |
| Nvidia GeForce RTX 2060 Super | |
| F1 2018 | |
| 1920x1080 Ultra High Preset AA:T AF:16x | |
| Nvidia Titan RTX | |
| MSI RTX 2080 Gaming X Trio | |
| AMD Radeon VII | |
| Nvidia GeForce RTX 2070 Super | |
| MSI RTX 2070 Gaming Z 8G | |
| Nvidia GeForce RTX 2060 Super | |
| MSI RTX 2060 Gaming Z 6G | |
| AMD Radeon RX Vega 64 | |
| 3840x2160 Ultra High Preset AA:T AF:16x | |
| Nvidia Titan RTX | |
| MSI RTX 2080 Gaming X Trio | |
| AMD Radeon VII | |
| Nvidia GeForce RTX 2070 Super | |
| MSI RTX 2070 Gaming Z 8G | |
| Nvidia GeForce RTX 2060 Super | |
| MSI RTX 2060 Gaming Z 6G | |
| AMD Radeon RX Vega 64 | |
| 2560x1440 Ultra High Preset AA:T AF:16x | |
| MSI RTX 2080 Gaming X Trio | |
| Nvidia GeForce RTX 2070 Super | |
| MSI RTX 2070 Gaming Z 8G | |
| Nvidia GeForce RTX 2060 Super | |
| Monster Hunter World | |
| 1920x1080 Highest Preset (Image Quality High) | |
| Nvidia Titan RTX | |
| MSI RTX 2080 Gaming X Trio | |
| Nvidia GeForce RTX 2070 Super | |
| MSI RTX 2070 Gaming Z 8G | |
| AMD Radeon VII | |
| Nvidia GeForce RTX 2060 Super | |
| MSI RTX 2060 Gaming Z 6G | |
| AMD Radeon RX Vega 64 | |
| AMD Radeon RX 5700 | |
| 3840x2160 Highest Preset (Image Quality High) | |
| Nvidia Titan RTX | |
| MSI RTX 2080 Gaming X Trio | |
| Nvidia GeForce RTX 2070 Super | |
| AMD Radeon VII | |
| MSI RTX 2070 Gaming Z 8G | |
| AMD Radeon RX Vega 64 | |
| Nvidia GeForce RTX 2060 Super | |
| AMD Radeon RX 5700 | |
| MSI RTX 2060 Gaming Z 6G | |
| 2560x1440 Highest Preset (Image Quality High) | |
| MSI RTX 2080 Gaming X Trio | |
| Nvidia GeForce RTX 2070 Super | |
| MSI RTX 2070 Gaming Z 8G | |
| Nvidia GeForce RTX 2060 Super | |
| AMD Radeon RX 5700 | |
| Far Cry 5 | |
| 1920x1080 Ultra Preset AA:T | |
| MSI RTX 2080 Gaming X Trio | |
| Nvidia Titan RTX | |
| MSI RTX 2070 Gaming Z 8G | |
| AMD Radeon RX Vega 64 | |
| Nvidia GeForce RTX 2060 Super | |
| Nvidia GeForce RTX 2070 Super | |
| MSI RTX 2060 Gaming Z 6G | |
| AMD Radeon VII | |
| AMD Radeon RX 5700 | |
| 3840x2160 Ultra Preset AA:T | |
| Nvidia Titan RTX | |
| MSI RTX 2080 Gaming X Trio | |
| AMD Radeon VII | |
| Nvidia GeForce RTX 2070 Super | |
| MSI RTX 2070 Gaming Z 8G | |
| Nvidia GeForce RTX 2060 Super | |
| AMD Radeon RX 5700 | |
| AMD Radeon RX Vega 64 | |
| MSI RTX 2060 Gaming Z 6G | |
| 2560x1440 Ultra Preset AA:T | |
| MSI RTX 2080 Gaming X Trio | |
| Nvidia GeForce RTX 2070 Super | |
| MSI RTX 2070 Gaming Z 8G | |
| Nvidia GeForce RTX 2060 Super | |
| AMD Radeon RX 5700 | |
| The Crew 2 | |
| 1920x1080 Ultra Preset | |
| Nvidia Titan RTX | |
| MSI RTX 2060 Gaming Z 6G | |
| MSI RTX 2070 Gaming Z 8G | |
| MSI RTX 2080 Gaming X Trio | |
| AMD Radeon VII | |
| Nvidia GeForce RTX 2060 Super | |
| Nvidia GeForce RTX 2070 Super | |
| AMD Radeon RX 5700 | |
| 3840x2160 Ultra Preset | |
| Nvidia Titan RTX | |
| MSI RTX 2080 Gaming X Trio | |
| Nvidia GeForce RTX 2070 Super | |
| MSI RTX 2070 Gaming Z 8G | |
| AMD Radeon VII | |
| AMD Radeon RX 5700 | |
| Nvidia GeForce RTX 2060 Super | |
| MSI RTX 2060 Gaming Z 6G | |
| 2560x1440 Ultra Preset | |
| MSI RTX 2070 Gaming Z 8G | |
| MSI RTX 2080 Gaming X Trio | |
| Nvidia GeForce RTX 2070 Super | |
| AMD Radeon RX 5700 | |
| Nvidia GeForce RTX 2060 Super | |
| Assassin´s Creed Origins | |
| 1920x1080 Ultra High Preset | |
| Nvidia Titan RTX | |
| MSI RTX 2080 Gaming X Trio | |
| MSI RTX 2070 Gaming Z 8G | |
| Nvidia GeForce RTX 2070 Super | |
| Nvidia GeForce RTX 2060 Super | |
| MSI RTX 2060 Gaming Z 6G | |
| AMD Radeon RX Vega 64 | |
| AMD Radeon VII | |
| AMD Radeon RX 5700 | |
| 3840x2160 Ultra High Preset | |
| Nvidia Titan RTX | |
| MSI RTX 2080 Gaming X Trio | |
| AMD Radeon VII | |
| Nvidia GeForce RTX 2070 Super | |
| MSI RTX 2070 Gaming Z 8G | |
| Nvidia GeForce RTX 2060 Super | |
| MSI RTX 2060 Gaming Z 6G | |
| AMD Radeon RX 5700 | |
| AMD Radeon RX Vega 64 | |
| 2560x1440 Ultra High Preset | |
| MSI RTX 2080 Gaming X Trio | |
| Nvidia GeForce RTX 2070 Super | |
| MSI RTX 2070 Gaming Z 8G | |
| Nvidia GeForce RTX 2060 Super | |
| AMD Radeon RX 5700 | |
| Kingdom Come: Deliverance | |
| 1920x1080 Ultra High Preset | |
| Nvidia Titan RTX | |
| MSI RTX 2080 Gaming X Trio | |
| Nvidia GeForce RTX 2070 Super | |
| MSI RTX 2070 Gaming Z 8G | |
| Nvidia GeForce RTX 2060 Super | |
| AMD Radeon RX Vega 64 | |
| AMD Radeon VII | |
| MSI RTX 2060 Gaming Z 6G | |
| AMD Radeon RX 5700 | |
| 3840x2160 Ultra High Preset | |
| Nvidia Titan RTX | |
| MSI RTX 2080 Gaming X Trio | |
| AMD Radeon RX Vega 64 | |
| Nvidia GeForce RTX 2070 Super | |
| AMD Radeon VII | |
| MSI RTX 2070 Gaming Z 8G | |
| Nvidia GeForce RTX 2060 Super | |
| AMD Radeon RX 5700 | |
| MSI RTX 2060 Gaming Z 6G | |
| 2560x1440 Ultra High Preset | |
| MSI RTX 2080 Gaming X Trio | |
| Nvidia GeForce RTX 2070 Super | |
| Nvidia GeForce RTX 2060 Super | |
| MSI RTX 2070 Gaming Z 8G | |
| AMD Radeon RX 5700 | |
| Fortnite | |
| 1920x1080 Epic Preset | |
| Nvidia GeForce RTX 2070 Super | |
| Nvidia GeForce RTX 2060 Super | |
| MSI RTX 2080 Gaming X Trio | |
| MSI RTX 2060 Gaming Z 6G | |
| MSI RTX 2070 Gaming Z 8G | |
| Nvidia Titan RTX | |
| AMD Radeon RX 5700 | |
| AMD Radeon VII | |
| 3840x2160 Epic Preset | |
| Nvidia Titan RTX | |
| MSI RTX 2080 Gaming X Trio | |
| Nvidia GeForce RTX 2070 Super | |
| MSI RTX 2070 Gaming Z 8G | |
| Nvidia GeForce RTX 2060 Super | |
| AMD Radeon VII | |
| AMD Radeon RX 5700 | |
| MSI RTX 2060 Gaming Z 6G | |
| 2560x1440 Epic Preset | |
| MSI RTX 2080 Gaming X Trio | |
| Nvidia GeForce RTX 2070 Super | |
| MSI RTX 2070 Gaming Z 8G | |
| Nvidia GeForce RTX 2060 Super | |
| AMD Radeon RX 5700 | |
| Final Fantasy XV Benchmark | |
| 1920x1080 High Quality | |
| Nvidia Titan RTX | |
| MSI RTX 2080 Gaming X Trio | |
| Nvidia GeForce RTX 2070 Super | |
| MSI RTX 2070 Gaming Z 8G | |
| Nvidia GeForce RTX 2060 Super | |
| MSI RTX 2060 Gaming Z 6G | |
| AMD Radeon RX 5700 | |
| AMD Radeon RX Vega 64 | |
| AMD Radeon RX Vega 64 | |
| 3840x2160 High Quality | |
| Nvidia Titan RTX | |
| MSI RTX 2080 Gaming X Trio | |
| Nvidia GeForce RTX 2070 Super | |
| MSI RTX 2070 Gaming Z 8G | |
| Nvidia GeForce RTX 2060 Super | |
| MSI RTX 2060 Gaming Z 6G | |
| AMD Radeon RX 5700 | |
| AMD Radeon RX Vega 64 | |
| AMD Radeon RX Vega 64 | |
| Destiny 2 | |
| 1920x1080 Highest Preset AA:SM AF:16x | |
| Nvidia Titan RTX | |
| MSI RTX 2070 Gaming Z 8G | |
| MSI RTX 2080 Gaming X Trio | |
| Nvidia GeForce RTX 2060 Super | |
| Nvidia GeForce RTX 2070 Super | |
| AMD Radeon RX 5700 | |
| AMD Radeon VII | |
| MSI RTX 2060 Gaming Z 6G | |
| 3840x2160 Highest Preset AA:SM AF:16x | |
| Nvidia Titan RTX | |
| MSI RTX 2080 Gaming X Trio | |
| Nvidia GeForce RTX 2070 Super | |
| MSI RTX 2070 Gaming Z 8G | |
| Nvidia GeForce RTX 2060 Super | |
| AMD Radeon VII | |
| MSI RTX 2060 Gaming Z 6G | |
| AMD Radeon RX 5700 | |
| 2560x1440 Highest Preset AA:SM AF:16x | |
| MSI RTX 2080 Gaming X Trio | |
| Nvidia GeForce RTX 2070 Super | |
| MSI RTX 2070 Gaming Z 8G | |
| Nvidia GeForce RTX 2060 Super | |
| AMD Radeon RX 5700 | |
| Far Cry Primal | |
| 1920x1080 Ultra Preset AA:SM | |
| AMD Radeon RX Vega 64 | |
| MSI RTX 2070 Gaming Z 8G | |
| AMD Radeon VII | |
| MSI RTX 2060 Gaming Z 6G | |
| AMD Radeon RX 5700 | |
| MSI RTX 2080 Gaming X Trio | |
| Nvidia GeForce RTX 2060 Super | |
| Nvidia GeForce RTX 2070 Super | |
| Nvidia Titan RTX | |
| 3840x2160 High Preset AA:SM | |
| Nvidia Titan RTX | |
| MSI RTX 2080 Gaming X Trio | |
| AMD Radeon VII | |
| Nvidia GeForce RTX 2070 Super | |
| MSI RTX 2070 Gaming Z 8G | |
| Nvidia GeForce RTX 2060 Super | |
| AMD Radeon RX 5700 | |
| MSI RTX 2060 Gaming Z 6G | |
| AMD Radeon RX Vega 64 | |
| The Witcher 3 | |
| 1920x1080 Ultra Graphics & Postprocessing (HBAO+) | |
| Nvidia Titan RTX | |
| MSI RTX 2080 Gaming X Trio | |
| Nvidia GeForce RTX 2070 Super | |
| MSI RTX 2070 Gaming Z 8G | |
| AMD Radeon RX 5700 | |
| Nvidia GeForce RTX 2060 Super | |
| AMD Radeon RX Vega 64 | |
| AMD Radeon VII | |
| MSI RTX 2060 Gaming Z 6G | |
| 3840x2160 High Graphics & Postprocessing (Nvidia HairWorks Off) | |
| Nvidia Titan RTX | |
| MSI RTX 2080 Gaming X Trio | |
| Nvidia GeForce RTX 2070 Super | |
| MSI RTX 2070 Gaming Z 8G | |
| Nvidia GeForce RTX 2060 Super | |
| AMD Radeon VII | |
| MSI RTX 2060 Gaming Z 6G | |
| AMD Radeon RX Vega 64 | |
| AMD Radeon RX 5700 | |
| Watch Dogs 2 | |
| 1920x1080 Ultra Preset | |
| Nvidia Titan RTX | |
| MSI RTX 2080 Gaming X Trio | |
| Nvidia GeForce RTX 2070 Super | |
| MSI RTX 2070 Gaming Z 8G | |
| Nvidia GeForce RTX 2060 Super | |
| AMD Radeon RX Vega 64 | |
| MSI RTX 2060 Gaming Z 6G | |
| AMD Radeon VII | |
| 3840x2160 High Preset | |
| Nvidia Titan RTX | |
| MSI RTX 2080 Gaming X Trio | |
| Nvidia GeForce RTX 2070 Super | |
| MSI RTX 2070 Gaming Z 8G | |
| Nvidia GeForce RTX 2060 Super | |
| AMD Radeon VII | |
| MSI RTX 2060 Gaming Z 6G | |
| AMD Radeon RX Vega 64 | |
| Battlefield 1 | |
| 1920x1080 Ultra Preset AA:T | |
| Nvidia Titan RTX | |
| Nvidia GeForce RTX 2070 Super | |
| MSI RTX 2080 Gaming X Trio | |
| AMD Radeon RX Vega 64 | |
| Nvidia GeForce RTX 2060 Super | |
| MSI RTX 2070 Gaming Z 8G | |
| AMD Radeon VII | |
| MSI RTX 2060 Gaming Z 6G | |
| 3840x2160 High Preset AA:T | |
| Nvidia Titan RTX | |
| MSI RTX 2080 Gaming X Trio | |
| AMD Radeon VII | |
| Nvidia GeForce RTX 2070 Super | |
| MSI RTX 2070 Gaming Z 8G | |
| Nvidia GeForce RTX 2060 Super | |
| AMD Radeon RX Vega 64 | |
| MSI RTX 2060 Gaming Z 6G | |
| The Division | |
| 1920x1080 Ultra Preset AF:16x | |
| Nvidia Titan RTX | |
| MSI RTX 2080 Gaming X Trio | |
| AMD Radeon RX 5700 | |
| Nvidia GeForce RTX 2070 Super | |
| MSI RTX 2070 Gaming Z 8G | |
| Nvidia GeForce RTX 2060 Super | |
| AMD Radeon RX Vega 64 | |
| MSI RTX 2060 Gaming Z 6G | |
| AMD Radeon VII | |
| 3840x2160 High Preset AF:8x | |
| Nvidia Titan RTX | |
| MSI RTX 2080 Gaming X Trio | |
| Nvidia GeForce RTX 2070 Super | |
| AMD Radeon VII | |
| MSI RTX 2070 Gaming Z 8G | |
| AMD Radeon RX 5700 | |
| Nvidia GeForce RTX 2060 Super | |
| AMD Radeon RX Vega 64 | |
| MSI RTX 2060 Gaming Z 6G | |
| For Honor | |
| 1920x1080 Extreme Preset AA:T AF:16x | |
| Nvidia Titan RTX | |
| MSI RTX 2080 Gaming X Trio | |
| Nvidia GeForce RTX 2070 Super | |
| AMD Radeon RX 5700 | |
| MSI RTX 2070 Gaming Z 8G | |
| Nvidia GeForce RTX 2060 Super | |
| AMD Radeon RX Vega 64 | |
| MSI RTX 2060 Gaming Z 6G | |
| AMD Radeon VII | |
| 3840x2160 High Preset AA:T AF:8x | |
| Nvidia Titan RTX | |
| MSI RTX 2080 Gaming X Trio | |
| Nvidia GeForce RTX 2070 Super | |
| AMD Radeon VII | |
| MSI RTX 2070 Gaming Z 8G | |
| Nvidia GeForce RTX 2060 Super | |
| AMD Radeon RX 5700 | |
| MSI RTX 2060 Gaming Z 6G | |
| AMD Radeon RX Vega 64 | |
| Ghost Recon Wildlands | |
| 1920x1080 Ultra Preset AA:T AF:16x | |
| Nvidia Titan RTX | |
| MSI RTX 2080 Gaming X Trio | |
| Nvidia GeForce RTX 2070 Super | |
| MSI RTX 2070 Gaming Z 8G | |
| Nvidia GeForce RTX 2060 Super | |
| AMD Radeon RX 5700 | |
| MSI RTX 2060 Gaming Z 6G | |
| AMD Radeon RX Vega 64 | |
| AMD Radeon VII | |
| 3840x2160 Ultra Preset AA:T AF:16x | |
| Nvidia Titan RTX | |
| MSI RTX 2080 Gaming X Trio | |
| Nvidia GeForce RTX 2070 Super | |
| MSI RTX 2070 Gaming Z 8G | |
| AMD Radeon RX 5700 | |
| Nvidia GeForce RTX 2060 Super | |
| Doom | |
| 1920x1080 Ultra Preset AA:SM | |
| Nvidia Titan RTX | |
| Nvidia GeForce RTX 2060 Super | |
| MSI RTX 2080 Gaming X Trio | |
| MSI RTX 2070 Gaming Z 8G | |
| MSI RTX 2060 Gaming Z 6G | |
| Nvidia GeForce RTX 2070 Super | |
| 3840x2160 High Preset AA:FX | |
| Nvidia Titan RTX | |
| MSI RTX 2080 Gaming X Trio | |
| Nvidia GeForce RTX 2070 Super | |
| MSI RTX 2070 Gaming Z 8G | |
| Nvidia GeForce RTX 2060 Super | |
| MSI RTX 2060 Gaming Z 6G | |
| GTA V | |
| 1920x1080 Highest AA:4xMSAA + FX AF:16x | |
| Nvidia Titan RTX | |
| MSI RTX 2080 Gaming X Trio | |
| AMD Radeon VII | |
| MSI RTX 2070 Gaming Z 8G | |
| MSI RTX 2060 Gaming Z 6G | |
| Nvidia GeForce RTX 2060 Super | |
| Nvidia GeForce RTX 2070 Super | |
| AMD Radeon RX 5700 | |
| 3840x2160 High/On (Advanced Graphics Off) AA:FX AF:8x | |
| Nvidia Titan RTX | |
| Nvidia GeForce RTX 2070 Super | |
| MSI RTX 2080 Gaming X Trio | |
| Nvidia GeForce RTX 2060 Super | |
| AMD Radeon RX 5700 | |
| AMD Radeon VII | |
| MSI RTX 2070 Gaming Z 8G | |
| MSI RTX 2060 Gaming Z 6G | |
| Battlefield 4 - 3840x2160 High Preset | |
| Nvidia Titan RTX | |
| MSI RTX 2080 Gaming X Trio | |
| Nvidia GeForce RTX 2070 Super | |
| MSI RTX 2070 Gaming Z 8G | |
| AMD Radeon RX Vega 64 | |
| AMD Radeon VII | |
| Nvidia GeForce RTX 2060 Super | |
| MSI RTX 2060 Gaming Z 6G | |
| Hitman 2 | |
| 1920x1080 Ultra AF:16x | |
| AMD Radeon VII | |
| AMD Radeon RX 5700 | |
| MSI RTX 2060 Gaming Z 6G | |
| MSI RTX 2080 Gaming X Trio | |
| Nvidia GeForce RTX 2060 Super | |
| AMD Radeon RX Vega 64 | |
| MSI RTX 2070 Gaming Z 8G | |
| Nvidia GeForce RTX 2070 Super | |
| Nvidia Titan RTX | |
| 3840x2160 Ultra AF:16x | |
| Nvidia Titan RTX | |
| MSI RTX 2080 Gaming X Trio | |
| Nvidia GeForce RTX 2070 Super | |
| AMD Radeon VII | |
| AMD Radeon RX Vega 64 | |
| MSI RTX 2070 Gaming Z 8G | |
| AMD Radeon RX 5700 | |
| Nvidia GeForce RTX 2060 Super | |
| MSI RTX 2060 Gaming Z 6G | |
| 2560x1440 Ultra AF:16x | |
| MSI RTX 2080 Gaming X Trio | |
| AMD Radeon RX 5700 | |
| Nvidia GeForce RTX 2070 Super | |
| MSI RTX 2070 Gaming Z 8G | |
| Nvidia GeForce RTX 2060 Super | |
| Battlefield V | |
| 1920x1080 Ultra Preset | |
| Nvidia Titan RTX | |
| MSI RTX 2080 Gaming X Trio | |
| AMD Radeon RX Vega 64 | |
| AMD Radeon VII | |
| MSI RTX 2070 Gaming Z 8G | |
| MSI RTX 2060 Gaming Z 6G | |
| AMD Radeon RX 5700 | |
| Nvidia GeForce RTX 2070 Super | |
| Nvidia GeForce RTX 2060 Super | |
| 3840x2160 Ultra Preset | |
| Nvidia Titan RTX | |
| MSI RTX 2080 Gaming X Trio | |
| AMD Radeon VII | |
| MSI RTX 2070 Gaming Z 8G | |
| AMD Radeon RX Vega 64 | |
| AMD Radeon RX 5700 | |
| MSI RTX 2060 Gaming Z 6G | |
| Nvidia GeForce RTX 2070 Super | |
| Nvidia GeForce RTX 2060 Super | |
| 2560x1440 Ultra Preset | |
| MSI RTX 2080 Gaming X Trio | |
| MSI RTX 2070 Gaming Z 8G | |
| AMD Radeon RX 5700 | |
| Nvidia GeForce RTX 2070 Super | |
| Nvidia GeForce RTX 2060 Super | |
| Farming Simulator 19 | |
| 1920x1080 Very High Preset | |
| Nvidia Titan RTX | |
| MSI RTX 2080 Gaming X Trio | |
| MSI RTX 2060 Gaming Z 6G | |
| Nvidia GeForce RTX 2070 Super | |
| MSI RTX 2070 Gaming Z 8G | |
| Nvidia GeForce RTX 2060 Super | |
| AMD Radeon VII | |
| AMD Radeon RX Vega 64 | |
| AMD Radeon RX 5700 | |
| 3840x2160 Very High Preset | |
| Nvidia Titan RTX | |
| MSI RTX 2080 Gaming X Trio | |
| Nvidia GeForce RTX 2070 Super | |
| MSI RTX 2070 Gaming Z 8G | |
| Nvidia GeForce RTX 2060 Super | |
| MSI RTX 2060 Gaming Z 6G | |
| AMD Radeon VII | |
| AMD Radeon RX 5700 | |
| AMD Radeon RX Vega 64 | |
| 2560x1440 Very High Preset | |
| MSI RTX 2080 Gaming X Trio | |
| MSI RTX 2070 Gaming Z 8G | |
| Nvidia GeForce RTX 2070 Super | |
| Nvidia GeForce RTX 2060 Super | |
| AMD Radeon RX 5700 | |
| Darksiders III | |
| 1920x1080 Epic | |
| Nvidia Titan RTX | |
| MSI RTX 2080 Gaming X Trio | |
| Nvidia GeForce RTX 2070 Super | |
| MSI RTX 2070 Gaming Z 8G | |
| AMD Radeon VII | |
| MSI RTX 2060 Gaming Z 6G | |
| Nvidia GeForce RTX 2060 Super | |
| AMD Radeon RX 5700 | |
| AMD Radeon RX Vega 64 | |
| 3840x2160 Epic | |
| Nvidia Titan RTX | |
| MSI RTX 2080 Gaming X Trio | |
| Nvidia GeForce RTX 2070 Super | |
| MSI RTX 2070 Gaming Z 8G | |
| AMD Radeon VII | |
| Nvidia GeForce RTX 2060 Super | |
| AMD Radeon RX 5700 | |
| AMD Radeon RX Vega 64 | |
| MSI RTX 2060 Gaming Z 6G | |
| Just Cause 4 | |
| 1920x1080 Very High / On AA:SM AF:16x | |
| Nvidia Titan RTX | |
| MSI RTX 2080 Gaming X Trio | |
| Nvidia GeForce RTX 2070 Super | |
| MSI RTX 2070 Gaming Z 8G | |
| Nvidia GeForce RTX 2060 Super | |
| AMD Radeon VII | |
| MSI RTX 2060 Gaming Z 6G | |
| AMD Radeon RX Vega 64 | |
| AMD Radeon RX 5700 | |
| 3840x2160 Very High / On AA:SM AF:16x | |
| Nvidia Titan RTX | |
| MSI RTX 2080 Gaming X Trio | |
| Nvidia GeForce RTX 2070 Super | |
| AMD Radeon VII | |
| MSI RTX 2070 Gaming Z 8G | |
| Nvidia GeForce RTX 2060 Super | |
| AMD Radeon RX 5700 | |
| MSI RTX 2060 Gaming Z 6G | |
| AMD Radeon RX Vega 64 | |
| 2560x1440 Very High / On AA:SM AF:16x | |
| MSI RTX 2080 Gaming X Trio | |
| Nvidia GeForce RTX 2070 Super | |
| MSI RTX 2070 Gaming Z 8G | |
| Nvidia GeForce RTX 2060 Super | |
| AMD Radeon RX 5700 | |
| Apex Legends | |
| 1920x1080 Maximum Settings AA:TS AF:16x | |
| MSI RTX 2070 Gaming Z 8G | |
| MSI RTX 2080 Gaming X Trio | |
| Nvidia Titan RTX 24 GB | |
| Nvidia GeForce RTX 2060 Super | |
| Nvidia GeForce RTX 2070 Super | |
| AMD Radeon RX 5700 | |
| MSI RTX 2060 Gaming Z 6G | |
| AMD Radeon RX Vega 64 | |
| 3840x2160 Maximum Settings AA:TS AF:16x | |
| Nvidia Titan RTX 24 GB | |
| MSI RTX 2080 Gaming X Trio | |
| MSI RTX 2070 Gaming Z 8G | |
| Nvidia GeForce RTX 2070 Super | |
| Nvidia GeForce RTX 2060 Super | |
| AMD Radeon RX 5700 | |
| AMD Radeon RX Vega 64 | |
| MSI RTX 2060 Gaming Z 6G | |
| 2560x1440 Maximum Settings AA:TS AF:16x | |
| Nvidia Titan RTX 24 GB | |
| MSI RTX 2070 Gaming Z 8G | |
| MSI RTX 2080 Gaming X Trio | |
| Nvidia GeForce RTX 2070 Super | |
| Nvidia GeForce RTX 2060 Super | |
| AMD Radeon RX 5700 | |
| MSI RTX 2060 Gaming Z 6G | |
| AMD Radeon RX Vega 64 | |
| Far Cry New Dawn | |
| 1920x1080 Ultra Preset | |
| MSI RTX 2080 Gaming X Trio | |
| MSI RTX 2070 Gaming Z 8G | |
| MSI RTX 2060 Gaming Z 6G | |
| Nvidia GeForce RTX 2070 Super | |
| AMD Radeon RX Vega 64 | |
| Nvidia GeForce RTX 2060 Super | |
| AMD Radeon VII | |
| AMD Radeon RX 5700 | |
| Nvidia Titan RTX 24 GB | |
| 3840x2160 Ultra Preset | |
| Nvidia Titan RTX 24 GB | |
| MSI RTX 2080 Gaming X Trio | |
| AMD Radeon VII | |
| Nvidia GeForce RTX 2070 Super | |
| MSI RTX 2070 Gaming Z 8G | |
| AMD Radeon RX 5700 | |
| Nvidia GeForce RTX 2060 Super | |
| AMD Radeon RX Vega 64 | |
| MSI RTX 2060 Gaming Z 6G | |
| 2560x1440 Ultra Preset | |
| MSI RTX 2080 Gaming X Trio | |
| Nvidia GeForce RTX 2070 Super | |
| AMD Radeon VII | |
| MSI RTX 2070 Gaming Z 8G | |
| AMD Radeon RX Vega 64 | |
| Nvidia GeForce RTX 2060 Super | |
| AMD Radeon RX 5700 | |
| MSI RTX 2060 Gaming Z 6G | |
| Nvidia Titan RTX 24 GB | |
| Metro Exodus | |
| 1920x1080 Ultra Quality AF:16x | |
| MSI RTX 2080 Gaming X Trio | |
| Nvidia Titan RTX 24 GB | |
| Nvidia GeForce RTX 2070 Super | |
| AMD Radeon VII | |
| MSI RTX 2070 Gaming Z 8G | |
| Nvidia GeForce RTX 2060 Super | |
| AMD Radeon RX 5700 | |
| AMD Radeon RX Vega 64 | |
| MSI RTX 2060 Gaming Z 6G | |
| 3840x2160 Ultra Quality AF:16x | |
| Nvidia Titan RTX 24 GB | |
| AMD Radeon RX Vega 64 | |
| MSI RTX 2080 Gaming X Trio | |
| AMD Radeon VII | |
| Nvidia GeForce RTX 2070 Super | |
| MSI RTX 2070 Gaming Z 8G | |
| Nvidia GeForce RTX 2060 Super | |
| AMD Radeon RX 5700 | |
| MSI RTX 2060 Gaming Z 6G | |
| 2560x1440 Ultra Quality AF:16x | |
| Nvidia Titan RTX 24 GB | |
| MSI RTX 2080 Gaming X Trio | |
| AMD Radeon VII | |
| Nvidia GeForce RTX 2070 Super | |
| MSI RTX 2070 Gaming Z 8G | |
| AMD Radeon RX 5700 | |
| Nvidia GeForce RTX 2060 Super | |
| AMD Radeon RX Vega 64 | |
| MSI RTX 2060 Gaming Z 6G | |
| Anthem | |
| 1920x1080 Ultra Preset | |
| MSI RTX 2080 Gaming X Trio | |
| AMD Radeon RX Vega 64 | |
| Nvidia GeForce RTX 2070 Super | |
| Nvidia Titan RTX 24 GB | |
| MSI RTX 2070 Gaming Z 8G | |
| AMD Radeon VII | |
| Nvidia GeForce RTX 2060 Super | |
| MSI RTX 2060 Gaming Z 6G | |
| AMD Radeon RX 5700 | |
| 2560x1440 Ultra Preset | |
| Nvidia Titan RTX 24 GB | |
| MSI RTX 2080 Gaming X Trio | |
| AMD Radeon VII | |
| Nvidia GeForce RTX 2070 Super | |
| MSI RTX 2070 Gaming Z 8G | |
| AMD Radeon RX 5700 | |
| AMD Radeon RX Vega 64 | |
| Nvidia GeForce RTX 2060 Super | |
| MSI RTX 2060 Gaming Z 6G | |
| Dirt Rally 2.0 | |
| 1920x1080 Ultra Preset AA:T AF:16x | |
| Nvidia Titan RTX 24 GB | |
| Nvidia GeForce RTX 2070 Super | |
| MSI RTX 2080 Gaming X Trio | |
| AMD Radeon VII | |
| AMD Radeon RX 5700 | |
| MSI RTX 2070 Gaming Z 8G | |
| Nvidia GeForce RTX 2060 Super | |
| AMD Radeon RX Vega 64 | |
| MSI RTX 2060 Gaming Z 6G | |
| 3840x2160 Ultra Preset AA:T AF:16x | |
| Nvidia Titan RTX 24 GB | |
| MSI RTX 2080 Gaming X Trio | |
| Nvidia GeForce RTX 2070 Super | |
| AMD Radeon VII | |
| MSI RTX 2070 Gaming Z 8G | |
| AMD Radeon RX 5700 | |
| Nvidia GeForce RTX 2060 Super | |
| AMD Radeon RX Vega 64 | |
| MSI RTX 2060 Gaming Z 6G | |
| 2560x1440 Ultra Preset AA:T AF:16x | |
| Nvidia Titan RTX 24 GB | |
| Nvidia GeForce RTX 2070 Super | |
| MSI RTX 2080 Gaming X Trio | |
| AMD Radeon VII | |
| AMD Radeon RX 5700 | |
| MSI RTX 2070 Gaming Z 8G | |
| Nvidia GeForce RTX 2060 Super | |
| AMD Radeon RX Vega 64 | |
| MSI RTX 2060 Gaming Z 6G | |
| The Division 2 | |
| 1920x1080 Ultra Preset | |
| Nvidia Titan RTX 24 GB | |
| MSI RTX 2080 Gaming X Trio | |
| MSI RTX 2070 Gaming Z 8G | |
| Nvidia GeForce RTX 2070 Super | |
| MSI RTX 2060 Gaming Z 6G | |
| Nvidia GeForce RTX 2060 Super | |
| AMD Radeon RX Vega 64 | |
| AMD Radeon RX 5700 | |
| 3840x2160 Ultra Preset | |
| Nvidia Titan RTX 24 GB | |
| MSI RTX 2080 Gaming X Trio | |
| MSI RTX 2070 Gaming Z 8G | |
| Nvidia GeForce RTX 2070 Super | |
| MSI RTX 2060 Gaming Z 6G | |
| AMD Radeon RX Vega 64 | |
| Nvidia GeForce RTX 2060 Super | |
| AMD Radeon RX 5700 | |
| 2560x1440 Ultra Preset | |
| Nvidia Titan RTX 24 GB | |
| MSI RTX 2080 Gaming X Trio | |
| MSI RTX 2070 Gaming Z 8G | |
| Nvidia GeForce RTX 2070 Super | |
| MSI RTX 2060 Gaming Z 6G | |
| Nvidia GeForce RTX 2060 Super | |
| AMD Radeon RX Vega 64 | |
| AMD Radeon RX 5700 | |
| Anno 1800 | |
| 3840x2160 Ultra Graphics Quality (DX11) | |
| Nvidia Titan RTX 24 GB | |
| MSI RTX 2080 Gaming X Trio | |
| Nvidia GeForce RTX 2070 Super | |
| MSI RTX 2070 Gaming Z 8G | |
| Nvidia GeForce RTX 2060 Super | |
| AMD Radeon RX 5700 | |
| MSI RTX 2060 Gaming Z 6G | |
| AMD Radeon RX Vega 64 | |
| 1920x1080 Ultra Graphics Quality (DX11) | |
| MSI RTX 2080 Gaming X Trio | |
| Nvidia GeForce RTX 2070 Super | |
| MSI RTX 2070 Gaming Z 8G | |
| MSI RTX 2060 Gaming Z 6G | |
| Nvidia GeForce RTX 2060 Super | |
| AMD Radeon RX 5700 | |
| Nvidia Titan RTX 24 GB | |
| AMD Radeon RX Vega 64 | |
| 2560x1440 Ultra Graphics Quality (DX11) | |
| MSI RTX 2080 Gaming X Trio | |
| Nvidia GeForce RTX 2070 Super | |
| MSI RTX 2070 Gaming Z 8G | |
| Nvidia GeForce RTX 2060 Super | |
| AMD Radeon RX 5700 | |
| MSI RTX 2060 Gaming Z 6G | |
| Nvidia Titan RTX 24 GB | |
| AMD Radeon RX Vega 64 | |
| Rage 2 | |
| 3840x2160 Ultra Preset (Resolution Scale Off) | |
| Nvidia Titan RTX 24 GB | |
| MSI RTX 2080 Gaming X Trio | |
| Nvidia GeForce RTX 2070 Super | |
| MSI RTX 2070 Gaming Z 8G | |
| Nvidia GeForce RTX 2060 Super | |
| AMD Radeon RX Vega 64 | |
| AMD Radeon RX 5700 | |
| MSI RTX 2060 Gaming Z 6G | |
| 1920x1080 Ultra Preset (Resolution Scale Off) | |
| Nvidia Titan RTX 24 GB | |
| MSI RTX 2080 Gaming X Trio | |
| Nvidia GeForce RTX 2070 Super | |
| MSI RTX 2070 Gaming Z 8G | |
| AMD Radeon RX Vega 64 | |
| Nvidia GeForce RTX 2060 Super | |
| MSI RTX 2060 Gaming Z 6G | |
| 2560x1440 Ultra Preset (Resolution Scale Off) | |
| Nvidia Titan RTX 24 GB | |
| MSI RTX 2080 Gaming X Trio | |
| Nvidia GeForce RTX 2070 Super | |
| MSI RTX 2070 Gaming Z 8G | |
| AMD Radeon RX Vega 64 | |
| Nvidia GeForce RTX 2060 Super | |
| AMD Radeon RX 5700 | |
| MSI RTX 2060 Gaming Z 6G | |
| F1 2019 | |
| 3840x2160 Ultra High Preset AA:T AF:16x | |
| Nvidia Titan RTX 24 GB | |
| Nvidia GeForce RTX 2070 Super | |
| AMD Radeon RX 5700 | |
| Nvidia GeForce RTX 2060 Super | |
| AMD Radeon RX Vega 64 | |
| 1920x1080 Ultra High Preset AA:T AF:16x | |
| Nvidia GeForce RTX 2070 Super | |
| Nvidia Titan RTX 24 GB | |
| AMD Radeon RX Vega 64 | |
| AMD Radeon RX 5700 | |
| Nvidia GeForce RTX 2060 Super | |
| 2560x1440 Ultra High Preset AA:T AF:16x | |
| Nvidia Titan RTX 24 GB | |
| Nvidia GeForce RTX 2070 Super | |
| AMD Radeon RX 5700 | |
| Nvidia GeForce RTX 2060 Super | |
| AMD Radeon RX Vega 64 | |
| low | med. | high | ultra | QHD | 4K | |
|---|---|---|---|---|---|---|
| BioShock Infinite (2013) | 314.9 | 282.6 | 261.7 | 172.3 | ||
| Battlefield 4 (2013) | 200 | 200 | 200 | 190 | 65 | |
| GTA V (2015) | 169 | 162 | 144 | 85 | 83 | |
| The Witcher 3 (2015) | 306 | 237 | 149 | 79 | 57 | |
| Dota 2 Reborn (2015) | 133.7 | 122.6 | 116.8 | 109.8 | 105.1 | |
| Rainbow Six Siege (2015) | 304.6 | 260.4 | 246.8 | 228.7 | 114.5 | |
| Rise of the Tomb Raider (2016) | 255 | 186 | 150 | 125 | 53.4 | |
| Far Cry Primal (2016) | 120 | 107 | 98 | 90 | 55 | |
| The Division (2016) | 279.5 | 229.1 | 132.3 | 106.1 | 54.5 | |
| Doom (2016) | 148 | 153 | 145 | 142 | 86 | |
| Overwatch (2016) | 300 | 300 | 298 | 213 | 118 | |
| Deus Ex Mankind Divided (2016) | 145.8 | 136.7 | 111.2 | 66.9 | 41.3 | |
| Battlefield 1 (2016) | 193 | 175 | 157 | 143 | 68 | |
| Dishonored 2 (2016) | 119.5 | 119.2 | 118.4 | 112.8 | 61.4 | |
| Watch Dogs 2 (2016) | 140 | 124 | 102 | 74 | 43.1 | |
| For Honor (2017) | 253.1 | 180.2 | 173.2 | 133.9 | 58.3 | |
| Ghost Recon Wildlands (2017) | 152.6 | 113.6 | 106.8 | 62.4 | 43.5 | |
| Rocket League (2017) | 249 | 247 | 244 | 138 | ||
| Dirt 4 (2017) | 295 | 235 | 203 | 125 | 74 | |
| Playerunknown's Battlegrounds (PUBG) (2017) | 198 | 164 | 155 | 128 | 48.4 | |
| Destiny 2 (2017) | 151 | 149 | 149 | 145 | 103 | 54.7 |
| Assassin´s Creed Origins (2017) | 109 | 96 | 93 | 80 | 68 | 43 |
| Call of Duty WWII (2017) | 243 | 232 | 155 | 135 | 107 | 68 |
| Fortnite (2018) | 280 | 216 | 179 | 159 | 100 | 49.5 |
| Final Fantasy XV Benchmark (2018) | 159 | 109 | 79 | 35 | ||
| Kingdom Come: Deliverance (2018) | 156 | 136 | 111 | 77 | 58.1 | 30 |
| X-Plane 11.11 (2018) | 101 | 92 | 77 | 67 | ||
| Far Cry 5 (2018) | 121 | 108 | 104 | 99 | 83 | 45 |
| The Crew 2 (2018) | 60 | 60 | 60 | 60 | 59.8 | 38.7 |
| Monster Hunter World (2018) | 139 | 123 | 118 | 93 | 56.2 | 28.4 |
| F1 2018 (2018) | 228 | 196 | 160 | 122 | 99 | 60 |
| Shadow of the Tomb Raider (2018) | 125 | 106 | 104 | 96 | 69 | 36 |
| FIFA 19 (2018) | 246 | 237 | 223 | 216 | 211 | 176 |
| Forza Horizon 4 (2018) | 164 | 137 | 134 | 110 | 90 | 62 |
| Assassin´s Creed Odyssey (2018) | 107 | 97 | 81 | 61 | 52 | 34 |
| Call of Duty Black Ops 4 (2018) | 222 | 163 | 158 | 146 | 96 | 48.6 |
| Hitman 2 (2018) | 87 | 86 | 78 | 79 | 75 | 45 |
| Battlefield V (2018) | 146 | 108 | 94 | 87 | 71 | 46.5 |
| Farming Simulator 19 (2018) | 187 | 147 | 128 | 118 | 111 | 65 |
| Darksiders III (2018) | 158 | 114 | 108 | 108 | 82 | 41.6 |
| Just Cause 4 (2018) | 192 | 143 | 109 | 102 | 75 | 41 |
| Apex Legends (2019) | 144 | 144 | 144 | 144 | 112 | 63 |
| Far Cry New Dawn (2019) | 112 | 98 | 95 | 85 | 79 | 50 |
| Metro Exodus (2019) | 126.9 | 95.3 | 72.1 | 58.9 | 46.5 | 29.7 |
| Anthem (2019) | 101 | 96 | 92 | 89 | 72 | 41 |
| Dirt Rally 2.0 (2019) | 215 | 177 | 158 | 93 | 71 | 42.8 |
| The Division 2 (2019) | 179 | 140 | 114 | 85 | 59 | 32 |
| Anno 1800 (2019) | 124 | 116 | 95 | 40.3 | 37.5 | 25 |
| Rage 2 (2019) | 226 | 126 | 107 | 104 | 69 | 33.8 |
| F1 2019 (2019) | 204 | 185 | 150 | 121 | 95 | 58 |
Compute Performance
Thanks to more CUDA cores, there is an increase in compute performance. As expected, the RTX 2070 Gaming Z 8G from MSI is slightly faster than the Nvidia GeForce RTX 2060S. The RTX 2060 Gaming Z 6G is about 20% slower than the RTX 2060S when it comes to compute performance. Both the Radeon VII and the Radeon RX 5700 do very well here and sometimes even manage to beat the RTX 2080. However, there are wild swings in performance and there are times when both AMD graphics cards fall significantly behind the RTX GPUs.
| LuxMark v2.0 64Bit | |
| Room GPUs-only | |
| Nvidia Titan RTX | |
| AMD Radeon VII | |
| MSI RTX 2080 Gaming X Trio | |
| Nvidia GeForce RTX 2070 Super | |
| MSI RTX 2070 Gaming Z 8G | |
| Nvidia GeForce RTX 2060 Super | |
| MSI RTX 2060 Gaming Z 6G | |
| AMD Radeon RX 5700 | |
| Sala GPUs-only | |
| Nvidia Titan RTX | |
| MSI RTX 2080 Gaming X Trio | |
| Nvidia GeForce RTX 2070 Super | |
| MSI RTX 2070 Gaming Z 8G | |
| Nvidia GeForce RTX 2060 Super | |
| AMD Radeon VII | |
| MSI RTX 2060 Gaming Z 6G | |
| AMD Radeon RX 5700 | |
| SiSoft Sandra 2016 | |
| Image Processing | |
| AMD Radeon VII | |
| MSI RTX 2080 Gaming X Trio | |
| Nvidia GeForce RTX 2070 Super | |
| MSI RTX 2070 Gaming Z 8G | |
| Nvidia GeForce RTX 2060 Super | |
| MSI RTX 2060 Gaming Z 6G | |
| AMD Radeon RX 5700 | |
| GP Cryptography (Higher Security AES256+SHA2-512) | |
| MSI RTX 2080 Gaming X Trio | |
| AMD Radeon VII | |
| Nvidia GeForce RTX 2070 Super | |
| MSI RTX 2070 Gaming Z 8G | |
| Nvidia GeForce RTX 2060 Super | |
| MSI RTX 2060 Gaming Z 6G | |
| GP Financial Analysis (FP High/Double Precision) | |
| AMD Radeon VII | |
| MSI RTX 2080 Gaming X Trio | |
| Nvidia GeForce RTX 2070 Super | |
| MSI RTX 2070 Gaming Z 8G | |
| Nvidia GeForce RTX 2060 Super | |
| MSI RTX 2060 Gaming Z 6G | |
| AMD Radeon RX 5700 | |
Emissions of the Nvidia GeForce RTX 2060S
Additional performance does not come for free. The power consumption of the RTX 2060S has increased, because additional VRAM needs more energy to work. On the specification sheet, Nvidia says that the Founders Edition card has a TDP of 175 watts. This is 15 watts higher than the predecessor model, but 15 watts lower than the RTX 2060 Gaming Z 6G from MSI.
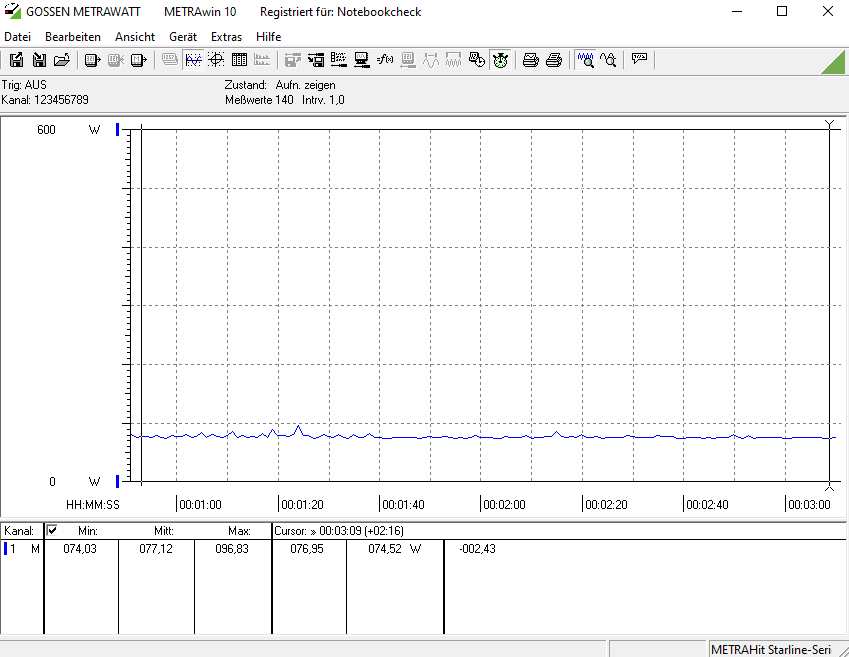
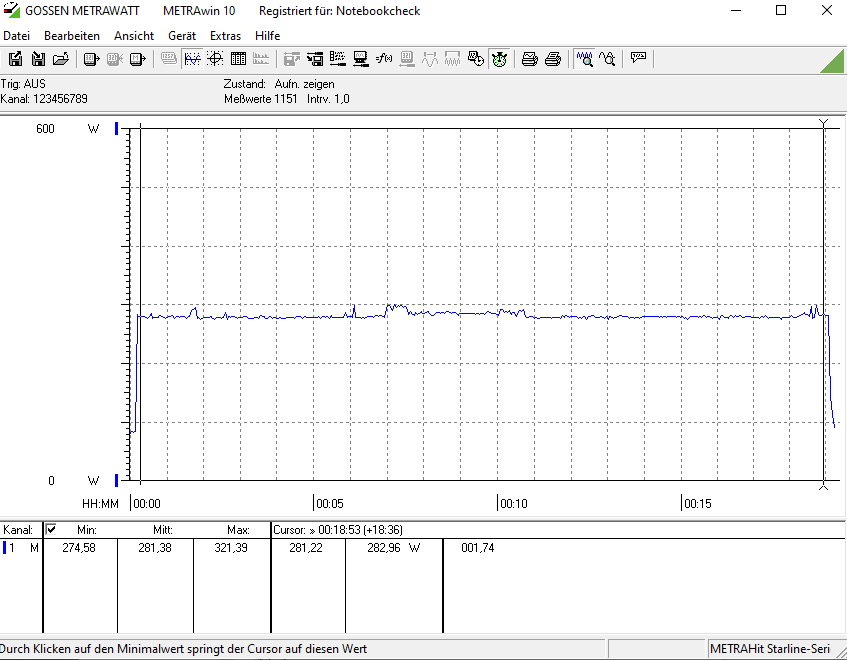
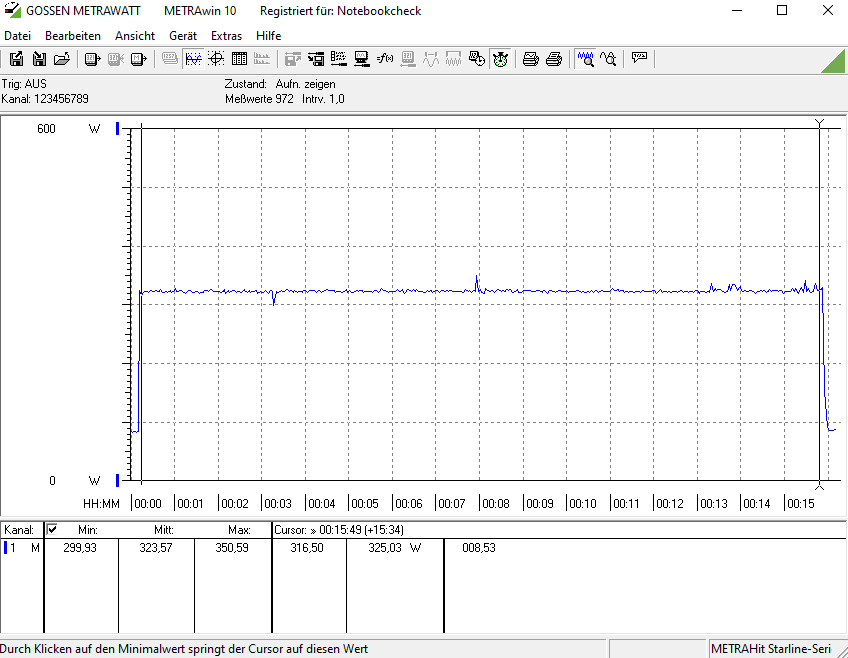
Our energy consumption numbers reflect the entire power draw of the system without the monitor. Here, the system drew 77 watts when idle. This is exactly what we expected to see, because all other GPUs consume about as much energy when idle. During the stress test, the power consumption reaches 281 watts. When compared to the MSI RTX 2060 Gaming Z, the system with the RTX 2060S is somewhat more energy-efficient. The energy consumption hits 323 watts when we raise the power limit by 22%. We use The Witcher 3
to measure the energy consumption during gaming. Here, the RTX 2060S (300 watts) is beaten by the RTX 2060 from MSI (290 watts) for the first time.
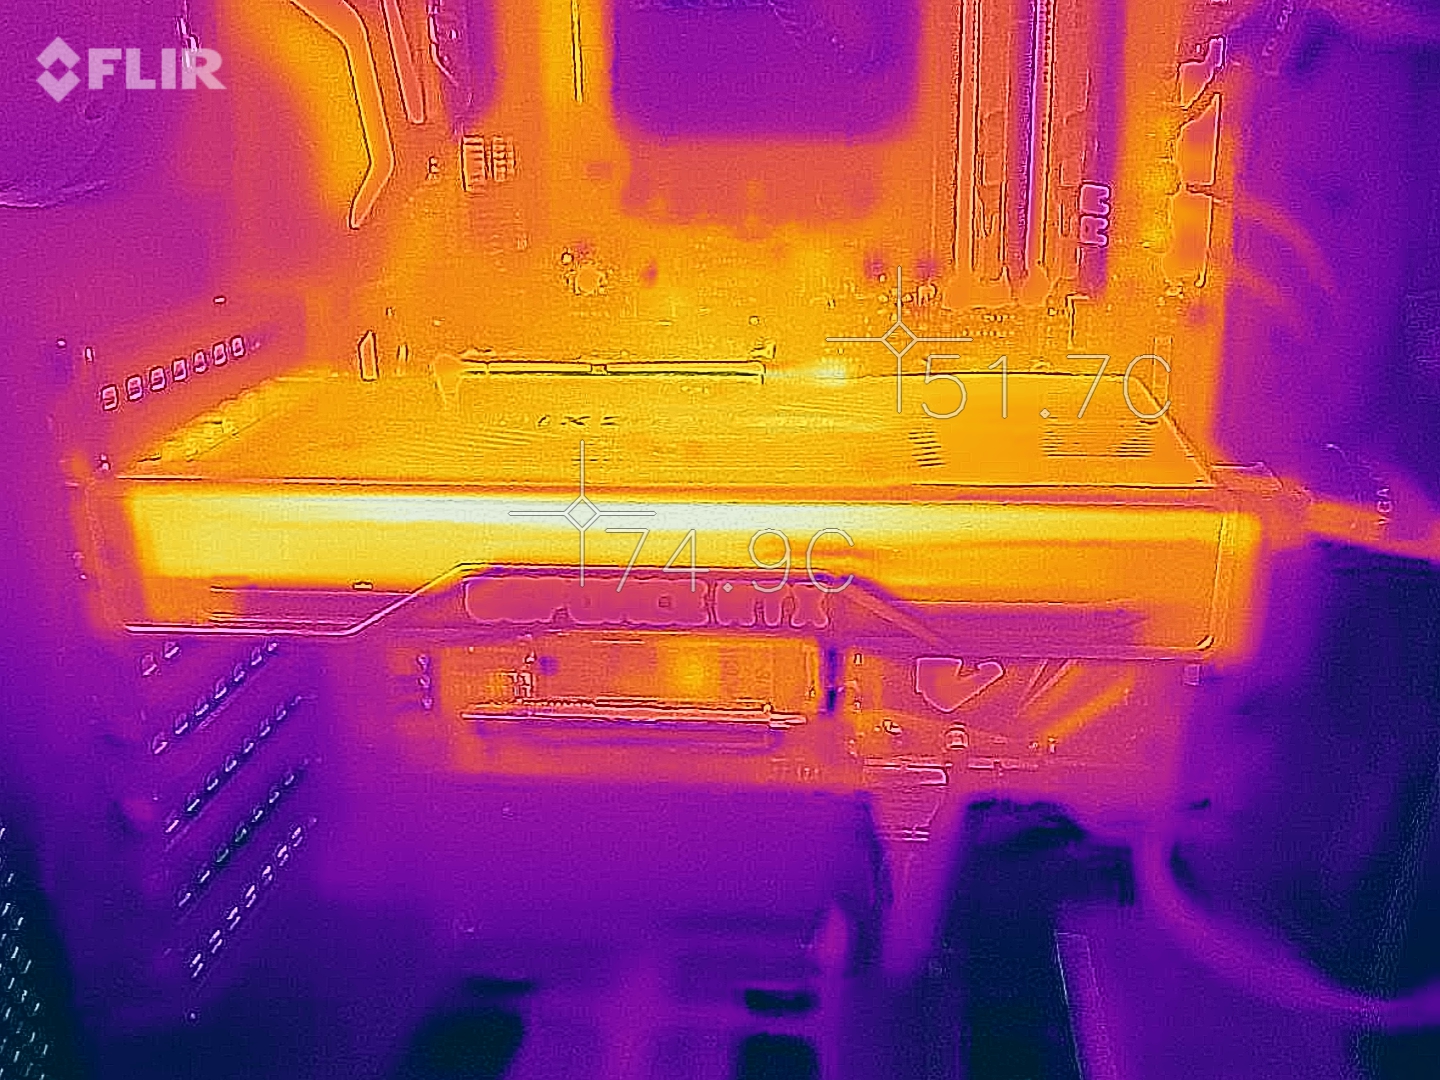
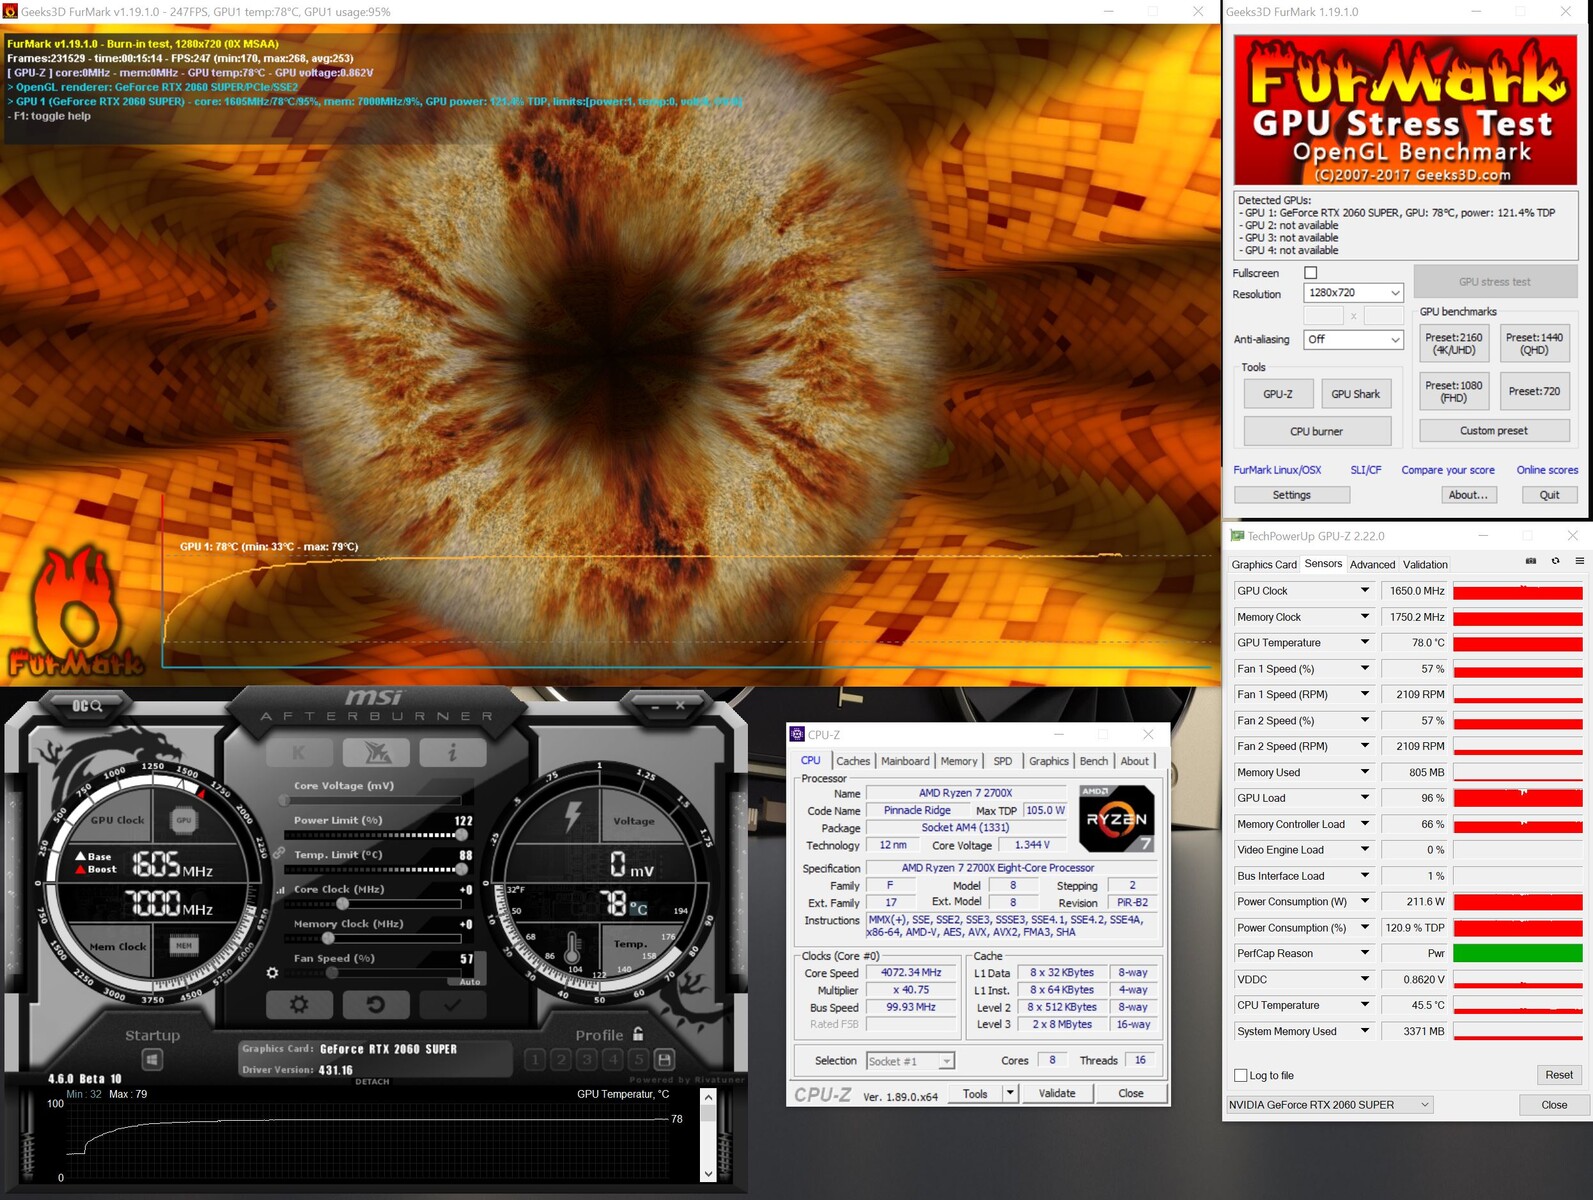
During the stress test, we also paid attention to the temperatures. It is worth mentioning that the temperatures were measured with the case closed. With the power target set to 100 %, the reference model of the RTX 2060S reaches 72 °C (161.6 °F). The fans operate at 50%, which is why they are barely audible. With the power target set to 122%, the GPU temperatures are 6 °C higher (76 °C/172.4 °F). Both fans become noticeably louder and spin at 2100 RPM (57%).
All in all, Nvidia’s cooling solution manages to keep the temperatures in check very well. The GPU never throttled because of thermal problems. The GPU hits the power limit way before the temperatures become critical.
| Power Consumption | |
| 1920x1080 The Witcher 3 ultra (external Monitor) | |
| Nvidia Titan RTX | |
| AMD Radeon RX Vega 64 (Idle: 74.3 W) | |
| MSI RTX 2080 Gaming X Trio (Idle: 87.78 W) | |
| Nvidia GeForce RTX 2070 Super (96.8 fps, Idle: 80.5 W) | |
| MSI RTX 2070 Gaming Z 8G (Idle: 73.3 W) | |
| AMD Radeon VII (Idle: 81.39 W) | |
| Nvidia GeForce RTX 2060 Super (82.7 fps, Idle: 77.12 W) | |
| AMD Radeon RX 5700 (84.2 fps, Idle: 64.5 W) | |
| MSI RTX 2060 Gaming Z 6G (Idle: 74.66 W) | |
| 1280x720 FurMark 1.19 GPU Stress Test (external Monitor) | |
| AMD Radeon VII (Idle: 81.39 W) | |
| MSI RTX 2080 Gaming X Trio | |
| MSI RTX 2070 Gaming Z 8G (Idle: 73.3 W) | |
| Nvidia GeForce RTX 2070 Super (283 fps, Idle: 80.5 W) | |
| MSI RTX 2060 Gaming Z 6G (Idle: 74.66 W) | |
| Nvidia GeForce RTX 2060 Super (237 fps, Idle: 77.12 W) | |
| AMD Radeon RX 5700 (207 fps, Idle: 64.5 W) | |
* ... smaller is better
Overclocking - Almost as fast as the RTX 2070
Our reference model from Nvidia represents the base configuration of the RTX 2060S. The models from Nvidia’s board partners should come with alternative cooling solutions and somewhat higher core clocks, as was the case with the MSI RTX 2060 Gaming Z 6G. The power limit of the Founders Edition card can be increased by 22%, which increases the TDP up to about 215 watts. This allows plenty of room for overclocking both the GPU and the VRAM. Numerically this means a 145 MHz boost to the core clock and a 900 MHz boost to the VRAM speed. That being said, the overclocking potential varies from GPU to GPU. There are no guarantees when it comes to overclocking.
With our settings, we were able to get 10% more performance out of the RTX 2060S. This led to the fans spinning somewhat faster, but they were still not overly bothersome. When overclocked, the GeForce RTX 2060S is almost on the same level as the RTX 2070 FE.
Pros
Cons
Verdict - Faster and more future-proof

The Nvidia GeForce RTX 2060S Founders Edition is a preemptive strike against AMD’s Navi-based GPUs. At the same time, the normal RTX 2060 is vanishing from the shelves, and it is going to become especially attractive to bargain hunters, despite the fact that it features only 6 GB of VRAM. However, the standard RTX 2060 is still good enough for 1080p gaming, especially if you are willing to turn down the graphics settings a bit. Those who already have an RTX 2060 will have to upgrade, whether they want to or not, if they really wish to max out all the settings when gaming at 1080p and 1440p. Here, the RTX 2060 cannot keep up, because some titles require more than 6 GB of VRAM. And this is where the RTX 2060S comes in. With 8 GB of GDDR6 VRAM, it offers as much video memory as the RTX 2070 and the RTX 2080, which makes the graphics card more future-proof.
There are also some improvements in terms of performance. All in all, the RTX 2060S is up to 20% faster than the predecessor. However, this increase in performance varies from title to title and from preset to preset.
The Nvidia GeForce RTX 2060S scores some major points with its good build quality and slick design. Moreover, the RTX 2060S also offers very good gaming performance.
The increased power consumption is justifiable, when you take a look at the performance gains. The factory-overclocked GPUs from the RTX 2060 series are just as power-hungry as the RTX 2060S Founders Edition.
Nevertheless, it will not be easy to sell this GPU, because Nvidia still charges 419 Euros (~$467) for the entry-level video card. Those who only game in 1080p and do not need ray-tracing or DLSS will be more than happy with the lower-priced GeForce GTX 1660Ti. However, those who plan to game in 4K or 1440K in the long-run should rather get the RTX 2060S or a Navi-based graphics card from Team Red. Having said that, the GeForce RTX 2060S is not powerful enough for a 4K gaming experience without any compromises.
Benchmarks
3DM Vant. Perf. total +
specvp12 sw-03 +
* Smaller numbers mean a higher performance
Game Benchmarks
The following benchmarks stem from our benchmarks of review laptops. The performance depends on the used graphics memory, clock rate, processor, system settings, drivers, and operating systems. So the results don't have to be representative for all laptops with this GPU. For detailed information on the benchmark results, click on the fps number.

007 First Light
2026
Forza Horizon 6
2026
Pragmata
2026
Death Stranding 2
2026
Crimson Desert
2026


Anno 117: Pax Romana
2025
ARC Raiders
2025
The Outer Worlds 2
2025
Battlefield 6
2025
Borderlands 4
2025
F1 25
2025
Doom: The Dark Ages
2025


Civilization 7
2025Monster Hunter Wilds
2025

Stalker 2
2024

Until Dawn
2024
God of War Ragnarök
2024
Final Fantasy XVI
2024
Space Marine 2
2024
Star Wars Outlaws
2024
Black Myth: Wukong
2024
Once Human
2024
The First Descendant
2024
F1 24
2024

Ghost of Tsushima
2024

Alone in the Dark
2024
Dragon's Dogma 2
2024
Last Epoch
2024
Skull & Bones
2024
Helldivers 2
2024
Enshrouded
2024
Palworld
2024

Ready or Not
2023
The Finals
2023


EA Sports WRC
2023
Alan Wake 2
2023
Lords of the Fallen
2023
Total War Pharaoh
2023

EA Sports FC 24
2023
Counter-Strike 2
2023
Cyberpunk 2077
2023
Baldur's Gate 3
2023
Lies of P
2023
Starfield
2023
Armored Core 6
2023
Immortals of Aveum
2023
Atlas Fallen
2023

F1 23
2023
Diablo 4
2023

Dead Island 2
2023
The Last of Us
2023

Company of Heroes 3
2023
Sons of the Forest
2023
Atomic Heart
2023
Returnal
2023
Hogwarts Legacy
2023
Dead Space Remake
2023
The Witcher 3 v4
2023
High On Life
2023


FIFA 23
2022
The Quarry
2022
F1 22
2022
Vampire Bloodhunt
2022
Ghostwire Tokyo
2022

Cyberpunk 2077 1.6
2022
Elex 2
2022
GRID Legends
2022
Elden Ring
2022
Dying Light 2
2022

God of War
2022
Halo Infinite
2021
Farming Simulator 22
2021
Battlefield 2042
2021
Forza Horizon 5
2021

Riders Republic
2021

Back 4 Blood
2021
Far Cry 6
2021
Alan Wake Remastered
2021
New World
2021
Deathloop
2021
F1 2021
2021

Days Gone
2021


Outriders
2021
Hitman 3
2021
Cyberpunk 2077 1.0
2020

Yakuza Like a Dragon
2020


Dirt 5
2020
Watch Dogs Legion
2020
FIFA 21
2020
Star Wars Squadrons
2020

Serious Sam 4
2020
Crysis Remastered
2020

Horizon Zero Dawn
2020
Death Stranding
2020
F1 2020
2020
Valorant
2020
Gears Tactics
2020
Doom Eternal
2020
Hunt Showdown
2020
Escape from Tarkov
2020
Fall Guys
2020


Need for Speed Heat
2019

GRID 2019
2019

FIFA 20
2019
Borderlands 3
2019
Control
2019
F1 2019
2019

Rage 2
2019
Anno 1800
2019
The Division 2
2019
Dirt Rally 2.0
2019
Anthem
2019
Far Cry New Dawn
2019
Metro Exodus
2019
Apex Legends
2019
Just Cause 4
2018
Darksiders III
2018
Battlefield V
2018
Farming Simulator 19
2018
Hitman 2
2018


Forza Horizon 4
2018
FIFA 19
2018

Strange Brigade
2018
F1 2018
2018
Monster Hunter World
2018
The Crew 2
2018
Far Cry 5
2018
X-Plane 11.11
2018


Fortnite
2018
Call of Duty WWII
2017

Destiny 2
2017
Dirt 4
2017Rocket League
2017For Honor
2017Watch Dogs 2
2016
Dishonored 2
2016
Battlefield 1
2016
Overwatch
2016
Doom
2016
The Division
2016
Far Cry Primal
2016

Rainbow Six Siege
2015Dota 2 Reborn
2015
The Witcher 3
2015
GTA V
2015
Battlefield 4
2013BioShock Infinite
2013| low | med. | high | ultra | QHD | 4K | |
|---|---|---|---|---|---|---|
| 007 First Light | 51.2 | 46.8 | 39.8 | 38.2 | 5.08 | |
| Forza Horizon 6 | 117 | 69 | 34 | 13 | ||
| Pragmata | 90.9 | 67.2 | 52.1 | 37.8 | ||
| Death Stranding 2 | 53.4 | 47.1 | 43 | 34 | 26.8 | 16.4 |
| Crimson Desert | 80.9 | 47 | 43.8 | 37 | 28.7 | 17 |
| Resident Evil Requiem | 89.8 | 63.2 | 58.5 | 26.6 | 12.7 | |
| Call of Duty Black Ops 7 | 98 | 86 | 65 | 23 | ||
| Anno 117: Pax Romana | 79.4 | 58.6 | 42.9 | 21.2 | 14.9 | |
| ARC Raiders | 146.7 | 87.1 | 70.1 | 37.9 | 27.8 | |
| The Outer Worlds 2 | 45 | 39.1 | 33.2 | 21.8 | ||
| Battlefield 6 | 93.4 | 86.3 | 70.4 | 33.9 | 26.8 | |
| Borderlands 4 | 52.6 | 42.4 | 34 | 19.7 | ||
| F1 25 | 225 | 177.7 | 133.5 | |||
| Doom: The Dark Ages | 53.9 | 45.7 | 41.9 | 39.5 | 26 | |
| The Elder Scrolls IV Oblivion Remastered | 91.1 | 61.1 | 40.5 | 19.7 | ||
| Assassin's Creed Shadows | 29 | 25 | 20 | 13 | ||
| Civilization 7 | 281 | 189.1 | 113.4 | 71.6 | 32.9 | |
| Monster Hunter Wilds | 51.9 | 43.2 | 33.2 | 25.2 | ||
| Kingdom Come Deliverance 2 | 104.9 | 79.2 | 65.6 | 46.1 | 32.6 | 17.7 |
| Stalker 2 | 53.2 | 47.1 | 40.1 | 33.7 | 24.5 | |
| Call of Duty Black Ops 6 | 70 | 66 | 41 | 40 | 27 | |
| Until Dawn | 117.1 | 78 | 53.9 | 39.6 | 28.8 | 15.9 |
| God of War Ragnarök | 100.2 | 84.1 | 73.4 | 67.9 | 51.3 | 28.9 |
| Final Fantasy XVI | 58.9 | 58.3 | 48.3 | 44.3 | 30.7 | |
| Space Marine 2 | 78.1 | 65.4 | 62 | 56.7 | 39.5 | 21.1 |
| Star Wars Outlaws | 37.6 | 34.4 | 30.3 | 24.4 | 16.6 | |
| Black Myth: Wukong | 64 | 48 | 37 | 19 | 14 | 7 |
| Once Human | 171.7 | 119.5 | 98.6 | 86.6 | 55.9 | 28 |
| The First Descendant | 140.8 | 85.2 | 68.4 | 56.1 | 36.1 | 19.4 |
| F1 24 | 240 | 201 | 148.3 | 45.5 | 28.8 | 13.9 |
| Senua's Saga Hellblade 2 | 50.7 | 40.7 | 30.3 | 20.7 | 10 | |
| Ghost of Tsushima | 87 | 69.7 | 64.2 | 52.2 | 39.5 | 22.5 |
| Horizon Forbidden West | 93.1 | 82.5 | 56.6 | 55.2 | 41.4 | 24.3 |
| Alone in the Dark | 223 | 178.9 | 149.9 | 84.7 | 41.6 | 12.2 |
| Dragon's Dogma 2 | 61.5 | 55.8 | 42 | 25.8 | ||
| Last Epoch | 241 | 186.7 | 162.2 | 131.1 | 85.9 | 42.5 |
| Skull & Bones | 103 | 90 | 73 | 56 | 43 | 26 |
| Helldivers 2 | 124.5 | 92.5 | 79.5 | 77.8 | 54.1 | 26.6 |
| Enshrouded | 67.3 | 57.8 | 48.7 | 40.8 | 31.5 | 19 |
| Palworld | 124.7 | 105 | 82 | 75.1 | 51.5 | 25.9 |
| Prince of Persia The Lost Crown | 359 | 359 | 359 | 313 | 155.2 | |
| Ready or Not | 204 | 182 | 159.6 | 107.8 | 61.5 | 26.2 |
| The Finals | 220 | 158.3 | 139.7 | 106.9 | 65.4 | 30.1 |
| Avatar Frontiers of Pandora | 53 | 49 | 43 | 33 | 22 | 11 |
| Call of Duty Modern Warfare 3 2023 | 95 | 87 | 65 | 61 | 43 | 25 |
| EA Sports WRC | 122.3 | 89.6 | 81.4 | 73 | 53.6 | 29.7 |
| Alan Wake 2 | 55.6 | 49.2 | 47 | 29.3 | 14.8 | |
| Lords of the Fallen | 73.9 | 62.3 | 44.9 | 30.7 | 20.6 | 10.4 |
| Total War Pharaoh | 352 | 230.7 | 132.3 | 103.3 | 70.5 | 35.6 |
| Assassin's Creed Mirage | 102 | 94 | 89 | 71 | 54 | 32 |
| EA Sports FC 24 | 217 | 199.1 | 167.7 | 146.9 | 111.5 | 67.4 |
| Counter-Strike 2 | 320 | 285 | 202 | 148.8 | 99.2 | 46.2 |
| Cyberpunk 2077 | 90.7 | 73.2 | 64.1 | 59.2 | 38.9 | 19.3 |
| Baldur's Gate 3 | 159.6 | 103 | 84.7 | 70.7 | 48.5 | 25.7 |
| Lies of P | 153.5 | 137.6 | 118.7 | 105 | 69.2 | 34.9 |
| Starfield | 54.9 | 48.1 | 39.9 | 35.7 | 29 | 18.6 |
| Armored Core 6 | 119.5 | 115.7 | 107.3 | 88.6 | 65.6 | 37.9 |
| Immortals of Aveum | 49.6 | 41.7 | 32 | 21.4 | 12 | |
| Atlas Fallen | 122 | 114.4 | 105 | 89.3 | 63.8 | 33.8 |
| Ratchet & Clank Rift Apart | 78.4 | 68.6 | 55.7 | 49.2 | 39.9 | 25.6 |
| F1 23 | 269 | 237 | 162.2 | 46 | 28.9 | 13.7 |
| Diablo 4 | 231 | 196.1 | 172.9 | 141.6 | 94 | 47 |
| Star Wars Jedi Survivor | 72 | 62.2 | 57.1 | 54.2 | 33.7 | 16.8 |
| Dead Island 2 | 226 | 191.6 | 138 | 101.2 | 68.7 | 33.7 |
| The Last of Us | 86.8 | 70.1 | 61.6 | 45.2 | 29.1 | 12.7 |
| Resident Evil 4 Remake | 117.6 | 94.5 | 82.2 | |||
| Company of Heroes 3 | 154.2 | 131.7 | 100.7 | 101.4 | 73.5 | 41.1 |
| Sons of the Forest | 94.5 | 78.4 | 74.9 | 72.7 | 54.5 | 32.3 |
| Atomic Heart | 168.3 | 124.3 | 72.7 | 58.1 | 43.6 | 25.6 |
| Returnal | 93 | 89 | 79 | 68 | 49 | 28 |
| Hogwarts Legacy | 124.5 | 91.5 | 68.8 | 58.1 | 40.7 | 21.6 |
| Dead Space Remake | 79.4 | 75.3 | 66 | 64.8 | 42.6 | 22 |
| The Witcher 3 v4 | 191.8 | 153.3 | 125.8 | 100.2 | 71.3 | 40.3 |
| High On Life | 221 | 137.7 | 105.1 | 86.2 | 51.2 | 19.4 |
| The Callisto Protocol | 134.8 | 92.2 | 58.7 | 57.7 | 42.9 | 25.1 |
| Need for Speed Unbound | 138.1 | 121.4 | 99.3 | 83.9 | 59.9 | 32.4 |
| Spider-Man Miles Morales | 115.8 | 108.1 | 101.1 | 97.8 | 67.8 | 35.1 |
| Call of Duty Modern Warfare 2 2022 | 112 | 95 | 71 | 68 | 48 | 29 |
| Uncharted Legacy of Thieves Collection | 75.7 | 72.6 | 69.7 | 65.3 | 50.5 | 21.8 |
| A Plague Tale Requiem | 97.9 | 74.2 | 54.8 | 41.6 | 29.2 | 16.4 |
| FIFA 23 | 266 | 238 | 165.9 | 161 | 117.9 | 71.4 |
| The Quarry | 136 | 104 | 83 | 64 | 43 | 20 |
| F1 22 | 251 | 225 | 165 | 49 | 31 | 15 |
| Vampire Bloodhunt | 307 | 169.3 | 155.7 | 146.9 | 99.9 | 50.9 |
| Ghostwire Tokyo | 132 | 125 | 124 | 123 | 78 | 38 |
| Tiny Tina's Wonderlands | 159 | 129 | 89 | 71 | 49 | 26 |
| Cyberpunk 2077 1.6 | 88 | 79 | 71 | 62 | 40 | 19 |
| Elex 2 | 87.3 | 83.3 | 74.7 | 67.9 | 49.7 | 28 |
| GRID Legends | 233 | 180 | 148 | 109 | 86 | 54 |
| Elden Ring | 59.9 | 59.9 | 59.7 | 59.9 | 59.8 | 56.9 |
| Dying Light 2 | 109 | 64.4 | 57 | 40 | 21 | |
| Rainbow Six Extraction | 171 | 148 | 146 | 119 | 78 | 34 |
| God of War | 119 | 101 | 82 | 57 | 46 | 31 |
| Halo Infinite | 112 | 88.2 | 86 | 66 | 52 | |
| Farming Simulator 22 | 277 | 222 | 171 | 147 | 112 | 68.3 |
| Battlefield 2042 | 102 | 112 | 94.7 | 80.9 | 61.3 | 36.5 |
| Forza Horizon 5 | 225 | 124 | 108 | 66 | 55 | 38 |
| Call of Duty Vanguard | 102 | 109 | 90.3 | 82 | 59.2 | 33.3 |
| Riders Republic | 190 | 123 | 102 | 92 | 66 | 36 |
| Guardians of the Galaxy | 137 | 131 | 129 | 126 | 86 | 46 |
| Back 4 Blood | 190 | 173 | 156 | 103 | 52.9 | |
| Far Cry 6 | 188 | 125 | 108 | 93 | 67 | 18 |
| Alan Wake Remastered | 93.7 | 90.3 | 89.7 | 85.1 | ||
| New World | 173 | 110 | 102 | 89.8 | 60.1 | 31.4 |
| Deathloop | 119 | 102 | 86.9 | 69 | 46.8 | 27.4 |
| F1 2021 | 434 | 247 | 202 | 100 | 72 | 40 |
| Monster Hunter Stories 2 | 144 | 144 | 144 | 143 | 108 | |
| Days Gone | 195 | 132 | 117 | 87.1 | 63.7 | 36.2 |
| Mass Effect Legendary Edition | 104 | 101 | 99.6 | 76.7 | ||
| Resident Evil Village | 322 | 163 | 148 | 129 | 85.1 | 42.6 |
| Outriders | 118 | 142 | 114 | 97 | 67 | 36 |
| Hitman 3 | 247 | 135 | 128 | 122 | 85 | 46 |
| Cyberpunk 2077 1.0 | 110 | 74.7 | 62.6 | 53 | 36 | 17 |
| Immortals Fenyx Rising | 124 | 87 | 75 | 57 | 49 | 39 |
| Yakuza Like a Dragon | 99 | 94.1 | 97.7 | 84.3 | 58.1 | 30.4 |
| Call of Duty Black Ops Cold War | 181 | 118 | 91.3 | 73 | 53.2 | 17.3 |
| Assassin´s Creed Valhalla | 112 | 81 | 68 | 61 | 47 | 29 |
| Dirt 5 | 148 | 88.9 | 70.8 | 60 | 50.4 | 34.3 |
| Watch Dogs Legion | 118 | 104 | 90.4 | 59.1 | 43.7 | 24.7 |
| FIFA 21 | 228 | 229 | 216 | 215 | 212 | 181 |
| Star Wars Squadrons | 378 | 282 | 241 | 229 | 150 | 85 |
| Mafia Definitive Edition | 147 | 105 | 97 | 67 | 35 | |
| Serious Sam 4 | 144.5 | 104.2 | 89.4 | 82 | 74 | 43 |
| Crysis Remastered | 246 | 143 | 74.4 | 60.7 | 46 | 24.6 |
| Flight Simulator 2020 | 75.2 | 67 | 54 | 39 | 30 | 18 |
| Horizon Zero Dawn | 149 | 102 | 85 | 69 | 54 | 31 |
| Death Stranding | 190 | 127 | 118 | 114 | 80.6 | 45.1 |
| F1 2020 | 362 | 228 | 188 | 133 | 99 | 56 |
| Valorant | 345 | 298 | 293 | 268 | 214 | |
| Gears Tactics | 323.7 | 199.3 | 134.5 | 92 | 63.7 | 34 |
| Doom Eternal | 235 | 202 | 181 | 180 | 114 | 58.7 |
| Hunt Showdown | 252 | 137 | 105 | 71 | 33.1 | |
| Escape from Tarkov | 121 | 120 | 117 | 98 | 77.7 | 37.8 |
| Fall Guys | 59.6 | 59.6 | 59.6 | |||
| Red Dead Redemption 2 | 145 | 106 | 72 | 46.5 | 37.6 | 24.1 |
| Star Wars Jedi Fallen Order | 122 | 121 | 114 | 82 | 41.6 | |
| Need for Speed Heat | 108 | 103 | 95 | 87 | 70 | 41 |
| Call of Duty Modern Warfare 2019 | 187 | 141 | 125 | 109 | 80 | 46 |
| GRID 2019 | 170 | 165 | 133 | 88 | 70 | 44 |
| Ghost Recon Breakpoint | 147 | 102 | 95 | 71 | 53 | 30 |
| FIFA 20 | 279 | 264 | 260 | 257 | 249 | 184 |
| Borderlands 3 | 192 | 130 | 92 | 71 | 50 | 27 |
| Control | 239 | 108 | 80 | 52 | 25 | |
| F1 2019 | 213 | 191 | 160 | 122 | 96 | 58 |
| Total War: Three Kingdoms | 239.8 | 138.5 | 98.2 | 69 | 43.9 | 21.5 |
| Rage 2 | 237 | 131 | 111 | 108 | 71 | 35 |
| Anno 1800 | 114 | 109 | 85 | 38 | 35 | 27 |
| The Division 2 | 190 | 142 | 115 | 85 | 59 | 32 |
| Dirt Rally 2.0 | 242 | 194 | 175 | 109 | 83 | 49 |
| Anthem | 111 | 107 | 102 | 99 | 76 | 42 |
| Far Cry New Dawn | 159 | 124 | 117 | 106 | 86 | 49 |
| Metro Exodus | 183 | 105 | 78 | 62 | 49 | 31 |
| Apex Legends | 144 | 144 | 144 | 144 | 114 | 64 |
| Just Cause 4 | 193 | 144 | 110 | 103 | 74 | 41 |
| Darksiders III | 203 | 133 | 120 | 114 | 83 | 42 |
| Battlefield V | 166 | 128 | 113 | 105 | 83 | 52 |
| Farming Simulator 19 | 218 | 164 | 142 | 131 | 115 | 66 |
| Hitman 2 | 93 | 90 | 82 | 82 | 74 | 42 |
| Call of Duty Black Ops 4 | 253 | 163 | 156 | 145 | 96 | 47 |
| Assassin´s Creed Odyssey | 120 | 101 | 85 | 61 | 52 | 35 |
| Forza Horizon 4 | 179 | 152 | 147 | 120 | 98 | 67 |
| FIFA 19 | 305 | 299 | 271 | 268 | 259 | 184 |
| Shadow of the Tomb Raider | 212 | 125 | 115 | 105 | 72 | 38 |
| Strange Brigade | 486 | 226 | 180 | 152 | 112 | 63 |
| F1 2018 | 247 | 205 | 167 | 123 | 98 | 61 |
| Monster Hunter World | 131 | 119 | 115 | 90 | 68 | 35 |
| The Crew 2 | 60 | 60 | 60 | 60 | 60 | 38 |
| Far Cry 5 | 185 | 132 | 124 | 116 | 87 | 46 |
| X-Plane 11.11 | 170 | 152 | 120 | 102 | ||
| Kingdom Come: Deliverance | 146 | 130 | 108 | 74 | 57 | 30 |
| Final Fantasy XV Benchmark | 197 | 117 | 86 | 68 | 36 | |
| Fortnite | 352 | 266 | 175 | 148 | 98 | 48 |
| Call of Duty WWII | 235 | 227 | 149 | 130 | 106 | 67 |
| Assassin´s Creed Origins | 126 | 104 | 98 | 84 | 69 | 44 |
| Destiny 2 | 165 | 164 | 160 | 148 | 104 | 55 |
| Playerunknown's Battlegrounds (PUBG) | 182 | 147 | 143 | 123 | 49 | |
| Dirt 4 | 288 | 227 | 196 | 127 | 75 | |
| Rocket League | 244 | 242 | 240 | 138 | ||
| Ghost Recon Wildlands | 159 | 114 | 106 | 62 | 44 | |
| For Honor | 297 | 182 | 174 | 135 | 58 | |
| Watch Dogs 2 | 147 | 130 | 103 | 74 | 43 | |
| Dishonored 2 | 119 | 119 | 119 | 113 | 61 | |
| Battlefield 1 | 193 | 175 | 157 | 143 | 68 | |
| Deus Ex Mankind Divided | 137 | 128 | 107 | 66 | 41 | |
| Overwatch | 300 | 300 | 298 | 213 | 118 | |
| Doom | 169 | 168 | 160 | 156 | 82 | |
| The Division | 287 | 227 | 124 | 101 | 54 | |
| Far Cry Primal | 118 | 107 | 98 | 91 | 56 | |
| Rise of the Tomb Raider | 286 | 201 | 153 | 127 | 53 | |
| Rainbow Six Siege | 376 | 306 | 262 | 237 | 114 | |
| Dota 2 Reborn | 226 | 201 | 194 | 180 | 118 | |
| The Witcher 3 | 402 | 271 | 164 | 85 | 59 | |
| GTA V | 181 | 177 | 170 | 104 | 86 | 84 |
| Battlefield 4 | 200 | 200 | 200 | 185 | 80 | |
| BioShock Infinite | 353 | 312 | 290 | 178 | ||
| low | med. | high | ultra | QHD | 4K | < 30 fps < 60 fps < 120 fps ≥ 120 fps | 1 15 56 117 | 1 18 78 94 | 1 34 91 67 | 10 41 86 40 | 24 64 72 7 | 61 84 23 6 |
For more games that might be playable and a list of all games and graphics cards visit our Gaming List
