Notebookcheck Logo

High On Life review: Laptop and desktop benchmarks

What it feels like to be high. You don't really want to know what the creators of High on Life were on when developing the game. The title turned out to be one of the funniest and most creative first-person shooters in the past few years. But is the engine just as optimised as the wit on display?
High On Life

Technical review

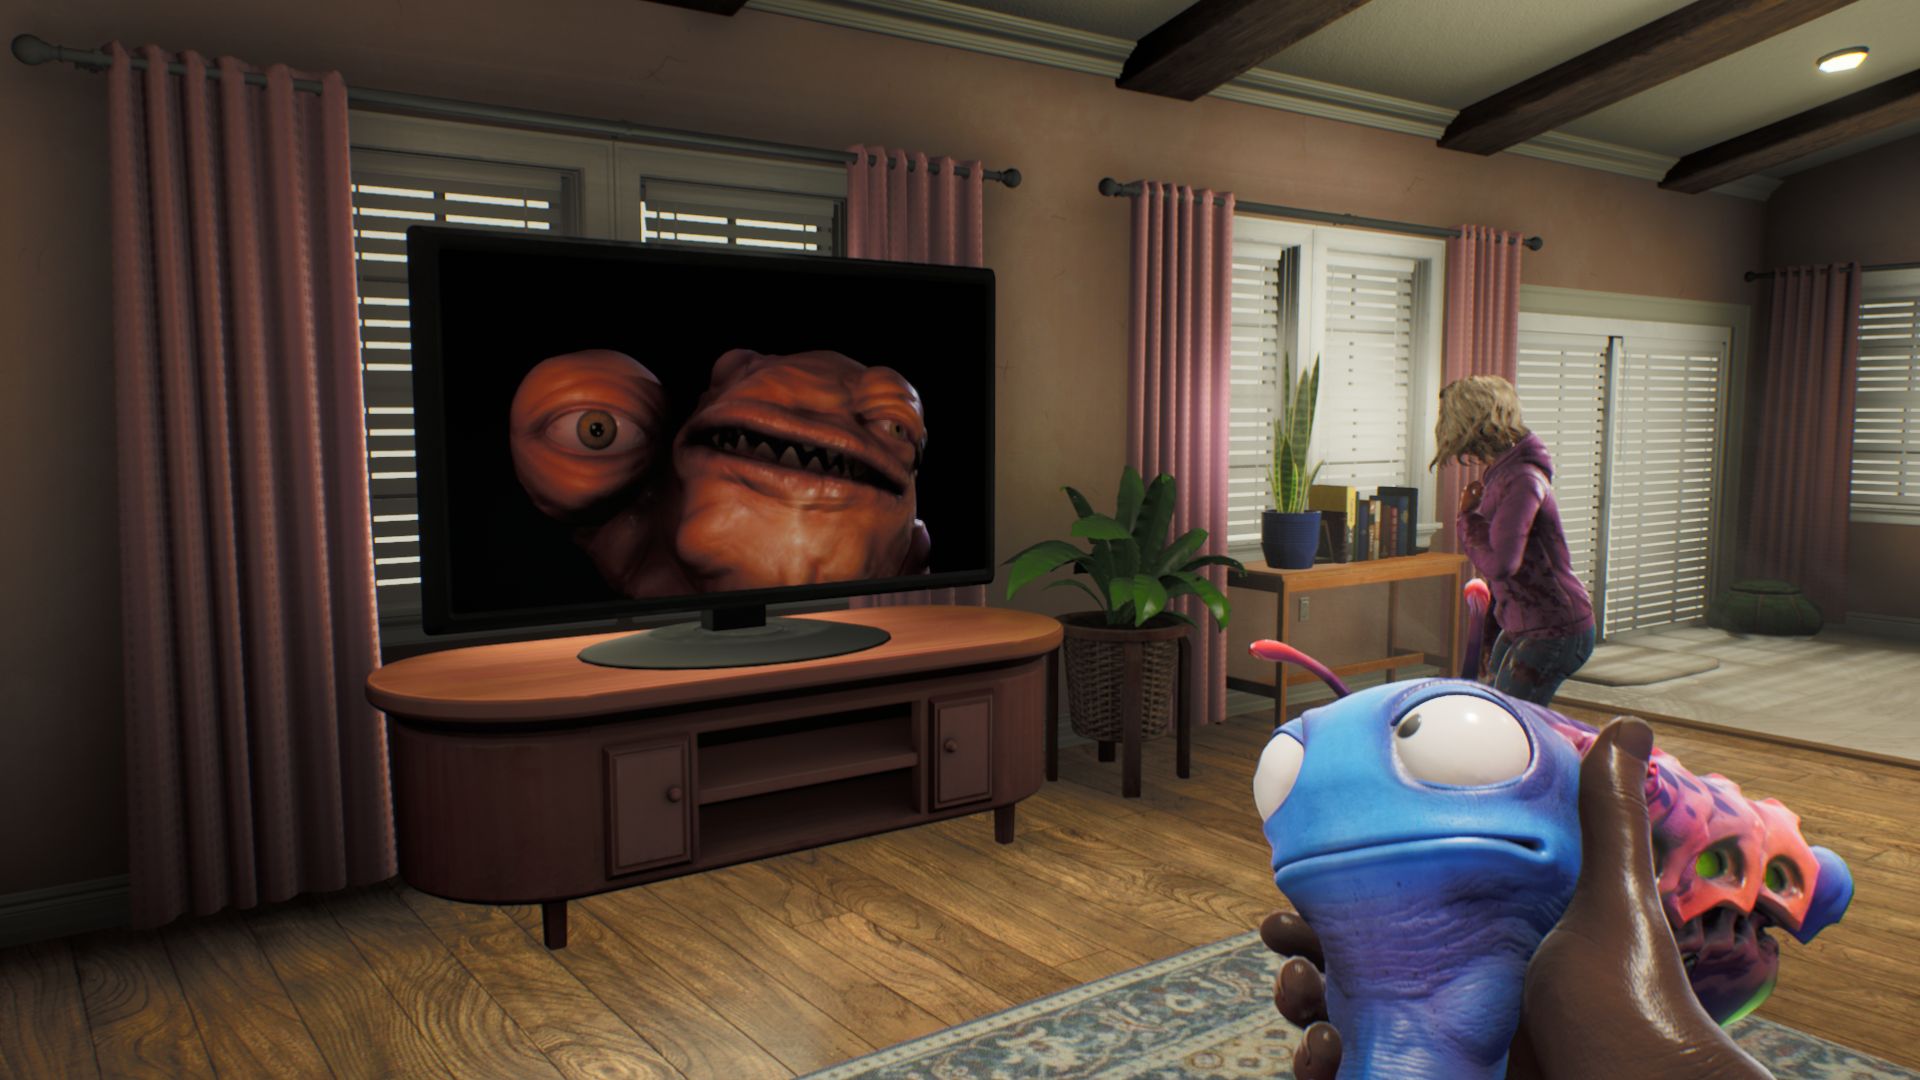
High on Life is made by Squanch Games, a previously lesser-known studio, and is built on the popular and highly successful Unreal Engine 4. You'll find a few weaknesses in its graphics upon a closer look (for example, facial animations are quite crude). That said, the first-person shooter is definitely a good looking game.

High On Life
High On Life
High On Life
High On Life
High On Life
High On Life

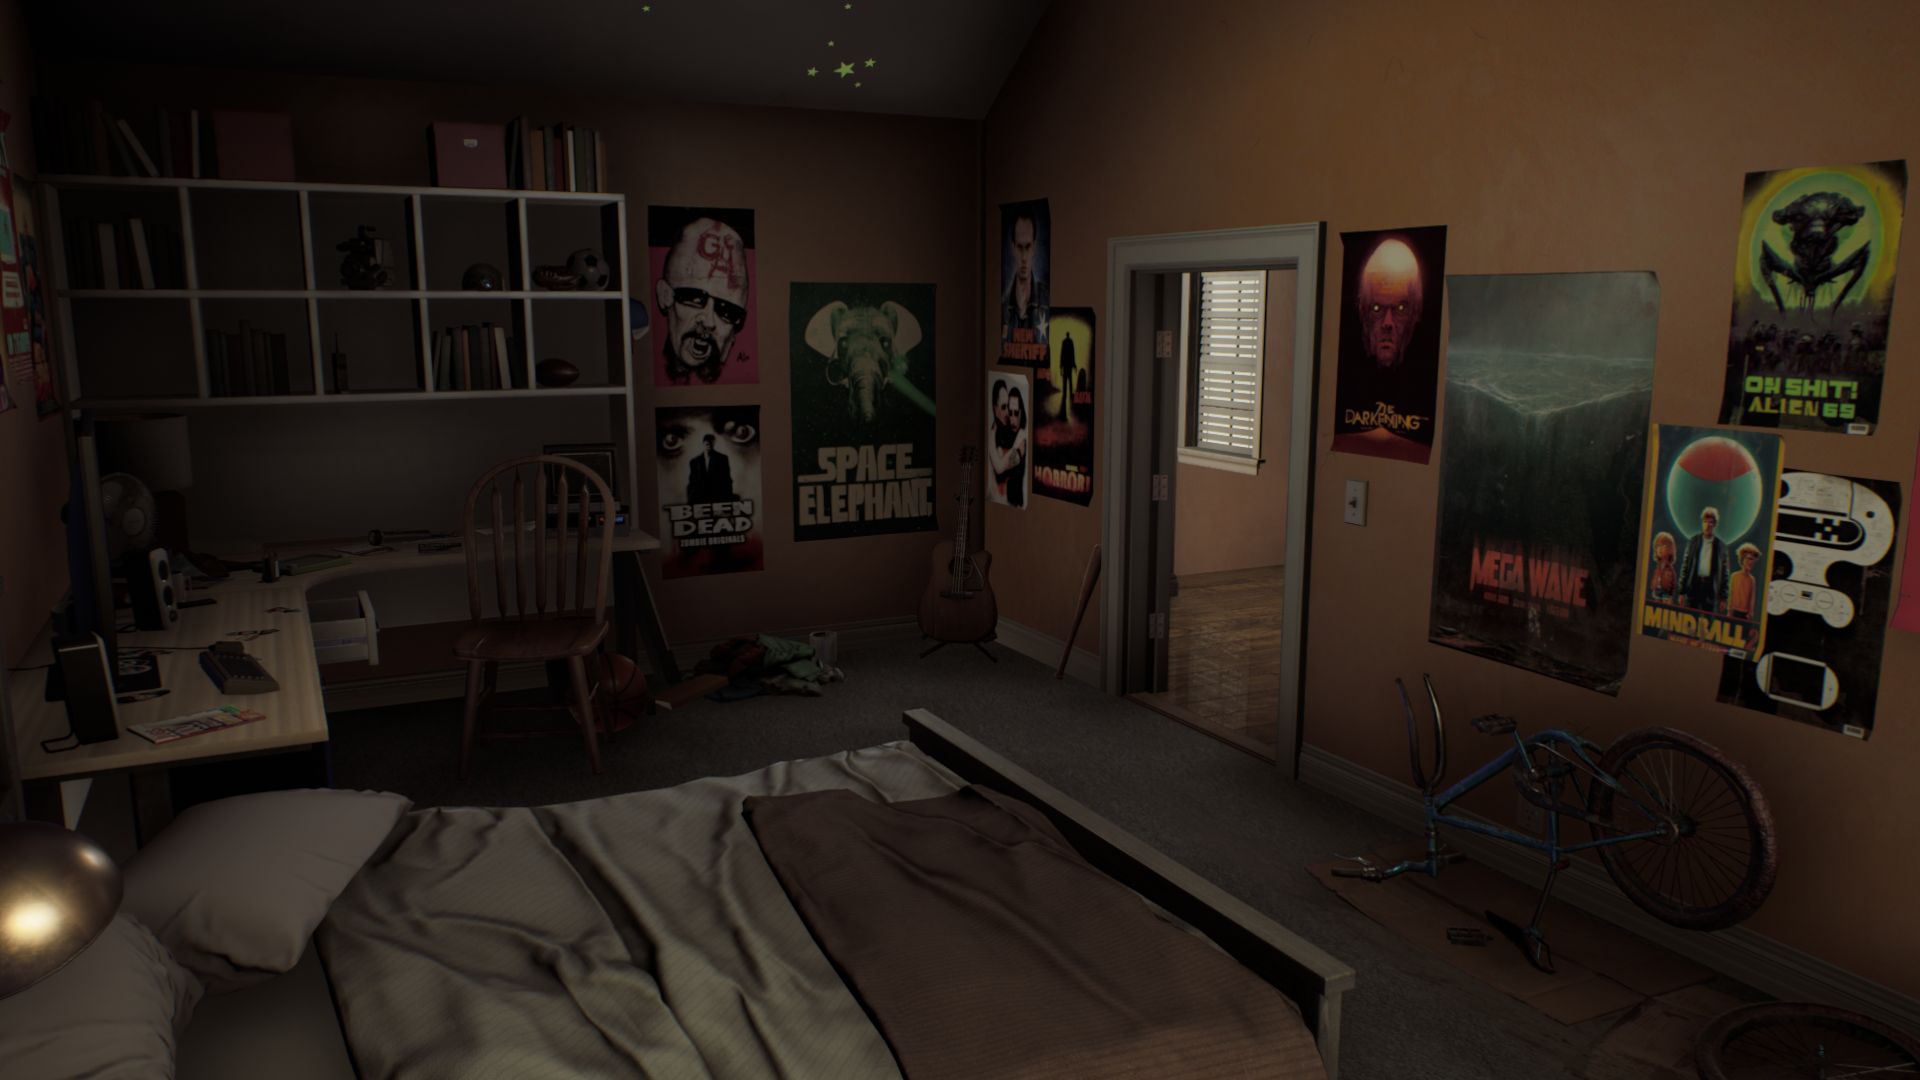
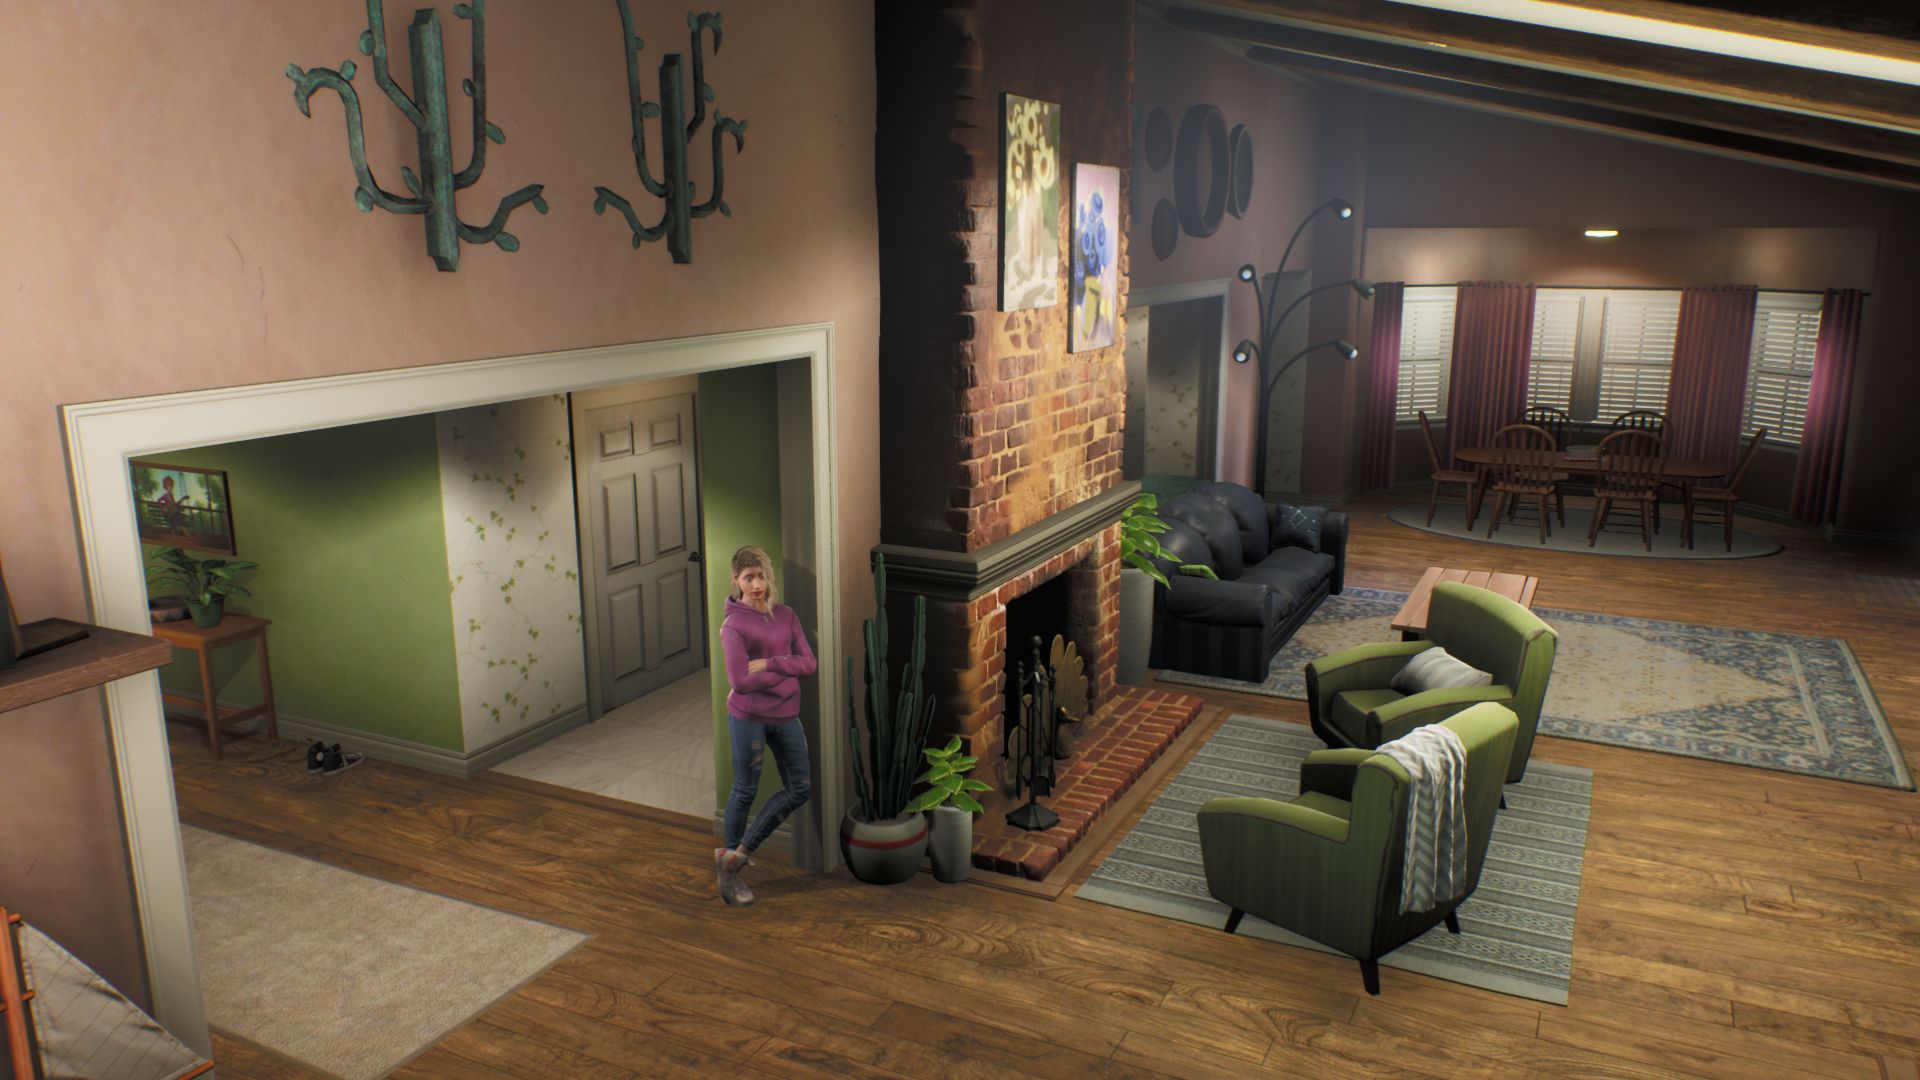
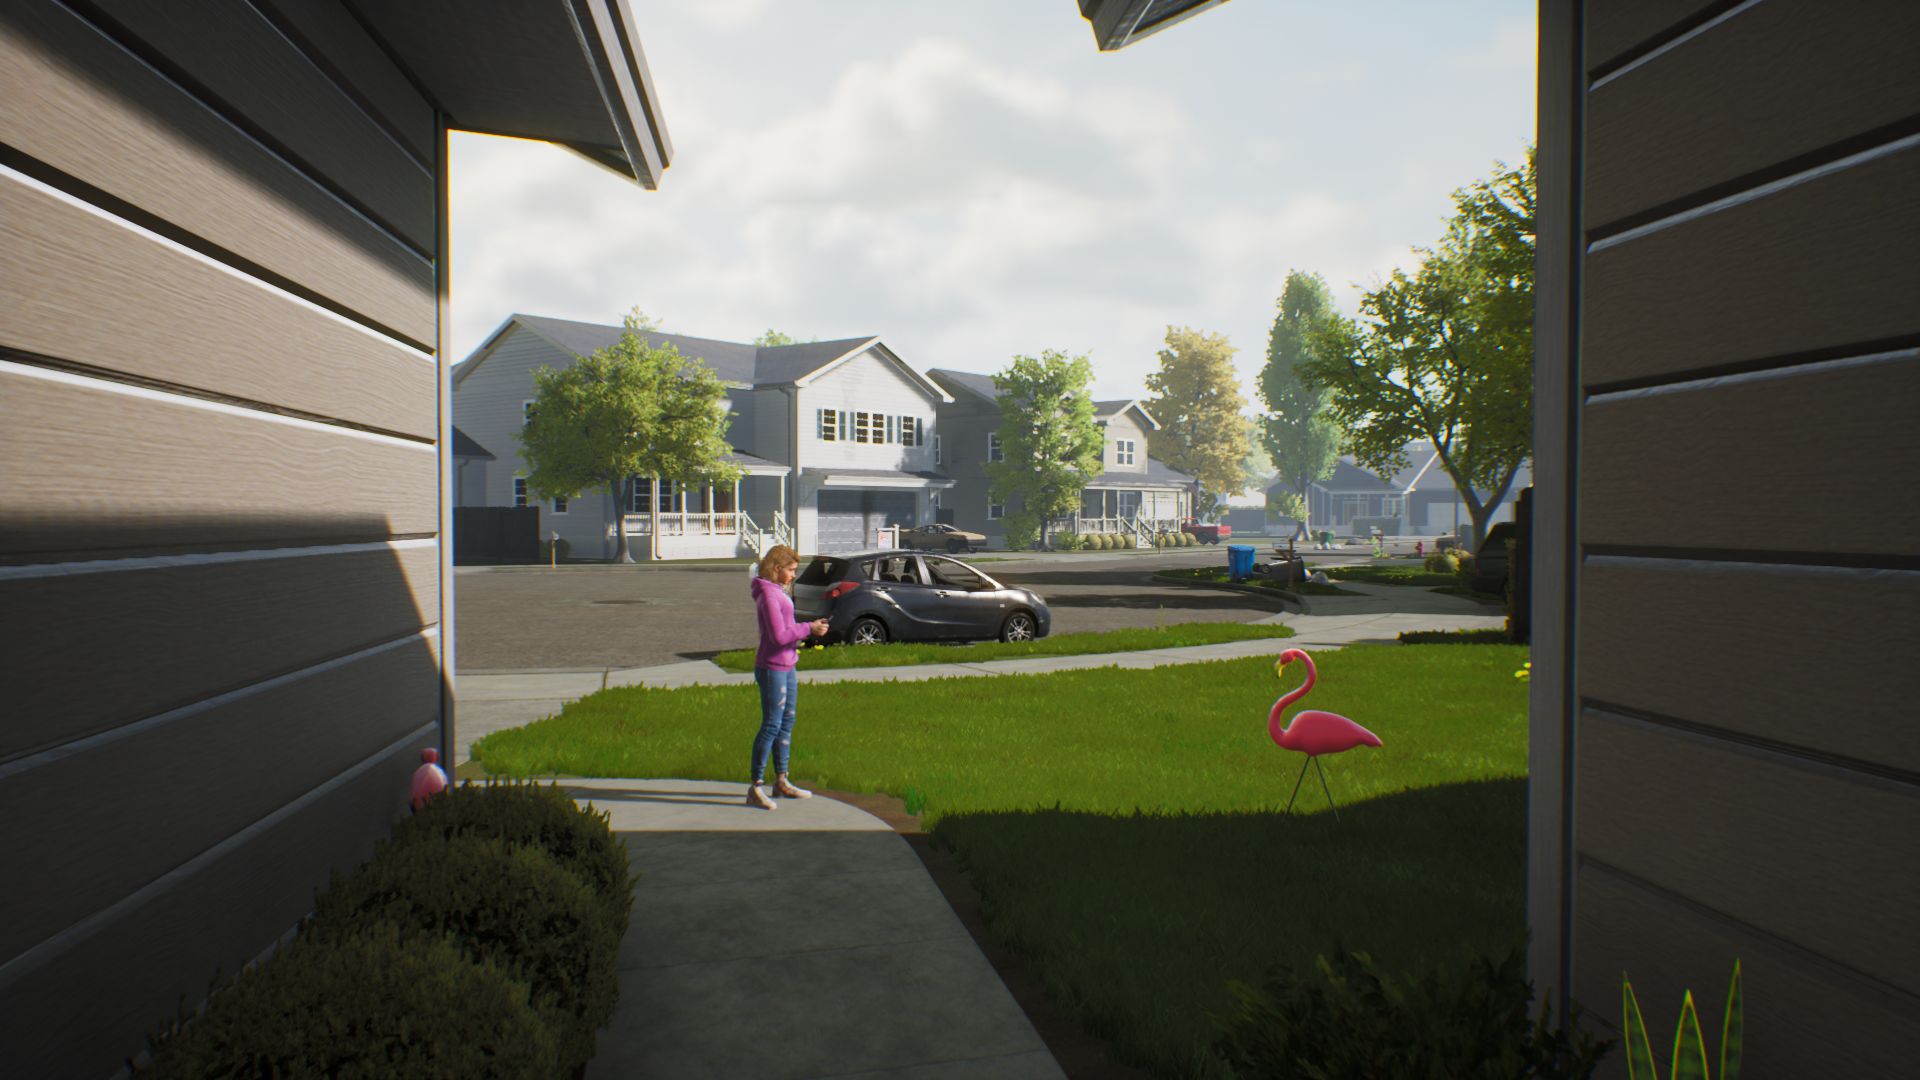
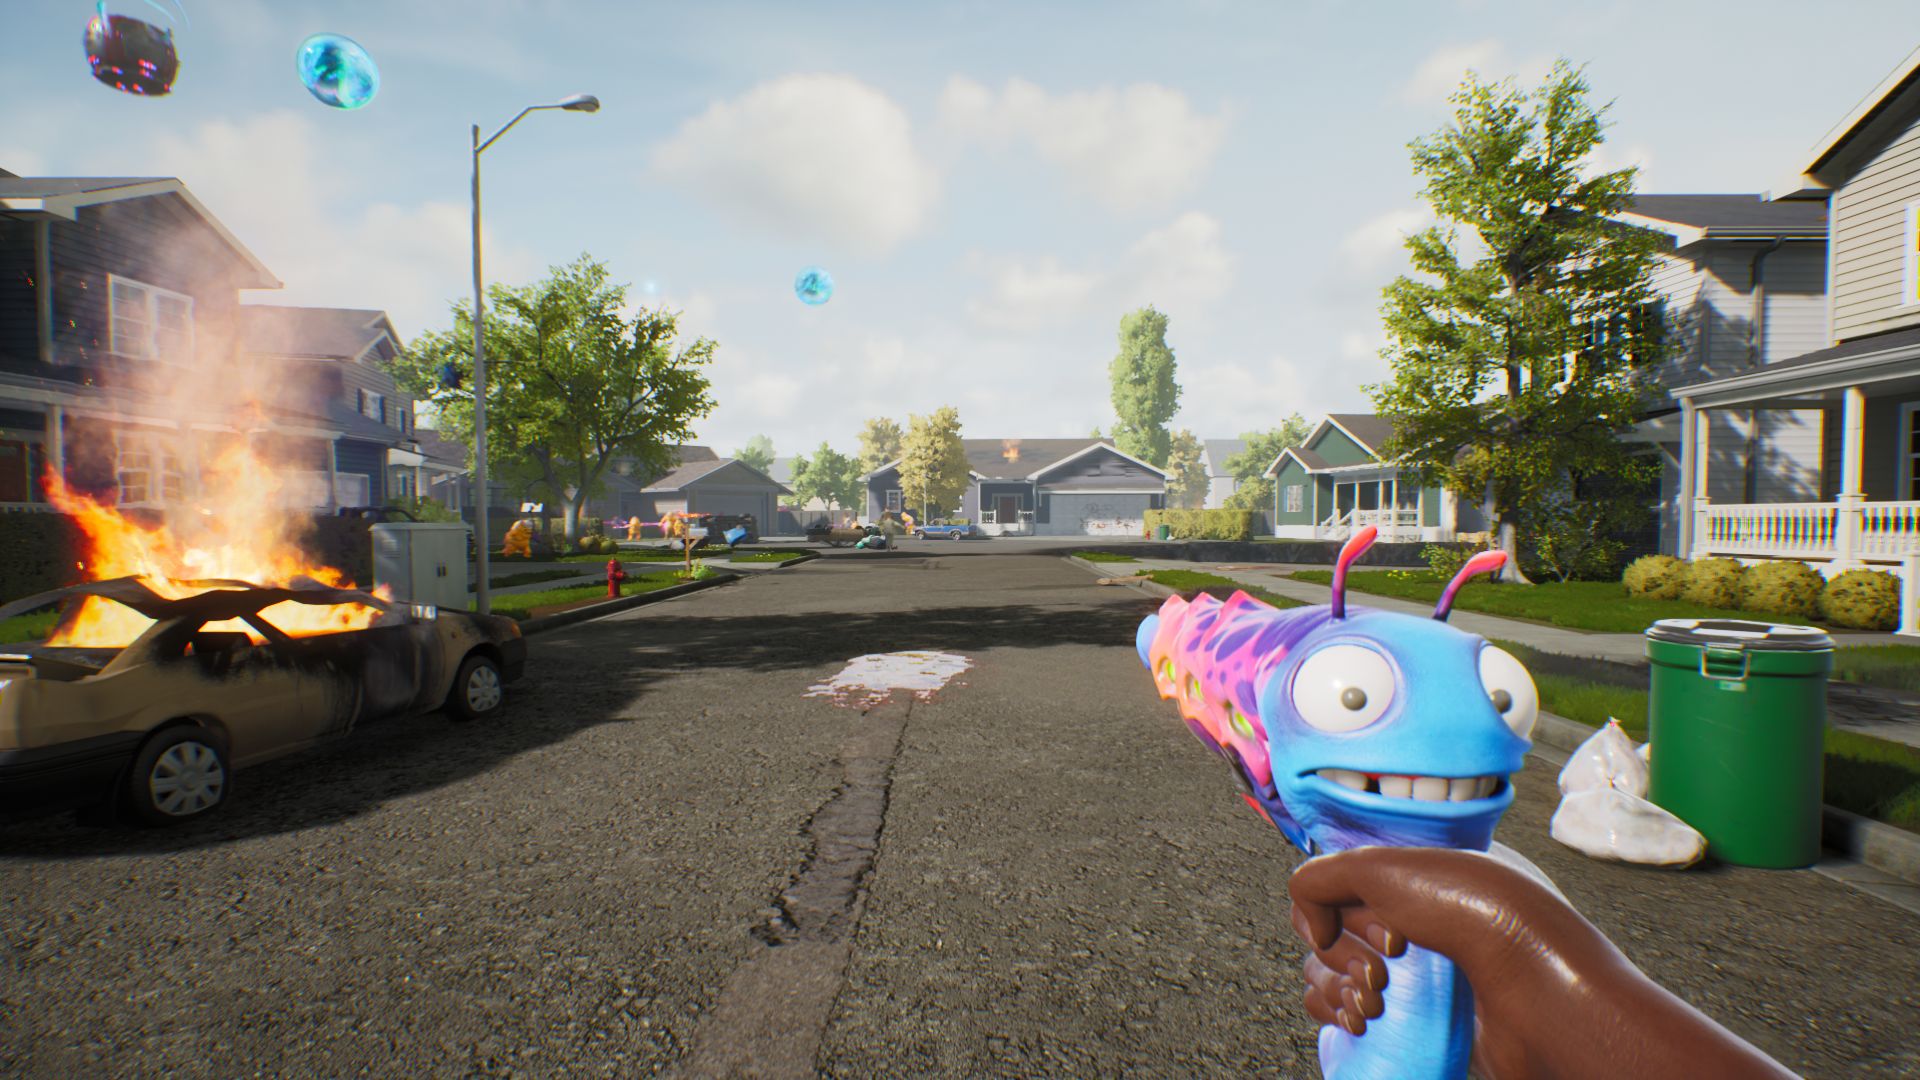
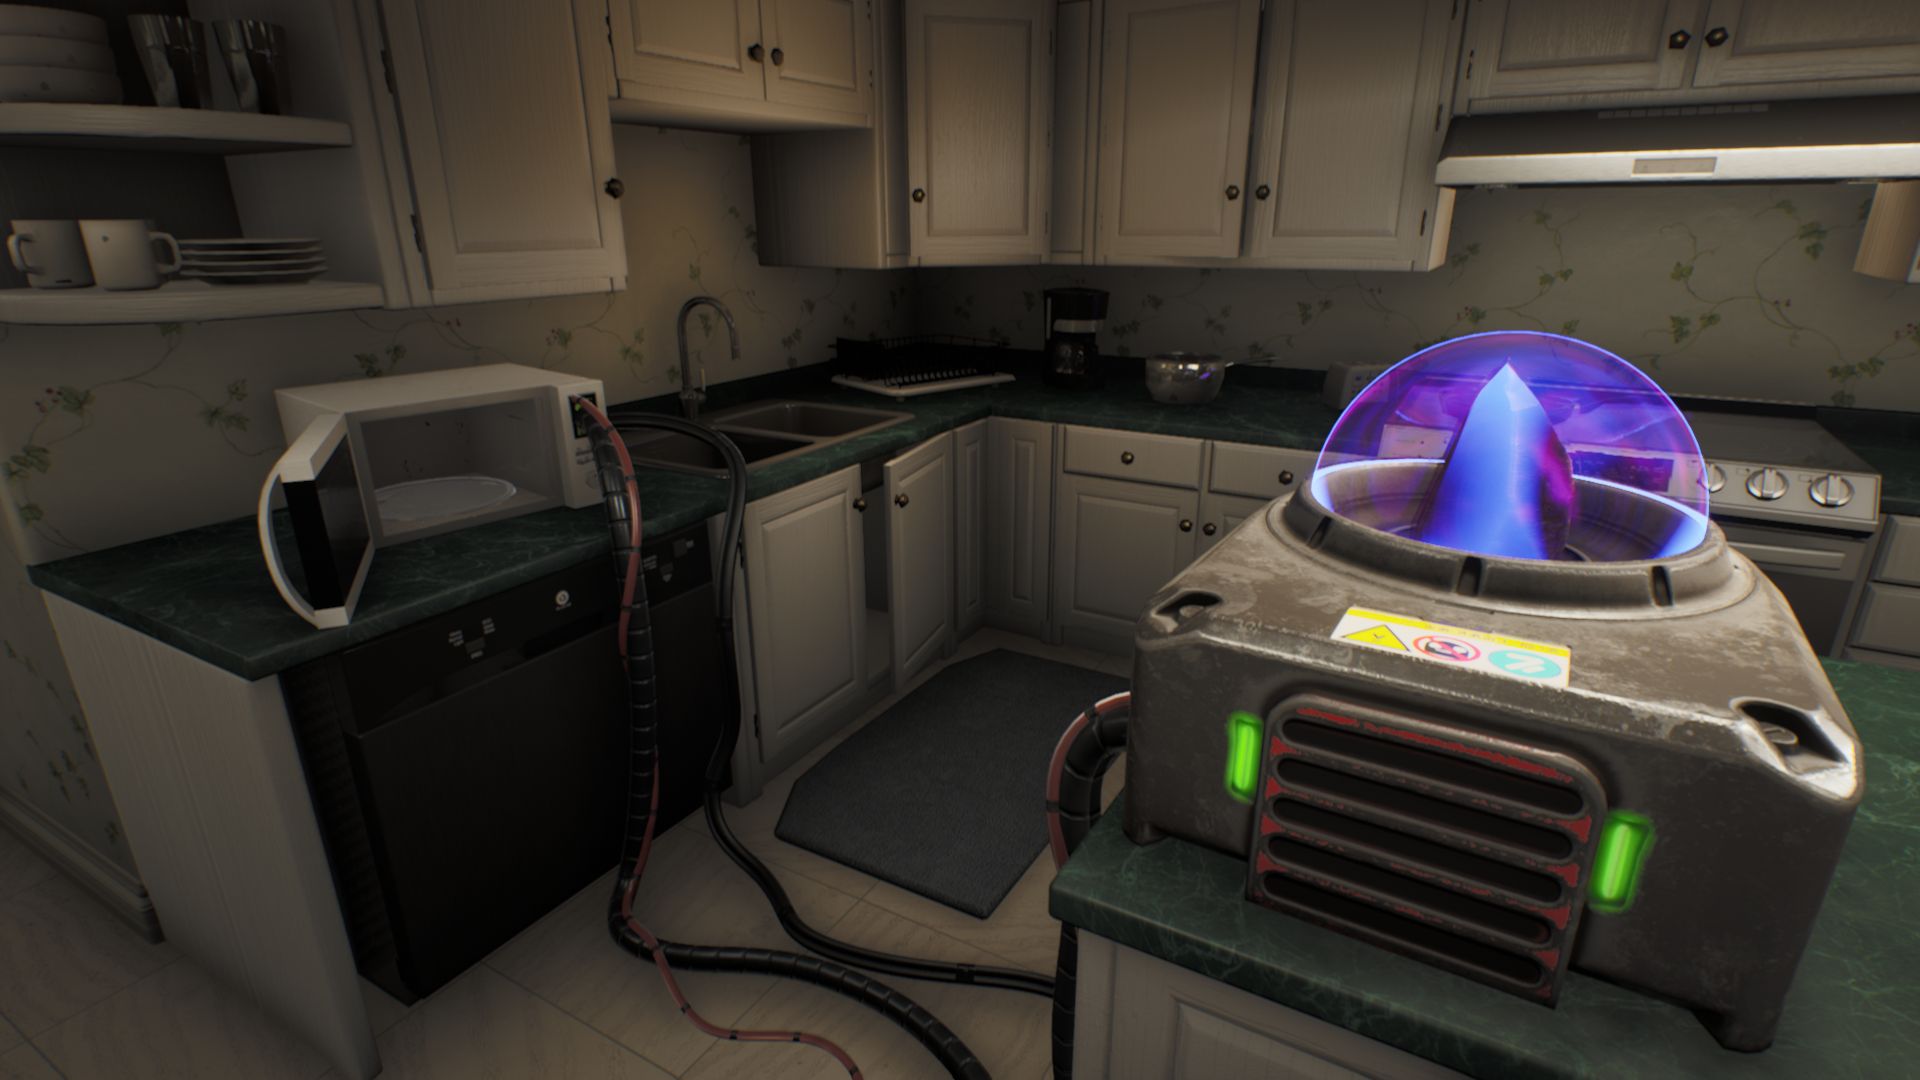
At medium settings and above, High on Life has rather impressive visuals characterised especially by an extremely colourful presentation, high contrast and wacky weapon design. The game also has some very thoughtfully designed areas with nice details (see screenshots). In general, the game stands out with its zany and self-deprecating vibe as well as its laid-back game- and gunplay that you have come to known from games such as the Serious Sam and Borderlands series.

High On Life
High On Life
High On Life
High On Life
High On Life
High On Life

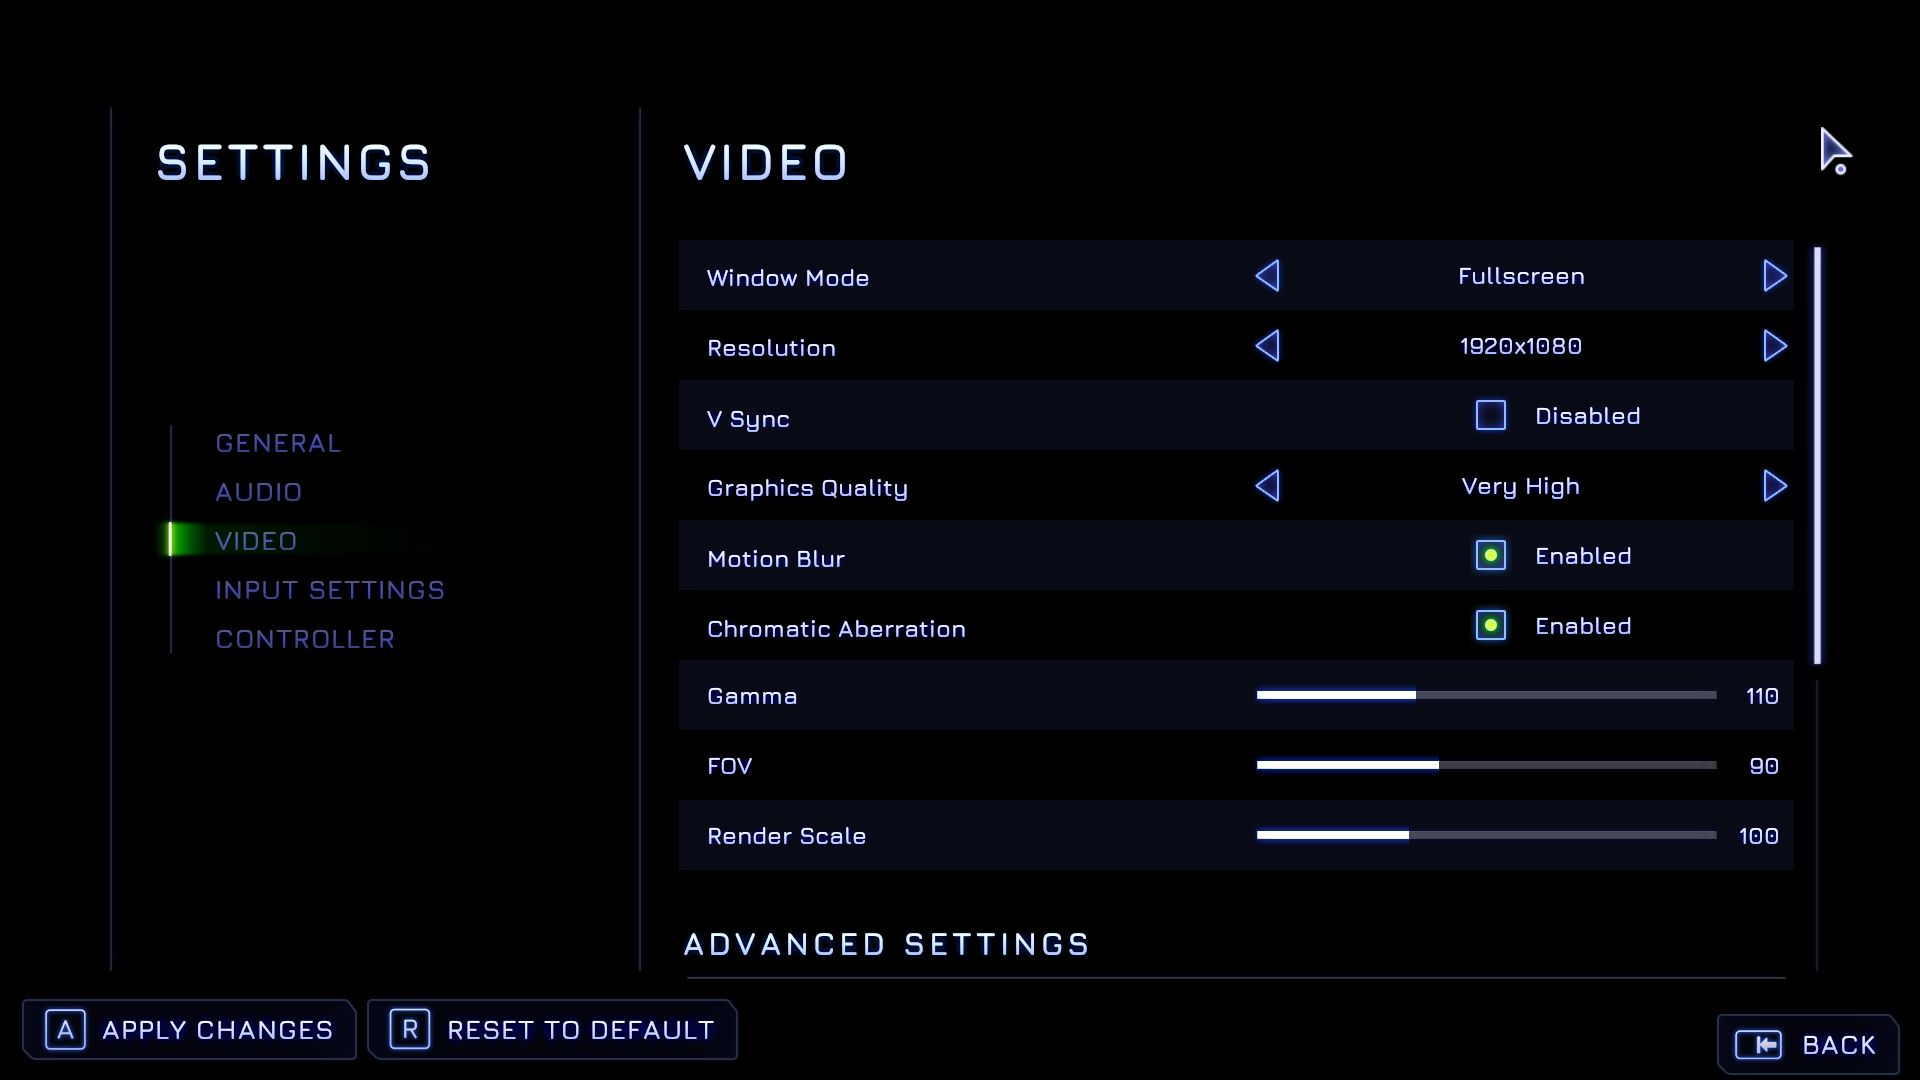
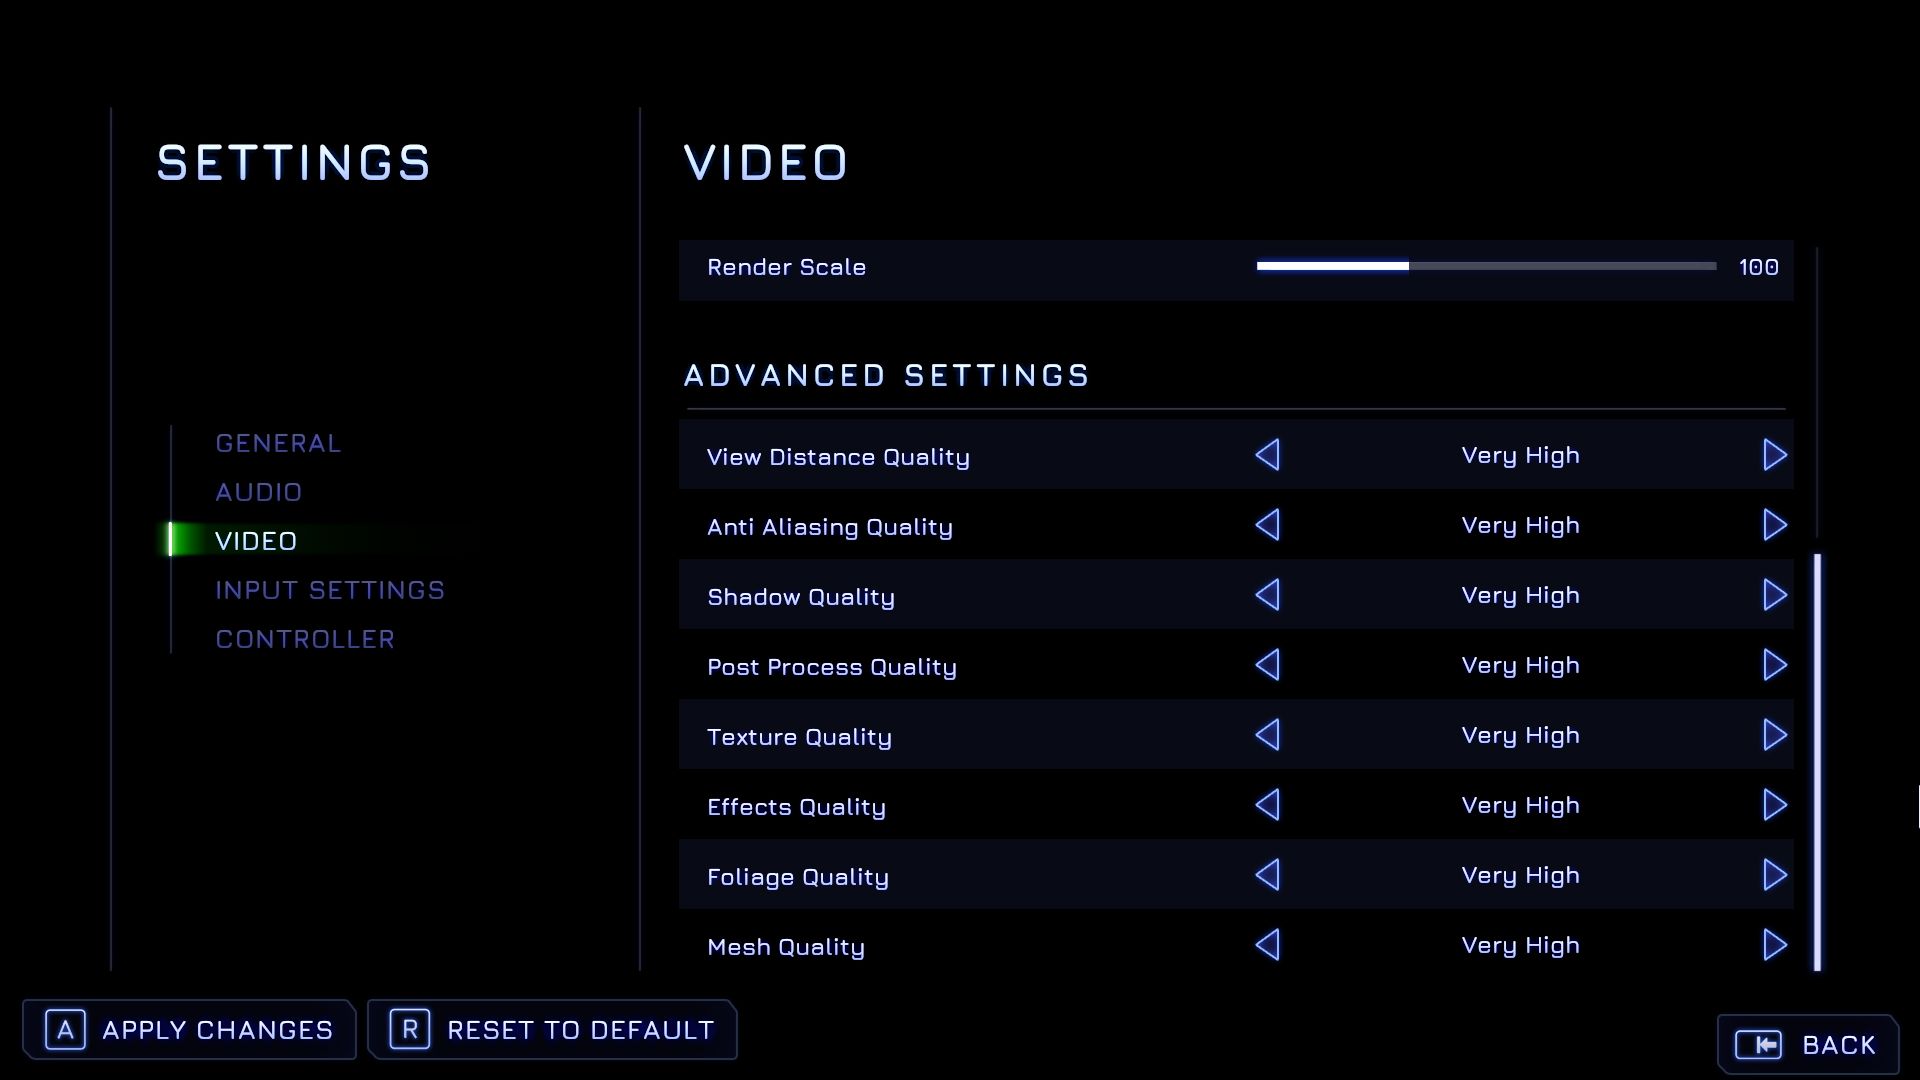
The graphics menu is similarly impressive. Even though many triple-A games provide more options by comparison, the number of settings in High on Life is adequate for a PC game. At the top of the menu, users can change settings like window mode, resolution, gamma, FOV and render scale. There are also toggle switches for VSync, motion blur and chromatic aberration. Below, you'll find the advanced options section with eight quality settings, which can be changed at one go without restarting by adjusting "Graphics Quality".

High On Life
High On Life
High On Life
High On Life
High On Life
High On Life

The game feels reasonably sophisticated from a technical standpoint. When loading, however, the game and its main menu stutter a little on some systems (especially those with Intel and AMD GPUs). Loading times are thankfully nice and short. High on Life takes up around 50 GB of storage space (the Steam version was used for our benchmarks).

High On Life
High On Life

Benchmark

For the benchmarks, we used the stylish alien city where the main character arrives shortly after the introductory section and tutorial. We recorded the game's performance over a predefined route for roughly 30 seconds using CapFrameX. You can take a look at the section in the video below. In our opinion, High on Life is playable if the average frame rate is at least 40 fps. But ideally the game should run at 60 fps or higher.

Results


FHD (1,920 x 1,080)

There are very significant performance differences between the various graphics presets. Whilst Intel iGPUs are at most only good enough to run the game at 1,280 x 720 and the lowest settings, more powerful iGPUs from AMD (e.g. the Radeon 680M) can handle the game at 1,920 x 1,080 and medium settings. A GeForce RTX 3050 Ti or better is required to run the game at high to max settings at Full HD.

High On Life
    1920x1080 Low Preset     1920x1080 Medium Preset     1920x1080 High Preset     1920x1080 Very High Preset
AMD Radeon RX 7900 XTX, i9-12900K
Desktop-PC
369 (21.5min, 112.5P0.1, 216P1) fps ∼66%
298 (75.3min, 105.1P0.1, 157.6P1) fps ∼56%
273 (87.7min, 112.7P0.1, 157.6P1) fps ∼54%
222 (79.7min, 113.5P0.1, 139P1) fps ∼49%
NVIDIA GeForce RTX 3080, i9-12900K
Desktop-PC
348 (86.5min, 165.6P0.1, 235P1) fps ∼62%
275 (89.4min, 128.8P0.1, 168.4P1) fps ∼51%
206 (61.4min, 102.3P0.1, 129.9P1) fps ∼41%
170.9 (56.5min, 88.5P0.1, 108.8P1) fps ∼37%
NVIDIA GeForce RTX 3070, i9-12900K
Desktop-PC
324 (92.8min, 149.8P0.1, 207P1) fps ∼58%
219 (56.8min, 105.7P0.1, 134.9P1) fps ∼41%
171.5 (52.3min, 77.7P0.1, 106.4P1) fps ∼34%
136.2 (61.1min, 66.2P0.1, 88.7P1) fps ∼30%
NVIDIA GeForce RTX 3080 Ti Laptop GPU, i9-12900HX
MSI Titan GT77 12UHS
252 (59.7min, 88.3P0.1, 142.7P1) fps ∼45%
204 (30.2min, 71.1P0.1, 104.9P1) fps ∼38%
154.1 (48.9min, 59P0.1, 84.8P1) fps ∼30%
129.7 (51.5min, 62.5P0.1, 73.8P1) fps ∼28%
AMD Radeon RX 6800M, R9 5900HX
Asus ROG Strix G15
168.5 (23.1min, 50.5P0.1, 73.9P1) fps ∼30%
122.9 (39.8min, 44.1P0.1, 63.2P1) fps ∼23%
108.1 (36.2min, 47.6P0.1, 56.4P1) fps ∼21%
95.3 (19.7min, 42.3P0.1, 53.1P1) fps ∼21%
NVIDIA GeForce RTX 3060 Laptop GPU, i7-12700H
Lenovo Legion 5 Pro
223 (54.2min, 93.3P0.1, 144.4P1) fps ∼40%
156.7 (31min, 72.1P0.1, 98.8P1) fps ∼29%
109.3 (32.8min, 43.3P0.1, 69.2P1) fps ∼22%
86.9 (18.1min, 31P0.1, 57.6P1) fps ∼19%
AMD Radeon RX 6600M, R7 5800H
Lenovo Legion 5
164 (53.7min, 68.6P0.1, 91.2P1) fps ∼29%
120.3 (39.2min, 55.5P0.1, 67.3P1) fps ∼22%
100.8 (43.9min, 47.5P0.1, 57.7P1) fps ∼20%
79.7 (35.5min, 43.3P0.1, 48.4P1) fps ∼17%
AMD Radeon RX 6800S, R9 6900HS
Asus ROG Zephyrus G14
170.1 (24.8min, 65.1P0.1, 118.5P1) fps ∼30%
125 (54.4min, 62.7P0.1, 76.2P1) fps ∼23%
101.6 (44.5min, 48.6P0.1, 61.6P1) fps ∼20%
76.1 (30.1min, 44.6P0.1, 53.2P1) fps ∼17%
AMD Radeon 680M, R9 6900HS
Asus ROG Zephyrus G14
63.1 (32.4min, 33.1P0.1, 36.6P1) fps ∼11%
45 (21.7min, 23.4P0.1, 25.9P1) fps ∼8%
33.8 (18.1min, 18.1P0.1, 19.8P1) fps ∼7%
25.7 (12.2min, 12.7P0.1, 14.8P1) fps ∼6%
Intel Iris Xe Graphics G7 96EUs, i7-1165G7
Zotac ZBOX CI665 Nano
31.8 (13.3min, 14.6P0.1, 18.2P1) fps ∼6%
19.3 (7.45min, 7.54P0.1, 8.74P1) fps ∼4%
18.3 (6.12min, 6.21P0.1, 6.87P1) fps ∼4%
12.8 (4.46min, 4.52P0.1, 6.45P1) fps ∼3%

QHD (2,560 x 1,440)

To play the game at 2,560 x 1,440 and Ultra preset, you should at least have an upper mid-range graphics card, such as a GeForce RTX 3060 or a Radeon RX 6600M.

High On Life
    2560x1440 Very High Preset
AMD Radeon RX 7900 XTX, i9-12900K
Desktop-PC
151.8 (73.4min, 80.2P0.1, 90.7P1) fps ∼38%
NVIDIA GeForce RTX 3080, i9-12900K
Desktop-PC
108.5 (53.5min, 55.3P0.1, 65.9P1) fps ∼27%
NVIDIA GeForce RTX 3070, i9-12900K
Desktop-PC
84.8 (37.8min, 42.7P0.1, 55.8P1) fps ∼21%
NVIDIA GeForce RTX 3080 Ti Laptop GPU, i9-12900HX
MSI Titan GT77 12UHS
82 (35.4min, 41P0.1, 52P1) fps ∼21%
AMD Radeon RX 6800M, R9 5900HX
Asus ROG Strix G15
63.1 (35.2min, 35.7P0.1, 39.5P1) fps ∼16%
NVIDIA GeForce RTX 3060 Laptop GPU, i7-12700H
Lenovo Legion 5 Pro
52.1 (23.5min, 24.5P0.1, 30.2P1) fps ∼13%
AMD Radeon RX 6600M, R7 5800H
Lenovo Legion 5
46.1 (22.7min, 23.3P0.1, 26.8P1) fps ∼12%

UHD (3,840 x 2,160)

Once we get to 3,840 x 2,160, not only does the game become way more graphically demanding, but this increase is also disproportionately large compared with other titles. At this resolution, even high-end desktop CPUs, such as the GeForce RTX 3080, have their work cut out for them.

High On Life
    3840x2160 Very High Preset
AMD Radeon RX 7900 XTX, i9-12900K
Desktop-PC
72.1 (31min, 36P0.1, 42.1P1) fps ∼20%
NVIDIA GeForce RTX 3080, i9-12900K
Desktop-PC
44 (20min, 20.2P0.1, 22.9P1) fps ∼12%
NVIDIA GeForce RTX 3070, i9-12900K
Desktop-PC
35.9 (14.9min, 15.8P0.1, 19.2P1) fps ∼10%
NVIDIA GeForce RTX 3080 Ti Laptop GPU, i9-12900HX
MSI Titan GT77 12UHS
34.6 (14.8min, 15.6P0.1, 19.1P1) fps ∼10%
AMD Radeon RX 6800M, R9 5900HX
Asus ROG Strix G15
26.8 (13.5min, 14.5P0.1, 16P1) fps ∼8%
NVIDIA GeForce RTX 3060 Laptop GPU, i7-12700H
Lenovo Legion 5 Pro
21.2 (9.32min, 9.73P0.1, 10.8P1) fps ∼6%
AMD Radeon RX 6600M, R7 5800H
Lenovo Legion 5
19.5 (7.94min, 8.08P0.1, 8.67P1) fps ∼5%

Note

Because gaming tests are very time-consuming and are often constrained by installation or activation limits, we are only able to provide you with part of the benchmark results at the time of publishing this article. We will be adding more graphics cards over the coming days and weeks.

Overview

Show Restrictions
PosModel< PrevNext >High On Life
 High On Life (2023)
low
1920x1080
Low Preset
med.
1920x1080
Medium Preset
high
1920x1080
High Preset
ultra
1920x1080
Very High Preset
QHD
2560x1440
Very High Preset
4K
3840x2160
Very High Preset
NVIDIA GeForce RTX 4090
0n2
0n2
0n2
0n2
0n2
0n2
AMD Radeon RX 7900 XTX
369
298
273
222
151.8
72.1
NVIDIA GeForce RTX 4080
304
258
226
157.1
71.5
NVIDIA GeForce RTX 4070 Ti
383
317
248
205
132.3
57.2
AMD Radeon RX 6950 XT
385
326
255
205
132.7
57.3
NVIDIA GeForce RTX 4090 Laptop GPU
277
246
211
0n2
0n2
0n2
NVIDIA GeForce RTX 3090
384
303
230
189.7
121.4
52.7
NVIDIA GeForce RTX 4080 Laptop GPU
214
162.8
148.4
100.6
42.6
NVIDIA GeForce RTX 3080
348
275
206
170.9
108.5
44
NVIDIA GeForce RTX 4070
406
267
213
169.7
106.3
45.7
NVIDIA GeForce RTX 4070 Laptop GPU
236
0n2
0n2
0n2
0n2
25.7
AMD Radeon RX 6800
361
252
181.9
142.8
90.2
38.4
NVIDIA Titan RTX
339
235
172.6
136.6
87.1
39.6
NVIDIA GeForce RTX 3080 Ti Laptop GPU
252
204
154.1
129.7
82
34.6
NVIDIA GeForce RTX 3070
324
219
171.5
136.2
84.8
35.9
AMD Radeon RX 6700 XT
317
195.6
158.6
118.9
73.4
30.1
NVIDIA GeForce RTX 3060 Ti
0n2
0n2
0n2
0n2
0n2
0n2
NVIDIA GeForce RTX 3070 Ti Laptop GPU
175.7
139.4
117.5
97.1
60.8
NVIDIA GeForce RTX 4060 Laptop GPU
0n2
0n2
0n2
0n2
PosModel< PrevNext >High On Life
low med. high ultra QHD 4K
AMD Radeon RX 6800M
168.5
122.9
108.1
95.3
63.1
26.8
AMD Radeon RX 6650 XT
289
179.3
142.2
107.8
62
24.5
NVIDIA GeForce RTX 3070 Laptop GPU
216
157
0n2
103
65.5
27.6
AMD Radeon RX 6800S
170.1
125
101.6
76.1
NVIDIA Titan X Pascal
231
147.2
115.5
93
57.5
25.1
NVIDIA GeForce RTX 2070 Super (Desktop)
260
164
125
98.9
59.7
26
Intel Arc A770M
178.5
126.5
99.7
80.9
52.9
24.9
AMD Radeon RX 5700 XT (Desktop)
256
155.8
127.1
98
59.1
26.7
AMD Radeon RX 7600S
138.7
103.7
80.5
49.1
21
NVIDIA GeForce RTX 3060 Laptop GPU
0n2
0n2
0n2
0n2
52.1
21.2
NVIDIA GeForce RTX 2060 Super (Desktop)
221
137.7
105.1
86.2
51.2
19.4
AMD Radeon RX 6600
0n2
0n2
0n2
0n2
0n2
0n2
AMD Radeon RX 5700 (Desktop)
224
139.4
110.7
86.2
52.5
23.5
AMD Radeon RX 6600M
0n2
0n2
0n2
0n2
0n2
0n2
NVIDIA GeForce RTX 3050
176.7
108.8
80.7
64.2
38.2
15.5
AMD Radeon RX 5600 XT (Desktop)
211
128.6
104.6
79.7
49.7
23.5
NVIDIA GeForce GTX 1660 Super (Desktop)
172.8
99
79.4
63.6
37.1
15.8
AMD Radeon RX 6500 XT
150.6
81.2
56.2
54.4
32.1
11.8
AMD Radeon RX 5500 XT (Desktop)
147
86.3
72.2
55.5
32.8
14
NVIDIA GeForce RTX 4050 Laptop GPU
104.9
0n2
0n2
0n2
0n2
22.9
PosModel< PrevNext >High On Life
low med. high ultra QHD 4K
NVIDIA GeForce RTX 3050 Ti Laptop GPU
104.7
77.5
60.3
50.8
31.8
NVIDIA GeForce GTX 1660 (Desktop)
157.3
89.9
72.6
57.6
34.8
14.3
NVIDIA GeForce GTX 1650 Super (Desktop)
139.4
76.9
60.1
50.7
31.3
7.78
Intel Arc A350M
71.9
42.6
38.2
27.8
18.8
4.36
AMD Radeon 780M
55.4
33.9
29
20.6
AMD Radeon 680M
63.1
45
33.8
25.7
NVIDIA GeForce MX450
29.4
15.8
14
12.4
Intel Iris Xe Graphics G7 96EUs
31.8
19.3
18.3
12.8
Intel Iris Xe Graphics G7 80EUs
0n2
0n2
0n2
0n2
Intel UHD Graphics 64EUs (Alder Lake 12th Gen)
33.4
20.1
18.2
Intel UHD Graphics 770
20.5
12.7
AMD Radeon RX Vega 7
0n2
16.1
16
10.2
NVIDIA GeForce 930MX
12.3
Intel UHD Graphics 620
10.6
(-) * Smaller values are better. / n123 Number of benchmarks for this median value / * Approximate position


Legend
5Stutters – This game is very likely to stutter and have poor frame rates. Based on all known benchmarks using the specified graphical settings, average frame rates are expected to fall below 25fps
May Stutter – This graphics card has not been explicitly tested on this game. Based on interpolated information from surrounding graphics cards of similar performance levels, stutters and poor frame rates are expected.
30Fluent – Based on all known benchmarks using the specified graphical settings, this game should run at or above 25fps
40Fluent – Based on all known benchmarks using the specified graphical settings, this game should run at or above 35fps
60Fluent – Based on all known benchmarks using the specified graphical settings, this game should run at or above 58fps
May Run Fluently – This graphics card has not been explicitly tested on this game. Based on interpolated information from surrounding graphics cards of similar performance levels, fluent frame rates are expected.
?Uncertain – This graphics card experienced unexpected performance issues during testing for this game. A slower card may be able to achieve better and more consistent frame rates than this particular GPU running the same benchmark scene.
Uncertain – This graphics card has not been explicitly tested on this game and no reliable interpolation can be made based on the performances of surrounding cards of the same class or family.
The value in the fields displays the average frame rate of all values in the database. Move your cursor over the value to see individual results.

Test systems

Device Graphics card Processor RAM Operating system
Laptops
MSI Titan GT77 12UHS Nvidia GeForce RTX 3080 Ti @175 W TGP (16 GB GDDR6) Intel Core i9-12900 2 x 16 GB DDR5 Windows 11
Lenovo Legion 5 Pro Nvidia GeForce RTX 3060 @140 W TGP (6 GB GDDR6) Intel Core i7-12700H 2 x 8 GB DDR5 Windows 11
Asus ROG Strix G15 AMD Radeon RX 6800M (12 GB GDDR6) AMD Ryzen 9 5900HX 2 x 8 GB DDR4 Windows 11
Lenovo Legion 5 AMD Radeon RX 6600M (8 GB GDDR6) AMD Ryzen 7 5800H 2 x 8 GB DDR4 Windows 11
Asus ROG Zephyrus G14 AMD Radeon 680M AMD Ryzen 9 6900HS 2 x 16 GB DDR5 Windows 11
Desktop PCs
Custom I AMD Radeon RX 7900 XTX (24 GB GDDR6)
MSI GeForce RTX 3080 (10 GB GDDR6X)
MSI GeForce RTX 3070 (8 GB GDDR6)
Intel Core i9-12900K 2 x 16 GB DDR4 Windows 11
Custom II Palit GeForce RTX 4090 GameRock OC (24 GB GDDR6X)
Nvidia GeForce RTX 3090 FE (24 GB GDDR6X)
Nvidia GeForce RTX 3060 Ti (8 GB GDDR6X)
Nvidia Titan RTX (24 GB GDDR6)
Nvidia GeForce RTX 2070 Super (8 GB GDDR6)
Nvidia GeForce RTX 2060 Super (8 GB GDDR6)
KFA2 GeForce GTX 1660 Super (6 GB GDDR6)
PNY GeForce GTX 1660 (6 GB GDDR5)
KFA2 GeForce GTX 1650 Super (4 GB GDDR6)
AMD Radeon RX 6800 (16 GB DDR6)
AMD Radeon RX 6700 XT (12 GB DDR6)
AMD Radeon RX 6650 XT (8 GB GDDR6)
AMD Radeon RX 6600 (8 GB GDDR6)
AMD Radeon RX 5700 XT (8 GB GDDR6)
AMD Radeon RX 5700 (8 GB GDDR6)
AMD Radeon RX 5600 XT (6 GB GDDR6)
AMD Radeon RX 5500 XT (8 GB GDDR6)
AMD Ryzen 9 7950X 2 x 16 GB DDR5 Windows 11
Custom III Nvidia GeForce RTX 2080 Super FE Intel Core i9-11900K 2 x 8 GB DDR4 Windows 11
Mini PCs
Zotac ZBOX CI665 Nano Intel Iris Xe Graphics G7 (96 CUs) Intel Core i7-1165G7 2 x 8 GB DDR4 Windows 11
Morefine S500+ AMD Radeon RX Vega 8 AMD Ryzen 9 5900HX 2 x 16 GB DDR4 Windows 11
Minisforum NUCXi7 Nvidia GeForce RTX 3070 @125 W TGP (8 GB GDDR6) Intel Core i7-11800H 2 x 8 GB DDR4 Windows 11
Minisforum HX90G AMD Radeon RX 6600M @100 W TGP (8 GB GDDR6) AMD Ryzen 9 5900HX 2 x 16 GB DDR4 Windows 11
4K monitors Nvidia driver AMD driver
Asus PB287Q, Philips Brilliance 329P9H, Gigabyte M32U ForceWare 528.02 Adrenalin 22.11.2
Read all 1 comments / answer
static version load dynamic
Loading Comments
Comment on this article
Please share our article, every link counts!
.170
> Notebook / Laptop Reviews and News > Reviews > High On Life review: Laptop and desktop benchmarks
Florian Glaser, 2023-01-26 (Update: 2023-01-26)