


Corsair Voyager a1600 laptop in review: Full AMD power for gamers, streamers and creators
Corsair has launched a very interesting device with the Voyager a1600, which stands out from the competition with special Elgato shortcuts. With a combination of AMD CPU and AMD GPU, gamers and streamers should get their money's worth. We have put the top model through our test course and will specifically look at the features and performance of the notebook in this review.
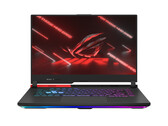
AMD Ryzen 9 6900HS, Radeon RX 6800M, 16", 2.4 kg