Asus ROG Strix G15 gaming laptop with Radeon RX 6800M and Ryzen 9 in review

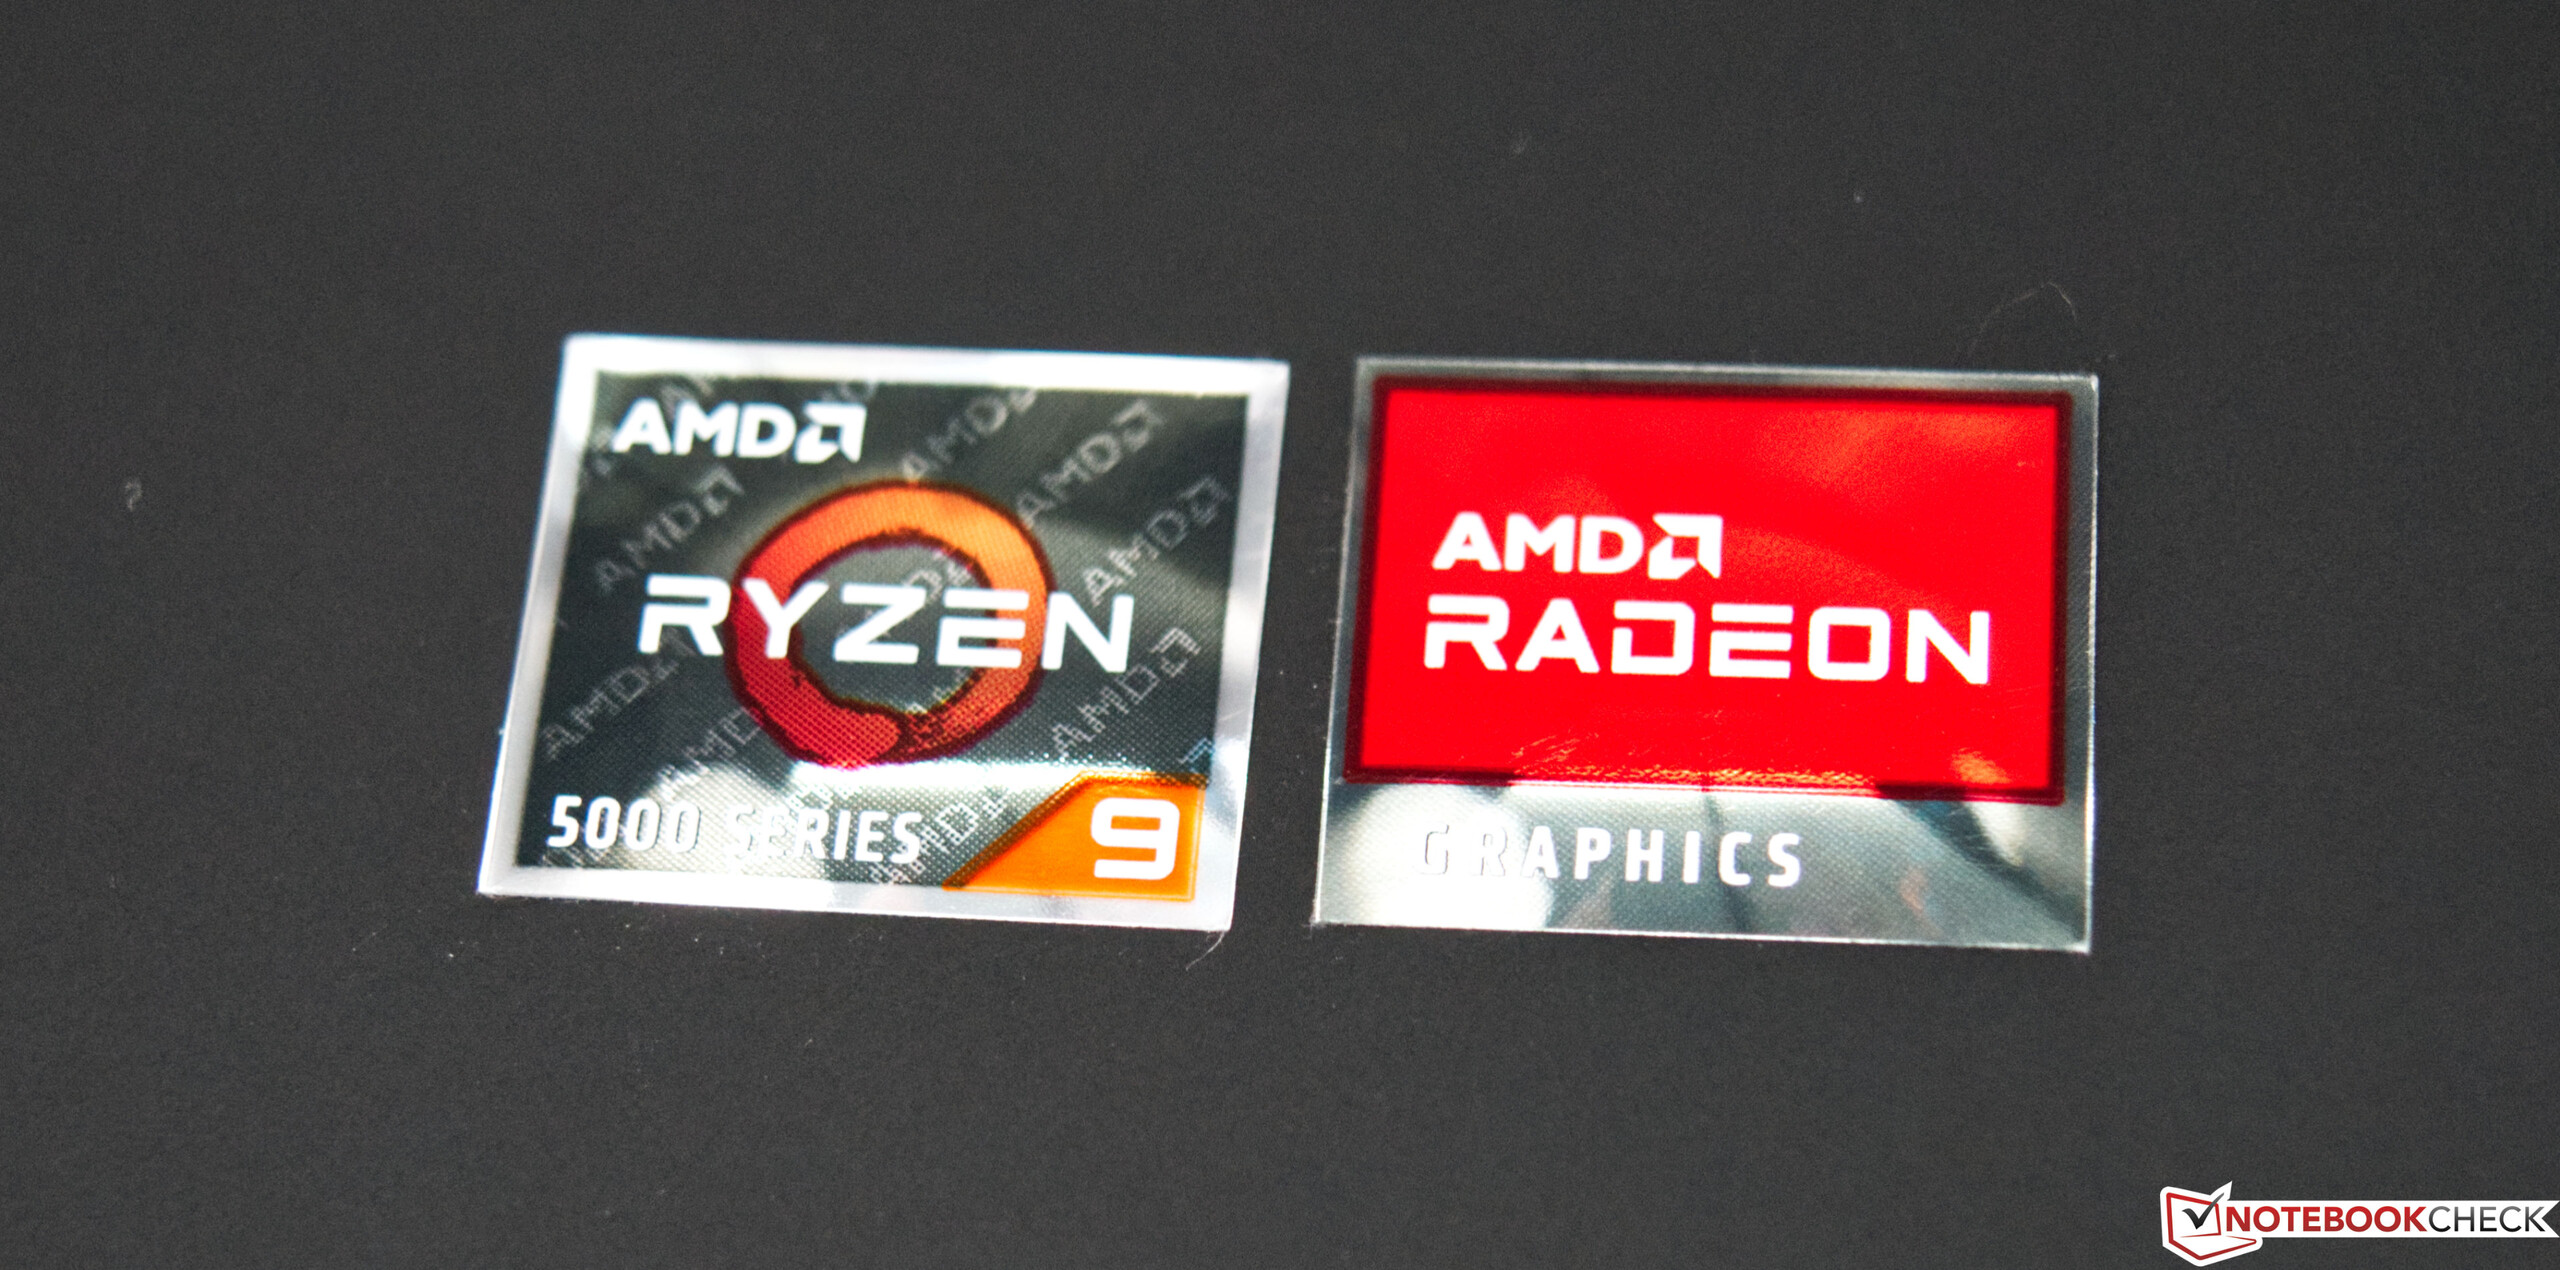
Asus has been offering high-quality gaming laptops under the ROG Strix brand for a few years now. With the Asus ROG Strix G15 G513QY, we now have a first sample from AMD and Asus featuring the latest AMD Radeon RX 6800M. AMD intends to compete with Nvidia's RTX 3000 mobile GPUs with it. We'll see if this endeavor succeeded later on. The rest of the Asus ROG Strix G15 G513QY's configuration is also impressive: With the AMD Ryzen 9 5900HX, an ultra-modern octa-core processor runs under the hood and provides a lot of power. Thanks to the Zen 3 architecture, the SoC's performance has increased significantly both in single and multi-core applications. RAM isn't lacking either at 16 GB. At the same time, the SSD of only 512 GB is rather small for a gaming device. However, this configuration shouldn't be considered to be final, because this is a pre-production device that can still be modified up until its official market launch.
Only powerful gaming laptops with the latest Nvidia GPUs are suitable as comparison devices for this review. You'll find a list in the following table, below the device details.
Possible contenders in comparison
Rating | Date | Model | Weight | Height | Size | Resolution | Price |
|---|---|---|---|---|---|---|---|
| 84.7 % v7 (old) | 07 / 2021 | Asus ROG Strix G15 G513QY R9 5900HX, Radeon RX 6800M | 2.4 kg | 27.9 mm | 15.60" | 1920x1080 | |
| 87.5 % v7 (old) | 05 / 2021 | Razer Blade 15 Advanced Model Early 2021 i7-10875H, GeForce RTX 3080 Laptop GPU | 2 kg | 16.99 mm | 15.60" | 1920x1080 | |
| 86 % v7 (old) | 03 / 2021 | Schenker XMG Pro 15 (Early 2021, RTX 3080) i7-10870H, GeForce RTX 3080 Laptop GPU | 2 kg | 19.8 mm | 15.60" | 1920x1080 | |
| 86.1 % v7 (old) | 06 / 2021 | Alienware m15 R4 RTX 3080 i9-10980HK, GeForce RTX 3080 Laptop GPU | 2.4 kg | 20 mm | 15.60" | 1920x1080 | |
| 85.4 % v7 (old) | 04 / 2021 | Alienware m15 R4 i9-10980HK, GeForce RTX 3070 Laptop GPU | 2.3 kg | 20 mm | 15.60" | 1920x1080 | |
| 87 % v7 (old) | 06 / 2021 | Schenker XMG Neo 15 Tiger Lake i7-11800H, GeForce RTX 3080 Laptop GPU | 2.2 kg | 26 mm | 15.60" | 2560x1440 | |
| 85 % v7 (old) | 02 / 2021 | Asus ROG Strix G15 G513QR R9 5900HX, GeForce RTX 3070 Laptop GPU | 2.3 kg | 27.2 mm | 15.60" | 1920x1080 |
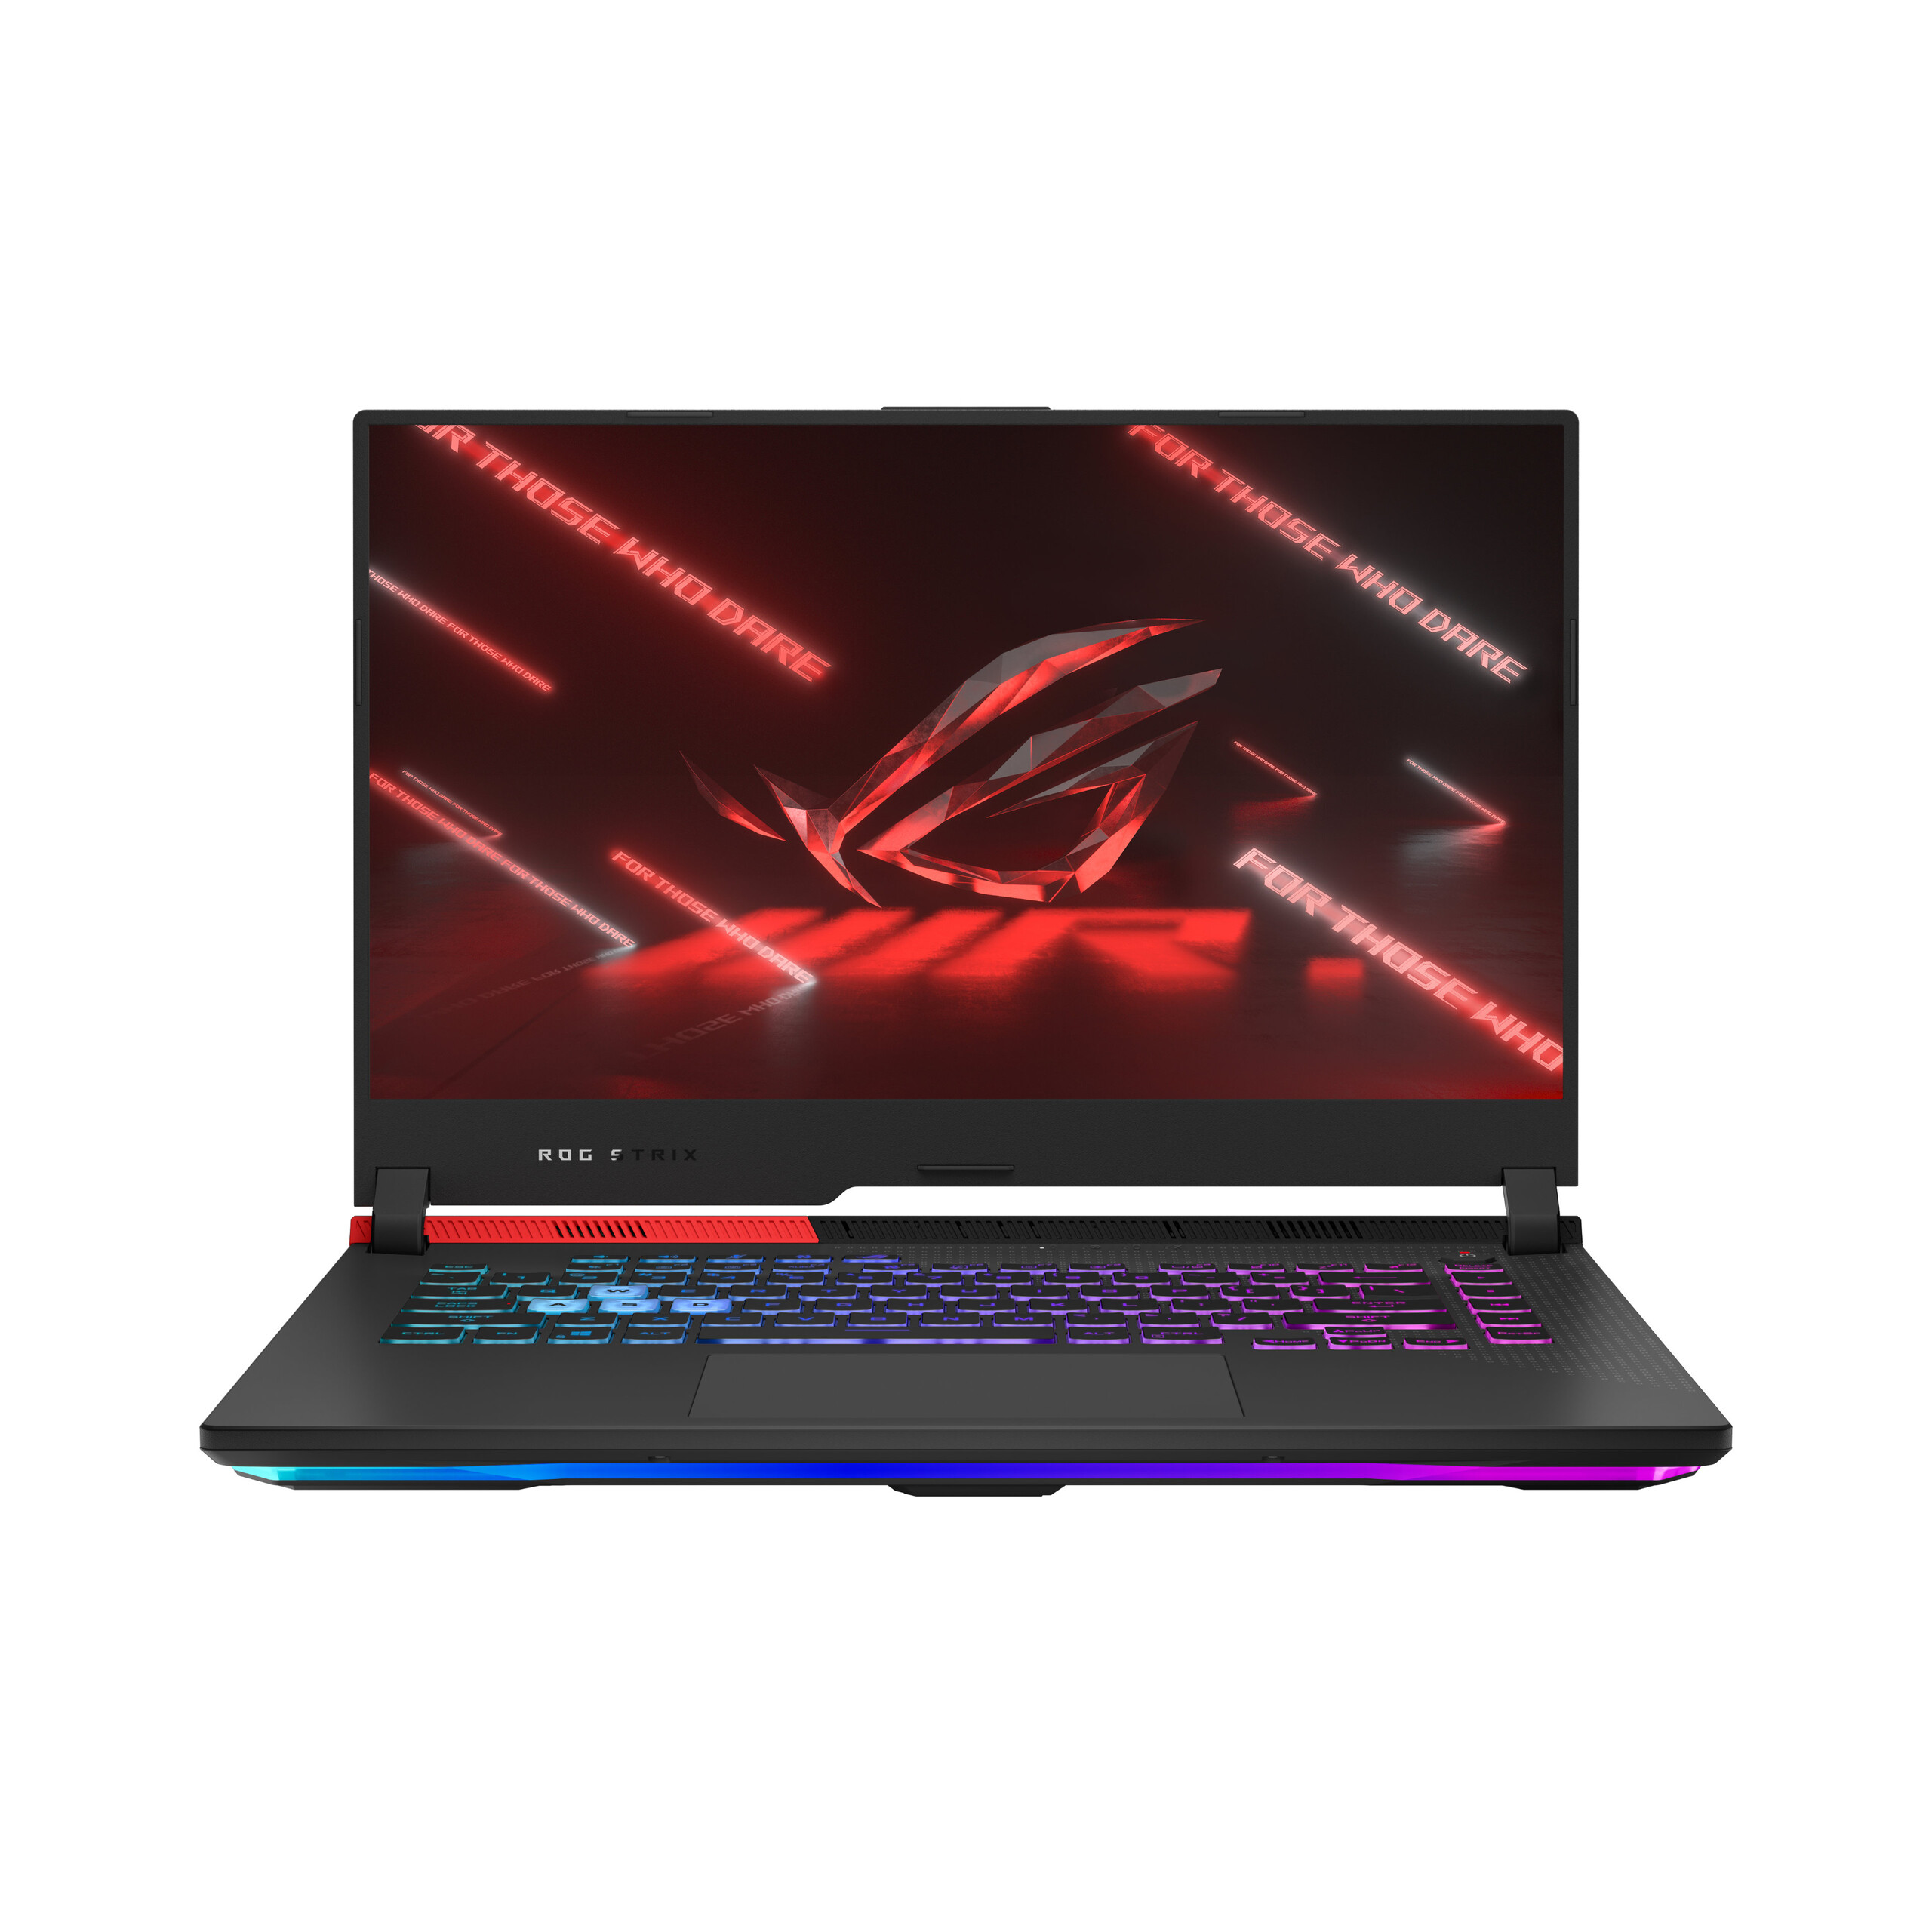
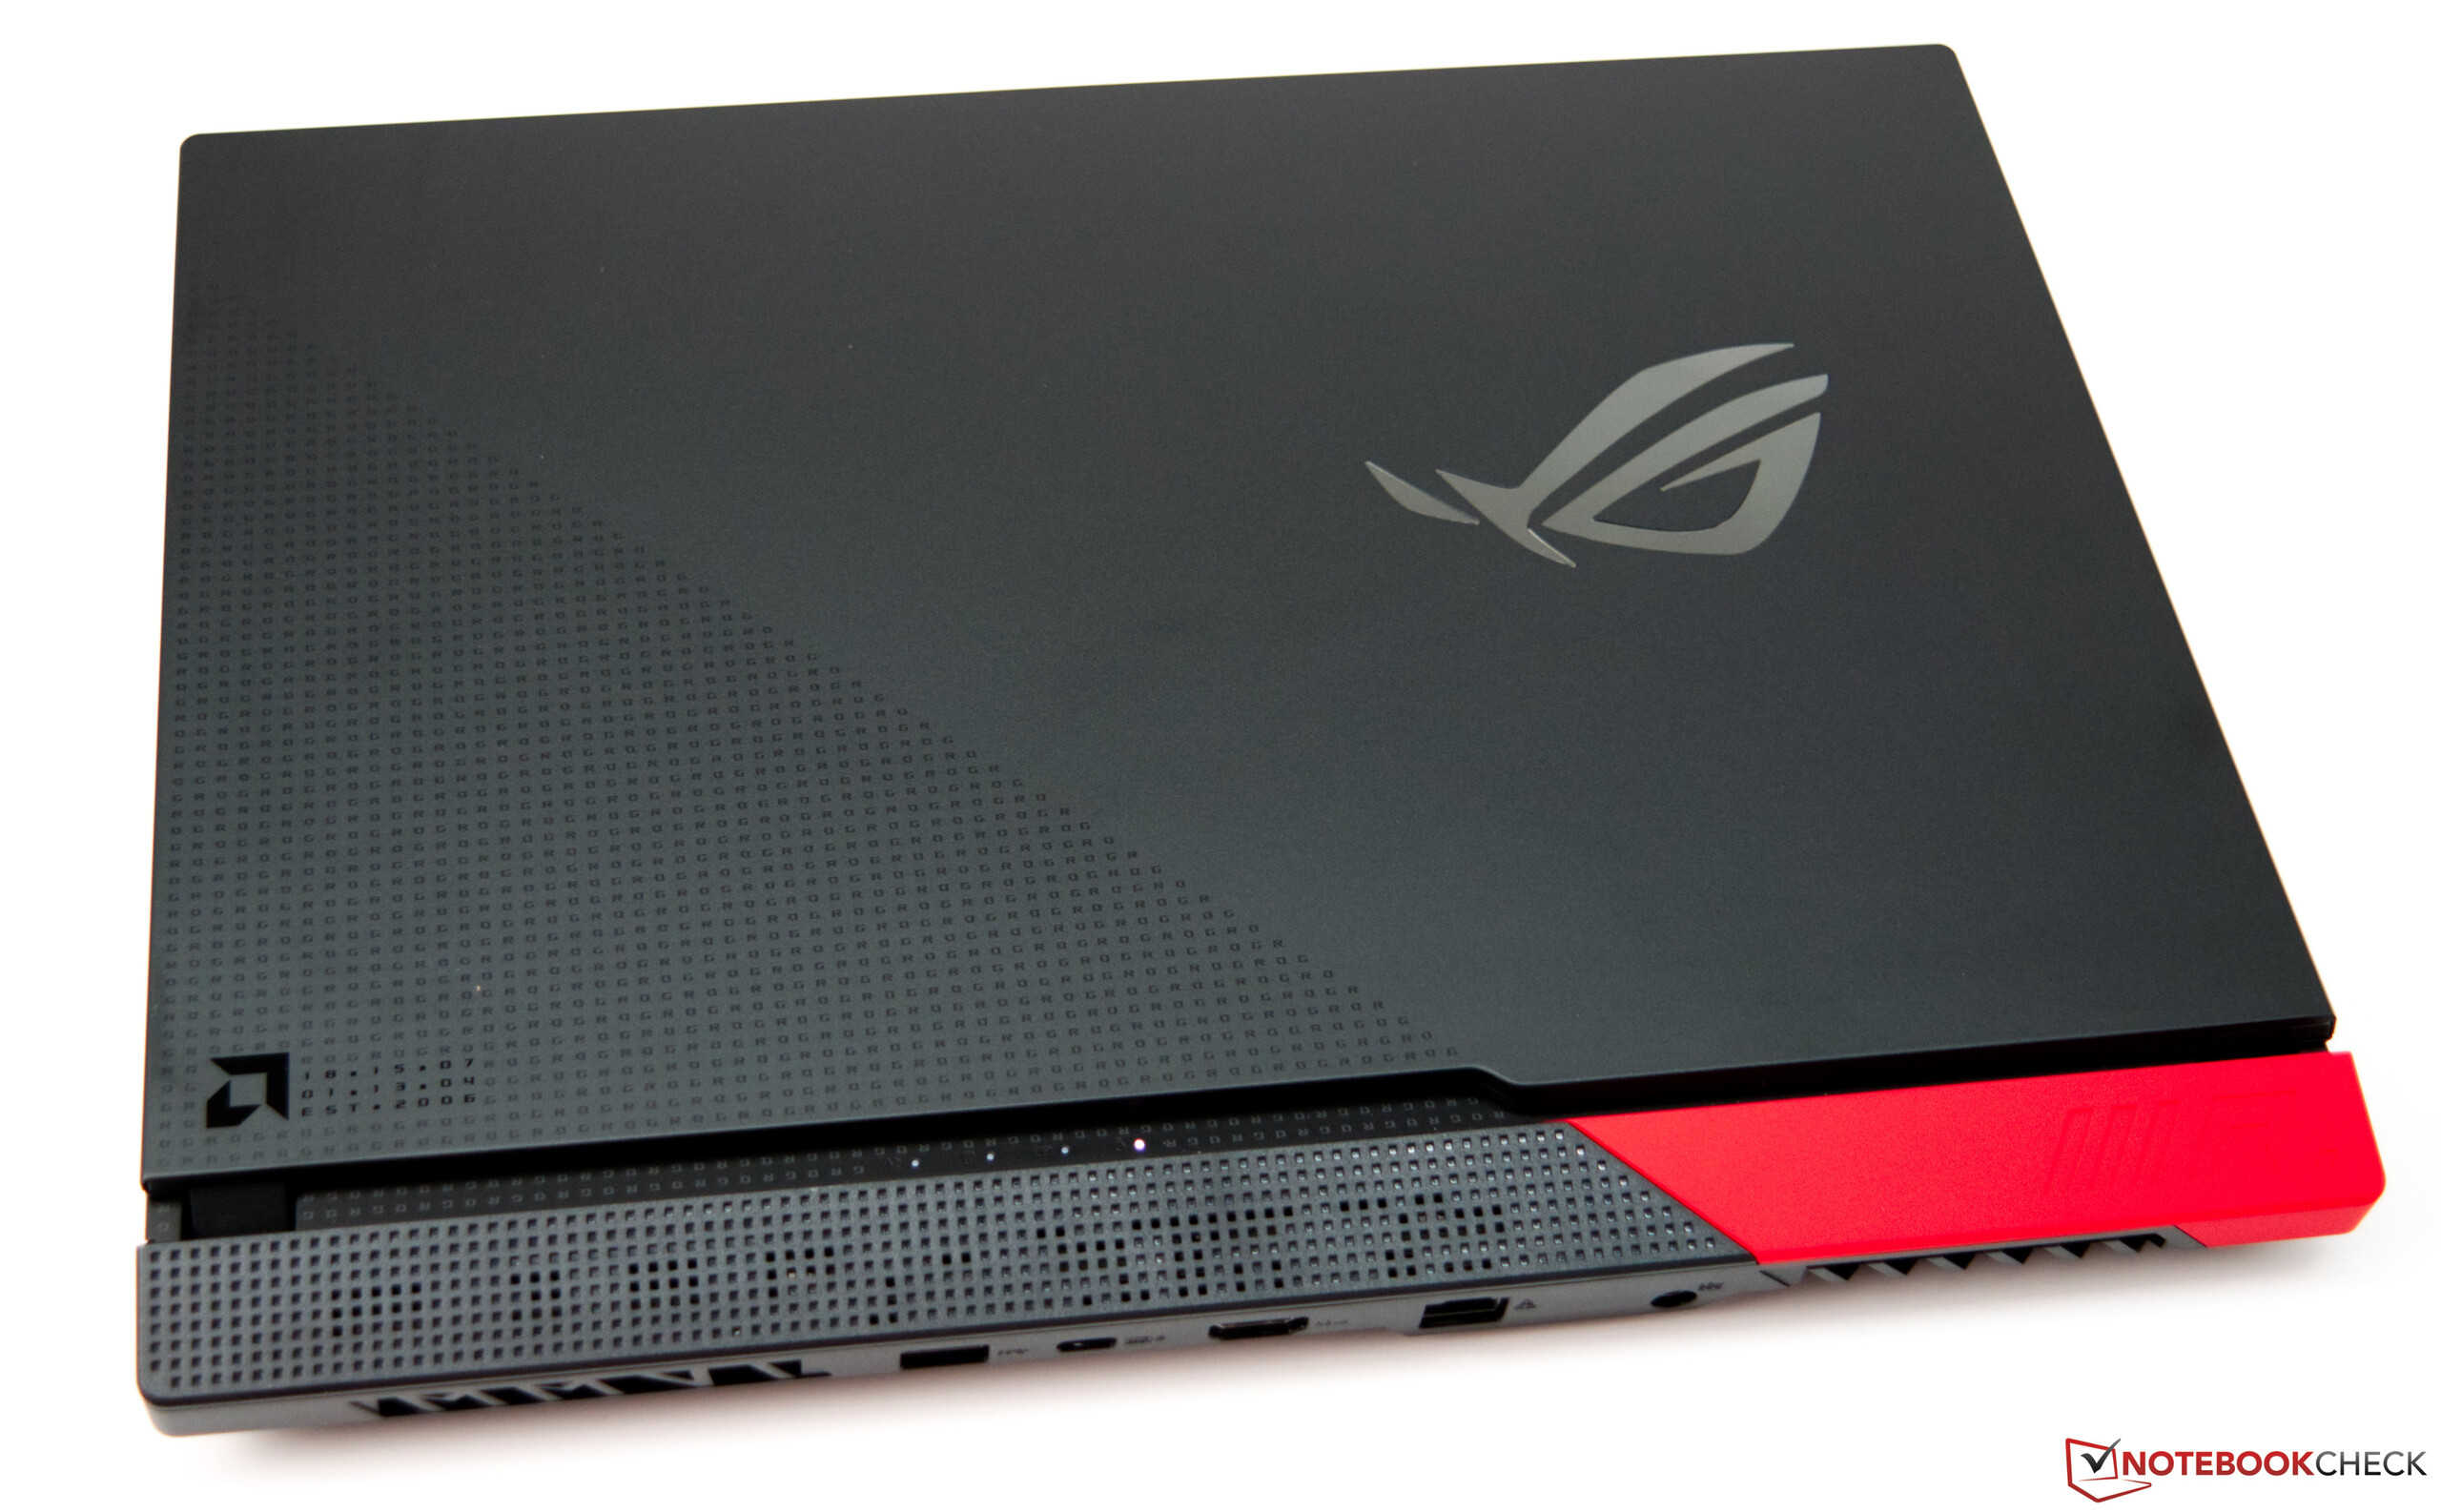
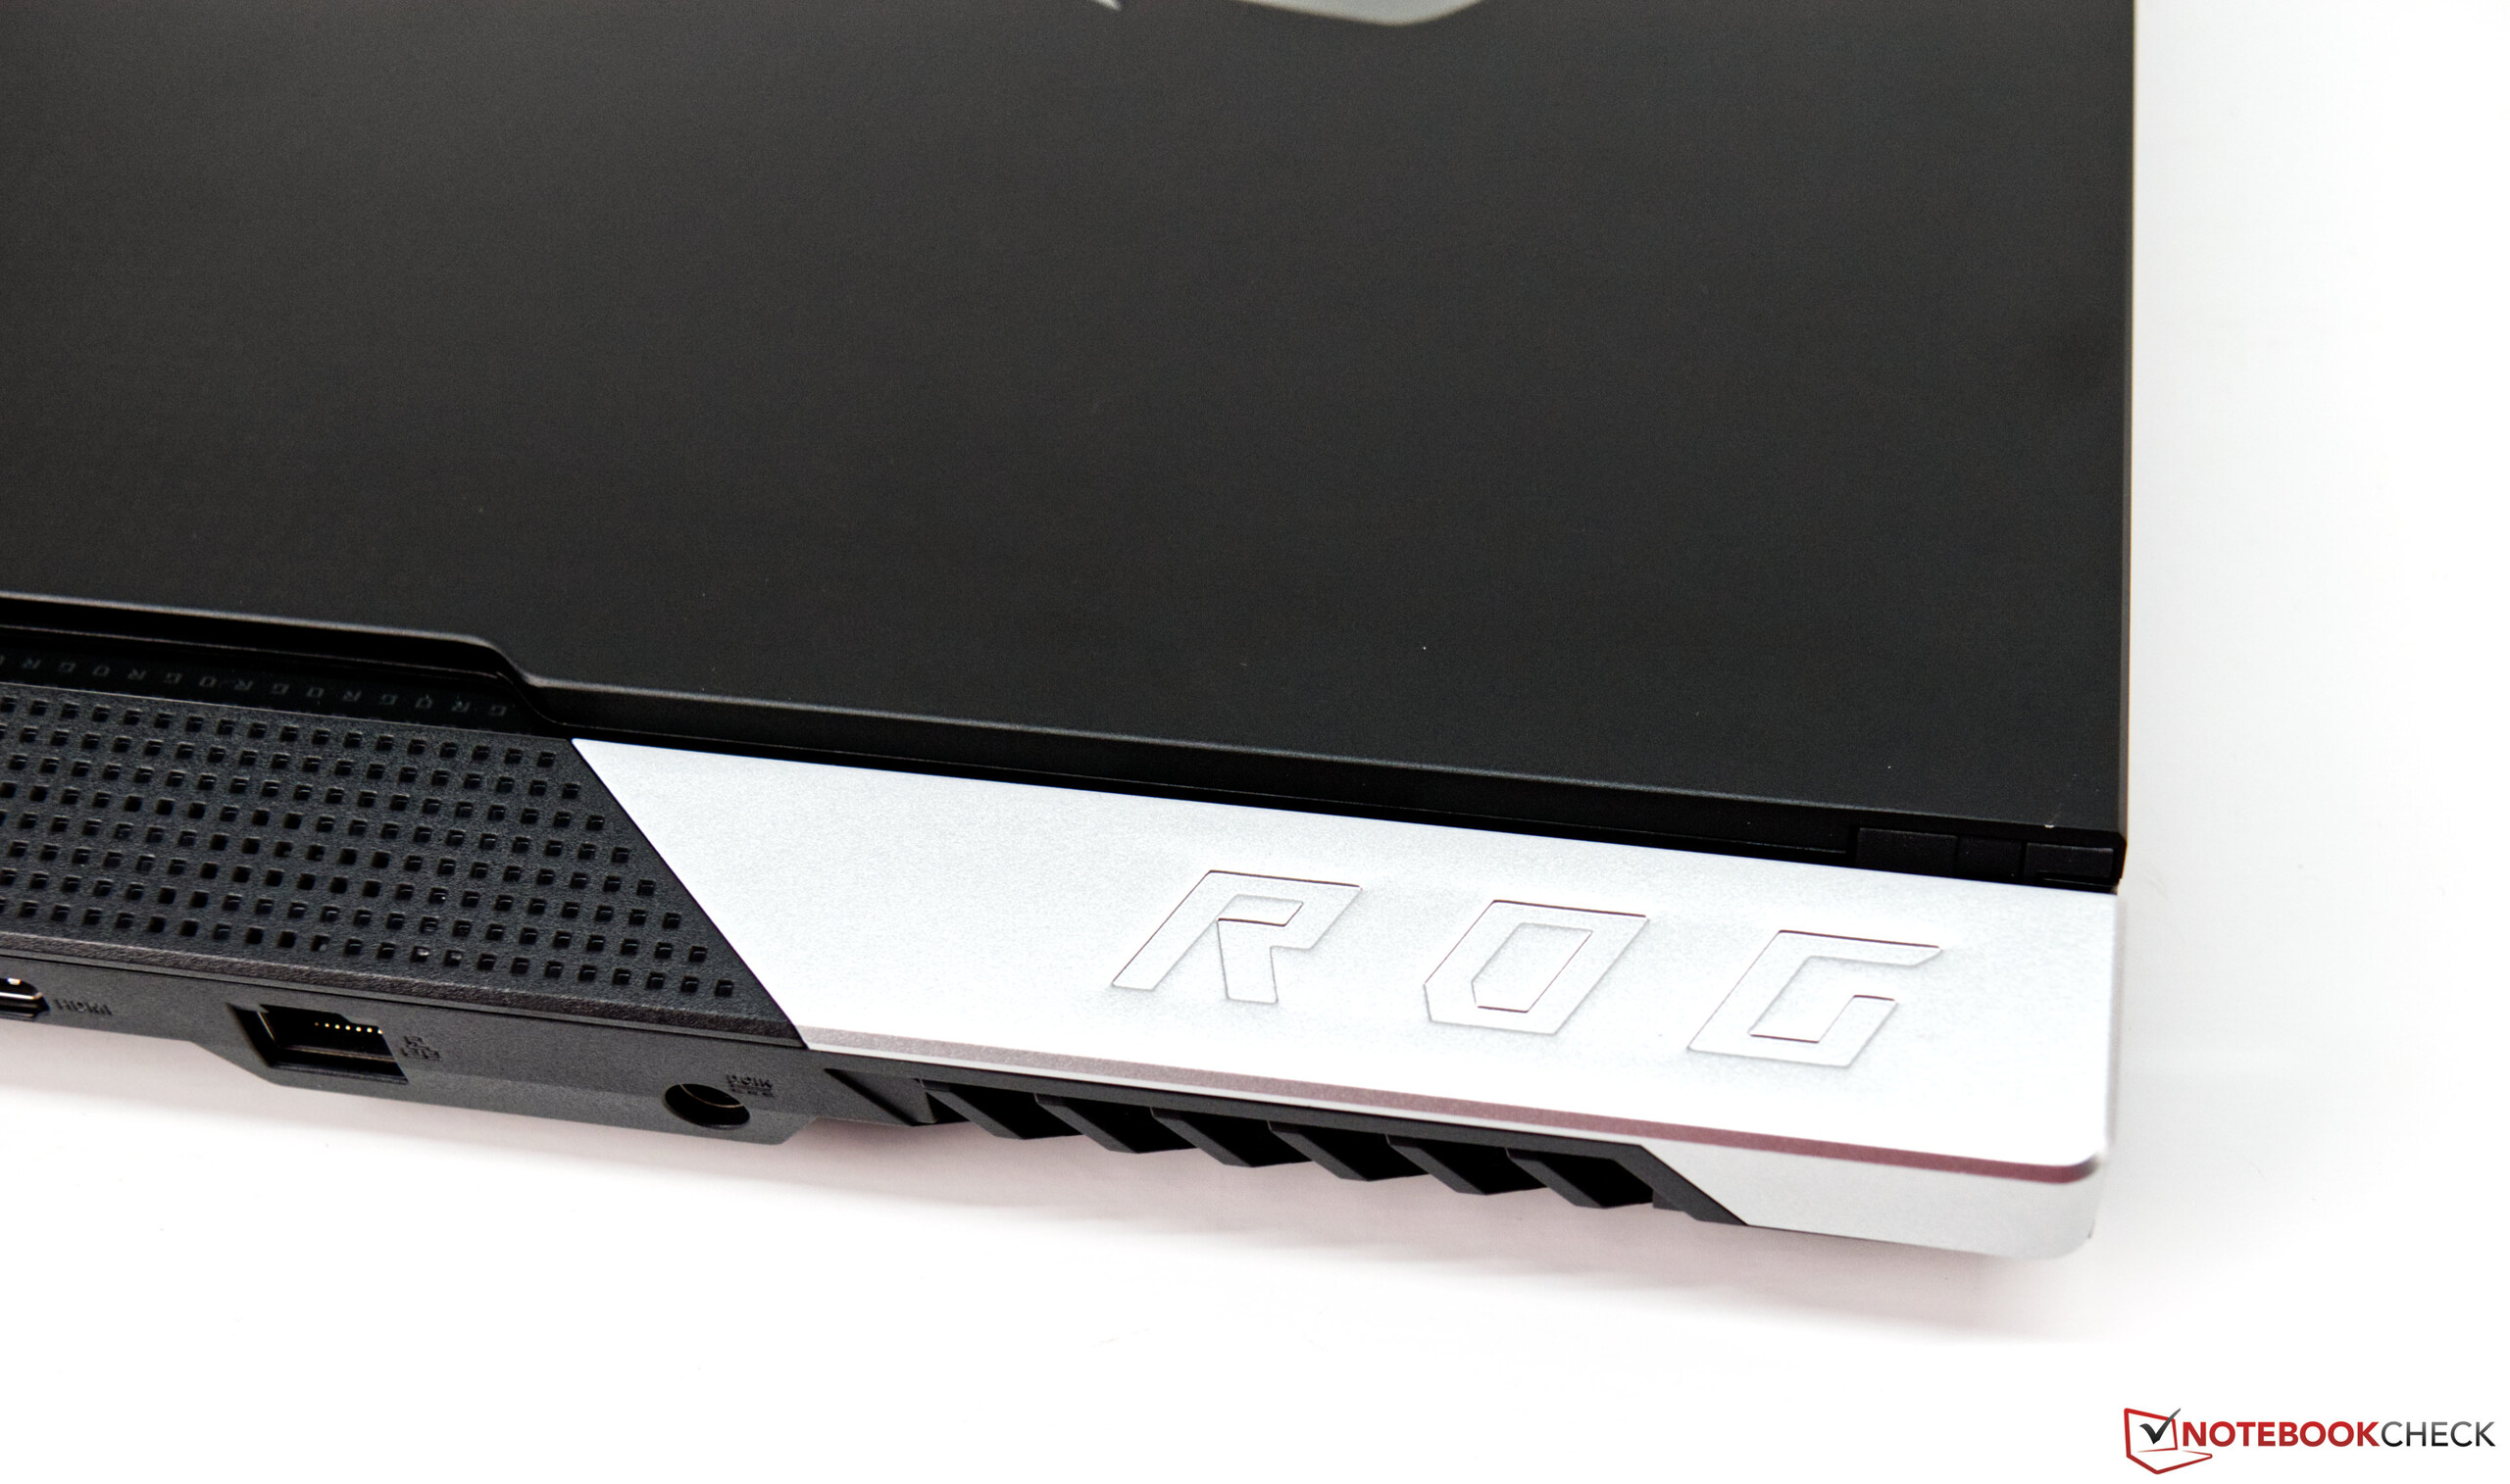
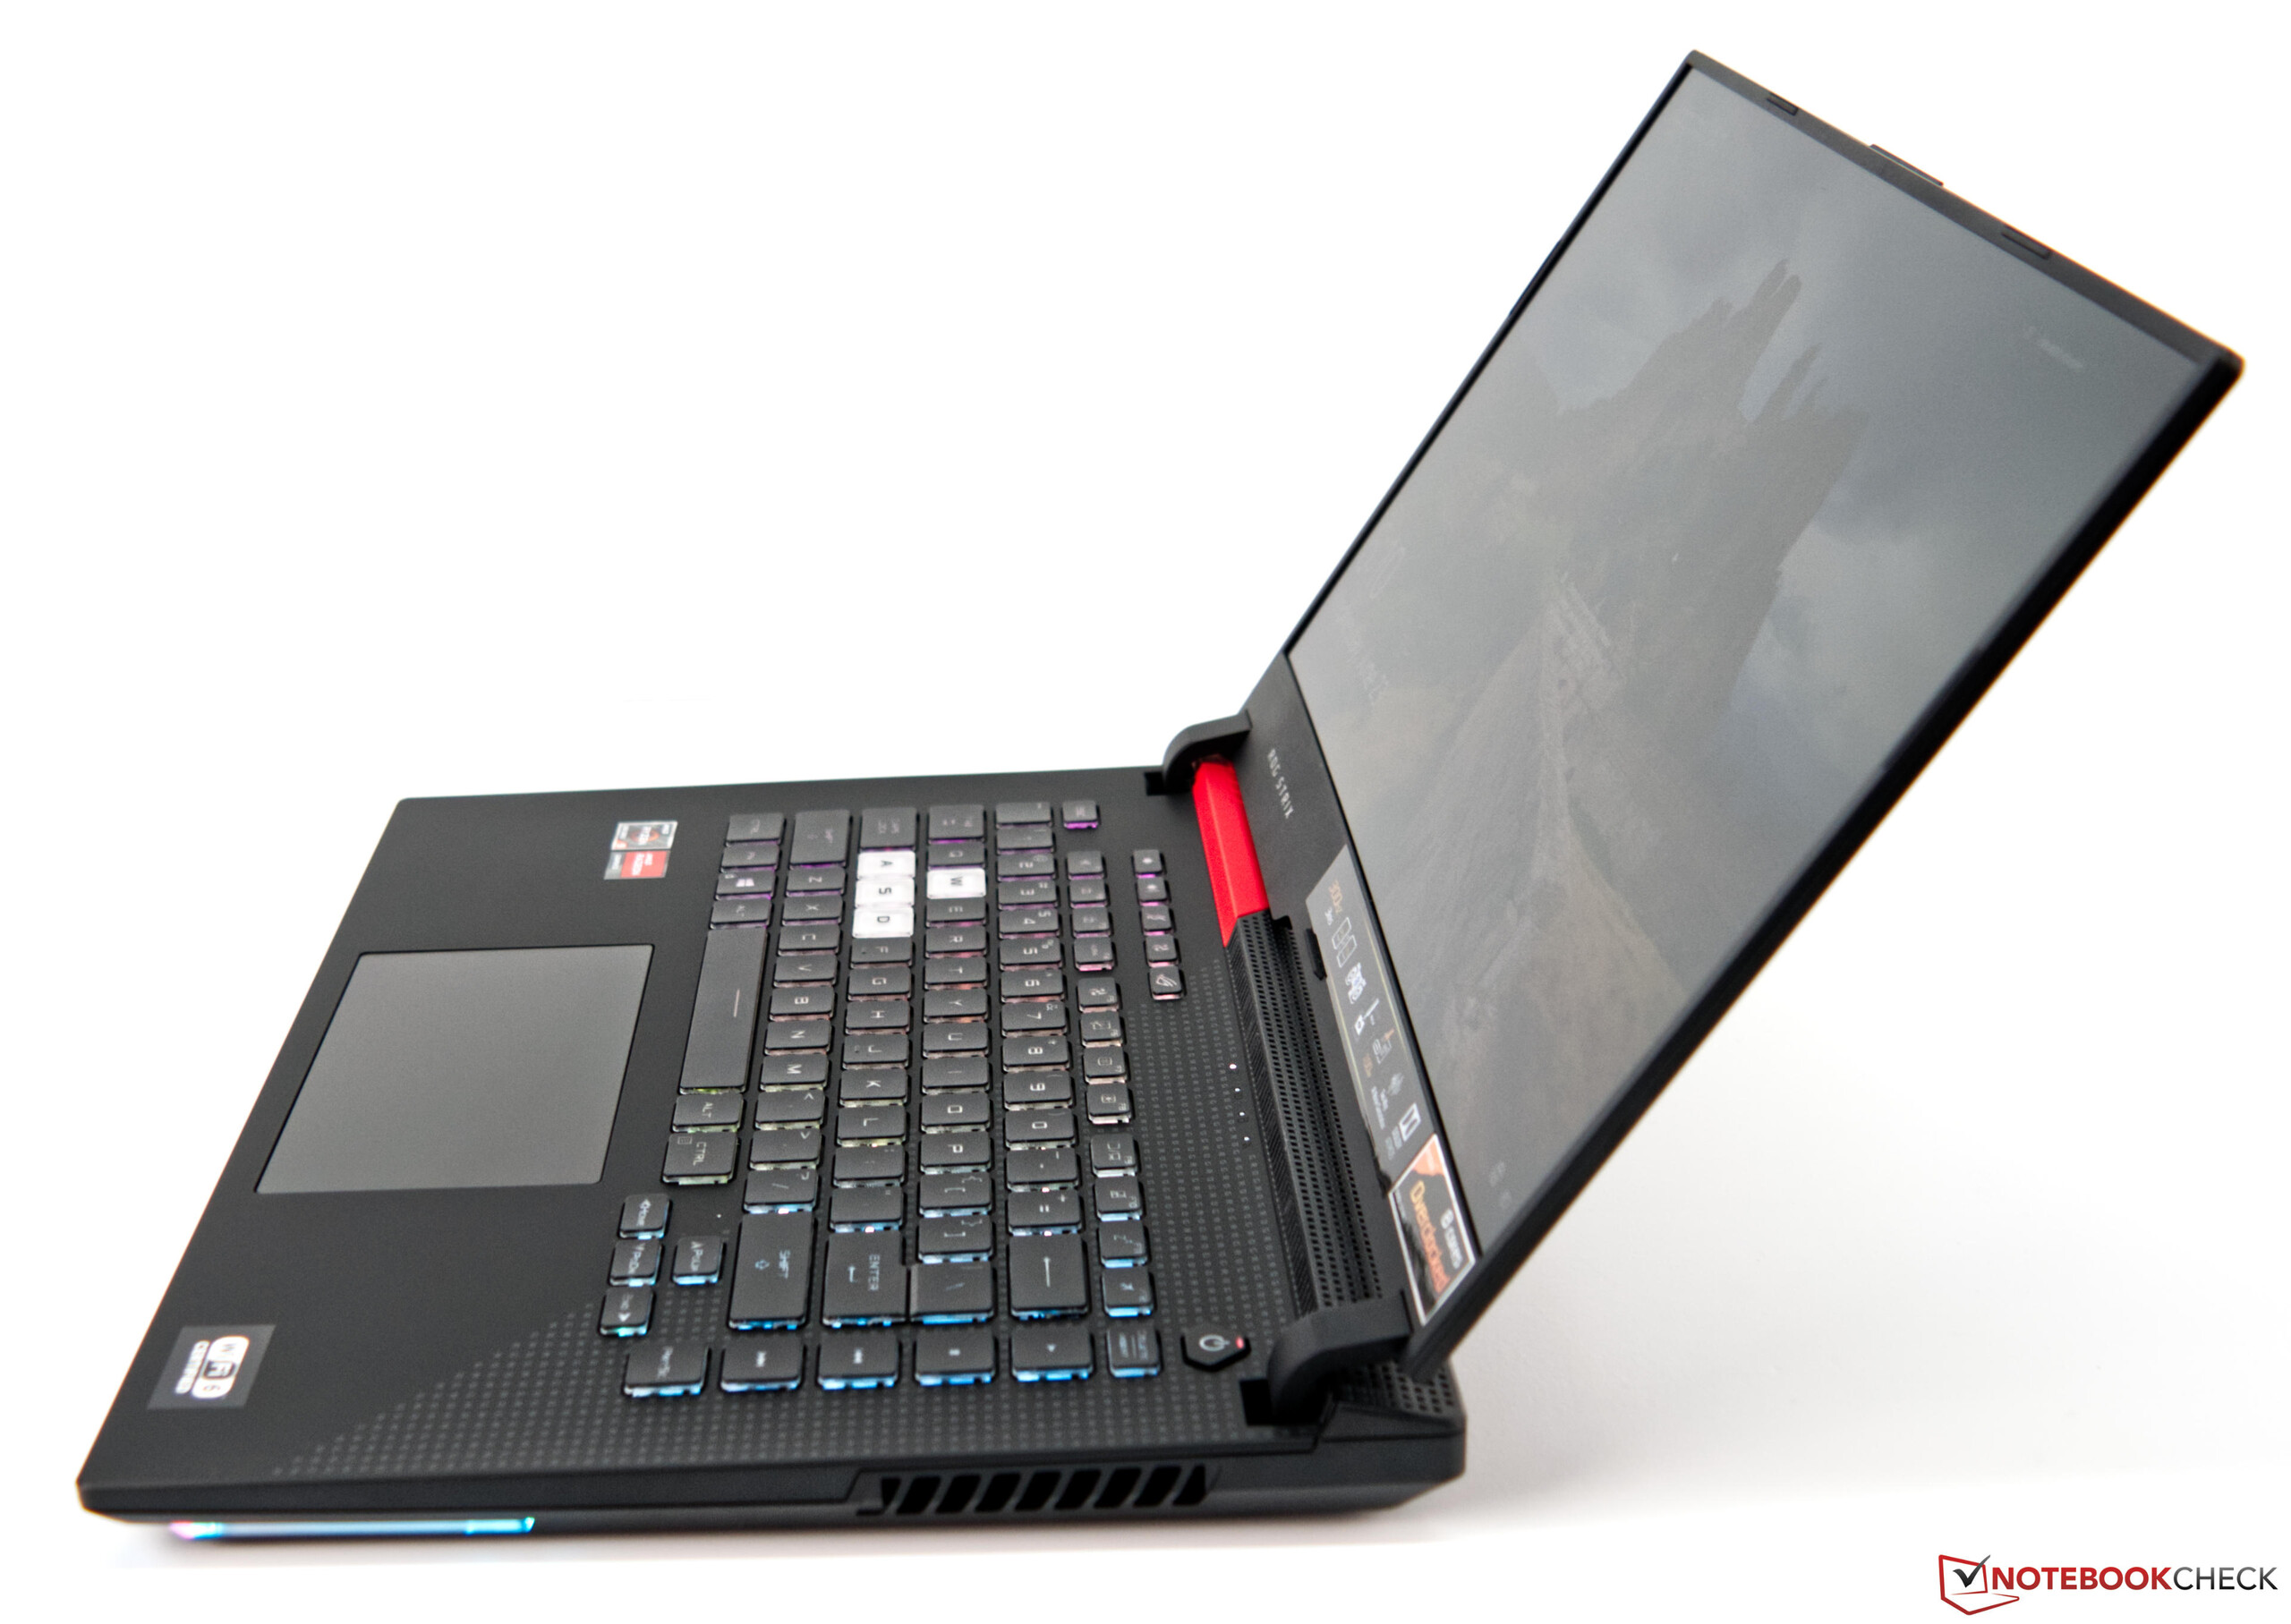
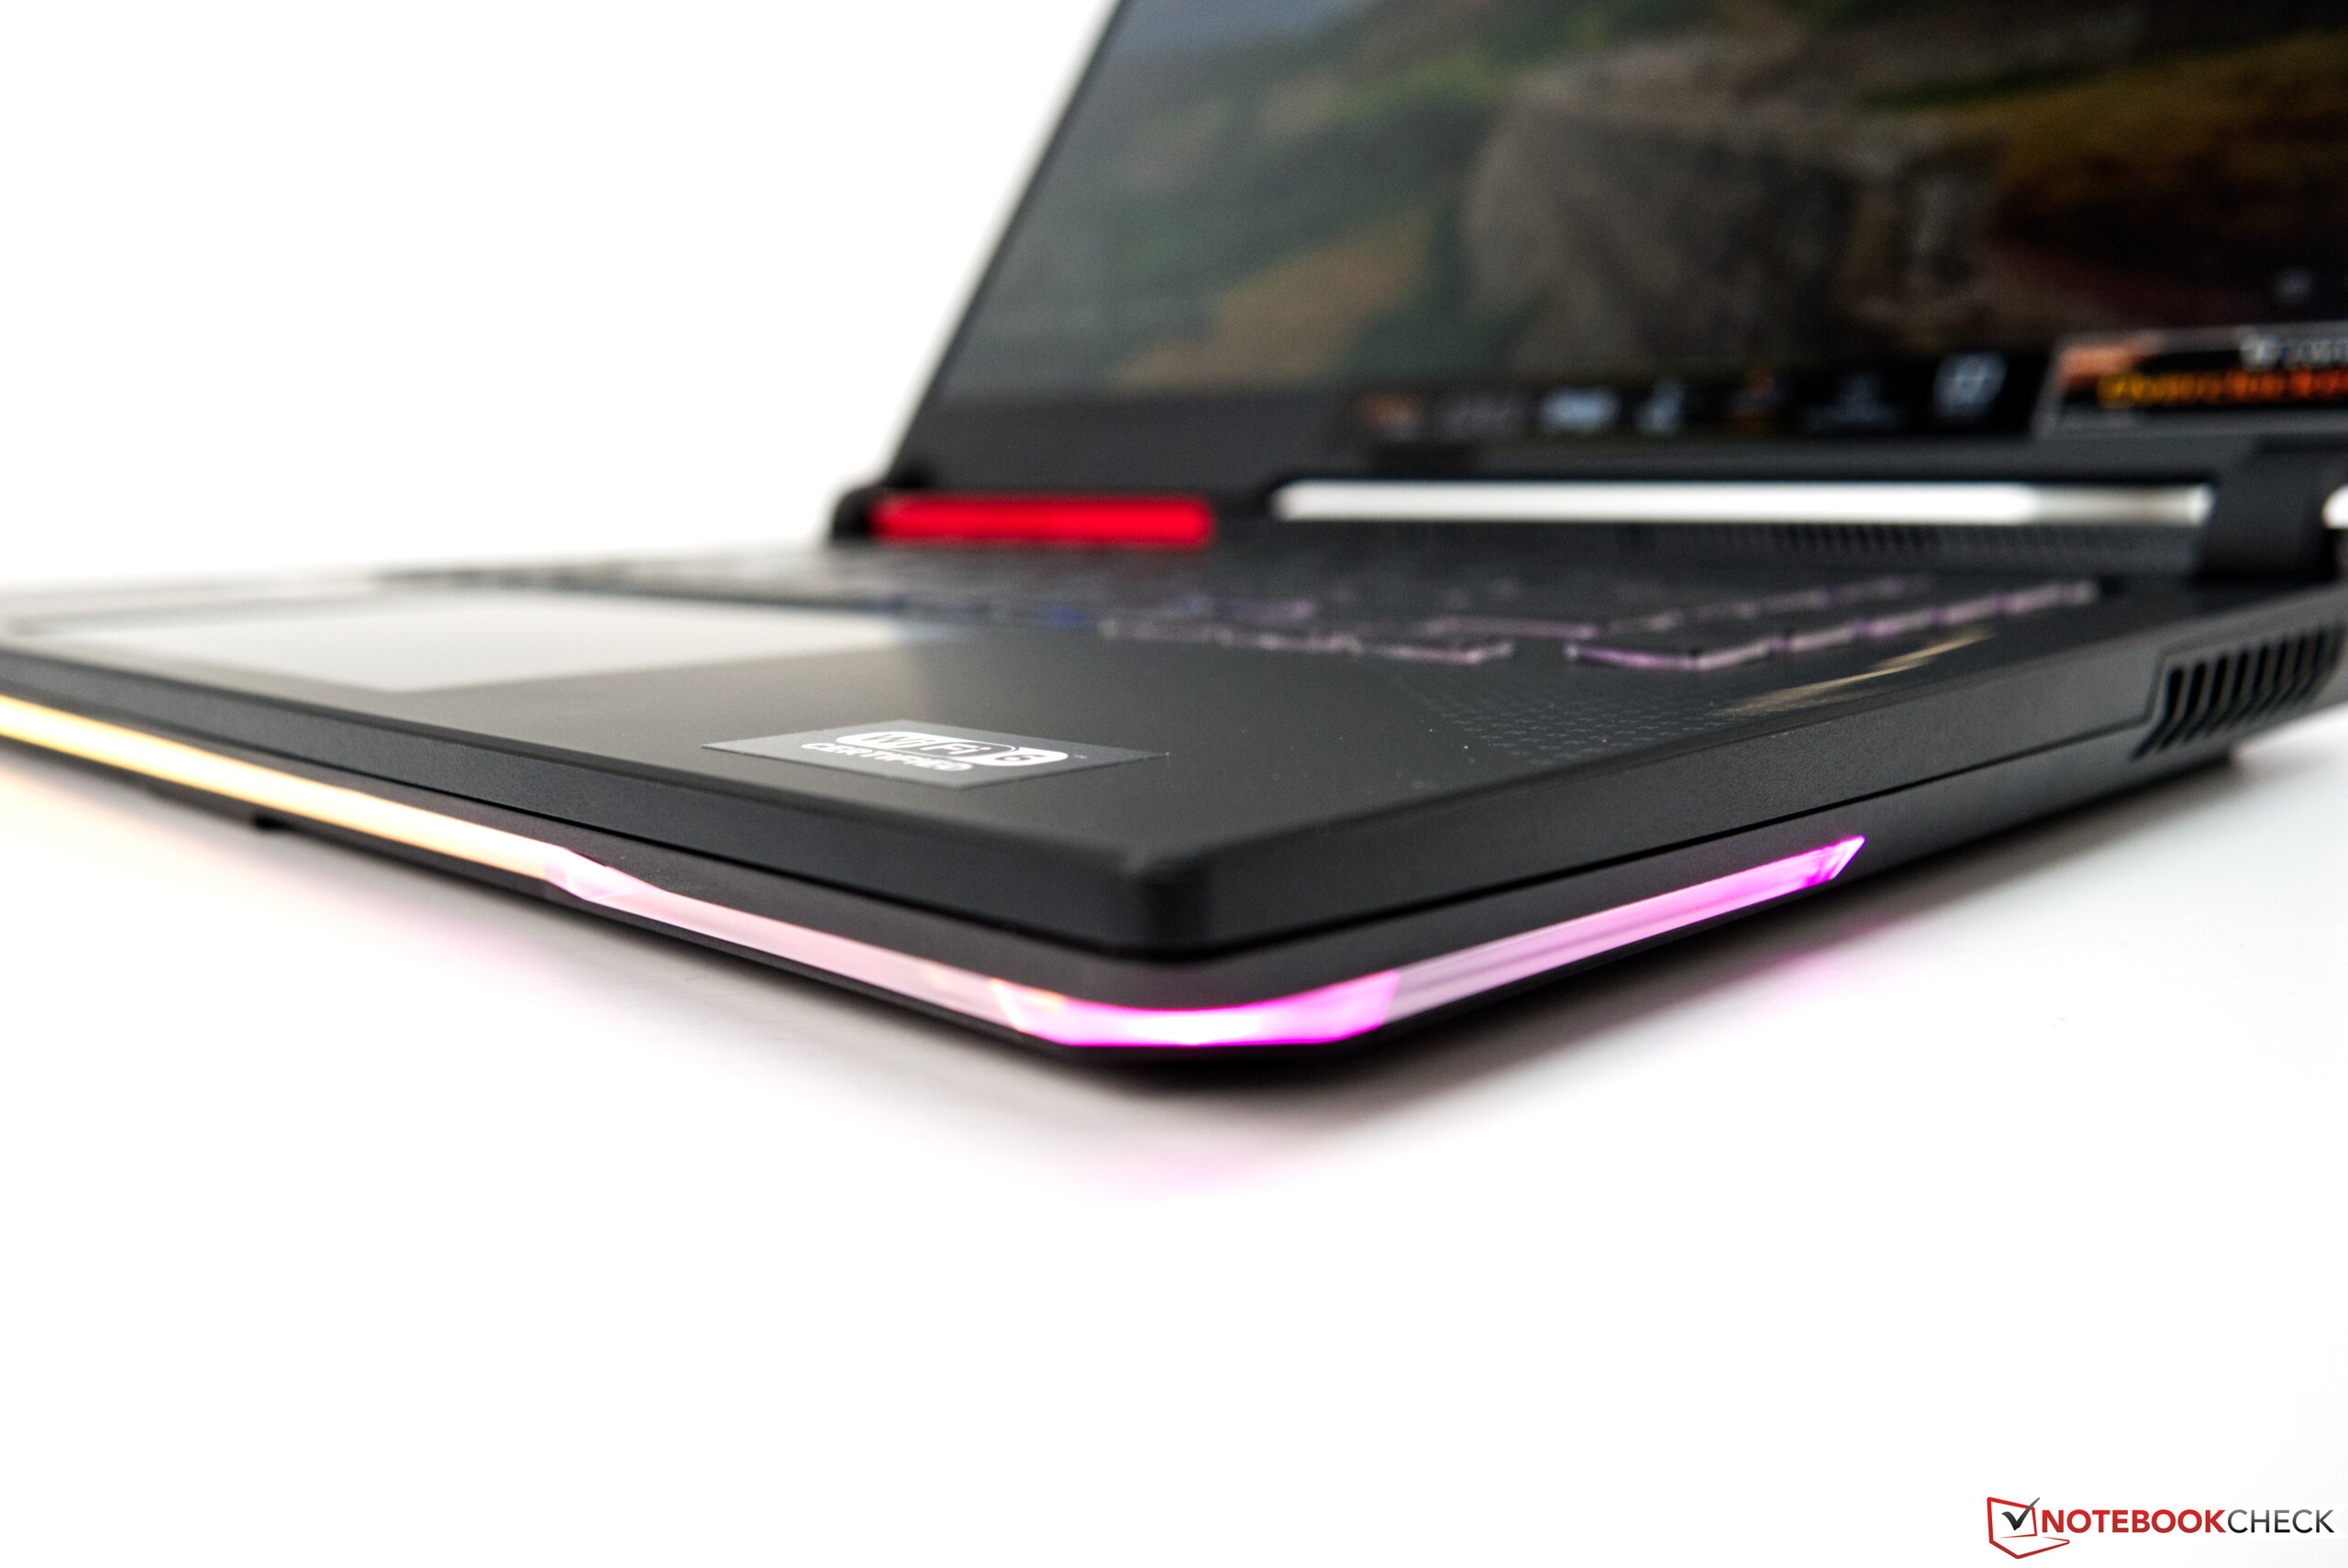
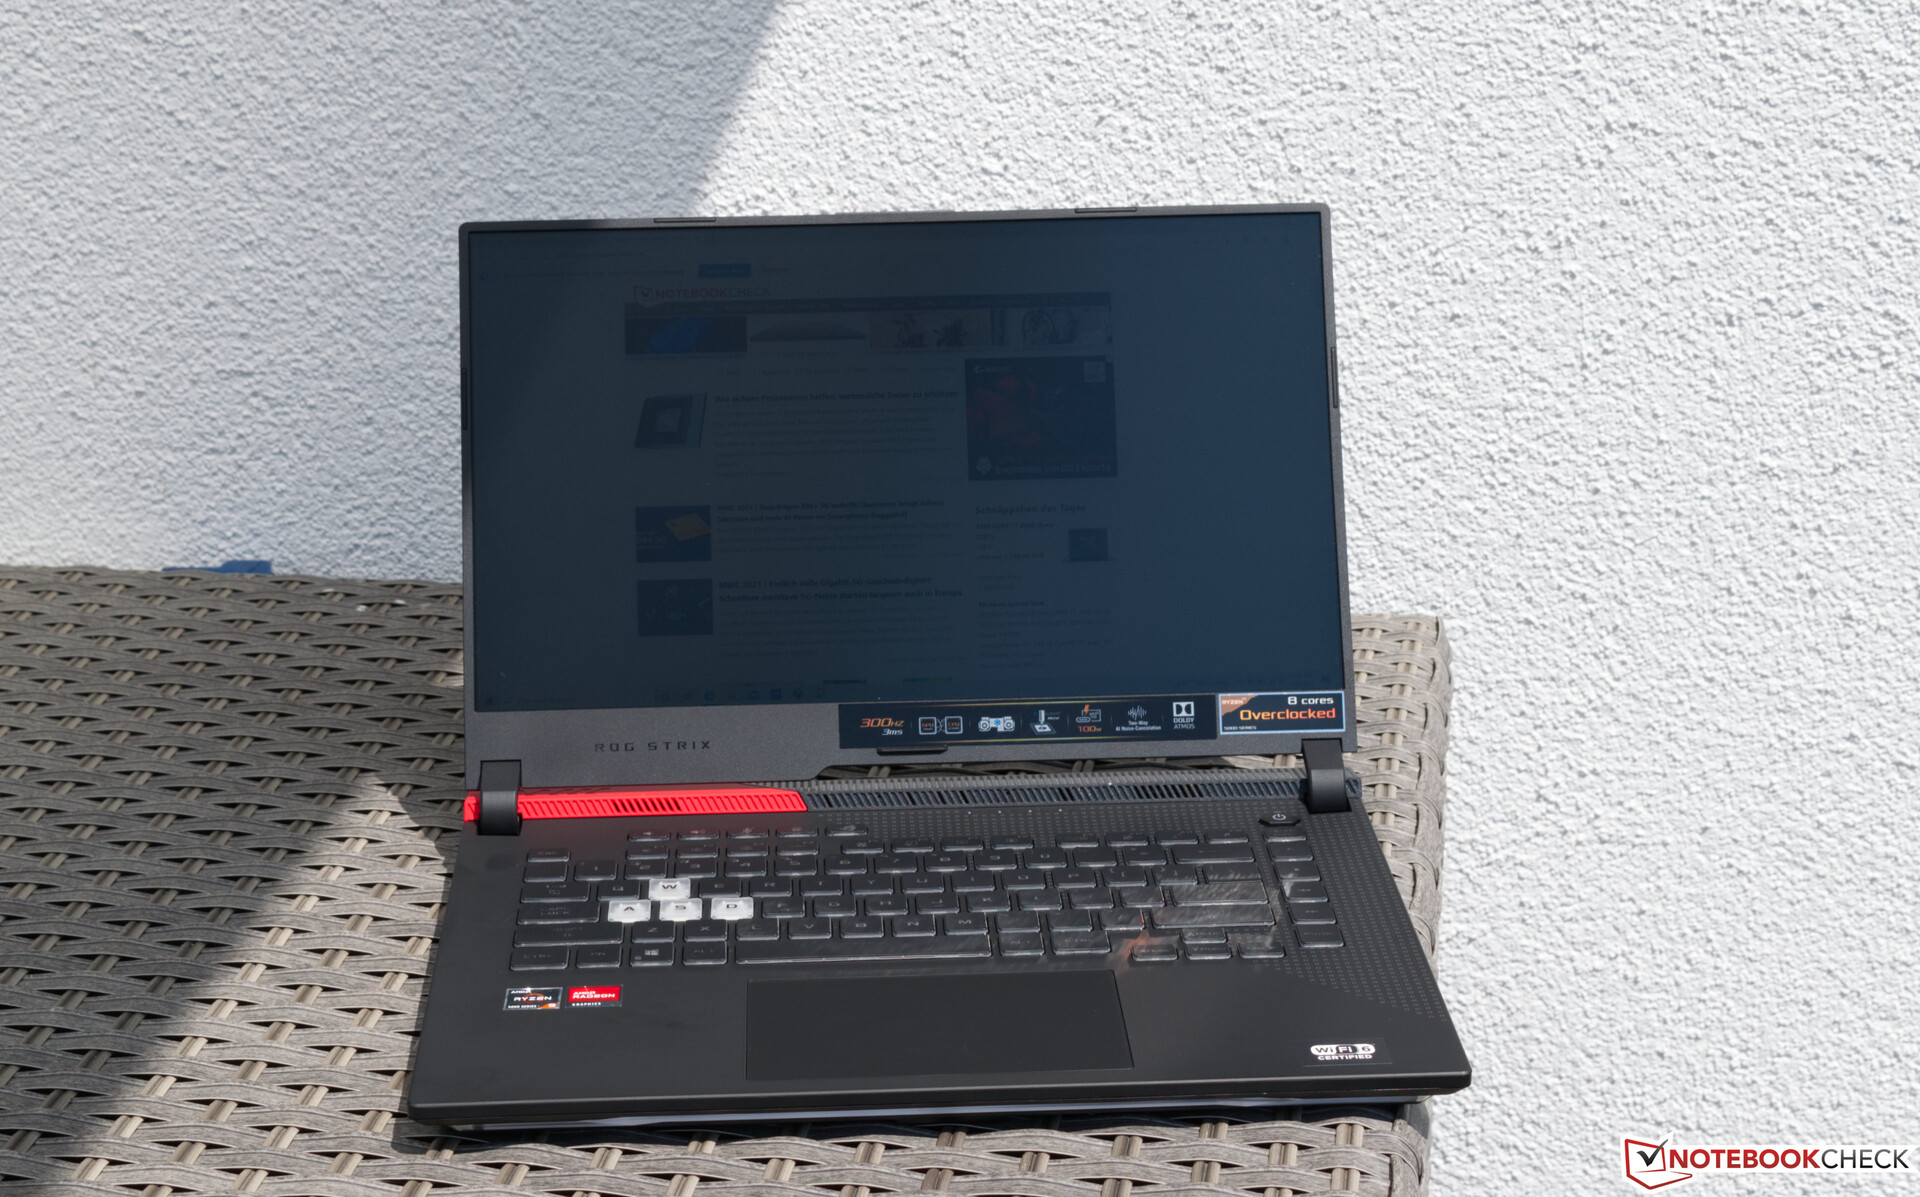
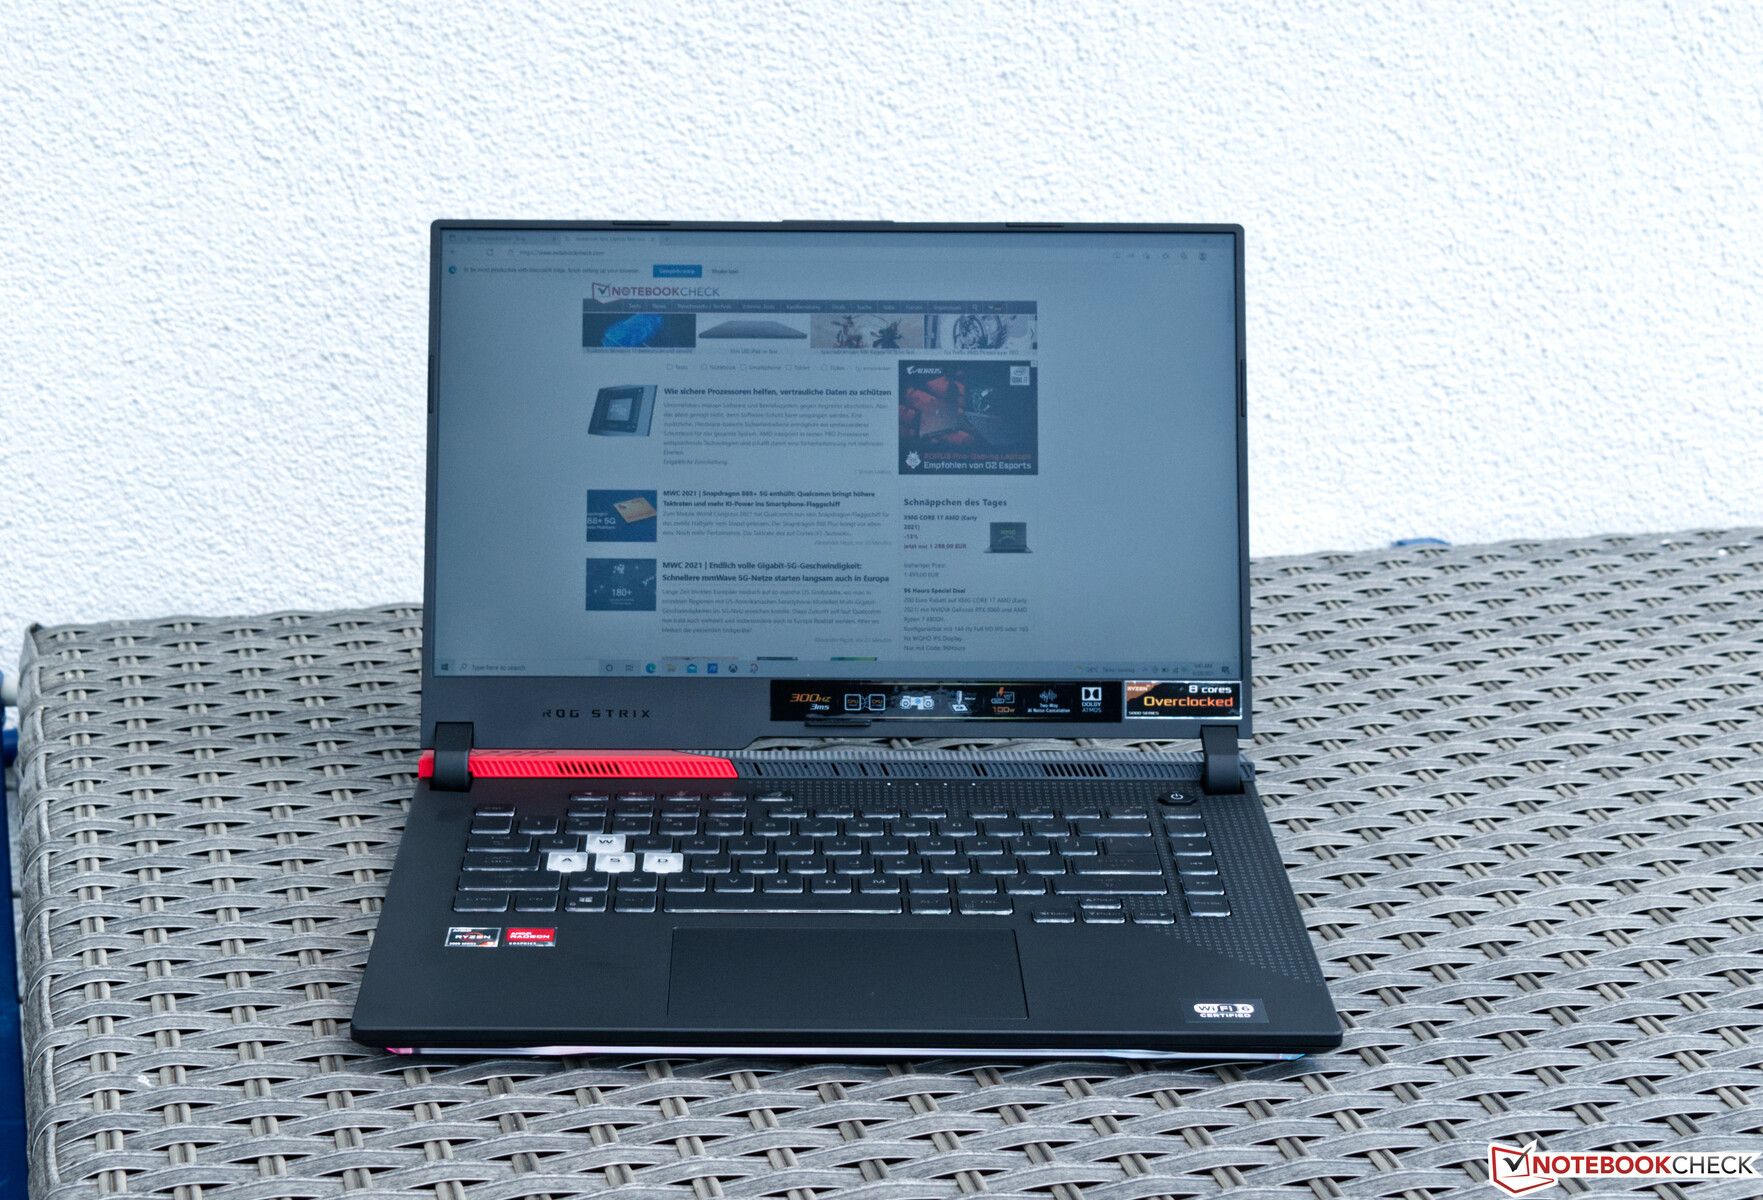
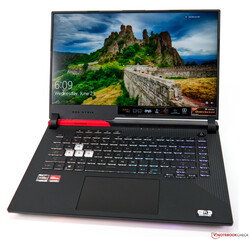
Case - A lot of plastic and a bit of RGB
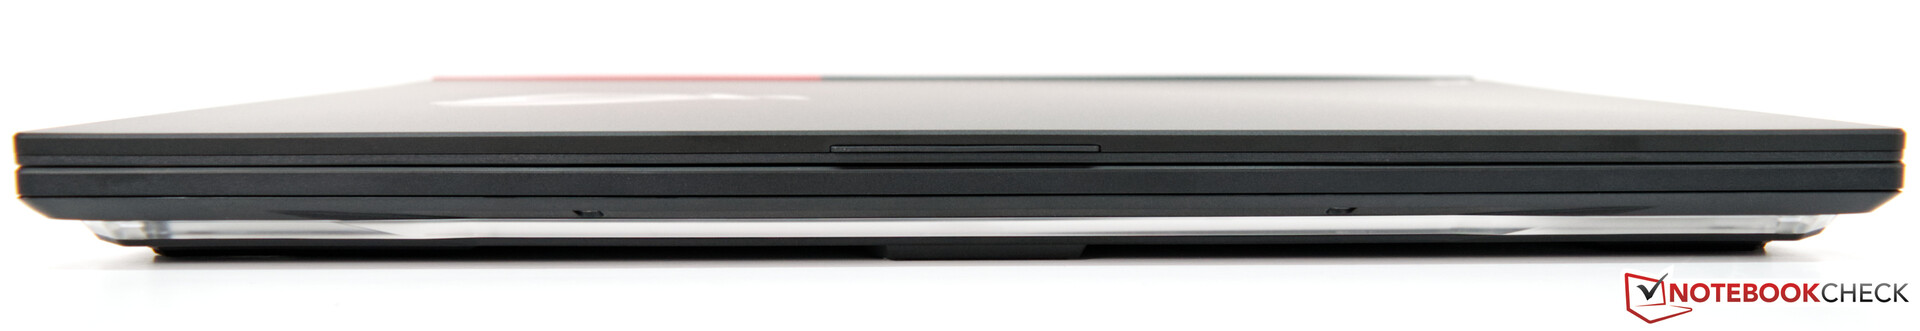
The case of the Asus ROG Strix G15 G513QY is made of plastic and metal. There are hardly any color details, because the device is completely black except for smaller accents. A plastic cover above the keyboard can be exchanged. The red cover can optionally be replaced with a silver or a dark, transparent cover. The display lid is decorated with an Asus logo, which also features a discreet backlight. The inside also somewhat emphasizes the gaming nature of the laptop by covering the base unit's right side with several small ROG letters. There's nothing to criticize in terms of workmanship. The surfaces also feel high quality and offer a good grip. Nevertheless, the device produces slight creaking noises when you try to twist it. The base unit offers good rigidity; however, since the display lid is made of aluminum, we would have expected a slightly better form stability. The lid absorbs localized pressure well, though, so that no ripples are visible on the display.
The hinges are quite smooth, and due to the laptop's own weight, the display can also be opened easily with one hand. At the same time, the maximum opening angle of about 120 degrees isn't very wide.


The Asus ROG Strix G15 G513QY's footprint isn't that much larger compared to the competition, placing the device in the midfield. Only the two Alienware devices are a bit more protruding in their dimensions. However, our Asus ROG Strix G15 G513QY is the heaviest at around 2.5 kilograms.
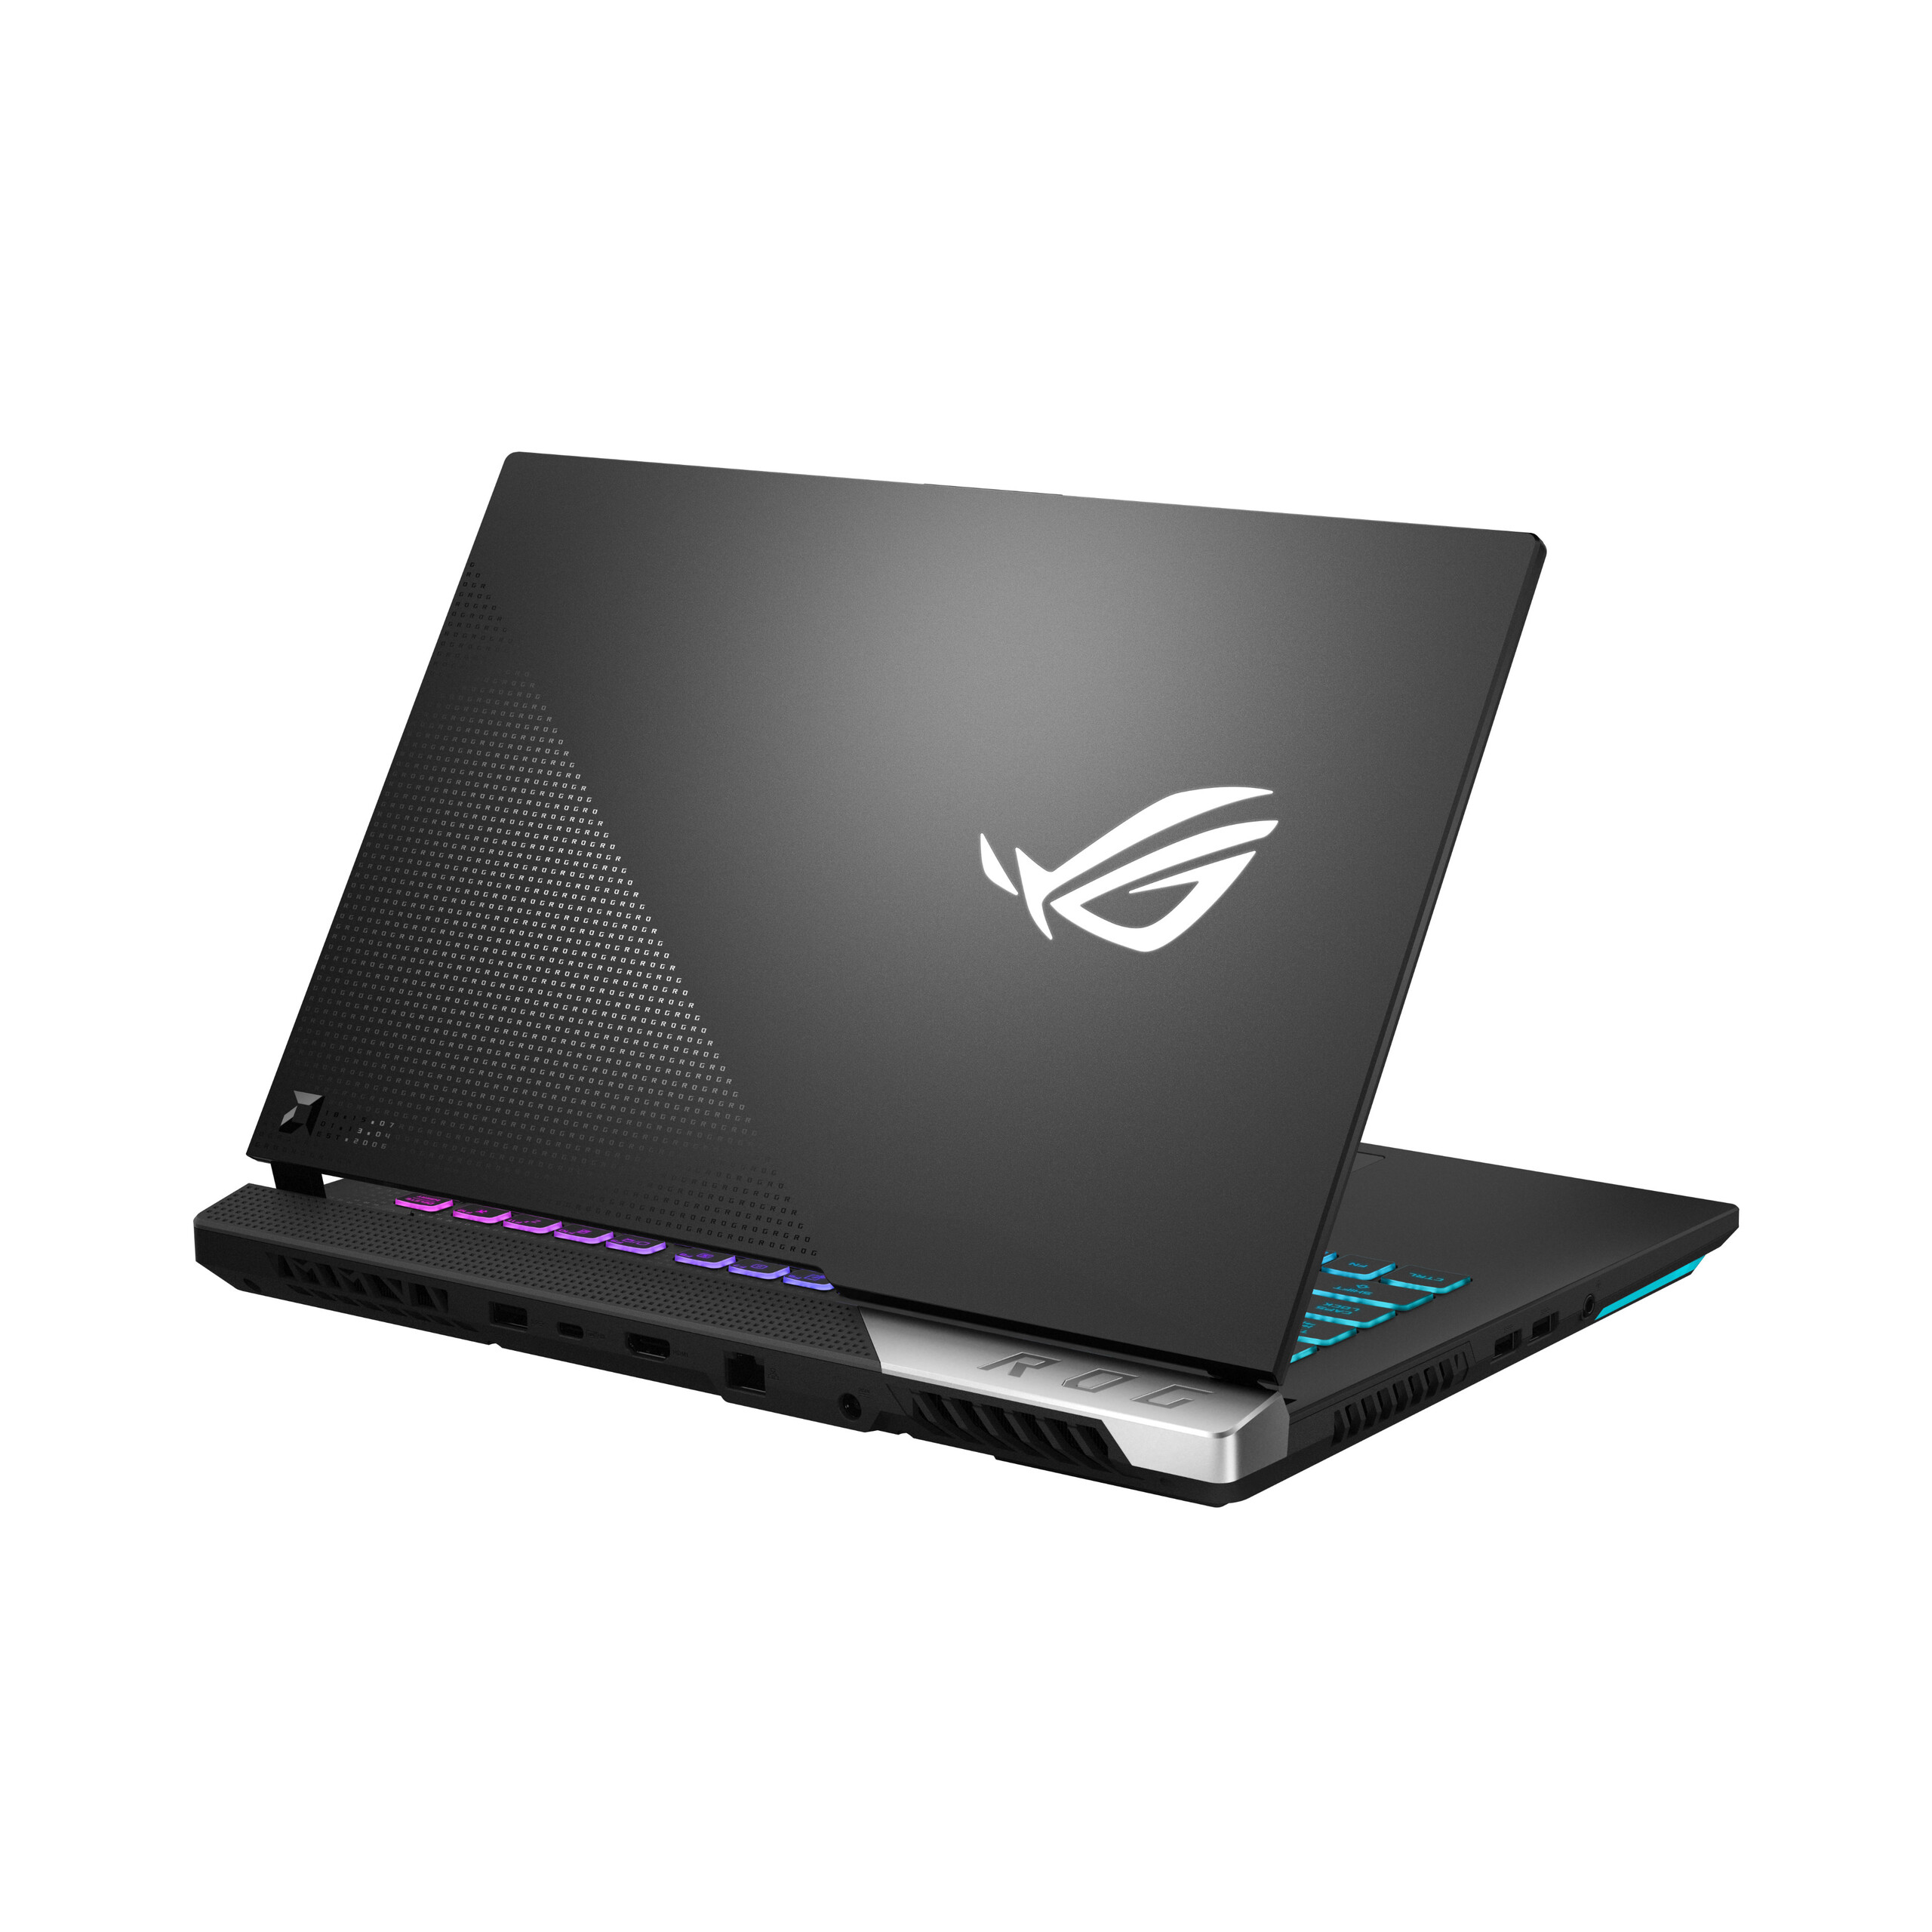
Connectivity - Leaves nothing to be desired!
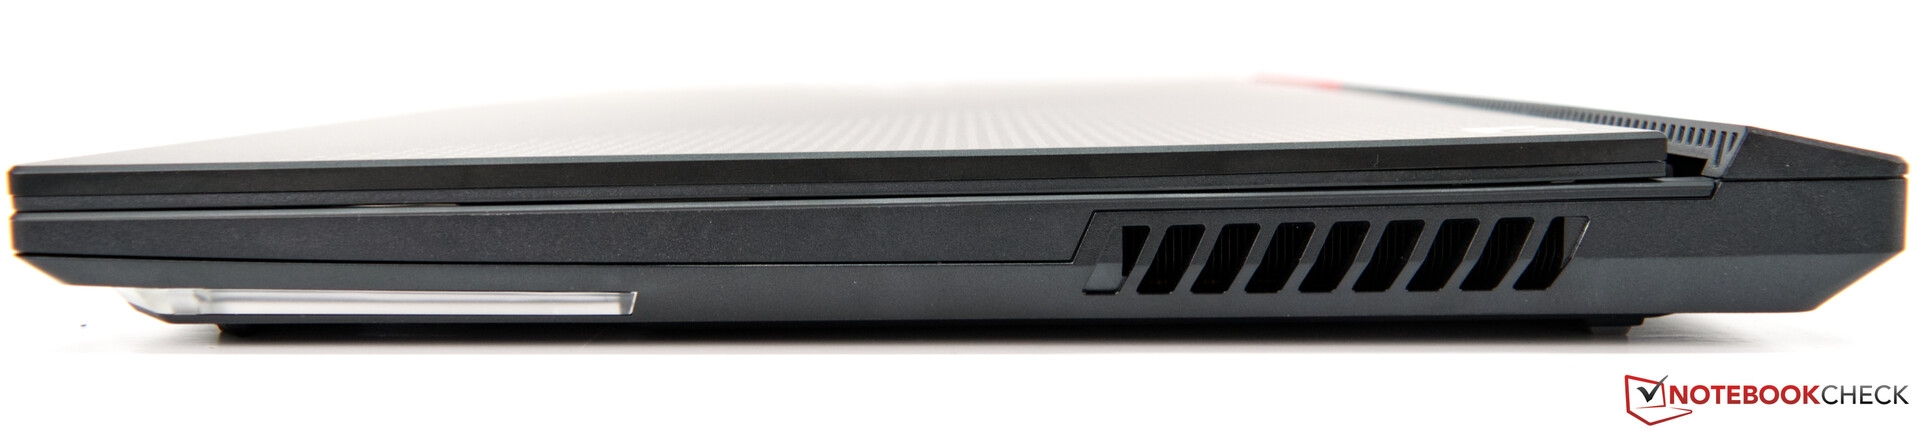
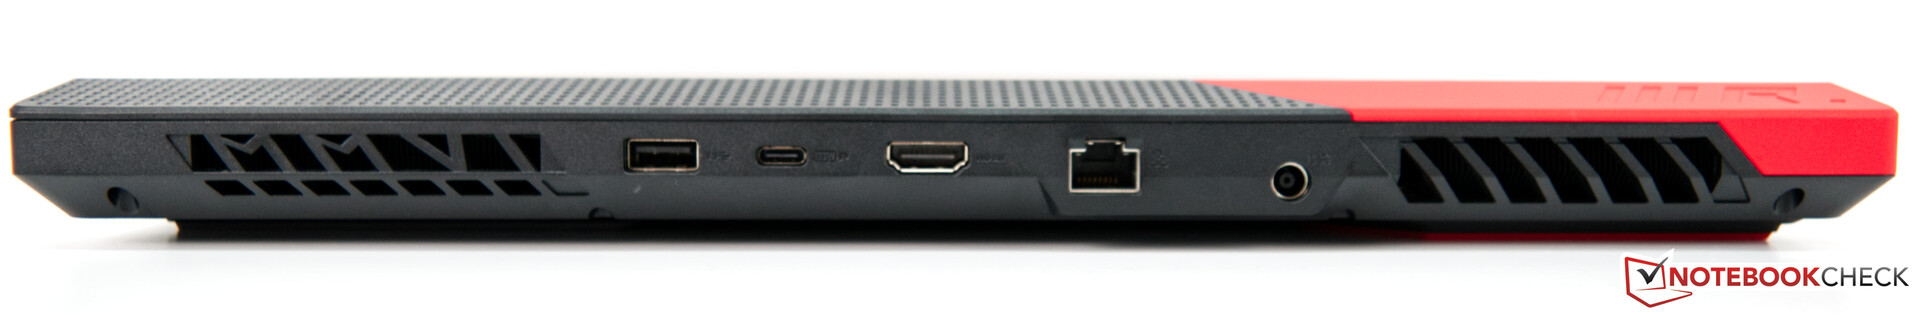
The port configuration of the Asus ROG Strix G15 G513QY is generous and also sensibly distributed. There are no ports on the right side, which gives the user enough room to use a mouse on the right side of the device. Consequently, the available ports are distributed across the left side and the back. A total of four USB ports is sufficient, and the USB-C port also offers the option of connecting an external display directly to the dedicated AMD Radeon RX 6800M using an adapter, and without having to take a detour through the SoC's iGPU, which is the case, unfortunately, when using the HDMI port that is included as well. In terms of performance, the use of the USB-C port for video output results in a gain of up to 10%. A card reader is not available.

Communication
A fast WiFi-6 AX module is installed in the Asus ROG Strix G15 G513QY, providing the latest standard. The router also has to support Wi-Fi 6 AX in order to be able to take full advantage of this performance. At the time of testing, we were only able to use a router with the AC standard. But there were no difficulties or unwanted connection drops with this combination, either. Those who prefer wired connections can also make use of these. The Asus ROG Strix G15 G513QY offers an RJ-45 port at the back that allows data transfers at up to 1 Gb/s.
Accessories
The laptop comes with the 280-watt power adapter and two additional plastic covers that can be interchanged on the base unit according to the user's taste.
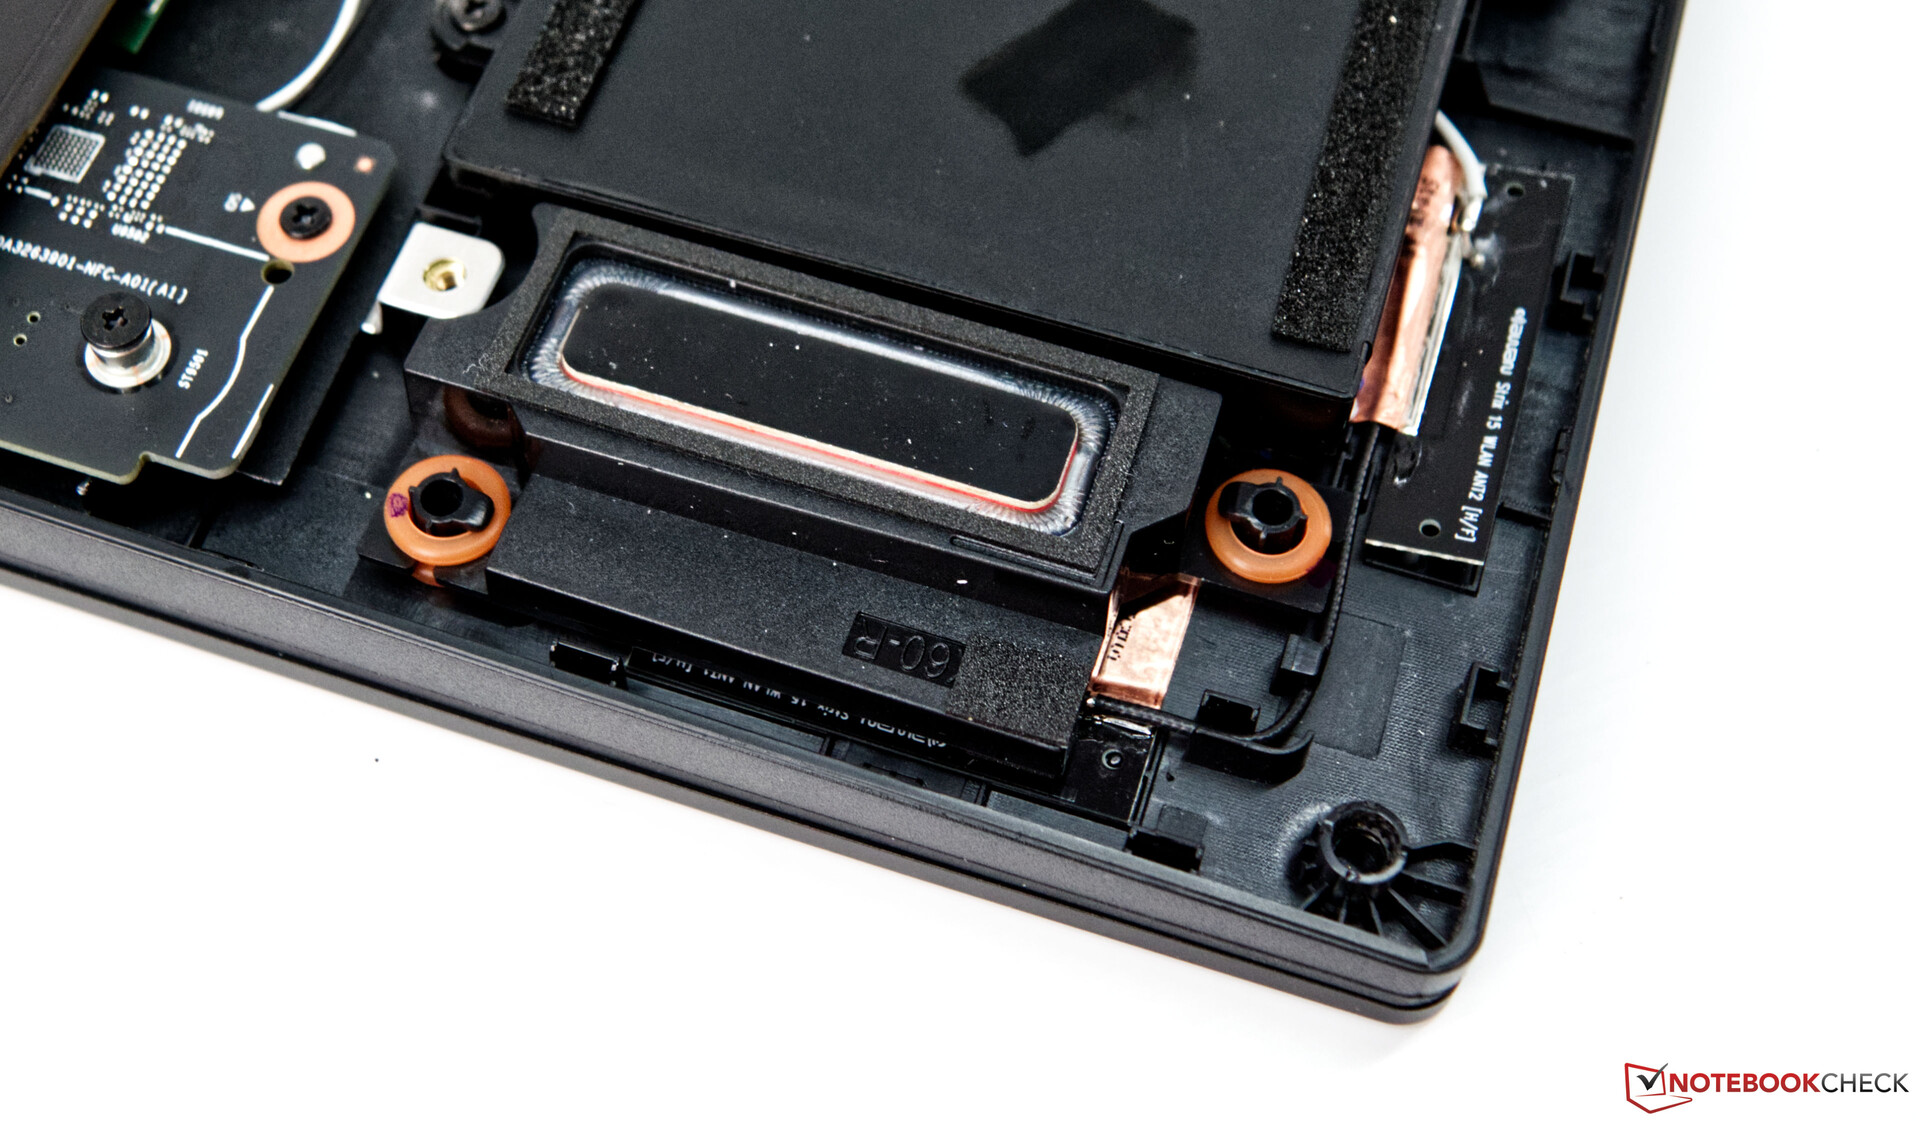
Maintenance
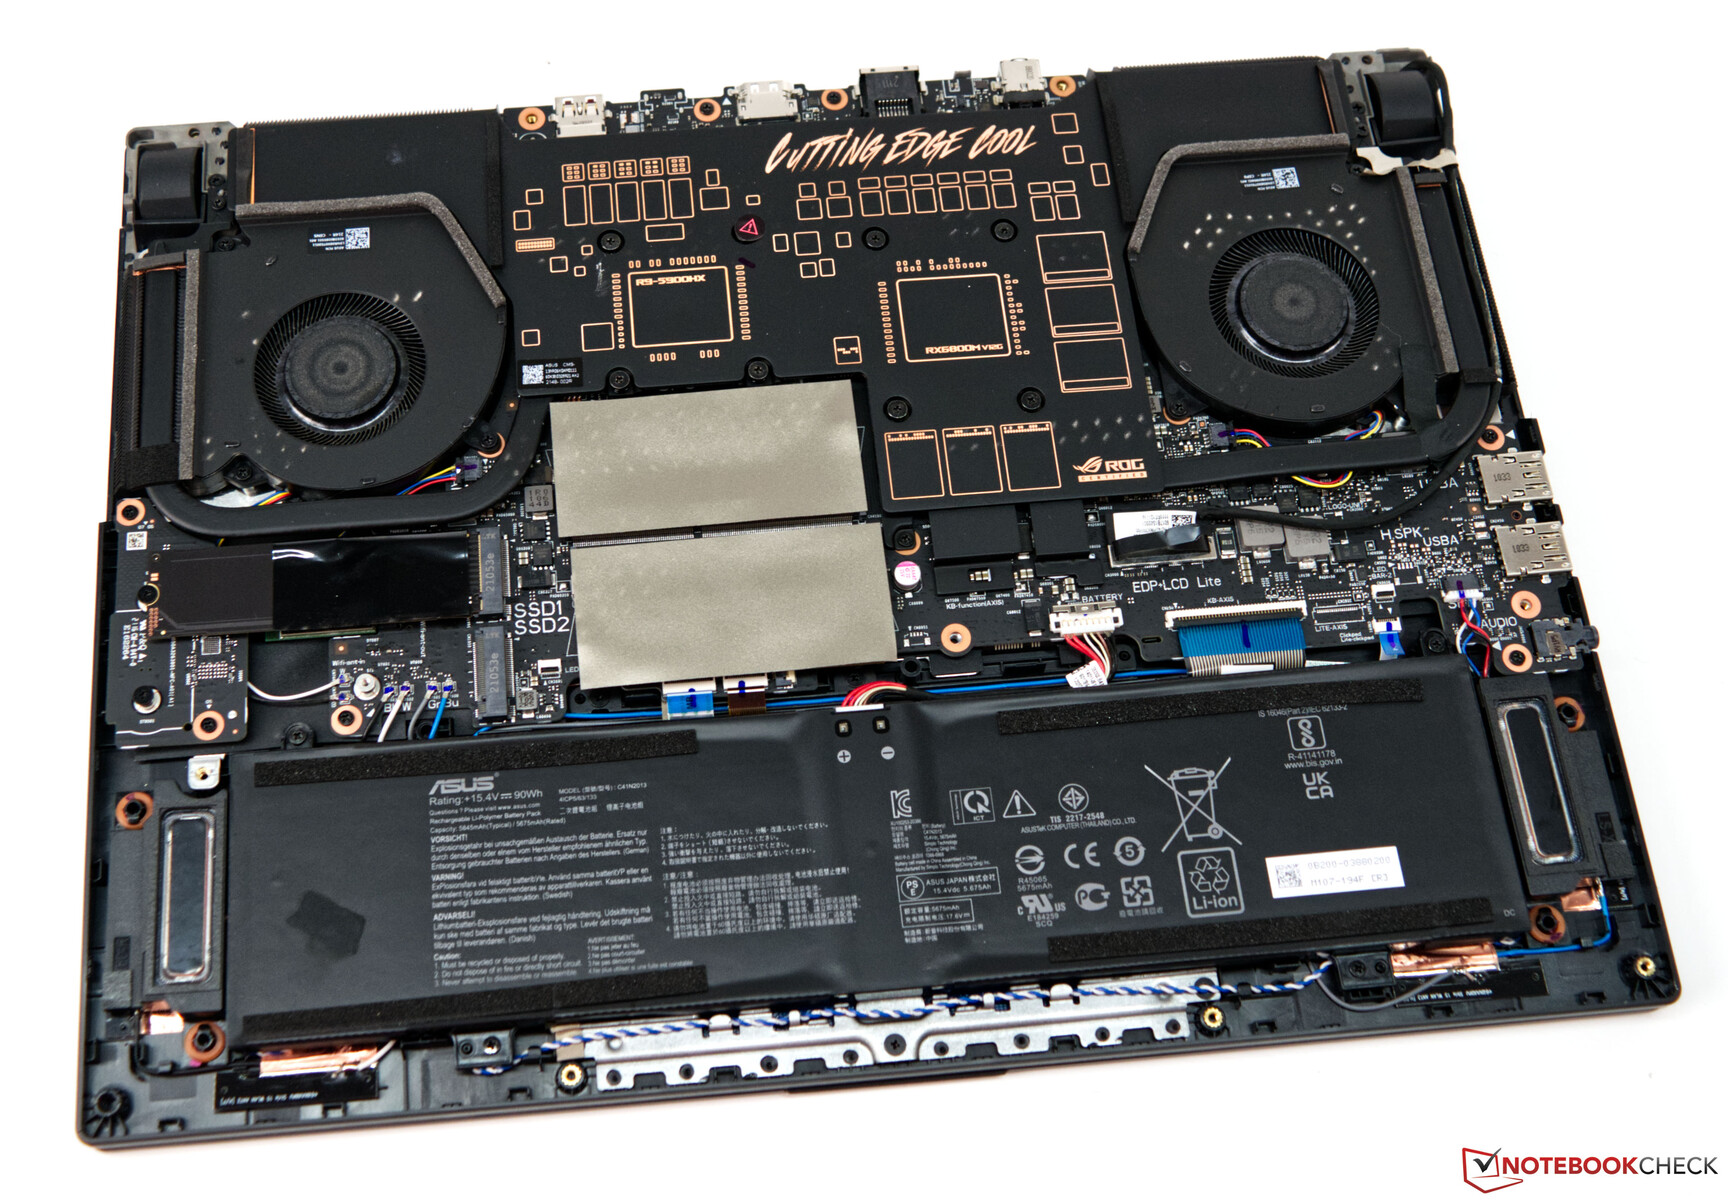
Maintenance tasks are actually relatively simple to carry out once the base cover has been removed. You should use the right tools, though, because the gaps are very narrow, and many plastic clips keep the cover firmly in place even after all the screws have been removed. Nevertheless, users don't have many options for expansion. The RAM slots are fully occupied, and only one additional mass storage device (M.2-2280) can still be installed.
Warranty
Since this is a pre-series device, we're unable to provide precise information regarding the warranty. The manufacturer will probably offer a 24-month warranty with Pickup and Return service, just like with the rest of its lineup.
Input devices
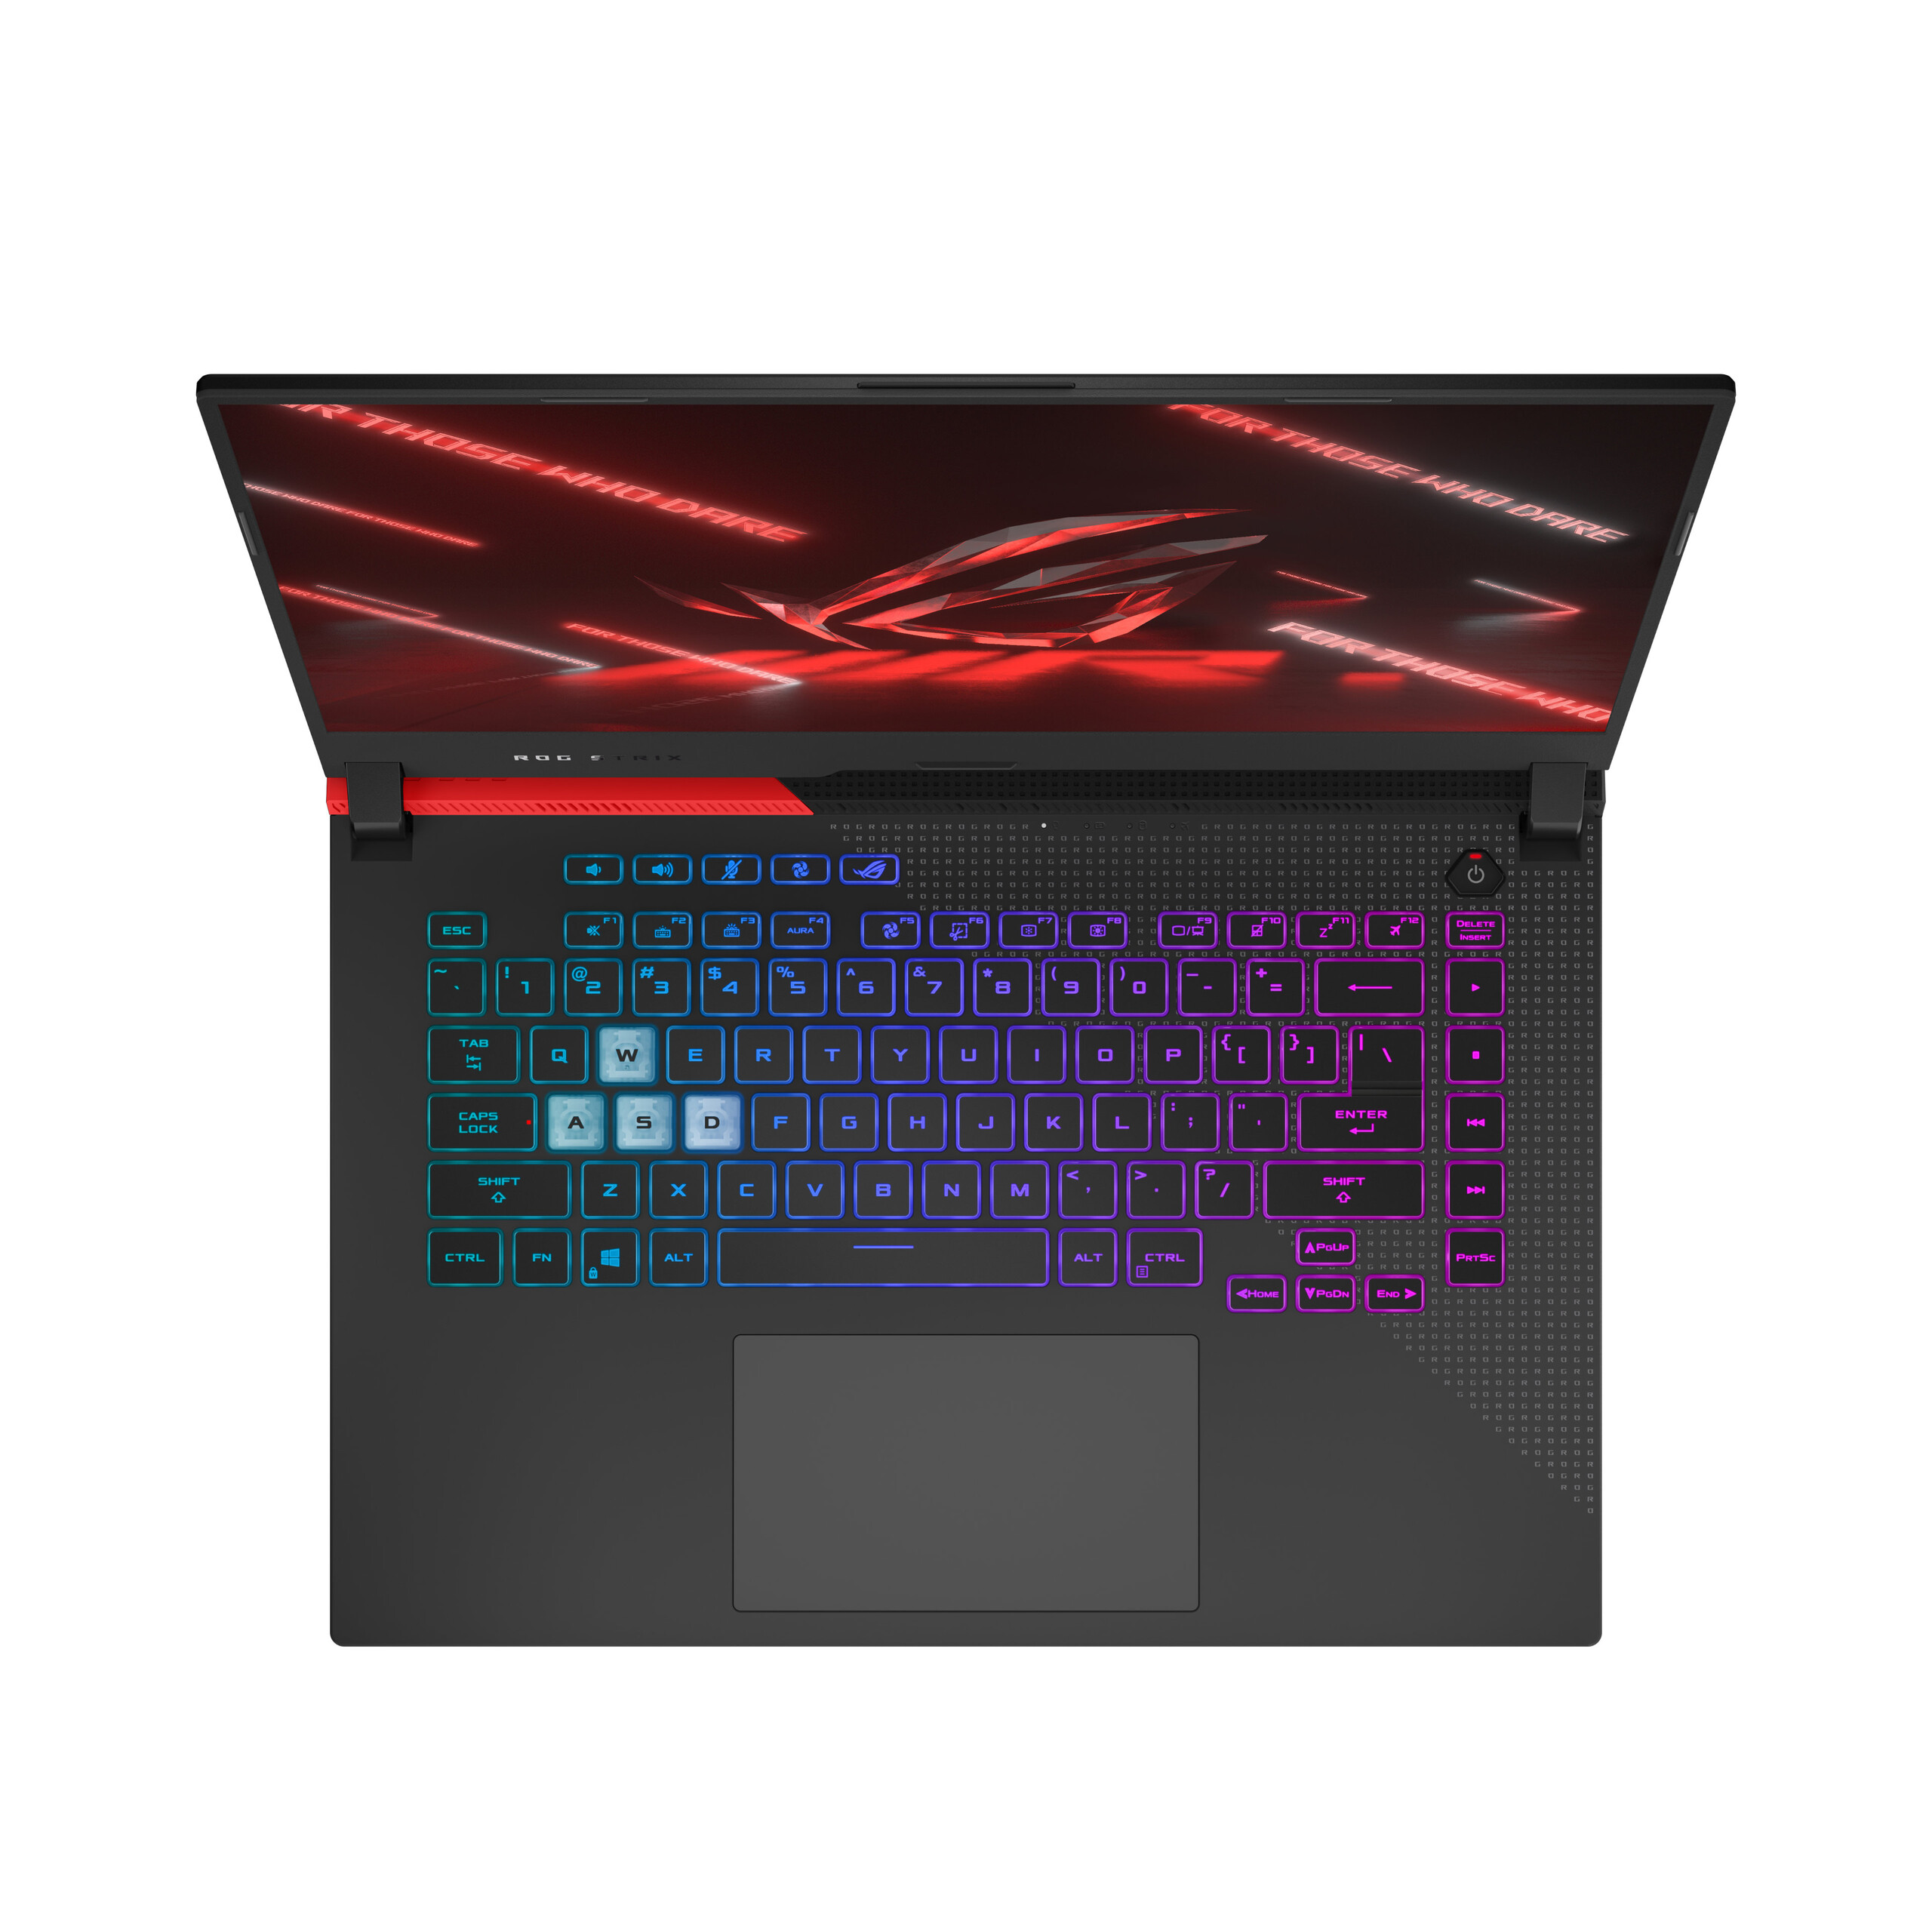
Keyboard and touchpad
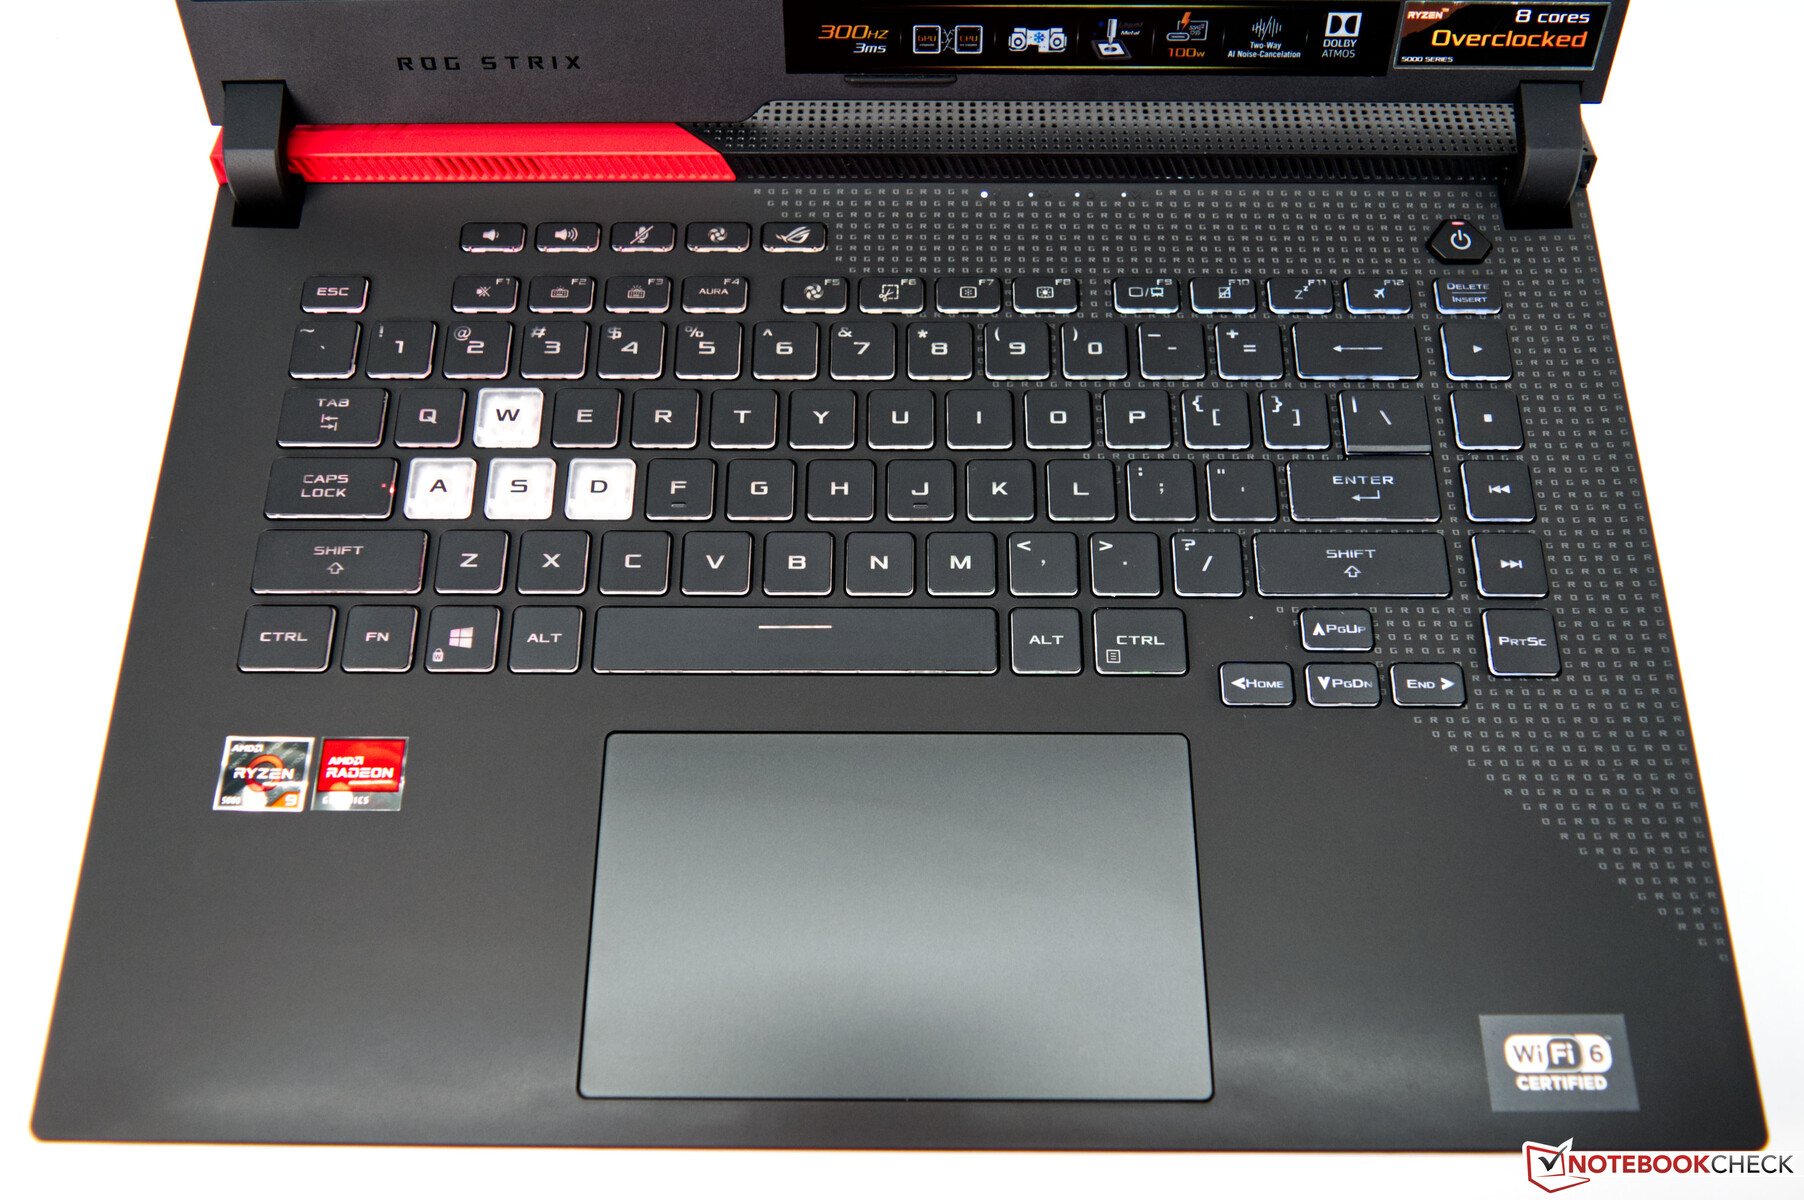
Asus uses a six-row chiclet keyboard without a numeric keypad but with complete RGB backlighting. This is the same model that is also used in the Asus ROG Strix G15 G513QR. The same advantages and disadvantages also apply, such as the very small arrow keys. There is no explanation for this in terms of space, though. The keyboard of the Asus ROG Strix G15 G513QY is good, the pressure point is clearly perceptible, and the stroke is slightly muffled. Nevertheless, this doesn't lead to a mushy typing experience. In addition, there are a few multimedia control keys for easier use. However, our test sample loses the comparison with a classic mechanical keyboard. The relatively quiet typing noise should be highlighted as a positive aspect.
Asus also bases the ClickPad on the identically built Asus ROG Strix G15 G513QR and offers a good size of 13 x 7.7 cm. The smooth surface normally allows for precise inputs. The bottom input buttons make themselves noticed with a quiet click when pressed. The touchpad supports standard two-finger gestures.
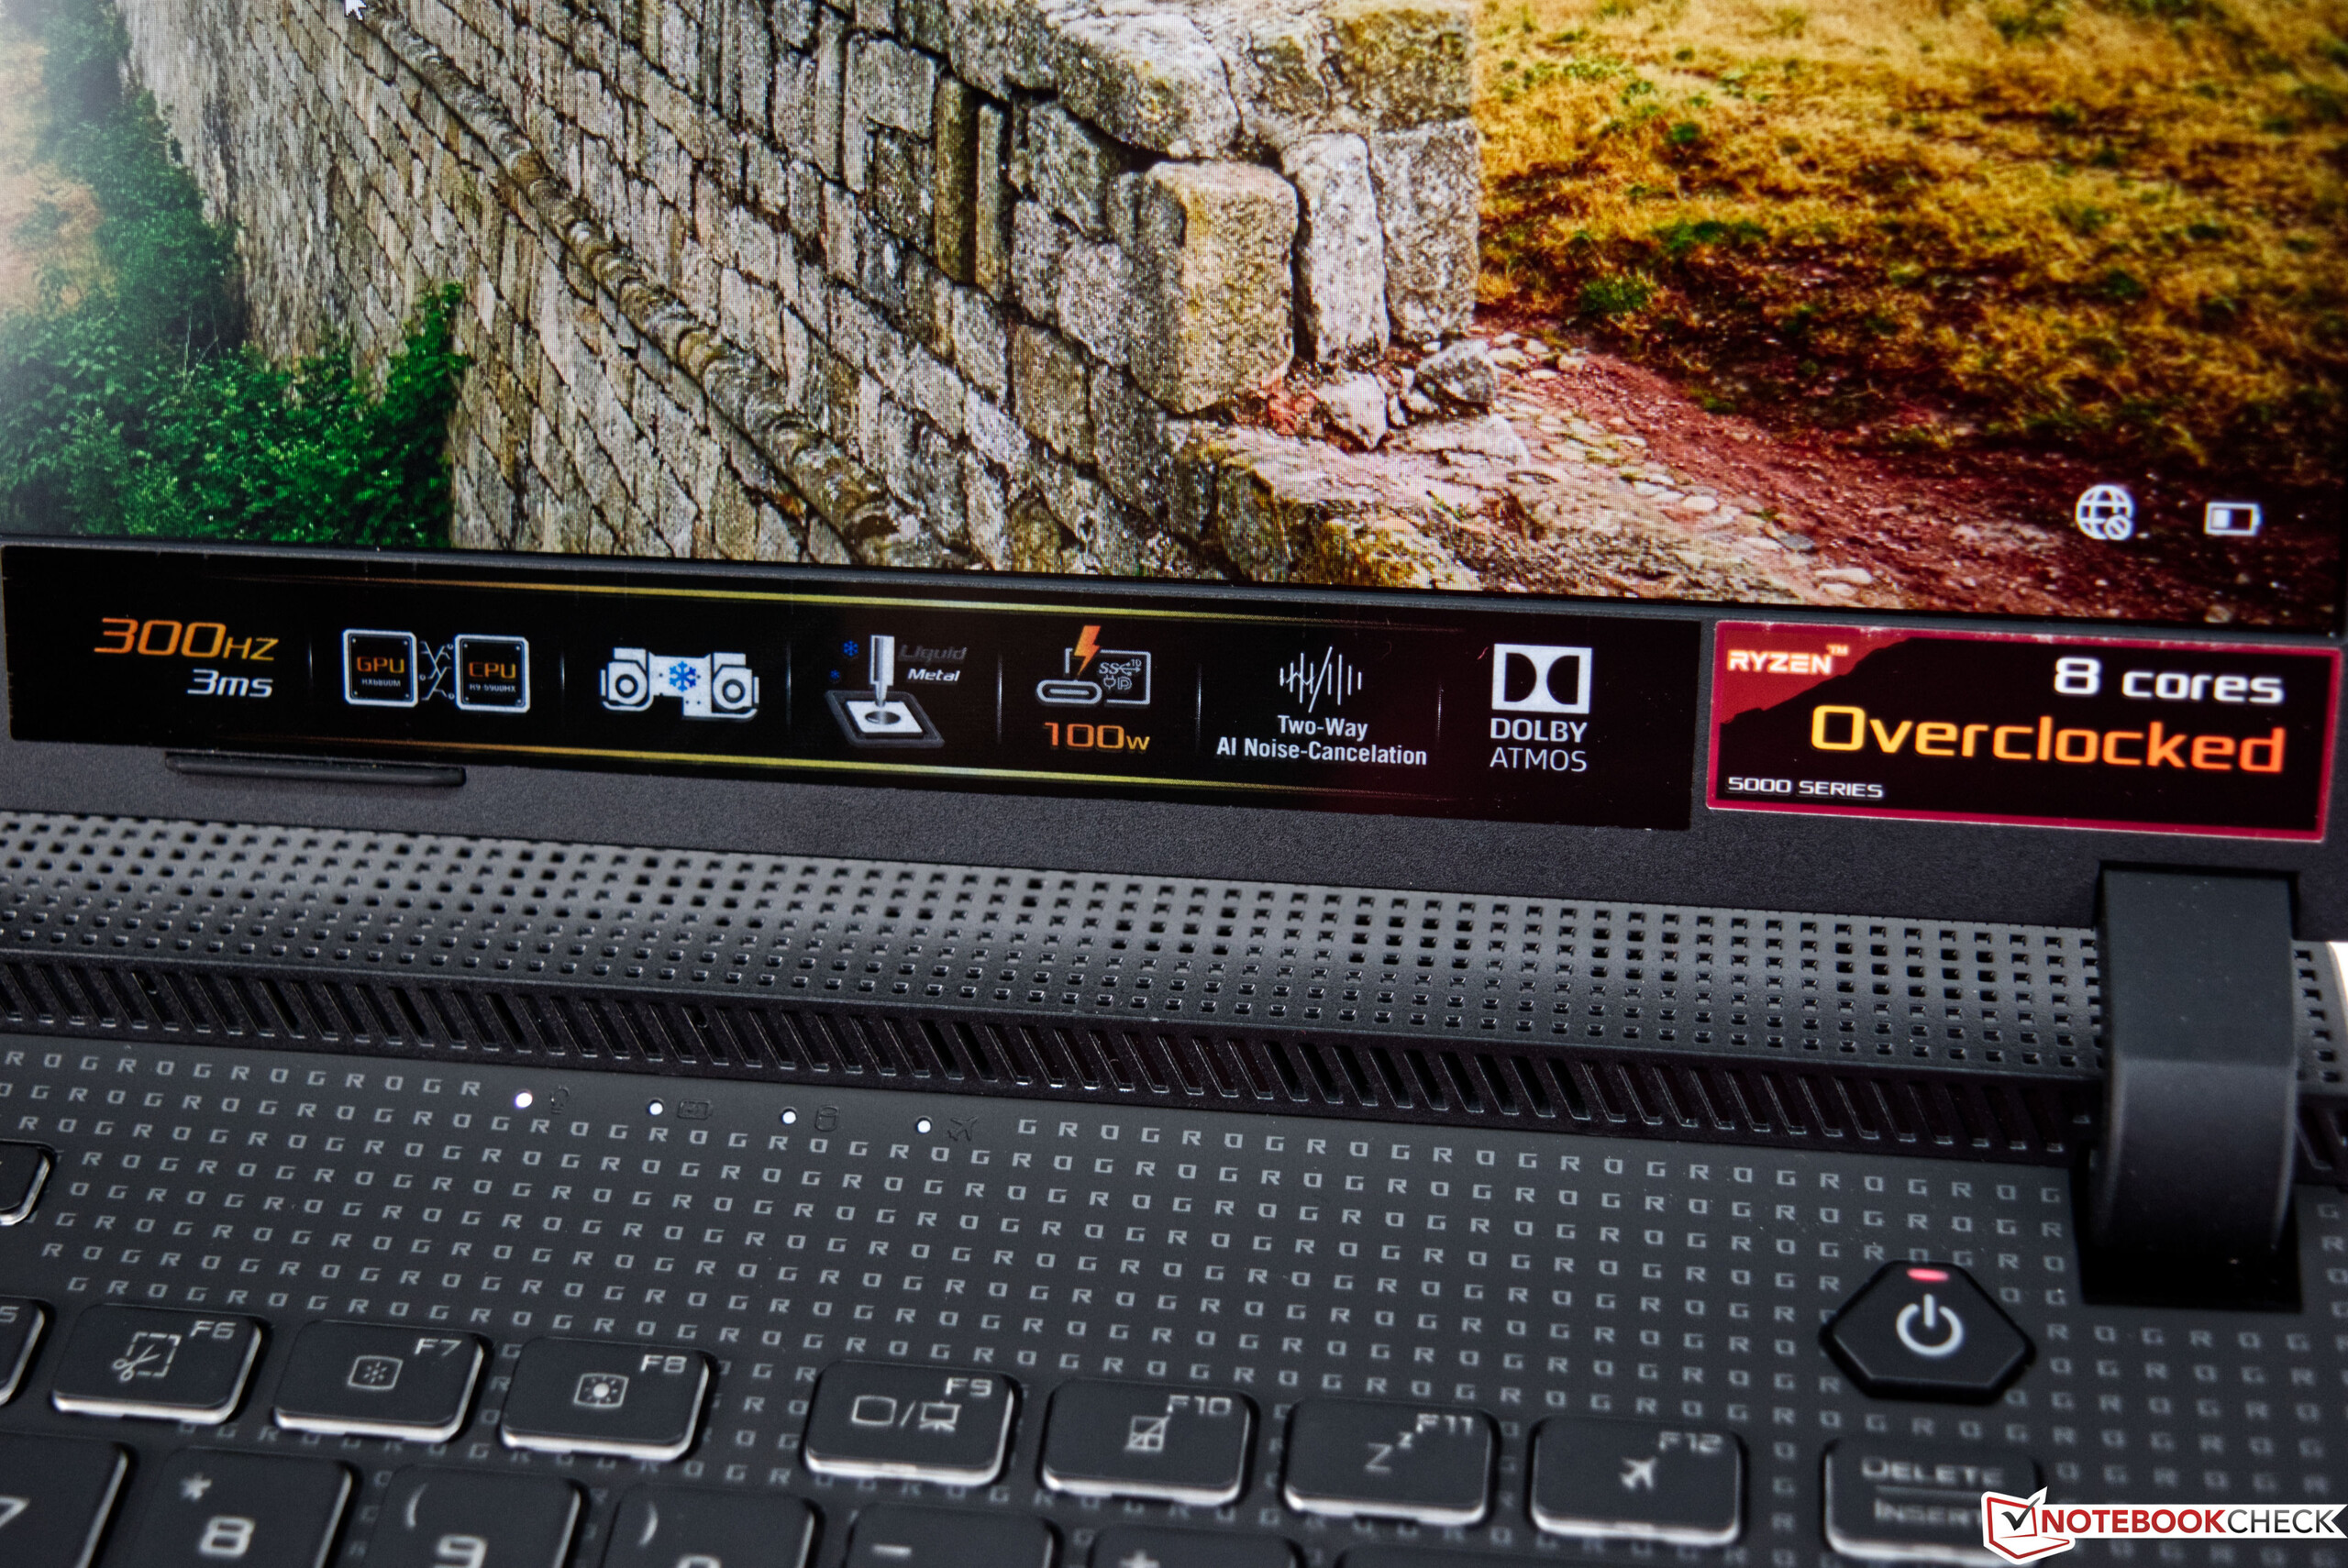
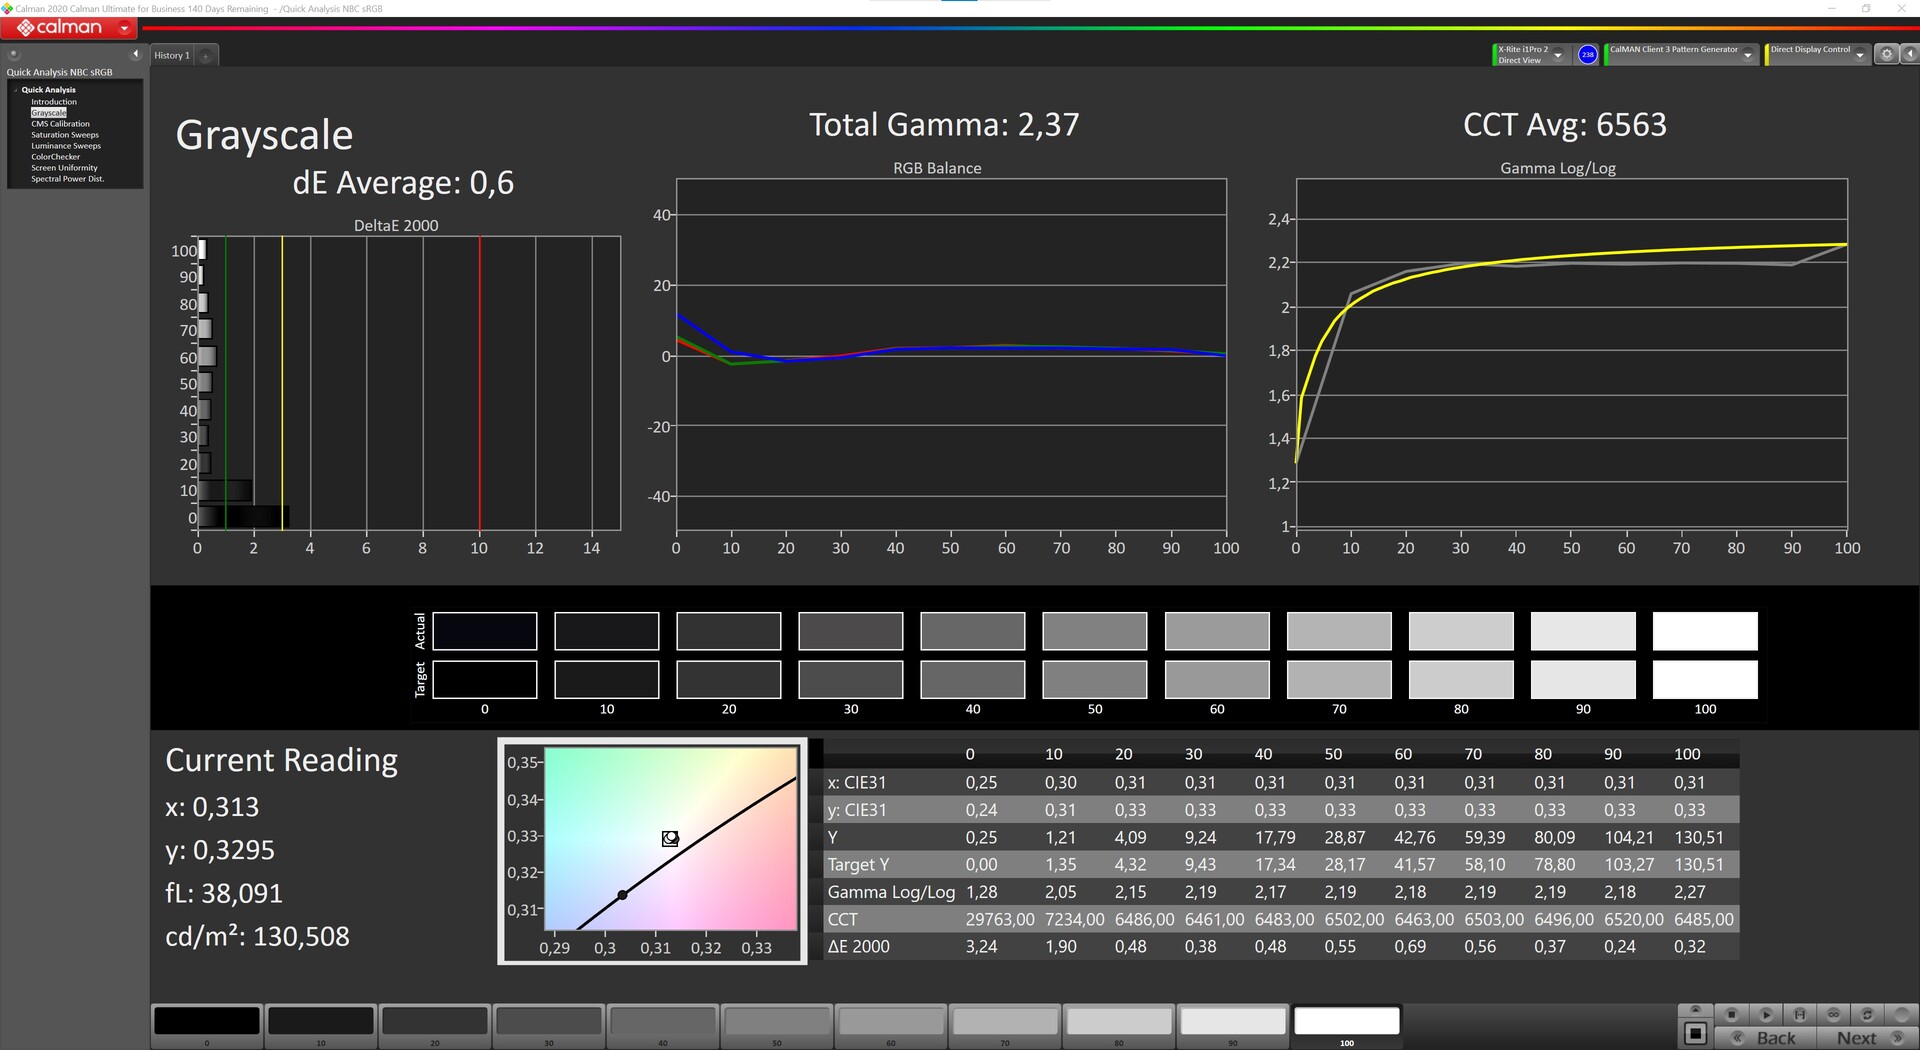
Display - 300 Hz and no PWM

Our review sample is equipped with a matte Full HD IPS panel, and with its high 300 Hz refresh rate, it offers an extremely fast picture. Alternatively, the Asus ROG Strix G15 G513QY will likely be available with a WQHD display, just like the Asus ROG Strix G15 G513QY. It offers a slightly higher resolution, but the refresh rate is only 165 Hz. The Adaptive Sync option that is supported by the built-in display should also be mentioned.
With an average brightness of 283 cd/m², our test sample suffers in comparison, but it offers a decent contrast ratio due to the low black level. Nevertheless, you have to deal with some clouding at the display's edges. Fortunately, no PWM is used for brightness control. The response times of 8 and 10 ms, respectively, are roughly on par with the competition.
| |||||||||||||||||||||||||
Brightness Distribution: 86 %
Center on Battery: 176 cd/m²
Contrast: 1224:1 (Black: 0.25 cd/m²)
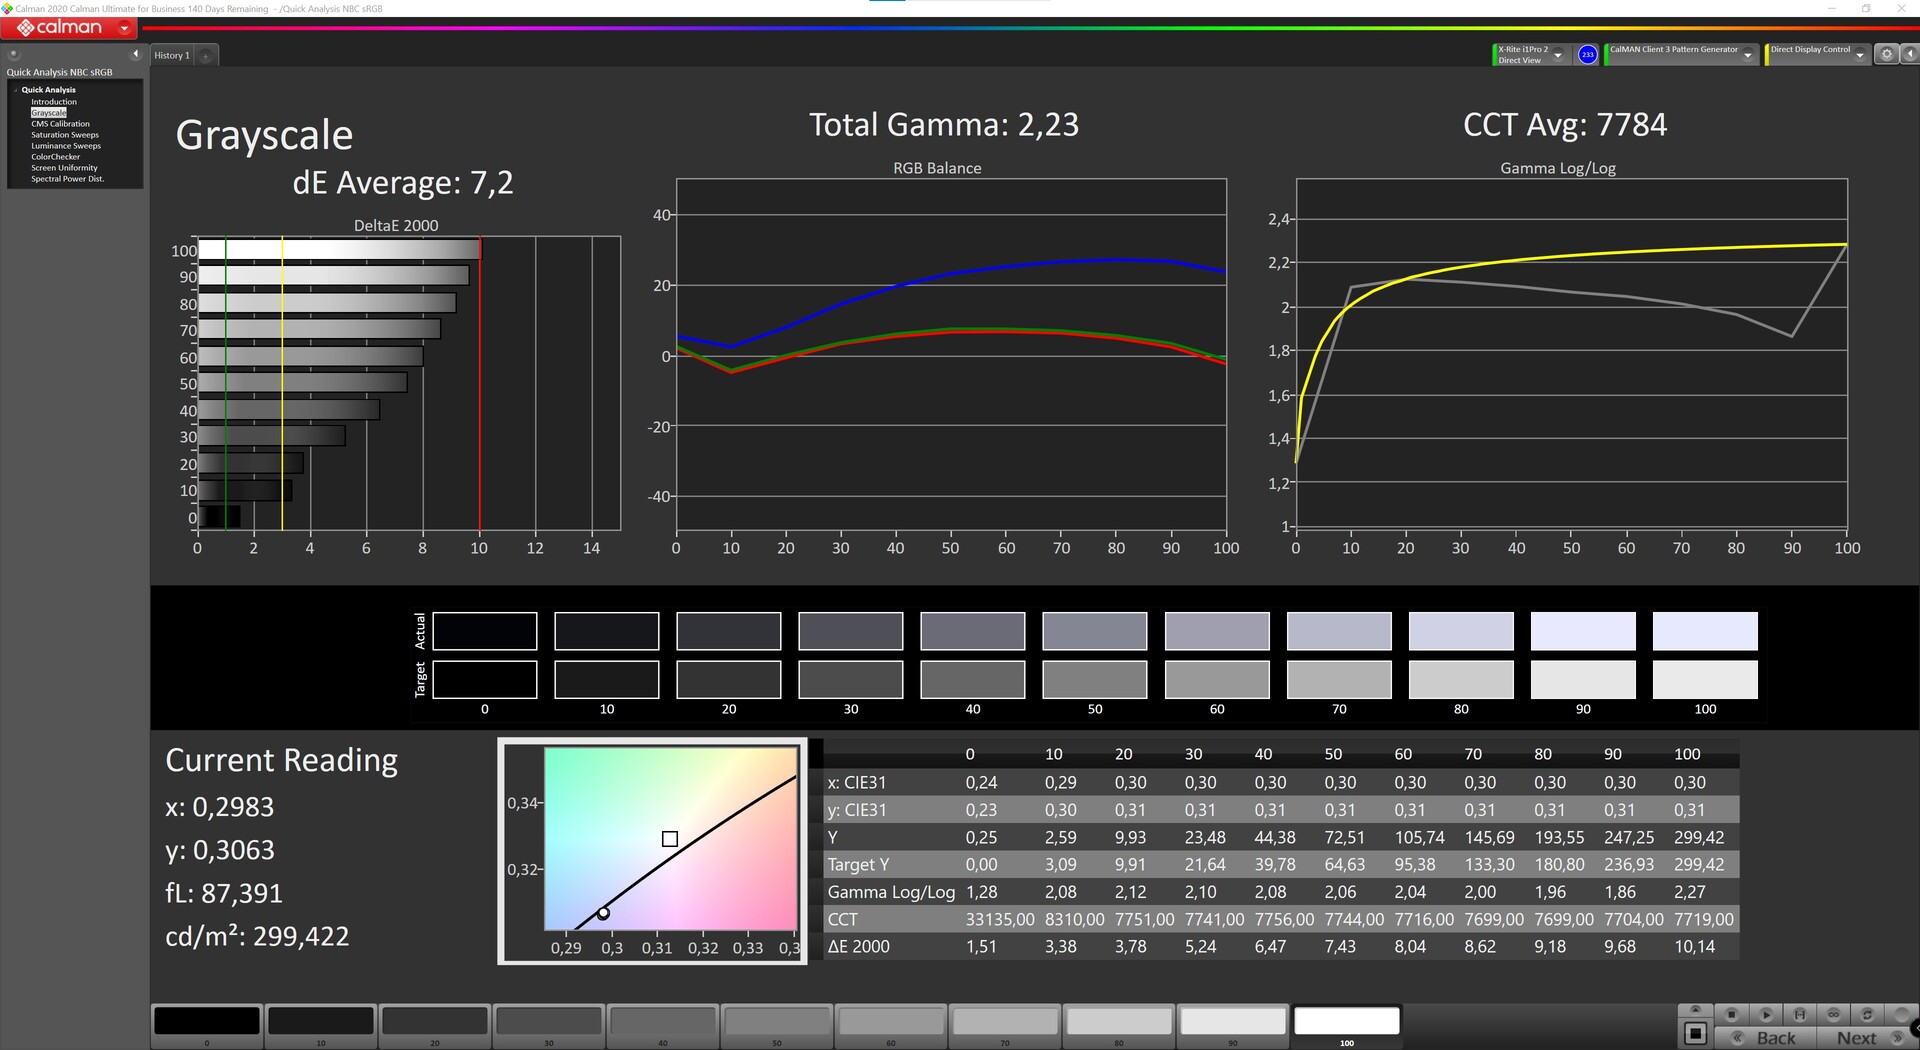
ΔE ColorChecker Calman: 4.97 | ∀{0.5-29.43 Ø4.77}
calibrated: 0.7
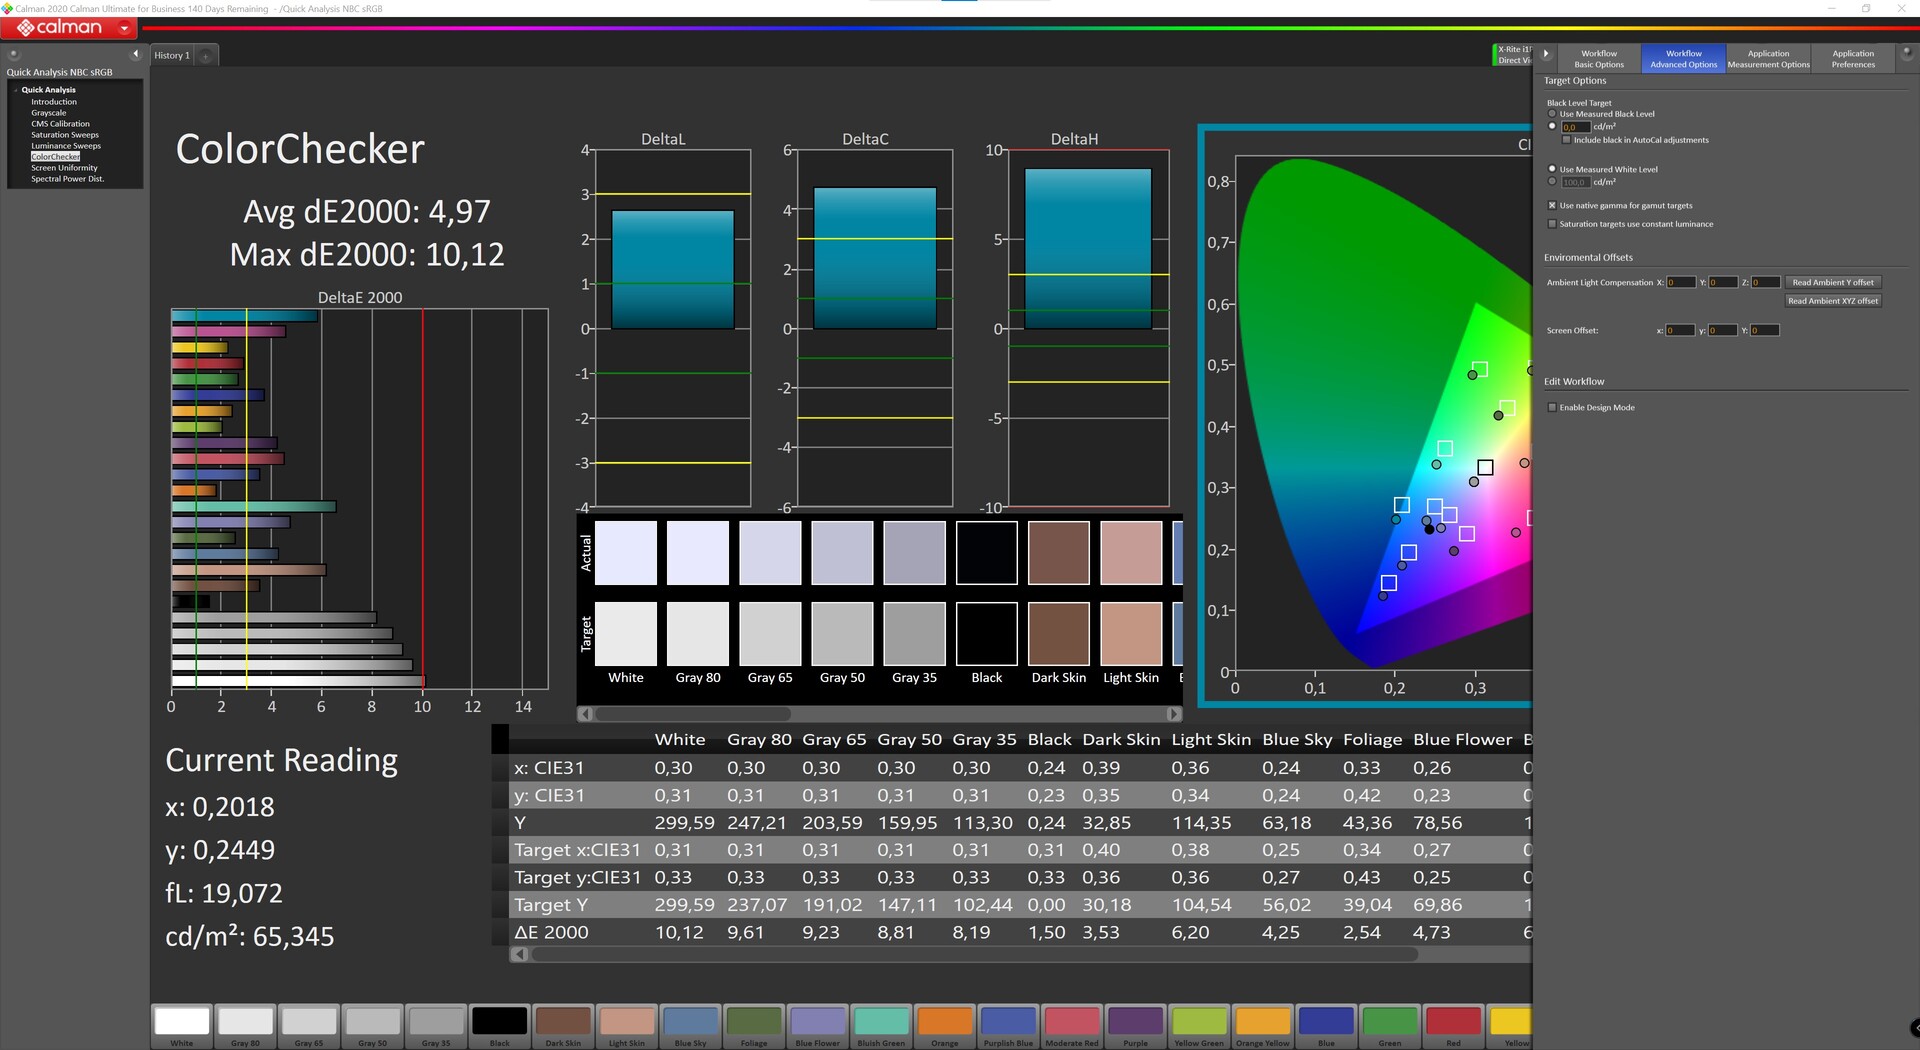
ΔE Greyscale Calman: 7.2 | ∀{0.09-98 Ø5}
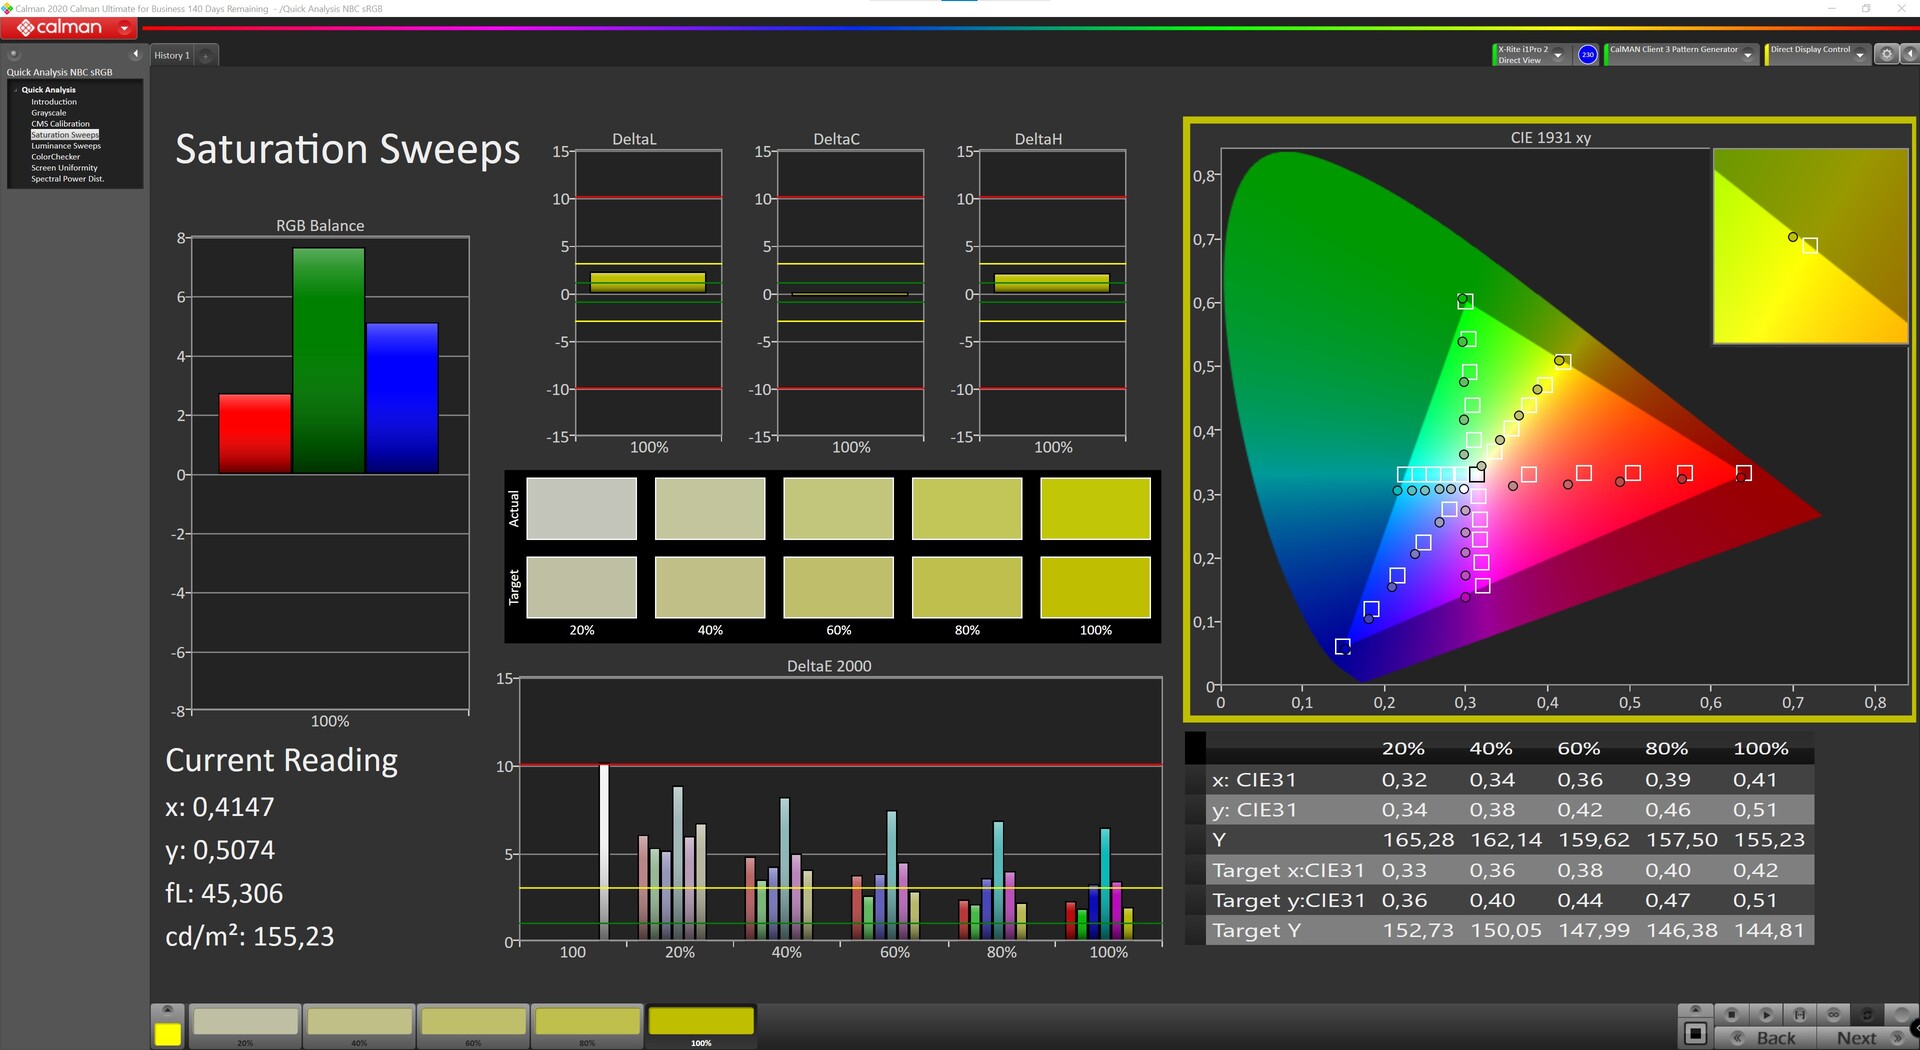
97.7% sRGB (Argyll 1.6.3 3D)
67.6% AdobeRGB 1998 (Argyll 1.6.3 3D)
67.6% AdobeRGB 1998 (Argyll 3D)
97.7% sRGB (Argyll 3D)
66.5% Display P3 (Argyll 3D)
Gamma: 2.23
CCT: 7784 K
| Asus ROG Strix G15 G513QY Sharp SHP152C, IPS, 1920x1080, 15.6" | Razer Blade 15 Advanced Model Early 2021 TL156VDXP02-0, IPS, 1920x1080, 15.6" | Schenker XMG Pro 15 (Early 2021, RTX 3080) AU Optronics AUO7A8C (B156HAN12.0), IPS, 1920x1080, 15.6" | Alienware m15 R4 RTX 3080 LG Philips LGD066E (156WFG), IPS, 1920x1080, 15.6" | Alienware m15 R4 LG Philips LGD066E, IPS, 1920x1080, 15.6" | Schenker XMG Neo 15 Tiger Lake BOE CQ NE156QHM-NY2, IPS, 2560x1440, 15.6" | Asus ROG Strix G15 G513QR LQ156M1JW25, IPS, 1920x1080, 15.6" | |
|---|---|---|---|---|---|---|---|
| Display | -0% | 4% | 4% | 3% | 2% | 0% | |
| Display P3 Coverage (%) | 66.5 | 65.9 -1% | 69.2 4% | 70.1 5% | 69.4 4% | 68.6 3% | 67.7 2% |
| sRGB Coverage (%) | 97.7 | 96.4 -1% | 99.7 2% | 99.8 2% | 99 1% | 98.6 1% | 94.3 -3% |
| AdobeRGB 1998 Coverage (%) | 67.6 | 68 1% | 70.8 5% | 71.5 6% | 70.5 4% | 69.3 3% | 68.2 1% |
| Response Times | -52% | 28% | 5% | 4% | -60% | 3% | |
| Response Time Grey 50% / Grey 80% * (ms) | 8 ? | 16 ? -100% | 3.6 ? 55% | 7.6 ? 5% | 7.4 ? 7% | 16 ? -100% | 8.2 ? -3% |
| Response Time Black / White * (ms) | 10 ? | 10.4 ? -4% | 10 ? -0% | 9.6 ? 4% | 10 ? -0% | 12 ? -20% | 9.2 ? 8% |
| PWM Frequency (Hz) | |||||||
| Screen | 21% | 18% | 14% | 12% | -1% | 7% | |
| Brightness middle (cd/m²) | 306 | 338 10% | 327 7% | 347 13% | 333 9% | 324 6% | 308 1% |
| Brightness (cd/m²) | 283 | 334 18% | 335 18% | 318 12% | 303 7% | 307 8% | 288 2% |
| Brightness Distribution (%) | 86 | 94 9% | 89 3% | 86 0% | 86 0% | 91 6% | 86 0% |
| Black Level * (cd/m²) | 0.25 | 0.24 4% | 0.22 12% | 0.31 -24% | 0.29 -16% | 0.27 -8% | 0.23 8% |
| Contrast (:1) | 1224 | 1408 15% | 1486 21% | 1119 -9% | 1148 -6% | 1200 -2% | 1339 9% |
| Colorchecker dE 2000 * | 4.97 | 1.39 72% | 2.18 56% | 1.68 66% | 1.8 64% | 3.36 32% | 3.28 34% |
| Colorchecker dE 2000 max. * | 10.12 | 3.31 67% | 4.24 58% | 3.03 70% | 4.49 56% | 9.87 2% | 8.51 16% |
| Colorchecker dE 2000 calibrated * | 0.7 | 0.97 -39% | 1 -43% | 1.08 -54% | 1.13 -61% | 1.23 -76% | 0.83 -19% |
| Greyscale dE 2000 * | 7.2 | 1.6 78% | 2.6 64% | 1.8 75% | 1.9 74% | 5.8 19% | 5 31% |
| Gamma | 2.23 99% | 2.291 96% | 2.123 104% | 2.262 97% | 2.265 97% | 2.311 95% | 2.057 107% |
| CCT | 7784 84% | 6626 98% | 6815 95% | 6592 99% | 6840 95% | 7087 92% | 7393 88% |
| Color Space (Percent of AdobeRGB 1998) (%) | 67.6 | 68 1% | 71 5% | 71 5% | 71 5% | 69 2% | 68 1% |
| Color Space (Percent of sRGB) (%) | 97.7 | 89 -9% | 93 -5% | 94 -4% | 93 -5% | 93 -5% | 90 -8% |
| Total Average (Program / Settings) | -10% /
8% | 17% /
16% | 8% /
11% | 6% /
9% | -20% /
-8% | 3% /
5% |
* ... smaller is better
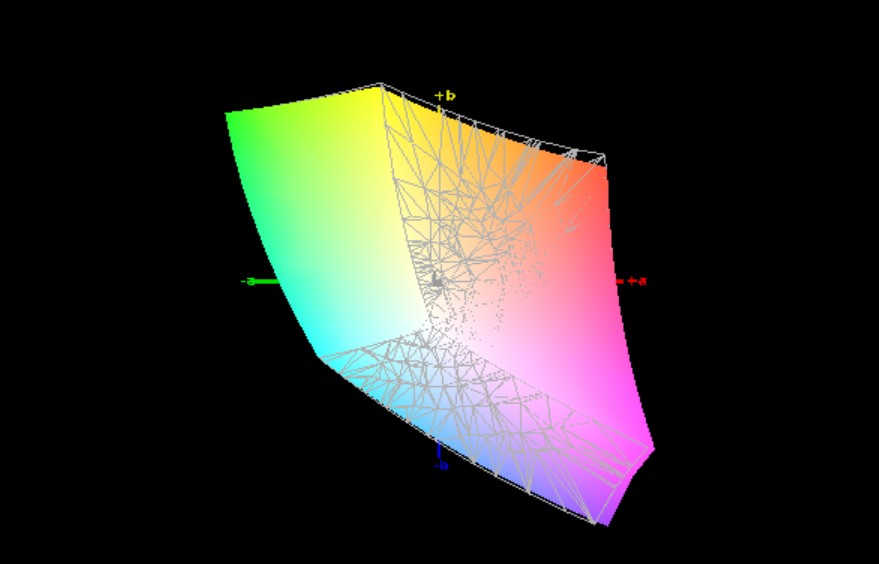
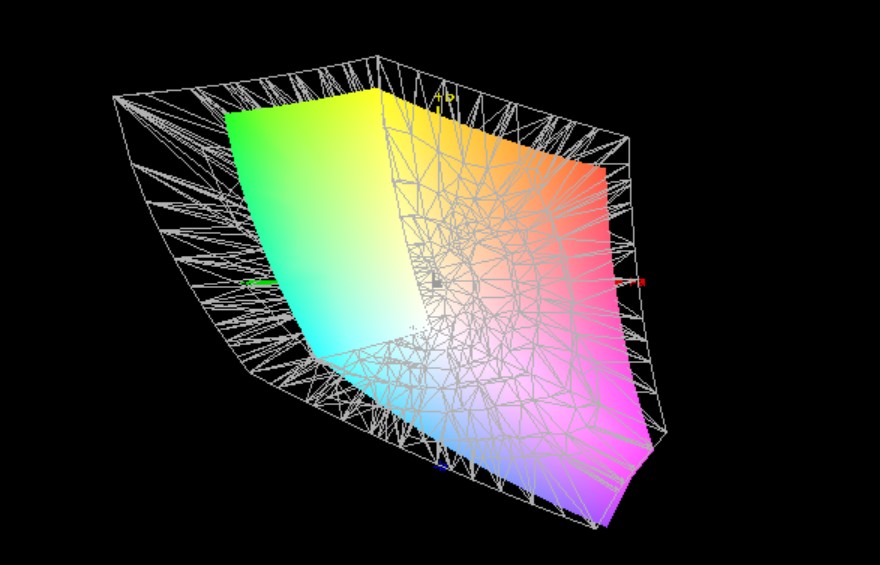
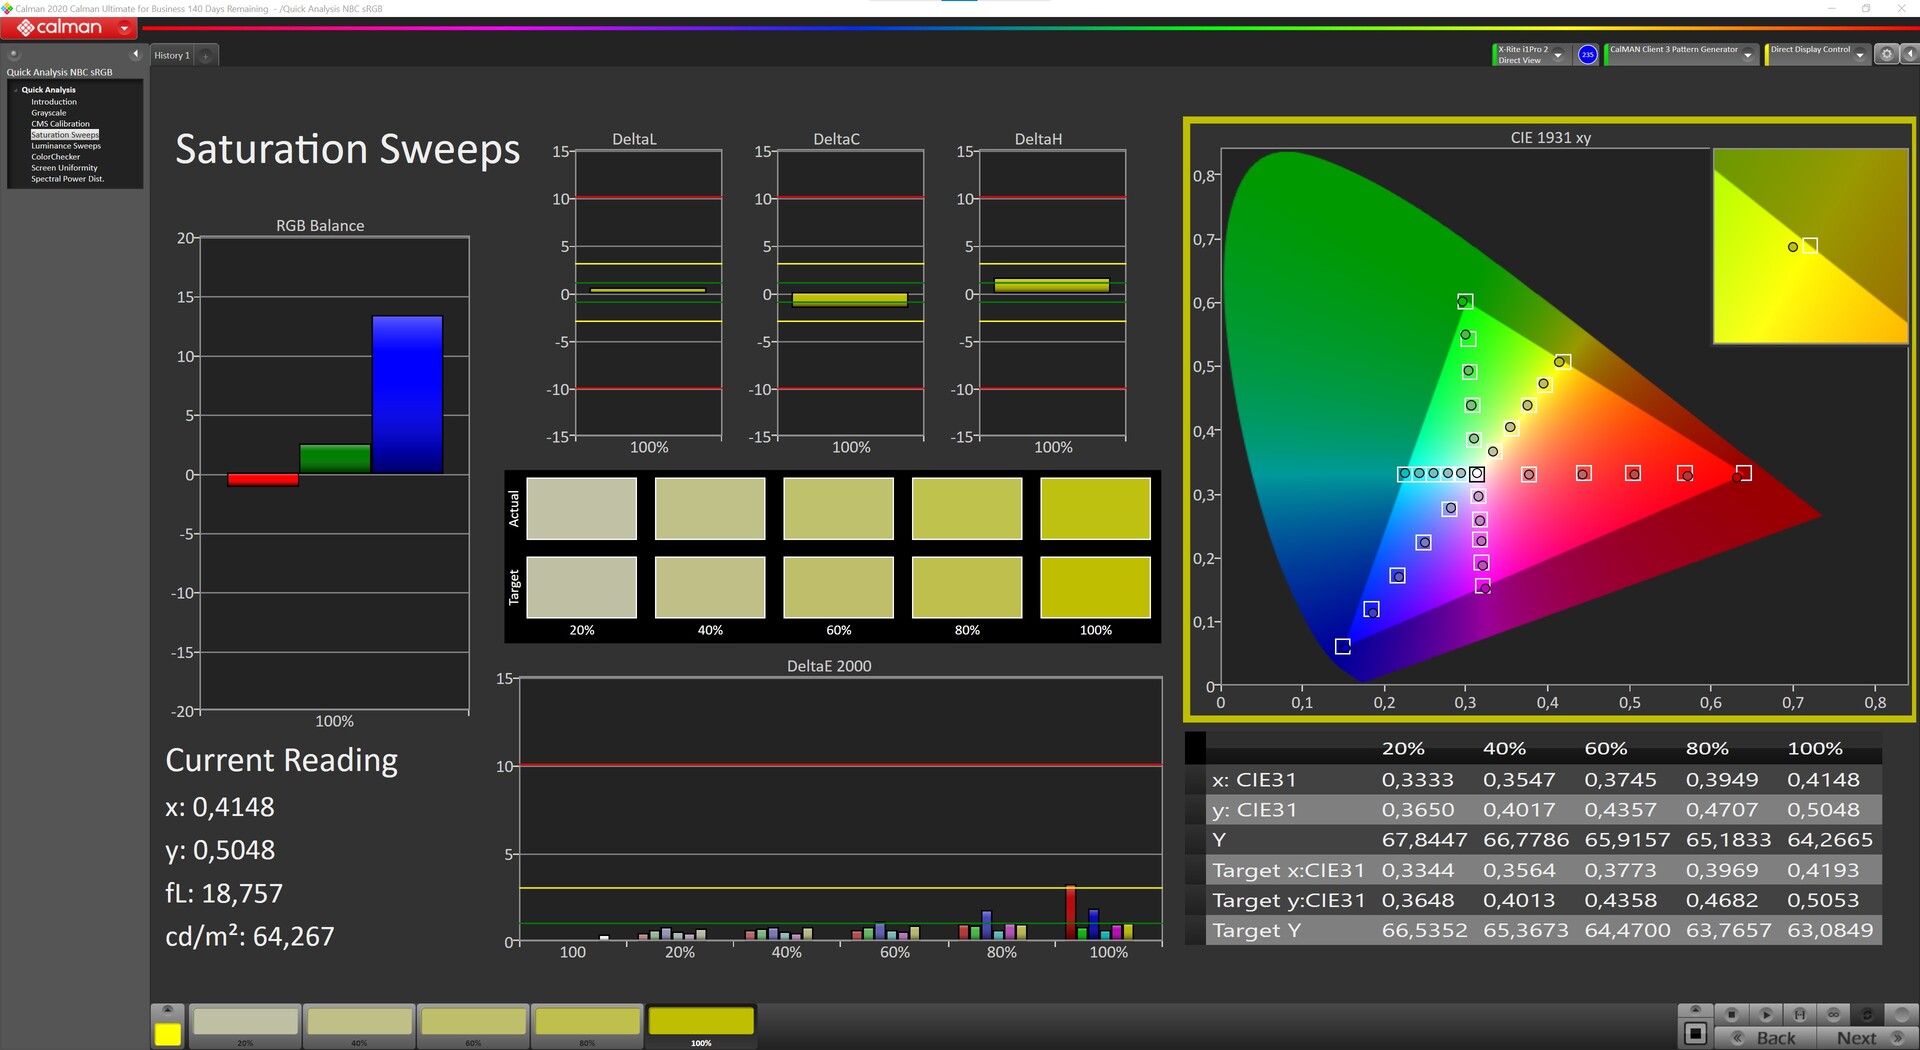
Elevated DeltaE 2000 color deviations relative to the sRGB color space are evident out of the box. After performing a manual calibration, the DeltaE 2000 color deviations could be significantly reduced, and the slight blue tint could also be removed. The Asus ROG Strix G15 G513QY scores points in terms of the measured color-space coverage and is on par with the comparison devices. At 97% (sRGB) and 67% (AdobeRGB), the device is also suitable for semi-professional image or video editing.

Display Response Times
| ↔ Response Time Black to White | ||
|---|---|---|
| 10 ms ... rise ↗ and fall ↘ combined | ↗ 5 ms rise | 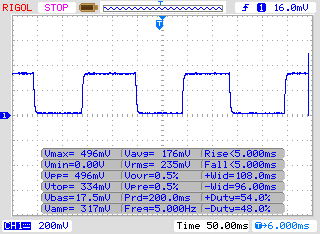 |
| ↘ 5 ms fall | ||
| The screen shows good response rates in our tests, but may be too slow for competitive gamers. In comparison, all tested devices range from 0.1 (minimum) to 240 (maximum) ms. » 26 % of all devices are better. This means that the measured response time is better than the average of all tested devices (20.2 ms). | ||
| ↔ Response Time 50% Grey to 80% Grey | ||
| 8 ms ... rise ↗ and fall ↘ combined | ↗ 3 ms rise | 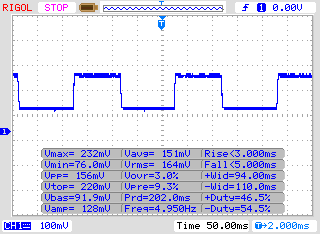 |
| ↘ 5 ms fall | ||
| The screen shows fast response rates in our tests and should be suited for gaming. In comparison, all tested devices range from 0.165 (minimum) to 636 (maximum) ms. » 19 % of all devices are better. This means that the measured response time is better than the average of all tested devices (31.5 ms). | ||
Screen Flickering / PWM (Pulse-Width Modulation)
| Screen flickering / PWM not detected |  | ||
In comparison: 53 % of all tested devices do not use PWM to dim the display. If PWM was detected, an average of 8070 (minimum: 5 - maximum: 343500) Hz was measured. | |||
As expected, our review sample performs well in the viewing-angle test. The IPS display has stable viewing angles. Only when viewing the screen from flat and oblique angles does a slight fogging occur. However, there shouldn't be any problems during normal use. The matte surface helps to make outdoor use a bit more tolerable, although places in the shade would be preferable.

Performance - Solidly equipped gaming laptop
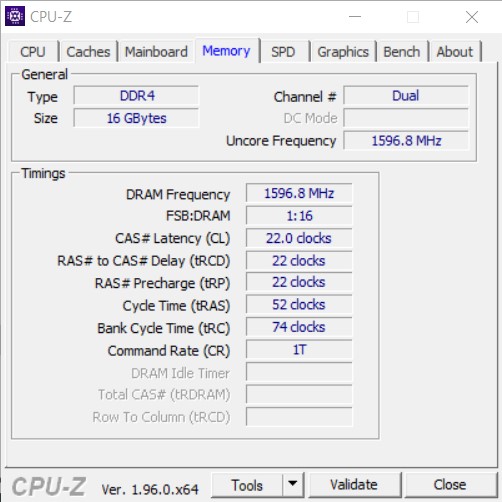
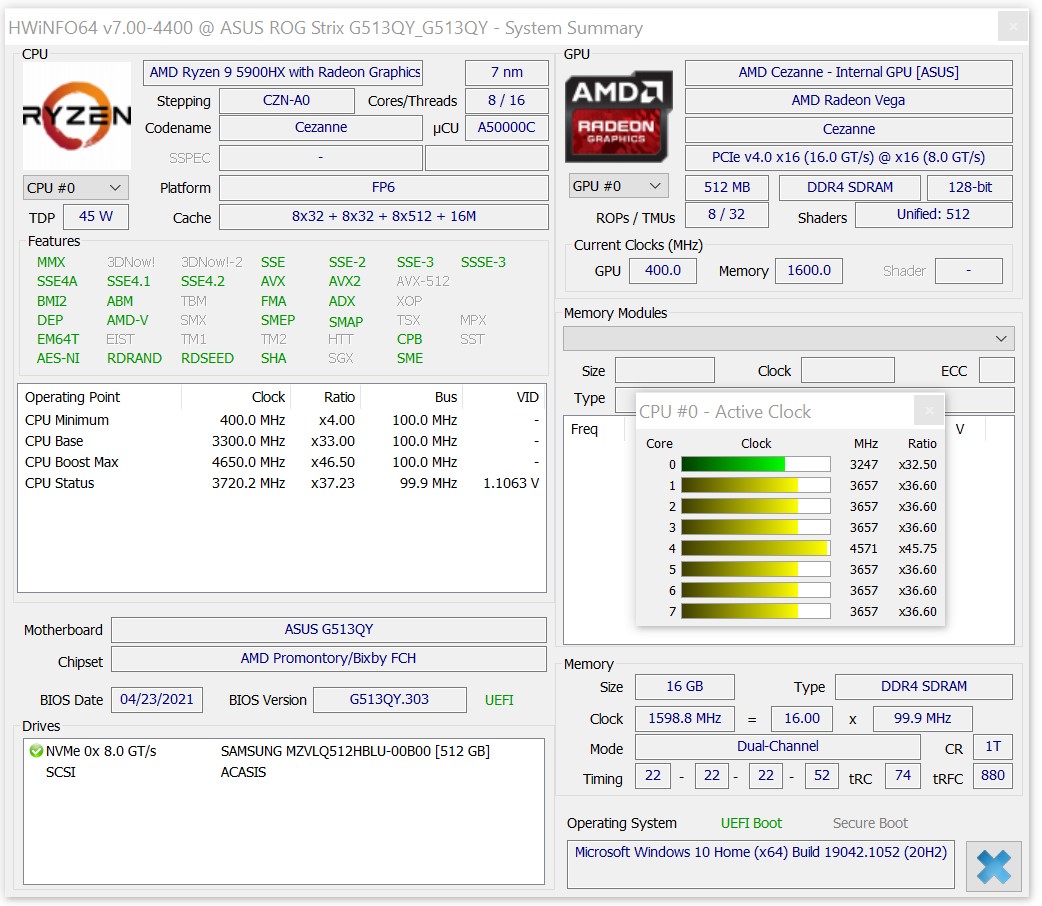
With the AMD Ryzen 9 5900HX and the brand-new AMD Radeon RX 6800M, our test device offers a very good foundation for playing even the most cutting-edge games on a laptop. The 16 GB of DDR4-3200 RAM run in dual-channel mode and are sufficient for most applications for now. However, the 512 GB SSD only offers limited storage space for a gaming laptop.
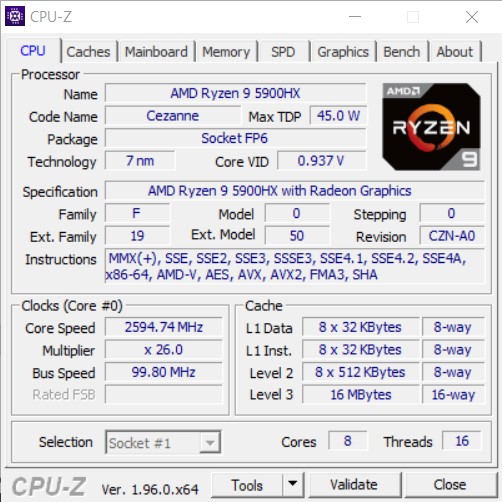
Processor
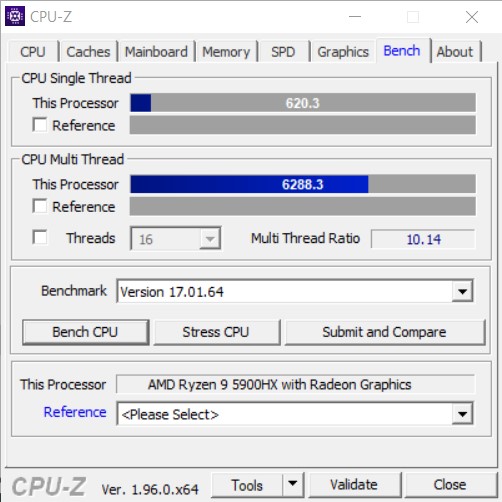
The AMD Ryzen 9 5900HX is a modern octa-core processor that is based on AMD's latest Zen 3 architecture. The SoC runs at a frequency of 3.3-4.6 GHz, supports SMT, and offers a total of 16 threads. In a direct comparison, the AMD Ryzen 9 5900HX can definitely hold its own against the Intel Core i7-11700H. The two rivals are often only separated by a few percentage points.
In the test, the Asus ROG Strix G15 G513QY was able to deliver a very consistent performance. There was no noticeable throttling of the AMD Ryzen 9 5900HX on battery power, and the tests conducted show an almost identical performance compared to when the device is plugged in. In the remaining CPU benchmarks, the AMD Ryzen 9 5900HX can almost always find its way to the top places. All the same, the performance displayed is above the class average. For further comparisons and benchmarks, we refer you here to our CPU Benchmarks article.
Cinebench R20: CPU (Single Core) | CPU (Multi Core)
Cinebench R15: CPU Single 64Bit | CPU Multi 64Bit
Blender: v2.79 BMW27 CPU
7-Zip 18.03: 7z b 4 -mmt1 | 7z b 4
Geekbench 5.5: Single-Core | Multi-Core
HWBOT x265 Benchmark v2.2: 4k Preset
LibreOffice : 20 Documents To PDF
R Benchmark 2.5: Overall mean
| Cinebench R23 / Single Core | |
| Average of class Gaming (1136 - 2267, n=145, last 2 years) | |
| Schenker XMG Neo 15 Tiger Lake | |
| Asus ROG Strix G15 G513QY | |
| Asus ROG Strix G15 G513QR | |
| Average AMD Ryzen 9 5900HX (1218 - 1499, n=29) | |
| Alienware m15 R4 RTX 3080 | |
| Razer Blade 15 Advanced Model Early 2021 | |
| Schenker XMG Pro 15 (Early 2021, RTX 3080) | |
| Cinebench R23 / Multi Core | |
| Average of class Gaming (5668 - 40970, n=145, last 2 years) | |
| Schenker XMG Neo 15 Tiger Lake | |
| Asus ROG Strix G15 G513QY | |
| Asus ROG Strix G15 G513QR | |
| Average AMD Ryzen 9 5900HX (6622 - 14363, n=30) | |
| Alienware m15 R4 RTX 3080 | |
| Schenker XMG Pro 15 (Early 2021, RTX 3080) | |
| Razer Blade 15 Advanced Model Early 2021 | |
| Cinebench R20 / CPU (Single Core) | |
| Average of class Gaming (439 - 870, n=144, last 2 years) | |
| Asus ROG Strix G15 G513QY | |
| Schenker XMG Neo 15 Tiger Lake | |
| Asus ROG Strix G15 G513QR | |
| Average AMD Ryzen 9 5900HX (471 - 584, n=29) | |
| Alienware m15 R4 RTX 3080 | |
| Alienware m15 R4 | |
| Razer Blade 15 Advanced Model Early 2021 | |
| Schenker XMG Pro 15 (Early 2021, RTX 3080) | |
| Cinebench R20 / CPU (Multi Core) | |
| Average of class Gaming (2179 - 16108, n=144, last 2 years) | |
| Schenker XMG Neo 15 Tiger Lake | |
| Asus ROG Strix G15 G513QY | |
| Asus ROG Strix G15 G513QR | |
| Average AMD Ryzen 9 5900HX (2242 - 5476, n=30) | |
| Alienware m15 R4 RTX 3080 | |
| Alienware m15 R4 | |
| Schenker XMG Pro 15 (Early 2021, RTX 3080) | |
| Razer Blade 15 Advanced Model Early 2021 | |
| Cinebench R15 / CPU Single 64Bit | |
| Average of class Gaming (188.8 - 343, n=143, last 2 years) | |
| Asus ROG Strix G15 G513QY | |
| Asus ROG Strix G15 G513QR | |
| Average AMD Ryzen 9 5900HX (197 - 243, n=25) | |
| Schenker XMG Neo 15 Tiger Lake | |
| Schenker XMG Pro 15 (Early 2021, RTX 3080) | |
| Alienware m15 R4 | |
| Razer Blade 15 Advanced Model Early 2021 | |
| Alienware m15 R4 RTX 3080 | |
| Cinebench R15 / CPU Multi 64Bit | |
| Average of class Gaming (1537 - 6271, n=144, last 2 years) | |
| Asus ROG Strix G15 G513QY | |
| Schenker XMG Neo 15 Tiger Lake | |
| Asus ROG Strix G15 G513QR | |
| Average AMD Ryzen 9 5900HX (1076 - 2267, n=29) | |
| Alienware m15 R4 RTX 3080 | |
| Schenker XMG Pro 15 (Early 2021, RTX 3080) | |
| Alienware m15 R4 | |
| Razer Blade 15 Advanced Model Early 2021 | |
| Blender / v2.79 BMW27 CPU | |
| Razer Blade 15 Advanced Model Early 2021 | |
| Schenker XMG Pro 15 (Early 2021, RTX 3080) | |
| Alienware m15 R4 RTX 3080 | |
| Alienware m15 R4 | |
| Average AMD Ryzen 9 5900HX (219 - 442, n=29) | |
| Asus ROG Strix G15 G513QR | |
| Asus ROG Strix G15 G513QY | |
| Schenker XMG Neo 15 Tiger Lake | |
| Average of class Gaming (80 - 517, n=140, last 2 years) | |
| 7-Zip 18.03 / 7z b 4 -mmt1 | |
| Average of class Gaming (4199 - 7508, n=142, last 2 years) | |
| Schenker XMG Neo 15 Tiger Lake | |
| Average AMD Ryzen 9 5900HX (4791 - 5905, n=29) | |
| Asus ROG Strix G15 G513QY | |
| Asus ROG Strix G15 G513QR | |
| Alienware m15 R4 | |
| Alienware m15 R4 RTX 3080 | |
| Razer Blade 15 Advanced Model Early 2021 | |
| Schenker XMG Pro 15 (Early 2021, RTX 3080) | |
| 7-Zip 18.03 / 7z b 4 | |
| Average of class Gaming (23795 - 148086, n=142, last 2 years) | |
| Average AMD Ryzen 9 5900HX (36011 - 62503, n=29) | |
| Schenker XMG Neo 15 Tiger Lake | |
| Asus ROG Strix G15 G513QY | |
| Asus ROG Strix G15 G513QR | |
| Alienware m15 R4 | |
| Alienware m15 R4 RTX 3080 | |
| Schenker XMG Pro 15 (Early 2021, RTX 3080) | |
| Razer Blade 15 Advanced Model Early 2021 | |
| Geekbench 5.5 / Single-Core | |
| Average of class Gaming (986 - 2474, n=141, last 2 years) | |
| Schenker XMG Neo 15 Tiger Lake | |
| Average AMD Ryzen 9 5900HX (1271 - 1574, n=27) | |
| Asus ROG Strix G15 G513QY | |
| Asus ROG Strix G15 G513QR | |
| Alienware m15 R4 | |
| Alienware m15 R4 RTX 3080 | |
| Razer Blade 15 Advanced Model Early 2021 | |
| Schenker XMG Pro 15 (Early 2021, RTX 3080) | |
| Geekbench 5.5 / Multi-Core | |
| Average of class Gaming (4557 - 27010, n=141, last 2 years) | |
| Schenker XMG Neo 15 Tiger Lake | |
| Average AMD Ryzen 9 5900HX (5057 - 9294, n=27) | |
| Alienware m15 R4 RTX 3080 | |
| Alienware m15 R4 | |
| Schenker XMG Pro 15 (Early 2021, RTX 3080) | |
| Asus ROG Strix G15 G513QY | |
| Asus ROG Strix G15 G513QR | |
| Razer Blade 15 Advanced Model Early 2021 | |
| HWBOT x265 Benchmark v2.2 / 4k Preset | |
| Average of class Gaming (7.7 - 44.3, n=142, last 2 years) | |
| Schenker XMG Neo 15 Tiger Lake | |
| Asus ROG Strix G15 G513QY | |
| Average AMD Ryzen 9 5900HX (8.26 - 17.1, n=29) | |
| Asus ROG Strix G15 G513QR | |
| Alienware m15 R4 RTX 3080 | |
| Alienware m15 R4 | |
| Schenker XMG Pro 15 (Early 2021, RTX 3080) | |
| Razer Blade 15 Advanced Model Early 2021 | |
| LibreOffice / 20 Documents To PDF | |
| Alienware m15 R4 RTX 3080 | |
| Schenker XMG Pro 15 (Early 2021, RTX 3080) | |
| Razer Blade 15 Advanced Model Early 2021 | |
| Average AMD Ryzen 9 5900HX (44.1 - 87.4, n=29) | |
| Asus ROG Strix G15 G513QY | |
| Asus ROG Strix G15 G513QR | |
| Alienware m15 R4 | |
| Average of class Gaming (19 - 88.8, n=141, last 2 years) | |
| Schenker XMG Neo 15 Tiger Lake | |
| R Benchmark 2.5 / Overall mean | |
| Schenker XMG Pro 15 (Early 2021, RTX 3080) | |
| Alienware m15 R4 RTX 3080 | |
| Razer Blade 15 Advanced Model Early 2021 | |
| Alienware m15 R4 | |
| Schenker XMG Neo 15 Tiger Lake | |
| Asus ROG Strix G15 G513QR | |
| Asus ROG Strix G15 G513QY | |
| Average AMD Ryzen 9 5900HX (0.48 - 0.599, n=29) | |
| Average of class Gaming (0.3439 - 0.759, n=142, last 2 years) | |
* ... smaller is better
System performance
The entire system benefits from the very powerful individual components and not least from the fast NVMe SSD. During the test period, the device always performed quickly and without noteworthy latencies. Even running multiple applications at the same time doesn't bring the device to its knees that fast.
Note: The built-in RAM runs in dual-channel mode. Nonetheless, the performance of the modules installed in the Asus ROG Strix G15 G513QY is not optimal. Linus Tech Tips has also taken a look at this problem and was able to achieve a significant performance increase (about 10%) with a different RAM kit. Application benchmarks as well as games benefited from this. We'll try to arrange for a different RAM kit, so we can show you the performance differences in detail once again. In the AIDA64 memory test, our test sample showed similar performance to that seen in the video from Linus Tech Tips.
| PCMark 10 / Score | |
| Average of class Gaming (5776 - 10060, n=119, last 2 years) | |
| Average AMD Ryzen 9 5900HX, AMD Radeon RX 6800M (7167 - 7380, n=2) | |
| Schenker XMG Neo 15 Tiger Lake | |
| Asus ROG Strix G15 G513QY | |
| Alienware m15 R4 RTX 3080 | |
| Alienware m15 R4 | |
| Schenker XMG Pro 15 (Early 2021, RTX 3080) | |
| Razer Blade 15 Advanced Model Early 2021 | |
| PCMark 10 / Essentials | |
| Average of class Gaming (8810 - 12600, n=123, last 2 years) | |
| Average AMD Ryzen 9 5900HX, AMD Radeon RX 6800M (10204 - 10430, n=2) | |
| Schenker XMG Neo 15 Tiger Lake | |
| Asus ROG Strix G15 G513QY | |
| Alienware m15 R4 RTX 3080 | |
| Schenker XMG Pro 15 (Early 2021, RTX 3080) | |
| Alienware m15 R4 | |
| Razer Blade 15 Advanced Model Early 2021 | |
| PCMark 10 / Productivity | |
| Average of class Gaming (6662 - 16716, n=121, last 2 years) | |
| Alienware m15 R4 RTX 3080 | |
| Average AMD Ryzen 9 5900HX, AMD Radeon RX 6800M (9060 - 9470, n=2) | |
| Asus ROG Strix G15 G513QY | |
| Schenker XMG Neo 15 Tiger Lake | |
| Alienware m15 R4 | |
| Razer Blade 15 Advanced Model Early 2021 | |
| Schenker XMG Pro 15 (Early 2021, RTX 3080) | |
| PCMark 10 / Digital Content Creation | |
| Average of class Gaming (7440 - 19351, n=121, last 2 years) | |
| Schenker XMG Neo 15 Tiger Lake | |
| Average AMD Ryzen 9 5900HX, AMD Radeon RX 6800M (10806 - 11050, n=2) | |
| Asus ROG Strix G15 G513QY | |
| Alienware m15 R4 RTX 3080 | |
| Alienware m15 R4 | |
| Schenker XMG Pro 15 (Early 2021, RTX 3080) | |
| Razer Blade 15 Advanced Model Early 2021 | |
| PCMark 10 Score | 7167 points | |
Help | ||
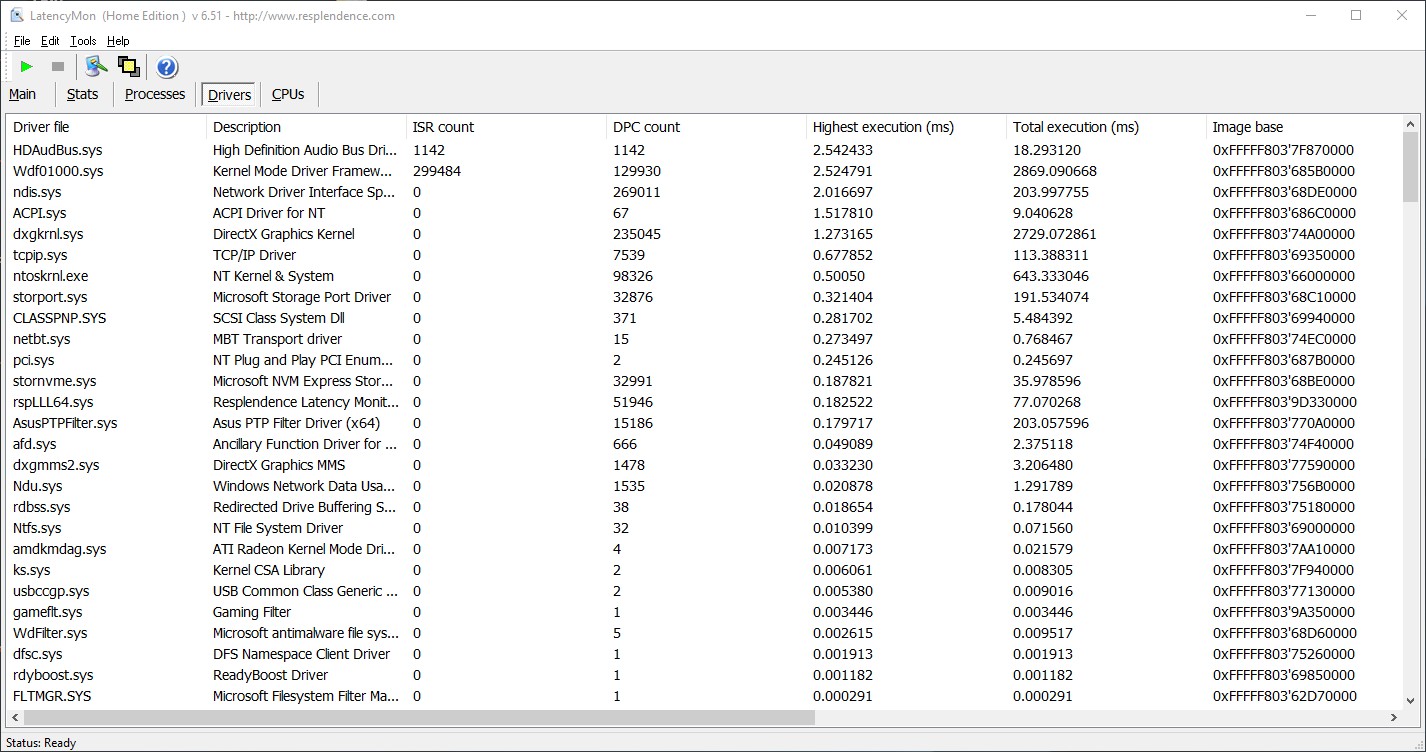
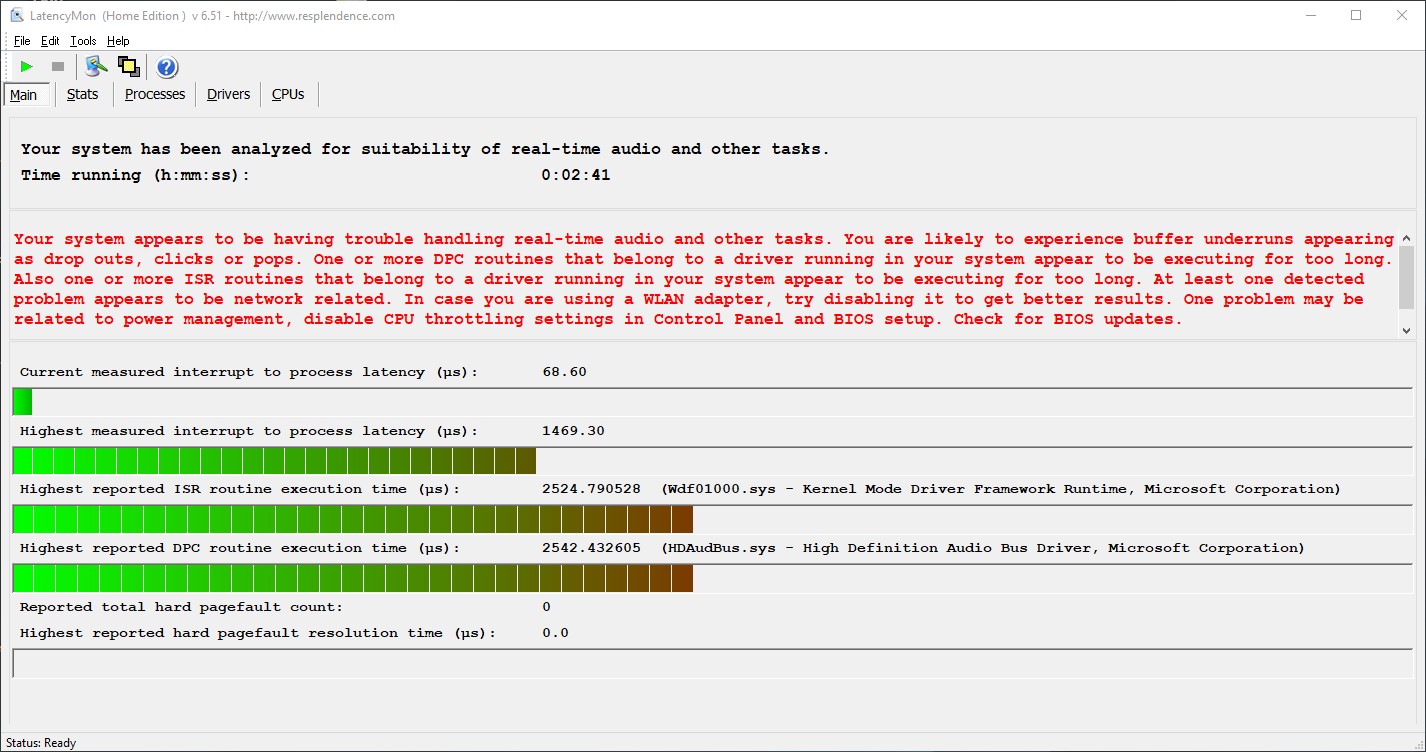
DPC latencies
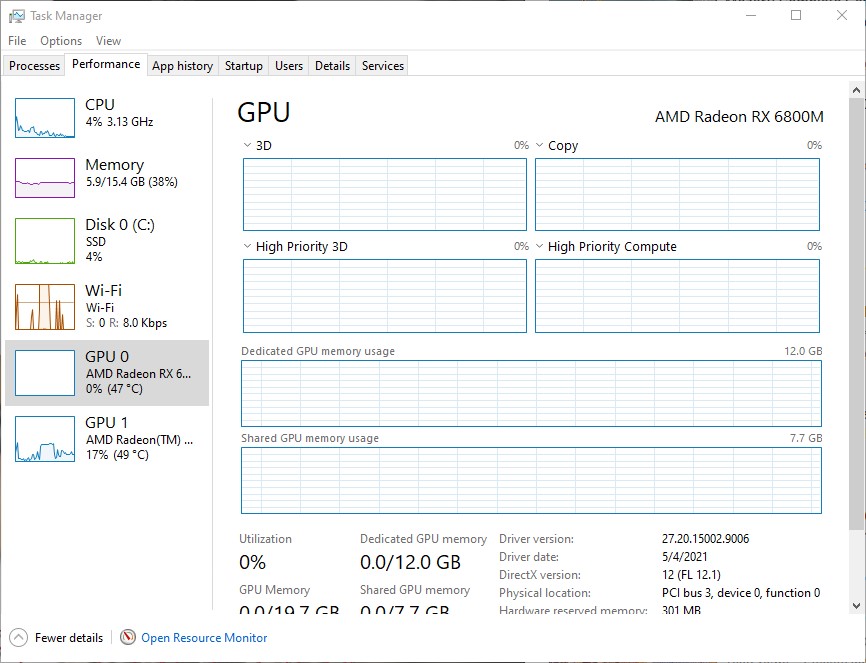
When opening several browser tabs in Edge and playing a 4K YouTube video, LatencyMon doesn't show any irregularities yet. Only after Prime95 is started do critical latencies occur. The iGPU shows an average load of 16 to 23% when playing our test video.
| DPC Latencies / LatencyMon - interrupt to process latency (max), Web, Youtube, Prime95 | |
| Alienware m15 R4 | |
| Asus ROG Strix G15 G513QY | |
| Alienware m15 R4 RTX 3080 | |
| Schenker XMG Pro 15 (Early 2021, RTX 3080) | |
| Razer Blade 15 Advanced Model Early 2021 | |
| Schenker XMG Neo 15 Tiger Lake | |
* ... smaller is better
Storage
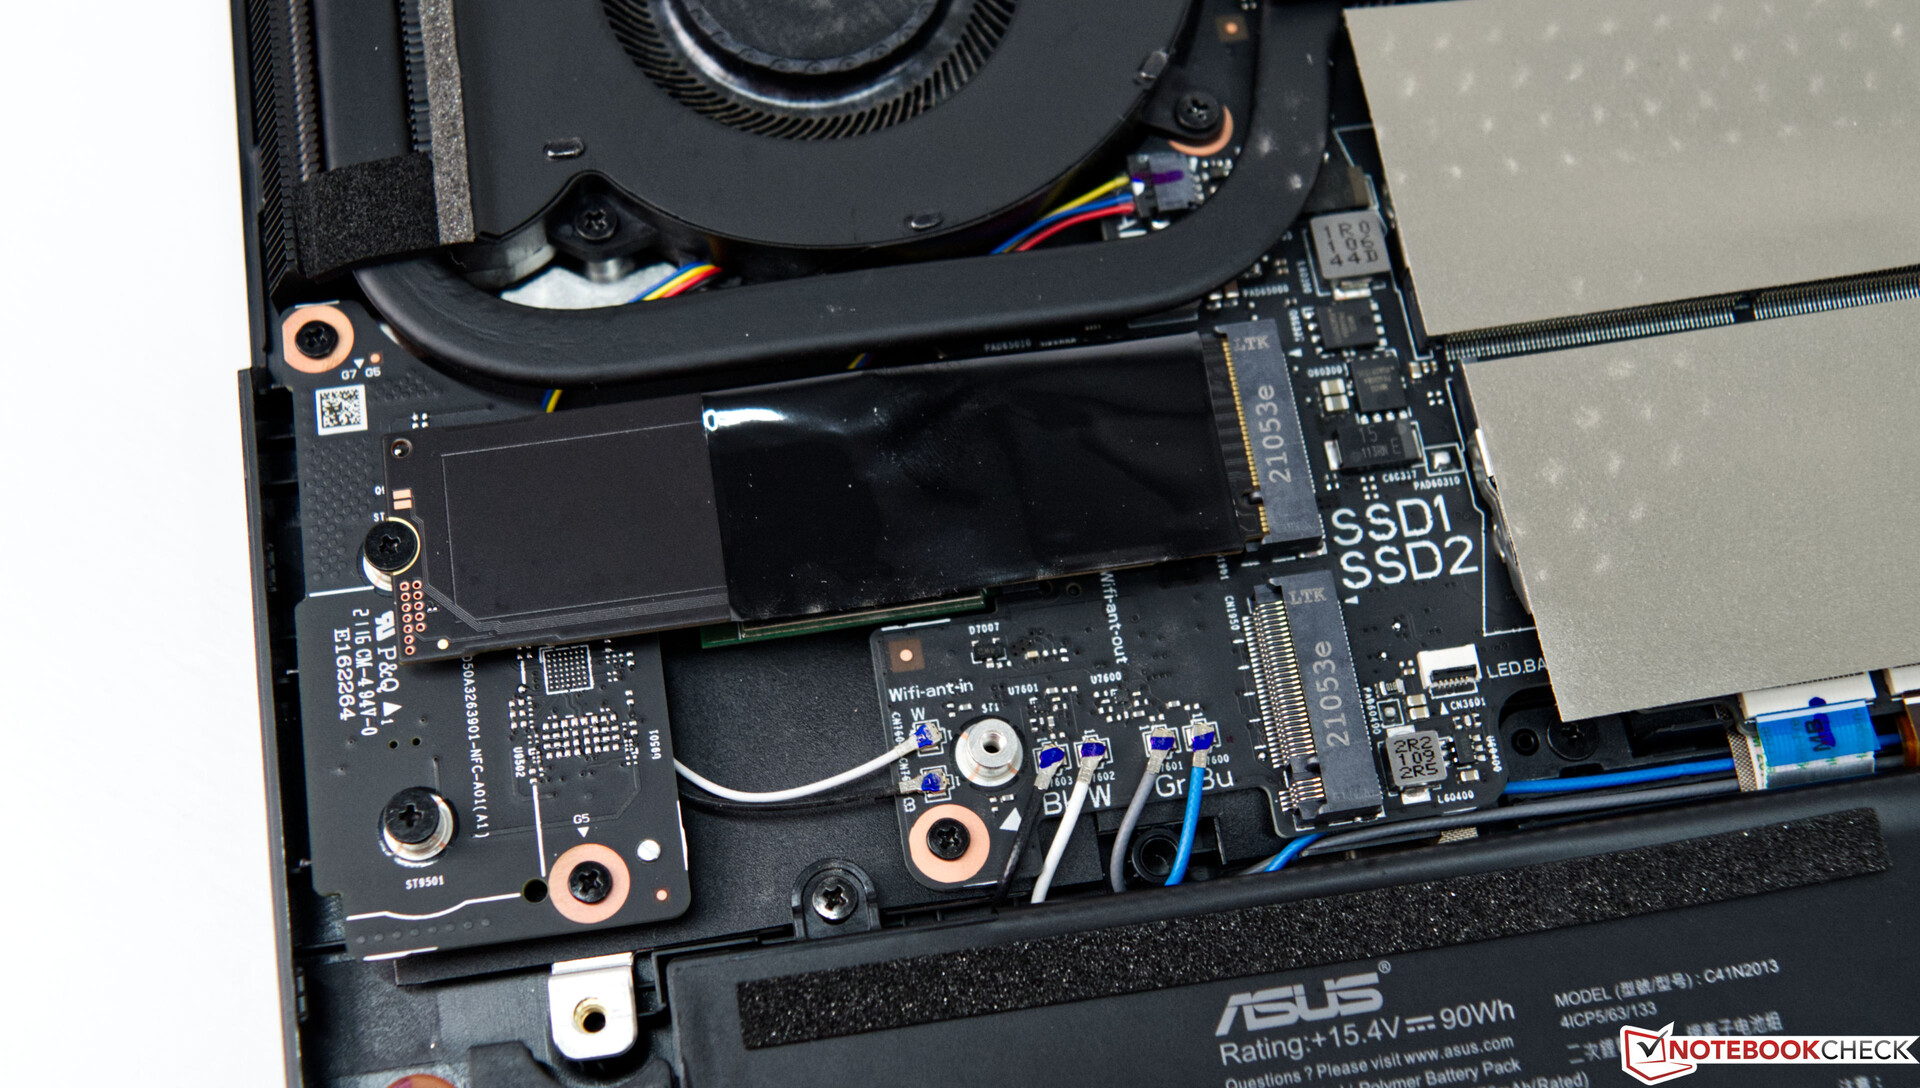
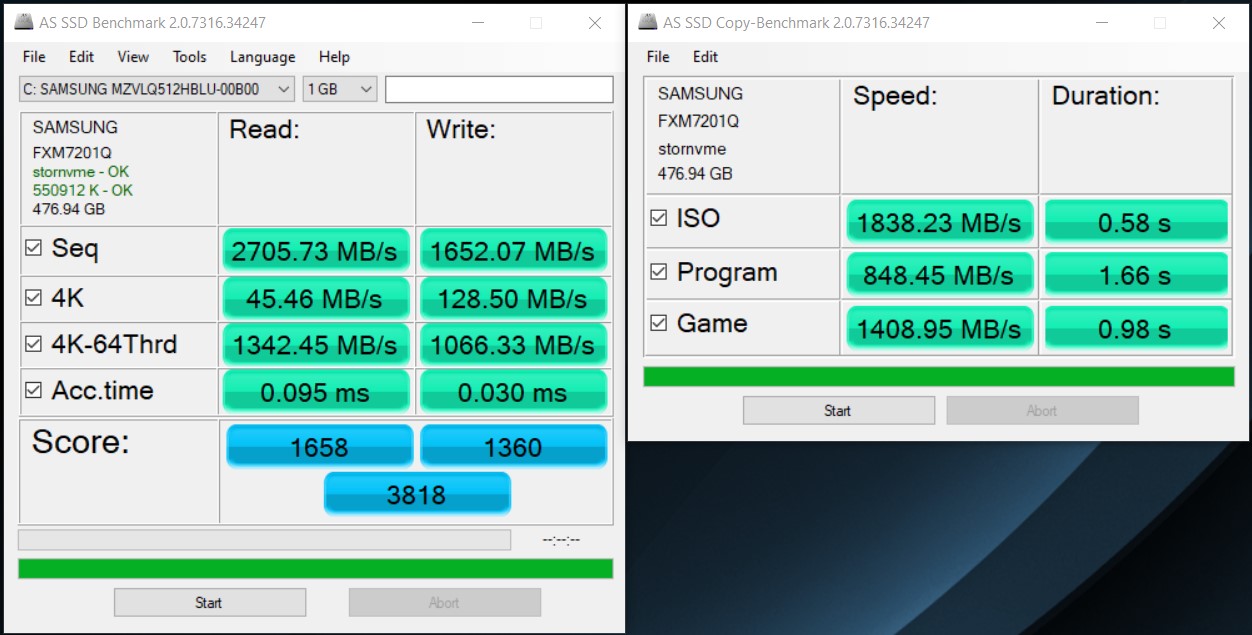
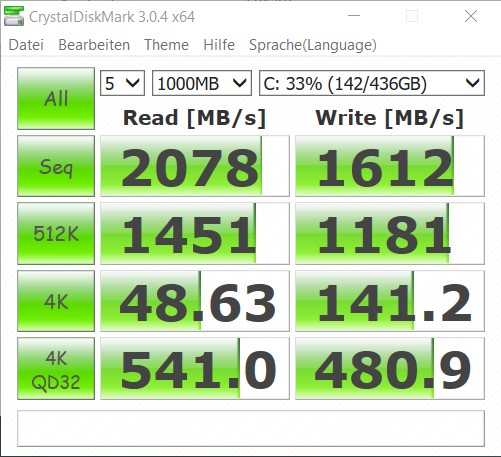
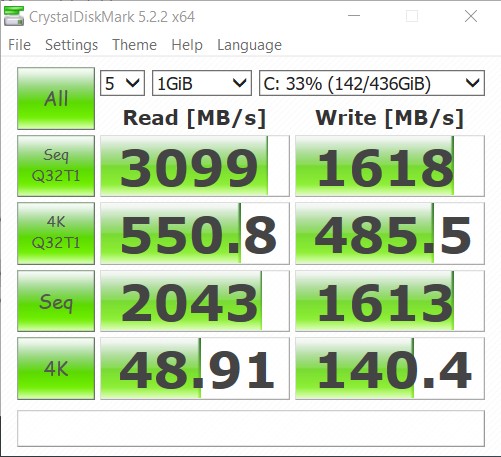
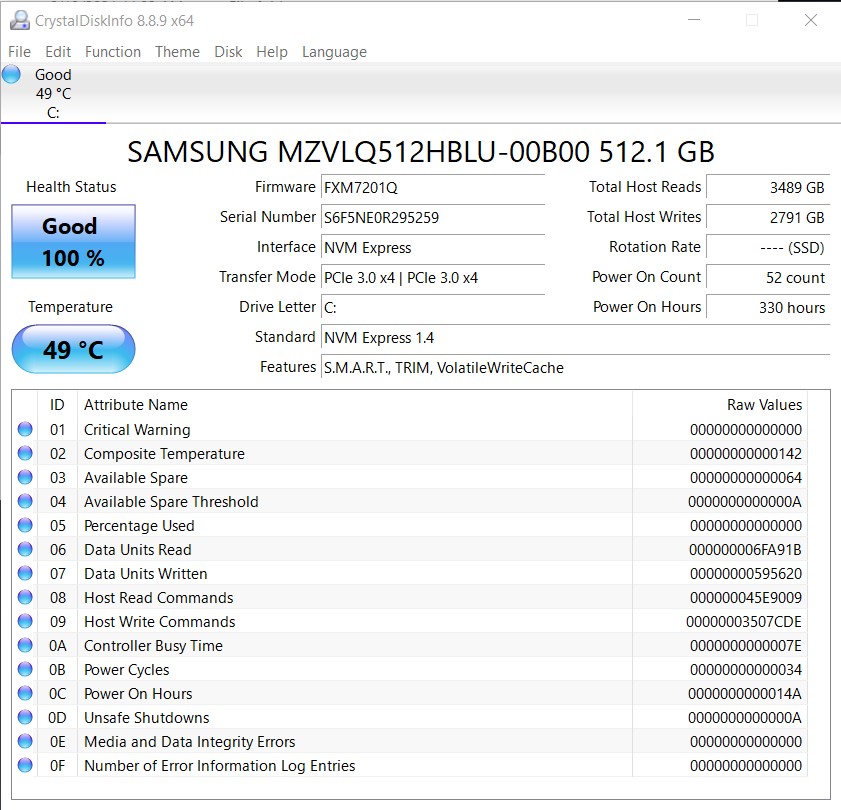
A fast NVMe SSD (M.2-2280) from Samsung serves as the system drive. The SSD was able to achieve good rates in the test, even though the comparison devices have slightly faster mass storage devices in some cases. For further comparisons and benchmarks, take a look at our HDD/SSD Benchmarks article.
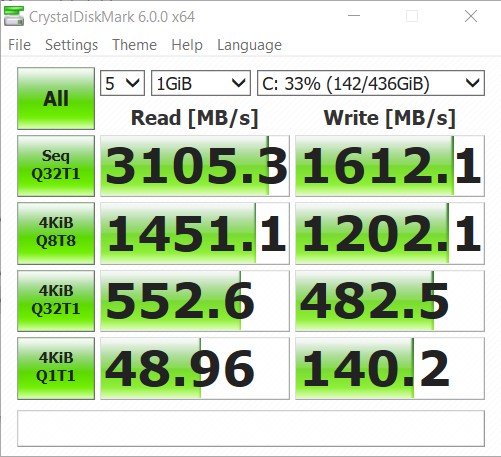
| Asus ROG Strix G15 G513QY Samsung PM991 MZVLQ512HALU | Razer Blade 15 Advanced Model Early 2021 Samsung PM981a MZVLB1T0HBLR | Schenker XMG Pro 15 (Early 2021, RTX 3080) Samsung SSD 970 EVO Plus 1TB | Alienware m15 R4 RTX 3080 2x WDC PC SN730 SDBPNTY-512G (RAID 0) | Alienware m15 R4 Micron 2300 1TB MTFDHBA1T0TDV | Schenker XMG Neo 15 Tiger Lake Samsung SSD 980 Pro 1TB MZ-V8P1T0BW | Average Samsung PM991 MZVLQ512HALU | |
|---|---|---|---|---|---|---|---|
| CrystalDiskMark 5.2 / 6 | 9% | 34% | 12% | 21% | 68% | -19% | |
| Write 4K (MB/s) | 140.4 | 138 -2% | 160.9 15% | 114.2 -19% | 93.7 -33% | 162.7 16% | 131.8 ? -6% |
| Read 4K (MB/s) | 48.91 | 47.41 -3% | 54 10% | 43.77 -11% | 48.1 -2% | 79 62% | 44.9 ? -8% |
| Write Seq (MB/s) | 1613 | 1922 19% | 2944 83% | 2785 73% | 2865 78% | 1162 ? -28% | |
| Read Seq (MB/s) | 2043 | 1673 -18% | 2781 36% | 2598 27% | 3411 67% | 1473 ? -28% | |
| Write 4K Q32T1 (MB/s) | 482.5 | 445.5 -8% | 495.2 3% | 464.5 -4% | 481.9 0% | 522 8% | 399 ? -17% |
| Read 4K Q32T1 (MB/s) | 553 | 534 -3% | 593 7% | 546 -1% | 521 -6% | 508 -8% | 426 ? -23% |
| Write Seq Q32T1 (MB/s) | 1612 | 2976 85% | 3283 104% | 3233 101% | 3362 109% | 4765 196% | 1348 ? -16% |
| Read Seq Q32T1 (MB/s) | 3105 | 3232 4% | 3549 14% | 3473 12% | 3200 3% | 7083 128% | 2398 ? -23% |
| Write 4K Q8T8 (MB/s) | 1202 | 1375 14% | 1040 ? -13% | ||||
| Read 4K Q8T8 (MB/s) | 1451 | 1447 0% | 985 ? -32% | ||||
| AS SSD | 16% | 39% | 10% | -9% | 60% | -24% | |
| Seq Read (MB/s) | 2706 | 2112 -22% | 2959 9% | 2888 7% | 2658 -2% | 4830 78% | 1921 ? -29% |
| Seq Write (MB/s) | 1652 | 2024 23% | 2521 53% | 2786 69% | 2769 68% | 2032 23% | 1128 ? -32% |
| 4K Read (MB/s) | 45.46 | 46.53 2% | 50.9 12% | 41.98 -8% | 46.07 1% | 62.3 37% | 47.6 ? 5% |
| 4K Write (MB/s) | 128.5 | 89.7 -30% | 141.1 10% | 108 -16% | 87.2 -32% | 146.4 14% | 137.9 ? 7% |
| 4K-64 Read (MB/s) | 1342 | 1747 30% | 2110 57% | 1396 4% | 1372 2% | 1305 -3% | 878 ? -35% |
| 4K-64 Write (MB/s) | 1066 | 1962 84% | 2329 118% | 1234 16% | 1247 17% | 3708 248% | 782 ? -27% |
| Access Time Read * (ms) | 0.095 | 0.052 45% | 0.034 64% | 0.056 41% | 0.052 45% | 0.029 69% | 0.09367 ? 1% |
| Access Time Write * (ms) | 0.03 | 0.04 -33% | 0.026 13% | 0.035 -17% | 0.098 -227% | 0.027 10% | 0.03708 ? -24% |
| Score Read (Points) | 1658 | 2004 21% | 2457 48% | 1727 4% | 1684 2% | 1850 12% | 1118 ? -33% |
| Score Write (Points) | 1360 | 2254 66% | 2722 100% | 1621 19% | 1611 18% | 4058 198% | 1033 ? -24% |
| Score Total (Points) | 3818 | 5280 38% | 6412 68% | 4227 11% | 4166 9% | 6724 76% | 2694 ? -29% |
| Copy ISO MB/s (MB/s) | 1838 | 2128 16% | 2275 24% | 1868 2% | 1709 -7% | 1347 ? -27% | |
| Copy Program MB/s (MB/s) | 848 | 707 -17% | 593 -30% | 812 -4% | 1250 47% | 421 ? -50% | |
| Copy Game MB/s (MB/s) | 1409 | 1471 4% | 1408 0% | 1596 13% | 1909 35% | 825 ? -41% | |
| Total Average (Program / Settings) | 13% /
14% | 37% /
37% | 11% /
11% | 6% /
4% | 64% /
63% | -22% /
-22% |
* ... smaller is better

Continuous load read : DiskSpd Read Loop, Queue Depth 8
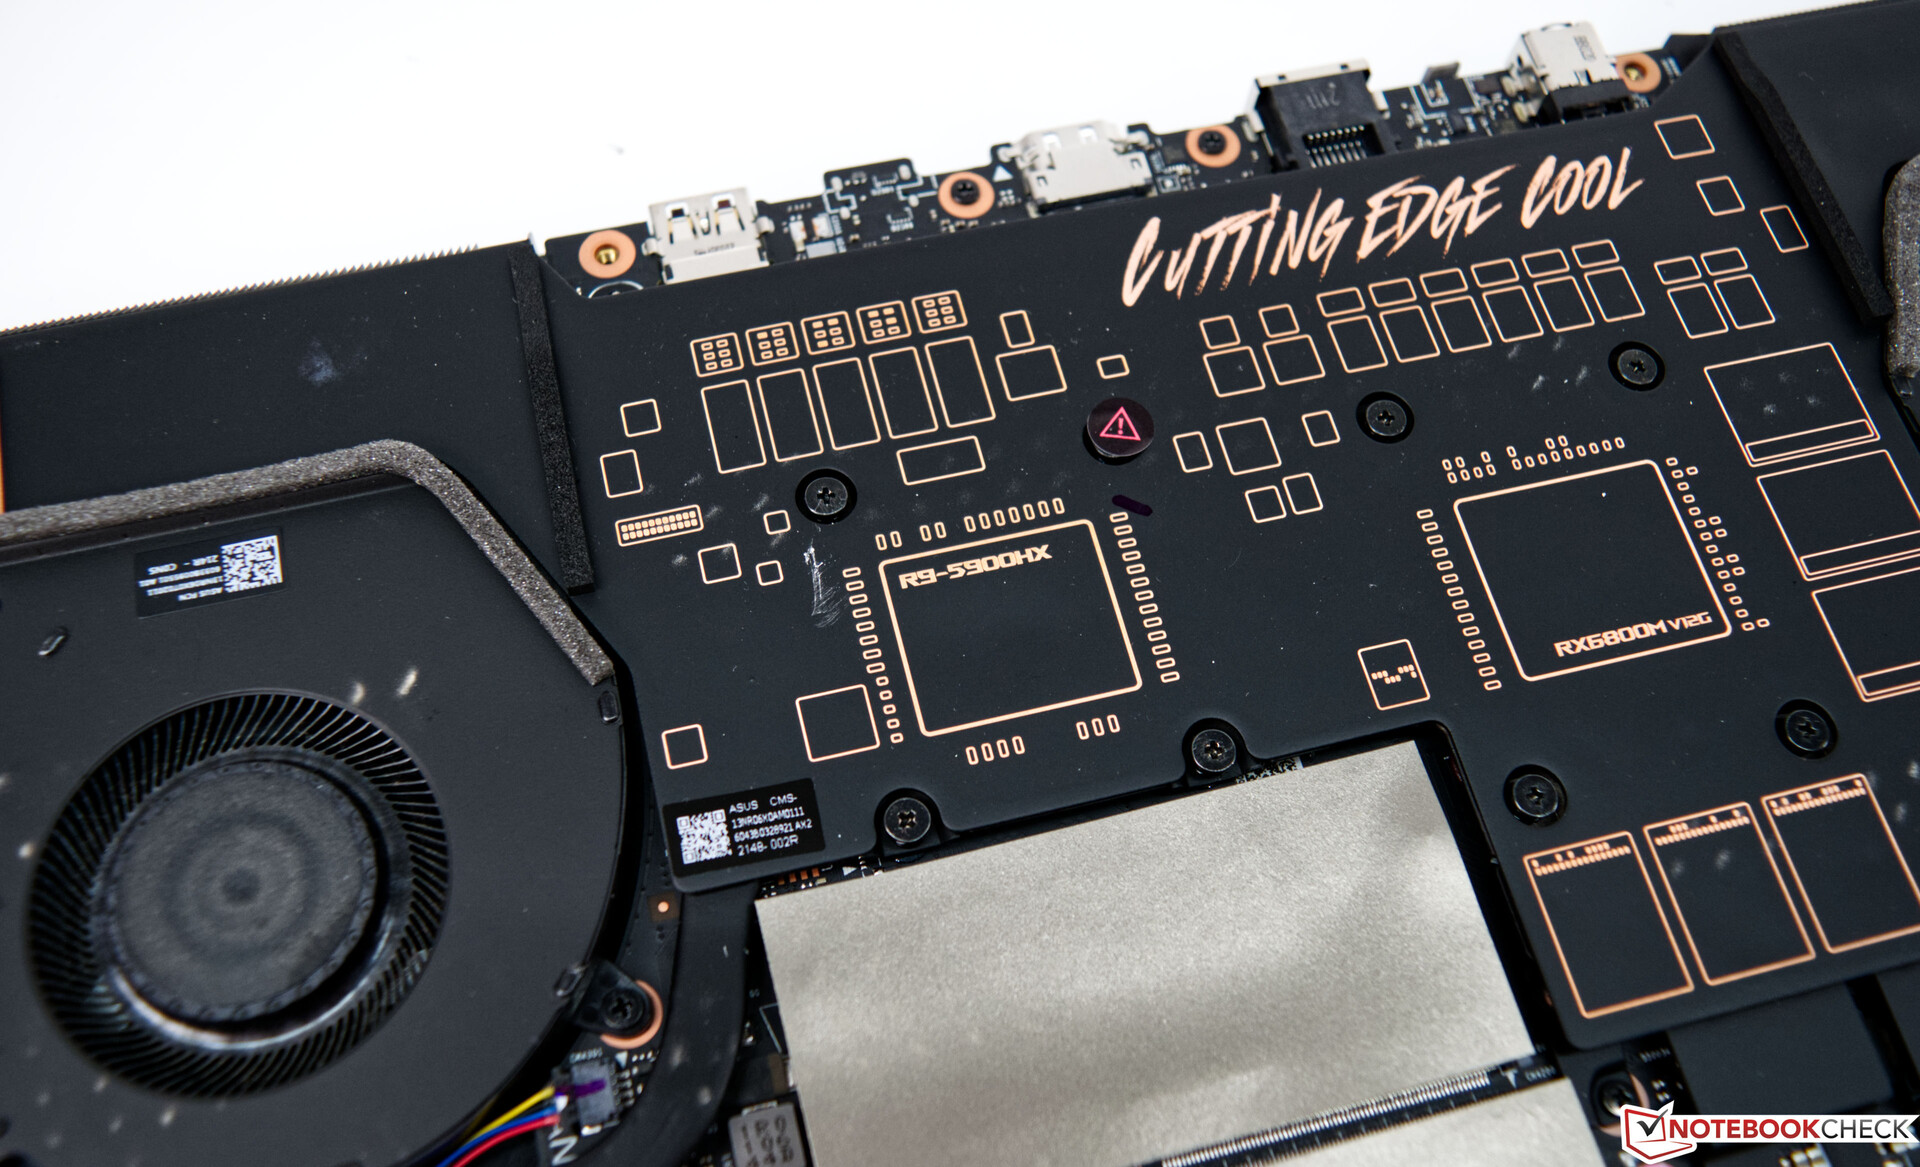
Graphics card
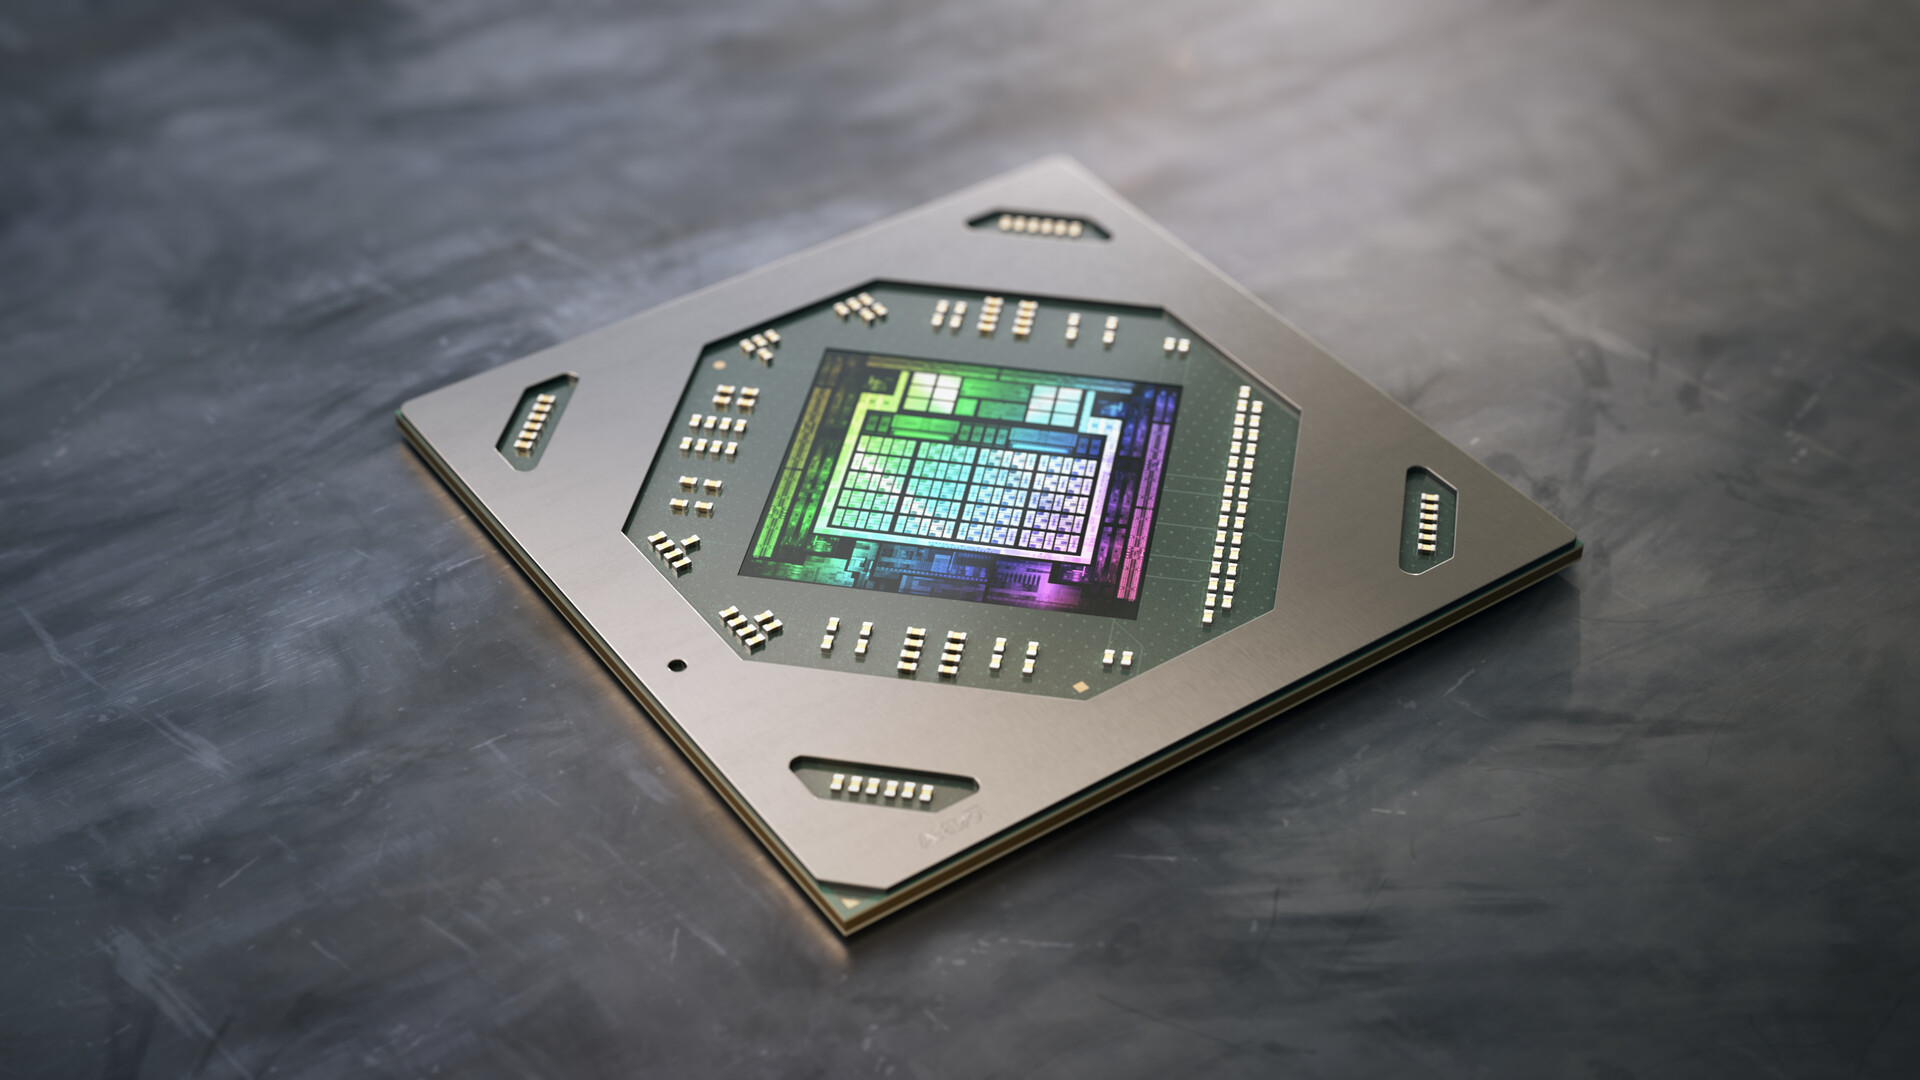
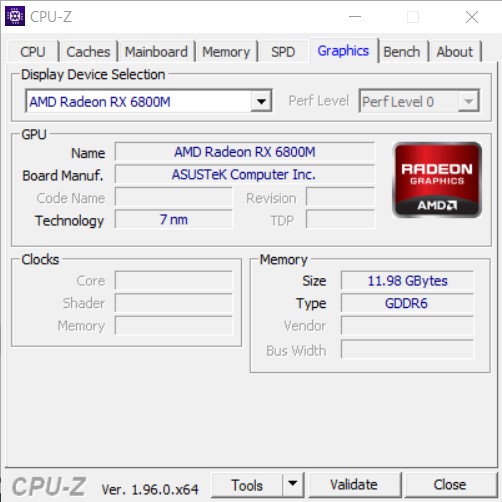
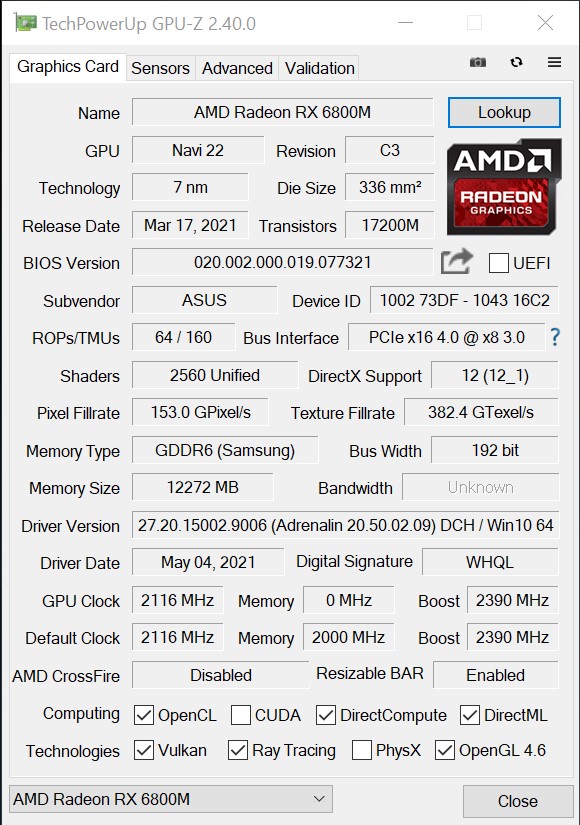
Our test device is equipped with AMD's latest model, the AMD Radeon RX 6800M. The mobile variant of the 6000 series is based on the RDNA2 architecture, and it's also the first time that RT cores for ray tracing computations are available here. With 12 GB of VRAM, the AMD Radeon RX 6800M has plenty of memory, which is convenient for many applications.
In the 3DMark benchmarks, the AMD Radeon RX 6800M in the Asus ROG Strix G15 G513QY shows a strong performance. The Nvidia GeForce RTX 3080 laptop GPU is often close, and the new AMD GPU can even claim first place in the Fire Strike benchmark. AMD specifies the AMD Radeon RX 6800M with a TDP of 140 watts+, which means that it can still be overclocked using Asus' Armoury Crate tool. We chose the "Turbo" preset for this review.
Performance is somewhat limited on battery power. However, in a 3DMark11 run, the Strix G15 still managed to achieve almost 75% of its original score when plugged in.
In 2D use, the iGPU of the AMD Ryzen 9 5800HX takes over the work, reducing energy consumption. If you want to get even more performance out of the Asus ROG Strix G15 G513QY, you should use the device in a stationary configuration with an external display and connect both via the USB-C port. Only the latter is directly connected to the AMD Radeon RX 6800M without having to go through the iGPU, which results in a performance increase of up to 10%.
For more comparisons and benchmarks, please take a look at our GPU Benchmarks article.
| 3DMark 05 Standard | 46595 points | |
| 3DMark 06 Standard Score | 46135 points | |
| 3DMark 11 Performance | 27640 points | |
| 3DMark Ice Storm Standard Score | 114175 points | |
| 3DMark Cloud Gate Standard Score | 47641 points | |
| 3DMark Fire Strike Score | 27587 points | |
| 3DMark Fire Strike Extreme Score | 16055 points | |
| 3DMark Time Spy Score | 10863 points | |
Help | ||
Gaming performance
Gaming performance is very good. Recent titles can largely be played smoothly and at high frame rates using the maximum settings. However, our The Witcher 3 benchmark comparison shows that the AMD Radeon RX 6800M doesn't really gain momentum at low resolutions and low details. The AMD Radeon RX 6800M only manages to be on par with the Nvidia GeForce RTX 3080 (laptop) when you select quality levels corresponding to the high preset or above. As is often the case, however, this also depends on the respective game and the optimizations made for each GPU.
| Far Cry New Dawn | |
| 1280x720 Low Preset | |
| Average AMD Radeon RX 6800M (100 - 111, n=3) | |
| Asus ROG Strix G15 G513QY | |
| 1920x1080 Medium Preset | |
| Average AMD Radeon RX 6800M (84 - 97, n=3) | |
| Asus ROG Strix G15 G513QY | |
| 1920x1080 High Preset | |
| Average AMD Radeon RX 6800M (82 - 94, n=3) | |
| Asus ROG Strix G15 G513QY | |
| 1920x1080 Ultra Preset | |
| Average AMD Radeon RX 6800M (75 - 86, n=4) | |
| Asus ROG Strix G15 G513QY | |
| Metro Exodus | |
| 1280x720 Low Quality AF:4x | |
| Average AMD Radeon RX 6800M (174 - 205, n=3) | |
| Asus ROG Strix G15 G513QY | |
| 1920x1080 Medium Quality AF:4x | |
| Average AMD Radeon RX 6800M (129 - 137.4, n=3) | |
| Asus ROG Strix G15 G513QY | |
| 1920x1080 High Quality AF:16x | |
| Asus ROG Strix G15 G513QY | |
| Average AMD Radeon RX 6800M (96.8 - 99.8, n=3) | |
| 1920x1080 Ultra Quality AF:16x | |
| Asus ROG Strix G15 G513QY | |
| Average AMD Radeon RX 6800M (78.7 - 79.3, n=3) | |
In our The Witcher 3 stability test, we can see a clearly visible drop in frame rates just after a few minutes. The delta in comparison to the beginning is about 10%.
The Witcher 3 FPS diagram
| low | med. | high | ultra | |
|---|---|---|---|---|
| GTA V (2015) | 167 | 158 | 124 | 75.1 |
| The Witcher 3 (2015) | 268 | 165 | 199 | 110 |
| Final Fantasy XV Benchmark (2018) | 142 | 118 | 99.7 | |
| X-Plane 11.11 (2018) | 70.9 | 61.4 | 50.4 | |
| Far Cry 5 (2018) | 115 | 99 | 95 | 89 |
| Strange Brigade (2018) | 332 | 205 | 192 | 179 |
| Far Cry New Dawn (2019) | 100 | 84 | 82 | 75 |
| Metro Exodus (2019) | 178 | 129 | 99.2 | 79.3 |
| Outriders (2021) | 110 | 101 | 100 | 103 |
| Resident Evil Village (2021) | 147 | 137 | 134 | 91.9 |
| Mass Effect Legendary Edition (2021) | 107 | 96.6 | ||
| Days Gone (2021) | 116 | 99.2 | 96.1 | 90.2 |
| Monster Hunter Stories 2 (2021) | 103 | 108 | 111 | |
| F1 2021 (2021) | 277 | 218 | 187 | 114 |
| New World (2021) | 101 | 82.6 | 80 | 73.7 |
| Far Cry 6 (2021) | 102 | 94 | 89 | 77 |
| Back 4 Blood (2021) | 170 | 151 | 152 | |
| Riders Republic (2021) | 93 | 86 | 82 | 81 |
| Call of Duty Vanguard (2021) | 116 | 136 | 120 | 107 |
| Forza Horizon 5 (2021) | 155 | 96 | 90 | 59 |
| Battlefield 2042 (2021) | 118 | 107 | 99.9 | 88 |
| Farming Simulator 22 (2021) | 182 | 142 | 122 | 112 |
| Halo Infinite (2021) | 52.2 | 52.6 | 48.1 |
Emissions - A lot of waste heat needs to be dissipated
Noise emissions
The noise emissions measured show that the Asus ROG Strix G15 G513QY is relatively quiet in idle usage and under low load. However, this changes under load, and a maximum of 49 dB(A) is reached. This is clearly audible, but it's not anything out of the ordinary in the genre of gaming laptops. Thankfully, the Asus ROG Strix G15 G513QY produces a monotonous fan noise that isn't too high. Most of the time, high-frequency fan noise is subjectively perceived as being even louder. We weren't able to detect any coil whine in our test device.
Noise level
| Idle |
| 26 / 31 / 34 dB(A) |
| Load |
| 44 / 49 dB(A) |
 | ||
30 dB silent 40 dB(A) audible 50 dB(A) loud |
||
min: | ||
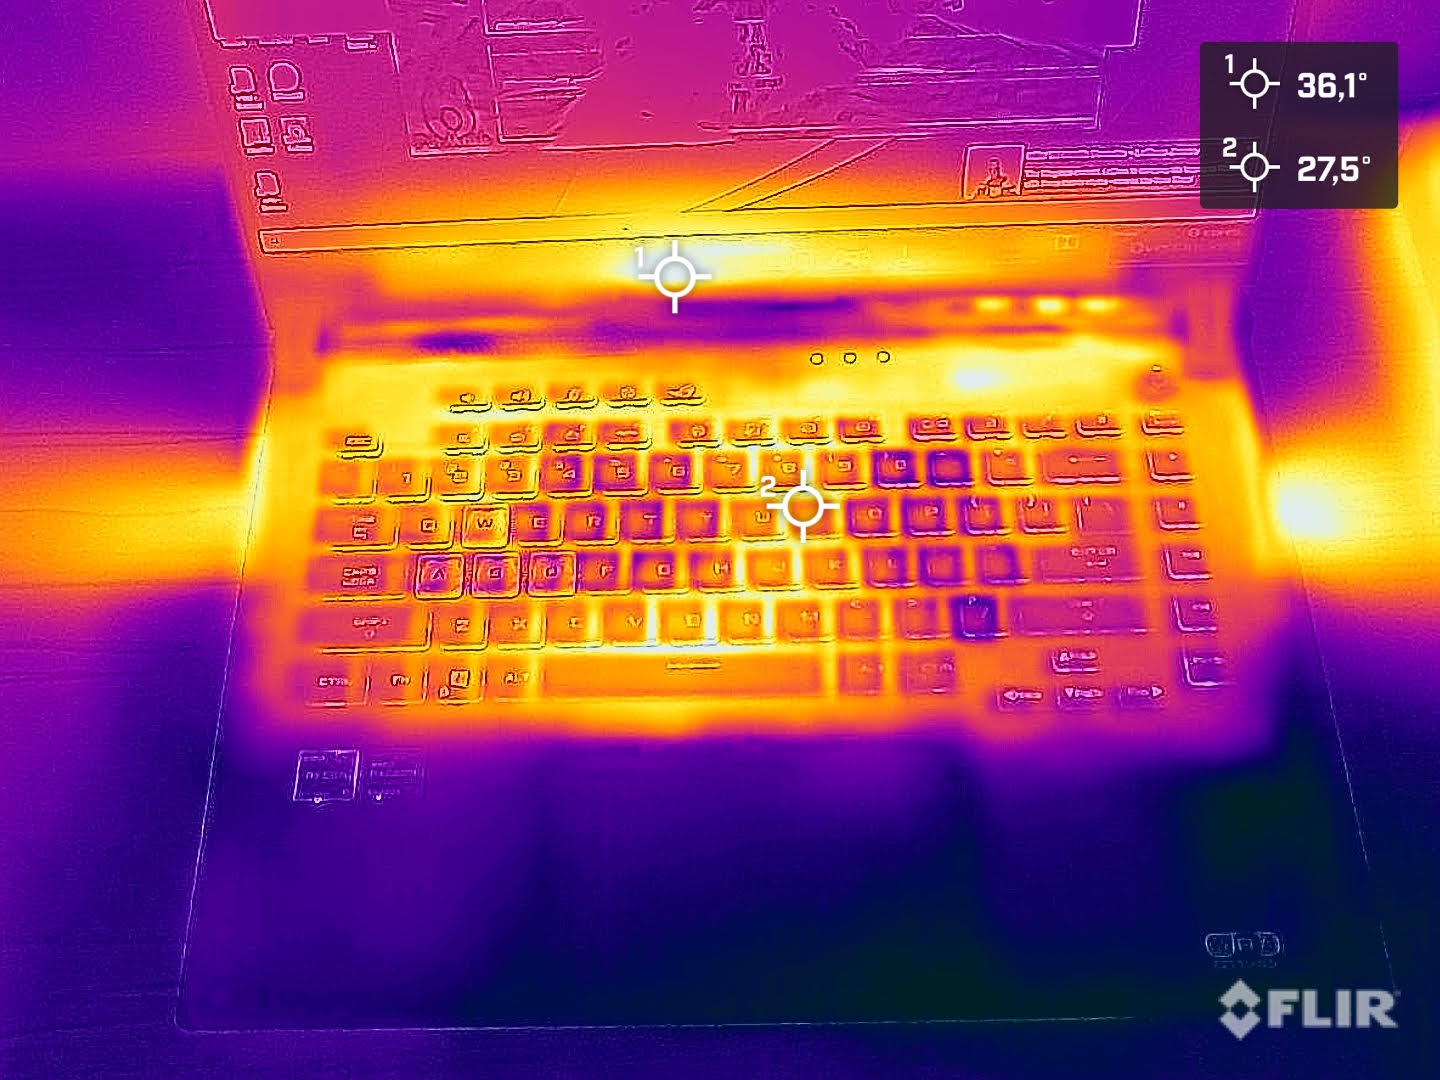
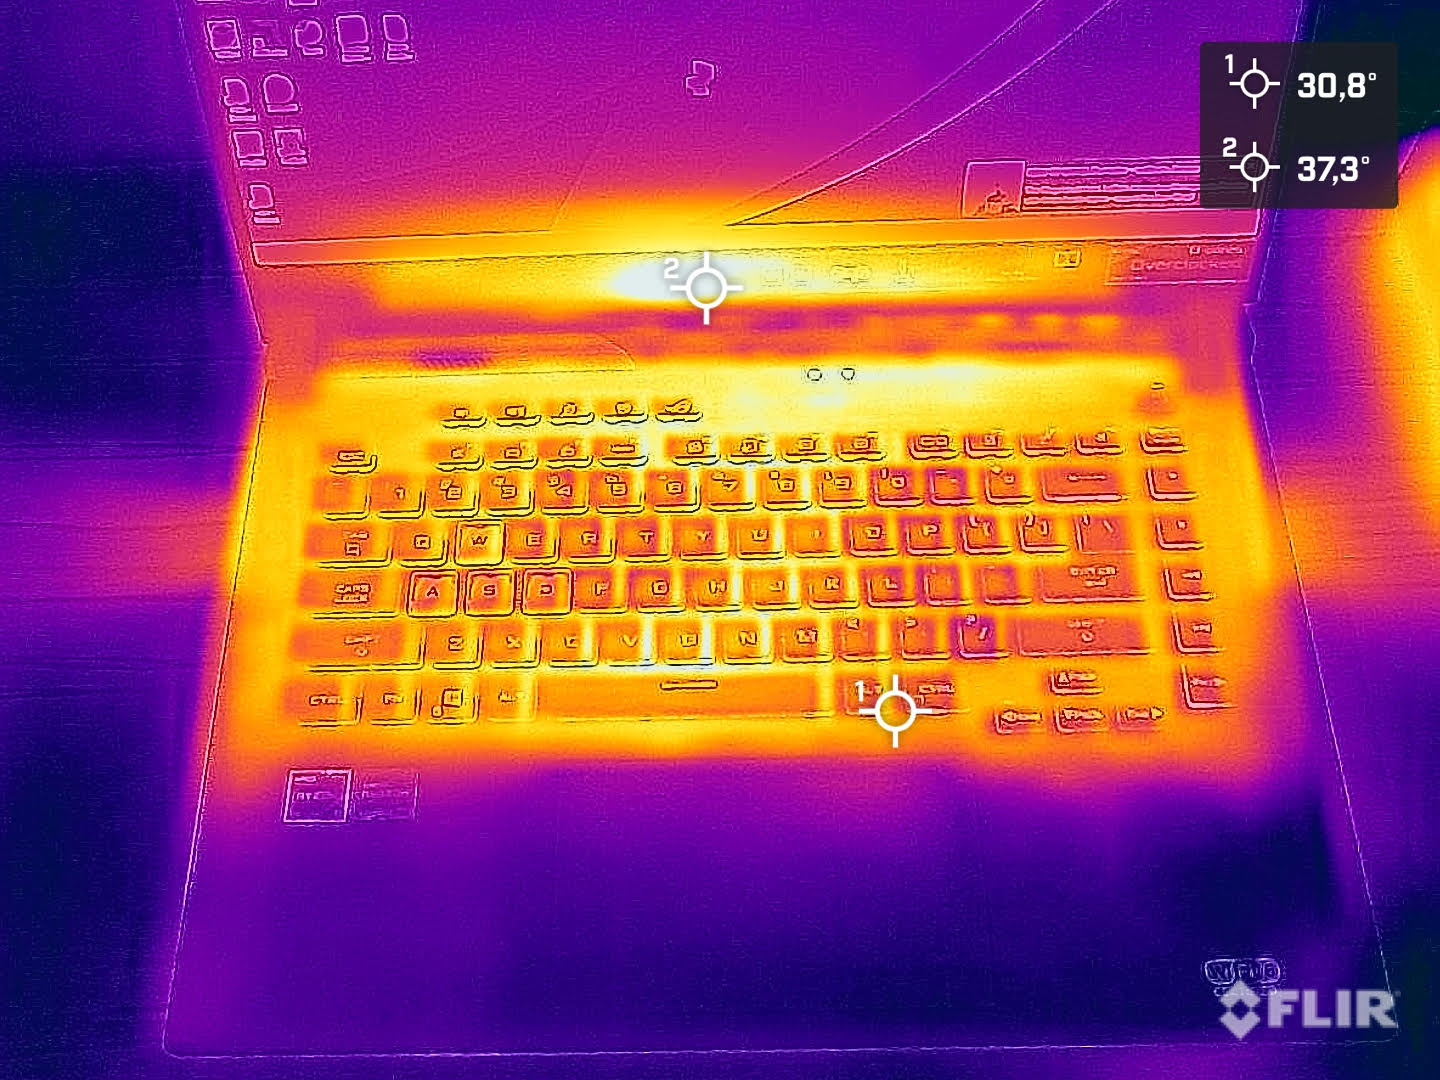
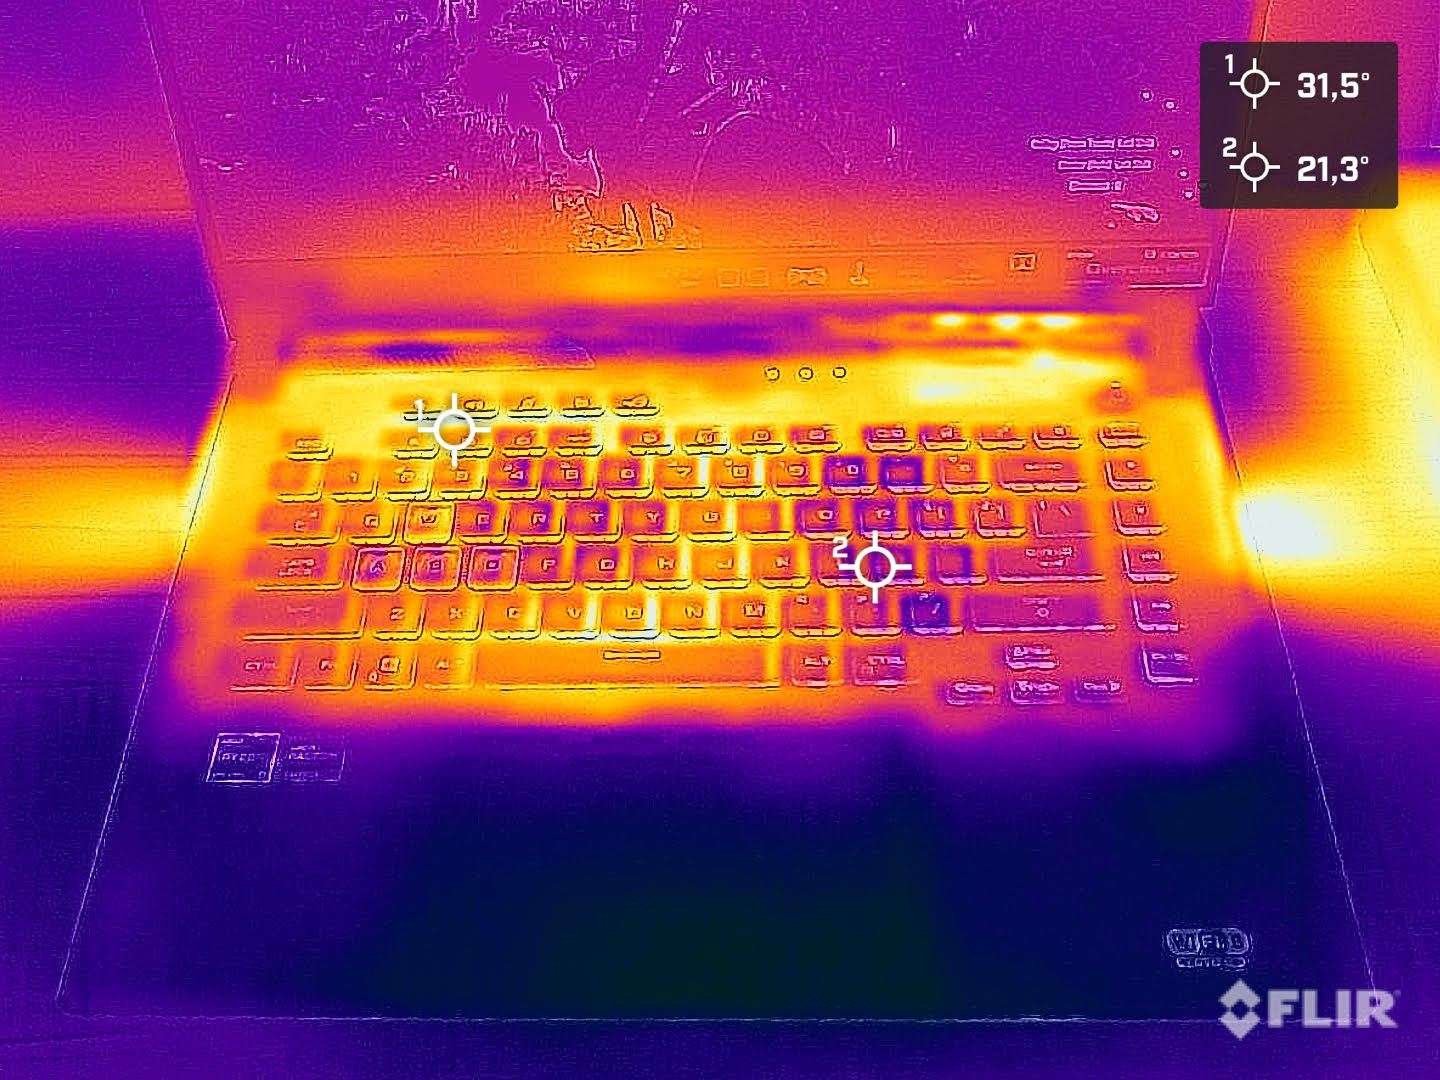
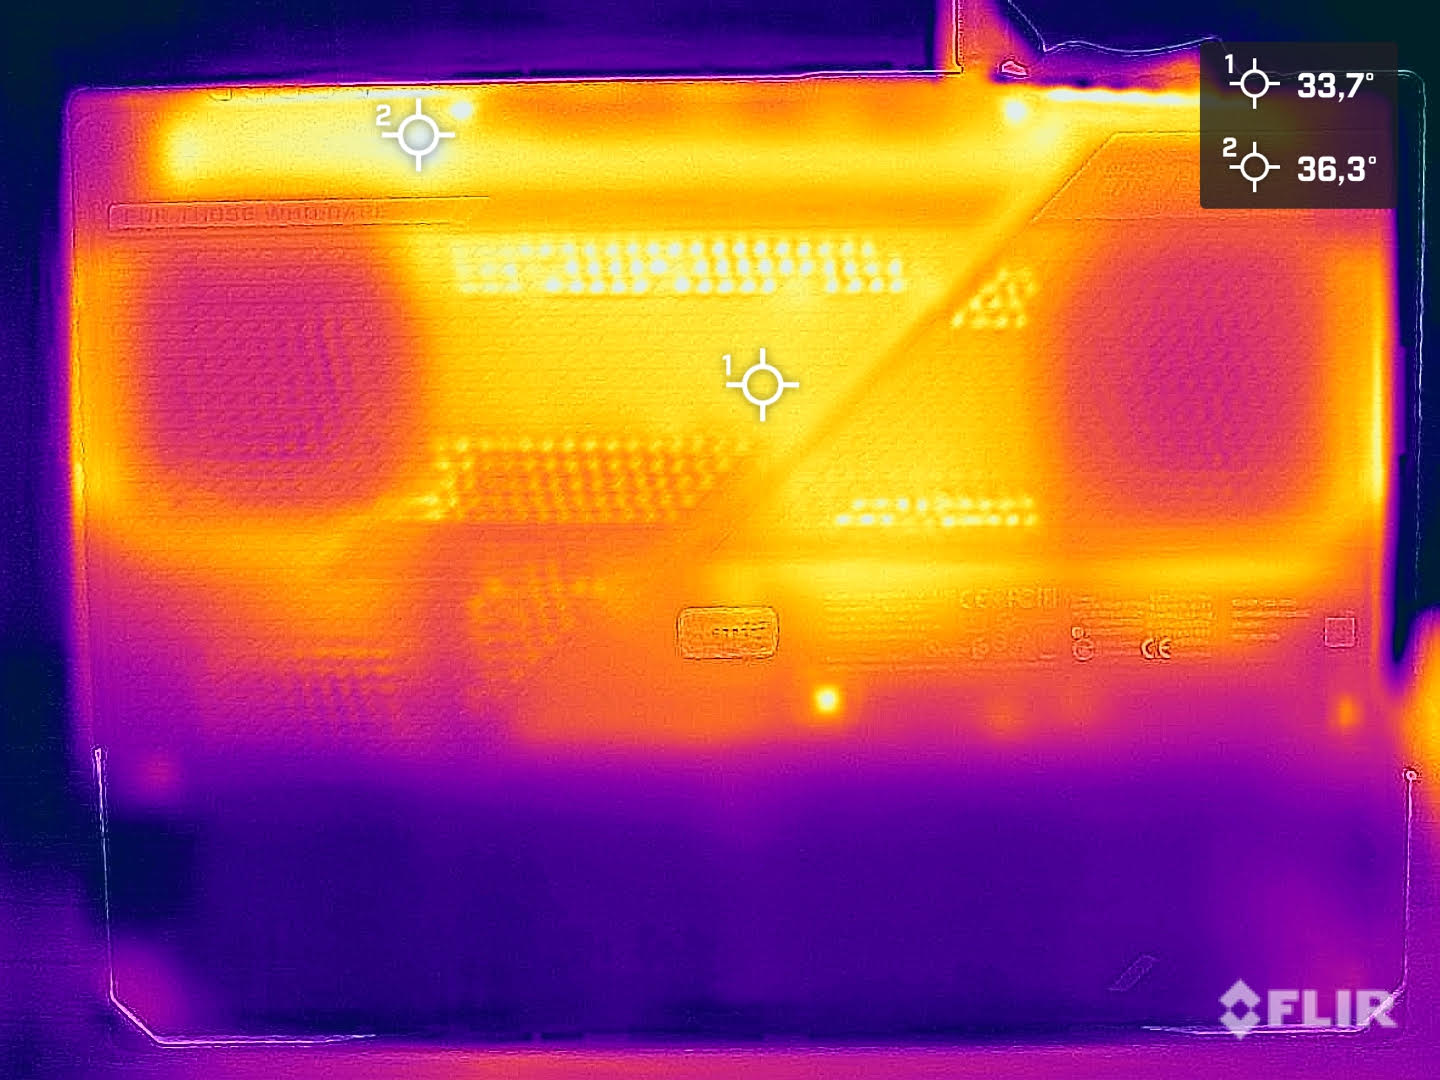
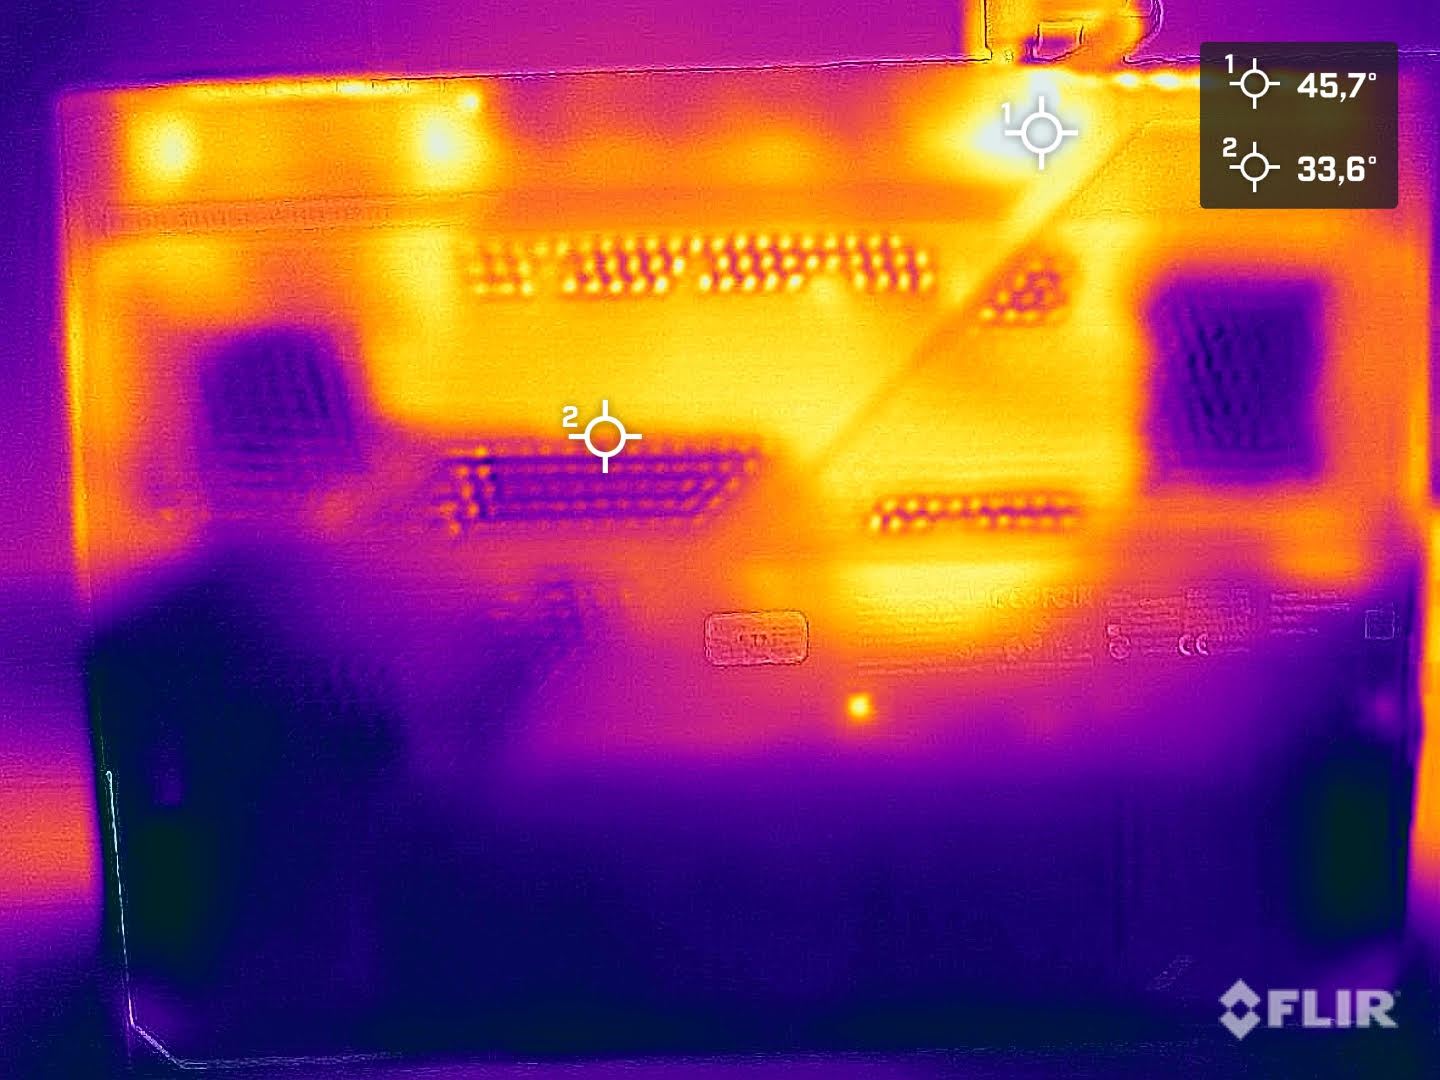
Temperature
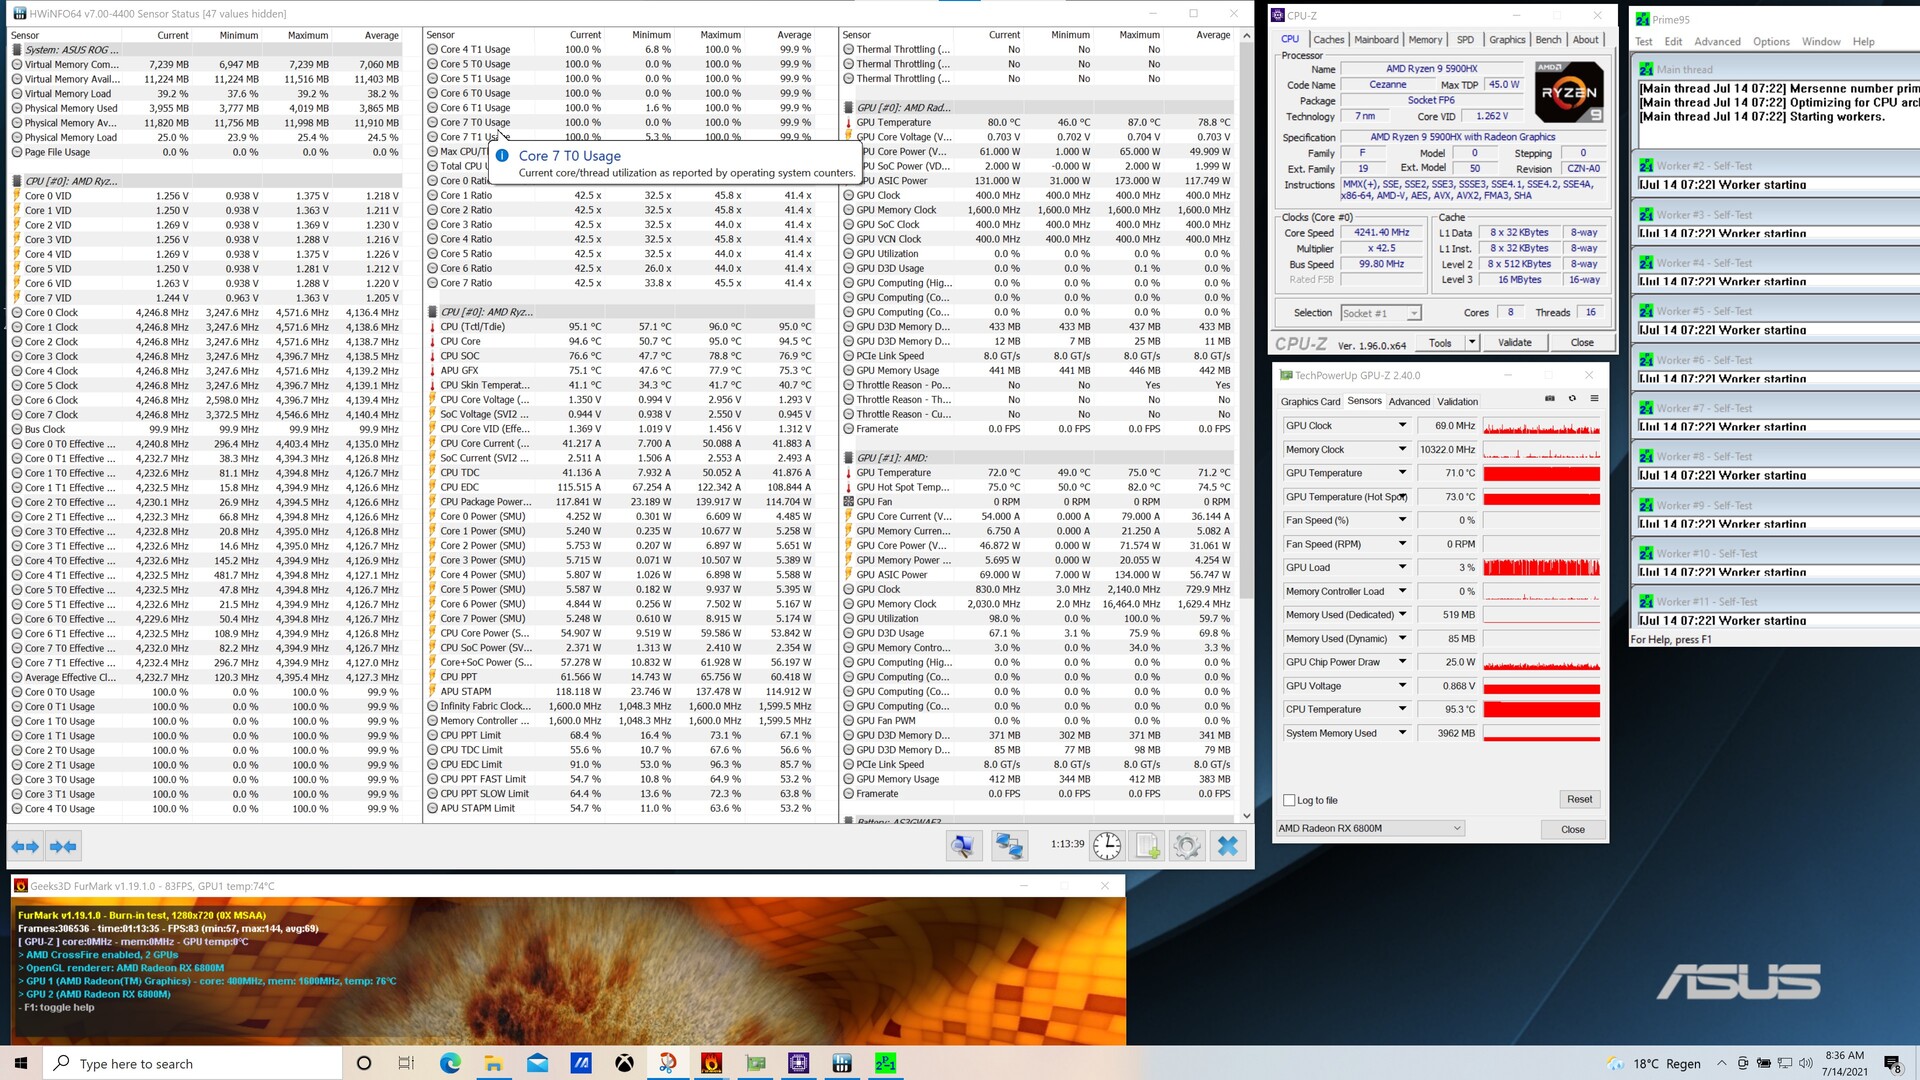
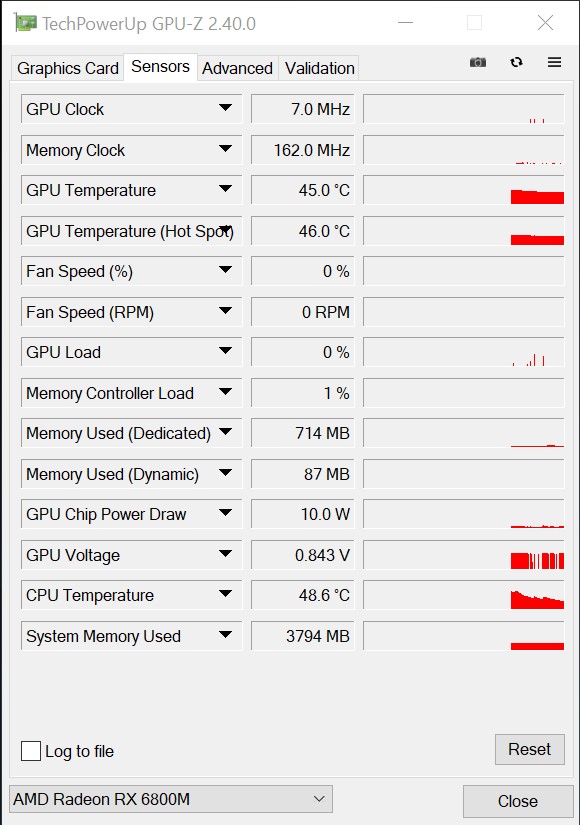
As for the general conditions, it should be mentioned in advance that the stress test was carried out in an air-conditioned room at approximately 20 °C (~68 °F). In addition, the case warmed up considerably more during gaming than during the stress test. However, everything is within the green range with a maximum of 43.3 °C (~110 °F).
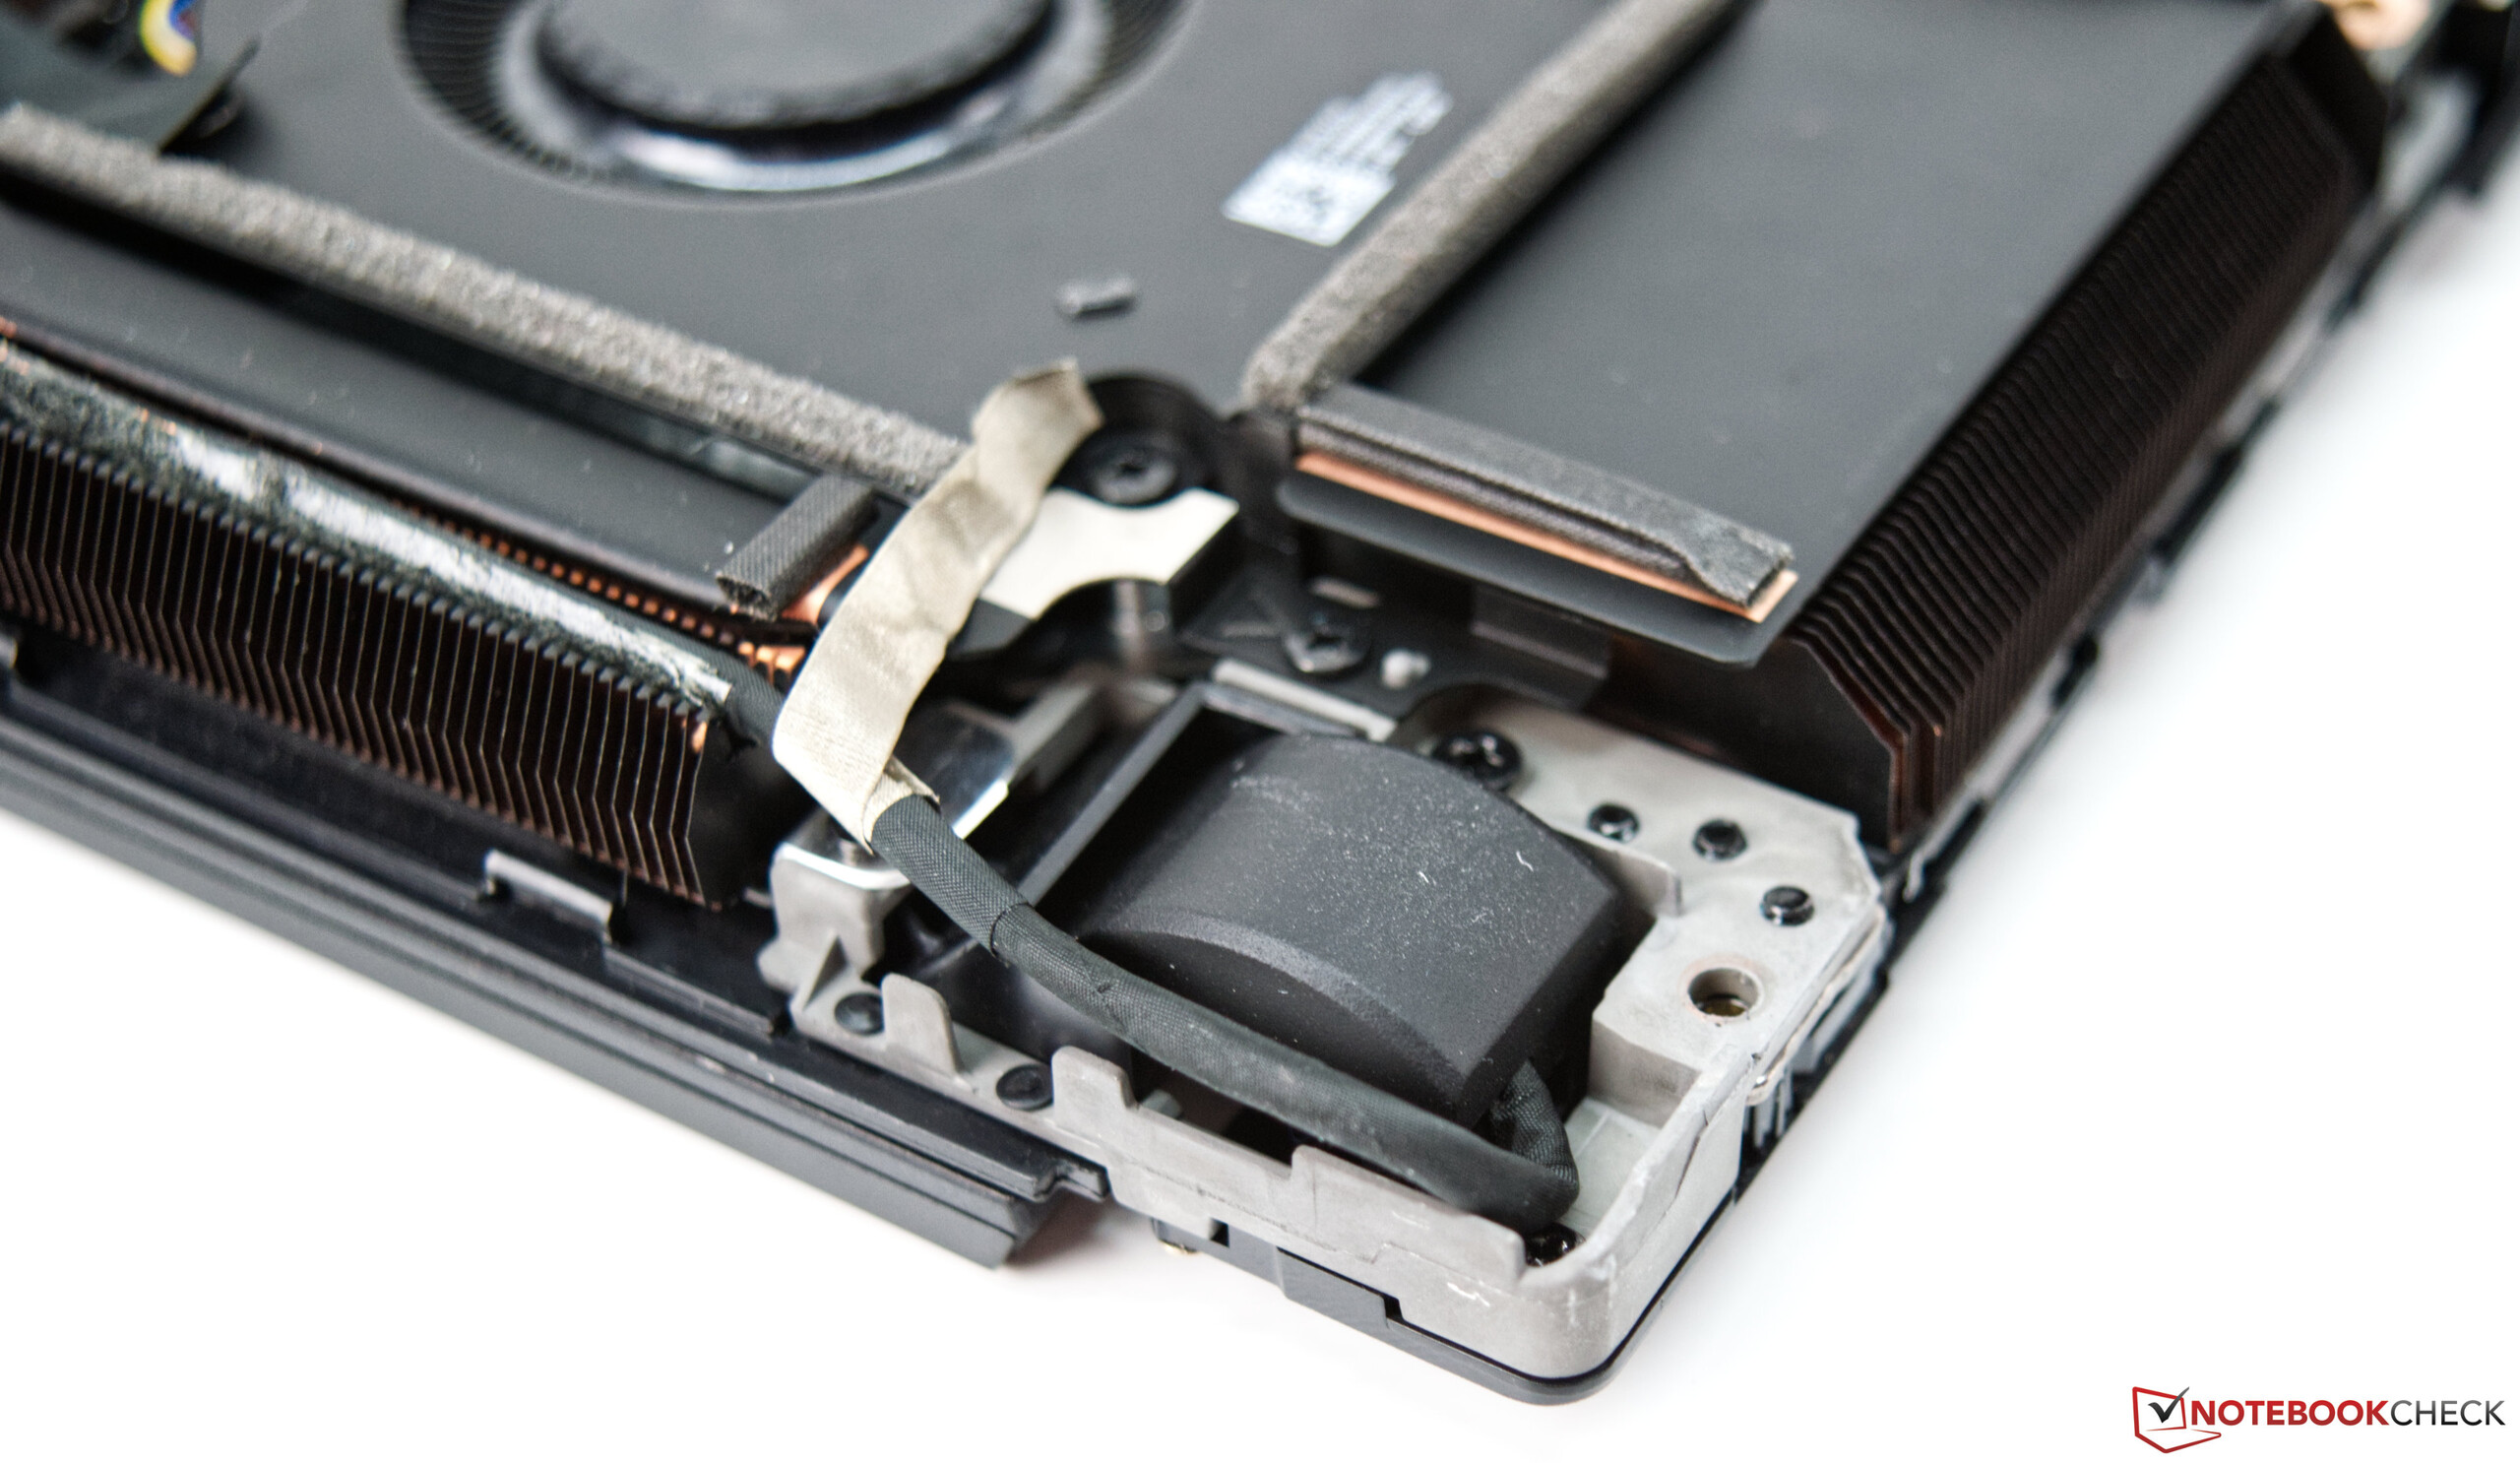
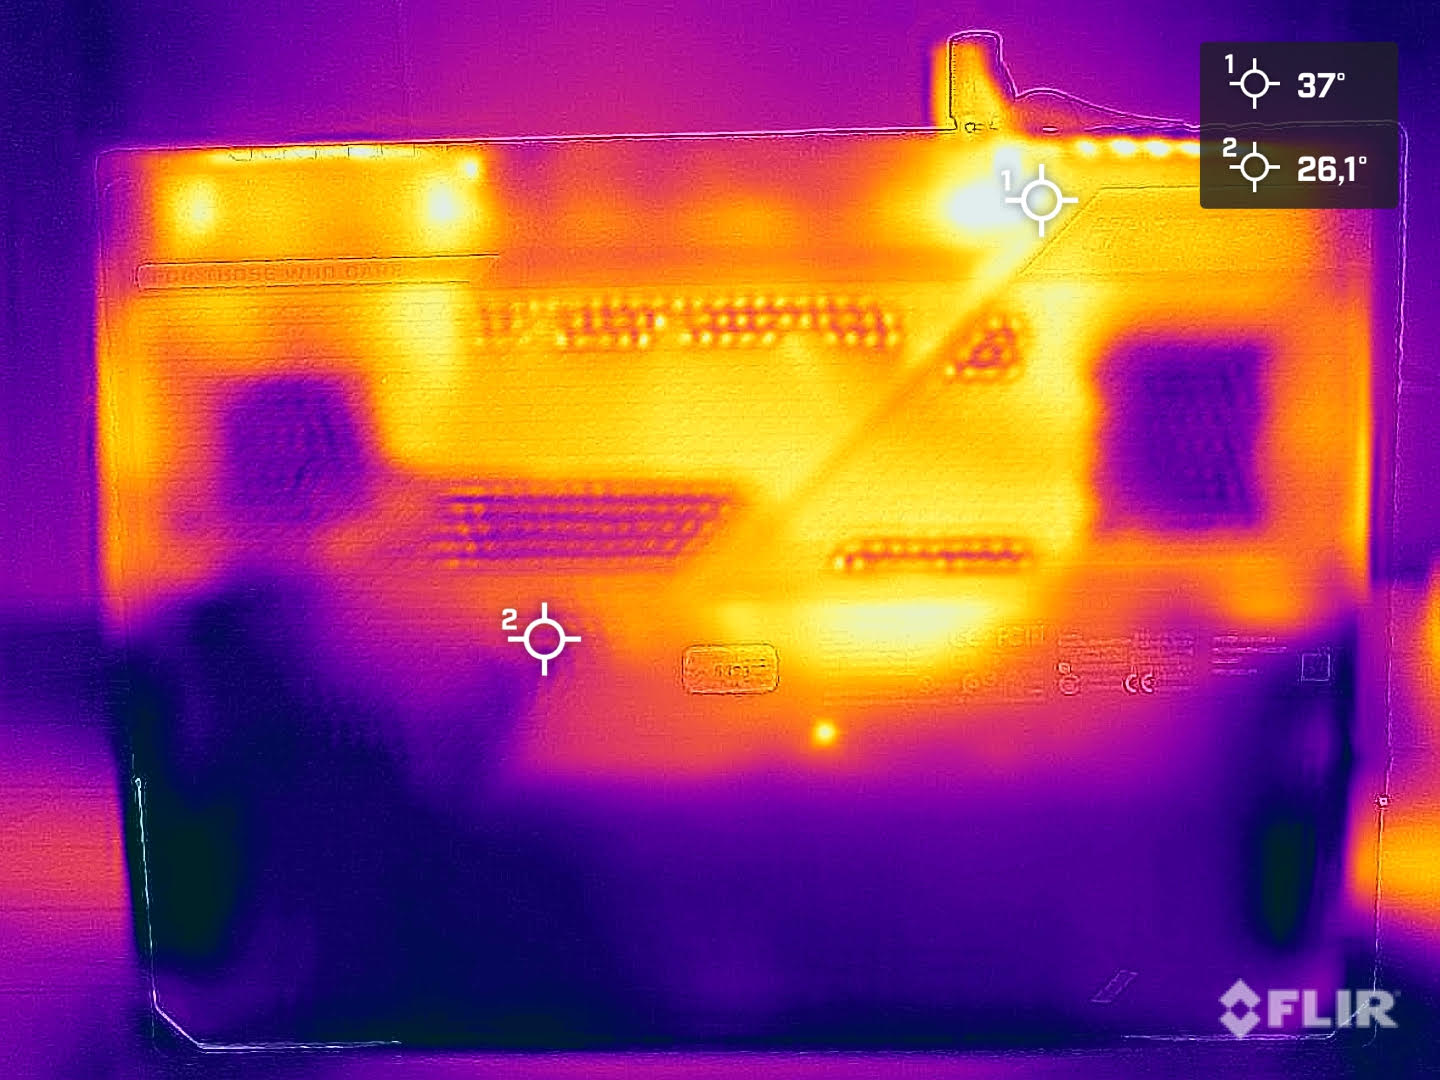
The SoC heated up to 96 °C (~205 °F) under continuous load, but an average clock speed of 4.1 GHz remained stable. The maximum temperature of the dedicated GPU is slightly lower at 82 °C (~180 °F). At first glance, the cooling system looks pretty massive. Waste heat is blown out of the case through the back and sides with the help of two axial fans. Furthermore, according to our information, Asus uses liquid metal on the CPU and GPU in order to ensure the fastest possible heat dissipation.
We weren't able to identify any lasting impact on performance due to the continuous load caused by our one-hour stress test. A second test with 3DMark 11 didn't yield a worse result compared to a cold boot.
(+) The maximum temperature on the upper side is 38.9 °C / 102 F, compared to the average of 40.4 °C / 105 F, ranging from 21.2 to 68.8 °C for the class Gaming.
(+) The bottom heats up to a maximum of 34.6 °C / 94 F, compared to the average of 43.3 °C / 110 F
(+) In idle usage, the average temperature for the upper side is 30.4 °C / 87 F, compared to the device average of 33.9 °C / 93 F.
(±) Playing The Witcher 3, the average temperature for the upper side is 35.4 °C / 96 F, compared to the device average of 33.9 °C / 93 F.
(+) The palmrests and touchpad are cooler than skin temperature with a maximum of 24.9 °C / 76.8 F and are therefore cool to the touch.
(+) The average temperature of the palmrest area of similar devices was 28.8 °C / 83.8 F (+3.9 °C / 7 F).
Speakers
The two speakers offer a clear sound when it comes to mids and highs. The two diaphragms are capable of producing a light bass, even though a separate small subwoofer would have been a good option. The maximum volume is perfectly sufficient to fill small to medium-sized rooms with sound. Voice reproduction is clear and intelligible. Nevertheless, we recommend external audio devices for a better sound experience. These can be connected to the device via Bluetooth or the 3.5 mm audio jack.
Asus ROG Strix G15 G513QY audio analysis
(±) | speaker loudness is average but good (77.5 dB)
Bass 100 - 315 Hz
(±) | reduced bass - on average 5% lower than median
(±) | linearity of bass is average (7.4% delta to prev. frequency)
Mids 400 - 2000 Hz
(+) | balanced mids - only 3% away from median
(+) | mids are linear (3.9% delta to prev. frequency)
Highs 2 - 16 kHz
(+) | balanced highs - only 1.7% away from median
(+) | highs are linear (6.3% delta to prev. frequency)
Overall 100 - 16.000 Hz
(+) | overall sound is linear (8.2% difference to median)
Compared to same class
» 1% of all tested devices in this class were better, 1% similar, 98% worse
» The best had a delta of 6%, average was 18%, worst was 132%
Compared to all devices tested
» 2% of all tested devices were better, 1% similar, 98% worse
» The best had a delta of 4%, average was 24%, worst was 134%
Schenker XMG Neo 15 Tiger Lake audio analysis
(±) | speaker loudness is average but good (79 dB)
Bass 100 - 315 Hz
(-) | nearly no bass - on average 22.6% lower than median
(±) | linearity of bass is average (9.5% delta to prev. frequency)
Mids 400 - 2000 Hz
(+) | balanced mids - only 4.7% away from median
(±) | linearity of mids is average (9.1% delta to prev. frequency)
Highs 2 - 16 kHz
(+) | balanced highs - only 4.1% away from median
(+) | highs are linear (5.3% delta to prev. frequency)
Overall 100 - 16.000 Hz
(±) | linearity of overall sound is average (19.4% difference to median)
Compared to same class
» 66% of all tested devices in this class were better, 7% similar, 27% worse
» The best had a delta of 6%, average was 18%, worst was 132%
Compared to all devices tested
» 47% of all tested devices were better, 8% similar, 46% worse
» The best had a delta of 4%, average was 24%, worst was 134%
Energy management
Energy consumption
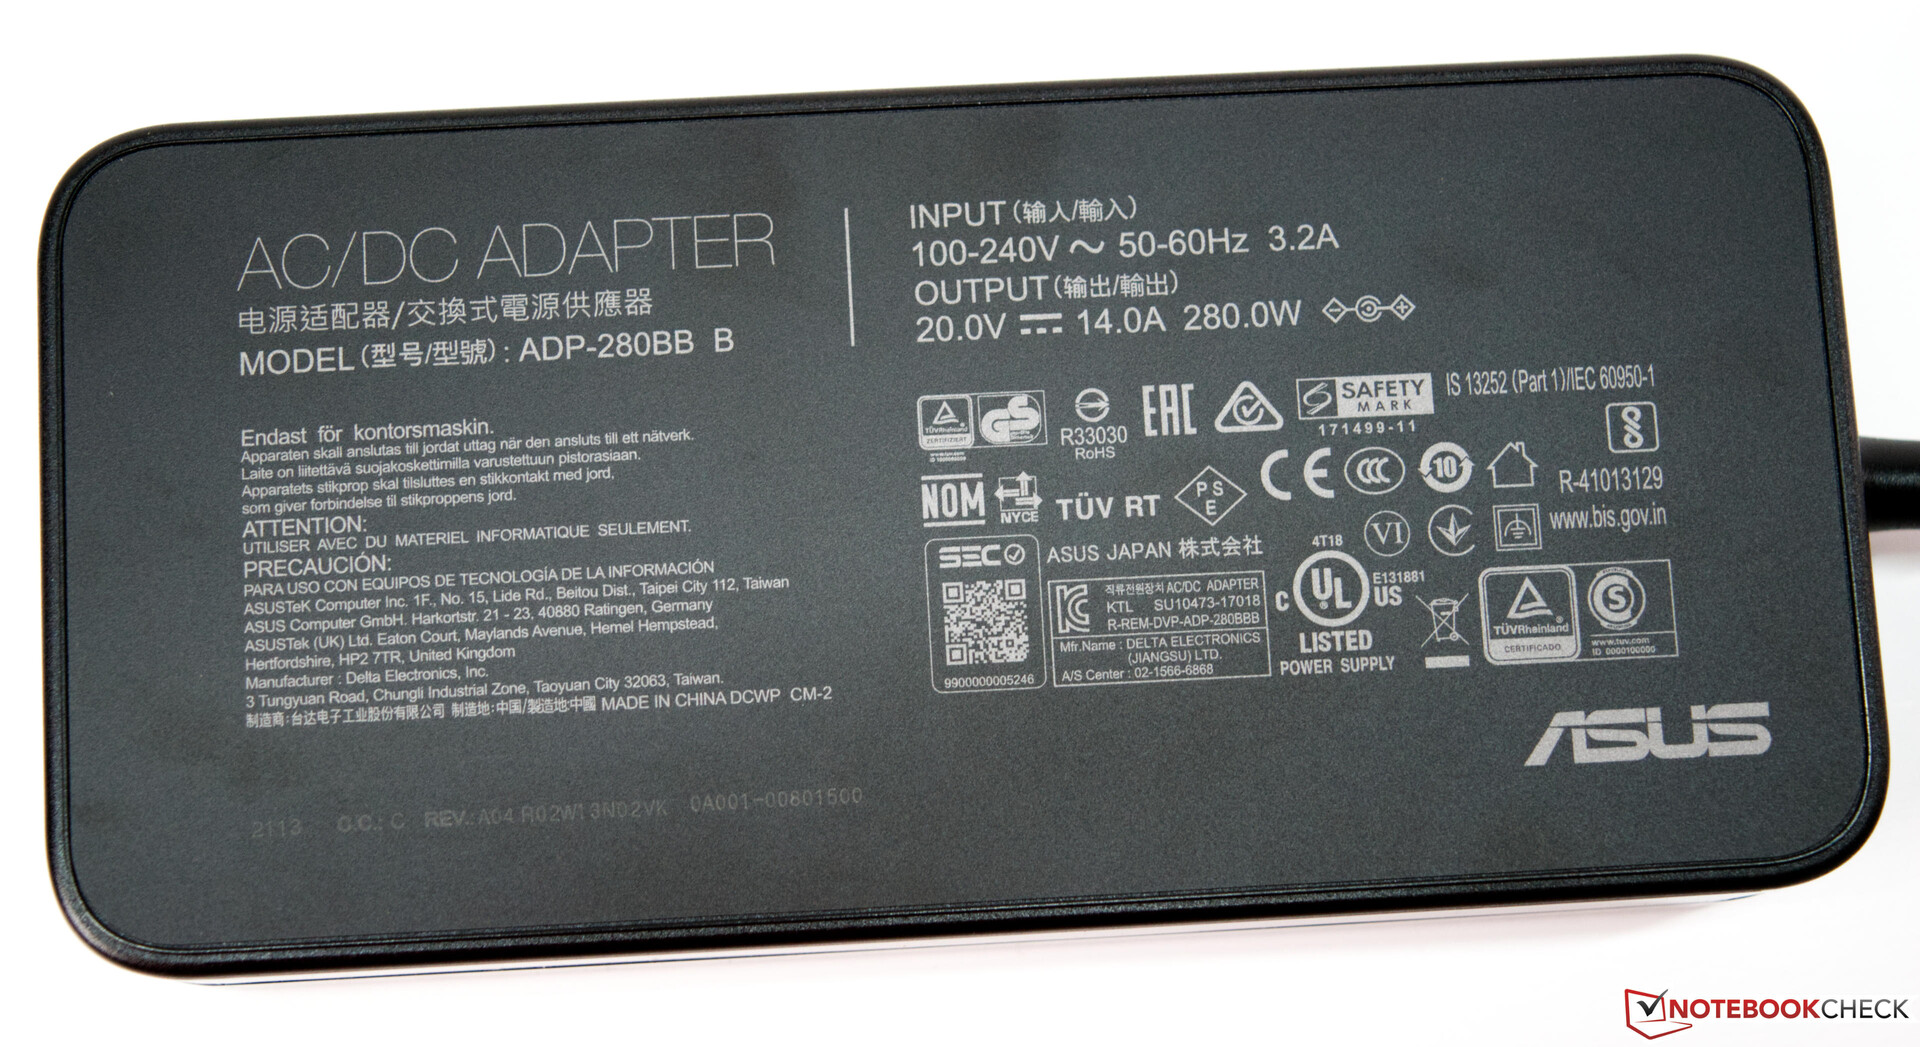
Depending on the brightness level and performance profile, we measured an idle power consumption of 12 to 13 watts. This makes the Asus ROG Strix G15 G513QY a bit more frugal than the competition. Even under average load, our review sample is relatively frugal with a solid 90 watts, and consumption only really ramps up under load. With a maximum of 263 watts, power consumption is slightly below the power adapter's maximum output, which is specified at 280 watts.
| Off / Standby | |
| Idle | |
| Load |
|
Key:
min: | |
| Asus ROG Strix G15 G513QY R9 5900HX, Radeon RX 6800M, Samsung PM991 MZVLQ512HALU, IPS, 1920x1080, 15.6" | Razer Blade 15 Advanced Model Early 2021 i7-10875H, GeForce RTX 3080 Laptop GPU, Samsung PM981a MZVLB1T0HBLR, IPS, 1920x1080, 15.6" | Schenker XMG Pro 15 (Early 2021, RTX 3080) i7-10870H, GeForce RTX 3080 Laptop GPU, Samsung SSD 970 EVO Plus 1TB, IPS, 1920x1080, 15.6" | Alienware m15 R4 RTX 3080 i9-10980HK, GeForce RTX 3080 Laptop GPU, 2x WDC PC SN730 SDBPNTY-512G (RAID 0), IPS, 1920x1080, 15.6" | Alienware m15 R4 i9-10980HK, GeForce RTX 3070 Laptop GPU, Micron 2300 1TB MTFDHBA1T0TDV, IPS, 1920x1080, 15.6" | Schenker XMG Neo 15 Tiger Lake i7-11800H, GeForce RTX 3080 Laptop GPU, Samsung SSD 980 Pro 1TB MZ-V8P1T0BW, IPS, 2560x1440, 15.6" | Asus ROG Strix G15 G513QR R9 5900HX, GeForce RTX 3070 Laptop GPU, SK Hynix HFM001TD3JX013N, IPS, 1920x1080, 15.6" | Average AMD Radeon RX 6800M | Average of class Gaming | |
|---|---|---|---|---|---|---|---|---|---|
| Power Consumption | -1% | 0% | -117% | -110% | -17% | -11% | -20% | -31% | |
| Idle Minimum * (Watt) | 12.1 | 13 -7% | 8 34% | 37 -206% | 35 -189% | 15 -24% | 4 67% | 14.5 ? -20% | 13.6 ? -12% |
| Idle Average * (Watt) | 13 | 15 -15% | 13 -0% | 40 -208% | 39 -200% | 17 -31% | 9 31% | 16.7 ? -28% | 19.3 ? -48% |
| Idle Maximum * (Watt) | 14.7 | 22 -50% | 22 -50% | 53 -261% | 48 -227% | 22 -50% | 36 -145% | 18.5 ? -26% | 25.7 ? -75% |
| Load Average * (Watt) | 90.3 | 98 -9% | 97 -7% | 121 -34% | 135 -50% | 101 -12% | 130 -44% | 111.9 ? -24% | 110.1 ? -22% |
| Witcher 3 ultra * (Watt) | 200 | 126 37% | 179 10% | 193 3% | 194 3% | 195 2% | 174 13% | ||
| Load Maximum * (Watt) | 263.4 | 165 37% | 225 15% | 246 7% | 252 4% | 230 13% | 227 14% | 263 ? -0% | 258 ? 2% |
* ... smaller is better
The Witcher 3 energy consumption
Battery life
In our standardized Wi-Fi test (150 cd/m², websites are periodically accessed through a script), the 90 Wh battery lasts a good 9 hours before the device has to be plugged in again. A complete charging process is completed after 105 minutes, which is definitely very fast in view of the large battery capacity.
Overall, the achieved rates are relatively good, because long battery runtimes aren't usually the strong suit of powerful gaming laptops.
| Asus ROG Strix G15 G513QY R9 5900HX, Radeon RX 6800M, 90 Wh | Razer Blade 15 Advanced Model Early 2021 i7-10875H, GeForce RTX 3080 Laptop GPU, 80 Wh | Schenker XMG Pro 15 (Early 2021, RTX 3080) i7-10870H, GeForce RTX 3080 Laptop GPU, 73 Wh | Alienware m15 R4 RTX 3080 i9-10980HK, GeForce RTX 3080 Laptop GPU, 86 Wh | Alienware m15 R4 i9-10980HK, GeForce RTX 3070 Laptop GPU, 86 Wh | Schenker XMG Neo 15 Tiger Lake i7-11800H, GeForce RTX 3080 Laptop GPU, 93 Wh | Asus ROG Strix G15 G513QR R9 5900HX, GeForce RTX 3070 Laptop GPU, 90 Wh | Average of class Gaming | |
|---|---|---|---|---|---|---|---|---|
| Battery runtime | -9% | -33% | -73% | -70% | -11% | -23% | -36% | |
| Reader / Idle (h) | 16.1 | 14.4 -11% | 8.4 -48% | 3.7 -77% | 9.17 ? -43% | |||
| WiFi v1.3 (h) | 9.2 | 9 -2% | 7.2 -22% | 1.8 -80% | 2.7 -71% | 5.6 -39% | 7.4 -20% | 6.75 ? -27% |
| Load (h) | 2.3 | 2 -13% | 1.6 -30% | 0.8 -65% | 0.9 -61% | 2.7 17% | 1.7 -26% | 1.45 ? -37% |
| H.264 (h) | 8.9 | 5.5 | 1.9 | 5.9 | 13.5 | 8.13 ? | ||
| Witcher 3 ultra (h) | 0.8 | 0.958 ? |
Pros
Cons
Verdict - AMD is back in the mobile high-end segment
The Asus ROG Strix G15 G513QY is a powerful gaming laptop that combines a cutting-edge AMD Ryzen 9 5900HX with the AMD Radeon RX 6800M, which is additionally equipped with 12 GB of VRAM. However, the latter can only demonstrate its full potential in this Asus laptop when an external display is connected to the device via the USB-C port. This is a shortcoming that costs about 10% in terms of performance during normal use with the integrated display. Nonetheless, the performance of the brand-new Radeon RX 6800M is very good, and it can compete with an Nvidia GeForce RTX 3080 (laptop) in many games. Despite this, the AMD Radeon RX 6800M places itself rather between the GeForce RTX 3080 laptop and the GeForce RTX 3070 laptop. This makes the 15-inch laptop a true alternative if buying a new high-end gaming laptop is currently on the agenda. Especially the great 300 Hz display was able to convince with good rates. We recommend calibrating the display (see linked profile), though; the improvements are very noticeable.
The Asus ROG Strix G15 G513QY offers excellent performance and a fast 300 Hz display. AMD celebrates a successful return to the mobile high-end GPU segment with the Radeon RX 6800M.
The lack of Thunderbolt and the single USB-C port, which supports DisplayPort and Power Delivery, don't seem to be up to date anymore. A webcam and an SD card reader are also missing. Furthermore, we don't want to leave the RAM issue unmentioned, since this situation is a fact and shouldn't occur in a gaming device. Therefore, if you decide to buy the Asus ROG Strix G15 G513QY, you should make sure that the same RAM as in our review sample is not installed. If you can live with these limitations, you'll get a very powerful gaming laptop with the Asus ROG Strix G15 G513QY, which features a cutting-edge and extremely potent CPU and GPU configuration from AMD.
A true alternative is the Alienware m15 R4, which is equipped with one of the fastest GeForce RTX 3070 laptop GPUs in terms of TPD classifications. But the Asus ROG Strix G15 G513QR with the Nvidia GeForce RTX 3070 laptop GPU is also an alternative that comes with a compelling price tag.
Price and availability
At the time of writing, you can find the Asus ROG Strix G15 G513QY with 512 GB of storage on newegg for $1,879. Going up to 1 TB of storage space increases the price to $1,964. You also have the option to increase both the storage space and RAM even further here. Alternatively, for example, you can also find it on Amazon with a 512 GB SSD, albeit at a higher price of $2,039.
Asus ROG Strix G15 G513QY
- 07/20/2021 v7 (old)
Sebastian Bade
Price comparison

