Notebookcheck Logo

Performance Analysis of Outriders

Cool game, but half-cooked on a technical level. The third person shooter from Square Enix and People Can Fly has had a mixed reception among both critics and players. We have analysed the performance of the PC version.
Outriders

Technology

Most users and critics agree that Outriders launched with a lot of problems. These include server issues as well as technological problems.

Outriders
Outriders
Outriders
Outriders

A month after launch, we decided to take a look at Outriders, which has generated a lot of debate online. Even though we did not encounter all of the issues that other players reported, we still ran into a great many problems, some of which were more annoying than others. For instance, on most systems, Outriders is stuttering quite a lot right after you get past the loading screen. However, the stuttering disappears after a while.

Outriders
Outriders
Outriders
Outriders

We ran into occasional stutters in Outriders on every system we tested. Moreover, on weaker systems, the frame rates were quite unstable with very poor minimums. For a third person shooter, Outriders requires a surprisingly high frame rate (60 FPS or higher) to feel smooth. What is more, the game occasionally crashed on us.

Outriders
Outriders
Outriders
Outriders

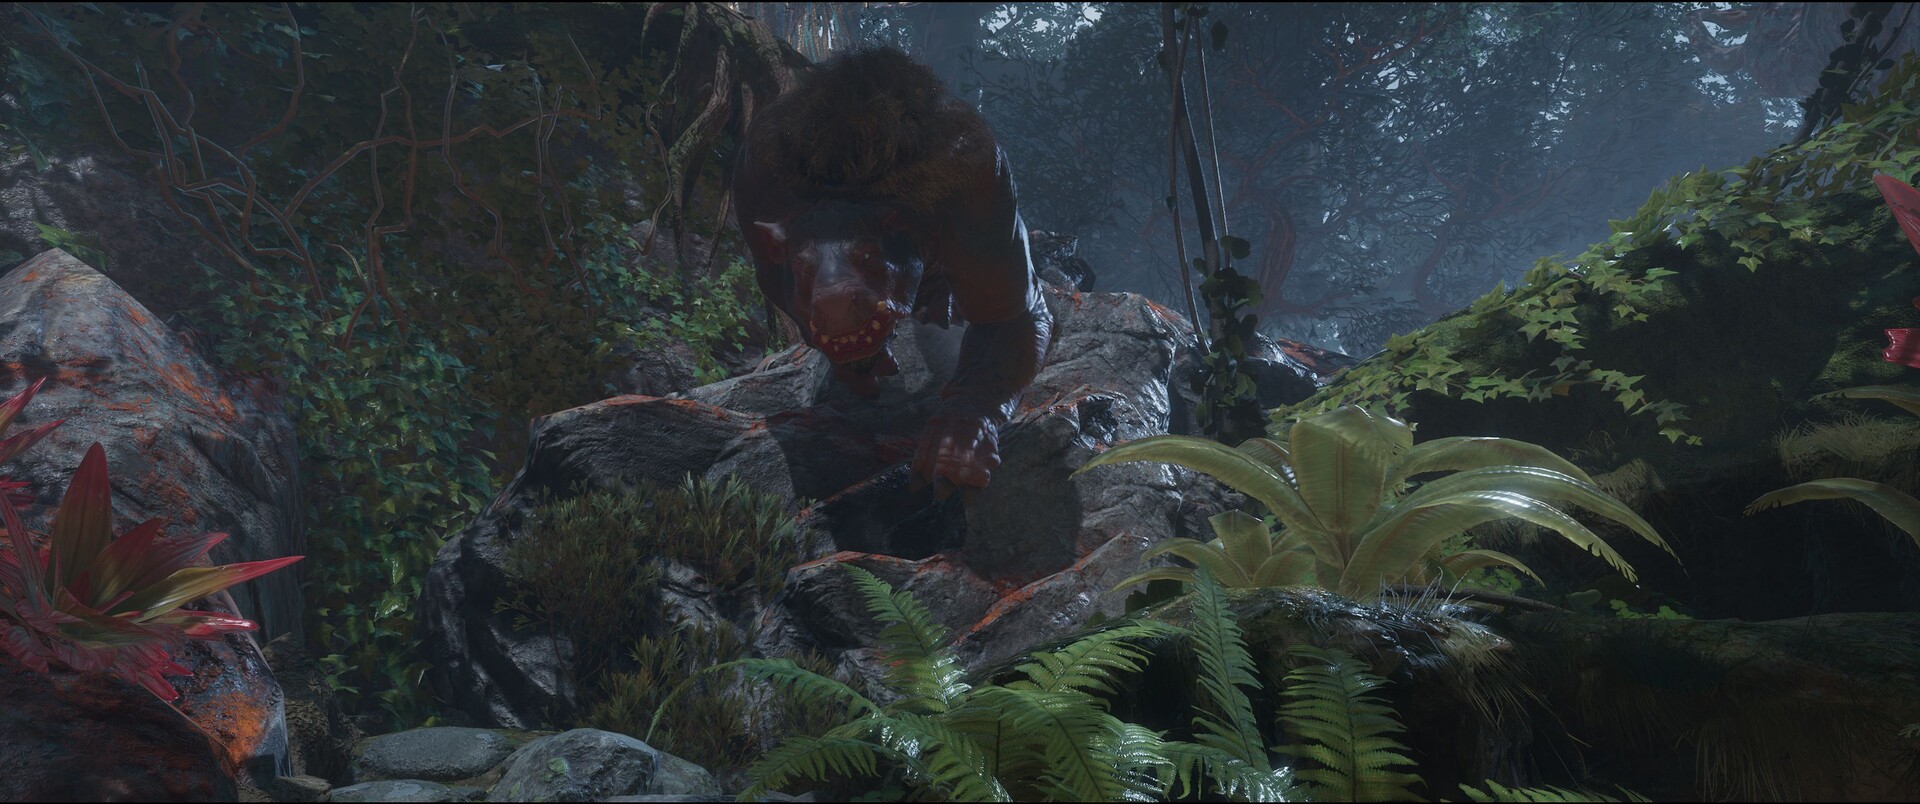
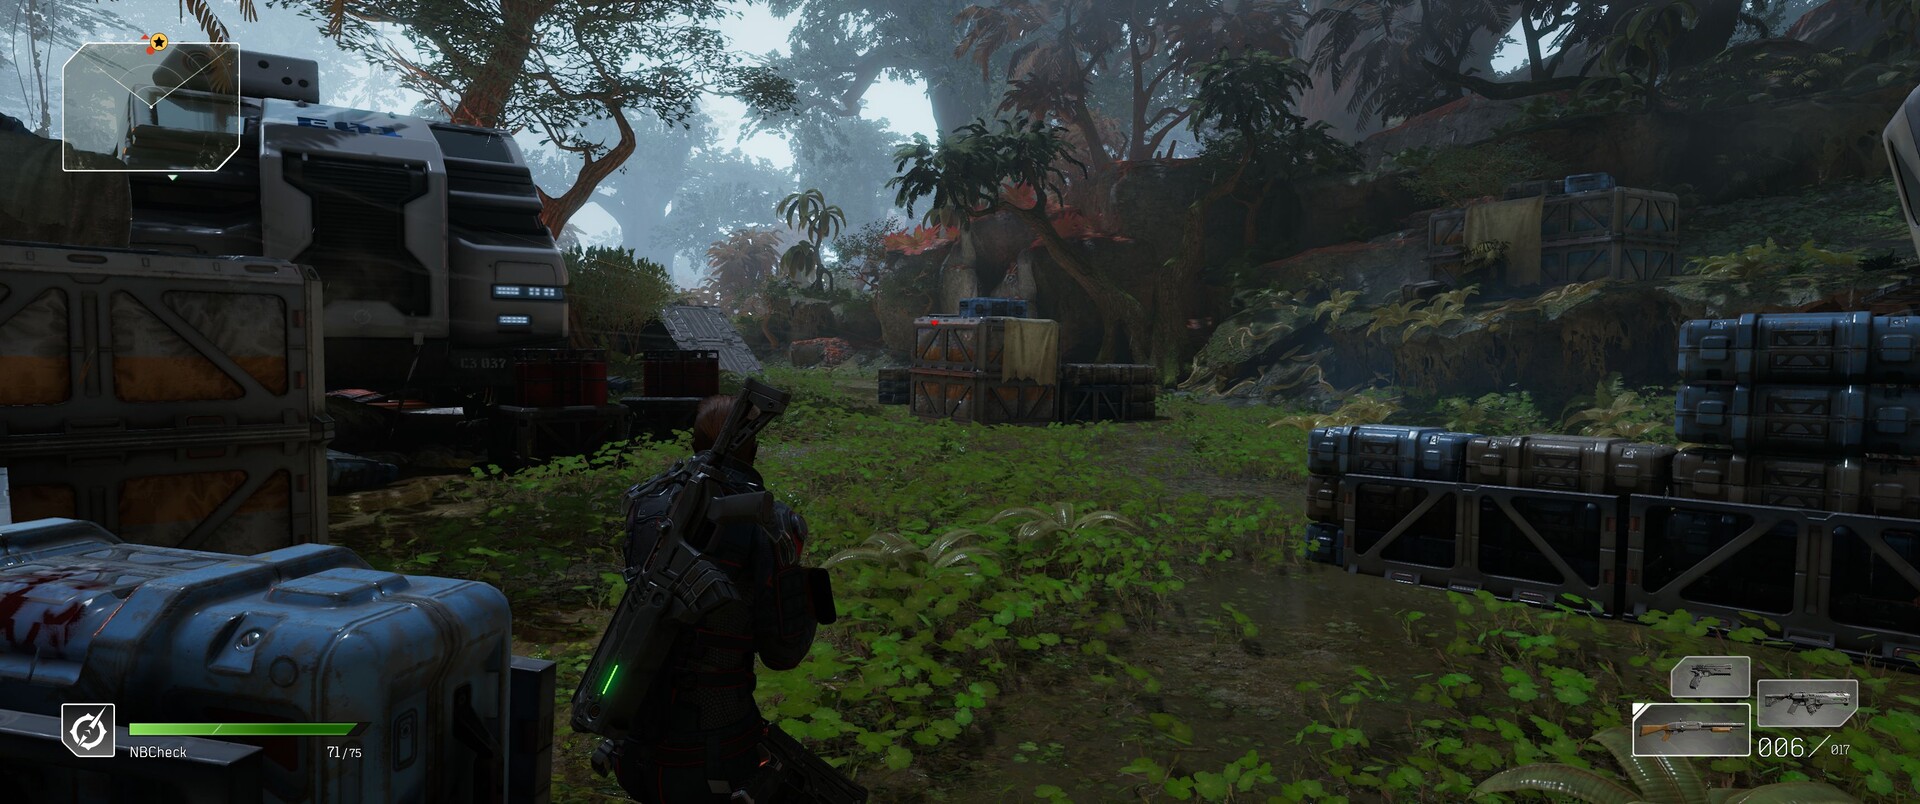
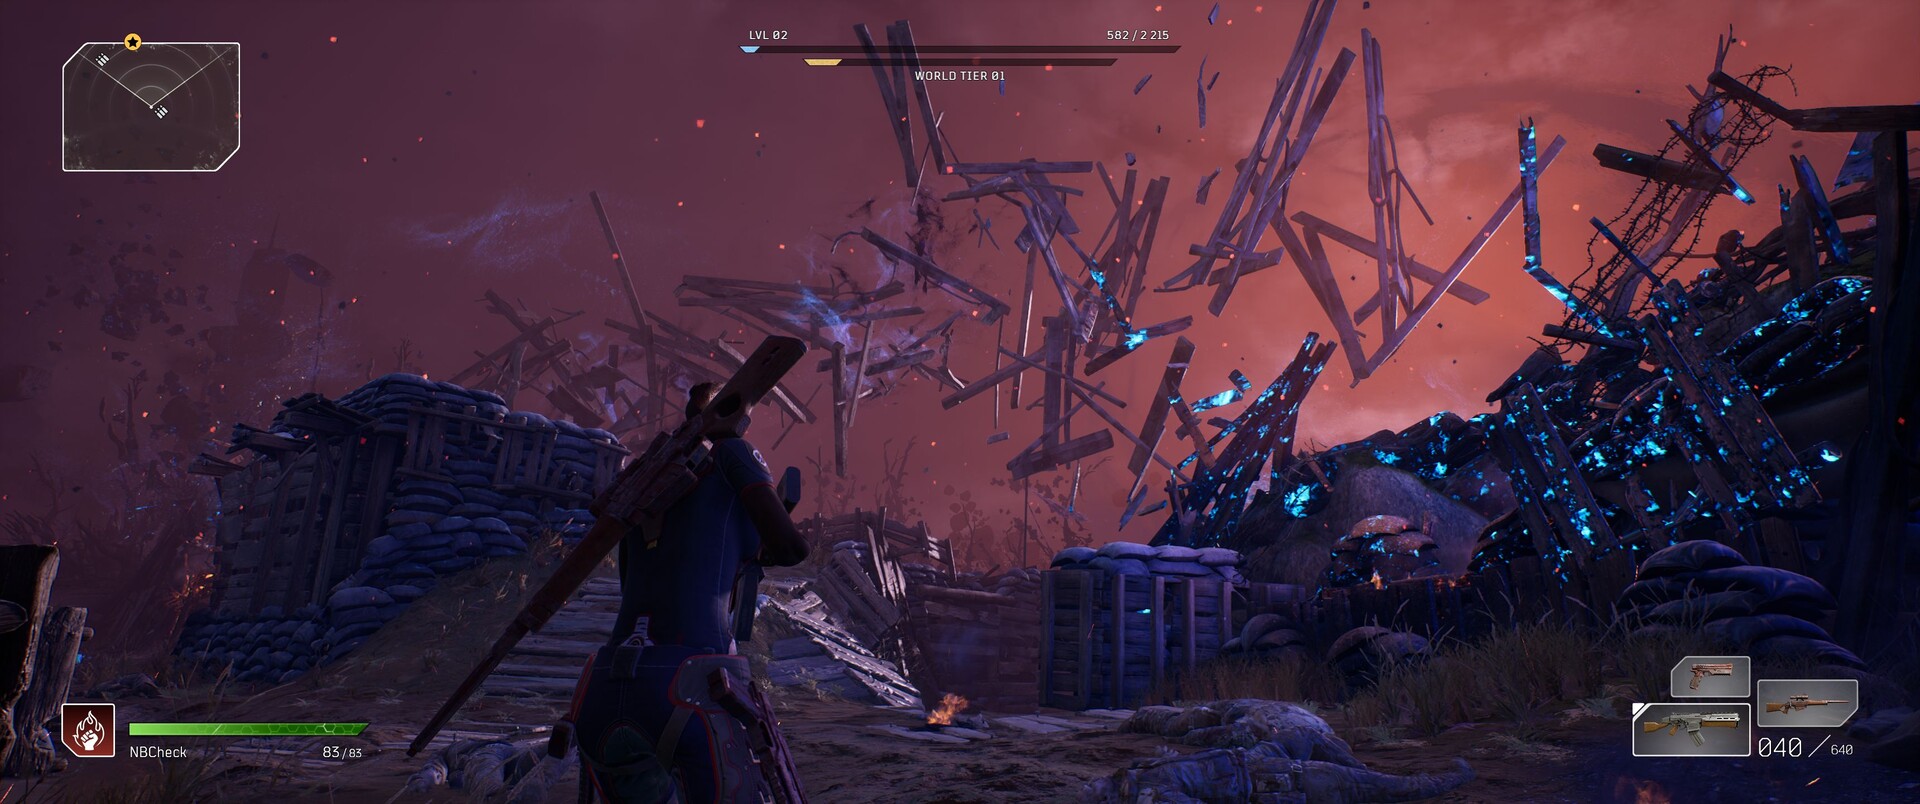
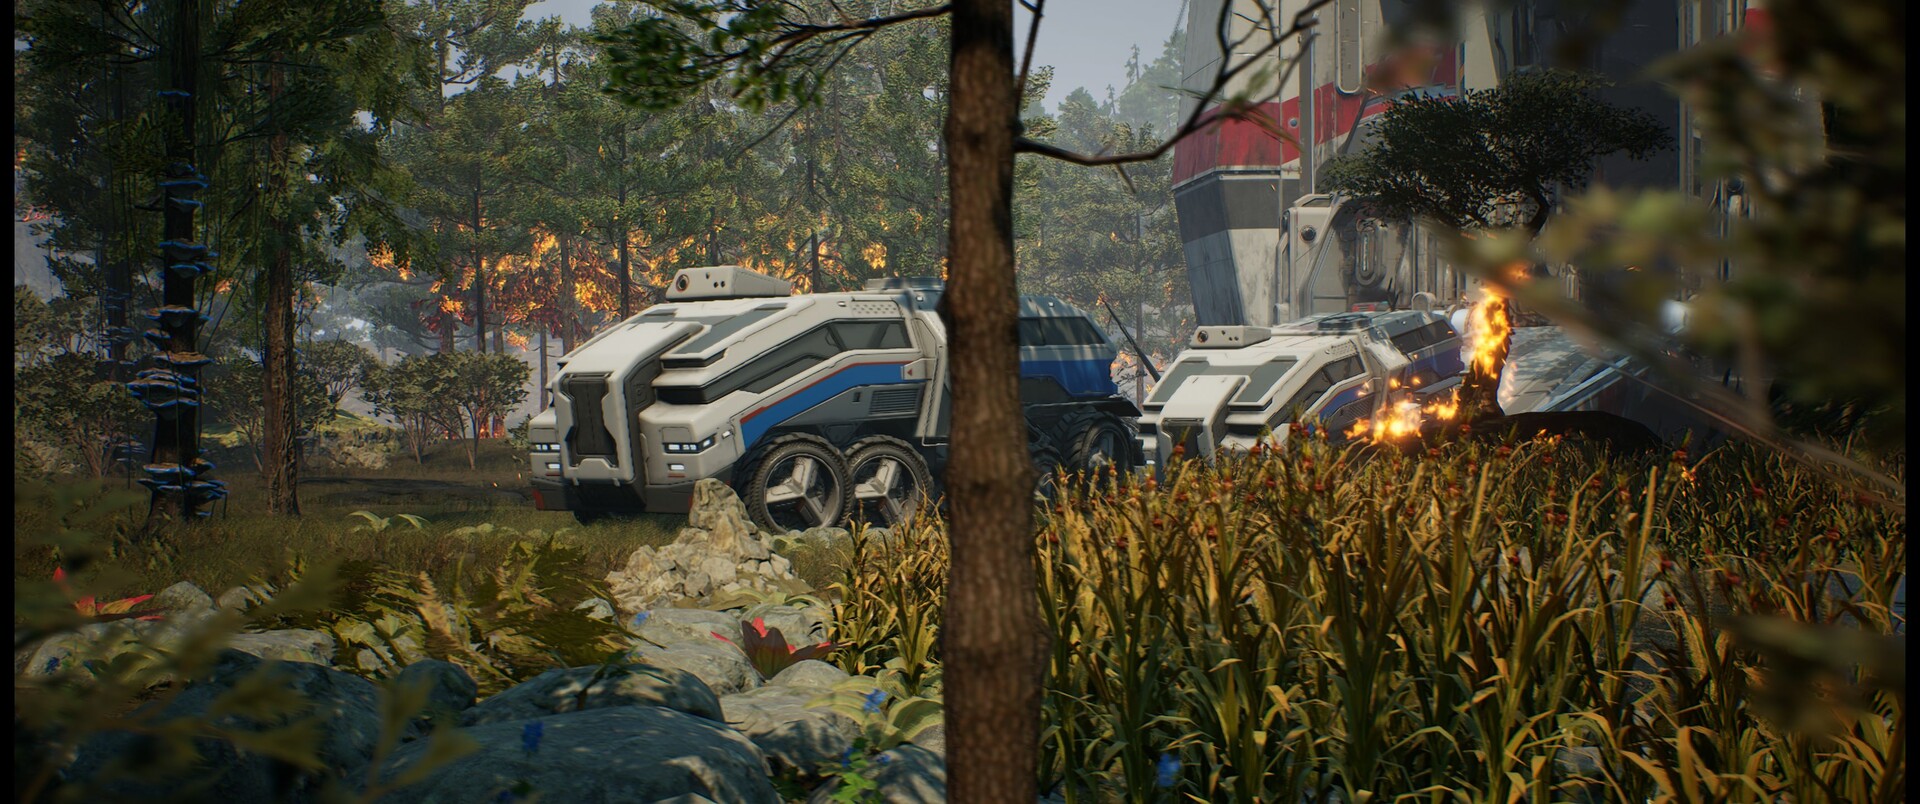
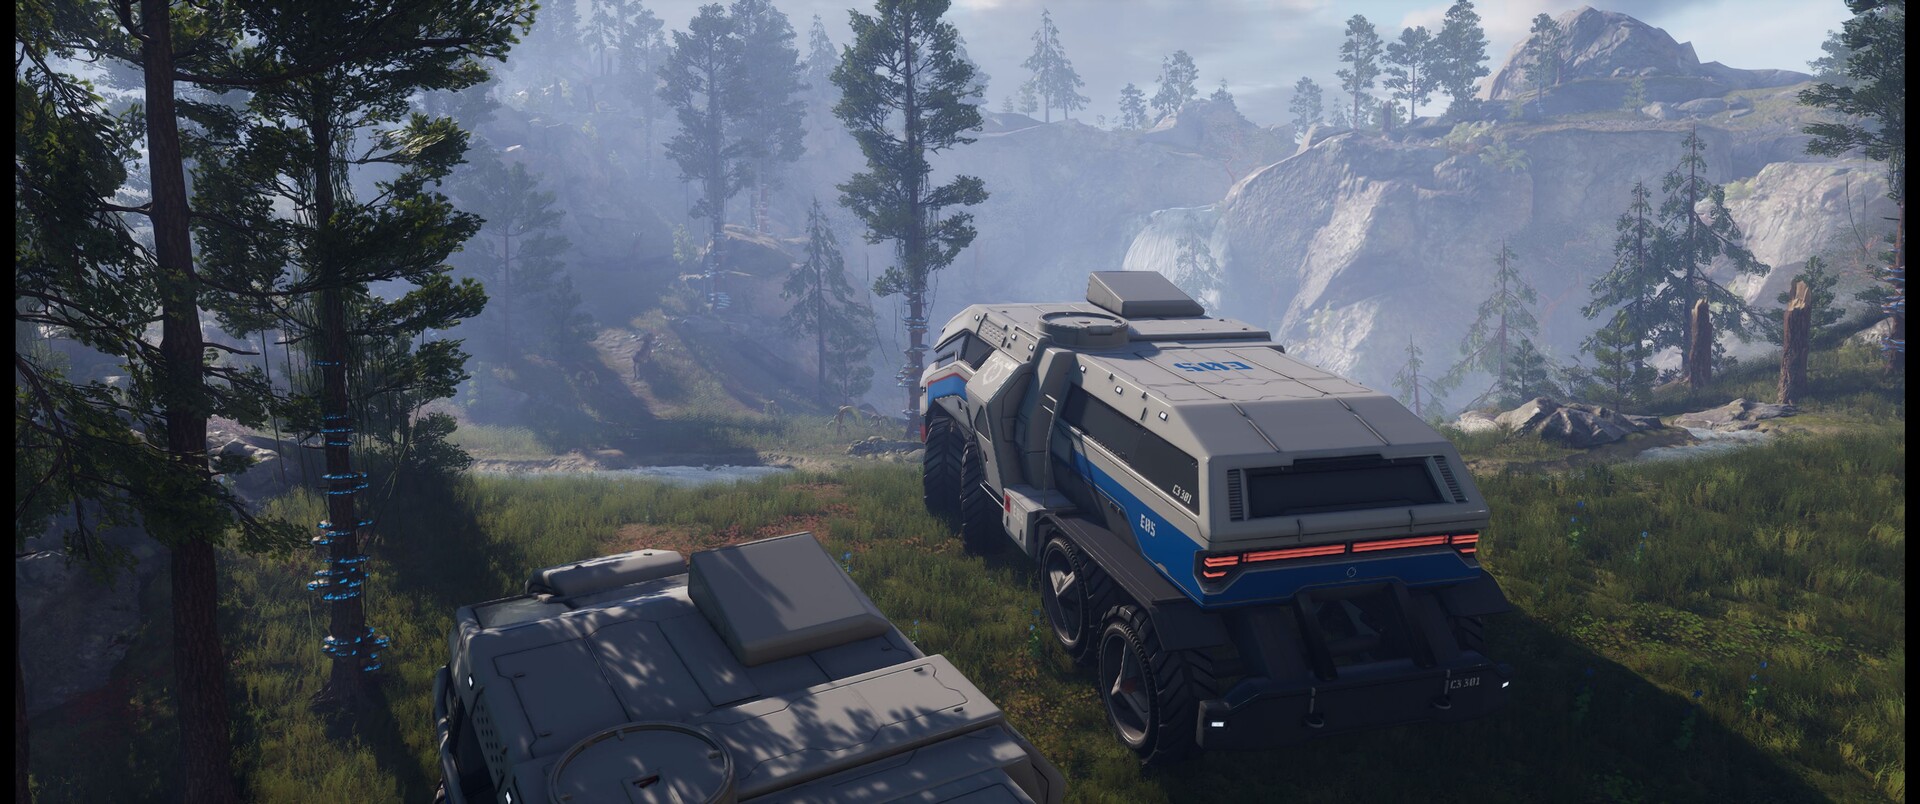
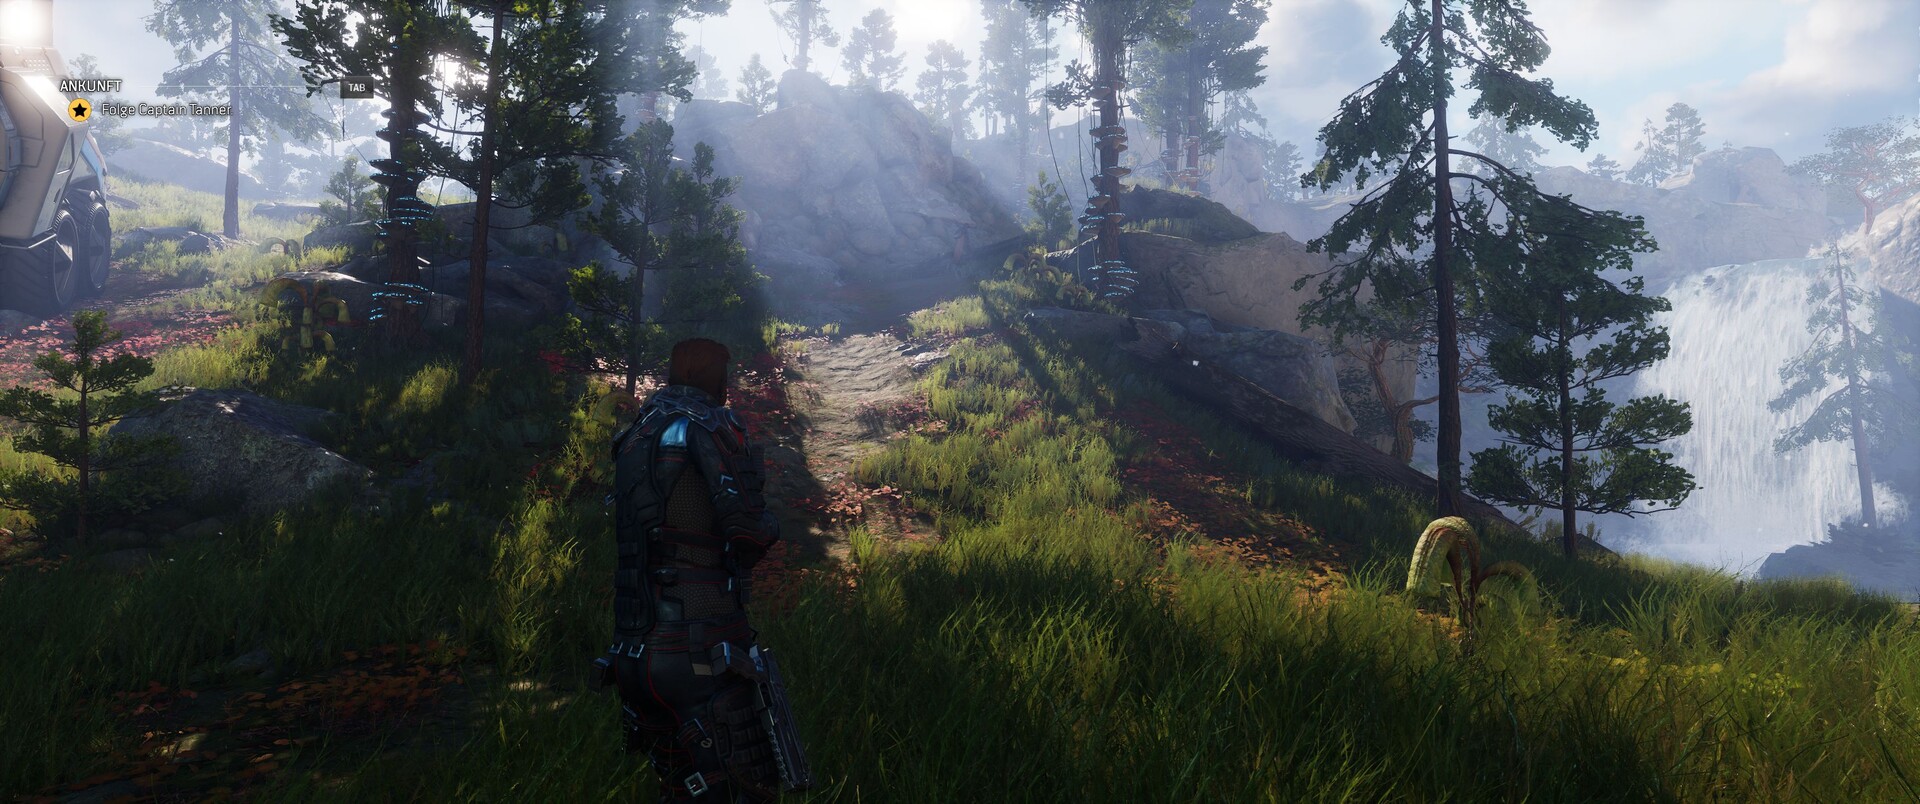
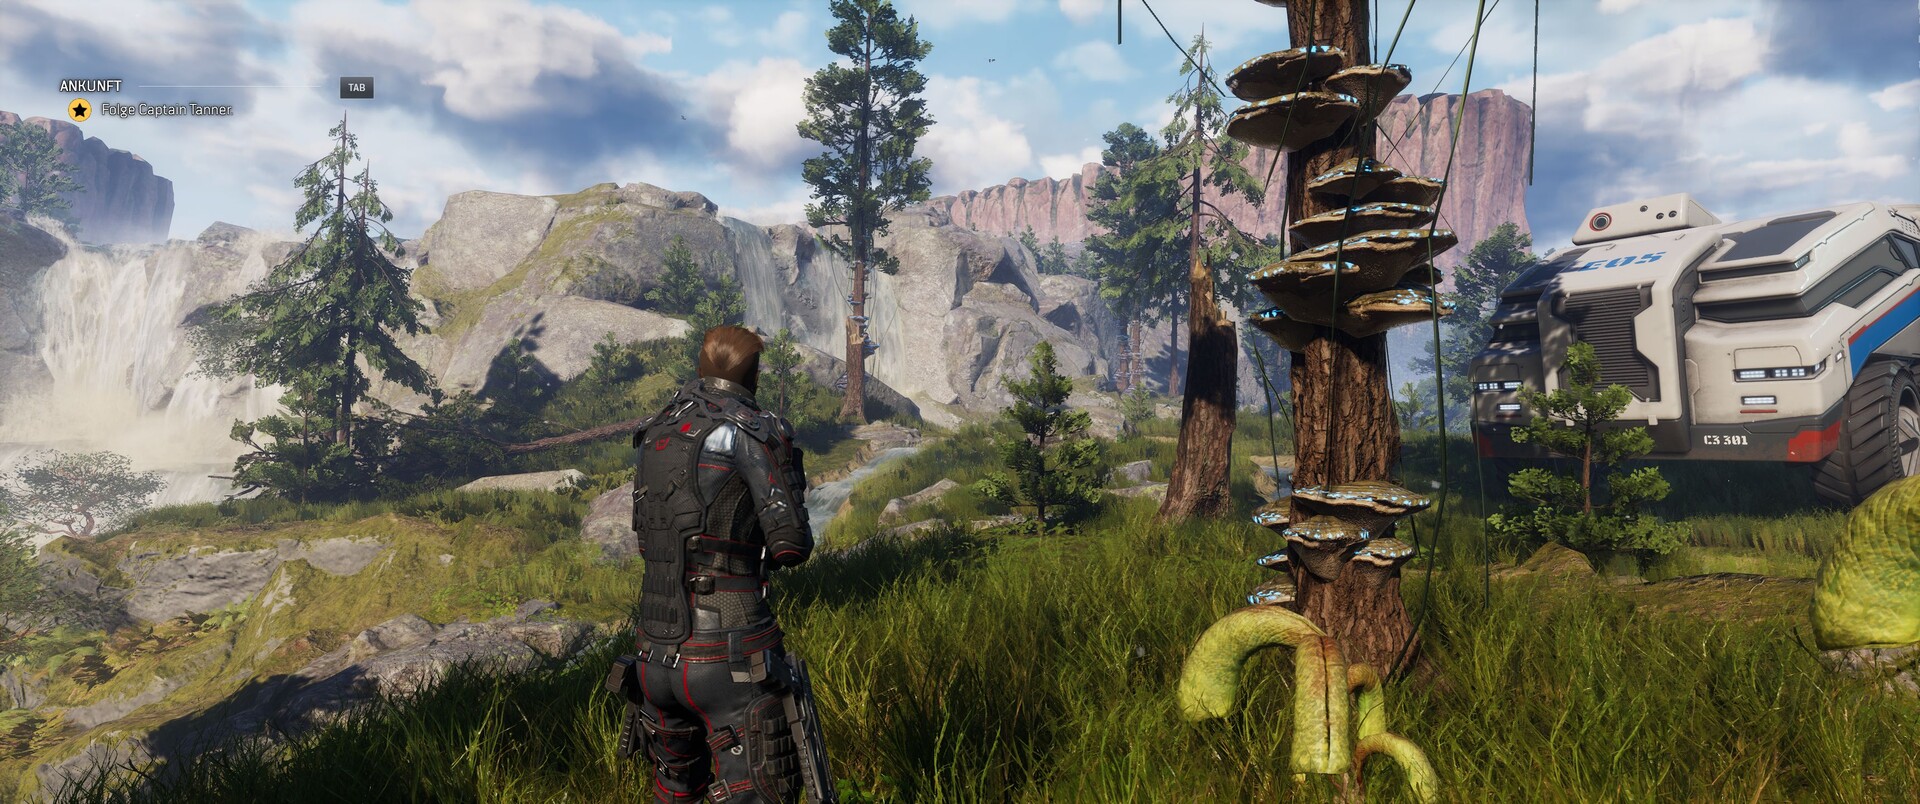
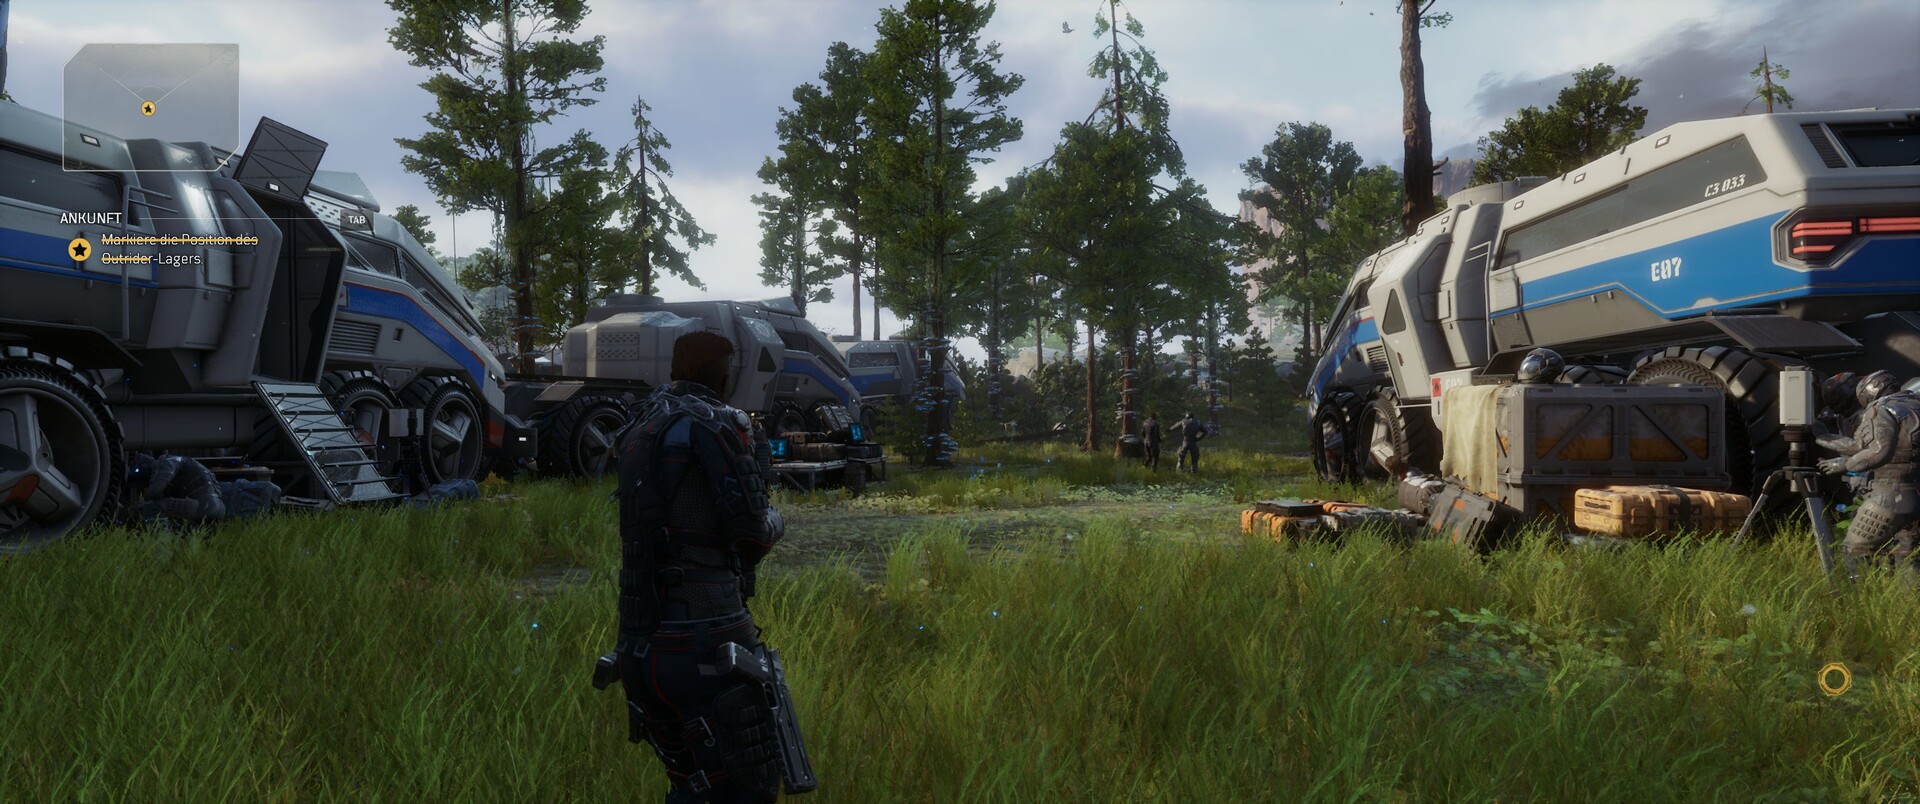
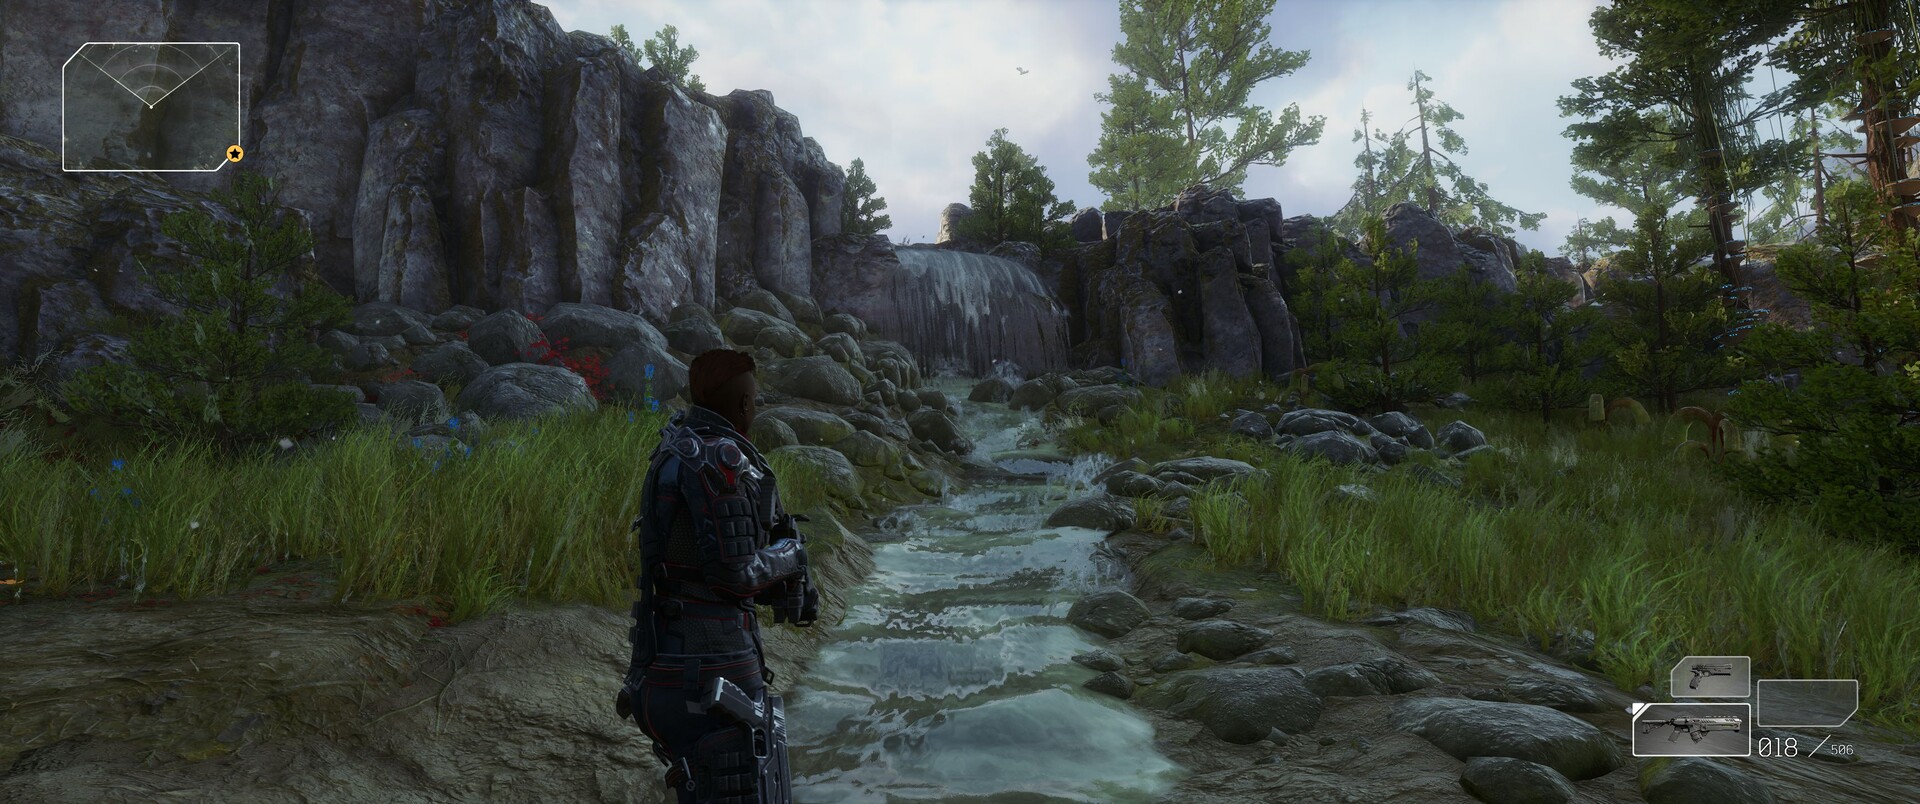
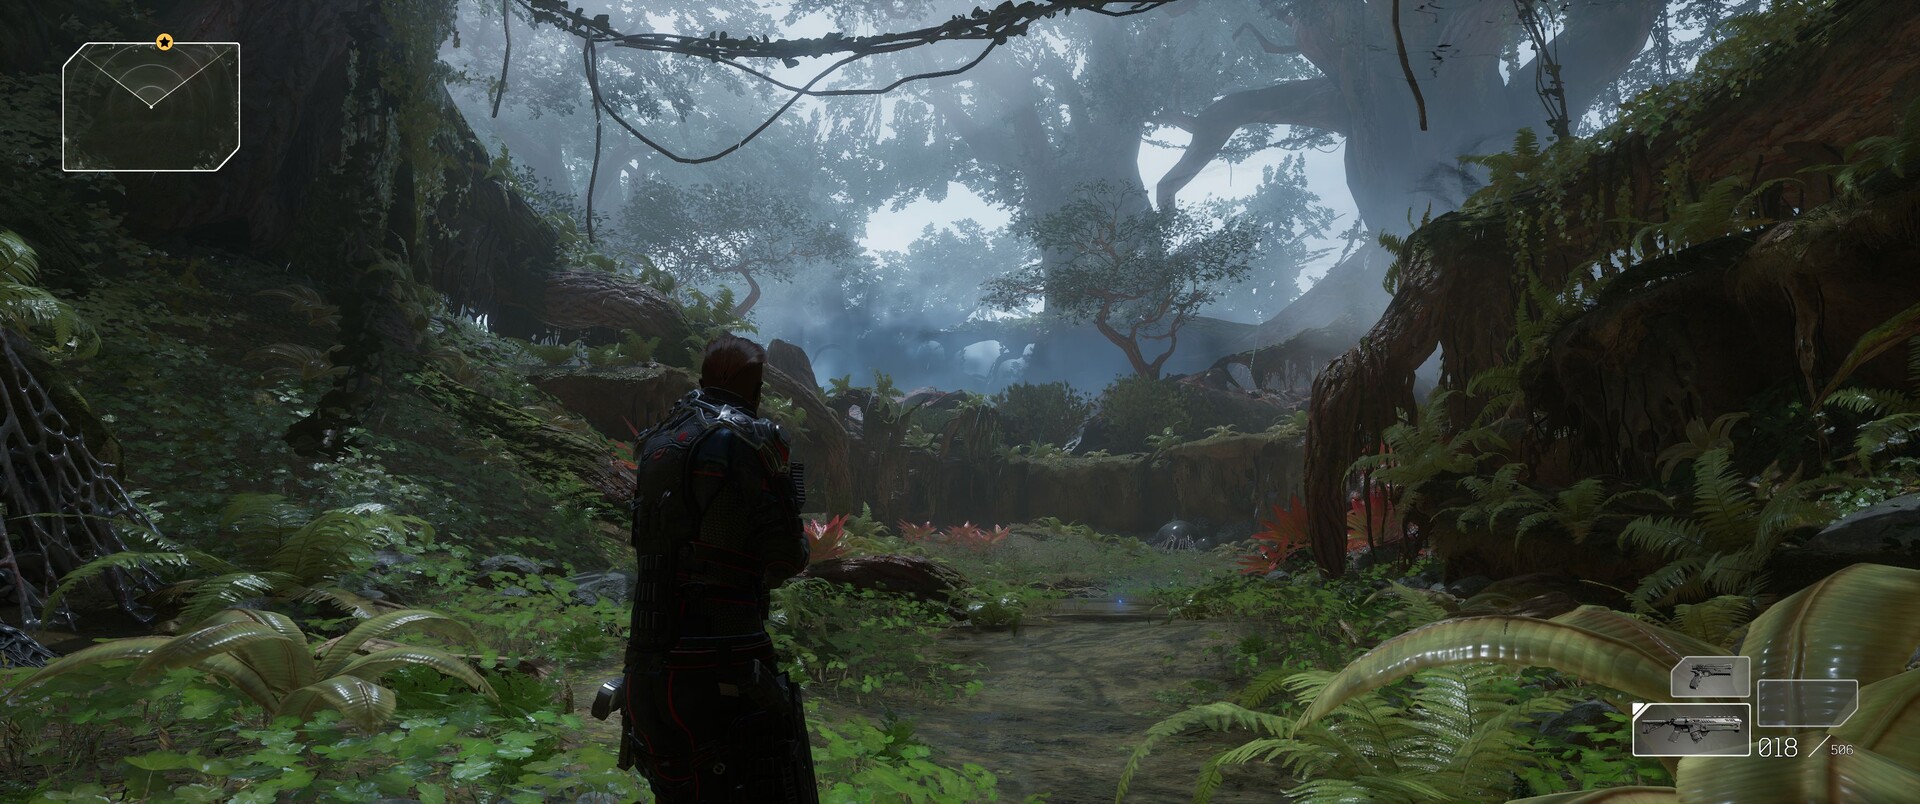
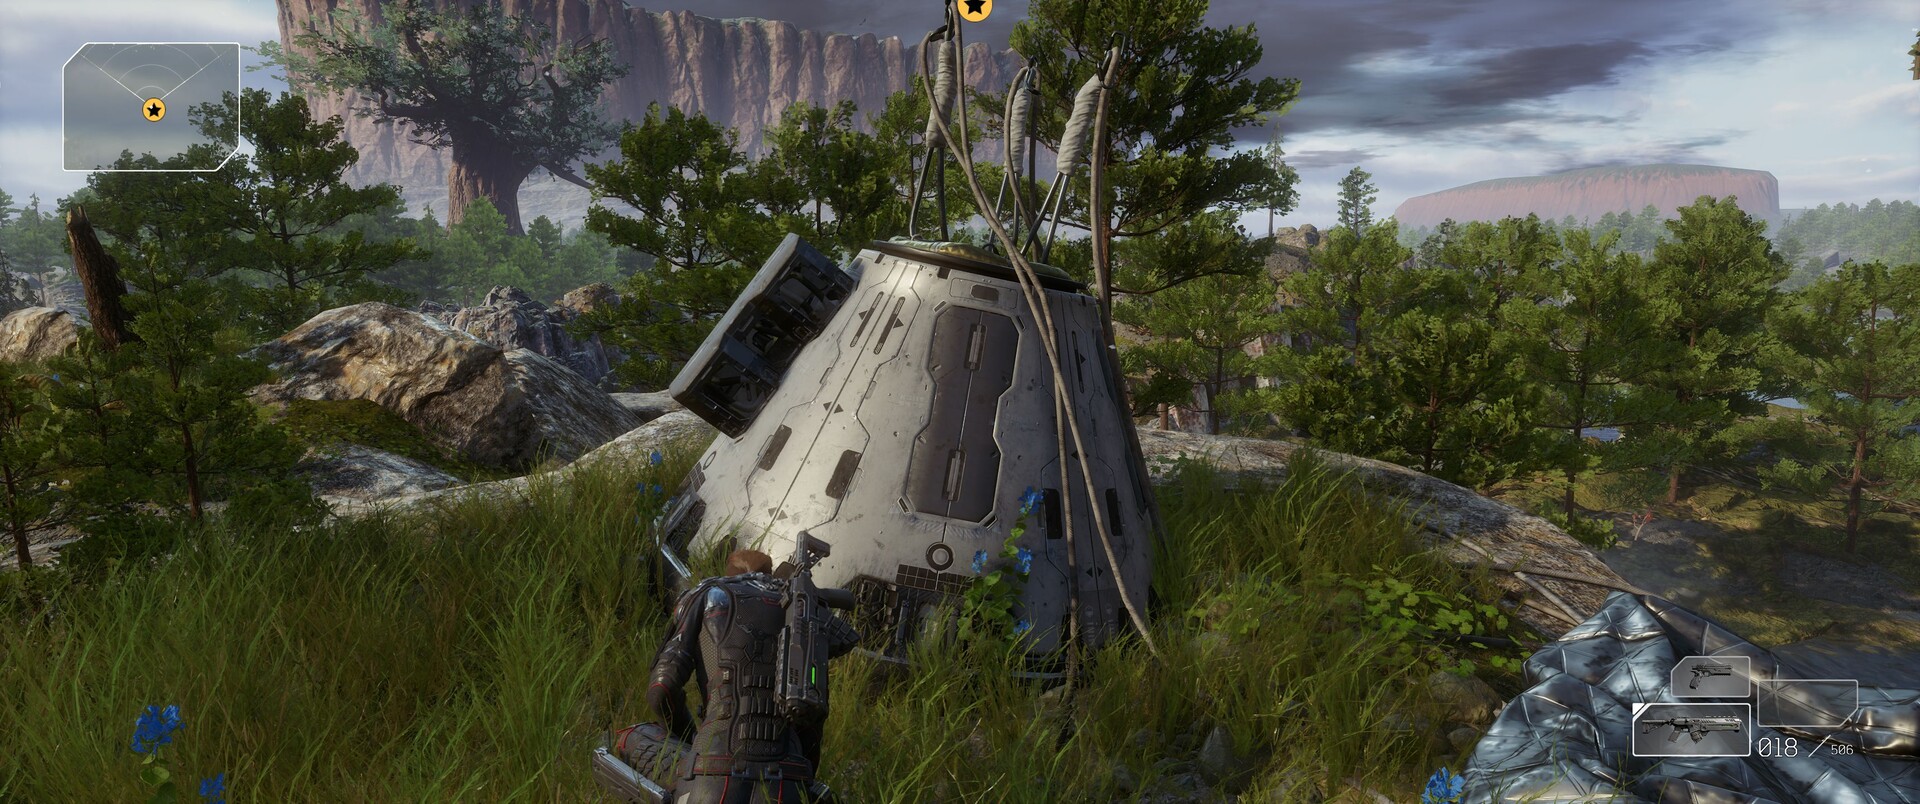
Visually (except for a few graphical glitches such as the occasionally flickering heads-up display), there is nothing to complain about. In addition to the lush vegetation, we were also very impressed by the huge game areas, textures, effects and the draw distance.

In terms of style, Outriders resembles EA’s Anthem, which is also set in a futuristic world and had a very mixed reception. Gameplay-wise, Outriders resembles Borderlands titles (keywords: skills and loot). The gunplay feels very good in Outriders.

Outriders
Outriders

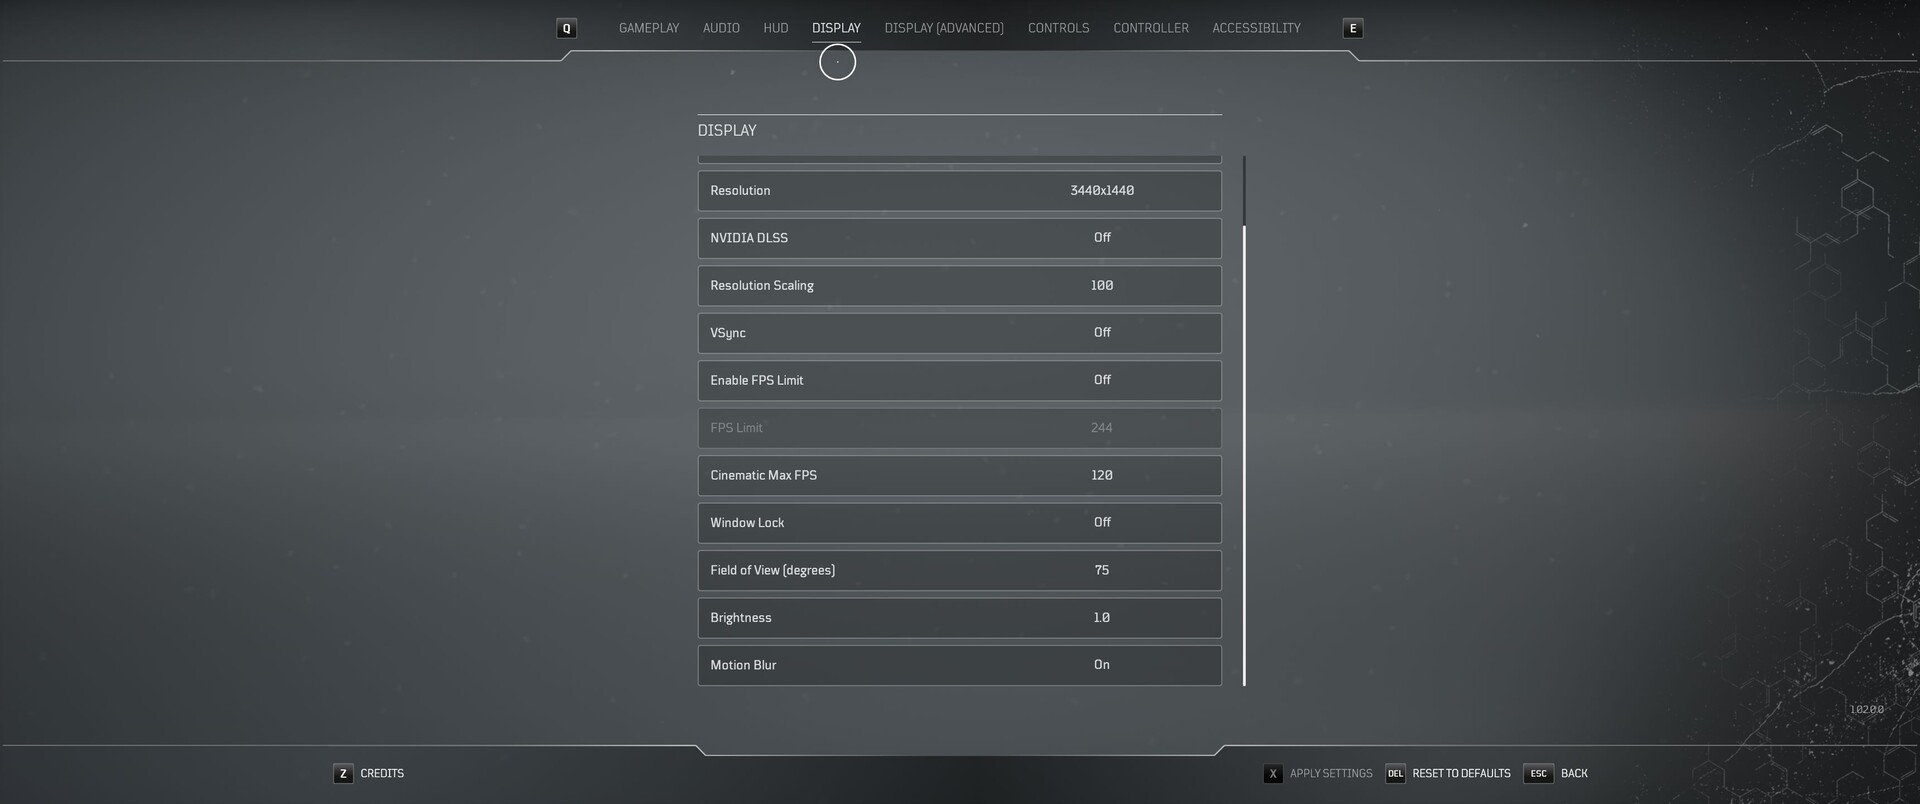
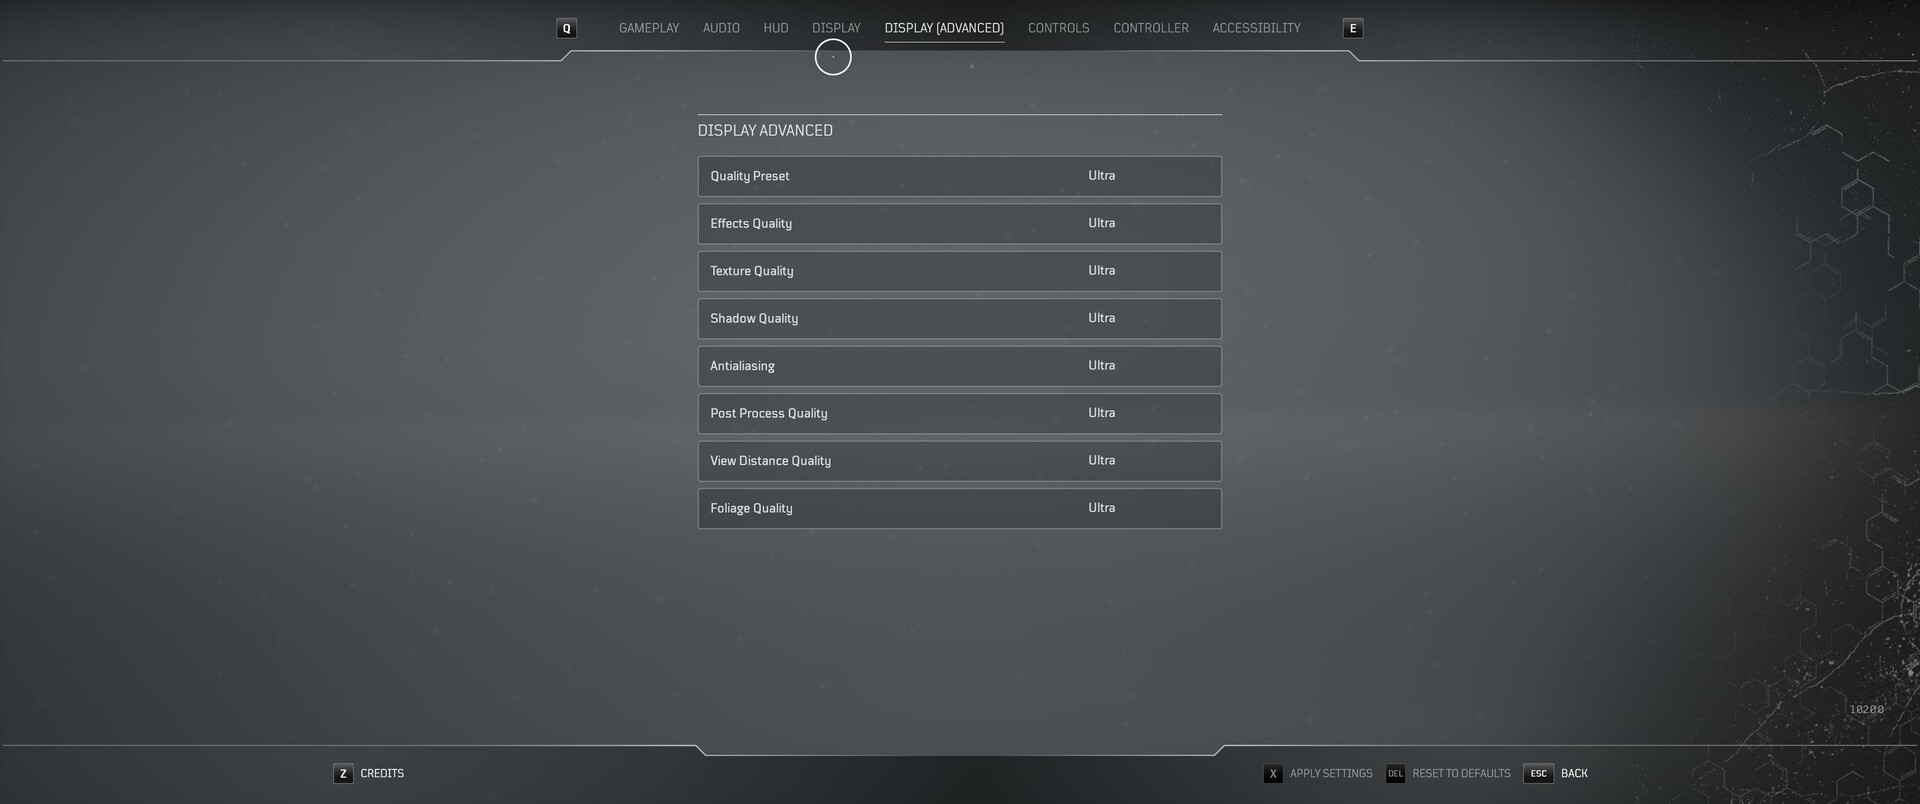
The streamlined graphics menu is praiseworthy. While in the Display tab, users can adjust the resolution, resolution scaling, field of view and the brightness (owners of an RTX GPU can also enable DLSS here), in the Advanced tab, there are 7 settings, all of which can be changed at the same time via presets. In the Display tab, users can also cap the frame rate.

Outriders does not need to be restarted for graphics changes to take effect, which is a big relief given that the introductory videos cannot be skipped and the game itself takes a while to start. Before you launch the game you can choose between DirectX 11 and DirectX 12 APIs. We chose to run Outriders in DirectX 12 mode. We recorded frame rates with the help of CapFrameX.

Benchmark

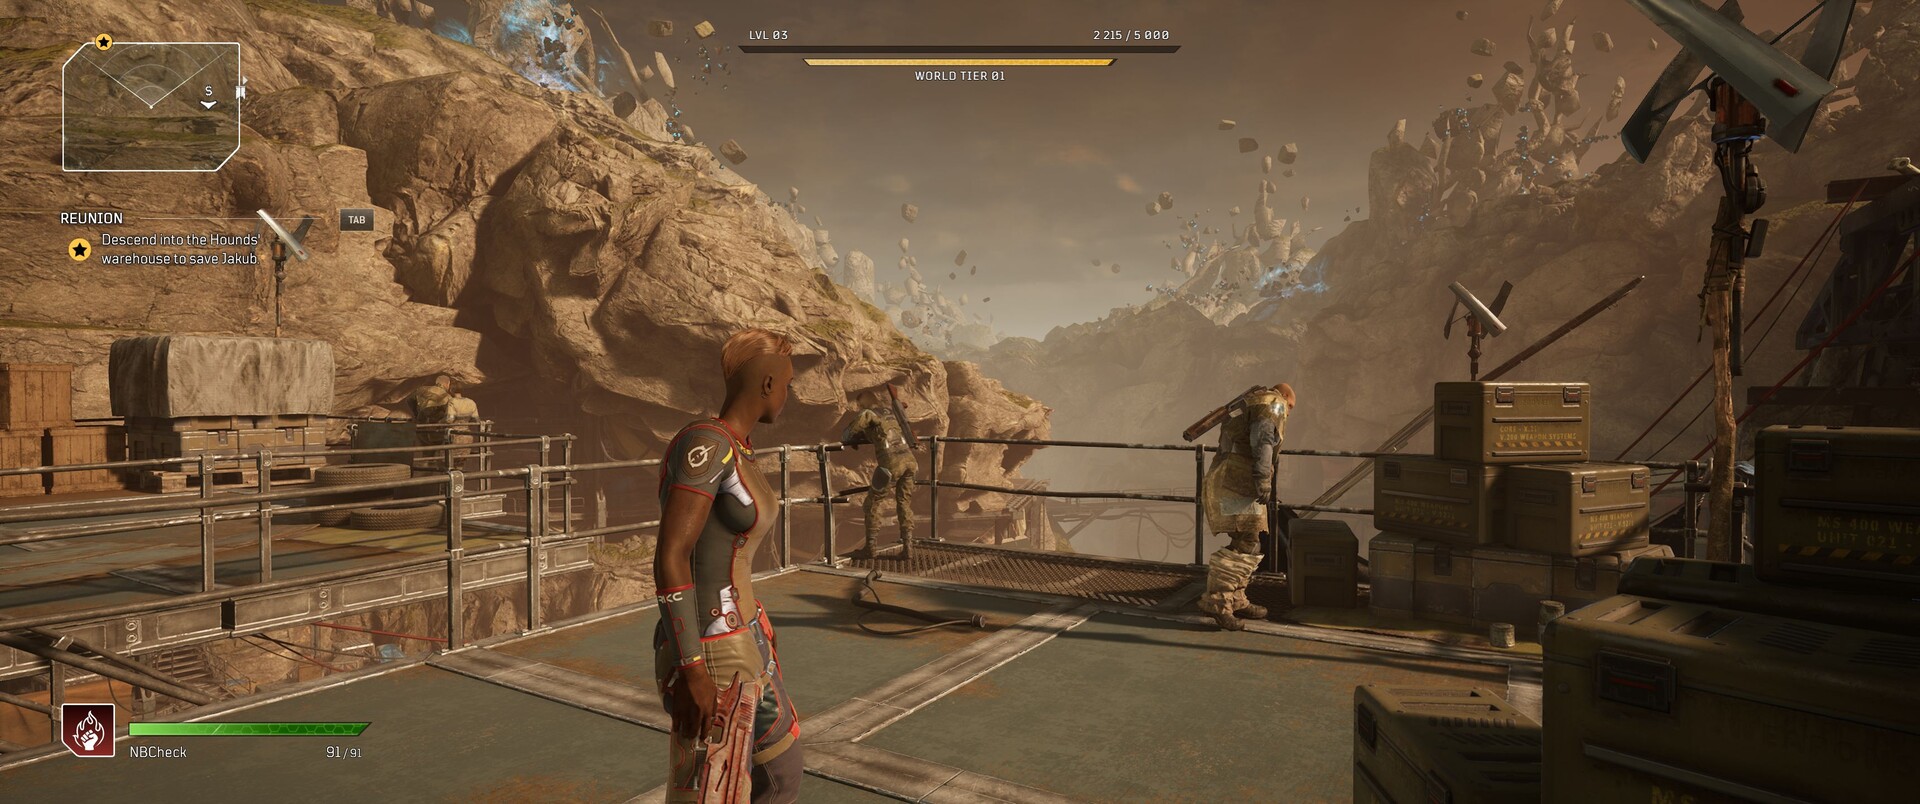
For our benchmarks, we use the Settlement Hub area, which players will reach after the one-hour tutorial mission. As you can see in the video below, we run through this area and past numerous NPS's.

Results

FHD (1920x1080)

Entry-level GPUs such as the GeForce MX330 cannot handle Outriders on the lowest settings at 1080p. To achieve playable frame rates at 1080p on high settings you will need a true mid-range graphics card such as the Radeon RX 5500M or the GeForce GTX 1650.

Outriders
    1920x1080 Low Preset     1920x1080 Medium Preset     1920x1080 High Preset     1920x1080 Ultra Preset
NVIDIA GeForce RTX 2080 Mobile, i9-9900K
MSI GT76 Titan DT 9SG
153 (16.4min, 18.8P0.1, 26.1P1) fps ∼37%
142 (16.9min, 17.7P0.1, 26.2P1) fps ∼39%
130 (16.9min, 18.1P0.1, 26.8P1) fps ∼39%
113 (13.5min, 16.5P0.1, 25.3P1) fps ∼33%
NVIDIA GeForce RTX 2080 Ti (Desktop), i9-9900K
MSI GeForce RTX 2080 Ti
142 (41.6min, 57.5P0.1, 71.7P1) fps ∼35%
135 (39.1min, 44.9P0.1, 62P1) fps ∼37%
135 (34.4min, 49.8P0.1, 60.7P1) fps ∼40%
132 (31.6min, 39.9P0.1, 60.7P1) fps ∼38%
NVIDIA GeForce RTX 3090, i9-9900K
MSI GeForce RTX 3090 Suprim X
142 (49.4min, 56.5P0.1, 75.3P1) fps ∼35%
134 (37.9min, 44.4P0.1, 63.5P1) fps ∼37%
132 (42min, 44.2P0.1, 60P1) fps ∼40%
125 (44.8min, 47.2P0.1, 57.1P1) fps ∼36%
NVIDIA GeForce RTX 3080, i9-9900K
MSI GeForce RTX 3080 Gaming X Trio
142 (46.6min, 53.4P0.1, 73.1P1) fps ∼35%
135 (34.6min, 42.8P0.1, 61.9P1) fps ∼37%
133 (30.1min, 46.4P0.1, 62.9P1) fps ∼40%
126 (38.2min, 45.8P0.1, 58.3P1) fps ∼37%
NVIDIA GeForce RTX 2080 (Desktop), i9-9900K
MSI GeForce RTX 2080
140 (46.8min, 50.7P0.1, 72.2P1) fps ∼34%
133 (36.7min, 44.9P0.1, 60.3P1) fps ∼37%
132 (30.7min, 44.8P0.1, 60.2P1) fps ∼40%
129 (43min, 49.8P0.1, 64.3P1) fps ∼38%
NVIDIA GeForce GTX 1660 Ti Mobile, i7-9750H
MSI GP65 Leopard 9SD
111 (28.2min, 31P0.1, 48.5P1) fps ∼27%
98.9 (9.02min, 25.1P0.1, 38P1) fps ∼27%
83.7 (26.4min, 29.7P0.1, 38.8P1) fps ∼25%
71.7 (23.1min, 27.3P0.1, 35.6P1) fps ∼21%
NVIDIA GeForce RTX 2070 Mobile, i7-9750H
MSI GP65 Leopard 9SF
111 (18.4min, 21.7P0.1, 30.1P1) fps ∼27%
106 (20.2min, 20.4P0.1, 28.8P1) fps ∼29%
94.3 (14.6min, 18.4P0.1, 23.6P1) fps ∼28%
81.7 (12.2min, 18.3P0.1, 23.5P1) fps ∼24%
NVIDIA GeForce RTX 2060 Mobile, i7-9750H
MSI GE65 Raider 9SE
106 (12.4min, 29.5P0.1, 49.4P1) fps ∼26%
104 (18.7min, 32.2P0.1, 46.6P1) fps ∼29%
89.8 (32.6min, 33.4P0.1, 45P1) fps ∼27%
76.6 (9.5min, 16.4P0.1, 45.5P1) fps ∼22%
NVIDIA GeForce GTX 1650 Ti Mobile, i7-10750H
MSI GP75
89.8 (43.9min, 49.4P0.1, 57.4P1) fps ∼22%
74 (34.2min, 35.9P0.1, 45.7P1) fps ∼20%
61.5 (23.9min, 32.2P0.1, 40.2P1) fps ∼18%
51.4 (29.2min, 30.3P0.1, 33.8P1) fps ∼15%
AMD Radeon RX 5500M, R7 3750H
MSI Alpha 15
84.8 (31.1min, 32.1P0.1, 41.8P1) fps ∼21%
76.9 (13.1min, 17.6P0.1, 36.6P1) fps ∼21%
62.5 (9.06min, 26P0.1, 35.6P1) fps ∼19%
49.7 (3.69min, 8.29P0.1, 17P1) fps ∼14%
NVIDIA GeForce GTX 1650 Mobile, i7-10750H
MSI GL75
79.8 (8.69min, 11.3P0.1, 27P1) fps ∼19%
66.8 (11.1min, 14.3P0.1, 23.1P1) fps ∼18%
53.6 (11.9min, 14.9P0.1, 30.3P1) fps ∼16%
43.1 (5.11min, 6.35P0.1, 13.9P1) fps ∼13%
NVIDIA GeForce MX350, i7-10710U
MSI Prestige 14
35.2 (15.4min, 16.5P0.1, 22.7P1) fps ∼9%
25.7 (8.66min, 10.3P0.1, 16P1) fps ∼7%
21.5 (7.23min, 8.47P0.1, 13.1P1) fps ∼6%
16.3 (3.42min, 3.97P0.1, 7.48P1) fps ∼5%
NVIDIA GeForce MX330, i7-10510U
MSI Prestige 14
31 (14.3min, 14.7P0.1, 19.9P1) fps ∼8%
26 (9.35min, 9.81P0.1, 17.3P1) fps ∼7%
20.9 (4.65min, 5.59P0.1, 12.2P1) fps ∼6%
14.6 (3.31min, 3.75P0.1, 7.26P1) fps ∼4%
NVIDIA GeForce GTX 1060 Mobile, 6820HK
MSI GT62VR
69.1 (13.9min, 14.9P0.1, 33.9P1) fps ∼19%
60.6 (12.3min, 24.4P0.1, 33.5P1) fps ∼18%
50.7 (13min, 14.9P0.1, 26.5P1) fps ∼15%
NVIDIA GeForce GTX 1050 Mobile, i7-7700HQ
MSI GL62M 7RD
33.3 (7.49min, 9.1P0.1, 16.4P1) fps ∼9%
27.2 (2.32min, 3.24P0.1, 5.57P1) fps ∼8%
24.7 (0.749min, 0.897P0.1, 4.4P1) fps ∼7%

QHD (2560x1440)

For a 1440p gaming experience, a high-end GPU is required. Players will need a GeForce RTX 2070 or better to hit 60 FPS or more on the highest settings at QHD resolution.

Outriders
    2560x1440 Ultra Preset
NVIDIA GeForce RTX 3080, i9-9900K
MSI GeForce RTX 3080 Gaming X Trio
125 (39.6min, 45.8P0.1, 61.9P1) fps ∼43%
NVIDIA GeForce RTX 3090, i9-9900K
MSI GeForce RTX 3090 Suprim X
125 (42.7min, 46.3P0.1, 61.6P1) fps ∼43%
NVIDIA GeForce RTX 2080 Ti (Desktop), i9-9900K
MSI GeForce RTX 2080 Ti
114 (41.2min, 45.2P0.1, 56P1) fps ∼39%
NVIDIA GeForce RTX 2080 (Desktop), i9-9900K
MSI GeForce RTX 2080
89.9 (32.6min, 49.8P0.1, 53.9P1) fps ∼31%
NVIDIA GeForce RTX 2080 Mobile, i9-9900K
MSI GT76 Titan DT 9SG
80.2 (10.2min, 15.6P0.1, 20.9P1) fps ∼28%
NVIDIA GeForce RTX 2070 Mobile, i7-9750H
MSI GP65 Leopard 9SF
60.5 (11min, 14.9P0.1, 25P1) fps ∼21%
NVIDIA GeForce RTX 2060 Mobile, i7-9750H
MSI GE65 Raider 9SE
51.6 (20.5min, 28.7P0.1, 32.8P1) fps ∼18%
NVIDIA GeForce GTX 1660 Ti Mobile, i7-9750H
MSI GP65 Leopard 9SD
46.6 (10.2min, 13.3P0.1, 25.4P1) fps ∼16%
NVIDIA GeForce GTX 1650 Ti Mobile, i7-10750H
MSI GP75
33.4 (8.81min, 9.26P0.1, 12.8P1) fps ∼11%
NVIDIA GeForce GTX 1650 Mobile, i7-10750H
MSI GL75
31.6 (8.21min, 8.68P0.1, 13.1P1) fps ∼11%
AMD Radeon RX 5500M, R7 3750H
MSI Alpha 15
31.3 (3.81min, 3.92P0.1, 7.33P1) fps ∼11%

UHD (3840x2160)

The game is especially demanding at 4K. No laptop GPUs that we tested (as of 29th of April, 2021) managed to achieve decent frame rates at UHD resolution on the highest settings in Outriders.

Outriders
    3840x2160 Ultra Preset
NVIDIA GeForce RTX 3090, i9-9900K
MSI GeForce RTX 3090 Suprim X
89.3 (33.3min, 40.2P0.1, 53.4P1) fps ∼7%
NVIDIA GeForce RTX 3080, i9-9900K
MSI GeForce RTX 3080 Gaming X Trio
79.1 (37.2min, 39.7P0.1, 50.7P1) fps ∼6%
NVIDIA GeForce RTX 2080 Ti (Desktop), i9-9900K
MSI GeForce RTX 2080 Ti
61.8 (31.9min, 34.9P0.1, 43P1) fps ∼5%
NVIDIA GeForce RTX 2080 (Desktop), i9-9900K
MSI GeForce RTX 2080
47.3 (6.58min, 14.6P0.1, 32P1) fps ∼4%
NVIDIA GeForce RTX 2080 Mobile, i9-9900K
MSI GT76 Titan DT 9SG
45.7 (6.06min, 12.4P0.1, 25P1) fps ∼4%
NVIDIA GeForce RTX 2070 Mobile, i7-9750H
MSI GP65 Leopard 9SF
32.8 (4.11min, 6.57P0.1, 17.3P1) fps ∼3%
NVIDIA GeForce RTX 2060 Mobile, i7-9750H
MSI GE65 Raider 9SE
32.8 (4.22min, 4.78P0.1, 8.29P1) fps ∼3%
NVIDIA GeForce GTX 1660 Ti Mobile, i7-9750H
MSI GP65 Leopard 9SD
31.7 (7min, 7.07P0.1, 9.78P1) fps ∼3%
NVIDIA GeForce GTX 1650 Ti Mobile, i7-10750H
MSI GP75
29.1 (5.47min, 6.49P0.1, 10.5P1) fps ∼2%
NVIDIA GeForce GTX 1650 Mobile, i7-10750H
MSI GL75
23.4 (8.29min, 9.51P0.1, 13.9P1) fps ∼2%
AMD Radeon RX 5500M, R7 3750H
MSI Alpha 15
22.9 (2.6min, 3.26P0.1, 7.73P1) fps ∼2%

Note

Because benchmarking video games is very time consuming and is often constrained by installation/activation limits, at the time of publishing, we were able to provide only a part of our performance analysis of Outriders. Other graphics cards will be added in the coming days and weeks.

Overview

Show Restrictions
PosModel< PrevNext >Outriders
 Outriders (2021)
low
1280x720
Low Preset
med.
1920x1080
Medium Preset
high
1920x1080
High Preset
ultra
1920x1080
Ultra Preset
QHD
2560x1440
Ultra Preset
4K
3840x2160
Ultra Preset
NVIDIA GeForce RTX 3090
120
135.5n2
149n2
146.5n2
137.5n2
87.5n2
NVIDIA GeForce RTX 3080 Ti
148
151
83.7
NVIDIA GeForce RTX 4080 Laptop GPU
157.7
151.1
149.9
130.5
72.3
NVIDIA GeForce RTX 3080
135
133
126
125
79.1
NVIDIA Titan RTX
136
162
158
156
119
64
NVIDIA GeForce RTX 3080 Ti Laptop GPU
160
155
153
111
57.4
NVIDIA GeForce RTX 4070 Laptop GPU
165.3
145.2
129.4
90
46.3
NVIDIA GeForce RTX 2080 Ti (Desktop)
135
135
132
114
61.8
AMD Radeon RX 6700 XT
197
175
152
140
99.7
49
NVIDIA GeForce RTX 3080 Laptop GPU
119n3
102n3
110n3
106n3
91.1
NVIDIA GeForce RTX 3070 Ti Laptop GPU
145n2
129.8n2
110.05n2
75.4n2
37.4
AMD Radeon RX 6800M
110
101
100
103
AMD Radeon RX 6600 XT
153
165
134
114
75.1
37
NVIDIA GeForce RTX 2080 (Desktop)
133
132
129
89.9
47.3
NVIDIA GeForce RTX 3070 Laptop GPU
109n2
99.5n3
108n3
106n3
79.3
AMD Radeon RX 6800S
122
114
106
66.8
38.2
NVIDIA GeForce RTX 3060
122
146
125
104
70.2
36.9
NVIDIA GeForce RTX 2080 Mobile
142
130
113
80.2
45.7
AMD Radeon RX 6700M
107
98.1
94.6
PosModel< PrevNext >Outriders
low med. high ultra QHD 4K
NVIDIA Titan X Pascal
123
144
125
111
78.3
40.7
NVIDIA GeForce RTX 2070 Super (Desktop)
169
161
138
116
82.8
42.3
AMD Radeon RX 5700 XT (Desktop)
191
153
125
110
73.1
37.2
NVIDIA GeForce RTX 3060 Laptop GPU
122
103
98.9n3
85.3n3
65.1
AMD Radeon RX 7600S
115.2
103.2
89.1
59.7
32.9
NVIDIA GeForce RTX 2060 Super (Desktop)
118
142
114
97.45n2
66.8n2
35.75n2
AMD Radeon RX 6600
192
146
116
98.8
61.1
30.8
AMD Radeon RX 5700 (Desktop)
154
146
116
99.8
66.8
33.2
AMD Radeon RX 6600M
92.9
90.2
88.7
AMD Radeon RX 6700S
115.5
111.3
96.9
56.3
NVIDIA GeForce RTX 2070 Mobile
106
94.3
81.7
60.5
32.8
AMD Radeon RX Vega 64
165
134
104
88.2
59.7
29.3
NVIDIA GeForce RTX 2060 Mobile
104
89.8
76.6
51.6
32.8
AMD Radeon RX 5600 XT (Desktop)
147
138
111
92.8
61.2
31
NVIDIA GeForce GTX 1080 Max-Q
60.2
NVIDIA GeForce GTX 1660 Super (Desktop)
189
112
86.8
76.4
49.1
31.3
AMD Radeon RX 5500 XT (Desktop)
133
93.1
74.6
61.9
41.8
28.3
Intel Arc A730M
90
76.1
69
43.9
NVIDIA GeForce GTX 1660 Ti Mobile
98.9
83.7
71.7
46.6
31.7
NVIDIA GeForce RTX 3050 Ti Laptop GPU
77.6n3
69.5n3
63n3
40.4
27.5
PosModel< PrevNext >Outriders
low med. high ultra QHD 4K
NVIDIA GeForce GTX 1660 (Desktop)
183
99.5
80.8
68.3
44.8
30.3
NVIDIA GeForce GTX 1650 Super (Desktop)
168
89.5
70.3
55.4
36.6
29.5
NVIDIA GeForce RTX 3050 4GB Laptop GPU
53.2
51
47.2
30.6
22.9
AMD Radeon RX 480 (Desktop)
48.8
34.9
NVIDIA GeForce GTX 1060 Mobile
72
69.1
60.6
50.7
NVIDIA GeForce GTX 1650 Ti Mobile
74
61.5
51.4
33.4
29.1
AMD Radeon RX 5500M
76.9
62.5
49.7
31.3
22.9
AMD Radeon Pro 5500M
70.7
44.4
36
27.6
NVIDIA GeForce RTX 2050 Mobile
55.3
34.6
33.5
30.3
NVIDIA GeForce GTX 1650 (Desktop)
142
69.5
54.6
42.2
32.4
27.7
NVIDIA GeForce GTX 1650 Mobile
66.8
53.6
43.1
31.6
23.4
AMD Radeon 680M
91.9
41.4
31
29.3
NVIDIA GeForce MX450
66.3n2
27.85n2
22.3n2
19.25n2
17.9
NVIDIA GeForce GTX 1050 Mobile
52.5
33.3
27.2
24.7
AMD Radeon 660M
35.3
30.4
27.9
AMD Radeon RX 560X (Laptop)
65.1
36.4
29.1
25.7
Intel Iris Xe MAX Graphics
55.6
30.7
28.8
26.1
Intel Iris Xe Graphics G7 96EUs
49.9n3
29.9n3
28.5n3
26.55n2
22.3
NVIDIA GeForce MX350
25.7
21.5
16.3
AMD Radeon RX 550 (Laptop)
42.4
15.8
12.4
9.48
PosModel< PrevNext >Outriders
low med. high ultra QHD 4K
NVIDIA GeForce GT 1030 (Desktop)
50.3
27.9
17.4
14.7
NVIDIA GeForce MX250
45.6
27.3
20.2
15.5
NVIDIA GeForce MX330
26
20.9
14.6
NVIDIA GeForce MX150
43.1
25
15.8
12.8
11.3
Intel Iris Xe Graphics G7 80EUs
32.9
26.1
22.4
20.8
NVIDIA GeForce GT 710
23.4
12.2
8.6
AMD Radeon 540X
36.6
23.6
16
AMD Radeon RX Vega 10
27
9.32
Intel UHD Graphics Xe 32EUs (Tiger Lake-H)
29.1
23.1
17.4
15.4
AMD Radeon RX Vega 8 (Ryzen 4000/5000)
39.9n3
29.1n3
21.9n3
16.7n3
17.1
AMD Radeon RX Vega 7
38.7n2
28.15n2
22.1n2
17.9n2
AMD Radeon RX Vega 8 (Ryzen 2000/3000)
28.6
17.8
11.9
10.5
NVIDIA GeForce 930MX
29.7
20.5
12.7
11.9
Intel Iris Graphics 550
26.4
18
12.9
AMD Radeon RX Vega 6 (Ryzen 4000/5000)
26.7
18.8
AMD Radeon RX Vega 6 (Ryzen 2000/3000)
20.9
11.7
8.18
Intel UHD Graphics G1 (Ice Lake 32 EU)
25.6
13.6
Intel UHD Graphics 630
20.7
13.2
Intel UHD Graphics Xe 16EUs (Tiger Lake-H)
22
13
Intel UHD Graphics 620
21.9
PosModel< PrevNext >Outriders
low med. high ultra QHD 4K
AMD Radeon RX Vega 3
23.6
11.7
Intel HD Graphics 615
12.4
(-) * Smaller values are better. / n123 Number of benchmarks for this median value / * Approximate position


Legend
5Stutters – This game is very likely to stutter and have poor frame rates. Based on all known benchmarks using the specified graphical settings, average frame rates are expected to fall below 25fps
May Stutter – This graphics card has not been explicitly tested on this game. Based on interpolated information from surrounding graphics cards of similar performance levels, stutters and poor frame rates are expected.
30Fluent – Based on all known benchmarks using the specified graphical settings, this game should run at or above 25fps
40Fluent – Based on all known benchmarks using the specified graphical settings, this game should run at or above 35fps
60Fluent – Based on all known benchmarks using the specified graphical settings, this game should run at or above 58fps
May Run Fluently – This graphics card has not been explicitly tested on this game. Based on interpolated information from surrounding graphics cards of similar performance levels, fluent frame rates are expected.
?Uncertain – This graphics card experienced unexpected performance issues during testing for this game. A slower card may be able to achieve better and more consistent frame rates than this particular GPU running the same benchmark scene.
Uncertain – This graphics card has not been explicitly tested on this game and no reliable interpolation can be made based on the performances of surrounding cards of the same class or family.
The value in the fields displays the average frame rate of all values in the database. Move your cursor over the value to see individual results.

Test Systems

Device GPU CPU RAM OS
Desktop PC I MSI GeForce RTX 3090 (24 GB GDDR6X)
MSI GeForce RTX 3080 (10 GB GDDR6X)
MSI GeForce RTX 3070 (8 GB GDDR6)
MSI GeForce RTX 2080 Ti (11 GB GDDR6)
MSI GeForce RTX 2080 (8 GB GDDR6)
Intel Core i9-9900K 4 x 8 GB DDR4 Windows 10 64 Bit
Desktop PC II Nvidia GeForce GTX 1080 Ti (11 GB GDDR5X)
Asus GeForce GTX 980 Ti (6 GB GDDR5)
Intel Core i7-8086K, Aorus Z370 Ultra Gaming 2 x 8 GB DDR4 Windows 10 64 Bit
Desktop PC III Nvidia GeForce RTX 3090 FE(24 GB GDDR6X)
Nvidia Titan RTX (24 GB GDDR6)
Nvidia GeForce RTX 2080 Super (8 GB GDDR6)
Nvidia GeForce RTX 2070 Super (8 GB GDDR6)
Nvidia GeForce RTX 2060 Super (8 GB GDDR6)
KFA2 GeForce GTX 1660 Super (6 GB GDDR6)
PNY GeForce GTX 1660 (6 GB GDDR5)
KFA2 GeForce GTX 1650 Super (4 GB GDDR6)
KFA2 GeForce GTX 1650 (4 GB GDDR5)
AMD Radeon RX 5700 XT (8 GB GDDR6)
AMD Radeon RX 5700 (8 GB GDDR6)
AMD Radeon RX 5600 XT (6 GB GDDR6)
AMD Radeon RX 5500 XT (8 GB GDDR6)
AMD Radeon RX Vega 64 (8 GB HBM2)
AMD Ryzen 9 5900X 2 x 16 GB DDR4 Windows 10 64 Bit
MSI GT76 Nvidia GeForce RTX 2080 (8 GB GDDR6) Intel Core i9-9900K 2 x 16 GB DDR4 Windows 10 64 Bit
MSI GP65 Nvidia GeForce RTX 2070 (8 GB GDDR6) Intel Core i7-9750H 2 x 16 GB DDR4 Windows 10 64 Bit
MSI GE65 Nvidia GeForce RTX 2060 (6 GB GDDR6) Intel Core i7-9750H 2 x 8 GB DDR4 Windows 10 64 Bit
MSI GP65 Nvidia GeForce GTX 1660 Ti (6 GB GDDR6) Intel Core i7-9750H 2 x 16 GB DDR4 Windows 10 64 Bit
MSI GP75 Nvidia GeForce GTX 1650 Ti (4 GB GDDR6) Intel Core i7-10750H 2 x 8 GB DDR4 Windows 10 64 Bit
MSI GL75 Nvidia GeForce GTX 1650 (4 GB GDDR6) Intel Core i7-10750H 2 x 8 GB DDR4 Windows 10 64 Bit
MSI GT62VR Nvidia GeForce GTX 1060 (6 GB GDDR5) Intel Core i7-6820HK 2 x 8 GB DDR4 Windows 10 64 Bit
MSI GE72 Nvidia GeForce GTX 1050 Ti (2 GB GDDR5) Intel Core i7-7700HQ 2 x 4 GB DDR4 Windows 10 64 Bit
MSI GL62 Nvidia GeForce GTX 1050 (2 GB GDDR5) Intel Core i7-7700HQ 2 x 4 GB DDR4 Windows 10 64 Bit
Honor MagicBook Pro Nvidia GeForce MX350 (2 GB GDDR5) Intel Core i7-10210U 1 x 16 GB DDR4 Windows 10 64 Bit
MSI Prestige 14 Nvidia GeForce MX330 (2 GB GDDR5) Intel Core i7-10510U 1 x 16 GB DDR4 Windows 10 64 Bit
MSI Prestige 14 Evo Intel Iris Xe (96 CUs) Intel Core i7-1185G7 1 x 16 GB DDR4 Windows 10 64 Bit
Dell G5 15 SE AMD Radeon RX5600M (6 GB GDDR6) AMD Ryzen 7 4800H 2 x 8 GB DDR4 Windows 10 64 Bit
MSI Alpha 15 AMD Radeon RX5500M (4 GB GDDR6) AMD Ryzen 7 3750H 2 x 8 GB DDR4 Windows 10 64 Bit
4K monitors Nvidia drivers AMD drivers
Asus PB287Q, Philips Brilliance 329P9H, Acer Predator XB321HK ForceWare 466.11 Adrenalin 21.4.1
static version load dynamic
Loading Comments
Comment on this article
Please share our article, every link counts!
Florian Glaser, 2021-04-29 (Update: 2021-04-30)