Notebook reviews with Intel Iris Xe Graphics G7 80EUs graphics card
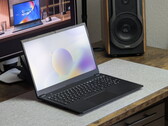
Schenker Connect 15 (E26) review: Business laptop with a replaceable battery, SmartCard, Wi-Fi 7 & LTE
Wi-Fi 7, LTE, a SmartCard reader, and a replaceable battery have become increasingly rare in modern business laptops. The Schenker Connect 15 focuses on exactly these features, combining enterprise-friendly capabilities with quiet and power-efficient hardware.
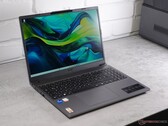
Intel Core 5 120U, Iris Xe G7 80EUs, 15.6", 1.9 kgAffordable laptop with solid performance – Acer Aspire Go 15 review
With the Aspire Go 15-51P, Acer has a Windows 11 laptop on offer that manages to stay affordable while still delivering a well-rounded package. Thanks to a speedy Core i5 processor, 16 GB of RAM, and impressive battery life, the deal looks almost too good to be true.
Intel Core i5-1334U, Iris Xe G7 80EUs, 15.3", 1.7 kgXiaomi RedmiBook 14 2025 review - Affordable everyday laptop with Raptor Lake refresh and 32 GB RAM
The RedmiBook 14 gets new Raptor Lake Refresh CPUs from Intel for the 2025 model year. In addition to the high-quality aluminum casing, there is also a high-resolution IPS screen that can be used to edit images with ease.
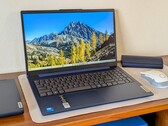
Intel Core 5 220H, Iris Xe G7 80EUs, 14", 1.4 kgIntel Core 5 120U performance debut: Lenovo IdeaPad Slim 3i 15IRU9 laptop review
It's one of the cheaper 15.6-inch laptops you can find without resorting to used systems running on outdated processors. It's a decent barebones experience so long as you keep your expectations in check.
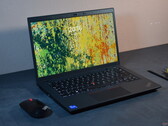
Intel Core 5 120U, Iris Xe G7 80EUs, 15.6", 1.6 kgLenovo ThinkPad L14 Gen 4 Intel Review: Not up to par anymore
Before testing the newest models of the ThinkPad L series, we take a look back. The Lenovo ThinkPad L14 Gen 4 Intel has many worthwhile attributes for office workers, but falters in a few important disciplines compared to more modern competitors - with the screen as an important example.
Intel Core i5-1335U, Iris Xe G7 80EUs, 14", 1.6 kgGetac S410 G5: Intel Core i5-1350P, 14.00", 2.9 kg
Review » Getac S410 Gen 5 rugged laptop review: Raptor Lake-P for extra performance
Schenker Work 14 Base: Intel Core i5-1235U, 14.00", 1.3 kg
Review » Schenker Work 14 Base review - The affordable office laptop with lots of ports and a bright IPS display
HP EliteBook x360 830 G10 7L7U1ET: Intel Core i5-1335U, 13.30", 1.3 kg
Review » HP EliteBook x360 830 G10 Laptop Review: Metal convertible with non-reflective touchscreen
Acer TravelMate P4 TMP414-53-58XQ: Intel Core i5-1335U, 14.00", 1.5 kg
Review » Acer TravelMate P4 laptop review: Understatement is for the bosses
Huawei MateBook 14 (2024): Intel Core i5-1240P, 14.00", 1.4 kg
Review » New Huawei MateBook 14 review: An attempt at a MacBook Air alternative
Acer Swift Go 14 SFG14-71: Intel Core i5-1335U, 14.00", 1.3 kg
Review » Acer Swift Go 14 (2023) review: The 14-inch laptop with a 2.9k OLED panel for US$800
Lenovo ThinkPad E16 G1 Core i5-1335U: Intel Core i5-1335U, 16.00", 1.8 kg
Review » Lenovo ThinkPad E16 G1 Intel review: Core i5 is neck-to-neck with AMD Ryzen 7
Dell Latitude 13 7340 i5-1345U: Intel Core i5-1345U, 13.30", 1.1 kg
Review » Dell Latitude 7340 laptop review: 0.22 lb less with negligible impact on performance
Microsoft Surface Laptop Go 3: Intel Core i5-1235U, 12.40", 1.1 kg
Review » Microsoft Surface Laptop Go 3 in review - Overpriced subnotebook without keyboard illumination
Lenovo ThinkPad X13 Yoga G4 21F20017GE: Intel Core i5-1335U, 13.30", 1.3 kg
Review » Lenovo ThinkPad X13 Yoga G4 Laptop Review: Convertible with long battery life and weak performance
Lenovo ThinkPad T14 G4 21HD0043GE: Intel Core i5-1335U, 14.00", 1.4 kg
Review » Lenovo ThinkPad T14 G4 Intel Laptop Review: Raptor Lake update for the T series
HP EliteBook 1040 G10 818N7EA: Intel Core i5-1335U, 14.00", 1.3 kg
Review » HP EliteBook 1040 G10 laptop review - HP's response to the ThinkPad X1 Carbon
Lenovo IdeaPad Flex 5 14IRU8: Intel Core i5-1335U, 14.00", 1.6 kg
Review » Lenovo IdeaPad Flex 5i 14IRU8 review: Affordable 14-inch convertible with Thunderbolt 4
Minisforum Venus Series NPB5: Intel Core i5-13500H, 0.6 kg
Review » Minisforum Venus Series NPB5 review: The mini PC with Raptor Lake-H aka an Intel Core i5-13500H and USB4
Dell Latitude 7440: Intel Core i5-1345U, 14.00", 1.2 kg
Review » Dell Latitude 7440 laptop review: Beating the Latitude 9440 in some key areas
Durabook R8 Tablet: Intel Core i5-1230U, 8.00", 0.9 kg
Review » Durabook R8 review: World's first fanless rugged tablet with Intel 12th gen
Acer Aspire 5 Spin 14: Intel Core i5-1335U, 14.00", 1.6 kg
Review » Acer Aspire 5 Spin 14 review: The 2-in-1 laptop with an active stylus
Dell Latitude 3440: Intel Core i5-1345U, 14.00", 1.5 kg
Review » Intel Core i5-1345U performance debut: Dell Latitude 3440 laptop review
Samsung Galaxy Book3 15, Core i5-1335U: Intel Core i5-1335U, 15.60", 1.5 kg
Review » Samsung Galaxy Book3 review: The Intel Core i5-1335U celebrates a solid premiere
Samsung Galaxy Book3 Pro 16: Intel Core i5-1340P, 16.00", 1.6 kg
Review » Samsung Galaxy Book3 Pro 16 review: Office laptop with Core-i5 power and a long battery life
Samsung Galaxy Book3 Pro 360 16, i5-1340P: Intel Core i5-1340P, 16.00", 1.7 kg
Review » Samsung Galaxy Book3 Pro 360 16-inch Convertible review: newest display generation meets revamped processor
Huawei MateBook D 14 2023, 53013PKG: Intel Core i5-1155G7, 14.00", 1.4 kg
Review » Huawei MateBook D 14 (2022) laptop review: Unibody for beginners
Dell Latitude 7230 Rugged Extreme: Intel Core i5-1240U, 12.00", 1.6 kg
Review » Dell Latitude 7230 Rugged Extreme tablet review: One of the best displays in its category
Acer TravelMate P4 TMP416-51-55KN: Intel Core i5-1240P, 16.00", 1.6 kg
Review » Acer TravelMate P4 TMP416-51 Review: Lightweight office laptop with endurance and power
Huawei MateBook D 15 2023-53013BSJ: Intel Core i5-1155G7, 15.60", 1.6 kg
Review » Huawei MateBook D 15 (2022) review: A laptop reminiscent of the MacBook Pro
HP Dragonfly Pro Chromebook: Intel Core i5-1235U, 14.00", 1.5 kg
Review » A Chromebook for MacBook Pro 14 users: HP Dragonfly Pro Chromebook review
Intel NUC 12 Pro Kit NUC12WSBi5: Intel Core i5-1240P, 0.5 kg
Review » Intel NUC 12 Pro Kit (Core i5-1240P) mini PC review: Snappy with great connectivity
Dell Latitude 3520: Intel Core i5-1135G7, 15.60", 1.8 kg
Review » Dell Latitude 3520 in review: Core i5 office laptop delivers good runtimes
Huawei MateBook D 15 2021, i5-1135G7: Intel Core i5-1135G7, 15.60", 1.5 kg
Review » Huawei MateBook D 15 Intel laptop review: Inexpensive quiet runner
Asus F415EA-EK115W: Intel Core i5-1135G7, 14.00", 1.6 kg
Review » Asus F415EA Review: Cool and quiet Core i5 office laptop
Huawei MateBook D 14 (2021): Intel Core i5-1135G7, 14.00", 1.4 kg
Review » Huawei MateBook D 14 review: Quiet office laptop with a long battery life
LG Gram 15Z90Q: Intel Core i5-1240P, 15.60", 1.1 kg
Review » LG Gram 15 (2022) laptop review: Focused on portability
Lenovo IdeaPad Gaming Chromebook 16: Intel Core i5-1235U, 16.00", 1.8 kg
Review » Lenovo IdeaPad Gaming Chromebook 16 review: Stream games while doing homework
Lenovo ThinkPad T14s G3 21BR00CDGE: Intel Core i5-1235U, 14.00", 1.3 kg
Review » Lenovo ThinkPad T14s G3 Intel laptop review: quiet, efficient and fast
Beelink SEi12 Core i5-1235U: Intel Core i5-1235U, 0.5 kg
Review » Beelink SEi12 mini PC review: Outperforming the Intel NUC 11
Lenovo ThinkPad X13 G3 21BN0046GE: Intel Core i5-1235U, 13.30", 1.3 kg
Review » Lenovo ThinkPad X13 G3 laptop review: Endurance in outdoor use with Intel Alder Lake-U
Intel NUC Pro Chassis_i5_1145G7: Intel Core i5-1145G7
Review » Intel NUC Pro Chassis Element in review - Modular barebone for many purposes
Intel NUC Pro Chassis_i5_1245U: Intel Core i5-1245U
Review » Intel NUC Pro Chassis Element in review - Modular barebone for many purposes
Acer Swift 3 SF314-71-56U3: Intel Core i5-12500H, 14.00", 1.4 kg
Review » Acer Swift 3 SF314 in review: Compact laptop with a beautiful OLED display and a fast CPU
Dell XPS 13 9315 2-in-1 Core i5-1230U: Intel Core i5-1230U, 13.00", 0.8 kg
Review » The Dell Surface Pro 8: XPS 13 9315 2-in-1 convertible review
Asus Zenbook 17 Fold UX9702: Intel Core i7-1250U, 17.30", 1.8 kg
Review » Asus Zenbook 17 Fold in review - Foldable 17-inch OLED convertible debut
LG Gram 14Z90Q: Intel Core i5-1240P, 14.00", 1 kg
Review » LG Gram 14 (2022) laptop review: Sleek, lightweight & economical
Lenovo ThinkPad T16 G1 21BWS00200: Intel Core i5-1240P, 16.00", 1.9 kg
Review » Lenovo ThinkPad T16 G1 Intel laptop review: 16-inch marathon runner
Dynabook Portégé X30L-K-139: Intel Core i5-1240P, 13.30", 0.9 kg
Review » Dynabook Portégé X30L-K-139 review - Business laptop weighs only 900 grams
Lenovo IdeaPad 5 Pro 14ITL6: Intel Core i5-1135G7, 14.00", 1.4 kg
Review » Review of Lenovo IdeaPad 5 Pro 14ITL6: sharp-looking 14-inch laptop
HP Envy 14-eb0252ng: Intel Core i5-1135G7, 14.00", 1.5 kg
Review » HP Envy 14 laptop review: Successful all-rounder
Lenovo IdeaPad Flex 5i 14IAU7: Intel Core i5-1235U, 14.00", 1.6 kg
Review » Lenovo IdeaPad Flex 5i 14IAU7 convertible review: Core i5-1235U done right
Microsoft Surface Laptop Go 2 Core i5: Intel Core i5-1135G7, 12.40", 1.1 kg
Review » Microsoft Surface Laptop Go 2 review - Compact companion with old hardware
LG Gram 17 (2022): Intel Core i5-1240P, 17.00", 1.4 kg
Review » LG Gram 17 (2022) review: Light office laptop with a large display and great battery life
Dell XPS 13 Plus 9320 i5-1240p: Intel Core i5-1240P, 13.40", 1.2 kg
Review » Dell XPS 13 Plus laptop review: Is the base configuration the best choice?
Dell XPS 13 9315, i5-1230U: Intel Core i5-1230U, 13.40", 1.2 kg
Review » Dell XPS 13 9315 laptop in review: Low performance, incredible battery life
VAIO FE 14.1 VWNC51429-SL: Intel Core i5-1235U, 14.10", 1.6 kg
Review » VAIO FE14 laptop review: Avoid the Core i5-1235U and get the Core i7-1255U
Gateway Ultra Slim 14.1 GWTC51427: Intel Core i5-1235U, 14.10", 1.6 kg
Review » Core i5-1235U performance debut: Gateway Ultra Slim 14.1 GWTC51427 laptop review
Lenovo ThinkPad X1 Carbon G10 21CC001RGE: Intel Core i5-1250P, 14.00", 1.2 kg
Review » Lenovo ThinkPad X1 Carbon G10 Laptop Review: Alder-Lake P28 without great effect
Lenovo Yoga Slim 7i Pro 14IAP G7: Intel Core i5-1240P, 14.00", 1.3 kg
Review » Lenovo Yoga Slim 7i Pro 14IAP laptop review: Affordable subnotebook with 12 cores and 2.8K display
LG Gram 14T90P: Intel Core i5-1135G7, 14.00", 1.2 kg
Review » LG Gram 14T90P convertible review: The Lenovo Yoga and HP Spectre challenger
Samsung Galaxy Book2 Pro 13 NP930XED-KA1DE: Intel Core i5-1240P, 13.30", 0.9 kg
Review » Samsung Galaxy Book2 Pro 13 review: Subnotebook with efficient Alder Lake i5
Dell Latitude 7420 JW6MH: Intel Core i5-1145G7, 14.00", 1.3 kg
Review » Dell Latitude 7420 Review: Windows PC - Maximum Security
VAIO SX12 VJS124X1011P: Intel Core i5-1155G7, 12.50", 0.9 kg
Review » Intel Core i5-1155G7 debut: VAIO SX12 laptop review
Lenovo ThinkPad X1 Titanium Yoga G1 20QB0016GE: Intel Core i5-1140G7, 13.50", 1.2 kg
Review » Lenovo ThinkPad X1 Titanium Yoga review: Slim convertible Titanium with i5
Dell Latitude 5320-TM4V2: Intel Core i5-1135G7, 13.30", 1.3 kg
Review » Latitude 5320 in review: Dell spoils the mouse replacement
Huawei MateBook E Core i5: Intel Core i5-1130G7, 12.60", 0.7 kg
Review » Huawei MateBook E Laptop Review – A new Windows tablet with OLED
Samsung Galaxy Book Pro 360 15 NP950QDB-KC3DE: Intel Core i5-1135G7, 15.60", 1.4 kg
Review » Samsung Galaxy Book Pro 360 15-inch Convertible review: larger footprint, more power
Acer Extensa 15 EX215-54-5103: Intel Core i5-1135G7, 15.60", 1.9 kg
Review » Acer Extensa 15 EX215-54 in Review: Core i5 power for little money
Huawei MateBook 13s i5 11300H: Intel Core i5-11300H, 13.40", 1.3 kg
Review » Huawei MateBook 13s Review: Great subnotebook with 90 Hz display
Acer Swift 3 SF314-511-54ZK: Intel Core i5-1135G7, 14.00", 1.2 kg
Review » Acer Swift 3 SF314 in review: Laptop tackles test with flying colors
Acer TravelMate P4 TMP414-51-59MR: Intel Core i5-1135G7, 14.00", 1.4 kg
Review » Acer TravelMate P4 in review: Business endurance runner with Thunderbolt 4
Dell Latitude 14 5420-D2G5W: Intel Core i5-1135G7, 14.00", 1.5 kg
Review » Dell Latitude 14 5420 review: A laptop so close to claiming the business crown
Dell Inspiron 15 3000 3511: Intel Core i5-1135G7, 15.60", 1.7 kg
Review » Dell Inspiron 15 3000 3511 laptop review: Making cheaper better
HP Pavilion 14-dv0357ng: Intel Core i5-1135G7, 14.00", 1.4 kg
Review » HP Pavilion 14 Laptop review: A well-thought-out device, an attractive exterior
Beelink GTI 11: Intel Core i5-1135G7, 0.6 kg
Review » Our top Intel NUC 11 alternative: Beelink GTI 11 mini PC review
Lenovo ThinkPad L14 G2-20X1003WGE: Intel Core i5-1135G7, 14.00", 1.7 kg
Review » Lenovo ThinkPad L14 G2 Review: Good even with Intel
Asus ExpertBook B1 B1400CEAE, i5-1135G7: Intel Core i5-1135G7, 14.00", 1.5 kg
Review » Asus ExpertBook B1 B1400 in review: Small, light and affordable
Asus ExpertBook B1 B1500CEAE, i5-1135G7: Intel Core i5-1135G7, 15.60", 1.7 kg
Review » Asus ExpertBook B1 B1500 in review: Many ports on the business laptop
Asus ExpertBook B5 Flip B5302FEA: Intel Core i5-1135G7, 13.30", 1.3 kg
Review » Asus ExpertBook B5 Flip in review: Compact and enduring convertible ideal for university, office and sofa
Lenovo ThinkPad X1 Carbon G9-20XW0089GE: Intel Core i5-1135G7, 14.00", 1.2 kg
Review » Lenovo ThinkPad X1 Carbon G9 laptop review: The ePrivacy screen remains problematic
Lenovo Yoga Slim 7 14ITL05 82A300CNGE: Intel Core i5-1135G7, 14.00", 1.4 kg
Review » Lenovo Yoga Slim 7 14ITL05 in review: Quiet, enduring 14-inch notebook
Dynabook Tecra A40-J-12E: Intel Core i5-1135G7, 14.00", 1.4 kg
Review » Dynabook Tecra A40 in review: A whisper in the office...
Lenovo ThinkBook Plus Gen2 Core i5: Intel Core i5-1130G7, 13.30", 1.2 kg
Review » Lenovo ThinkBook Plus Gen2 in review: E-ink laptop with touchscreen
Gateway GWTN141-10GR: Intel Core i5-1135G7, 14.10", 1.6 kg
Review » Walmart Gateway GWTN141 laptop review: Potential $500 sweet spot
LG Gram 17Z90P-G.AA56G: Intel Core i5-1135G7, 17.00", 1.4 kg
Review » LG Gram 17Z90P review: Flexible lightweight with a 16:10 display
Fujitsu LifeBook U7311 i5: Intel Core i5-1135G7, 13.30", 1.2 kg
Review » Fujitsu LifeBook U7311 Laptop Review: A lot of ports...
HP Pavilion x360 14-dy0157ng: Intel Core i5-1135G7, 14.00", 1.5 kg
Review » HP Pavilion x360 14 (2021) Review: 2-in-1 laptop supports pen-input and Power Delivery
Dell Inspiron 13 5301-0D0XN: Intel Core i5-1135G7, 13.30", 1.1 kg
Review » Dell Inspiron 13 5301 in review: Stylish and compact subnotebook, but...
HP Pavilion x360 15-er0155ng: Intel Core i5-1135G7, 15.60", 1.8 kg
Review » HP Pavilion x360 15-inch (2021) 2-in-1 Laptop Review: Dim screen, high price
Samsung Galaxy Book NP750XDA: Intel Core i5-1135G7, 15.60", 1.6 kg
Review » Galaxy Book (2021) in review: The affordable Samsung notebook for office users
Honor MagicBook 15 i5 1135G7: Intel Core i5-1135G7, 15.60", 1.5 kg
Review » Honor MagicBook 15 (2021) Review - The switch to Intel is unnecessarily expensive
Acer Spin 3 SP313-51N-56YV: Intel Core i5-1135G7, 13.30", 1.4 kg
Review » Acer Spin 3 SP313-51N convertible in review: A good all-rounder with weaknesses
Samsung Galaxy Book Pro 360 13: Intel Core i5-1135G7, 13.20", 1.1 kg
Review » Samsung Galaxy Book Pro 360 13" in review: Samsung's new business class for convertibles
Dell XPS 13 9305 Core i5 FHD: Intel Core i5-1135G7, 13.30", 1.2 kg
Review » Dell XPS 13 9305 Core i5 Full HD laptop in review: Less display, better colors
HP Spectre x360 13-aw2003dx: Intel Core i5-1135G7, 13.30", 1.2 kg
Review » HP Spectre x360 13 11th Gen Intel Convertible Review: Proof That OLED Isn't Everything
Acer TravelMate Spin P4 TMP414RN-51-53J8: Intel Core i5-1135G7, 14.00", 1.4 kg
Review » Acer TravelMate Spin P4 laptop review - business model with Thunderbolt 4
Lenovo ThinkPad L13 Yoga Gen2-20VK000VGE: Intel Core i5-1135G7, 13.30", 1.5 kg
Review » Lenovo ThinkPad L13 Yoga Gen 2 laptop review: Business convertible now with Tiger Lake
Lenovo ThinkBook 15 Gen2 ITL: Intel Core i5-1135G7, 15.60", 1.8 kg
Review » Lenovo ThinkBook 15 Gen2 Laptop review: Affordable Tiger Lake laptop
Intel NUC11TNKi5: Intel Core i5-1135G7, 0.5 kg
Review » Intel NUC11TNKi5 Pro Mini Tiger Canyon Review: Smallest Tiger Lake NUC
Schenker VIA 14 Late 2020: Intel Core i5-1135G7, 14.00", 1.1 kg
Review » Schenker VIA 14 laptop in review: Lightweight magnesium ultrabook with extremely long battery life
Lenovo ThinkBook 14 G2 ITL 20VD008WGE: Intel Core i5-1135G7, 14.00", 1.5 kg
Review » Lenovo ThinkBook 14 Gen 2 Tiger Lake review: Office laptop with poor endurance
Acer Swift 5 SF514-55T-58DN: Intel Core i5-1135G7, 14.00", 1 kg
Review » Acer Swift 5 SF514-55T Laptop review: Slim allrounder on EVO basis
Microsoft Surface Pro 7 Plus: Intel Core i5-1135G7, 12.30", 0.8 kg
Review » Microsoft Surface Pro 7 Plus in review: Tiger Lake provides a performance boost
Acer Aspire 5 A515-56-511A: Intel Core i5-1135G7, 15.60", 1.9 kg
Review » Acer Aspire 5 A515 in review: A look at a Tiger Lake laptop
Lenovo ThinkPad L13 Gen2-20VH0017GE: Intel Core i5-1135G7, 13.30", 1.4 kg
Review » Lenovo ThinkPad L13 Gen 2 laptop review: Stylish ultrabook now with Intel Tiger Lake
GPD Win 3: Intel Core i5-1135G7, 5.50", 0.6 kg
Review » GPD Win 3 Review: The Unofficial Microsoft Switch
Lenovo ThinkBook 13s-ITL-20V90003GE: Intel Core i5-1135G7, 13.30", 1.3 kg
Review » Lenovo ThinkBook 13s in review: Battery life or performance? You decide.
Dell Inspiron 15 7506 2-in-1 P97F: Intel Core i5-1135G7, 15.60", 1.8 kg
Review » Dell Inspiron 15 7506 2-in-1 Convertible Review: Easy to Use, Easy to Own
Lenovo Yoga 9i 14ITL5: Intel Core i5-1135G7, 14.00", 1.4 kg
Review » Lenovo Yoga 9i 14 Convertible Review: The Yoga C940 Twin
Lenovo Yoga 7 14ITL5: Intel Core i5-1135G7, 14.00", 1.5 kg
Review » Lenovo Yoga 7i 14-inch Tiger Lake Laptop Review: Core i5-1135G7 Debut
Dell 15 (DC15250): Intel Core i5-1334U, 15.60", 1.9 kg
External Review » Dell 15 (DC15250) - Reviews and Specs
Acer Aspire 17 A17-51M, Core 5 120U: Intel Core 5 120U, 17.30", 2.1 kg
External Review » Acer Aspire 17 A17-51M, Core 5 120U - Reviews and Specs
Asus VivoBook 17 X1704VA: Intel Core 5 120U, 17.30", 2.1 kg
External Review » Asus VivoBook 17 X1704VA
HP Laptop 14-ep1000: Intel Core 5 120U, 14.00", 1.4 kg
External Review » HP Laptop 14-ep1000
Medion Signium 14 S1: Intel Core 5 120U, 14.00", 1 kg
External Review » Medion Signium 14 S1
HP Omnibook 5 Flip 14-fp0000TU: Intel Core i5-1334U, 14.00", 1.7 kg
External Review » HP Omnibook 5 Flip 14-fp0000TU
Acer Aspire Lite 14 AL14-52M: Intel Core i5-1334U, 14.00", 1.5 kg
External Review » Acer Aspire Lite 14 AL14-52M
Acer Aspire Go AG15-51P-56UR: Intel Core i5-1334U, 15.30", 1.7 kg
External Review » Acer Aspire Go AG15-51P-56UR
Honor MagicBook X16 Plus 2025: Intel Core 5 220H, 16.00", 1.8 kg
External Review » Honor MagicBook X16 Plus 2025
Acer Aspire Lite 15 AL15-72P: Intel Core i5-13500H, 15.60", 1.8 kg
External Review » Acer Aspire Lite 15 AL15-72P
Lenovo IP Flex 5 Chromebook Plus 14IAU7, i5-1334U: Intel Core i5-1334U, 14.00", 1.6 kg
External Review » Lenovo IP Flex 5 Chromebook Plus 14IAU7, i5-1334U
LG gram Book 15U50T: Intel Core i5-1334U, 15.60", 1.7 kg
External Review » LG gram Book 15U50T
Lenovo Thinkpad E14 G5, i5-1335U: Intel Core i5-1335U, 14.00", 1.5 kg
External Review » Lenovo Thinkpad E14 G5, i5-1335U
Dell Inspiron 14 7440 2-in-1: Intel Core 5 120U, 14.00", 1.7 kg
External Review » Dell Inspiron 14 7440 2-in-1
Dell Inspiron 16 5640: Intel Core i5-1334U, 16.00", 2.1 kg
External Review » Dell Inspiron 16 5640
MSI Modern 14 F13MG: Intel Core i5-1335U, 14.00", 1.5 kg
External Review » MSI Modern 14 F13MG
Asus Chromebook Plus CX3402CVA : Intel Core i5-1335U, 14.00", 1.5 kg
External Review » Asus Chromebook Plus CX3402CVA
Acer TravelMate P2 TMP215-55: Intel Core i5-1334U, 15.60", 1.6 kg
External Review » Acer TravelMate P2 TMP215-55
Acer Aspire 5 A514-55, i5-1235U: Intel Core i5-1235U, 14.00", 1.7 kg
External Review » Acer Aspire 5 A514-55, i5-1235U
Acer TravelMate P4 TMP414-53-58XQ: Intel Core i5-1335U, 14.00", 1.5 kg
External Review » Acer TravelMate P4 TMP414-53-58XQ
Acer Aspire Go AG15-51P: Intel Core i5-1334U, 15.30", 1.7 kg
External Review » Acer Aspire Go AG15-51P
Asus ExpertBook B1 B1503CVA: Intel Core i5-1335U, 15.60", 1.7 kg
External Review » Asus ExpertBook B1 B1503CVA
MSI Modern 15 F13MG: Intel Core i5-1335U, 15.60", 1.7 kg
External Review » MSI Modern 15 F13MG
Infinix Inbook Air Pro Plus: Intel Core i5-1334U, 14.00", 1 kg
External Review » Infinix Inbook Air Pro Plus
Lenovo IdeaPad Slim 3 16IRU9: Intel Core 5 120U, 16.00", 1.7 kg
External Review » Lenovo IdeaPad Slim 3 16IRU9
Acer Chromebook Plus 515 CBE595: Intel Core 5 120U, 15.60", 1.7 kg
External Review » Acer Chromebook Plus 515 CBE595
Dell Latitude 3550: Intel Core i5-1335U, 15.60", 1.8 kg
External Review » Dell Latitude 3550
Acer Swift Go 14 SFG14-71: Intel Core i5-1335U, 14.00", 1.3 kg
External Review » Acer Swift Go 14 SFG14-71
Acer TravelMate P4 TMP416-51-55KN: Intel Core i5-1240P, 16.00", 1.6 kg
External Review » Acer TravelMate P4 TMP416-51-55KN
Acer Aspire Spin 14 ASP14-51: Intel Core 5 120U, 14.00", 1.6 kg
External Review » Acer Aspire Spin 14 ASP14-51
Acer Aspire 5 A514-56M, i5-1335U: Intel Core i5-1335U, 14.00", 1.7 kg
External Review » Acer Aspire 5 A514-56M, i5-1335U
Acer Chromebook Plus 516 GE CBG516-2H: Intel Core 5 120U, 16.00", 1.7 kg
External Review » Acer Chromebook Plus 516 GE CBG516-2H
Asus ExpertBook B1 B1502CVA: Intel Core i5-1335U, 15.60", 1.7 kg
External Review » Asus ExpertBook B1 B1502CVA
Medion Akoya E16433: Intel Core i5-1235U, 16.00", 2 kg
External Review » Medion Akoya E16433
Acer Aspire 5 A15-51M: Intel Core 5 120U, 15.60", 1.8 kg
External Review » Acer Aspire 5 A15-51M
Dell Inspiron 5330, i5-1340P: Intel Core i5-1340P, 13.30", 1.3 kg
External Review » Dell Inspiron 5330, i5-1340P
Acer Swift Go 16 SFG16-71, i5-1335U: Intel Core i5-1335U, 16.00", 1.6 kg
External Review » Acer Swift Go 16 SFG16-71, i5-1335U
Acer Chromebook Plus 515 CB515-2H, i5-1335U: Intel Core i5-1335U, 15.60", 1.7 kg
External Review » Acer Chromebook Plus 515 CB515-2H, i5-1335U
Asus ExpertBook B5 Flip B5402FVA: Intel Core i5-1340P, 14.00", 1.4 kg
External Review » Asus ExpertBook B5 Flip B5402FVA
Lenovo IdeaPad Slim 3 15IRU9: Intel Core 5 120U, 15.60", 1.6 kg
External Review » Lenovo IdeaPad Slim 3 15IRU9
Lenovo IdeaPad Slim 5 15IRU9: Intel Core 5 120U, 15.30", 1.7 kg
External Review » Lenovo IdeaPad Slim 5 15IRU9
Dell Latitude 13 5340: Intel Core i5-1335U, 13.30", 1.2 kg
External Review » Dell Latitude 13 5340
Lenovo ThinkPad X1 Yoga G8, i5-1345U: Intel Core i5-1345U, 14.00", 1.4 kg
External Review » Lenovo ThinkPad X1 Yoga G8, i5-1345U
Acer TravelMate P6 TMP614-53, i5-1335U: Intel Core i5-1335U, 14.00", 1.1 kg
External Review » Acer TravelMate P6 TMP614-53, i5-1335U
Honor MagicBook X 14 Pro 2024, i5-13500H: Intel Core i5-13500H, 14.00", 1.4 kg
External Review » Honor MagicBook X 14 Pro 2024, i5-13500H
Asus Vivobook 16 A1605: Intel Core 5 120U, 16.00", 1.9 kg
External Review » Asus Vivobook 16 A1605
Lenovo ThinkBook 16 G6 IRL: Intel Core i5-1335U, 16.00", 1.7 kg
External Review » Lenovo ThinkBook 16 G6 IRL
Lenovo ThinkPad T16 G2, i5-1335U: Intel Core i5-1335U, 16.00", 1.7 kg
External Review » Lenovo ThinkPad T16 G2, i5-1335U
Dell Latitude 7030 Rugged Extreme: Intel Core i5-1240U, 10.10", 1 kg
External Review » Dell Latitude 7030 Rugged Extreme
Asus Vivobook 14 X1404ZA, i5-1235U: Intel Core i5-1235U, 14.00", 1.4 kg
External Review » Asus Vivobook 14 X1404ZA, i5-1235U
HP 470 G10: Intel Core i5-1335U, 17.30", 2.1 kg
External Review » HP 470 G10
Lenovo ThinkPad L13 G4: Intel Core i5-1335U, 13.30", 1.3 kg
External Review » Lenovo ThinkPad L13 G4
Asus Vivobook 16X K3604: Intel Core i7-1360P, 16.00", 1.6 kg
External Review » Asus Vivobook 16X K3604
HP Pavilion 15-eg3000ng: Intel Core i5-1335U, 15.60", 1.7 kg
External Review » HP Pavilion 15-eg3000ng
HP EliteBook 640 G10: Intel Core i5-1335U, 14.00", 1.4 kg
External Review » HP EliteBook 640 G10
Acer TravelMate P4 TMP413-51: Intel Core i5-1335U, 13.30", 1.4 kg
External Review » Acer TravelMate P4 TMP413-51
HP Pavilion SE 14-ep0000: Intel Core i5-1335U, 14.00", 2.3 kg
External Review » HP Pavilion SE 14-ep0000
Getac S410 G5: Intel Core i5-1350P, 14.00", 2.9 kg
External Review » Getac S410 G5
HP Envy x360 13-bf0000: Intel Core i5-1230U, 13.30", 1.4 kg
External Review » HP Envy x360 13-bf0000
Acer Aspire Lite 15 AL15-51M: Intel Core i5-1155G7, 15.60", 1.6 kg
External Review » Acer Aspire Lite 15 AL15-51M
HP 240 G10: Intel Core i5-1335U, 14.00", 1.4 kg
External Review » HP 240 G10
Infinix INBook Y2 Plus: Intel Core i5-1155G7, 15.60", 1.8 kg
External Review » Infinix INBook Y2 Plus
Dell Latitude 13 7340 i5-1345U: Intel Core i5-1345U, 13.30", 1.1 kg
External Review » Dell Latitude 13 7340 i5-1345U
HP EliteBook 650 G10: Intel Core i5-1335U, 15.60", 1.8 kg
External Review » HP EliteBook 650 G10
Acer TravelMate P2 TMP216-51: Intel Core i5-1335U, 16.00", 1.9 kg
External Review » Acer TravelMate P2 TMP216-51
Lenovo Yoga Pro 7 14IRH G8, i5-13500H: Intel Core i5-13500H, 14.50", 1.5 kg
External Review » Lenovo Yoga Pro 7 14IRH G8, i5-13500H
Panasonic Toughbook FZ-40: Intel Core i5-1145G7, 14.00", 3.4 kg
External Review » Panasonic Toughbook FZ-40
Lenovo IdeaPad Duet 5 12IRU8: Intel Core i5-1335U, 12.40", 0.7 kg
External Review » Lenovo IdeaPad Duet 5 12IRU8
Lenovo Yoga Slim 6 14IRH8: Intel Core i5-13500H, 14.00", 1.4 kg
External Review » Lenovo Yoga Slim 6 14IRH8
Xiaomi Redmi Book 16 2024: Intel Core i5-13500H, 16.00", 1.7 kg
External Review » Xiaomi Redmi Book 16 2024
Chuwi Corebook X 2023: Intel Core i5-1235U, 14.00", 1.4 kg
External Review » Chuwi Corebook X 2023
HP 250 G10: Intel Core i5-1335U, 15.60", 1.5 kg
External Review » HP 250 G10
HP Pavilion 15-eg3000: Intel Core i5-1335U, 15.60", 1.7 kg
External Review » HP Pavilion 15-eg3000
HP Spectre x360 14-ef2000: Intel Core i5-1335U, 13.50", 1.4 kg
External Review » HP Spectre x360 14-ef2000
Asus Vivobook 14 X1404VA: Intel Core i5-1335U, 14.00", 1.4 kg
External Review » Asus Vivobook 14 X1404VA
HP Envy Move: Intel Core i5-1335U, 23.80", 4.1 kg
External Review » HP Envy Move
Lenovo ThinkPad E16 G1 Core i5-1335U: Intel Core i5-1335U, 16.00", 1.8 kg
External Review » Lenovo ThinkPad E16 G1 Core i5-1335U
HP 14-ee0000: Intel Core i5-1335U, 14.00", 1.4 kg
External Review » HP 14-ee0000
Asus ExpertBook B5 B5602: Intel Core i5-1240P, 16.00", 1.5 kg
External Review » Asus ExpertBook B5 B5602
Lenovo ThinkPad T14 G4 21HD0043GE: Intel Core i5-1335U, 14.00", 1.4 kg
External Review » Lenovo ThinkPad T14 G4 21HD0043GE
HP Pavilion Plus 14-eh1000np: Intel Core i5-1340P, 14.00", 1.4 kg
External Review » HP Pavilion Plus 14-eh1000np
Dell Vostro 14 3430: Intel Core i5-1335U, 14.00", 1.4 kg
External Review » Dell Vostro 14 3430
Dell Inspiron 15 3530: Intel Core i5-1335U, 15.60", 1.7 kg
External Review » Dell Inspiron 15 3530
Dell XPS 13 Plus 9320, i5-1340P: Intel Core i5-1340P, 13.40", 1.2 kg
External Review » Dell XPS 13 Plus 9320, i5-1340P
Asus Zenbook 14X OLED UX3404VA, i5-13500H: Intel Core i5-13500H, 14.50", 1.6 kg
External Review » Asus Zenbook 14X OLED UX3404VA, i5-13500H
Asus VivoBook 15 X1504ZA: Intel Core i5-1235U, 15.60", 1.6 kg
External Review » Asus VivoBook 15 X1504ZA
Infinix INBook X3 Slim: Intel Core i5-1235U, 14.20", 1.2 kg
External Review » Infinix INBook X3 Slim
HP Pavilion Plus 14-eh1021ns: Intel Core i5-1340P, 14.00", 1.4 kg
External Review » HP Pavilion Plus 14-eh1021ns
Asus VivoBook 16 X1605VA: Intel Core i5-1335U, 16.00", 1.9 kg
External Review » Asus VivoBook 16 X1605VA
Microsoft Surface Laptop Go 3: Intel Core i5-1235U, 12.40", 1.1 kg
External Review » Microsoft Surface Laptop Go 3
Acer Swift Go 14 SFG14-71, i5-1335U: Intel Core i5-1335U, 14.00", 1.3 kg
External Review » Acer Swift Go 14 SFG14-71, i5-1335U
Acer Aspire Vero AV15-53P-59MT: Intel Core i5-1335U, 15.60", 1.7 kg
External Review » Acer Aspire Vero AV15-53P-59MT
Lenovo ThinkPad X13 Yoga G4 21F20017GE: Intel Core i5-1335U, 13.30", 1.3 kg
External Review » Lenovo ThinkPad X13 Yoga G4 21F20017GE
Lenovo Yoga Slim 6 14IAP8, i5-1240P: Intel Core i5-1240P, 14.00", 1.3 kg
External Review » Lenovo Yoga Slim 6 14IAP8, i5-1240P
HP Pavilion x360 14-ek0751nd: Intel Core i5-1235U, 14.00", 1.5 kg
External Review » HP Pavilion x360 14-ek0751nd
HP Pavilion 15-eg2752nd: Intel Core i5-1235U, 15.60", 1.7 kg
External Review » HP Pavilion 15-eg2752nd
HP Envy x360 15-fe0000: Intel Core i5-1335U, 15.60", 1.8 kg
External Review » HP Envy x360 15-fe0000
Dell Inspiron 16 7630 2-in-1: Intel Core i5-1335U, 16.00", 2.1 kg
External Review » Dell Inspiron 16 7630 2-in-1
Acer Chromebook Spin 714 CP714-2WN: Intel Core i5-1335U, 14.00", 1.4 kg
External Review » Acer Chromebook Spin 714 CP714-2WN
Honor MagicBook X 16 Pro 2023: Intel Core i5-13500H, 16.00", 1.8 kg
External Review » Honor MagicBook X 16 Pro 2023
Acer Swift Go 14 SFG14-71: Intel Core i5-13500H, 14.00", 1.3 kg
External Review » Acer Swift Go 14 SFG14-71
Acer Aspire 5 A515-57-50Y7: Intel Core i5-1235U, 15.60", 1.8 kg
External Review » Acer Aspire 5 A515-57-50Y7
HP 15s-fd0082ns: Intel Core i5-1335U, 15.60", 1.6 kg
External Review » HP 15s-fd0082ns
HP 15s-fq5110ns: Intel Core i5-1235U, 15.60", 1.7 kg
External Review » HP 15s-fq5110ns
Honor MagicBook 14 2023: Intel Core i5-13500H, 14.20", 1.5 kg
External Review » Honor MagicBook 14 2023
Huawei MateBook D 14 2023: Intel Core i5-1240P, 14.00", 1.4 kg
External Review » Huawei MateBook D 14 2023
HP ProBook 440 G10: Intel Core i5-1335U, 14.00", 1.4 kg
External Review » HP ProBook 440 G10
HP ProBook 450 G10: Intel Core i5-1335U, 15.60", 1.8 kg
External Review » HP ProBook 450 G10
Lenovo ThinkBook 14s Yoga IRU G3: Intel Core i5-1335U, 14.00", 1.5 kg
External Review » Lenovo ThinkBook 14s Yoga IRU G3
Asus ExpertBook B1 B1402CBA: Intel Core i5-1235U, 14.00", 1.5 kg
External Review » Asus ExpertBook B1 B1402CBA
LG gram 15Z90R: Intel Core i5-1340P, 15.60", 1.2 kg
External Review » LG gram 15Z90R
Asus Vivobook 14X OLED S3405VA: Intel Core i5-13500H, 14.00", 1.4 kg
External Review » Asus Vivobook 14X OLED S3405VA
Asus Vivobook 15 X1504VA: Intel Core i5-1335U, 15.60", 1.7 kg
External Review » Asus Vivobook 15 X1504VA
Huawei MateBook D 14 2023, 53013PKG: Intel Core i5-1155G7, 14.00", 1.4 kg
External Review » Huawei MateBook D 14 2023, 53013PKG
Lenovo IdeaPad Gaming Chromebook 16: Intel Core i5-1235U, 16.00", 1.8 kg
External Review » Lenovo IdeaPad Gaming Chromebook 16
Samsung Galaxy Book3 15, Core i5-1335U: Intel Core i5-1335U, 15.60", 1.5 kg
External Review » Samsung Galaxy Book3 15, Core i5-1335U
Asus VivoBook 14 F1402ZA, i5-1235U: Intel Core i5-1235U, 14.00", 1.5 kg
External Review » Asus VivoBook 14 F1402ZA, i5-1235U
MSI Modern 14 C13M: Intel Core i5-1335U, 14.00", 1.4 kg
External Review » MSI Modern 14 C13M
LG Gram SuperSlim 2023, i5-1340P: Intel Core i5-1340P, 15.60", 1 kg
External Review » LG Gram SuperSlim 2023, i5-1340P
Dell Vostro 16 5630: Intel Core i5-1340P, 16.00", 1.9 kg
External Review » Dell Vostro 16 5630
HP Pavilion 15-eg2000TU: Intel Core i5-1240P, 15.60", 1.7 kg
External Review » HP Pavilion 15-eg2000TU
Dell Inspiron 16 5620: Intel Core i5-1235U, 16.00", 1.9 kg
External Review » Dell Inspiron 16 5620
Dell Inspiron 14 5410, i5-11300H: Intel Core i5-11300H, 14.00", 1.4 kg
External Review » Dell Inspiron 14 5410, i5-11300H
Acer Aspire 3 A315-59, i5-1235U: Intel Core i5-1235U, 15.60", 1.8 kg
External Review » Acer Aspire 3 A315-59, i5-1235U
Asus ExpertBook B1 B1502CB, i5-1235U: Intel Core i5-1235U, 15.60", 1.7 kg
External Review » Asus ExpertBook B1 B1502CB, i5-1235U
Asus ZenBook S13 OLED UX5304, i5-1335U: Intel Core i5-1335U, 13.30", 1.1 kg
External Review » Asus ZenBook S13 OLED UX5304, i5-1335U
Infinix Zero Book: Intel Core i5-12500H, 15.60", 1.8 kg
External Review » Infinix Zero Book
Acer Aspire 5 Spin 14: Intel Core i5-1335U, 14.00", 1.6 kg
External Review » Acer Aspire 5 Spin 14
HP Pavilion 14-dv2009ns: Intel Core i5-1235U, 14.00", 1.4 kg
External Review » HP Pavilion 14-dv2009ns
Asus Vivobook 15 F1605PA: Intel Core i5-11300H, 16.00", 1.9 kg
External Review » Asus Vivobook 15 F1605PA
HP Pavilion 14-dv1013ns: Intel Core i5-1155G7, 14.00", 1.4 kg
External Review » HP Pavilion 14-dv1013ns
HP Pavilion x360 14-ek0005ns: Intel Core i5-1235U, 14.00", 1.5 kg
External Review » HP Pavilion x360 14-ek0005ns
HP 15s-fq5081ns: Intel Core i5-1235U, 15.60", 1.7 kg
External Review » HP 15s-fq5081ns
Asus Vivobook 15 X1505ZA: Intel Core i5-1235U, 15.60", 1.7 kg
External Review » Asus Vivobook 15 X1505ZA
Asus VivoBook 16X X1605ZA: Intel Core i5-1235U, 16.00", 1.9 kg
External Review » Asus VivoBook 16X X1605ZA
Dell Inspiron 14 5430: Intel Core i5-1335U, 14.00", 1.7 kg
External Review » Dell Inspiron 14 5430
Dell Inspiron 15 3520: Intel Core i5-1235U, 15.60", 1.9 kg
External Review » Dell Inspiron 15 3520
Lenovo IdeaPad Flex 5 14IRU8: Intel Core i5-1335U, 14.00", 1.6 kg
External Review » Lenovo IdeaPad Flex 5 14IRU8
HP Pavilion x360 14-ek1000: Intel Core i5-1335U, 14.00", 1.5 kg
External Review » HP Pavilion x360 14-ek1000
Wortmann Terra Mobile 1470U: Intel Core i5-1235U, 14.00", 1.1 kg
External Review » Wortmann Terra Mobile 1470U
Asus Zenbook 14 Flip UP3404VA: Intel Core i5-1340P, 14.00", 1.5 kg
External Review » Asus Zenbook 14 Flip UP3404VA
Acer Aspire 5 A515-58: Intel Core i5-1335U, 15.60", 1.8 kg
External Review » Acer Aspire 5 A515-58
Samsung Galaxy Book3 360 13, i5-1340P: Intel Core i5-1340P, 13.30", 1.2 kg
External Review » Samsung Galaxy Book3 360 13, i5-1340P
HP 15s-fq5075ns: Intel Core i5-1235U, 15.60", 1.7 kg
External Review » HP 15s-fq5075ns
Asus ZenBook Flip 14 UP5401EA, i5-1135G7: Intel Core i5-1135G7, 14.00", 1.4 kg
External Review » Asus ZenBook Flip 14 UP5401EA, i5-1135G7
HP Pavilion Plus 14-eh0000ns: Intel Core i5-1240P, 14.00", 1.4 kg
External Review » HP Pavilion Plus 14-eh0000ns
Infinix INBook X2, i5-1155G7: Intel Core i5-1155G7, 14.00", 1.2 kg
External Review » Infinix INBook X2, i5-1155G7
Dell Vostro 3520, i5-1235U: Intel Core i5-1235U, 15.60", 1.7 kg
External Review » Dell Vostro 3520, i5-1235U
Asus Vivobook 15 A1505VA: Intel Core i5-13500H, 15.60", 1.7 kg
External Review » Asus Vivobook 15 A1505VA
Asus Zenbook 14 UX3402VA: Intel Core i5-1340P, 14.00", 1.4 kg
External Review » Asus Zenbook 14 UX3402VA
Asus Vivobook S 14 Flip TP3402VA: Intel Core i5-13500H, 14.00", 1.5 kg
External Review » Asus Vivobook S 14 Flip TP3402VA
Asus Chromebook Vibe CX3401 Flip: Intel Core i5-1235U, 14.00", 1.8 kg
External Review » Asus Chromebook Vibe CX3401 Flip
HP 15s-fq5089ns: Intel Core i5-1235U, 15.60", 1.7 kg
External Review » HP 15s-fq5089ns
HP 15s-fq4008ns: Intel Core i5-1155G7, 15.60", 1.7 kg
External Review » HP 15s-fq4008ns
Acer Aspire 3 A315-59-58K8: Intel Core i5-1235U, 15.60", 1.8 kg
External Review » Acer Aspire 3 A315-59-58K8
Samsung Galaxy Book3 360 15, i5-1340P: Intel Core i5-1340P, 15.60", 1.5 kg
External Review » Samsung Galaxy Book3 360 15, i5-1340P
Lenovo ThinkPad T14s G3 21BR00CDGE: Intel Core i5-1235U, 14.00", 1.3 kg
External Review » Lenovo ThinkPad T14s G3 21BR00CDGE
Lenovo ThinkPad X13 G3 21BN0046GE: Intel Core i5-1235U, 13.30", 1.3 kg
External Review » Lenovo ThinkPad X13 G3 21BN0046GE
HP EliteBook x360 830 G9, i5-1235U: Intel Core i5-1235U, 13.30", 1.3 kg
External Review » HP EliteBook x360 830 G9, i5-1235U
Lenovo IdeaPad Duet 5 12IAU7, i5-1235U: Intel Core i5-1235U, 12.40", 0.8 kg
External Review » Lenovo IdeaPad Duet 5 12IAU7, i5-1235U
Lenovo IdeaPad 3 15ITL6, i5-1155G7: Intel Core i5-1155G7, 15.60", 1.7 kg
External Review » Lenovo IdeaPad 3 15ITL6, i5-1155G7
Honor MagicBook X 15 2022, i5-1135G7: Intel Core i5-1135G7, 15.60", 1.6 kg
External Review » Honor MagicBook X 15 2022, i5-1135G7
Lenovo ThinkBook 14 G4 IAP, i5-1235U: Intel Core i5-1235U, 14.00", 1.4 kg
External Review » Lenovo ThinkBook 14 G4 IAP, i5-1235U
Lenovo Thinkpad X1 Carbon G10, i5-1235U: Intel Core i5-1235U, 14.00", 1.1 kg
External Review » Lenovo Thinkpad X1 Carbon G10, i5-1235U
Acer Extensa 15 EX215-54-57VY: Intel Core i5-1135G7, 15.60", 1.9 kg
External Review » Acer Extensa 15 EX215-54-57VY
Asus VivoBook 15 F1500EA, i5-1135G7: Intel Core i5-1135G7, 15.60", 1.8 kg
External Review » Asus VivoBook 15 F1500EA, i5-1135G7
Acer Spin 3 SP314-55N-55RR: Intel Core i5-1235U, 14.00", 1.5 kg
External Review » Acer Spin 3 SP314-55N-55RR
Asus VivoBook 15 F1502ZA, i5-1235U: Intel Core i5-1235U, 15.60", 1.7 kg
External Review » Asus VivoBook 15 F1502ZA, i5-1235U
HP 15s-fq5022ns: Intel Core i5-1235U, 15.60", 1.7 kg
External Review » HP 15s-fq5022ns
HP 15s-fq5071ns: Intel Core i5-1235U, 15.60", 1.7 kg
External Review » HP 15s-fq5071ns
HP Dragonfly Pro Chromebook: Intel Core i5-1235U, 14.00", 1.5 kg
External Review » HP Dragonfly Pro Chromebook
Lenovo ThinkBook 14 G4, i5-1240P: Intel Core i5-1240P, 14.00", 1.4 kg
External Review » Lenovo ThinkBook 14 G4, i5-1240P
Dell Latitude 7230 Rugged Extreme: Intel Core i5-1240U, 12.00", 1.6 kg
External Review » Dell Latitude 7230 Rugged Extreme
Samsung Galaxy Book3 Pro 16: Intel Core i5-1340P, 16.00", 1.6 kg
External Review » Samsung Galaxy Book3 Pro 16, Core i5-1340P
Samsung Galaxy Book3 Pro 360 16, i5-1340P: Intel Core i5-1340P, 16.00", 1.7 kg
External Review » Samsung Galaxy Book3 Pro 360 16, i5-1340P
Asus Chromebook Flip CX5601, i5-1235U: Intel Core i5-1235U, 16.00", 2.2 kg
External Review » Asus Chromebook Flip CX5601, i5-1235U
Acer Chromebook Spin 514 CP514-2H-53K9: Intel Core i5-1130G7, 14.00", 1.4 kg
External Review » Acer Chromebook Spin 514 CP514-2H-53K9
HP Spectre x360 14, i5-1235U: Intel Core i5-1235U, 13.50", 1.4 kg
External Review » HP Spectre x360 14, i5-1235U
Asus Zenbook 14 Q409ZA, i5-1240P: Intel Core i5-1240P, 14.00", 1.4 kg
External Review » Asus Zenbook 14 Q409ZA, i5-1240P
Asus VivoBook S 14 Flip TP3402ZA: Intel Core i5-12500H, 14.00", 1.5 kg
External Review » Asus VivoBook S 14 Flip TP3402ZA
Asus Vivobook 14 F1400EA-EB1837W: Intel Core i5-1135G7, 14.00", 1.6 kg
External Review » Asus Vivobook 14 F1400EA-EB1837W
HP Envy x360 15-ew0004ns: Intel Core i5-1240P, 15.60", 1.8 kg
External Review » HP Envy x360 15-ew0004ns
Microsoft Surface Laptop 5 13, i5-1245U: Intel Core i5-1245U, 13.50", 1.3 kg
External Review » Microsoft Surface Laptop 5 13, i5-1245U
Microsoft Surface Pro 9, i5-1245U: Intel Core i5-1245U, 13.00", 0.9 kg
External Review » Microsoft Surface Pro 9, i5-1245U
Samsung Galaxy Book3 Pro 14, i5-1340P: Intel Core i5-1340P, 14.00", 1.2 kg
External Review » Samsung Galaxy Book3 Pro 14, i5-1340P
Lenovo ThinkBook Plus Gen3, i5-12500H: Intel Core i5-12500H, 17.30", 2 kg
External Review » Lenovo ThinkBook Plus Gen3, i5-12500H
Dell Latitude 14 9430, i5-1245U: Intel Core i5-1245U, 14.00", 1.3 kg
External Review » Dell Latitude 14 9430, i5-1245U
Lenovo ThinkBook 14s Yoga G2 IAP 21DM0005GE: Intel Core i5-1235U, 14.00", 1.5 kg
External Review » Lenovo ThinkBook 14s Yoga G2 IAP 21DM0005GE
HP ProBook 440 G9, i5-1235U: Intel Core i5-1235U, 14.00", 1.4 kg
External Review » HP ProBook 440 G9, i5-1235U
Lenovo ThinkPad L15 G3, i5-1235: Intel Core i5-1235U, 15.60", 1.8 kg
External Review » Lenovo ThinkPad L15 G3, i5-1235
Fujitsu LifeBook U7512, i5-1235U: Intel Core i5-1235U, 15.60", 1.4 kg
External Review » Fujitsu LifeBook U7512, i5-1235U
Asus Vivobook 17 X1702, i5-1235U: Intel Core i5-1235U, 17.30", 2.1 kg
External Review » Asus Vivobook 17 X1702, i5-1235U
Acer TravelMate Spin P4 TMP414RN-52-595S: Intel Core i5-1240P, 14.00", 1.5 kg
External Review » Acer TravelMate Spin P4 TMP414RN-52-595S
Dynabook Portégé X40L-K-10S: Intel Core i5-1240P, 14.00", 1.1 kg
External Review » Dynabook Portégé X40L-K-10S
Microsoft Surface Laptop 5 13, i5-1235U: Intel Core i5-1235U, 13.50", 1.3 kg
External Review » Microsoft Surface Laptop 5 13, i5-1235U
Lenovo Yoga Slim 7 Pro 14IAP7, i5-1240P: Intel Core i5-1240P, 14.00", 1.3 kg
External Review » Lenovo Yoga Slim 7 Pro 14IAP7, i5-1240P
Asus Vivobook 14 A1402, i5-1235U: Intel Core i5-1235U, 14.00", 1.5 kg
External Review » Asus Vivobook 14 A1402, i5-1235U
Dell Vostro 15 3500, i5-1135G7 iGPU: Intel Core i5-1135G7, 15.60", 1.8 kg
External Review » Dell Vostro 15 3500, i5-1135G7 iGPU
Lenovo IdeaPad 3 15IAU7-82RK0092GE: Intel Core i5-1235U, 15.60", 1.6 kg
External Review » Lenovo IdeaPad 3 15IAU7-82RK0092GE
Acer Chromebook Vero 514 CBV514-1H, i5-1235U: Intel Core i5-1235U, 14.00", 1.5 kg
External Review » Acer Chromebook Vero 514 CBV514-1H, i5-1235U
Honor Magicbook X 16, i5-1235U: Intel Core i5-1235U, 16.00", 1.8 kg
External Review » Honor Magicbook X 16, i5-1235U
HP Pavilion 14-dv2014TU: Intel Core i5-1235U, 14.00", 1.4 kg
External Review » HP Pavilion 14-dv2014TU
Asus Vivobook 14 X1405ZA, i5-1235U: Intel Core i5-1235U, 14.00", 1.6 kg
External Review » Asus Vivobook 14 X1405ZA, i5-1235U
HP 15s-fq5034ns: Intel Core i5-1235U, 15.60", 1.7 kg
External Review » HP 15s-fq5034ns
Asus Vivobook 14 F1400EA-EB1517W: Intel Core i5-1135G7, 14.00", 1.6 kg
External Review » Asus Vivobook 14 F1400EA-EB1517W
HP 470 G9, i5-1235U: Intel Core i5-1235U, 17.30", 2.1 kg
External Review » HP 470 G9, i5-1235U
Dell Latitude 15 3530, i5-1235U: Intel Core i5-1235U, 15.60", 1.8 kg
External Review » Dell Latitude 15 3530, i5-1235U
Acer TravelMate P2 TMP215-54-598S: Intel Core i5-1235U, 15.60", 1.9 kg
External Review » Acer TravelMate P2 TMP215-54-598S
HP EliteBook 650 G9, i5-1235U: Intel Core i5-1235U, 15.60", 1.7 kg
External Review » HP EliteBook 650 G9, i5-1235U
Lenovo ThinkBook 15 G4 IAP, i5-1235U: Intel Core i5-1235U, 15.60", 1.7 kg
External Review » Lenovo ThinkBook 15 G4 IAP, i5-1235U
Lenovo Ideapad 5 Pro 14IAP7, i5-1240P: Intel Core i5-1240P, 14.00", 1.4 kg
External Review » Lenovo Ideapad 5 Pro 14IAP7, i5-1240P
Asus Vivobook S 15 M3502, i5-12500H: Intel Core i5-12500H, 15.60", 1.8 kg
External Review » Asus Vivobook S 15 M3502, i5-12500H
Lenovo ThinkBook 13s G4 IAP, i5-1240P: Intel Core i5-1240P, 13.30", 1.2 kg
External Review » Lenovo ThinkBook 13s G4 IAP, i5-1240P
Dell XPS 13 9315 2-in-1 Core i5-1230U: Intel Core i5-1230U, 13.00", 0.8 kg
External Review » Dell XPS 13 9315 2-in-1 Core i5-1230U
Asus Vivobook Flip 14 TP470EA-EC384W: Intel Core i5-1135G7, 14.00", 1.5 kg
External Review » Asus Vivobook Flip 14 TP470EA-EC384W
Acer TravelMate P2 TMP214-53-53VY: Intel Core i5-1135G7, 14.00", 1.6 kg
External Review » Acer TravelMate P2 TMP214-53-53VY
Lenovo ThinkPad X13 G3, i5-1240P: Intel Core i5-1240P, 13.30", 1.3 kg
External Review » Lenovo ThinkPad X13 G3, i5-1240P
HP Pavilion Plus 14-eh0021TU: Intel Core i5-12500H, 14.00", 1.4 kg
External Review » HP Pavilion Plus 14-eh0021TU
HP EliteBook 640 G9, i5-1235U: Intel Core i5-1235U, 14.00", 1.4 kg
External Review » HP EliteBook 640 G9, i5-1235U
HP EliteBook 840 G9, i5-1235U: Intel Core i5-1235U, 14.00", 1.4 kg
External Review » HP EliteBook 840 G9, i5-1235U
Lenovo ThinkPad E14 G4, i5-1235U: Intel Core i5-1235U, 14.00", 1.6 kg
External Review » Lenovo ThinkPad E14 G4, i5-1235U
Lenovo ThinkPad C14 Chromebook, i5-1245U: Intel Core i5-1245U, 14.00", 1.7 kg
External Review » Lenovo ThinkPad C14 Chromebook, i5-1245U
Acer Chromebook 516 GE CBG516-1H-53SL: Intel Core i5-1240P, 16.00", 1.7 kg
External Review » Acer Chromebook 516 GE CBG516-1H-53SL
Asus Vivobook S 15 K3502, i5-12500H: Intel Core i5-12500H, 15.60", 1.8 kg
External Review » Asus Vivobook S 15 K3502, i5-12500H
Fujitsu CH 13 4ZR1C22927: Intel Core i5-1135G7, 13.30", 1 kg
External Review » Fujitsu CH 13 4ZR1C22927
Lenovo IdeaPad Flex 5 14IAU7-82R7007XGE: Intel Core i5-1235U, 14.00", 1.6 kg
External Review » Lenovo IdeaPad Flex 5 14IAU7-82R7007XGE
Dell Latitude 14 7430, i5-1235U: Intel Core i5-1235U, 14.00", 1.2 kg
External Review » Dell Latitude 14 7430, i5-1235U
Asus ExpertBook P1 P1512CEA-EJ0213: Intel Core i5-1135G7, 15.60", 1.8 kg
External Review » Asus ExpertBook P1 P1512CEA-EJ0213
Asus Vivobook 14 F1400EA-EB1648 : Intel Core i5-1135G7, 14.00", 1.6 kg
External Review » Asus Vivobook 14 F1400EA-EB1648
Samsung Galaxy Book2 15, i5-1235U: Intel Core i5-1235U, 15.60", 1.6 kg
External Review » Samsung Galaxy Book2 15, i5-1235U
Asus VivoBook 15 F515EA-EJ2079W: Intel Core i5-1135G7, 15.60", 1.8 kg
External Review » Asus VivoBook 15 F515EA-EJ2079W
Monster Huma H5 V3.1: Intel Core i5-1135G7, 15.60", 1.7 kg
External Review » Monster Huma H5 V3.1
Fujitsu LifeBook U7312, i5-1235U: Intel Core i5-1235U, 13.30", 1 kg
External Review » Fujitsu LifeBook U7312, i5-1235U
Dell Inspiron 14 5420, i5-1235U: Intel Core i5-1235U, 14.00", 1.6 kg
External Review » Dell Inspiron 14 5420, i5-1235U
Asus ExpertBook B1 B1400CBA, i5-1235U: Intel Core i5-1235U, 14.00", 1.5 kg
External Review » Asus ExpertBook B1 B1400CBA, i5-1235U
Asus ExpertBook B5 B5402CB, i5-1240P: Intel Core i5-1240P, 14.00", 1.3 kg
External Review » Asus ExpertBook B5 B5402CB, i5-1240P
HP Probook 450 G9-6A179EA: Intel Core i5-1235U, 15.60", 1.7 kg
External Review » HP Probook 450 G9-6A179EA
Dell Vostro 16 5620, i5-1240P: Intel Core i5-1240P, 16.00", 2 kg
External Review » Dell Vostro 16 5620, i5-1240P
Asus Vivobook 14X A1403, i5-12500H: Intel Core i5-12500H, 14.00", 1.6 kg
External Review » Asus Vivobook 14X A1403, i5-12500H
Asus ExpertBook B5 Flip B5402F, i5-1240P: Intel Core i5-1240P, 14.00", 1.3 kg
External Review » Asus ExpertBook B5 Flip B5402F, i5-1240P
Microsoft Surface Pro 9, i5-1235U: Intel Core i5-1235U, 13.00", 0.9 kg
External Review » Microsoft Surface Pro 9, i5-1235U
Lenovo IdeaPad 5 15IAL7-82SF000RGE: Intel Core i5-1235U, 15.60", 1.9 kg
External Review » Lenovo IdeaPad 5 15IAL7-82SF000RGE
LG Gram 14Z90Q: Intel Core i5-1240P, 14.00", 1 kg
External Review » LG Gram 14Z90Q
Dell XPS 13 9315, i5-1230U: Intel Core i5-1230U, 13.40", 1.2 kg
External Review » Dell XPS 13 9315, i5-1230U
Dynabook Portégé X30L-K-139: Intel Core i5-1240P, 13.30", 0.9 kg
External Review » Dynabook Portégé X30L-K-139
Huawei Matebook D 15 2022, i5-1155G7: Intel Core i5-1155G7, 15.60", 1.6 kg
External Review » Huawei Matebook D 15 2022, i5-1155G7
Asus VivoBook 15 K513EA-L12891W: Intel Core i5-1135G7, 15.60", 1.8 kg
External Review » Asus VivoBook 15 K513EA-L12891W
Asus Vivobook 14 K413EA-EB1156T: Intel Core i5-1135G7, 14.00", 1.4 kg
External Review » Asus Vivobook 14 K413EA-EB1156T
HP 14s-dq4000ns: Intel Core i5-1155G7, 14.00", 1.5 kg
External Review » HP 14s-dq4000ns
Asus Expertbook B3 Flip B3402, i5-1235U: Intel Core i5-1235U, 14.00", 1.6 kg
External Review » Asus Expertbook B3 Flip B3402, i5-1235U
Acer Aspire 5 A515-57-56UV: Intel Core i5-1235U, 15.60", 1.8 kg
External Review » Acer Aspire 5 A515-57-56UV
Asus Vivobook S 14 K3402ZA, i5-12500H: Intel Core i5-12500H, 14.00", 1.5 kg
External Review » Asus Vivobook S 14 K3402ZA, i5-12500H
Gateway GWTC51427-BK: Intel Core i5-1235U, 14.10", 1.7 kg
External Review » Gateway GWTC51427-BK
Lenovo ThinkPad E14 Gen2-20TA00HKSP: Intel Core i5-1135G7, 14.00", 1.6 kg
External Review » Lenovo ThinkPad E14 Gen2-20TA00HKSP
Acer Swift 3 SF314-71-56U3: Intel Core i5-12500H, 14.00", 1.4 kg
External Review » Acer Swift 3 SF314-71-56U3
Acer Aspire 3 A315-58-54JJ: Intel Core i5-1135G7, 15.60", 1.7 kg
External Review » Acer Aspire 3 A315-58-54JJ
HP 15s-fq2708nd: Intel Core i5-1135G7, 15.60", 1.7 kg
External Review » HP 15s-fq2708nd
Acer Aspire 3 A315-58-57F6: Intel Core i5-1135G7, 15.60", 1.7 kg
External Review » Acer Aspire 3 A315-58-57F6
Asus VivoBook 14 X415EA-EB1703W: Intel Core i5-1135G7, 14.10", 1.6 kg
External Review » Asus VivoBook 14 X415EA-EB1703W
HP 15s-fq5078TU: Intel Core i5-1235U, 15.60", 1.7 kg
External Review » HP 15s-fq5078TU
Asus ZenBook Flip 14 UP5401ZA, i5-12500H: Intel Core i5-12500H, 14.00", 1.4 kg
External Review » Asus ZenBook Flip 14 UP5401ZA, i5-12500H
Intel NUC M15 LAPBC510: Intel Core i5-1135G7, 15.60", 1.7 kg
External Review » Intel NUC M15 LAPBC510
Huawei MateBook 14 (2024): Intel Core i5-1240P, 14.00", 1.4 kg
External Review » Huawei MateBook 14 2022, i5-1240P
Asus VivoBook 15X A1503, i5-12500H: Intel Core i5-12500H, 15.60", 1.7 kg
External Review » Asus VivoBook 15X A1503, i5-12500H
Asus VivoBook S 14 S3402, i7-12500H: Intel Core i5-12500H, 14.00", 1.5 kg
External Review » Asus VivoBook S 14 S3402, i7-12500H
Dell Inspiron 16 7620 2-in-1 K7JT6: Intel Core i5-1235U, 16.00", 2.2 kg
External Review » Dell Inspiron 16 7620 2-in-1 K7JT6
VAIO FE 14.1 VWNC51429-SL: Intel Core i5-1235U, 14.10", 1.6 kg
External Review » VAIO FE 14.1 VWNC51429-SL
Lenovo ThinkPad L14 G3 21C1003AGE: Intel Core i5-1235U, 14.00", 1.4 kg
External Review » Lenovo ThinkPad L14 G3 21C1003AGE
Lenovo IdeaPad 5 Pro 16IAH7-82SK0035GE: Intel Core i5-12500H, 16.00", 2 kg
External Review » Lenovo IdeaPad 5 Pro 16IAH7-82SK0035GE
Lenovo ThinkPad L13 Yoga G3 21B50043GE: Intel Core i5-1235U, 13.30", 1.3 kg
External Review » Lenovo ThinkPad L13 Yoga G3 21B50043GE
Lenovo ThinkPad T16 G1 21BV006DGE: Intel Core i5-1240P, 16.00", 1.7 kg
External Review » Lenovo ThinkPad T16 G1 21BV006DGE
Acer Aspire Vero AV14-51-59UW: Intel Core i5-1235U, 14.00", 1.5 kg
External Review » Acer Aspire Vero AV14-51-59UW
Dell Latitude 14 5430-68TVC: Intel Core i5-1245U, 14.00", 1.4 kg
External Review » Dell Latitude 14 5430-68TVC
Dell Latitude 15 7530, i5-1245U: Intel Core i5-1245U, 15.60", 1.5 kg
External Review » Dell Latitude 15 7530, i5-1245U
MSI Modern 15 B12M, i5-1235U: Intel Core i5-1235U, 15.60", 1.8 kg
External Review » MSI Modern 15 B12M, i5-1235U
MSI Prestige 14 Evo A12M-229: Intel Core i5-1240P, 14.00", 1.3 kg
External Review » MSI Prestige 14 Evo A12M-229
Lenovo Yoga 7 14IAL7-82QE003GGE: Intel Core i5-1240P, 14.00", 1.4 kg
External Review » Lenovo Yoga 7 14IAL7-82QE003GGE
HP Elite Dragonfly Chromebook, i5-1245U: Intel Core i5-1245U, 13.50", 1.3 kg
External Review » HP Elite Dragonfly Chromebook, i5-1245U
HP 17-cn1006ns: Intel Core i5-1155G7, 17.30", 2.1 kg
External Review » HP 17-cn1006ns
Acer Aspire 5 A515-57-58LU: Intel Core i5-1235U, 15.60", 1.8 kg
External Review » Acer Aspire 5 A515-57-58LU
Samsung Galaxy Book2 Pro 360 13, i5-1235U: Intel Core i5-1235U, 13.30", 1.2 kg
External Review » Samsung Galaxy Book2 Pro 360 13, i5-1235U
Asus ZenBook 14X UX5401ZA-KP005W: Intel Core i5-12500H, 14.00", 1.4 kg
External Review » Asus ZenBook 14X UX5401ZA-KP005W
MSI Summit E14 Evo A12M-051: Intel Core i5-1240P, 14.00", 1.6 kg
External Review » MSI Summit E14 Evo A12M-051
Asus Vivobook 14 F415EA-EK1255W: Intel Core i5-1135G7, 14.00", 1.6 kg
External Review » Asus Vivobook 14 F415EA-EK1255W
HP 17-cn1012ns: Intel Core i5-1155G7, 17.30", 2.1 kg
External Review » HP 17-cn1012ns
HP Envy 13-ba1009ns: Intel Core i5-1135G7, 13.30", 1.3 kg
External Review » HP Envy 13-ba1009ns
Asus ExpertBook B2 Flip B2502FBA-N80113X: Intel Core i5-1240P, 14.00", 1.6 kg
External Review » Asus ExpertBook B2 Flip B2502FBA-N80113X
Acer Aspire Vero AV15-51-522W: Intel Core i5-1155G7, 15.60", 1.8 kg
External Review » Acer Aspire Vero AV15-51-522W
MSI Modern 14 C12M, i5-1235U: Intel Core i5-1235U, 14.00", 1.4 kg
External Review » MSI Modern 14 C12M, i5-1235U
HP 15s-fq4085ns: Intel Core i5-1155G7, 15.60", 1.7 kg
External Review » HP 15s-fq4085ns
Lenovo IdeaPad 5 Pro 14ITL6: Intel Core i5-1135G7, 14.00", 1.4 kg
External Review » Lenovo IdeaPad 5 Pro 14ITL6
Acer Chromebook Spin 714 CP714-1WN-53M9: Intel Core i5-1235U, 14.00", 1.4 kg
External Review » Acer Chromebook Spin 714 CP714-1WN-53M9
Asus VivoBook 15 X515EA-BQ943T: Intel Core i5-1135G7, 15.60", 1.8 kg
External Review » Asus VivoBook 15 X515EA-BQ943T
Acer Chromebook 515 CB515-1W-50FL: Intel Core i5-1145G7, 15.60", 1.7 kg
External Review » Acer Chromebook 515 CB515-1W-50FL
LG Gram 17 (2022): Intel Core i5-1240P, 17.00", 1.4 kg
External Review » LG Gram 17 (2022)
Lenovo IdeaPad 3 14ITL6-9QSP: Intel Core i5-1135G7, 14.10", 1.4 kg
External Review » Lenovo IdeaPad 3 14ITL6-9QSP
Lenovo V14 G2 ITL-82KA001KSP: Intel Core i5-1135G7, 14.00", 1.6 kg
External Review » Lenovo V14 G2 ITL-82KA001KSP
MSI Modern 14 B11MOU-1060XES: Intel Core i5-1155G7, 14.00", 1.3 kg
External Review » MSI Modern 14 B11MOU-1060XES
Asus VivoBook 14 K413EA-EB362T: Intel Core i5-1135G7, 14.00", 1.4 kg
External Review » Asus VivoBook 14 K413EA-EB362T
Asus Zenbook 14 UX3402ZA, i5-1240P: Intel Core i5-1240P, 14.00", 1.4 kg
External Review » Asus Zenbook 14 UX3402ZA, i5-1240P
MSI Modern 15 A11MU-682XE: Intel Core i5-1155G7, 15.60", 1.6 kg
External Review » MSI Modern 15 A11MU-682XE
HP Pavilion x360 14-dy0018ns: Intel Core i5-1135G7, 14.00", 1.8 kg
External Review » HP Pavilion x360 14-dy0018ns
HP 15s-fq4040ns: Intel Core i5-1155G7, 15.60", 1.7 kg
External Review » HP 15s-fq4040ns
Dell Latitude 15 5530-48J03: Intel Core i5-1235U, 15.60", 1.6 kg
External Review » Dell Latitude 15 5530-48J03
Samsung Galaxy Book2 Pro 15, i5-1240P: Intel Core i5-1240P, 15.60", 1.1 kg
External Review » Samsung Galaxy Book2 Pro 15, i5-1240P
Acer Swift 3 SF314-512-50F6: Intel Core i5-1240P, 14.00", 1.3 kg
External Review » Acer Swift 3 SF314-512-50F6
HP Envy x360 13-bd0018na: Intel Core i5-1135G7, 13.30", 1.3 kg
External Review » HP Envy x360 13-bd0018na
Dell XPS 13 Plus 9320 i5-1240p: Intel Core i5-1240P, 13.40", 1.2 kg
External Review » Dell XPS 13 Plus 9320 i5-1240p
Lenovo Yoga Slim 7 Pro 14IHU5-82NH0048GE: Intel Core i5-11300H, 14.00", 1.4 kg
External Review » Lenovo Yoga Slim 7 Pro 14IHU5-82NH0048GE
Asus VivoBook 15 X1502ZA-BQ165W: Intel Core i5-1240P, 15.60", 1.7 kg
External Review » Asus VivoBook 15 X1502ZA-BQ165W
LG Gram 14T90P: Intel Core i5-1135G7, 14.00", 1.2 kg
External Review » LG Gram 14T90P
Microsoft Surface Laptop Go 2 Core i5: Intel Core i5-1135G7, 12.40", 1.1 kg
External Review » Microsoft Surface Laptop Go 2 Core i5
Acer Swift 3 SF316-51-57D7: Intel Core i5-11300H, 16.10", 1.8 kg
External Review » Acer Swift 3 SF316-51-57D7
HP Pavilion 14-dv1000ns: Intel Core i5-1155G7, 14.00", 1.4 kg
External Review » HP Pavilion 14-dv1000ns
Microsoft Surface Laptop Studio i5-11300H: Intel Core i5-11300H, 14.40", 1.7 kg
External Review » Microsoft Surface Laptop Studio i5-11300H
Dynabook Satellite Pro C40-J-11I: Intel Core i5-1135G7, 14.00", 1.6 kg
External Review » Dynabook Satellite Pro C40-J-11I
Asus Chromebook Flip CX5 CX5400FMA-AI0077: Intel Core i5-1130G7, 14.00", 1.4 kg
External Review » Asus Chromebook Flip CX5 CX5400FMA-AI0077
Acer TravelMate P4 TMP414-51-59MR: Intel Core i5-1135G7, 14.00", 1.4 kg
External Review » Acer TravelMate P4 TMP414-51-59MR
Xiaomi Mi Notebook Ultra 2021 i5: Intel Core i5-11300H, 15.60", 1.7 kg
External Review » Xiaomi Mi Notebook Ultra 2021 i5
Asus Expertbook B5 B5302C, i5-1135G7: Intel Core i5-1135G7, 13.30", 1.2 kg
External Review » Asus Expertbook B5 B5302C, i5-1135G7
Acer Swift 3 SF314-59-50MZ: Intel Core i5-1135G7, 14.00", 1.2 kg
External Review » Acer Swift 3 SF314-59-50MZ
Asus Vivobook 14 X413EA-EK1338T: Intel Core i5-1135G7, 14.00", 1.4 kg
External Review » Asus Vivobook 14 X413EA-EK1338T
Asus Vivobook 14 F415EA-EK1005W: Intel Core i5-1135G7, 14.00", 1.6 kg
External Review » Asus Vivobook 14 F415EA-EK1005W
Asus VivoBook 14 K413EA-EK231T: Intel Core i5-1135G7, 14.00", 1.4 kg
External Review » Asus VivoBook 14 K413EA-EK231T
MSI Modern 14 B11MOU-689XES: Intel Core i5-1155G7, 14.00", 1.3 kg
External Review » MSI Modern 14 B11MOU-689XES
Acer Aspire 5 A514-54-501Z: Intel Core i5-1135G7, 14.00", 1.6 kg
External Review » Acer Aspire 5 A514-54-501Z
Asus VivoBook 15 K513EA-AB54: Intel Core i5-1135G7, 15.60", 1.8 kg
External Review » Asus VivoBook 15 K513EA-AB54
Acer Aspire Vero AV15-51-58JC: Intel Core i5-1155G7, 15.60", 1.8 kg
External Review » Acer Aspire Vero AV15-51-58JC
HP Pavilion x360 14-dy1002ns: Intel Core i5-1155G7, 14.00", 1.5 kg
External Review » HP Pavilion x360 14-dy1002ns
Dell Vostro 13 5301-V078G: Intel Core i5-1135G7, 13.30", 1.1 kg
External Review » Dell Vostro 13 5301-V078G
Lenovo ThinkPad L15 G2-20X300P0GE: Intel Core i5-1135G7, 15.60", 2 kg
External Review » Lenovo ThinkPad L15 G2-20X300P0GE
Acer Aspire 3 A317-53-58F1: Intel Core i5-1135G7, 17.30", 2.6 kg
External Review » Acer Aspire 3 A317-53-58F1
HP ZBook Firefly 14 G8-2C9Q8EA: Intel Core i5-1135G7, 14.00", 1.4 kg
External Review » HP ZBook Firefly 14 G8-2C9Q8EA
Samsung Galaxy Book2 Pro 13 NP930XED-KA1DE: Intel Core i5-1240P, 13.30", 0.9 kg
External Review » Samsung Galaxy Book2 Pro 13 NP930XED-KA1DE
Dell Latitude 15 9520, i5-1145G7: Intel Core i5-1145G7, 15.00", 1.4 kg
External Review » Dell Latitude 15 9520, i5-1145G7
Asus ExpertBook B3 Flip B3402FEA-EC0048R: Intel Core i5-1135G7, 14.00", 1.6 kg
External Review » Asus ExpertBook B3 Flip B3402FEA-EC0048R
Acer Aspire Vero AV15-51-55K2: Intel Core i5-1155G7, 15.60", 1.8 kg
External Review » Acer Aspire Vero AV15-51-55K2
Acer Swift 3 SF314-511-54ZK: Intel Core i5-1135G7, 14.00", 1.2 kg
External Review » Acer Swift 3 SF314-511-54ZK
Huawei MateBook E Core i5: Intel Core i5-1130G7, 12.60", 0.7 kg
External Review » Huawei MateBook E Core i5
Asus VivoBook 15 X513EA-BQ003T: Intel Core i5-1135G7, 15.60", 1.8 kg
External Review » Asus VivoBook 15 X513EA-BQ003T
HP 15s-fq4004ns: Intel Core i5-1155G7, 15.60", 1.7 kg
External Review » HP 15s-fq4004ns
HP Pavilion x360 14-dy1001ns: Intel Core i5-1155G7, 14.00", 1.5 kg
External Review » HP Pavilion x360 14-dy1001ns
MSI Modern 15 A11MU-619XES: Intel Core i5-1135G7, 15.60", 1.6 kg
External Review » MSI Modern 15 A11MU-619XES
HP Envy x360 13-bd0055nf: Intel Core i5-1135G7, 13.30", 1.3 kg
External Review » HP Envy x360 13-bd0055nf
HP 15s-fq2079ns: Intel Core i5-1135G7, 15.60", 1.7 kg
External Review » HP 15s-fq2079ns
Medion Akoya S15449-MD62127: Intel Core i5-1135G7, 15.60", 1.8 kg
External Review » Medion Akoya S15449-MD62127
Asus Chromebook Flip CX5 CX5500FEA-E60030: Intel Core i5-1135G7, 15.60", 2 kg
External Review » Asus Chromebook Flip CX5 CX5500FEA-E60030
HP 17-cn0025nr: Intel Core i5-1135G7, 17.30", 2.1 kg
External Review » HP 17-cn0025nr
HP 15s-fq2016sa: Intel Core i5-1135G7, 15.60", 1.7 kg
External Review » HP 15s-fq2016sa
Dynabook Tecra A50-J-18Z: Intel Core i5-1135G7, 15.60", 1.7 kg
External Review » Dynabook Tecra A50-J-18Z
Lenovo ThinkPad X1 Yoga G6-20XY003GGE: Intel Core i5-1135G7, 14.00", 1.4 kg
External Review » Lenovo ThinkPad X1 Yoga G6-20XY003GGE
Dell Latitude 14 3420-WNC19: Intel Core i5-1145G7, 14.00", 1.5 kg
External Review » Dell Latitude 14 3420-WNC19
HP 470 G8-3S8S1EA: Intel Core i5-1135G7, 17.30", 2.1 kg
External Review » HP 470 G8-3S8S1EA
HP ProBook 430 G8-2W1H2EA: Intel Core i5-1135G7, 13.30", 1.4 kg
External Review » HP ProBook 430 G8-2W1H2EA
Dell Latitude 13 7320 Detachable 34TR3: Intel Core i5-1140G7, 13.00", 0.8 kg
External Review » Dell Latitude 13 7320 Detachable 34TR3
Asus ExpertBook B7 Flip B7402FEA-L90074R: Intel Core i5-1155G7, 14.00", 1.5 kg
External Review » Asus ExpertBook B7 Flip B7402FEA-L90074R
Lenovo V17 G2 ITL-82NX00EBMH: Intel Core i5-1135G7, 17.30", 2.2 kg
External Review » Lenovo V17 G2 ITL-82NX00EBMH
Asus VivoBook 15 K513EA-L11430T: Intel Core i5-1135G7, 15.60", 1.7 kg
External Review » Asus VivoBook 15 K513EA-L11430T
Asus Vivobook Pro 14 K3400PA-WH51: Intel Core i5-11300H, 14.00", 1.4 kg
External Review » Asus Vivobook Pro 14 K3400PA-WH51
Medion Akoya E16401-MD62290: Intel Core i5-1135G7, 16.10", 2 kg
External Review » Medion Akoya E16401-MD62290
Lenovo ThinkBook 15 Gen2 ITL: Intel Core i5-1135G7, 15.60", 1.8 kg
External Review » Lenovo ThinkBook 15 Gen2 ITL
Asus ExpertBook B1 B1500CEAE, i5-1135G7: Intel Core i5-1135G7, 15.60", 1.7 kg
External Review » Asus ExpertBook B1 B1500CEAE, i5-1135G7
MSI Modern 14 B11MOU-852VN: Intel Core i5-1155G7, 14.00", 1.3 kg
External Review » MSI Modern 14 B11MOU-852VN
Asus VivoBook S15 S533EA-L11012T: Intel Core i5-1135G7, 15.60", 1.8 kg
External Review » Asus VivoBook S15 S533EA-L11012T
Asus VivoBook Flip 14 TP470EA-EC084T: Intel Core i5-1135G7, 14.00", 1.5 kg
External Review » Asus VivoBook Flip 14 TP470EA-EC084T
Medion Akoya S15449-MD62034: Intel Core i5-1135G7, 15.60", 1.9 kg
External Review » Medion Akoya S15449-MD62034
HP Chromebook x360 14c-cc0025no: Intel Core i5-1135G7, 14.00", 1.7 kg
External Review » HP Chromebook x360 14c-cc0025no
Acer Chromebook Spin 713 CP713-3W-503Z: Intel Core i5-1135G7, 13.50", 1.4 kg
External Review » Acer Chromebook Spin 713 CP713-3W-503Z
HP Envy 13-ba1013na: Intel Core i5-1135G7, 13.30", 1.3 kg
External Review » HP Envy 13-ba1013na
Asus ExpertBook B5 Flip B5302FEA: Intel Core i5-1135G7, 13.30", 1.3 kg
External Review » Asus ExpertBook B5 Flip B5302FEA
Asus VivoBook S14 S433EA-AM464T: Intel Core i5-1135G7, 14.00", 1.4 kg
External Review » Asus VivoBook S14 S433EA-AM464T
Asus VivoBook Flip 14 TP470EA-EC163T: Intel Core i5-1135G7, 14.00", 1.5 kg
External Review » Asus VivoBook Flip 14 TP470EA-EC163T
Acer Aspire Vero AV15-51-55CG: Intel Core i5-1155G7, 15.60", 1.8 kg
External Review » Acer Aspire Vero AV15-51-55CG
Alldocube iWork GT i5: Intel Core i5-1135G7, 10.95", 0.6 kg
External Review » Alldocube iWork GT i5
Asus Zenbook 17 Fold UX9702: Intel Core i7-1250U, 17.30", 1.8 kg
External Review » Asus Zenbook 17 Fold UX9702
Acer Aspire 5 A515-56-572C: Intel Core i5-1135G7, 15.60", 1.9 kg
External Review » Acer Aspire 5 A515-56-572C
VAIO SX14 VJS144X0711S: Intel Core i5-1155G7, 14.00", 1.1 kg
External Review » VAIO SX14 VJS144X0711S
Acer Swift 3 SF314-511-58NS: Intel Core i5-1135G7, 14.00", 1.2 kg
External Review » Acer Swift 3 SF314-511-58NS
HP 15-dy2024nr: Intel Core i5-1135G7, 15.60", 1.7 kg
External Review » HP 15-dy2024nr
HP Envy x360 15-ed1016ur: Intel Core i5-1135G7, 15.60", 1.9 kg
External Review » HP Envy x360 15-ed1016ur
Asus Chromebook Flip CX5 CX5500FEA-E60038: Intel Core i5-1135G7, 15.60", 2 kg
External Review » Asus Chromebook Flip CX5 CX5500FEA-E60038
Dell Latitude 15 3520-7D36T: Intel Core i5-1135G7, 15.60", 1.8 kg
External Review » Dell Latitude 15 3520-7D36T
Lenovo IdeaPad Flex 5 CB 13ITL6-82M70028GE: Intel Core i5-1135G7, 13.30", 1.6 kg
External Review » Lenovo IdeaPad Flex 5 CB 13ITL6-82M70028GE
Lenovo IdeaPad Slim 5 Pro 14ITL6-82L3009LIN: Intel Core i5-1135G7, 14.00", 1.4 kg
External Review » Lenovo IdeaPad Slim 5 Pro 14ITL6-82L3009LIN
Huawei MateBook 14s i5: Intel Core i5-11300H, 14.20", 1.4 kg
External Review » Huawei MateBook 14s i5
Acer Chromebook Spin 514 CP514-2H-56QM: Intel Core i5-1140G7, 14.00", 1.4 kg
External Review » Acer Chromebook Spin CP514-2H-56QM
Asus Chromebook CX9400, i5-1135G7: Intel Core i5-1135G7, 14.00", 1.1 kg
External Review » Asus Chromebook CX9400, i5-1135G7
HP Pavilion x360 15-er0155ng: Intel Core i5-1135G7, 15.60", 1.8 kg
External Review » HP Pavilion x360 15-er0155ng
Acer Aspire 5 A515-56-50RS: Intel Core i5-1135G7, 15.60", 1.7 kg
External Review » Acer Aspire 5 A515-56-50RS
Dell Inspiron 14 5410 2-in-1: Intel Core i5-1135G7, 14.00", 1.7 kg
External Review » Dell Inspiron 14 5410 2-in-1
HP Pavilion x360 14-dy0009ns: Intel Core i5-1135G7, 14.00", 1.6 kg
External Review » HP Pavilion x360 14-dy0009ns
Lenovo IdeaPad 3 17ITL6-82H9008UMH: Intel Core i5-1135G7, 17.30", 2.1 kg
External Review » Lenovo IdeaPad 3 17ITL6-82H9008UMH
HP Pavilion x360 14-dw1028ns: Intel Core i5-1135G7, 14.00", 1.6 kg
External Review » HP Pavilion x360 14-dw1028ns
Asus VivoBook 15 K513EA-L512TS: Intel Core i5-1135G7, 15.60", 1.8 kg
External Review » Asus VivoBook K513EA-L512TS
Getac S410 G4, 1135G7: Intel Core i5-1135G7, 14.00", 2.4 kg
External Review » Getac S410 G4, 1135G7
Lenovo ThinkPad X1 Titanium Yoga G1-20QB0016GE: Intel Core i5-1140G7, 13.50", 1.2 kg
External Review » Lenovo ThinkPad X1 Titanium Yoga G1-20QB0016GE
Dell Latitude 7320 Detachable 34TR3: Intel Core i5-1140G7, 13.00", 0.8 kg
External Review » Dell Latitude 7320 Detachable 34TR3
Fujitsu Stylistic Q7311, i5-1135G7: Intel Core i5-1135G7, 13.30", 0.8 kg
External Review » Fujitsu Stylistic Q7311, i5-1135G7
Lenovo Yoga Duet 7 13ITL6-82MA000QGE: Intel Core i5-1135G7, 13.00", 0.8 kg
External Review » Lenovo Yoga Duet 7 13ITL6-82MA000QGE
Asus VivoBook 14 X415, i5-1135G7: Intel Core i5-1135G7, 14.00", 1.6 kg
External Review » Asus VivoBook 14 X415, i5-1135G7
Dynabook Tecra A40-J-12E: Intel Core i5-1135G7, 14.00", 1.4 kg
External Review » Dynabook Tecra A40-J-12E
MSI Summit E13 Flip Evo A11MT-095: Intel Core i5-1135G7, 13.40", 1.4 kg
External Review » MSI Summit E13 Flip Evo A11MT-095
Realme Book Slim i5: Intel Core i5-1135G7, 14.00", 1.4 kg
External Review » realme Book Slim i5
Dell Inspiron 15 3501-PFV0X: Intel Core i5-1135G7, 15.60", 1.9 kg
External Review » Dell Inspiron 15 3501-PFV0X
LG Gram 14Z90P-G.AP55G: Intel Core i5-1135G7, 14.00", 1 kg
External Review » LG Gram 14Z90P-G.AP55G
Samsung Galaxy Book Pro 13 NP930XDB-KH1US: Intel Core i5-1135G7, 13.30", 0.9 kg
External Review » Samsung Galaxy Book Pro 13 NP930XDB-KH1US
Lenovo Yoga Slim 9 14ITL5-82D10044LT: Intel Core i5-1135G7, 14.00", 1.3 kg
External Review » Lenovo Yoga Slim 9 14ITL5-82D10044LT
Lenovo IdeaPad 3 14ITL6-82H7009FSP: Intel Core i5-1135G7, 14.00", 1.4 kg
External Review » Lenovo IdeaPad 3 14ITL6-82H7009FSP
Lenovo ThinkPad X1 Carbon G9-20XW0026GE: Intel Core i5-1135G7, 14.00", 1.1 kg
External Review » Lenovo ThinkPad X1 Carbon G9-20XW0026GE
HP 15s-fq2038ns: Intel Core i5-1135G7, 15.60", 1.7 kg
External Review » HP 15s-fq2038ns
HP Envy 13-ba1014ns: Intel Core i5-1135G7, 13.30", 1.3 kg
External Review » HP Envy 13-ba1014ns
Asus VivoBook 14 X413EA-EB070T: Intel Core i5-1135G7, 14.00", 1.5 kg
External Review » Asus VivoBook 14 X413EA-EB070T
Lenovo ThinkPad X13 G2-20WK00AHGE: Intel Core i5-1135G7, 13.30", 1.3 kg
External Review » Lenovo ThinkPad X13 G2-20WK00AHGE
Gateway GWTN141-10GR: Intel Core i5-1135G7, 14.10", 1.6 kg
External Review » Gateway GWTN141-10GR
Acer Aspire 5 A517-52-59SV: Intel Core i5-1135G7, 17.30", 2.6 kg
External Review » Acer Aspire 5 A517-52-59SV
Acer Swift 3 SF314-59-5021: Intel Core i5-1135G7, 14.00", 1.2 kg
External Review » Acer Swift 3 SF314-59-5021
Xiaomi RedmiBook Pro 15, i5-11300H iGPU: Intel Core i5-11300H, 15.60", 1.7 kg
External Review » Xiaomi RedmiBook Pro 15, i5-11300H iGPU
Asus ExpertBook B1 B1400CEAE, i5-1135G7: Intel Core i5-1135G7, 14.00", 1.5 kg
External Review » Asus ExpertBook B1 B1400CEAE, i5-1135G7
Lenovo ThinkPad T14 G2-20W00027US: Intel Core i5-1145G7, 14.00", 1.5 kg
External Review » Lenovo ThinkPad T14 G2-20W00027US
Dell Latitude 13 3320, i5-1135G7: Intel Core i5-1135G7, 13.30", 1.2 kg
External Review » Dell Latitude 13 3320, i5-1135G7
Dell Latitude 14 9420 2-in-1, i5-1135G7: Intel Core i5-1135G7, 14.00", 1.3 kg
External Review » Dell Latitude 14 9420 2-in-1, i5-1135G7
HP Pavilion x360 14-dw1024nr: Intel Core i5-1135G7, 14.00", 1.6 kg
External Review » HP Pavilion x360 14-dw1024nr
HP Pavilion 14-dv0007na: Intel Core i5-1135G7, 14.00", 1.4 kg
External Review » HP Pavilion 14-dv0007na
HP 15s-fq2005ns: Intel Core i5-1135G7, 15.60", 1.7 kg
External Review » HP 15s-fq2005ns
Acer Swift 3 SF316-51-51BS: Intel Core i5-11300H, 16.10", 1.8 kg
External Review » Acer Swift 3 SF316-51-51BS
Samsung Galaxy Book 15, i5-1135G7: Intel Core i5-1135G7, 15.60", 1.6 kg
External Review » Samsung Galaxy Book 15, i5-1135G7
Fujitsu Lifebook U7511, i5-1145G7: Intel Core i5-1145G7, 15.60", 1.5 kg
External Review » Fujitsu Lifebook U7511, i5-1145G7
HP 14s-dq2003ns: Intel Core i5-1135G7, 14.00", 1.5 kg
External Review » HP 14s-dq2003ns
Lenovo Yoga Duet 7 13IML05, i5-1135G7: Intel Core i5-1135G7, 13.00", 0.8 kg
External Review » Lenovo Yoga Duet 7 13IML05, i5-1135G7
Fujitsu Lifebook E5411, i5-1145G7: Intel Core i5-1145G7, 14.00", 1.8 kg
External Review » Fujitsu Lifebook E5411, i5-1145G7
Acer Swift 5 SF514-55T-5001: Intel Core i5-1135G7, 14.00", 1.1 kg
External Review » Acer Swift 5 SF514-55T-5001
Lenovo Yoga Slim 7 15ITL05-82AC002FGE: Intel Core i5-1135G7, 15.60", 1.9 kg
External Review » Lenovo Yoga Slim 7 15ITL05-82AC002FGE
Acer Swift 3X SF314-510G-55EP: Intel Core i5-1135G7, 14.00", 1.4 kg
External Review » Acer Swift 3X SF314-510G-55EP
Lenovo Yoga Slim 7 13ITL5-82CU002JGE: Intel Core i5-1135G7, 13.30", 1.2 kg
External Review » Lenovo Yoga Slim 7 13ITL5-82CU002JGE
Lenovo IdeaPad Flex 5 14ITL05-82HS004TGE: Intel Core i5-1135G7, 14.00", 1.5 kg
External Review » Lenovo IdeaPad Flex 5 14ITL05-82HS004TGE
Acer Chromebook 514 CB514-1WT-57YM: Intel Core i5-1135G7, 14.00", 1.4 kg
External Review » Acer Chromebook 514 CB514-1WT-57YM
VAIO SE14 NP14V3IN033P: Intel Core i5-1135G7, 14.00", 1.4 kg
External Review » VAIO SE14 NP14V3IN033P
Dynabook Portégé X30L-J-10G: Intel Core i5-1135G7, 13.30", 0.9 kg
External Review » Dynabook Portégé X30L-J-10G
HP Pavilion 14-dv0021ns: Intel Core i5-1135G7, 14.00", 1.4 kg
External Review » HP Pavilion 14-dv0021ns
HP 15s-fq2041ns: Intel Core i5-1135G7, 15.60", 1.7 kg
External Review » HP 15s-fq2041ns
Lenovo ThinkPad L13 Yoga Gen2-20VK000VGE: Intel Core i5-1135G7, 13.30", 1.5 kg
External Review » Lenovo ThinkPad L13 Yoga Gen2-20VK000VGE
Fujitsu Lifebook U7411, i5-1145G7: Intel Core i5-1145G7, 14.00", 1.2 kg
External Review » Fujitsu Lifebook U7411, i5-1145G7
Acer Swift 3X SF314-510G-52N1: Intel Core i5-1135G7, 14.00", 1.4 kg
External Review » Acer Swift 3X SF314-510G-52N1
Honor MagicBook 15 i5 1135G7: Intel Core i5-1135G7, 15.60", 1.5 kg
External Review » Honor MagicBook 15 i5 1135G7
Samsung Book 15 NP550XDA-KF2BR: Intel Core i5-1135G7, 15.60", 1.8 kg
External Review » Samsung Book 15 NP550XDA-KF2BR
Huawei MateBook 14 2021, i5-1135G7: Intel Core i5-1135G7, 14.00", 1.5 kg
External Review » Huawei MateBook 14 2021, i5-1135G7
HP Pavilion x360 14-dy0157ng: Intel Core i5-1135G7, 14.00", 1.5 kg
External Review » HP Pavilion x360 14-dy0157ng
Lenovo Yoga Slim 7 Carbon 13ITL5-82EV0048GE: Intel Core i5-1135G7, 13.30", 1 kg
External Review » Lenovo Yoga Slim 7 Carbon 13ITL5-82EV0048GE
Lenovo ThinkPad L13 Gen2-20VH0017GE: Intel Core i5-1135G7, 13.30", 1.4 kg
External Review » Lenovo ThinkPad L13 Gen2-20VH0017GE
Lenovo ThinkBook 13s G2 ITL-20V90003GE: Intel Core i5-1135G7, 13.30", 1.3 kg
External Review » Lenovo ThinkBook 13s G2 ITL-20V90003GE
HP Pavilion x360 14-dw1001ns: Intel Core i5-1135G7, 14.00", 1.6 kg
External Review » HP Pavilion x360 14-dw1001ns
HP 15-dy2021nr: Intel Core i5-1135G7, 15.60", 1.7 kg
External Review » HP 15-dy2021nr
HP Spectre x360 13-aw2003dx: Intel Core i5-1135G7, 13.30", 1.2 kg
External Review » HP Spectre x360 13-aw2003dx
Xiaomi RedmiBook Pro 14 2021, i5-1135G7: Intel Core i5-1135G7, 14.00", 1.5 kg
External Review » Xiaomi RedmiBook Pro 14 2021, i5-1135G7
Acer Chromebook Spin 713 CP713-3W-57R0: Intel Core i5-1135G7, 13.50", 1.4 kg
External Review » Acer Chromebook Spin 713 CP713-3W-57R0
HP Envy x360 13-bd0062TU: Intel Core i5-1135G7, 13.30", 1.3 kg
External Review » HP Envy x360 13-bd0062TU
Acer TravelMate Spin P4 TMP414RN-51-53J8: Intel Core i5-1135G7, 14.00", 1.4 kg
External Review » Acer TravelMate Spin P4 TMP414RN-51-53J8
HP Pavilion x360 14-dw1002ns: Intel Core i5-1135G7, 14.00", 1.6 kg
External Review » HP Pavilion x360 14-dw1002ns
HP Pavilion 14-dv0001ns: Intel Core i5-1135G7, 14.00", 1.4 kg
External Review » HP Pavilion 14-dv0001ns
HP Pavilion 13-bb0062tu: Intel Core i5-1135G7, 13.30", 1.2 kg
External Review » HP Pavilion 13-bb0062tu
Dynabook Portégé X30L-J-11J: Intel Core i5-1135G7, 13.30", 0.9 kg
External Review » Dynabook Portégé X30L-J-11J
Lenovo IdeaPad 3 15ITL6-82H800KDGE: Intel Core i5-1135G7, 15.60", 1.7 kg
External Review » Lenovo IdeaPad 3 15ITL6-82H800KDGE
HP 14s-dq2004ns: Intel Core i5-1135G7, 14.00", 1.5 kg
External Review » HP 14s-dq2004ns
Lenovo IdeaPad 3 15ITL6-82H800BXGE: Intel Core i5-1135G7, 15.60", 1.7 kg
External Review » Lenovo IdeaPad 3 15ITL6-82H800BXGE
HP Pavilion 15-eg0005ns: Intel Core i5-1135G7, 15.60", 1.8 kg
External Review » HP Pavilion 15-eg0005ns
Dell Inspiron 13 5301, i5-1135G7: Intel Core i5-1135G7, 13.30", 1.2 kg
External Review » Dell Inspiron 13 5301, i5-1135G7
Acer Aspire 5 A515-56-55LT: Intel Core i5-1135G7, 15.60", 1.7 kg
External Review » Acer Aspire 5 A515-56-55LT
Acer Aspire 5 A514-54-552U: Intel Core i5-1135G7, 14.00", 1.5 kg
External Review » Acer Aspire 5 A514-54-552U
Samsung Galaxy Book Pro 360 13: Intel Core i5-1135G7, 13.20", 1.1 kg
External Review » Samsung Galaxy Book Pro 360 13
Microsoft Surface Laptop 4 13 i5: Intel Core i5-1135G7, 13.50", 1.3 kg
External Review » Microsoft Surface Laptop 4 13 i5
MSI Modern 14 B11SB, i5-1135G7: Intel Core i5-1135G7, 14.00", 1.3 kg
External Review » MSI Modern 14 B11SB, i5-1135G7
Asus VivoBook S14 S435EA-HM003T: Intel Core i5-1135G7, 14.00", 1.3 kg
External Review » Asus VivoBook S14 S435EA-HM003T
Acer Spin 5 SP513-55N-53HZ: Intel Core i5-1135G7, 13.50", 1.2 kg
External Review » Acer Spin 5 SP513-55N-53HZ
HP Envy 13-ba1028TU: Intel Core i5-1135G7, 13.30", 1.2 kg
External Review » HP Envy 13-ba1028TU
Dell Latitude 13 5320, i5-1135G7: Intel Core i5-1135G7, 13.30", 1.2 kg
External Review » Dell Latitude 13 5320, i5-1135G7
Dell Latitude 15 5520, i5-1135G7: Intel Core i5-1135G7, 15.60", 1.6 kg
External Review » Dell Latitude 15 5520, i5-1135G7
HP Pavilion 13-bb0154ng: Intel Core i5-1135G7, 13.30", 1.2 kg
External Review » HP Pavilion 13-bb0154ng
Lenovo ThinkBook 13s-ITL-20V90003GE: Intel Core i5-1135G7, 13.30", 1.3 kg
External Review » Lenovo ThinkBook 13s-ITL-20V90003GE
Acer Swift 3 SF314-59-52Q3: Intel Core i5-1135G7, 14.00", 1.2 kg
External Review » Acer Swift 3 Infinity 3 SF314-59, i5-1135G7
Honor MagicBook 14, i5-1135G7: Intel Core i5-1135G7, 14.00", 1.4 kg
External Review » Honor MagicBook 14, i5-1135G7
Huawei MateBook D 15 2021, i5-1135G7: Intel Core i5-1135G7, 15.60", 1.5 kg
External Review » Huawei MateBook D 15 2021, i5-1135G7
HP Pavilion 14-dv0020ns: Intel Core i5-1135G7, 14.00", 1.4 kg
External Review » HP Pavilion 14-dv0020ns
Dell Latitude 13 5320, i5-1145G7: Intel Core i5-1145G7, 13.30", 1.2 kg
External Review » Dell Latitude 13 5320, i5-1145G7
Dell XPS 13 9310, i5-1135G7 FHD: Intel Core i5-1135G7, 13.40", 1.2 kg
External Review » Dell XPS 13 9310, i5-1135G7 FHD
Dell Latitude 13 7320 2-in-1, i5-1145G7: Intel Core i5-1145G7, 13.30", 1.4 kg
External Review » Dell Latitude 7320 2-in-1, i5-1145G7
Dell Vostro 14 5402, i5-1135G7: Intel Core i5-1135G7, 14.00", 1.4 kg
External Review » Dell Vostro 14 5402, i5-1135G7
Asus Zenbook Flip 13 UX363EA-EM087T: Intel Core i5-1135G7, 14.00", 1.3 kg
External Review » Asus Zenbook Flip 13 UX363EA-EM087T
HP 15s-fq2086ns: Intel Core i5-1135G7, 15.60"
External Review » HP 15s-fq2086ns
HP 14s-dq2012ns: Intel Core i5-1135G7, 14.00", 1.5 kg
External Review » HP 14s-dq2012ns
Acer Swift 5 SF514-55TA-574H: Intel Core i5-1135G7, 14.00", 1.1 kg
External Review » Acer Swift 5 SF514-55TA-574H
HP Pavilion 14-dv0000ns: Intel Core i5-1135G7, 14.00", 1.4 kg
External Review » HP Pavilion 14-dv0000ns
HP 15s-fq2087ns: Intel Core i5-1135G7, 15.60", 1.7 kg
External Review » HP 15s-fq2087ns
HP 15s-fq2000ns: Intel Core i5-1135G7, 15.60", 1.7 kg
External Review » HP 15s-fq2000ns
Lenovo ThinkBook 14 G2 ITL 20VD008WGE: Intel Core i5-1135G7, 14.00", 1.5 kg
External Review » Lenovo ThinkBook 14 G2 ITL 20VD008WGE
MSI Modern 15 A11M-007NE: Intel Core i5-1135G7, 15.60", 1.6 kg
External Review » MSI Modern 15 A11M-007NE
HP 15s-fq2091ns: Intel Core i5-1135G7, 15.60", 1.7 kg
External Review » HP 15s-fq2091ns
HP 15s-fq2007ns: Intel Core i5-1135G7, 15.60", 1.7 kg
External Review » HP 15s-fq2007ns
HP 15s-fq2002ns: Intel Core i5-1135G7, 15.60", 1.7 kg
External Review » HP 15s-fq2002ns
Dell Latitude 13 7320, i5-1135G7: Intel Core i5-1135G7, 13.30", 1.1 kg
External Review » Dell Latitude 7320, i5-1135G7
Lenovo ThinkBook 14s Yoga ITL, i5-1135G7: Intel Core i5-1135G7, 14.00", 1.5 kg
External Review » Lenovo ThinkBook 14s Yoga ITL, i5-1135G7
MSI Modern 15 A11M, i5-1135G7: Intel Core i5-1135G7, 15.60", 1.6 kg
External Review » MSI Modern 15 A11M, i5-1135G7
Dell Inspiron 15 7506 2-in-1 P97F: Intel Core i5-1135G7, 15.60", 1.8 kg
External Review » Dell Inspiron 15 7506 2-in-1 P97F
Acer Swift 5 SF514-55T-58DN: Intel Core i5-1135G7, 14.00", 1 kg
External Review » Acer Swift 5 SF514-55T-58DN
Dynabook Portégé X30W-J-10H: Intel Core i5-1135G7, 13.30", 1 kg
External Review » Dynabook Portégé X30W-J-10H
Lenovo ThinkPad E15 Gen2-20TD0003GE: Intel Core i5-1135G7, 15.60", 1.7 kg
External Review » Lenovo ThinkPad E15 Gen2-20TD0003GE
HP 15s-fq2009ns: Intel Core i5-1135G7, 15.60", 1.7 kg
External Review » HP 15s-fq2009ns
Microsoft Surface Pro 7 Plus: Intel Core i5-1135G7, 12.30", 0.8 kg
External Review » Microsoft Surface Pro 7 Plus
HP 15s-fq2013ns: Intel Core i5-1135G7, 15.60", 1.7 kg
External Review » HP 15s-fq2013ns
Microsoft Surface Pro 7+ 3BQ-00003: Intel Core i5-1135G7, 12.30", 0.8 kg
External Review » Microsoft Surface Pro 7+ 3BQ-00003
HP EliteBook 840 Aero G8: Intel Core i5-1135G7, 14.00", 1.2 kg
External Review » HP EliteBook 840 Aero G8
HP 15s-fq2004ns: Intel Core i5-1135G7, 15.60", 1.7 kg
External Review » HP 15s-fq2004ns
HP 14s-dq2006ns: Intel Core i5-1135G7, 14.00", 1.5 kg
External Review » HP 14s-dq2006ns
Medion Akoya S15449 MD61991: Intel Core i5-1135G7, 15.60", 1.8 kg
External Review » Medion Akoya S15449 MD61991
HP ProBook 450 G8, i5-1135G7: Intel Core i5-1135G7, 15.60", 1.7 kg
External Review » HP ProBook 450 G8, i5-1135G7
HP Envy 13-ba1018ns : Intel Core i5-1135G7, 13.30", 1.3 kg
External Review » HP Envy 13-ba1018ns
HP 15s-fq2008ns: Intel Core i5-1135G7, 15.60", 1.7 kg
External Review » HP 15s-fq2008ns
Asus Zenbook Flip S UX371EA-HL144R: Intel Core i5-1135G7, 13.30", 1.2 kg
External Review » Asus Zenbook Flip S UX371EA-HL144R
Lenovo IdeaPad 5 15ITL05-82FG00B0GE: Intel Core i5-1135G7, 15.60", 1.7 kg
External Review » Lenovo IdeaPad 5 15ITL05-82FG00B0GE
Dell XPS 13 9310 2-in-1, i5-1135G7: Intel Core i5-1135G7, 13.40", 1.3 kg
External Review » Dell XPS 13 9310 2-in-1, i5-1135G7
Acer Swift 3 Air 3: Intel Core i5-1135G7, 13.50", 1.2 kg
External Review » Acer Swift 3 Air 3
Lenovo Yoga Slim 7 14ITL05, i5-1135G7: Intel Core i5-1135G7, 14.00", 1.4 kg
External Review » Lenovo Yoga Slim 7 14ITL05, i5-1135G7
Fujitsu UH-X, i5: Intel Core i5-1135G7, 13.30", 0.7 kg
External Review » Fujitsu UH-X
HP Pavilion 15-eg0656ng: Intel Core i5-1135G7, 15.60", 1.8 kg
External Review » HP Pavilion 15-eg0656ng
HP ProBook 650 G8, i5-1135G7: Intel Core i5-1135G7, 15.60", 1.7 kg
External Review » HP ProBook 650 G8, i5-1135G7
Asus VivoBook Flip 14 TP470EA-EC033T: Intel Core i5-1135G7, 14.00", 1.5 kg
External Review » Asus VivoBook Flip 14 TP470EA-EC033T
Lenovo ThinkPad E14 Gen2-20TA004FUS: Intel Core i5-1135G7, 14.00", 1.6 kg
External Review » Lenovo ThinkPad E14 Gen2-20TA004FUS
Acer Book RS Porsche Design AP714-51T-59ZV: Intel Core i5-1135G7, 14.00", 1.3 kg
External Review » Acer Book RS Porsche Design AP714-51T-59ZV
Asus Vivobook Flip 14 TP470EA-EC029TS: Intel Core i5-1135G7, 14.00", 1.5 kg
External Review » Asus Vivobook Flip 14 TP470EA-EC029TS
HP Pavilion 14-dv0301ng: Intel Core i5-1135G7, 14.00", 1.4 kg
External Review » HP Pavilion 14-dv0301ng
Lenovo Yoga 7 14ITL5: Intel Core i5-1135G7, 14.00", 1.5 kg
External Review » Lenovo Yoga 7 14ITL5
Acer Aspire 5 A514-54-59BP: Intel Core i5-1135G7, 14.00", 1.6 kg
External Review » Acer Aspire 5 A514-54-59BP
Asus VivoBook S14 S433EA-EB043T: Intel Core i5-1135G7, 14.00", 1.4 kg
External Review » Asus VivoBook S14 S433EA-EB043T
Asus ZenBook 13 UX325EA, i5-1135G7: Intel Core i5-1135G7, 13.30", 1.1 kg
External Review » Asus ZenBook 13 UX325EA, i5-1135G7
Lenovo IdeaPad Slim 5 15, i5-1135G7: Intel Core i5-1135G7, 15.60", 1.7 kg
External Review » Lenovo IdeaPad Slim 5 15, i5-1135G7
Acer Aspire 5 A514-54-55X7: Intel Core i5-1135G7, 14.00", 1.7 kg
External Review » Acer Aspire 5 A514-54-55X7
Medion Akoya S15449 MD61865: Intel Core i5-1135G7, 15.60", 1.8 kg
External Review » Medion Akoya S15449 MD61865
Acer Swift 5 SF514-55TA-57P3: Intel Core i5-1135G7, 14.00", 1.1 kg
External Review » Acer Swift 5 SF514-55TA-57P3
Acer Aspire 5 A515-56-51P5: Intel Core i5-1135G7, 15.60", 1.9 kg
External Review » Acer Aspire 5 A515-56-51P5
Asus ZenBook 14 UX435EA: Intel Core i5-1135G7, 14.00", 1.3 kg
External Review » Asus ZenBook 14 UX435EA
Asus ZenBook 14 UX425EA-HM038T: Intel Core i5-1135G7, 14.00", 1.4 kg
External Review » Asus ZenBook 14 UX425EA-HM038T
Lenovo Yoga 9i 14ITL5: Intel Core i5-1135G7, 14.00", 1.4 kg
External Review » Lenovo Yoga 9i 14ITL5
Asus Vivobook 15 K513EQ, i5-1135G7: Intel Core i5-1135G7, 15.60", 1.8 kg
External Review » Asus Vivobook 15 K513, i5-1135G7
Acer Swift 3 SF314-59-52A6 silber: Intel Core i5-1135G7, 14.00"
External Review » Acer Swift 3 SF314-59-52A6 silber
Asus Zenbook Flip 13 UX363EA-EM179R: Intel Core i5-1135G7, 13.30", 1.3 kg
External Review » Asus Zenbook Flip 13 UX363EA-EM179R
Acer Book RS Porsche Design AP714-51T-57D6: Intel Core i5-1135G7, 14.00", 1.3 kg
External Review » Acer Book RS Porsche Design AP714-51T-57D6
Asus Zenbook Flip 13 UX363EA-EM111T: Intel Core i5-1135G7, 13.30", 1.3 kg
External Review » Asus Zenbook Flip 13 UX363EA-EM111T
Asus VivoBook 15 S513EA-EJ118T: Intel Core i5-1135G7, 15.60", 1.7 kg
External Review » Asus VivoBook 15 S513EA-EJ118T
Acer Aspire 5 A515-56-511A: Intel Core i5-1135G7, 15.60", 1.9 kg
External Review » Acer Aspire 5 A515-56-511A
Acer Swift 3 SF314-59-74VC: Intel Core i5-1135G7, 14.00", 1.2 kg
External Review » Acer Swift 3 SF314-59-74VC
Schenker Connect 15 (E26): Intel Core 5 120U, 15.60", 1.9 kg
» Niche feature: SD card readers in business laptops are essential for some, irrelevant for most
» Schenker Connect 15: 48 W sustained power draw measured – is the 45 W power adapter too weak?
» Intel Core 5 120U compared: Schenker Connect 15 vs. Lenovo IdeaPad Slim 3i in a gaming benchmark test
» Wi-Fi 7 in the Schenker Connect 15: 3,500 Mbps - but what does that actually bring to day-to-day business use?
» USB-C or barrel connector? Why some laptops in 2026 still rely on two charging ports
» Office laptops 2026 compared: this should be the standard battery life today
» Why almost every laptop is missing this practical feature
» This business laptop is enterprise through and through on paper – and a compromise in reality?
» Schenker Connect 15 price check: How quickly €1,000 turns into a €1,600 laptop
Acer Aspire Go AG15-51P-56UR: Intel Core i5-1334U, 15.30", 1.7 kg
» End of Windows 10 support: Acer Aspire Go 15 may be a cheap alternative for some
Acer Swift Go 14 SFG14-71: Intel Core i5-1335U, 14.00", 1.3 kg
» Acer Swift Go 14 OLED price dips to historic low again as Meteor Lake laptop records 20% discount
Lenovo Thinkpad X1 Carbon G10, i5-1235U: Intel Core i5-1235U, 14.00", 1.1 kg
» Lenovo ThinkPad X1 Carbon Gen 10 with 32GB memory is now extremely cheap in refurbished laptop sale
Lenovo ThinkPad X1 Yoga G8, i5-1345U: Intel Core i5-1345U, 14.00", 1.4 kg
» Lenovo ThinkPad X1 Yoga Gen 8 with 32GB RAM gets big price cut in latest refurbished laptop sale
Microsoft Surface Pro 9, i5-1235U: Intel Core i5-1235U, 13.00", 0.9 kg
» BestBuy clears out Surface Pro 9 with i5 CPU, 8GB RAM, 256GB SSD at $330 off MSRP
Lenovo ThinkPad L13 Yoga Gen2-20VK000VGE: Intel Core i5-1135G7, 13.30", 1.5 kg
» Compact Lenovo ThinkPad L13 Yoga convertible laptop with 16GB RAM now on sale for $449
Dell XPS 13 9315, i5-1230U: Intel Core i5-1230U, 13.40", 1.2 kg
» Dell XPS 13 laptop with Core i7, 32GB RAM and 1TB SSD is 39% off right now
Lenovo ThinkPad L14 G3 21C1003AGE: Intel Core i5-1235U, 14.00", 1.4 kg
» Lenovo ThinkPad L14 Gen 3 laptop with upgradable 16GB RAM is 67% off right now
Lenovo ThinkPad T14 G4 21HD0043GE: Intel Core i5-1335U, 14.00", 1.4 kg
» ThinkPad T14 Gen 4 laptop drops to $563 in Lenovo's intriguing outlet sale
HP EliteBook x360 830 G10 7L7U1ET: Intel Core i5-1335U, 13.30", 1.3 kg
» EliteBook x360 830 G10: Great convertible for business customers
Lenovo ThinkPad E16 G1 Core i5-1335U: Intel Core i5-1335U, 16.00", 1.8 kg
» Lenovo ThinkPad E16 laptop with AMD Ryzen 5 7530U and 24GB RAM marked down by 45%
Dell XPS 13 9315, i5-1230U: Intel Core i5-1230U, 13.40", 1.2 kg
» Sleek Dell XPS 13 laptop with 32GB RAM and Core i7 now discounted by 26%
Lenovo ThinkPad X1 Carbon G10 21CC001RGE: Intel Core i5-1250P, 14.00", 1.2 kg
» ThinkPad X1 Carbon with Core i5-1240P and 16GB RAM is just $639 in Lenovo's refurbished business laptop sale
Acer Aspire Vero AV15-53P-59MT: Intel Core i5-1335U, 15.60", 1.7 kg
» Acer Aspire Vero 15 review: The sustainable waste-laptop with a QHD webcam surpasses all expectations
Microsoft Surface Pro 9, i5-1245U: Intel Core i5-1245U, 13.00", 0.9 kg
» Microsoft Surface Pro 9 Windows tablet with Core i5 and 16GB RAM now on sale for 35% off
Acer Swift Go 14 SFG14-71: Intel Core i5-1335U, 14.00", 1.3 kg
» MacBook Air Acer-style with OLED, USB 4 and a moderate price
Lenovo ThinkPad X13 Yoga G4 21F20017GE: Intel Core i5-1335U, 13.30", 1.3 kg
» Lenovo ThinkPad X13 Yoga G4: ThinkPads should utilize magnesium more
Lenovo ThinkPad L13 Yoga Gen2-20VK000VGE: Intel Core i5-1135G7, 13.30", 1.5 kg
» ThinkPad L13 Yoga convertible massively discounted in Lenovo's latest laptop sale
Lenovo ThinkPad T14 G4 21HD0043GE: Intel Core i5-1335U, 14.00", 1.4 kg
» Lenovo ThinkPad T14 Gen 4: Intel version without performance punch
HP EliteBook 1040 G10 818N7EA: Intel Core i5-1335U, 14.00", 1.3 kg
» HP's EliteBook 1040 G10 shows weaknesses in the display and fan management
Dell XPS 13 9315, i5-1230U: Intel Core i5-1230U, 13.40", 1.2 kg
» Dell XPS 13 laptop with Core i7 and 16GB RAM now on sale with significant 32% discount
Dell Latitude 7440: Intel Core i5-1345U, 14.00", 1.2 kg
» Dell Latitude 7440 is arguably easier to use than the more expensive Latitude 9440
Lenovo ThinkPad X1 Titanium Yoga G1 20QB0016GE: Intel Core i5-1140G7, 13.50", 1.2 kg
» Lenovo ThinkPad X1 Titanium Yoga convertible with bright QHD display gets substantial discount
Microsoft Surface Pro 9, i5-1235U: Intel Core i5-1235U, 13.00", 0.9 kg
» Microsoft Surface Pro 9 Windows tablet with 120Hz QHD display falls to lowest price ever on Amazon
Dell XPS 13 9315 2-in-1 Core i5-1230U: Intel Core i5-1230U, 13.00", 0.8 kg
» Ultraportable Dell XPS 13 9315 with Core i7-1250U CPU and 16 GB of DDR5 memory gets a respectable 20% discount
Dell XPS 13 9315, i5-1230U: Intel Core i5-1230U, 13.40", 1.2 kg
» Ultraportable Dell XPS 13 9315 with Core i7-1250U CPU and 16 GB of DDR5 memory gets a respectable 20% discount
Lenovo ThinkPad L14 G2-20X1003WGE: Intel Core i5-1135G7, 14.00", 1.7 kg
» Lenovo ThinkPad L14 Gen 2 with Core i5 and 16GB RAM now 72% off in clearance sale
Samsung Galaxy Book3 Pro 16: Intel Core i5-1340P, 16.00", 1.6 kg
» Samsung Galaxy Book3 Pro 16: 16-inch laptop with a long battery life and meager storage equipment
Huawei MateBook D 14 2023, 53013PKG: Intel Core i5-1155G7, 14.00", 1.4 kg
» Huawei MateBook D 14 reviewed: Quiet office laptop with long battery life in a unibody design
Huawei MateBook D 14 (2021): Intel Core i5-1135G7, 14.00", 1.4 kg
» Huawei MateBook D 14: Elegant 14-inch laptop with a very good battery life
Lenovo IdeaPad Gaming Chromebook 16: Intel Core i5-1235U, 16.00", 1.8 kg
» The Lenovo IdeaPad Gaming Chromebook 16 is now shipping, but one of its best features is still not OS wide
Lenovo ThinkPad T14s G3 21BR00CDGE: Intel Core i5-1235U, 14.00", 1.3 kg
» Lenovo ThinkPad T14s G3 Intel reviewed: quiet mobile companion with great performance
Acer Swift 3 SF314-71-56U3: Intel Core i5-12500H, 14.00", 1.4 kg
» Acer Swift 3 SF314 shines with a 2.8K OLED display and a powerful CPU in our review, but...
Asus Zenbook 17 Fold UX9702: Intel Core i7-1250U, 17.30", 1.8 kg
» The Asus Zenbook 17 Fold OLED is an incredibly exciting, but expensive convertible
Lenovo ThinkPad T16 G1 21BWS00200: Intel Core i5-1240P, 16.00", 1.9 kg
» Lenovo ThinkPad T16 G1 Intel: Much is new in the 16 incher with long battery runtimes
Lenovo IdeaPad Flex 5i 14IAU7: Intel Core i5-1235U, 14.00", 1.6 kg
» The Core i5-1235U had a terrible launch until the Lenovo IdeaPad Flex i5 14 saved it
LG Gram 17 (2022): Intel Core i5-1240P, 17.00", 1.4 kg
» LG Gram 17 (2022): Finally available with a matte display
Microsoft Surface Laptop Go 2 Core i5: Intel Core i5-1135G7, 12.40", 1.1 kg
» The compact Surface Laptop Go 2 from Microsoft needs a keyboard illumination
Dell XPS 13 Plus 9320 i5-1240p: Intel Core i5-1240P, 13.40", 1.2 kg
» The Core-i5 XPS Plus is 18% slower than the i7 variant
Dell XPS 13 9315, i5-1230U: Intel Core i5-1230U, 13.40", 1.2 kg
» The Dell XPS 13 (9315) launches with a very lightweight chassis and 4K 16:10 touchscreen
VAIO FE 14.1 VWNC51429-SL: Intel Core i5-1235U, 14.10", 1.6 kg
» 2022 Vaio FE 14 is new on the inside but old on the outside
Lenovo ThinkPad X1 Carbon G10 21CC001RGE: Intel Core i5-1250P, 14.00", 1.2 kg
» ThinkPad X1 Carbon Gen 10: Lenovo should not use Alder Lake P28
Lenovo Yoga Slim 7i Pro 14IAP G7: Intel Core i5-1240P, 14.00", 1.3 kg
» The Lenovo Yoga Slim 7i Pro with its 12-core Alder Charge CPU performs well under testing in many respects, but cuts back in the wrong place.
Samsung Galaxy Book2 Pro 13 NP930XED-KA1DE: Intel Core i5-1240P, 13.30", 0.9 kg
» Ultra-compact and bright: Samsung Galaxy Book2 Pro 13 with Alder Lake and OLED in review
Dell Latitude 7420 JW6MH: Intel Core i5-1145G7, 14.00", 1.3 kg
» Not Maximally Fast but Maximally Secure: Dell Latitude 7420 Review
VAIO SX12 VJS124X1011P: Intel Core i5-1155G7, 12.50", 0.9 kg
» Intel Core i5-1155G7 outperforms the Core i7-1165G7: 12-inch Vaio SX12 comes with the performance of a 15-inch Ultrabook
Huawei MateBook E Core i5: Intel Core i5-1130G7, 12.60", 0.7 kg
» The new Huawei MateBook E is an interesting, but also expensive Windows OLED Tablet
Acer Swift 3 SF314-511-54ZK: Intel Core i5-1135G7, 14.00", 1.2 kg
» The Acer Swift 3 SF314 excels in our review in all disciplines
Acer TravelMate P4 TMP414-51-59MR: Intel Core i5-1135G7, 14.00", 1.4 kg
» Acer TravelMate P4: Compact 14-inch laptop supports Power Delivery
Dell Latitude 14 5420-D2G5W: Intel Core i5-1135G7, 14.00", 1.5 kg
» Excellent Core i5, terrible clickpad: Dell Latitude 14 5420 review
Dell Inspiron 15 3000 3511: Intel Core i5-1135G7, 15.60", 1.7 kg
» We love how quick and easy it is to add RAM and storage to the Dell Inspiron 15 3511
HP Pavilion 14-dv0357ng: Intel Core i5-1135G7, 14.00", 1.4 kg
» The HP Pavilion 14 is slow to win you over
Beelink GTI 11: Intel Core i5-1135G7, 0.6 kg
» Beelink GTI 11 mini PC hits Intel NUC where it hurts: Price
Gateway GWTN141-10GR: Intel Core i5-1135G7, 14.10", 1.6 kg
» Walmart's newest $500 Gateway laptop is a step in the right direction for affordable models
LG Gram 17Z90P-G.AA56G: Intel Core i5-1135G7, 17.00", 1.4 kg
» The new LG Gram 17: a high performance but too flexible
Fujitsu LifeBook U7311 i5: Intel Core i5-1135G7, 13.30", 1.2 kg
» Fujitsu LifeBook U7311: The classic notebook
HP Pavilion x360 14-dy0157ng: Intel Core i5-1135G7, 14.00", 1.5 kg
» HP Pavilion x360 14 (2021) 2-in-1 Laptop: Good battery life, dim display
Dell Inspiron 13 5301-0D0XN: Intel Core i5-1135G7, 13.30", 1.1 kg
» Dell Inspiron 13 5301: The subnotebook is stylish, but it shows a couple of shortcomings in the test
HP Pavilion x360 15-er0155ng: Intel Core i5-1135G7, 15.60", 1.8 kg
» The HP Pavilion x360 15 comes with slow Wi-Fi
HP Spectre x360 13-aw2003dx: Intel Core i5-1135G7, 13.30", 1.2 kg
» HP Spectre x360 13 OLED battery life is significantly shorter than the IPS option by several hours
Dell XPS 13 9305 Core i5 FHD: Intel Core i5-1135G7, 13.30", 1.2 kg
» Dell XPS 13 9305 in review: Worthwhile entry into the XPS universe
Lenovo ThinkPad L13 Yoga Gen2-20VK000VGE: Intel Core i5-1135G7, 13.30", 1.5 kg
» The ThinkPad L13 Yoga Gen 2 business convertible comes with Tiger Lake and Thunderbolt 4
Lenovo ThinkBook 15 Gen2 ITL: Intel Core i5-1135G7, 15.60", 1.8 kg
» Lenovo ThinkBook 15 G2: Affordable office laptop with Tiger Lake CPU
Intel NUC11TNKi5: Intel Core i5-1135G7, 0.5 kg
» Intel NUC11TNK with Core i5 now shipping for $579 USD with no RAM, OS, or storage
Lenovo ThinkBook 14 G2 ITL 20VD008WGE: Intel Core i5-1135G7, 14.00", 1.5 kg
» The Lenovo ThinkBook 14 G2 is interesting because of its SD card reader
Acer Swift 5 SF514-55T-58DN: Intel Core i5-1135G7, 14.00", 1 kg
» Acer Swift 5 SF514: Intel's Evo label ensures good laptops
Acer Aspire 5 A515-56-511A: Intel Core i5-1135G7, 15.60", 1.9 kg
» Acer Aspire 5 with Tiger Lake: A notebook like many others
Lenovo ThinkPad L13 Gen2-20VH0017GE: Intel Core i5-1135G7, 13.30", 1.4 kg
» The ThinkPad L13 Gen 2 convinces in the test with an excellent keyboard and Thunderbolt 4
GPD Win 3: Intel Core i5-1135G7, 5.50", 0.6 kg
» The GPD Win 3 is two times more expensive than a Playstation 5. Is it really worth it?
Lenovo ThinkBook 13s-ITL-20V90003GE: Intel Core i5-1135G7, 13.30", 1.3 kg
» Lenovo ThinkBook 13s: More battery life, less flexibility
Lenovo Yoga 7 14ITL5: Intel Core i5-1135G7, 14.00", 1.5 kg
» Lenovo Yoga 7i Core i5-1135G7 CPU is on par with the Core i7-1165G7, but its Iris Xe graphics is way behind