Lenovo ThinkBook Plus Gen2 in review: E-ink laptop with touchscreen

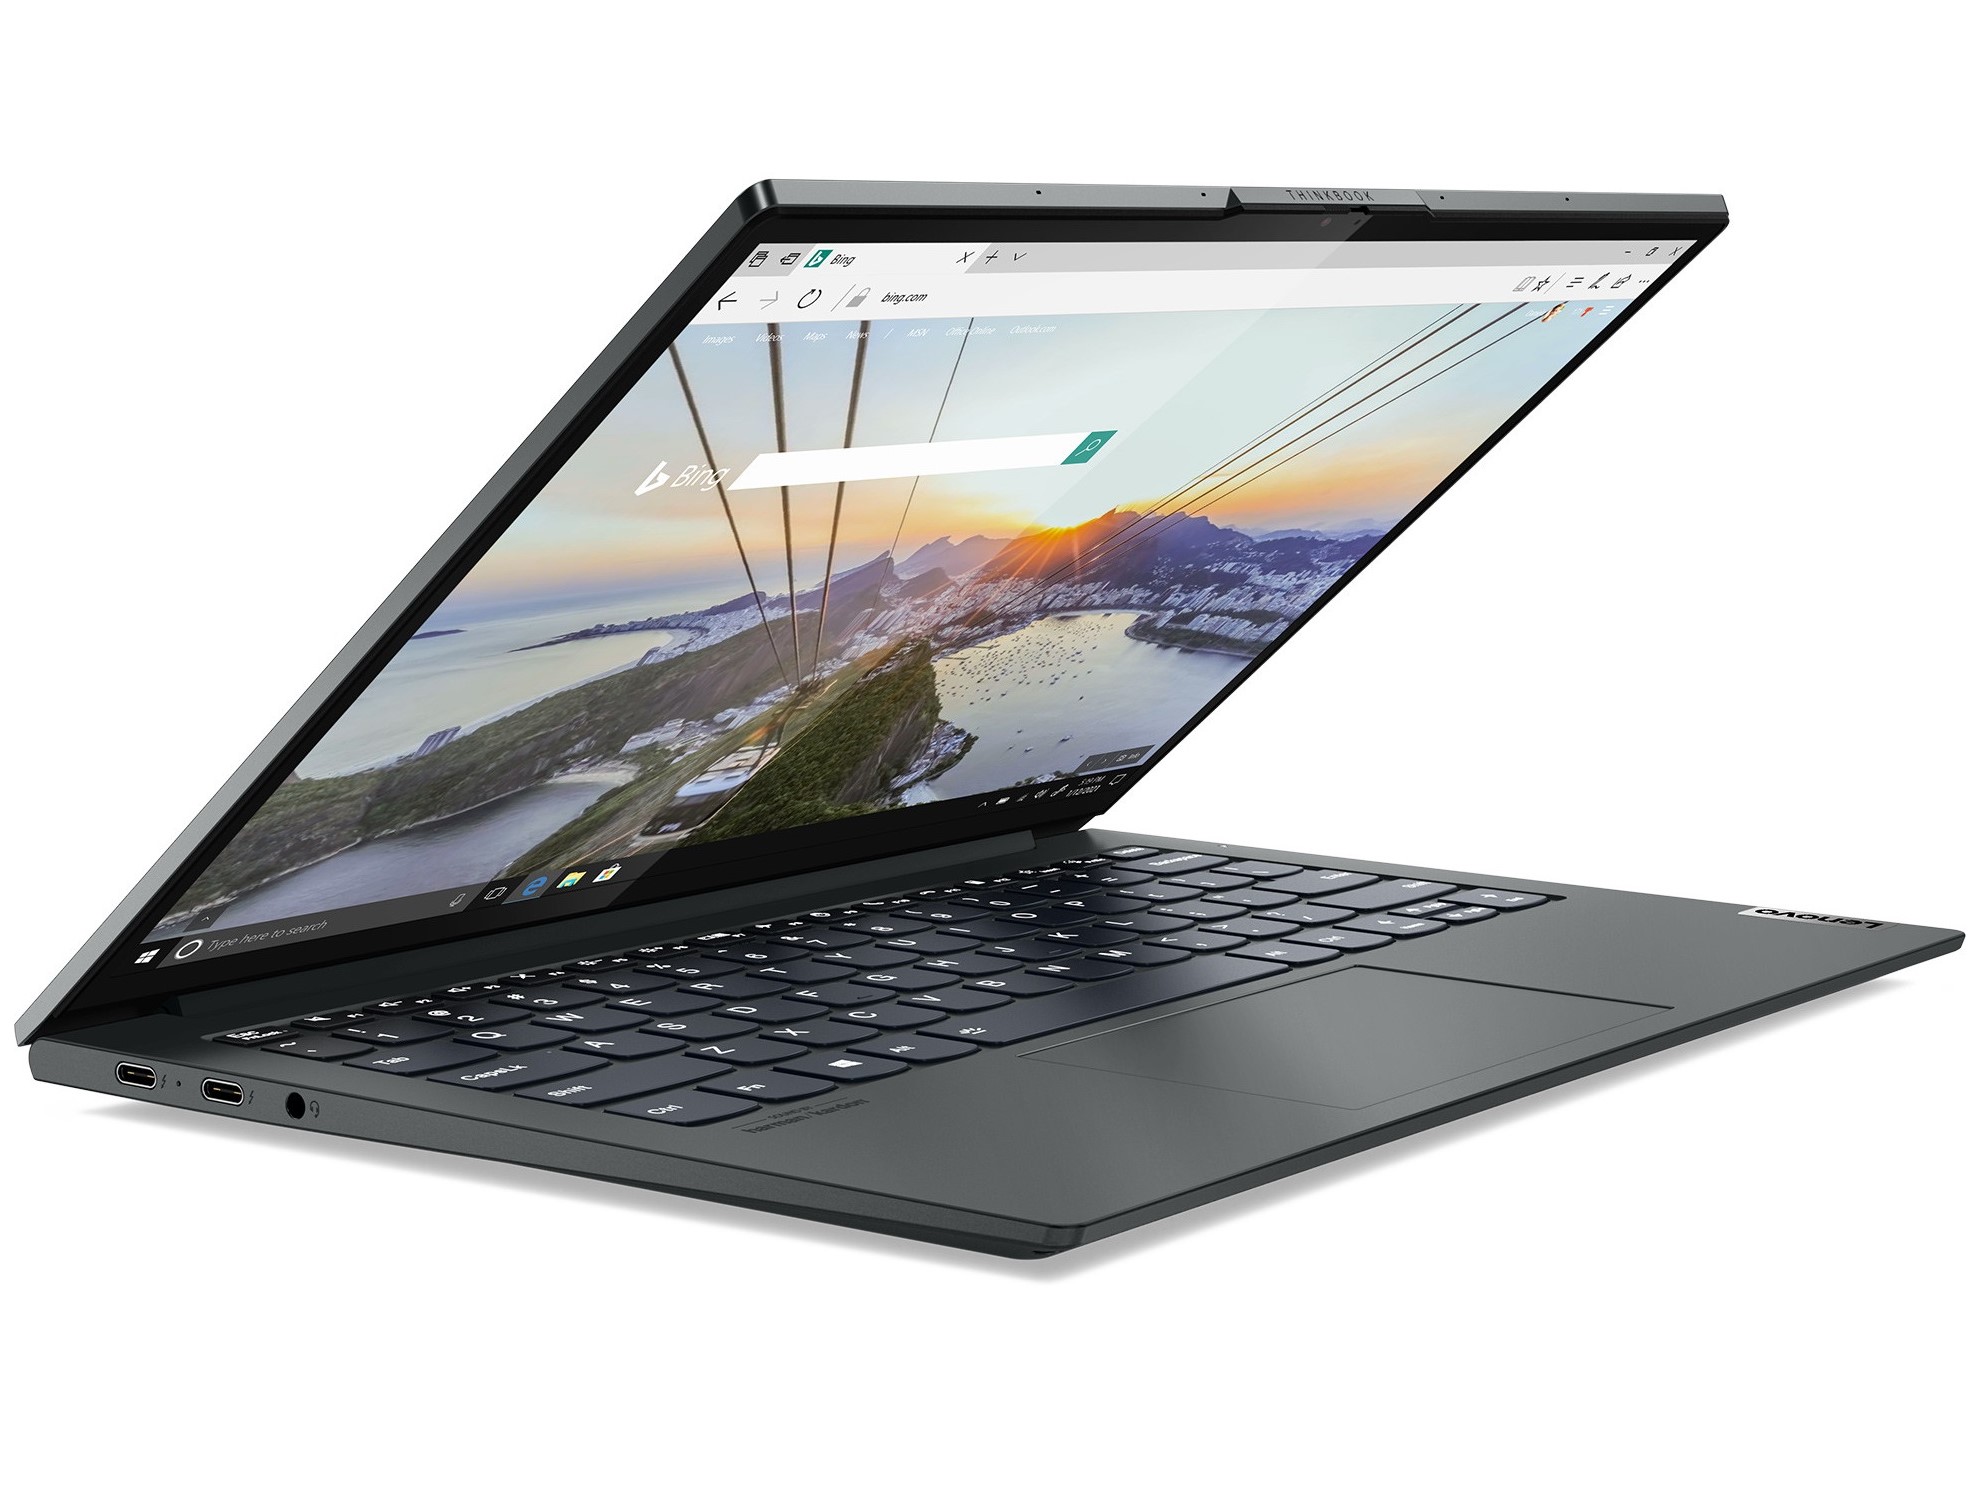
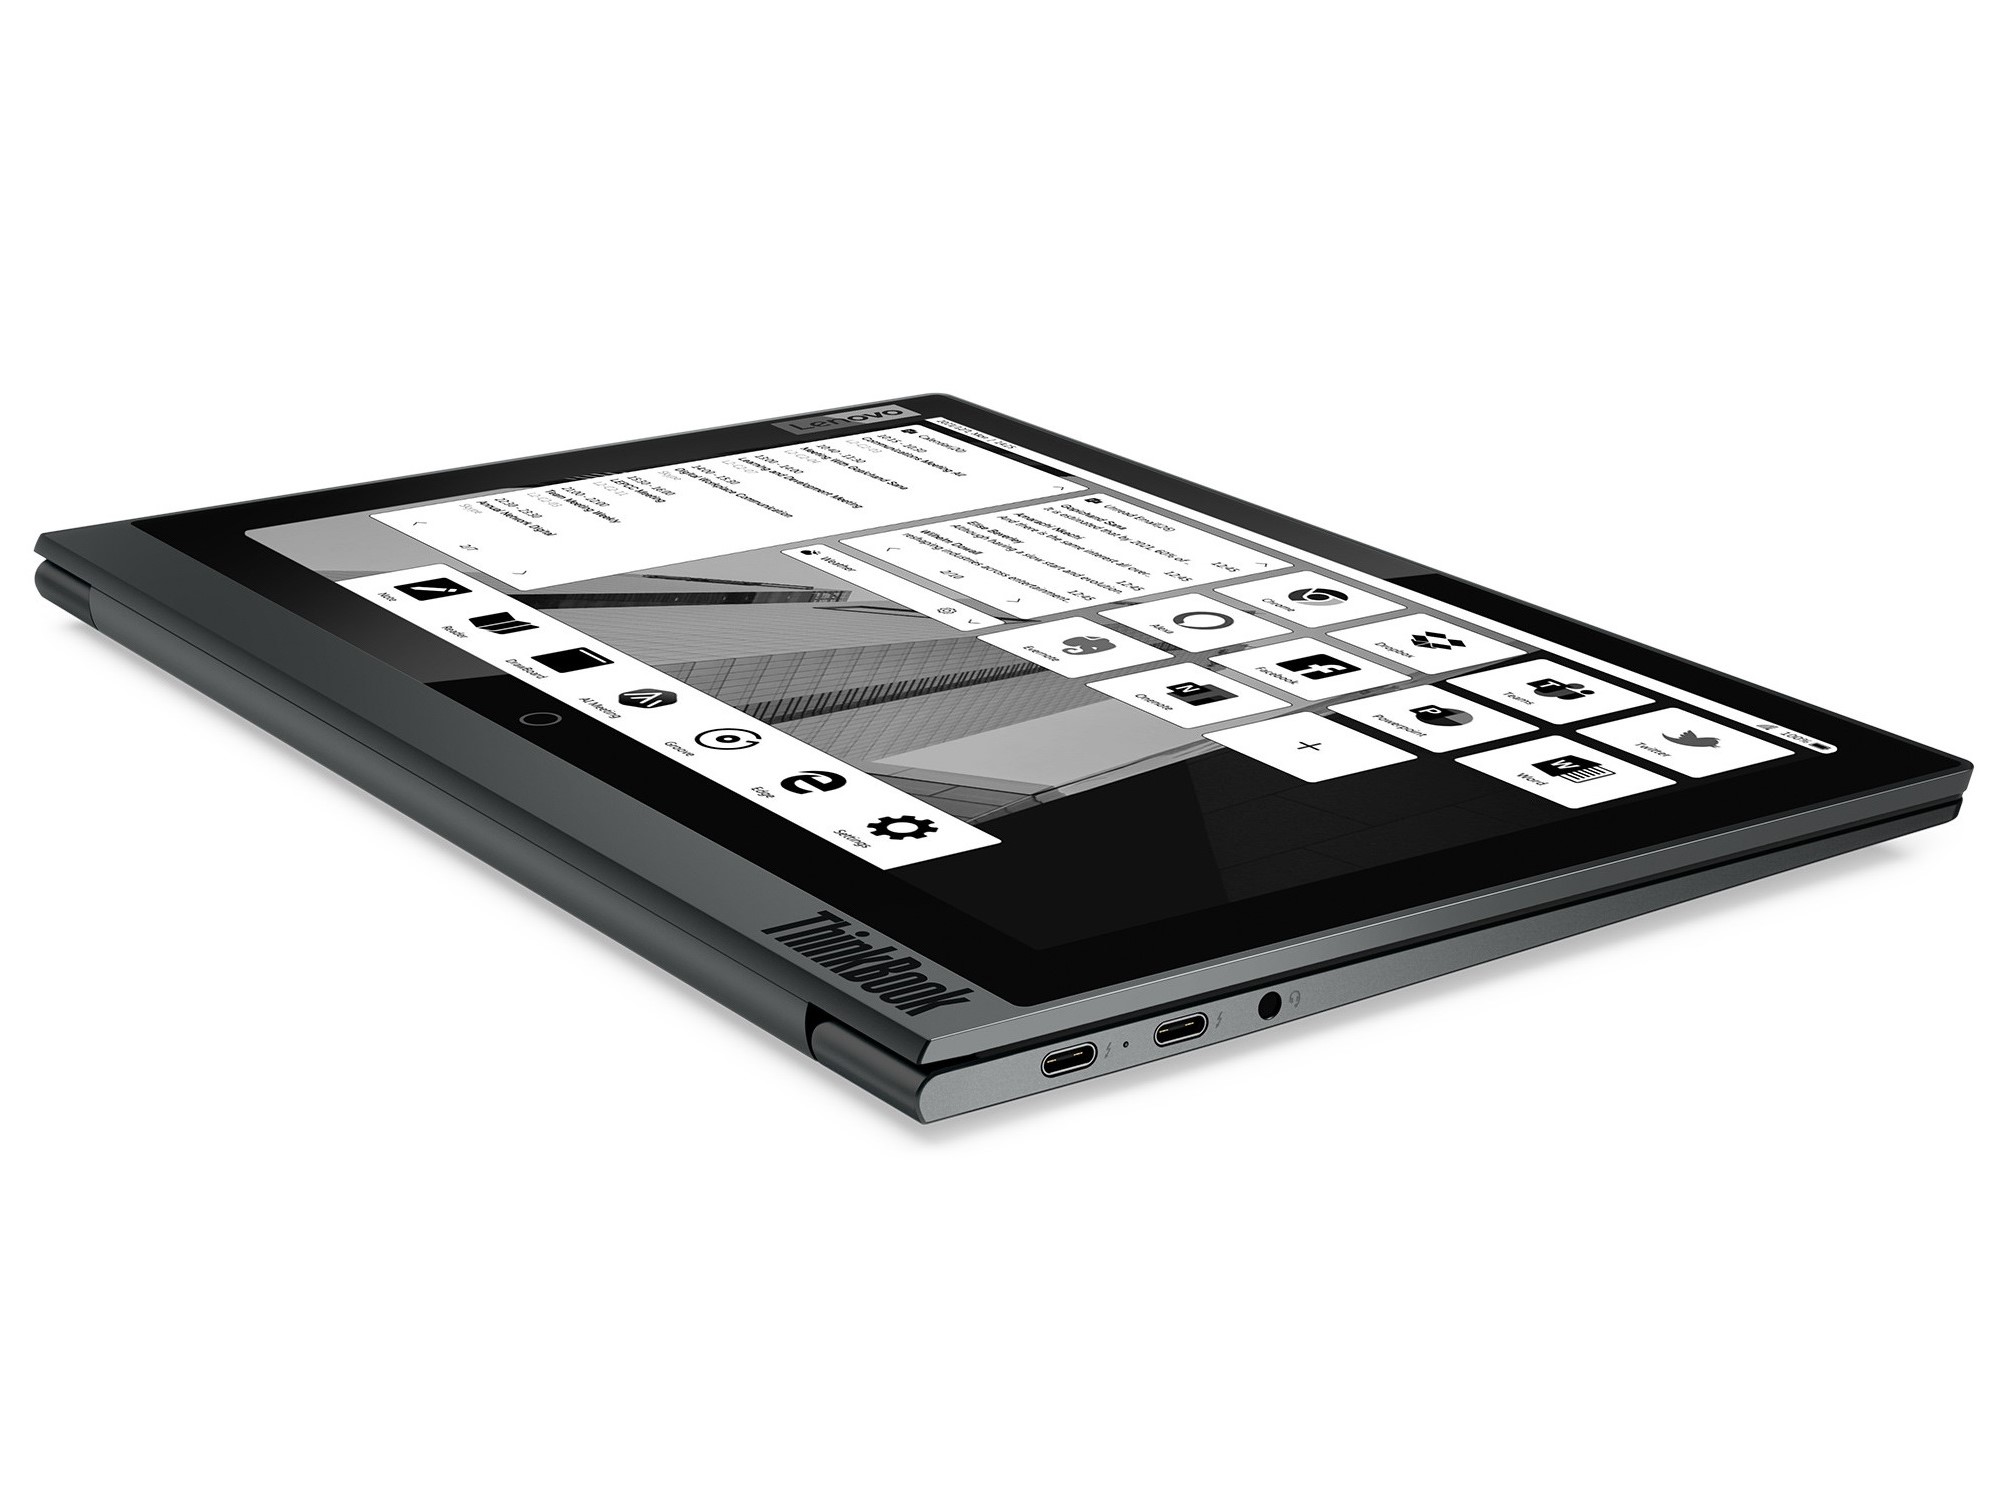
While the ThinkBook Plus of the first generation was basically a normal laptop with a touch-enabled E-ink display, Lenovo now adds a touch-enabled IPS panel to the ThinkBook Plus Gen2. However, the laptop is not a real convertible because the screen cannot be turned 360 degrees. Therefore, only the E-ink display on the outside is available for use in a closed state.
However, not only the two displays are available for a price of around 1,400 Euro (~$1621), but also an Intel Core i5-1130G7, which is supported by 16 GB of RAM. The size of the installed SSD is 512 GB and the internal Intel Iris Xe Graphics G7 80EUs is used for displaying image content.
Possible competitors in comparison
Rating | Date | Model | Weight | Height | Size | Resolution | Price |
|---|---|---|---|---|---|---|---|
| 86.1 % v7 (old) | 10 / 2021 | Lenovo ThinkBook Plus Gen2 Core i5 i5-1130G7, Iris Xe G7 80EUs | 1.2 kg | 13.9 mm | 13.30" | 2560x1600 | |
| 86.9 % v7 (old) | 10 / 2020 | Lenovo ThinkBook Plus 13 i7 i7-10510U, UHD Graphics 620 | 1.4 kg | 17.4 mm | 13.30" | 1920x1080 | |
| 84.4 % v7 (old) | 08 / 2021 | HP Pavilion Aero 13 be0097nr R7 5800U, Vega 8 | 953 g | 17 mm | 13.30" | 1920x1200 | |
| 85.7 % v7 (old) | 06 / 2021 | Acer Spin 3 SP313-51N-56YV i5-1135G7, Iris Xe G7 80EUs | 1.4 kg | 16 mm | 13.30" | 2560x1600 | |
| 85.4 % v7 (old) | 06 / 2021 | Samsung Galaxy Book Pro 360 13 i5-1135G7, Iris Xe G7 80EUs | 1.1 kg | 13 mm | 13.20" | 1920x1080 |
Case & features - Slim notebook made of aluminum
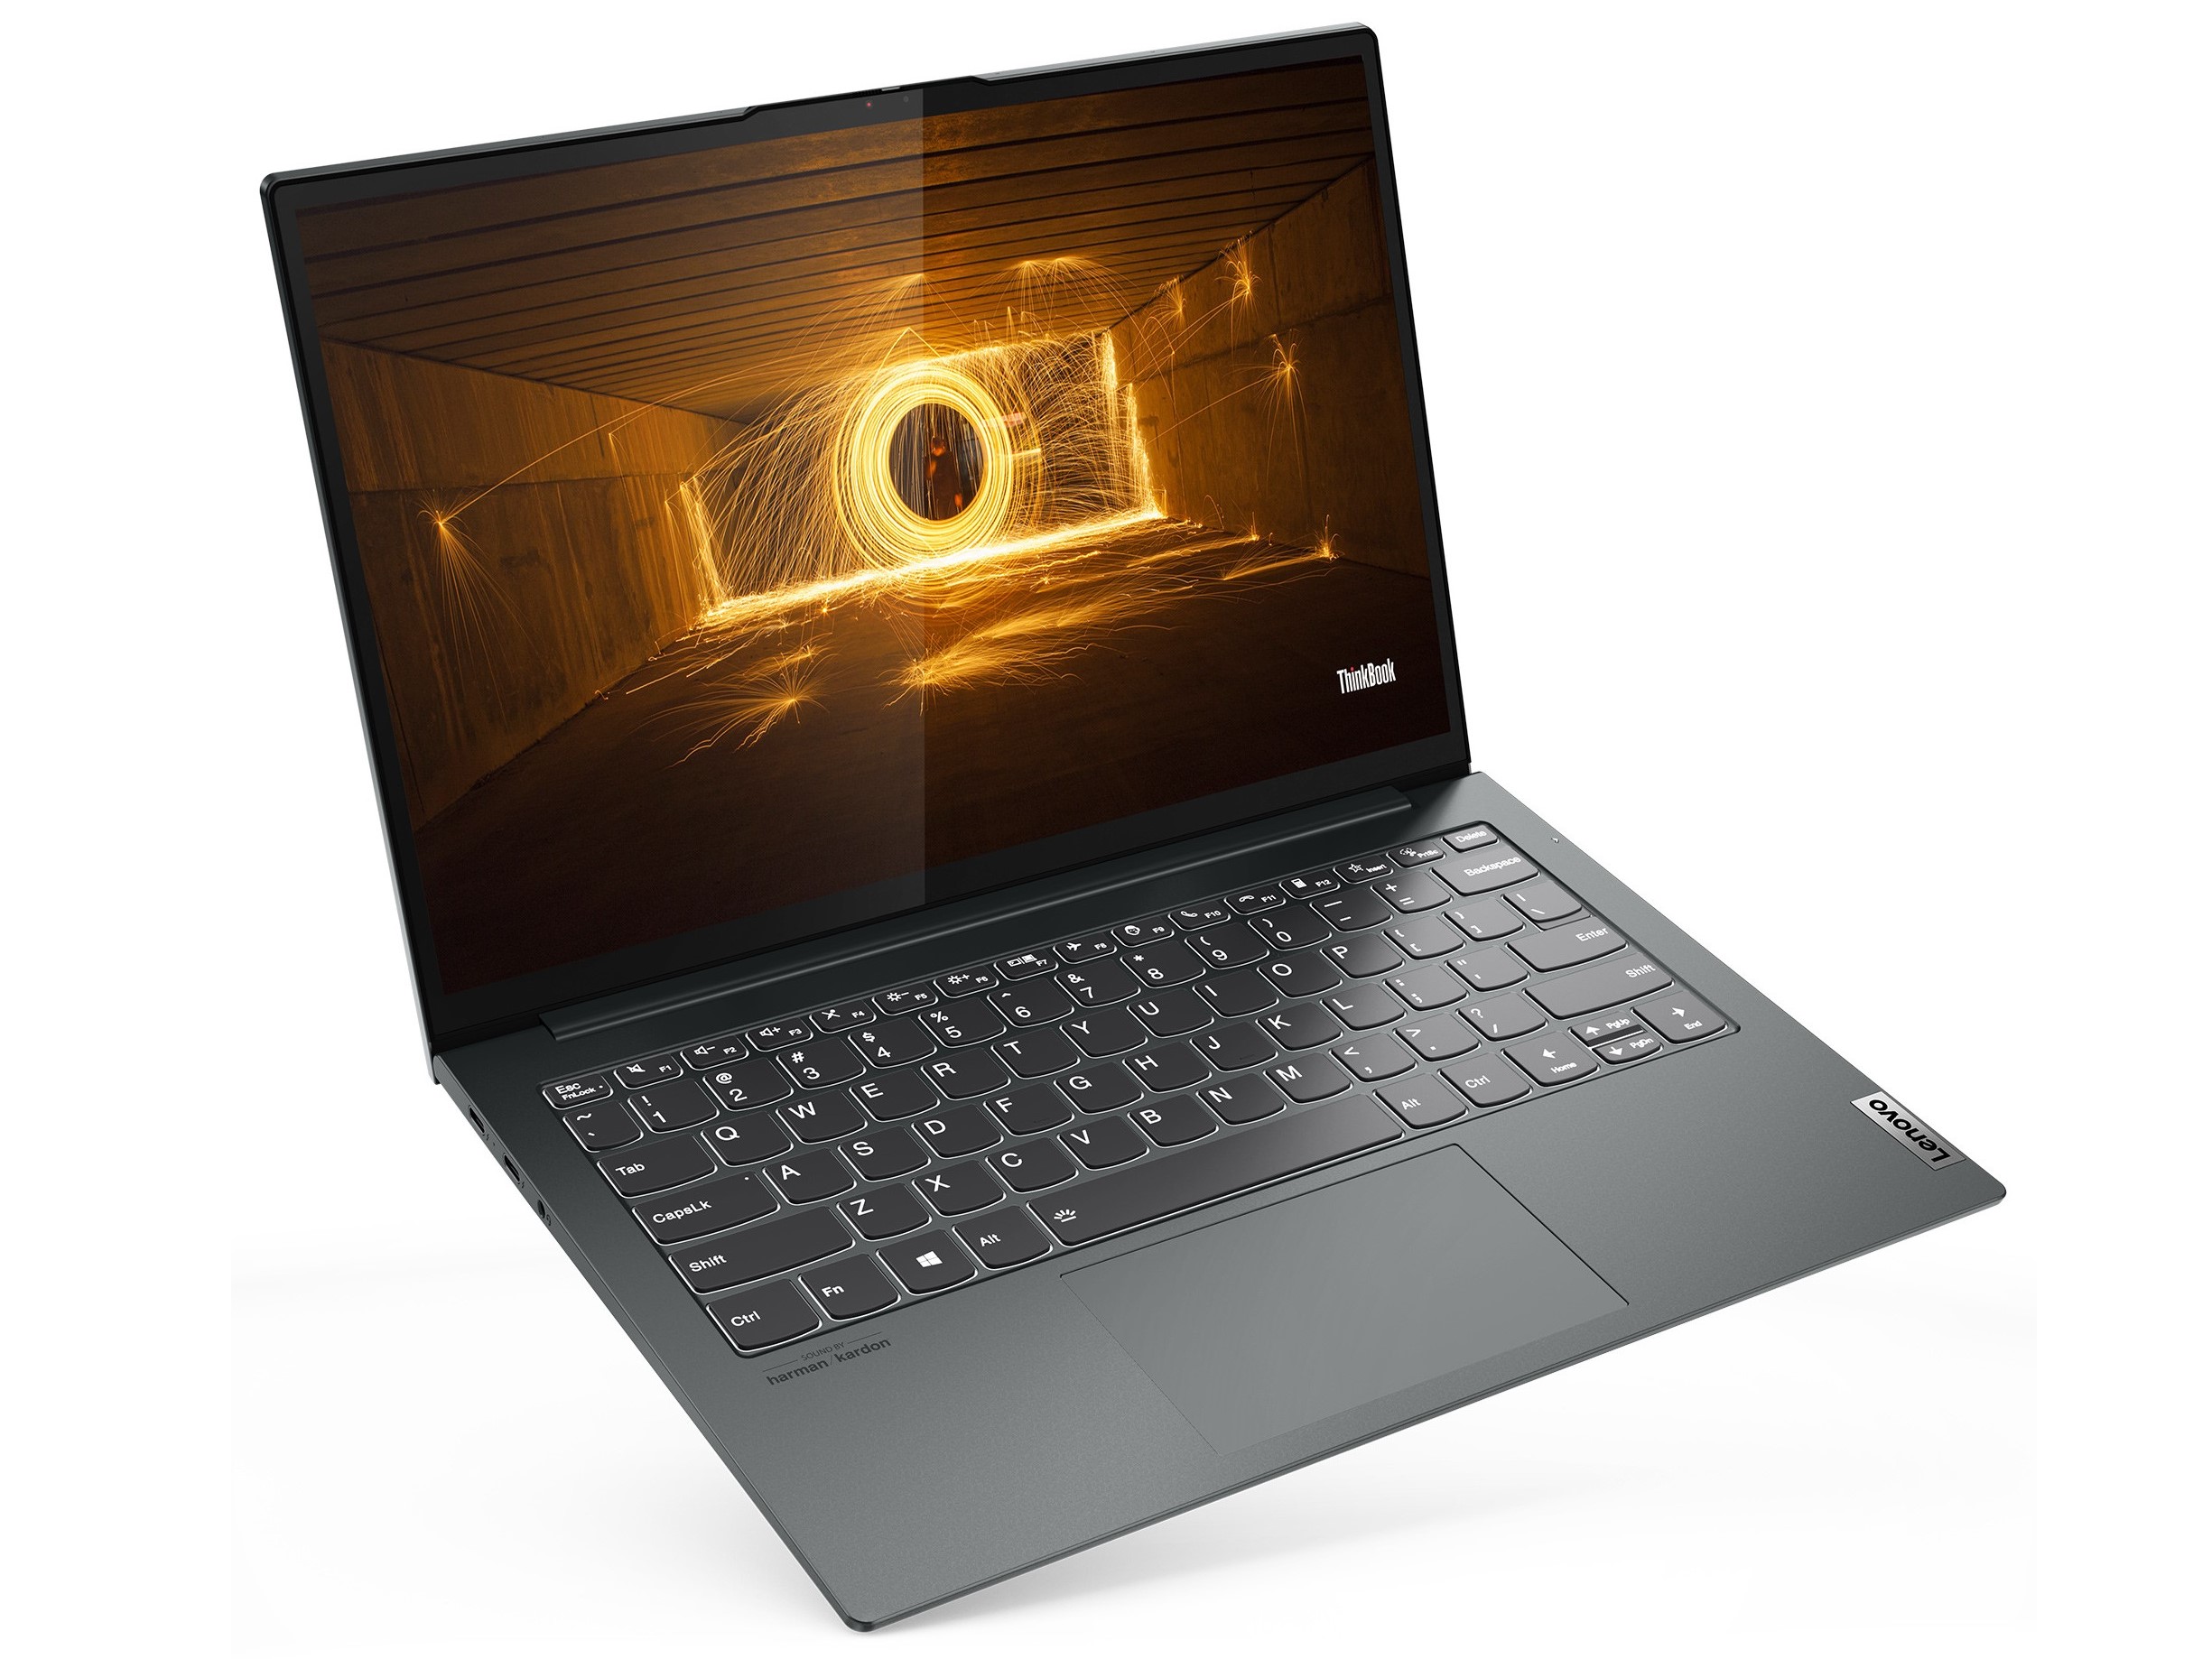
Lenovo manufactures the ThinkBook Plus Gen2 from aluminum. This makes it extremely sturdy and gives a high-quality impression. The notebook is also very slim, quite light at 1.2 kg (~2.65 pounds), and the other dimensions are a bit more compact than other 13-inch devices.
The base plate can theoretically be removed, but it is hooked in very tightly. In order not to damage the device, we therefore aborted the opening attempt.
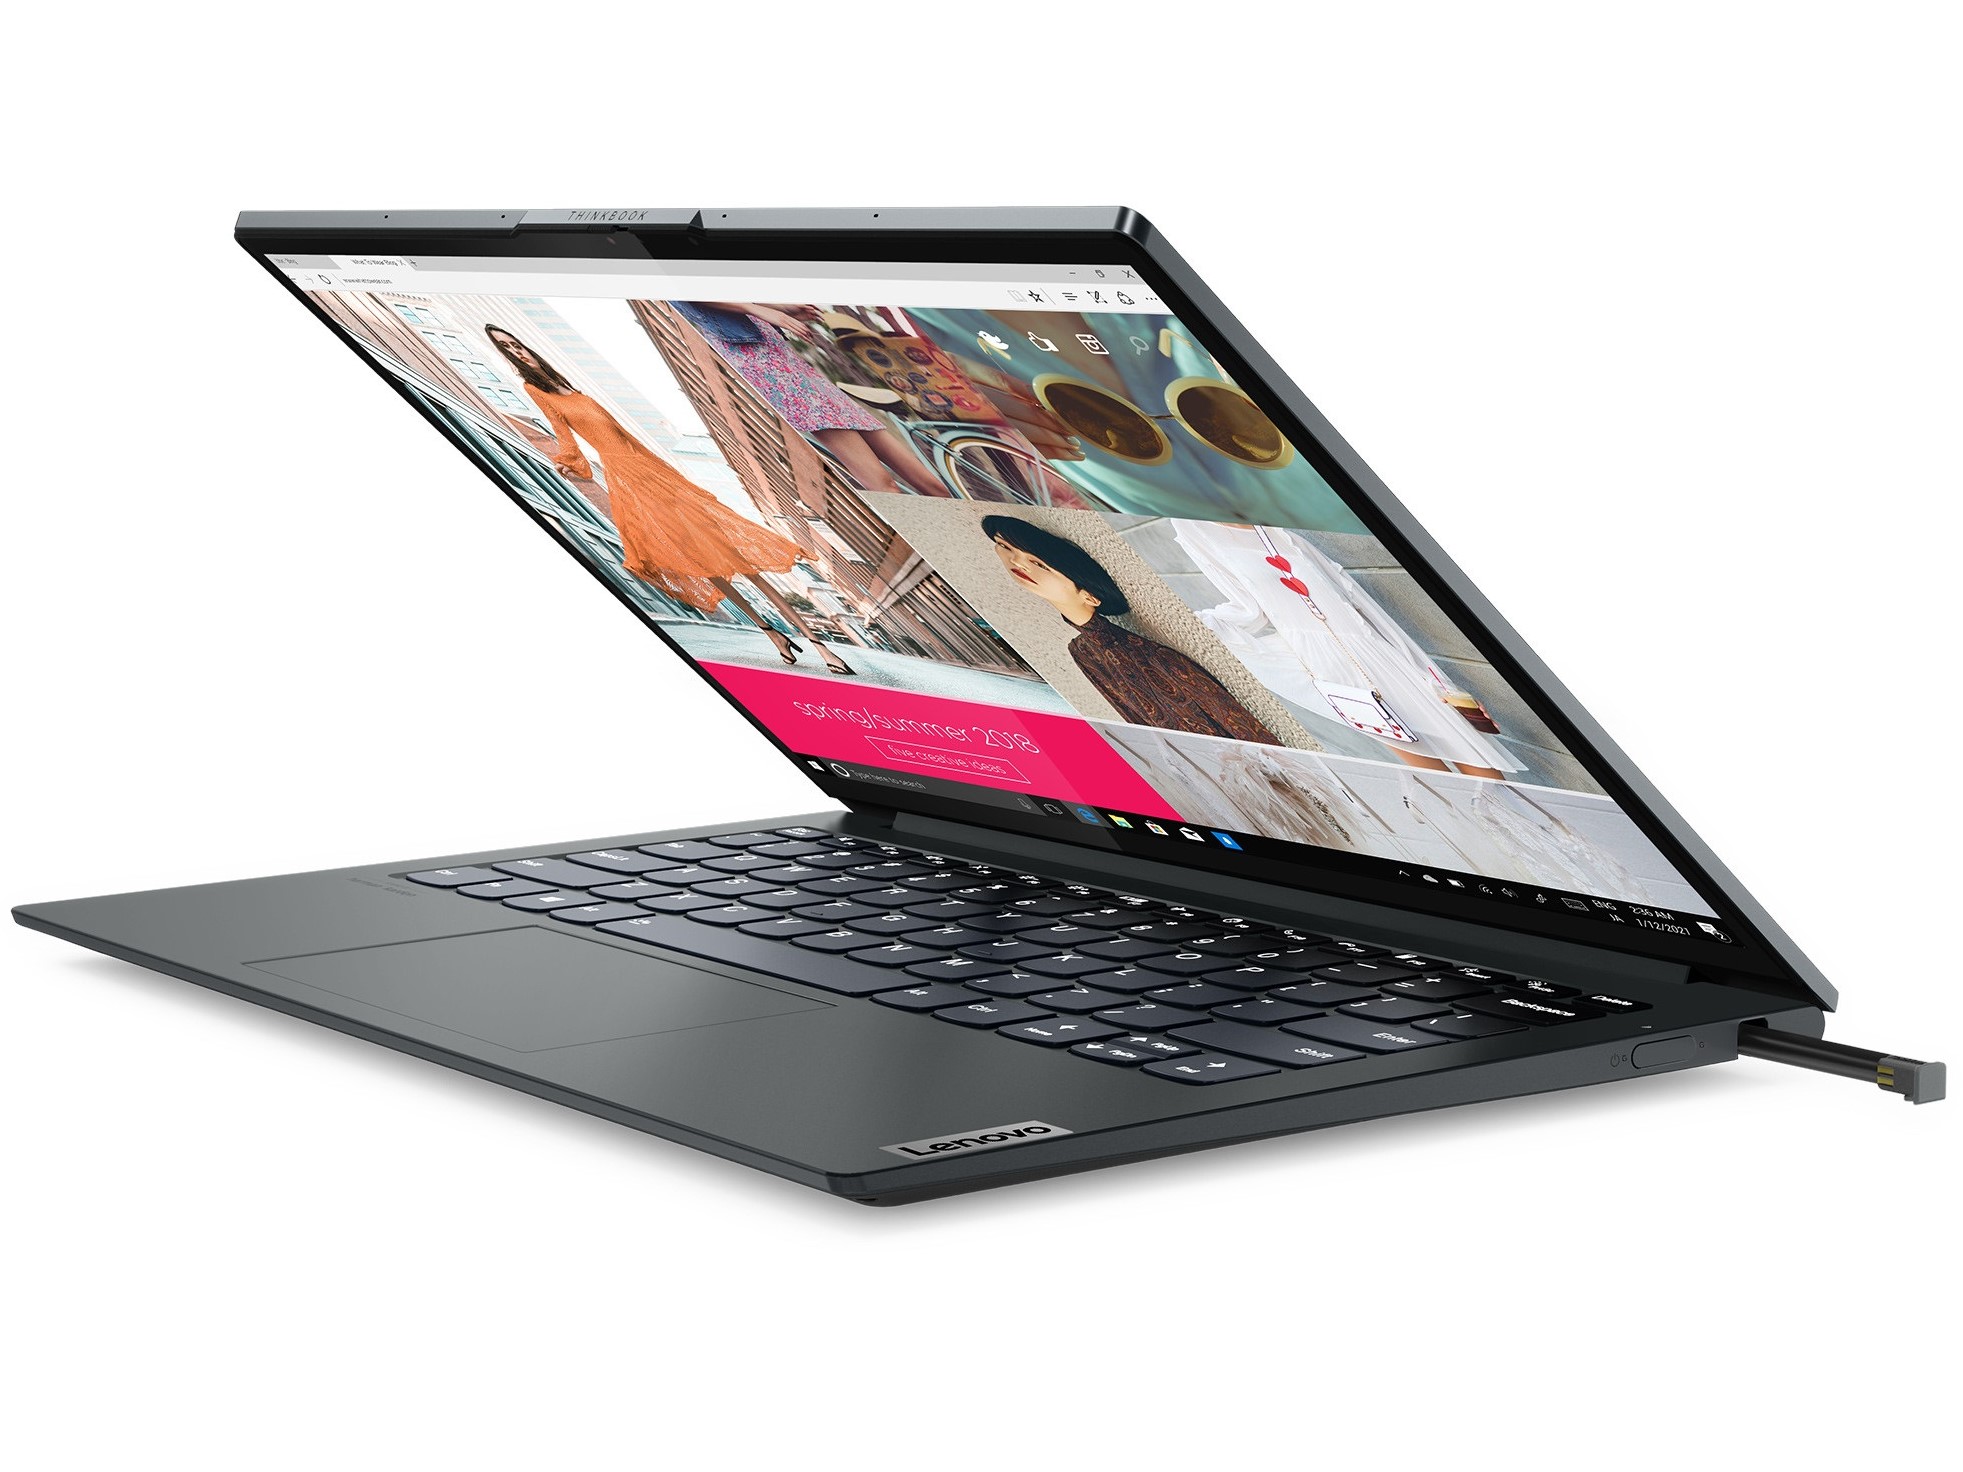
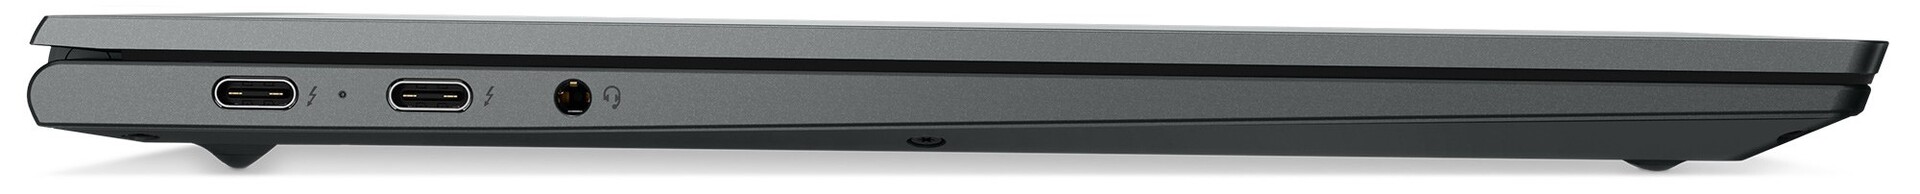
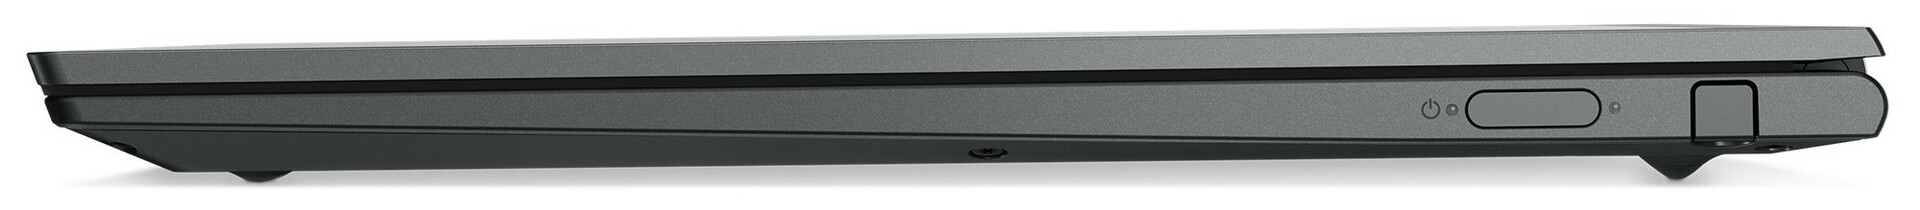
The port selection of the ThinkBook Plus Gen2 is very clear, but allows for versatile expansion thanks to two Thunderbolt 4 ports. It is very nice that the included input pen can be stored directly in a slot next to the power button.
Lenovo's notebook can establish wireless connections via Bluetooth 5.2 and WiFi 6. In combination with our reference router, the Netgear Nighthawk AX12, we achieved WLAN speeds of 1.293 MBit/s on average when transmitting and 1.403 MBit/s when receiving data.
As in so many current notebooks, a low-resolution camera with 0.9 MP is used as a webcam. Even in good light conditions, it only delivers a mediocre picture quality with visible weaknesses in sharpness and contrast.

Connection equipment


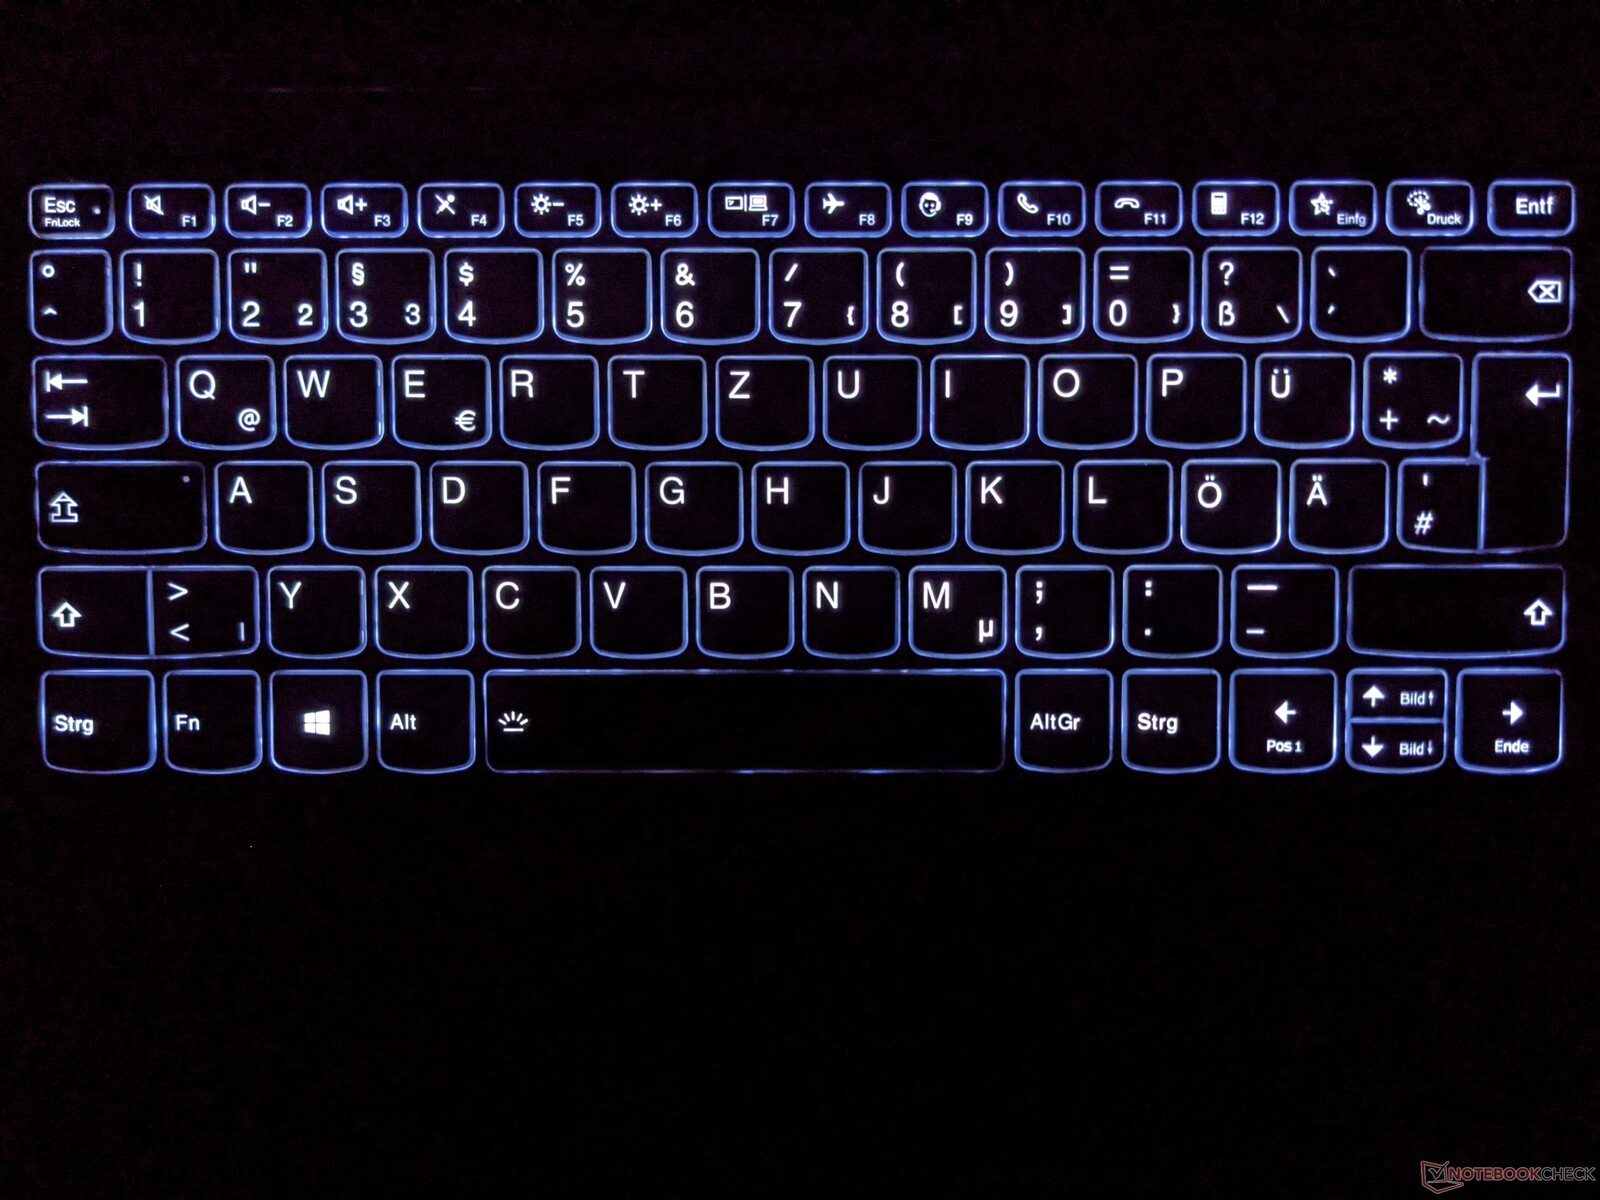
Input devices - stylus included
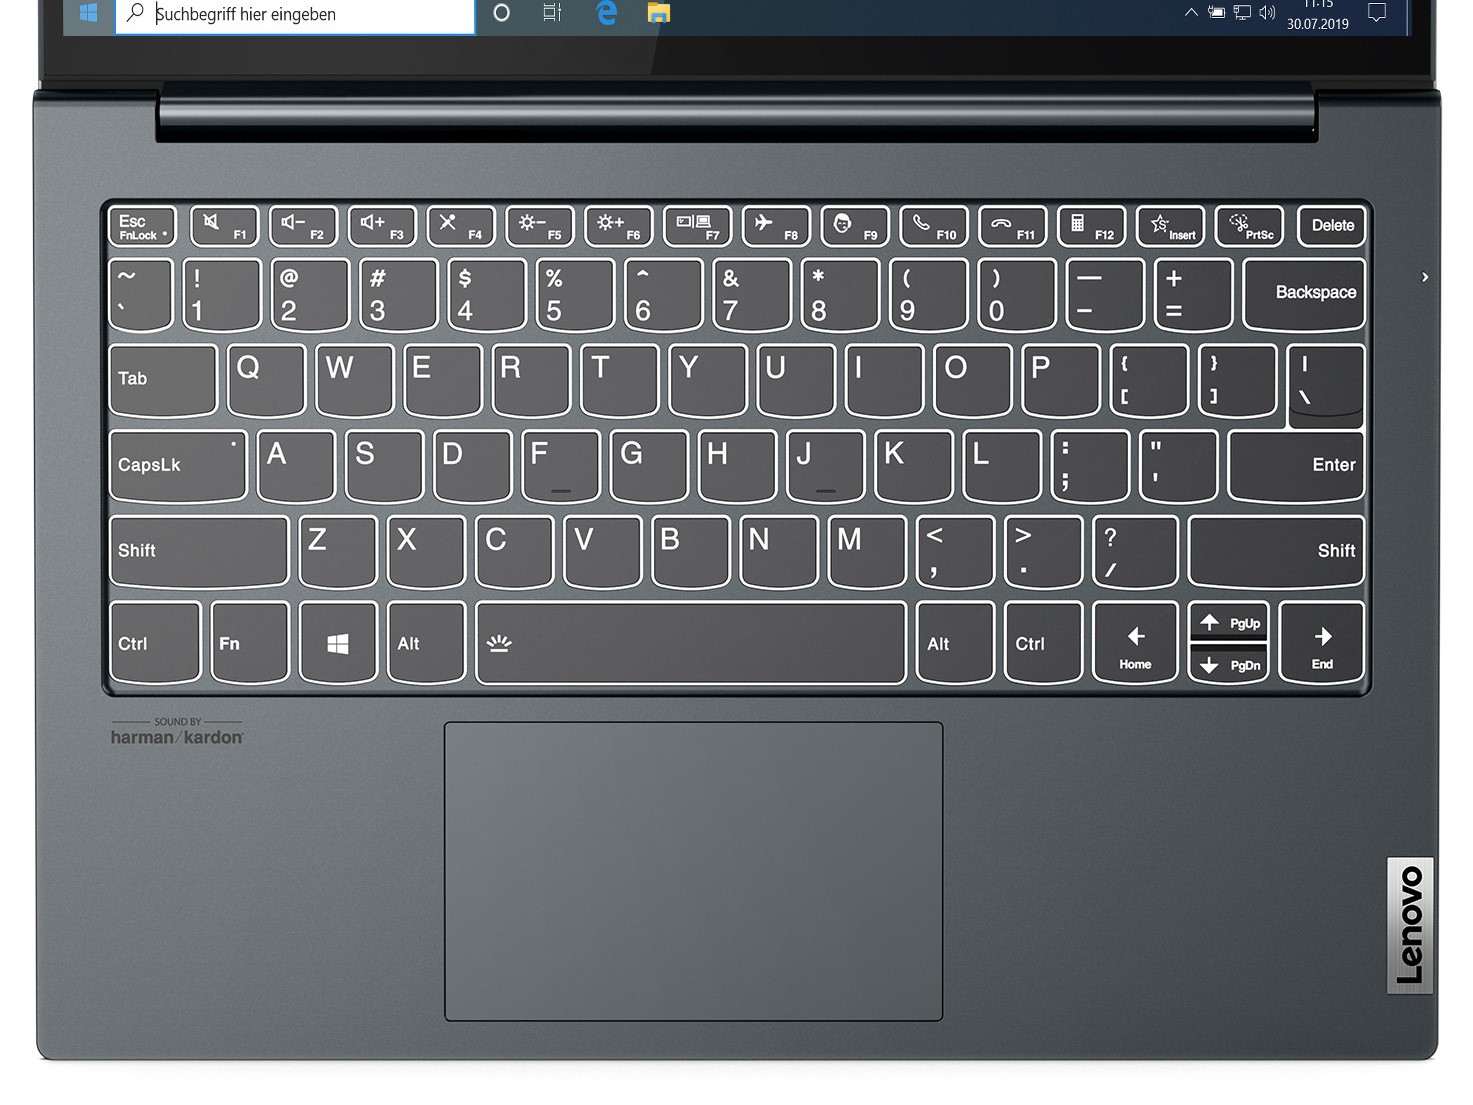
The keyboard of the ThinkBook Plus offers a well-designed layout and a clear feedback. The travel is relatively short, but even longer typing tasks go well after a short familiarization period. A clickpad is used as a mouse replacement, which is good for navigating the mouse pointer.
The main screen of Lenovo's laptop is touch-enabled and also responds reliably to touches. Precise inputs can also be made via the included input pen. These are also possible on the E-ink screen, although the screen itself reacts very sluggishly.
Thus, touches and, for example, drawings or written text are reliably picked up by the system, but the implementation on the E-ink screen always happens with a significant delay. This is due to the underlying technology, but it is very energy-saving and comfortable for the eyes.
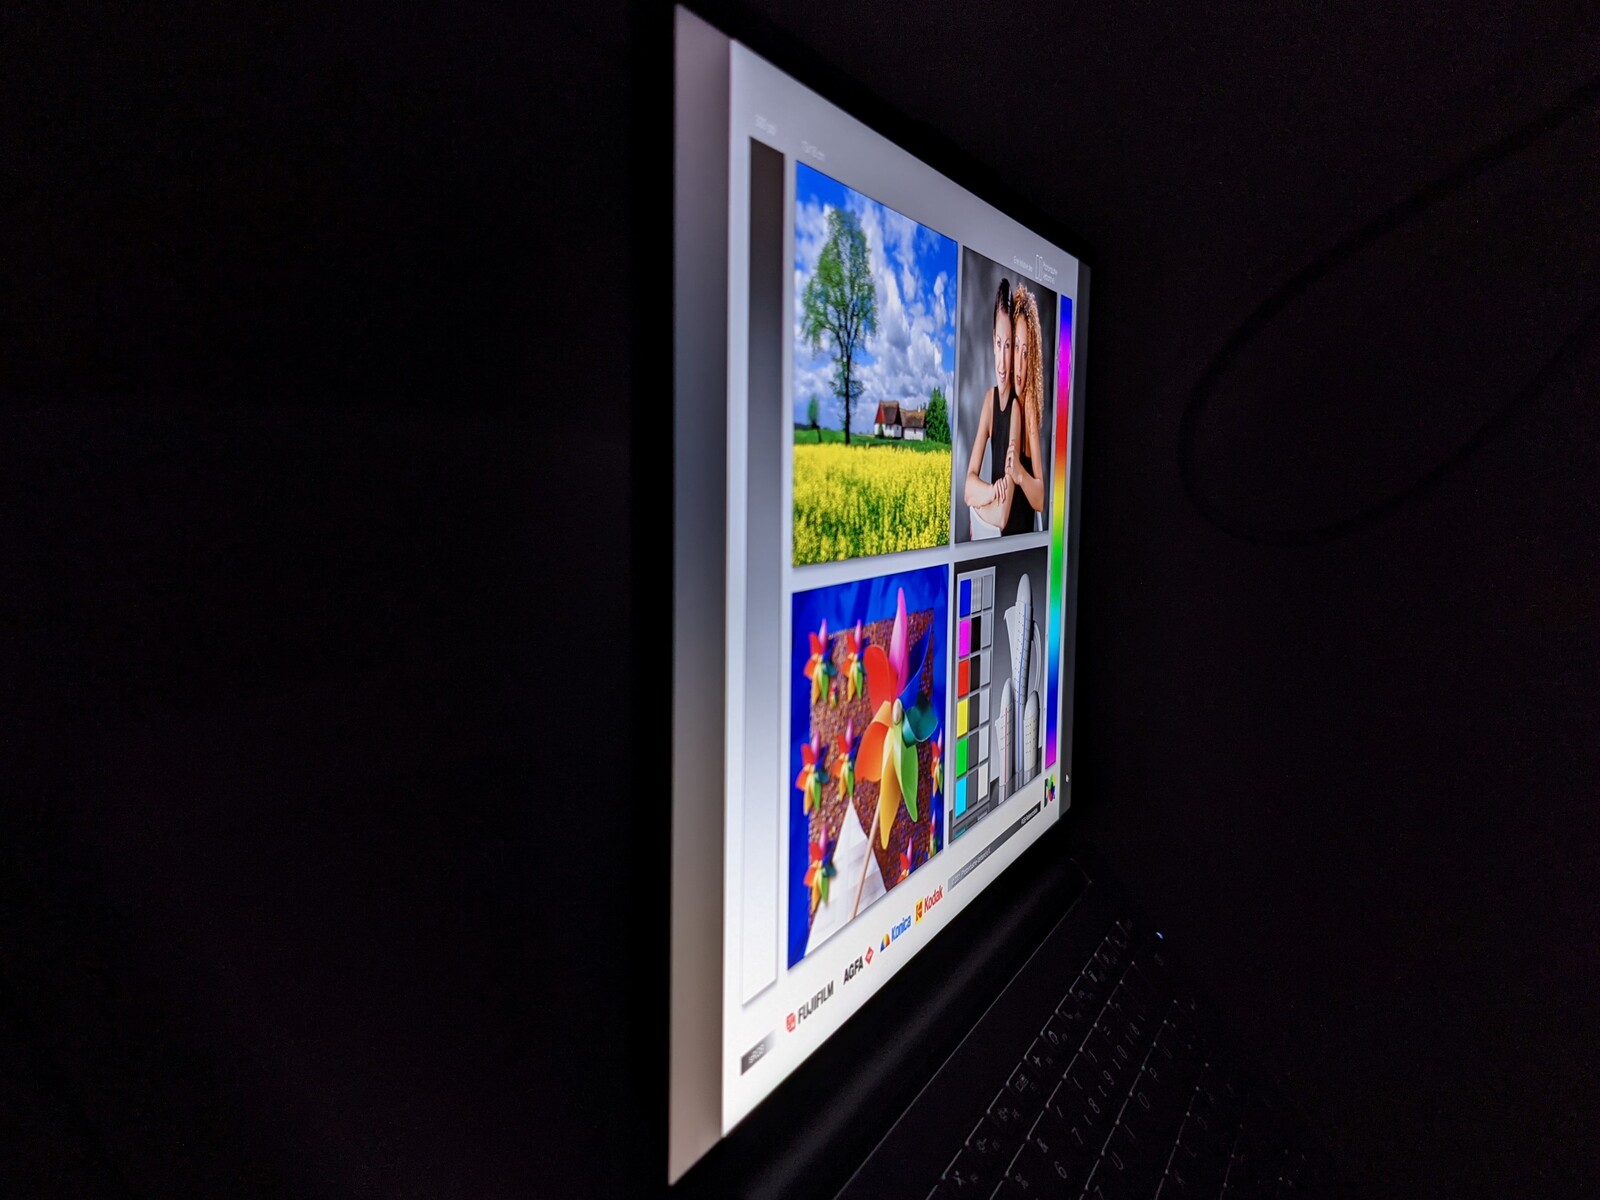
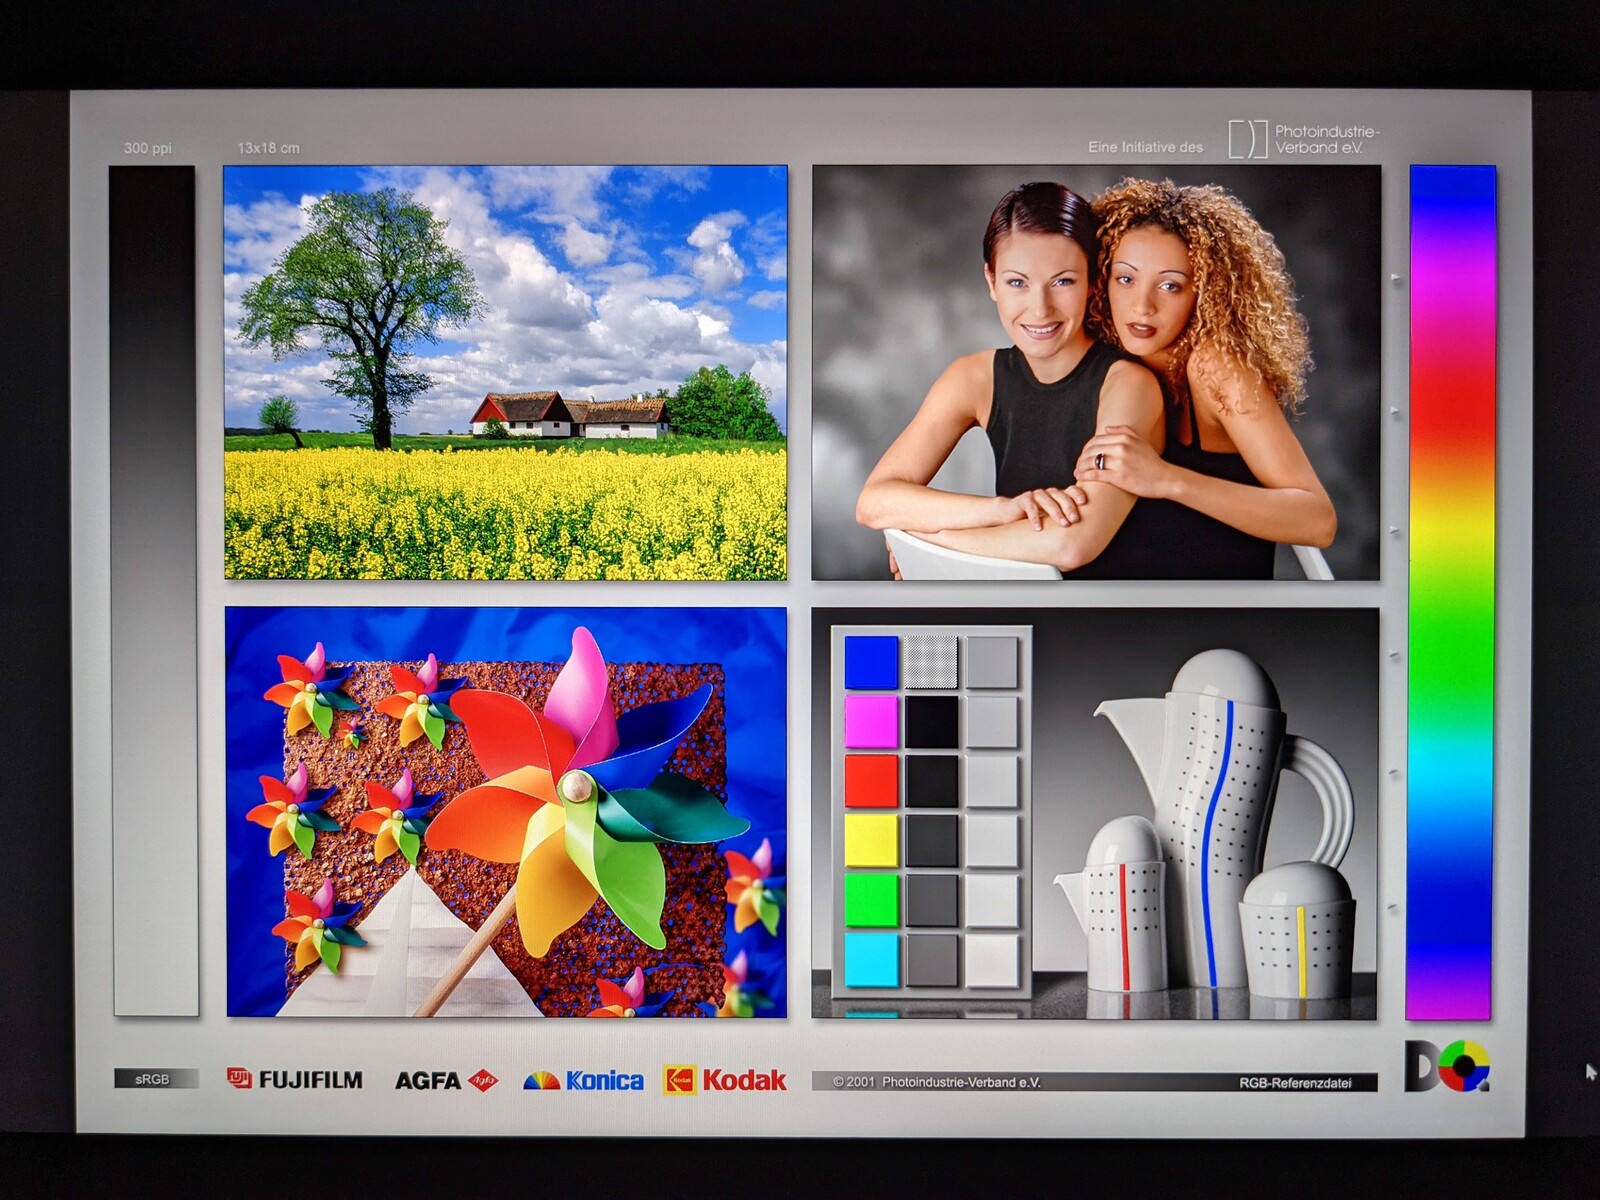
Display - ThinkPad Plus with QHD
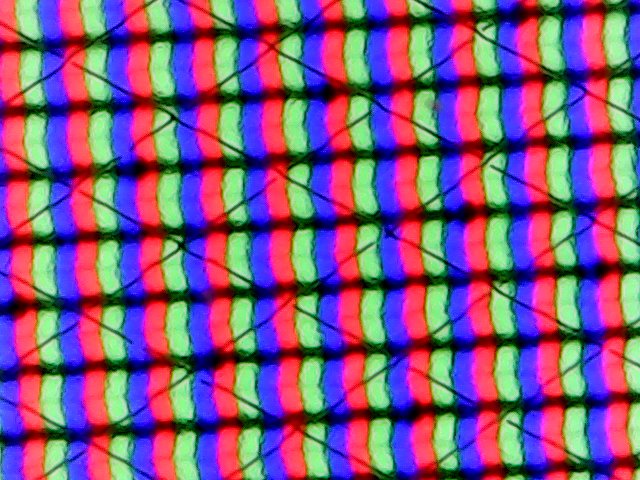

The main screen of the Lenovo ThinkBook Plus Gen2 consists of a 13.3-inch IPS panel with a 16:10 aspect ratio and a resolution of 2,560 x 1,600 pixels. The maximum brightness is 388 cd/m² on average and the illumination is 94 percent. Thus, it is the display with the second-best rates in our test field.
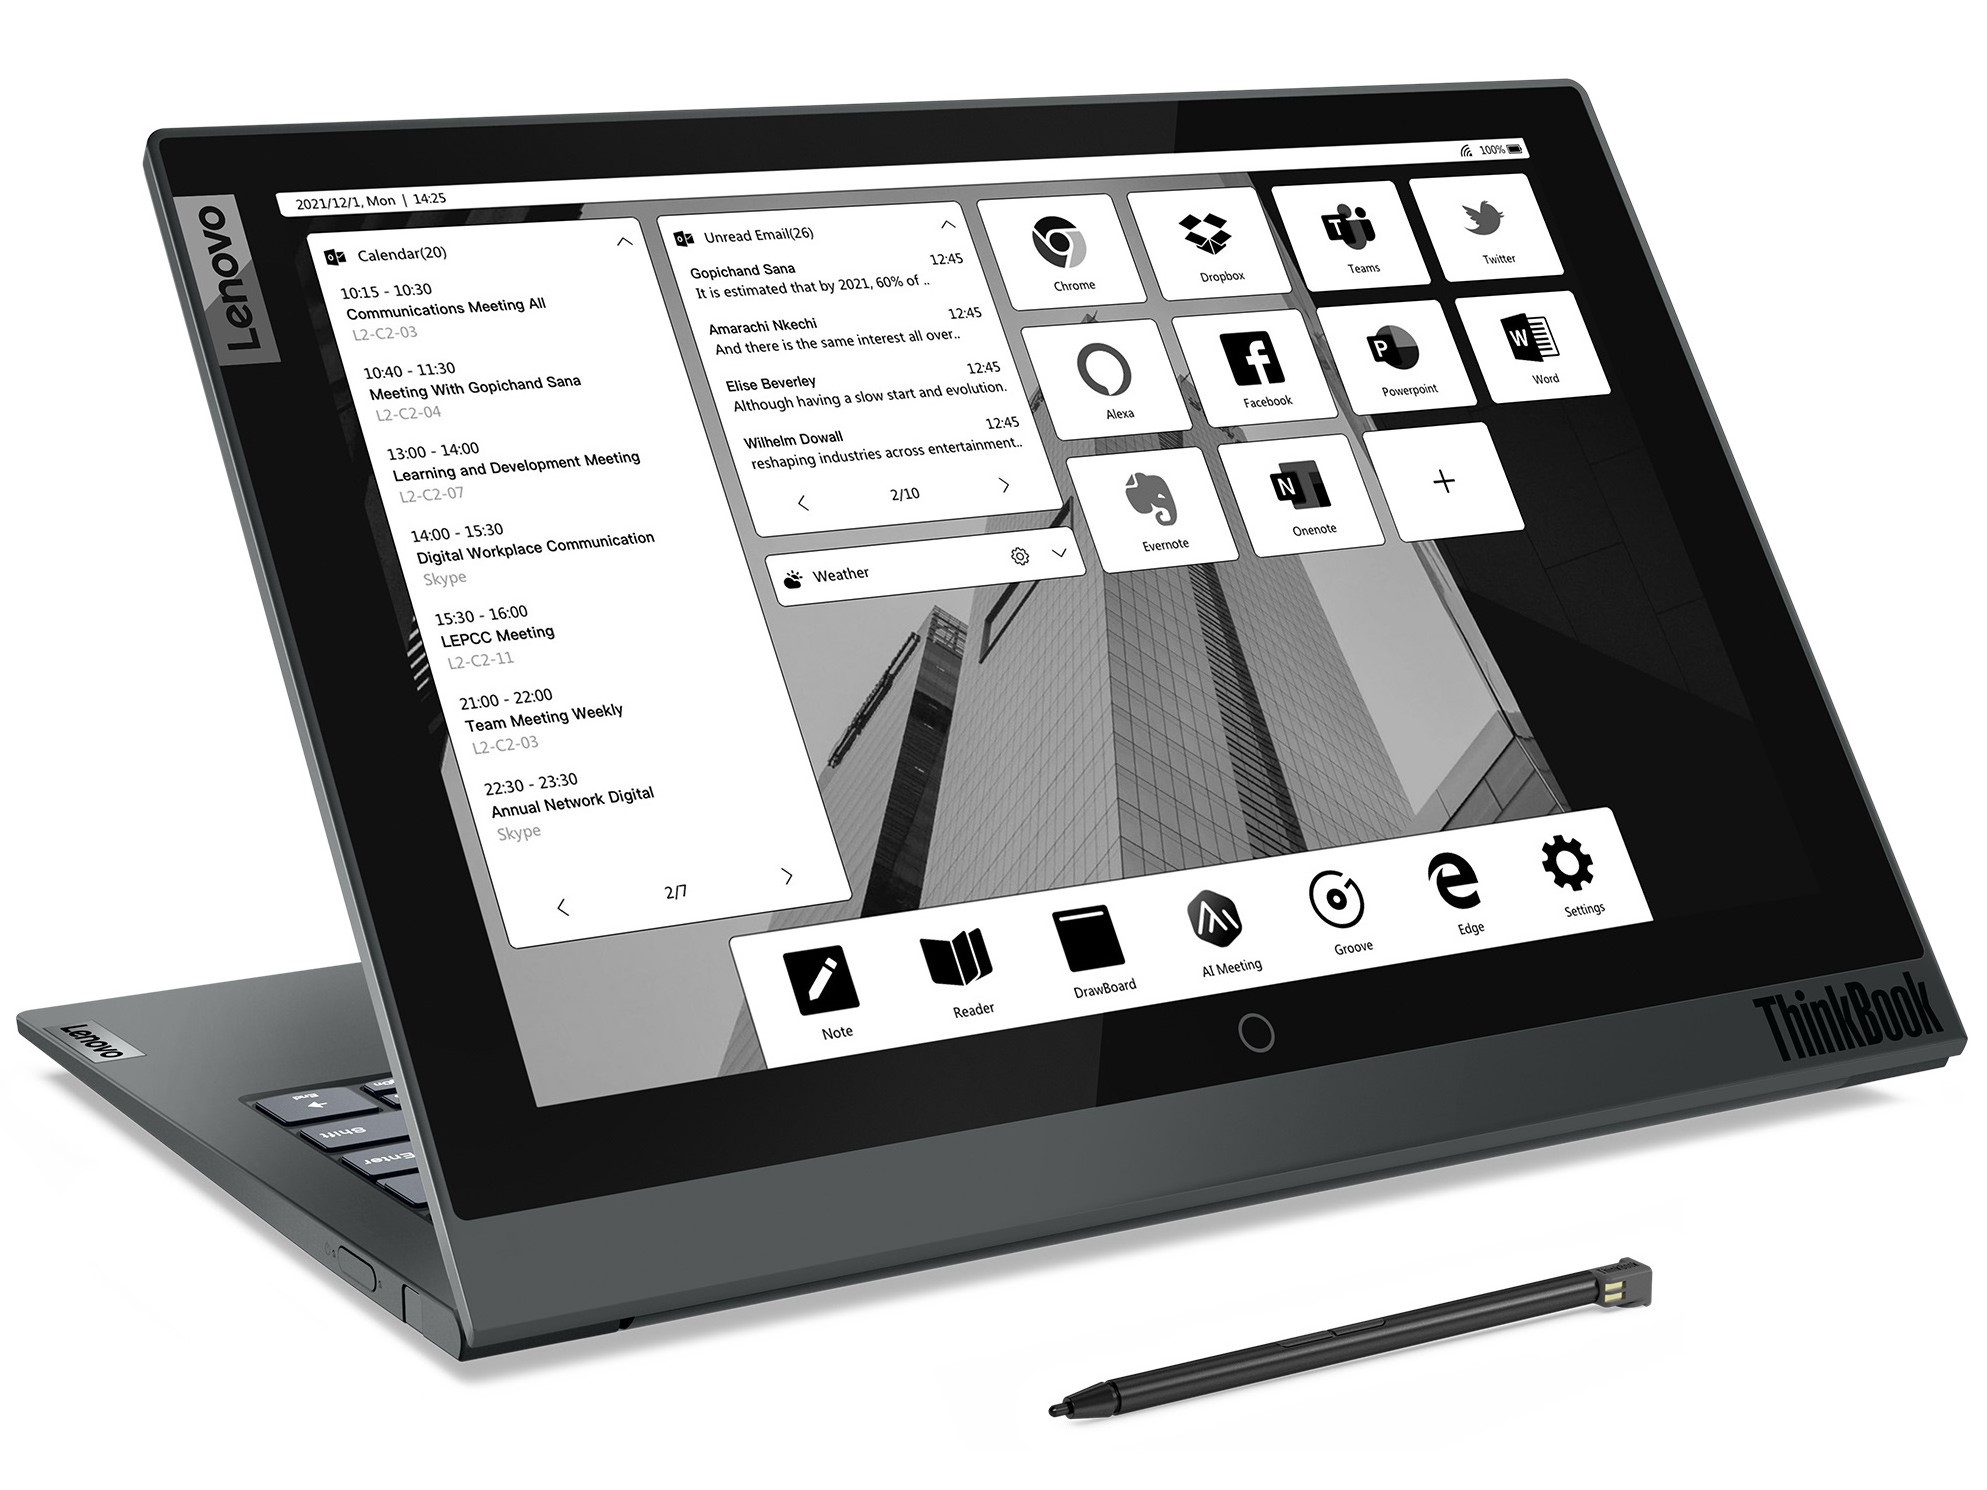
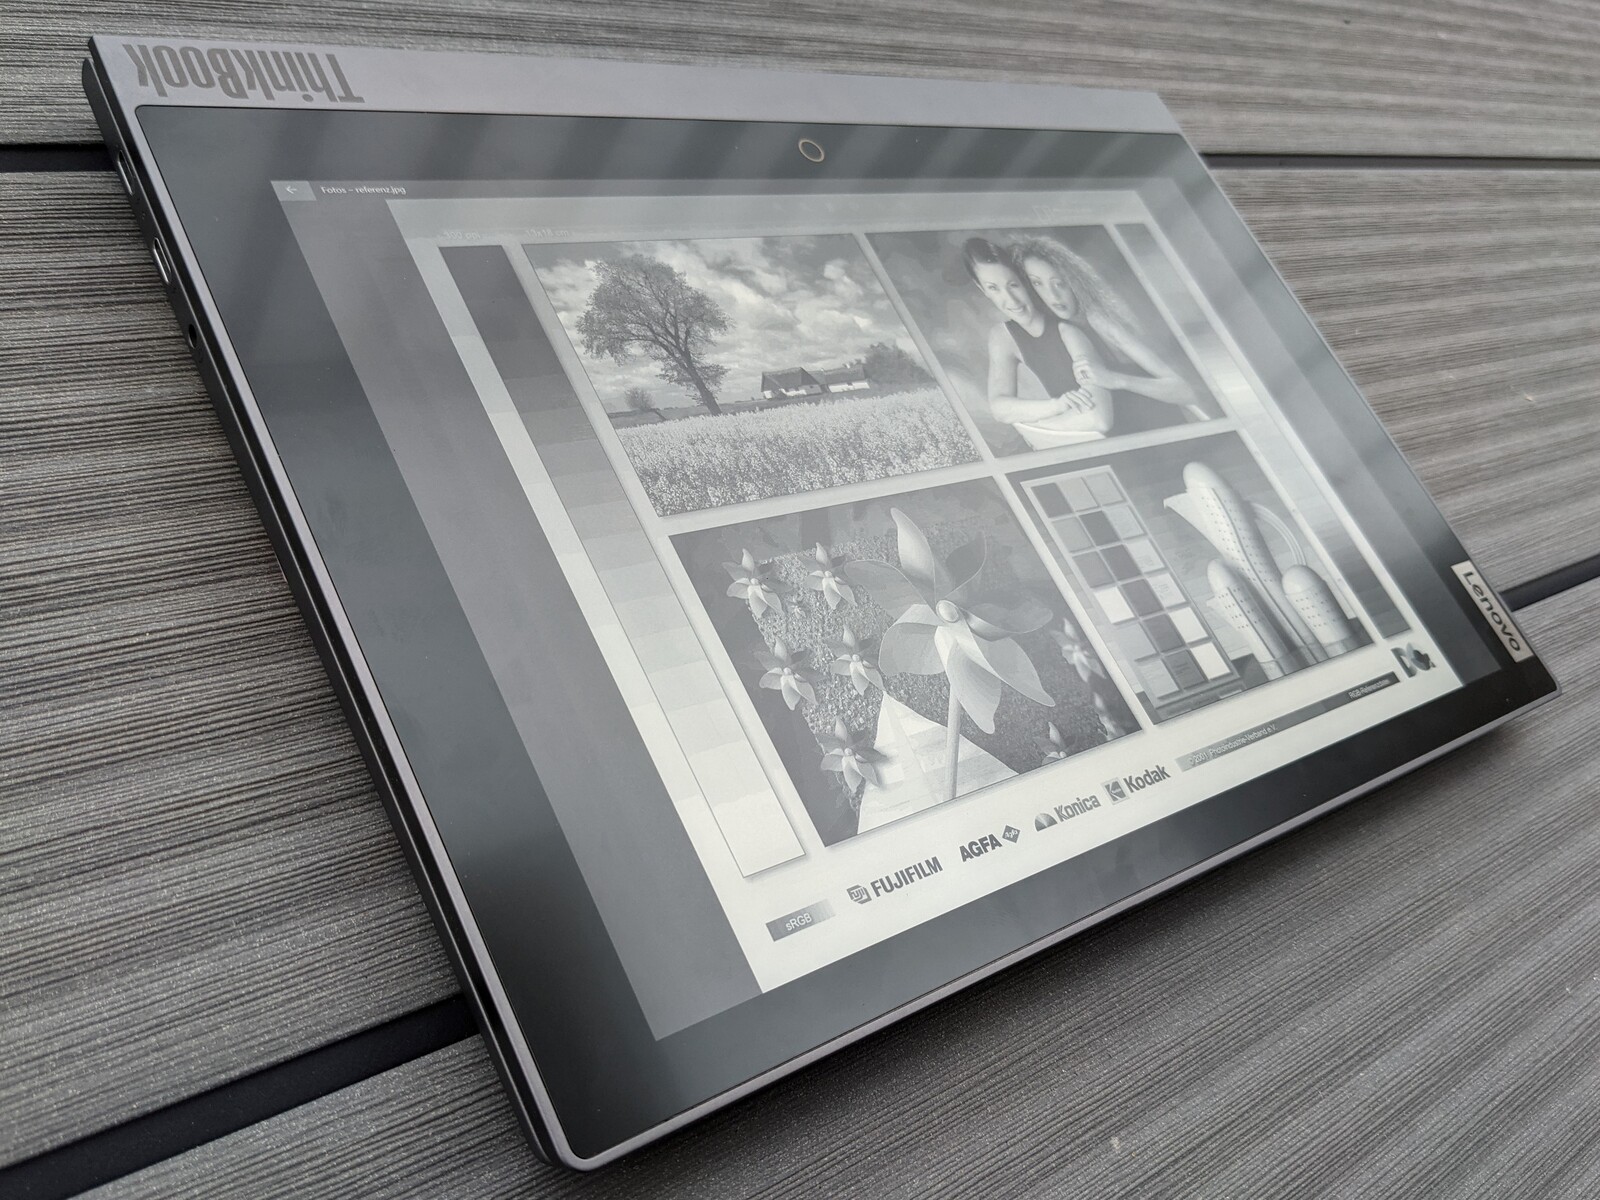
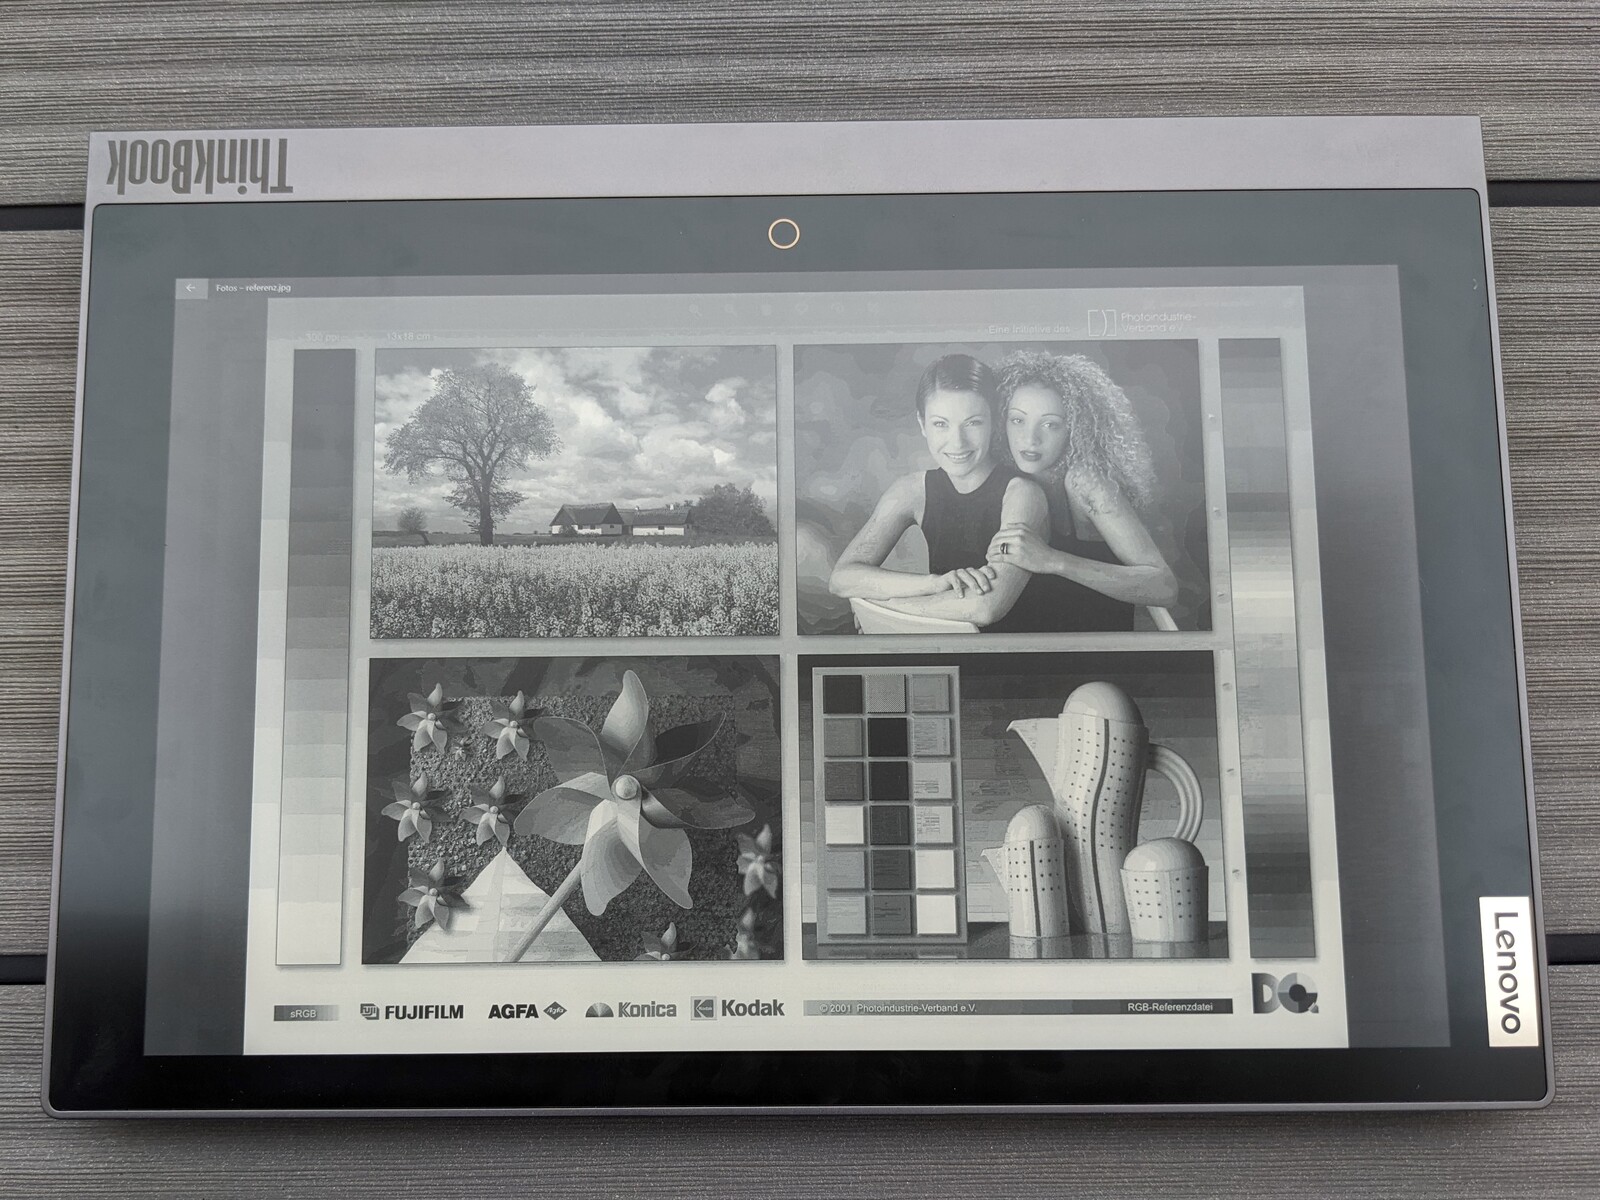
With the E-ink screen installed on the lid's upper side, the ThinkBook has a second display that is suitable for displaying static content. The resolution of the black and white panel is also 2,560 x 1,600 pixels, but with a size of 12 inches. The E-ink display does not have a backlight, which is why external illumination is needed in poor ambient light.
According to our measurements, no PWM is used. External monitors can also be operated, but the "external display only" option does not work. This is probably due to the secondary E-ink display.
| |||||||||||||||||||||||||
Brightness Distribution: 94 %
Center on Battery: 403 cd/m²
Contrast: 1683:1 (Black: 0.24 cd/m²)
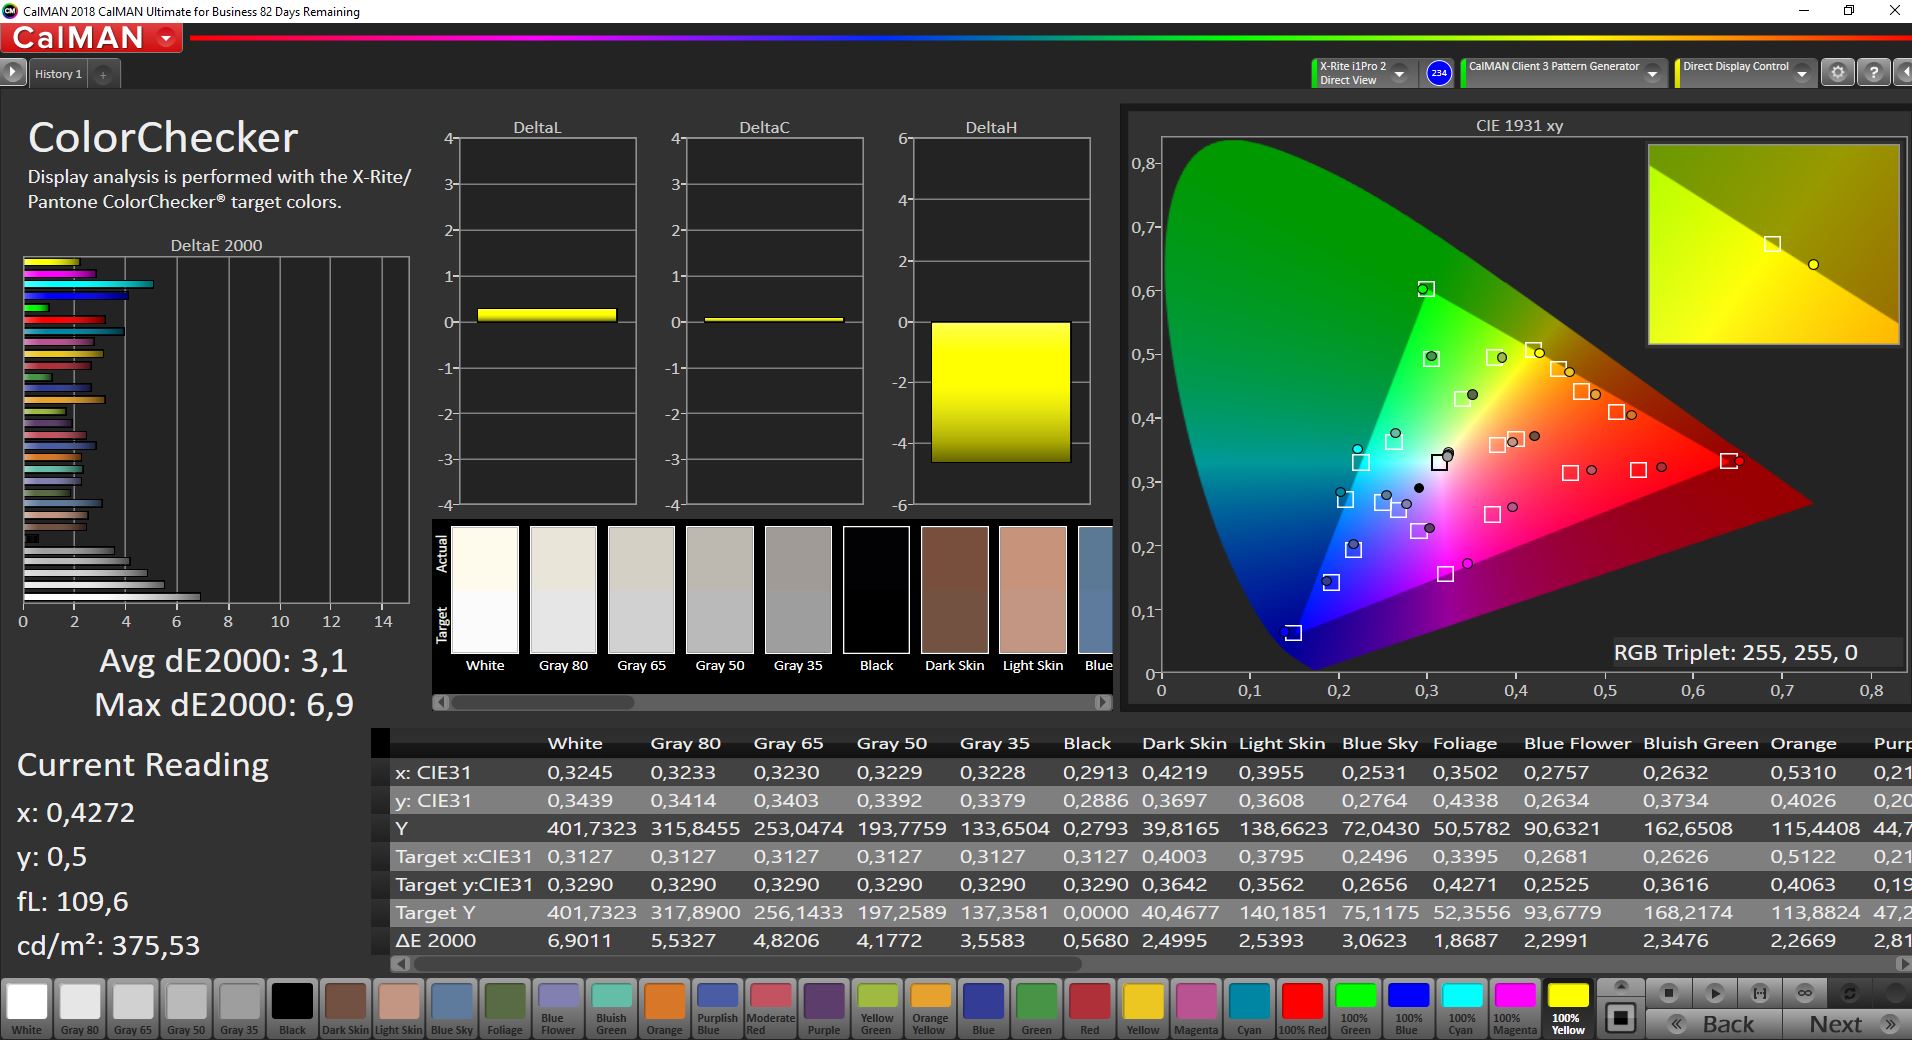
ΔE ColorChecker Calman: 3.1 | ∀{0.5-29.43 Ø4.77}
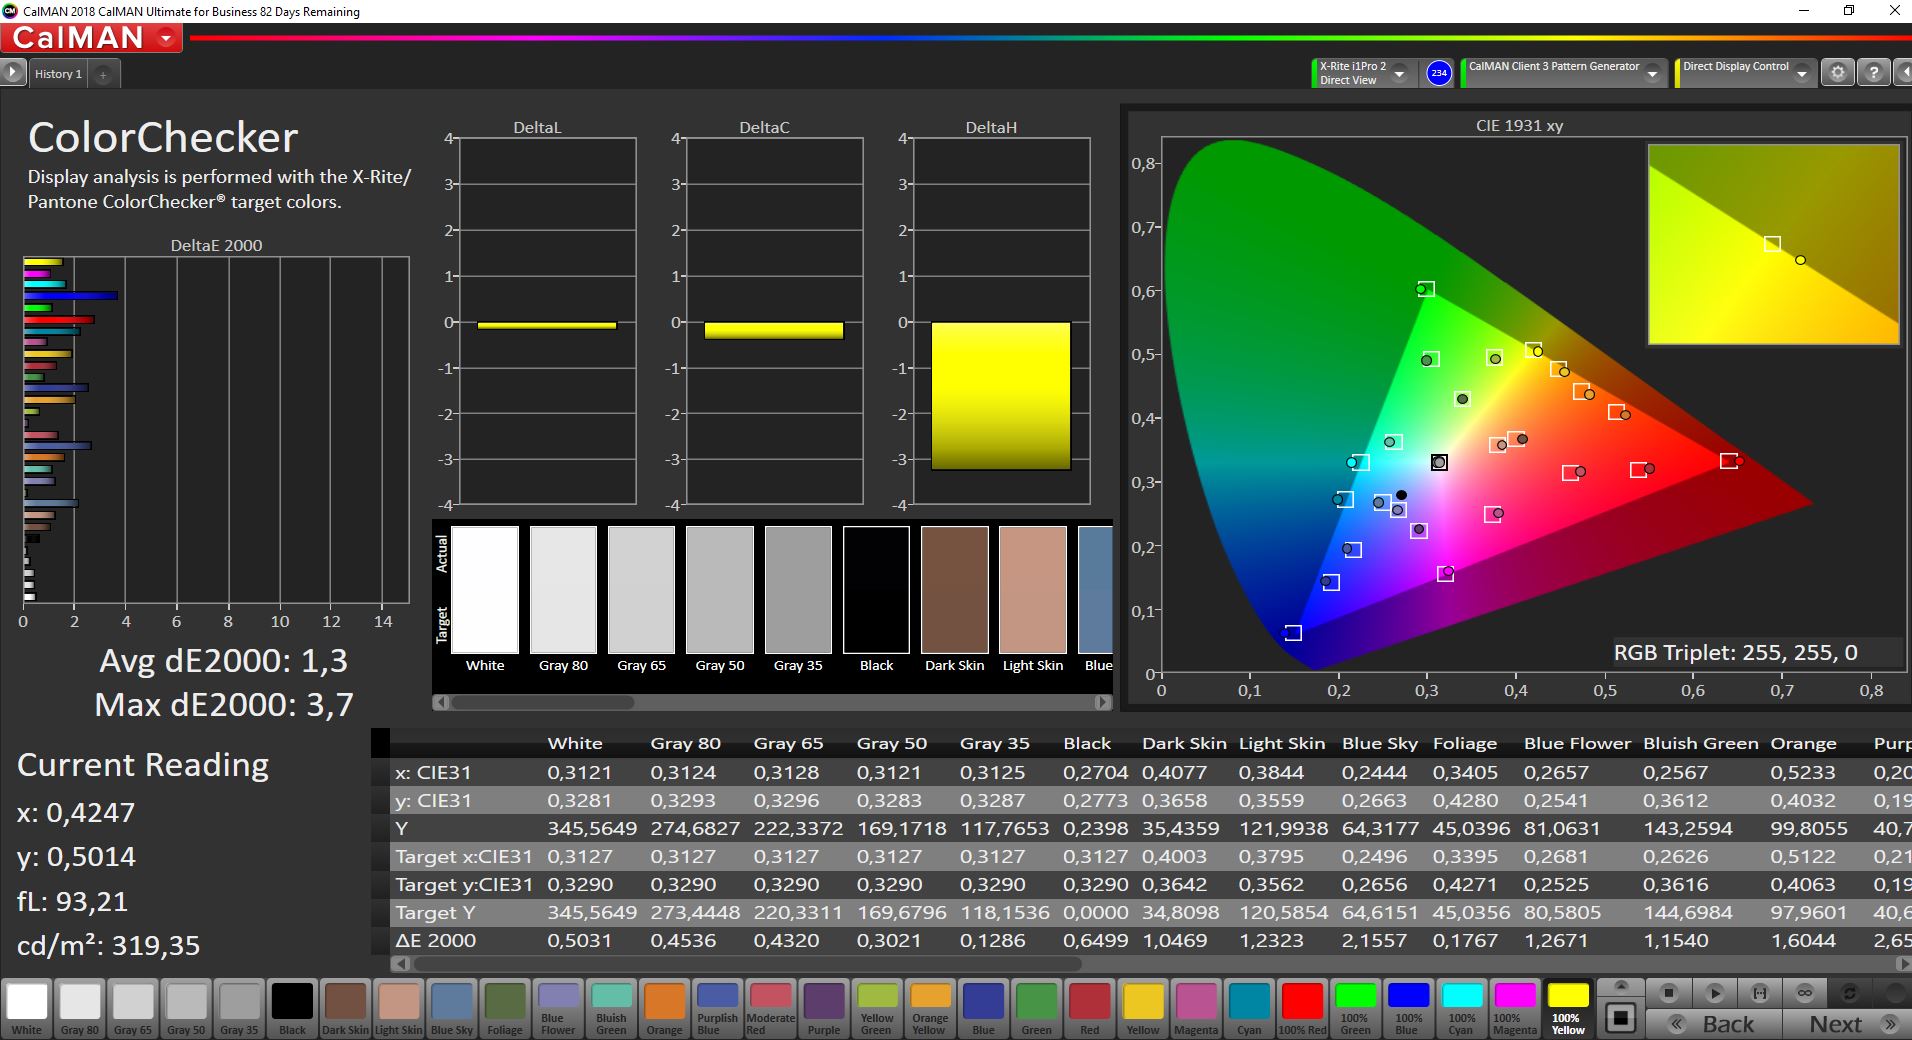
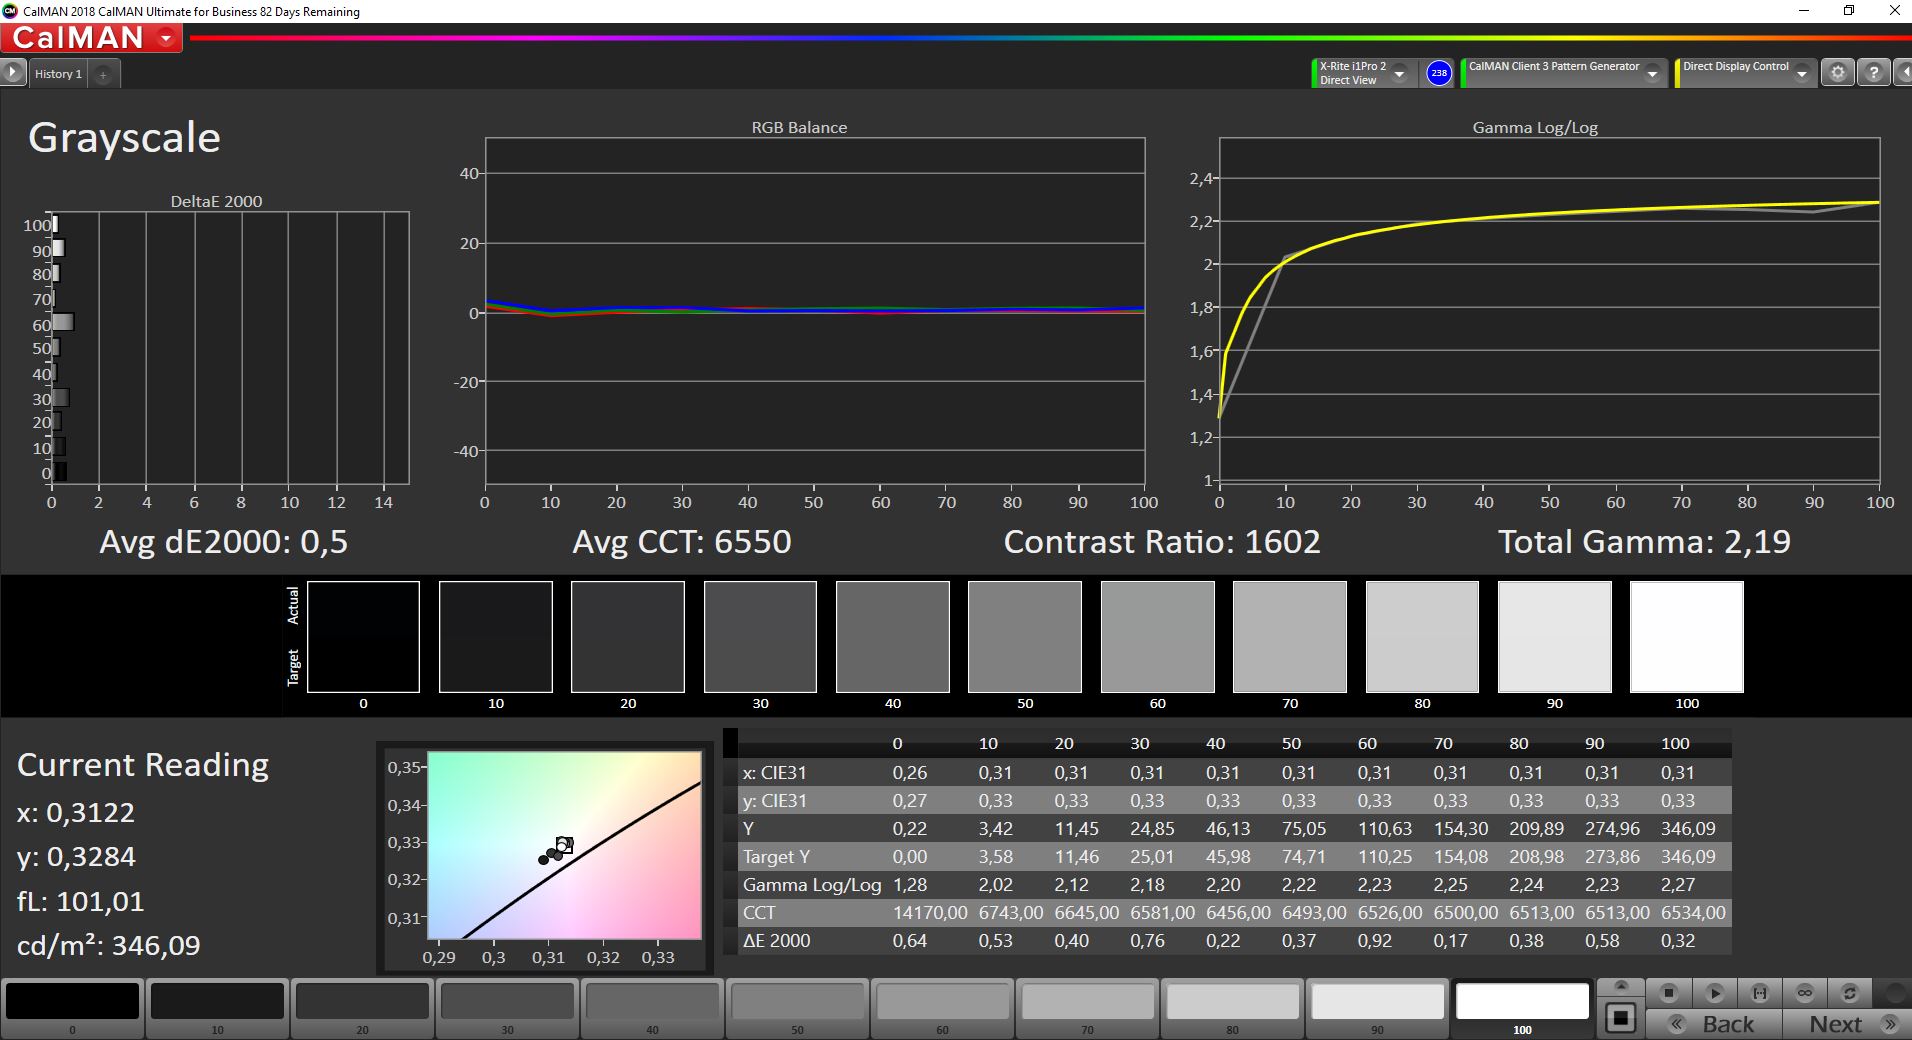
calibrated: 1.3
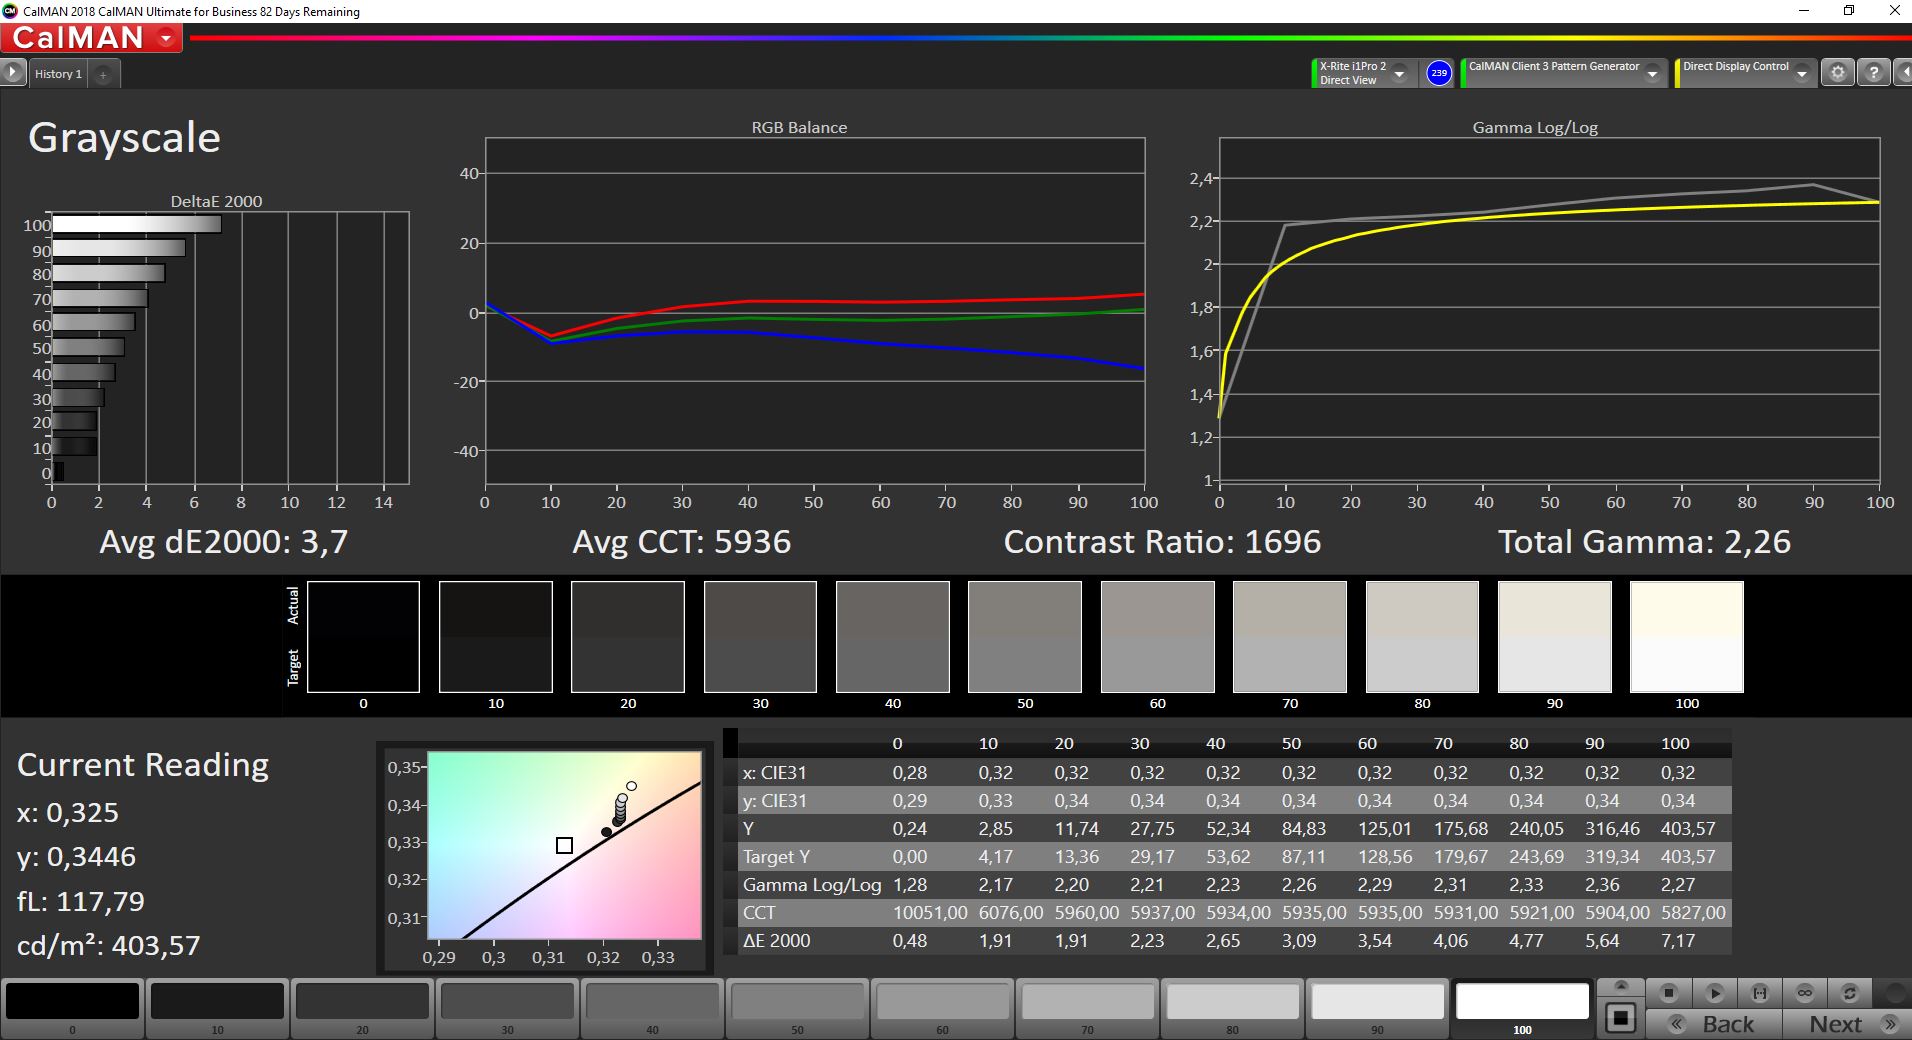
ΔE Greyscale Calman: 3.7 | ∀{0.09-98 Ø5}
72.2% AdobeRGB 1998 (Argyll 3D)
98% sRGB (Argyll 3D)
70.1% Display P3 (Argyll 3D)
Gamma: 2.26
CCT: 5936 K
| Lenovo ThinkBook Plus Gen2 Core i5 CSOT T3 MND307DA1-5 (LCD), IPS, E-Ink, 2560x1600, 13.3" | Lenovo ThinkBook Plus 13 i7 LP133WF7-SPB1, IPS LED, 1920x1080, 13.3" | HP Pavilion Aero 13 be0097nr AU Optronics AUO6496, IPS, 1920x1200, 13.3" | Acer Spin 3 SP313-51N-56YV AU Optronics AUOB493, IPS, 2560x1600, 13.3" | Samsung Galaxy Book Pro 360 13 AMOLED, 1920x1080, 13.2" | |
|---|---|---|---|---|---|
| Display | -5% | 4% | 7% | 26% | |
| Display P3 Coverage (%) | 70.1 | 66 -6% | 73.4 5% | 78.8 12% | 99.4 42% |
| sRGB Coverage (%) | 98 | 96.1 -2% | 99.8 2% | 99.8 2% | 100 2% |
| AdobeRGB 1998 Coverage (%) | 72.2 | 67 -7% | 74.8 4% | 77.6 7% | 96 33% |
| Response Times | -20% | -6% | -25% | 94% | |
| Response Time Grey 50% / Grey 80% * (ms) | 42.8 ? | 53.6 ? -25% | 42.4 ? 1% | 52 ? -21% | 2 ? 95% |
| Response Time Black / White * (ms) | 28 ? | 32 ? -14% | 31.6 ? -13% | 36 ? -29% | 2 ? 93% |
| PWM Frequency (Hz) | 60 ? | ||||
| Screen | -30% | 1% | -32% | 219% | |
| Brightness middle (cd/m²) | 404 | 328 -19% | 473.9 17% | 338 -16% | 287 -29% |
| Brightness (cd/m²) | 388 | 329 -15% | 458 18% | 307 -21% | 289 -26% |
| Brightness Distribution (%) | 94 | 89 -5% | 91 -3% | 83 -12% | 96 2% |
| Black Level * (cd/m²) | 0.24 | 0.21 12% | 0.36 -50% | 0.27 -13% | 0.01 96% |
| Contrast (:1) | 1683 | 1562 -7% | 1316 -22% | 1252 -26% | 28700 1605% |
| Colorchecker dE 2000 * | 3.1 | 6.4 -106% | 2.99 4% | 4.63 -49% | 2.24 28% |
| Colorchecker dE 2000 max. * | 6.9 | 11.2 -62% | 4.35 37% | 9.99 -45% | 3.69 47% |
| Colorchecker dE 2000 calibrated * | 1.3 | 1.2 8% | 1.1 15% | 1.64 -26% | |
| Greyscale dE 2000 * | 3.7 | 6.5 -76% | 4 -8% | 6.76 -83% | 2.73 26% |
| Gamma | 2.26 97% | 2.87 77% | 2.35 94% | 2.37 93% | 2.46 89% |
| CCT | 5936 110% | 6428 101% | 6269 104% | 5934 110% | 6523 100% |
| Color Space (Percent of AdobeRGB 1998) (%) | 61.6 | 68 | |||
| Color Space (Percent of sRGB) (%) | 95.9 | 98 | |||
| Total Average (Program / Settings) | -18% /
-23% | -0% /
1% | -17% /
-23% | 113% /
155% |
* ... smaller is better
Display Response Times
| ↔ Response Time Black to White | ||
|---|---|---|
| 28 ms ... rise ↗ and fall ↘ combined | ↗ 14 ms rise | 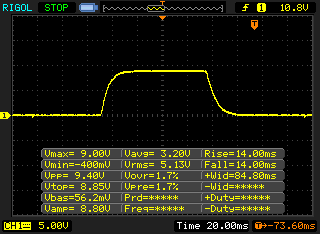 |
| ↘ 14 ms fall | ||
| The screen shows relatively slow response rates in our tests and may be too slow for gamers. In comparison, all tested devices range from 0.1 (minimum) to 240 (maximum) ms. » 70 % of all devices are better. This means that the measured response time is worse than the average of all tested devices (20.2 ms). | ||
| ↔ Response Time 50% Grey to 80% Grey | ||
| 42.8 ms ... rise ↗ and fall ↘ combined | ↗ 21.6 ms rise | 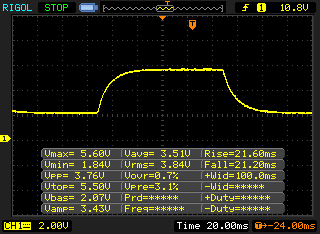 |
| ↘ 21.2 ms fall | ||
| The screen shows slow response rates in our tests and will be unsatisfactory for gamers. In comparison, all tested devices range from 0.165 (minimum) to 636 (maximum) ms. » 70 % of all devices are better. This means that the measured response time is worse than the average of all tested devices (31.5 ms). | ||
Screen Flickering / PWM (Pulse-Width Modulation)
| Screen flickering / PWM not detected | 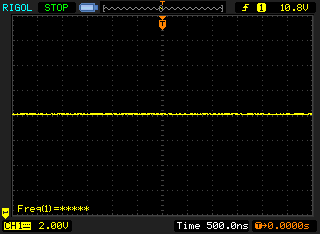 | ||
In comparison: 53 % of all tested devices do not use PWM to dim the display. If PWM was detected, an average of 8070 (minimum: 5 - maximum: 343500) Hz was measured. | |||
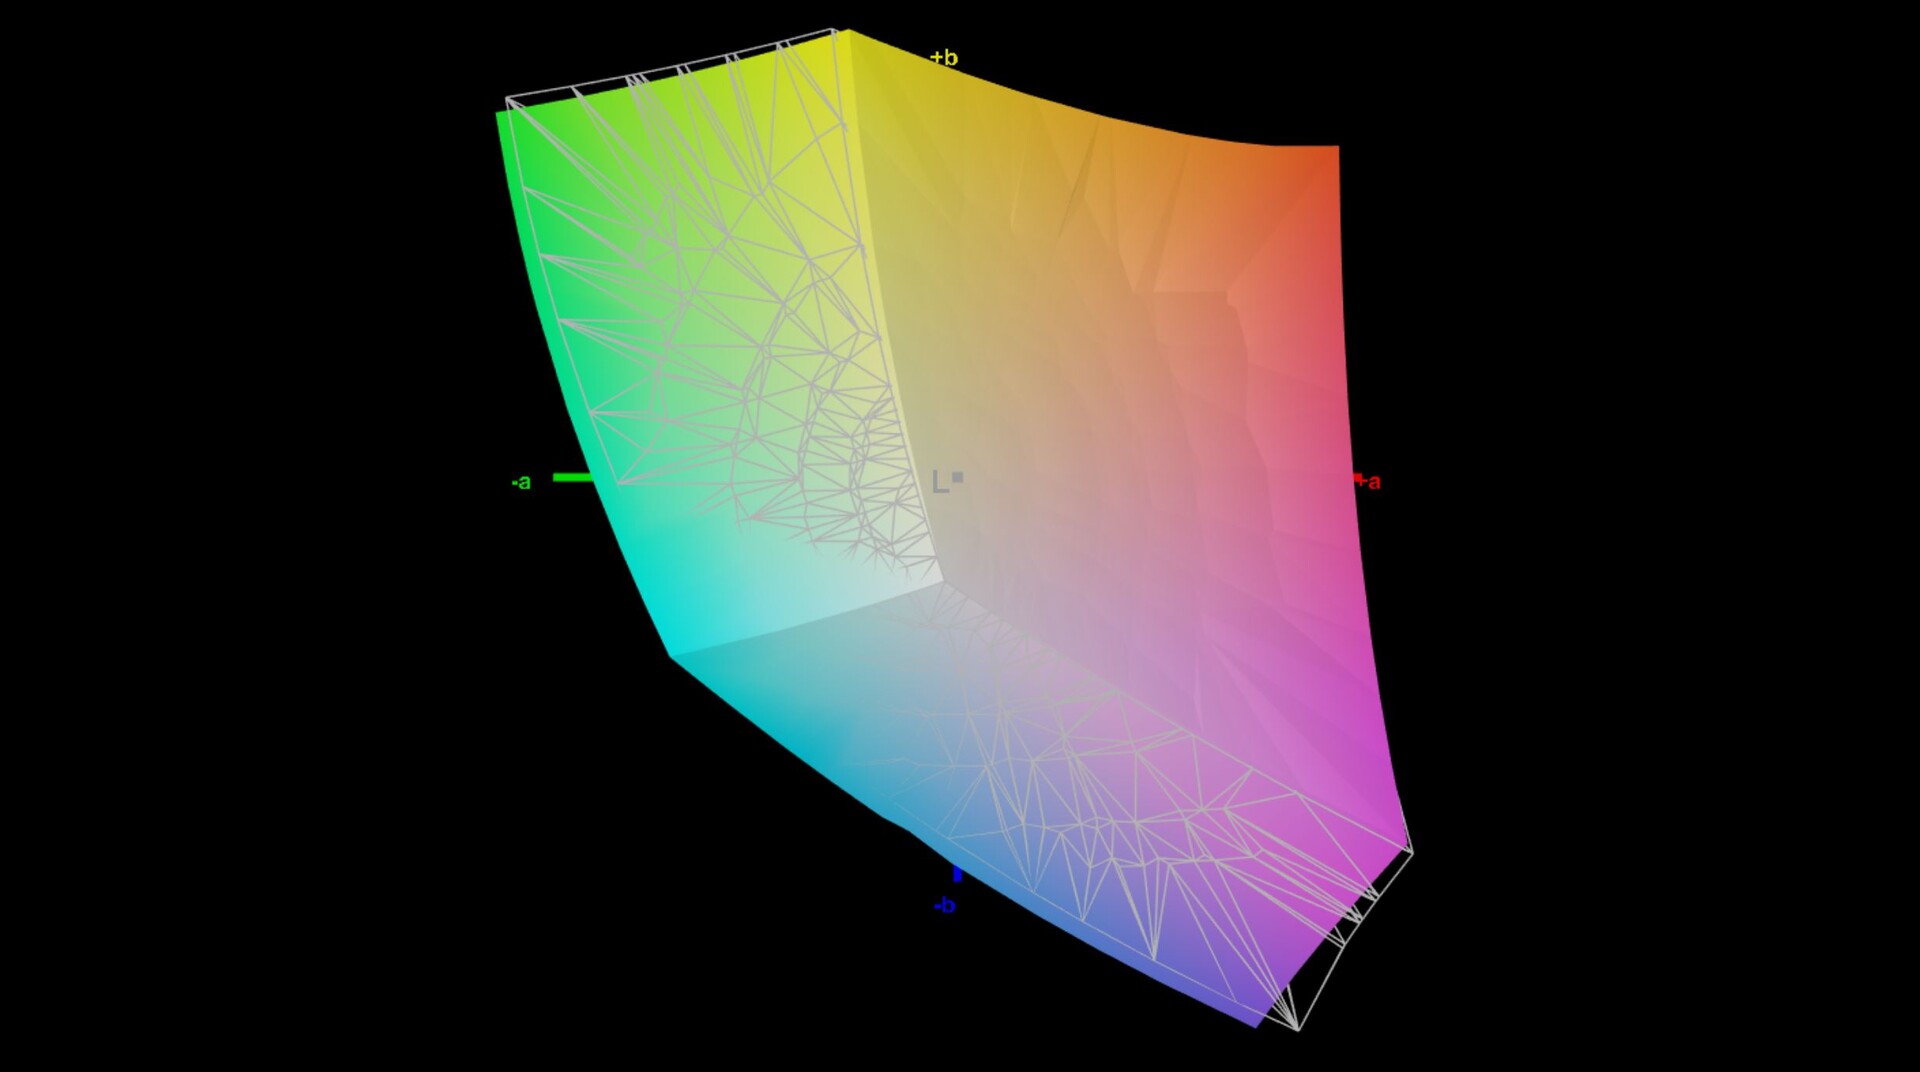
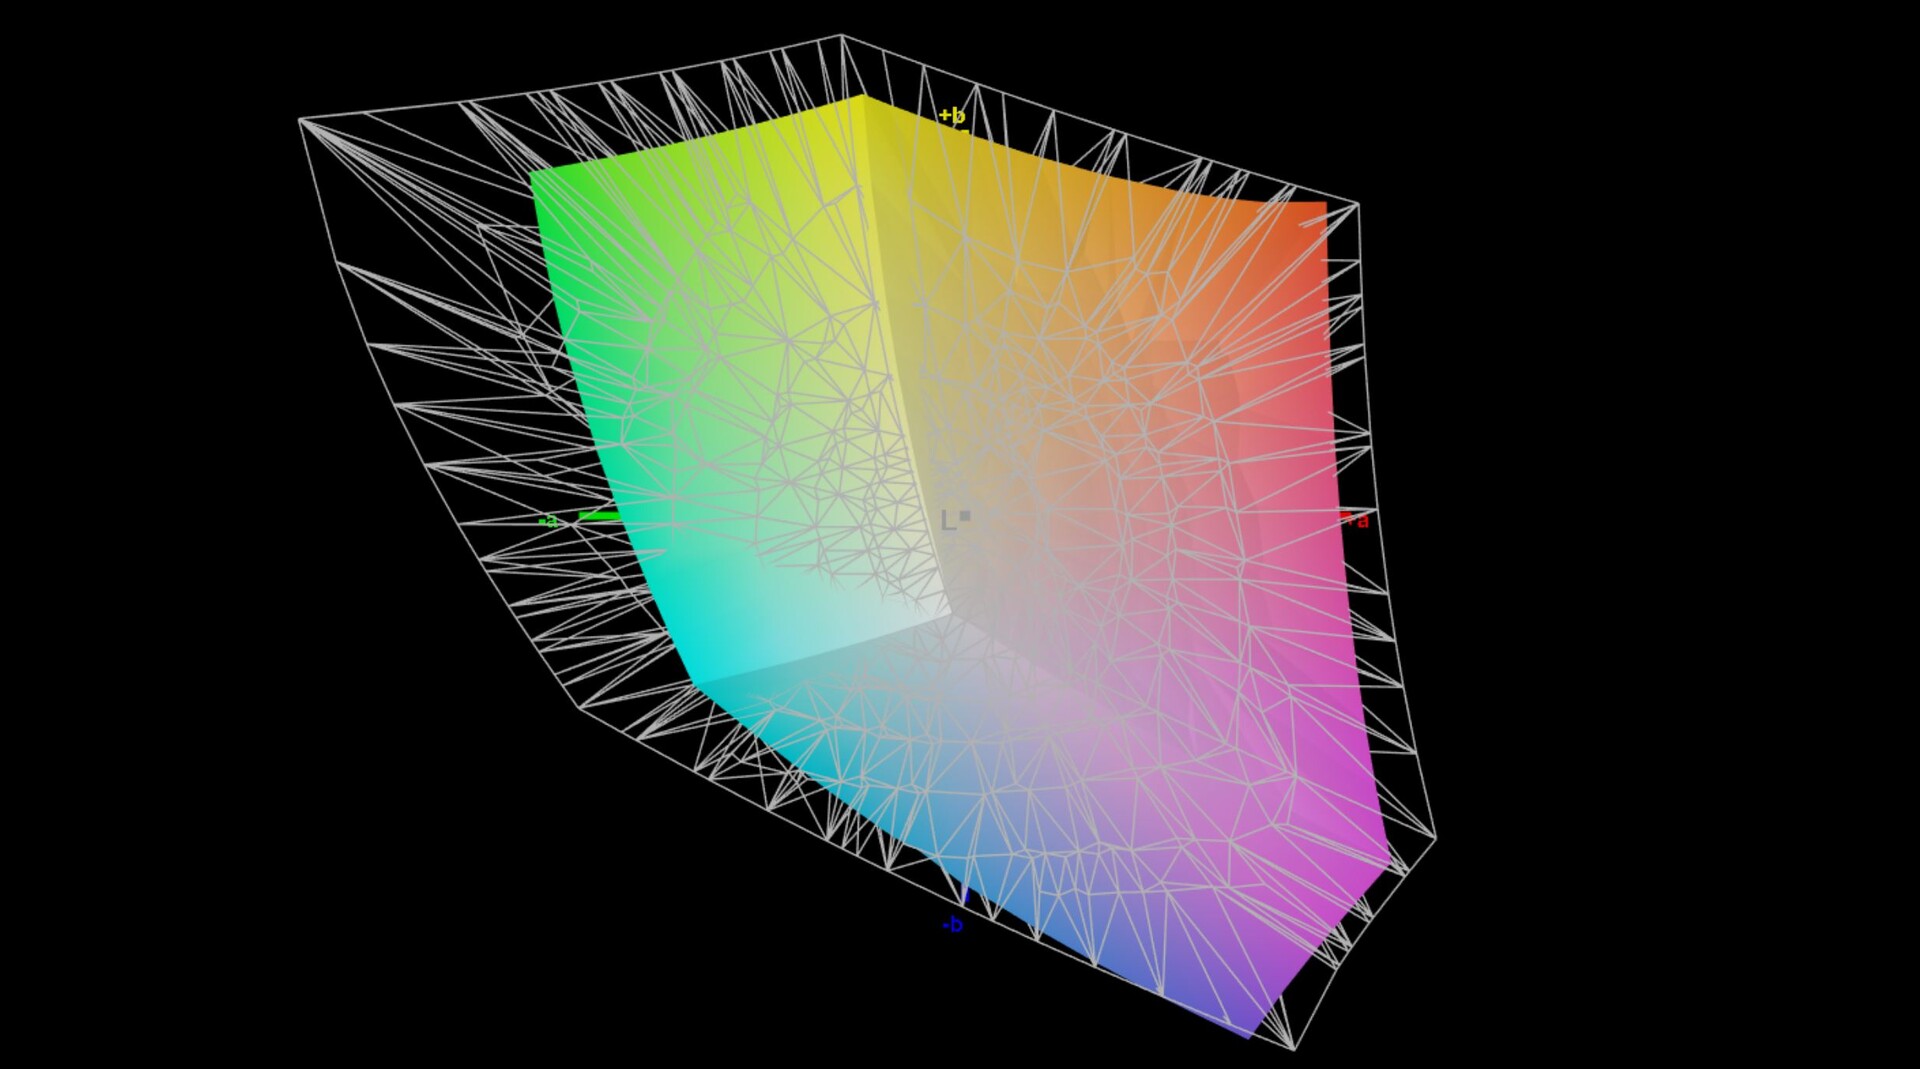
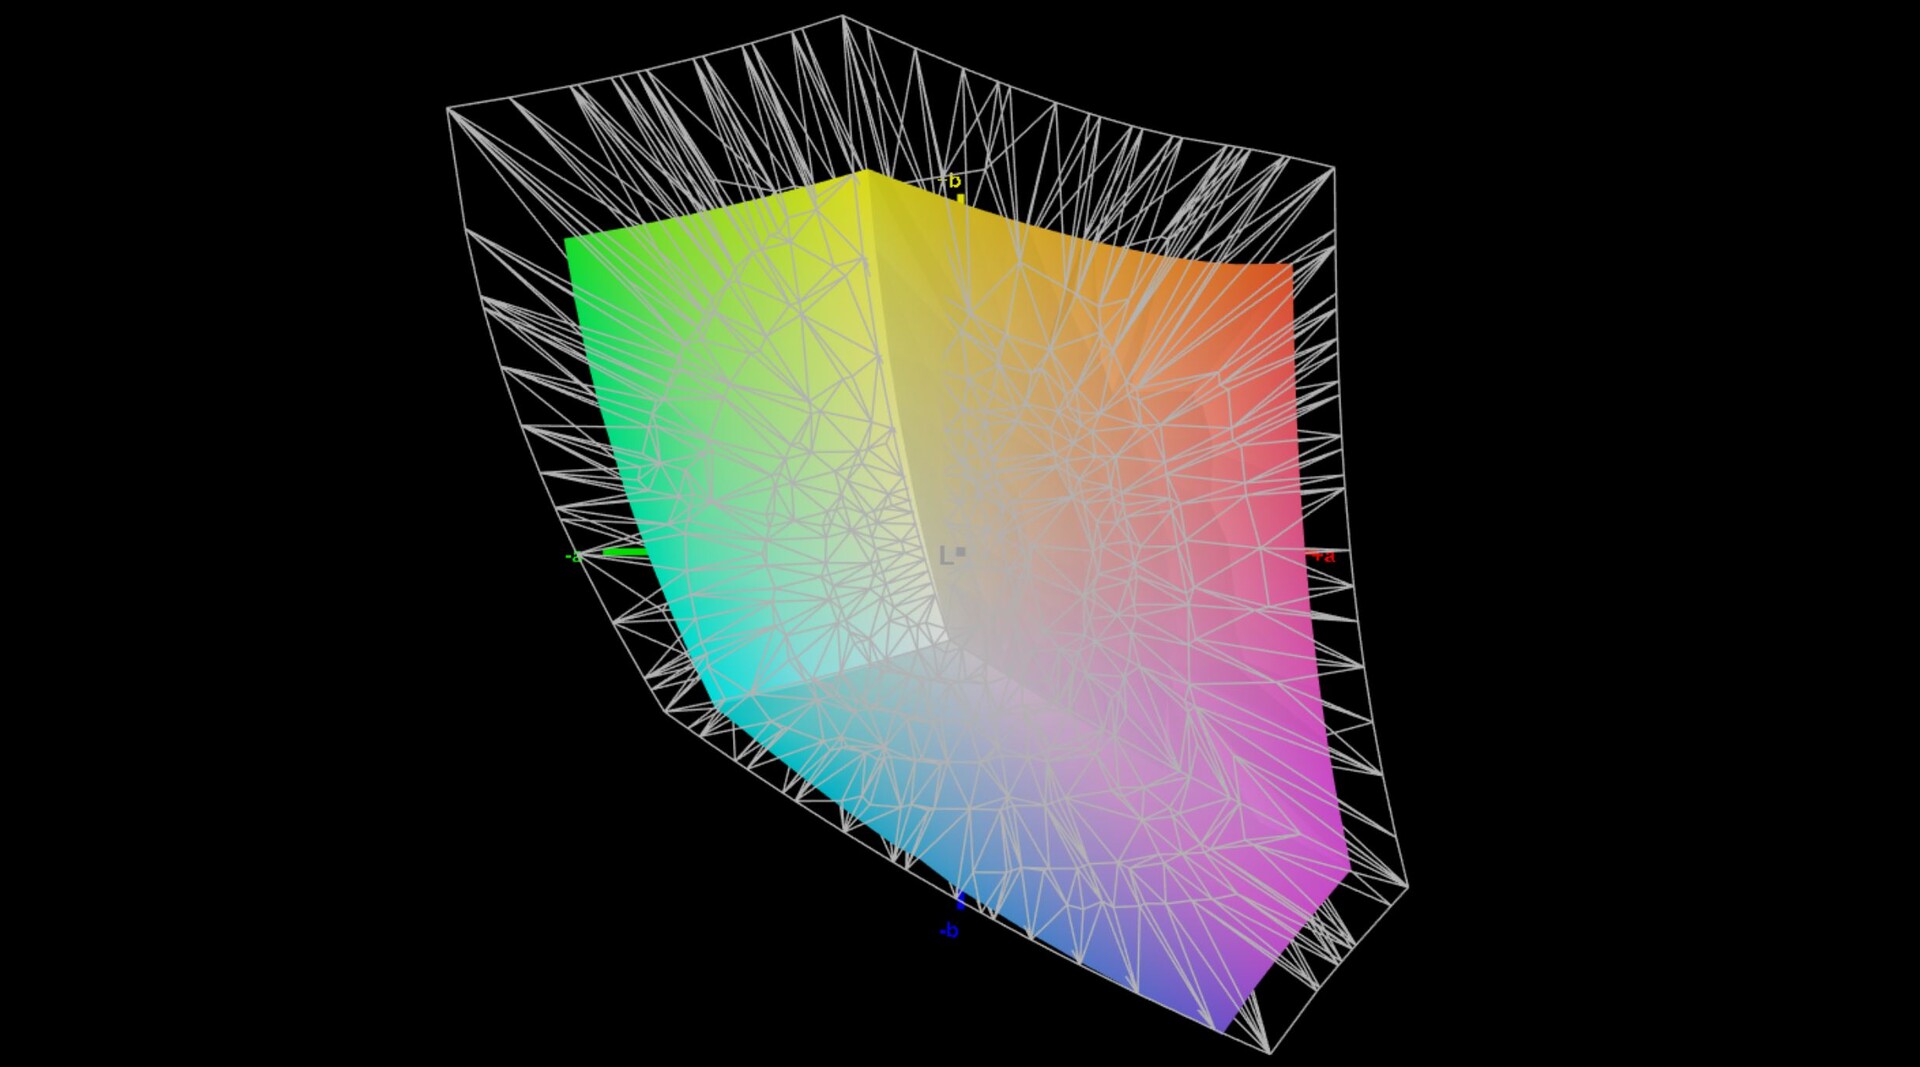

Our measurements certify a very high color space coverage of 98 percent (sRGB) for the ThinkBook Plus Gen2's main screen. The contrast ratio of 1,683:1 is one of the highest in our test field and the black value of 0.24 cd/m² is only slightly higher.
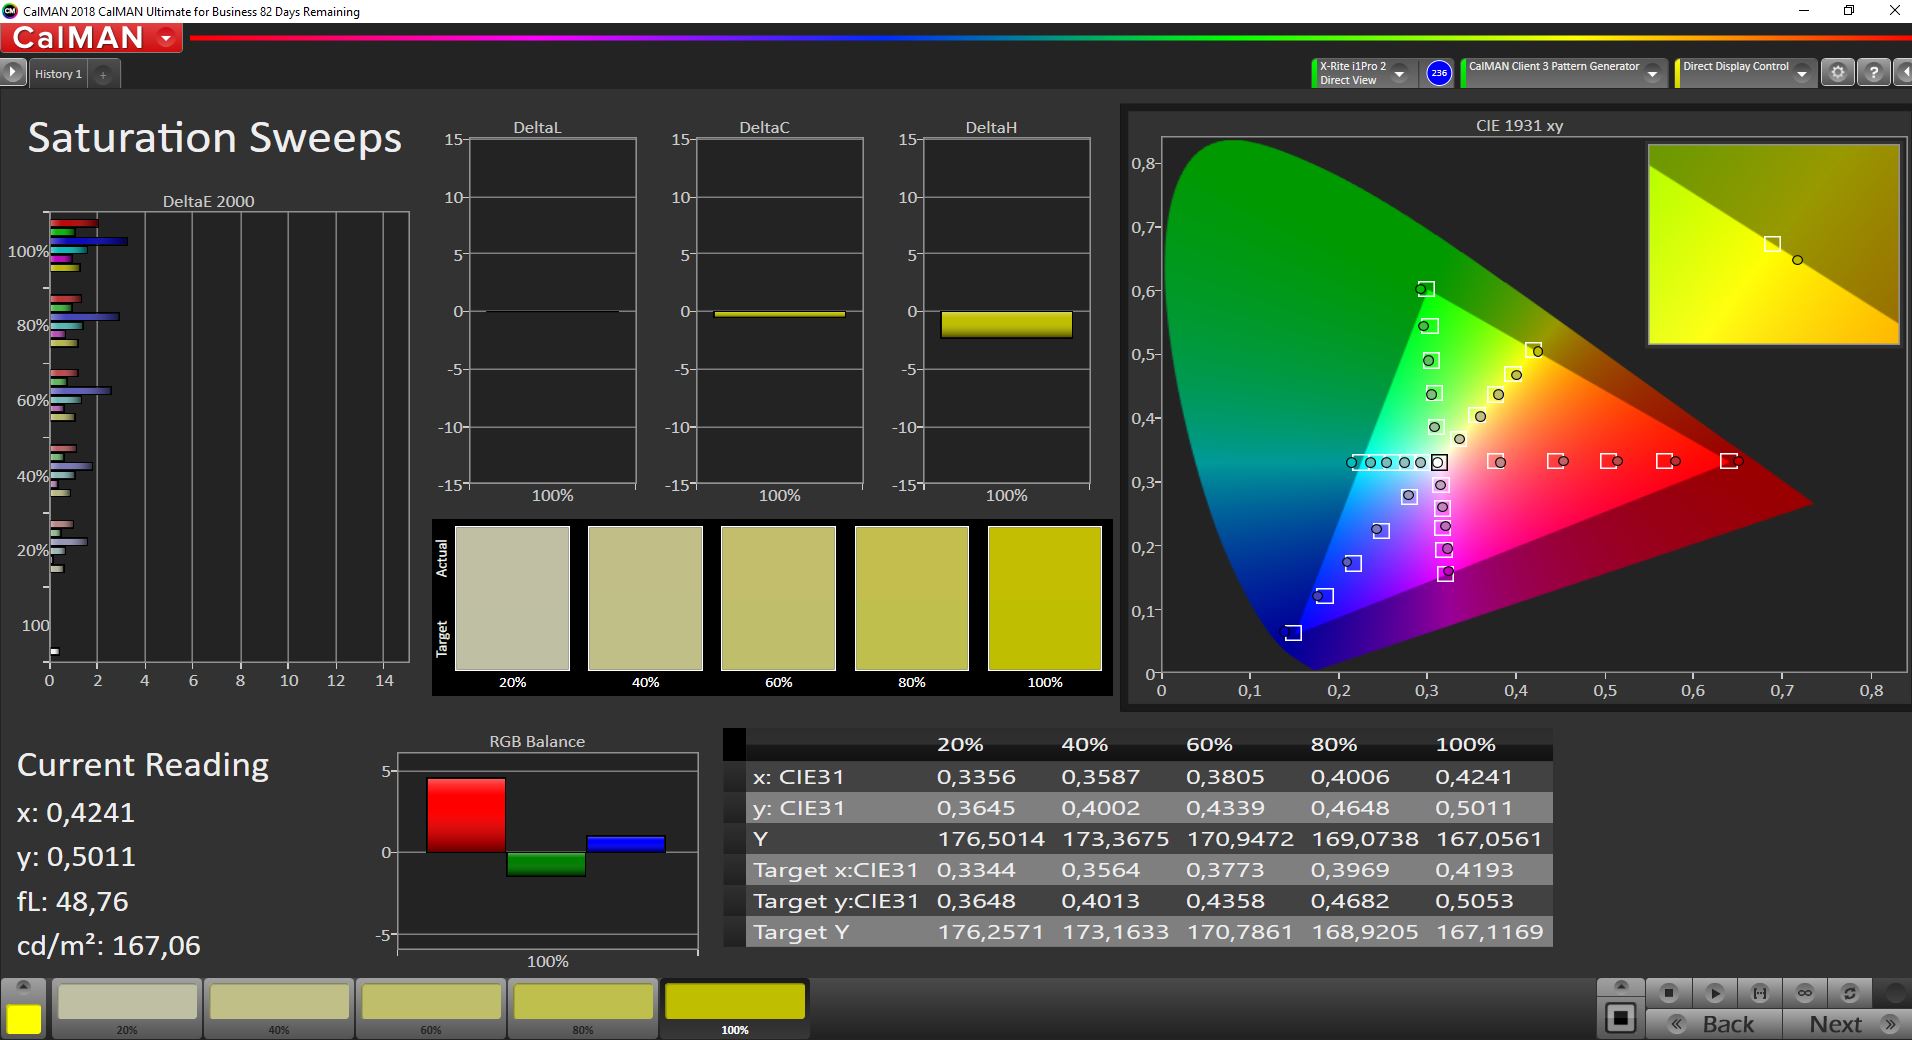
The CalMAN analysis also shows that colors are only displayed with a low DeltaE-2000 deviation of 3.1 ex-factory. This value can be lowered to 1.3 through a calibration. The corresponding ICC file can be downloaded in the upper right window next to the screen illumination graphic.
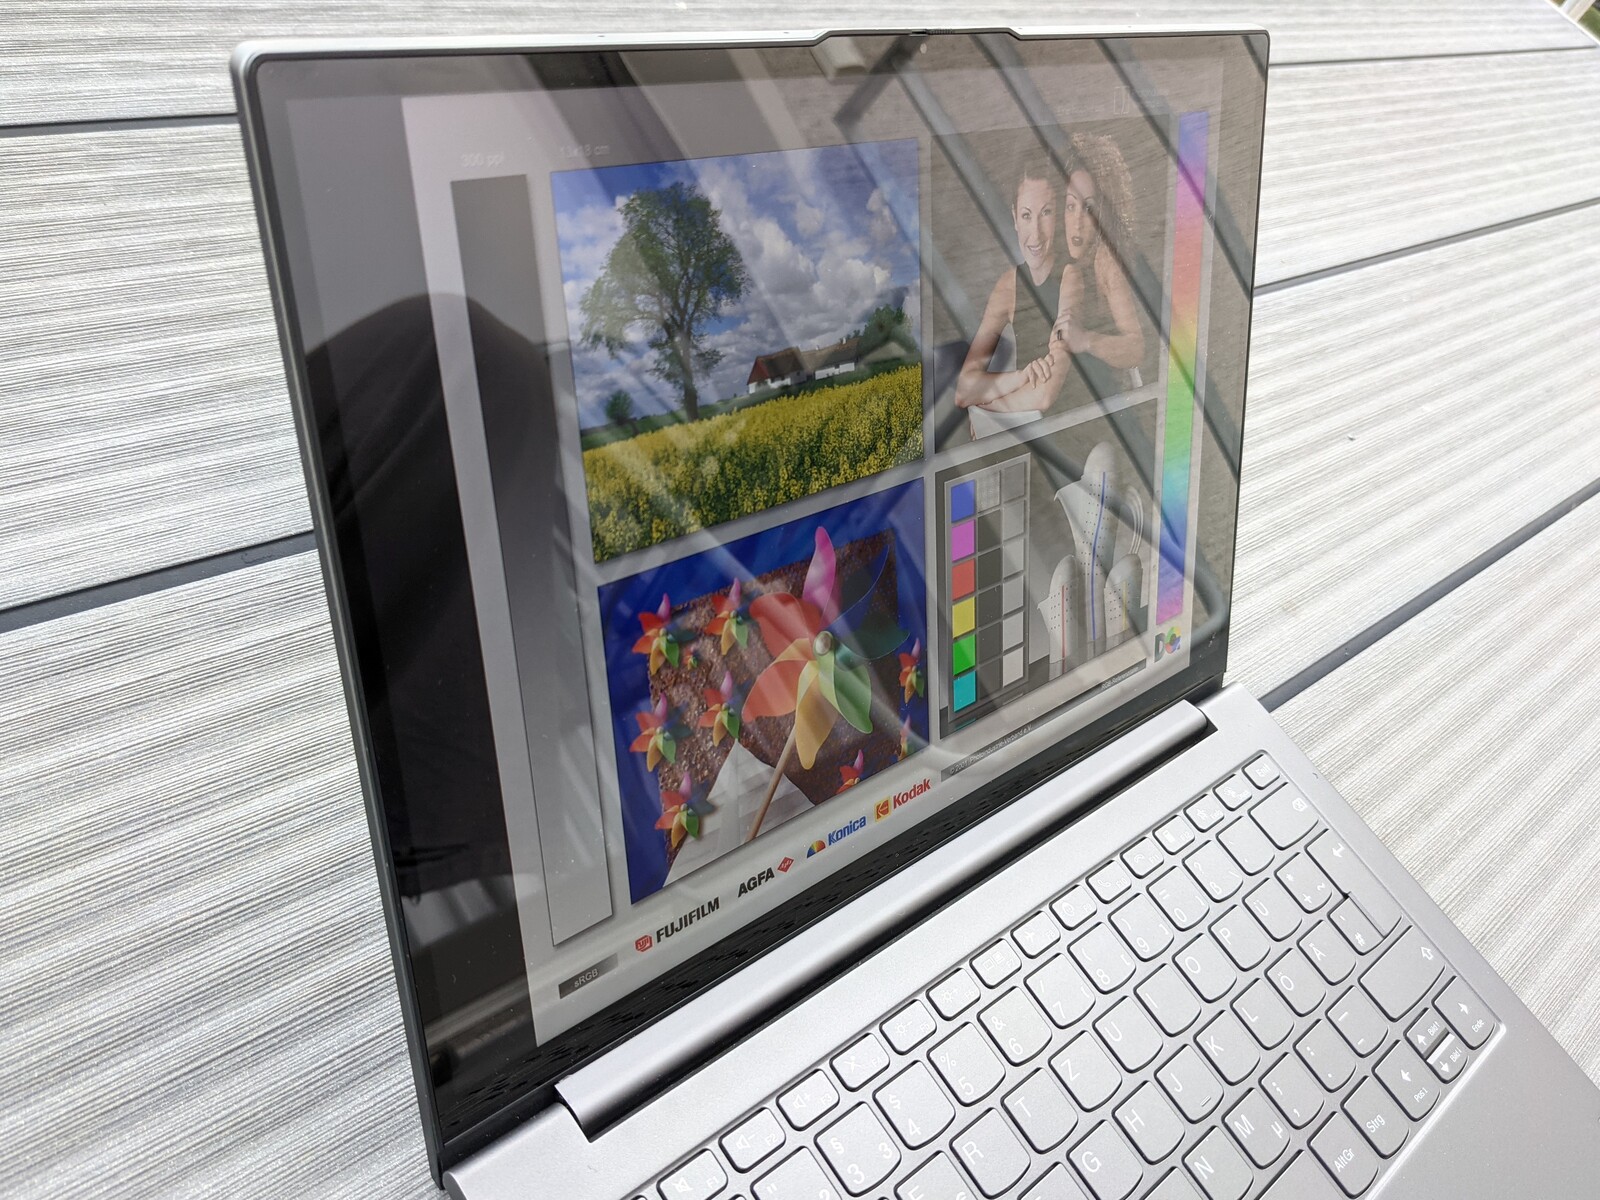
Both the IPS and the E-ink display are very viewing angle stable. Image content can be read well from the main display outdoors. However, its glossy surface causes annoying reflections. This effect is much less pronounced on the external E-ink screen, which is why it is well-suited for consuming content outdoors.

Performance - CPU performance on predecessor level
Lenovo targets the ThinkBook Plus Gen2 at office users who need enough performance for everyday work as well as office applications. Besides the configuration tested here, no other options are offered, which means that only the processor's internal graphics unit is available for graphically more demanding tasks, for example. Lenovo offers different performance modes in the preloaded Vantage app. We performed the following benchmarks and measurements with the "intelligent cooling" preset.
Processor
The here installed Intel Core i5-1130G7 is a processor with four cores that can process up to eight tasks simultaneously. Compared to the "normal" Core i5-1135G7, however, it is a UP4 chip with a lower performance, which is noticeable both in the lower clocks (1.8-4 GHz) and the lower TDP (7-15 watts).
Lenovo uses the PL1 of the i5-1130G7 in the ThinkBook Plus Gen2 to 12 watts, the PL2 to 25 watts. Thus, in our Cinebench R15 permanent load test, a value on par with the Intel Core i7-10510U in the predecessor ThinkBook Plus is reached. The drop in performance is a bit slower in the ThinkBook Plus Gen2, but settles back to the level of the ThinkBook Plus in the long run.
In the individual tests, the results are usually only enough for the lower place in our test field. The level of the Intel Core i5-1135G7 is slightly undercut and the Intel Core i7-10510U of the ThinkPad Plus predecessor is only surpassed in single multi-core tests. The multi-core performance can be increased by about 25% with the optional high-performance mode, but it still remains on a fairly low level overall.
Cinebench R15 Multi Endurance test
Cinebench R20: CPU (Multi Core) | CPU (Single Core)
Cinebench R15: CPU Multi 64Bit | CPU Single 64Bit
Blender: v2.79 BMW27 CPU
7-Zip 18.03: 7z b 4 | 7z b 4 -mmt1
Geekbench 5.5: Multi-Core | Single-Core
HWBOT x265 Benchmark v2.2: 4k Preset
LibreOffice : 20 Documents To PDF
R Benchmark 2.5: Overall mean
| Cinebench R23 / Multi Core | |
| Average of class Subnotebook (1555 - 21812, n=71, last 2 years) | |
| HP Pavilion Aero 13 be0097nr | |
| Acer Spin 3 SP313-51N-56YV | |
| Samsung Galaxy Book Pro 360 13 | |
| Samsung Galaxy Book Pro 360 13 | |
| Lenovo ThinkBook Plus Gen2 Core i5 | |
| Average Intel Core i5-1130G7 (2237 - 3240, n=2) | |
| Cinebench R23 / Single Core | |
| Average of class Subnotebook (358 - 2165, n=72, last 2 years) | |
| HP Pavilion Aero 13 be0097nr | |
| Acer Spin 3 SP313-51N-56YV | |
| Samsung Galaxy Book Pro 360 13 | |
| Samsung Galaxy Book Pro 360 13 | |
| Lenovo ThinkBook Plus Gen2 Core i5 | |
| Average Intel Core i5-1130G7 (1077 - 1226, n=2) | |
| Cinebench R20 / CPU (Multi Core) | |
| Average of class Subnotebook (579 - 8541, n=66, last 2 years) | |
| HP Pavilion Aero 13 be0097nr | |
| Acer Spin 3 SP313-51N-56YV | |
| Lenovo ThinkBook Plus 13 i7 | |
| Lenovo ThinkBook Plus 13 i7 | |
| Samsung Galaxy Book Pro 360 13 | |
| Samsung Galaxy Book Pro 360 13 | |
| Lenovo ThinkBook Plus Gen2 Core i5 | |
| Average Intel Core i5-1130G7 (870 - 1251, n=2) | |
| Cinebench R20 / CPU (Single Core) | |
| Average of class Subnotebook (128 - 826, n=66, last 2 years) | |
| HP Pavilion Aero 13 be0097nr | |
| Acer Spin 3 SP313-51N-56YV | |
| Samsung Galaxy Book Pro 360 13 | |
| Samsung Galaxy Book Pro 360 13 | |
| Lenovo ThinkBook Plus Gen2 Core i5 | |
| Average Intel Core i5-1130G7 (418 - 478, n=2) | |
| Lenovo ThinkBook Plus 13 i7 | |
| Cinebench R15 / CPU Multi 64Bit | |
| Average of class Subnotebook (327 - 3345, n=66, last 2 years) | |
| HP Pavilion Aero 13 be0097nr | |
| Acer Spin 3 SP313-51N-56YV | |
| Lenovo ThinkBook Plus 13 i7 | |
| Lenovo ThinkBook Plus 13 i7 | |
| Samsung Galaxy Book Pro 360 13 | |
| Samsung Galaxy Book Pro 360 13 | |
| Lenovo ThinkBook Plus Gen2 Core i5 | |
| Lenovo ThinkBook Plus Gen2 Core i5 | |
| Average Intel Core i5-1130G7 (564 - 700, n=4) | |
| Cinebench R15 / CPU Single 64Bit | |
| Average of class Subnotebook (72.4 - 322, n=66, last 2 years) | |
| HP Pavilion Aero 13 be0097nr | |
| Acer Spin 3 SP313-51N-56YV | |
| Samsung Galaxy Book Pro 360 13 | |
| Samsung Galaxy Book Pro 360 13 | |
| Lenovo ThinkBook Plus Gen2 Core i5 | |
| Lenovo ThinkBook Plus Gen2 Core i5 | |
| Average Intel Core i5-1130G7 (114 - 189.7, n=3) | |
| Lenovo ThinkBook Plus 13 i7 | |
| Blender / v2.79 BMW27 CPU | |
| Average Intel Core i5-1130G7 (1124 - 1255, n=2) | |
| Lenovo ThinkBook Plus Gen2 Core i5 | |
| Samsung Galaxy Book Pro 360 13 | |
| Lenovo ThinkBook Plus 13 i7 | |
| Acer Spin 3 SP313-51N-56YV | |
| Average of class Subnotebook (159 - 2271, n=69, last 2 years) | |
| HP Pavilion Aero 13 be0097nr | |
| 7-Zip 18.03 / 7z b 4 | |
| Average of class Subnotebook (11668 - 77867, n=66, last 2 years) | |
| HP Pavilion Aero 13 be0097nr | |
| Samsung Galaxy Book Pro 360 13 | |
| Samsung Galaxy Book Pro 360 13 | |
| Acer Spin 3 SP313-51N-56YV | |
| Lenovo ThinkBook Plus 13 i7 | |
| Average Intel Core i5-1130G7 (14453 - 14999, n=2) | |
| Lenovo ThinkBook Plus Gen2 Core i5 | |
| 7-Zip 18.03 / 7z b 4 -mmt1 | |
| Average of class Subnotebook (2643 - 6442, n=68, last 2 years) | |
| HP Pavilion Aero 13 be0097nr | |
| Acer Spin 3 SP313-51N-56YV | |
| Samsung Galaxy Book Pro 360 13 | |
| Samsung Galaxy Book Pro 360 13 | |
| Lenovo ThinkBook Plus 13 i7 | |
| Lenovo ThinkBook Plus Gen2 Core i5 | |
| Average Intel Core i5-1130G7 (4094 - 4256, n=2) | |
| Geekbench 5.5 / Multi-Core | |
| Average of class Subnotebook (2557 - 17218, n=61, last 2 years) | |
| Acer Spin 3 SP313-51N-56YV | |
| Lenovo ThinkBook Plus Gen2 Core i5 | |
| Average Intel Core i5-1130G7 (4710 - 4894, n=2) | |
| Lenovo ThinkBook Plus 13 i7 | |
| Geekbench 5.5 / Single-Core | |
| Average of class Subnotebook (726 - 2350, n=61, last 2 years) | |
| Acer Spin 3 SP313-51N-56YV | |
| Average Intel Core i5-1130G7 (1306 - 1337, n=2) | |
| Lenovo ThinkBook Plus Gen2 Core i5 | |
| Lenovo ThinkBook Plus 13 i7 | |
| HWBOT x265 Benchmark v2.2 / 4k Preset | |
| Average of class Subnotebook (0.97 - 25.1, n=66, last 2 years) | |
| HP Pavilion Aero 13 be0097nr | |
| Acer Spin 3 SP313-51N-56YV | |
| Lenovo ThinkBook Plus 13 i7 | |
| Samsung Galaxy Book Pro 360 13 | |
| Average Intel Core i5-1130G7 (n=1) | |
| LibreOffice / 20 Documents To PDF | |
| Lenovo ThinkBook Plus 13 i7 | |
| Lenovo ThinkBook Plus Gen2 Core i5 | |
| Average Intel Core i5-1130G7 (57.7 - 58.9, n=2) | |
| Average of class Subnotebook (38.5 - 220, n=65, last 2 years) | |
| Samsung Galaxy Book Pro 360 13 | |
| Samsung Galaxy Book Pro 360 13 | |
| HP Pavilion Aero 13 be0097nr | |
| Acer Spin 3 SP313-51N-56YV | |
| R Benchmark 2.5 / Overall mean | |
| Average Intel Core i5-1130G7 (0.714 - 0.753, n=2) | |
| Lenovo ThinkBook Plus Gen2 Core i5 | |
| Lenovo ThinkBook Plus 13 i7 | |
| Samsung Galaxy Book Pro 360 13 | |
| Acer Spin 3 SP313-51N-56YV | |
| HP Pavilion Aero 13 be0097nr | |
| Average of class Subnotebook (0.403 - 1.456, n=67, last 2 years) | |
* ... smaller is better
System performance
In the PCMark 10 test for evaluating the system performance, the ThinkBook Plus Gen2 achieved a result that was about 10 percent better than the predecessor ThinkBook Plus. Especially the very good Essentials score stands out here, which can lead our test field.
In everyday use, Lenovo's notebook always delivered a smooth system performance and both launching programs and accessing files was fast.
| PCMark 10 / Score | |
| Average of class Subnotebook (4920 - 8424, n=53, last 2 years) | |
| HP Pavilion Aero 13 be0097nr | |
| Acer Spin 3 SP313-51N-56YV | |
| Samsung Galaxy Book Pro 360 13 | |
| Lenovo ThinkBook Plus Gen2 Core i5 | |
| Average Intel Core i5-1130G7, Intel Iris Xe Graphics G7 80EUs (4082 - 4482, n=2) | |
| Lenovo ThinkBook Plus 13 i7 | |
| PCMark 10 / Essentials | |
| Average of class Subnotebook (8552 - 11406, n=53, last 2 years) | |
| Lenovo ThinkBook Plus Gen2 Core i5 | |
| HP Pavilion Aero 13 be0097nr | |
| Acer Spin 3 SP313-51N-56YV | |
| Average Intel Core i5-1130G7, Intel Iris Xe Graphics G7 80EUs (8873 - 10226, n=2) | |
| Samsung Galaxy Book Pro 360 13 | |
| Lenovo ThinkBook Plus 13 i7 | |
| PCMark 10 / Productivity | |
| Average of class Subnotebook (5435 - 16132, n=53, last 2 years) | |
| HP Pavilion Aero 13 be0097nr | |
| Lenovo ThinkBook Plus 13 i7 | |
| Samsung Galaxy Book Pro 360 13 | |
| Acer Spin 3 SP313-51N-56YV | |
| Lenovo ThinkBook Plus Gen2 Core i5 | |
| Average Intel Core i5-1130G7, Intel Iris Xe Graphics G7 80EUs (5875 - 6004, n=2) | |
| PCMark 10 / Digital Content Creation | |
| Average of class Subnotebook (5722 - 12442, n=53, last 2 years) | |
| HP Pavilion Aero 13 be0097nr | |
| Acer Spin 3 SP313-51N-56YV | |
| Samsung Galaxy Book Pro 360 13 | |
| Lenovo ThinkBook Plus Gen2 Core i5 | |
| Average Intel Core i5-1130G7, Intel Iris Xe Graphics G7 80EUs (3543 - 3982, n=2) | |
| Lenovo ThinkBook Plus 13 i7 | |
| PCMark 10 Score | 4482 points | |
Help | ||
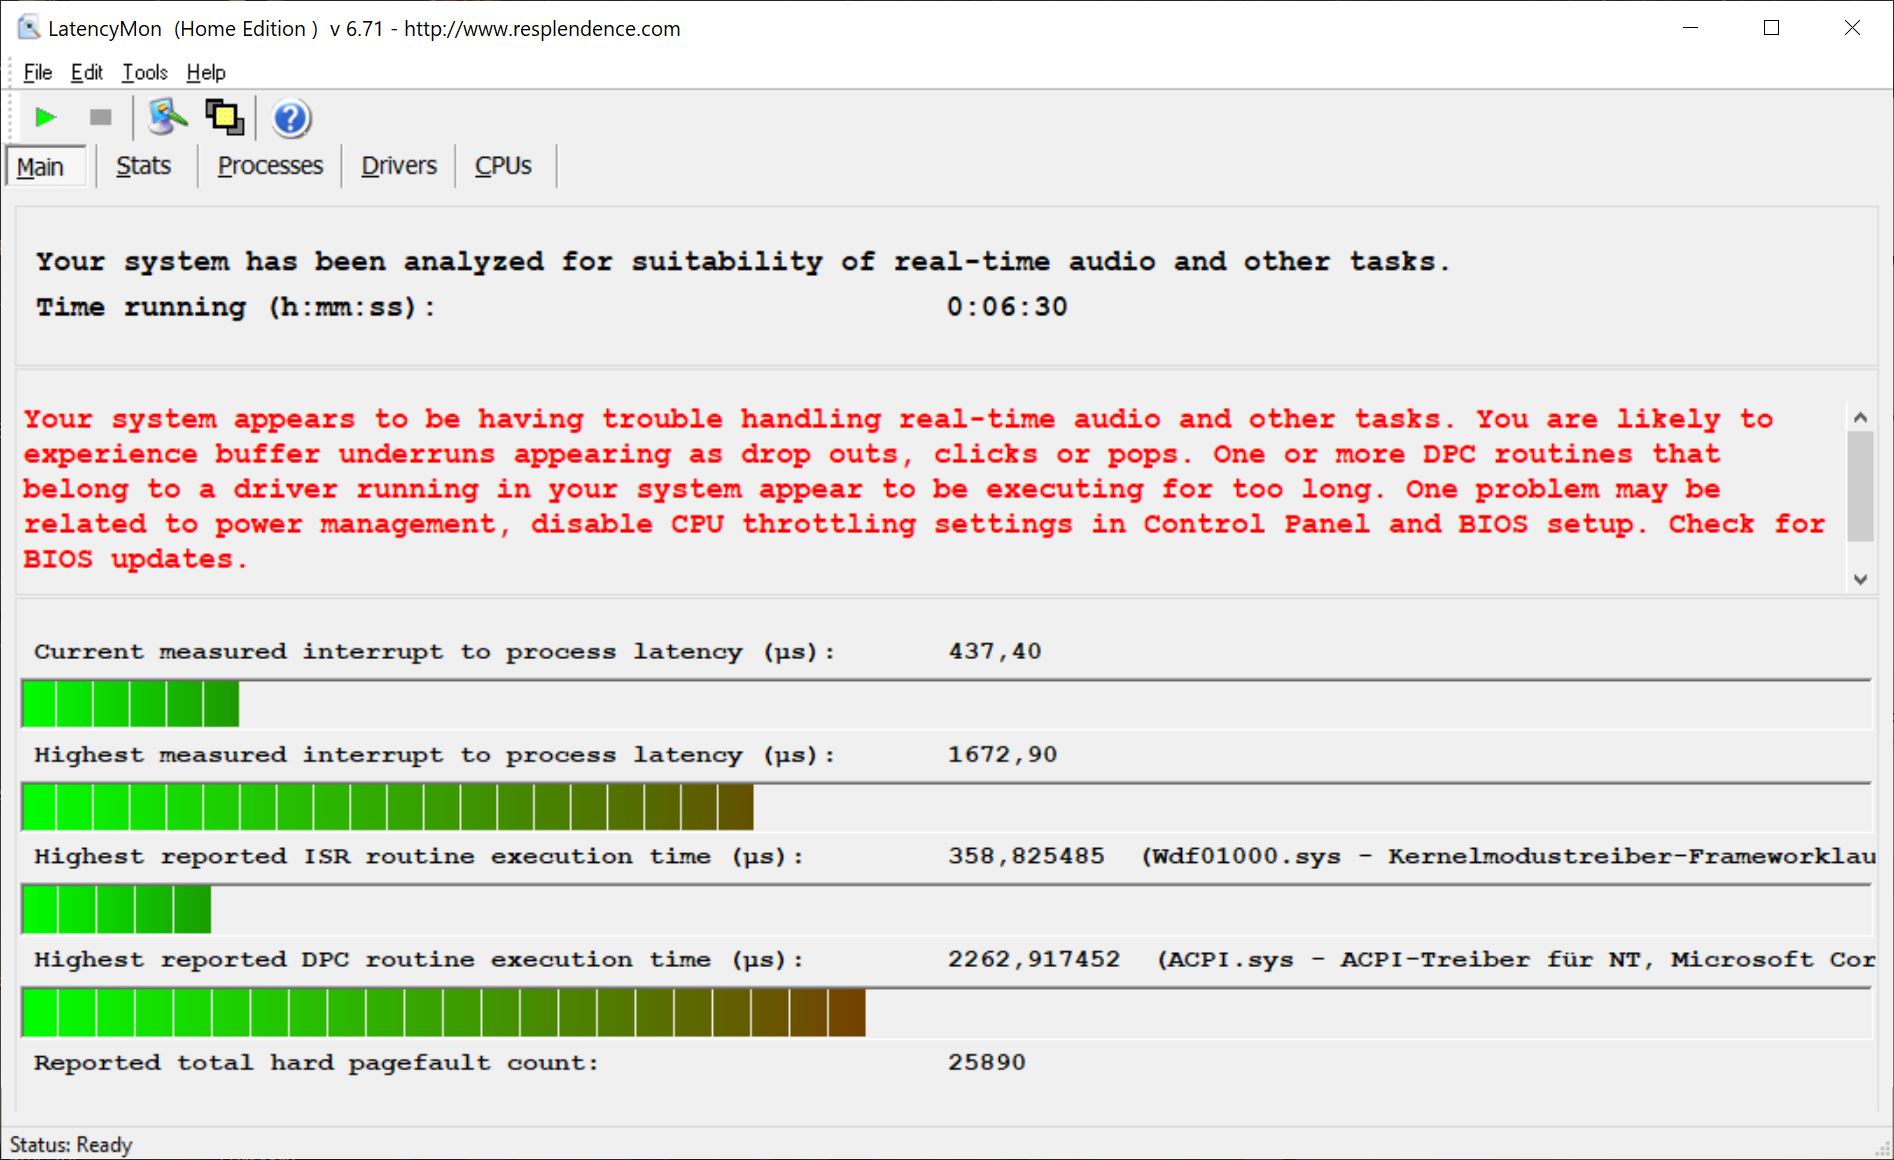
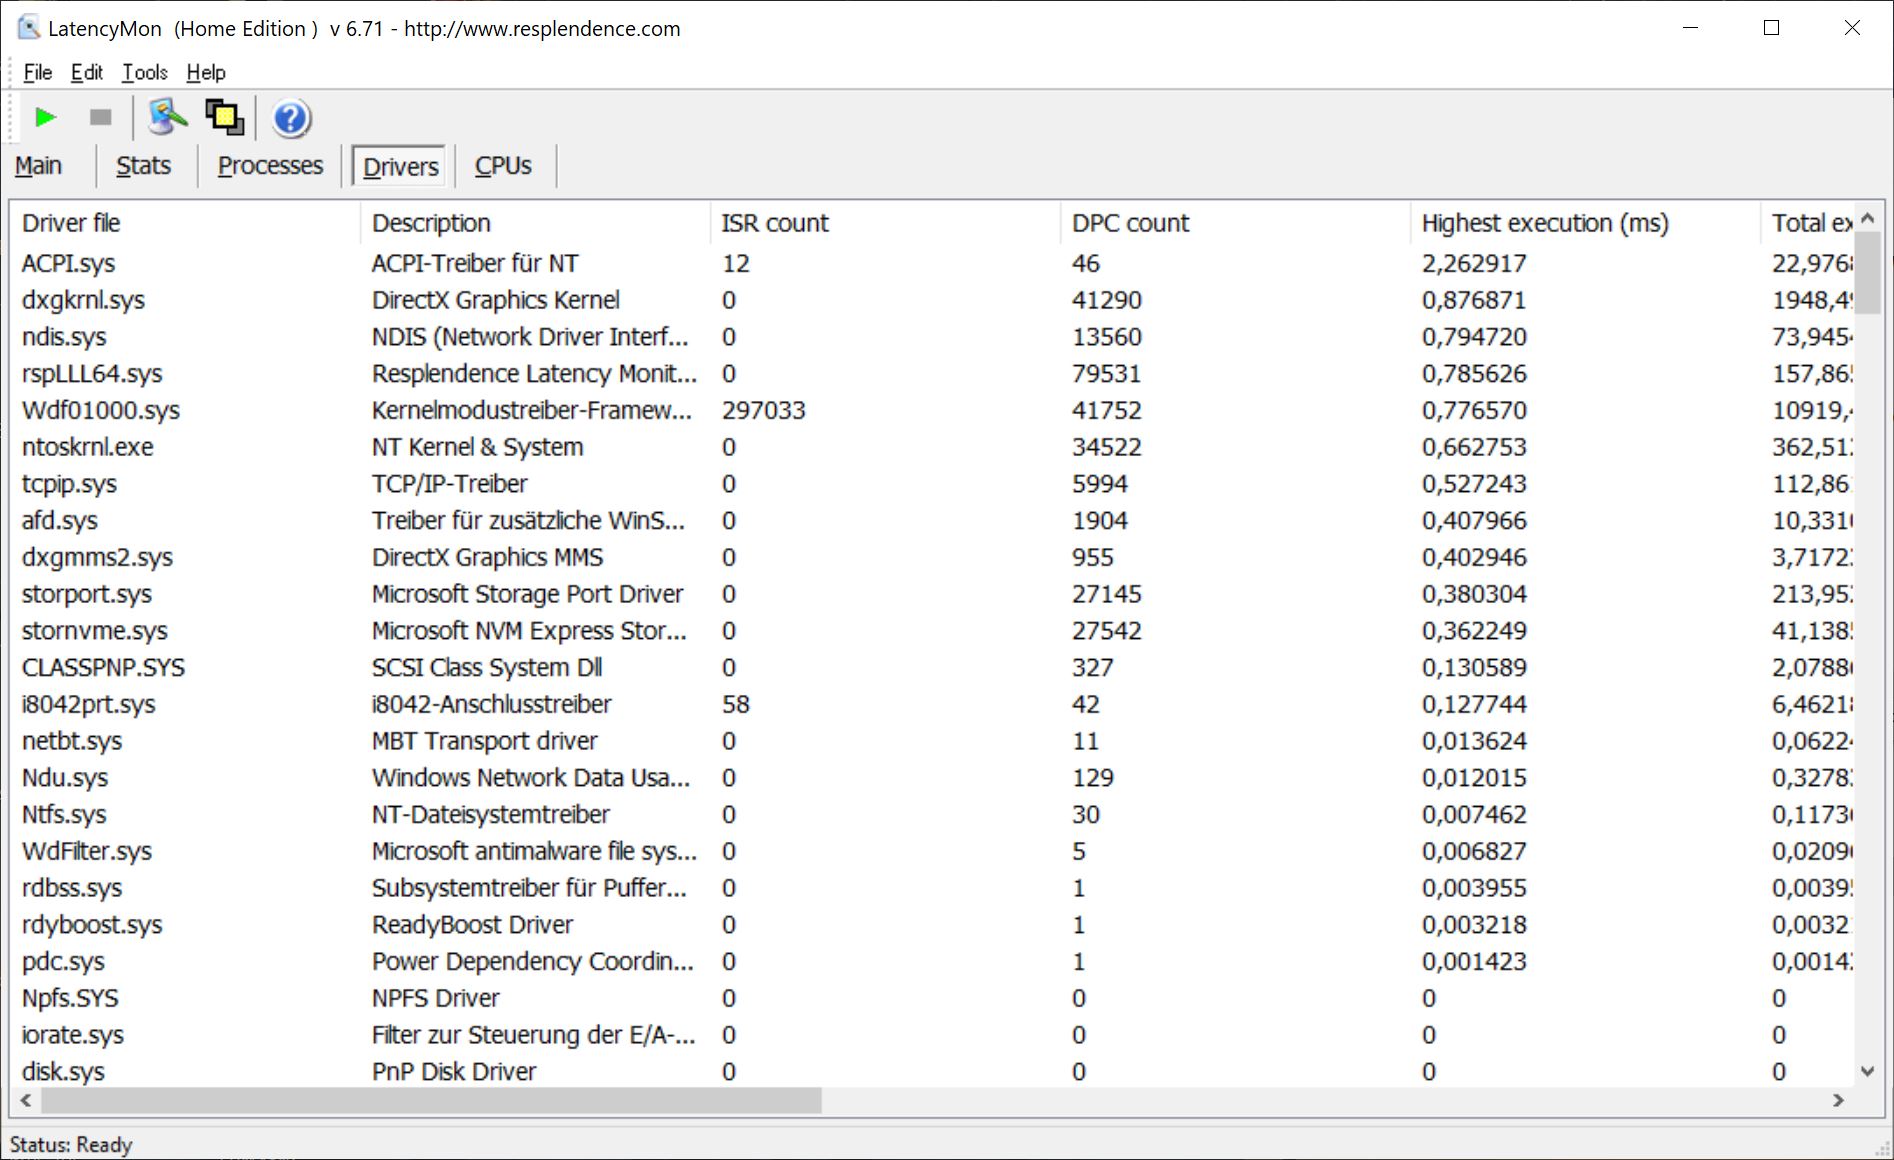
DPC latencies
In the test with LatencyMon, the Lenovo ThinkBook Plus Gen2 shows increased interruption times with our test configuration. Thus, it is not suitable for real-time applications or similar with the current BIOS version.
| DPC Latencies / LatencyMon - interrupt to process latency (max), Web, Youtube, Prime95 | |
| Samsung Galaxy Book Pro 360 13 | |
| Lenovo ThinkBook Plus Gen2 Core i5 | |
| Acer Spin 3 SP313-51N-56YV | |
| HP Pavilion Aero 13 be0097nr | |
| Lenovo ThinkBook Plus 13 i7 | |
* ... smaller is better
Mass storage
Lenovo installs a 512 GB PCIe 4.0 SSD from Samsung in the ThinkBook Plus Gen2. It achieves very good read and write rates (>6 GB/s) in the storage benchmarks, which are sufficient for the first place in our test field.
How the comparison with other mass storage devices turns out can be seen in our HDD/SSD benchmark list can be found.
| Lenovo ThinkBook Plus Gen2 Core i5 Samsung PM9A1 MZVL2512HCJQ | Lenovo ThinkBook Plus 13 i7 WDC PC SN730 SDBPNTY-512G | HP Pavilion Aero 13 be0097nr Intel SSD 660p SSDPEKNW512G8 | Acer Spin 3 SP313-51N-56YV Kingston OM8PCP3512F-AB | Samsung Galaxy Book Pro 360 13 Samsung PM991 MZVLQ256HAJD | Average Samsung PM9A1 MZVL2512HCJQ | Average of class Subnotebook | |
|---|---|---|---|---|---|---|---|
| CrystalDiskMark 5.2 / 6 | -43% | -51% | -42% | -54% | -15% | -24% | |
| Write 4K (MB/s) | 222.8 | 135.4 -39% | 128.3 -42% | 286.1 28% | 170.6 -23% | 179.1 ? -20% | 149 ? -33% |
| Read 4K (MB/s) | 88.8 | 48.83 -45% | 50.9 -43% | 48.89 -45% | 44.51 -50% | 75.6 ? -15% | 63.5 ? -28% |
| Write Seq (MB/s) | 4096 | 2036 -50% | 971 -76% | 982 -76% | 872 -79% | 3016 ? -26% | 2503 ? -39% |
| Read Seq (MB/s) | 4439 | 2127 -52% | 1540 -65% | 1301 -71% | 1188 -73% | 3350 ? -25% | 3146 ? -29% |
| Write 4K Q32T1 (MB/s) | 467.1 | 394.1 -16% | 538 15% | 625 34% | 483.1 3% | 459 ? -2% | 424 ? -9% |
| Read 4K Q32T1 (MB/s) | 628 | 345.2 -45% | 344.4 -45% | 301 -52% | 284.3 -55% | 554 ? -12% | 491 ? -22% |
| Write Seq Q32T1 (MB/s) | 5023 | 2700 -46% | 980 -80% | 981 -80% | 950 -81% | 4346 ? -13% | 4365 ? -13% |
| Read Seq Q32T1 (MB/s) | 6822 | 3331 -51% | 1829 -73% | 1631 -76% | 1872 -73% | 6346 ? -7% | 5523 ? -19% |
| AS SSD | -58% | -111% | -100% | -79% | -14% | -43% | |
| Seq Read (MB/s) | 5403 | 2341 -57% | 1616 -70% | 1748 -68% | 1771 -67% | 4656 ? -14% | 4293 ? -21% |
| Seq Write (MB/s) | 3792 | 993 -74% | 761 -80% | 941 -75% | 894 -76% | 2742 ? -28% | 2858 ? -25% |
| 4K Read (MB/s) | 80.4 | 45.76 -43% | 46.87 -42% | 44.06 -45% | 53.5 -33% | 67 ? -17% | 58.7 ? -27% |
| 4K Write (MB/s) | 195.1 | 141.8 -27% | 126.6 -35% | 77.7 -60% | 157.8 -19% | 173.8 ? -11% | 168.3 ? -14% |
| 4K-64 Read (MB/s) | 1687 | 615 -64% | 324.6 -81% | 451.1 -73% | 478.1 -72% | 1514 ? -10% | 850 ? -50% |
| 4K-64 Write (MB/s) | 1797 | 1295 -28% | 815 -55% | 926 -48% | 741 -59% | 2355 ? 31% | 1694 ? -6% |
| Access Time Read * (ms) | 0.035 | 0.096 -174% | 0.074 -111% | 0.188 -437% | 0.156 -346% | 0.04867 ? -39% | 0.06008 ? -72% |
| Access Time Write * (ms) | 0.021 | 0.026 -24% | 0.135 -543% | 0.043 -105% | 0.023 -10% | 0.03605 ? -72% | 0.05891 ? -181% |
| Score Read (Points) | 2307 | 895 -61% | 533 -77% | 670 -71% | 709 -69% | 2047 ? -11% | 1338 ? -42% |
| Score Write (Points) | 2371 | 1536 -35% | 1018 -57% | 1098 -54% | 988 -58% | 2778 ? 17% | 2148 ? -9% |
| Score Total (Points) | 5792 | 2834 -51% | 1798 -69% | 2084 -64% | 2034 -65% | 5812 ? 0% | 4112 ? -29% |
| Total Average (Program / Settings) | -51% /
-52% | -81% /
-86% | -71% /
-76% | -67% /
-69% | -15% /
-14% | -34% /
-35% |
* ... smaller is better

Continuous reading: DiskSpd Read Loop, Queue Depth 8
Graphics card
The ThinkBook Plus Gen2's internal graphics unit is used for displaying image content. The Intel Iris Xe Graphics G7 80EUs is responsible. This is suitable for applications with low demands on the GPU performance, such as simple photo editing.
In the 3DMark benchmarks, the GPU shows a slightly below-average result, but can place itself clearly ahead of the Intel UHD Graphics 620 of the predecessor Lenovo ThinkBook Plus. Which performance is achieved in comparison with other graphics units can be seen in our GPU benchmark list.
| 3DMark 11 Performance | 4466 points | |
| 3DMark Cloud Gate Standard Score | 12148 points | |
| 3DMark Fire Strike Score | 3116 points | |
| 3DMark Time Spy Score | 1160 points | |
Help | ||
Gaming performance
The here installed Intel Iris Xe Graphics G7 80EUs is only suitable for very simple or older games. Thus, smooth frame rates were mostly only possible with reduced resolution and lowered graphics settings in the titles we tested.
We have listed which performance can be expected in other games in our GPU games list.
Witcher 3 FPS-Diagram
| The Witcher 3 - 1366x768 Medium Graphics & Postprocessing | |
| Average of class Subnotebook (56.2 - 115, n=18, last 2 years) | |
| Acer Spin 3 SP313-51N-56YV | |
| Average Intel Iris Xe Graphics G7 80EUs (21.8 - 56.9, n=103) | |
| Samsung Galaxy Book Pro 360 13 | |
| Lenovo ThinkBook Plus Gen2 Core i5 | |
| low | med. | high | ultra | |
|---|---|---|---|---|
| GTA V (2015) | 59.9 | 54.6 | 19.3 | 8.84 |
| The Witcher 3 (2015) | 66 | 39.5 | 20.7 | 9.65 |
| Dota 2 Reborn (2015) | 81.5 | 63.7 | 39.5 | 34.8 |
| X-Plane 11.11 (2018) | 36.8 | 24.6 | 21.5 | |
| Far Cry 5 (2018) | 29 | 16 | 15 | 14 |
| Strange Brigade (2018) | 60.4 | 27.1 | 21.7 | 18.2 |
Emissions & Energy - Battery life decreases
Noise emissions
The Lenovo ThinkBook Plus Gen2 is extremely quiet or inaudible in daily use. When using the "intelligent cooling" mode, we measured a maximum noise level of 34.5 dB(A) under heavy load. However, significantly louder fan noise of approximately 42 dB(A) can be heard in "ultra performance" mode.
We could not determine any other noises, such as coil whine or similar.
Noise level
| Idle |
| 25.4 / 27.4 / 32.2 dB(A) |
| Load |
| 32.2 / 34.5 dB(A) |
 | ||
30 dB silent 40 dB(A) audible 50 dB(A) loud |
||
min: | ||
Temperature
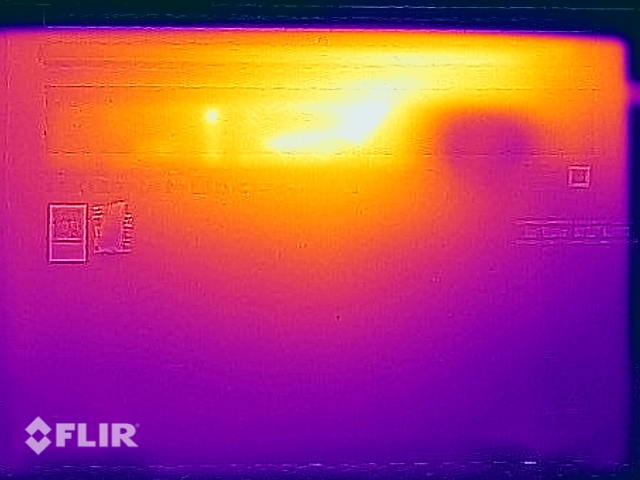
Under very heavy load, the ThinkBook Plus Gen2 heats up to 45 °C (113 °F) on the underside. However, Lenovo's notebook always stays cool in everyday use and can therefore be used without problems at any time.
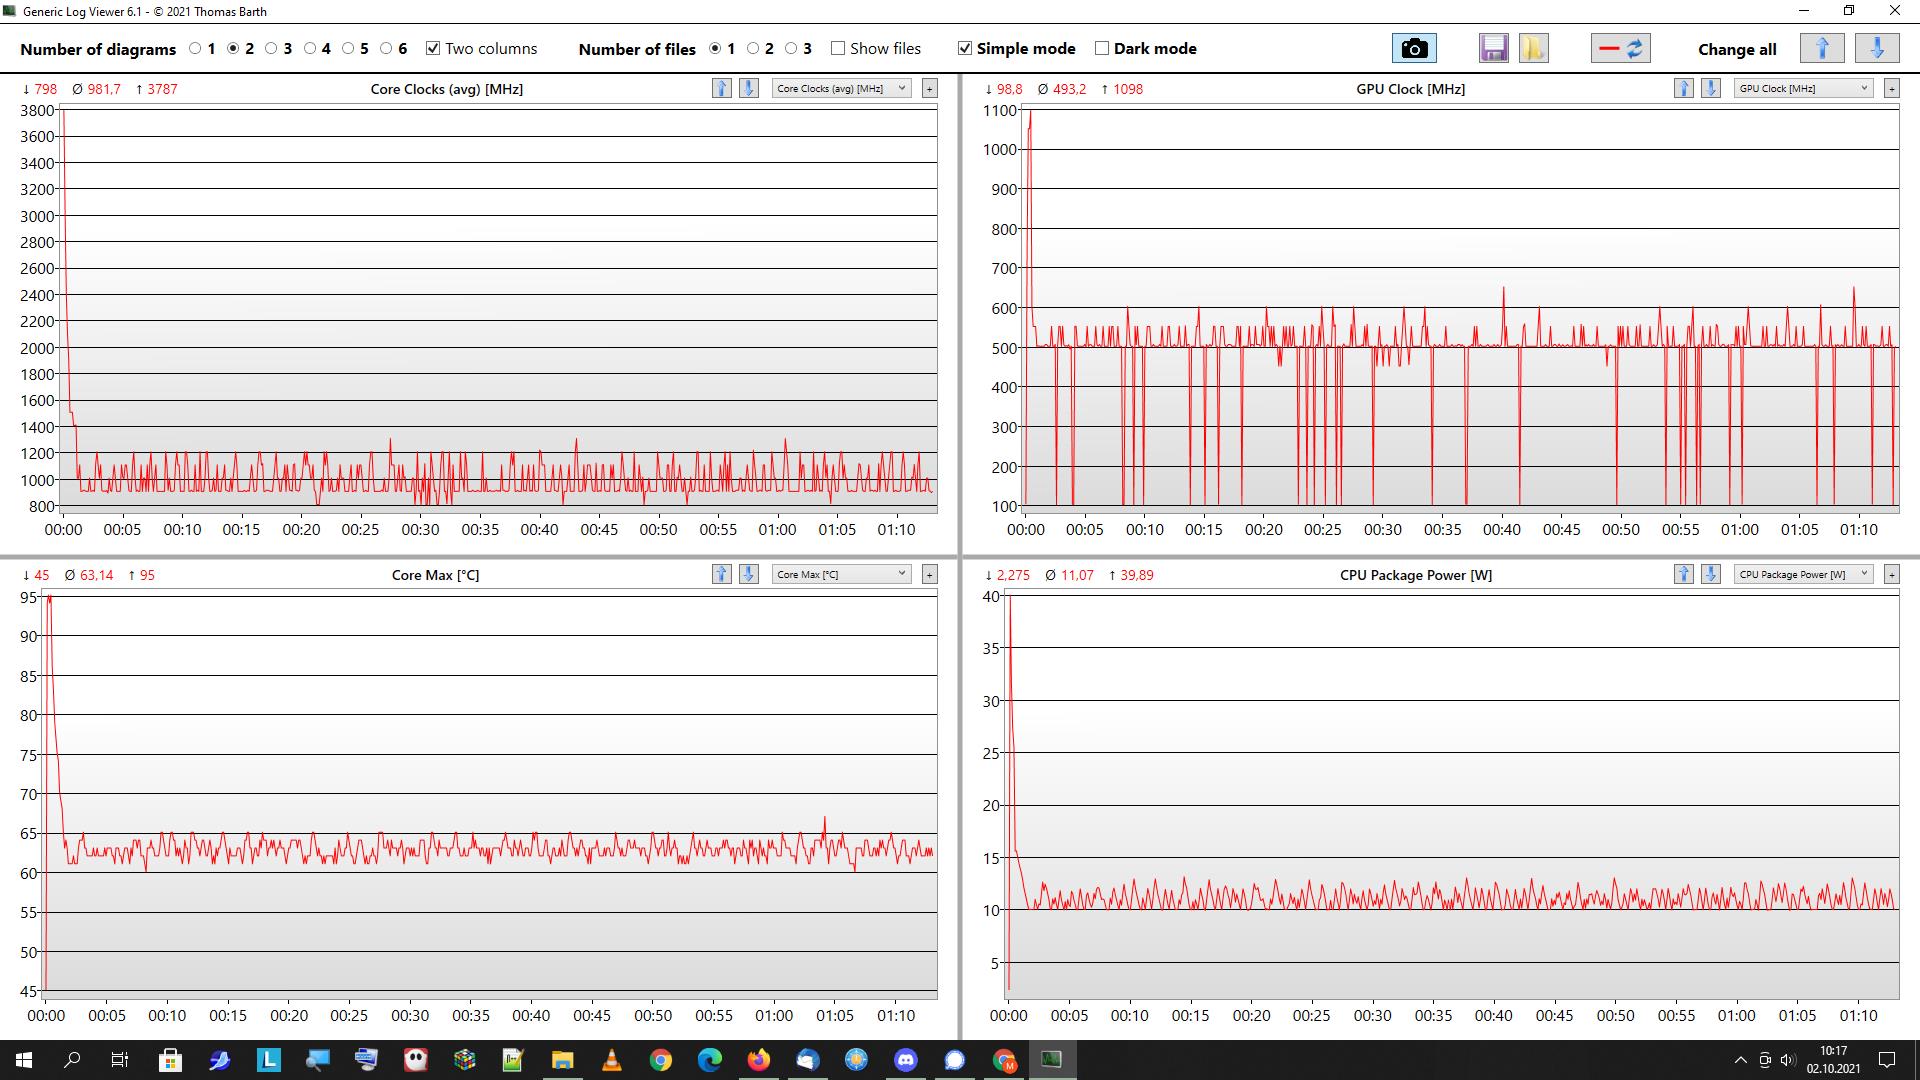
During our approximately one-hour endurance stress test, the temperatures inside the laptop rose to well over 90 °C (194 °F) and the clock rates dropped below the base clock of 1.8 GHz. However, such a load should not occur in everyday use and the system quickly stabilized again after the end of the test, so restrictions due to too high temperatures do not have to be expected.
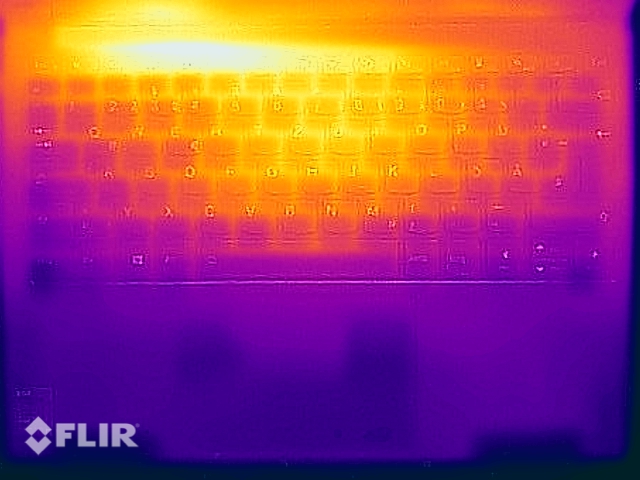
(±) The maximum temperature on the upper side is 42 °C / 108 F, compared to the average of 35.9 °C / 97 F, ranging from 21.4 to 59 °C for the class Subnotebook.
(±) The bottom heats up to a maximum of 44.5 °C / 112 F, compared to the average of 39.3 °C / 103 F
(+) In idle usage, the average temperature for the upper side is 27.5 °C / 82 F, compared to the device average of 30.8 °C / 87 F.
(±) Playing The Witcher 3, the average temperature for the upper side is 33.7 °C / 93 F, compared to the device average of 30.8 °C / 87 F.
(+) The palmrests and touchpad are cooler than skin temperature with a maximum of 27.2 °C / 81 F and are therefore cool to the touch.
(±) The average temperature of the palmrest area of similar devices was 28.2 °C / 82.8 F (+1 °C / 1.8 F).
Speaker
The speakers of the E-ink laptop offer a medium volume and a relatively wide sound spectrum. Thus, they are quite suitable for the occasional playback of media content in quiet environments.
Lenovo ThinkBook Plus Gen2 Core i5 audio analysis
(±) | speaker loudness is average but good (81.9 dB)
Bass 100 - 315 Hz
(±) | reduced bass - on average 13.5% lower than median
(±) | linearity of bass is average (9.7% delta to prev. frequency)
Mids 400 - 2000 Hz
(+) | balanced mids - only 3.2% away from median
(+) | mids are linear (5.3% delta to prev. frequency)
Highs 2 - 16 kHz
(+) | balanced highs - only 2% away from median
(+) | highs are linear (4.1% delta to prev. frequency)
Overall 100 - 16.000 Hz
(+) | overall sound is linear (10.9% difference to median)
Compared to same class
» 9% of all tested devices in this class were better, 3% similar, 88% worse
» The best had a delta of 5%, average was 18%, worst was 53%
Compared to all devices tested
» 6% of all tested devices were better, 2% similar, 93% worse
» The best had a delta of 4%, average was 24%, worst was 134%
Lenovo ThinkBook Plus 13 i7 audio analysis
(-) | not very loud speakers (71.7 dB)
Bass 100 - 315 Hz
(-) | nearly no bass - on average 15% lower than median
(-) | bass is not linear (16.1% delta to prev. frequency)
Mids 400 - 2000 Hz
(±) | higher mids - on average 5.9% higher than median
(+) | mids are linear (5.6% delta to prev. frequency)
Highs 2 - 16 kHz
(+) | balanced highs - only 3.6% away from median
(±) | linearity of highs is average (9% delta to prev. frequency)
Overall 100 - 16.000 Hz
(±) | linearity of overall sound is average (23.9% difference to median)
Compared to same class
» 81% of all tested devices in this class were better, 4% similar, 15% worse
» The best had a delta of 5%, average was 18%, worst was 53%
Compared to all devices tested
» 71% of all tested devices were better, 7% similar, 22% worse
» The best had a delta of 4%, average was 24%, worst was 134%
Energy consumption
Our measurements certify an average power consumption of 7.9 watts for the ThinkBook Plus Gen2 in our idle scenario. Under load, the power consumption is around 30 watts, but can reach peaks of over 65 watts.
The included power adapter supplies an output of 65 watts and is thus sufficiently dimensioned.
| Off / Standby | |
| Idle | |
| Load |
|
Key:
min: | |
Power consumption Witcher 3 / Stress test
Battery life
In our practical WLAN test, the Lenovo ThinkBook Plus Gen2 achieves a runtime of approximately seven and a half hours. Thus, it does not offer the runtime of the predecessor despite the larger 53 Wh battery. The battery is fully recharged after about one and a half hours with the included charger.
Pros
Cons
Verdict - ThinkBook Plus G2 brings better displays


If you already own the ThinkBook Plus of the 1st generation and can benefit from the concept in everyday use, you will get an equally powerful device with the ThinkBook Plus Gen2, with a larger E-ink display and touch functionality of the main screen. The resolution also increases and the screen format is now 16:10 instead of 16:9. With two Thunderbolt ports, modern transfer standards are available, but USB-A and HDMI now have to be dispensed with.
The Lenovo ThinkBook Plus Gen2 is a high-quality notebook. However, it is only worth buying if the E-ink display is also used in everyday life.
You can wave the option of the ThinkBook Plus Gen2 unless you really can make use of the 12-inch second display. The battery has a higher capacity, but does not last as long as the predecessor. The CPU performance also remains roughly the same, only the internal graphics unit has become stronger. In return, Lenovo's notebook is now lighter and slimmer. We also liked the quality of the main screen, which displays colors vividly and with only a slight deviation ex-factory.
However, a recommendation for the ThinkBook Plus Gen2 stands and falls with the question whether the E-ink display is really used in everyday use. If this is not the case, it is more worthwhile to go for a convertible like the Samsung Galaxy Book Pro 360. If you can basically do without a touch-enabled screen and an external display, a conventional notebook like the HP Pavilion Aero 13 is the better choice.
Price and availability
The Lenovo ThinkBook Plus Gen2 is available now and can be purchased, for example, from our rental provider Campuspoint.
Lenovo ThinkBook Plus Gen2 Core i5
- 10/02/2021 v7 (old)
Mike Wobker
Price comparison

