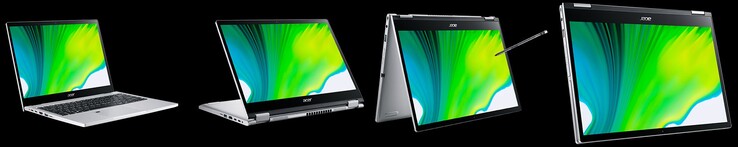
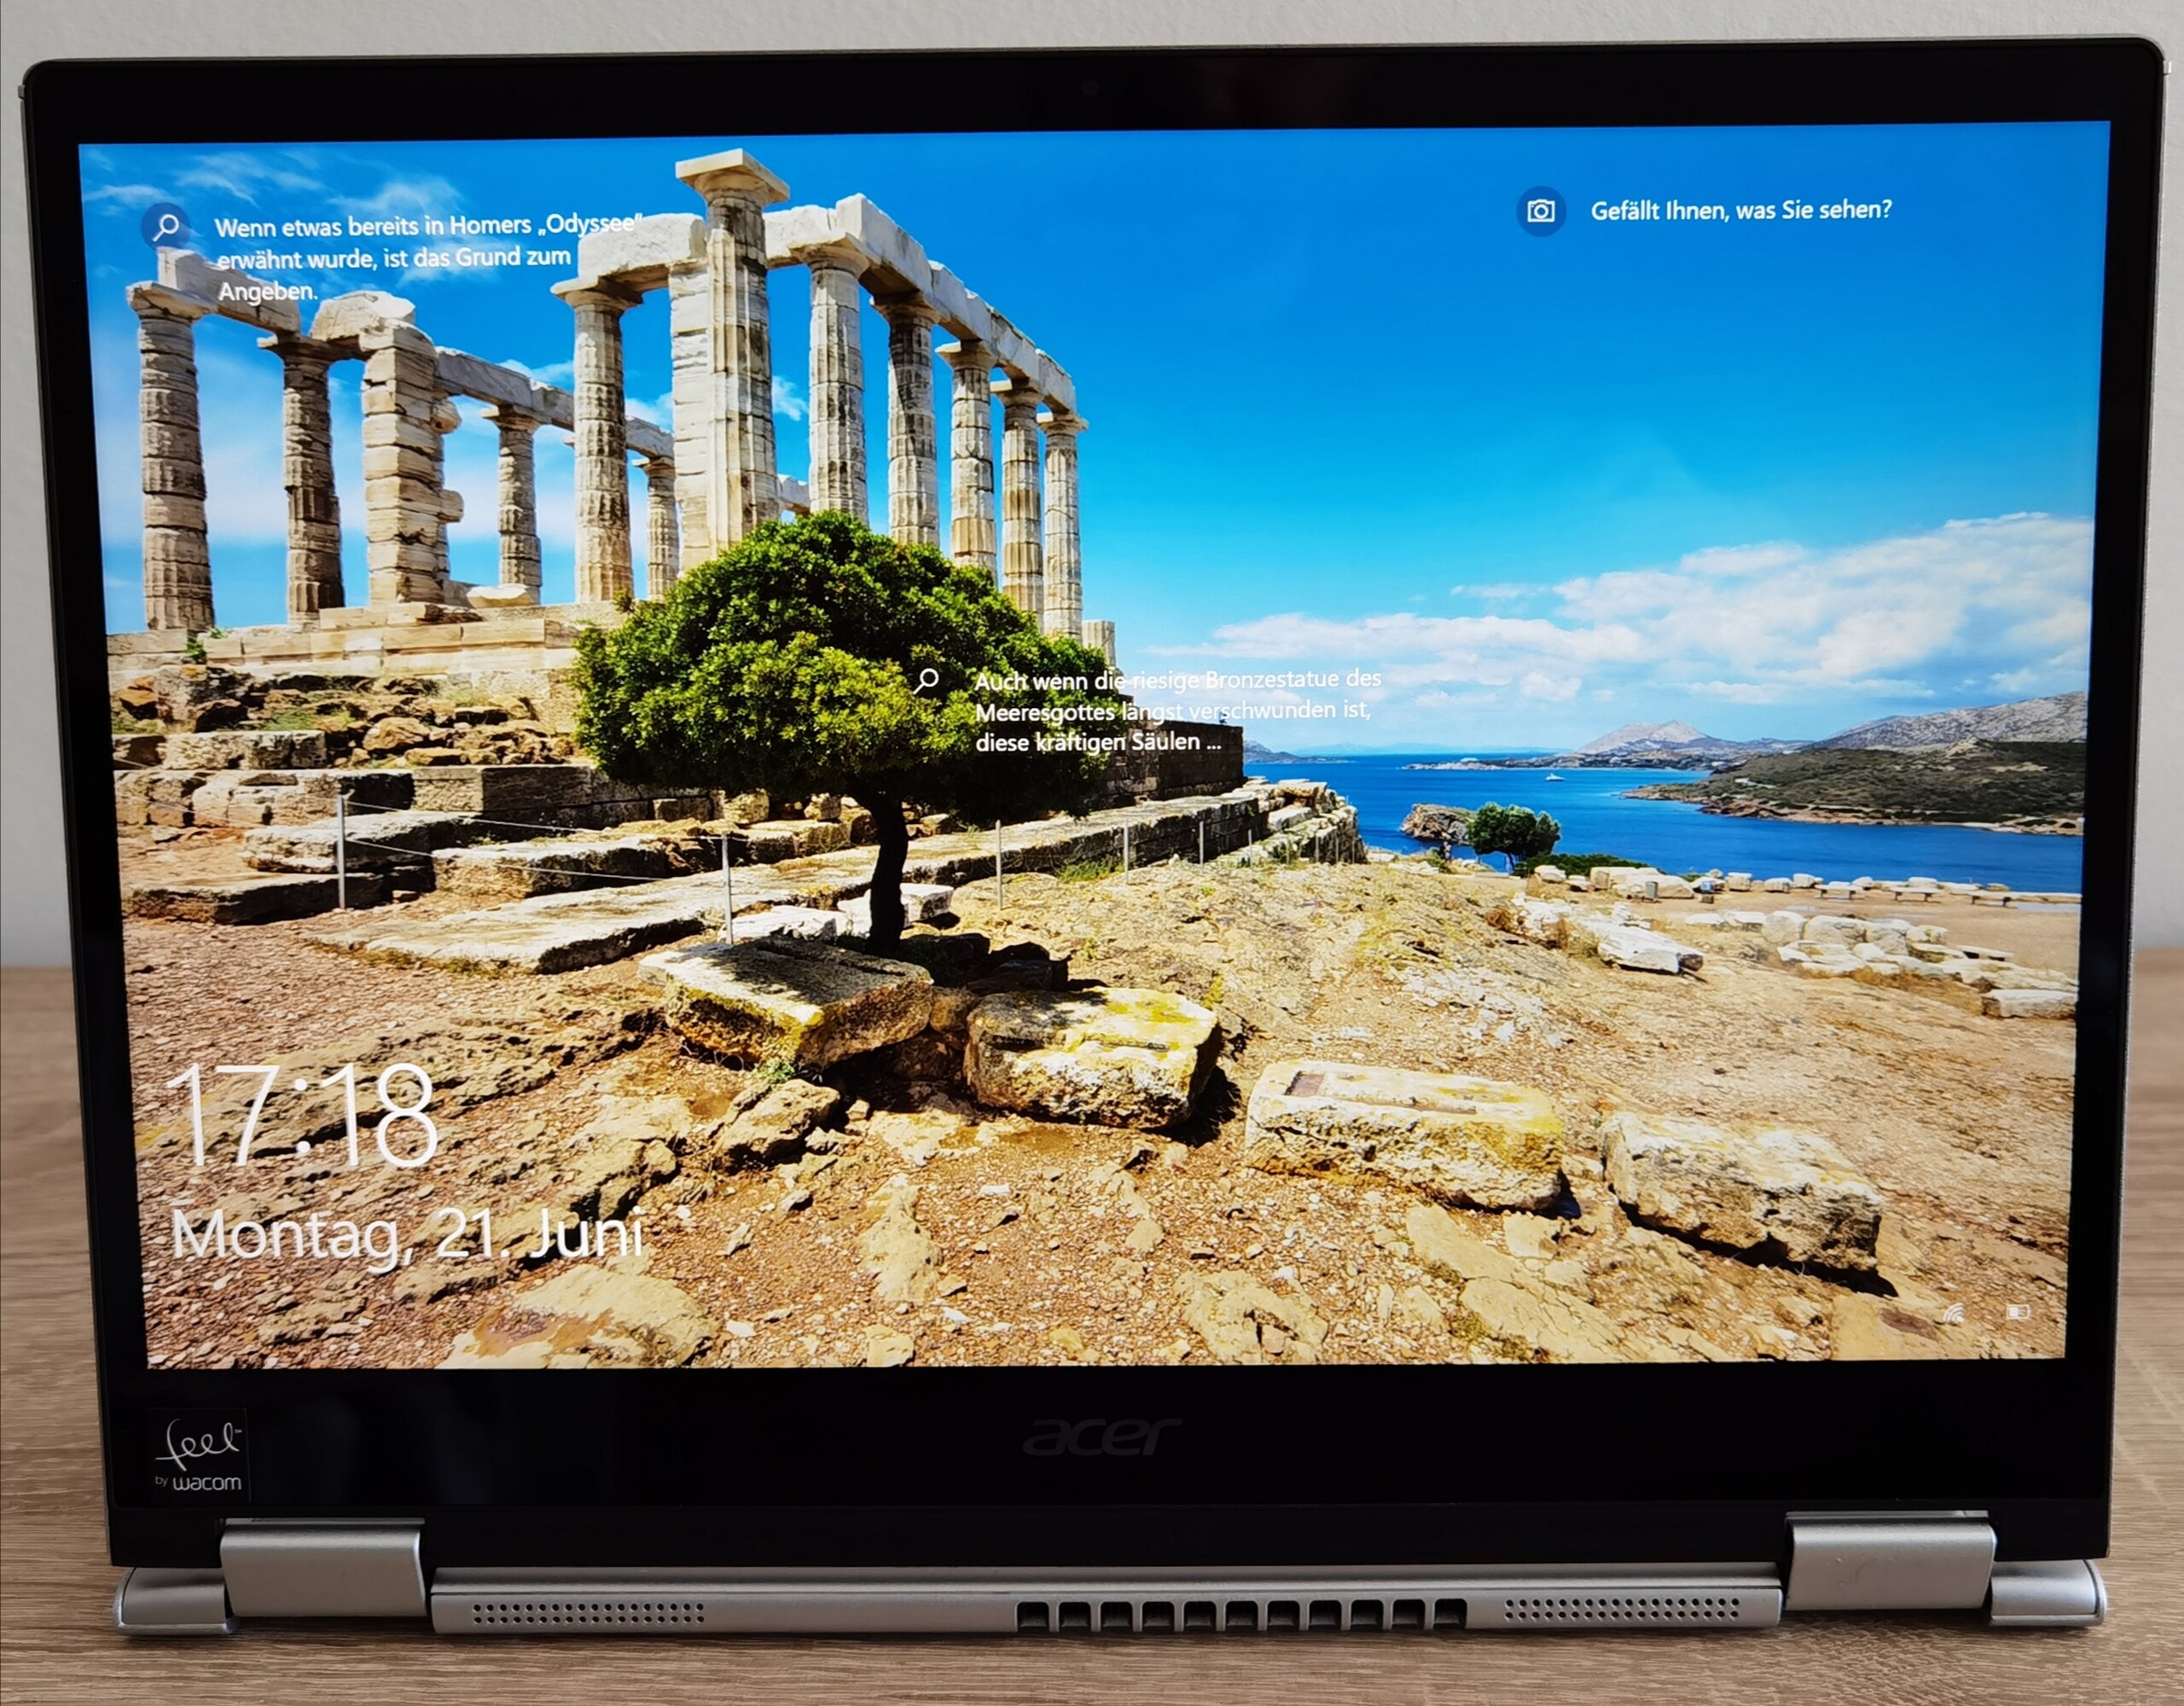
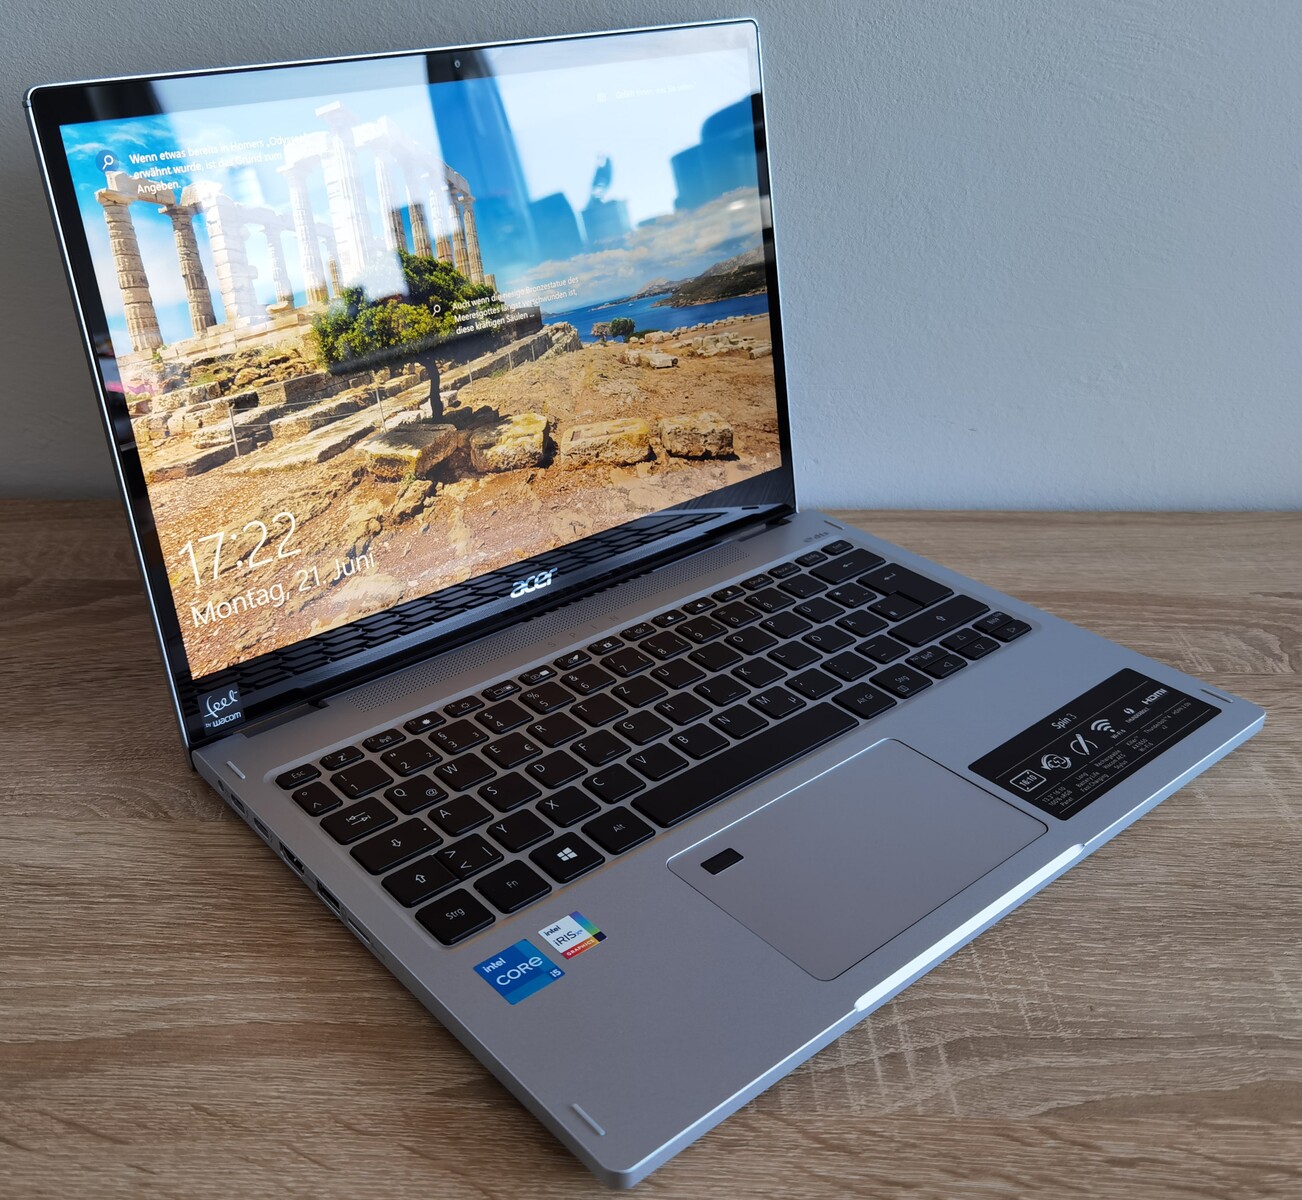
Acer Spin 3 SP313-51N convertible in review: A good all-rounder with weaknesses
Can you get a current, powerful convertible with Thunderbolt 4 and WQXGA resolution for less than 1000 Euros (~$1192)? Yes, because even budget notebooks are getting cheaper and have more performance and features. We will take a closer look at whether the Acer Spin 3 SP313-51N also meets these requirements in this review with a configuration of an Intel Core i5 1135G7, 16 GB LPDDR4X Ram and a 512 GB NVMe SSD. Does Acer have better cards than Dell and Lenovo?
Possible competitors in comparison
Rating | Date | Model | Weight | Height | Size | Resolution | Price |
|---|---|---|---|---|---|---|---|
| 85.7 % v7 (old) | 06 / 2021 | Acer Spin 3 SP313-51N-56YV i5-1135G7, Iris Xe G7 80EUs | 1.4 kg | 16 mm | 13.30" | 2560x1600 | |
| 86 % v7 (old) | 01 / 2021 | Lenovo ThinkBook 13s-ITL-20V90003GE i5-1135G7, Iris Xe G7 80EUs | 1.3 kg | 14.9 mm | 13.30" | 1920x1080 | |
| 87.7 % v7 (old) | 05 / 2021 | Dell XPS 13 9305 Core i5 FHD i5-1135G7, Iris Xe G7 80EUs | 1.2 kg | 16 mm | 13.30" | 1920x1080 | |
| 88.3 % v7 (old) | 04 / 2021 | Lenovo ThinkPad L13 Yoga Gen2-20VK000VGE i5-1135G7, Iris Xe G7 80EUs | 1.5 kg | 17.6 mm | 13.30" | 1920x1080 |
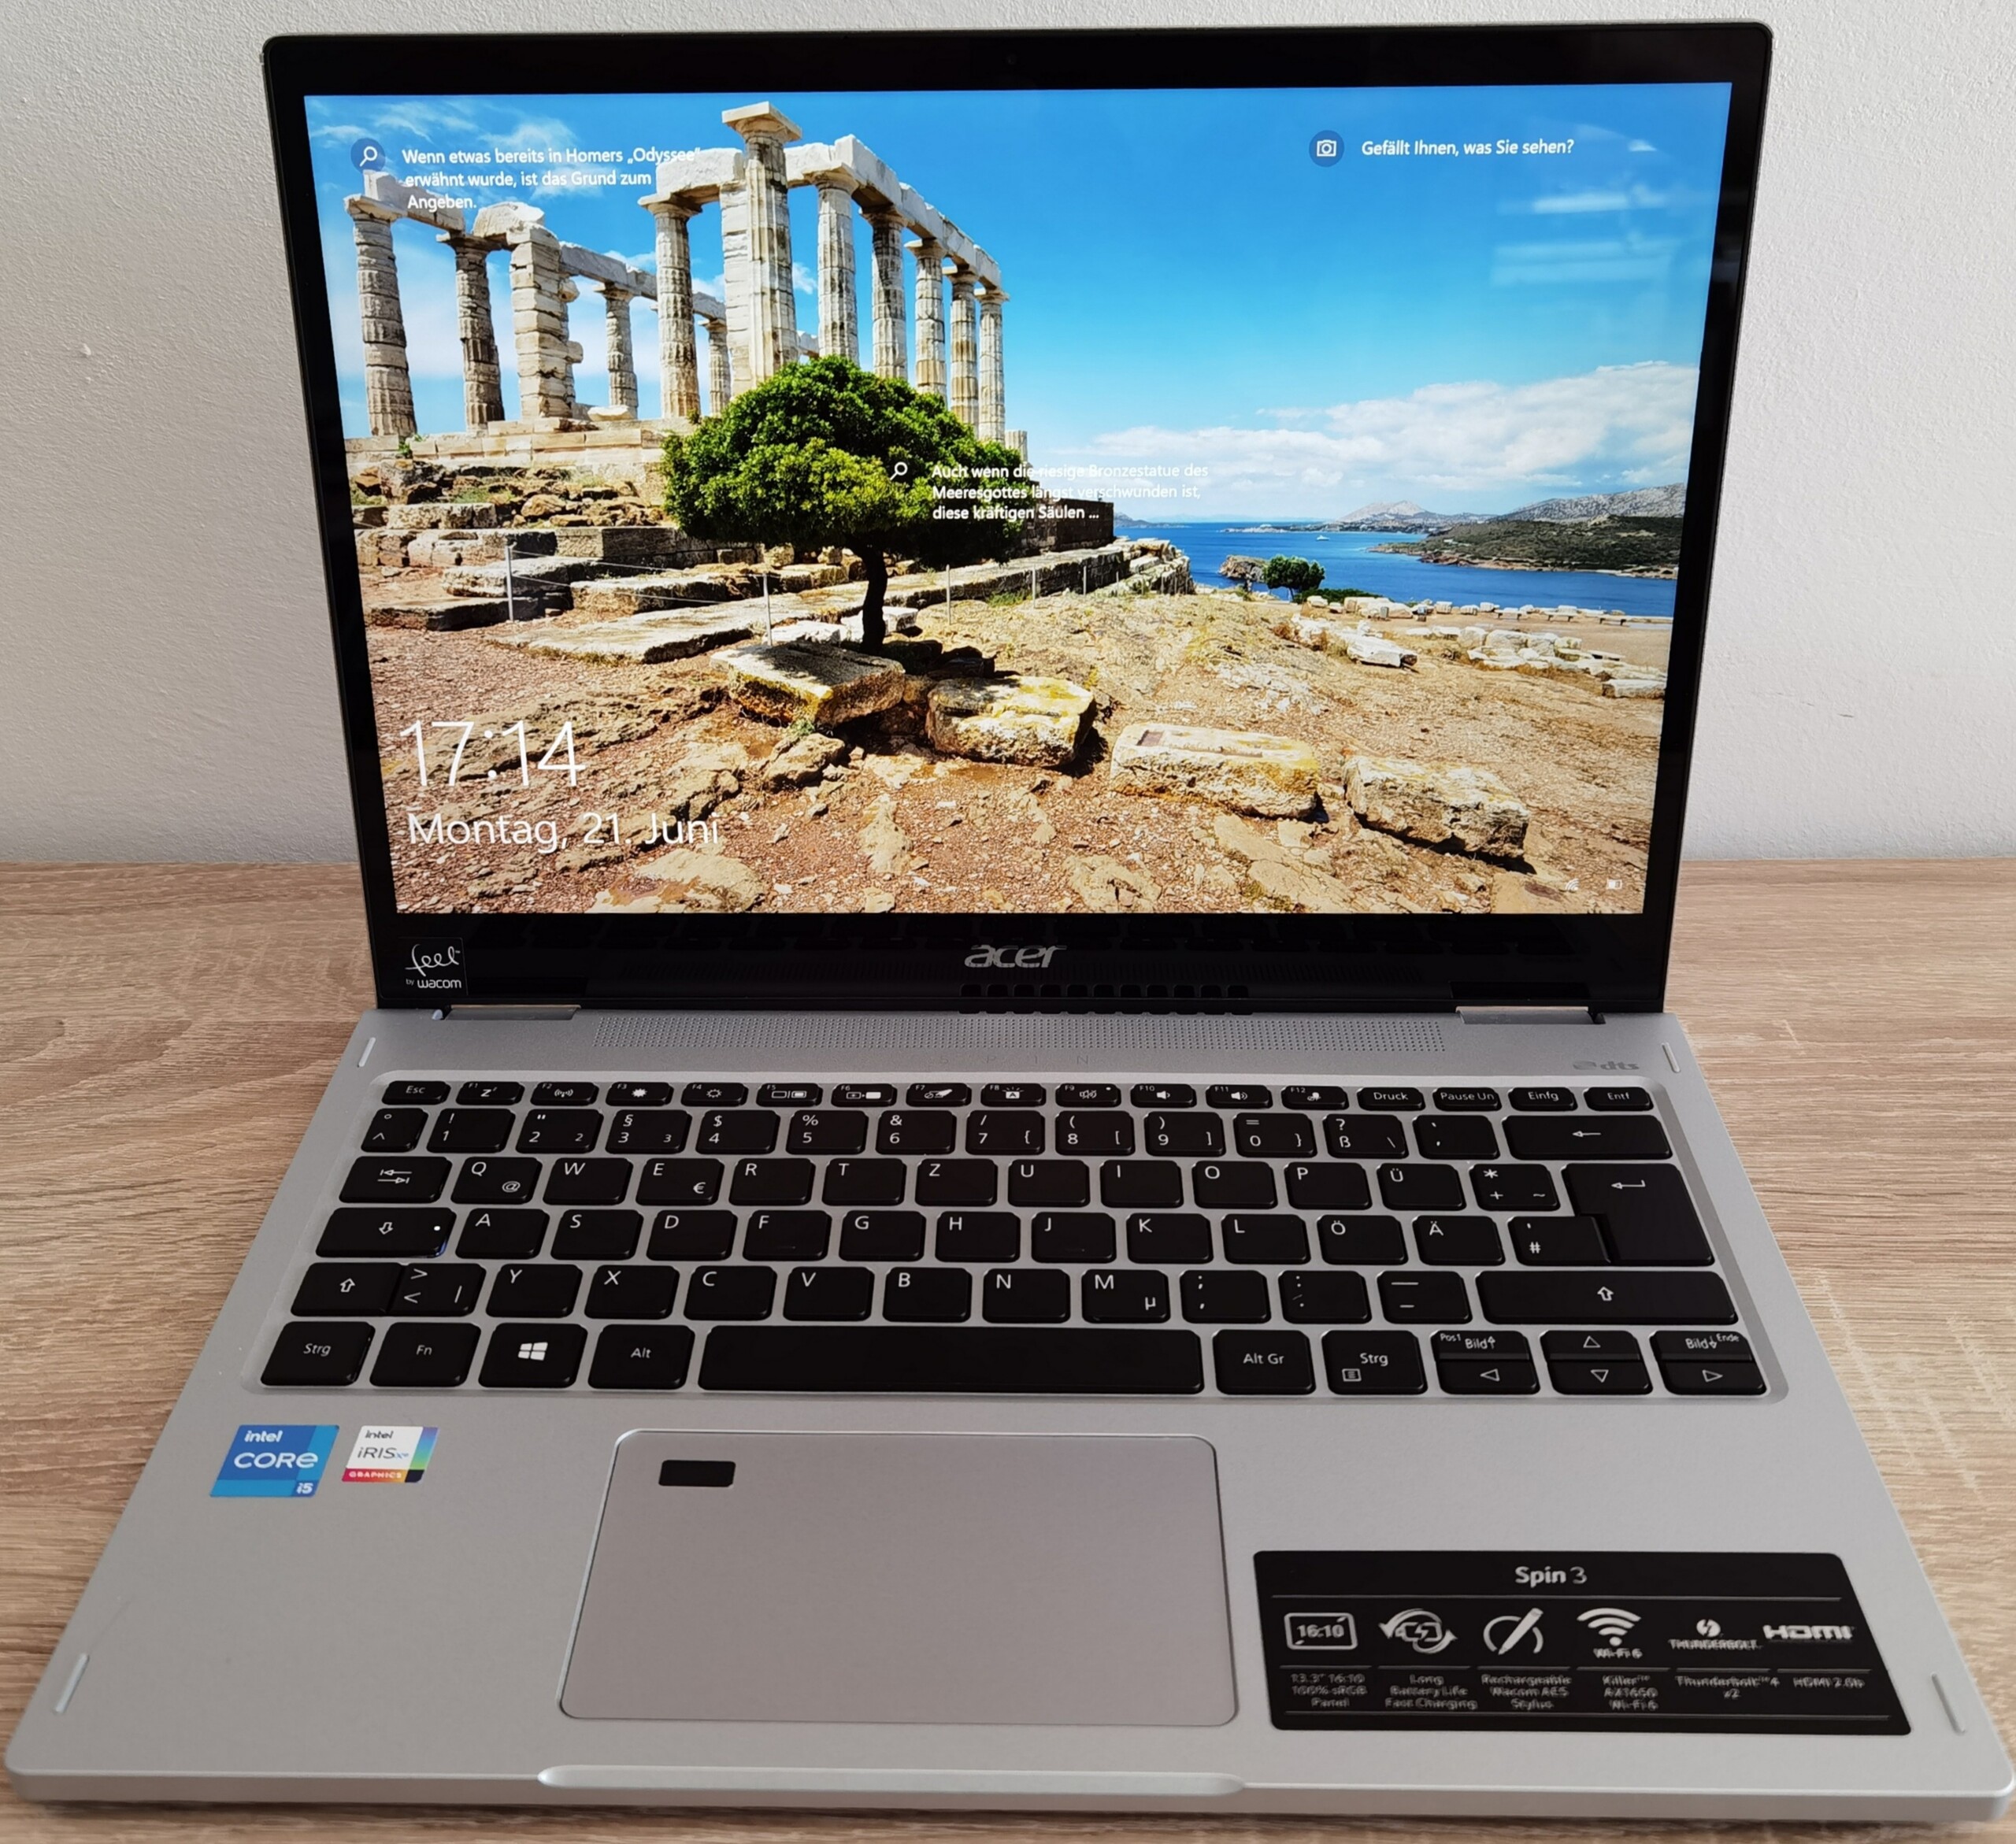
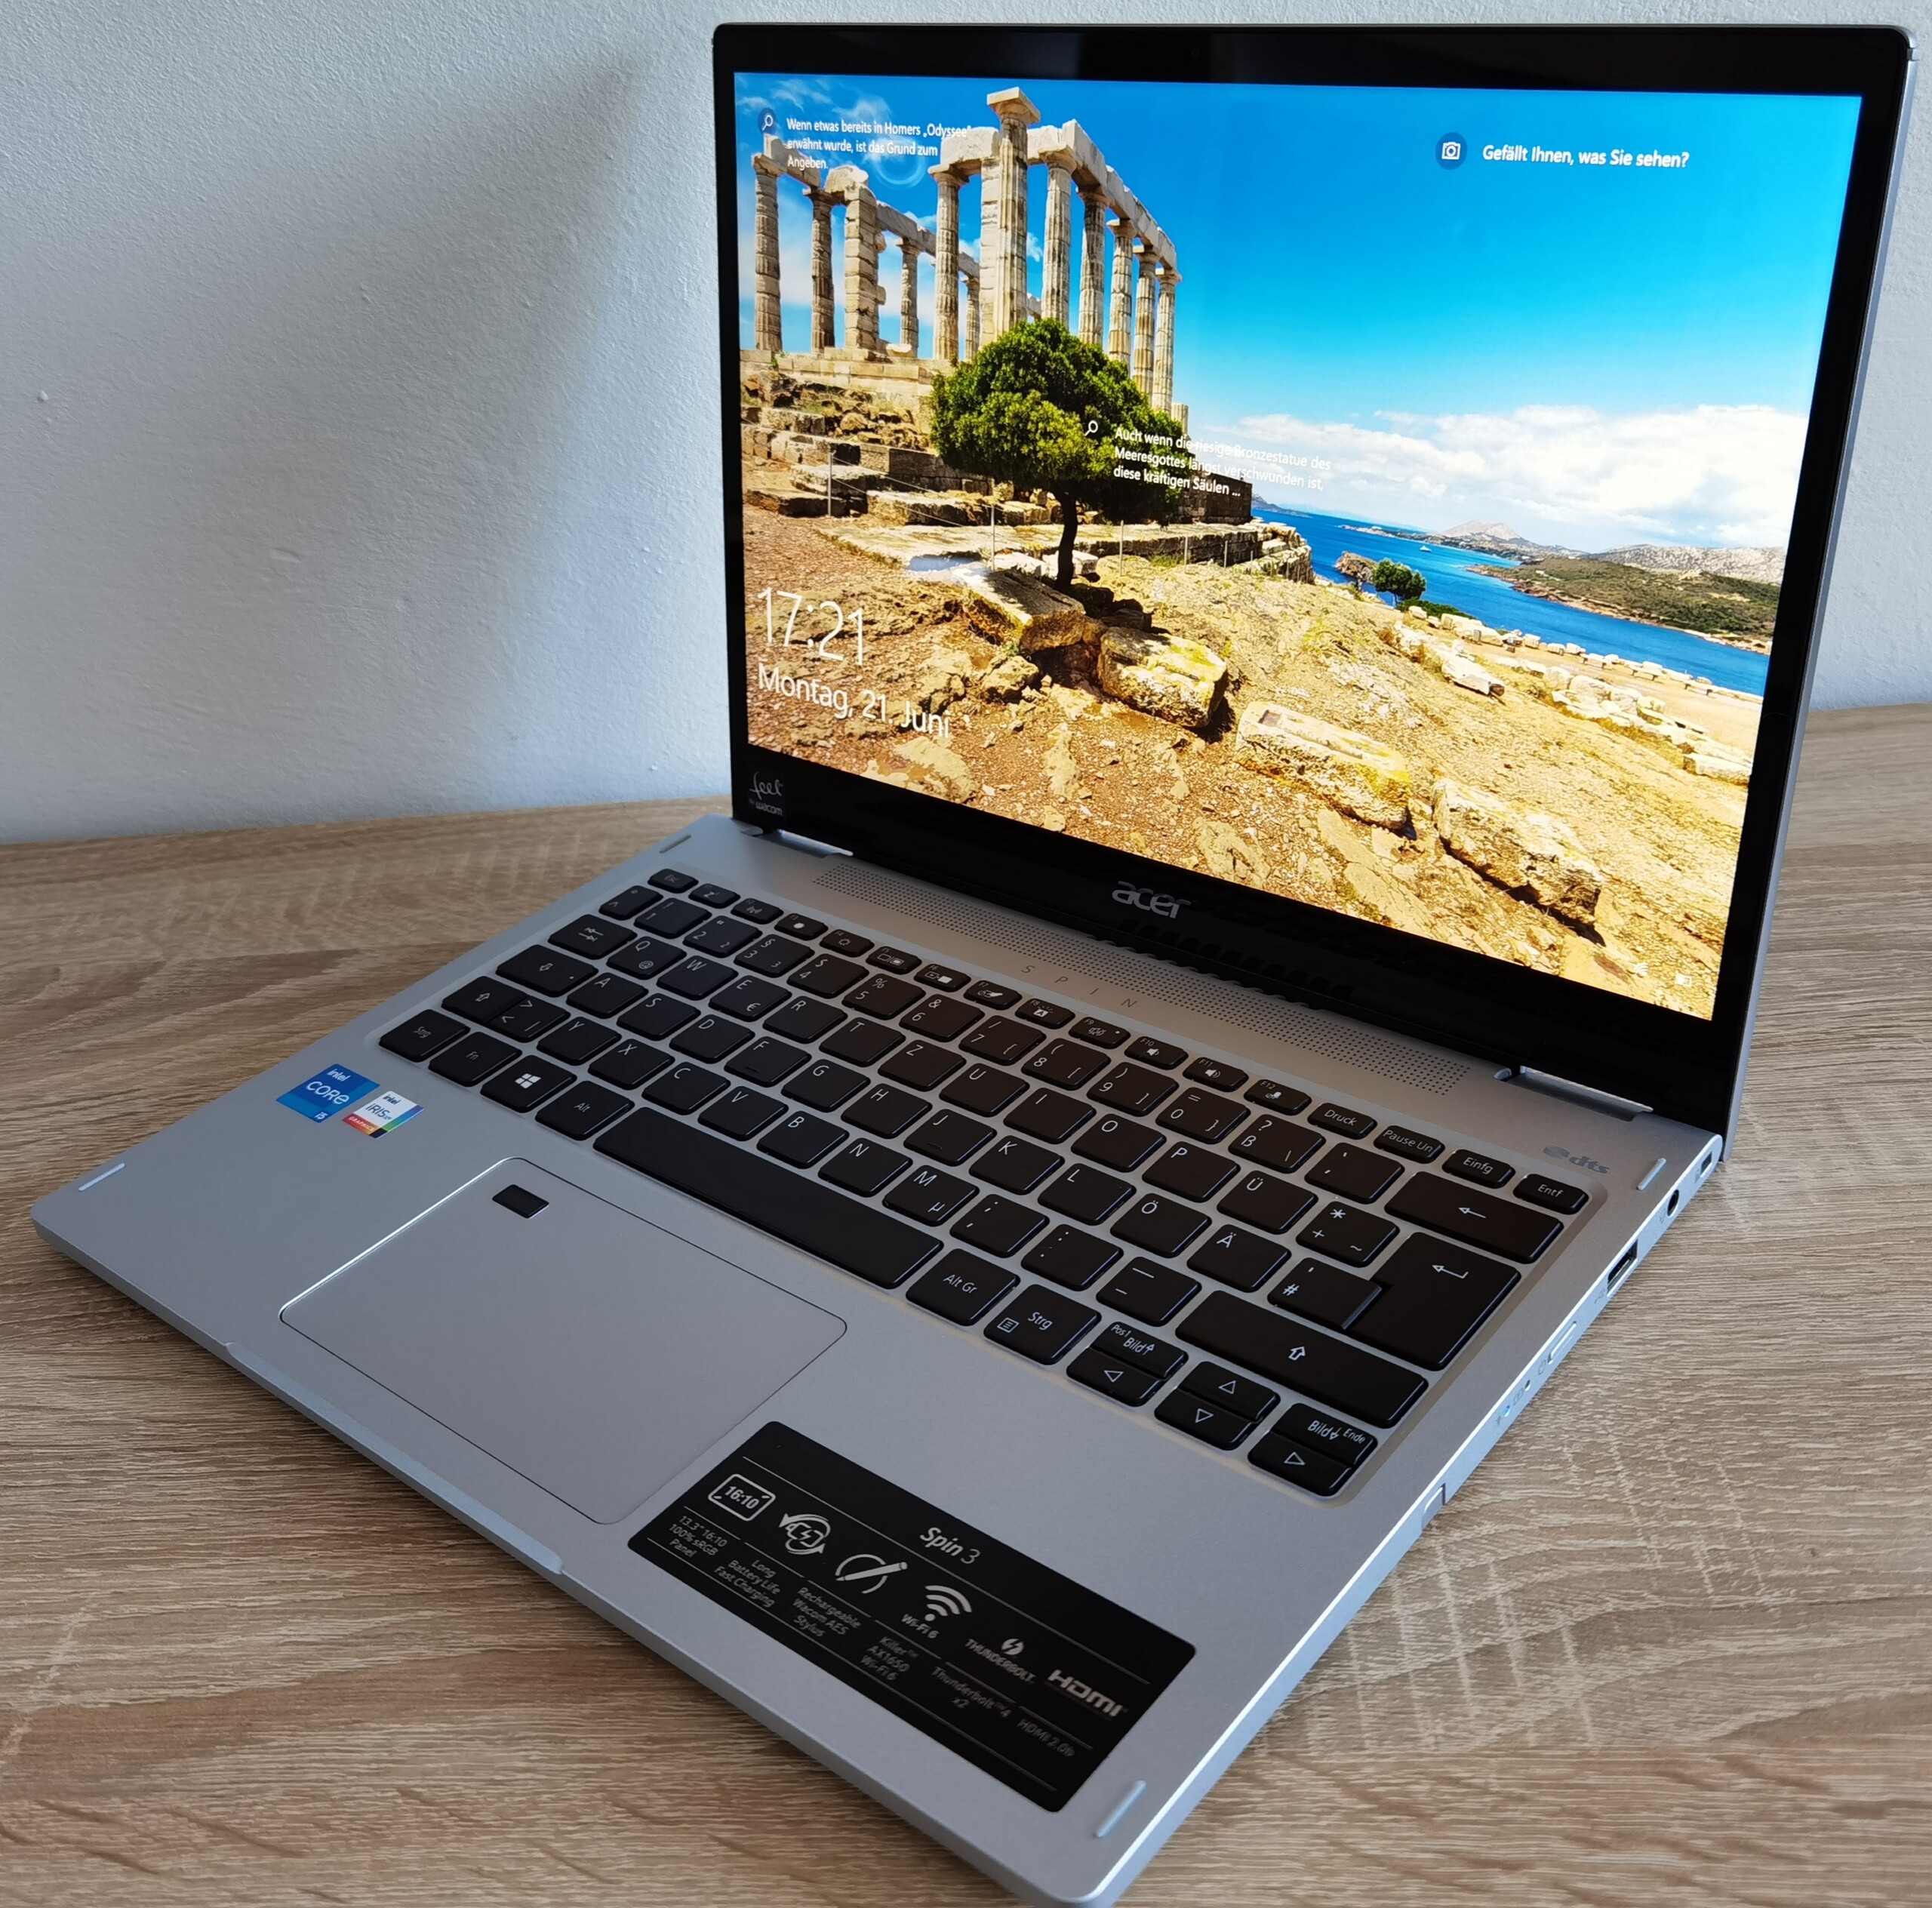
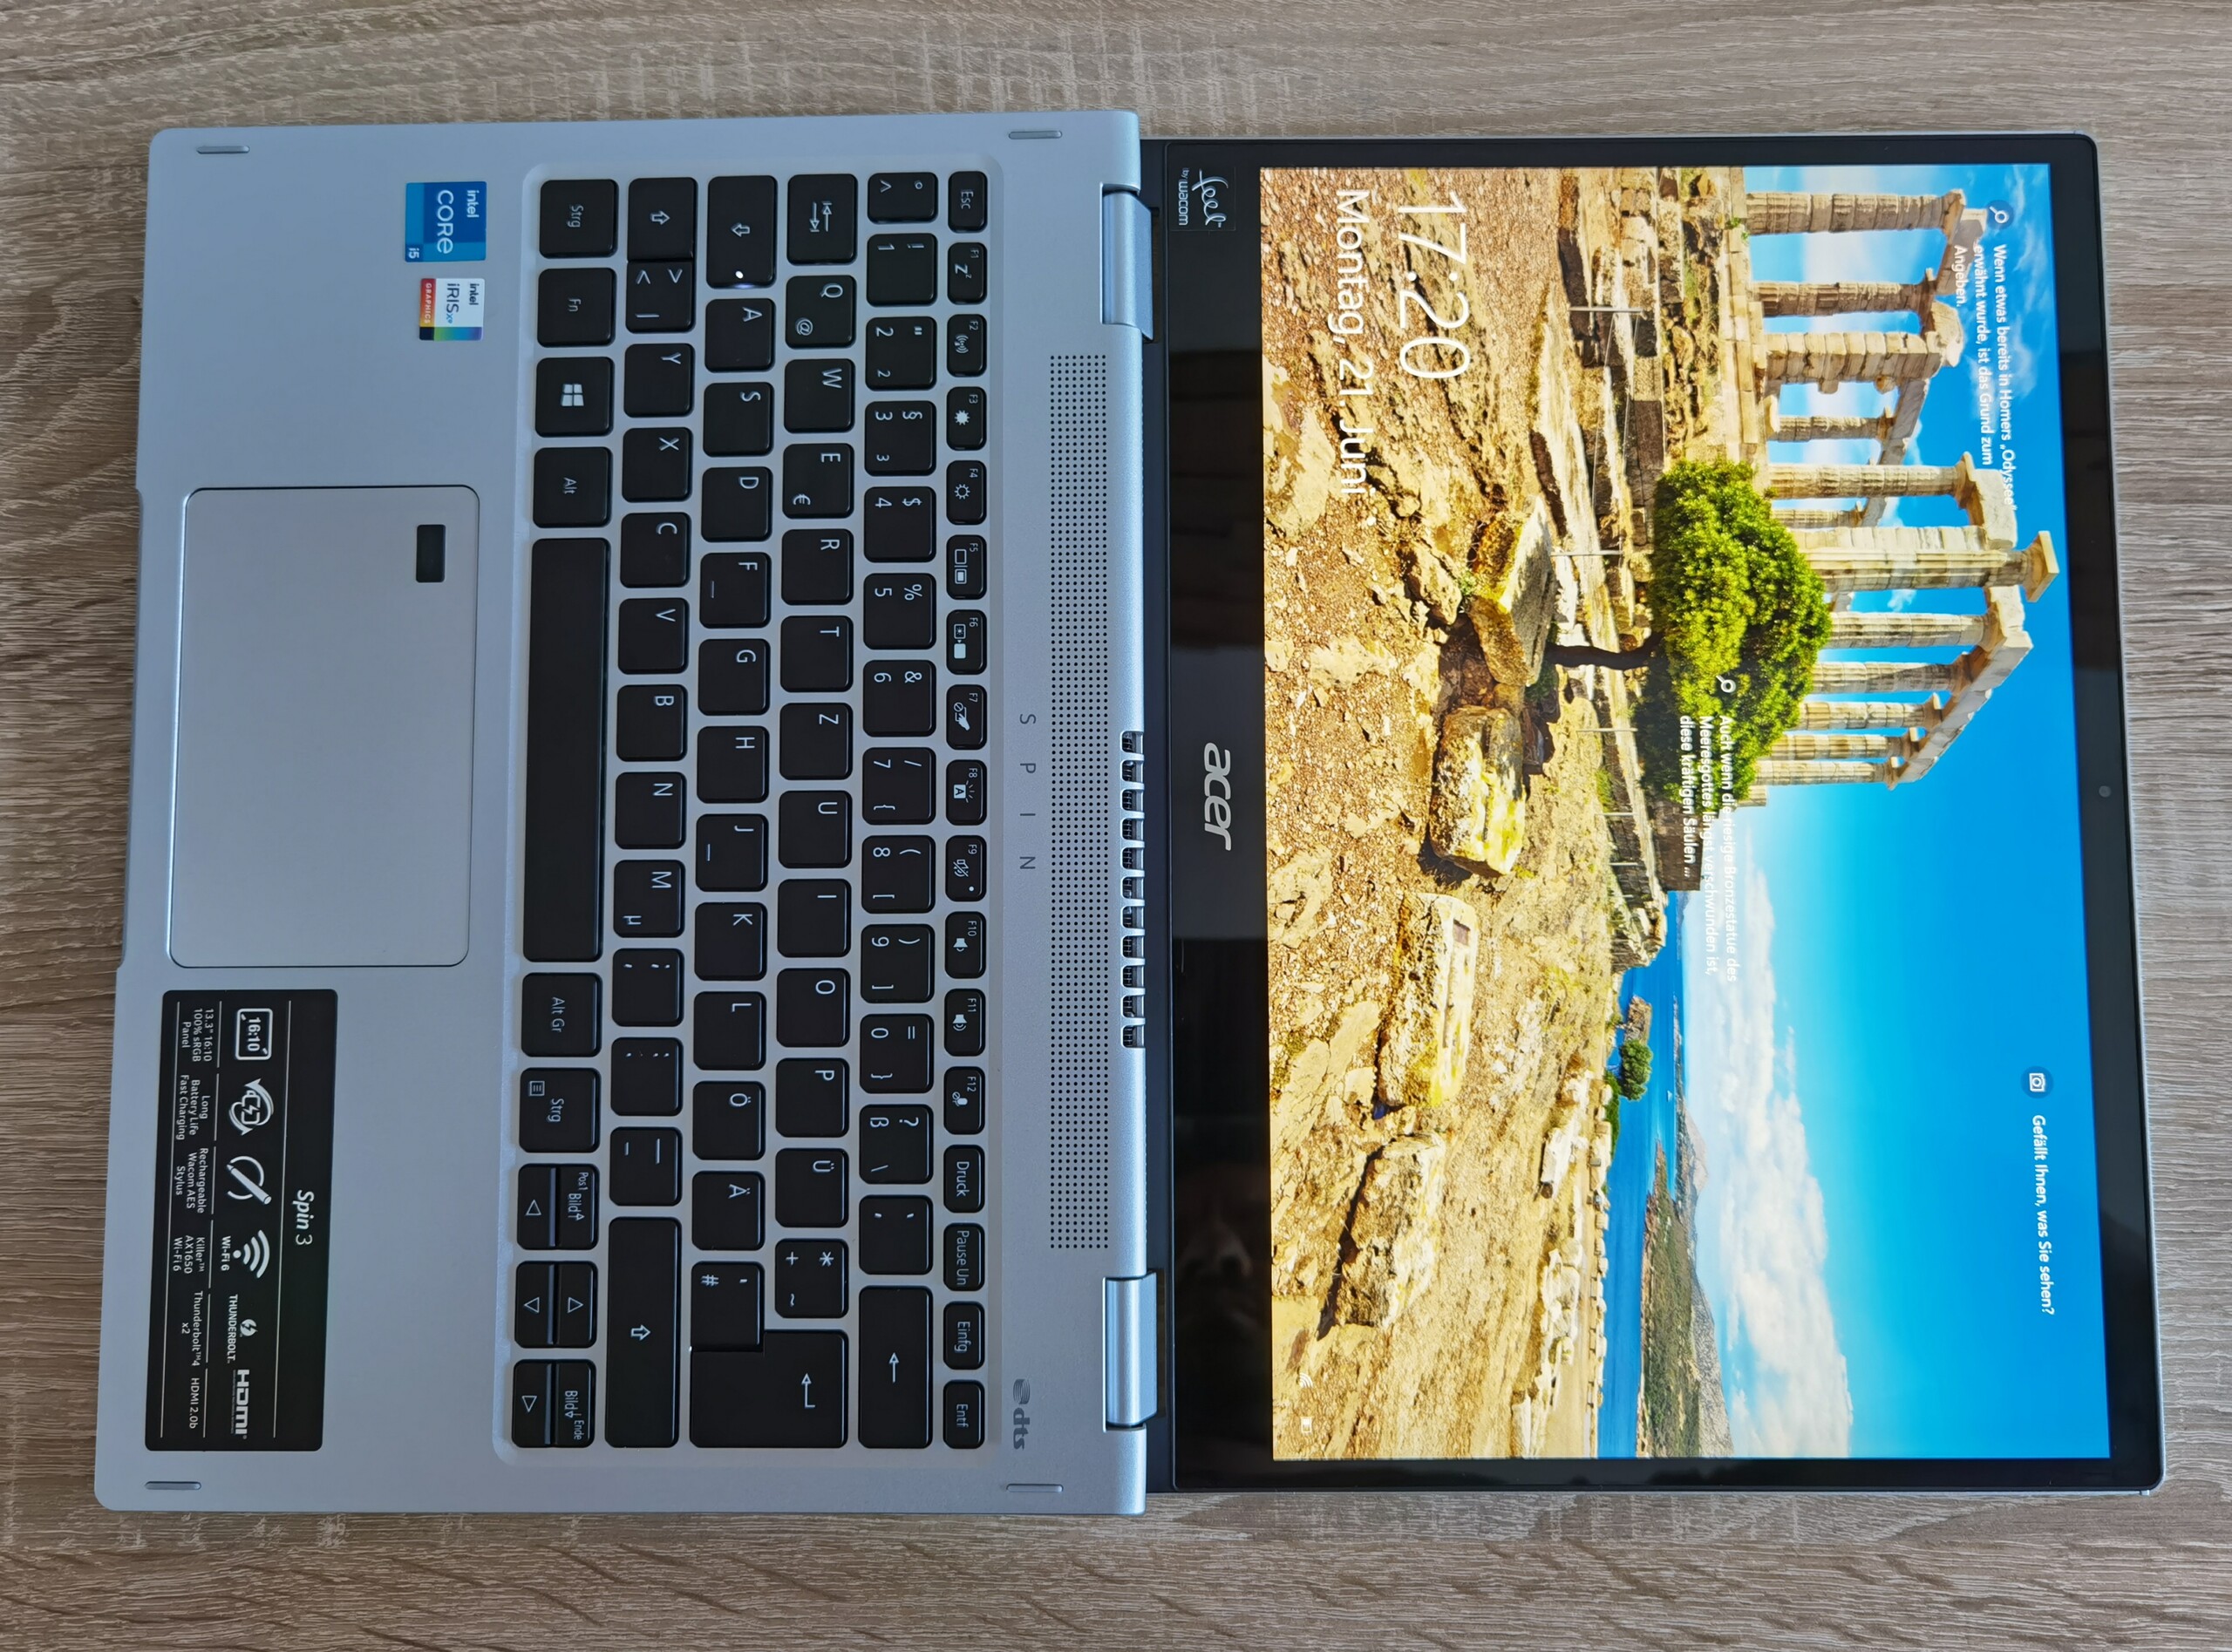
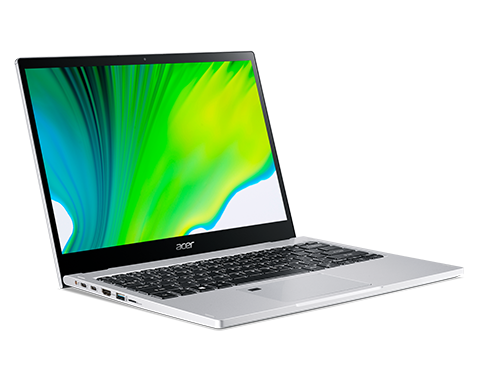
Case - Robust and multifaceted with 1,400 grams
The unibody case of our convertible is made of an aluminum alloy and looks sophisticated and elegant. It is no lightweight with a weight of 1.4 kilograms (~3.1 lb), but it has room for the Wacom stylus pen, which is included in the scope of delivery, compared to the competition. Thus, the pen can be stored well and it charges automatically at the same time.
Acer has put a lot of effort into the build quality, as the base and lid feel sturdy and are difficult to twist. Only the hinges could have been better. The display can be opened with one hand and we did not notice any wobbling during operation. To prevent the Spin 3 from slipping, the device has rubber feet on the back.

The Acer Spin 3 is not particularly light, it is comparatively heavy, like the Lenovo Thinkpad L13 Yoga. In return, the Spin 3 is a bit bigger. Working with one hand quickly becomes cumbersome due to the weight.
Equipment - Acer convertible with Thunderbolt
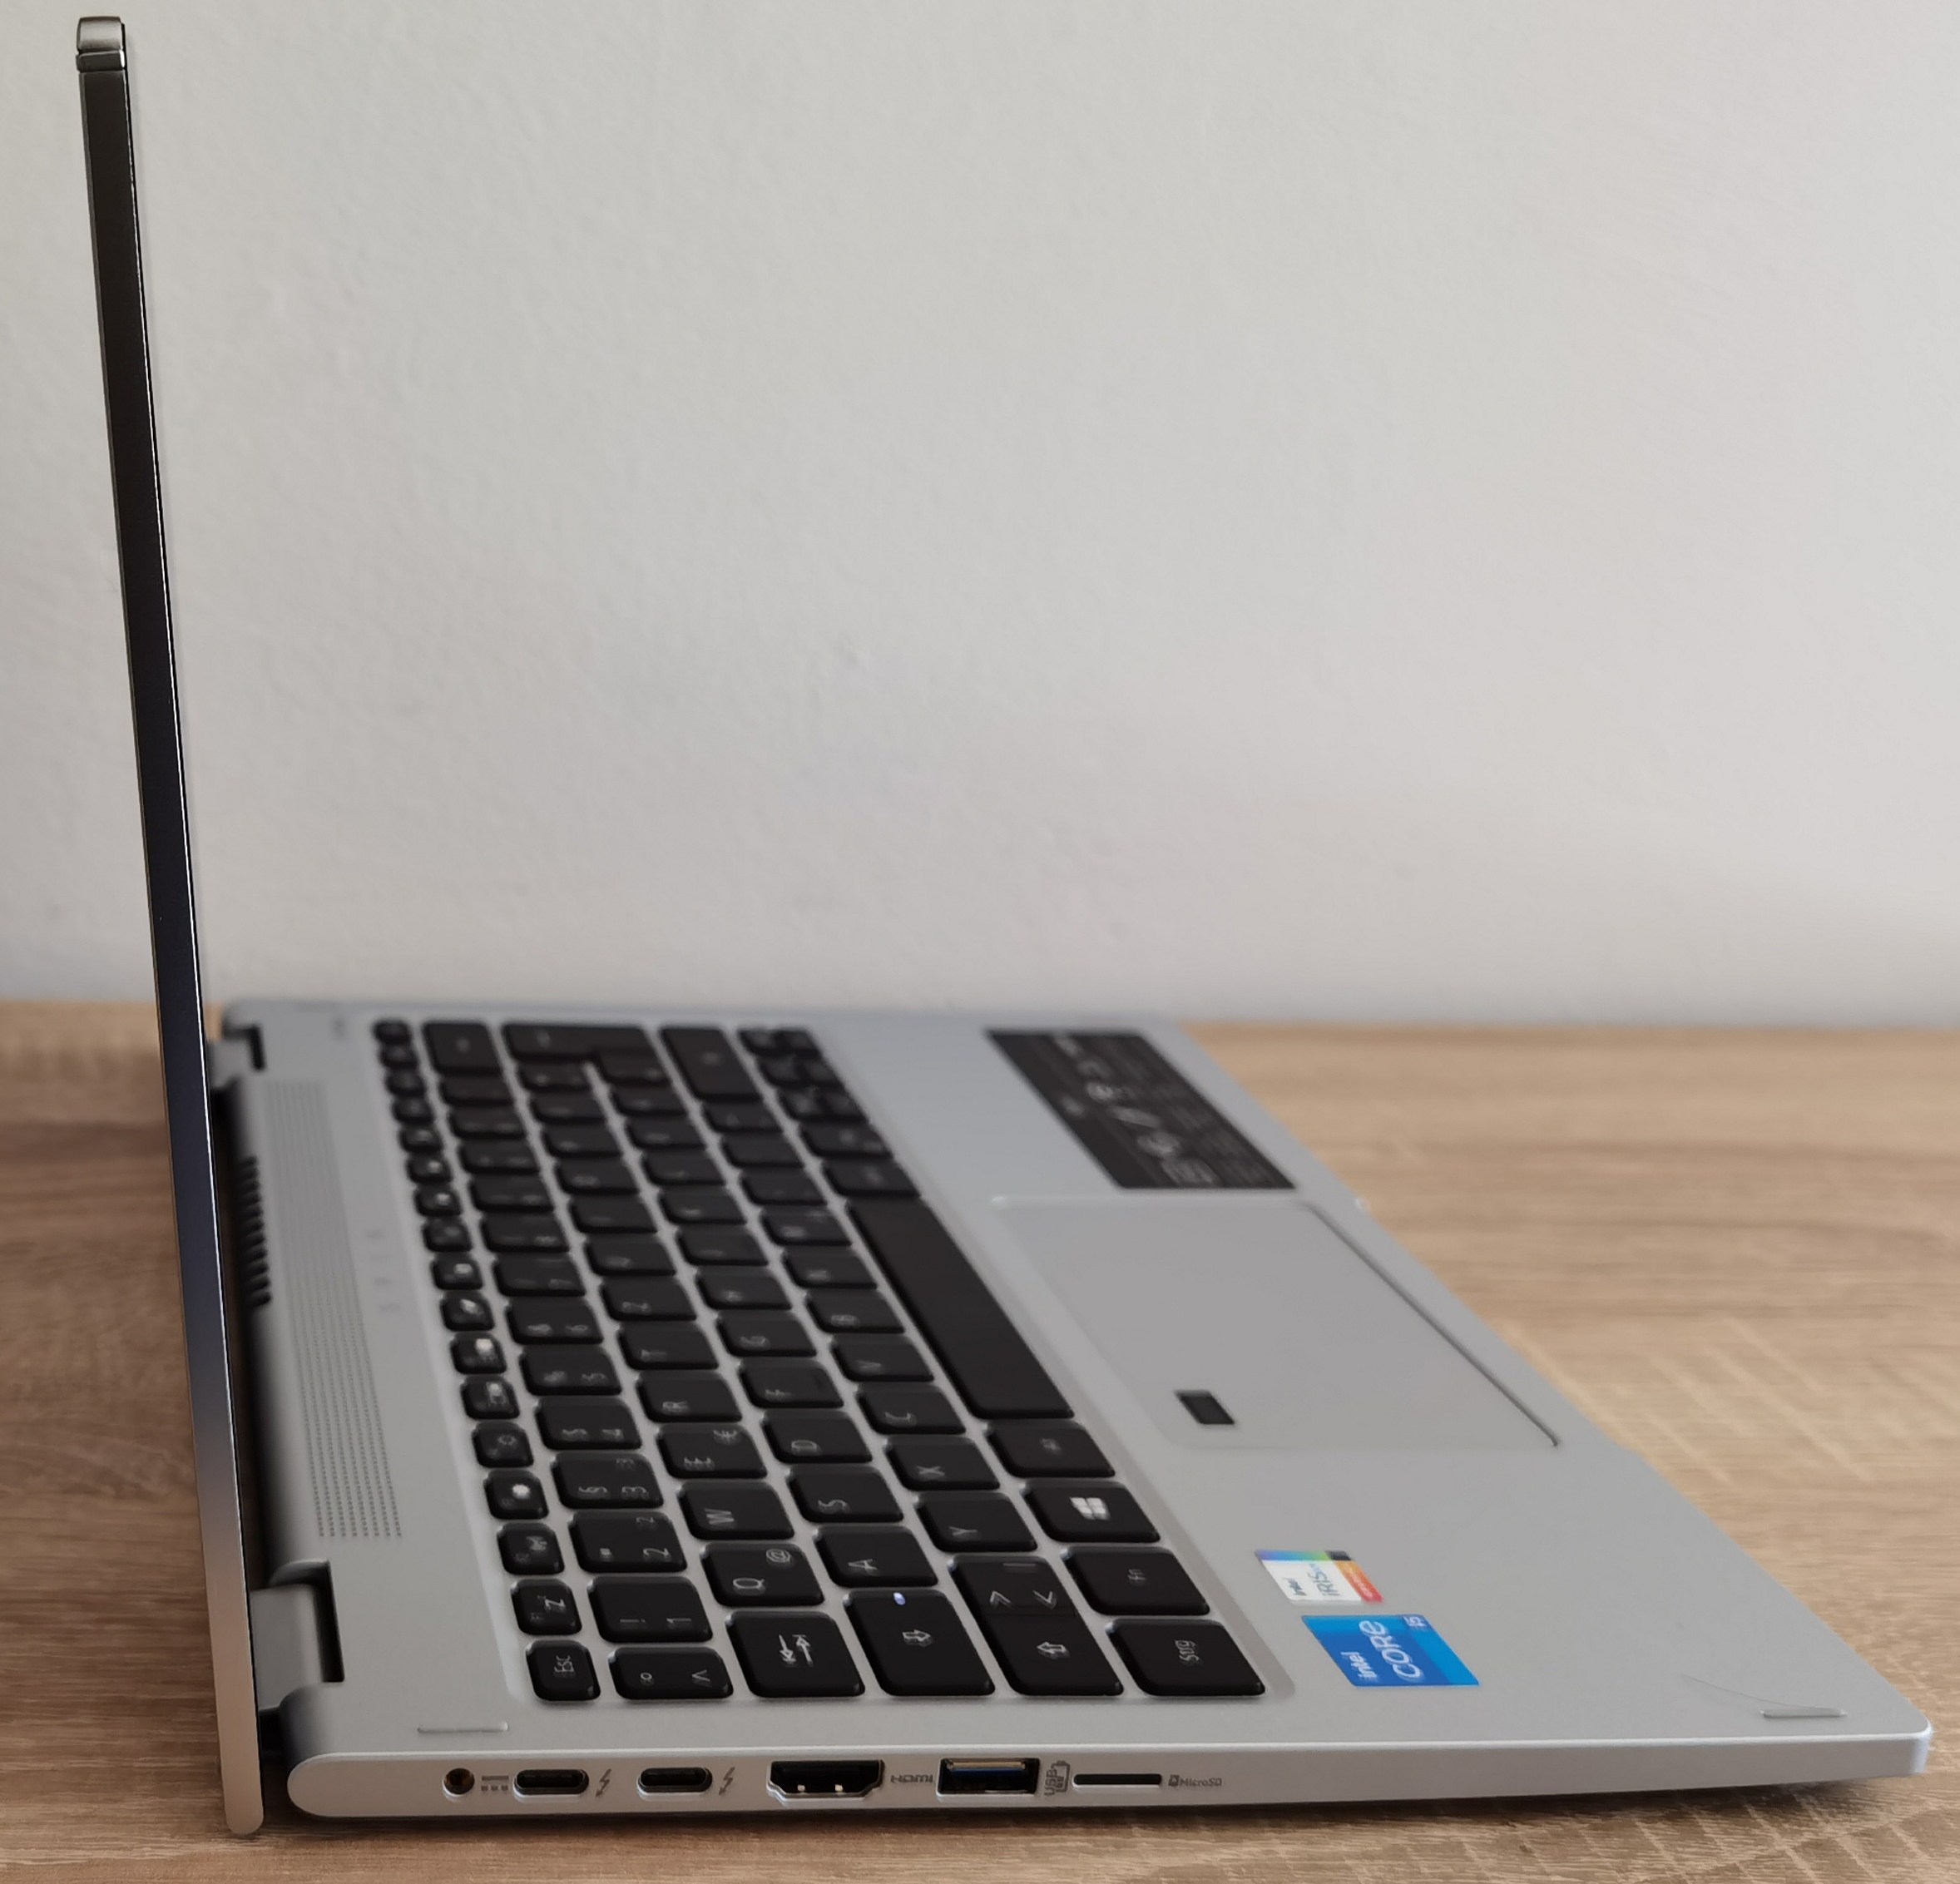
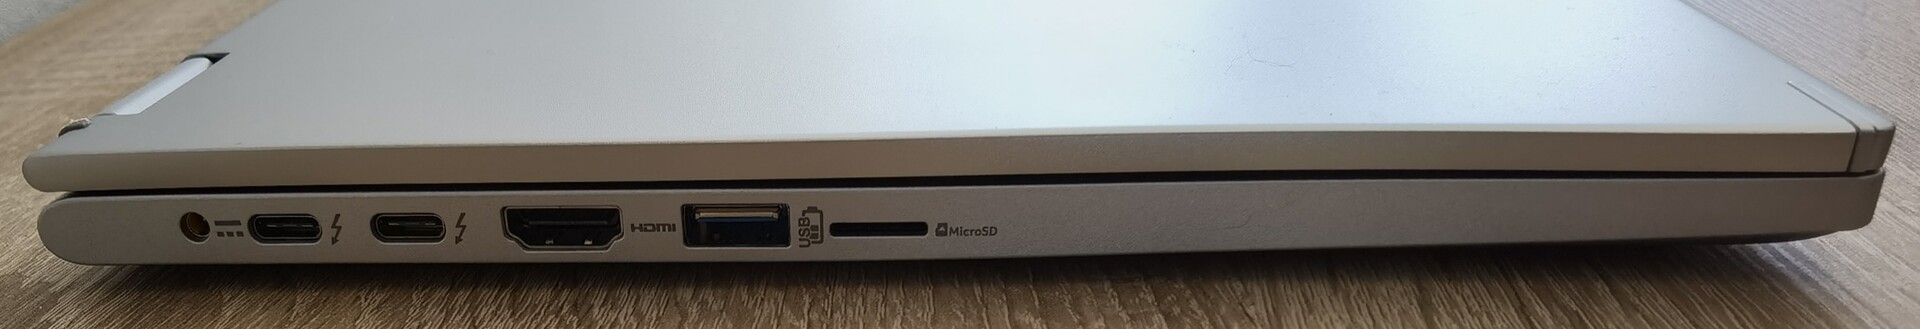
Intel brings Thunderbolt 4 to the Acer Spin with Tiger Lake, which supports a data bandwidth of 40 Gbit/s and thus up to two 4K or one 8k display-out port. If that's not enough, there's also an HDMI 2.0b port to choose from. USB 3.2 Gen 1 ports are also present as well as a micro-SD card reader, a combo audio jack and Kensington Lock.
Thus, almost all the necessary points that one needs are covered. In addition, all ports are placed so that neighboring slots are not obstructed.
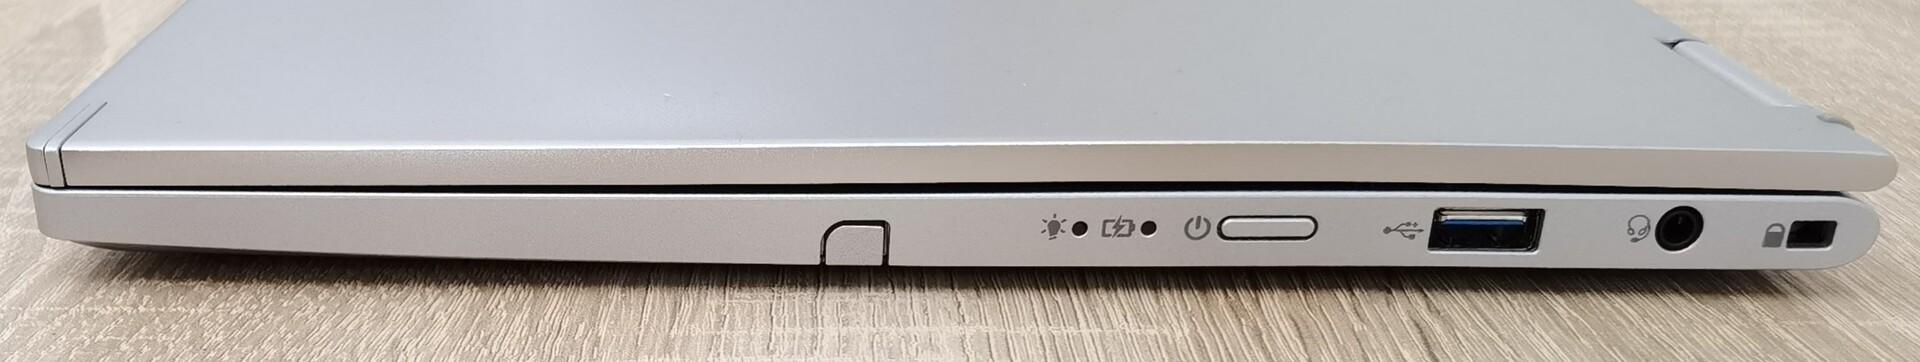
SD Card reader
The micro-SD card reader is slower than average. Thus, users who work a lot with micro-SD cards will need a lot of patience here. In our standard JPG copy tests and sequential read tests with the AV Pro microSD 128 GB V60, we recorded 14.5 MB/s and 27 MB/s, respectively.
| SD Card Reader | |
| average JPG Copy Test (av. of 3 runs) | |
| Dell XPS 13 9305 Core i5 FHD | |
| Lenovo ThinkPad L13 Yoga Gen2-20VK000VGE (AV PRO V60) | |
| Lenovo ThinkPad L13 Gen2-20VH0017GE (Toshiba Exceria Pro M501 64 GB UHS-II) | |
| Average of class Convertible (29.4 - 141, n=20, last 2 years) | |
| Acer Spin 3 SP313-51N-56YV (AV PRO microSD 128 GB V60) | |
| maximum AS SSD Seq Read Test (1GB) | |
| Dell XPS 13 9305 Core i5 FHD | |
| Average of class Convertible (67.5 - 254, n=19, last 2 years) | |
| Lenovo ThinkPad L13 Gen2-20VH0017GE (Toshiba Exceria Pro M501 64 GB UHS-II) | |
| Lenovo ThinkPad L13 Yoga Gen2-20VK000VGE (AV PRO V60) | |
| Acer Spin 3 SP313-51N-56YV (AV PRO microSD 128 GB V60) | |
Communication
The Acer Spin 3 SP313 does not have an Ethernet port. All networking is done via the Killer Wi-Fi 6 AX1650i chip, which also offers Bluetooth 5.1. The WLAN tests were performed at a distance of 1 m (3.3 ft) from our Netgear Nighthawk AX12 RAX120 router without physical obstacles or other connected network devices.
The Wi-Fi performance of the Spin 3 is almost 40 percent worse than the average scores in the iperf3 send and receive test. Dell's competition scores here with the Dell XPS 13 9305.
Webcam
The 720p webcam is only suitable for everyday use to a limited extent. A muddy picture, coarse resolution and slow display are the reasons for that. Users who place a lot of value on the webcam's quality should rather go for the Lenovo ThinkBook 13s or look for an external solution.


Maintenance
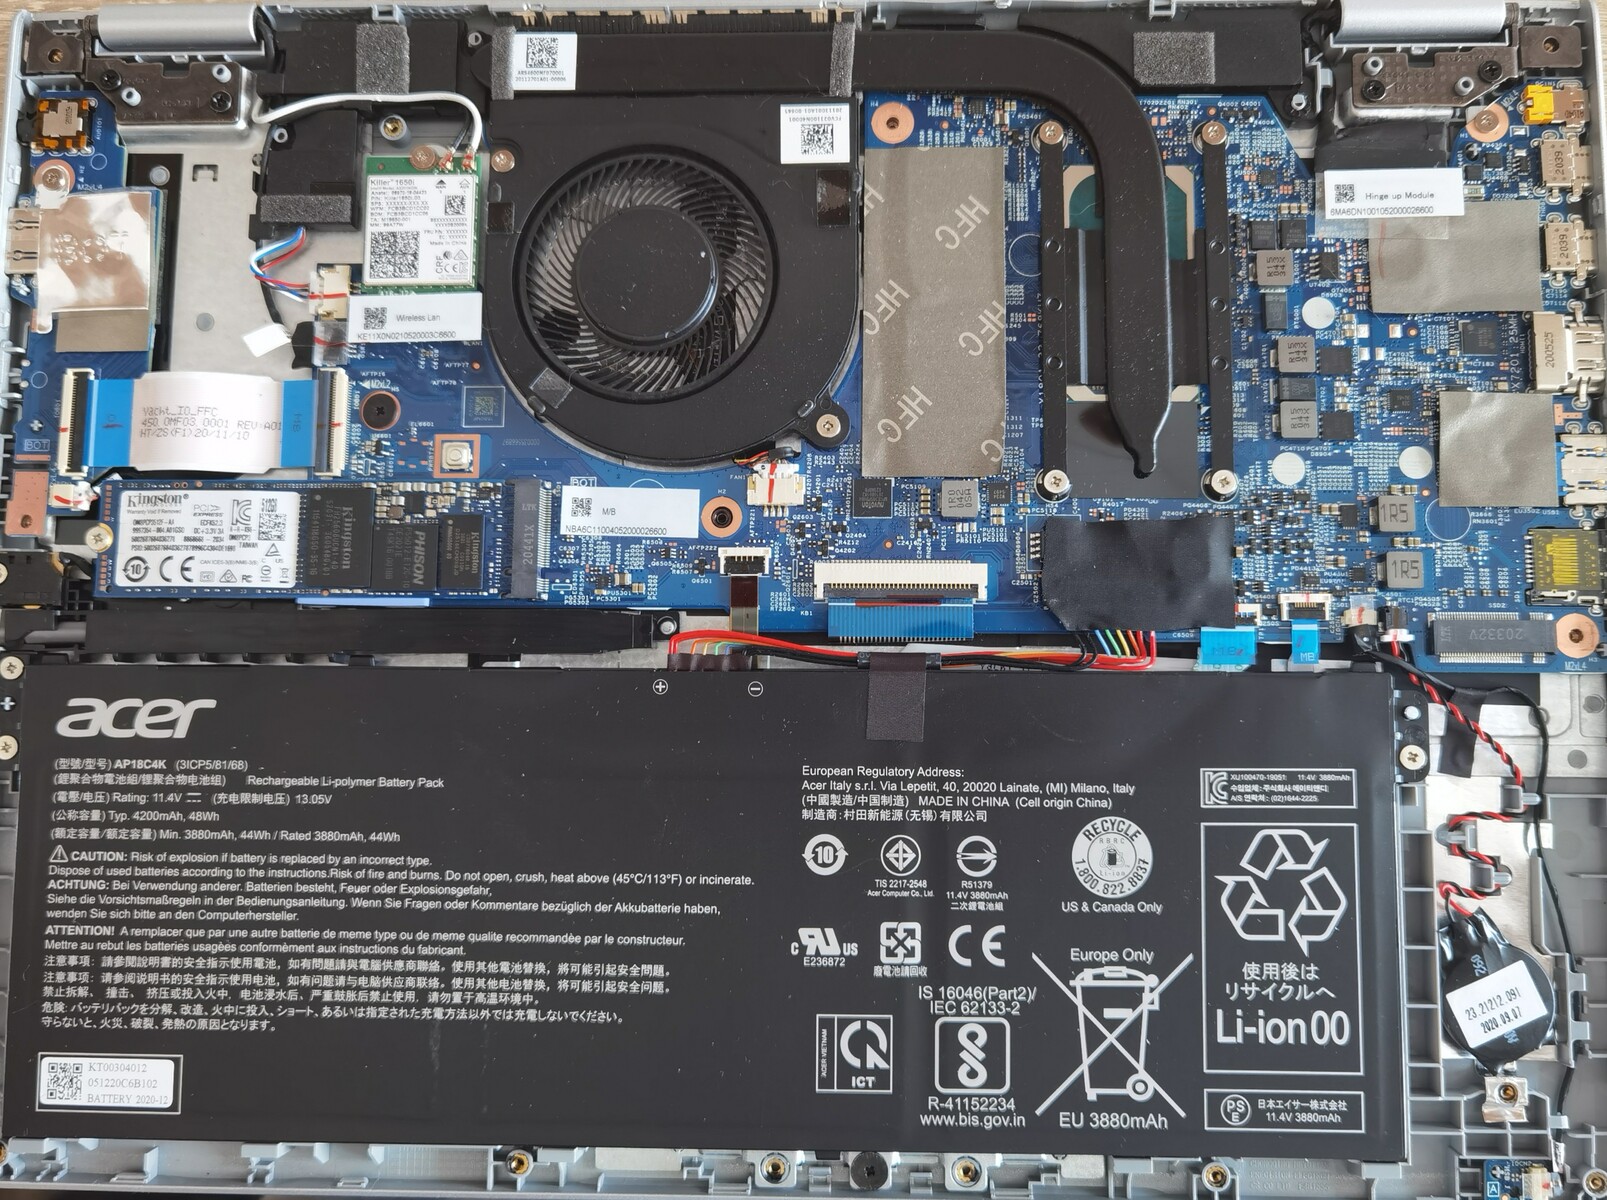
There is no maintenance hatch, so you have to remove the entire bottom cover to access the components. This is done by removing all 11 screws from the back and then opening the bottom panel with a lever tool.
Only the SSD and the WLAN card can be changed.
Inside, you can see a single heat pipe that runs along the Intel Core i5 1135G7 to a fan. Other manufacturers score with more heatpipes and/or more fans here. Since the entire waste heat is dissipated to the back via the fan slots in the center, the touch display also heats up due to the poor cooling performance. Acer could have done a better job with that.
Accessories and warranty
The scope of delivery includes the notebook as well as a power adapter and the usual inserts.
Acer offers a standard warranty for the Spin 3 with a one-year return service and a one-year ITW (International Travelers Warranty).
The ITW is a travel warranty that covers service cases during stays abroad up to a maximum of 3 months in over 100 countries around the world. With the ITW, you can have a device purchased in your home country repaired free of charge in the country where you are staying for no longer than 3 months, as long as it has an Acer representative.
Warranty extensions are available on the Acer homepage, where the standard warranty and the ITW can be extended up to 4 years. Acer offers a 3-year on-site service with repair within one business day for customers who need a replacement quickly in case of a defect.
Input devices - Acer with bright keyboard
Keyboard
The keys have a matte surface that is prone to fingerprints, but it proves to be relatively non-slip. The keyboard illumination has 3 levels and the brightness is more than sufficient. What we noticed negatively is the cramped keyboard layout. The space on the sides could have been used more here. Overall, the typing experience on the Spin 3 is good for most everyday tasks, although there is no strong tactile feedback. Keystroke noise is relatively quiet and no rattling/bending under pressure could be detected during use. Those used to desktop keyboards may find the key travel too soft, but you will quickly get used to it.

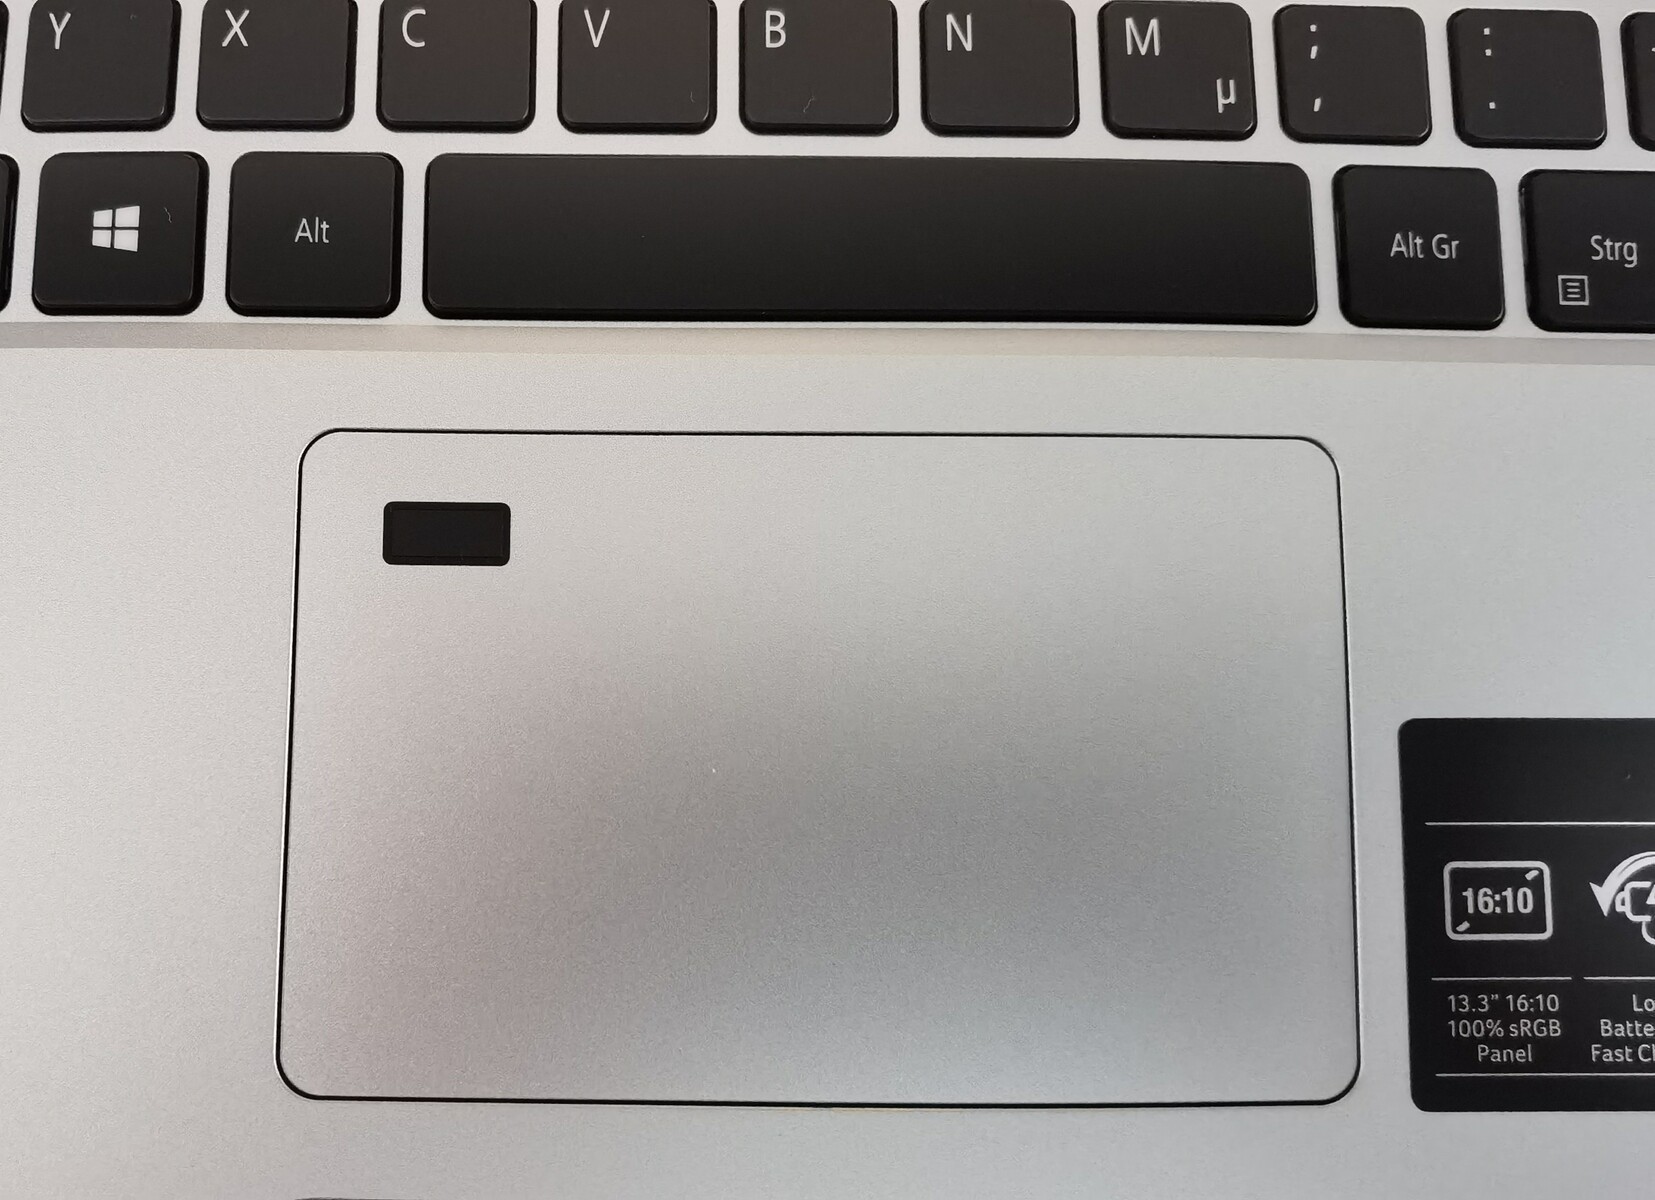
Touchpad
The touchpad has a very precise response and offers enough surface area without giving you the feeling that you could accidentally reach the touchpad while typing. The trackpad also offers a clearly noticeable pressure point towards the bottom. On the top left of the touchpad is the fingerprint sensor, which can be used to unlock the device quickly and securely.
The multi-touch screen has a swift response and does not offer any reason for criticism in our opinion.
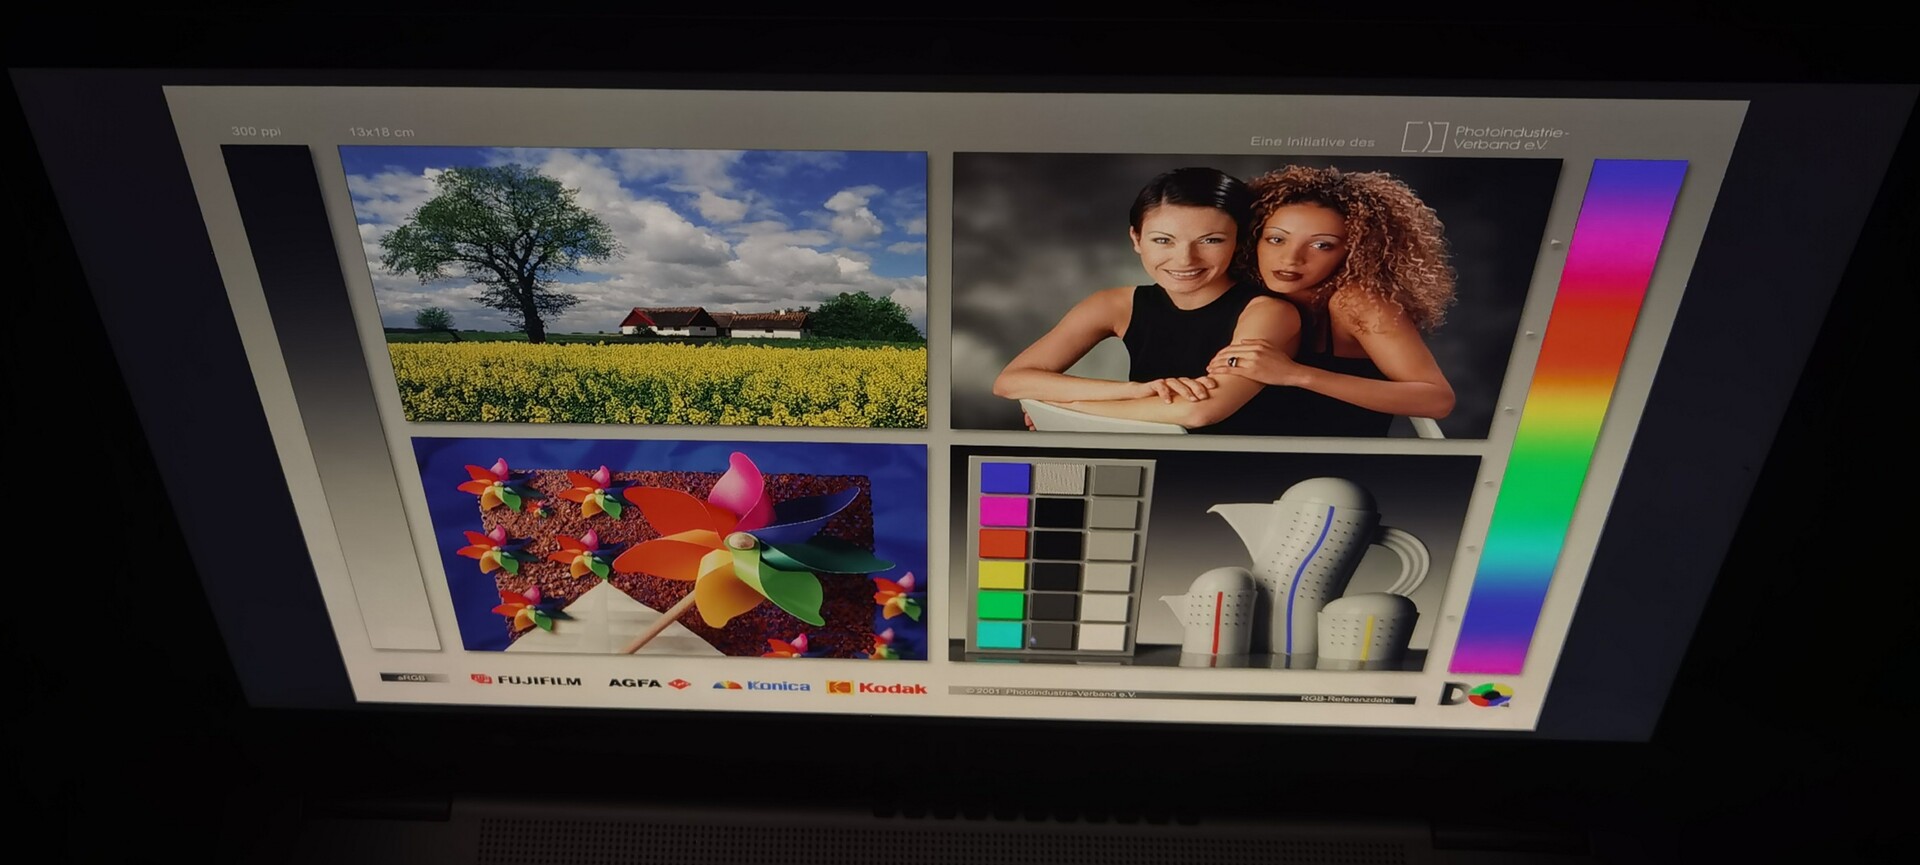
Display - WQXGA in 16:10 format
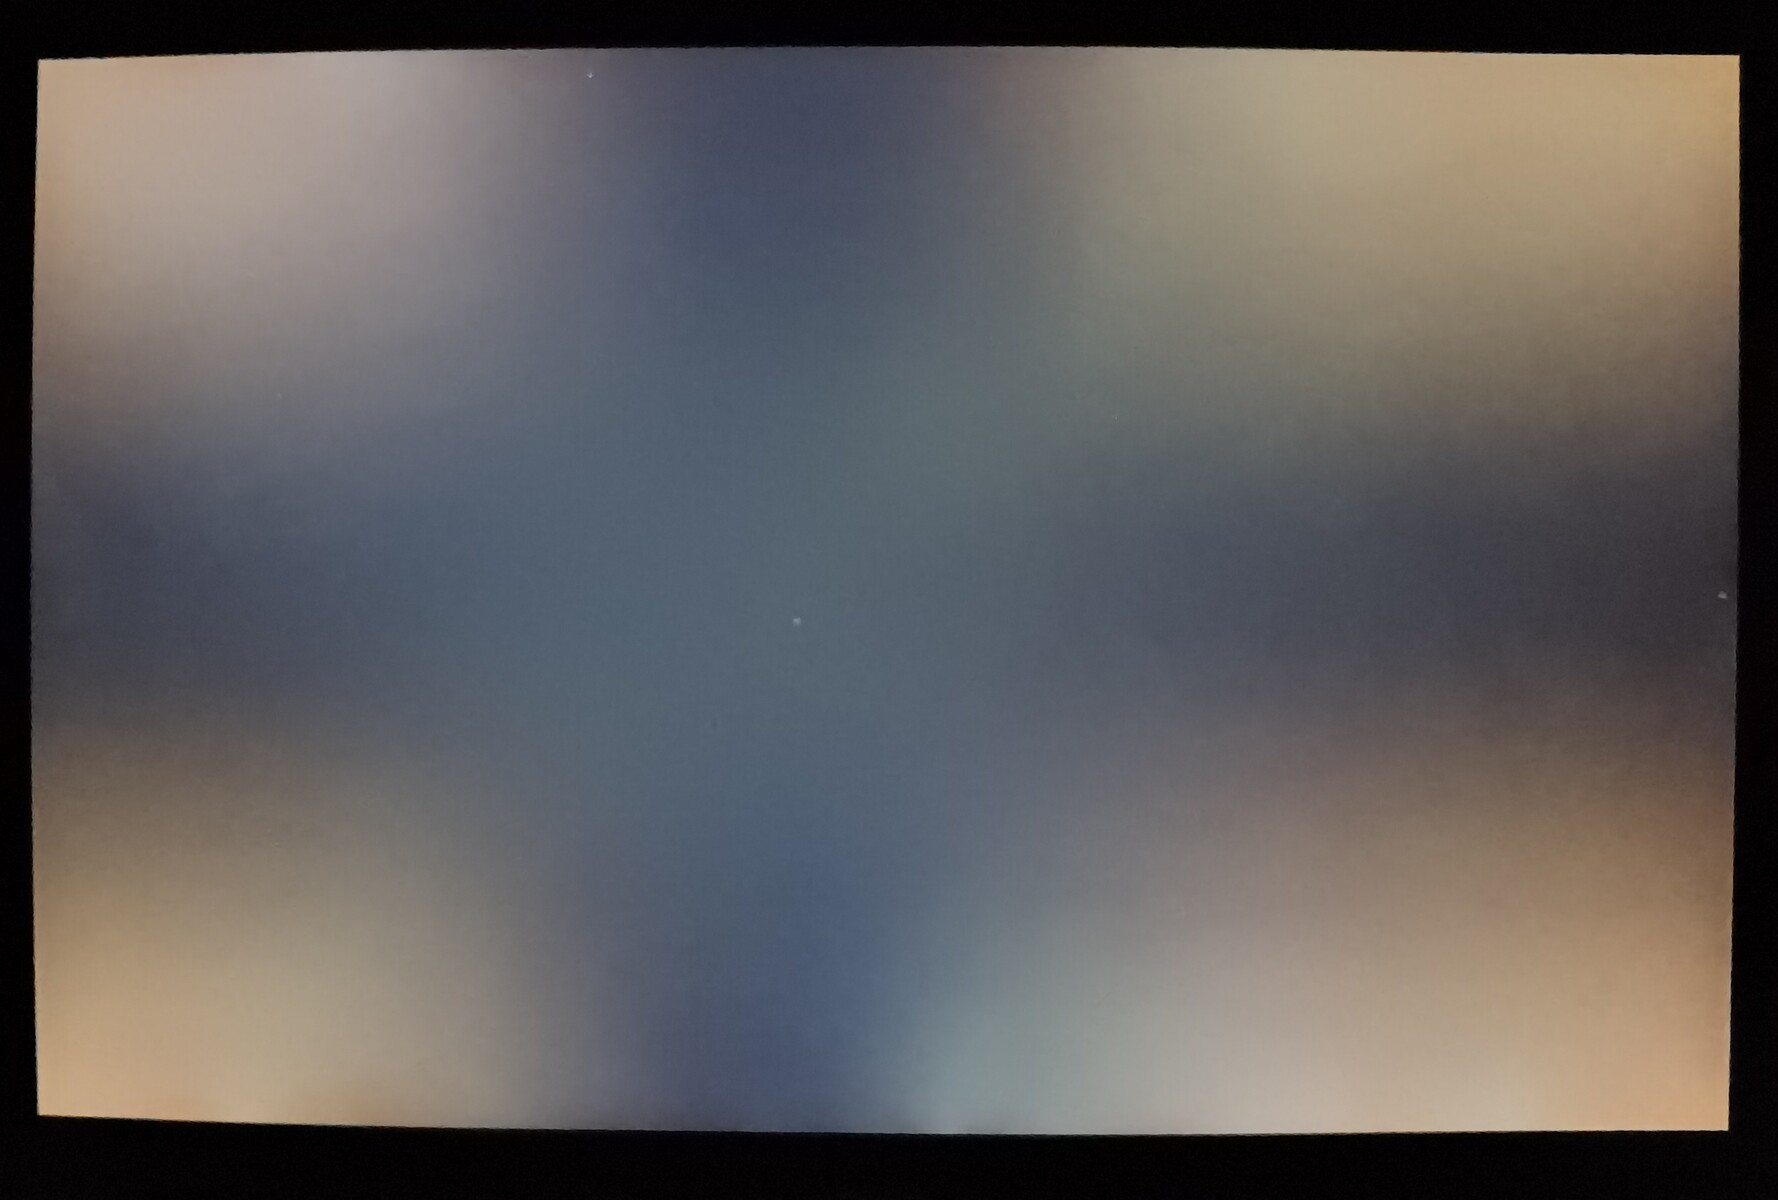
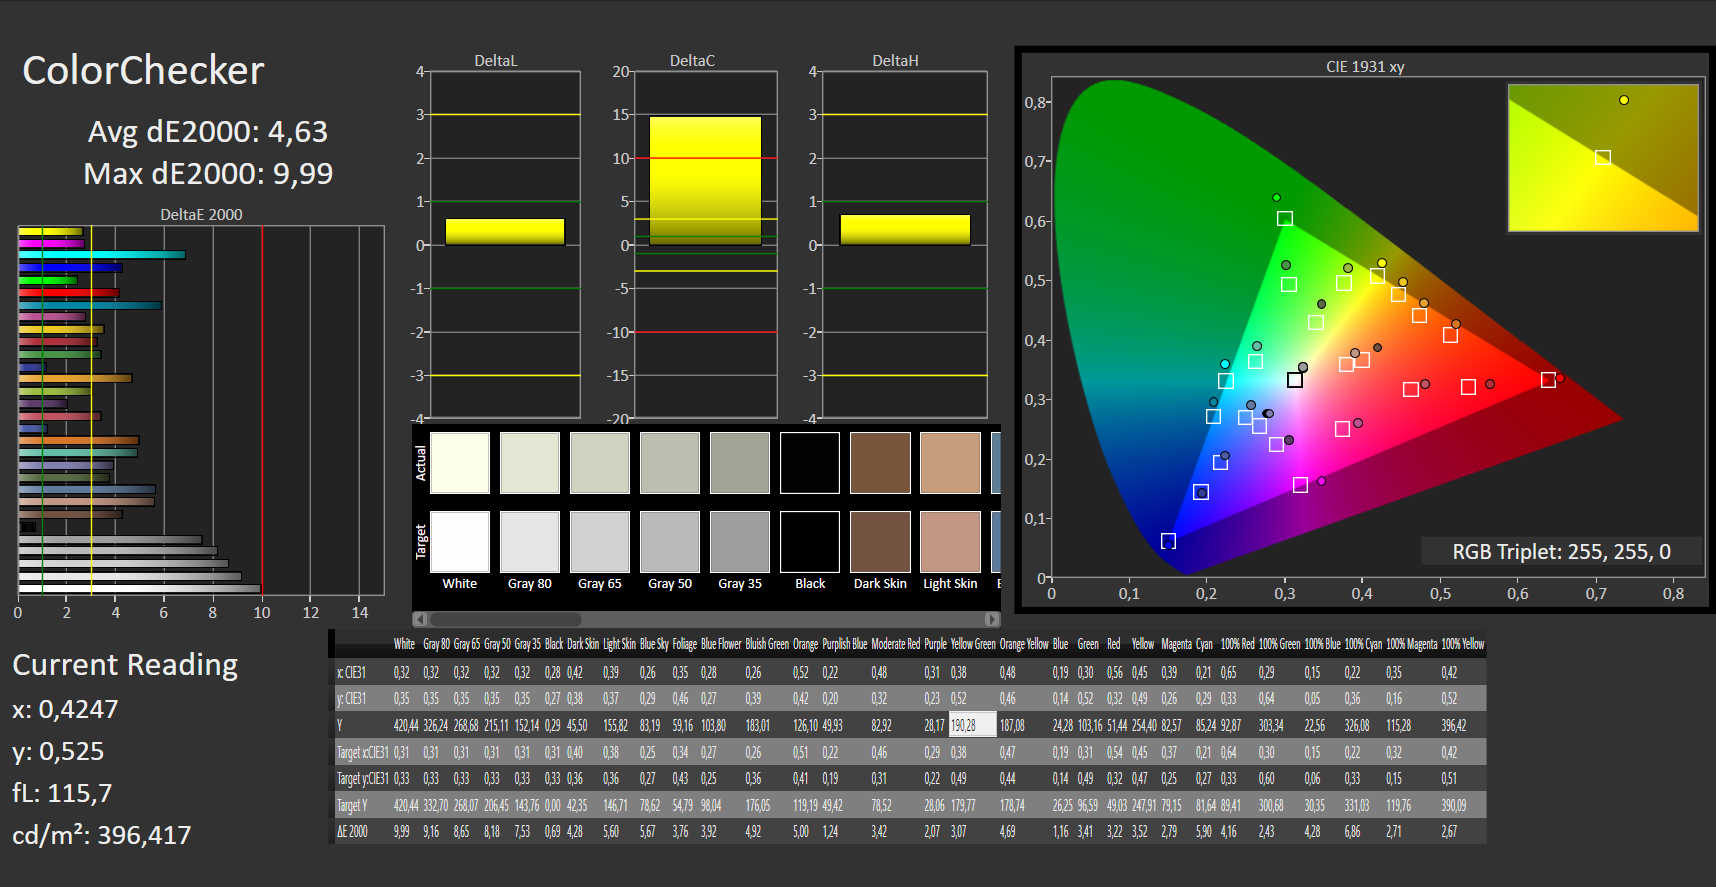
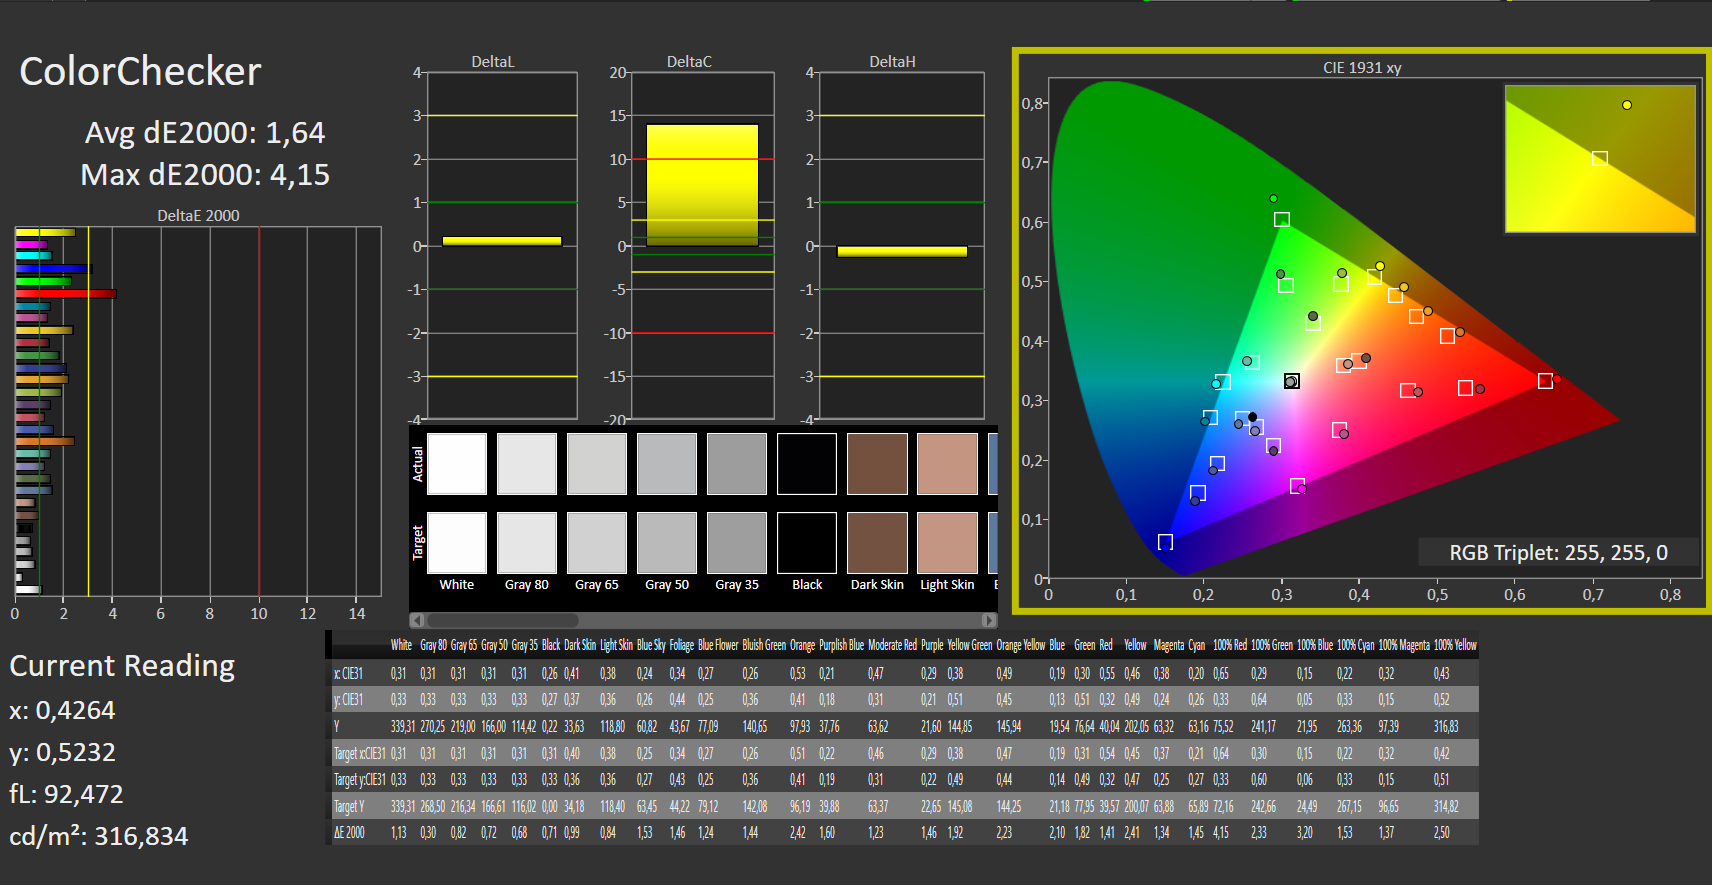
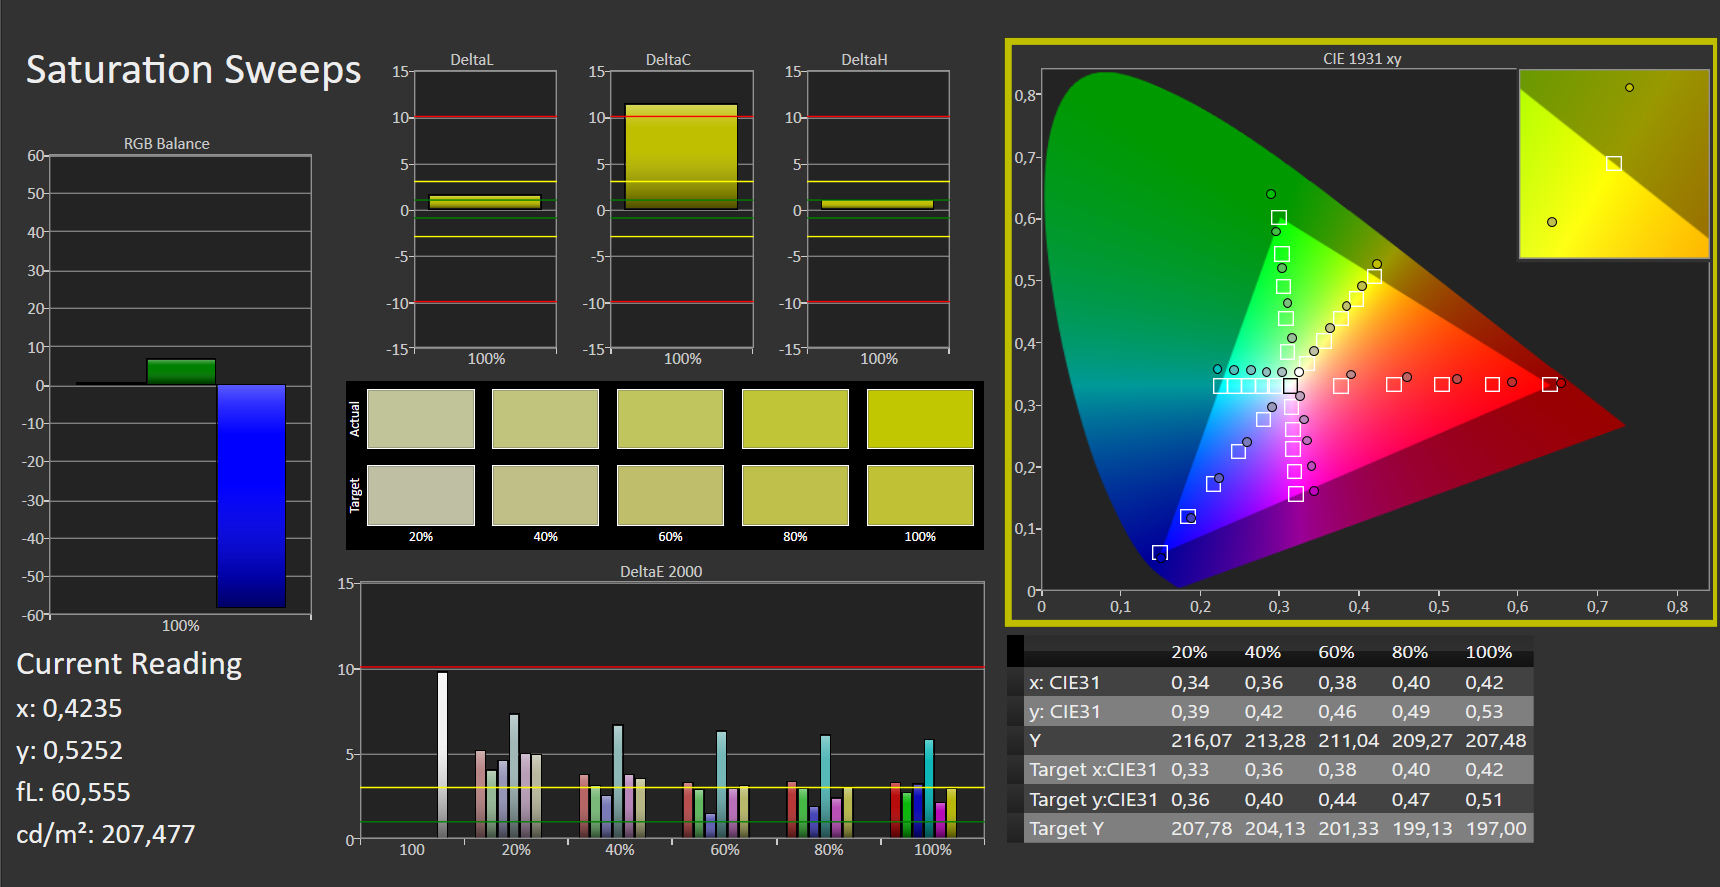
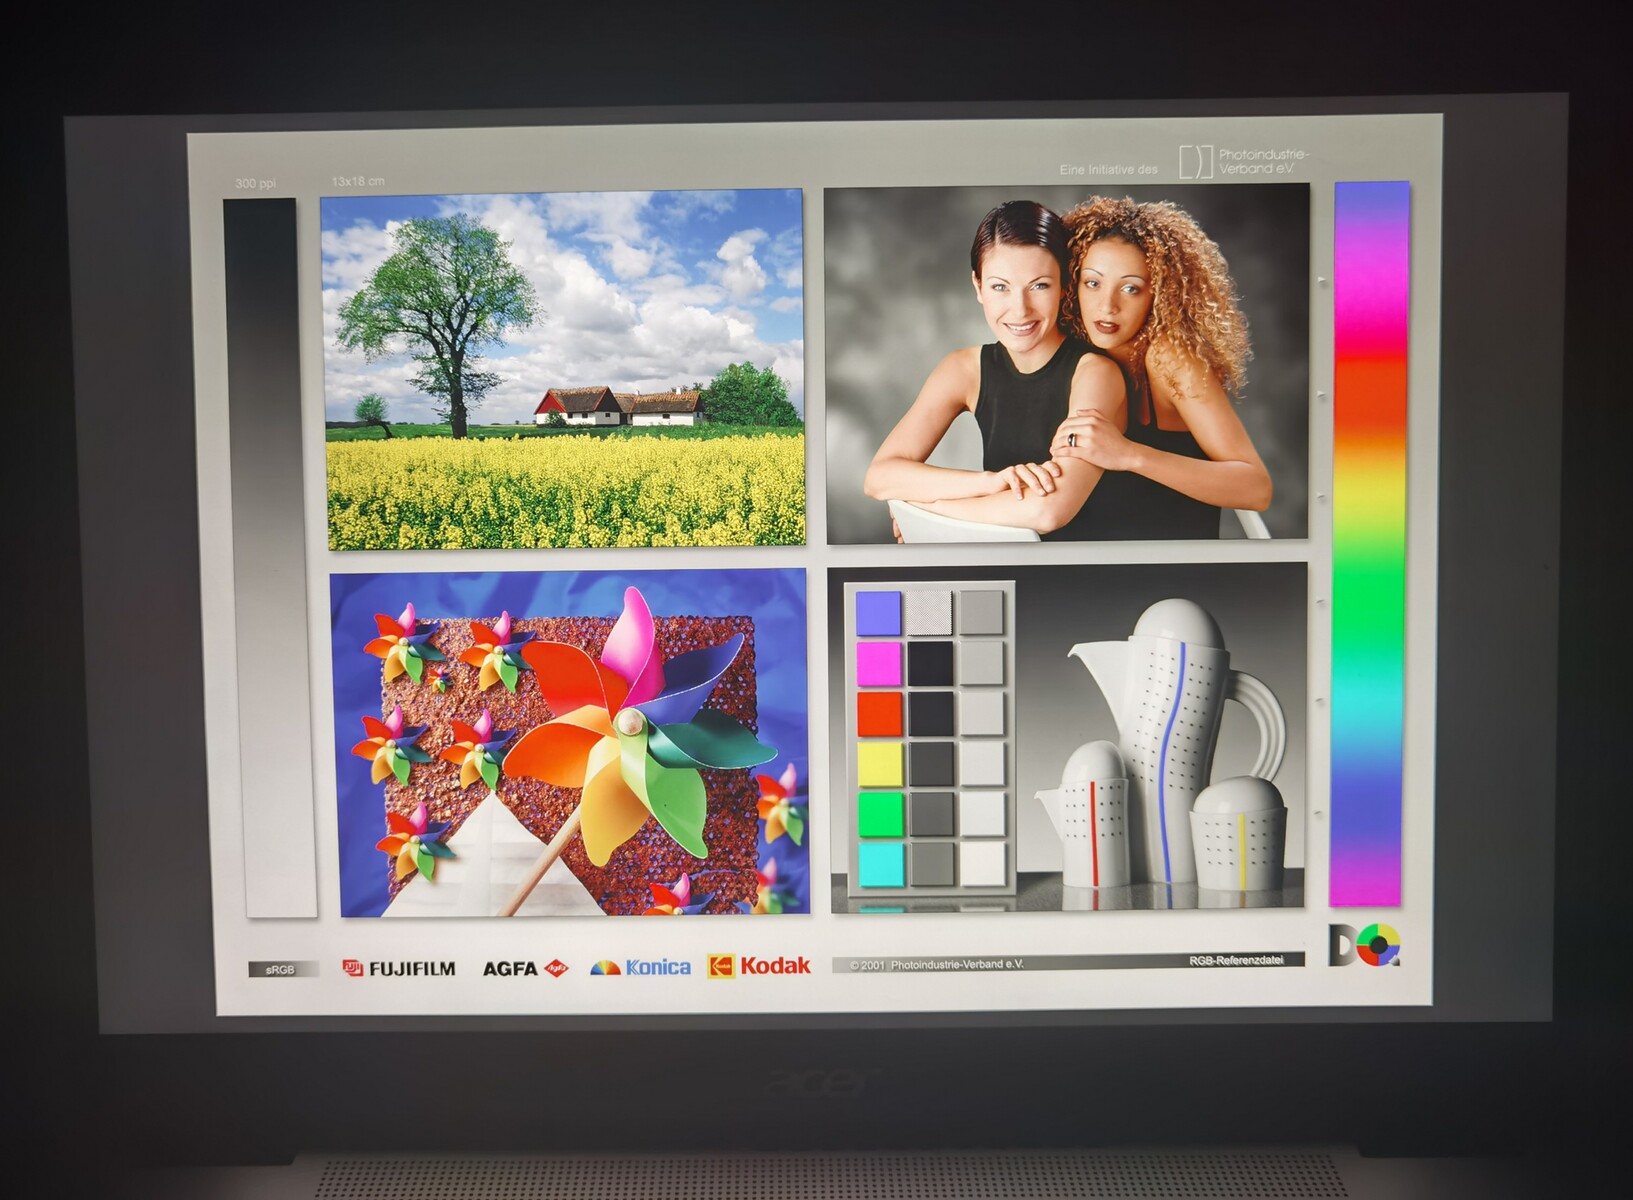
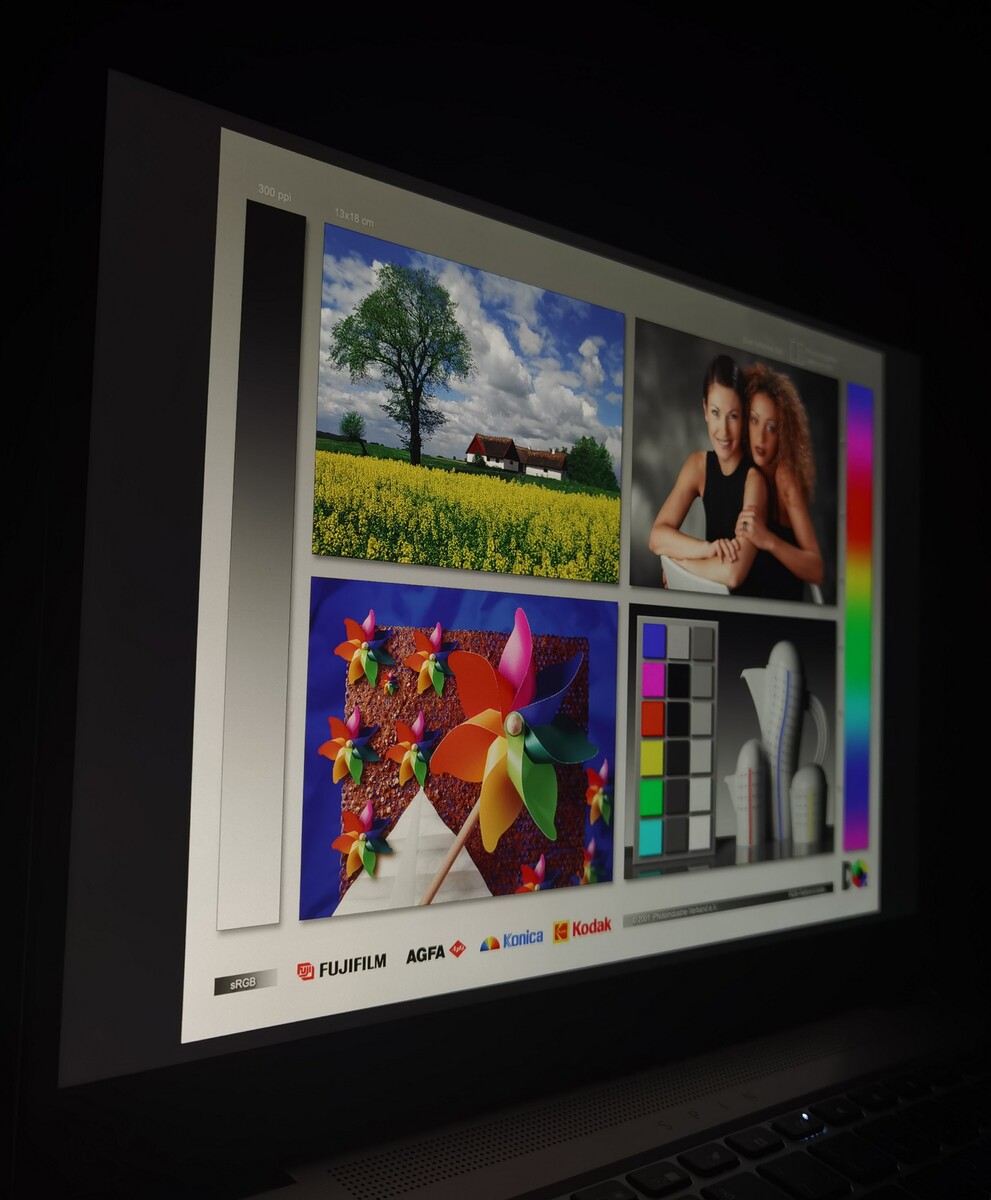
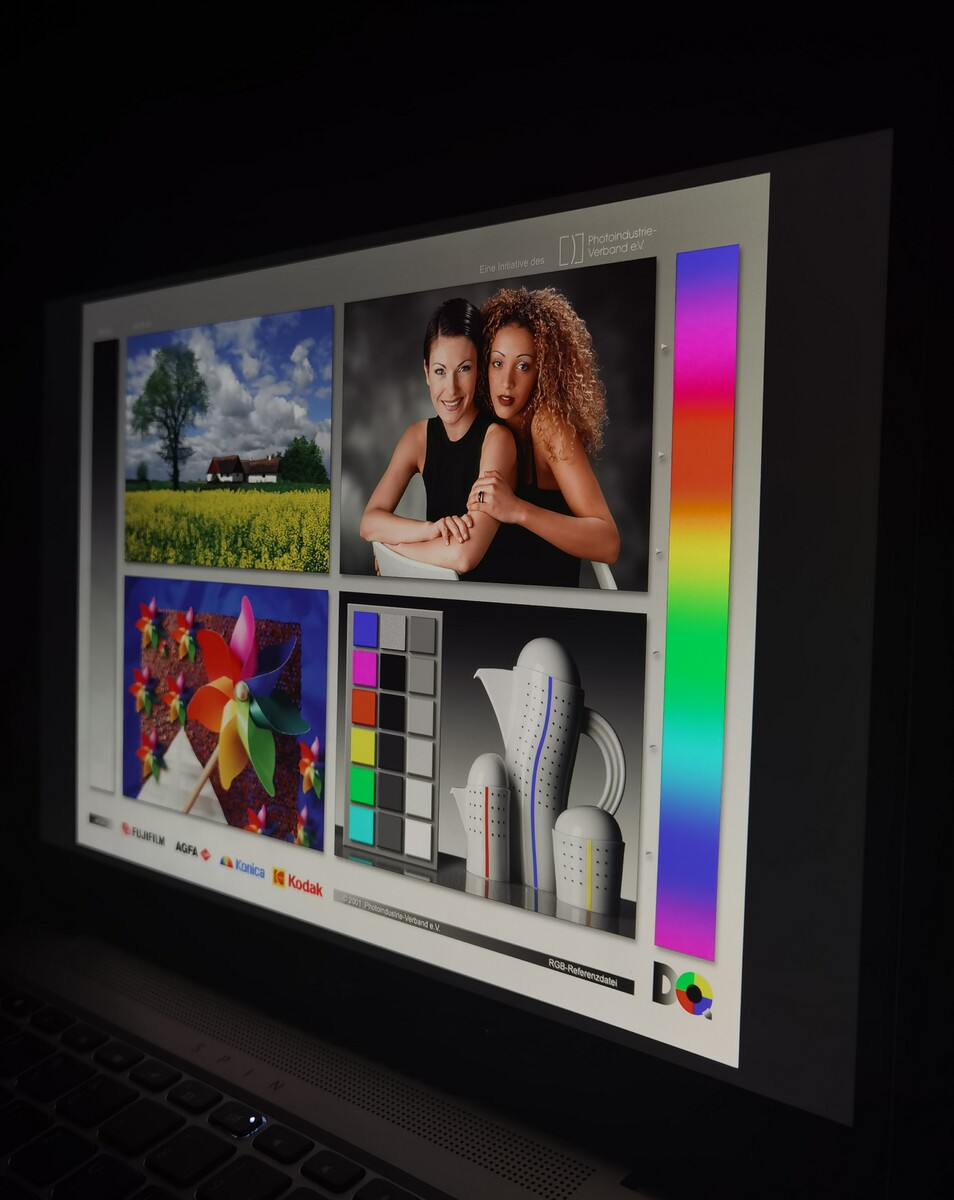
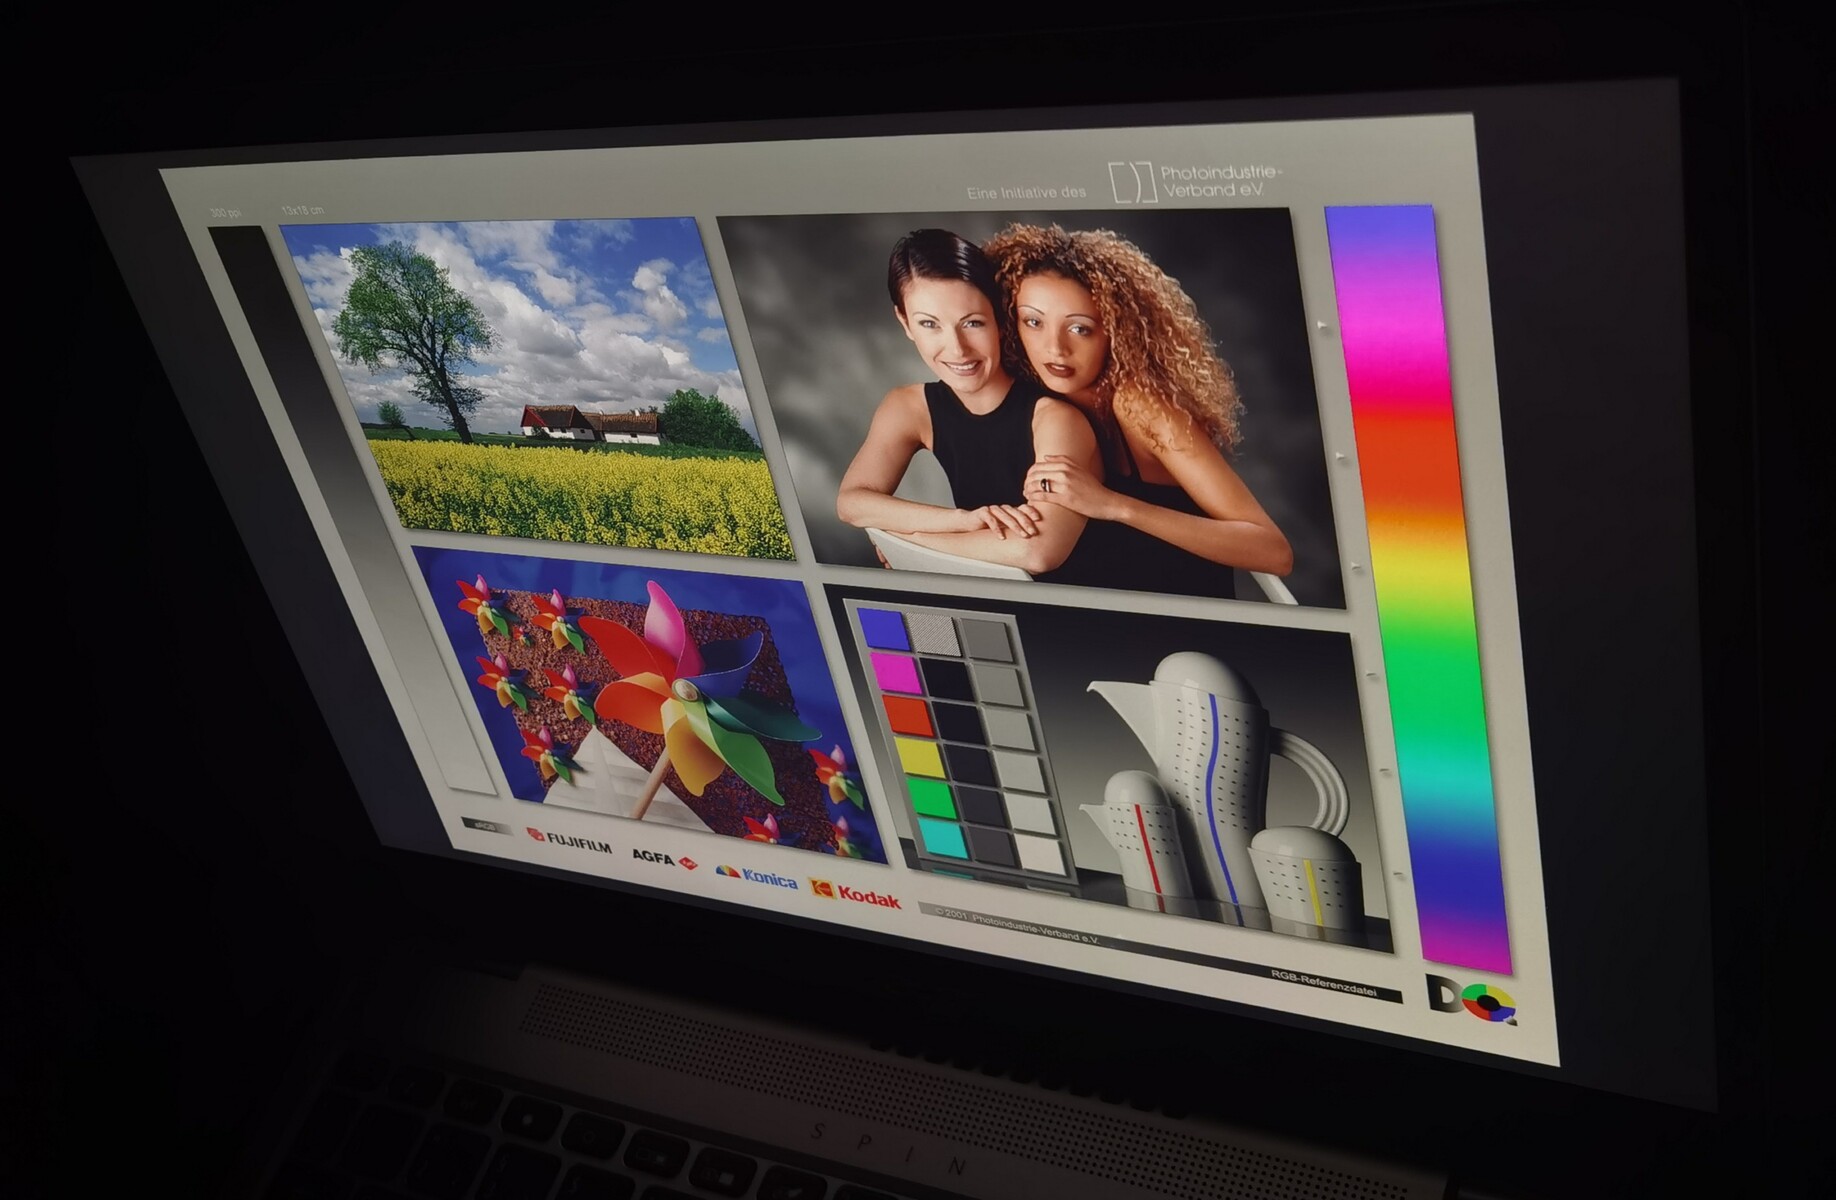
The 13.3-inch LCD display with LED backlight technology scores with a resolution of 2560 x 1600 (WQXGA) in 16:10 format and offers a multi-touch screen. The screen is only suitable for outdoor use to a limited extent because it is reflective. The illumination is uneven towards the center and offers an average brightness of 306 candelas. If you take a look at the competition, you will notice that Dell offers a much brighter screen, but you also have to make do with a Full HD resolution and worse values in terms of color space. You can see halos at the edges, but they are not visible in practice. We did not notice any PWM during use.
| |||||||||||||||||||||||||
Brightness Distribution: 83 %
Center on Battery: 343 cd/m²
Contrast: 1252:1 (Black: 0.27 cd/m²)
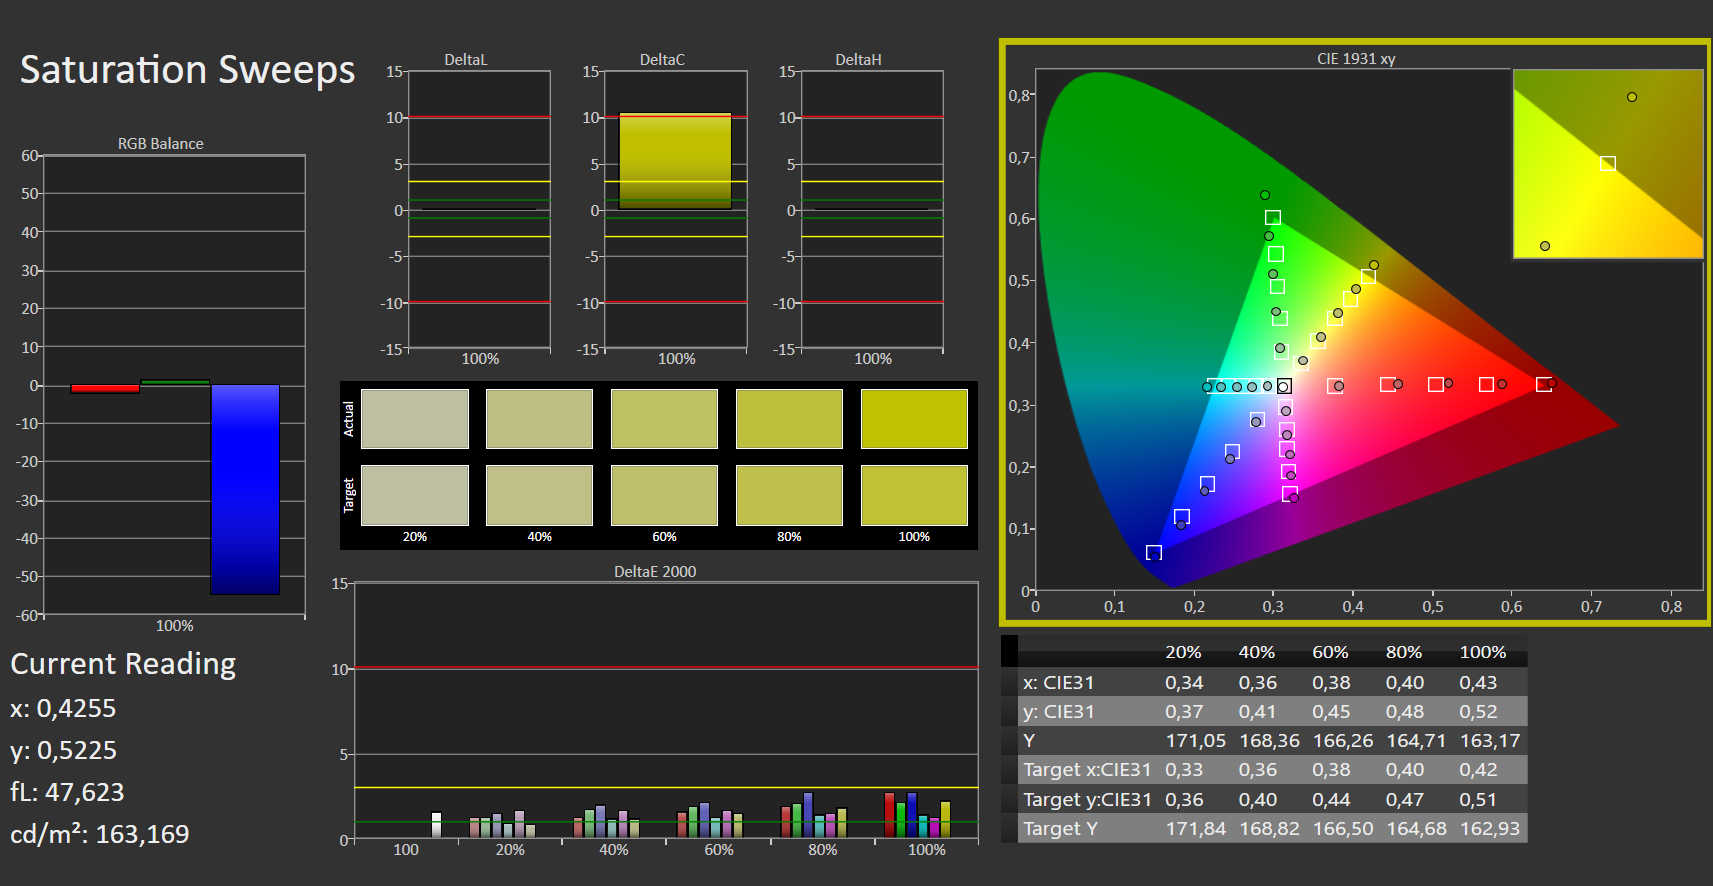
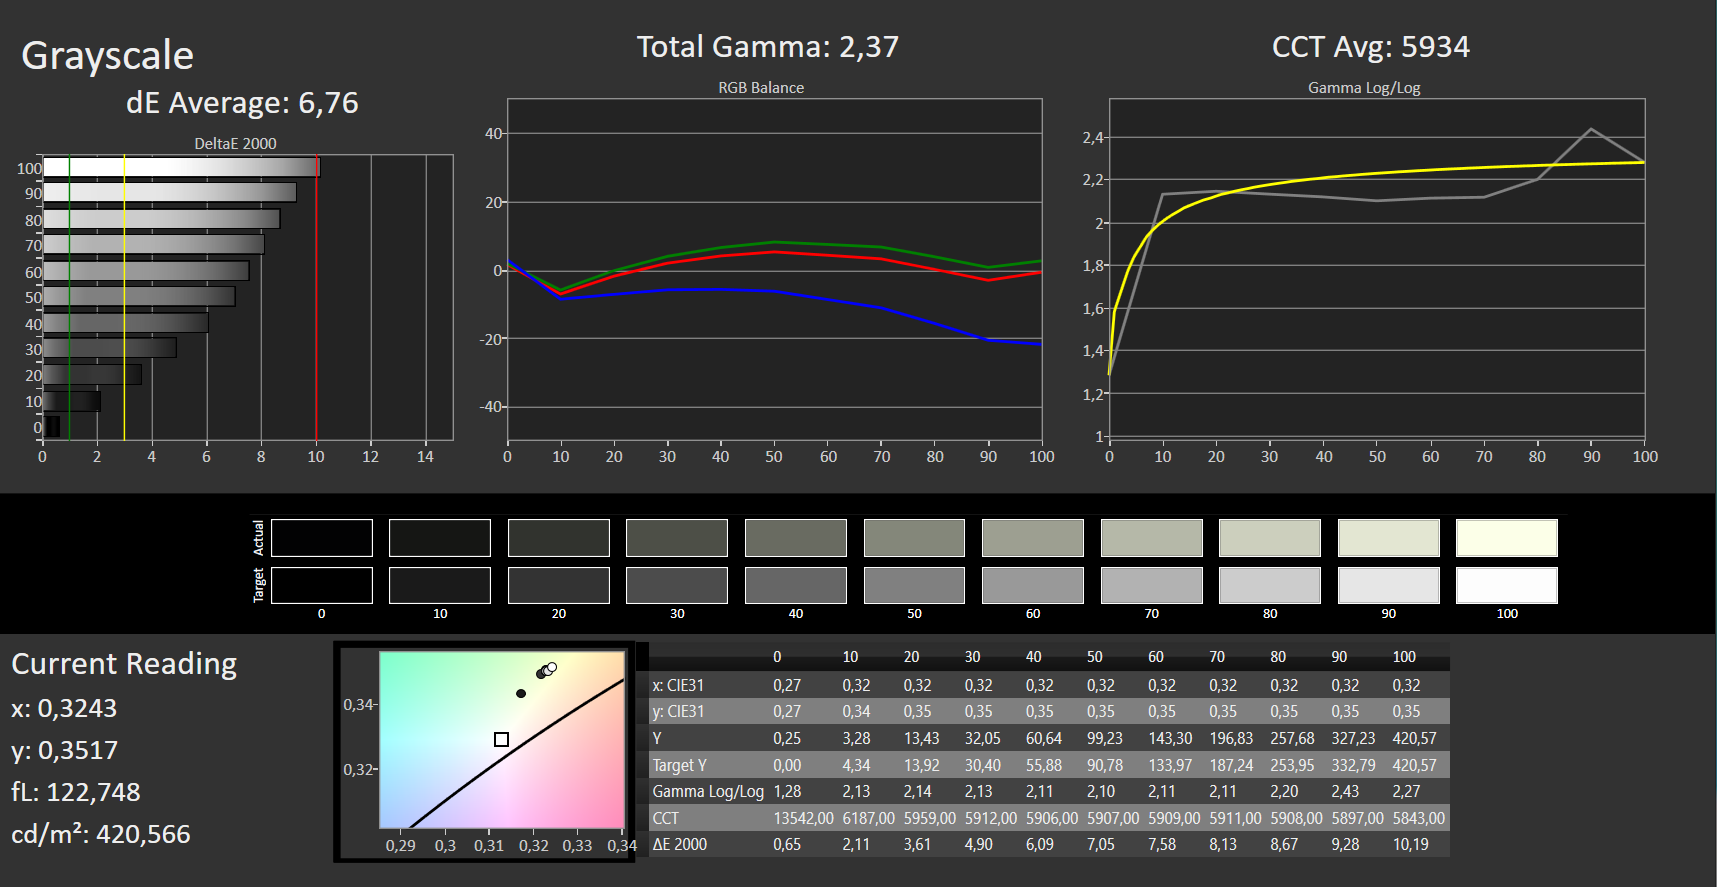
ΔE ColorChecker Calman: 4.63 | ∀{0.5-29.43 Ø4.71}
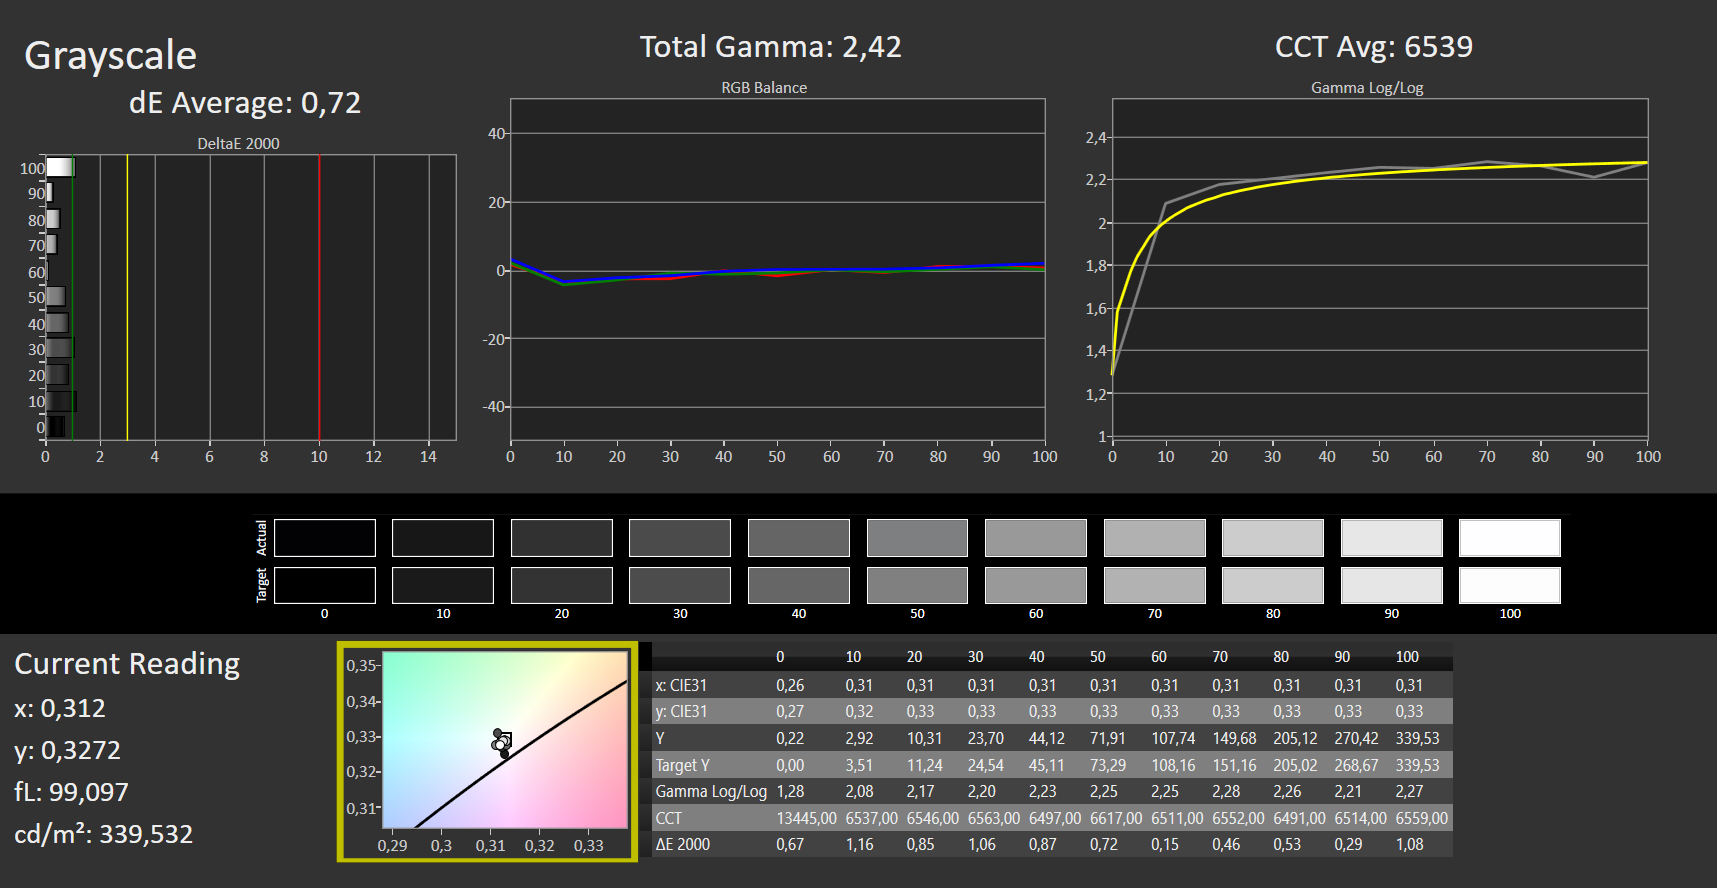
calibrated: 1.64
ΔE Greyscale Calman: 6.76 | ∀{0.09-98 Ø4.96}
98% sRGB (Argyll 1.6.3 3D)
68% AdobeRGB 1998 (Argyll 1.6.3 3D)
77.6% AdobeRGB 1998 (Argyll 3D)
99.8% sRGB (Argyll 3D)
78.8% Display P3 (Argyll 3D)
Gamma: 2.37
CCT: 5934 K
| Acer Spin 3 SP313-51N-56YV AU Optronics AUOB493, IPS, 2560x1600, 13.3" | Dell XPS 13 9305 Core i5 FHD Sharp SHP14AE, IPS, 1920x1080, 13.3" | Lenovo ThinkPad L13 Yoga Gen2-20VK000VGE N133HCE-EP2, IPS, 1920x1080, 13.3" | Lenovo ThinkPad L13 Gen2-20VH0017GE B133HAN06.6, IPS, 1920x1080, 13.3" | |
|---|---|---|---|---|
| Display | -11% | -7% | -45% | |
| Display P3 Coverage (%) | 78.8 | 66.3 -16% | 68.5 -13% | 42.49 -46% |
| sRGB Coverage (%) | 99.8 | 97.1 -3% | 99.4 0% | |
| AdobeRGB 1998 Coverage (%) | 77.6 | 67.1 -14% | 70.7 -9% | 43.92 -43% |
| Response Times | 10% | 14% | 6% | |
| Response Time Grey 50% / Grey 80% * (ms) | 52 ? | 55 ? -6% | 44.4 ? 15% | 52.4 ? -1% |
| Response Time Black / White * (ms) | 36 ? | 27 ? 25% | 31.2 ? 13% | 31.2 ? 13% |
| PWM Frequency (Hz) | 996 ? | 25000 ? | ||
| Screen | 20% | 22% | -26% | |
| Brightness middle (cd/m²) | 338 | 486 44% | 316 -7% | 244 -28% |
| Brightness (cd/m²) | 307 | 446 45% | 299 -3% | 237 -23% |
| Brightness Distribution (%) | 83 | 77 -7% | 92 11% | 93 12% |
| Black Level * (cd/m²) | 0.27 | 0.4 -48% | 0.25 7% | 0.21 22% |
| Contrast (:1) | 1252 | 1215 -3% | 1264 1% | 1162 -7% |
| Colorchecker dE 2000 * | 4.63 | 2.54 45% | 1.7 63% | 4.7 -2% |
| Colorchecker dE 2000 max. * | 9.99 | 4.34 57% | 3.8 62% | 17.7 -77% |
| Colorchecker dE 2000 calibrated * | 1.64 | 1.04 37% | 0.7 57% | 4.3 -162% |
| Greyscale dE 2000 * | 6.76 | 2.34 65% | 2.8 59% | 2.8 59% |
| Gamma | 2.37 93% | 2.28 96% | 2.25 98% | 2.24 98% |
| CCT | 5934 110% | 6864 95% | 6654 98% | 6259 104% |
| Color Space (Percent of AdobeRGB 1998) (%) | 68 | 62 -9% | 64.5 -5% | 40.3 -41% |
| Color Space (Percent of sRGB) (%) | 98 | 97 -1% | 99.4 1% | 63 -36% |
| Total Average (Program / Settings) | 6% /
13% | 10% /
16% | -22% /
-24% |
* ... smaller is better
With 98% coverage of the sRGB color space and 68% of AdobeRGB, the Spin 3 does not have to hide behind its rivals; on the contrary, it even achieves the best rates here. Content creation is definitely feasible with this device. The contrast ratio of 1252:1 and the black value of 0.27 also cut a good figure. Only the response times of the test device are quite poor.
The Spin 3 is only suitable for outdoor use to a limited extent. The display brightness would have to be higher for this. You should avoid direct sunlight because the display is highly reflective. Thus, it is hardly possible to use it on very bright days.
Display Response Times
| ↔ Response Time Black to White | ||
|---|---|---|
| 36 ms ... rise ↗ and fall ↘ combined | ↗ 21 ms rise |  |
| ↘ 15 ms fall | ||
| The screen shows slow response rates in our tests and will be unsatisfactory for gamers. In comparison, all tested devices range from 0.1 (minimum) to 240 (maximum) ms. » 94 % of all devices are better. This means that the measured response time is worse than the average of all tested devices (19.8 ms). | ||
| ↔ Response Time 50% Grey to 80% Grey | ||
| 52 ms ... rise ↗ and fall ↘ combined | ↗ 26 ms rise |  |
| ↘ 26 ms fall | ||
| The screen shows slow response rates in our tests and will be unsatisfactory for gamers. In comparison, all tested devices range from 0.165 (minimum) to 636 (maximum) ms. » 88 % of all devices are better. This means that the measured response time is worse than the average of all tested devices (31 ms). | ||
Screen Flickering / PWM (Pulse-Width Modulation)
| Screen flickering / PWM not detected |  | ||
In comparison: 52 % of all tested devices do not use PWM to dim the display. If PWM was detected, an average of 7754 (minimum: 5 - maximum: 343500) Hz was measured. | |||
The viewing angle stability is first-rate thanks to the IPS panel and is not limited in any way. Operation on the lap is possible without problems thanks to Acer's chosen cooling concept.
Performance - Acer meets Tiger Lake
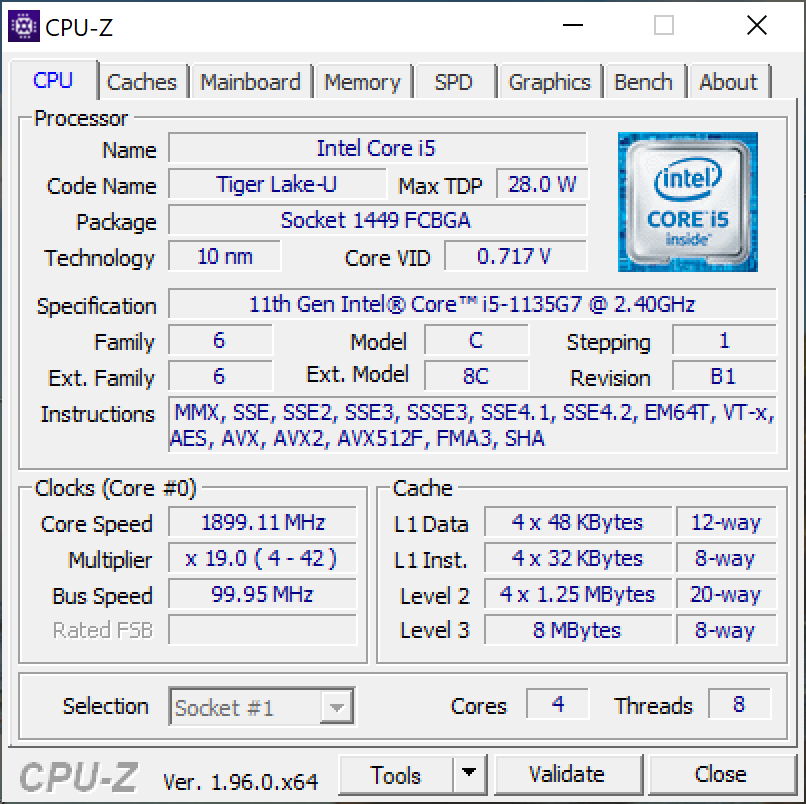
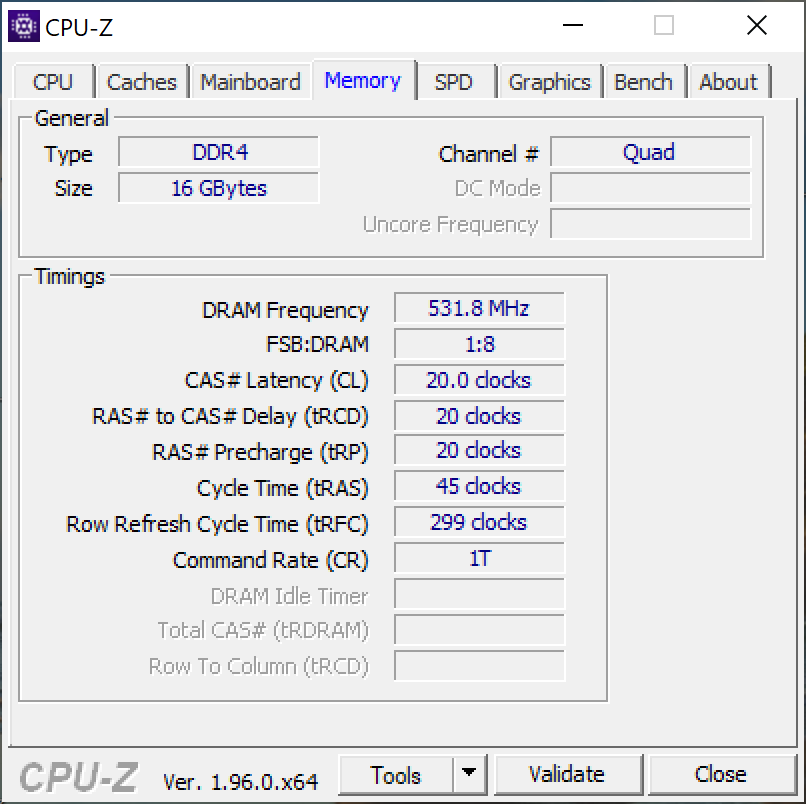
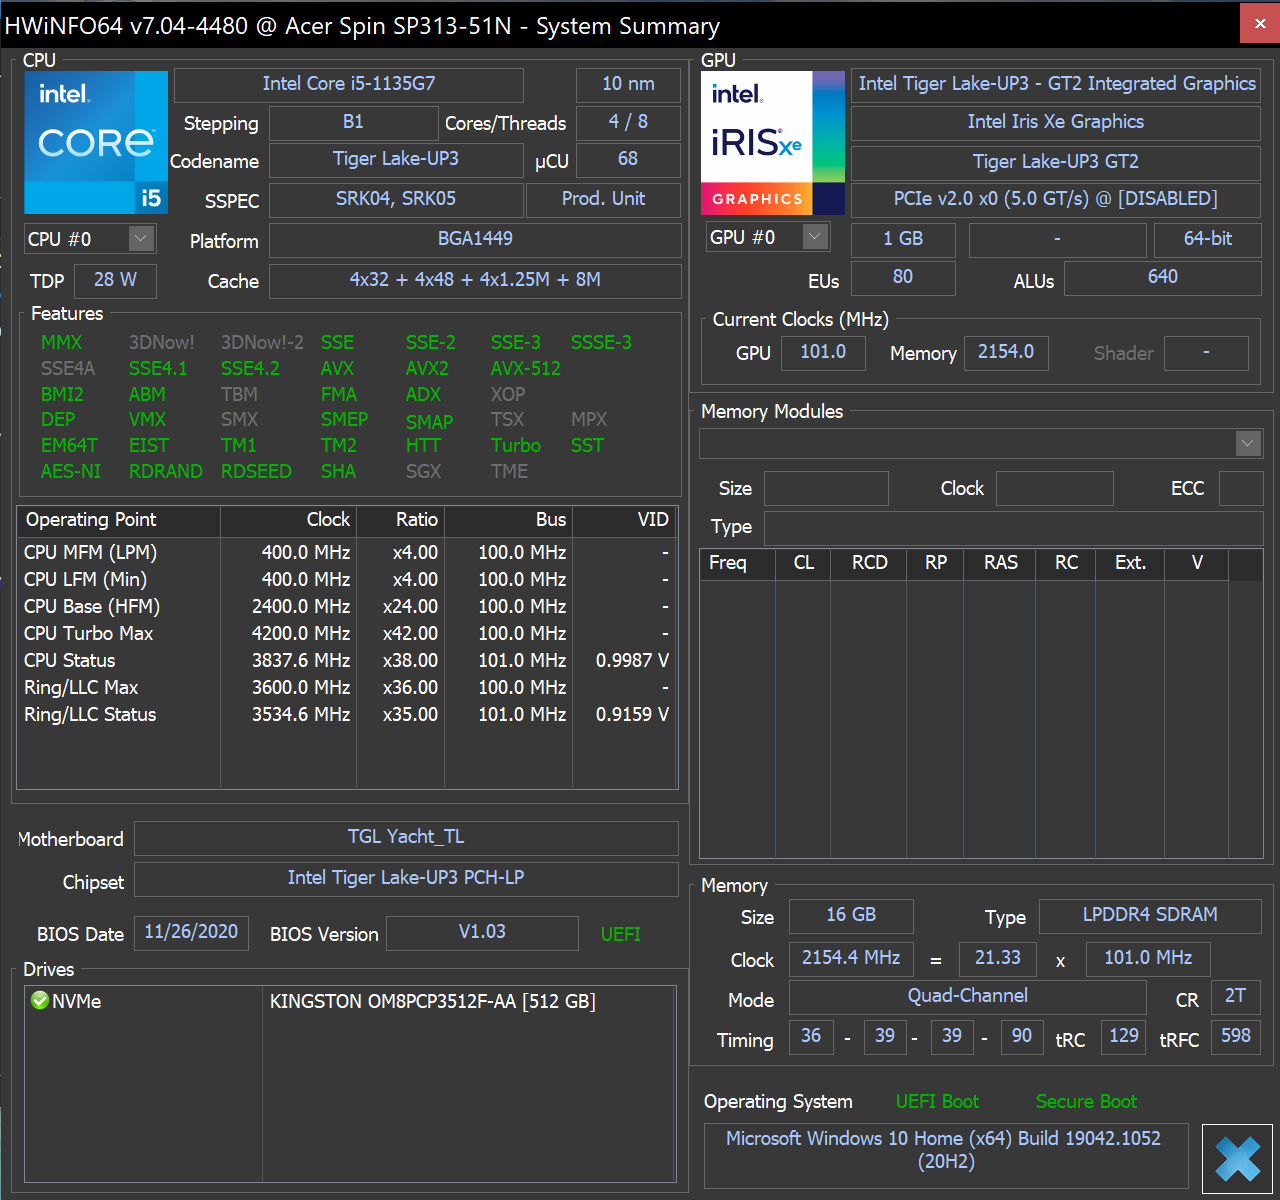
The Acer Spin 3 SP313-51N-56YV is not only available with the Intel Core i5 1135G7 and 512 GB of memory, but also as the SP313-51N-740X version with the Intel Core i7 1165G7(Intel Iris Xe G7 iGPU with 96 EUs) and 1 TB memory. Both devices are equipped with the Intel Iris Xe G7 iGPU, which only differ in the execution units, and are suitable for all common office applications. The working memory is soldered, but with 16 GB RAM you have enough reserves for the next few years anyway.
Processor
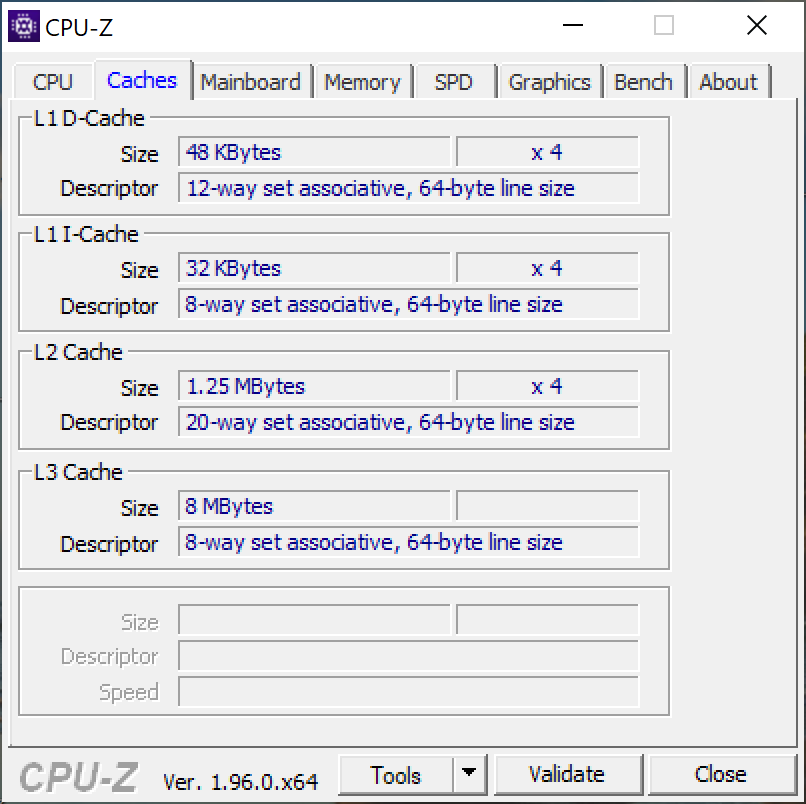
The Intel Core i5 1135G7 installed in the test device is a quad-core processor from Intel's current Tiger Lake generation with a base clock of 2.4 GHz and a Turbo clock of up to 4.2 GHz. The performance is mostly above average. However, the benchmark starts with a relatively high score in the Cinebench R15 loop, but the processor permanently clocks over 17% lower after a short time. This problem is nothing new and is partly due to the weak cooling of the device.
We could use the processor's full performance in battery mode.
Cinebench R20: CPU (Single Core) | CPU (Multi Core)
Cinebench R15: CPU Single 64Bit | CPU Multi 64Bit
Blender: v2.79 BMW27 CPU
7-Zip 18.03: 7z b 4 -mmt1 | 7z b 4
Geekbench 5.5: Single-Core | Multi-Core
HWBOT x265 Benchmark v2.2: 4k Preset
LibreOffice : 20 Documents To PDF
R Benchmark 2.5: Overall mean
| Cinebench R23 / Single Core | |
| Average of class Convertible (740 - 2188, n=48, last 2 years) | |
| Lenovo ThinkPad L13 Gen2-20VH0017GE | |
| Acer Spin 3 SP313-51N-56YV | |
| Lenovo ThinkPad L13 Yoga Gen2-20VK000VGE | |
| Average Intel Core i5-1135G7 (1062 - 1373, n=53) | |
| Dell XPS 13 9305 Core i5 FHD | |
| Cinebench R23 / Multi Core | |
| Average of class Convertible (1317 - 30959, n=48, last 2 years) | |
| Dell XPS 13 9305 Core i5 FHD | |
| Acer Spin 3 SP313-51N-56YV | |
| Average Intel Core i5-1135G7 (2786 - 6136, n=55) | |
| Lenovo ThinkPad L13 Yoga Gen2-20VK000VGE | |
| Lenovo ThinkPad L13 Gen2-20VH0017GE | |
| Cinebench R20 / CPU (Single Core) | |
| Average of class Convertible (273 - 834, n=48, last 2 years) | |
| Lenovo ThinkPad L13 Gen2-20VH0017GE | |
| Lenovo ThinkPad L13 Gen2-20VH0017GE | |
| Lenovo ThinkPad L13 Yoga Gen2-20VK000VGE | |
| Acer Spin 3 SP313-51N-56YV | |
| Average Intel Core i5-1135G7 (375 - 527, n=62) | |
| Dell XPS 13 9305 Core i5 FHD | |
| Cinebench R20 / CPU (Multi Core) | |
| Average of class Convertible (595 - 12102, n=48, last 2 years) | |
| Dell XPS 13 9305 Core i5 FHD | |
| Acer Spin 3 SP313-51N-56YV | |
| Average Intel Core i5-1135G7 (979 - 2382, n=62) | |
| Lenovo ThinkPad L13 Yoga Gen2-20VK000VGE | |
| Lenovo ThinkPad L13 Gen2-20VH0017GE | |
| Lenovo ThinkPad L13 Gen2-20VH0017GE | |
| Cinebench R15 / CPU Single 64Bit | |
| Average of class Convertible (149.8 - 317, n=47, last 2 years) | |
| Acer Spin 3 SP313-51N-56YV | |
| Lenovo ThinkPad L13 Gen2-20VH0017GE | |
| Lenovo ThinkPad L13 Gen2-20VH0017GE | |
| Lenovo ThinkPad L13 Yoga Gen2-20VK000VGE | |
| Average Intel Core i5-1135G7 (141.4 - 205, n=61) | |
| Cinebench R15 / CPU Multi 64Bit | |
| Average of class Convertible (478 - 4940, n=47, last 2 years) | |
| Acer Spin 3 SP313-51N-56YV | |
| Average Intel Core i5-1135G7 (431 - 941, n=65) | |
| Lenovo ThinkPad L13 Yoga Gen2-20VK000VGE | |
| Dell XPS 13 9305 Core i5 FHD | |
| Lenovo ThinkPad L13 Gen2-20VH0017GE | |
| Lenovo ThinkPad L13 Gen2-20VH0017GE | |
| Blender / v2.79 BMW27 CPU | |
| Lenovo ThinkPad L13 Gen2-20VH0017GE | |
| Lenovo ThinkPad L13 Gen2-20VH0017GE | |
| Lenovo ThinkPad L13 Yoga Gen2-20VK000VGE | |
| Acer Spin 3 SP313-51N-56YV | |
| Average Intel Core i5-1135G7 (499 - 1044, n=60) | |
| Dell XPS 13 9305 Core i5 FHD | |
| Average of class Convertible (105 - 1051, n=47, last 2 years) | |
| 7-Zip 18.03 / 7z b 4 -mmt1 | |
| Average of class Convertible (3672 - 6655, n=47, last 2 years) | |
| Lenovo ThinkPad L13 Gen2-20VH0017GE | |
| Lenovo ThinkPad L13 Gen2-20VH0017GE | |
| Lenovo ThinkPad L13 Yoga Gen2-20VK000VGE | |
| Acer Spin 3 SP313-51N-56YV | |
| Average Intel Core i5-1135G7 (3924 - 4921, n=62) | |
| Dell XPS 13 9305 Core i5 FHD | |
| 7-Zip 18.03 / 7z b 4 | |
| Average of class Convertible (12977 - 121368, n=47, last 2 years) | |
| Dell XPS 13 9305 Core i5 FHD | |
| Average Intel Core i5-1135G7 (14745 - 24873, n=62) | |
| Acer Spin 3 SP313-51N-56YV | |
| Lenovo ThinkPad L13 Gen2-20VH0017GE | |
| Lenovo ThinkPad L13 Gen2-20VH0017GE | |
| Lenovo ThinkPad L13 Yoga Gen2-20VK000VGE | |
| Geekbench 5.5 / Single-Core | |
| Average of class Convertible (806 - 2275, n=48, last 2 years) | |
| Lenovo ThinkPad L13 Yoga Gen2-20VK000VGE | |
| Acer Spin 3 SP313-51N-56YV | |
| Average Intel Core i5-1135G7 (1147 - 1428, n=58) | |
| Lenovo ThinkPad L13 Gen2-20VH0017GE | |
| Lenovo ThinkPad L13 Gen2-20VH0017GE | |
| Dell XPS 13 9305 Core i5 FHD | |
| Geekbench 5.5 / Multi-Core | |
| Average of class Convertible (1608 - 22023, n=48, last 2 years) | |
| Acer Spin 3 SP313-51N-56YV | |
| Dell XPS 13 9305 Core i5 FHD | |
| Average Intel Core i5-1135G7 (3475 - 5472, n=58) | |
| Lenovo ThinkPad L13 Gen2-20VH0017GE | |
| Lenovo ThinkPad L13 Gen2-20VH0017GE | |
| Lenovo ThinkPad L13 Yoga Gen2-20VK000VGE | |
| HWBOT x265 Benchmark v2.2 / 4k Preset | |
| Average of class Convertible (3.43 - 36.2, n=47, last 2 years) | |
| Average Intel Core i5-1135G7 (3.57 - 7.6, n=57) | |
| Acer Spin 3 SP313-51N-56YV | |
| Lenovo ThinkPad L13 Yoga Gen2-20VK000VGE | |
| Lenovo ThinkPad L13 Gen2-20VH0017GE | |
| Lenovo ThinkPad L13 Gen2-20VH0017GE | |
| LibreOffice / 20 Documents To PDF | |
| Dell XPS 13 9305 Core i5 FHD | |
| Lenovo ThinkPad L13 Yoga Gen2-20VK000VGE | |
| Average of class Convertible (42.5 - 84.3, n=47, last 2 years) | |
| Average Intel Core i5-1135G7 (44.2 - 62.9, n=60) | |
| Lenovo ThinkPad L13 Gen2-20VH0017GE | |
| Lenovo ThinkPad L13 Gen2-20VH0017GE | |
| Acer Spin 3 SP313-51N-56YV | |
| R Benchmark 2.5 / Overall mean | |
| Dell XPS 13 9305 Core i5 FHD | |
| Acer Spin 3 SP313-51N-56YV | |
| Average Intel Core i5-1135G7 (0.619 - 0.727, n=59) | |
| Lenovo ThinkPad L13 Yoga Gen2-20VK000VGE | |
| Lenovo ThinkPad L13 Gen2-20VH0017GE | |
| Lenovo ThinkPad L13 Gen2-20VH0017GE | |
| Average of class Convertible (0.3915 - 0.84, n=47, last 2 years) | |
* ... smaller is better
System performance
The system performance is on an average level and is thus on par with the competition. In practice, all tasks in everyday use were completed almost without delays and there were no problems.
Whether the performance of other notebooks can keep up here can be seen in our CPU benchmark list.
| PCMark 10 Score | 4676 points | |
Help | ||
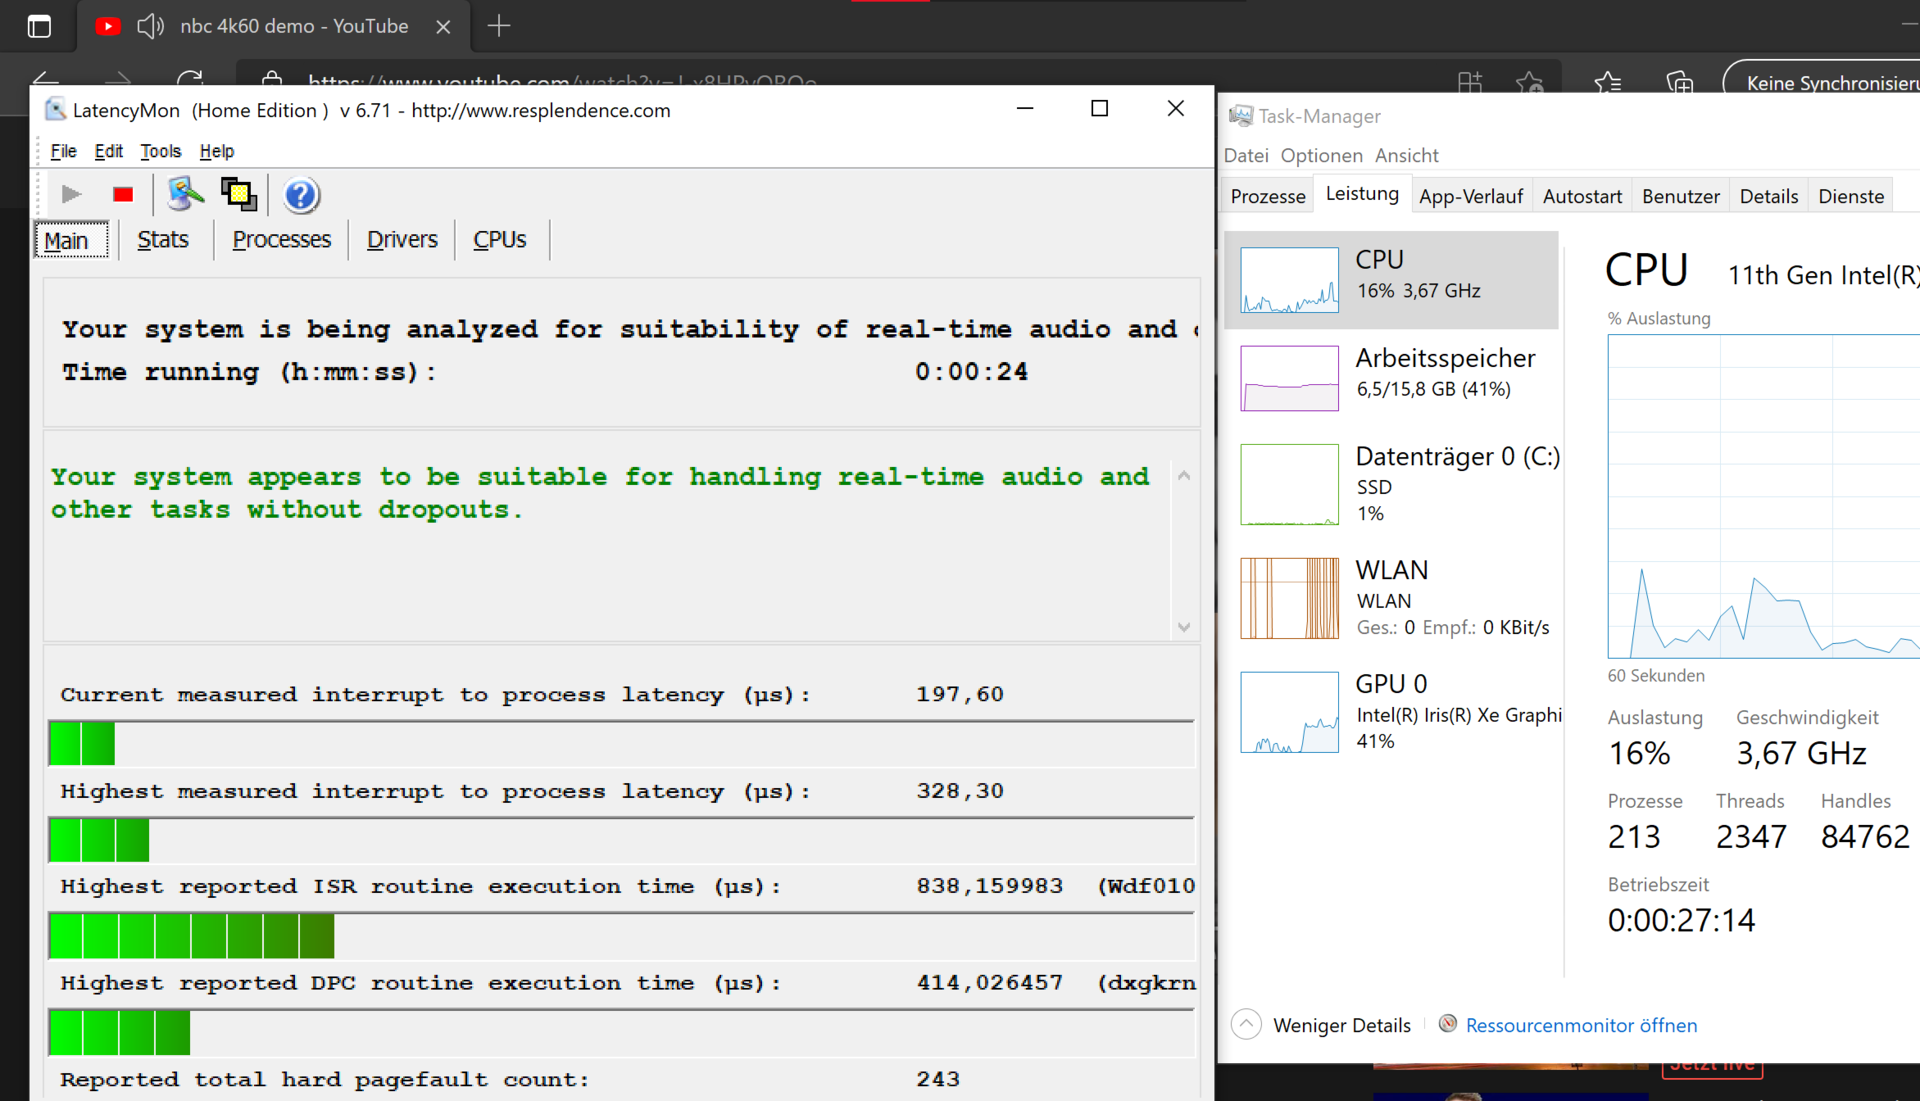
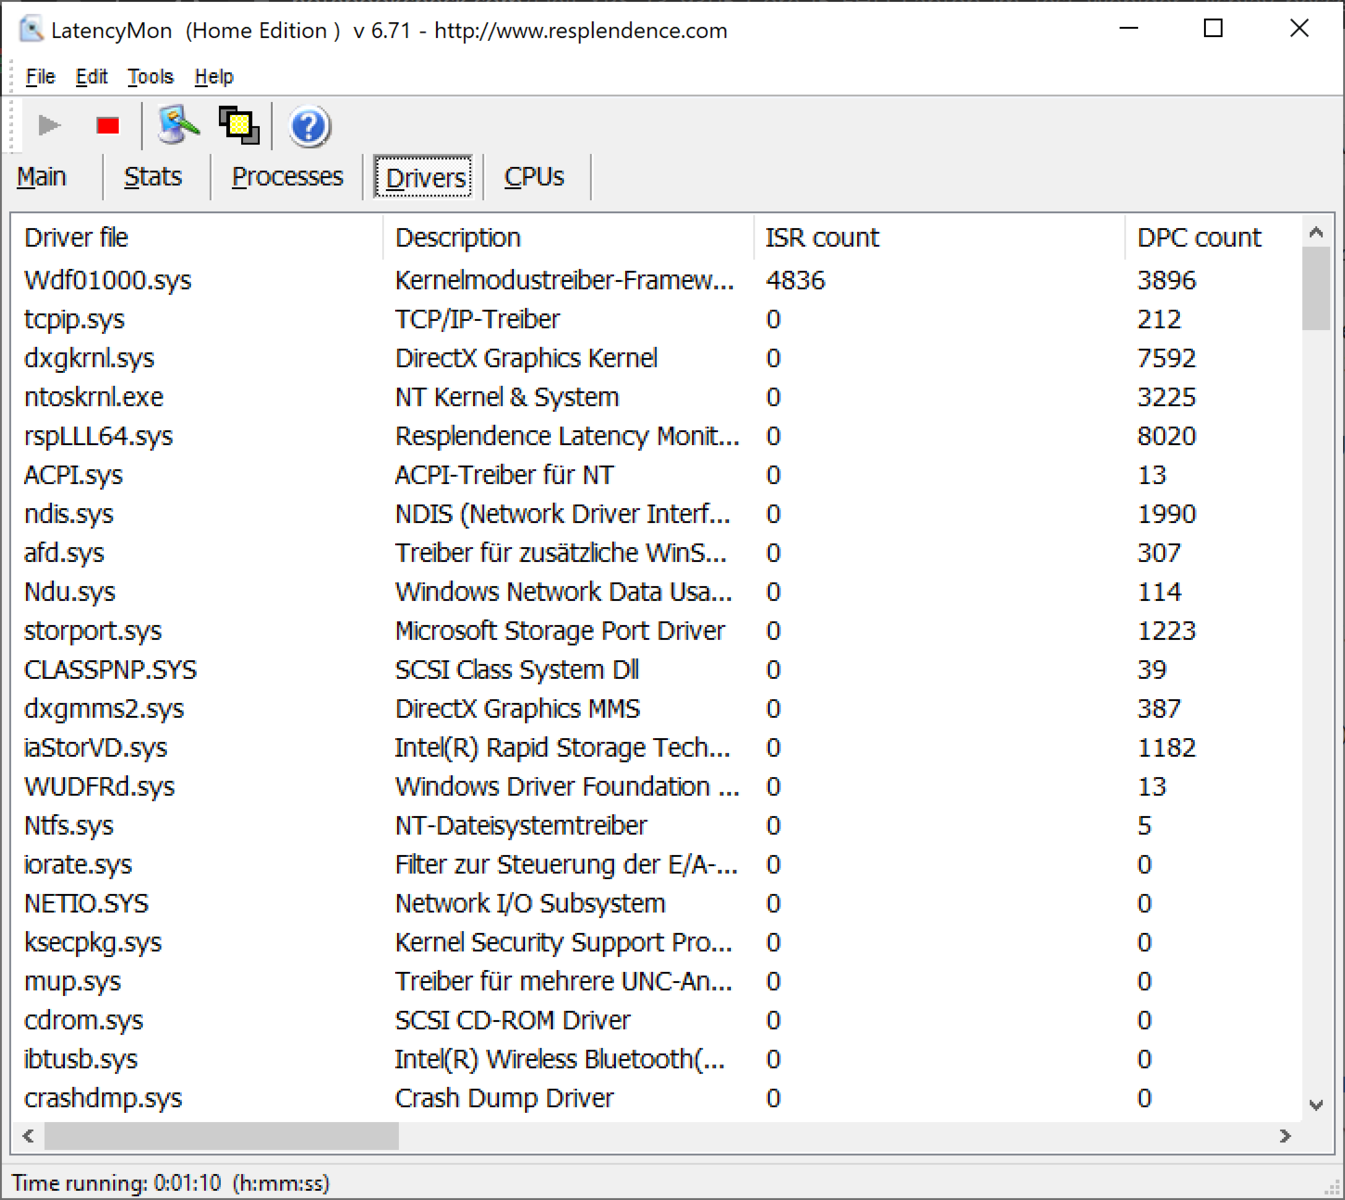
DPC latencies
We could determine low interruption rates with our Acer convertible in the LatencyMon DPC test.
| DPC Latencies / LatencyMon - interrupt to process latency (max), Web, Youtube, Prime95 | |
| Lenovo ThinkPad L13 Gen2-20VH0017GE | |
| Acer Spin 3 SP313-51N-56YV | |
| Lenovo ThinkBook 13s-ITL-20V90003GE | |
| Lenovo ThinkPad L13 Yoga Gen2-20VK000VGE | |
| Dell XPS 13 9305 Core i5 FHD | |
* ... smaller is better
Mass storage
The system drive in our review unit is a 512 GB SSD from Kingston, which is connected via the M.2 PCIe Gen. 3 interface with the NVMe protocol 1.3. The performance of the NVMe SSD is about 10-35 percent below the competition. There are enough performance reserves for all common office applications.
More benchmarks of this and other SSDs are available in our technology section.
| Acer Spin 3 SP313-51N-56YV Kingston OM8PCP3512F-AB | Dell XPS 13 9305 Core i5 FHD Samsung PM9A1 MZVL2512HCJQ | Lenovo ThinkPad L13 Yoga Gen2-20VK000VGE WDC PC SN730 SDBPNTY-256G | Lenovo ThinkPad L13 Gen2-20VH0017GE Samsung SSD PM981a MZVLB512HBJQ | Average Kingston OM8PCP3512F-AB | |
|---|---|---|---|---|---|
| CrystalDiskMark 5.2 / 6 | 14% | 31% | 36% | -5% | |
| Write 4K (MB/s) | 286.1 | 136.9 -52% | 119.7 -58% | 131.2 -54% | 194.5 ? -32% |
| Read 4K (MB/s) | 48.89 | 47.34 -3% | 38.54 -21% | 35.92 -27% | 47.3 ? -3% |
| Write Seq (MB/s) | 982 | 1150 17% | 1754 79% | 978 ? 0% | |
| Read Seq (MB/s) | 1301 | 2052 58% | 1709 31% | 1299 ? 0% | |
| Write 4K Q32T1 (MB/s) | 625 | 433 -31% | 461.9 -26% | 417.7 -33% | 505 ? -19% |
| Read 4K Q32T1 (MB/s) | 301 | 293 -3% | 390.5 30% | 352 17% | 301 ? 0% |
| Write Seq Q32T1 (MB/s) | 981 | 1148 17% | 2185 123% | 2926 198% | 978 ? 0% |
| Read Seq Q32T1 (MB/s) | 1631 | 3427 110% | 3118 91% | 3533 117% | 1930 ? 18% |
| Write 4K Q8T8 (MB/s) | 383.7 | 981 ? | |||
| Read 4K Q8T8 (MB/s) | 981 | 301 ? | |||
| AS SSD | 89% | 72% | 69% | 13% | |
| Seq Read (MB/s) | 1748 | 2629 50% | 2387 37% | 2651 52% 2648 51% | 1570 ? -10% |
| Seq Write (MB/s) | 941 | 1270 35% | 2000 113% | 1417 51% 1417 51% | 904 ? -4% |
| 4K Read (MB/s) | 44.06 | 65.2 48% | 41.18 -7% | 54.3 23% 44.39 1% | 48.2 ? 9% |
| 4K Write (MB/s) | 77.7 | 182.5 135% | 169.6 118% | 178.9 130% 111.4 43% | 118.9 ? 53% |
| 4K-64 Read (MB/s) | 451.1 | 1032 129% | 681 51% | 1009 124% 615 36% | 415 ? -8% |
| 4K-64 Write (MB/s) | 926 | 1257 36% | 571 -38% | 1651 78% 1536 66% | 829 ? -10% |
| Access Time Read * (ms) | 0.188 | 0.07 63% | 0.051 73% | 0.063 66% 0.059 69% | 0.1294 ? 31% |
| Access Time Write * (ms) | 0.043 | 0.023 47% | 0.025 42% | 0.034 21% 0.02 53% | 0.0371 ? 14% |
| Score Read (Points) | 670 | 1360 103% | 961 43% | 1328 98% 925 38% | 619 ? -8% |
| Score Write (Points) | 1098 | 1567 43% | 941 -14% | 1904 73% 1857 69% | 1036 ? -6% |
| Score Total (Points) | 2084 | 3573 71% | 2384 14% | 3815 83% 3252 56% | 1955 ? -6% |
| Copy ISO MB/s (MB/s) | 969 | 1430 48% | 1855 91% | 2188 126% | 977 ? 1% |
| Copy Program MB/s (MB/s) | 609 | 782 28% | 565 -7% | 547 -10% | 373 ? -39% |
| Copy Game MB/s (MB/s) | 232.4 | 1177 406% | 1360 485% | 900 287% | 610 ? 162% |
| Total Average (Program / Settings) | 52% /
62% | 52% /
57% | 53% /
63% | 4% /
7% |
* ... smaller is better

Continuous load read: DiskSpd Read Loop, Queue Depth 8
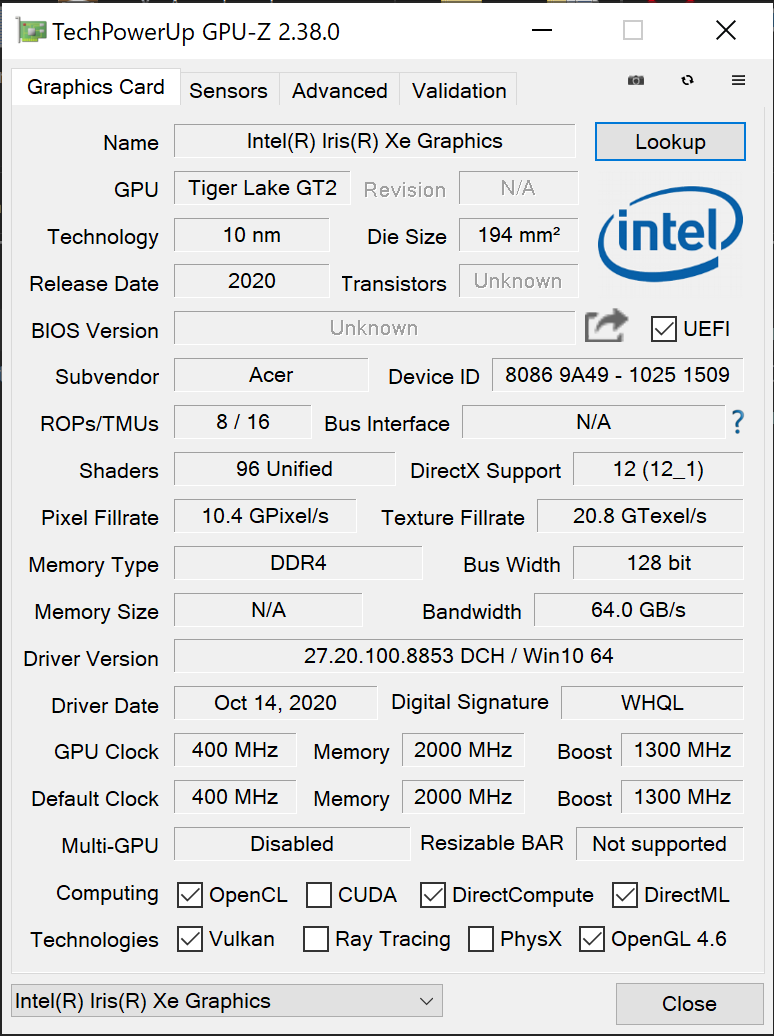
Graphics card
Acer relies on the internal Intel Iris Xe G7 iGPU with 80 EUs for the graphics solution. How strong this is depends on the installed working memory and the cooling solution. Acer has done a good job here because the Spin 3 manages to stand out from the competition in all benchmarks despite only one heat pipe that is cooled by a fan. This is probably also due to the fast LPDDR4X RAM in quad-channel mode. Nevertheless, the Acer Spin 3 is not a gaming notebook. Playing current AAA titles is not possible or only possible to a very limited extent. If you still want to play games on the device, you can connect an external display and an eGPU via the two Thunderbolt 4 ports. You should ask yourself whether this solution makes sense and consider that the full performance of the built-in graphics card cannot be accessed. In theory, Thunderbolt 4 is not the bottleneck here, but the installed processor and its cooling performance.
You can compare the performance of other graphics cards tested by us in our GPU benchmark list.
| 3DMark 06 Standard Score | 23181 points | |
| 3DMark 11 Performance | 6313 points | |
| 3DMark Cloud Gate Standard Score | 19218 points | |
| 3DMark Fire Strike Score | 4352 points | |
Help | ||
Gaming performance
The 3DMark results are impressive and are above the comparison devices. The performance in synthetic benchmarks is about 10% higher (Fire Strike) than the dedicated NVIDIA MX450. Unfortunately, the performance cannot be transferred to the practical field, where dedicated GPUs still perform better.
| GTA V | |
| 1024x768 Lowest Settings possible | |
| Average of class Convertible (50.6 - 172, n=38, last 2 years) | |
| Average Intel Iris Xe Graphics G7 80EUs (36.5 - 144.6, n=84) | |
| Dell XPS 13 9305 Core i5 FHD | |
| Acer Spin 3 SP313-51N-56YV | |
| 1366x768 Normal/Off AF:4x | |
| Average of class Convertible (46.6 - 161.6, n=31, last 2 years) | |
| Dell XPS 13 9305 Core i5 FHD | |
| Acer Spin 3 SP313-51N-56YV | |
| Average Intel Iris Xe Graphics G7 80EUs (28.9 - 133.8, n=87) | |
| 1920x1080 High/On (Advanced Graphics Off) AA:2xMSAA + FX AF:8x | |
| Average of class Convertible (6.88 - 166.9, n=40, last 2 years) | |
| Dell XPS 13 9305 Core i5 FHD | |
| Acer Spin 3 SP313-51N-56YV | |
| Average Intel Iris Xe Graphics G7 80EUs (7.81 - 32, n=86) | |
| 1920x1080 Highest AA:4xMSAA + FX AF:16x | |
| Average of class Convertible (7.14 - 90.6, n=40, last 2 years) | |
| Dell XPS 13 9305 Core i5 FHD | |
| Average Intel Iris Xe Graphics G7 80EUs (3.07 - 11.6, n=74) | |
| Acer Spin 3 SP313-51N-56YV | |
| low | med. | high | ultra | |
|---|---|---|---|---|
| GTA V (2015) | 78 | 72 | 20 | 6 |
| The Witcher 3 (2015) | 79 | 51 | 25 | 12 |
| Dota 2 Reborn (2015) | 82.8 | 61.7 | 43.5 | 38.8 |
| Final Fantasy XV Benchmark (2018) | 34.8 | 18.2 | 18 | |
| X-Plane 11.11 (2018) | 42.6 | 32.1 | 33 | |
| Strange Brigade (2018) | 73.4 | 29.8 | 26 | |
| F1 2020 (2020) | 59 | 26 |
Emissions - Acer Spin mostly quiet
Noise emissions
The fan characteristic of our test device was mostly quiet and pleasant. Under load, you can clearly hear the single fan, but it is still within tolerance and does not seem obtrusive or high-frequency.
Noise level
| Idle |
| 25.5 / 25.5 / 25.5 dB(A) |
| Load |
| 34.5 / 38.7 dB(A) |
 | ||
30 dB silent 40 dB(A) audible 50 dB(A) loud |
||
min: | ||
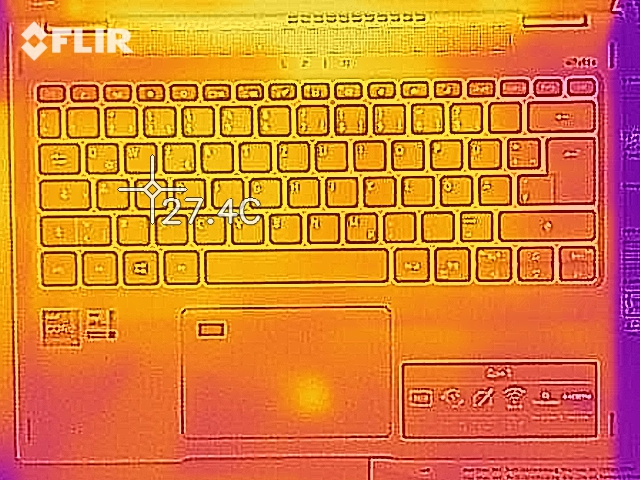
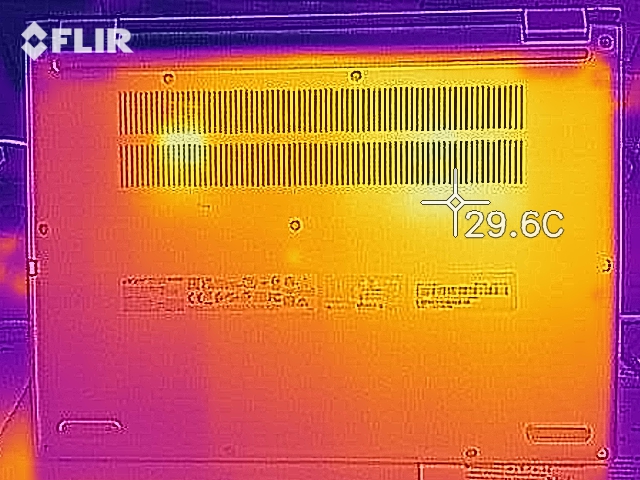
Temperature
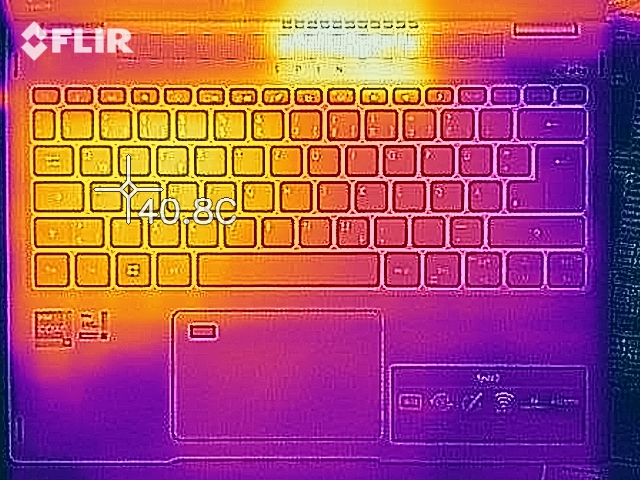
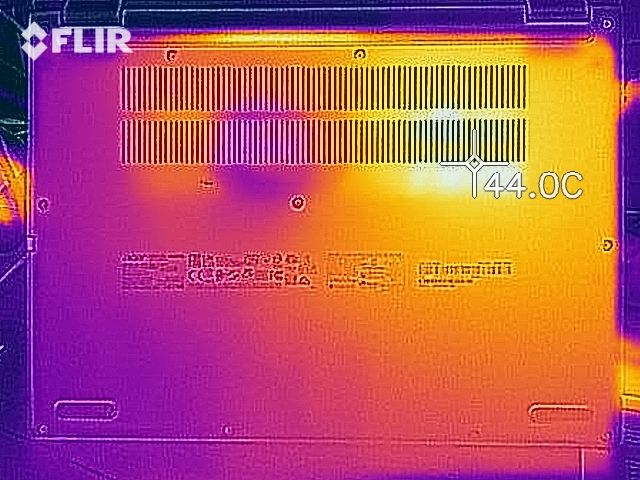
The temperatures of the device and case are cool during everyday use and use on the thighs is not restricted here. Under load, we noticed that our test device warms up the touchscreen noticeably during laptop use. When using the device as a tablet, Acer's chosen cooling solution turns into a positive and the display stays cool.
During our one-hour stress test, the device gets quite hot and the processor starts to throttle heavily. Since you do not have these loads in everyday use, users do not have to expect restrictions in this area.
(+) The maximum temperature on the upper side is 38.3 °C / 101 F, compared to the average of 35.4 °C / 96 F, ranging from 19.6 to 60 °C for the class Convertible.
(±) The bottom heats up to a maximum of 41.9 °C / 107 F, compared to the average of 36.9 °C / 98 F
(+) In idle usage, the average temperature for the upper side is 23.9 °C / 75 F, compared to the device average of 30.3 °C / 87 F.
(+) The palmrests and touchpad are cooler than skin temperature with a maximum of 25.4 °C / 77.7 F and are therefore cool to the touch.
(+) The average temperature of the palmrest area of similar devices was 28 °C / 82.4 F (+2.6 °C / 4.7 F).
Speaker
The speakers are moderately loud at 76 decibels and hardly offer any bass. The mids are again quite balanced. You do not need to expect miracles from Acer here, but the speakers are okay for everyday use.
Acer Spin 3 SP313-51N-56YV audio analysis
(±) | speaker loudness is average but good (76.3 dB)
Bass 100 - 315 Hz
(-) | nearly no bass - on average 30.2% lower than median
(±) | linearity of bass is average (10.3% delta to prev. frequency)
Mids 400 - 2000 Hz
(+) | balanced mids - only 4.1% away from median
(±) | linearity of mids is average (7.8% delta to prev. frequency)
Highs 2 - 16 kHz
(±) | higher highs - on average 7.7% higher than median
(+) | highs are linear (6.9% delta to prev. frequency)
Overall 100 - 16.000 Hz
(-) | overall sound is not linear (31.9% difference to median)
Compared to same class
» 91% of all tested devices in this class were better, 2% similar, 7% worse
» The best had a delta of 6%, average was 20%, worst was 57%
Compared to all devices tested
» 91% of all tested devices were better, 2% similar, 7% worse
» The best had a delta of 4%, average was 23%, worst was 134%
Dell XPS 13 9305 Core i5 FHD audio analysis
(±) | speaker loudness is average but good (77 dB)
Bass 100 - 315 Hz
(-) | nearly no bass - on average 21.4% lower than median
(±) | linearity of bass is average (7.7% delta to prev. frequency)
Mids 400 - 2000 Hz
(+) | balanced mids - only 4.5% away from median
(+) | mids are linear (6.7% delta to prev. frequency)
Highs 2 - 16 kHz
(+) | balanced highs - only 4.3% away from median
(+) | highs are linear (4.8% delta to prev. frequency)
Overall 100 - 16.000 Hz
(±) | linearity of overall sound is average (17.7% difference to median)
Compared to same class
» 49% of all tested devices in this class were better, 7% similar, 44% worse
» The best had a delta of 5%, average was 18%, worst was 53%
Compared to all devices tested
» 35% of all tested devices were better, 8% similar, 57% worse
» The best had a delta of 4%, average was 23%, worst was 134%
Power management - Acer's battery runtime is average
Energy consumption
The power consumption in idle and under load is 6.6 and 32.2 watts average, respectively, and is thus 13 to 28 percent below the consumption of the tested contenders.
| Off / Standby | |
| Idle | |
| Load |
|
Key:
min: | |
| Acer Spin 3 SP313-51N-56YV i5-1135G7, Iris Xe G7 80EUs, Kingston OM8PCP3512F-AB, IPS, 2560x1600, 13.3" | Dell XPS 13 9305 Core i5 FHD i5-1135G7, Iris Xe G7 80EUs, Samsung PM9A1 MZVL2512HCJQ, IPS, 1920x1080, 13.3" | Lenovo ThinkPad L13 Yoga Gen2-20VK000VGE i5-1135G7, Iris Xe G7 80EUs, WDC PC SN730 SDBPNTY-256G, IPS, 1920x1080, 13.3" | Lenovo ThinkPad L13 Gen2-20VH0017GE i5-1135G7, Iris Xe G7 80EUs, Samsung SSD PM981a MZVLB512HBJQ, IPS, 1920x1080, 13.3" | Average Intel Iris Xe Graphics G7 80EUs | Average of class Convertible | |
|---|---|---|---|---|---|---|
| Power Consumption | -13% | -27% | -24% | -28% | -31% | |
| Idle Minimum * (Watt) | 3.5 | 3.2 9% | 4.6 -31% | 4.4 -26% | 4.49 ? -28% | 4.2 ? -20% |
| Idle Average * (Watt) | 6.6 | 6.7 -2% | 7.3 -11% | 7.2 -9% | 7.4 ? -12% | 6.89 ? -4% |
| Idle Maximum * (Watt) | 8.5 | 10.5 -24% | 10.2 -20% | 9.8 -15% | 9.26 ? -9% | 8.63 ? -2% |
| Load Average * (Watt) | 32.2 | 28.5 11% | 32.3 -0% | 31.7 2% | 36.6 ? -14% | 44.1 ? -37% |
| Witcher 3 ultra * (Watt) | 32.5 | 28.5 12% | 35 -8% | 33.3 -2% | ||
| Load Maximum * (Watt) | 34.5 | 64 -86% | 65.3 -89% | 66.6 -93% | 61.7 ? -79% | 66.5 ? -93% |
* ... smaller is better
Cinebench R15 Multi energy consumption on external Monitor
Battery life
With its 48 Wh battery, our test device places itself in the midfield with just over 8 hours in the WiFi test with 150 candela and 6 hours and 22 minutes in maximum brightness. Probably because the weight was already quite high, Express Charge was included as a feature instead of a bigger battery. Thus, the device is fully recharged in 1 hour and 30 minutes.
| Acer Spin 3 SP313-51N-56YV i5-1135G7, Iris Xe G7 80EUs, 48 Wh | Dell XPS 13 9305 Core i5 FHD i5-1135G7, Iris Xe G7 80EUs, 52 Wh | Lenovo ThinkPad L13 Yoga Gen2-20VK000VGE i5-1135G7, Iris Xe G7 80EUs, 46 Wh | Lenovo ThinkPad L13 Gen2-20VH0017GE i5-1135G7, Iris Xe G7 80EUs, 46 Wh | Samsung Galaxy Book Pro 360 13 i5-1135G7, Iris Xe G7 80EUs, 63 Wh | Average of class Convertible | |
|---|---|---|---|---|---|---|
| Battery runtime | 38% | -20% | -21% | 69% | 22% | |
| WiFi v1.3 (h) | 8.1 | 9.2 14% | 6.7 -17% | 6.1 -25% | 12.1 49% | 12 ? 48% |
| Load (h) | 1.8 | 2.9 61% | 1.4 -22% | 1.5 -17% | 3.4 89% | 1.713 ? -5% |
| Reader / Idle (h) | 25.4 | 31.3 | 26.7 ? | |||
| H.264 (h) | 8.8 | 7.6 | 20.1 | 15 ? |
Pros
Cons
Verdict
The Acer Spin 3 SP313 with Intel Core i5 1135G7, 16 GB LPDDR4X RAM, 512 GB PCI Gen. 3 NVMe and a touch display with WQXGA resolution has a lot to offer.
Those looking for a mobile convertible for indoor use with enough performance and a reasonable battery life might have found the right thing here. The touch display is suitable for all everyday applications: Movies look crisp and sharp, and the integrated stylus does a good job with drawing and presentations.
For outdoor use, you might want to look for a device without a reflective display and with a brighter panel. The manufacturer scores with two Thunderbolt ports and Tiger Lake, Fast-Charging and a fingerprint sensor that is placed on the touchpad. We noticed the cooling concept negatively; Acer could have installed several heat pipes or an additional fan instead of just one. Then the display would only heat up a bit. Furthermore, the Spin 3 is not lightweight and has a somewhat cramped-looking keyboard. The case looks elegant and high-quality. On the other hand, Acer could have made the hinges more stable.
Acer has taken the "Spin" to heart and created a solid convertible here that can be transformed from laptop to tablet in no time.
Considering what is offered for the current price of 899 Euros, you can definitely accept a few shortcomings in our opinion.
Price and availability
The Acer Spin 3 SP313-51N we tested with the Intel Core i5 1135G7 and 512 GB memory as well as 16 GB LPDDR4X RAM is available at Cyberportfor 899 Euros (~$1072). The stronger Acer Spin 3 SP313-51N with the Intel Core i7 1165G7 as well as Intel Iris Xe G7 iGPU with 96 EUs and 1 TB memory is available directly from Acer in the store for 1,199 Euros (~$1430).
Acer Spin 3 SP313-51N-56YV
- 06/27/2021 v7 (old)
Patrick Schüdzig
Price comparison
