Reviews for the Intel Core i7-1165G7 processor
Lenovo V17 G2 review: 17-inch laptop with unrewarding MX350
With its 17-inch display, Nvidia graphics, and Intel's Core i7 CPU, Lenovo's V17 G2 is well suited for office and multimedia tasks, including simple gaming. Our review shows whether the additional premium for the top equipment is worthwhile for the otherwise affordable laptop.
Intel Core i7-1165G7, NVIDIA GeForce MX350, 17.3", 2.2 kgPrimeBook Circular review: Modular 14-inch NUC-based laptop
Prime Computer offers an interesting business notebook in the form of the PrimeBook Circular, which employs a modular design with the goal of high sustainability. In this detailed review, find out how well the in-house model based on Intel's NUC Compute Element performs under testing.
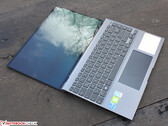
Intel Core i7-1165G7, Iris Xe G7 96EUs, 13.9", 1.6 kgAsus ZenBook 14X OLED Review: Games & Strong 3K Colors
Asus has gone the extra mile: The 14-incher combines the easily adjustable graphics performance of an MX450 with a scalable Tiger Lake Core i7. On top of that, it has a colorful 3K widescreen OLED. Does this leave anything to be desired?
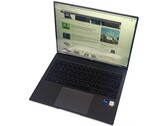
Intel Core i7-1165G7, NVIDIA GeForce MX450, 14", 1.4 kgHuawei MateBook 14 (2021) review: MacBook Air with touch?
With the MateBook 14 2021, Huawei offers a very high-quality mid-range ultrabook with a touchscreen in the 3:2 format. Our test shows how it fares against its competitors including the MacBook Air M1 and whether an AMD or Intel processor inside the case can do a better job.
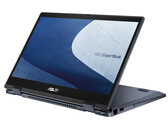
Intel Core i7-1165G7, Iris Xe G7 96EUs, 14", 1.5 kgAsus ExpertBook B3 Flip in review: 2-in-1 laptop with digital stylus and LTE modem
The ExpertBook B3, which offers an LTE modem and two Thunderbolt 4 ports in a 14-inch form factor, also features an FHD IPS display. The touchscreen can be used with the included input pen. The latter can be stowed away in the base unit.
Intel Core i7-1165G7, Iris Xe G7 96EUs, 14", 1.6 kgLG Gram 15Z90P-G.AA89G: Intel Iris Xe Graphics G7 96EUs, 15.60", 1.1 kg
Review » Review of the LG Gram 15Z90P: 1.1-kg (~2.4-lb) 15-inch laptop
Samsung Galaxy Book Pro 15 NP950XDB-KC5US: Intel Iris Xe Graphics G7 96EUs, 15.60", 1.1 kg
Review » Samsung Galaxy Book Pro 15 NP950XDB laptop review: Insanely lightweight
Acer Swift 3X SF314-510G-70DW: Intel Iris Xe MAX Graphics, 14.00", 1.4 kg
Review » Acer Swift 3X laptop in review: Intel Iris Xe MAX combines high battery life and gaming performance
Dell Inspiron 14 5410-D3D7T: Intel Iris Xe Graphics G7 96EUs, 14.00", 1.5 kg
Review » Dell Inspiron 14 5410 2-in-1 laptop in review: The modular convertible offers affordable performance
Acer Enduro Urban N3 EUN314: Intel Iris Xe Graphics G7 96EUs, 14.00", 1.8 kg
Review » Acer Enduro Urban N3 EUN314 laptop review: Part rugged, part Ultrabook
Dell Inspiron 13 7306-6TYH5: Intel Iris Xe Graphics G7 96EUs, 13.30", 1.4 kg
Review » Dell Inspiron 13 7306 Laptop review: Compact convertible for drawing and creative tasks
Asus Vivobook 15 K513EQ: NVIDIA GeForce MX350, 15.60", 1.6 kg
Review » Asus Vivobook 15 K513EQ OLED laptop review: The Lenovo IdeaPad alternative
Dynabook Portégé X30W-J-10K: Intel Iris Xe Graphics G7 96EUs, 13.30", 1 kg
Review » Dynabook Portégé X30W-J-10K laptop in review - A lightweight with port diversity
Asus Zenbook 14X UX5400E: NVIDIA GeForce MX450, 14.00", 1.4 kg
Review » Asus Zenbook 14X OLED pre-production unit review: That's some punchy colors!
Dell Inspiron 15 3501: Intel Iris Xe Graphics G7 96EUs, 15.60", 2 kg
Review » Dell Inspiron 15 3501 laptop in review: Quiet office laptop
Dell XPS 13 9310 2-in-1: Intel Iris Xe Graphics G7 96EUs, 13.40", 1.3 kg
Review » Dell XPS 13 9310 2-in-1 Review: Better than the XPS 13 7390 2-in-1 in one specific way
Razer Blade Stealth 13 2021 OLED: NVIDIA GeForce GTX 1650 Ti Max-Q, 13.30", 1.5 kg
Review » Razer Blade Stealth 13 2021 in review: Mobile gamer with OLED panel
Acer TravelMate P614P-52: Intel Iris Xe Graphics G7 96EUs, 14.00", 1 kg
Review » Acer TravelMate P6 (2021) Review: Welcome improvements to an already capable business laptop but not without caveats
Asus Chromebook Flip CX5 CX5500FEA: Intel Iris Xe Graphics G7 96EUs, 15.60", 2 kg
Review » Asus Chromebook Flip CX5 in review: 1,200 Euros for a Chromebook?
HP EliteBook 830 G8-i7-1165G7: Intel Iris Xe Graphics G7 96EUs, 13.30", 1.3 kg
Review » HP EliteBook 830 G8 business laptop in review: The 1,000-nit SureView panel remains problematic
HP EliteBook 850 G8 3C7Z8EA: Intel Iris Xe Graphics G7 96EUs, 15.60", 1.8 kg
Review » HP EliteBook 850 G8 Review - Business laptop with a super bright screen and lots of extras
MSI Modern 14 B11SB-085: NVIDIA GeForce MX450, 14.00", 1.3 kg
Review » MSI Modern 14 B11SB review: 14-inch allrounder suffers from heat development
Framework Laptop 13.5: Intel Iris Xe Graphics G7 96EUs, 13.50", 1.3 kg
Review » Framework Laptop 13.5 Review: If Microsoft Made A Repairable Surface Laptop, This Would Be It
ADATA XPG Xenia 14: Intel Iris Xe Graphics G7 96EUs, 14.00", 1 kg
Review » ADATA XPG Xenia 14 Laptop Review: A New 14-inch Favorite
Asus ZenBook Flip 13 UX363EA-HP069T: Intel Iris Xe Graphics G7 96EUs, 13.30", 1.2 kg
Review » Asus ZenBook Flip 13 in review: Compact convertible with great OLED display
Lenovo ThinkPad X13 G2 20WK0024GE: Intel Iris Xe Graphics G7 96EUs, 13.30", 1.3 kg
Review » Lenovo ThinkPad X13 G2 Review: The perfect mobile companion?
Lenovo ThinkPad T14s G2 20WM003TGE: Intel Iris Xe Graphics G7 96EUs, 14.00", 1.3 kg
Review » Lenovo ThinkPad T14s G2 Intel review: A very good business laptop despite the 16:9 format
MSI Modern 15 A11M-062: Intel Iris Xe Graphics G7 96EUs, 15.60", 1.6 kg
Review » MSI Modern 15 A11M in review: Slim office laptop offers strong keyboard backlighting
HP Pavilion 15-eg: NVIDIA GeForce MX450, 15.60", 1.7 kg
Review » HP Pavilion 15 (2021) Laptop Review: 11th Gen Intel and GeForce MX450 Combo
Schenker Vision 14: Intel Iris Xe Graphics G7 96EUs, 14.00", 1 kg
Review » Schenker Vision 14 Laptop Review - Perfect Ultrabook with 1 kg and 16:10 display?
Lenovo ThinkPad P15s Gen2-20W6000GGE: NVIDIA T500 Laptop GPU, 15.60", 1.9 kg
Review » Lenovo ThinkPad P15s Gen 2 laptop review: Ultrabook workstation now with Nvidia T500
Lenovo ThinkPad X13 Yoga G2: Intel Iris Xe Graphics G7 96EUs, 13.30", 1.2 kg
Review » ThinkPad X13 Yoga G2 laptop review: Lenovo business convertible stands out with WQXGA 16:10 LCD
LG Gram 16 (2021): Intel Iris Xe Graphics G7 96EUs, 16.00", 1.2 kg
Review » LG Gram 16 (2021) in review: 1,200 grams, excellent battery life, 16:10 display
HP Spectre x360 14-ea0378ng: Intel Iris Xe Graphics G7 96EUs, 13.50", 1.3 kg
Review » HP Spectre x360 14 Review: High-resolution OLED display, poor battery life
LG Gram 14Z90P-G.AA79G: Intel Iris Xe Graphics G7 96EUs, 14.00", 1 kg
Review » LG Gram 14Z90P in review: Superior endurance and finally more performance
HP Envy 13-ba1475ng: NVIDIA GeForce MX450, 13.30", 1.3 kg
Review » HP Envy 13 with Intel Tiger Lake and GeForce MX450 in review
Honor Magicbook 14 i7-1165G7: Intel Iris Xe Graphics G7 96EUs, 14.00", 1.4 kg
Review » Honor MagicBook 14 laptop review: i7 Tiger Lake at the same level as the Ryzen model
Asus ZenBook 13 UX325EA: Intel Iris Xe Graphics G7 96EUs, 13.30", 1.2 kg
Review » Asus ZenBook 13 laptop review: Core i7-1165G7 versus Ryzen 7 5800U. Which one is the better ZenBook?
MSI Summit B15 A11M: Intel Iris Xe Graphics G7 96EUs, 15.60", 1.5 kg
Review » MSI Summit B15 A11M Laptop Review: Embracing Iris Xe Over GeForce MX
ADATA XPG Xenia Xe: Intel Iris Xe Graphics G7 96EUs, 15.60", 1.7 kg
Review » ADATA XPG Xenia Xe Review: The Tiger Lake Laptop Designed By Intel
Lenovo ThinkPad X1 Carbon G9-20XXS00100: Intel Iris Xe Graphics G7 96EUs, 14.00", 1.2 kg
Review » Lenovo ThinkPad X1 Carbon Gen 9 Review: Longer battery runtime with the Full-HD panel
Lenovo ThinkPad X1 Carbon G9-20XWCTO1WW: Intel Iris Xe Graphics G7 96EUs, 14.00", 1.2 kg
Review » Lenovo ThinkPad X1 Carbon Gen 9 Laptop Review: Big 16:10 upgrade with Intel Tiger Lake
HP ProBook 440 G8-2W1G4EA: Intel Iris Xe Graphics G7 96EUs, 14.00", 1.4 kg
Review » HP ProBook 440 G8 review: Robust office laptop with a Tiger Lake CPU
Lenovo ThinkPad T14 Gen2-20W1S00000: NVIDIA GeForce MX450, 14.00", 1.5 kg
Review » Lenovo ThinkPad T14 Gen 2 laptop review: Familiar benefits from Intel Tiger Lake
Lenovo ThinkPad T15 Gen2-20W5S00100: NVIDIA GeForce MX450, 15.60", 1.9 kg
Review » Lenovo ThinkPad T15 Gen2 laptop in review: Business combined with media GPU and Tiger Lake
Lenovo ThinkPad X1 Yoga G6-20Y0S00200: Intel Iris Xe Graphics G7 96EUs, 14.00", 1.4 kg
Review » ThinkPad X1 Yoga G6 Review: Lenovo's best Business Convertible
HP ZBook Firefly 15 G8 2C9R7EA: NVIDIA T500 Laptop GPU, 15.60", 1.8 kg
Review » HP ZBook Firefly 15 G8 laptop in review: Quadro T500 and Tiger Lake in a 15-inch model
Intel NUC11PHKi7C: NVIDIA GeForce RTX 2060 Mobile, 1.4 kg
Review » Kaby Lake-G Is History: Intel Phantom Canyon NUC11PHKi7C Review
Durabook S14I: Intel Iris Xe Graphics G7 96EUs, 14.00", 3 kg
Review » Durabook S14I Rugged Laptop Review: Durable 11th Gen Tiger Lake
HP ZBook Firefly 14 G8 2C9Q2EA: NVIDIA T500 Laptop GPU, 14.00", 1.4 kg
Review » HP ZBook Firefly 14 G8 laptop in review: Small workstation with faster ports
LG Gram 16 2-in-1 16T90P: Intel Iris Xe Graphics G7 96EUs, 16.00", 1.5 kg
Review » LG Gram 16 16T90P Convertible Review: Lighter Than Most 15.6-inch Laptops
Lenovo Yoga Slim 7i Carbon 13 ITL: Intel Iris Xe Graphics G7 96EUs, 13.30", 1 kg
Review » Lenovo Yoga Slim 7i Carbon 13ITL5 laptop review: Tiger Lake combined with ultralight materials
Huawei MateBook X Pro 2021: Intel Iris Xe Graphics G7 96EUs, 13.90", 1.3 kg
Review » Huawei MateBook X Pro 2021 Review: A Great Laptop You Probably Can't Buy
Dell Inspiron 14 7400-VY8JW: NVIDIA GeForce MX350, 14.50", 1.3 kg
Review » Dell Inspiron 14 7400 Laptop Review: Portable office laptop with a Tiger Lake CPU
Asus ExpertBook B9 B9400CE-KC0166R: Intel Iris Xe Graphics G7 96EUs, 14.00", 1 kg
Review » Asus ExpertBook B9 Laptop Review: Tiger Lake offers a decent boost in performance for the ultra-mobile flyweight
Acer Aspire 5 A517-52G-79Z5: NVIDIA GeForce MX350, 17.30", 2.2 kg
Review » Acer Aspire 5 A517 laptop review: Attractive 17.3-incher with Tiger Lake CPU and MX350 GPU
Aorus Gaming Box GeForce RTX 2080 Ti: , 3.8 kg
Review » The Aorus Gaming Box GeForce RTX 2080 Ti Turned Our Tiny Intel NUC into a 4K Powerhouse
Lenovo ThinkPad E15 Gen2-20TD002MGE: NVIDIA GeForce MX450, 15.60", 1.8 kg
Review » Lenovo ThinkPad E15 Gen 2 Review: Tiger Lake laptop with an Nvidia GeForce MX450
Intel NUC11PAQi7: Intel Iris Xe Graphics G7 96EUs, 0.6 kg
Review » Intel NUC11PAQi7 Panther Canyon Mini PC Review: Tiger Lake Done Right
Lenovo ThinkPad E14 Gen2-20TA000DGE: Intel Iris Xe Graphics G7 96EUs, 14.00", 1.6 kg
Review » Lenovo ThinkPad E14 Gen 2 Laptop Review: Intel's Tiger Lake quad-core beats AMD's hexa-core
Asus ZenBook Duo 14 UX482EA: Intel Iris Xe Graphics G7 96EUs, 14.00", 1.6 kg
Review » A Mini Multitasking Monster: Asus ZenBook Duo 14 UX482 Laptop Review
Lenovo IdeaPad Slim 9i 14ITL5: Intel Iris Xe Graphics G7 96EUs, 14.00", 1.3 kg
Review » Lenovo IdeaPad Slim 9i Laptop Review: Luxurious Looks, Terrible Touchpad
Lenovo ThinkBook 14s Yoga ITL 20WE0023GE: Intel Iris Xe Graphics G7 96EUs, 14.00", 1.5 kg
Review » Lenovo ThinkBook 14s Yoga ITL Review: Quiet, cool, enduring 2-in-1 device
Asus Zenbook 14 UX435EG: NVIDIA GeForce MX450, 14.00", 1.3 kg
Review » Asus ZenBook 14 UX435EG Review: A compact, mobile multimedia allrounder with an unnecessary touchscreen
Dell Inspiron 15 7000 7506 2-in-1 Black Edition: Intel Iris Xe MAX Graphics, 15.60", 1.9 kg
Review » Dell Inspiron 15 7000 7506 2-in-1 Black Edition vs. Silver Edition: What's The Difference?
Asus VivoBook S15 S533EQ-BQ002T: NVIDIA GeForce MX350, 15.60", 1.8 kg
Review » Asus VivoBook S15 S533EQ in review: Elegant all-rounder with equipment weaknesses
HP Spectre x360 14t-ea000: Intel Iris Xe Graphics G7 96EUs, 13.50", 1.3 kg
Review » HP Spectre x360 14 Convertible Review: An Instant Favorite
Razer Book 13 FHD: Intel Iris Xe Graphics G7 96EUs, 13.40", 1.4 kg
Review » Razer Book 13 Core i7 Laptop Review: Like an XPS 13, But Faster
HP Pavilion 13-bb0015cl: Intel Iris Xe Graphics G7 96EUs, 13.30", 1.2 kg
Review » 2020 HP Pavilion 13 11th gen Core i7 Review: It's Actually Pretty Good
Schenker Vision 15: Intel Iris Xe Graphics G7 96EUs, 15.60", 1.7 kg
Review » Schenker Vision 15 (Intel NUC M15) Laptop Review: Intel's answer to XPS 15 and MacBook Pro?
Razer Blade Stealth i7-1165G7 GTX 1650 Ti Max-Q: NVIDIA GeForce GTX 1650 Ti Max-Q, 13.30", 1.4 kg
Review » Razer Blade Stealth Tiger Lake GTX 1650 Ti Max-Q Laptop Review: A Small Step Forward
Dell XPS 13 9310 Core i7 FHD: Intel Iris Xe Graphics G7 96EUs, 13.40", 1.3 kg
Review » Dell XPS 13 9310 Core i7 Laptop Review: The 11th Gen Tiger Lake Difference
Asus ZenBook 14 UX425EA: Intel Iris Xe Graphics G7 96EUs, 14.00", 1.2 kg
Review » Asus ZenBook 14 UX425E Review: 11th Gen Core i7 "Tiger Lake" Debut
Acer SF514-55T: Intel Iris Xe Graphics G7 96EUs, 14.00", 1 kg
Review » Acer Swift 5 Sneak Peek Preview: Tiger Lake iGPU attacks Entry-Level GeForce
Asus ZenBook Flip S UX371: Intel Iris Xe Graphics G7 96EUs, 13.30", 1.2 kg
Review » Asus ZenBook Flip S UX371 Review - Compact Convertible with Tiger Lake and OLED
Dell Inspiron 15 3501: Intel Iris Xe Graphics G7 96EUs, 15.60", 2 kg
External Review » Dell Inspiron 15 3501
Dell Latitude 13 7330 Rugged Extreme, i7-1165G7: Intel Iris Xe Graphics G7 96EUs, 13.30", 2.7 kg
External Review » Dell Latitude 13 7330 Rugged Extreme, i7-1165G7
Asus VivoBook 15 F1500EA, i7-1165G7: Intel Iris Xe Graphics G7 96EUs, 15.60", 1.8 kg
External Review » Asus VivoBook 15 F1500EA, i7-1165G7
Acer Aspire 3 A315-58, i7-1165G7: Intel Iris Xe Graphics G7 96EUs, 15.60", 1.7 kg
External Review » Acer Aspire 3 A315-58, i7-1165G7
Acer TravelMate Spin P6 TMP614RN-52: Intel Iris Xe Graphics G7 96EUs, 14.00", 1 kg
External Review » Acer TravelMate Spin P6 TMP614RN-52
Asus ExpertBook P1412: Intel Iris Xe Graphics G7 96EUs, 14.00", 1.5 kg
External Review » Asus ExpertBook P1412
ADATA XPG Xenia 14: Intel Iris Xe Graphics G7 96EUs, 14.00", 1 kg
External Review » ADATA XPG Xenia 14
Dell Inspiron 14 5410-D3D7T: Intel Iris Xe Graphics G7 96EUs, 14.00", 1.5 kg
External Review » Dell Inspiron 14 5410-D3D7T
Asus Vivobook 14 F1400EA-EB1594W: Intel Iris Xe Graphics G7 96EUs, 14.00", 1.6 kg
External Review » Asus Vivobook 14 F1400EA-EB1594W
Asus ZenBook Flip S UX371EA-HL753W: Intel Iris Xe Graphics G7 96EUs, 13.30", 1.2 kg
External Review » Asus ZenBook Flip S UX371EA-HL753W
HP Pavilion 15-eg2025nr: Intel Iris Xe Graphics G7 96EUs, 15.60", 1.8 kg
External Review » HP Pavilion 15-eg2025nr
Samsung Galaxy Book Pro 15 NP950XDB-KC5US: Intel Iris Xe Graphics G7 96EUs, 15.60", 1.1 kg
External Review » Samsung Galaxy Book Pro 15 NP950XDB-KC5US
HP Envy 13-ba1006ns: Intel Iris Xe Graphics G7 96EUs, 13.30", 1.3 kg
External Review » HP Envy 13-ba1006ns
Lenovo IdeaPad 3 15ITL6-82H8015MMH: Intel Iris Xe Graphics G7 96EUs, 15.60", 1.7 kg
External Review » Lenovo IdeaPad 3 15ITL6-82H8015MMH
Acer Aspire 5 A515-56-758V: Intel Iris Xe Graphics G7 96EUs, 15.60", 1.7 kg
External Review » Acer Aspire 5 A515-56-758V
Asus VivoBook 15 K513EA-L12236: Intel Iris Xe Graphics G7 96EUs, 15.60", 1.8 kg
External Review » Asus VivoBook 15 K513EA-L12236
Asus Vivobook 15 F515EA-EJ1479W: Intel Iris Xe Graphics G7 96EUs, 15.60", 1.8 kg
External Review » Asus Vivobook 15 F515EA-EJ1479W
HP Elitebook 840 G8 Aero 5Z619EA: Intel Iris Xe Graphics G7 96EUs, 14.00", 1.3 kg
External Review » HP Elitebook 840 G8 Aero 5Z619EA
Dell Inspiron 15 3511, i7-1165G7: Intel Iris Xe Graphics G7 96EUs, 15.60", 1.7 kg
External Review » Dell Inspiron 15 3511, i7-1165G7
Acer Aspire 5 A515-56G-78TR: NVIDIA GeForce MX350, 15.60", 1.7 kg
External Review » Acer Aspire 5 A515-56G-78TR
Dynabook Portégé X30L-J-190: Intel Iris Xe Graphics G7 96EUs, 13.30", 0.9 kg
External Review » Dynabook Portégé X30L-J-190
Asus ZenBook Flip 14 UP5401EA-KU030T: Intel Iris Xe Graphics G7 96EUs, 14.00", 1.4 kg
External Review » Asus ZenBook Flip 14 UP5401EA-KU030T
Lenovo V17 G2 ITL-82NX00EUGE: NVIDIA GeForce MX350, 17.30", 2.2 kg
External Review » Lenovo V17 G2 ITL-82NX00EUGE
Asus ZenBook Flip 13 UX363EA-AH74T: Intel Iris Xe Graphics G7 96EUs, 13.30", 1.3 kg
External Review » Asus ZenBook Flip 13 UX363EA-AH74T
Lenovo Yoga Duet 7 13ITL6-82MA000RGE: Intel Iris Xe Graphics G7 96EUs, 13.00", 0.8 kg
External Review » Lenovo Yoga Duet 7 13ITL6-82MA000RGE
Prime Computer PrimeBook Circular-i7-1165G7: Intel Iris Xe Graphics G7 96EUs, 13.90", 1.6 kg
External Review » Prime Computer PrimeBook Circular-i7-1165G7
Acer Aspire 5 A514-54G-743J: NVIDIA GeForce MX350, 14.00", 1.7 kg
External Review » Acer Aspire 5 A514-54G-743J
Asus VivoBook 14 F415EA-EB377T: Intel Iris Xe Graphics G7 96EUs, 14.00", 1.6 kg
External Review » Asus VivoBook 14 F415EA-EB377T
Asus VivoBook 15 K513EA-L11141T: Intel Iris Xe Graphics G7 96EUs, 15.60", 1.8 kg
External Review » Asus VivoBook 15 K513EA-L11141T
Acer Enduro Urban N3 EUN314-51W-70RF: Intel Iris Xe Graphics G7 96EUs, 14.00", 1.9 kg
External Review » Acer Enduro Urban N3 EUN314-51W-70RF
MSI Modern 14 B11MOU-485XES: Intel Iris Xe Graphics G7 96EUs, 14.00", 1.3 kg
External Review » MSI Modern 14 B11MOU-485XES
Durabook Z14I: Intel Iris Xe Graphics G7 96EUs, 14.00", 3.6 kg
External Review » Durabook Z14I
MSI Modern 14 B11MO-074XES: Intel Iris Xe Graphics G7 96EUs, 14.00", 1.3 kg
External Review » MSI Modern 14 B11MO-074XES
Asus ZenBook Flip 13 UX363EA-HP525T: Intel Iris Xe Graphics G7 96EUs, 15.60", 1.3 kg
External Review » Asus ZenBook Flip 13 UX363EA-HP525T
Asus ExpertBook B1 B1500CEAE-BQ0067R: Intel Iris Xe Graphics G7 96EUs, 15.60", 1.7 kg
External Review » Asus ExpertBook B1 B1500CEAE-BQ0067R
Dell Vostro 15 3510, i7-1165G7 MX350: NVIDIA GeForce MX350, 15.60", 1.7 kg
External Review » Dell Vostro 15 3510, i7-1165G7 MX350
Dell XPS 13 9305-P42X4: Intel Iris Xe Graphics G7 96EUs, 13.30", 1.2 kg
External Review » Dell XPS 13 9305-P42X4
Asus ExpertBook B9450CEA-XH75: Intel Iris Xe Graphics G7 96EUs, 14.00", 1 kg
External Review » Asus ExpertBook B9450CEA-XH75
Asus ExpertBook B1 B1400CEAE-EB0116R: Intel Iris Xe Graphics G7 96EUs, 14.00", 1.5 kg
External Review » Asus ExpertBook B1 B1400CEAE-EB0116R
VAIO SX14, i7-1165G7: Intel Iris Xe Graphics G7 96EUs, 14.00", 1.1 kg
External Review » VAIO SX14, i7-1165G7
Asus VivoBook S14 S435EA-KC035T: Intel Iris Xe Graphics G7 96EUs, 14.00", 1.3 kg
External Review » Asus VivoBook S14 S435EA-KC035T
Asus VivoBook 14 F415EA-EB378T: Intel Iris Xe Graphics G7 96EUs, 14.00", 1.6 kg
External Review » Asus VivoBook 14 F415EA-EB378T
Asus VivoBook S14 S433EA-EB1150T: Intel Iris Xe Graphics G7 96EUs, 14.00", 1.4 kg
External Review » Asus VivoBook S14 S433EA-EB1150T
Lenovo IdeaPad 5 Pro 14ITL6-82L3003NSP: Intel Iris Xe Graphics G7 96EUs, 14.00", 1.4 kg
External Review » Lenovo IdeaPad 5 Pro 14ITL6-82L3003NSP
HP Spectre x360 14-ea0435no: Intel Iris Xe Graphics G7 96EUs, 13.50", 1.3 kg
External Review » HP Spectre x360 14-ea0435no
Dell Precision 15 3560-HYFRK: NVIDIA T500 Laptop GPU, 15.60", 1.6 kg
External Review » Dell Precision 15 3560-HYFRK
HP Envy 14-eb0021tx: NVIDIA GeForce GTX 1650 Ti Max-Q, 14.00", 1.5 kg
External Review » HP Envy 14-eb0021tx
HP Envy x360 15-es0021ur: Intel Iris Xe Graphics G7 96EUs, 15.60", 1.8 kg
External Review » HP Envy x360 15-es0021ur
Asus ZenBook 14 UX425EA-KI359T: Intel Iris Xe Graphics G7 96EUs, 14.00", 1.2 kg
External Review » Asus ZenBook 14 UX425EA-KI359T
Asus ExpertBook B3 Flip B3402FEA: Intel Iris Xe Graphics G7 96EUs, 14.00", 1.6 kg
External Review » Asus ExpertBook B3 Flip B3402FEA-EC0053R
HP Pavilion 15-eg0025nr: Intel Iris Xe Graphics G7 96EUs, 15.60", 1.8 kg
External Review » HP Pavilion 15-eg0025nr
Dynabook Tecra A40-J-11J: Intel Iris Xe Graphics G7 96EUs, 14.00", 1.5 kg
External Review » Dynabook Tecra A40-J-11J
HP Envy 13-ba1002ns: NVIDIA GeForce MX450, 13.30", 1.3 kg
External Review » HP Envy 13-ba1002ns
Asus ZenBook Flip 13 UX363EA-HP043T: Intel Iris Xe Graphics G7 96EUs, 13.30", 1.3 kg
External Review » Asus ZenBook Flip 13 UX363EA-HP043T
MSI Modern 15 A11M-045XES: Intel Iris Xe Graphics G7 96EUs, 15.60", 1.6 kg
External Review » MSI Modern 15 A11M-045XES
Dynabook Tecra A50-J-13W: Intel Iris Xe Graphics G7 96EUs, 15.60", 1.6 kg
External Review » Dynabook Tecra A50-J-13W
Lenovo IdeaPad 5 14ITL05-82FE005PGE: Intel Iris Xe Graphics G7 96EUs, 14.00", 1.4 kg
External Review » Lenovo IdeaPad 5 14ITL05-82FE005PGE
LG UltraPC 15U70P-P.AAS8U1: NVIDIA GeForce GTX 1650 Ti Mobile, 15.60", 1.9 kg
External Review » LG UltraPC 15U70P-P.AAS8U1
Acer Enduro Urban N3 EUN314-51WG-74PB: NVIDIA GeForce MX330, 14.00", 1.9 kg
External Review » Acer Enduro Urban N3 EUN314-51WG-74PB
Intel NUC M15 Kit LAPBC710: Intel Iris Xe Graphics G7 96EUs, 15.60", 1.7 kg
External Review » Intel NUC M15 Kit LAPBC710
Asus Vivobook 15 K513EQ: NVIDIA GeForce MX350, 15.60", 1.6 kg
External Review » Asus Vivobook 15 K513EQ
Razer Blade Stealth 13 2021 OLED: NVIDIA GeForce GTX 1650 Ti Max-Q, 13.30", 1.5 kg
External Review » Razer Blade Stealth 13 2021 OLED
Dell Vostro 14 3401, i7-1165G7: NVIDIA GeForce MX330, 14.00", 1.6 kg
External Review » Dell Vostro 14 3401, i7-1165G7
Acer Aspire 5 A515-56-73AP: Intel Iris Xe Graphics G7 96EUs, 15.60", 1.7 kg
External Review » Acer Aspire 5 A515-56-73AP
Asus ExpertBook B5 Flip B5302FEA-LG0400R: Intel Iris Xe Graphics G7 96EUs, 13.30", 1.3 kg
External Review » Asus ExpertBook B5 Flip B5302FEA-LG0400R
HP Pavilion x360 14-dy0028ns: Intel Iris Xe Graphics G7 96EUs, 14.00", 1.6 kg
External Review » HP Pavilion x360 14-dy0028ns
HP Pavilion x360 14-dy0034ns: Intel Iris Xe Graphics G7 96EUs, 14.00", 1.6 kg
External Review » HP Pavilion x360 14-dy0034ns
Lenovo Yoga Slim 7 14ITL05-82A30024GE: Intel Iris Xe Graphics G7 96EUs, 14.00", 1.4 kg
External Review » Lenovo Yoga Slim 7 14ITL05-82A30024GE
Asus Zenbook 14X UX5401EA-KN144T: Intel Iris Xe Graphics G7 96EUs, 14.00", 1.4 kg
External Review » Asus Zenbook 14X UX5401EA-KN144T
HP 15s-fq2089ns: Intel Iris Xe Graphics G7 96EUs, 15.60", 1.7 kg
External Review » HP 15s-fq2089ns
HP Envy x360 13-bd0350nd: Intel Iris Xe Graphics G7 96EUs, 13.30", 1.3 kg
External Review » HP Envy x360 13-bd0350nd
Dynabook Portégé X30W-J-10K: Intel Iris Xe Graphics G7 96EUs, 13.30", 1 kg
External Review » Dynabook Portégé X30W-J-10K
LG Gram 16 2-in-1 16T90P: Intel Iris Xe Graphics G7 96EUs, 16.00", 1.5 kg
External Review » LG Gram 16 2-in-1 16T90P
Lenovo ThinkPad P15s G2-20W6005EGE: NVIDIA T500 Laptop GPU, 15.60", 1.8 kg
External Review » Lenovo ThinkPad P15s G2-20W6005EGE
Dynabook Portégé X30L-J-13R: Intel Iris Xe Graphics G7 96EUs, 13.30", 0.9 kg
External Review » Dynabook Portégé X30L-J-13R
Asus Expertbook B5 B5302C, i7-1165G7: Intel Iris Xe Graphics G7 96EUs, 13.30", 1.1 kg
External Review » Asus Expertbook B5 B5302C, i7-1165G7
Dynabook Portégé X30L-J-13P: Intel Iris Xe Graphics G7 96EUs, 13.30", 0.9 kg
External Review » Dynabook Portégé X30L-J-13P
HP Pavilion 15-eg0018ns: Intel Iris Xe Graphics G7 96EUs, 15.60", 1.8 kg
External Review » HP Pavilion 15-eg0018ns
HP Pavilion x360 14-dw1023ns: Intel Iris Xe Graphics G7 96EUs, 14.00", 1.6 kg
External Review » HP Pavilion x360 14-dw1023ns
Asus Zenbook 14X UX5400E: NVIDIA GeForce MX450, 14.00", 1.4 kg
External Review » Asus Zenbook 14X UX5400E
Samsung Galaxy Book 15, i7-1165G7: Intel Iris Xe Graphics G7 96EUs, 15.60", 1.6 kg
External Review » Samsung Galaxy Book 15, i7-1165G7
Lenovo ThinkPad X1 Yoga G6-20XY002PUS: Intel Iris Xe Graphics G7 96EUs, 14.00", 1.4 kg
External Review » Lenovo ThinkPad X1 Yoga G6-20XY002PUS
Fujitsu UH-X, i7: Intel Iris Xe Graphics G7 96EUs, 13.30", 0.7 kg
External Review » Fujitsu UH-X, i7
Asus ExpertBook B1 B1400C, 1165G7 MX330: NVIDIA GeForce MX330, 14.00", 1.5 kg
External Review » Asus ExpertBook B1 B1400C, 1165G7 MX330
HP 15s-fq2088ns: Intel Iris Xe Graphics G7 96EUs, 15.60", 1.7 kg
External Review » HP 15s-fq2088ns
HP 15s-fq2010ns: Intel Iris Xe Graphics G7 96EUs, 15.60", 1.7 kg
External Review » HP 15s-fq2010ns
Asus Chromebook CX9400, i7-1165G7: Intel Iris Xe Graphics G7 96EUs, 14.00", 1.1 kg
External Review » Asus Chromebook CX9400, i7-1165G7
HP Pavilion 15-eg0019ns: Intel Iris Xe Graphics G7 96EUs, 15.60", 1.8 kg
External Review » HP Pavilion 15-eg0019ns
HP Envy 13-ba1012ns: NVIDIA GeForce MX450, 13.30", 1.3 kg
External Review » HP Envy 13-ba1012ns
Lenovo IdeaPad Flex 5 14ITL05-82HS003QGE: Intel Iris Xe Graphics G7 96EUs, 14.00", 1.5 kg
External Review » Lenovo IdeaPad Flex 5 14ITL05-82HS003QGE
Asus ExpertBook B9 B9400CE-KC0166R: Intel Iris Xe Graphics G7 96EUs, 14.00", 1 kg
External Review » Asus ExpertBook B9 B9400CE-KC0166R
HP Pavilion 15-eg0504TU: Intel Iris Xe Graphics G7 96EUs, 15.60", 1.8 kg
External Review » HP Pavilion 15-eg0504TU
Lenovo ThinkPad X1 Carbon G9-20XW005JGE: Intel Iris Xe Graphics G7 96EUs, 14.00", 1.1 kg
External Review » Lenovo ThinkPad X1 Carbon G9-20XW005JGE
Dell XPS 13 9310 2-in-1: Intel Iris Xe Graphics G7 96EUs, 13.40", 1.3 kg
External Review » Dell XPS 13 9310 2-in-1
Dell Latitude 15 7520, i7-1165G7: Intel Iris Xe Graphics G7 96EUs, 15.60", 1.8 kg
External Review » Dell Latitude 15 7520, i7-1165G7
Lenovo ThinkPad T15 G2, i7-1165G7 iGPU: Intel Iris Xe Graphics G7 96EUs, 15.60", 1.8 kg
External Review » Lenovo ThinkPad T15 G2, i7-1165G7 iGPU
HP ZBook Firefly 14 G8 2C9Q2EA: NVIDIA T500 Laptop GPU, 14.00", 1.4 kg
External Review » HP ZBook Firefly 14 G8 2C9Q2EA
HP Pavilion 15-eg0006ns: NVIDIA GeForce MX450, 15.60", 1.8 kg
External Review » HP Pavilion 15-eg0006ns
Asus VivoBook S14 S433EA-AM613T: Intel Iris Xe Graphics G7 96EUs, 14.00", 1.4 kg
External Review » Asus VivoBook S14 S433EA-AM613T
HP Spectre x360 14-ea0059nw: Intel Iris Xe Graphics G7 96EUs, 13.50", 1.3 kg
External Review » HP Spectre x360 14-ea0059nw
HP Envy x360 15-es0570nd: Intel Iris Xe Graphics G7 96EUs, 15.60", 1.8 kg
External Review » HP Envy x360 15-es0570nd
LG Gram 16 (2021): Intel Iris Xe Graphics G7 96EUs, 16.00", 1.2 kg
External Review » LG Gram 16 (2021)
Lenovo IdeaPad 3 15ITL6-82H800BHSP: Intel Iris Xe Graphics G7 96EUs, 15.60", 1.7 kg
External Review » Lenovo IdeaPad 3 15ITL6-82H800BHSP
HP Pavilion 15-eg0007ns: NVIDIA GeForce MX450, 15.60", 1.8 kg
External Review » HP Pavilion 15-eg0007ns
HP Envy 17-ch0000ns: NVIDIA GeForce MX450, 17.30", 2.5 kg
External Review » HP Envy 17-ch0000ns
HP Pavilion x360 14-dw1003ns: Intel Iris Xe Graphics G7 96EUs, 14.00", 1.6 kg
External Review » HP Pavilion x360 14-dw1003ns
HP Envy 14-eb0037no: Intel Iris Xe Graphics G7 96EUs, 14.00", 1.5 kg
External Review » HP Envy 14-eb0037no
Getac S410, i7-1165G7: Intel Iris Xe Graphics G7 96EUs, 14.00", 2.4 kg
External Review » Getac S410, i7-1165G7
Acer TravelMate P4 TMP414-51-75L8: Intel Iris Xe Graphics G7 96EUs, 14.00", 1.4 kg
External Review » Acer TravelMate P4 TMP414-51-75L8
Asus Vivobook 14 K413EA-EB608T: Intel Iris Xe Graphics G7 96EUs, 14.00", 1.4 kg
External Review » Asus Vivobook 14 K413EA-EB608T
HP 15s-fq2039ns: Intel Iris Xe Graphics G7 96EUs, 15.60", 1.7 kg
External Review » HP 15s-fq2039ns
Asus ExpertBook B1 B1500C, i7-1165G7 MX330: NVIDIA GeForce MX330, 15.60", 1.7 kg
External Review » Asus ExpertBook B1500C, i7-1165G7 MX330
Lenovo ThinkPad X1 Yoga G6-20Y0S00200: Intel Iris Xe Graphics G7 96EUs, 14.00", 1.4 kg
External Review » Lenovo ThinkPad X1 Yoga G6-20Y0S00200
Durabook S14I: Intel Iris Xe Graphics G7 96EUs, 14.00", 3 kg
External Review » Durabook S14I
Hyperbook NV4, i7-1165G7 GTX 1650 Ti: NVIDIA GeForce GTX 1650 Ti Mobile, 14.00", 1.4 kg
External Review » Hyperbook NV4, i7-1165G7 GTX 1650 Ti
Acer Swift 3X SF314-510G-73NT: Intel Iris Xe Graphics G7 96EUs, 14.00", 1.4 kg
External Review » Acer Swift 3X SF314-510G-73NT
Huawei MateBook D 15 2021, i7-1165G7: Intel Iris Xe Graphics G7 96EUs, 15.60", 1.6 kg
External Review » Huawei MateBook D 15 2021, i7-1165G7
HP Envy x360 13-bd0032nr: Intel Iris Xe Graphics G7 96EUs, 13.30", 1.3 kg
External Review » HP Envy x360 13-bd0032nr
HP EliteBook 850 G8 3C7Z8EA: Intel Iris Xe Graphics G7 96EUs, 15.60", 1.8 kg
External Review » HP EliteBook 850 G8 3C7Z8EA
HP EliteBook 830 G8-i7-1165G7: Intel Iris Xe Graphics G7 96EUs, 13.30", 1.3 kg
External Review » HP EliteBook 830 G8-i7-1165G7
HP Envy 14-eb0003ns: NVIDIA GeForce GTX 1650 Ti Max-Q, 14.00", 1.5 kg
External Review » HP Envy 14-eb0003ns
Lenovo ThinkPad X1 Carbon G9-20XWCTO1WW: Intel Iris Xe Graphics G7 96EUs, 14.00", 1.2 kg
External Review » Lenovo ThinkPad X1 Carbon G9-20XWCTO1WW
Dynabook Portégé X40-J-11C: Intel Iris Xe Graphics G7 96EUs, 14.00", 1.4 kg
External Review » Dynabook Portégé X40-J-11C
Acer TravelMate P614P-52: Intel Iris Xe Graphics G7 96EUs, 14.00", 1 kg
External Review » Acer TravelMate P614P-52
Dell Latitude 14 5420, i7-1165G7: Intel Iris Xe Graphics G7 96EUs, 14.00", 1.4 kg
External Review » Dell Latitude 14 5420, i7-1165G7
HP EliteBook x360 1030 G8, i7-1165G7: Intel Iris Xe Graphics G7 96EUs, 13.30", 1.2 kg
External Review » HP EliteBook x360 1030 G8, i7-1165G7
HP EliteBook x360 1040 G8, i7-1165G7: Intel Iris Xe Graphics G7 96EUs, 14.00", 1.3 kg
External Review » HP EliteBook x360 1040 G8, i7-1165G7
Samsung Galaxy Book Pro 13 NP930XDB-KD1US: Intel Iris Xe Graphics G7 96EUs, 13.30", 0.9 kg
External Review » Samsung Galaxy Book Pro 13 NP930XDB-KD1US
Huawei MateBook 14 2021, i7-1165G7: Intel Iris Xe Graphics G7 96EUs, 14.00", 1.5 kg
External Review » Huawei MateBook 14 2021, i7-1165G7
Acer Swift 3 SF314-59-71YQ: Intel Iris Xe Graphics G7 96EUs, 14.00", 1.2 kg
External Review » Acer Swift 3 SF314-59-71YQ
HP Pavilion 15-eg: NVIDIA GeForce MX450, 15.60", 1.7 kg
External Review » HP Pavilion 15-eg0025cl
HP Pavilion 15-eg0021nr: Intel Iris Xe Graphics G7 96EUs, 15.60", 1.8 kg
External Review » HP Pavilion 15-eg0021nr
HP Pavilion x360 14-dw1004ns: Intel Iris Xe Graphics G7 96EUs, 14.00", 1.6 kg
External Review » HP Pavilion x360 14-dw1004ns
HP Elite Dragonfly G2, i7-1165G7: Intel Iris Xe Graphics G7 96EUs, 13.30", 1 kg
External Review » HP Elite Dragonfly G2, i7-1165G7
Asus Chromebook Flip CX5 CX5500FEA: Intel Iris Xe Graphics G7 96EUs, 15.60", 2 kg
External Review » Asus Chromebook Flip CX5 CX5500FEA-E60050
Dynabook Portégé X30W-J-10C: Intel Iris Xe Graphics G7 96EUs, 13.30", 1 kg
External Review » Dynabook Portégé X30W-J-10C
Asus ZenBook 13 UX325EA-KG245T: Intel Iris Xe Graphics G7 96EUs, 13.30", 1.2 kg
External Review » Asus ZenBook 13 UX325EA-KG245T
MSI Modern 14 B11SB-008ES: NVIDIA GeForce MX450, 14.00", 1.3 kg
External Review » MSI Modern 14 B11SB-008ES
HP 15s-fq2042ns: Intel Iris Xe Graphics G7 96EUs, 15.60", 1.7 kg
External Review » HP 15s-fq2042ns
Asus Vivobook 15 K513EP-EJ104T: NVIDIA GeForce MX330, 15.60", 1.8 kg
External Review » Asus Vivobook 15 K513EP-EJ104T
HP Envy 14-eb0490nd: Intel Iris Xe Graphics G7 96EUs, 14.00", 1.5 kg
External Review » HP Envy 14-eb0490nd
HP ProBook 440 G8-2W1G4EA: Intel Iris Xe Graphics G7 96EUs, 14.00", 1.4 kg
External Review » HP ProBook 440 G8-2W1G4EA
Samsung Galaxy Book Pro 360 15 NP950QDB-KA1US: Intel Iris Xe Graphics G7 96EUs, 15.60", 1.4 kg
External Review » Samsung Galaxy Book Pro 360 15 NP950QDB-KA1US
Samsung Galaxy Book Pro 15 NP950XDB-KA1US: Intel Iris Xe Graphics G7 96EUs, 15.60", 1.1 kg
External Review » Samsung Galaxy Book Pro 15 NP950XDB-KA1US
Dell Latitude 13 7320 2-in-1, i7-1165G7: Intel Iris Xe Graphics G7 96EUs, 13.30", 1.4 kg
External Review » Dell Latitude 13 7320 2-in-1, i7-1165G7
HP Pavilion 14-dv0058TU: Intel Iris Xe Graphics G7 96EUs, 14.00", 1.4 kg
External Review » HP Pavilion 14-dv0058TU
Asus ZenBook 13 UX325EA: Intel Iris Xe Graphics G7 96EUs, 13.30", 1.2 kg
External Review » Asus ZenBook 13 UX325EA
LG Gram 14Z90P-G.AA79G: Intel Iris Xe Graphics G7 96EUs, 14.00", 1 kg
External Review » LG Gram 14Z90P-G.AA79G
MSI Modern 15 A11SB-011ES: NVIDIA GeForce MX450, 15.60", 1.6 kg
External Review » MSI Modern 15 A11SB-011ES
HP 14s-dq2013ns: Intel Iris Xe Graphics G7 96EUs, 14.00", 1.5 kg
External Review » HP 14s-dq2013ns
HP 14s-dq2005ns: Intel Iris Xe Graphics G7 96EUs, 14.00", 1.5 kg
External Review » HP 14s-dq2005ns
HP Pavilion 13-bb0667ng: Intel Iris Xe Graphics G7 96EUs, 13.30", 1.2 kg
External Review » HP Pavilion 13-bb0667ng
MSI Summit B15 A11M-057: Intel Iris Xe Graphics G7 96EUs, 15.60", 1.6 kg
External Review » MSI Summit B15 A11M-057
Acer TravelMate P4 TMP414-51-74K7: Intel Iris Xe Graphics G7 96EUs, 14.00", 1.4 kg
External Review » Acer TravelMate P4 TMP414-51-74K7
Asus VivoBook S14 S435EA-HM004T: Intel Iris Xe Graphics G7 96EUs, 14.00", 1.3 kg
External Review » Asus VivoBook S14 S435EA-HM004T
Honor Magicbook 14 i7-1165G7: Intel Iris Xe Graphics G7 96EUs, 14.00", 1.4 kg
External Review » Honor Magicbook 14 i7-1165G7
Lenovo ThinkPad X1 Carbon G9-20XXS00100: Intel Iris Xe Graphics G7 96EUs, 14.00", 1.2 kg
External Review » Lenovo ThinkPad X1 Carbon G9-20XXS00100
Lenovo Yoga Slim 7i Carbon 13 ITL: Intel Iris Xe Graphics G7 96EUs, 13.30", 1 kg
External Review » Lenovo Yoga Slim 7i Carbon 13 ITL
HP 15s-fq2011ns: Intel Iris Xe Graphics G7 96EUs, 15.60", 1.7 kg
External Review » HP 15s-fq2011ns
HP Envy 17-cg1000ns: NVIDIA GeForce MX450, 17.30", 2.7 kg
External Review » HP Envy 17-cg1000ns
Asus ZenBook Flip 13 UX363EA-HP165T: Intel Iris Xe Graphics G7 96EUs, 13.30", 1.3 kg
External Review » Asus ZenBook Flip 13 UX363EA-HP165T
Asus VivoBook 15 K513EA-BQ684: Intel Iris Xe Graphics G7 96EUs, 15.60", 1.8 kg
External Review » Asus VivoBook 15 K513EA-BQ684
Asus VivoBook Ultra 14 K413EQ-EK115T: NVIDIA GeForce MX350, 14.00"
External Review » Asus VivoBook Ultra 14 K413EQ-EK115T
LG Gram 15Z95N-G.AA78B: Intel Iris Xe Graphics G7 96EUs, 15.60"
External Review » LG Gram 15Z95N-G.AA78B
LG Gram 17Z95N-G.AA78B: Intel Iris Xe Graphics G7 96EUs, 17.00", 1.4 kg
External Review » LG Gram 17Z95N-G.AA78B
Lenovo Yoga Slim 9 14ITL5-82D1002HGE: Intel Iris Xe Graphics G7 96EUs, 14.00", 1.2 kg
External Review » Lenovo Yoga Slim 9 14ITL5-82D1002HGE
Xiaomi RedmiBook Pro 14 2021, i7-1165G7 MX450: NVIDIA GeForce MX450, 14.00", 1.5 kg
External Review » Xiaomi RedmiBook Pro 14 2021, i7-1165G7 MX450
LG Gram 16Z90P-K.AAB6U1: Intel Iris Xe Graphics G7 96EUs, 16.00", 1.2 kg
External Review » LG Gram 16Z90P-K.AAB6U1
HP Pavilion 13-bb0015cl: Intel Iris Xe Graphics G7 96EUs, 13.30", 1.2 kg
External Review » HP Pavilion 13-bb0015cl
Lenovo ThinkBook 14s Yoga ITL 20WE0023GE: Intel Iris Xe Graphics G7 96EUs, 14.00", 1.5 kg
External Review » Lenovo ThinkBook 14s Yoga ITL 20WE0023GE
HP Envy 14-eb0775ng: NVIDIA GeForce GTX 1650 Ti Max-Q, 14.00", 1.5 kg
External Review » HP Envy 14-eb0775ng
Acer Swift 3X SF314-510G-70DW: Intel Iris Xe MAX Graphics, 14.00", 1.4 kg
External Review » Acer Swift 3X SF314-510G-70DW
Acer Swift 5 SF514-55GT-72L0: NVIDIA GeForce MX350, 14.00", 1.1 kg
External Review » Acer Swift 5 SF514-55GT-72L0
Samsung Galaxy Book Flex2 NP930QCA-KA2DE: Intel Iris Xe Graphics G7 96EUs, 13.30", 1.3 kg
External Review » Samsung Galaxy Book Flex2 NP930QCA-KA2DE
Acer Swift 5 SF514-55T-70LG: Intel Iris Xe Graphics G7 96EUs, 14.00", 1.1 kg
External Review » Acer Swift 5 SF514-55T-70LG
Razer Blade Stealth i7-1165G7 GTX 1650 Ti Max-Q: NVIDIA GeForce GTX 1650 Ti Max-Q, 13.30", 1.4 kg
External Review » Razer Blade Stealth i7-1165G7 GTX 1650 Ti Max-Q
Lenovo Yoga 7 14ITL5, i7-1165G7: Intel Iris Xe Graphics G7 96EUs, 14.00", 1.4 kg
External Review » Lenovo Yoga 7 14ITL5, i7-1165G7
LG Gram 17Z90P-K.AAB8U1: Intel Iris Xe Graphics G7 96EUs, 17.00", 1.4 kg
External Review » LG Gram 17Z90P-K.AAB8U1
Lenovo ThinkBook 15 G2 ITL, i7-1165G7: Intel Iris Xe Graphics G7 96EUs, 15.60", 1.7 kg
External Review » Lenovo ThinkBook 15 G2 ITL, i7-1165G7
HP Spectre x360 13-aw2002ng: Intel Iris Xe Graphics G7 96EUs, 13.30", 1.3 kg
External Review » HP Spectre x360 13-aw2002ng
HP Spectre x360 14-ea0004ns: Intel Iris Xe Graphics G7 96EUs, 13.50", 1.4 kg
External Review » HP Spectre x360 14-ea0004ns
HP Pavilion 14-dv0005ns: NVIDIA GeForce MX450, 14.00", 1.4 kg
External Review » HP Pavilion 14-dv0005ns
Asus ZenBook 14 UX425EA-HM165T: Intel Iris Xe Graphics G7 96EUs, 14.00", 1.2 kg
External Review » Asus ZenBook 14 UX425EA-HM165T
Acer Swift 3 Air 3 SF313-53-79G3: Intel Iris Xe Graphics G7 96EUs, 13.50", 1.2 kg
External Review » Acer Swift 3 Air 3 SF313-53-79G3
Lenovo IdeaPad Slim 9i 14ITL5: Intel Iris Xe Graphics G7 96EUs, 14.00", 1.3 kg
External Review » Lenovo IdeaPad Slim 9i 14ITL5
Huawei MateBook X Pro 2021: Intel Iris Xe Graphics G7 96EUs, 13.90", 1.3 kg
External Review » Huawei MateBook X Pro 2021
Asus ZenBook 13 UX325EA-EG247: Intel Iris Xe Graphics G7 96EUs, 13.30", 1.1 kg
External Review » Asus ZenBook 13 UX325EA-EG247
HP Spectre x360 13-aw2006ng: Intel Iris Xe Graphics G7 96EUs, 13.30", 1.3 kg
External Review » HP Spectre x360 13-aw2006ng
HP Elite x2 G8: Intel Iris Xe Graphics G7 96EUs, 13.00"
External Review » HP Elite x2 G8
Lenovo IdeaPad 5 14ITL05-82FE005QGE: NVIDIA GeForce MX450, 14.00"
External Review » Lenovo IdeaPad 5 14ITL05-82FE005QGE
MSI Modern 14 B11SB-009XES: NVIDIA GeForce MX450, 14.00", 1.3 kg
External Review » MSI Modern 14 B11SB-009XES
HP Spectre x360 13t-aw200: Intel Iris Xe Graphics G7 96EUs, 13.30", 1.3 kg
External Review » HP Spectre x360 13t-aw200
Acer Swift 5 SF514-55T-71NL: Intel Iris Xe Graphics G7 96EUs, 14.00", 1.1 kg
External Review » Acer Swift 5 SF514-55T-71NL
HP Envy 13-ba1033tx: NVIDIA GeForce MX450, 13.30", 1.3 kg
External Review » HP Envy 13-ba1033tx
Acer Swift 5 SF514-55TA-7494: Intel Iris Xe Graphics G7 96EUs, 14.00", 1.1 kg
External Review » Acer Swift 5 SF514-55TA-7494
HP Envy x360 15-ed1550nd: Intel Iris Xe Graphics G7 96EUs, 15.60", 1.9 kg
External Review » HP Envy x360 15-ed1550nd
Dell Inspiron 13 7306 2-in-1, i7-1165G7: Intel Iris Xe Graphics G7 96EUs, 13.30", 1.4 kg
External Review » Dell Inspiron 13 7306 2-in-1, i7-1165G7
HP Pavilion 14-dv0067tx: NVIDIA GeForce MX450, 14.00", 1.5 kg
External Review » HP Pavilion 14-dv0067tx
Lenovo Yoga Slim 7i Pro: NVIDIA GeForce MX450, 14.00", 1.5 kg
External Review » Lenovo Yoga Slim 7i Pro
HP Envy 17-cg1490nd : NVIDIA GeForce MX450, 17.30", 2.8 kg
External Review » HP Envy 17-cg1490nd
Dell Inspiron 15 7000 7506 2-in-1 Black Edition: Intel Iris Xe MAX Graphics, 15.60", 1.9 kg
External Review » Dell Inspiron 15 7000 7506 2-in-1 Black Edition
Asus ZenBook Duo 14 UX482EA: Intel Iris Xe Graphics G7 96EUs, 14.00", 1.6 kg
External Review » Asus ZenBook Duo 14 UX482EA
MSI Modern 14 B11M-028: Intel Iris Xe Graphics G7 96EUs, 14.00", 1.3 kg
External Review » MSI Modern 14 B11M-028
Asus VivoBook S14 S433EQ-EB044T: Intel Iris Xe Graphics G7 96EUs, 14.00", 1.4 kg
External Review » Asus VivoBook S14 S433EQ-EB044T
HP Spectre x360 14t-ea000: Intel Iris Xe Graphics G7 96EUs, 13.50", 1.3 kg
External Review » HP Spectre x360 14t-ea000
Asus Zenbook 14 UX435EG: NVIDIA GeForce MX450, 14.00", 1.3 kg
External Review » Asus Zenbook 14 UX435EG
Acer Swift 5 SF514-55TA-74EC: Intel Iris Xe Graphics G7 96EUs, 14.00", 1.1 kg
External Review » Acer Swift 5 SF514-55TA-74EC
Lenovo Yoga 7 15ITL5-82BJ0031GE: Intel Iris Xe Graphics G7 96EUs, 15.60", 1.9 kg
External Review » Lenovo Yoga 7 15ITL5-82BJ0031GE
Razer Blade Stealth 13 2021, i7-1165G7: Intel Iris Xe Graphics G7 96EUs, 13.30", 1.4 kg
External Review » Razer Blade Stealth 13 2021, i7-1165G7
HP Spectre x360 14-ea0030tu: Intel Iris Xe Graphics G7 96EUs, 13.50", 1.4 kg
External Review » HP Spectre x360 14-ea0030tu
Asus ZenBook Flip S UX371EA-HL135T: Intel Iris Xe Graphics G7 96EUs, 13.30", 1.2 kg
External Review » Asus ZenBook Flip S UX371EA-HL135T
Asus ZenBook S UX393EA-HK003T: Intel Iris Xe Graphics G7 96EUs, 13.90", 1.4 kg
External Review » Asus ZenBook S UX393EA-HK003T
Dell XPS 13 9310 cn93214sc: Intel Iris Xe Graphics G7 96EUs, 13.40", 1.3 kg
External Review » Dell XPS 13 9310 cn93214sc
MSI Modern 15 A11SB-039RU: NVIDIA GeForce MX450, 15.60", 1.6 kg
External Review » MSI Modern 15 A11SB-039RU
Asus ZenBook 14 Ultralight UX435EGL: Intel Iris Xe Graphics G7 96EUs, 14.00", 1 kg
External Review » Asus ZenBook 14 Ultralight UX435EGL
HP Envy 17-cg1279ng: NVIDIA GeForce MX450, 17.30", 2.7 kg
External Review » HP Envy 17-cg1279ng
Schenker Vision 15: Intel Iris Xe Graphics G7 96EUs, 15.60", 1.7 kg
External Review » Schenker Vision 15
Asus ZenBook Flip S UX371EA-HL003T: Intel Iris Xe Graphics G7 96EUs, 13.30", 1.3 kg
External Review » Asus ZenBook Flip S UX371EA-HL003T
Lenovo Yoga Slim 7i Carbon: NVIDIA GeForce MX330, 13.30", 1 kg
External Review » Lenovo Yoga Slim 7i Carbon
Dell XPS 13 cn93214sc: Intel Iris Xe Graphics G7 96EUs, 13.40", 1.2 kg
External Review » Dell XPS 13 cn93214sc
Dell XPS 13 9310 2-in-1, i7-1165G7: Intel Iris Xe Graphics G7 96EUs, 13.40", 1.3 kg
External Review » Dell XPS 13 9310 2-in-1, i7-1165G7
Acer Swift 5 SF514-55GT-79BM: NVIDIA GeForce MX350, 14.00", 1 kg
External Review » Acer Swift 5 SF514-55GT-79BM
Asus ZenBook 13 UX325EA-AH77: Intel Iris Xe Graphics G7 96EUs, 13.30", 1.1 kg
External Review » Asus ZenBook 13 UX325EA-AH77
Asus VivoBook S15 S533EA-BQ003T: Intel Iris Xe Graphics G7 96EUs, 15.60", 1.8 kg
External Review » Asus VivoBook S15 S533EA-BQ003T
Asus ZenBook 14 Ultralight UX435, i7: Intel Iris Xe Graphics G7 96EUs, 14.00", 1 kg
External Review » Asus ZenBook 14 Ultralight UX435, i7
Razer Book 13 FHD: Intel Iris Xe Graphics G7 96EUs, 13.40", 1.4 kg
External Review » Razer Book 13 FHD
Asus VivoBook S15 S533EQ-BQ002T: NVIDIA GeForce MX350, 15.60", 1.8 kg
External Review » Asus VivoBook S15 S533EQ-BQ002T
Acer TravelMate Spin P4 TMP414RN-51-71V7: Intel Iris Xe Graphics G7 96EUs, 14.00", 1.5 kg
External Review » Acer TravelMate Spin P4 TMP414RN-51-71V7
Acer Book RS Porsche Design AP714-51GT-71A4: NVIDIA GeForce MX350, 14.00", 1.3 kg
External Review » Acer Book RS Porsche Design AP714-51GT-71A4
Acer Swift 3X: Intel Iris Xe MAX Graphics, 14.00"
External Review » Acer Swift 3X
Asus ZenBook Flip 13 UX363EA-EM045R: Intel Iris Xe Graphics G7 96EUs, 13.30", 1.3 kg
External Review » Asus ZenBook Flip 13 UX363EA-EM045R
Acer Swift 3X SF314-510G-761J: Intel Iris Xe Graphics G7 96EUs, 14.00", 1.4 kg
External Review » Acer Swift 3X SF314-510G-761J
HP Envy 13-ba1097nr: Intel Iris Xe Graphics G7 96EUs, 13.30", 1.3 kg
External Review » HP Envy 13-ba1097nr
Fujitsu LifeBook U9311: Intel Iris Xe Graphics G7 96EUs, 13.30", 0.9 kg
External Review » Fujitsu LifeBook U9311
Acer Swift 3 SF313-53-78UG: Intel Iris Xe Graphics G7 96EUs, 13.50", 1.2 kg
External Review » Acer Swift 3 SF313-53-78UG
Asus ZenBook 13 UX325EA, i7-1165G7: Intel Iris Xe Graphics G7 96EUs, 13.30", 1.1 kg
External Review » Asus ZenBook 13 UX325EA, i7-1165G7
Asus ExpertBook B9 B9400CEA-KC0167R: Intel Iris Xe Graphics G7 96EUs, 14.00", 1 kg
External Review » Asus ExpertBook B9400CEA-KC0167R
Dell XPS 13 9310, i7-1165G7 4K: Intel Iris Xe Graphics G7 96EUs, 13.40", 1.3 kg
External Review » Dell XPS 13 9310, i7-1165G7 4K
Dell XPS 13 9310 Core i7 FHD: Intel Iris Xe Graphics G7 96EUs, 13.40", 1.3 kg
External Review » Dell XPS 13 9310 Core i7 FHD
Asus ZenBook S UX393EA-HK001T: Intel Iris Xe Graphics G7 96EUs, 13.90", 1.4 kg
External Review » Asus ZenBook S UX393EA-HK001T
Asus Vivobook S14 S433EA-EB160T: Intel Iris Xe Graphics G7 96EUs, 14.00", 1.4 kg
External Review » Asus Vivobook S14 S433EA-EB160T
Asus ZenBook 14 UX425EA: Intel Iris Xe Graphics G7 96EUs, 14.00", 1.2 kg
External Review » Asus ZenBook 14 UX425EA
Asus ZenBook Flip S UX371: Intel Iris Xe Graphics G7 96EUs, 13.30", 1.2 kg
External Review » Asus ZenBook Flip S UX371
Acer Swift 5 (2021): Intel Iris Xe Graphics G7 96EUs, 14.00", 1 kg
External Review » Acer Swift 5 (2021)
Lenovo ThinkPad X1 Yoga G6-20Y0S00200: Intel Iris Xe Graphics G7 96EUs, 14.00", 1.4 kg
» Lenovo ThinkPad X1 Yoga convertible with 4K display, Core i7 and 16GB RAM on sale for 75% off MSRP
» Lenovo ThinkPad X1 Yoga Gen 6 convertible with Core i7, 16GB RAM and 4K display now 71% off
Lenovo V17 G2 ITL-82NX00EUGE: NVIDIA GeForce MX350, 17.30", 2.2 kg
» Lenovo V17 G2 reviewed: The 17-inch laptop is affordable when going without the MX350
Asus ZenBook 14X OLED UX5400EA-L7154W: NVIDIA GeForce MX450, 14.00", 1.4 kg
» Fast MX450 & Flawless OLED: Asus ZenBook 14X Review
Huawei MateBook 14 2021, i7-1165G7: Intel Iris Xe Graphics G7 96EUs, 14.00", 1.5 kg
» Huawei MateBook 14 laptop (i7-1165G7) test: An affordable MacBook-Air competitor with 3:2 touchscreen
Asus ExpertBook B3 Flip B3402FEA: Intel Iris Xe Graphics G7 96EUs, 14.00", 1.6 kg
» Asus ExpertBook B3 Flip: 2-in-1 notebook with two cameras and LTE modem
Samsung Galaxy Book Pro 15 NP950XDB-KC5US: Intel Iris Xe Graphics G7 96EUs, 15.60", 1.1 kg
» Samsung Galaxy Book Pro 15 sacrifices chassis rigidity to be as thin and light as possible
Acer Swift 3X SF314-510G-70DW: Intel Iris Xe MAX Graphics, 14.00", 1.4 kg
» The Acer Swift 3X impresses with 18 hours of battery life and solid gaming performance in our review
Dell Inspiron 14 5410-D3D7T: Intel Iris Xe Graphics G7 96EUs, 14.00", 1.5 kg
» Dell Inspiron 14 5410 and 7415: Two convertibles as different as the left and right Twix
Dell Inspiron 13 7306-6TYH5: Intel Iris Xe Graphics G7 96EUs, 13.30", 1.4 kg
» Dell Inspiron 7306: Convertible for creative types
Asus Vivobook 15 K513EQ: NVIDIA GeForce MX350, 15.60", 1.6 kg
» 2021 Asus VivoBook 15 sets a new display standard for budget laptops with its outstanding 1080p OLED panel
Asus Zenbook 14X UX5400E: NVIDIA GeForce MX450, 14.00", 1.4 kg
» Asus Zenbook 14X OLED: Vibrant display, weak long-term performance
Framework Laptop 13.5: Intel Iris Xe Graphics G7 96EUs, 13.50", 1.3 kg
» Framework doubles down on repairability, now sells replacement laptop parts directly to its customers
Dell Inspiron 15 3501: Intel Iris Xe Graphics G7 96EUs, 15.60", 2 kg
» The Dell Inspiron 15 3501 supports Linux
Dell XPS 13 9310 2-in-1: Intel Iris Xe Graphics G7 96EUs, 13.40", 1.3 kg
» The Dell XPS 13 9310 2-in-1 is both a minor and major upgrade over the older XPS 13 7390 2-in-1
Acer TravelMate P614P-52: Intel Iris Xe Graphics G7 96EUs, 14.00", 1 kg
» Acer TravelMate P6 (2021) in review: Possibly one of the best Iris Xe Graphics G7 performances seen with the Core i7-1165G7 so far
Asus Chromebook Flip CX5 CX5500FEA: Intel Iris Xe Graphics G7 96EUs, 15.60", 2 kg
» Asus Chromebook Flip CX5: 2-in-1 laptop with optional stylus input
HP EliteBook 830 G8-i7-1165G7: Intel Iris Xe Graphics G7 96EUs, 13.30", 1.3 kg
» The new HP EliteBook 830 G8 is a great subnotebook with 5G, but you should avoid the SureView panel
HP EliteBook 850 G8 3C7Z8EA: Intel Iris Xe Graphics G7 96EUs, 15.60", 1.8 kg
» The HP EliteBook 850 G8 comes with a super bright screen and a lot of other features
MSI Modern 14 B11SB-085: NVIDIA GeForce MX450, 14.00", 1.3 kg
» For 1200 Euros (~$1420), MSI only offers working memory in single-channel mode
ADATA XPG Xenia 14: Intel Iris Xe Graphics G7 96EUs, 14.00", 1 kg
» The surprisingly good ADATA XPG Xenia 14 is now shipping starting at $1099 USD
Lenovo ThinkPad X13 G2 20WK0024GE: Intel Iris Xe Graphics G7 96EUs, 13.30", 1.3 kg
» Lenovo equips the new ThinkPad X13 G2 with 16:10 display and 5G connectivity
Lenovo ThinkPad T14s G2 20WM003TGE: Intel Iris Xe Graphics G7 96EUs, 14.00", 1.3 kg
» Lenovo should change its ThinkPad T14s to use the 16:10 format
MSI Modern 15 A11M-062: Intel Iris Xe Graphics G7 96EUs, 15.60", 1.6 kg
» MSI Modern 15 A11M: Updated office laptop
Schenker Vision 14: Intel Iris Xe Graphics G7 96EUs, 14.00", 1 kg
» The Schenker Vision 14 shows, what a modern Ultrabook should look like
Lenovo ThinkPad P15s Gen2-20W6000GGE: NVIDIA T500 Laptop GPU, 15.60", 1.9 kg
» Lenovo ThinkPad P15s G2: Workstations with ULV CPUs are getting better and better
HP Pavilion 15-eg: NVIDIA GeForce MX450, 15.60", 1.7 kg
» Nvidia gave laptop makers a useless overblown GeForce MX450 3DMark score that has proven impossible to reach
Lenovo ThinkPad X13 Yoga G2: Intel Iris Xe Graphics G7 96EUs, 13.30", 1.2 kg
» Convertibles like the ThinkPad X13 Yoga Gen 2 benefit a lot from 16:10 displays
LG Gram 16 (2021): Intel Iris Xe Graphics G7 96EUs, 16.00", 1.2 kg
» LG Gram 16 (2021): 16:10 display, room for two NVMe SSDs, Thunderbolt 4/USB 4
HP Spectre x360 14-ea0378ng: Intel Iris Xe Graphics G7 96EUs, 13.50", 1.3 kg
» HP Spectre x360 14: Stylus, great keyboard, 3:2 OLED screen
Asus ZenBook 13 UX325EA: Intel Iris Xe Graphics G7 96EUs, 13.30", 1.2 kg
» ZenBook 13 in review: Is it better to go with Ryzen or with Intel Core? There are good arguments for both.
Honor Magicbook 14 i7-1165G7: Intel Iris Xe Graphics G7 96EUs, 14.00", 1.4 kg
» Honor MagicBook 14 (2021): What does the Tiger Lake upgrade bring us?
MSI Summit B15 A11M: Intel Iris Xe Graphics G7 96EUs, 15.60", 1.5 kg
» MSI Summit B15 is basically a Modern 15 but with Thunderbolt 4 support
ADATA XPG Xenia Xe: Intel Iris Xe Graphics G7 96EUs, 15.60", 1.7 kg
» We ran 3DMark on over 40 different 11th gen Core i7 Iris Xe laptops: These are the slowest and fastest models you can buy
Lenovo ThinkPad X1 Carbon G9-20XWCTO1WW: Intel Iris Xe Graphics G7 96EUs, 14.00", 1.2 kg
» X1 Carbon Gen 9: Lenovo has to be careful with the ThinkPad keyboard
HP ProBook 440 G8-2W1G4EA: Intel Iris Xe Graphics G7 96EUs, 14.00", 1.4 kg
» HP ProBook 440 G8: Solid office laptop with some potential for expansion
Lenovo ThinkPad X1 Yoga G6-20Y0S00200: Intel Iris Xe Graphics G7 96EUs, 14.00", 1.4 kg
» The ThinkPad X1 Yoga G6 is a very good Business Convertible, but there are still some software issues
HP ZBook Firefly 15 G8 2C9R7EA: NVIDIA T500 Laptop GPU, 15.60", 1.8 kg
» HP ZBook Firefly 15 G8: Now with more performance but also with higher heat development
Intel NUC11PHKi7C: NVIDIA GeForce RTX 2060 Mobile, 1.4 kg
» 100 W Core i7-8809G vs. 28 W Core i7-1165G7: Can Tiger Lake outperform the exotic Intel-AMD chipset?
Lenovo ThinkPad X1 Yoga G6-20Y0S00200: Intel Iris Xe Graphics G7 96EUs, 14.00", 1.4 kg
» The ThinkPad X1 Yoga G6 has arrived: Better than the X1 Titanium Yoga?!
HP ZBook Firefly 14 G8 2C9Q2EA: NVIDIA T500 Laptop GPU, 14.00", 1.4 kg
» HP ZBook Firefly 14 G8: How much better can an entry-level workstation get?
LG Gram 16 2-in-1 16T90P: Intel Iris Xe Graphics G7 96EUs, 16.00", 1.5 kg
» LG Gram 16 2-in-1 is bigger and lighter than the HP Spectre x360 15, but there's a catch
Lenovo Yoga Slim 7i Carbon 13 ITL: Intel Iris Xe Graphics G7 96EUs, 13.30", 1 kg
» The Lenovo Yoga Slim 7i Carbon is the lightest Yoga laptop to date
Huawei MateBook X Pro 2021: Intel Iris Xe Graphics G7 96EUs, 13.90", 1.3 kg
» It's time for Huawei to drop that problematic keyboard webcam from its MateBook and MagicBook laptops
Dell Inspiron 14 7400-VY8JW: NVIDIA GeForce MX350, 14.50", 1.3 kg
» Dell Inspiron 14 7400: Tiger Lake processor plus a good screen equals a great laptop
Aorus Gaming Box GeForce RTX 2080 Ti: , 3.8 kg
» Aorus Gaming Box eGPU makes a pretty strong case for Thunderbolt over the proprietary Asus ROG XG Mobile alternative
Lenovo ThinkPad E15 Gen2-20TD002MGE: NVIDIA GeForce MX450, 15.60", 1.8 kg
» Lenovo ThinkPad E15 Gen 2: Who would like some Intel, who needs AMD?
Intel NUC11PAQi7: Intel Iris Xe Graphics G7 96EUs, 0.6 kg
» The fastest Core i7-1165G7 PC available is now over two times faster than the slowest Core i7-1165G7 laptop
Lenovo ThinkPad E14 Gen2-20TA000DGE: Intel Iris Xe Graphics G7 96EUs, 14.00", 1.6 kg
» Lenovo ThinkPad E14 Gen 2 shows off the potential of Intel Tiger Lake-H35 CPUs
Asus ZenBook Duo 14 UX482EA: Intel Iris Xe Graphics G7 96EUs, 14.00", 1.6 kg
» Asus' unique ZenBook Duo ScreenPad is getting better, but it's not quite there just yet
Lenovo IdeaPad Slim 9i 14ITL5: Intel Iris Xe Graphics G7 96EUs, 14.00", 1.3 kg
» Lenovo IdeaPad Slim 9i Core i7-1165G7 has slower CPU performance than the Yoga 9i Core i5-1135G7
Lenovo ThinkBook 14s Yoga ITL 20WE0023GE: Intel Iris Xe Graphics G7 96EUs, 14.00", 1.5 kg
» DDR4-3200 RAM limits Tiger Lake graphics performance - a review of the Lenovo ThinkBook 14s Yoga ITL
Asus Zenbook 14 UX435EG: NVIDIA GeForce MX450, 14.00", 1.3 kg
» 12-Watt GeForce MX450 beats the 25-Watt GeForce-MX350 - Testing the Asus ZenBook 14 UX435EG
Dell Inspiron 15 7000 7506 2-in-1 Black Edition: Intel Iris Xe MAX Graphics, 15.60", 1.9 kg
» That awkward moment when a Core i5-1135G7 can outperform the more expensive Core i7-1165G7
Asus VivoBook S15 S533EQ-BQ002T: NVIDIA GeForce MX350, 15.60", 1.8 kg
» The Asus VivoBook S15 S533EQ comes with a Thunderbolt 4 port
HP Spectre x360 14t-ea000: Intel Iris Xe Graphics G7 96EUs, 13.50", 1.3 kg
» HP Spectre x360 14 renders the Spectre x360 13 almost obsolete, paves the way for potential 3:2 EliteBooks
Dell XPS 13 9310 Core i7 FHD: Intel Iris Xe Graphics G7 96EUs, 13.40", 1.3 kg
» Razer Book 13 vs. Dell XPS 13 9310: Same CPU, Same Display, Big Differences
HP Pavilion 13-bb0015cl: Intel Iris Xe Graphics G7 96EUs, 13.30", 1.2 kg
» The cheap HP Pavilion isn't that bad of a deal anymore
Razer Book 13 FHD: Intel Iris Xe Graphics G7 96EUs, 13.40", 1.4 kg
» Razer Book 13 and Intel NUC M15 are the fastest laptops thus far with the 11th gen Core i7-1165G7 CPU
Schenker Vision 15: Intel Iris Xe Graphics G7 96EUs, 15.60", 1.7 kg
» The Schenker Vision 15 (Intel NUC M15) is the best Tiger Lake implementation so far
Dell XPS 13 9310 Core i7 FHD: Intel Iris Xe Graphics G7 96EUs, 13.40", 1.3 kg
» Tiger Lake Dell XPS 13 9310 vs. Asus ZenBook 14 UX425EA: the Dynamic Power Policy difference
Asus ZenBook Flip S UX371: Intel Iris Xe Graphics G7 96EUs, 13.30", 1.2 kg
» The Asus ZenBook UX371 with the OLED Panel need some fine-tuning
Asus ZenBook 14 UX425EA: Intel Iris Xe Graphics G7 96EUs, 14.00", 1.2 kg
» Intel Iris Xe G7 graphics isn't so bad, but it still has a long way to go in terms of drivers and compatibility
Asus ExpertBook B9 B9400CE-KC0166R: Intel Iris Xe Graphics G7 96EUs, 14.00", 1 kg
» Dear manufacturers, users want better web cameras!