Reviews for the Intel Core i9-13900H processor
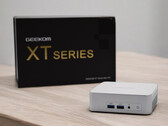
Geekom XT13 Pro review: NUC mini-PC does without Meteor Lake and only gets an Intel Core i9-13900H
Geekom has presented the XT13 Pro as a powerful NUC mini-PC based on an Intel Core i9-13900H. This means that Intel's Meteor Lake processors are still left out. We have analyzed how well the high-end model of the Raptor Lake H series performs against the newer processors using numerous measurements and benchmarks.
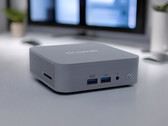
Intel Core i9-13900H, Iris Xe G7 96EUs, 555 gGeekom GT13 Pro mini-PC review - Stylish NUC alternative with Intel Core i9-13900H, 32 GB DDR4 RAM and 2 TB SSD
Geekom's GT13 Pro follows on from the existing model range with a stylish design. The Intel Core i9-13900H promises a lot, but in this detailed review, we take a closer look at how well the high-end SoC performs in the small 0.5 liter case. With 32 GB RAM and a 2 TB SSD, the mini PC is well equipped, which is also reflected in the connections with two USB4 ports.
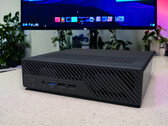
Intel Core i9-13900H, Iris Xe G7 96EUs, 440 gWorkstation review: Minisforum MS-01 debuts with Intel Core i9-13900H, but lacks a dedicated graphics card ex-works
According to the manufacturer, the Minisforum MS-01 is a workstation for performance-hungry workloads. Equipped with an Intel Core i9-13900H as well as fast DDR5 RAM, it can accommodate several SSDs in the device - all this sounds promising. The MS-01 also has a physical PCIe x16 interface for installing expansion cards. In this review, we explore the question of whether Minisforum has succeeded in creating a powerful workstation or whether it is just a simple mini-PC for everyday use.
Intel Core i9-13900H, Iris Xe G7 96EUs, 1.5 kgAsus VivoBook S15 BAPE laptop review: A supremely powerful OLED laptop? Or will the special edition come a cropper?
The Asus VivoBook S15 OLED BAPE Edition stands out - not only because of its design but also due to what's included in the box. Dive into our "A Bathing Ape" laptop review and discover whether the multimedia machine, its OLED display and Intel Core i9-13900H manage to impress in everyday use.
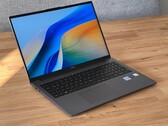
Intel Core i9-13900H, Iris Xe G7 96EUs, 15.6", 1.6 kgHuawei MateBook D 16 2024 review - A multimedia laptop now with the Intel Core i9-13900H
Huawei has equipped the 2024 model of its multimedia laptop, the MateBook D 16, with an Intel Core i9-13900H processor. However, it is held back by its power limits. Severe cuts have been made, especially regarding the ports but, by contrast, the battery life has improved.
Intel Core i9-13900H, Iris Xe G7 96EUs, 16", 1.7 kgGeekom Mini IT13: Intel Iris Xe Graphics G7 96EUs, 0.7 kg
Review » Geekom Mini IT13 Mini PC Review - Mini Desktop with an overkill Core i9
MSI Stealth 16 Mercedes-AMG Motorsport A13VG: NVIDIA GeForce RTX 4070 Laptop GPU, 16.00", 1.9 kg
Review » MSI Stealth 16 Mercedes-AMG Motorsport laptop in review: Mobile racing car with OLED display
Asus VivoBook Pro 16 K6602VU: NVIDIA GeForce RTX 4050 Laptop GPU, 16.00", 1.9 kg
Review » Asus VivoBook Pro 16 (2023) Laptop Review: Core i9-13900H, RTX 4050, and 3.2K OLED augur well for hobbyist creators
Schenker XMG Pro 16 Studio (Mid 23): NVIDIA GeForce RTX 4070 Laptop GPU, 16.00", 2.6 kg
Review » XMG Pro 16 Studio (Mid 23) review: The RTX 4070 laptop for gamers and creators
Lenovo ThinkPad P1 G6-21FV000DGE: NVIDIA RTX 2000 Ada Generation Laptop, 16.00", 1.9 kg
Review » Lenovo ThinkPad P1 G6 laptop in review - Mobile workstation replaces the ThinkPad X1 Extreme
Dell Precision 5480: NVIDIA RTX 3000 Ada Generation Laptop, 14.00", 1.6 kg
Review » Nvidia RTX 3000 Ada performance debut: Dell Precision 5480 workstation review
Dell Precision 5000 5680: NVIDIA RTX 5000 Ada Generation Laptop, 16.00", 2.3 kg
Review » Dell Precision 5680 review: Ada Lovelace dominates on workstations
Lenovo Legion Slim 7i 16 Gen 8: NVIDIA GeForce RTX 4070 Laptop GPU, 16.00", 2.1 kg
Review » Lenovo Legion Slim 7i 16 Gen 8 laptop review: Slimmer than the Razer Blade 16
Asus ZenBook 14X UX3404VC: Intel Iris Xe Graphics G7 96EUs, 14.50", 1.6 kg
Review » Asus ZenBook 14X (2023) laptop review: OLED ultrabook at its limit
Huawei MateBook 16s i9: Intel Iris Xe Graphics G7 96EUs, 16.00", 2 kg
Review » Huawei MateBook 16s 2023 review - Multimedia laptop now with a brighter 3:2 display
Asus ROG Flow X16 GV601V: NVIDIA GeForce RTX 4060 Laptop GPU, 16.00", 2.1 kg
Review » The slim Asus ROG Flow X16 laptop review: A powerful, 16-inch gaming workstation 2-in-1 with a touchscreen display
Asus Zenbook Pro 14 OLED UX6404VI: NVIDIA GeForce RTX 4070 Laptop GPU, 14.50", 1.7 kg
Review » Asus Zenbook Pro 14 OLED laptop review: MacBook Pro rival with 120 Hz OLED display
Asus ZenBook Pro 14 Duo UX8402VV-P1021W: NVIDIA GeForce RTX 4060 Laptop GPU, 14.50", 1.8 kg
Review » Asus ZenBook Pro 14 Duo laptop review with second display for creatives: Increased productivity
Samsung Galaxy Book3 Ultra 16, i9-13900H RTX 4070: NVIDIA GeForce RTX 4070 Laptop GPU, 16.00", 1.8 kg
Review » Samsung Galaxy Book3 Ultra 16 with RTX 4070 in review: High graphics performance in a business-like notebook
Asus ROG Flow Z13 GZ301V: NVIDIA GeForce RTX 4060 Laptop GPU, 13.40", 1.6 kg
Review » Asus ROG Flow Z13 in review: Madness - RTX 4060 in an impressive gaming tablet
MSI Stealth 17 Studio A13VH-014: NVIDIA GeForce RTX 4080 Laptop GPU, 17.30", 3 kg
Review » MSI Stealth 17 Studio review: A laptop with a quiet RTX 4080 for almost every occasion
Asus ROG Flow Z13 ACRNM: NVIDIA GeForce RTX 4070 Laptop GPU, 13.40", 1.7 kg
Review » Asus ROG Flow Z13 ACRNM Review - Gaming Convertible with RTX 4070 Laptop
Asus ROG Zephyrus M16 GU604VY-NM042X: NVIDIA GeForce RTX 4090 Laptop GPU, 16.00", 2.3 kg
Review » Asus ROG Zephyrus M16 (2023) laptop review: RTX 4090 with a super bright, Mini-LED display
Gigabyte AERO 16 OLED BSF: NVIDIA GeForce RTX 4070 Laptop GPU, 16.00", 2.1 kg
Review » Slim Gigabyte AERO 16 OLED laptop review: Efficient RTX 4070 for gamers and creatives
MSI Modern 14 H D13MG: Intel Iris Xe Graphics G7 96EUs, 14.00", 1.6 kg
External Review » MSI Modern 14 H D13MG
Acer Nitro V 15 ANV15-51, i9-13900H: NVIDIA GeForce RTX 4060 Laptop GPU, 15.60", 2.1 kg
External Review » Acer Nitro V 15 ANV15-51, i9-13900H
Infinix GT Book 16: NVIDIA GeForce RTX 4060 Laptop GPU, 16.00", 2 kg
External Review » Infinix GT Book 16
Asus Vivobook S 14 Flip TP3402VA, i9-13900H: Intel Iris Xe Graphics G7 96EUs, 14.00", 1.5 kg
External Review » Asus Vivobook S 14 Flip TP3402VA, i9-13900H
Lenovo Legion Slim 7 16IRH8, i9-13900H RTX 4070: NVIDIA GeForce RTX 4070 Laptop GPU, 16.00", 2 kg
External Review » Lenovo Legion Slim 7 16IRH8, i9-13900H RTX 4070
Huawei MateBook D 16 2024: Intel Iris Xe Graphics G7 96EUs, 16.00", 1.7 kg
External Review » Huawei MateBook D 16 2024
MSI Modern 15 H B13M: Intel Iris Xe Graphics G7 96EUs, 15.60", 1.9 kg
External Review » MSI Modern 15 H B13M
Dell XPS 17 9730, i9-13900H: NVIDIA GeForce RTX 4070 Laptop GPU, 17.00", 2.4 kg
External Review » Dell XPS 17 9730, i9-13900H
Lenovo ThinkPad P1 G6-21FV000DGE: NVIDIA RTX 2000 Ada Generation Laptop, 16.00", 1.9 kg
External Review » Lenovo ThinkPad P1 G6-21FV000DGE
Asus Vivobook S 14 OLED K5404VA: Intel Iris Xe Graphics G7 96EUs, 14.50", 1.5 kg
External Review » Asus Vivobook S 14 OLED K5404VA
Asus VivoBook Pro 16 OLED K6602V: NVIDIA GeForce RTX 4050 Laptop GPU, 16.00", 1.9 kg
External Review » Asus VivoBook Pro 16 OLED K6602V
Dell Precision 5480: NVIDIA RTX 3000 Ada Generation Laptop, 14.00", 1.6 kg
External Review » Dell Precision 5480
Asus TUF Gaming F17 FX707VV: NVIDIA GeForce RTX 4060 Laptop GPU, 17.30", 2.6 kg
External Review » Asus TUF Gaming F17 FX707VV
Asus VivoBook S15 OLED K5504, i9-13900H: Intel Iris Xe Graphics G7 96EUs, 15.60", 1.8 kg
External Review » Asus VivoBook S15 OLED K5504, i9-13900H
MSI Stealth 16 Studio A13VF, i9-13900H: NVIDIA GeForce RTX 4060 Laptop GPU, 16.00", 2 kg
External Review » MSI Stealth 16 Studio A13VF, i9-13900H
Asus ZenBook 14X OLED UX3404VA, i9-13900H: Intel Iris Xe Graphics G7 96EUs, 14.50", 1.6 kg
External Review » Asus ZenBook 14X OLED UX3404VA, i9-13900H
HP Zbook Power G10: NVIDIA RTX 3000 Ada Generation Laptop, 15.60", 2 kg
External Review » HP Zbook Power G10
Asus VivoBook 16X OLED K3605VV: NVIDIA GeForce RTX 4060 Laptop GPU, 16.00", 1.8 kg
External Review » Asus VivoBook 16X OLED K3605VV
Asus Vivobook 17X K3704VA: Intel Iris Xe Graphics G7 96EUs, 17.30", 2.1 kg
External Review » Asus Vivobook 17X K3704VA
Asus ZenBook Pro 16X OLED UX7602BZ: NVIDIA GeForce RTX 4080 Laptop GPU, 16.00", 2.2 kg
External Review » Asus ZenBook Pro 16X OLED UX7602BZ
Dell Precision 5000 5680: NVIDIA RTX 5000 Ada Generation Laptop, 16.00", 2.3 kg
External Review » Dell Precision 5000 5680
MSI Stealth 17 Studio A13VI, i9-13900H: NVIDIA GeForce RTX 4090 Laptop GPU, 17.30", 2.8 kg
External Review » MSI Stealth 17 Studio A13VI, i9-13900H
Asus ZenBook Pro 14 Duo UX8402VV-P1021W: NVIDIA GeForce RTX 4060 Laptop GPU, 14.50", 1.8 kg
External Review » Asus ZenBook Pro 14 Duo UX8402VV-P1021W
HP Envy 16-h1000: NVIDIA GeForce RTX 4060 Laptop GPU, 16.00", 2.7 kg
External Review » HP Envy 16-h1000
Origin PC EON14-S 2023: NVIDIA GeForce RTX 4070 Laptop GPU, 14.00", 1.8 kg
External Review » Origin PC EON14-S 2023
Asus Vivobook 15 OLED L1201W: Intel Iris Xe Graphics G7 96EUs, 15.60", 1.7 kg
External Review » Asus Vivobook 15 OLED L1201W
Huawei MateBook D 16 2023: Intel Iris Xe Graphics G7 96EUs, 16.00", 1.7 kg
External Review » Huawei MateBook D 16 2023
Lenovo Legion Slim 7i 16 Gen 8: NVIDIA GeForce RTX 4070 Laptop GPU, 16.00", 2.1 kg
External Review » Lenovo Legion Slim 7i 16 Gen 8
Hyperbook SL606, i9-13900H RTX 4070: NVIDIA GeForce RTX 4070 Laptop GPU, 16.00", 2.7 kg
External Review » Hyperbook SL606, i9-13900H RTX 4070
Asus ROG Flow Z13 GZ301VU: NVIDIA GeForce RTX 4050 Laptop GPU, 13.40", 1.2 kg
External Review » Asus ROG Flow Z13 GZ301VU
Asus VivoBook Pro 15 OLED K6502VU: NVIDIA GeForce RTX 4050 Laptop GPU, 15.60", 1.8 kg
External Review » Asus VivoBook Pro 15 OLED K6502VU
Asus Vivobook 14X K3405VC: NVIDIA GeForce RTX 3050 4GB Laptop GPU, 14.00", 1.4 kg
External Review » Asus Vivobook 14X K3405VC
Asus ZenBook Pro 14 Duo UX8402VU: NVIDIA GeForce RTX 4050 Laptop GPU, 14.50", 1.8 kg
External Review » Asus ZenBook Pro 14 Duo UX8402VU
Asus VivoBook Pro 16 OLED K6602VV: NVIDIA GeForce RTX 4060 Laptop GPU, 16.00", 1.9 kg
External Review » Asus VivoBook Pro 16 OLED K6602VV
Asus Zenbook Pro 14 OLED UX6404VV: NVIDIA GeForce RTX 4060 Laptop GPU, 14.50", 1.6 kg
External Review » Asus Zenbook Pro 14 OLED UX6404VV
Origin PC EVO16-S 2023: NVIDIA GeForce RTX 4070 Laptop GPU, 16.10", 2.5 kg
External Review » Origin PC EVO16-S 2023
Asus ROG Zephyrus M16 GU604VY-NM001W: NVIDIA GeForce RTX 4090 Laptop GPU, 16.00", 2.3 kg
External Review » Asus ROG Zephyrus M16 GU604VY-NM001W
Asus ROG Zephyrus M16 GU604VZ: NVIDIA GeForce RTX 4080 Laptop GPU, 16.00", 2.3 kg
External Review » Asus ROG Zephyrus M16 GU604VZ
Asus ROG Zephyrus M16 GU604VI: NVIDIA GeForce RTX 4070 Laptop GPU, 16.00", 2.3 kg
External Review » Asus ROG Zephyrus M16 GU604VI
Asus Zenbook Pro 14 OLED UX6404VI: NVIDIA GeForce RTX 4070 Laptop GPU, 14.50", 1.7 kg
External Review » Asus Zenbook Pro 14 OLED UX6404VI
Asus VivoBook 14X S3405: Intel Iris Xe Graphics G7 96EUs, 14.00", 1.4 kg
External Review » Asus VivoBook 14X S3405
MSI Pulse 15 B13VFK: NVIDIA GeForce RTX 4060 Laptop GPU, 15.60", 2.3 kg
External Review » MSI Pulse 15 B13VFK
Asus ROG Flow X16 GV601V: NVIDIA GeForce RTX 4060 Laptop GPU, 16.00", 2.1 kg
External Review » Asus ROG Flow X16 GV601V
Asus ROG Flow X16 GV601VI: NVIDIA GeForce RTX 4070 Laptop GPU, 16.00", 2.2 kg
External Review » Asus ROG Flow X16 GV601VI
MSI Stealth 17 Studio A13VH-053US: NVIDIA GeForce RTX 4080 Laptop GPU, 17.30", 2.8 kg
External Review » MSI Stealth 17 Studio A13VH-053US
Asus ROG Flow Z13 GZ301V: NVIDIA GeForce RTX 4060 Laptop GPU, 13.40", 1.6 kg
External Review » Asus ROG Flow Z13 GZ301V
Gigabyte AERO 16 OLED BSF: NVIDIA GeForce RTX 4070 Laptop GPU, 16.00", 2.1 kg
External Review » Gigabyte AERO 16 OLED BSF
Asus ROG Flow Z13 ACRNM: NVIDIA GeForce RTX 4070 Laptop GPU, 13.40", 1.7 kg
External Review » Asus ROG Flow Z13 ACRNM
Asus ROG Zephyrus G16 GU603VV-N4007W: NVIDIA GeForce RTX 4060 Laptop GPU, 16.00", 2 kg
External Review » Asus ROG Zephyrus G16 2023 GU603VV-N4007W
Asus Zenbook 14X UX3404VC-M3145X: NVIDIA GeForce RTX 3050 4GB Laptop GPU, 14.50", 1.6 kg
External Review » Asus Zenbook 14X UX3404VC-M3145X
Asus ZenBook 14X UX3404VC: Intel Iris Xe Graphics G7 96EUs, 14.50", 1.6 kg
External Review » Asus ZenBook 14X UX3404VC
Asus ROG Zephyrus M16 GU604VY-NM042X: NVIDIA GeForce RTX 4090 Laptop GPU, 16.00", 2.3 kg
External Review » Asus ROG Zephyrus M16 GU604VY-NM042X
Samsung Galaxy Book3 Ultra 16, i9-13900H RTX 4070: NVIDIA GeForce RTX 4070 Laptop GPU, 16.00", 1.8 kg
External Review » Samsung Galaxy Book3 Ultra 16, i9-13900H RTX 4070
Huawei MateBook 16s i9: Intel Iris Xe Graphics G7 96EUs, 16.00", 2 kg
External Review » Huawei MateBook 16s i9
Lenovo ThinkPad P1 G6-21FV000DGE: NVIDIA RTX 2000 Ada Generation Laptop, 16.00", 1.9 kg
» Maxed-out Lenovo ThinkPad P1 with RTX 4090, 64GB RAM and Core i9 gets 45% discount
Asus ROG Zephyrus M16 GU604VZ: NVIDIA GeForce RTX 4080 Laptop GPU, 16.00", 2.3 kg
» RTX 4080-equipped Asus ROG Zephyrus M16 with 240Hz Mini-LED display hits lowest price ever
Minisforum MS-01: Intel Iris Xe Graphics G7 96EUs, 1.5 kg
» Minisforum reveals MS-A1 high-end mini PC with up a Ryzen 7 8700G, 96 GB of memory, and OCuLink support
Asus ROG Flow X16 GV601V: NVIDIA GeForce RTX 4060 Laptop GPU, 16.00", 2.1 kg
» Asus ROG Flow X16 gaming laptop with RTX 4060 and Core i9 gets tempting $500 price cut
Asus ROG Zephyrus M16 GU604VI: NVIDIA GeForce RTX 4070 Laptop GPU, 16.00", 2.3 kg
» Stealthy Asus ROG Zephyrus M16 gaming laptop with RTX 4070 and Core i9 drops back to record-low price
Lenovo ThinkPad P1 G6-21FV000DGE: NVIDIA RTX 2000 Ada Generation Laptop, 16.00", 1.9 kg
» The ThinkPad X1 Extreme is now a thing of the past, instead, the ThinkPad P1 is now available
Schenker XMG Pro 16 Studio (Mid 23): NVIDIA GeForce RTX 4070 Laptop GPU, 16.00", 2.6 kg
» XMG Pro 16 Studio: Lots of power for gamers and creators
Lenovo ThinkPad P1 G6-21FV000DGE: NVIDIA RTX 2000 Ada Generation Laptop, 16.00", 1.9 kg
» Lenovo's ThinkPad X1 Extreme is history, from now on you only get the ThinkPad P1
Dell Precision 5000 5680: NVIDIA RTX 5000 Ada Generation Laptop, 16.00", 2.3 kg
» Dell Precision 5680 and its 165 W USB-C adapter show us what an XPS 16 could be like
Asus ROG Zephyrus M16 GU604VI: NVIDIA GeForce RTX 4070 Laptop GPU, 16.00", 2.3 kg
» Powerful Asus ROG Zephyrus M16 QHD gaming laptop with RTX 4070 and Core i9 on sale with its largest discount yet
Asus VivoBook Pro 16 OLED K6602VV: NVIDIA GeForce RTX 4060 Laptop GPU, 16.00", 1.9 kg
» 2023 Lenovo Legion Slim 5 price sees whopping 38% cut for open-box SKU with Ryzen 5 7640HS CPU and RTX 4060 GPU
Lenovo Legion Slim 7i 16 Gen 8: NVIDIA GeForce RTX 4070 Laptop GPU, 16.00", 2.1 kg
» Small attention to detail on the Lenovo Legion Slim Gen 8 solves an annoying issue on the Alienware x16 r1
Asus Zenbook Pro 14 OLED UX6404VI: NVIDIA GeForce RTX 4070 Laptop GPU, 14.50", 1.7 kg
» The Asus Zenbook Pro 14 impresses with a lot of performance and the world's first 120 Hz OLED display
Samsung Galaxy Book3 Ultra 16, i9-13900H RTX 4070: NVIDIA GeForce RTX 4070 Laptop GPU, 16.00", 1.8 kg
» A quiet and hot creator laptop: Samsung Galaxy Book3 Ultra 16 reviewed
Asus ROG Flow Z13 GZ301V: NVIDIA GeForce RTX 4060 Laptop GPU, 13.40", 1.6 kg
» This AAA gaming tablet has us convinced: Asus ROG Flow Z13 with RTX 4060 reviewed.
Asus ROG Zephyrus M16 GU604V: NVIDIA GeForce RTX 4090 Laptop GPU, 16.00", 2.3 kg
» Asus ROG Zephyrus M16 (2023) review: Neither Intel Gen 13 nor RTX 40 - OLED and Mini-LED displays are the new laptop's highlights
Gigabyte AERO 16 OLED BSF: NVIDIA GeForce RTX 4070 Laptop GPU, 16.00", 2.1 kg
» New Aero 16 OLED reviewed: OLED and new Intel/Nvidia generations on the rise