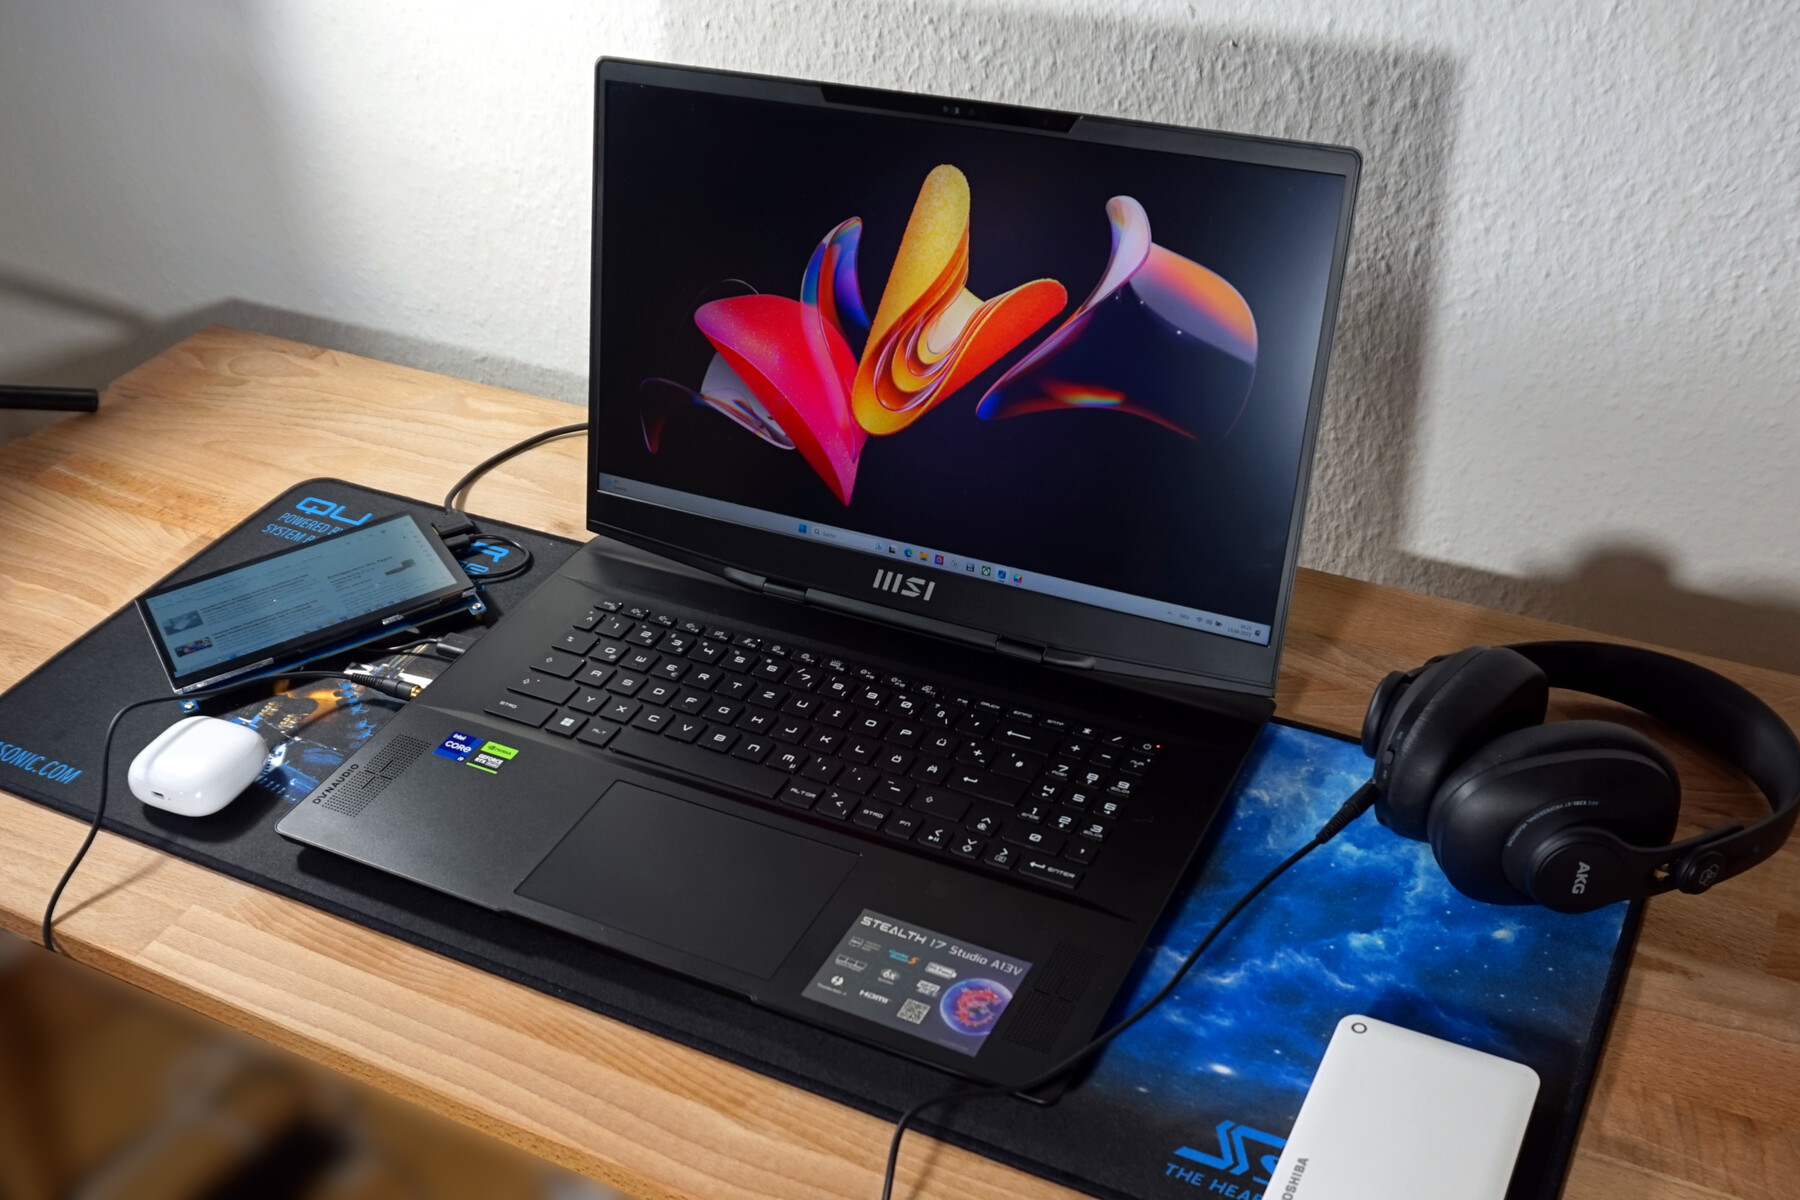
MSI Stealth 17 Studio review: A laptop with a quiet RTX 4080 for almost every occasion
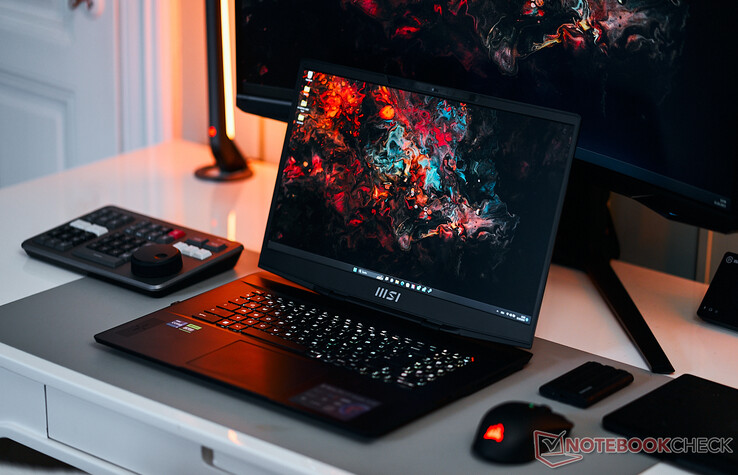
The MSI Stealth 17 Studio treads a fine line. By day, it's a comparatively sober work device: flat design, white keyboard backlighting, and hardly audible cooling noise despite extensive hardware resources and bags of power. In the evening, it turns into a potent gaming machine: The key lighting changes to a rainbow effect, the fans kick in and even demanding games almost reach 100fps.
Basically, this all seems logical. A laptop for creators which offers plenty of graphics power for fast, high-level, image and video processing. This power should also be at hand during leisure time. So MSI only had to combine the device's discreet appearance and the slimmest possible design for mobile work with a sufficiently powerful cooling system and a few light effects. Ultimately, a brilliant Mini LED display suits both worlds perfectly. Our review reveals how well it succeeds and how quiet the system is, even when dealing with fast-moving images.
It's not so easy to find competitors, as most laptops are designed for either gaming or content creation. With an Intel Core i9-13900H and an Nvidia GeForce RTX 4080, it has to be able to compete with an HP Omen 17-ck2097ng or Razer Blade 16. There's also no harm in taking a look at a multimedia laptop from last year's high-end segment such as the Gigabyte Aero 16 YE5.
Additionally, you can find a video about the MSI Stealth 17 Studio on our YouTube channel:
Possible competitors compared
Rating | Date | Model | Weight | Height | Size | Resolution | Price |
|---|---|---|---|---|---|---|---|
| 89.2 % v7 (old) | 04 / 2023 | MSI Stealth 17 Studio A13VH-014 i9-13900H, GeForce RTX 4080 Laptop GPU | 3 kg | 21.3 mm | 17.30" | 3840x2160 | |
| 91.2 % v7 (old) | 02 / 2023 | Razer Blade 16 Early 2023 i9-13950HX, GeForce RTX 4080 Laptop GPU | 2.4 kg | 21.99 mm | 16.00" | 2560x1600 | |
| 88.4 % v7 (old) | 04 / 2023 | Asus ROG Strix G17 G713PI R9 7945HX, GeForce RTX 4070 Laptop GPU | 2.8 kg | 30.7 mm | 17.30" | 2560x1440 | |
| 86 % v7 (old) | 04 / 2023 | Aorus 17X AZF i9-13900HX, GeForce RTX 4090 Laptop GPU | 2.9 kg | 21.8 mm | 17.30" | 2560x1440 | |
| 85.4 % v7 (old) | 03 / 2023 | HP Omen 17-ck2097ng i9-13900HX, GeForce RTX 4080 Laptop GPU | 2.8 kg | 27 mm | 17.30" | 2560x1440 | |
| 84.7 % v7 (old) | 03 / 2022 | Gigabyte Aero 16 YE5 i9-12900HK, GeForce RTX 3080 Ti Laptop GPU | 2.3 kg | 22.4 mm | 16.00" | 3840x2400 |
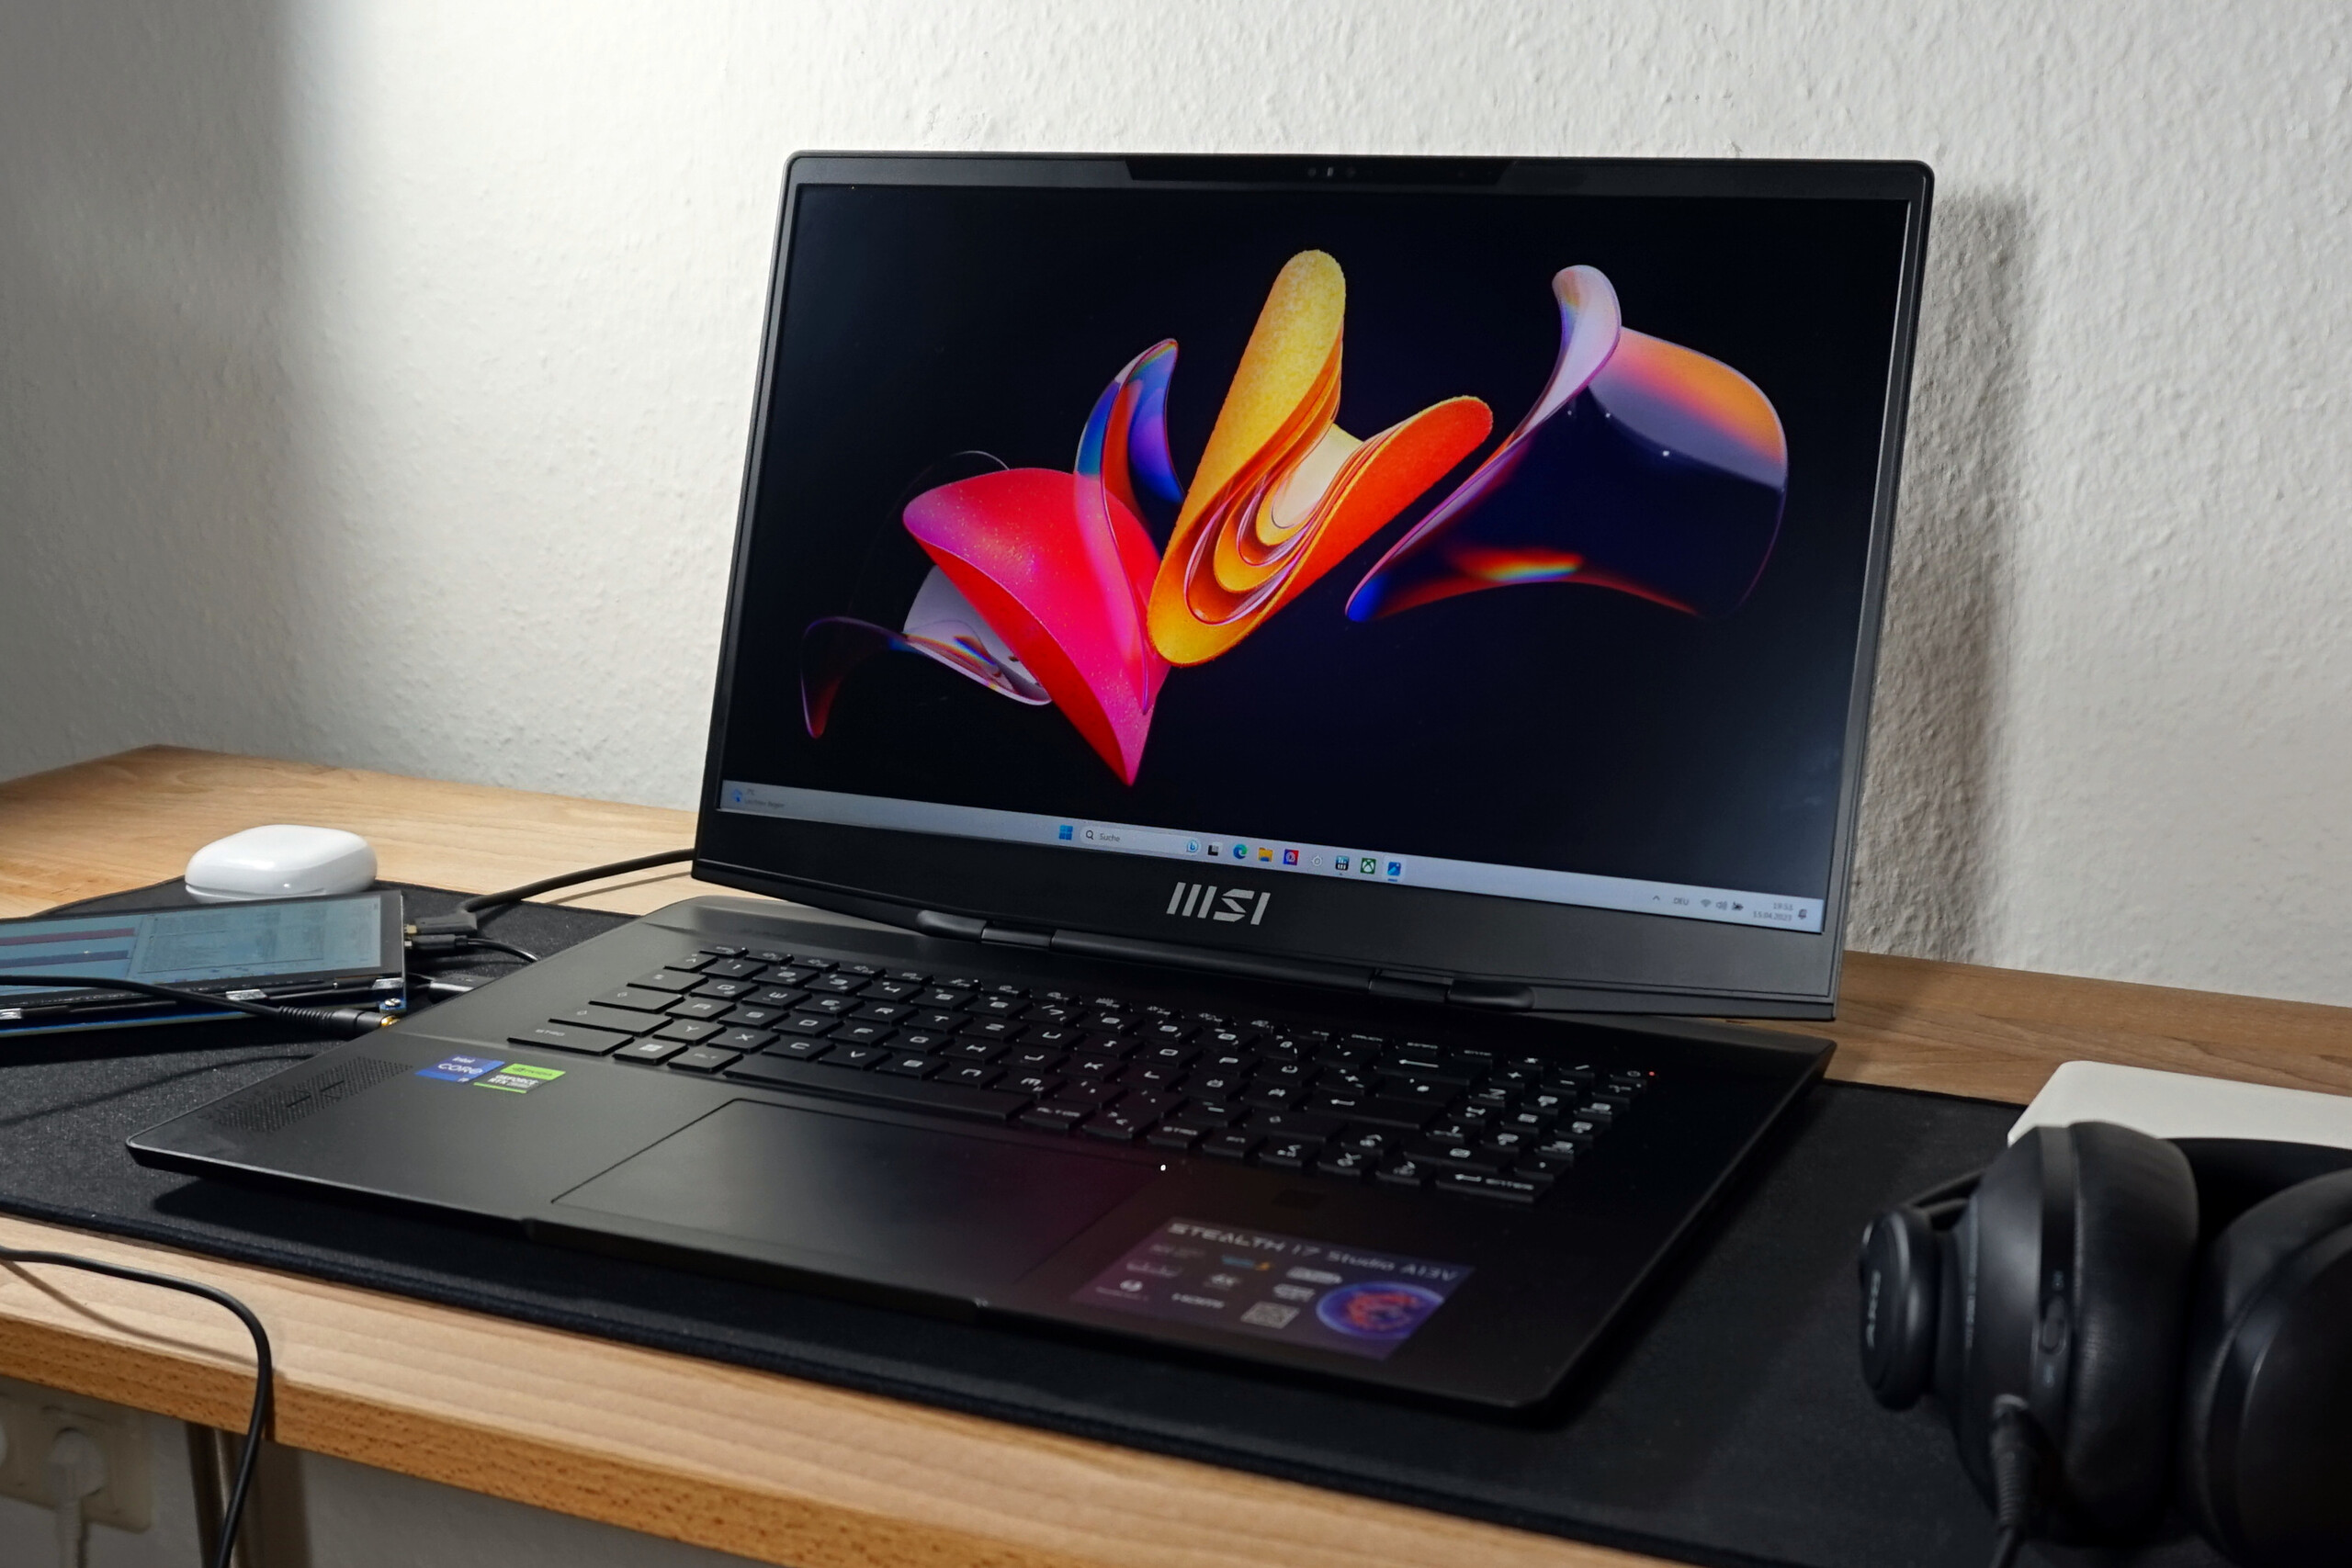
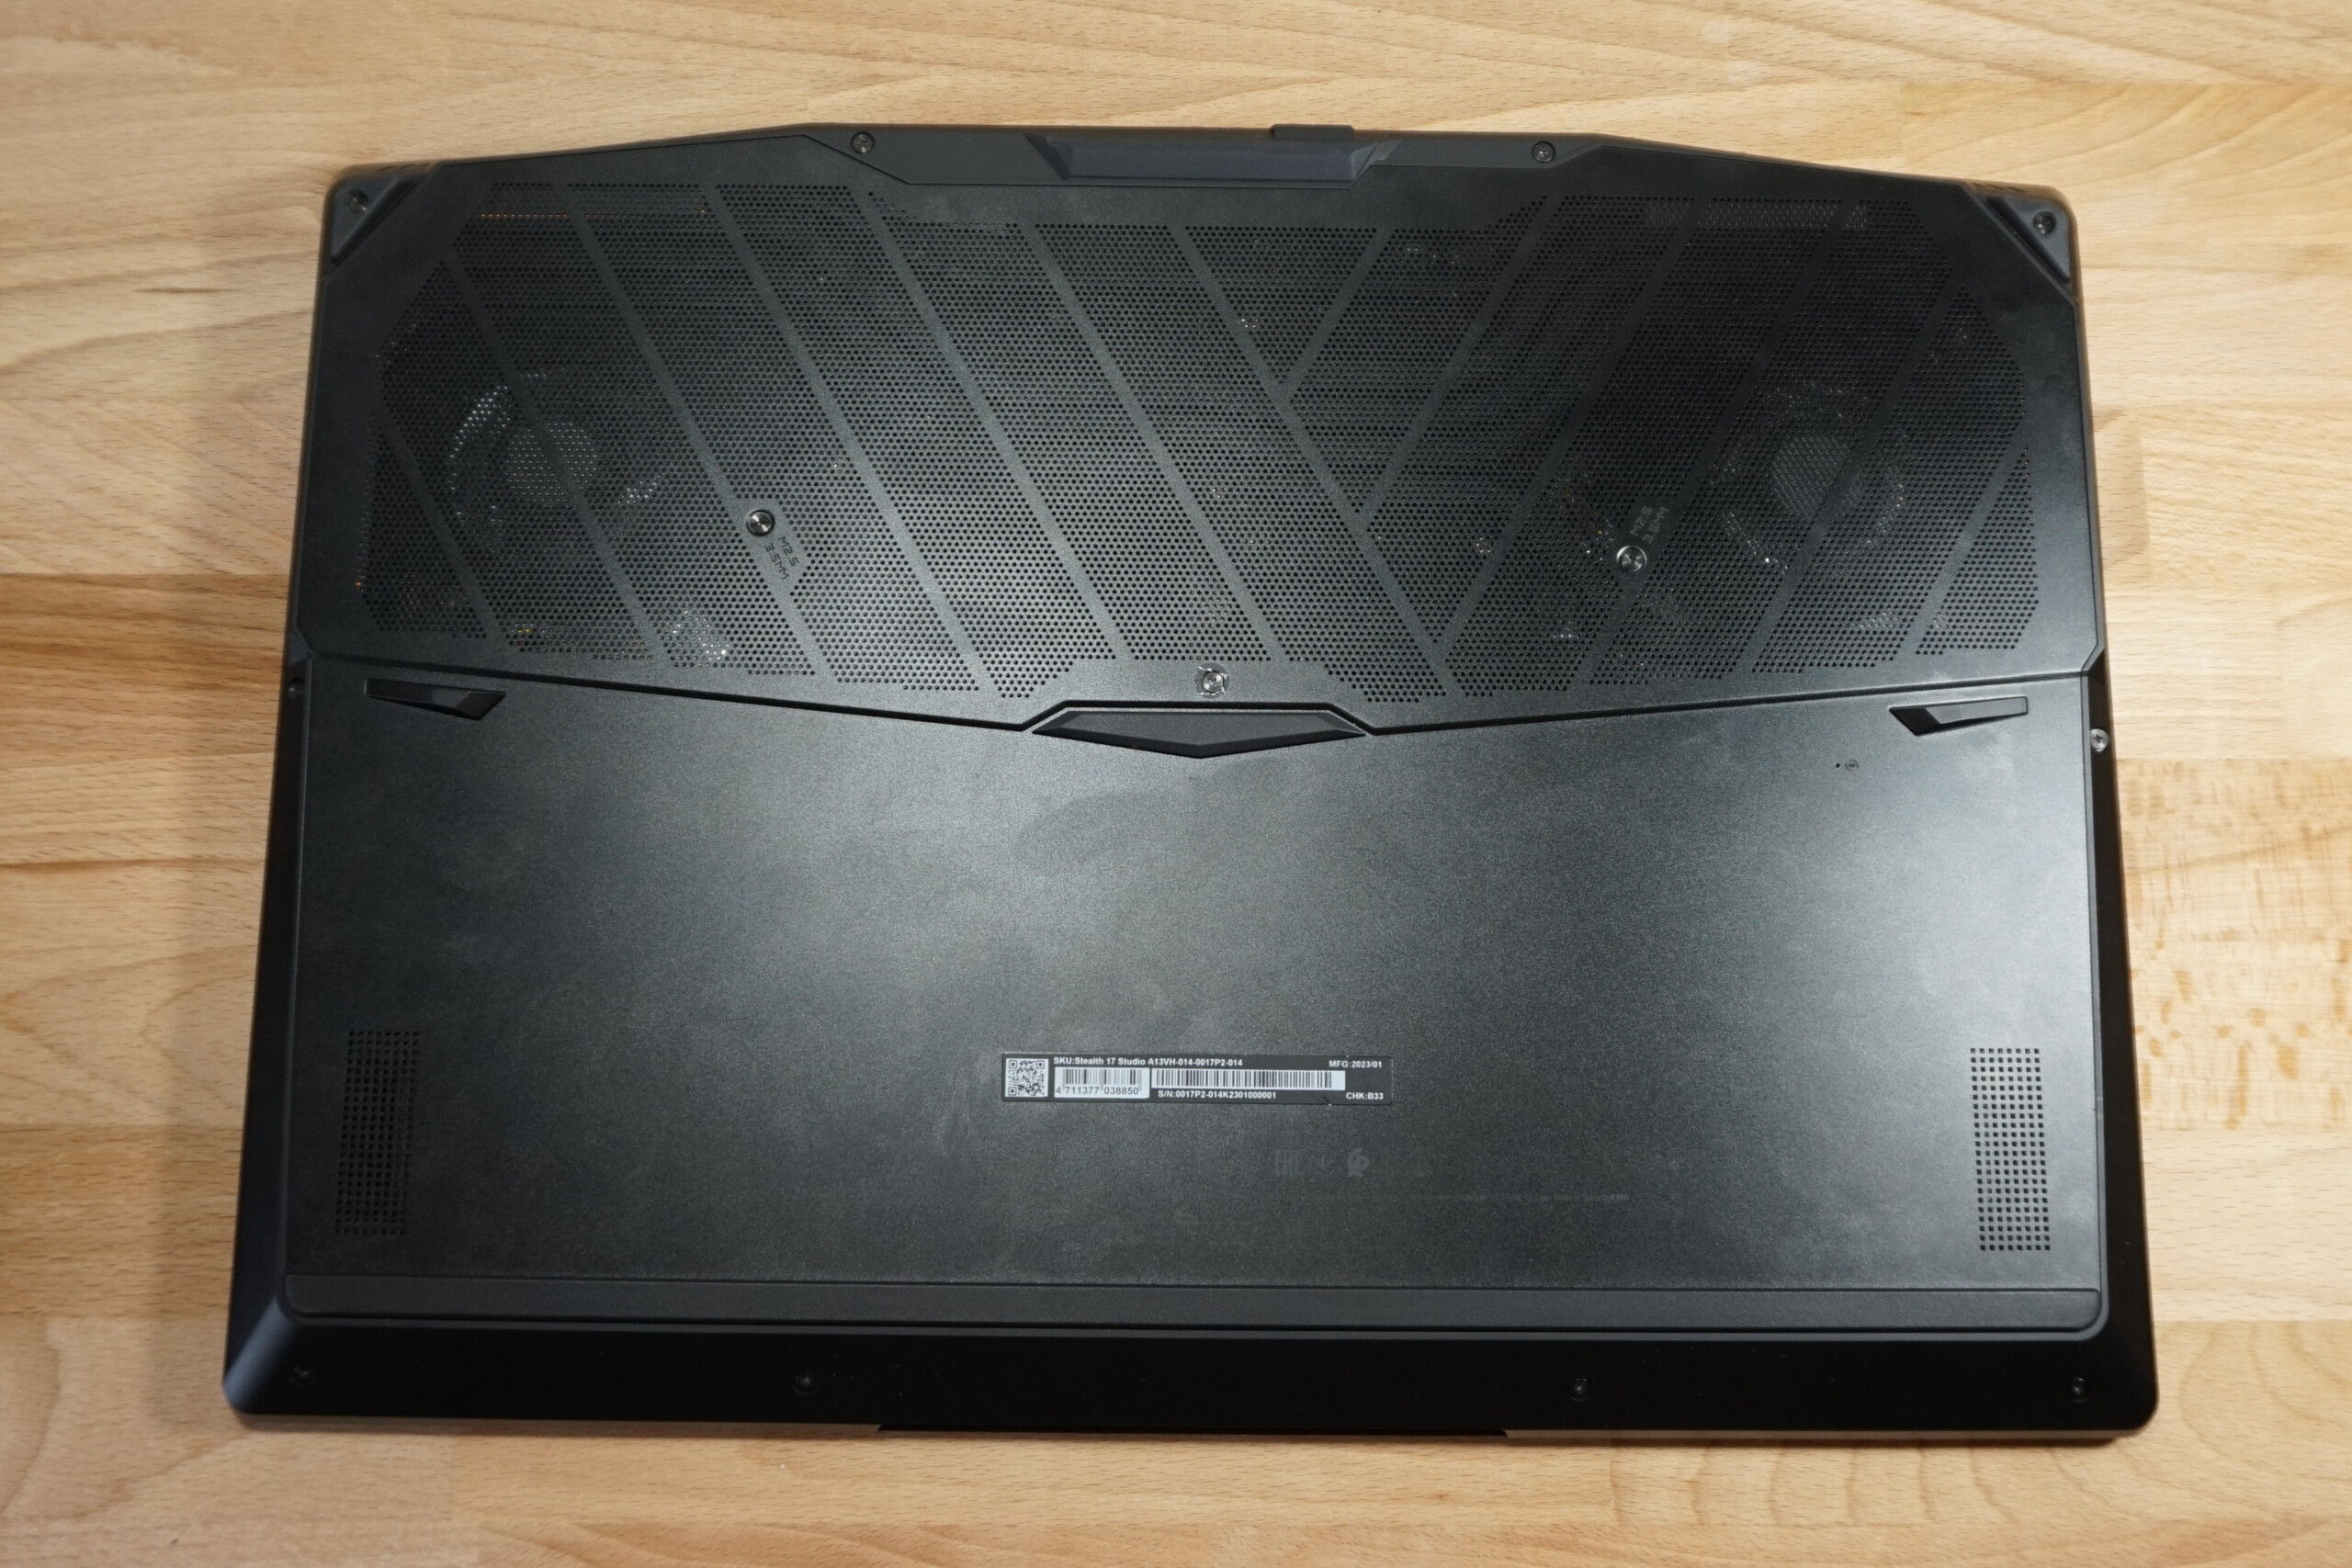
Case - A sleek, slim MSI Stealth 17
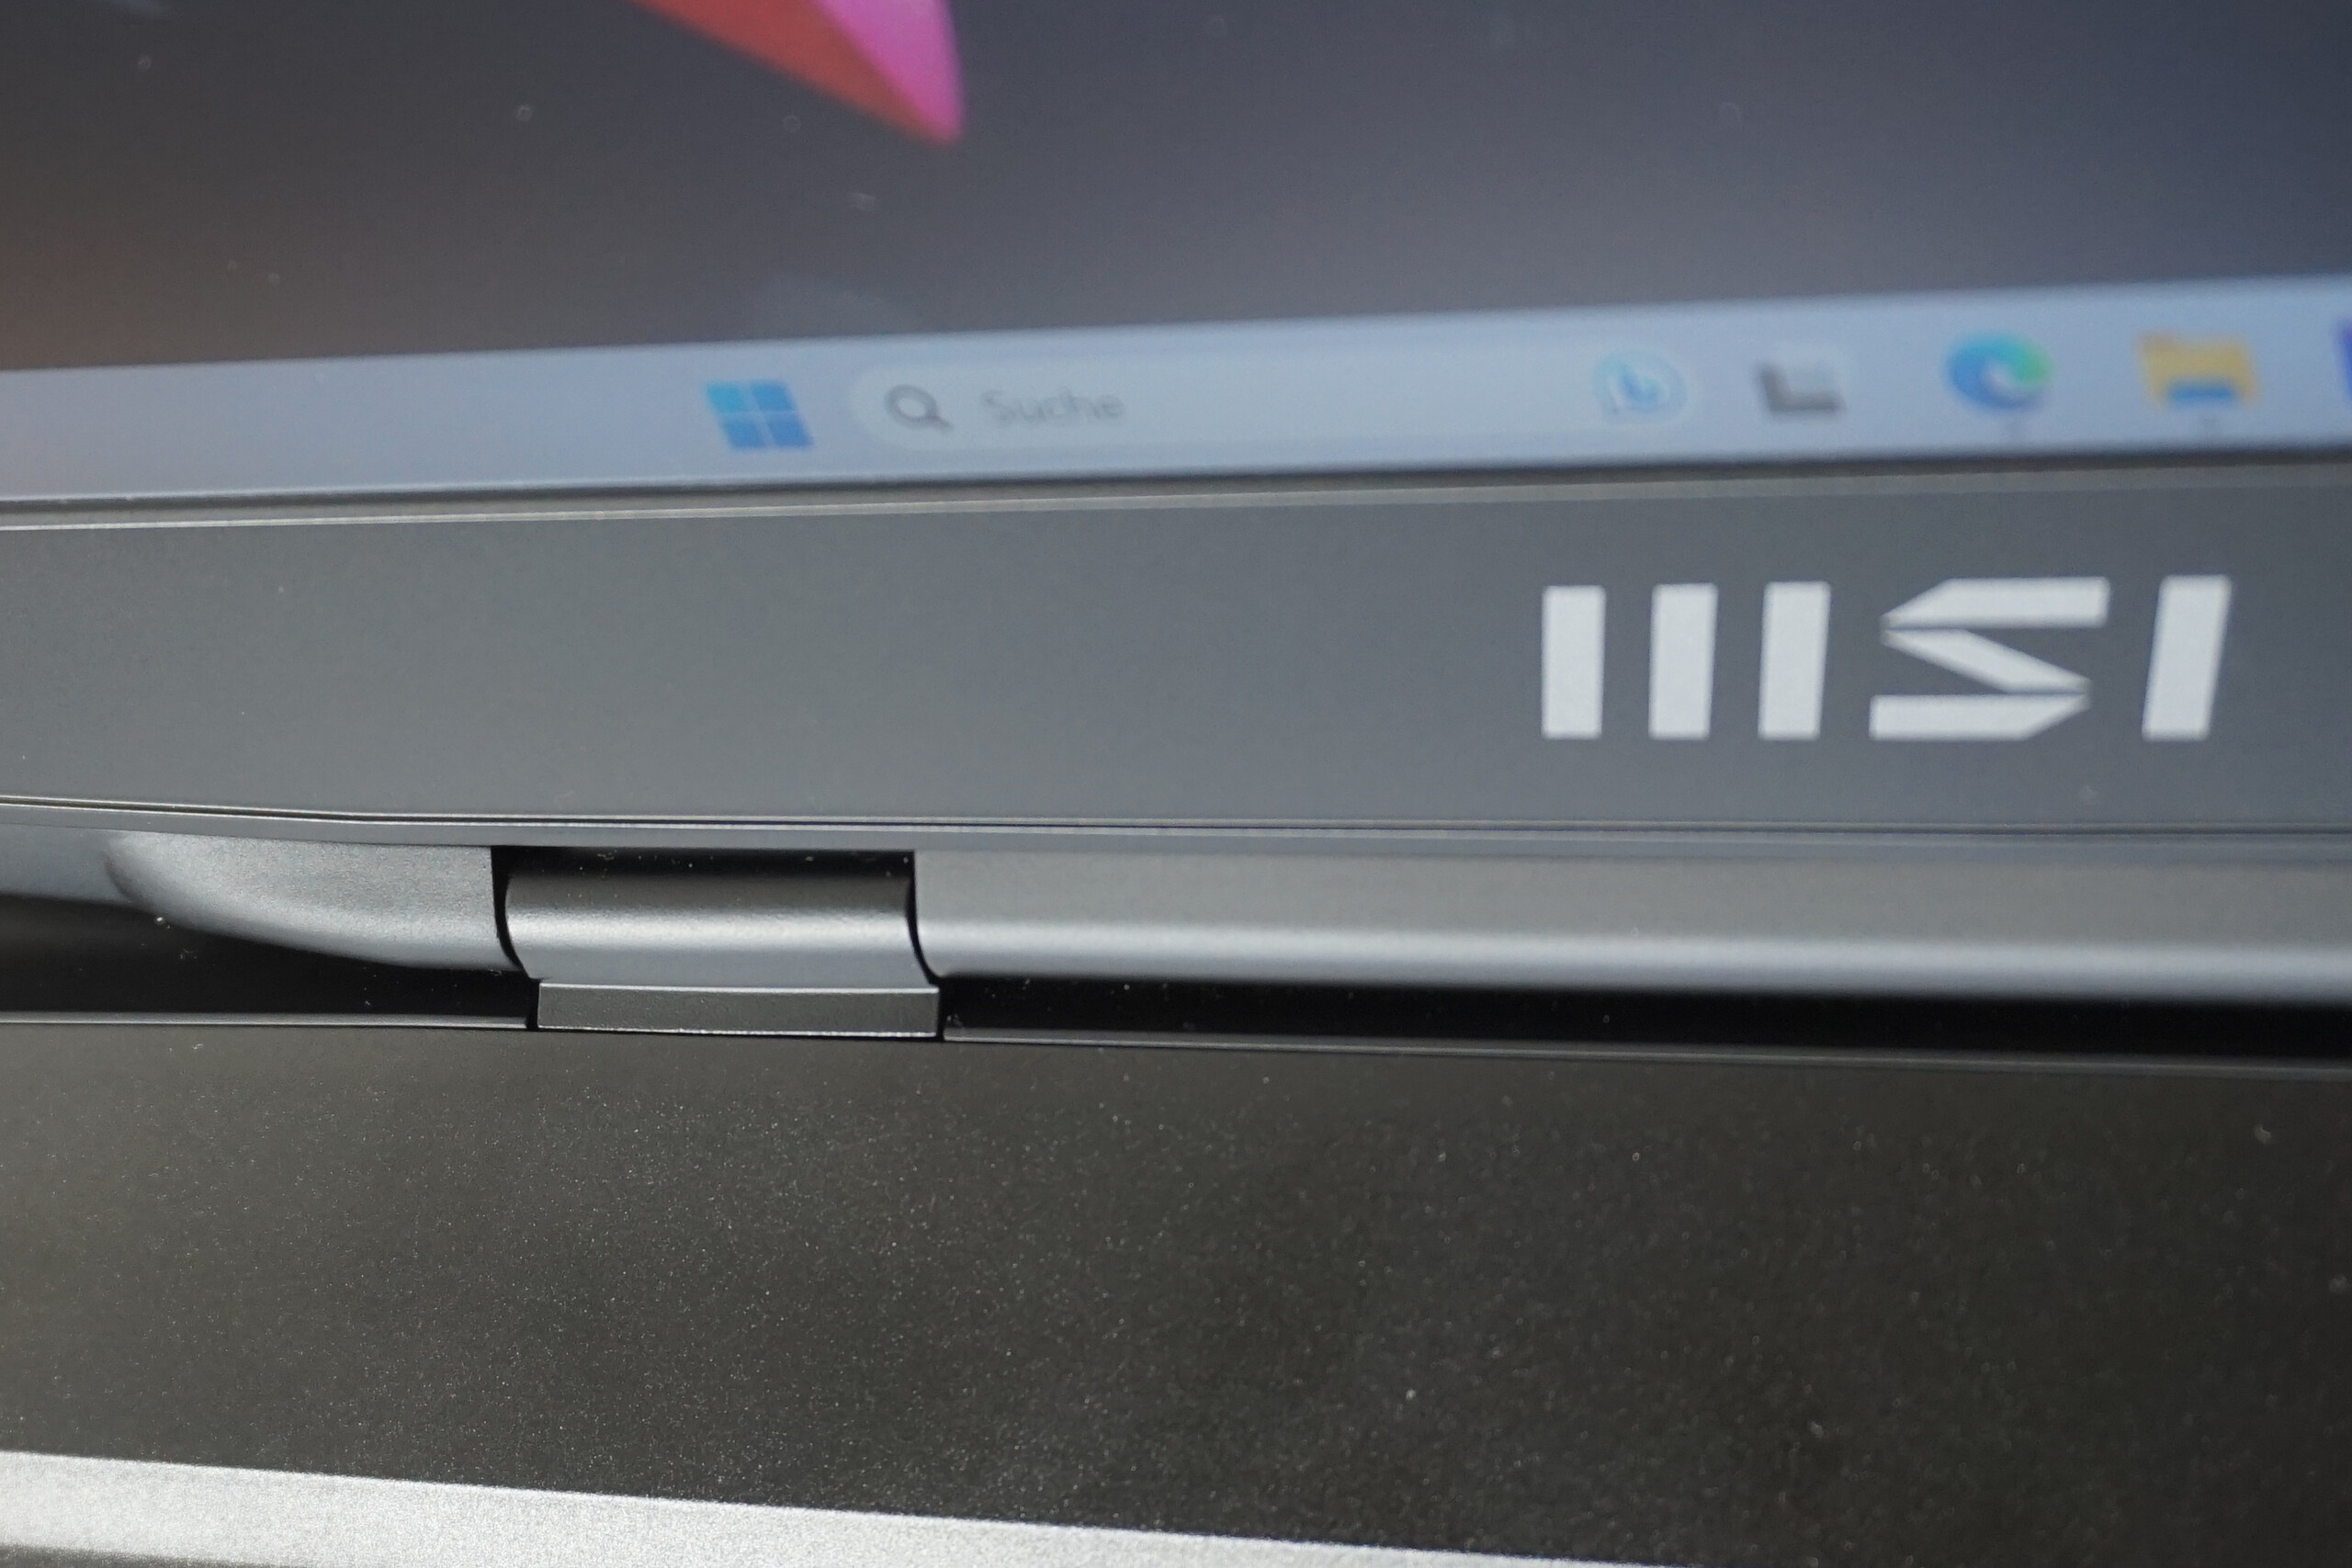
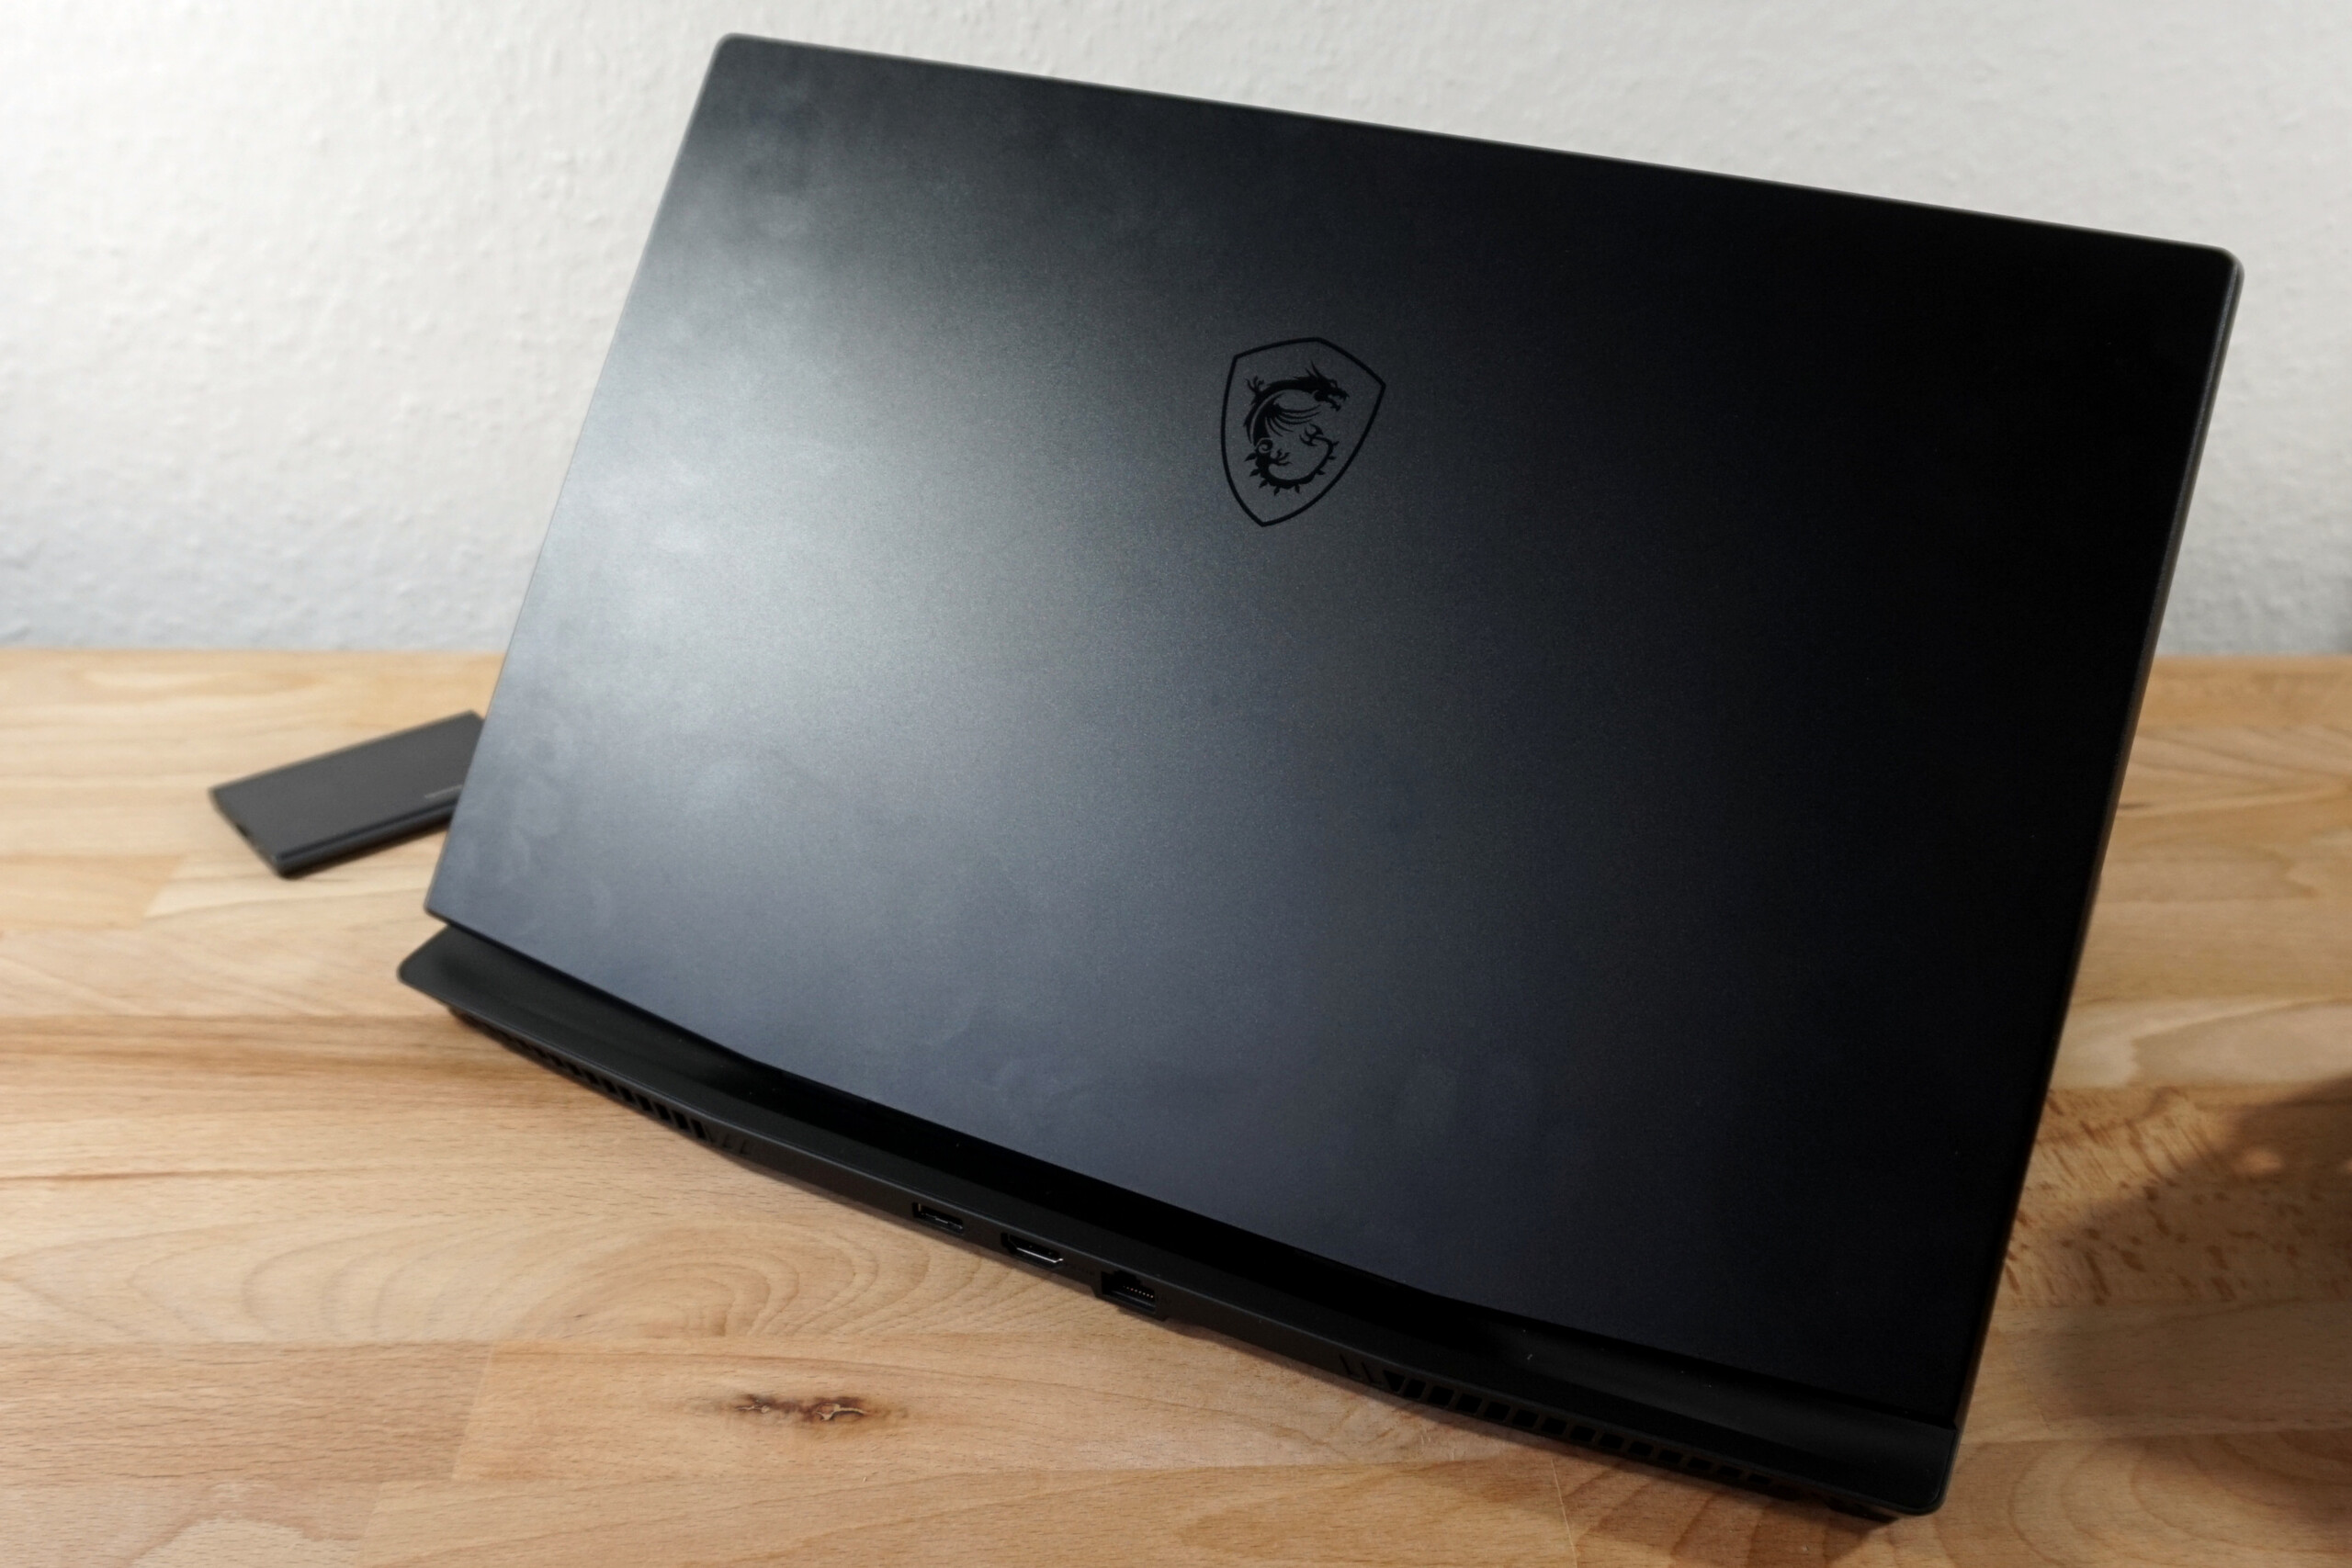
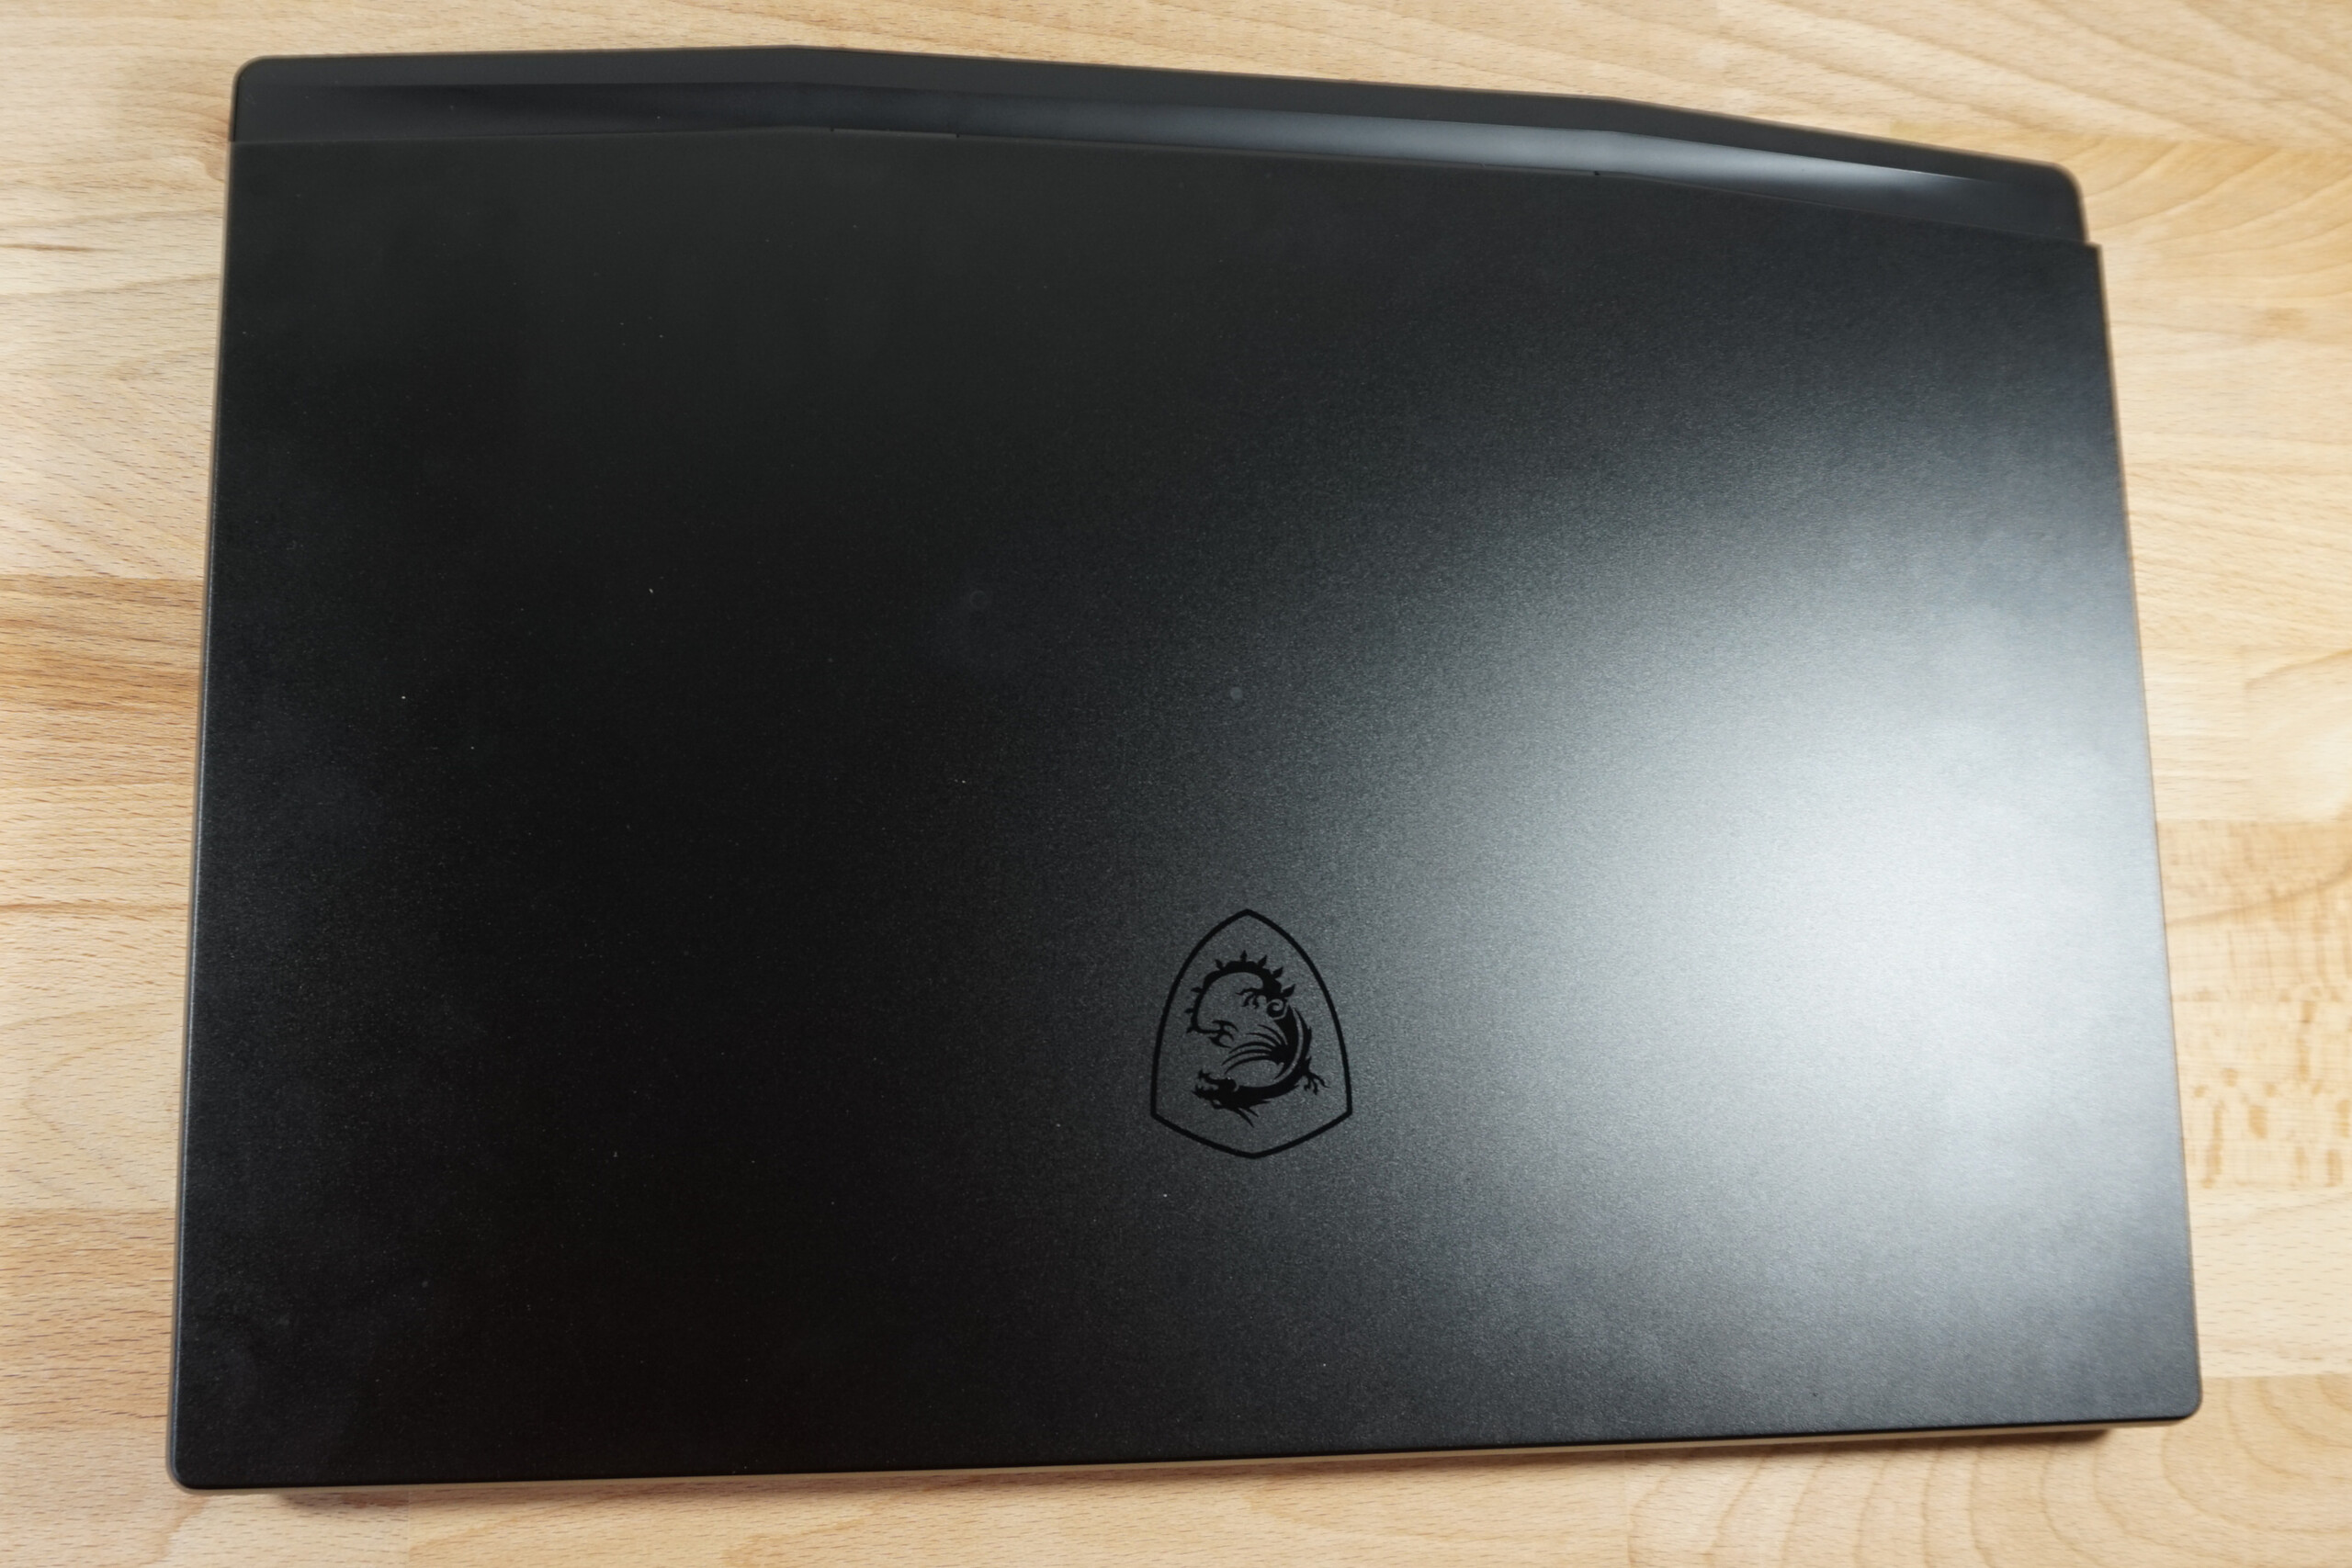
The MSI laptop's black case is largely free of accents with only the manufacturer's logo standing out from the metal display lid due to having a different surface texture.
The keyboard frame and the base also consist of metal. Additional components such as the side parts, display frame and ventilation cover behind the display are made of plastic. Everything looks consistent and, above all, solidly constructed. Held at the front corner of the base, torsion is minimal. The heavy 4K display behaves similarly. Here too, the stable construction restricts unwanted movement.
However, the screen"s hinges make a negative impression as they have been clearly built too small and weak. At an angle of around 30 degrees, the laptop closes by itself. Furthermore, the display almost always folds into its end position of 130 degrees, for example, when lifting the Stealth 17 off the desk.
Even compared to other 17-inch devices, the case is big and heavy. In terms of depth, only pure gaming laptops with larger cooling solutions surpass it. By comparison, the cooling system found in the Stealth 17 Studio is compact.
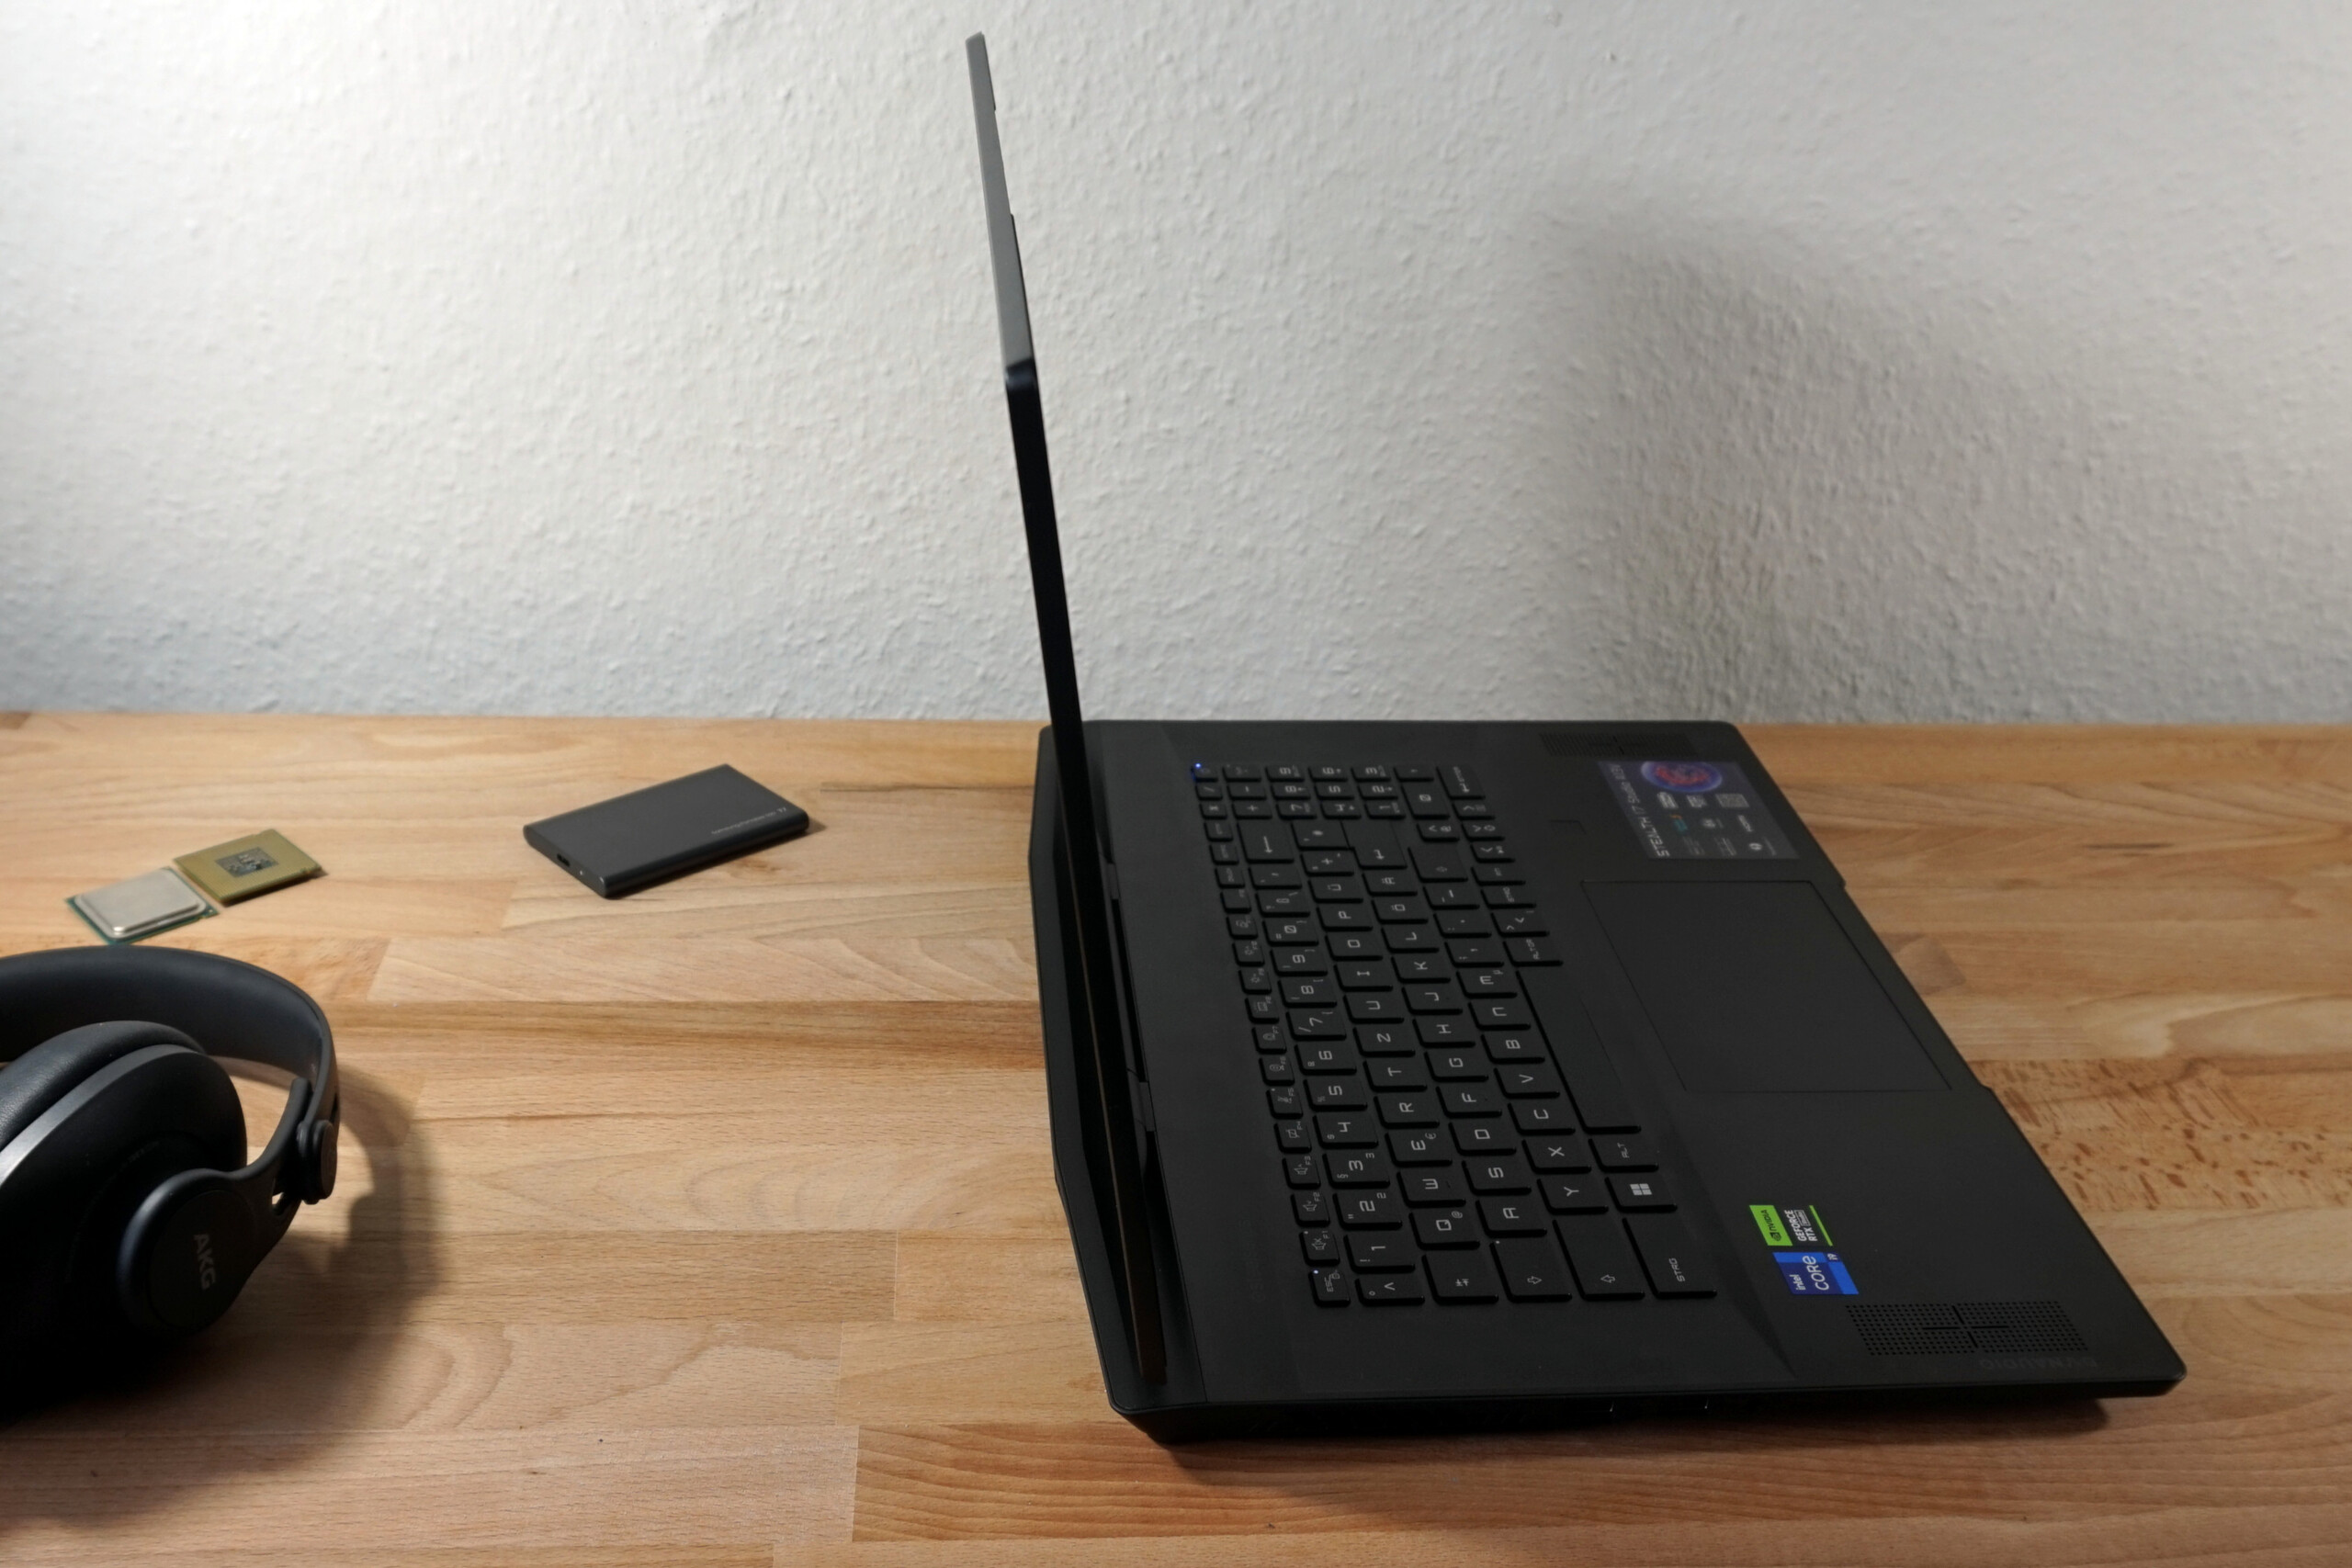
On the other hand, the device's thickness can hardly be beaten. At 21 mm, this is exceptionally flat for this performance category. Just for comparison: The similarly equipped Asus ROG Strix G17 is 50 % thicker.
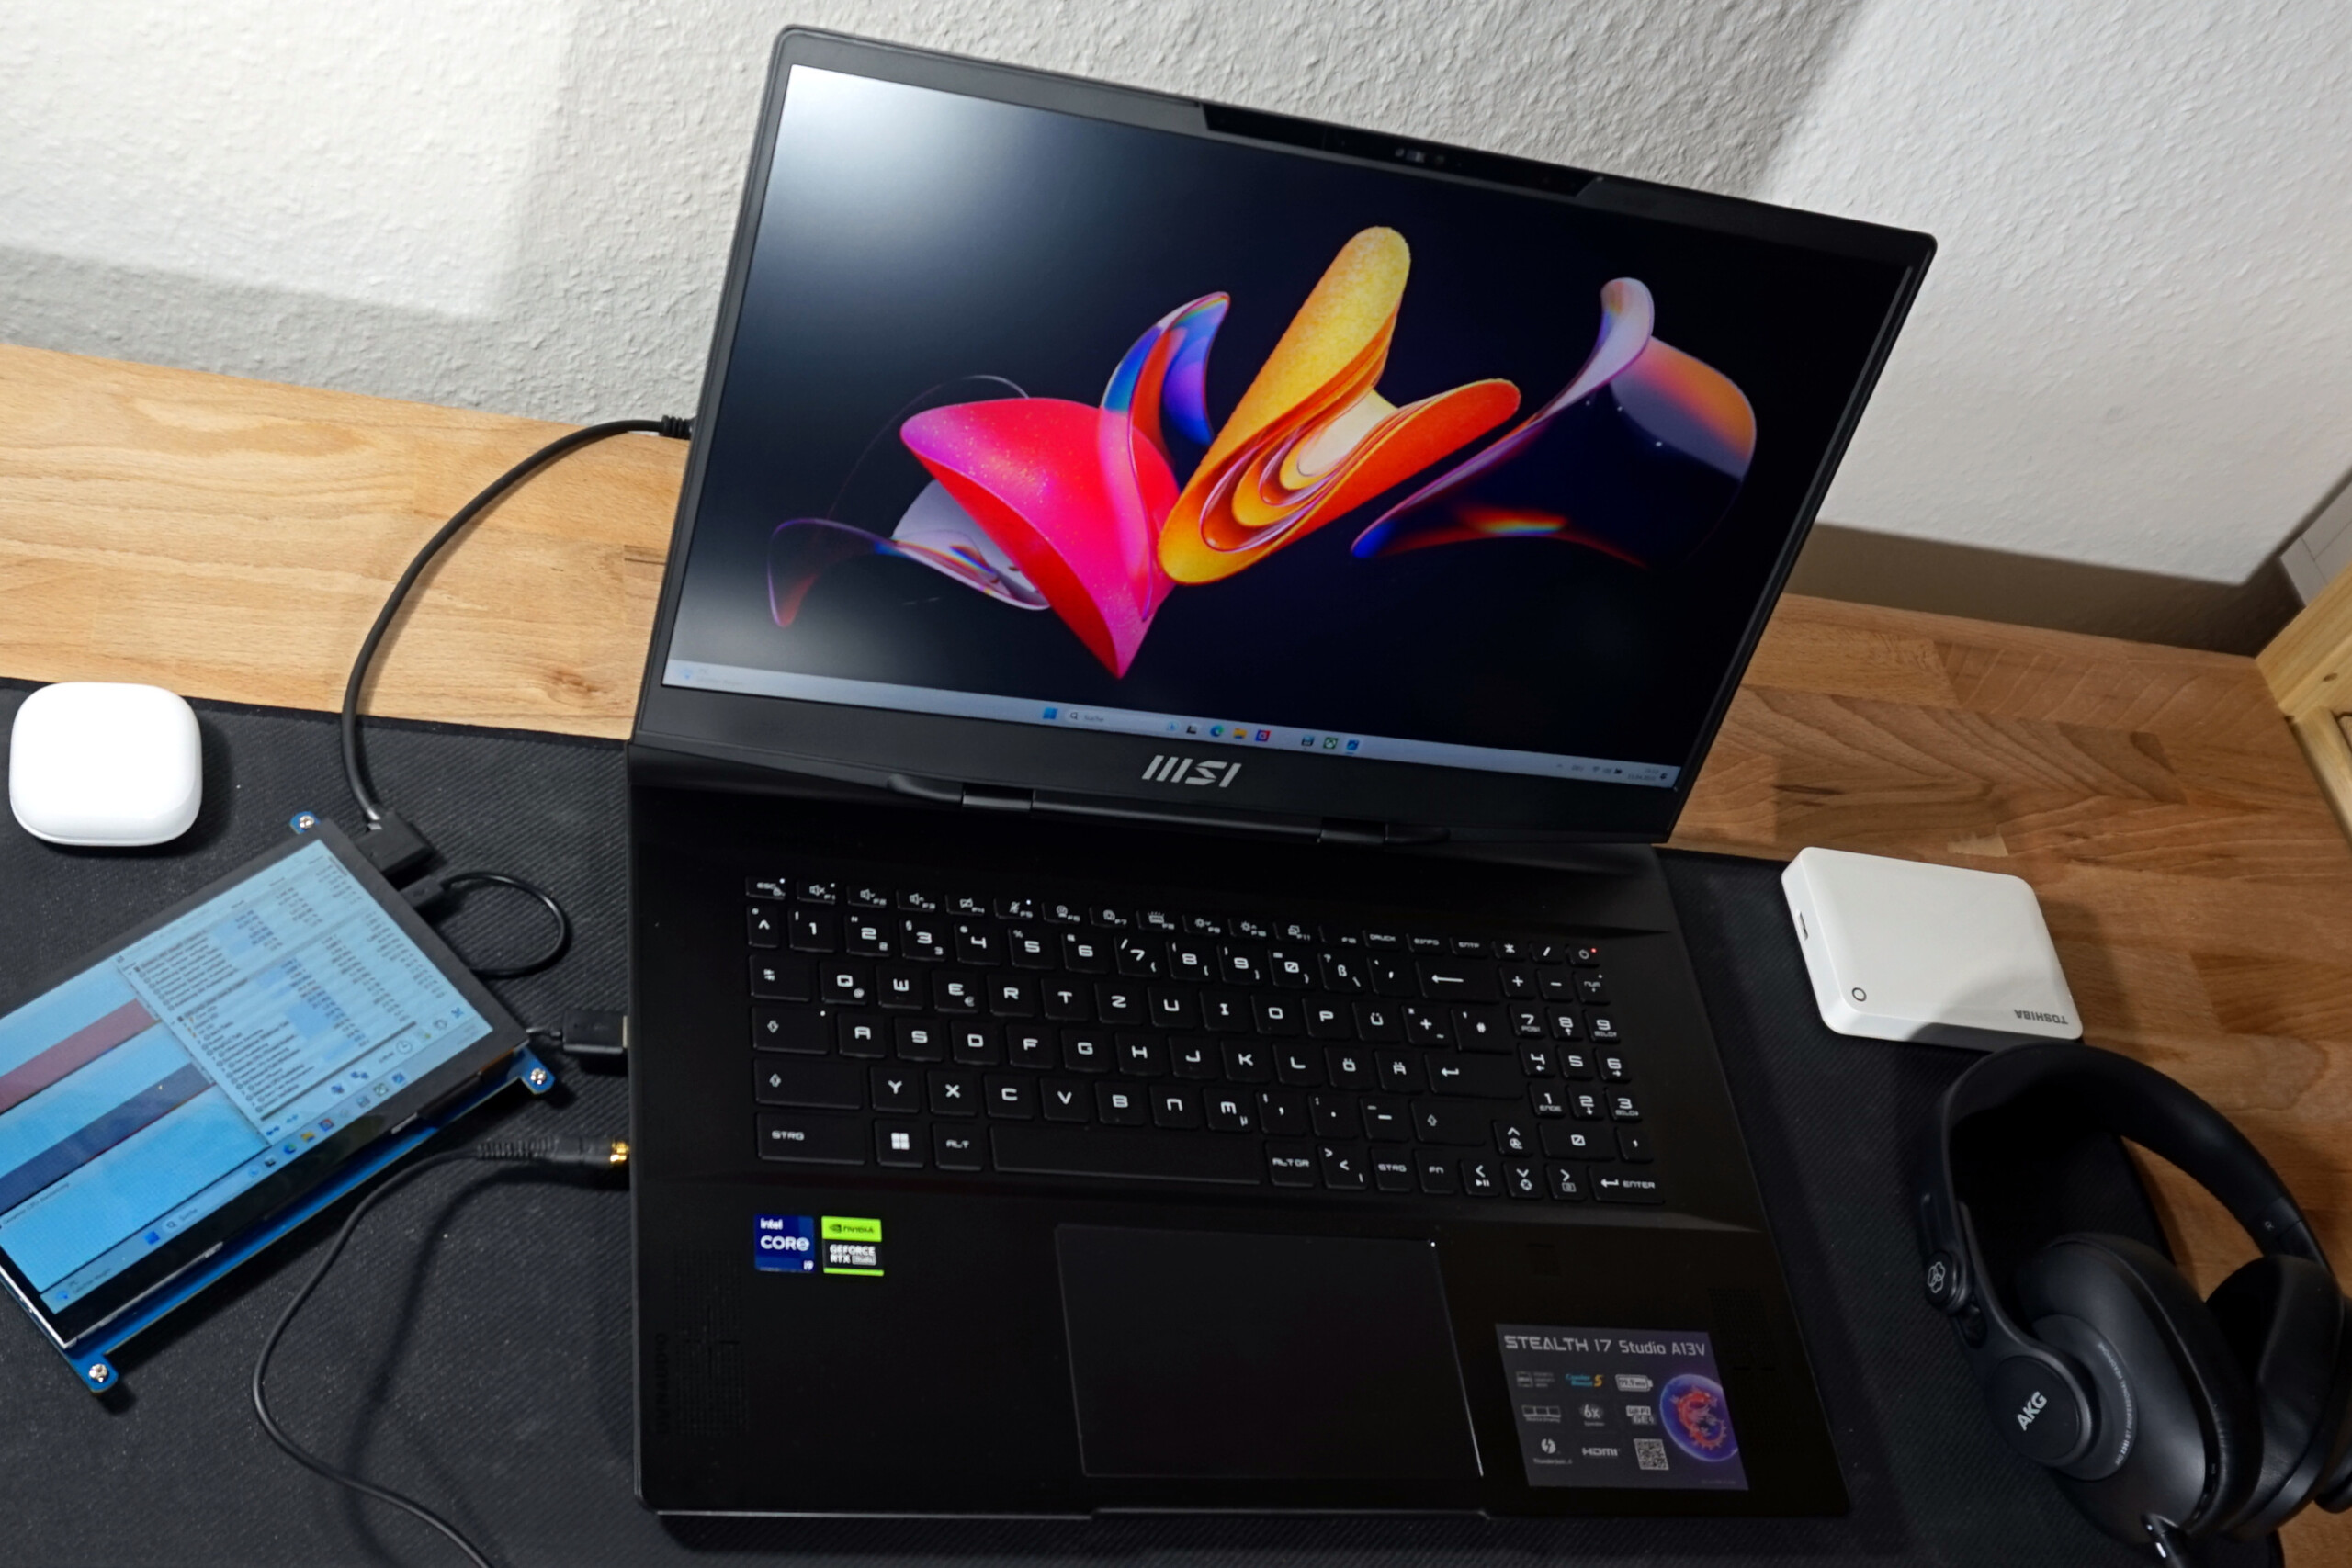
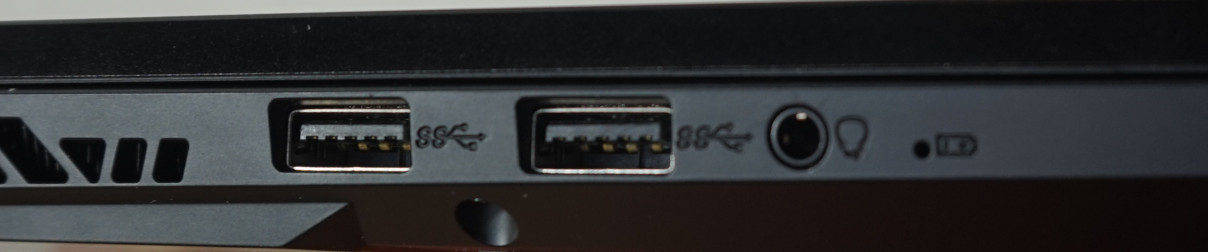
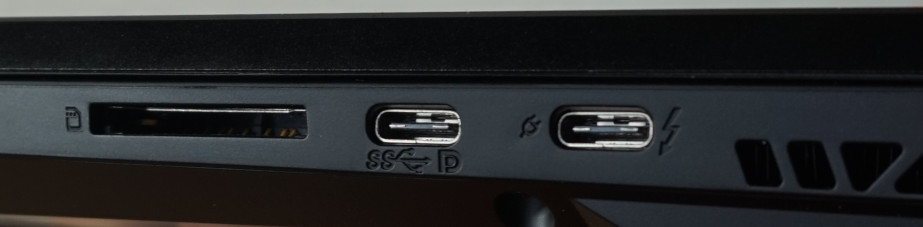
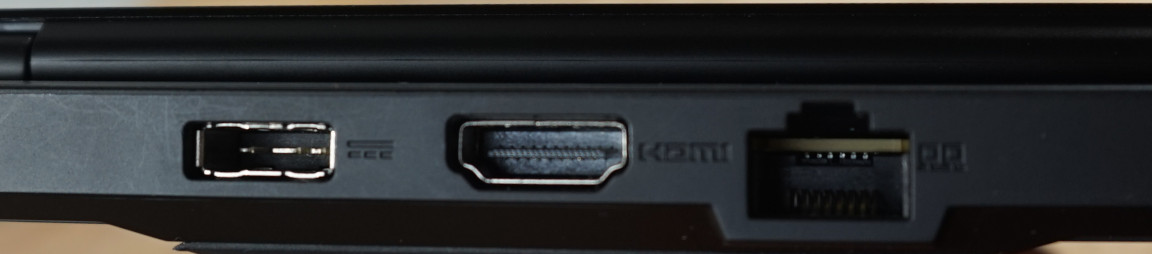
Features - All you need for a creator's laptop, and gaming alike
The laptop comes with a complete selection of ports. While some gaming laptops do without a card reader, quite a few multimedia laptops do without the LAN port.
By contrast, the MSI Stealth 17 Studio serves all requirements: With a total of three video outputs, four USB ports, including Thunderbolt 4, a card reader for normal SD cards and 2.5 Gbit LAN, the basics for gaming, fast data transfer and variable connections to other devices, monitors and streaming accessories, are all covered.
Considering the self-proclaimed high level to which the Stealth belongs, the USB-A and USB-C ports would be more practical on the left and right. Additionally, the manufacturer could have gone for a dedicated headphone jack as well as the built-in headset connector.
SD Card Reader
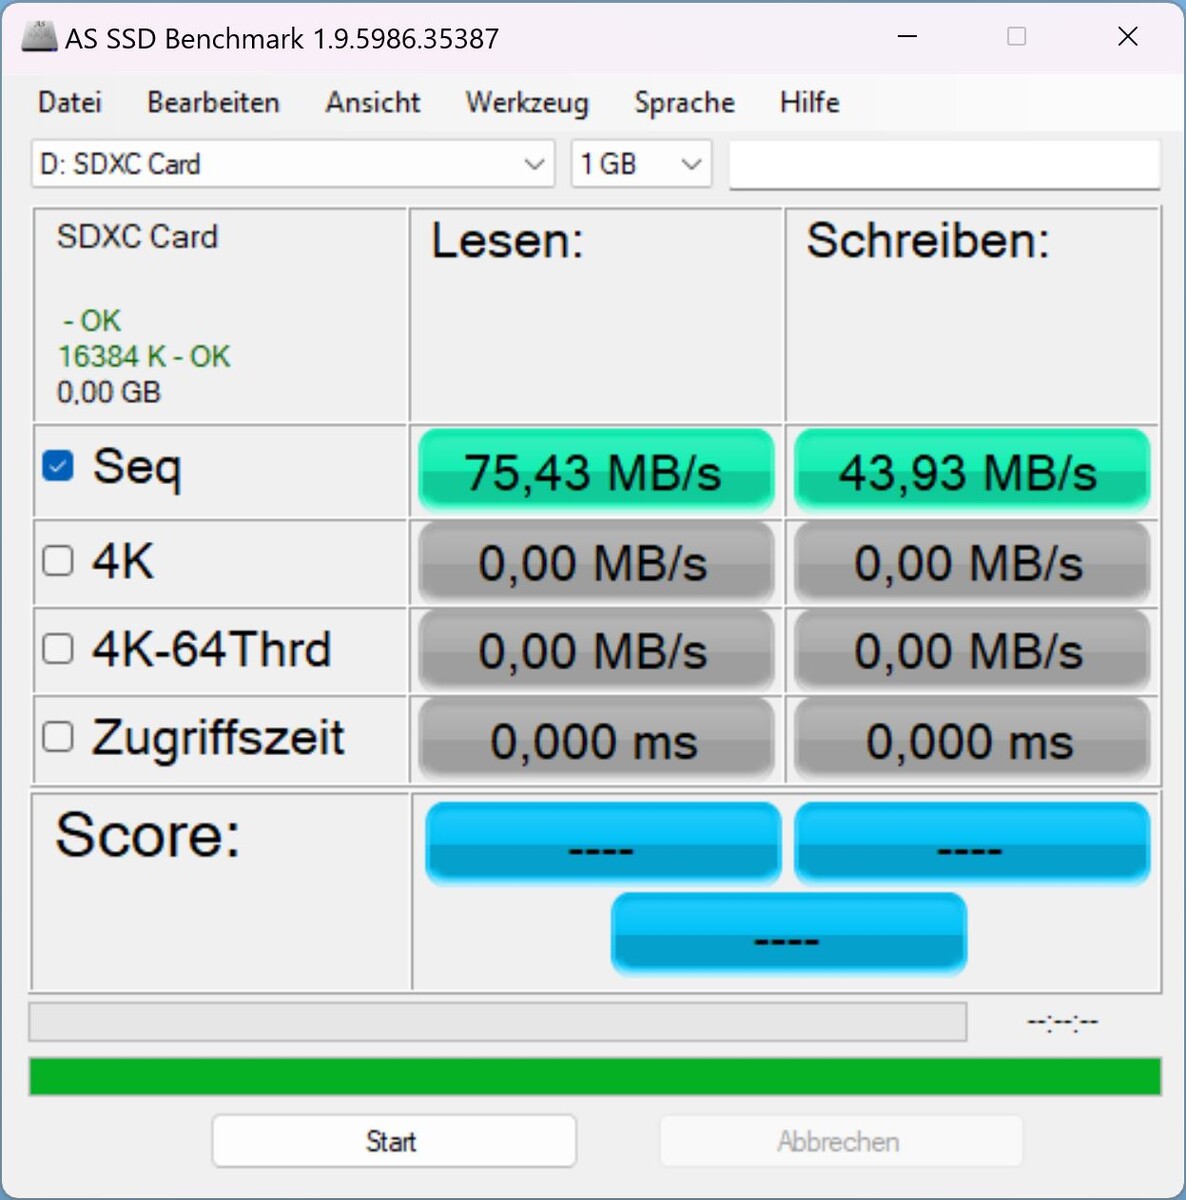
The card reader scored disappointingly when measured with our AV PRO microSD 128 GB V60 reference card. When reading image files, the Stealth 17 could only manage just under half the transfer speed of the Razer Blade 16 Early 2023 in our test.
Nevertheless, the waiting time for 30 GB of image data is around 10 minutes and is within limits.
| SD Card Reader | |
| average JPG Copy Test (av. of 3 runs) | |
| Razer Blade 16 Early 2023 (AV PRO microSD 128 GB V60) | |
| Average of class Gaming (20.9 - 210, n=54, last 2 years) | |
| HP Omen 17-ck2097ng (AV PRO microSD 128 GB V60) | |
| MSI Stealth 17 Studio A13VH-014 | |
| maximum AS SSD Seq Read Test (1GB) | |
| Razer Blade 16 Early 2023 (AV PRO microSD 128 GB V60) | |
| Average of class Gaming (25.5 - 261, n=51, last 2 years) | |
| HP Omen 17-ck2097ng (AV PRO microSD 128 GB V60) | |
| MSI Stealth 17 Studio A13VH-014 | |
Communication
The LAN connection works almost without delay with stable data rates at 2,500 Mbit/s, providing the additional network architecture can keep up.
At least at close proximity, the WiFi module is on par. The requirement is a short distance to the router and no interference from other radio networks. This is demonstrated by our comparison between the 5 GHz measurements at less than 1,000 Mbit/s and 6 GHz almost approaching 1,600 Mbit/s. In the 5 GHz range, a large number of nearby wireless networks can noticeably reduce the transfer rate. The step up to 6 GHz and wider frequency bands, effectively prevent this.
All in all, the Stealth 17 managed to impress us with its wired and wireless network connections.
Webcam
The Full HD resolution webcam works decently but not outstandingly. It adapts quickly and without visual artefacts, especially when it comes to poor or changeable lighting conditions. What's not as easy on the eye is the permanent and visibly noticeable image noise. Overall, for a laptop, the camera is pretty good. The Full HD resolution ensures decent quality video calls on the go with only moderate bandwidth requirements and delivers attractive images under good lighting conditions.
In terms of the other hardware features, there can be no complaints about the mechanical cover and the additional infrared camera for logging in via face recognition.
The microphone sounds very good. Regardless of the distance, the volume level remains the same and speech coming from varying directions also poses no real problems. In addition, voices sound natural with only a subtle tinny undertone being present.


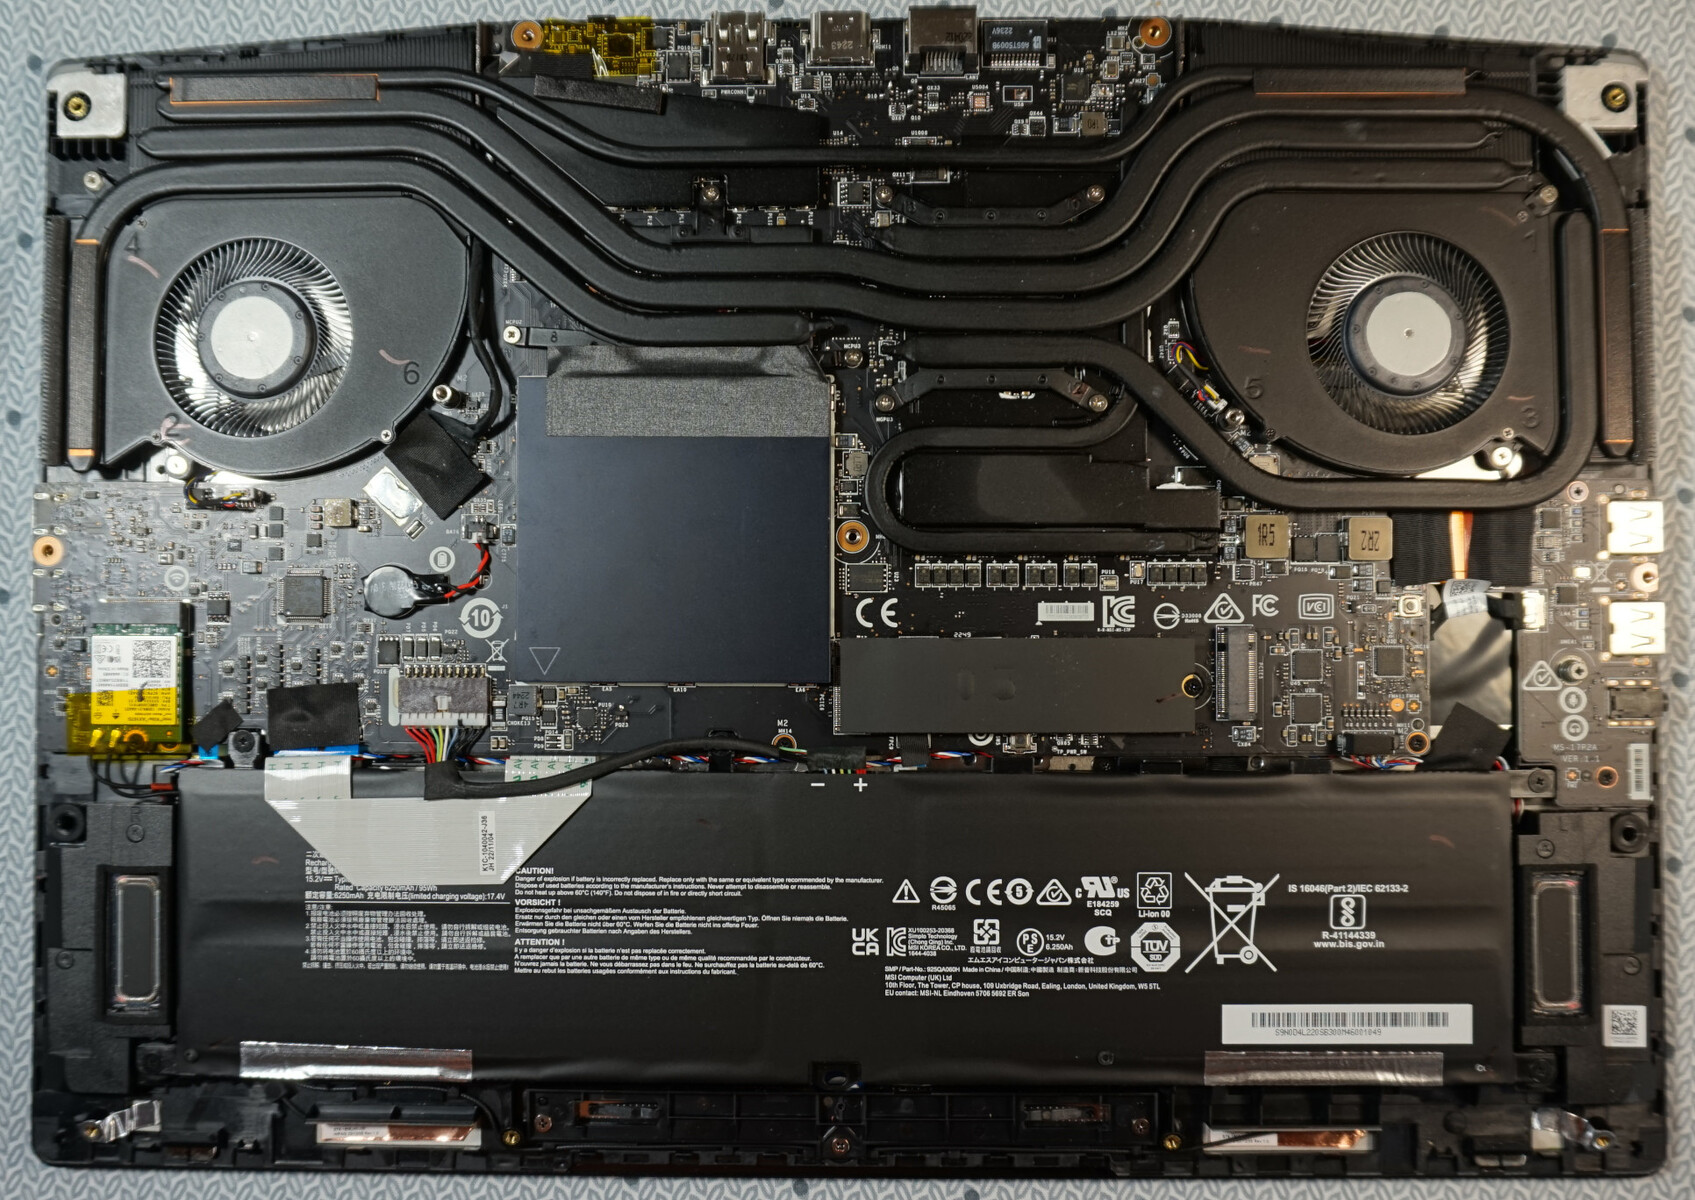
Maintenance
If you are not discouraged by the seal covering the middle screw, opening the device is uncomplicated - the three different screw lengths notwithstanding. In the side cooling vents area, the case can be easily pried open and is something for which a delicate touch is required rather than brute strength.
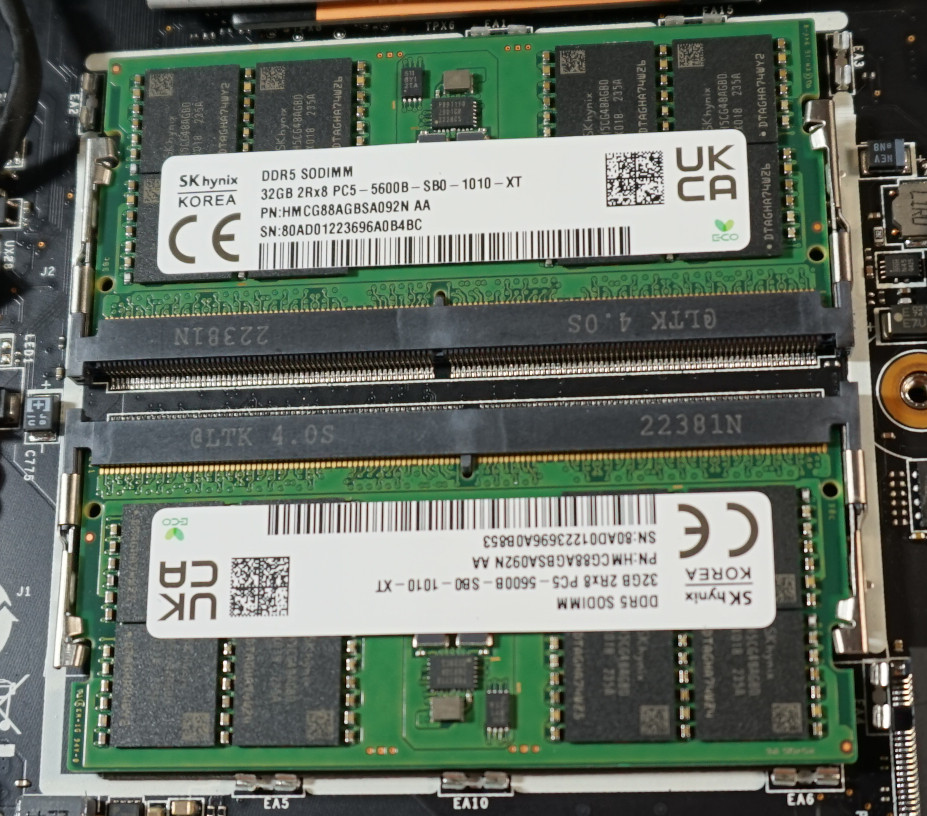
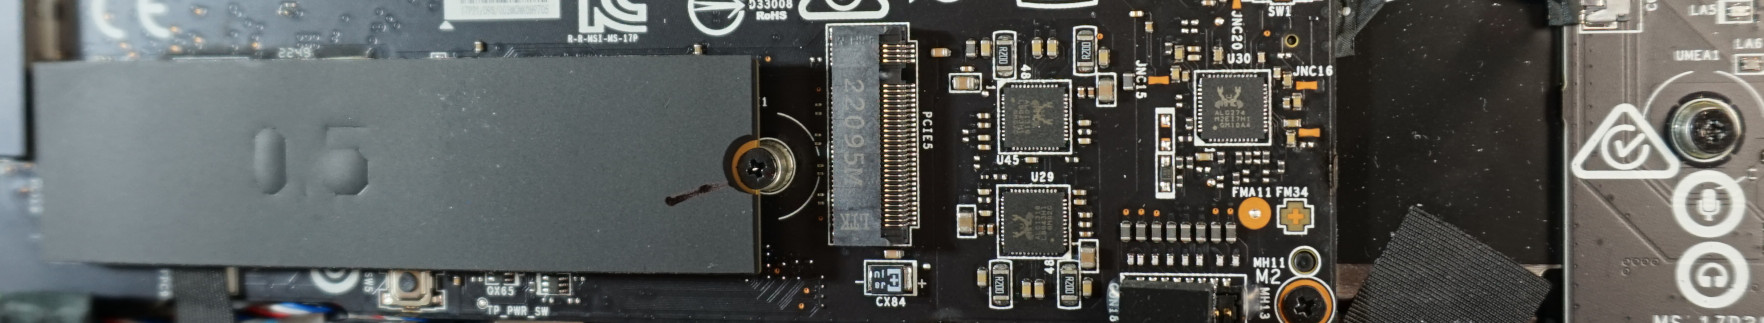
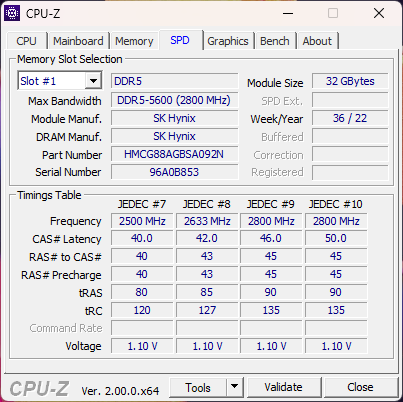
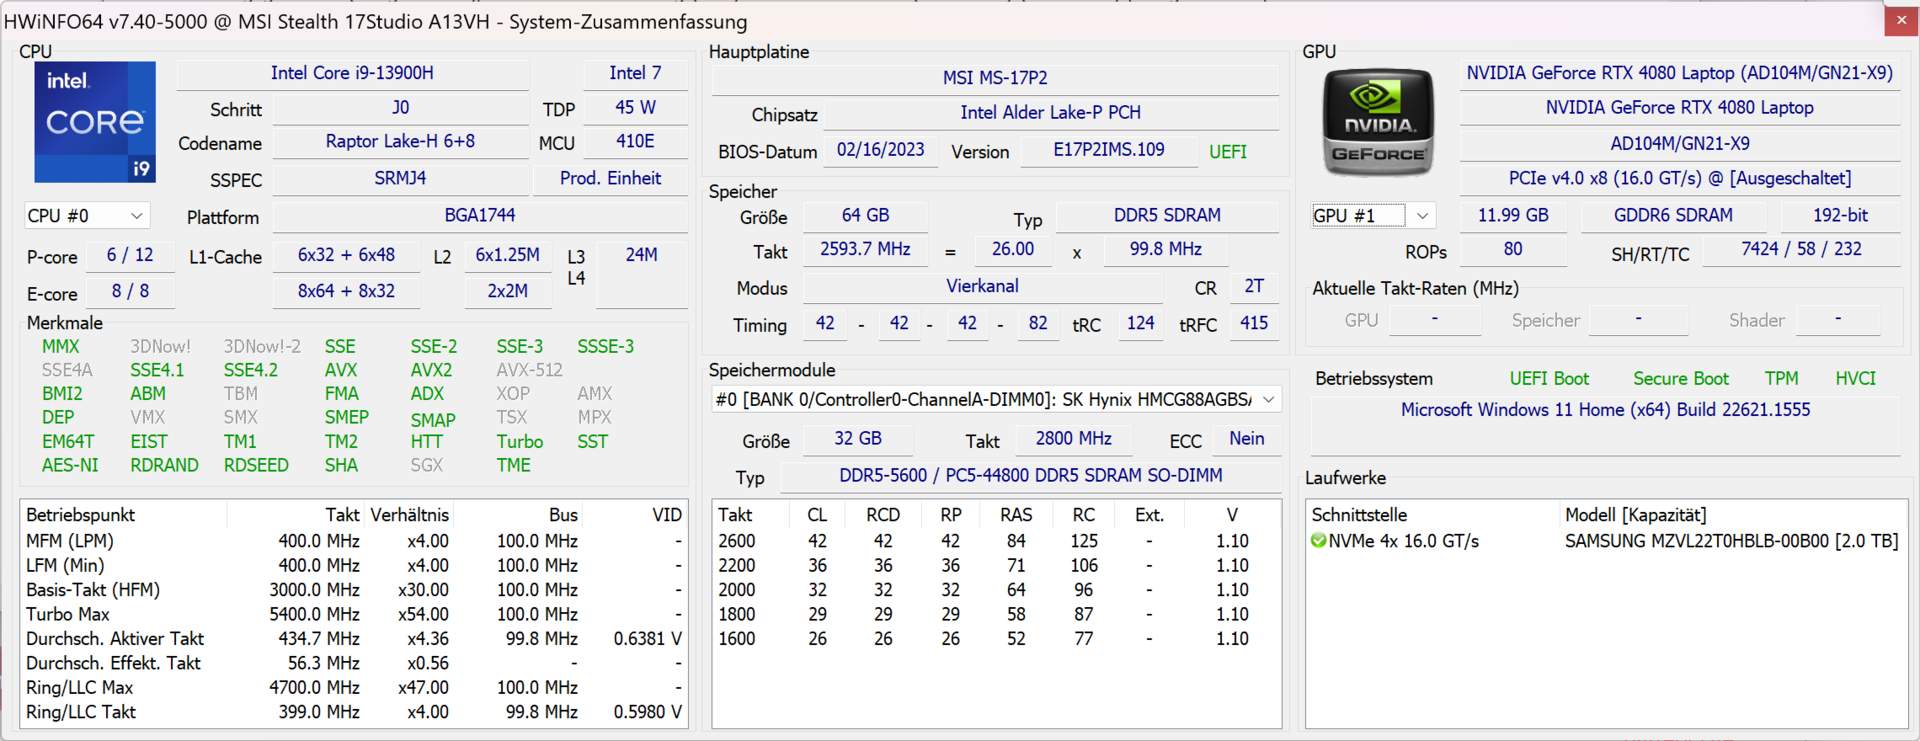
Subsequently, the fans, the battery and all replaceable components can be easily accessed. The WiFi module can be swapped. Two RAM slots allow for the installation of a maximum of 64 GB DDR5 RAM and this was already equipped to the max in our Stealth 17 review device. Furthermore, there is a free slot for an M.2 SSD.
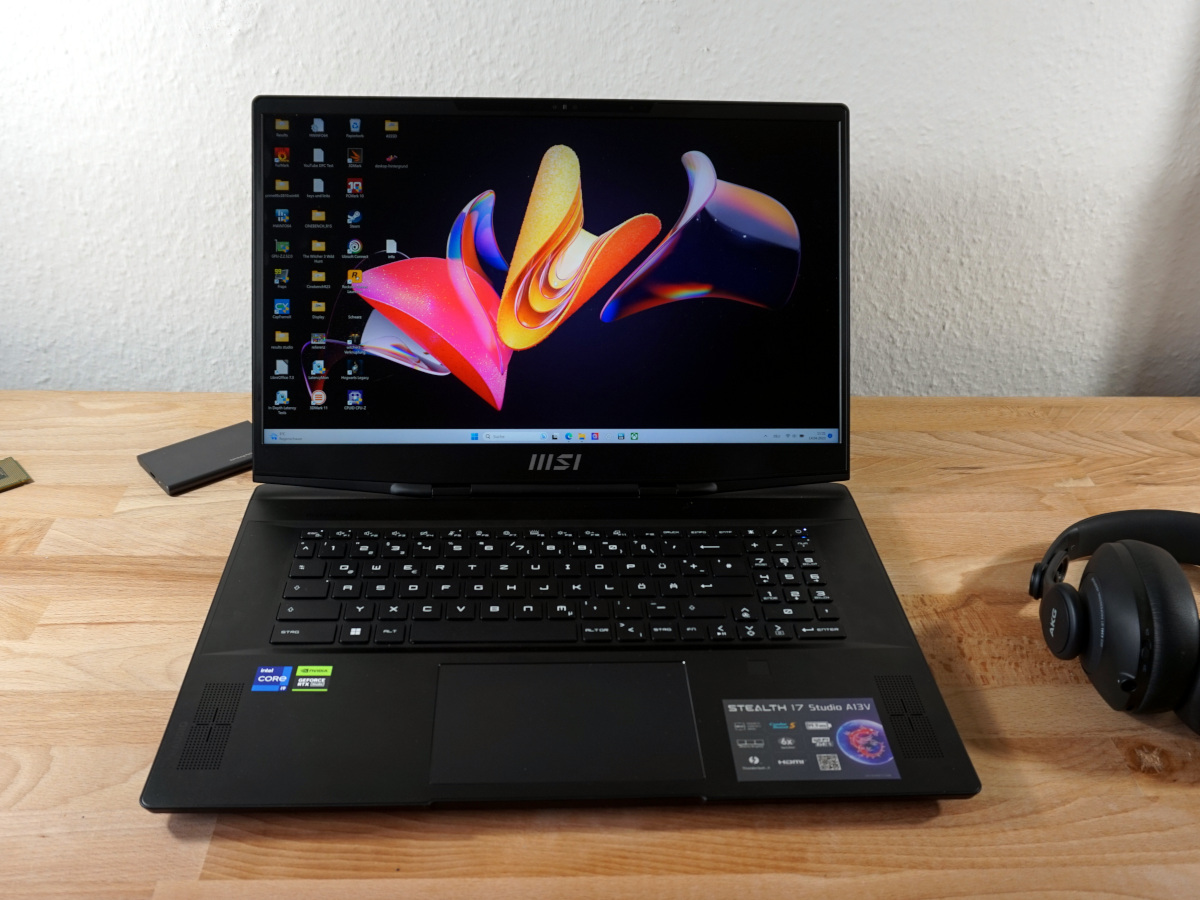
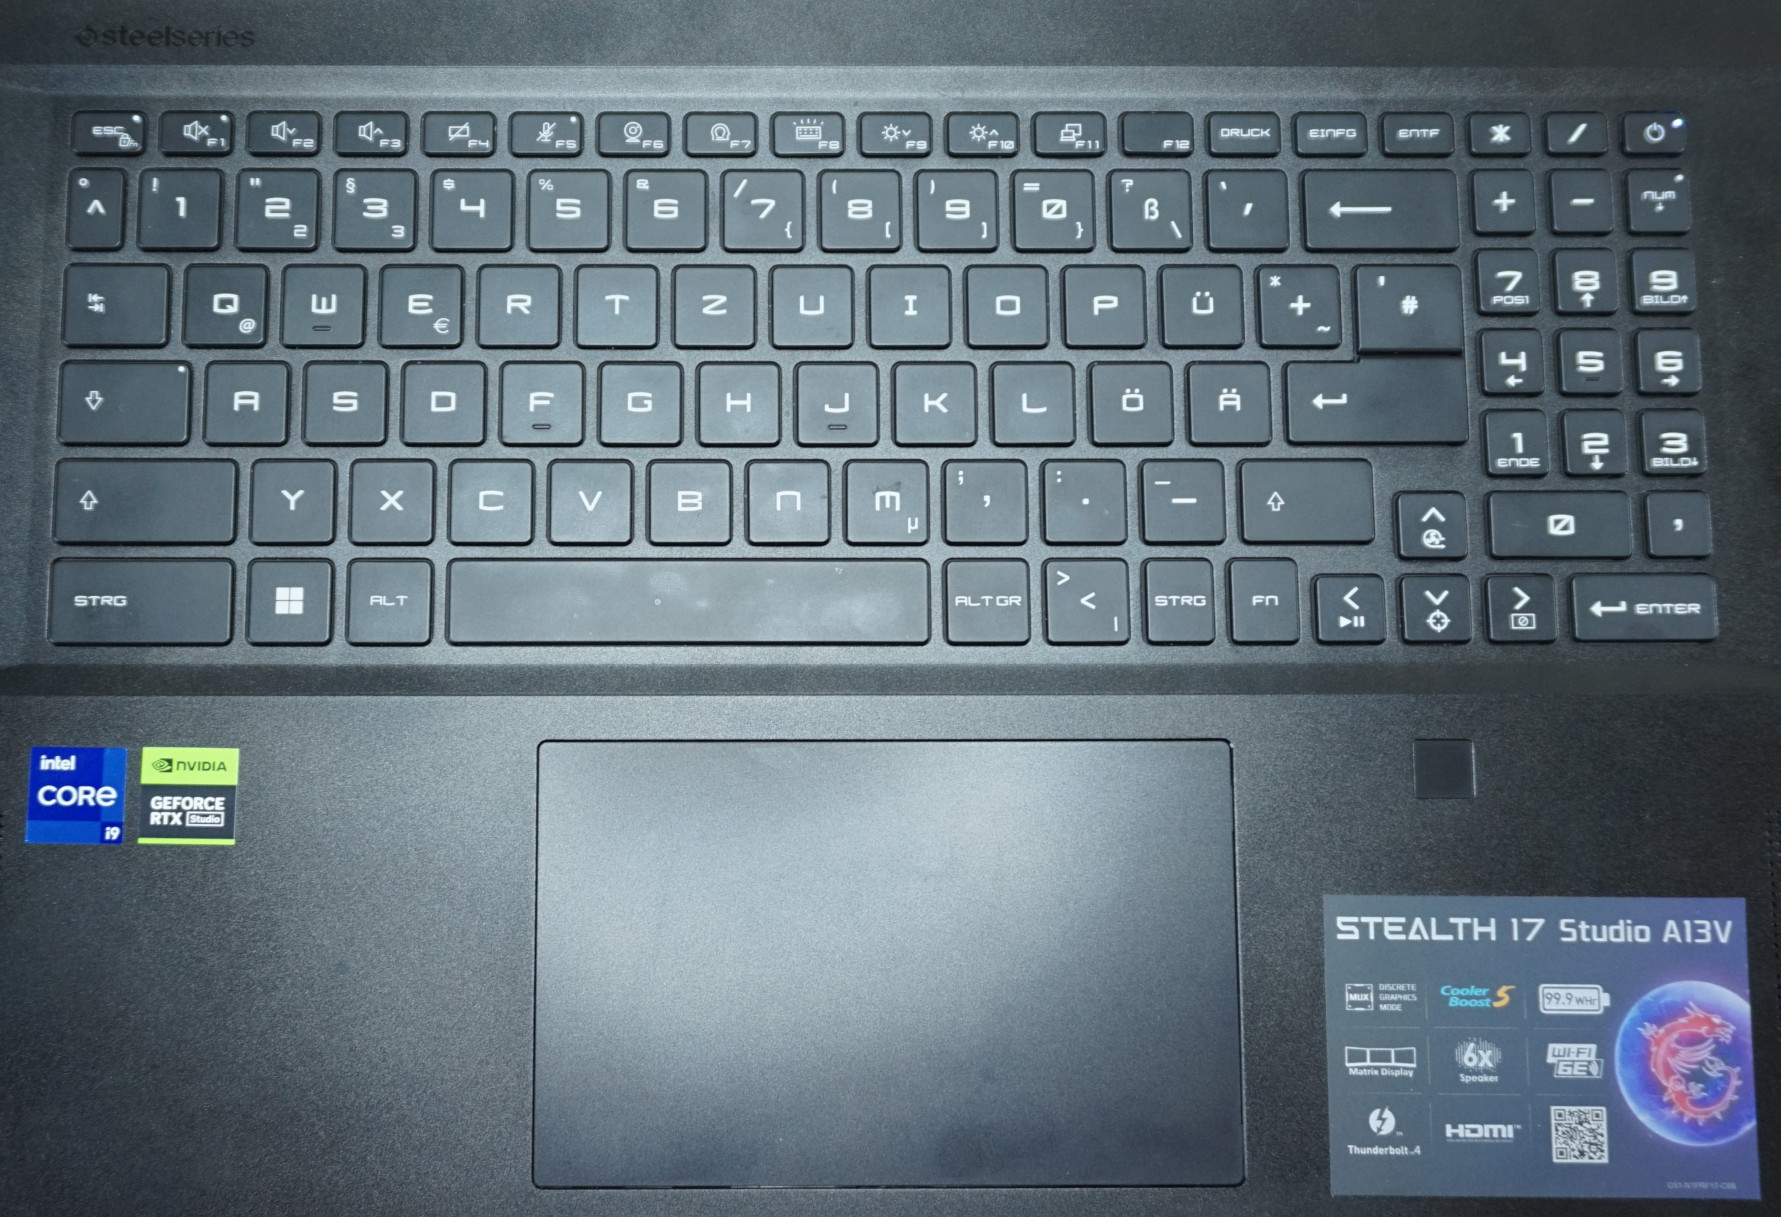
Input devices - A lot of average in a premium, creator's laptop
The barely audible typing noise fits well with the overall image of a quiet work device. In addition, the slightly above-average key travel of 1.7 mm is tangible and ensures a fast and easy typing experience. The keyboard is no better, but also no worse than the kind found in most business laptops. The numerical keypad appears a little too cramped which is a negative point when switching often to the desktop.
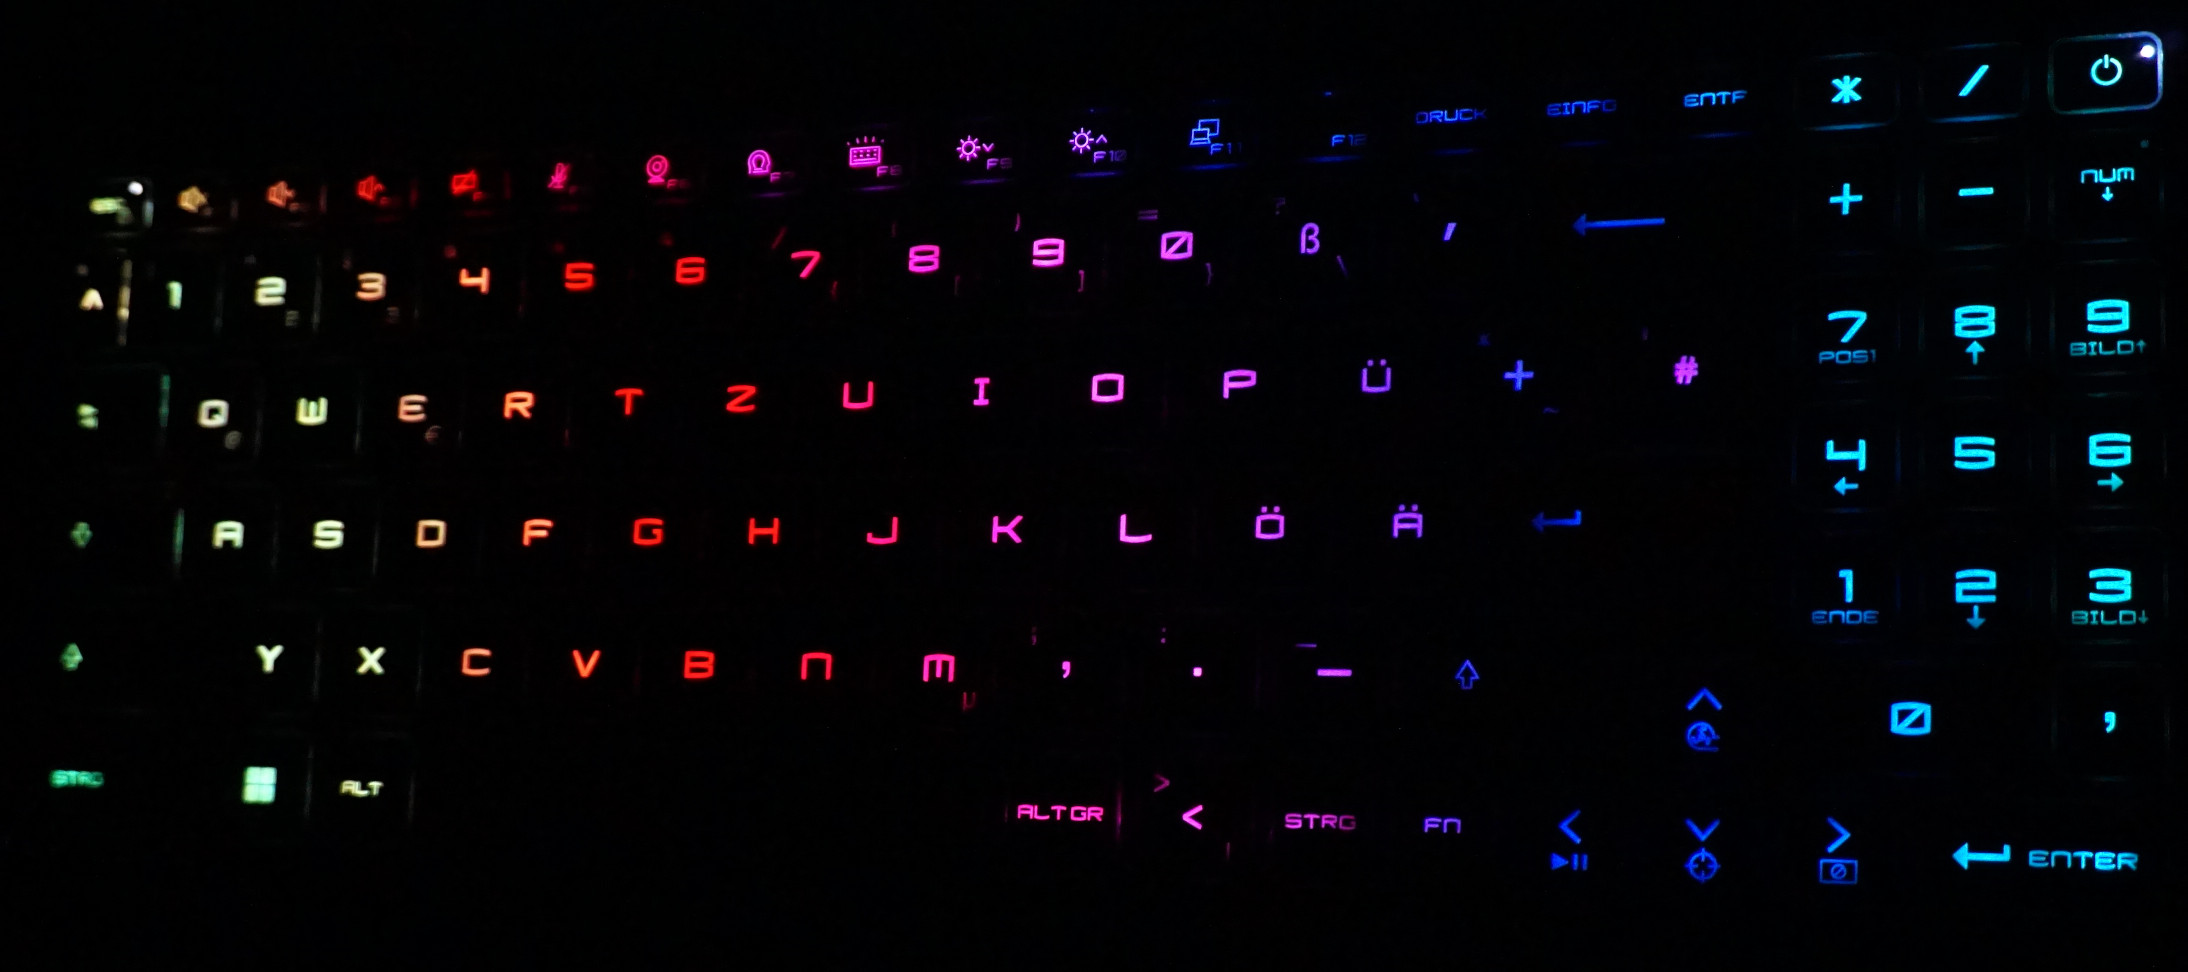
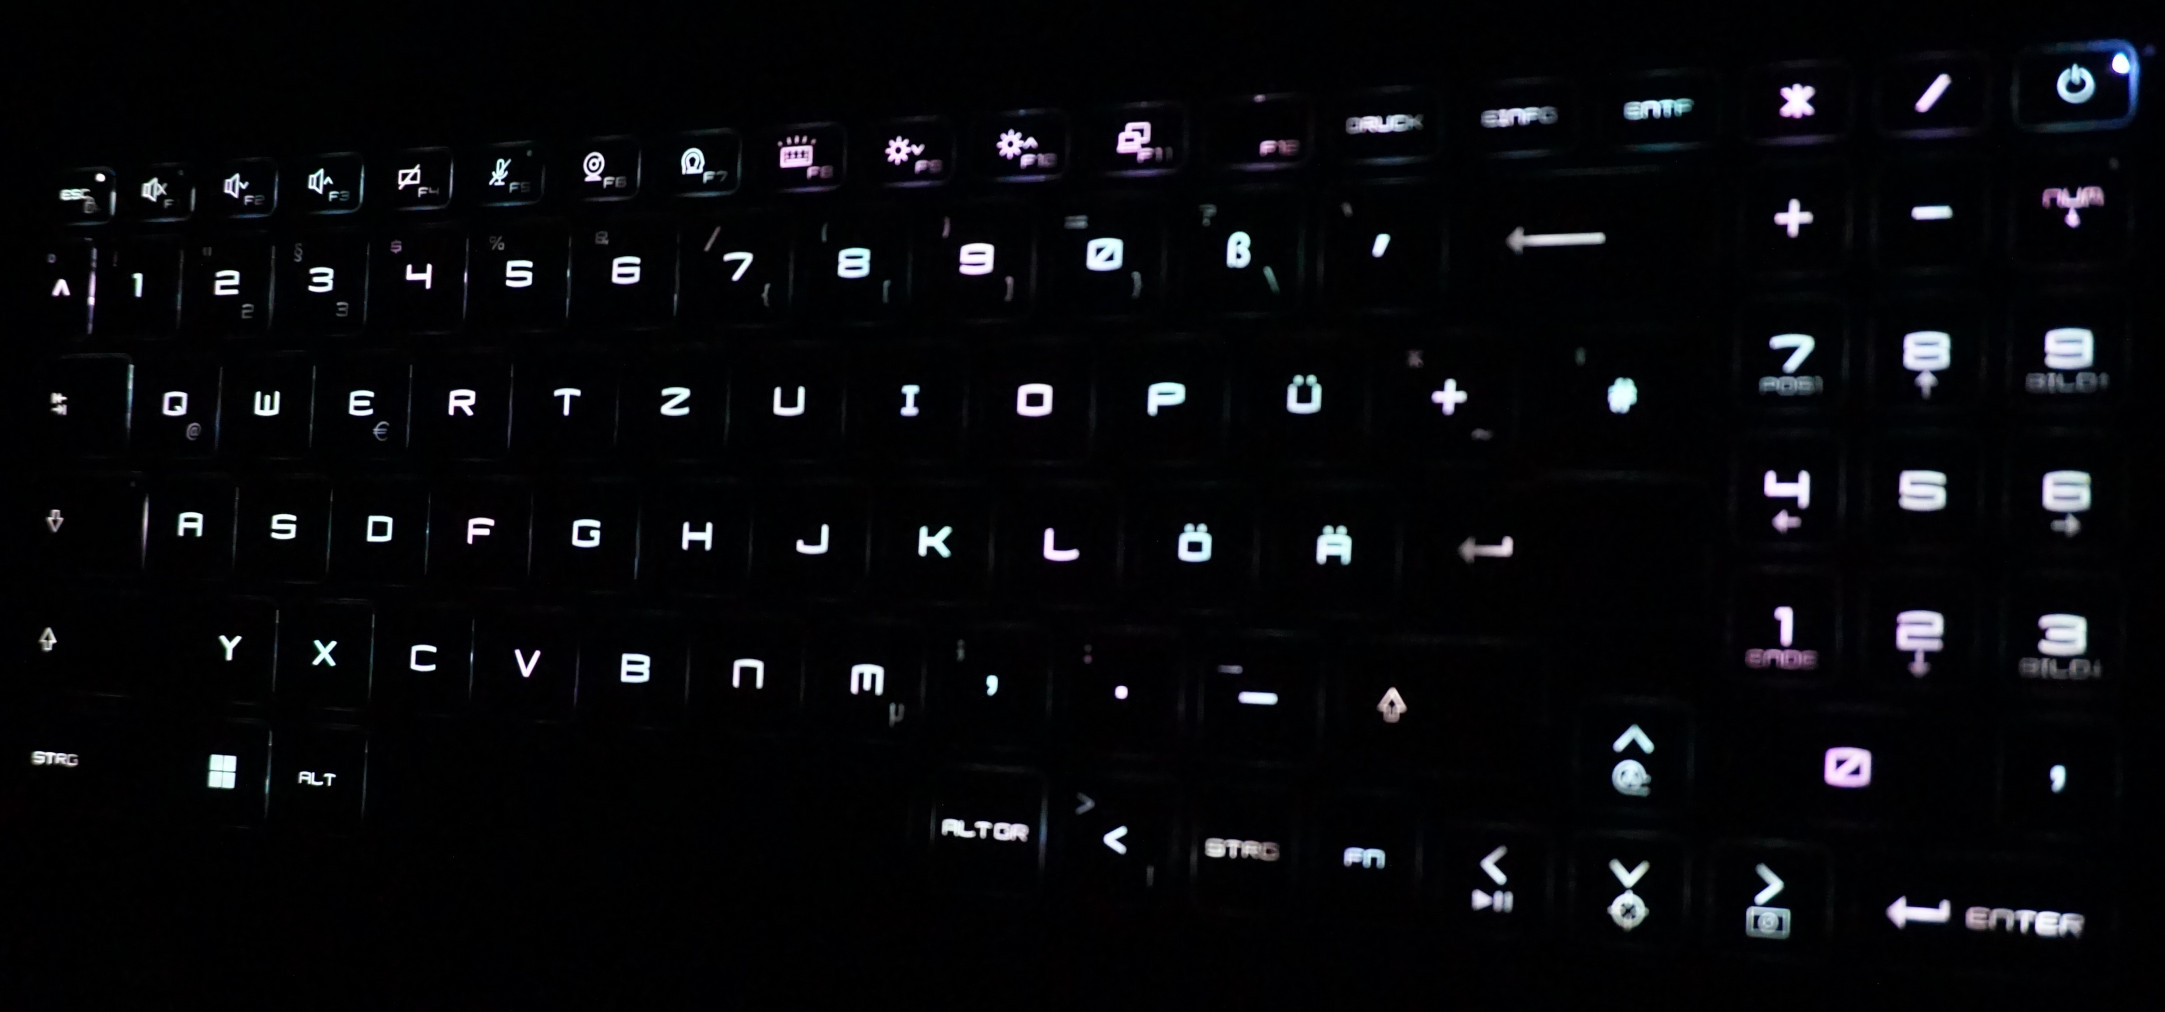
On top of that, every key can be backlit individually and also change color. Furthermore, with the help of the SteelSeries GG Client software, all keys can be assigned new or additional functions.
Unfortunately, the combination of switching colors and sensor values doesn't work. What could be more annoying is the uneven lightning. If your preference is single-color backlighting, differences between the keys are noticeable, especially with lighter colors.
Likewise, the touchpad doesn't match the Stealth 17's premium character although its functions are basically fine. The physical keys in the lower area seem mushy and imprecise. Although in normal situations, we could see a mouse more likely being used.
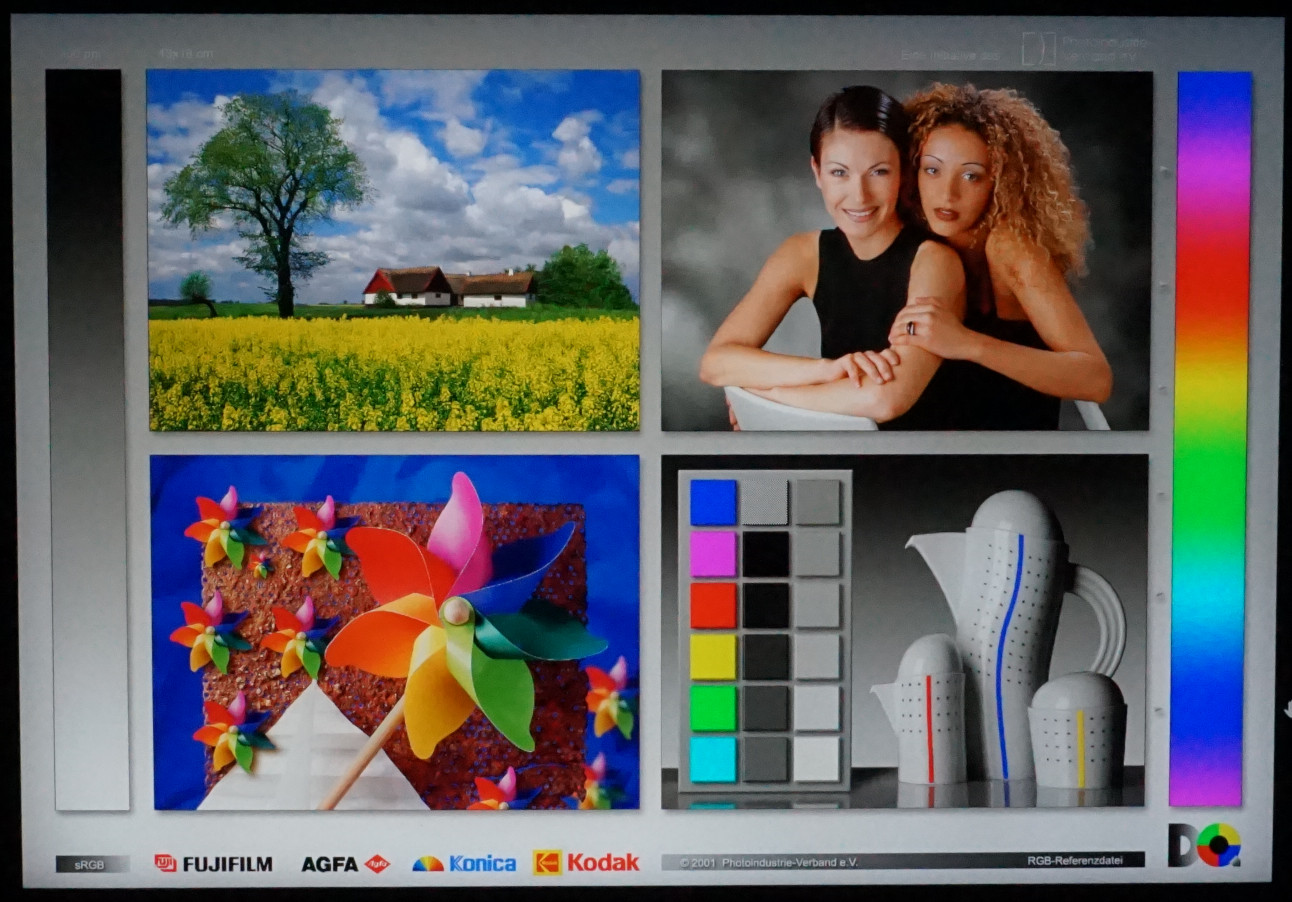
Display - Stunning image values for the Stealth 17
With its 4K resolution and (at least on paper) almost 100 percent DCI-P3 color space coverage and the VESA DisplayHDR 1000 certification, the screen is intended for professional applications. In particular, high-level video editing demands such display attributes. In addition, there is the 144 Hz frame rate which has its benefits in games. Smooth-moving images and low latency are the results.
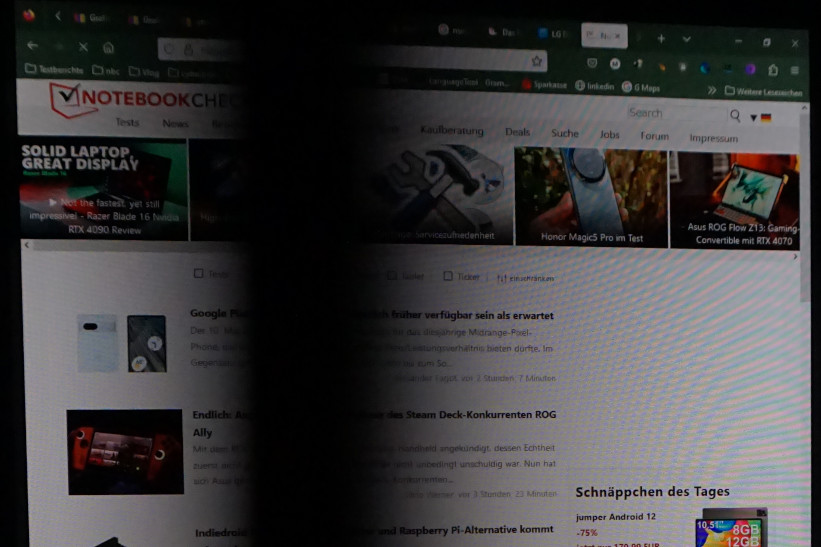
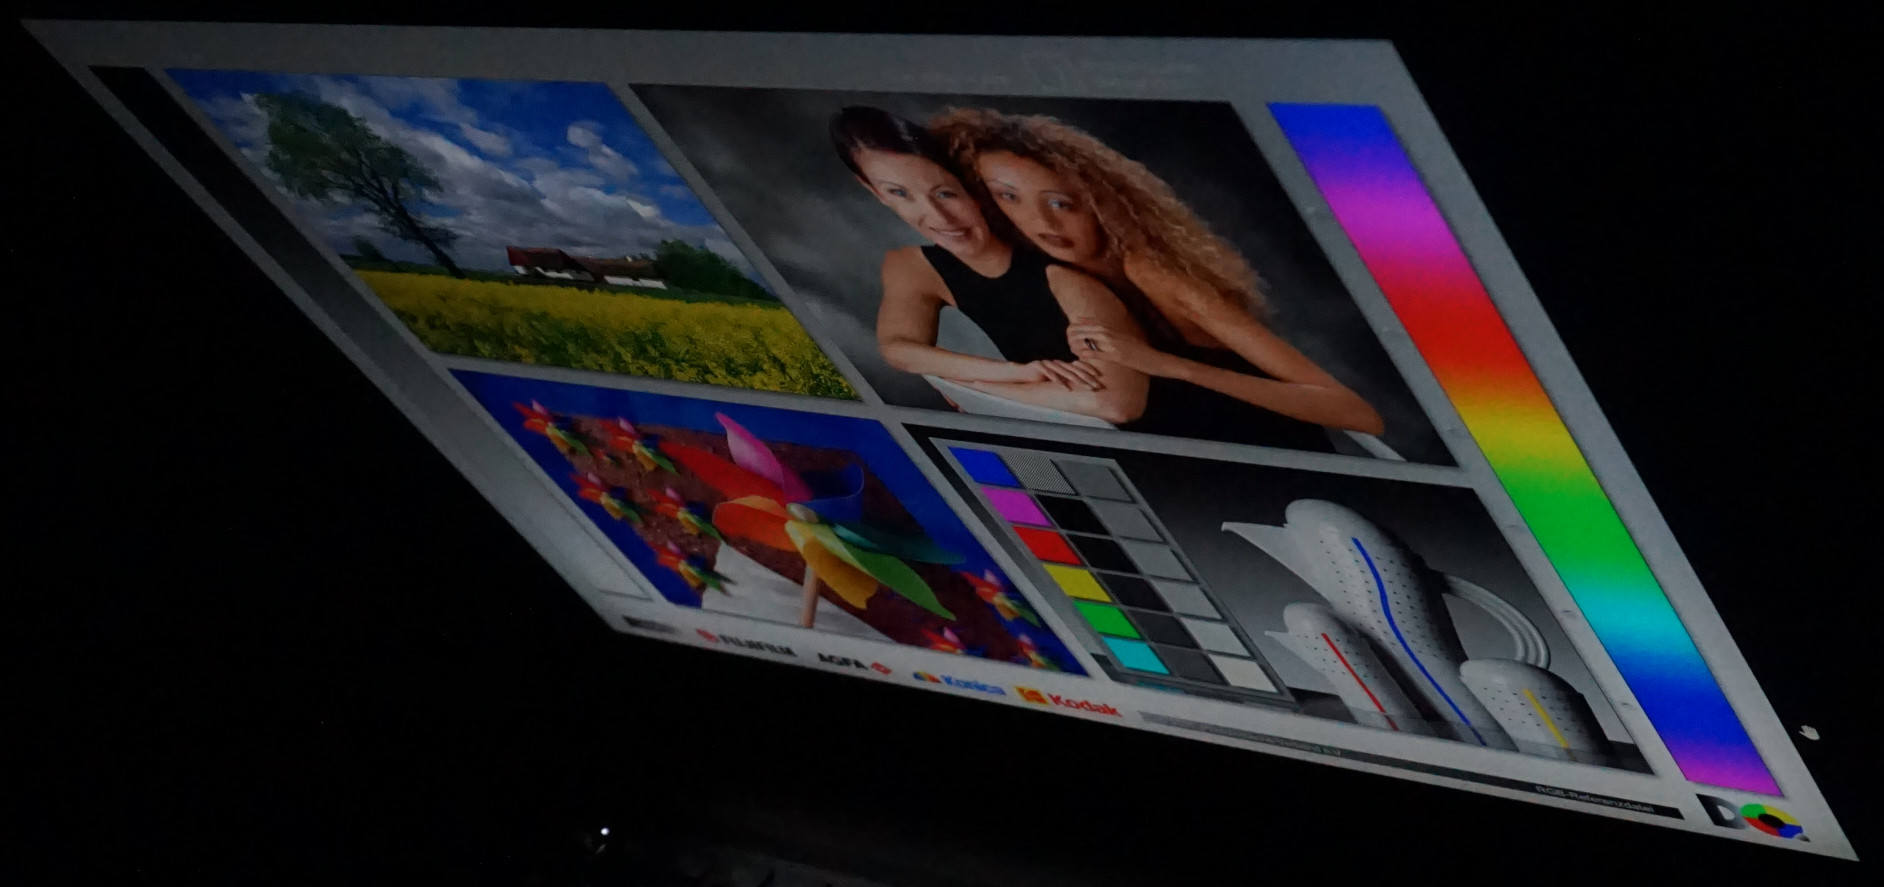
Thanks to almost perfect black levels, contrast is high but can never quite be at zero due to residual light reflections. When it comes to video playback and games, the difference to classic backlighting is clearly visible. The picture resembles the one found in an OLED display. That is shown by our image capture whose purpose is to reveal any screen bleeding. Not a single trace of this can be seen in the long exposure.
For many tasks, a 4K resolution in a 17-inch device is too much. Windows 11 automatically sets the magnification factor to 250 %. However, 200 % should be sufficient in order to be able to recognise text and graphics. That said, we would not recommend less than that. By contrast, in terms of image editing, the high pixel density is an advantage.
We measured 400 cd/m² without any worsening in battery mode. This still results in wonderful images indoors which, however, never appear dazzlingly bright. Regarding, for HDR content, the peak brightness could be higher.
| |||||||||||||||||||||||||
Brightness Distribution: 93 %
Center on Battery: 408.46 cd/m²
Contrast: 19865:1 (Black: 0.02 cd/m²)
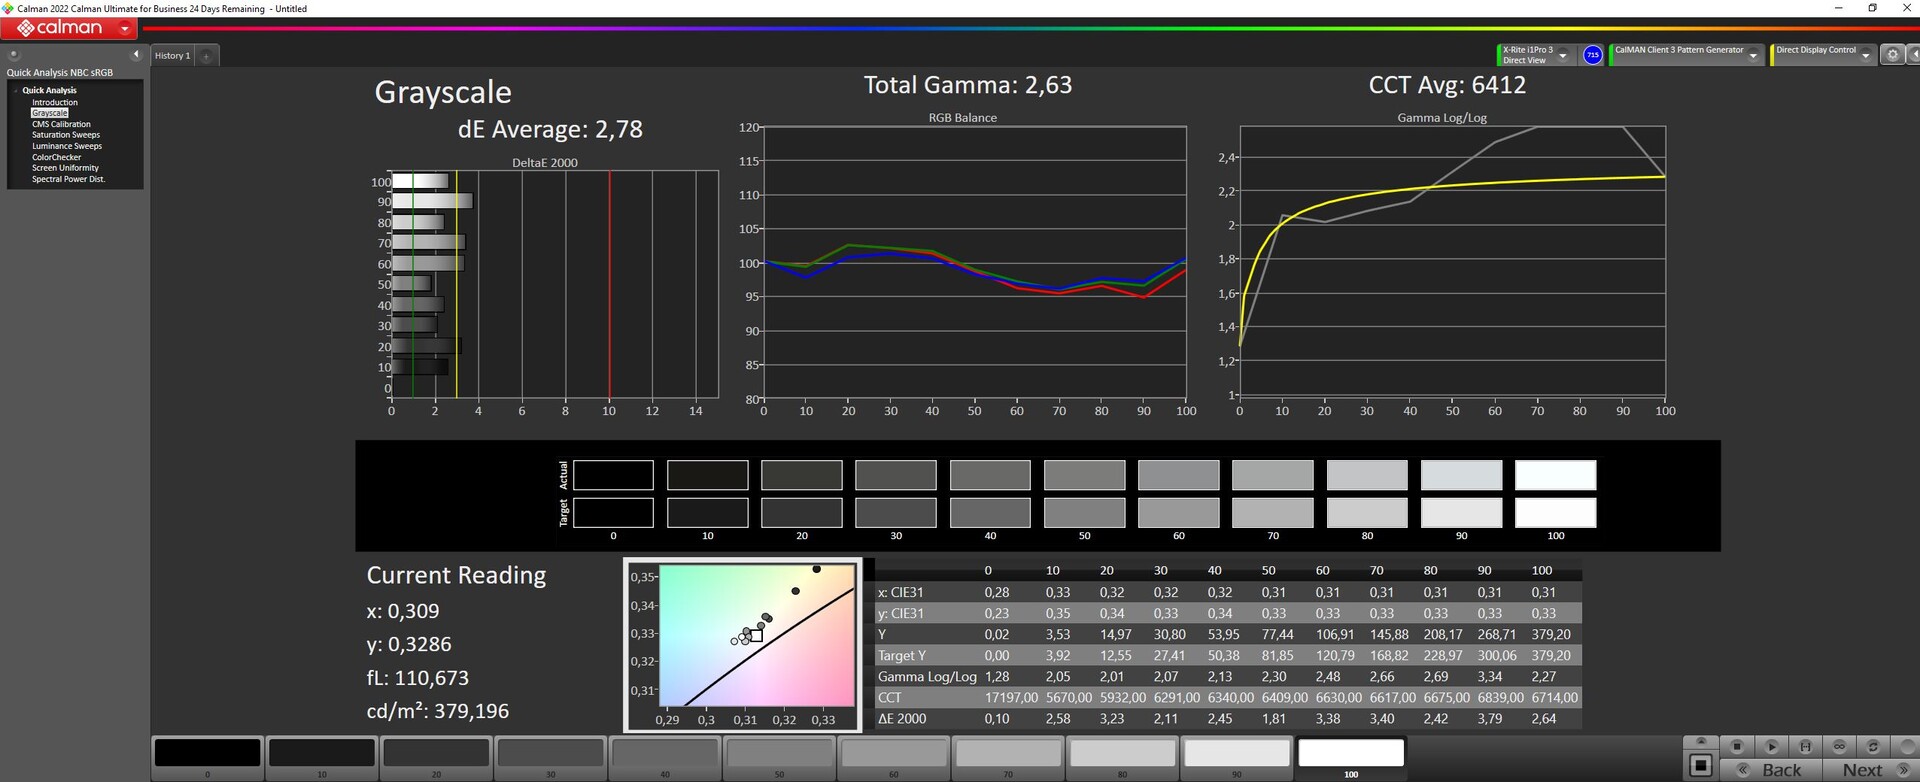
ΔE ColorChecker Calman: 2.52 | ∀{0.5-29.43 Ø4.73}
calibrated: 2.52
ΔE Greyscale Calman: 2.78 | ∀{0.09-98 Ø4.97}
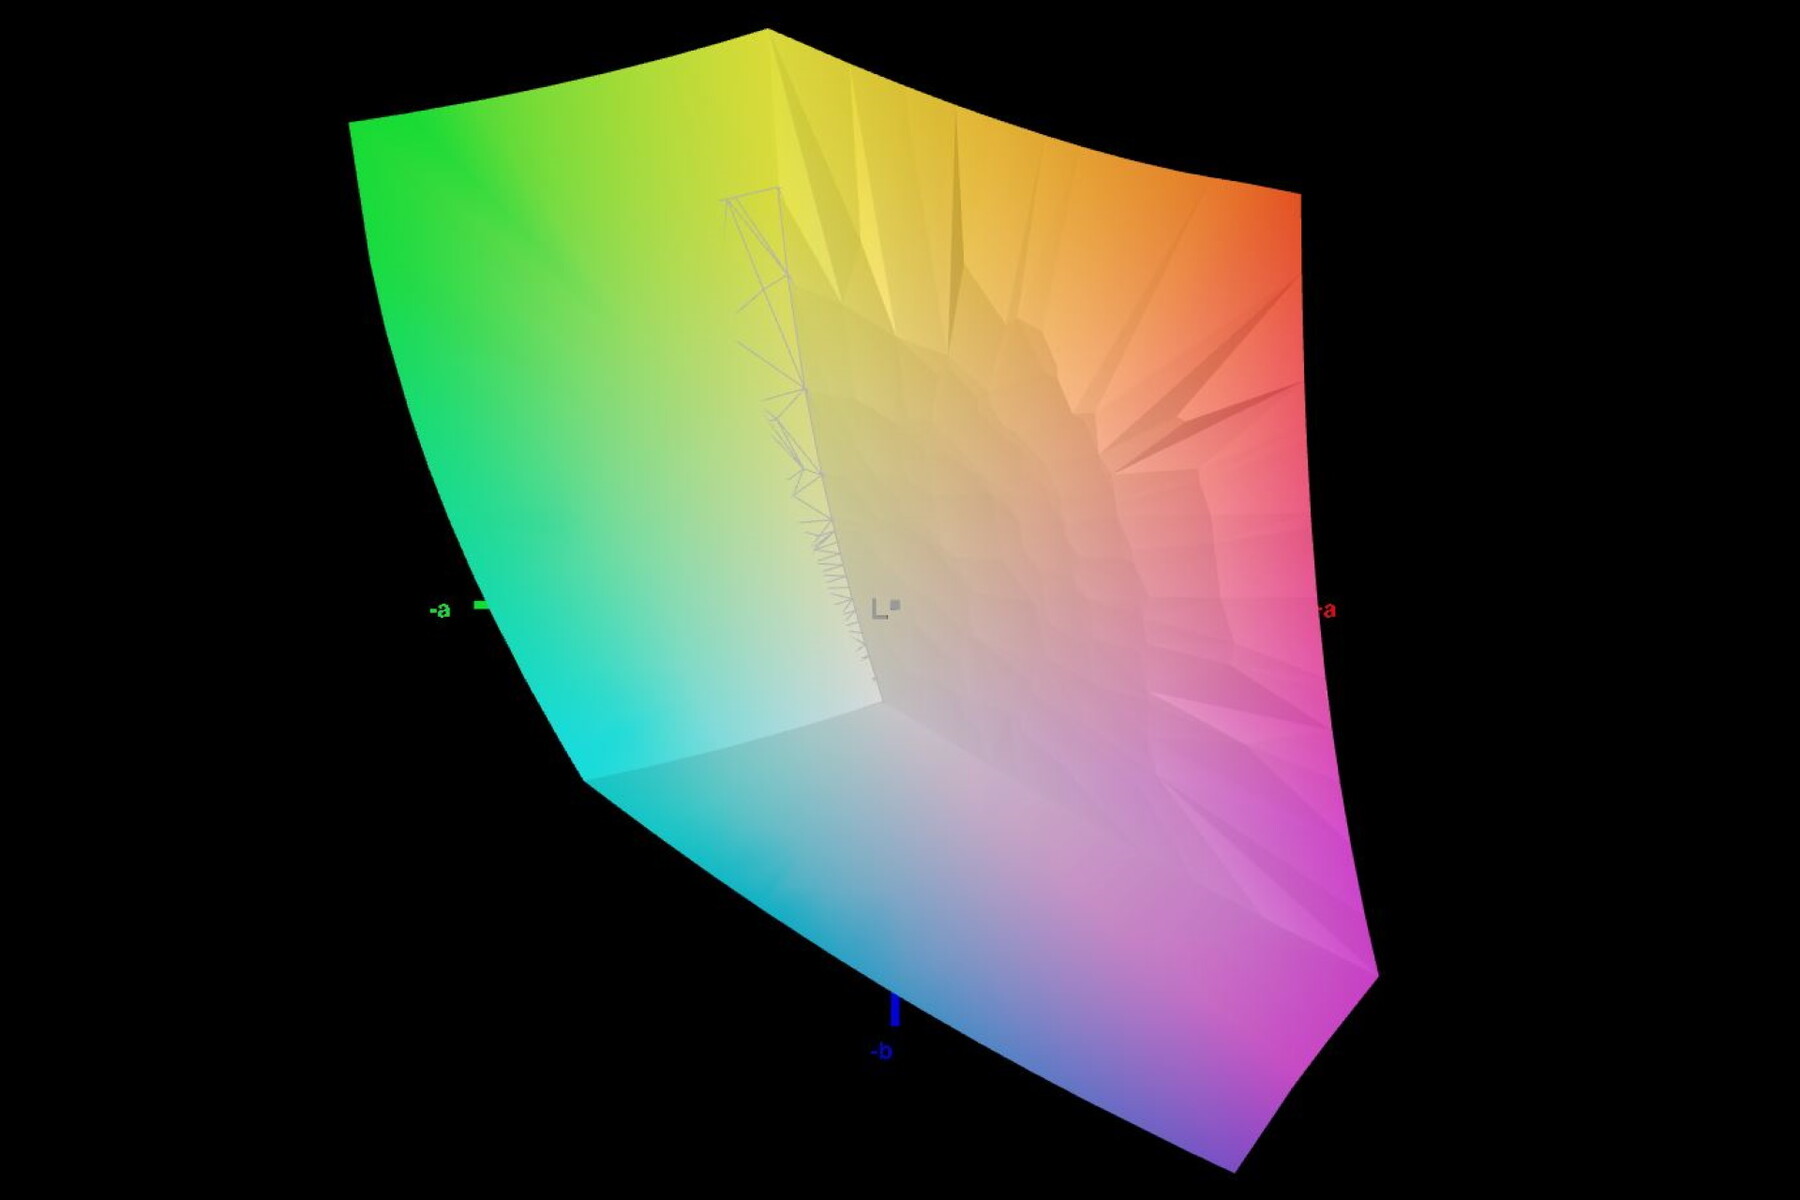
94.07% AdobeRGB 1998 (Argyll 3D)
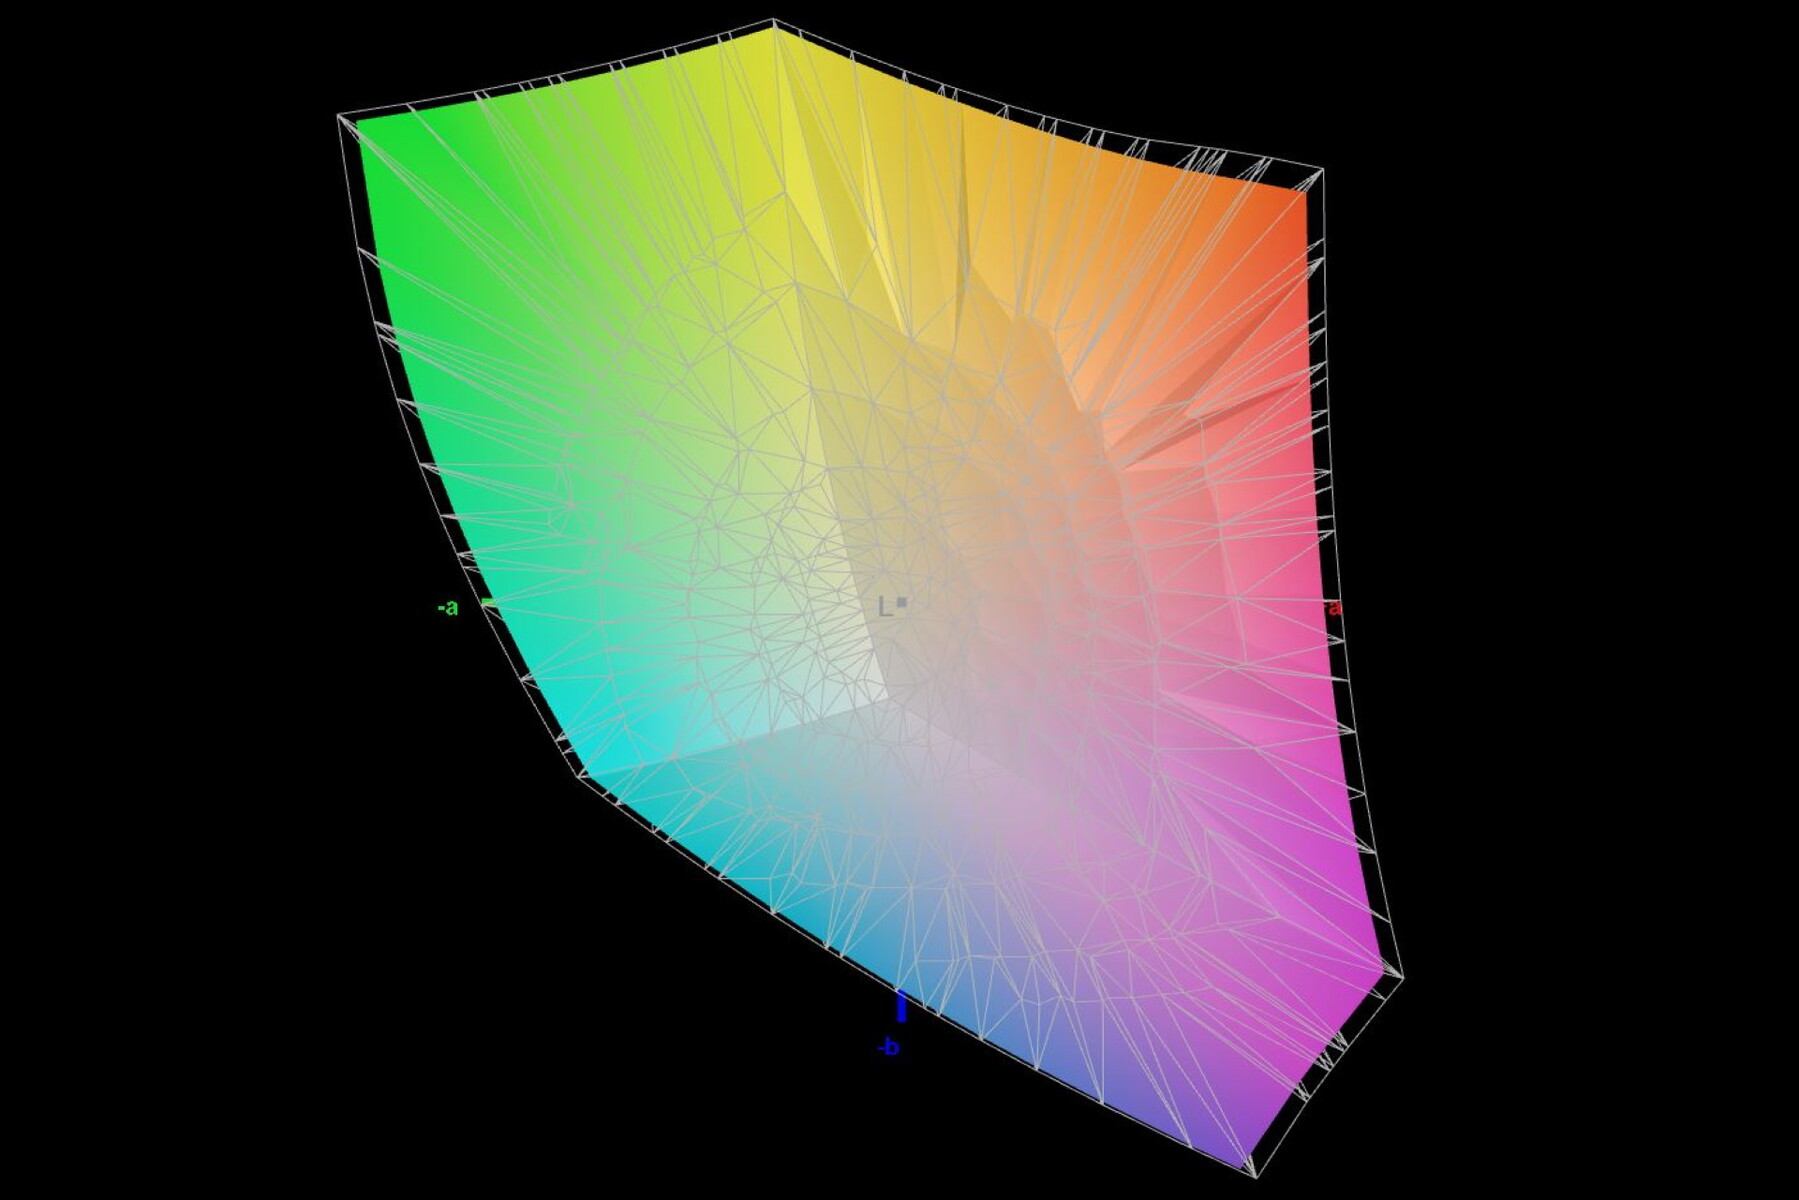
99.1% sRGB (Argyll 3D)
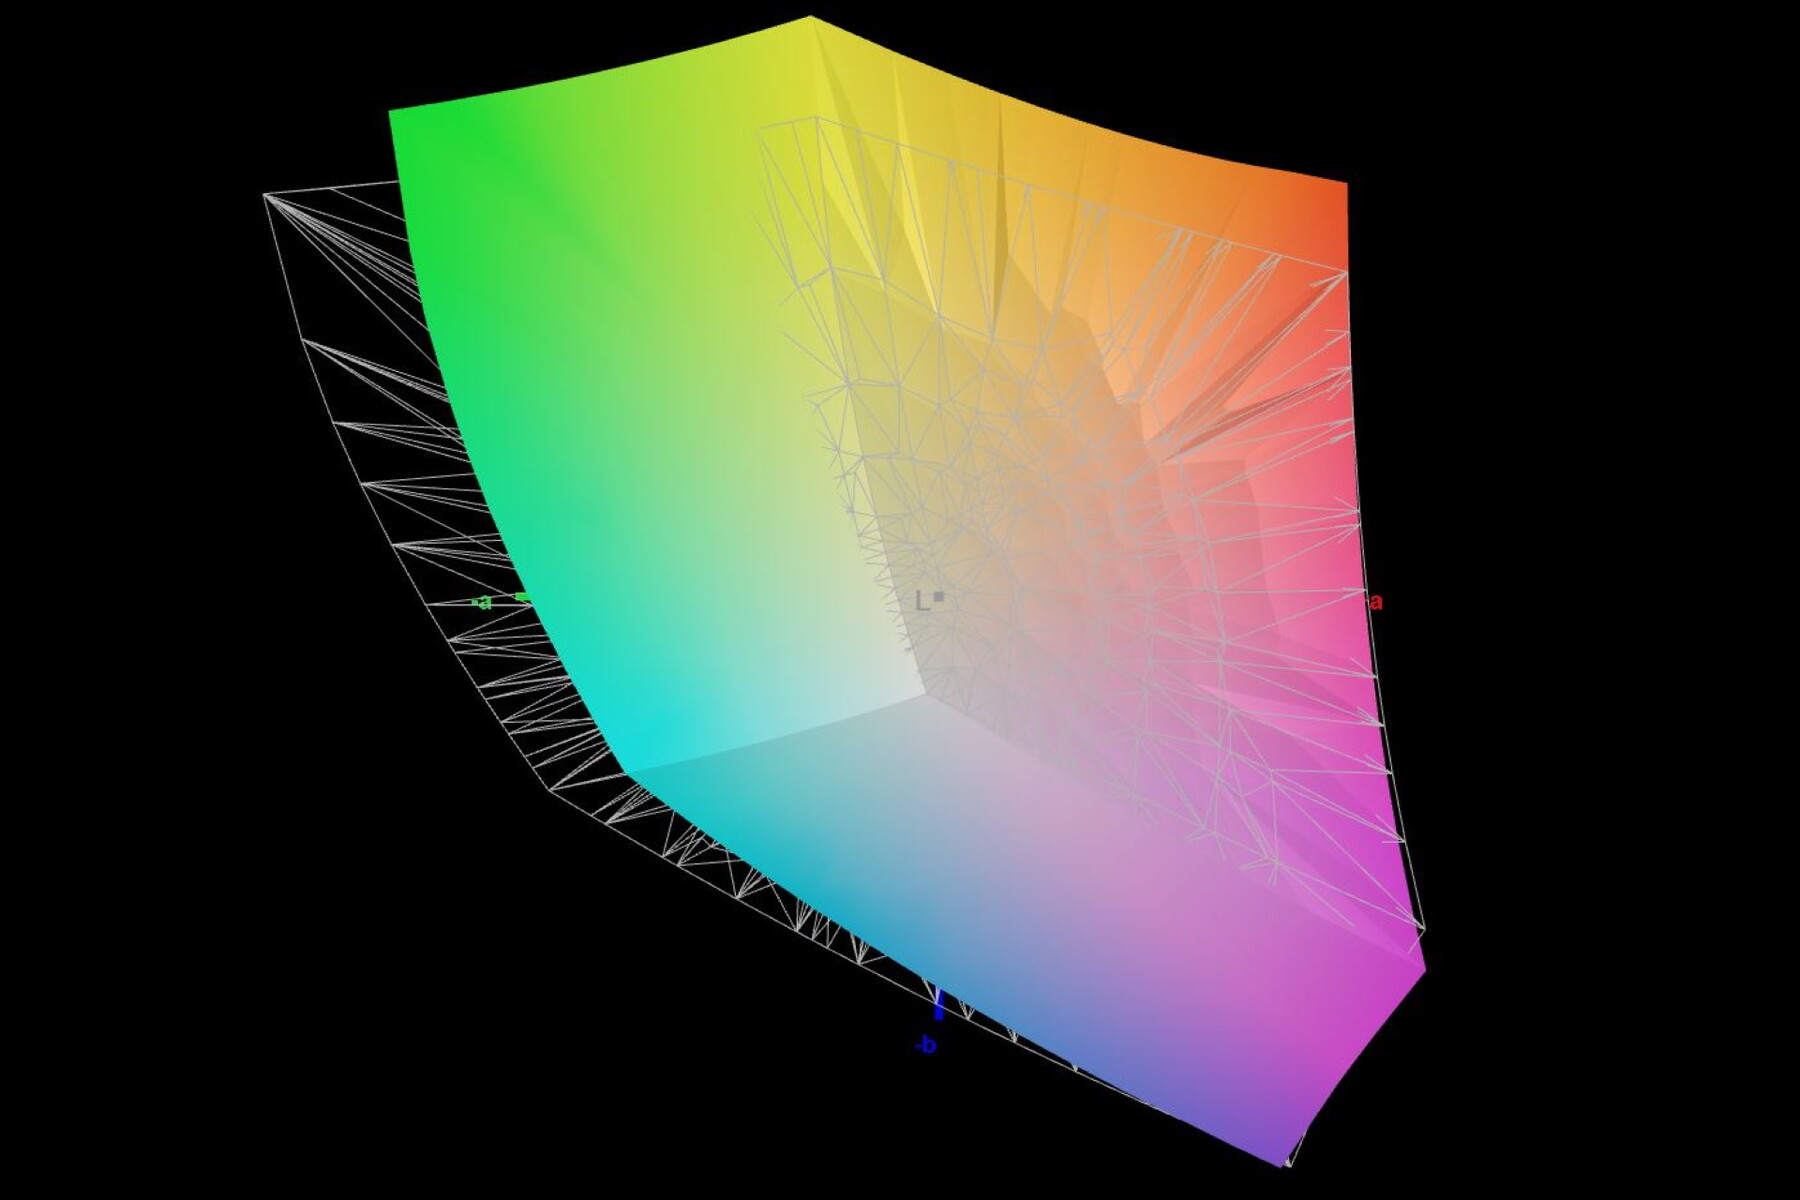
92% Display P3 (Argyll 3D)
Gamma: 2.63
CCT: 6412 K
| MSI Stealth 17 Studio A13VH-014 AUO41A2 B173ZAN06.C, Mini LED, 3840x2160, 17.3" | Gigabyte Aero 16 YE5 Samsung SDC416B, AMOLED, 3840x2400, 16" | HP Omen 17-ck2097ng BOE BOE09BF, IPS, 2560x1440, 17.3" | Razer Blade 16 Early 2023 CSOT T3 MNG007DA4-1, IPS, 2560x1600, 16" | Aorus 17X AZF BOE09F9, IPS, 2560x1440, 17.3" | Asus ROG Strix G17 G713PI BOE0B69, IPS, 2560x1440, 17.3" | |
|---|---|---|---|---|---|---|
| Display | -18% | 1% | -1% | -0% | ||
| Display P3 Coverage (%) | 92 | 67.4 -27% | 98.5 7% | 96.7 5% | 98.3 7% | |
| sRGB Coverage (%) | 99.1 | 97.6 -2% | 100 1% | 99.9 1% | 100 1% | |
| AdobeRGB 1998 Coverage (%) | 94.07 | 69.6 -26% | 89.7 -5% | 84.5 -10% | 85.9 -9% | |
| Response Times | -64% | -635% | -875% | -730% | -599% | |
| Response Time Grey 50% / Grey 80% * (ms) | 46.4 ? | 2.4 ? 95% | 15.6 ? 66% | 6.6 ? 86% | 14 ? 70% | 5.3 ? 89% |
| Response Time Black / White * (ms) | 0.62 ? | 2 ? -223% | 8.9 ? -1335% | 12 ? -1835% | 10.1 ? -1529% | 8.6 ? -1287% |
| PWM Frequency (Hz) | 2400 | 60 ? | ||||
| Screen | 24% | -169% | -195% | -163% | -195% | |
| Brightness middle (cd/m²) | 397.29 | 368 -7% | 371 -7% | 456.8 15% | 294 -26% | 327 -18% |
| Brightness (cd/m²) | 392 | 368 -6% | 350 -11% | 437 11% | 276 -30% | 320 -18% |
| Brightness Distribution (%) | 93 | 93 0% | 90 -3% | 83 -11% | 90 -3% | 89 -4% |
| Black Level * (cd/m²) | 0.02 | 0.01 50% | 0.32 -1500% | 0.35 -1650% | 0.28 -1300% | 0.38 -1800% |
| Contrast (:1) | 19865 | 36800 85% | 1159 -94% | 1305 -93% | 1050 -95% | 861 -96% |
| Colorchecker dE 2000 * | 2.52 | 2.33 8% | 1.74 31% | 3.7 -47% | 2.81 -12% | 1.01 60% |
| Colorchecker dE 2000 max. * | 3.91 | 4.34 -11% | 3.59 8% | 6.42 -64% | 5.7 -46% | 4.01 -3% |
| Colorchecker dE 2000 calibrated * | 2.52 | 1.01 60% | 0.66 74% | 0.86 66% | 0.41 84% | |
| Greyscale dE 2000 * | 2.78 | 0.8 71% | 2.8 -1% | 2.6 6% | 3.4 -22% | 1.6 42% |
| Gamma | 2.63 84% | 2.119 104% | 2.19 100% | 2.3 96% | 2.301 96% | 2.168 101% |
| CCT | 6412 101% | 6569 99% | 6474 100% | 6108 106% | 7389 88% | 6659 98% |
| Total Average (Program / Settings) | -20% /
6% | -274% /
-203% | -356% /
-250% | -298% /
-209% | -265% /
-211% |
* ... smaller is better
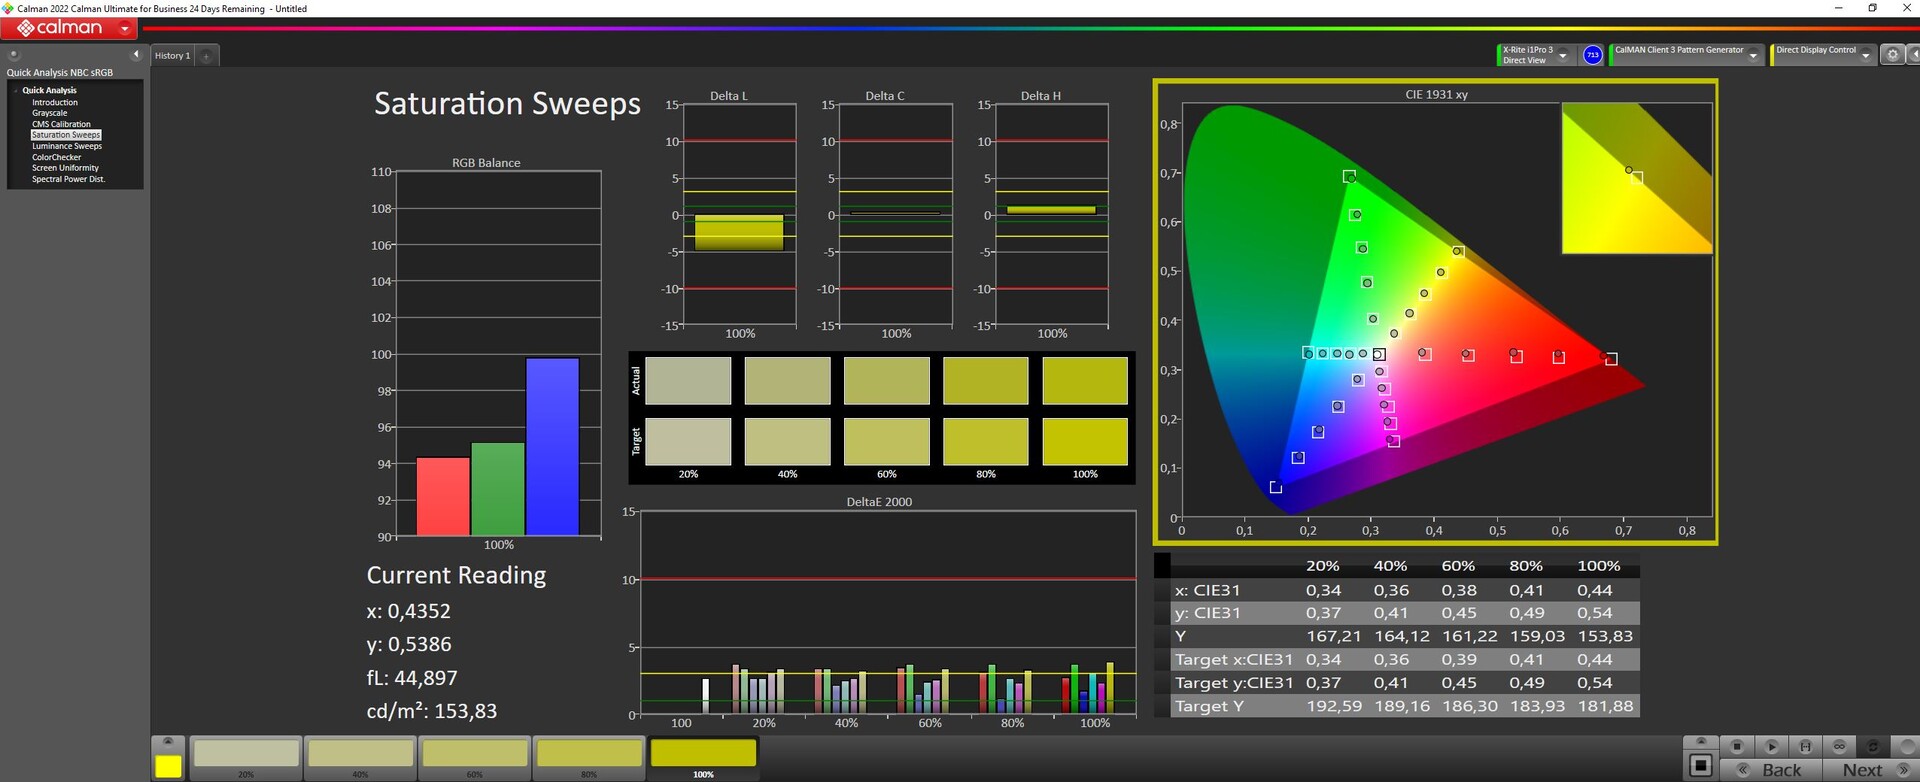
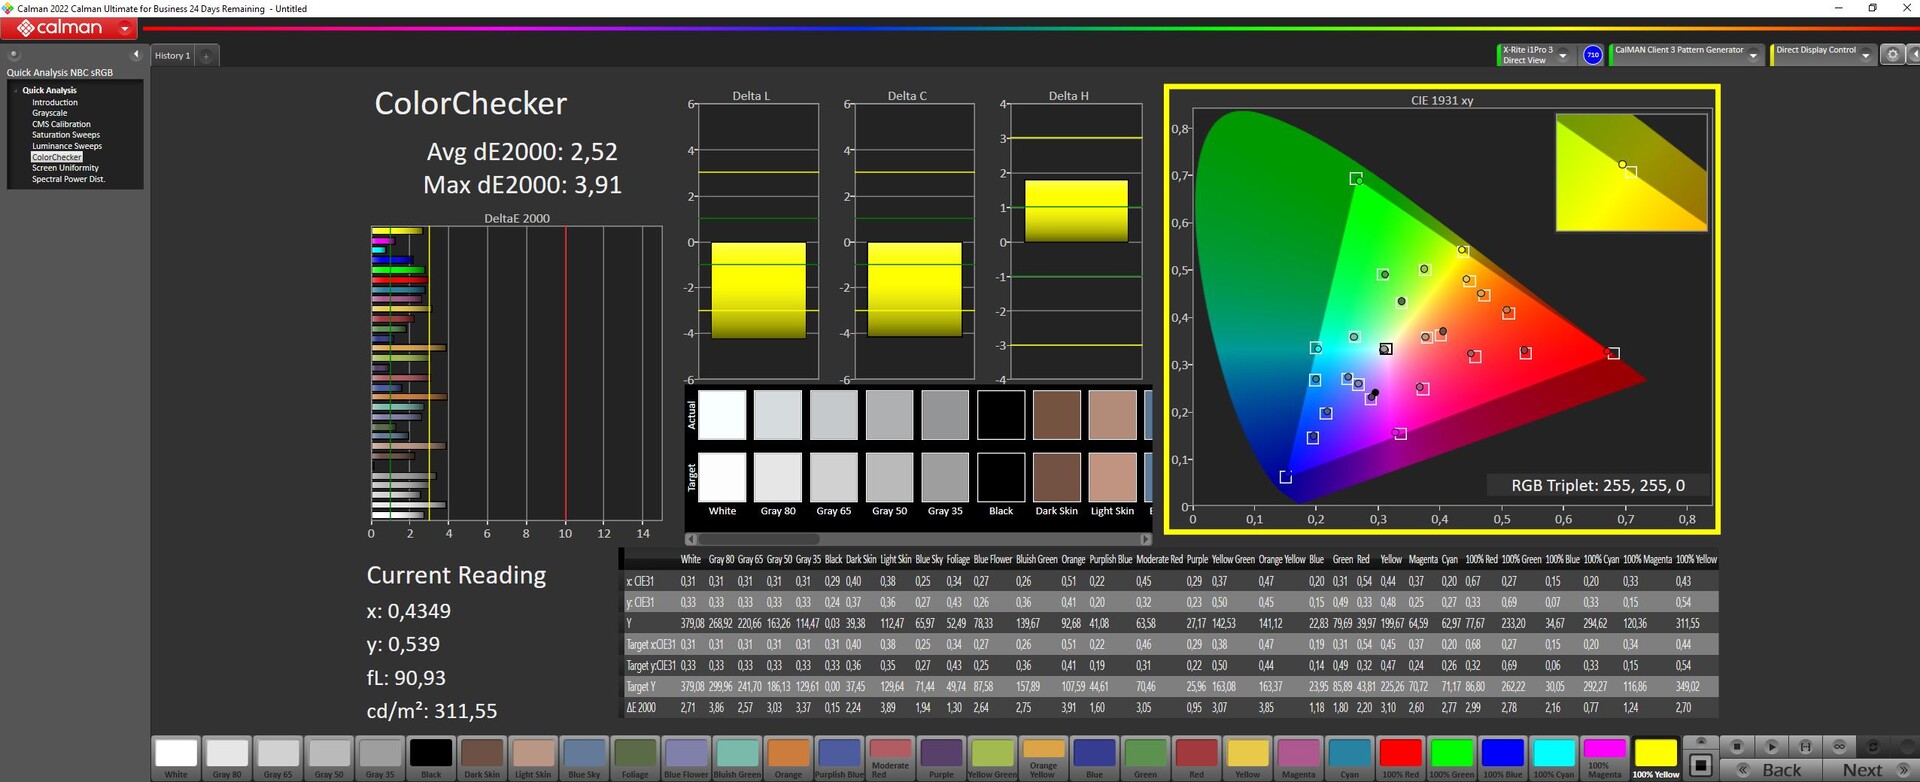
The typical color space coverage does not appear quite perfect. In particular, DCI-P3 lacks a little radiance. The fact the display belongs to the premium category is demonstrated by 94 percent AdobeRGB cold space coverage. Most competing IPS panels lag quite a bit behind.
From the off, color reproduction accuracy is good. At 2.5, the measured DeltaE value sits below the perceptibility level. Even the maximum detected deviation of some brown tones ought to be imperceptible to most people. Subsequent calibration failed to result in improvements.
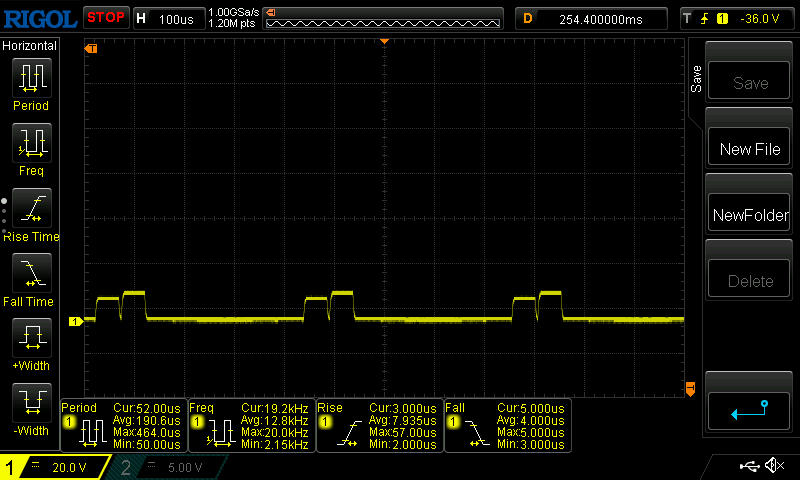
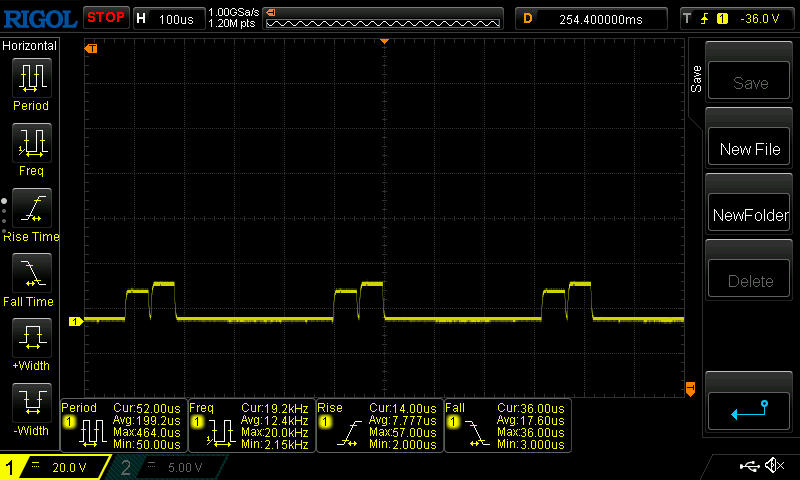
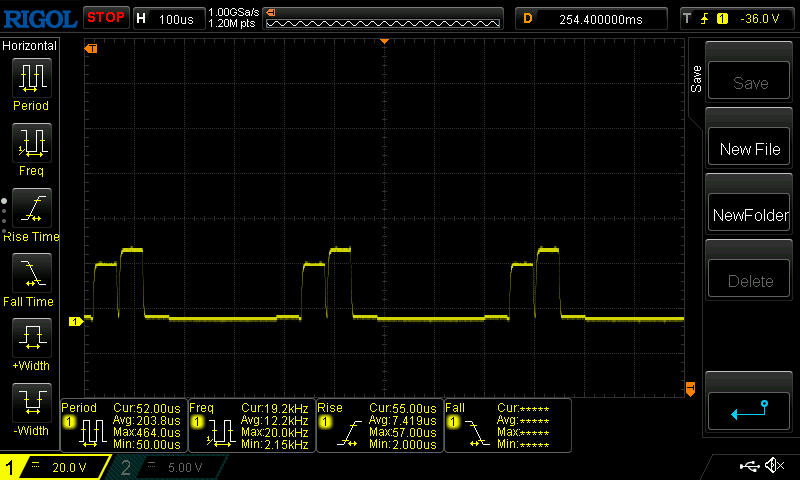
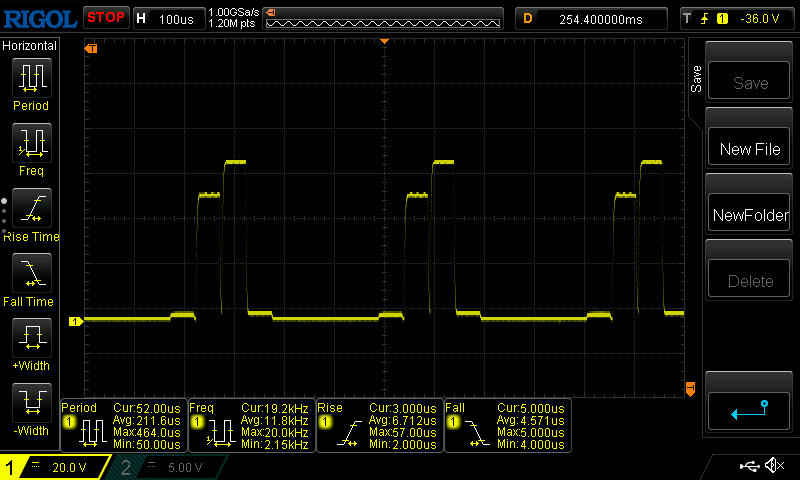
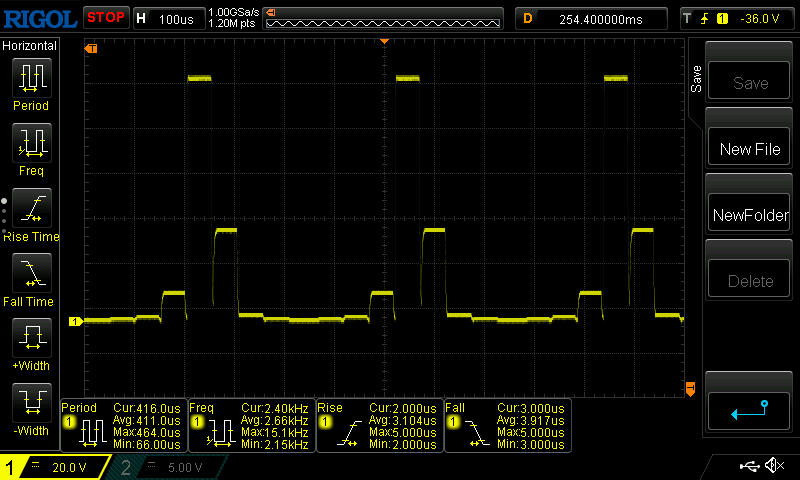
We were able to detect PWM-related flickering with a frequency of 2.4 kHz. However, the intensity thereof is hardly comparable to a typical LED display. Thanks to the mini-LED's fine rastering, very limited areas are momentarily turned off. That doesn't necessarily mean that users of a sensitive disposition won't notice it.
Across all brightness levels and with short exposure times, a dense array of slightly dark stripes can be seen to run across the picture. It appears the backlighting doesn't go off completely. This is due to only a tiny LED area being deactivated while the surrounding mini-LEDs seem to illuminate the switched-off part. As a result, the darkening appears significantly less intensive.
With an exposure time of 1/500 second, this can be clearly seen. This is seen in the images under the analysis data: With mini-LEDs, a few areas are slightly darkened. By contrast, with normal LED backlighting, a large area remains completely black for a few fractions of a second as a bigger area is switched off.
The gray-to-gray response time is not impressive - as with other mini-LED panels. On the other hand, the switch from light to dark is on a very good level.
Display Response Times
| ↔ Response Time Black to White | ||
|---|---|---|
| 0.62 ms ... rise ↗ and fall ↘ combined | ↗ 0.42 ms rise | 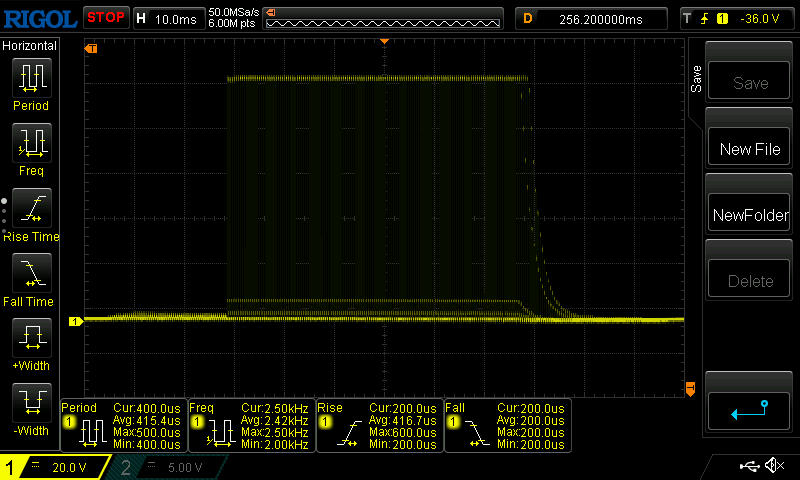 |
| ↘ 0.2 ms fall | ||
| The screen shows very fast response rates in our tests and should be very well suited for fast-paced gaming. In comparison, all tested devices range from 0.1 (minimum) to 240 (maximum) ms. » 1 % of all devices are better. This means that the measured response time is better than the average of all tested devices (19.9 ms). | ||
| ↔ Response Time 50% Grey to 80% Grey | ||
| 46.4 ms ... rise ↗ and fall ↘ combined | ↗ 24 ms rise | 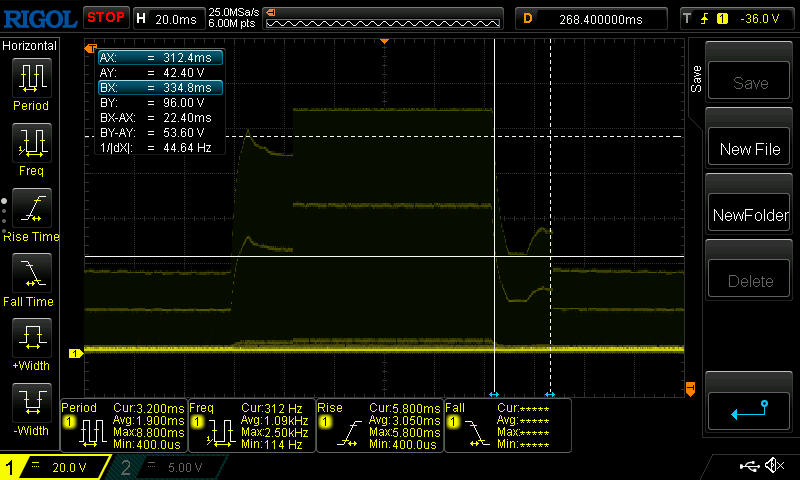 |
| ↘ 22.4 ms fall | ||
| The screen shows slow response rates in our tests and will be unsatisfactory for gamers. In comparison, all tested devices range from 0.165 (minimum) to 636 (maximum) ms. » 80 % of all devices are better. This means that the measured response time is worse than the average of all tested devices (31.1 ms). | ||
Screen Flickering / PWM (Pulse-Width Modulation)
| Screen flickering / PWM detected | 2400 Hz |  | |
The display backlight flickers at 2400 Hz (worst case, e.g., utilizing PWM) . The frequency of 2400 Hz is quite high, so most users sensitive to PWM should not notice any flickering. In comparison: 52 % of all tested devices do not use PWM to dim the display. If PWM was detected, an average of 7816 (minimum: 5 - maximum: 343500) Hz was measured. | |||
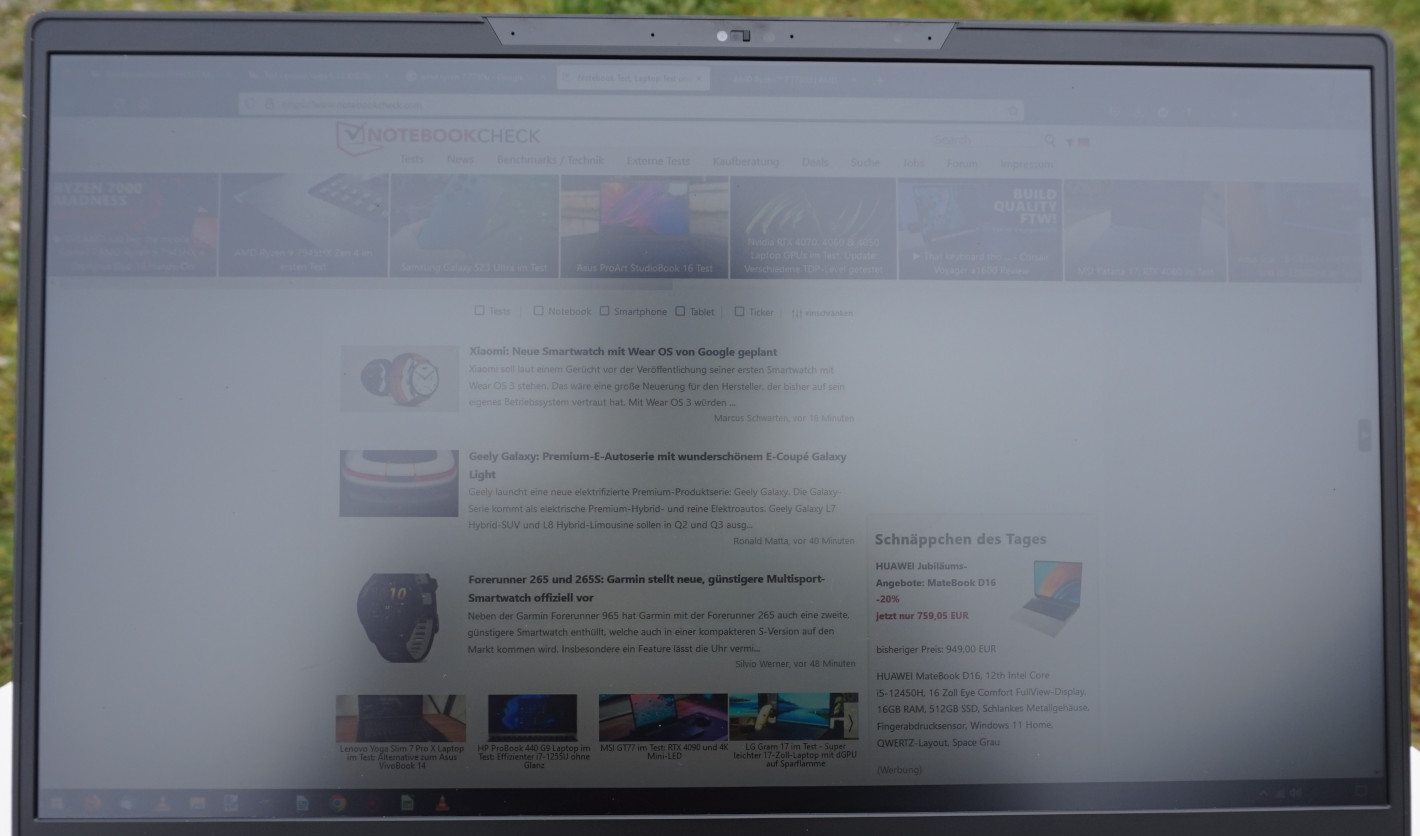
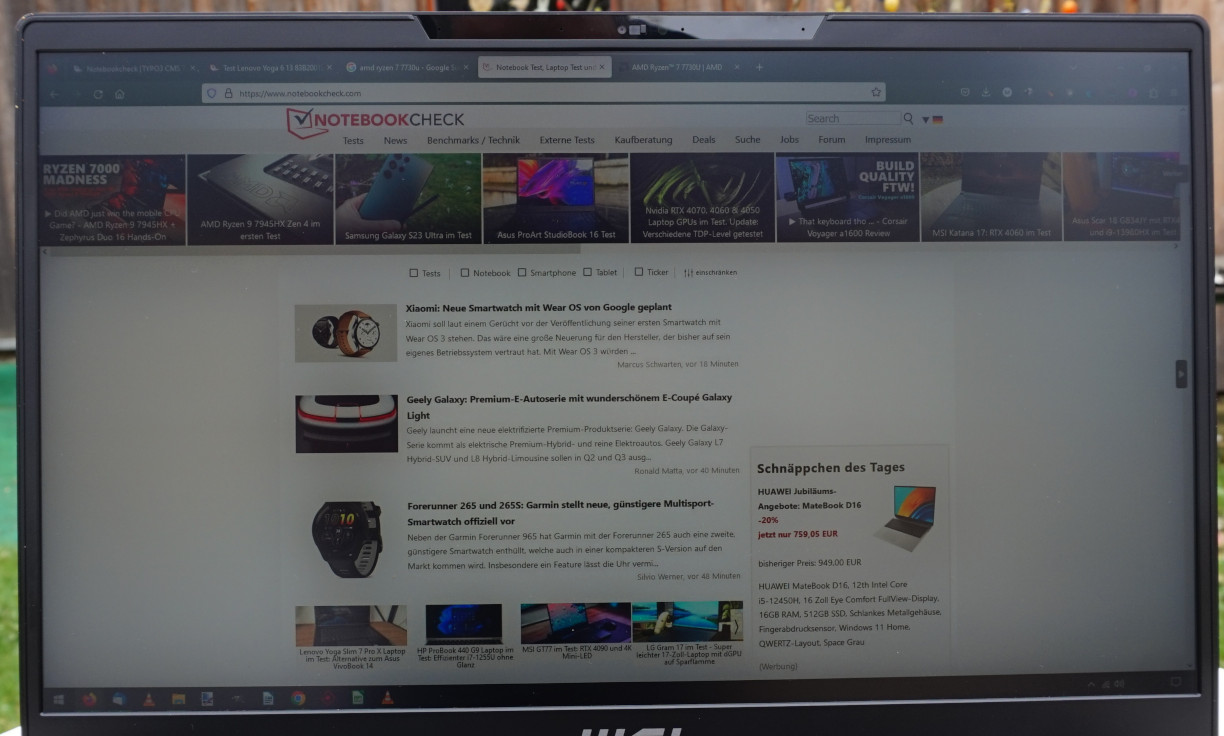
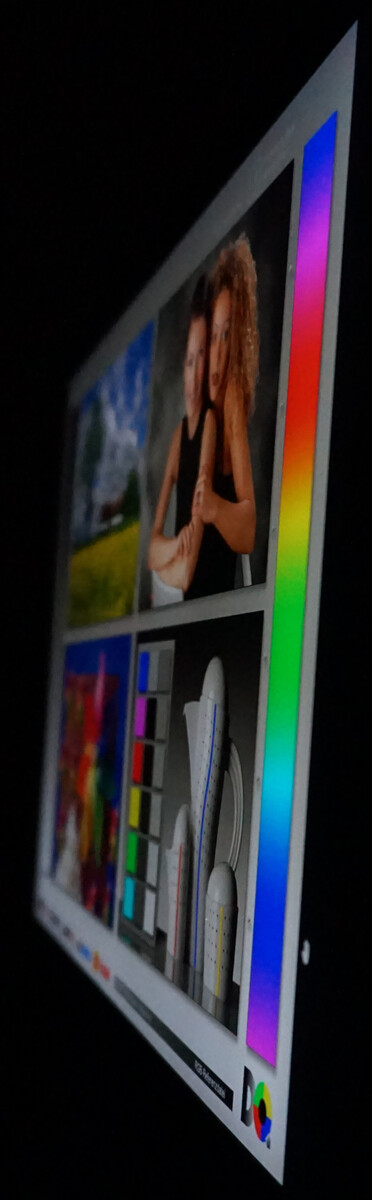
Despite good contrast values, the display has problems outdoors. Even when only slightly overcast, sunlight cast directly onto the screen should be avoided as the display becomes otherwise illegible. Pointed away from the light, text remains legible and images are also sufficiently recognisable.
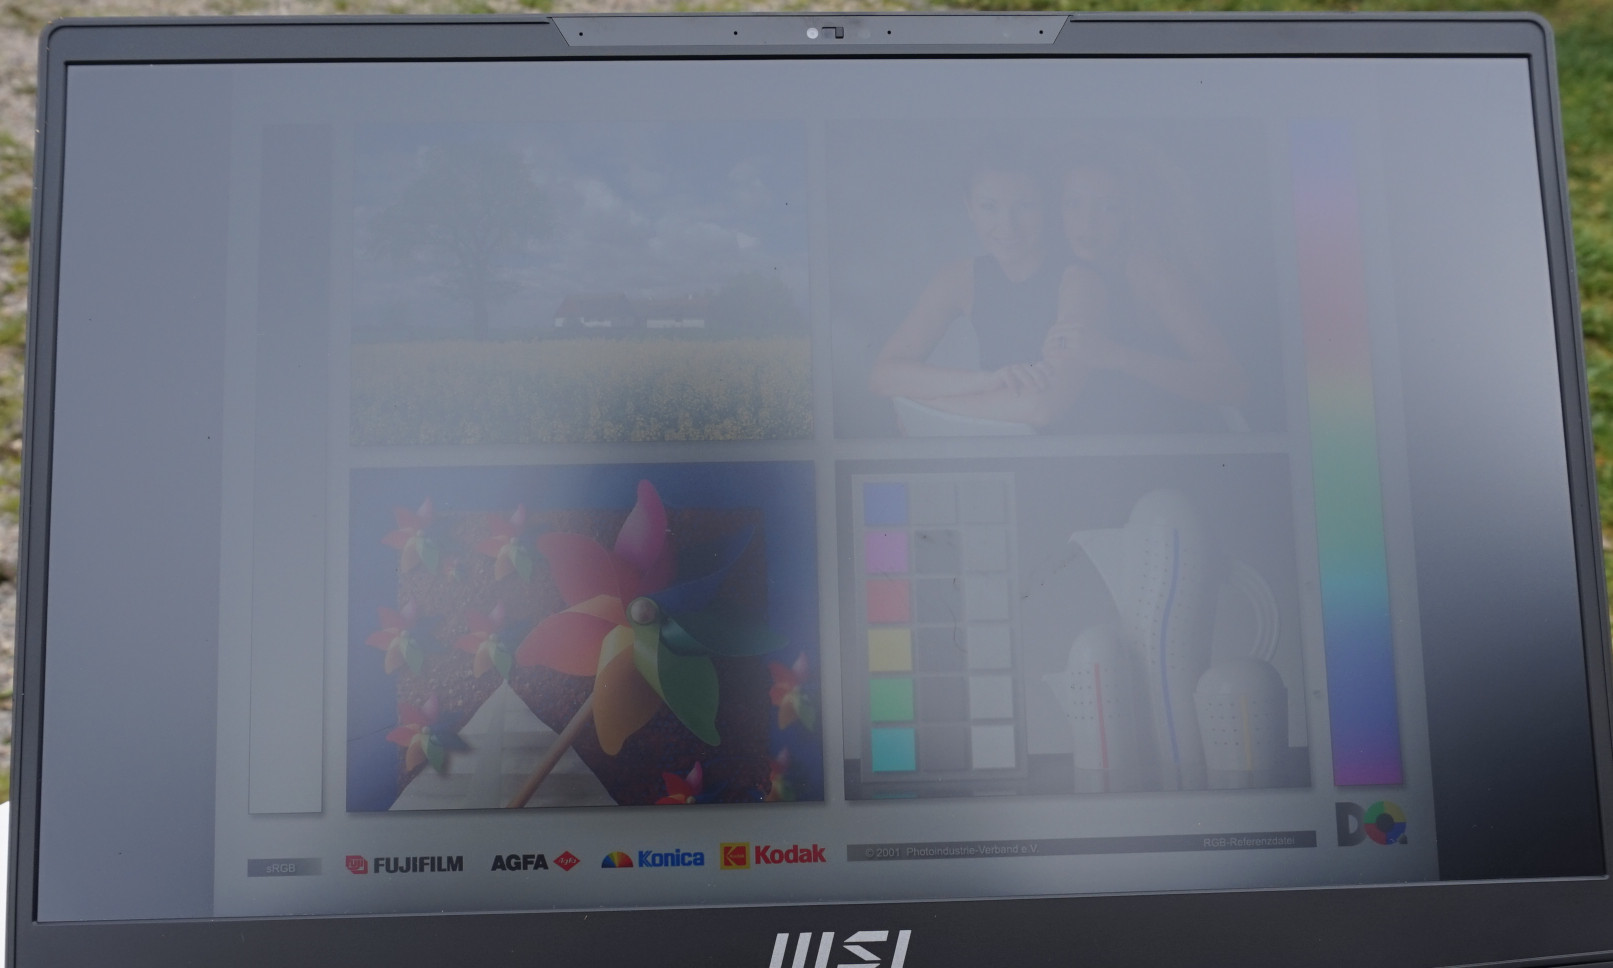
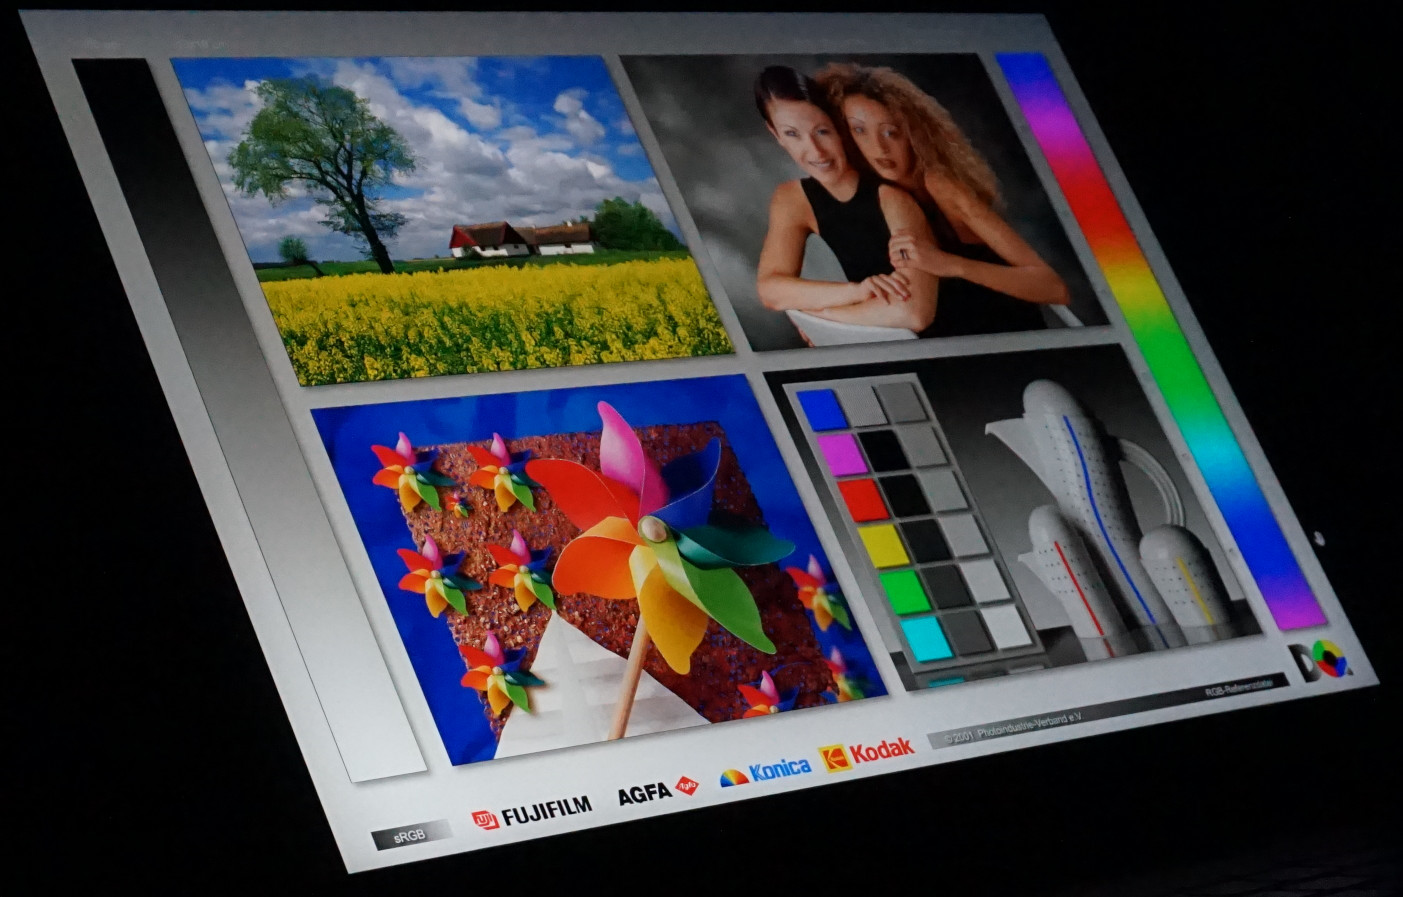
Viewing angle stability is exceptional. Even when viewed from a very steep, wide angle, colors and brightness remain unchanged.
Performance - Hardware restraints are practical
There's hardly anything that should pose problems for the Intel Core i9-13900H and the Nvidia GeForce RTX 4080. Thanks to high-level computational power, numerous computing cores and powerful graphics, various types of applications, as well as demanding games, can be dealt with effortlessly. There is also the 64 GB of RAM which comes into its own when multitasking or editing complex images. Regardless of the task, whether installing software or booting programmes, the machine's high operational speed is tangible.
Test conditions
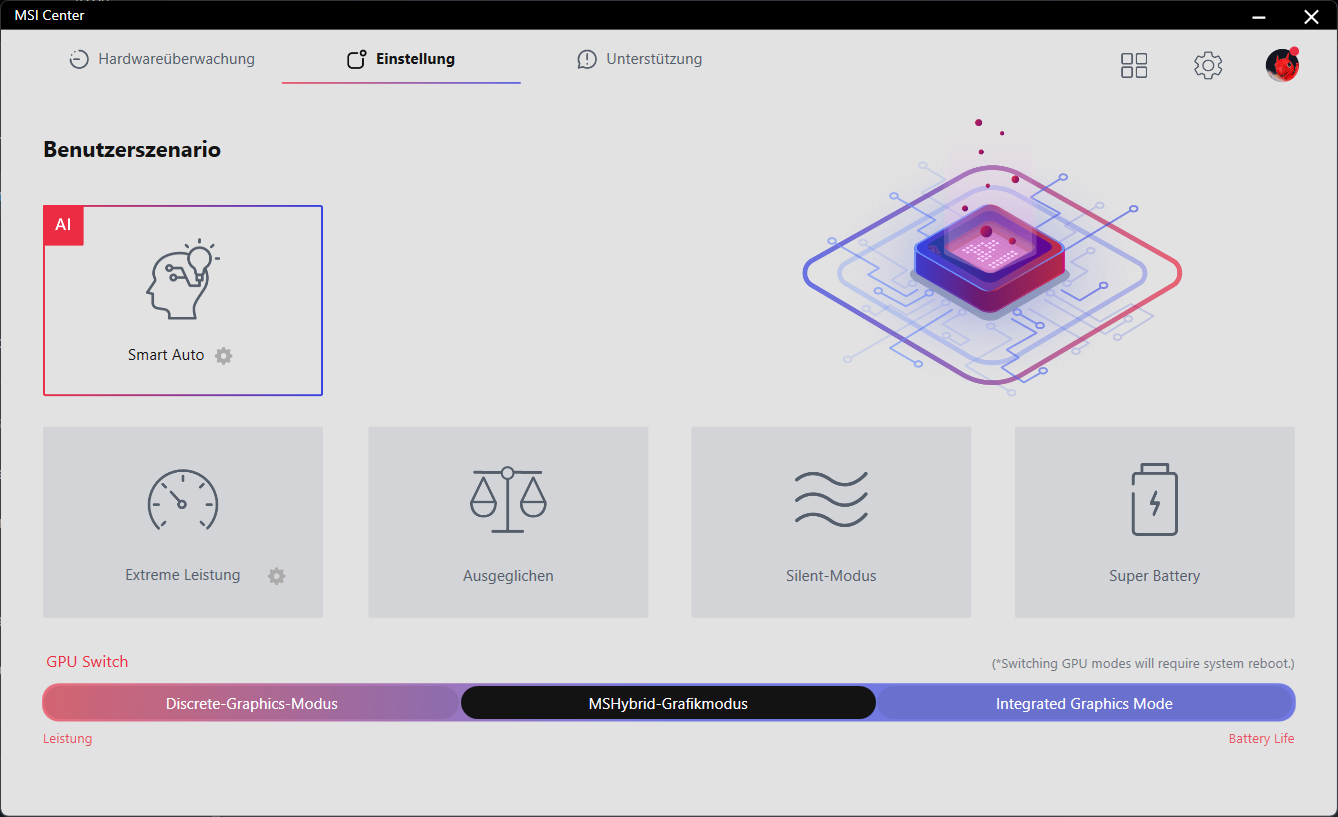
For every test and benchmark, we used the "Smart Auto" performance mode. This mode is supposed to be able to independently determine the required mix of graphics and computing power as well as fan settings, with the help of artificial intelligence.
The Stealth 17 Studio remains moderately loud and seldom results in the fans being switched on. By contrast, "Extreme Performance" mode reminded us significantly more of the kind of behavior associated with a gaming laptop. However, since the aim here is a successful mix of gaming and work, the quieter mode is preferable. We can also see below that "Extreme Performance" doesn't automatically result in better performance. Conversely, during the entire testing, the automatic setting was impressive.
It's worth noting: During the entire testing period, two BIOS updates were necessary. The first one resulted in acceptable battery life which was previously only half as long. After the second one, blue screens disappeared which had previously been reliably triggered by various hardware tests.
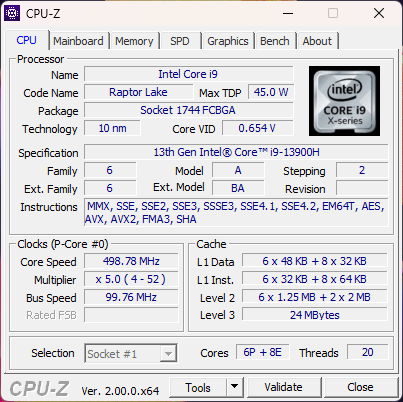
Processor
A total of 14 cores, 20 threads and a top clock speed of 5.4 GHz power the Intel Core i9-13900H. This places it high in the rankings of mobile CPUs. There are faster cores such as the AMD Ryzen 9 7945HX or the Intel Core i9-13950HX. However, the gap behind its predecessor, the Intel Core i9-12900H, proved to be 10 % or more in various tests.
But even the Intel Core i9-13900HX, which likewise promises more power, was on a similar level to the 13900H (found in competing models) after only a few runs in our Cinebench R15 continuous test. This speaks in favor of good cooling and power supply settings in the MSI Stealth 17 Studio. The laptop displayed only moderate fluctuations between the individual test runs.
The 115-watt power consumption - which is permitted over a longer period - was reached regularly. Additionally, 135 watts were permitted for fractions of a second. Only in "Silent" mode was power consumption limited to 30 watts while in battery mode even up to 45 watts were permitted.
Further benchmarks and comparison values can be found in our CPU benchmark list.
Cinebench R15 Multi Continuous Test
Cinebench R23: Multi Core | Single Core
Cinebench R20: CPU (Multi Core) | CPU (Single Core)
Cinebench R15: CPU Multi 64Bit | CPU Single 64Bit
Blender: v2.79 BMW27 CPU
7-Zip 18.03: 7z b 4 | 7z b 4 -mmt1
Geekbench 5.5: Multi-Core | Single-Core
HWBOT x265 Benchmark v2.2: 4k Preset
LibreOffice : 20 Documents To PDF
R Benchmark 2.5: Overall mean
| CPU Performance rating | |
| Lenovo Legion Pro 7 16IRX8H | |
| Schenker XMG Neo 16 Raptor Lake | |
| Razer Blade 16 Early 2023 | |
| Average of class Gaming | |
| Asus ROG Zephyrus M16 GU604VY-NM042X | |
| MSI Stealth 17 Studio A13VH-014 | |
| Alienware x17 R2 P48E | |
| Average Intel Core i9-13900H | |
| MSI Creator Z17 A12UGST-054 | |
| Gigabyte AERO 16 OLED BSF | |
| Razer Blade 17 Early 2022 | |
| Cinebench R23 / Single Core | |
| Schenker XMG Neo 16 Raptor Lake | |
| Lenovo Legion Pro 7 16IRX8H | |
| Razer Blade 16 Early 2023 | |
| Average of class Gaming (1166 - 2356, n=112, last 2 years) | |
| Asus ROG Zephyrus M16 GU604VY-NM042X | |
| Razer Blade 17 Early 2022 | |
| Alienware x17 R2 P48E | |
| Average Intel Core i9-13900H (1297 - 2054, n=26) | |
| MSI Creator Z17 A12UGST-054 | |
| Gigabyte AERO 16 OLED BSF | |
| MSI Stealth 17 Studio A13VH-014 | |
| Cinebench R20 / CPU (Multi Core) | |
| Lenovo Legion Pro 7 16IRX8H | |
| Schenker XMG Neo 16 Raptor Lake | |
| Average of class Gaming (4029 - 16108, n=111, last 2 years) | |
| Razer Blade 16 Early 2023 | |
| MSI Stealth 17 Studio A13VH-014 | |
| Asus ROG Zephyrus M16 GU604VY-NM042X | |
| Gigabyte AERO 16 OLED BSF | |
| Alienware x17 R2 P48E | |
| Average Intel Core i9-13900H (4935 - 7716, n=25) | |
| MSI Creator Z17 A12UGST-054 | |
| Razer Blade 17 Early 2022 | |
| Cinebench R20 / CPU (Single Core) | |
| Lenovo Legion Pro 7 16IRX8H | |
| Average of class Gaming (442 - 895, n=111, last 2 years) | |
| Schenker XMG Neo 16 Raptor Lake | |
| Asus ROG Zephyrus M16 GU604VY-NM042X | |
| Razer Blade 16 Early 2023 | |
| Alienware x17 R2 P48E | |
| Average Intel Core i9-13900H (428 - 792, n=25) | |
| MSI Creator Z17 A12UGST-054 | |
| Razer Blade 17 Early 2022 | |
| MSI Stealth 17 Studio A13VH-014 | |
| Gigabyte AERO 16 OLED BSF | |
| Cinebench R15 / CPU Multi 64Bit | |
| Schenker XMG Neo 16 Raptor Lake | |
| Schenker XMG Neo 16 Raptor Lake | |
| Lenovo Legion Pro 7 16IRX8H | |
| Razer Blade 16 Early 2023 | |
| Average of class Gaming (1578 - 6271, n=112, last 2 years) | |
| Asus ROG Zephyrus M16 GU604VY-NM042X | |
| MSI Stealth 17 Studio A13VH-014 | |
| Gigabyte AERO 16 OLED BSF | |
| Alienware x17 R2 P48E | |
| Average Intel Core i9-13900H (2061 - 3100, n=26) | |
| MSI Creator Z17 A12UGST-054 | |
| Razer Blade 17 Early 2022 | |
| Cinebench R15 / CPU Single 64Bit | |
| Lenovo Legion Pro 7 16IRX8H | |
| Schenker XMG Neo 16 Raptor Lake | |
| Schenker XMG Neo 16 Raptor Lake | |
| Average of class Gaming (188.8 - 343, n=111, last 2 years) | |
| Asus ROG Zephyrus M16 GU604VY-NM042X | |
| MSI Stealth 17 Studio A13VH-014 | |
| Razer Blade 16 Early 2023 | |
| Alienware x17 R2 P48E | |
| Average Intel Core i9-13900H (211 - 297, n=26) | |
| MSI Creator Z17 A12UGST-054 | |
| Razer Blade 17 Early 2022 | |
| Gigabyte AERO 16 OLED BSF | |
| Blender / v2.79 BMW27 CPU | |
| Razer Blade 17 Early 2022 | |
| MSI Creator Z17 A12UGST-054 | |
| Average Intel Core i9-13900H (166 - 268, n=24) | |
| Alienware x17 R2 P48E | |
| Gigabyte AERO 16 OLED BSF | |
| Asus ROG Zephyrus M16 GU604VY-NM042X | |
| MSI Stealth 17 Studio A13VH-014 | |
| Average of class Gaming (80 - 330, n=109, last 2 years) | |
| Razer Blade 16 Early 2023 | |
| Schenker XMG Neo 16 Raptor Lake | |
| Lenovo Legion Pro 7 16IRX8H | |
| 7-Zip 18.03 / 7z b 4 | |
| Lenovo Legion Pro 7 16IRX8H | |
| Schenker XMG Neo 16 Raptor Lake | |
| Razer Blade 16 Early 2023 | |
| Average of class Gaming (33491 - 148086, n=110, last 2 years) | |
| Asus ROG Zephyrus M16 GU604VY-NM042X | |
| MSI Stealth 17 Studio A13VH-014 | |
| Gigabyte AERO 16 OLED BSF | |
| Alienware x17 R2 P48E | |
| Average Intel Core i9-13900H (45045 - 79032, n=25) | |
| MSI Creator Z17 A12UGST-054 | |
| Razer Blade 17 Early 2022 | |
| 7-Zip 18.03 / 7z b 4 -mmt1 | |
| Lenovo Legion Pro 7 16IRX8H | |
| Schenker XMG Neo 16 Raptor Lake | |
| Razer Blade 16 Early 2023 | |
| Average of class Gaming (4199 - 7436, n=110, last 2 years) | |
| Asus ROG Zephyrus M16 GU604VY-NM042X | |
| MSI Stealth 17 Studio A13VH-014 | |
| Average Intel Core i9-13900H (3665 - 6600, n=25) | |
| Razer Blade 17 Early 2022 | |
| MSI Creator Z17 A12UGST-054 | |
| Alienware x17 R2 P48E | |
| Gigabyte AERO 16 OLED BSF | |
| Geekbench 5.5 / Multi-Core | |
| Lenovo Legion Pro 7 16IRX8H | |
| Schenker XMG Neo 16 Raptor Lake | |
| Razer Blade 16 Early 2023 | |
| Average of class Gaming (6460 - 27010, n=110, last 2 years) | |
| Asus ROG Zephyrus M16 GU604VY-NM042X | |
| Gigabyte AERO 16 OLED BSF | |
| MSI Stealth 17 Studio A13VH-014 | |
| Alienware x17 R2 P48E | |
| MSI Creator Z17 A12UGST-054 | |
| Average Intel Core i9-13900H (9094 - 15410, n=26) | |
| Razer Blade 17 Early 2022 | |
| Geekbench 5.5 / Single-Core | |
| MSI Stealth 17 Studio A13VH-014 | |
| Average of class Gaming (986 - 2474, n=110, last 2 years) | |
| Lenovo Legion Pro 7 16IRX8H | |
| Schenker XMG Neo 16 Raptor Lake | |
| Asus ROG Zephyrus M16 GU604VY-NM042X | |
| Average Intel Core i9-13900H (1140 - 2043, n=26) | |
| Alienware x17 R2 P48E | |
| MSI Creator Z17 A12UGST-054 | |
| Razer Blade 16 Early 2023 | |
| Razer Blade 17 Early 2022 | |
| Gigabyte AERO 16 OLED BSF | |
| HWBOT x265 Benchmark v2.2 / 4k Preset | |
| Lenovo Legion Pro 7 16IRX8H | |
| Schenker XMG Neo 16 Raptor Lake | |
| Razer Blade 16 Early 2023 | |
| Average of class Gaming (11.5 - 44.3, n=110, last 2 years) | |
| MSI Stealth 17 Studio A13VH-014 | |
| Asus ROG Zephyrus M16 GU604VY-NM042X | |
| Alienware x17 R2 P48E | |
| Gigabyte AERO 16 OLED BSF | |
| Average Intel Core i9-13900H (14.1 - 22.3, n=25) | |
| MSI Creator Z17 A12UGST-054 | |
| Razer Blade 17 Early 2022 | |
| LibreOffice / 20 Documents To PDF | |
| Gigabyte AERO 16 OLED BSF | |
| MSI Stealth 17 Studio A13VH-014 | |
| Asus ROG Zephyrus M16 GU604VY-NM042X | |
| Average of class Gaming (19 - 88.8, n=110, last 2 years) | |
| Average Intel Core i9-13900H (34.4 - 82.8, n=25) | |
| Razer Blade 16 Early 2023 | |
| Schenker XMG Neo 16 Raptor Lake | |
| Lenovo Legion Pro 7 16IRX8H | |
| Alienware x17 R2 P48E | |
| MSI Creator Z17 A12UGST-054 | |
| Razer Blade 17 Early 2022 | |
| R Benchmark 2.5 / Overall mean | |
| Gigabyte AERO 16 OLED BSF | |
| MSI Creator Z17 A12UGST-054 | |
| Average Intel Core i9-13900H (0.4052 - 0.723, n=25) | |
| Razer Blade 17 Early 2022 | |
| Alienware x17 R2 P48E | |
| Average of class Gaming (0.3439 - 0.759, n=111, last 2 years) | |
| MSI Stealth 17 Studio A13VH-014 | |
| Razer Blade 16 Early 2023 | |
| Asus ROG Zephyrus M16 GU604VY-NM042X | |
| Lenovo Legion Pro 7 16IRX8H | |
| Schenker XMG Neo 16 Raptor Lake | |
* ... smaller is better
AIDA64: FP32 Ray-Trace | FPU Julia | CPU SHA3 | CPU Queen | FPU SinJulia | FPU Mandel | CPU AES | CPU ZLib | FP64 Ray-Trace | CPU PhotoWorxx
| Performance rating | |
| Asus ROG Strix G17 G713PI | |
| Average of class Gaming | |
| Razer Blade 16 Early 2023 | |
| Aorus 17X AZF | |
| HP Omen 17-ck2097ng | |
| MSI Stealth 17 Studio A13VH-014 | |
| Average Intel Core i9-13900H | |
| Gigabyte Aero 16 YE5 | |
| AIDA64 / FP32 Ray-Trace | |
| Asus ROG Strix G17 G713PI | |
| Average of class Gaming (10227 - 85542, n=109, last 2 years) | |
| Razer Blade 16 Early 2023 | |
| Razer Blade 16 Early 2023 | |
| Razer Blade 16 Early 2023 | |
| MSI Stealth 17 Studio A13VH-014 | |
| Aorus 17X AZF | |
| HP Omen 17-ck2097ng | |
| Average Intel Core i9-13900H (6788 - 19557, n=25) | |
| Gigabyte Aero 16 YE5 | |
| AIDA64 / FPU Julia | |
| Asus ROG Strix G17 G713PI | |
| Average of class Gaming (51376 - 238426, n=109, last 2 years) | |
| Razer Blade 16 Early 2023 | |
| Razer Blade 16 Early 2023 | |
| Razer Blade 16 Early 2023 | |
| MSI Stealth 17 Studio A13VH-014 | |
| Aorus 17X AZF | |
| HP Omen 17-ck2097ng | |
| Average Intel Core i9-13900H (22551 - 95579, n=25) | |
| Gigabyte Aero 16 YE5 | |
| AIDA64 / CPU SHA3 | |
| Asus ROG Strix G17 G713PI | |
| Razer Blade 16 Early 2023 | |
| Razer Blade 16 Early 2023 | |
| Razer Blade 16 Early 2023 | |
| Average of class Gaming (2180 - 9817, n=109, last 2 years) | |
| Aorus 17X AZF | |
| HP Omen 17-ck2097ng | |
| MSI Stealth 17 Studio A13VH-014 | |
| Average Intel Core i9-13900H (2491 - 4270, n=25) | |
| Gigabyte Aero 16 YE5 | |
| AIDA64 / CPU Queen | |
| Asus ROG Strix G17 G713PI | |
| Razer Blade 16 Early 2023 | |
| Razer Blade 16 Early 2023 | |
| HP Omen 17-ck2097ng | |
| Aorus 17X AZF | |
| Average of class Gaming (49785 - 173351, n=101, last 2 years) | |
| Gigabyte Aero 16 YE5 | |
| Average Intel Core i9-13900H (65121 - 120936, n=25) | |
| MSI Stealth 17 Studio A13VH-014 | |
| AIDA64 / FPU SinJulia | |
| Asus ROG Strix G17 G713PI | |
| Razer Blade 16 Early 2023 | |
| Razer Blade 16 Early 2023 | |
| Razer Blade 16 Early 2023 | |
| Average of class Gaming (4424 - 33636, n=109, last 2 years) | |
| Aorus 17X AZF | |
| HP Omen 17-ck2097ng | |
| MSI Stealth 17 Studio A13VH-014 | |
| Average Intel Core i9-13900H (6108 - 11631, n=25) | |
| Gigabyte Aero 16 YE5 | |
| AIDA64 / FPU Mandel | |
| Asus ROG Strix G17 G713PI | |
| Average of class Gaming (25115 - 128721, n=109, last 2 years) | |
| Razer Blade 16 Early 2023 | |
| Razer Blade 16 Early 2023 | |
| Razer Blade 16 Early 2023 | |
| MSI Stealth 17 Studio A13VH-014 | |
| Aorus 17X AZF | |
| HP Omen 17-ck2097ng | |
| Average Intel Core i9-13900H (11283 - 48474, n=25) | |
| Gigabyte Aero 16 YE5 | |
| AIDA64 / CPU AES | |
| Aorus 17X AZF | |
| Asus ROG Strix G17 G713PI | |
| Razer Blade 16 Early 2023 | |
| Razer Blade 16 Early 2023 | |
| Razer Blade 16 Early 2023 | |
| Average of class Gaming (39258 - 247074, n=109, last 2 years) | |
| Gigabyte Aero 16 YE5 | |
| HP Omen 17-ck2097ng | |
| Average Intel Core i9-13900H (3691 - 149377, n=25) | |
| MSI Stealth 17 Studio A13VH-014 | |
| AIDA64 / CPU ZLib | |
| Asus ROG Strix G17 G713PI | |
| Razer Blade 16 Early 2023 | |
| Razer Blade 16 Early 2023 | |
| Razer Blade 16 Early 2023 | |
| Average of class Gaming (574 - 2531, n=109, last 2 years) | |
| Aorus 17X AZF | |
| HP Omen 17-ck2097ng | |
| MSI Stealth 17 Studio A13VH-014 | |
| Average Intel Core i9-13900H (789 - 1254, n=25) | |
| Gigabyte Aero 16 YE5 | |
| AIDA64 / FP64 Ray-Trace | |
| Asus ROG Strix G17 G713PI | |
| Average of class Gaming (5509 - 45446, n=109, last 2 years) | |
| Razer Blade 16 Early 2023 | |
| Razer Blade 16 Early 2023 | |
| Razer Blade 16 Early 2023 | |
| MSI Stealth 17 Studio A13VH-014 | |
| Aorus 17X AZF | |
| HP Omen 17-ck2097ng | |
| Average Intel Core i9-13900H (3655 - 10716, n=25) | |
| Gigabyte Aero 16 YE5 | |
| AIDA64 / CPU PhotoWorxx | |
| Razer Blade 16 Early 2023 | |
| Razer Blade 16 Early 2023 | |
| Razer Blade 16 Early 2023 | |
| HP Omen 17-ck2097ng | |
| MSI Stealth 17 Studio A13VH-014 | |
| Aorus 17X AZF | |
| Average of class Gaming (12271 - 89891, n=109, last 2 years) | |
| Average Intel Core i9-13900H (10871 - 50488, n=25) | |
| Gigabyte Aero 16 YE5 | |
| Asus ROG Strix G17 G713PI | |
System performance
The measured values for PCMark 10 are at a high level. However, the Stealth 17 Studio cannot keep up with the best models and lacks the extremely high power consumption the competition is able to briefly offer. Nevertheless, its computing power is sufficient for complex multitasking and, in particular, for moments when lengthy periods of high-level performance are required.
CrossMark: Overall | Productivity | Creativity | Responsiveness
| PCMark 10 / Score | |
| Average of class Gaming (5828 - 11574, n=95, last 2 years) | |
| Asus ROG Zephyrus M16 GU604VY-NM042X | |
| Alienware x17 R2 P48E | |
| Gigabyte AERO 16 OLED BSF | |
| Razer Blade 16 Early 2023 | |
| Lenovo Legion Pro 7 16IRX8H | |
| MSI Stealth 17 Studio A13VH-014 | |
| Average Intel Core i9-13900H, NVIDIA GeForce RTX 4080 Laptop GPU (n=1) | |
| Razer Blade 17 Early 2022 | |
| MSI Creator Z17 A12UGST-054 | |
| PCMark 10 / Essentials | |
| Lenovo Legion Pro 7 16IRX8H | |
| Asus ROG Zephyrus M16 GU604VY-NM042X | |
| Gigabyte AERO 16 OLED BSF | |
| Alienware x17 R2 P48E | |
| Razer Blade 16 Early 2023 | |
| Average of class Gaming (8810 - 12600, n=99, last 2 years) | |
| MSI Creator Z17 A12UGST-054 | |
| Razer Blade 17 Early 2022 | |
| MSI Stealth 17 Studio A13VH-014 | |
| Average Intel Core i9-13900H, NVIDIA GeForce RTX 4080 Laptop GPU (n=1) | |
| PCMark 10 / Productivity | |
| Asus ROG Zephyrus M16 GU604VY-NM042X | |
| Lenovo Legion Pro 7 16IRX8H | |
| Average of class Gaming (6845 - 18766, n=97, last 2 years) | |
| Alienware x17 R2 P48E | |
| MSI Stealth 17 Studio A13VH-014 | |
| Average Intel Core i9-13900H, NVIDIA GeForce RTX 4080 Laptop GPU (n=1) | |
| MSI Creator Z17 A12UGST-054 | |
| Gigabyte AERO 16 OLED BSF | |
| Razer Blade 17 Early 2022 | |
| Razer Blade 16 Early 2023 | |
| PCMark 10 / Digital Content Creation | |
| Razer Blade 16 Early 2023 | |
| Average of class Gaming (7602 - 19657, n=97, last 2 years) | |
| Gigabyte AERO 16 OLED BSF | |
| Alienware x17 R2 P48E | |
| Asus ROG Zephyrus M16 GU604VY-NM042X | |
| MSI Stealth 17 Studio A13VH-014 | |
| Average Intel Core i9-13900H, NVIDIA GeForce RTX 4080 Laptop GPU (n=1) | |
| Razer Blade 17 Early 2022 | |
| Lenovo Legion Pro 7 16IRX8H | |
| MSI Creator Z17 A12UGST-054 | |
| CrossMark / Overall | |
| MSI Creator Z17 A12UGST-054 | |
| Average of class Gaming (1366 - 2409, n=97, last 2 years) | |
| Asus ROG Zephyrus M16 GU604VY-NM042X | |
| Alienware x17 R2 P48E | |
| Gigabyte AERO 16 OLED BSF | |
| Razer Blade 17 Early 2022 | |
| MSI Stealth 17 Studio A13VH-014 | |
| Average Intel Core i9-13900H, NVIDIA GeForce RTX 4080 Laptop GPU (n=1) | |
| Razer Blade 16 Early 2023 | |
| CrossMark / Productivity | |
| MSI Creator Z17 A12UGST-054 | |
| Average of class Gaming (1386 - 2254, n=97, last 2 years) | |
| Asus ROG Zephyrus M16 GU604VY-NM042X | |
| Alienware x17 R2 P48E | |
| Gigabyte AERO 16 OLED BSF | |
| Razer Blade 17 Early 2022 | |
| MSI Stealth 17 Studio A13VH-014 | |
| Average Intel Core i9-13900H, NVIDIA GeForce RTX 4080 Laptop GPU (n=1) | |
| Razer Blade 16 Early 2023 | |
| CrossMark / Creativity | |
| Asus ROG Zephyrus M16 GU604VY-NM042X | |
| Average of class Gaming (1343 - 2729, n=97, last 2 years) | |
| MSI Creator Z17 A12UGST-054 | |
| Alienware x17 R2 P48E | |
| Gigabyte AERO 16 OLED BSF | |
| MSI Stealth 17 Studio A13VH-014 | |
| Average Intel Core i9-13900H, NVIDIA GeForce RTX 4080 Laptop GPU (n=1) | |
| Razer Blade 17 Early 2022 | |
| Razer Blade 16 Early 2023 | |
| CrossMark / Responsiveness | |
| Gigabyte AERO 16 OLED BSF | |
| MSI Creator Z17 A12UGST-054 | |
| Average of class Gaming (1226 - 2334, n=97, last 2 years) | |
| Alienware x17 R2 P48E | |
| Asus ROG Zephyrus M16 GU604VY-NM042X | |
| Razer Blade 17 Early 2022 | |
| MSI Stealth 17 Studio A13VH-014 | |
| Average Intel Core i9-13900H, NVIDIA GeForce RTX 4080 Laptop GPU (n=1) | |
| Razer Blade 16 Early 2023 | |
| PCMark 10 Score | 7486 points | |
Help | ||
| AIDA64 / Memory Copy | |
| Razer Blade 16 Early 2023 | |
| Razer Blade 16 Early 2023 | |
| Razer Blade 16 Early 2023 | |
| Aorus 17X AZF | |
| HP Omen 17-ck2097ng | |
| MSI Stealth 17 Studio A13VH-014 | |
| Average of class Gaming (21750 - 129946, n=109, last 2 years) | |
| Gigabyte Aero 16 YE5 | |
| Average Intel Core i9-13900H (37448 - 74486, n=25) | |
| Asus ROG Strix G17 G713PI | |
| AIDA64 / Memory Read | |
| Aorus 17X AZF | |
| Razer Blade 16 Early 2023 | |
| Razer Blade 16 Early 2023 | |
| Razer Blade 16 Early 2023 | |
| HP Omen 17-ck2097ng | |
| MSI Stealth 17 Studio A13VH-014 | |
| Average of class Gaming (22956 - 118858, n=109, last 2 years) | |
| Gigabyte Aero 16 YE5 | |
| Average Intel Core i9-13900H (41599 - 75433, n=25) | |
| Asus ROG Strix G17 G713PI | |
| AIDA64 / Memory Write | |
| Razer Blade 16 Early 2023 | |
| Razer Blade 16 Early 2023 | |
| Razer Blade 16 Early 2023 | |
| HP Omen 17-ck2097ng | |
| Aorus 17X AZF | |
| Average of class Gaming (22297 - 135096, n=109, last 2 years) | |
| MSI Stealth 17 Studio A13VH-014 | |
| Average Intel Core i9-13900H (36152 - 88505, n=25) | |
| Gigabyte Aero 16 YE5 | |
| Asus ROG Strix G17 G713PI | |
| AIDA64 / Memory Latency | |
| Average of class Gaming (75.3 - 259, n=109, last 2 years) | |
| Razer Blade 16 Early 2023 | |
| Razer Blade 16 Early 2023 | |
| Razer Blade 16 Early 2023 | |
| MSI Stealth 17 Studio A13VH-014 | |
| Gigabyte Aero 16 YE5 | |
| Average Intel Core i9-13900H (75.8 - 102.3, n=25) | |
| Asus ROG Strix G17 G713PI | |
| HP Omen 17-ck2097ng | |
| Aorus 17X AZF | |
* ... smaller is better
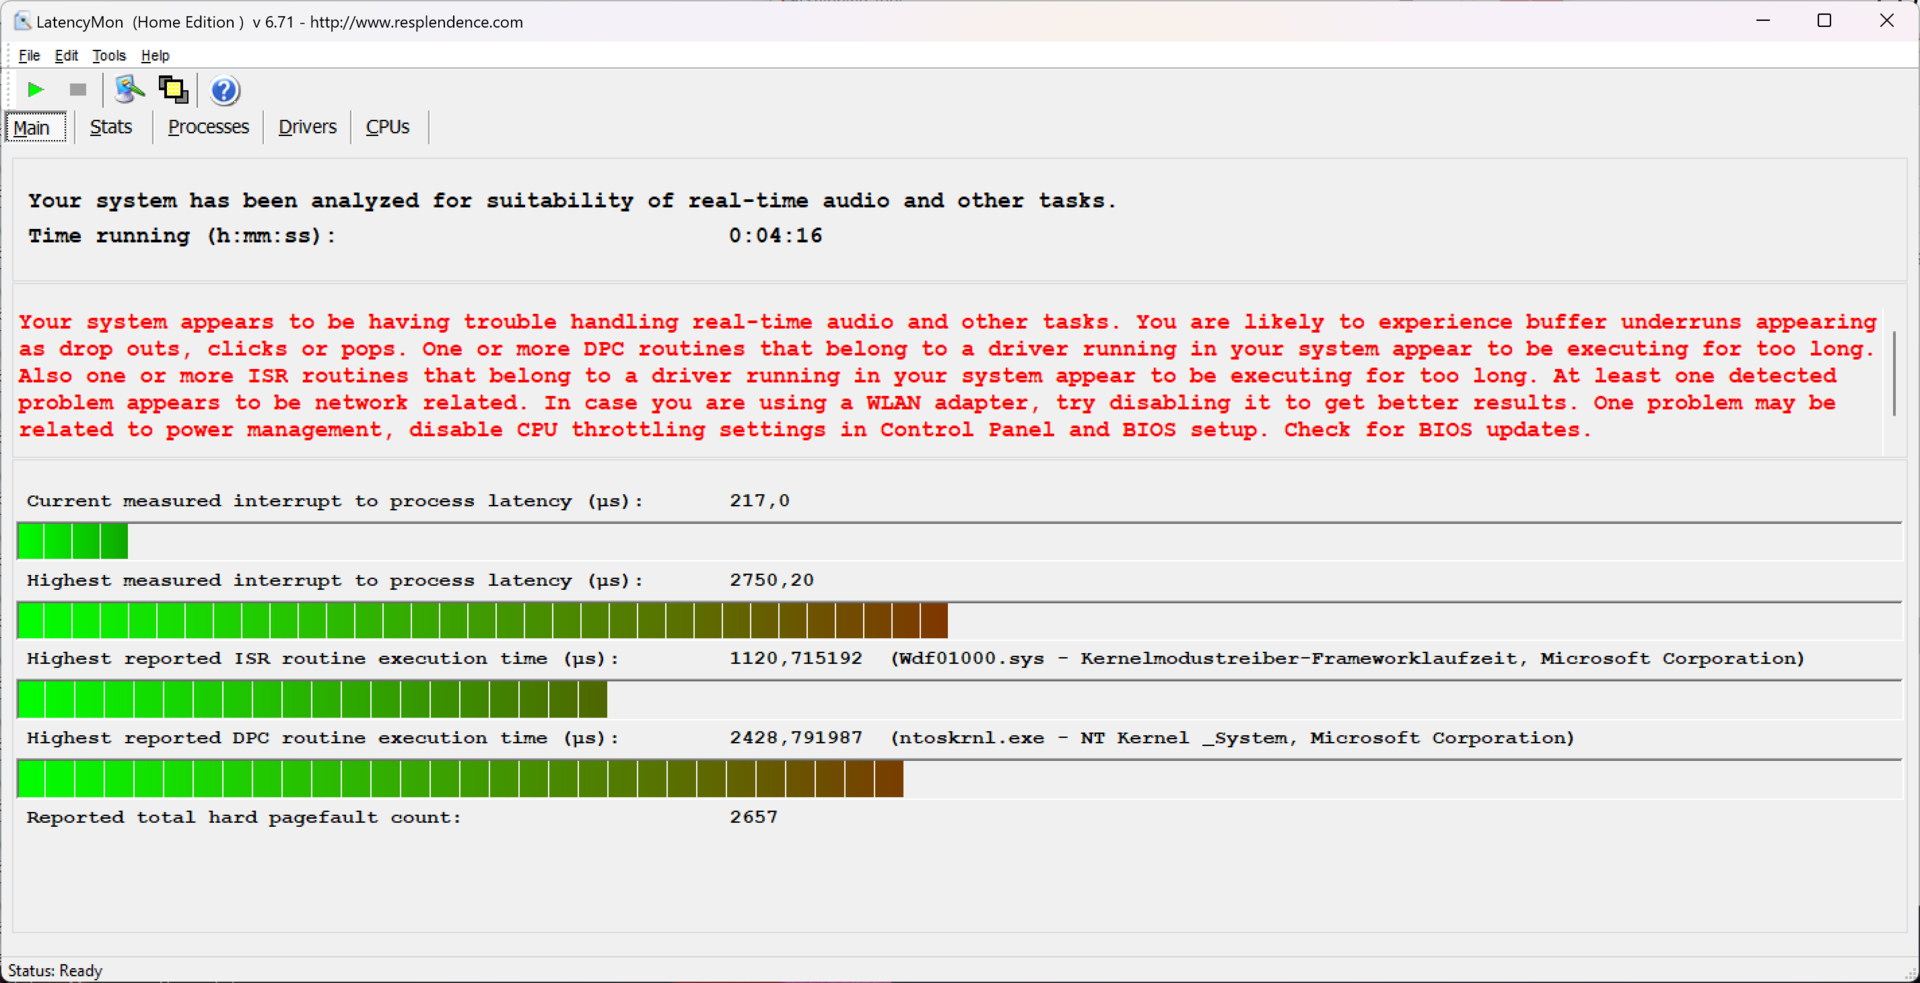
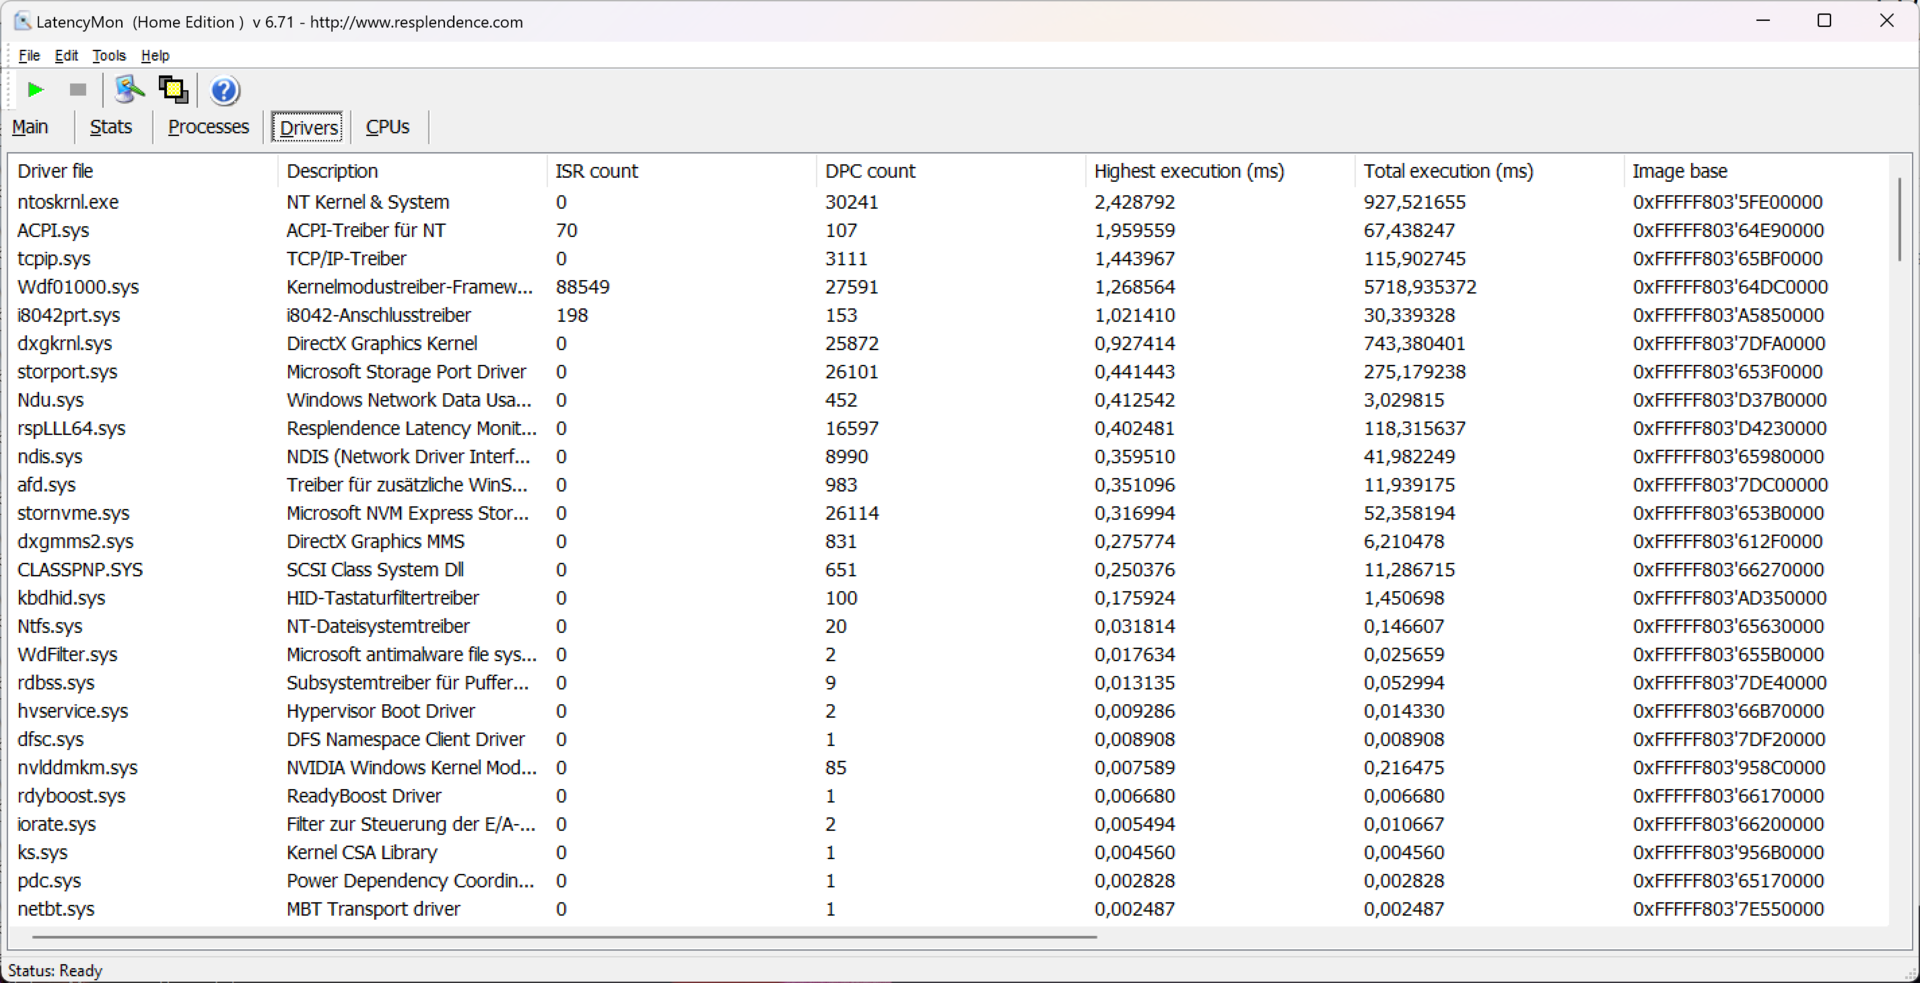
DPC latencies
Even when surfing with multiple tabs, latency was too high for suitably demanding tasks such as real-time audio processing. With various driver updates it is possible this performance could change in either both positive or negative directions. As we generally encountered a few immature processes, it can be hoped that performance in this area will improve. The high latency of earlier graphics card drivers in the RTX 4000 series appears to already have been solved. The Gigabyte Aero 16 YE5 is an example that multimedia laptops can clearly do better.
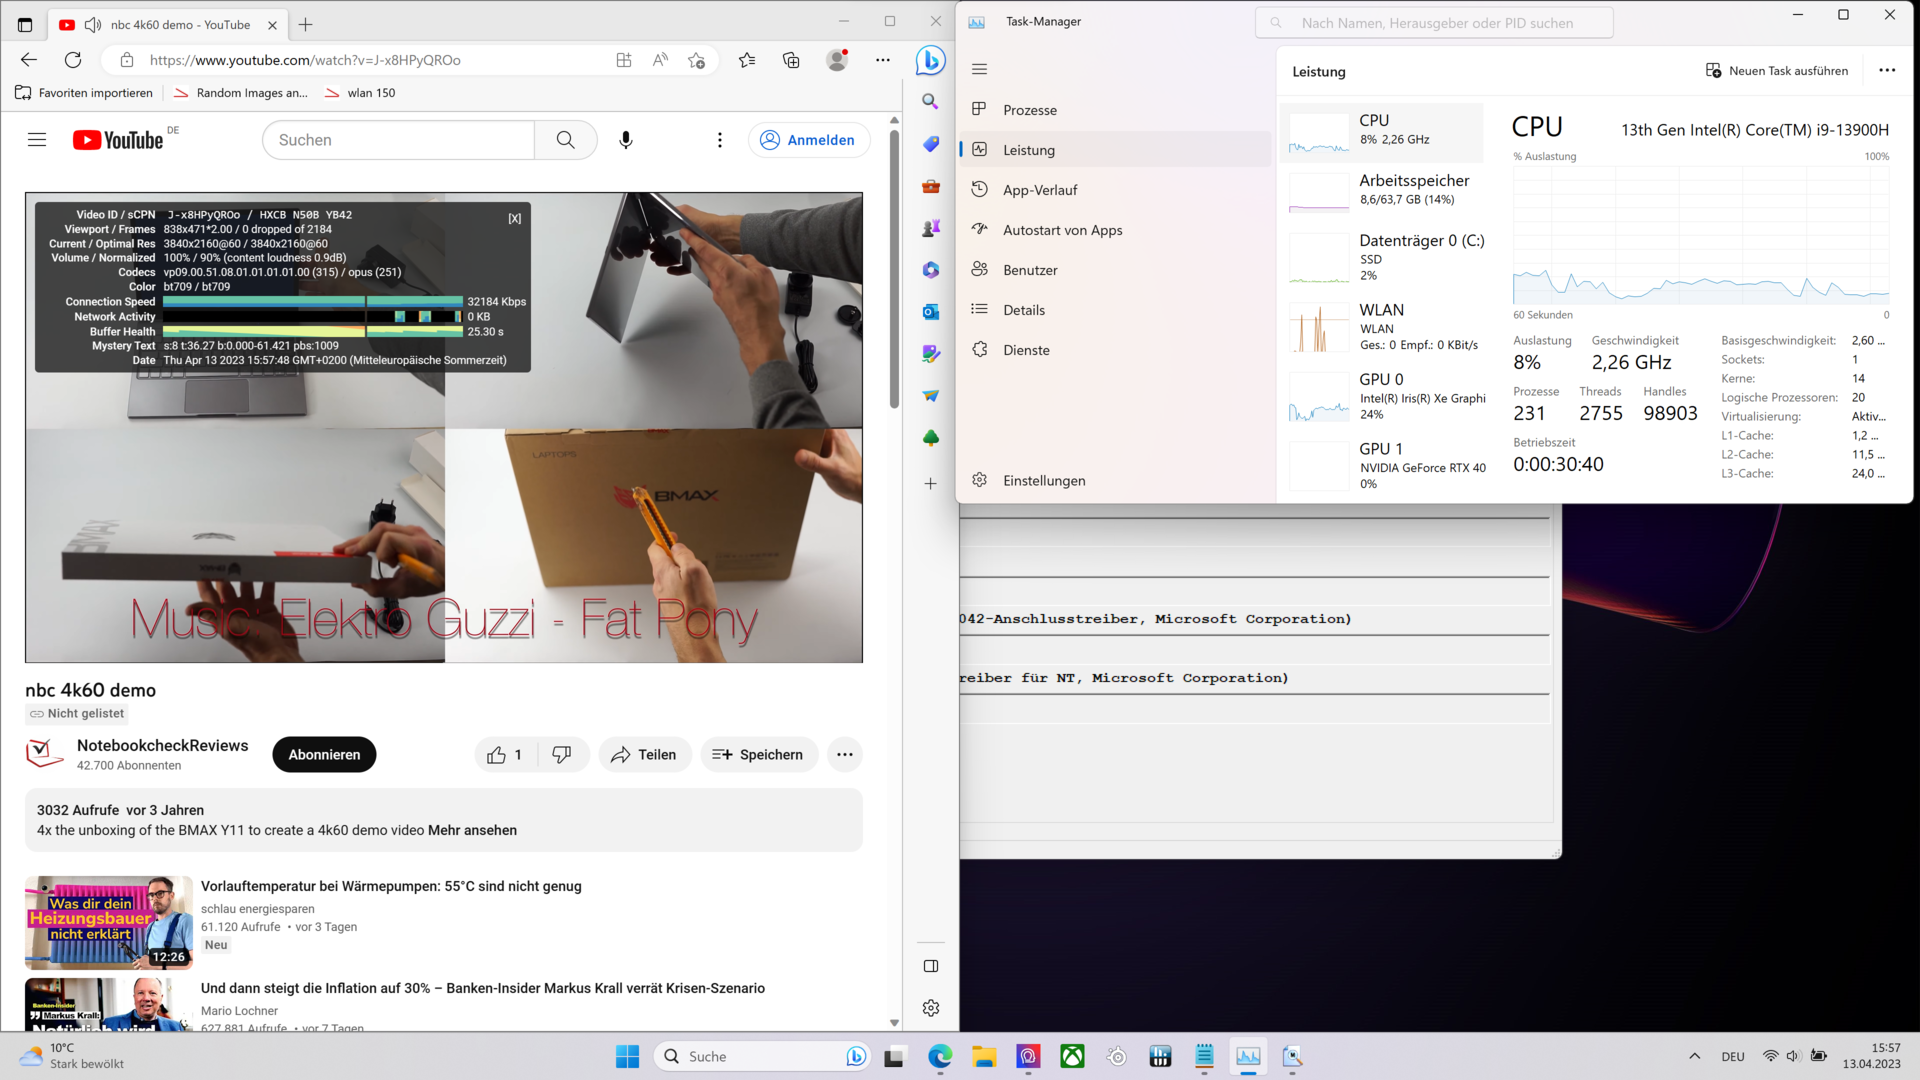
Video streaming in 4K didn't pose any problems. There were no skipped frames and, at a little over 20 %, the iGPU's load was not too high.
| DPC Latencies / LatencyMon - interrupt to process latency (max), Web, Youtube, Prime95 | |
| Aorus 17X AZF | |
| MSI Stealth 17 Studio A13VH-014 | |
| Razer Blade 16 Early 2023 | |
| HP Omen 17-ck2097ng | |
| Asus ROG Strix G17 G713PI | |
| Gigabyte Aero 16 YE5 | |
* ... smaller is better
Mass storage
With its 2 TB of storage, the NVMe SSD Samsung PM9A is convincing all round and earns a high placing in our rankings.
The continuous test while carrying out sequential writing caught our attention. When "Extreme Performance" was set (red line), the speed dropped after a short time due to high temperatures. The transfer rate remained at its highest level using "Smart Auto" or AI mode (blue line).

* ... smaller is better
Continuous performance read: DiskSpd Read Loop, Queue Depth 8
Graphics card
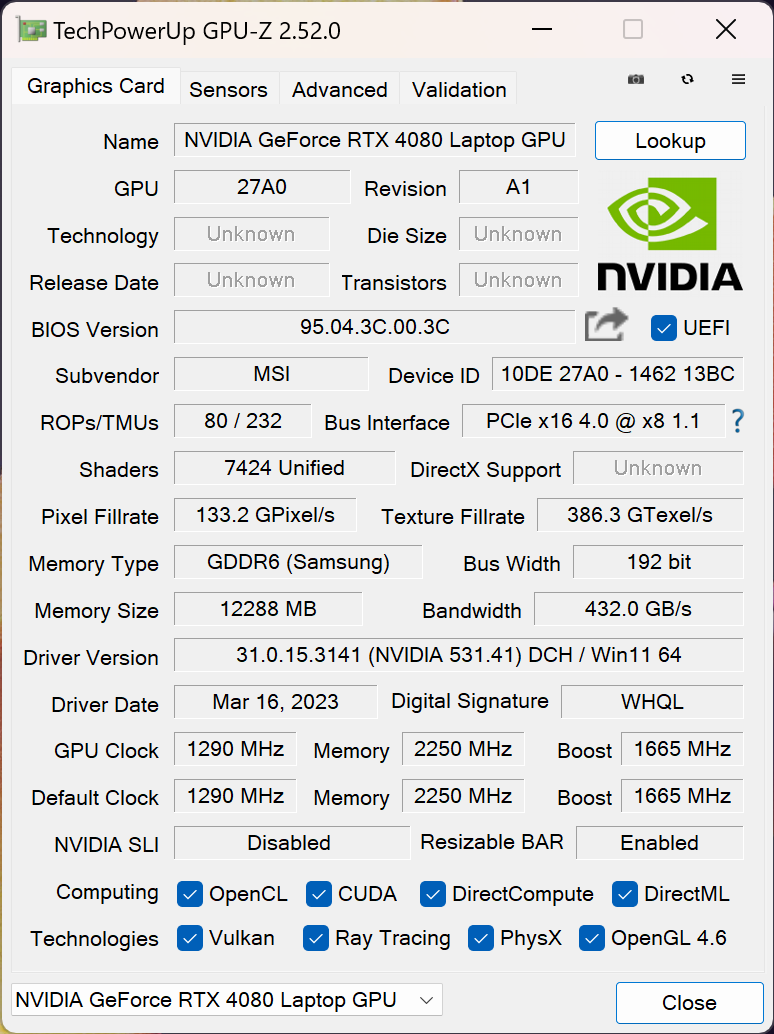
The MSI Stealth 17 Studio A13V can be equipped with all currently available RTX 4000 graphics cards. The A13VH-014 model at hand comes with an RTX 4080 and 12 GB of VRAM. However, compared to the reference model, other performance values are somewhat curbed.
The boost clock speed sits at 1,665 instead of 2,280 MHz and instead of consuming the maximum allowed 150 watts, it only consumes 105 watts of electricity. This explains the clear gap in our average values for the RTX 4080. Compared to gaming laptops equipped with an Nvidia GeForce RTX 3080 Ti or the RTX 4070, it is clearly up to 20 % more performant, despite these limitations.
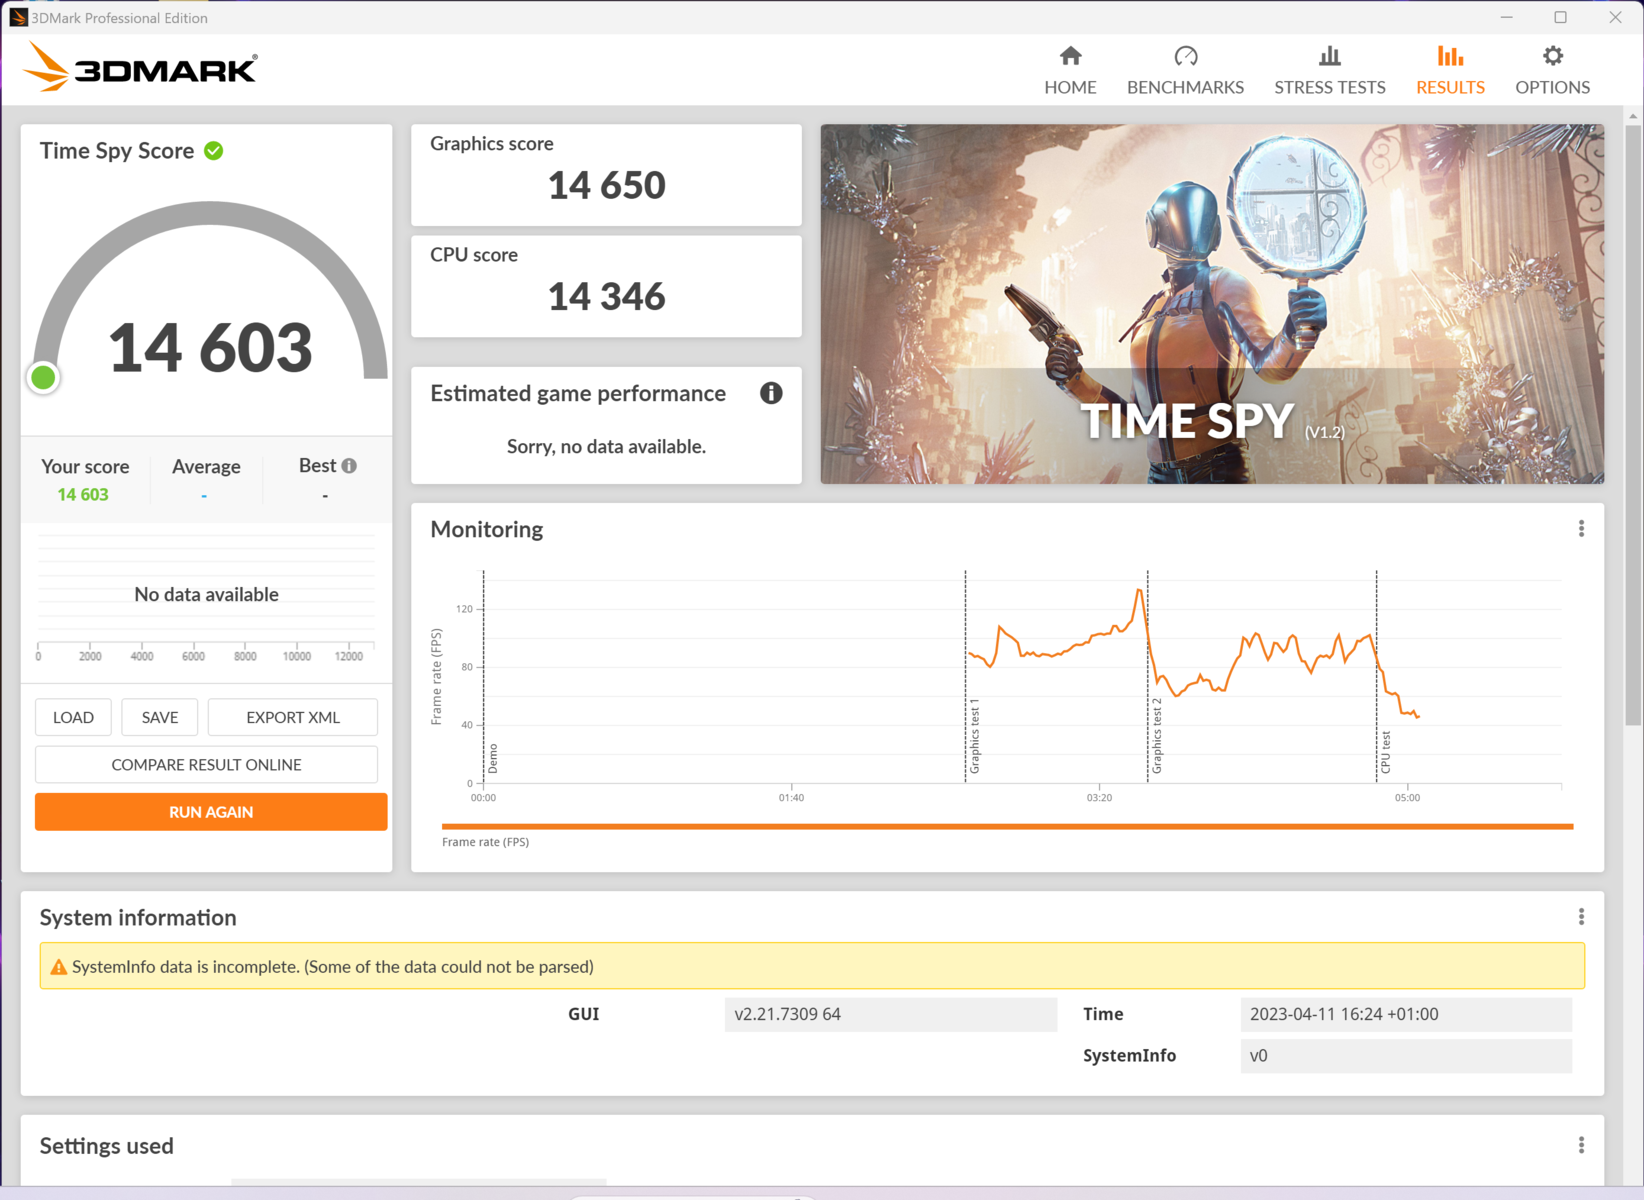
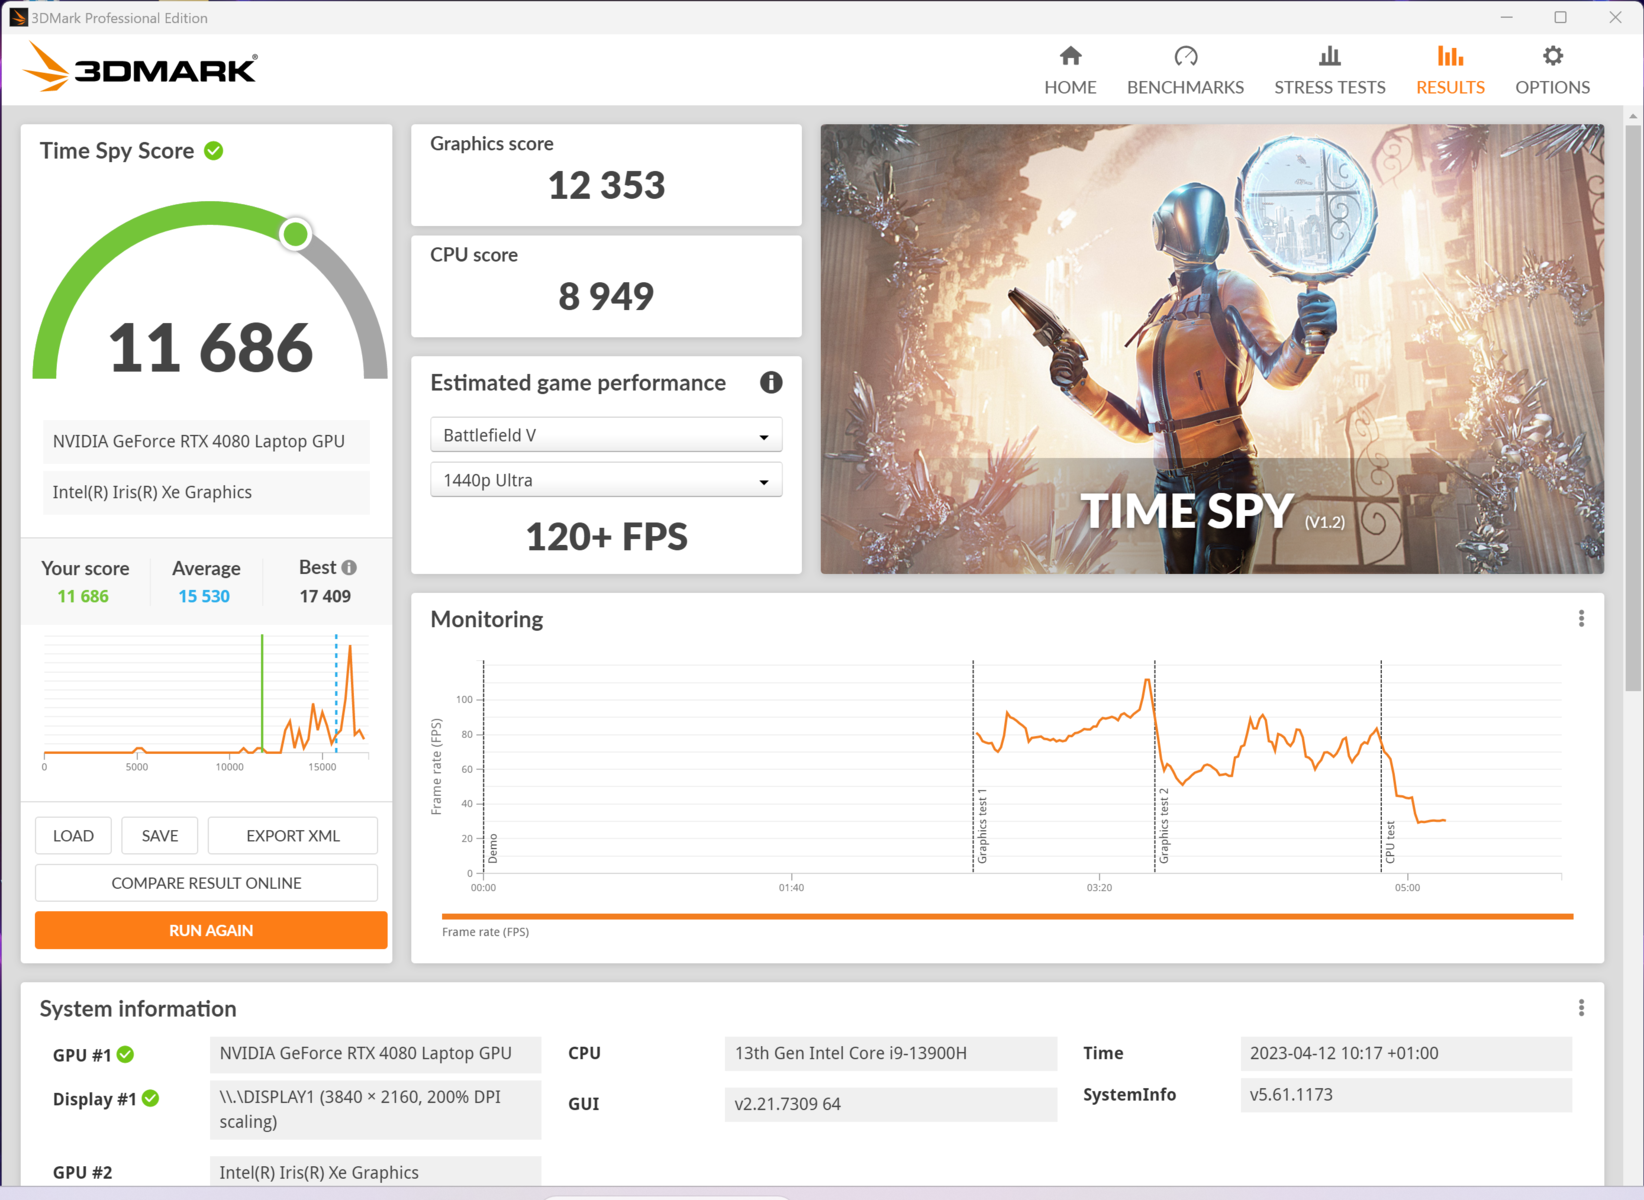
It is worth noting that in the demanding 3DMark Time Spy test, we observed hardly any difference between "Smart Auto" and "Extreme" although the fan noise was noticeably different. In the intelligent switching mode, the graphics card received a little more power and the processor somewhat less. At the same time, this allows for slightly higher heat dissipation. In most games, we achieved better frame rate values in AI mode than in "Extreme" mode.
The results with reduced fan noise are also remarkable. "Silent" mode ensures very quiet operation but allows, in most current games, smooth rendering at high-quality settings. For test purposes, we were able to play using 10 % of the speaker's available volume without fans interfering with speech or sound effects.
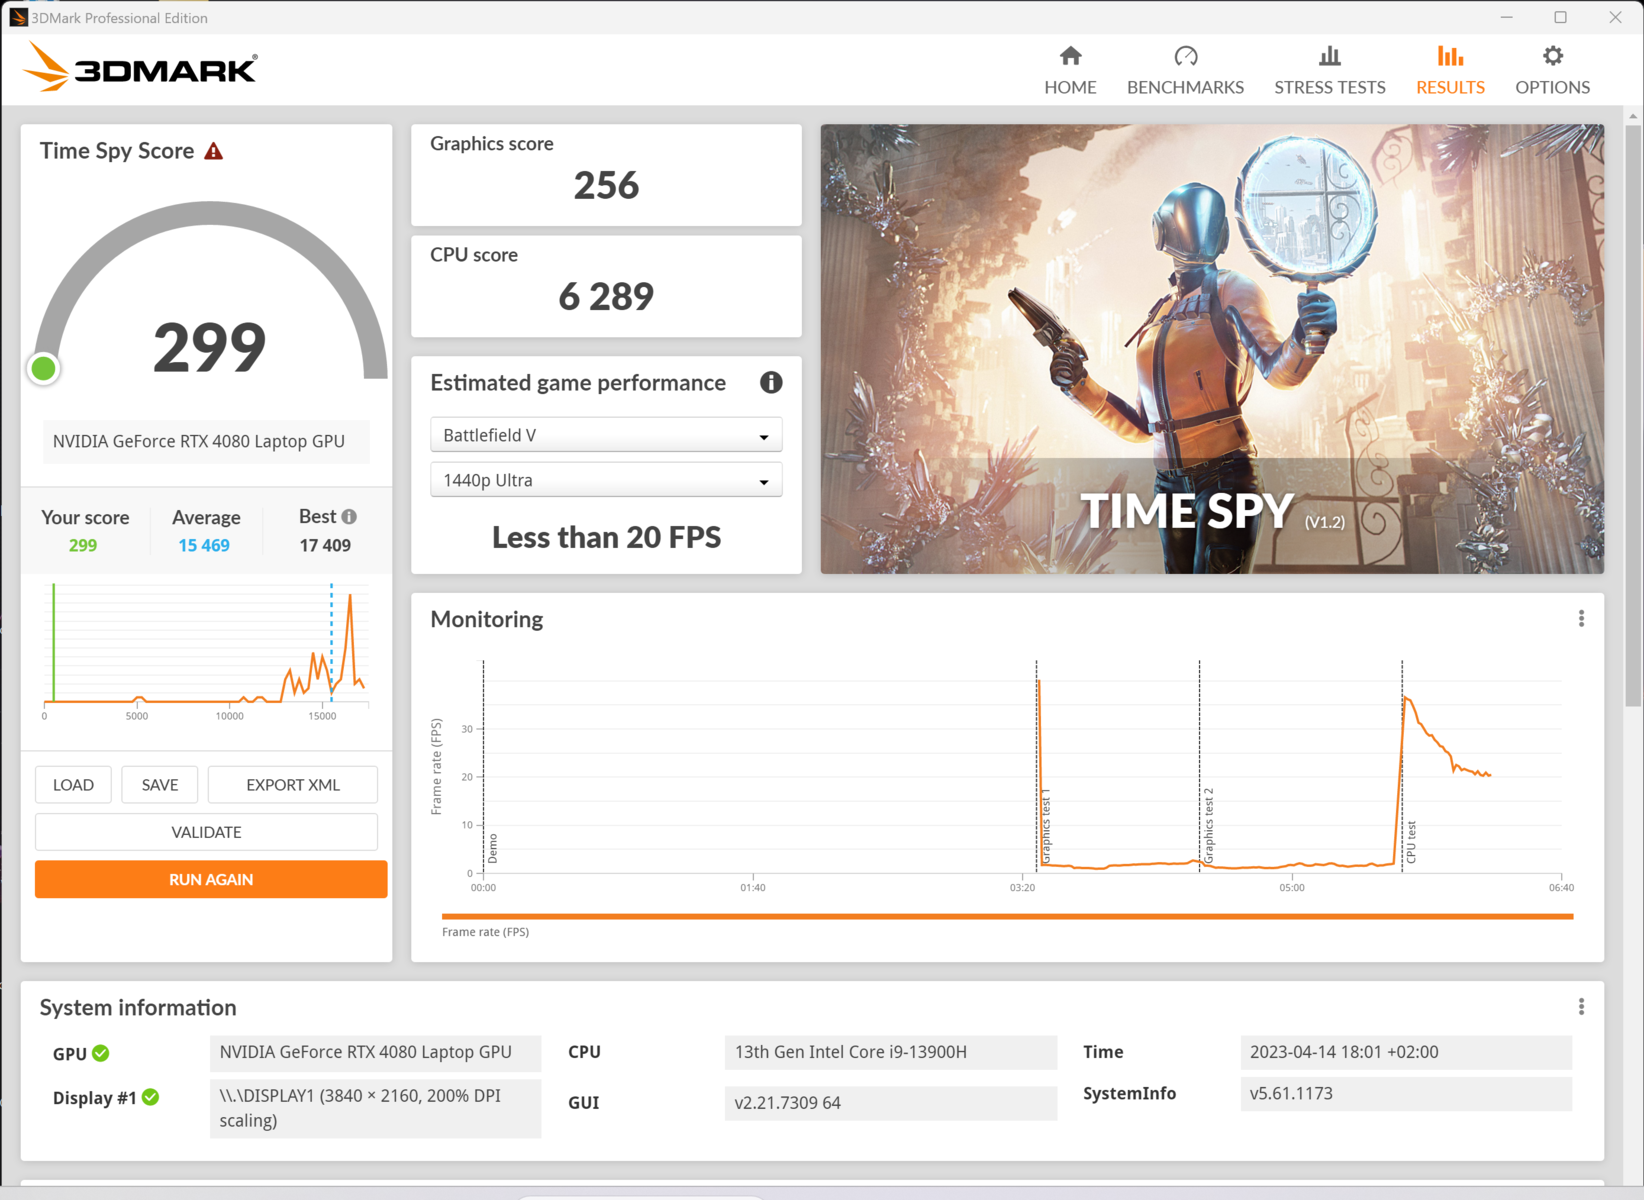
However, we would totally advise against using the device in battery mode. Our recorded results were even worse than entry-level office segment laptops. Without a mains connection, the game Witcher 3 only managed 3fps in Full HD and Ultra settings. We presume this has something to do with a configuration error, unfortunately, many of which we observed during testing.

| 3DMark 11 Performance | 33542 points | |
| 3DMark Cloud Gate Standard Score | 51999 points | |
| 3DMark Fire Strike Score | 30028 points | |
| 3DMark Fire Strike Extreme Score | 16371 points | |
| 3DMark Time Spy Score | 14775 points | |
Help | ||
* ... smaller is better
| Photoshop PugetBench - Overall Score | |
| MSI Titan GT77 HX 13VI | |
| Asus Zephyrus Duo 16 GX650PY-NM006W | |
| MSI Stealth 17 Studio A13VH-014 | |
| Asus ROG Strix Scar 18 2023 G834JY-N6005W | |
| Premiere Pro PugetBench - Overall Score 0.9 | |
| MSI Stealth 17 Studio A13VH-014 | |
| Asus Zephyrus Duo 16 GX650PY-NM006W | |
| MSI Titan GT77 HX 13VI | |
Gaming Performance
Despite having power that cannot be fully accessed, the Nvidia GeForce RTX 4080 demonstrated very good frame rates across various games, quality settings and resolutions. Even a current title such as "Hogwarts Legacy" is playable at maximum settings and in 4K, even though 43fps is very modest.
The Stealth 17 Studio is particularly impressive at somewhat lower QHD resolutions and often sits above 100fps - mark you, at the highest detail settings.
Compared with other purely gaming-focussed laptops, MSI's device manages to perform like an Alienware x17 R2. That machine uses the older RTX 3080 Ti but is always significantly louder and consumes considerably more power.
Additional game analysis, comparison data and more can be found in our GPU benchmark list.
| The Witcher 3 | |
| 1920x1080 High Graphics & Postprocessing (Nvidia HairWorks Off) | |
| Aorus 17X AZF | |
| Razer Blade 16 Early 2023 | |
| Average NVIDIA GeForce RTX 4080 Laptop GPU (246 - 385, n=14) | |
| HP Omen 17-ck2097ng | |
| MSI Stealth 17 Studio A13VH-014 | |
| Average of class Gaming (181 - 341, n=3, last 2 years) | |
| Asus ROG Strix G17 G713PI | |
| Gigabyte Aero 16 YE5 | |
| 1920x1080 Ultra Graphics & Postprocessing (HBAO+) | |
| Aorus 17X AZF | |
| Razer Blade 16 Early 2023 | |
| Average of class Gaming (95 - 240, n=8, last 2 years) | |
| Average NVIDIA GeForce RTX 4080 Laptop GPU (130.4 - 186.1, n=20) | |
| HP Omen 17-ck2097ng | |
| MSI Stealth 17 Studio A13VH-014 | |
| Asus ROG Strix G17 G713PI | |
| Gigabyte Aero 16 YE5 | |
| Far Cry 6 | |
| 1920x1080 Ultra Graphics Quality + HD Textures AA:T | |
| Average NVIDIA GeForce RTX 4080 Laptop GPU (118 - 156, n=5) | |
| Aorus 17X AZF | |
| Razer Blade 16 Early 2023 | |
| MSI Stealth 17 Studio A13VH-014 | |
| Average of class Gaming (96.3 - 135.7, n=3, last 2 years) | |
| 2560x1440 Ultra Graphics Quality + HD Textures AA:T | |
| Average NVIDIA GeForce RTX 4080 Laptop GPU (100 - 141, n=5) | |
| Aorus 17X AZF | |
| Razer Blade 16 Early 2023 | |
| MSI Stealth 17 Studio A13VH-014 | |
| Average of class Gaming (74.5 - 116.7, n=2, last 2 years) | |
| 3840x2160 Ultra Graphics Quality + HD Textures AA:T | |
| Aorus 17X AZF | |
| Razer Blade 16 Early 2023 | |
| Average NVIDIA GeForce RTX 4080 Laptop GPU (61 - 73, n=4) | |
| MSI Stealth 17 Studio A13VH-014 | |
| Average of class Gaming (n=1last 2 years) | |
| F1 22 | |
| 1920x1080 Ultra High Preset AA:T AF:16x | |
| Aorus 17X AZF | |
| Average NVIDIA GeForce RTX 4080 Laptop GPU (72.3 - 124.2, n=15) | |
| HP Omen 17-ck2097ng | |
| MSI Stealth 17 Studio A13VH-014 | |
| Asus ROG Strix G17 G713PI | |
| Average of class Gaming (40.1 - 121.2, n=5, last 2 years) | |
| 2560x1440 Ultra High Preset AA:T AF:16x | |
| Aorus 17X AZF | |
| Average NVIDIA GeForce RTX 4080 Laptop GPU (55.4 - 79, n=13) | |
| HP Omen 17-ck2097ng | |
| MSI Stealth 17 Studio A13VH-014 | |
| Average of class Gaming (42 - 77.8, n=3, last 2 years) | |
| Asus ROG Strix G17 G713PI | |
| 3840x2160 Ultra High Preset AA:T AF:16x | |
| Aorus 17X AZF | |
| Average of class Gaming (n=1last 2 years) | |
| Average NVIDIA GeForce RTX 4080 Laptop GPU (25.8 - 39.8, n=10) | |
| MSI Stealth 17 Studio A13VH-014 | |
| Hogwarts Legacy | |
| 1920x1080 Ultra Preset AA:High T | |
| Average NVIDIA GeForce RTX 4080 Laptop GPU (108 - 131, n=3) | |
| MSI Stealth 17 Studio A13VH-014 | |
| Asus ROG Strix G17 G713PI | |
| Average of class Gaming (76 - 108.3, n=2, last 2 years) | |
| Aorus 17X AZF | |
| 2560x1440 Ultra Preset AA:High T | |
| Average NVIDIA GeForce RTX 4080 Laptop GPU (76 - 102, n=3) | |
| Aorus 17X AZF | |
| MSI Stealth 17 Studio A13VH-014 | |
| Average of class Gaming (52 - 96.8, n=2, last 2 years) | |
| Asus ROG Strix G17 G713PI | |
| 3840x2160 Ultra Preset AA:High T | |
| Average of class Gaming (n=1last 2 years) | |
| Aorus 17X AZF | |
| MSI Stealth 17 Studio A13VH-014 | |
| Average NVIDIA GeForce RTX 4080 Laptop GPU (n=1) | |
For a short period, the frame rate in Witcher 3 is almost on par with an RTX 4080 but quickly drops to a still impressive 120fps. This corresponds pretty much exactly to an Asus ROG Strix G17 with an RTX 4070 and significantly more powerful CPU but this is also a considerably more generously built, pure gaming laptop. The multimedia and creator's laptop, the Gigabyte Aero 16 with an RTX 3080 Ti, lags well behind.
Considering the slightly restricted power consumption and clock speed as well as the moderate fan behaviour, this was an excellent result in the continuous test.
For a better ranking of fan noise and gaming performance, here are the MSI laptop's frame rates and noise values:
| Mode | AI | Extreme | Balanced | Silent |
| Fps (FHD, Ultra) | 127 | 135 | 134 | 114 |
| P0.1 | 48 | 50 | 52 | 61 |
| Fan noise (dB) | 48 | 53 | 48 | 36 |
The still decent frame rates with barely audible fans are remarkable. Compared to "Extreme", "Silent" appears less than half as loud. In addition, the CPU performance limit seems to ensure more stable performance because the P0.1 value (99,9 % of all frames above this value) is the best and comes with minimum noise emissions.
Witcher 3fps diagram
| low | med. | high | ultra | QHD | 4K DLSS | 4K | |
|---|---|---|---|---|---|---|---|
| GTA V (2015) | 168.4 | 122.7 | 105.9 | 123.9 | |||
| The Witcher 3 (2015) | 274 | 145 | 66 | ||||
| Dota 2 Reborn (2015) | 140 | 136.2 | 116.7 | ||||
| Final Fantasy XV Benchmark (2018) | 134 | 105.8 | 60.8 | ||||
| X-Plane 11.11 (2018) | 106.1 | 90 | |||||
| Far Cry 5 (2018) | 158 | 136 | 116 | 75 | |||
| Strange Brigade (2018) | 301 | 269 | 192.2 | 100.9 | |||
| Horizon Zero Dawn (2020) | 113 | 106 | 86 | 62 | |||
| Assassin´s Creed Valhalla (2020) | 118 | 93 | 55 | ||||
| Far Cry 6 (2021) | 118 | 100 | 61 | ||||
| Cyberpunk 2077 1.6 (2022) | 105.2 | 94.9 | 63.39 | 29 | |||
| Tiny Tina's Wonderlands (2022) | 112.86 | 89.27 | 47.85 | ||||
| F1 22 (2022) | 203 | 91.1 | 60.4 | 25.8 | |||
| Call of Duty Modern Warfare 2 2022 (2022) | 126 | 93 | 55 | ||||
| Hogwarts Legacy (2023) | 137 | 116 | 76 | 43 |
Emissions - The powerful but quiet MSI Stealth
Noise emissions
This creator's laptop gets loud when maximum power is required for gaming, with the fan values a little north of 50 dB. That is loud but this is easily surpassed by some top-model gaming laptops. In "Extreme" mode the fans soon start to spin but quickly return to a minimum if they are not required.
AI mode works much more convincingly. Intelligent management ensures that the cooling is relatively consistent and, at just under 50 dB, is at least not too loud. In doing so, the laptop can be kept cool despite its slim form factor without immediately creating an overpowering din.
In some situations, "Silent" mode seems extremely useful. The measured 36 dB are bettered by some office laptops. This level of noise allows for focused work whether in the office or working remotely. When gaming, almost 20 % of the maximum performance has to be sacrificed but this is by no means glaring considering the benchmarks. This means you can actually play without headphones in a quiet environment where the device's powerful speakers can also be used for in-game sound.
For comparison, here are the Witcher 3 volume levels we measured at Full HD and Ultra settings:
| Witcher 3 Ultra | AI mode | Extreme | Balanced | Silent |
| Volume (dB) | 48 | 53 | 48 | 36 |
Noise level
| Idle |
| 24 / 24 / 24 dB(A) |
| Load |
| 34.49 / 49.66 dB(A) |
 | ||
30 dB silent 40 dB(A) audible 50 dB(A) loud |
||
min: | ||
| MSI Stealth 17 Studio A13VH-014 GeForce RTX 4080 Laptop GPU, i9-13900H, Samsung PM9A1 MZVL22T0HBLB | Gigabyte Aero 16 YE5 GeForce RTX 3080 Ti Laptop GPU, i9-12900HK, Phison ESR01TBMFCT | HP Omen 17-ck2097ng GeForce RTX 4080 Laptop GPU, i9-13900HX, SK hynix PC801 HFS001TEJ9X101N | Razer Blade 16 Early 2023 GeForce RTX 4080 Laptop GPU, i9-13950HX, SSSTC CA6-8D1024 | Aorus 17X AZF GeForce RTX 4090 Laptop GPU, i9-13900HX, Gigabyte AG470S1TB-SI B10 | Asus ROG Strix G17 G713PI GeForce RTX 4070 Laptop GPU, R9 7945HX, WD PC SN560 SDDPNQE-1T00 | |
|---|---|---|---|---|---|---|
| Noise | -20% | -18% | -1% | -23% | -12% | |
| off / environment * (dB) | 24 | 25 -4% | 24 -0% | 23 4% | 25 -4% | 25 -4% |
| Idle Minimum * (dB) | 24 | 30 -25% | 31 -29% | 23 4% | 28 -17% | 26 -8% |
| Idle Average * (dB) | 24 | 32 -33% | 32 -33% | 23 4% | 29 -21% | 29 -21% |
| Idle Maximum * (dB) | 24 | 33 -38% | 33 -38% | 23.6 2% | 34 -42% | 30 -25% |
| Load Average * (dB) | 34.49 | 45 -30% | 45 -30% | 39 -13% | 51 -48% | 46 -33% |
| Witcher 3 ultra * (dB) | 48.29 | 50 -4% | 45 7% | 51.6 -7% | 57 -18% | 46 5% |
| Load Maximum * (dB) | 49.66 | 52 -5% | 50 -1% | 51.3 -3% | 54 -9% | 47 5% |
* ... smaller is better
Temperature
The price of very restrained cooling can be felt in an always perceptible increase in temperature. Even when carrying out simple tasks such as viewing images or surfing the internet, the base of the unit gets so warm that laptop use becomes uncomfortable.
With intensive use, especially during long gaming sessions, the keyboard area and even more so, the rear bottom part where the heat pipes and fans operate, get very warm. That can be clearly and unpleasantly felt on all the keys. However, it can't be considered really hot either. On warm days, you wouldn't really want to use a keyboard like this, making it hard to avoid using a separate keyboard.
Larger heat pipes could prevent this but also go against the laptop's thin design ethos.
(-) The maximum temperature on the upper side is 47 °C / 117 F, compared to the average of 40.4 °C / 105 F, ranging from 21.2 to 68.8 °C for the class Gaming.
(-) The bottom heats up to a maximum of 54 °C / 129 F, compared to the average of 43.2 °C / 110 F
(+) In idle usage, the average temperature for the upper side is 27.1 °C / 81 F, compared to the device average of 33.9 °C / 93 F.
(-) Playing The Witcher 3, the average temperature for the upper side is 40.3 °C / 105 F, compared to the device average of 33.9 °C / 93 F.
(+) The palmrests and touchpad are cooler than skin temperature with a maximum of 31 °C / 87.8 F and are therefore cool to the touch.
(-) The average temperature of the palmrest area of similar devices was 28.8 °C / 83.8 F (-2.2 °C / -4 F).
| MSI Stealth 17 Studio A13VH-014 Intel Core i9-13900H, NVIDIA GeForce RTX 4080 Laptop GPU | Gigabyte Aero 16 YE5 Intel Core i9-12900HK, NVIDIA GeForce RTX 3080 Ti Laptop GPU | HP Omen 17-ck2097ng Intel Core i9-13900HX, NVIDIA GeForce RTX 4080 Laptop GPU | Razer Blade 16 Early 2023 Intel Core i9-13950HX, NVIDIA GeForce RTX 4080 Laptop GPU | Aorus 17X AZF Intel Core i9-13900HX, NVIDIA GeForce RTX 4090 Laptop GPU | Asus ROG Strix G17 G713PI AMD Ryzen 9 7945HX, NVIDIA GeForce RTX 4070 Laptop GPU | |
|---|---|---|---|---|---|---|
| Heat | -5% | 15% | 10% | 2% | 5% | |
| Maximum Upper Side * (°C) | 47 | 49 -4% | 41 13% | 40 15% | 47 -0% | 42 11% |
| Maximum Bottom * (°C) | 54 | 55 -2% | 51 6% | 37.6 30% | 51 6% | 41 24% |
| Idle Upper Side * (°C) | 30 | 33 -10% | 24 20% | 32.4 -8% | 30 -0% | 33 -10% |
| Idle Bottom * (°C) | 32 | 33 -3% | 25 22% | 31.4 2% | 31 3% | 34 -6% |
* ... smaller is better
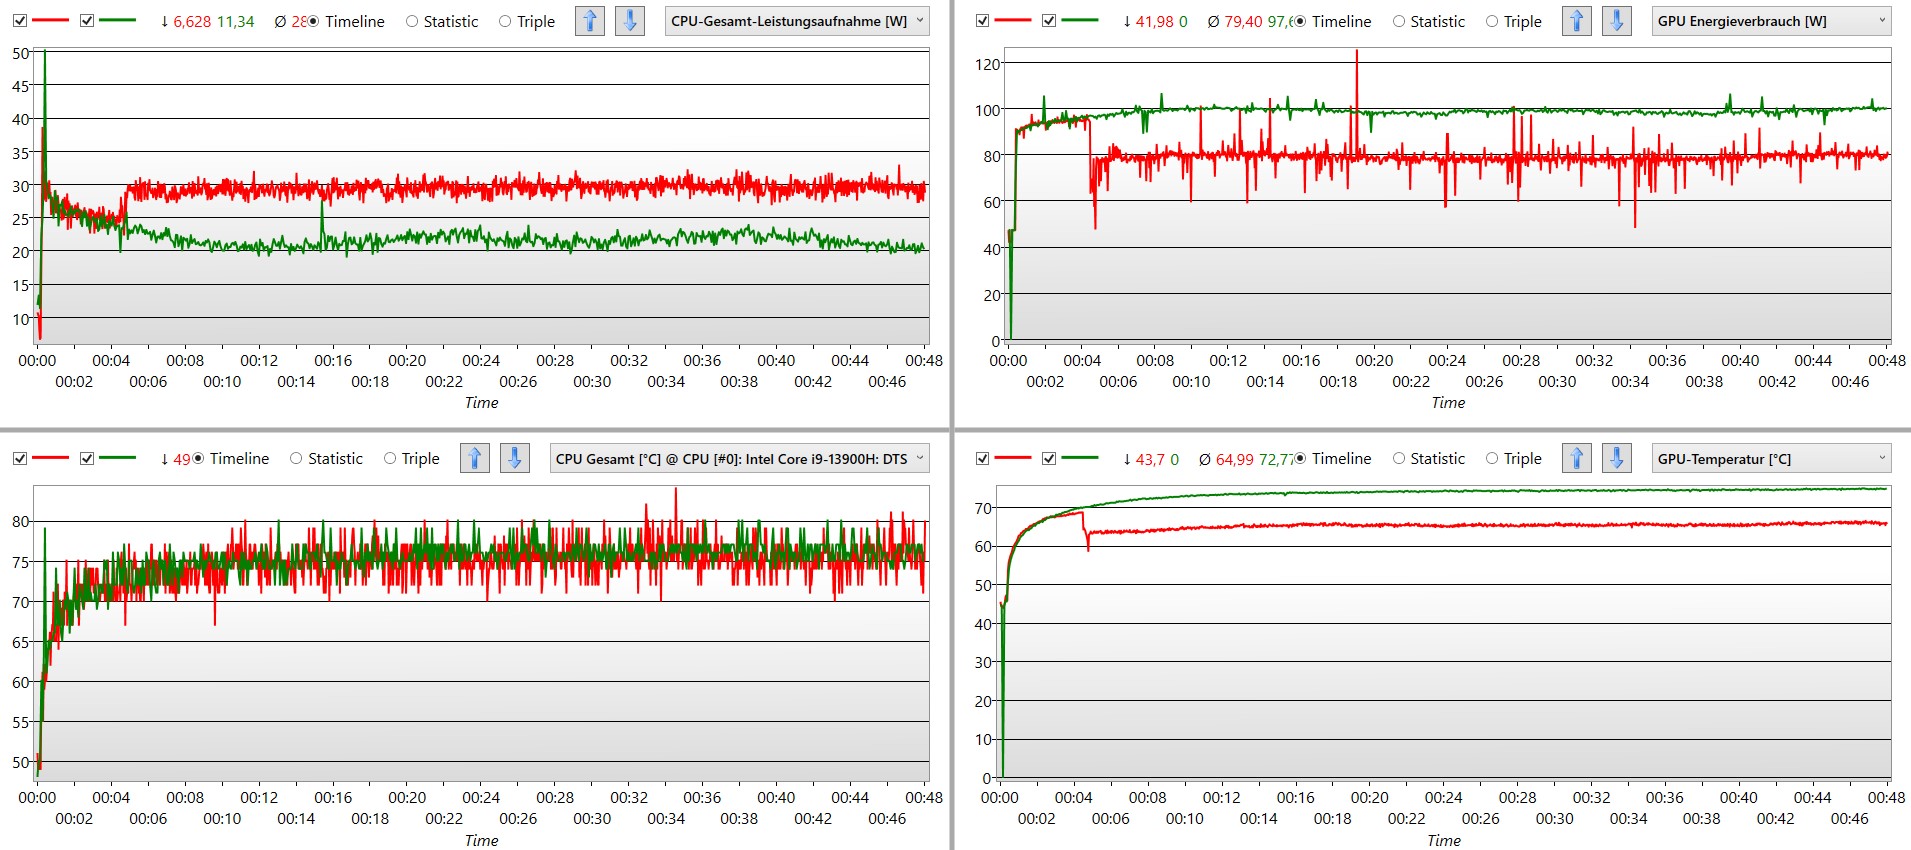
Stress test
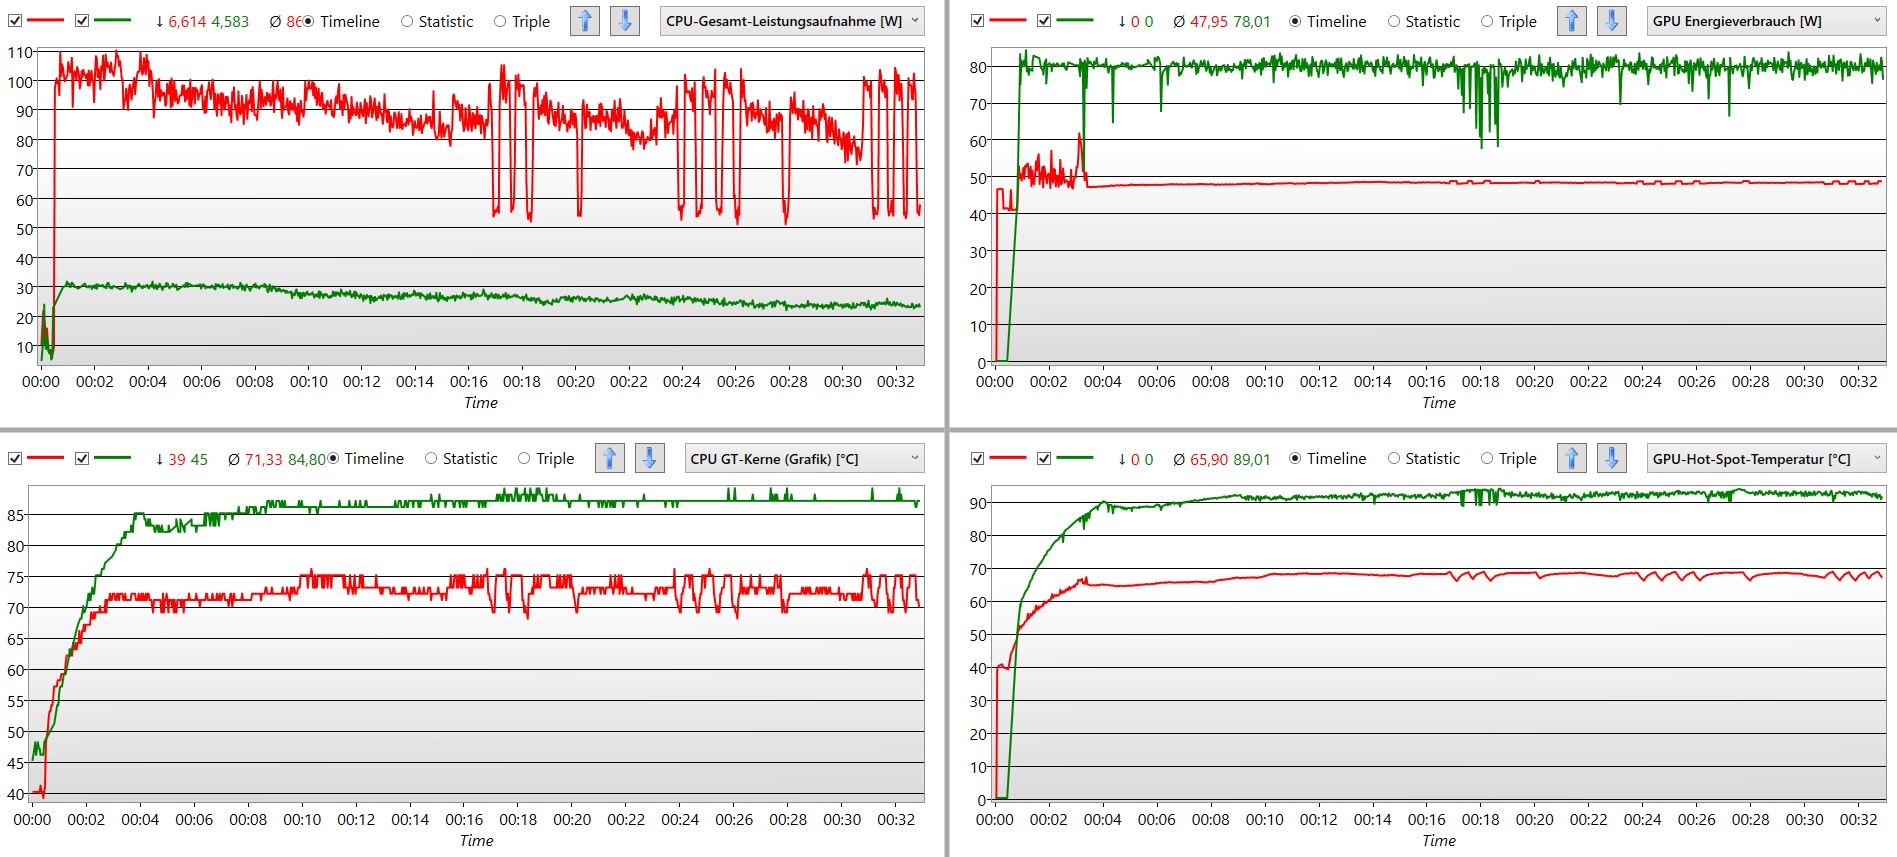
Under constant load, the CPU can be supplied with 90 watts or more for almost 15 minutes. Subsequently, this value has to be throttled back to 50 watts, again and again. Then, 100 watts or more are reached once more, for a brief moment. The clock frequency then also increases to more than 4,000 MHz and never falls below 2,500 MHz.
In parallel, the GPU runs almost constantly at 48 watts, after a few minutes then 60 watts and shows no drops or throttling. The component's temperature constantly stays considerably under 80 °C.
"Silent" mode lives up to its name even in these conditions, even though the fans are running and no throttling occurs. Graphics performance is higher than in the other modes. In return, the CPU is only allowed around 25 watts and the laptop gets very hot.
Speakers
The stereo speakers are considerably better equipped than you would expect from typical laptop drivers. In addition to its broadband speakers, MSI's laptop also uses two woofers on the left and right
This means we are dealing with a two-way system, albeit in a compact form factor. And it sure knows how to make itself heard. Very deep basses are clearly audible and also relatively loud. Voices and instruments sound precise. On top of video game sound, even listening to music is both possible and enjoyable in this configuration.
Only the high basses and lower mids could handle a little more power. It's exactly in this gap where the woofers can no longer operate and, as a result, a sense of presence is missing from, for example, drums and bass guitar. Otherwise, the Stealth 17's speakers almost sound outstanding for a laptop.
MSI Stealth 17 Studio A13VH-014 audio analysis
(+) | speakers can play relatively loud (82.44 dB)
Bass 100 - 315 Hz
(±) | reduced bass - on average 8% lower than median
(±) | linearity of bass is average (8.8% delta to prev. frequency)
Mids 400 - 2000 Hz
(±) | higher mids - on average 8.2% higher than median
(+) | mids are linear (6.8% delta to prev. frequency)
Highs 2 - 16 kHz
(+) | balanced highs - only 1% away from median
(+) | highs are linear (4% delta to prev. frequency)
Overall 100 - 16.000 Hz
(+) | overall sound is linear (11.6% difference to median)
Compared to same class
» 10% of all tested devices in this class were better, 3% similar, 87% worse
» The best had a delta of 6%, average was 18%, worst was 132%
Compared to all devices tested
» 8% of all tested devices were better, 2% similar, 90% worse
» The best had a delta of 4%, average was 24%, worst was 134%
Apple MacBook Pro 16 2021 M1 Pro audio analysis
(+) | speakers can play relatively loud (84.7 dB)
Bass 100 - 315 Hz
(+) | good bass - only 3.8% away from median
(+) | bass is linear (5.2% delta to prev. frequency)
Mids 400 - 2000 Hz
(+) | balanced mids - only 1.3% away from median
(+) | mids are linear (2.1% delta to prev. frequency)
Highs 2 - 16 kHz
(+) | balanced highs - only 1.9% away from median
(+) | highs are linear (2.7% delta to prev. frequency)
Overall 100 - 16.000 Hz
(+) | overall sound is linear (4.6% difference to median)
Compared to same class
» 0% of all tested devices in this class were better, 0% similar, 100% worse
» The best had a delta of 5%, average was 17%, worst was 45%
Compared to all devices tested
» 0% of all tested devices were better, 0% similar, 100% worse
» The best had a delta of 4%, average was 24%, worst was 134%
Energy management - Economical and portable, for a gaming laptop
Power consumption
In view of the powerful hardware, a minimum of 14 watts consumption can be considered a very good value. Especially as the MSI Stealth will be using most of it for its complex mini-LED display. When undertaking simple tasks, this increases to almost 20 watts. The Gigabyte Aero 16 YE5, with the previous generation's CPU, would run dry with so little power although it does have to power an OLED display.
Our peak measurement was 210 watts which means the 240-watt power supply unit is the ideal size in order to charge the battery in every situation. The HP Omen 17, with its HX variant of the CPU and identical graphic chip, sits at 300 watts. Almost regardless of the situation, the Stealth 17 Studio proves itself to be economical for the power on offer.
| Off / Standby | |
| Idle | |
| Load |
|
Key:
min: | |
| MSI Stealth 17 Studio A13VH-014 i9-13900H, GeForce RTX 4080 Laptop GPU, Samsung PM9A1 MZVL22T0HBLB, Mini LED, 3840x2160, 17.3" | Gigabyte Aero 16 YE5 i9-12900HK, GeForce RTX 3080 Ti Laptop GPU, Phison ESR01TBMFCT, AMOLED, 3840x2400, 16" | HP Omen 17-ck2097ng i9-13900HX, GeForce RTX 4080 Laptop GPU, SK hynix PC801 HFS001TEJ9X101N, IPS, 2560x1440, 17.3" | Razer Blade 16 Early 2023 i9-13950HX, GeForce RTX 4080 Laptop GPU, SSSTC CA6-8D1024, IPS, 2560x1600, 16" | Aorus 17X AZF i9-13900HX, GeForce RTX 4090 Laptop GPU, Gigabyte AG470S1TB-SI B10, IPS, 2560x1440, 17.3" | Asus ROG Strix G17 G713PI R9 7945HX, GeForce RTX 4070 Laptop GPU, WD PC SN560 SDDPNQE-1T00, IPS, 2560x1440, 17.3" | Average NVIDIA GeForce RTX 4080 Laptop GPU | Average of class Gaming | |
|---|---|---|---|---|---|---|---|---|
| Power Consumption | -50% | -31% | -50% | -34% | -22% | -38% | -14% | |
| Idle Minimum * (Watt) | 13.9 | 26 -87% | 16 -15% | 15.2 -9% | 11 21% | 15 -8% | 16.9 ? -22% | 13.4 ? 4% |
| Idle Average * (Watt) | 20 | 30 -50% | 20 -0% | 22.8 -14% | 17 15% | 20 -0% | 22 ? -10% | 19.1 ? 4% |
| Idle Maximum * (Watt) | 20.6 | 37 -80% | 26 -26% | 49.8 -142% | 29 -41% | 29 -41% | 34.1 ? -66% | 24.7 ? -20% |
| Load Average * (Watt) | 77 | 127 -65% | 135 -75% | 121.2 -57% | 134 -74% | 121 -57% | 117.9 ? -53% | 108.4 ? -41% |
| Witcher 3 ultra * (Watt) | 162 | 176 -9% | 215 -33% | 242 -49% | 278 -72% | 179.8 -11% | ||
| Load Maximum * (Watt) | 216 | 236 -9% | 299 -38% | 273.7 -27% | 334 -55% | 246 -14% | 297 ? -38% | 254 ? -18% |
* ... smaller is better
Power consumption Witcher 3 / stress test
Power consumption with an external monitor
Battery life
Before the first BIOS update, we determined battery life to be a little over three hours in the WiFi test with reduced display brightness.
Subsequently, the MSI Stealth 17 then showed that it can also be economical in battery mode. Despite the still decent computing power, we measured considerably over five hours with both Full HD video playback and a WiFi test, where websites were changed every minute, despite still decent computing power. At least at this performance level, this can be considered a very good result.
In battery tests, the competition was left behind in Witcher 3. However, that is no mean feat considering the completely minimised graphics performance and 3fps. For this reason, we would advise against playing games or editing images or videos in battery mode.
"Super Battery" mode was disappointing. It sounds super but we didn't even manage five hours in the WiFi test. Maybe additional updates will improve matters.
| MSI Stealth 17 Studio A13VH-014 i9-13900H, GeForce RTX 4080 Laptop GPU, 99 Wh | Gigabyte AERO 16 OLED BSF i9-13900H, GeForce RTX 4070 Laptop GPU, 88 Wh | Asus ROG Zephyrus M16 GU604VY-NM042X i9-13900H, GeForce RTX 4090 Laptop GPU, 90 Wh | MSI Creator Z17 A12UGST-054 i9-12900H, GeForce RTX 3070 Ti Laptop GPU, 90 Wh | Razer Blade 17 Early 2022 i9-12900H, GeForce RTX 3080 Ti Laptop GPU, 82 Wh | Alienware x17 R2 P48E i9-12900HK, GeForce RTX 3080 Ti Laptop GPU, 87 Wh | Lenovo Legion Pro 7 16IRX8H i9-13900HX, GeForce RTX 4080 Laptop GPU, 99.9 Wh | Razer Blade 16 Early 2023 i9-13950HX, GeForce RTX 4080 Laptop GPU, 95.2 Wh | Average of class Gaming | |
|---|---|---|---|---|---|---|---|---|---|
| Battery runtime | 32% | 15% | 11% | -13% | -57% | 11% | -2% | 21% | |
| H.264 (h) | 5.6 | 7.4 32% | 4.8 -14% | 5.5 -2% | 4.8 -14% | 8.26 ? 48% | |||
| WiFi v1.3 (h) | 5.6 | 7.5 34% | 4.3 -23% | 5.5 -2% | 3.8 -32% | 2 -64% | 5.1 -9% | 6.1 9% | 6.94 ? 24% |
| Witcher 3 ultra (h) | 2.6 | ||||||||
| Load (h) | 1.6 | 2.1 31% | 2.9 81% | 2.2 38% | 1.7 6% | 0.8 -50% | 2.1 31% | 1.4 -13% | 1.47 ? -8% |
Pros
Cons
Verdict - Strong, not perfect
The MSI Stealth 17 Studio is equally capable of high-level media processing and playing current games. It remains pleasantly quiet, even if a few percentage points of power have had to be sacrificed in the process. While the CPU manages to reach its full potential, the RTX 4080 has been shackled a bit to the level of an RTX 4070.
It is exactly this trick that ensures an enormous improvement in efficiency so that high-level (if not the highest level) gaming is possible without any overblown noise generation. Similarly, this applies to work in the office. Especially in "Silent" mode, the Stealth is perfectly restrained, even if it does get very warm.
Not quite perfect: To some extent, the Stealth 17 is well thought out. It packs tons of graphics power and high-end components in a slim case. The laptop's cooling system can be set such that, noise-wise, it doesn't even reach low volume. However, small flaws cloud otherwise exceptionally positive impressions.
Additionally, there are outstanding features in the form of 64 GB of RAM, the large M.2 SSD plus expandability options and a 144 Hz, 4K mini-LED display. This is rounded off by really good-sounding speakers and an RGB keyboard with numerous customisation options.
But: The Stealth 17 Studio top model (RTX 4090) costs the princely sum of $3,999. And for that price, the list of flaws seems somewhat too long. The two BIOS updates are the easiest to forgive. The weak hinges, on the other hand, seem like a design flaw. Especially since the mini-LED display attached to them certainly possesses good but in no way superlative image quality and fails to impress in either the areas of brightness or the promised color space.
There are also some small additional details. The touchpad, which ought to be used only occasionally, appears imprecise. The keyboard backlighting is uneven, and the laptop's power supply cable is too short, meaning the PSU must inevitably sit on the desk.
The good basic concept is unaffected but improvements seem inevitable. The version of the Stealth 17 Studio A13V, which is better in many situations, is likely to be the next smaller variant. This device does without Mini LED and 4K, instead going for IPS, QHD resolution, an i7 and the RTX 4070 - and all for $1,300 less. If gaming is the main focus, the Asus ROG Strix G17, for example, offers considerably more power for around $2,300 and is recognizable as a gaming laptop from afar - unlike the Stealth.
Price and availablity
The MSI Stealth 17 Studio (32 GB of RAM) with an Nvidia GeForce RTX 4080 can be had on Amazon for $2,669. A variant with an RTX 4090 and 64 GB of RAM is also available there for $3,999.
MSI Stealth 17 Studio A13VH-014
- 04/18/2023 v7 (old)
Mario Petzold
Transparency
The selection of devices to be reviewed is made by our editorial team. The test sample was provided to the author as a loan by the manufacturer or retailer for the purpose of this review. The lender had no influence on this review, nor did the manufacturer receive a copy of this review before publication. There was no obligation to publish this review. As an independent media company, Notebookcheck is not subjected to the authority of manufacturers, retailers or publishers.
This is how Notebookcheck is testing
Every year, Notebookcheck independently reviews hundreds of laptops and smartphones using standardized procedures to ensure that all results are comparable. We have continuously developed our test methods for around 20 years and set industry standards in the process. In our test labs, high-quality measuring equipment is utilized by experienced technicians and editors. These tests involve a multi-stage validation process. Our complex rating system is based on hundreds of well-founded measurements and benchmarks, which maintains objectivity. Further information on our test methods can be found here.
Price comparison

