Nvidia Ada RTX 40 Laptop GPU analysis: 175 W RTX 4090 Laptop GPU surpasses a 350 W RTX 3090 in performance and power efficiency

Laptop GPUs are traditionally held back by power and frequency limitations compared to their desktop counterparts.
While we are still not at the stage where physics can be discounted, today's GPUs have evolved to offer more performance per watt than ever before.
Last year, Nvidia announced the Ada Lovelace architecture for consumer desktops marked by the advent of GeForce RTX 40 Series. In our testing, the RTX 4090, RTX 4080, and the RTX 4070 Ti desktop cards offered significant performance and efficiency uplifts compared to their Ampere counterparts.
Today, it is the turn of Ada's mobile variants to repeat the feat.
Laptops featuring flagship Ada mobile GPUs such as the RTX 4090 and RTX 4080 Laptop GPUs are now available worldwide. Devices with midrange Ada cards will launch later this month.
Ada mobile architecture: RTX 40 mobile in comparison with other Nvidia GPUs
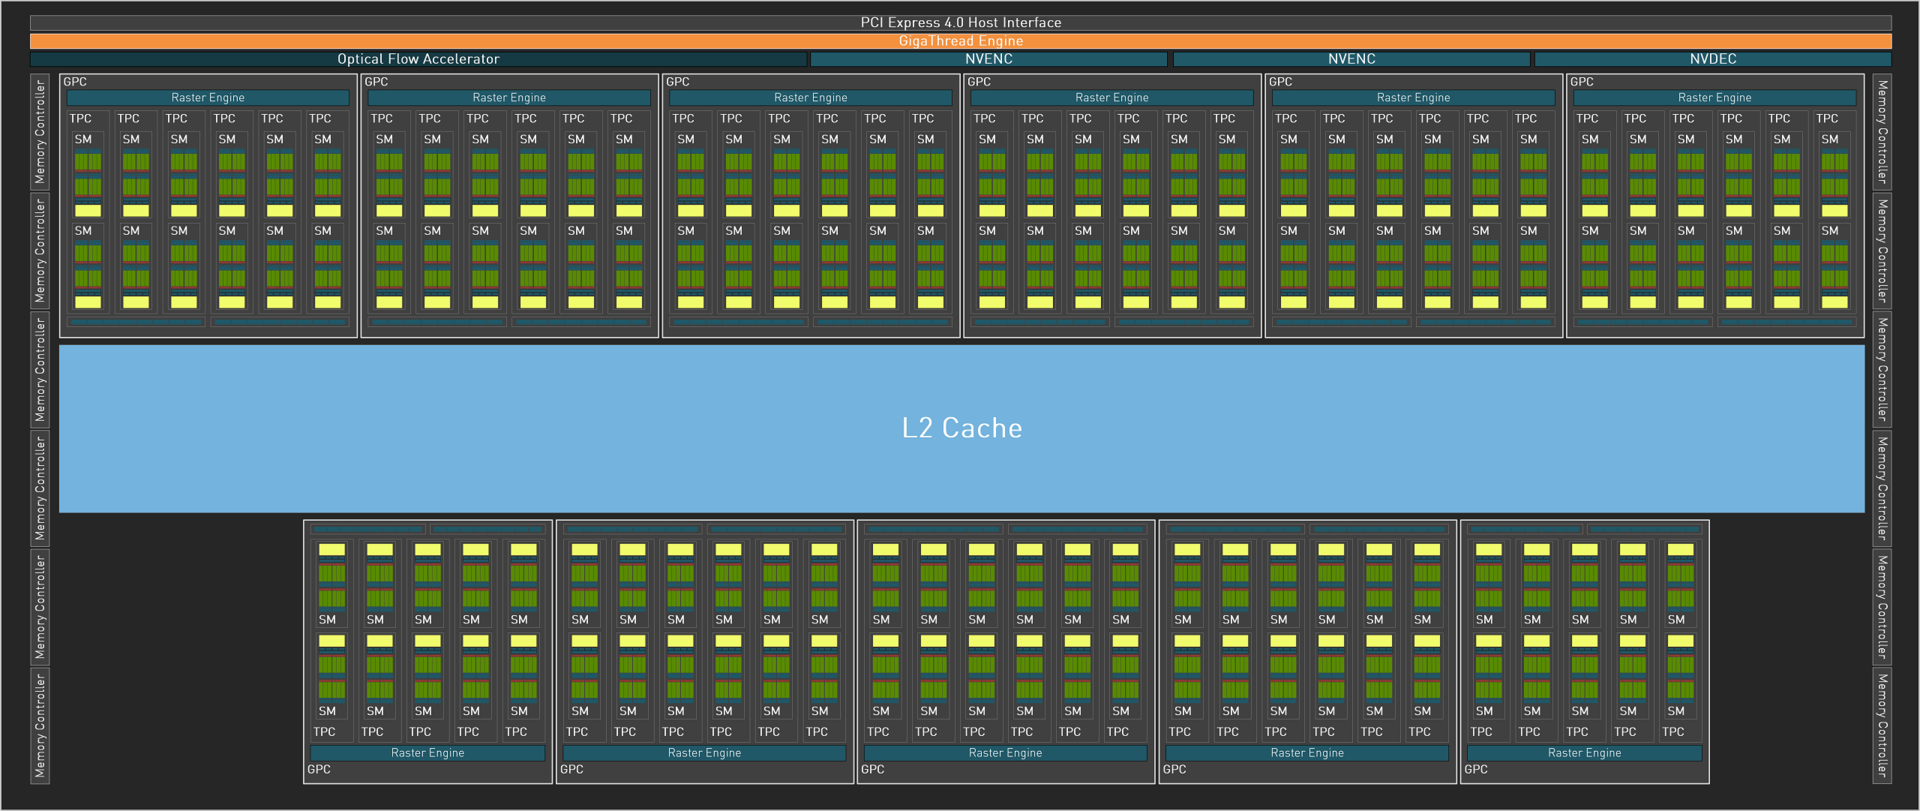
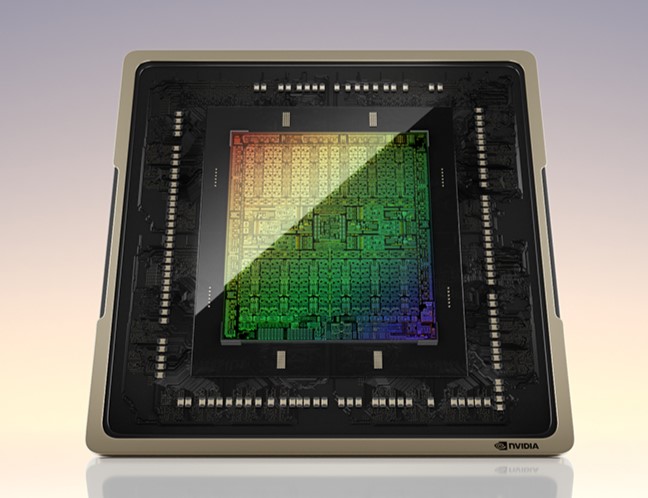
Shoehorning a full fat AD102 die in a laptop chassis is not possible without serious compromises in battery life and thermal management. Therefore, the RTX 40 mobile lineup starts from the AD103 GPU, which is made de novo for mainstream GPUs such as the RTX 4080 and below and thus is not a cut-down AD102 part.
Therefore, the RTX 4090 Laptop GPU is essentially the same as the desktop RTX 4080 with misleading nomenclature. However, that's where the similarities between these cards end.
The RTX 4090 Laptop GPU can be configured in a TDP range between 80 W and 150 W, which results in boost clocks ranging from 1,455 MHz to 2,040 MHz.
Learning from the Ampere fiasco, OEMs are now proactively indicating the GPU wattage in the specifications which should give buyers a better perspective of performance relative to the laptop's configuration and chassis.
However, do note that not all OEMs publish Dynamic Boost values.
The RTX 4090 Laptop GPU uses the same 256-bit memory bus as the desktop RTX 4080 but suffers from a ~20% reduction in memory bandwidth albeit being slightly faster than the RTX 3080 Ti Laptop GPU.
The power-hungry nature of GDDR6X means that it cannot be used in a laptop form factor. Nvidia said that the GDDR6 VRAM in Ada mobile is designed to be highly efficient with improved clock gating, low voltage, and added lower power memory states.
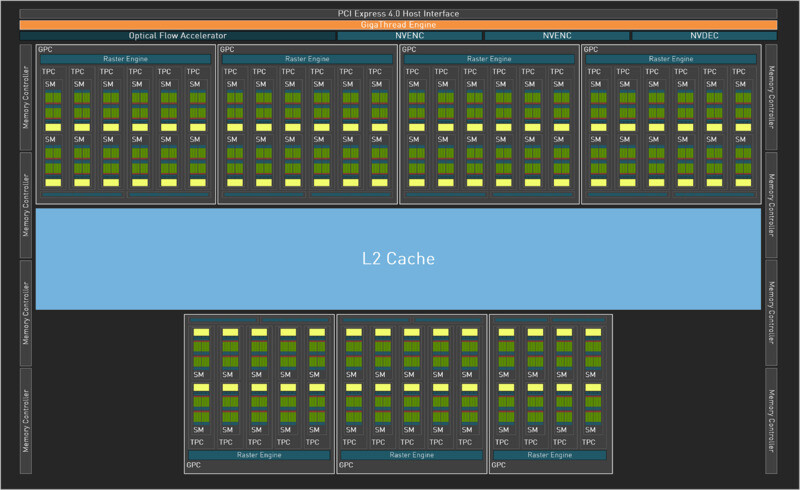
The RTX 4080 Laptop GPU uses the desktop RTX 4070 Ti's AD104 die with a slight reduction in CUDA core counts that matches with what we had seen before in the RTX 3080 Ti Laptop GPU.
Although the RTX 3080 Ti Laptop GPU seems better on paper, at least in terms of VRAM characteristics, the RTX 4080 mobile makes up for this deficiency with architectural improvements in Ada.
| Specification | RTX 4090 FE | RTX 4080 FE | RTX 4070 Ti | RTX 4090 Laptop GPU | RTX 4080 Laptop GPU | RTX 3090 Ti FE | RTX 3090 FE | RTX 3080 Ti FE | RTX 3080 FE | RTX 3080 Ti Laptop GPU |
| Chip | AD102 | AD103 | AD104 | AD103 | AD104 | GA102 | GA102 | GA102 | GA102 | GA103 |
| FinFET Process | Custom 4N | Custom 4N | Custom 4N | Custom 4N | Custom 4N | 8 nm | 8 nm | 8 nm | 8 nm | 8 nm |
| CUDA Cores | 16,384 | 9,728 | 7,680 | 9,728 | 7,424 | 10,752 | 10,496 | 10,240 | 8,704 | 7,424 |
| Texture Units | 512 | 304 | 240 | 304 | 232 | 336 | 328 | 320 | 272 | 232 |
| Tensor Cores | 512 4th Gen. | 304 4th Gen. | 240 4th Gen. | 304 4th Gen. | 232 4th Gen. | 336 3rd Gen. | 328 3rd Gen. | 320 3rd Gen. | 272 3rd Gen. | 232 3rd Gen. |
| RT Cores | 128 3rd Gen. | 76 3rd Gen. | 60 3rd Gen. | 76 3rd Gen. | 58 3rd Gen. | 84 2nd Gen. | 82 2nd Gen. | 80 2nd Gen. | 68 2nd Gen. | 58 2nd Gen. |
| GPU Base Clock | 2,235 MHz | 2,205 MHz | 2,310 MHz | 1,590 MHz | 1,530 MHz | 1,560 MHz | 1,395 MHz | 1,365 MHz | 1,440 MHz | 1,230 MHz |
| GPU Boost Clock | 2,520 MHz | 2,505 MHz | 2,760 MHz | 2,040 MHz | 1,995 MHz | 1,860 MHz | 1,695 MHz | 1,665 MHz | 1,710 MHz | 1,590 MHz |
| Memory Bus | 384-bit | 256-bit | 192-bit | 256-bit | 192-bit | 384-bit | 384-bit | 384-bit | 320-bit | 256-bit |
| Memory Bandwidth | 1,008 GB/s | 716.8 GB/s | 504 GB/s | 576 GB/s | 432 GB/s | 1,008 GB/s | 936 GB/s | 912 GB/s | 760 GB/s | 512 GB/s |
| Video Memory | 24 GB GDDR6X | 16 GB GDDR6X | 12 GB GDDR6X | 16 GB GDDR6 | 12 GB GDDR6 | 24 GB GDDR6X | 24 GB GDDR6X | 12 GB GDDR6X | 10 GB GDDR6X | 16 GB GDDR6 |
| Power Consumption | 450 W | 320 W | 285 W | 150 W (+25 W DB) | 150 W (+25 W DB) | 450 W | 350 W | 350 W | 320 W | 150 W (+25 W DB) |
The Ada generation also brings with it some notable changes to Nvidia's Max-Q implementation. When Max-Q first debuted with Turing, the focus was more towards the TDP rating alone. The cards themselves were distinctly labeled as Max-Q, which made selection easier.
However, from Ampere, Nvidia chose to put both the press and end-users in a conundrum by removing the Max-Q branding and instead using it as an umbrella term for technologies such as Whisper Mode, Resizeable BAR, Dynamic Boost, Advanced Optimus, and the likes.
OEMs now have the choice of using whichever subset of Max-Q technologies they deem fit, and also fit in a large GPU in a thin chassis for bragging rights whilst actually configuring its TDP near base values.
With Ada, Nvidia is introducing what it calls 5th gen Max-Q in which DLSS 3 and low-power GDDR6 memory play an integral part.
New DLSS 3 and ray tracing pipelines
We've touched briefly upon DLSS 3 and new ray tracing functions in Ada in our review of the RTX 4090 Founders Edition. Essentially, DLSS 3 uses Ada's new standalone Optical Flow Accelerator (OFA) to insert frames on the fly. The frame generation happens on the GPU and not in the game.
More precisely, DLSS 3 is a combination of existing DLSS 2 Super Resolution and frame generation. According to Nvidia, DLSS 3 reconstructs 7/8th of the image — 3/4th of the first frame is reconstructed with DLSS 2 Super Resolution while the complete second frame is created with frame generation.
Since frame generation happens at the GPU, DLSS 3 can help boost frames in CPU-bound or physics-heavy titles like Microsoft Flight Simulator 2020.
Note that DLSS 3 requires an RTX 40 GPU, supported title, and enabling Hardware accelerated GPU scheduling and Nvidia Reflex.

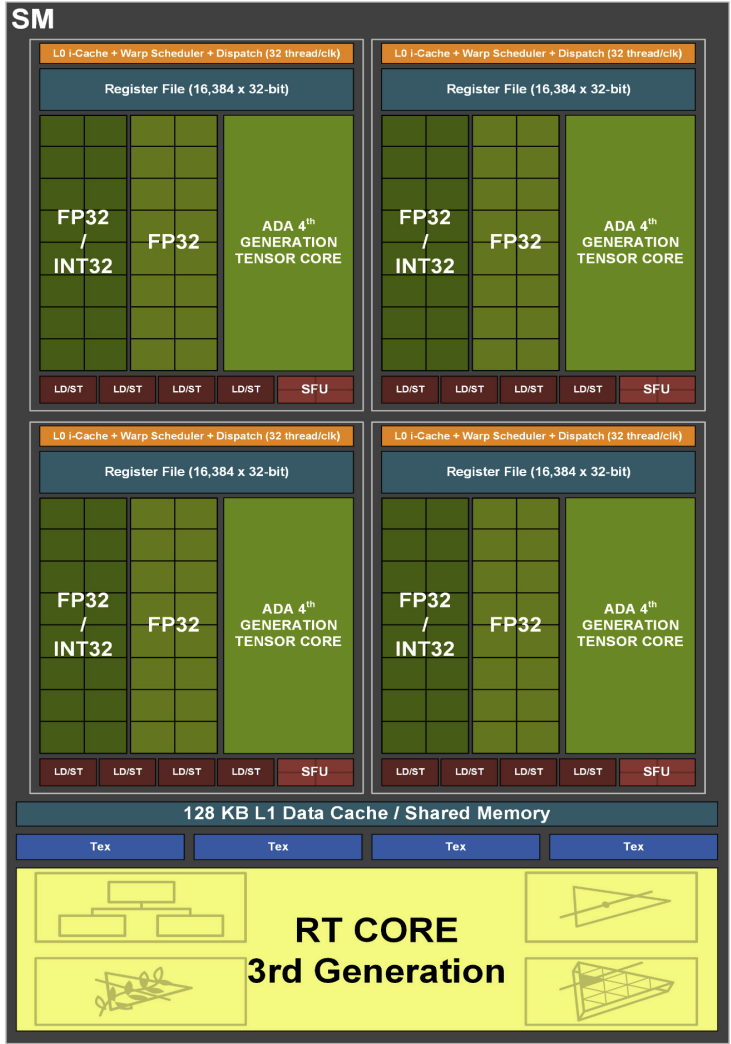
Ada features 3rd generation ray tracing (RT) cores with two new functions — the opacity micromap engine and the displaced micro-mesh engine. This is in addition to the box intersection engine and triangle intersection engine already present in Ampere.
There's also a new Shader Execution Reordering (SER) pipeline, which works as an efficient scheduler for secondary ray threads. While SER can potentially speed up intensive RT calculations like path tracing, it requires support from the game developer.
According to Nvidia, implementing SER should be quite straightforward. Developers will be able to get feedback about SER performance via Nvidia NSight. The company said that it is working with Microsoft and others to add SER support to graphics APIs such as DirectX.
Test devices: Cream of the crop
We have the following test devices in our labs:
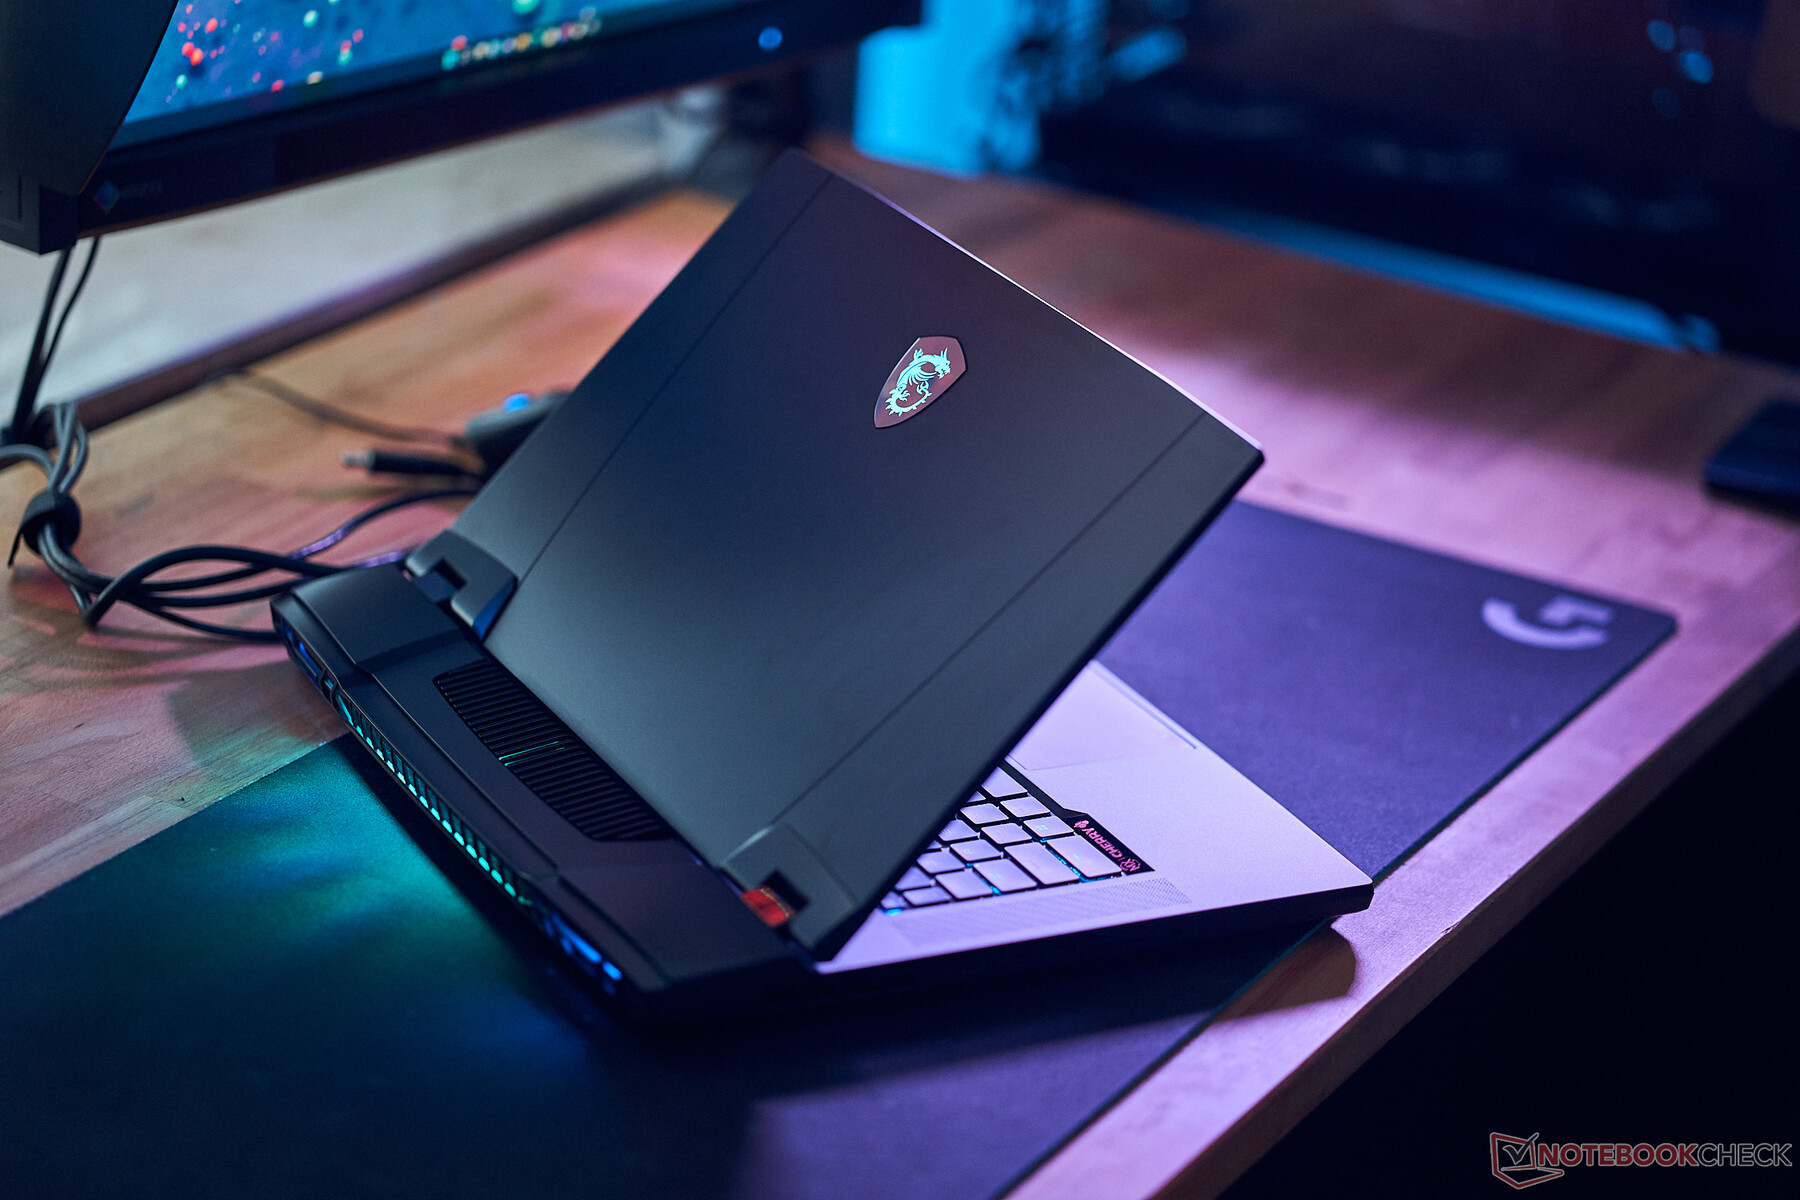
- MSI Titan GT77 HX 13V (Core i9-13950HX + RTX 4090 Laptop GPU)
- Schenker XMG Neo 16 (Core i9-13900HX + RTX 4090 Laptop GPU)
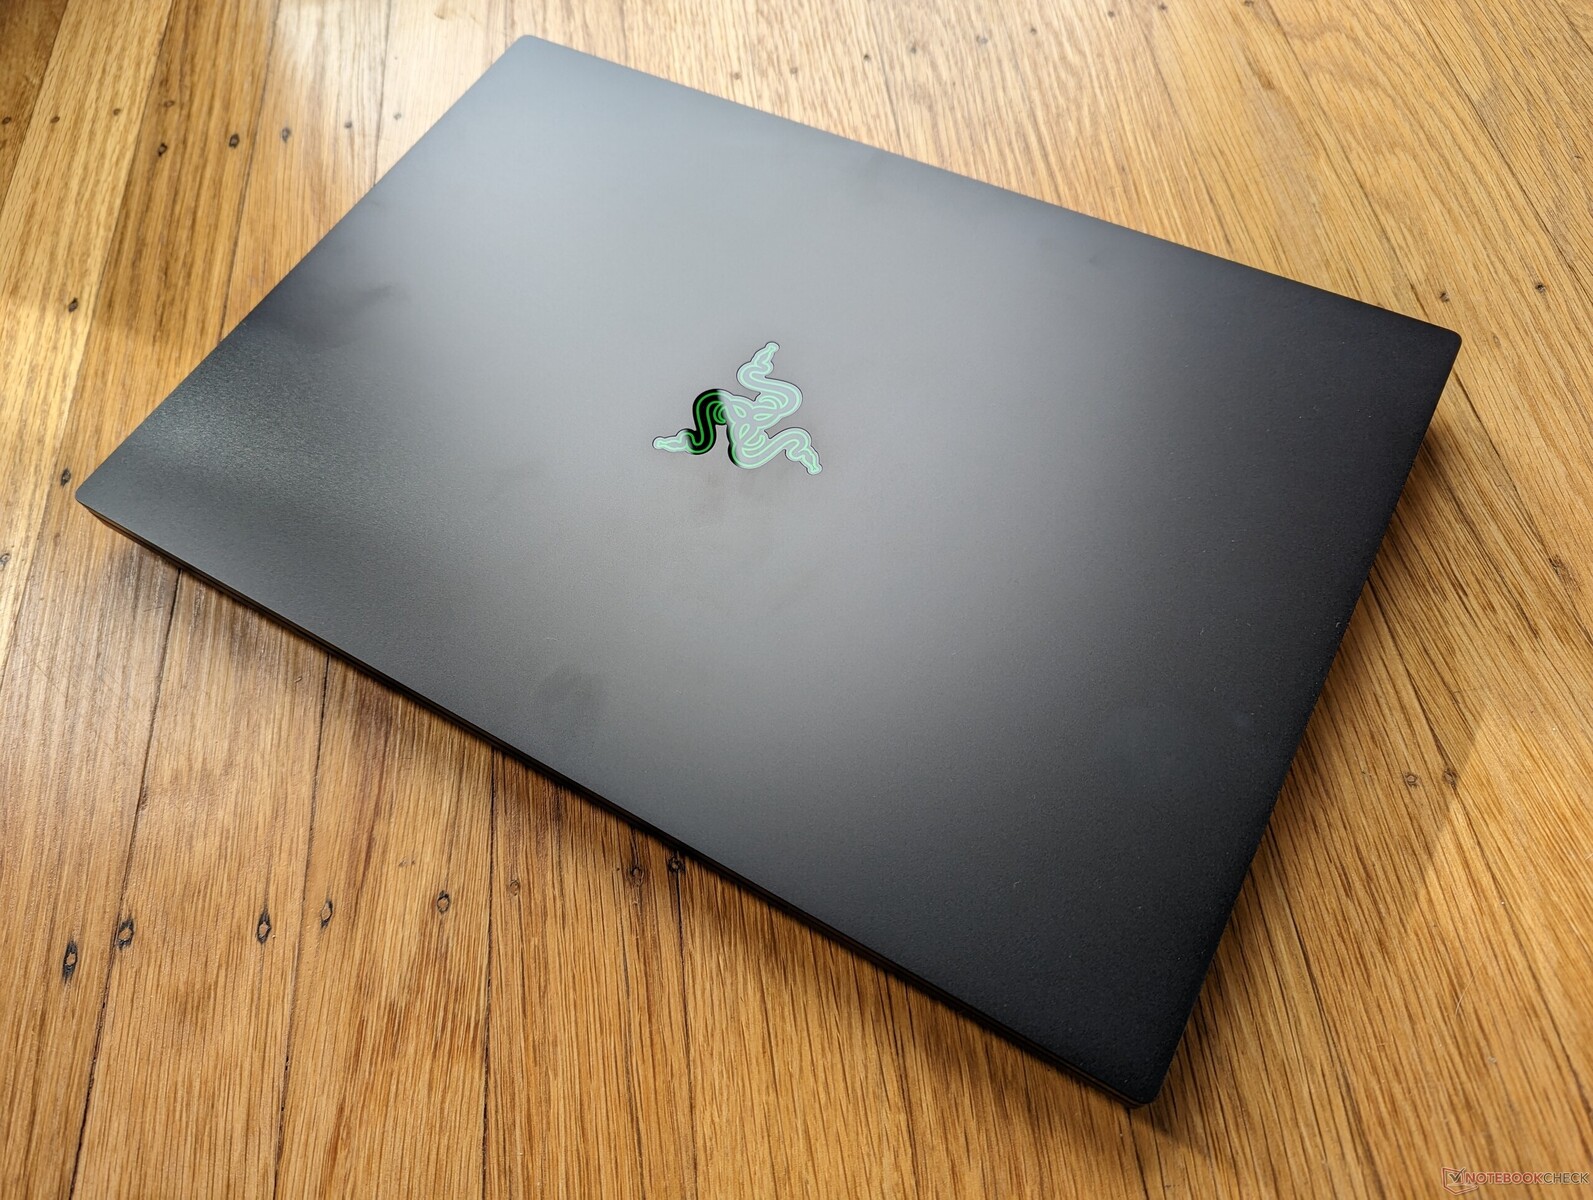
- Razer Blade 16 Early 2023 (Core i9-13950HX + RTX 4080 Laptop GPU)
All tested devices were run in their maxed-out performance modes with MUX switching to the dGPU. This allowed the RTX 4090 and RTX 4090 to utilize the full 175 W TGP including Dynamic Boost.

Note: We are the first to receive an early variant of the Schenker XMG Neo 16. Since this is a pre-production model, the scores may not be reflective of the device's actual performance in our official review with a retail sample.
Synthetic performance: RTX 4090 mobile right on the heels of a desktop RTX 4070 Ti
Cumulative 3DMark performance sees the RTX 4090 Laptop GPU in both the Titan GT77 HX and the XMG Neo 16 performing on similar lines, indicating no potential bottlenecking elsewhere in the pipeline.
The Razer Blade 16's RTX 4080 Laptop GPU trails by 19% compared to the RTX 4090 Laptop, which is similar to the percentage delta between the desktop variants of these GPUs.
That being said, the RTX 4090 Laptop GPU is up to 35% slower than the desktop RTX 4090 Founders Edition card while trailing by up to 26% compared to the Radeon RX 7900 XTX. However, its performance is comparable to that of the desktop RTX 4070 Ti.
Despite featuring a similar number of CUDA cores, TDP limitations mean that the 320 W RTX 4080 Founders Edition is 20% faster compared to a 175 W RTX 4090 Laptop GPU in overall 3DMark performance.
Compared to previous generation mobile GPUs, the Ada generation seems to offer significant performance uplifts. The RTX 4090 Laptop GPU is a whopping 76% faster in all 3DMark tests taken together than the average RTX 3080 Ti Laptop GPU.
Good 43% gains are also seen with the RTX 4080 Laptop GPU compared to the average RTX 3080 Ti mobile variant.
Gaming performance: RTX 4090 Laptop GPU on par with RTX 4070 Ti at 4K
A similar trend is seen in gaming as well, wherein the RTX 4090 Laptop GPU in the XMG Neo 16 is within striking distance of the RTX 4070 Ti desktop in cumulative gaming performance.
We see that the RTX 4080 Laptop GPU trails the RTX 4090 mobile variant by up to 17%, which is similar to the deltas we see between the desktop versions of the RTX 4090 and the RTX 4080.
Architecture improvements seem to confer the RTX 4080 Laptop a 33% advantage over the RTX 3080 Ti Laptop GPU in overall gaming performance, but the RTX 4090 offers a whopping 61% gain over Ampere's mobile flagship.
Just like their desktop counterparts, RTX 40 mobile GPUs also seem to get easily CPU-bottlenecked at lower resolutions. Metro Exodus (non-Enhanced), for instance, sees the RTX 4090 Laptop GPU trailing the desktop RTX 4070 Ti by up to 19% at 1080p Ultra. However, at 4K Ultra, the flagship Ada mobile GPU performs on par with the RTX 4070 Ti.
We also see widening deltas between the RTX 4090 Laptop GPU and the RTX 4090 desktop card at 4K Ultra compared to 1080p or QHD Ultra for this reason — Ada simply loves to be taxed at 4K.
Interestingly, the gap between the RTX 4080 Laptop GPU and the RTX 4090 Laptop GPU also increases at 4K.
Exceedingly CPU-bound games like Mafia: Definitive Edition show perceptible differences between the RTX 4070 Ti and RTX 4090 Laptop GPU only at 1080p. As the resolution increases, the RTX 4090 Laptop GPU is able to close the gap or even beat the RTX 4070 Ti by a whisker in this game.
Ray tracing performance
Despite sporting the same number of RT cores as the RTX 4080 desktop, the RTX 4090 Laptop GPU can be up to 25% slower in overall ray tracing performance. However, we see excellent gains up to 58% compared to the RTX 3080 Ti Laptop GPU.
While we see very good fps numbers at native 1080p, 4K native ray tracing at playable frame rates is still not within the realm of possibility as seen in the Cyberpunk 2077 results. Nvidia is pushing DLSS 3 as the only viable means of playing at higher resolutions with RT enabled.
DLSS 3 performance
The following table illustrates benefits of DLSS 3 in supported titles with the RTX 4090 Laptop GPU in the MSI Titan GT77 HX 13V.
Compared to 4K native, DLSS 3 in Balanced mode shows phenomenal performance advantages at 4K Ultra settings. Cyberpunk 2077 has been Nvidia's poster child for ray tracing and DLSS performance for some time now, and accordingly we see a stupendous 331% gain in average fps after enabling DLSS 3 compared to native 4K at Ultra settings.
| Game | Setting | DLSS off | DLSS on (Balanced) | Difference |
|---|---|---|---|---|
| Spider-Man Miles Morales | 4K Ultra | 83 FPS | 132 FPS | +59 % |
| The Witcher 3 4.00 | 4K RT Ultra | 27 FPS | 50 FPS | +85 % |
| Cyberpunk 2077 1.5 | 4K RT Ultra | 22 FPS | 95 FPS | +331 % |
| God of War | 4K Ultra | 80 FPS | 111 FPS | +38 % |
| Horizon Zero Dawn | 4K Ultra | 95 FPS | 143 FPS | +51 % |
MSI Titan GT77 HX 13VI
| low | med. | high | ultra | QHD | 4K DLSS | 4K | |
|---|---|---|---|---|---|---|---|
| GTA V (2015) | 184.1 | 182.6 | 140.9 | 138.5 | 175.7 | ||
| The Witcher 3 (2015) | 619 | 546 | 422 | 198.9 | 160 | ||
| Dota 2 Reborn (2015) | 225 | 206 | 194.1 | 185.9 | 178.9 | ||
| Final Fantasy XV Benchmark (2018) | 230 | 221 | 187.4 | 162.9 | 94.7 | ||
| X-Plane 11.11 (2018) | 203 | 177.5 | 134.1 | 114.3 | |||
| Far Cry 5 (2018) | 186 | 173 | 160 | 159 | 113 | ||
| Strange Brigade (2018) | 490 | 396 | 391 | 373 | 309 | 159.3 | |
| Shadow of the Tomb Raider (2018) | 245 | 227 | 219 | 214 | 187 | 103 | |
| Metro Exodus (2019) | 204 | 183 | 153 | 132 | 116 | 81 | |
| Control (2019) | 240 | 232 | 187 | 122 | 63 | ||
| Borderlands 3 (2019) | 201 | 176 | 162 | 151 | 130 | 76 | |
| Horizon Zero Dawn (2020) | 209 | 189 | 174 | 163 | 154 | 131 | 95 |
| Mafia Definitive Edition (2020) | 219 | 189 | 179 | 161 | 93 | ||
| Watch Dogs Legion (2020) | 152 | 144 | 131 | 120 | 109 | 69 | |
| F1 2021 (2021) | 501 | 449 | 417 | 209 | 192.4 | 114.4 | |
| Far Cry 6 (2021) | 167 | 147 | 144 | 135 | 89 | ||
| Forza Horizon 5 (2021) | 220 | 181 | 174 | 124 | 113 | 95 | |
| God of War (2022) | 201 | 200 | 180 | 133 | 115 | 80 | |
| Rainbow Six Extraction (2022) | 378 | 347 | 346 | 314 | 219 | 112 | |
| Dying Light 2 (2022) | 240 | 206 | 174 | 121 | 62 | ||
| GRID Legends (2022) | 254 | 230 | 210 | 199 | 190 | 132 | |
| Cyberpunk 2077 1.6 (2022) | 156 | 144 | 138 | 135 | 98 | 56 | |
| Ghostwire Tokyo (2022) | 237 | 236 | 234 | 231 | 206 | 100 | |
| Tiny Tina's Wonderlands (2022) | 339 | 289 | 224 | 182 | 131 | 70 | |
| F1 22 (2022) | 316 | 294 | 283 | 138.2 | 90.1 | 44.9 | |
| Call of Duty Modern Warfare 2 2022 (2022) | 230 | 215 | 183 | 176 | 135 | 126 | 85 |
| Spider-Man Miles Morales (2022) | 134 | 131 | 118 | 116 | 113 | 83 | |
| The Callisto Protocol (2022) | 195 | 181 | 145 | 144 | 114 | 68 | |
| The Witcher 3 v4 (2023) | 240 | 189 | 173 | 150 | 104 | 50 | |
| Dead Space Remake (2023) | 147 | 141 | 130 | 129 | 100 | 53 |
Razer Blade 16 Early 2023
| low | med. | high | ultra | QHD DLSS | QHD FSR | QHD | 4K DLSS | 4K FSR | 4K | |
|---|---|---|---|---|---|---|---|---|---|---|
| GTA V (2015) | 186.6 | 185.2 | 183.4 | 140.7 | 125.2 | 143.7 | ||||
| The Witcher 3 (2015) | 609.6 | 462.7 | 353.5 | 176.8 | 120.6 | |||||
| Dota 2 Reborn (2015) | 218 | 204 | 196 | 194.7 | 176.7 | |||||
| Final Fantasy XV Benchmark (2018) | 195.8 | 184.1 | 157.8 | 120.1 | 74.1 | |||||
| X-Plane 11.11 (2018) | 201 | 177.7 | 137 | 117.5 | ||||||
| Strange Brigade (2018) | 438 | 365 | 351 | 323 | 237 | 122.3 | ||||
| Shadow of the Tomb Raider (2018) | 228 | 201 | 196 | 176 | 154 | 84 | ||||
| Metro Exodus (2019) | 197 | 170.4 | 145 | 121.7 | 102 | 67 | ||||
| Control (2019) | 239.1 | 204.7 | 157 | 102 | 50.1 | |||||
| Borderlands 3 (2019) | 207.7 | 176.6 | 158.1 | 133.5 | 108.7 | 59.8 | ||||
| Valorant (2020) | 336 | |||||||||
| Horizon Zero Dawn (2020) | 128 | 112 | ||||||||
| Mafia Definitive Edition (2020) | 280.3 | 184 | 171.3 | 121.6 | 70.4 | |||||
| Watch Dogs Legion (2020) | 140 | 129 | 121 | 110 | 93 | 56 | ||||
| Far Cry 6 (2021) | 181 | 149 | 134 | 125 | 115 | 71 | ||||
| Dying Light 2 (2022) | 184.1 | 160.4 | 140.9 | 97.8 | 48.6 | |||||
| Cyberpunk 2077 1.6 (2022) | 121.1 | 118.1 | 113.8 | 106.2 | 81.2 | 40 | ||||
| Ghostwire Tokyo (2022) | 198.7 | 159.6 | 154 | 145 | 135.9 | 73.1 | ||||
| The Callisto Protocol (2022) | 177.8 | 159.8 | 119.9 | 120.4 | 93.1 | 55.3 | ||||
| Baldur's Gate 3 (2023) | 168.3 | 160 | 121.9 | 120.5 | 66.7 | |||||
| Cyberpunk 2077 (2023) | 110 | 93.6 | 80.6 | 44.4 | 36.2 | 35 | ||||
| Alan Wake 2 (2023) | 66.9 | 37 | ||||||||
| Skull & Bones (2024) | 50 | |||||||||
| Horizon Forbidden West (2024) | 56.1 | 54.8 | 39.5 | |||||||
| F1 24 (2024) | 226 | 236 | 251 | 117.7 | 118.8 | 92.5 | 76.3 | 65 | 38.8 | |
| Black Myth: Wukong (2024) | 110 | 89 | 71 | 42 | 47 | 31 | 33 | 18 | ||
| Star Wars Outlaws (2024) | 84.3 | 81.5 | 74.1 | 64.4 | 59.1 | 47.7 | 35.8 | 20.5 | ||
| Call of Duty Black Ops 6 (2024) | 107 | 100 | 65 | 62 | ||||||
| Stalker 2 (2024) | 63.1 | 50.3 | 30.9 | |||||||
| Marvel Rivals (2024) | 145 | 120 | 88 | 74 | 56 | |||||
| Indiana Jones and the Great Circle (2024) | 96.4 | 80.3 | 51 | |||||||
| Kingdom Come Deliverance 2 (2025) | 92.3 | 92.3 | 71.2 | |||||||
| Monster Hunter Wilds (2025) | 63.3 | 62 | 54.8 | 48 | 34.4 | |||||
| Civilization 7 (2025) | 155.1 | 117.3 | 105.8 | 50.2 | ||||||
| Assassin's Creed Shadows (2025) | 69 | 50 | 52 | 44 | 41 | 32 | ||||
| Doom: The Dark Ages (2025) | 112.5 | 102.8 | 94.6 | 93.8 | 86.6 | 65.4 | 51.9 | 53.1 | 34.7 | |
| F1 25 (2025) | 172.5 | 171.9 | 44.2 | 46.1 | 26.5 | 24.2 | 12.2 | |||
| Borderlands 4 (2025) | 58.5 | 30.5 | 46.1 | 26.2 | ||||||
| Battlefield 6 (2025) | 128.9 | 121.9 | 115.1 | 103.8 | 113.8 | 75.5 | 70.1 | 53.7 | ||
| The Outer Worlds 2 (2025) | 83.7 | 79.7 | 73.6 | 61.1 | 31.1 | 43.4 | ||||
| ARC Raiders (2025) | 88.4 | 89.4 | 68.1 | |||||||
| Anno 117: Pax Romana (2025) | 79.8 | 48.2 | 35.2 | |||||||
| Call of Duty Black Ops 7 (2025) | 58 | 56 | 38 | |||||||
| Resident Evil Requiem (2026) | 66.6 | 46.1 | 21.6 | |||||||
| Death Stranding 2 (2026) | 72.1 | 80 | 60.3 | 37.9 | ||||||
| Crimson Desert (2026) | 104.2 | 88.7 | 76.2 | 69 | 68.1 | 59.3 | 48 | 35.9 | ||
| Pragmata (2026) | 114 | 97.9 | 81 | 64.8 | 44.2 | |||||
| War Thunder (2026) | 304 | 127 | 88.6 | 37.9 | ||||||
| Forza Horizon 6 (2026) | 91 | 78 | 59 | 58 | 44 | 37 | 27 | |||
| 007 First Light (2026) | 78.6 | 69.6 | 55.9 | 51.8 | 28.3 |
Schenker XMG Neo 16
| low | med. | high | ultra | QHD | 4K | |
|---|---|---|---|---|---|---|
| GTA V (2015) | 137.5 | 137.7 | 88.9 | |||
| The Witcher 3 (2015) | 216.4 | 137.1 | ||||
| Dota 2 Reborn (2015) | 227 | 202 | 191.2 | 177.3 | 179.4 | |
| Final Fantasy XV Benchmark (2018) | 180.7 | 158 | 91.5 | |||
| X-Plane 11.11 (2018) | 204 | 179.7 | 135.5 | 124.2 | ||
| Strange Brigade (2018) | 482 | 396 | 372 | 350 | 311 | 160.3 |
| Shadow of the Tomb Raider (2018) | 207 | 168 | 103 | |||
| Metro Exodus (2019) | 131.51 | 117.44 | 83.98 | |||
| Control (2019) | 183.7 | 121.9 | 63.5 | |||
| Borderlands 3 (2019) | 176 | 132.34 | 70.5 | |||
| Mafia Definitive Edition (2020) | 187.9 | 168.1 | 91.8 | |||
| Watch Dogs Legion (2020) | 127 | 113 | 71 | |||
| Assassin´s Creed Valhalla (2020) | 161 | 130 | 78 | |||
| Far Cry 6 (2021) | 139 | 134 | 92 | |||
| Dying Light 2 (2022) | 171.8 | 118.4 | 61.7 | |||
| Cyberpunk 2077 1.6 (2022) | 122.8 | 94.26 | 49.15 | |||
| Ghostwire Tokyo (2022) | 230.1 | 196.8 | 97.7 | |||
| Tiny Tina's Wonderlands (2022) | 189.4 | 135.8 | 73.7 | |||
| F1 22 (2022) | 137.4 | 90.5 | 45.3 | |||
| Call of Duty Modern Warfare 2 2022 (2022) | 181 | 137 | 86 | |||
| Spider-Man Miles Morales (2022) | 121.4 | 115.7 | 84.2 | |||
| The Callisto Protocol (2022) | 143.5 | 116.5 | 69.8 | |||
| The Witcher 3 v4 (2023) | 141.8 | 102.9 | 52.8 |
Stress test
The tested laptop models did not show any significant inconsistencies due to thermal throttling when stressed with The Witcher 3 at 1080p Ultra.
The Titan GT77 HX 13V's RTX 4090 did seem to have some trouble in sustaining the initial framerate but manages to recover after some time. The XMG Neo 16's RTX 4090 implementation fares slightly better in this regard.
The Razer Blade 16's RTX 4080, on the other hand, is able to cope well in this stress test.
Power consumption: RTX 4090 mobile 53% more power efficient than RTX 3080 Ti Laptop GPU
Power consumption from the wall in the case of laptop GPUs is not really comparable to what we observe with desktop parts. In fact, the RTX 4090 Founders Edition card alone can pull more than 700 W under load when configured to use a higher power target.
What is interesting here is that you are now getting a lot more performance per Watt compared to any other Nvidia mobile GPU to date.
For instance, the MSI Titan GT77 12UHS featuring the RTX 3080 Ti has a similar total system power consumption as that of the Titan GT77 HX 13V at about 248 W in The Witcher 3 at 1080p ultra and about a 11% higher 241 W in FurMark (1280 x 720, no AA). However, the Titan GT77 HX 13V is an impressive 53% more power efficient in The Witcher 3 compared to its 12th gen predecessor.
The Razer Blade 16 with its RTX 4080 Laptop GPU sips 7% higher power (236 W) than the Blade 17 with an RTX 3080 Ti Laptop GPU (220 W) in The Witcher 3. Despite the slightly higher overall power consumption, the new Blade 16 with the RTX 4080 Laptop GPU is 32% more power efficient in the game compared to the Blade 17 despite the latter's RTX 3080 Ti being configured at 165 W.
This also lines up well with how Nvidia has designed Ada to be much more power-efficient than Ampere. Benefits from the custom 4N process aside, the Ada GPU first tries to hit the maximum clocks and voltage limits before increasing power, resulting in higher performance and increased efficiency at the same power value compared to Ampere.
Power consumption: External monitor
| Power Consumption / The Witcher 3 ultra (external Monitor) | |
| NVIDIA GeForce RTX 4090 Founders Edition (133% PT OC, Idle: 81.25 W) | |
| NVIDIA GeForce RTX 4090 Founders Edition (100% PT, Idle: 81.25 W) | |
| AMD Radeon RX 7900 XTX (Idle: 86.5 W) | |
| Average NVIDIA GeForce RTX 3090 (Idle: 464 - 597, n=18 W) | |
| NVIDIA GeForce RTX 4080 Founders Edition (110% PT, Idle: 78.45 W) | |
| NVIDIA GeForce RTX 4080 Founders Edition (100% PT, Idle: 78.45 W) | |
| AMD Radeon RX 7900 XT (Idle: 84.6 W) | |
| Asus TUF Gaming GeForce RTX 4070 Ti (Perf BIOS / 110% PT, Idle: 75.4 W) | |
| Asus TUF Gaming GeForce RTX 4070 Ti (Perf BIOS / 100% PT, Idle: 75.4 W) | |
| Asus TUF Gaming GeForce RTX 4070 Ti (Quiet BIOS / 100% PT, Idle: 75.4 W) | |
| MSI Titan GT77 HX 13VI | |
| MSI Titan GT77 12UHS | |
| Razer Blade 16 Early 2023 | |
| Razer Blade 17 Early 2022 | |
| Average NVIDIA GeForce RTX 3080 Ti Laptop GPU (Idle: 144 - 287, n=27 W) | |
| Average AMD Radeon RX 6800M (Idle: n=1 W) | |
| Average NVIDIA GeForce RTX 3080 Laptop GPU (Idle: 124 - 244, n=26 W) | |
| Average AMD Radeon RX 6700M (Idle: n=1 W) | |
| Average NVIDIA GeForce RTX 3070 Ti Laptop GPU (Idle: 115 - 234, n=25 W) | |
| Average AMD Radeon RX 6600M (Idle: 124 - 191, n=6 W) | |
| Average NVIDIA GeForce RTX 3060 Laptop GPU (Idle: 107.5 - 191, n=38 W) | |
| Power Consumption / FurMark 1.19 GPU Stress Test (external Monitor) | |
| NVIDIA GeForce RTX 4090 Founders Edition (133% PT OC, Idle: 81.25 W) | |
| NVIDIA GeForce RTX 4090 Founders Edition (100% PT, Idle: 81.25 W) | |
| AMD Radeon RX 7900 XTX (Idle: 86.5 W) | |
| AMD Radeon RX 7900 XT (Idle: 84.6 W) | |
| Average NVIDIA GeForce RTX 3090 (Idle: 281 - 551, n=9 W) | |
| NVIDIA GeForce RTX 4080 Founders Edition (110% PT, Idle: 78.45 W) | |
| NVIDIA GeForce RTX 4080 Founders Edition (100% PT, Idle: 78.45 W) | |
| Asus TUF Gaming GeForce RTX 4070 Ti (Perf BIOS / 110% PT, Idle: 75.4 W) | |
| Asus TUF Gaming GeForce RTX 4070 Ti (Quiet BIOS / 100% PT, Idle: 75.4 W) | |
| Asus TUF Gaming GeForce RTX 4070 Ti (Perf BIOS / 100% PT, Idle: 75.4 W) | |
| Razer Blade 16 Early 2023 | |
| MSI Titan GT77 12UHS | |
| Razer Blade 17 Early 2022 | |
| MSI Titan GT77 HX 13VI | |
| Average NVIDIA GeForce RTX 3080 Ti Laptop GPU (Idle: 139.2 - 288, n=28 W) | |
| Average AMD Radeon RX 6800M (Idle: n=1 W) | |
| Average NVIDIA GeForce RTX 3070 Ti Laptop GPU (Idle: 123.6 - 211, n=27 W) | |
| Average NVIDIA GeForce RTX 3080 Laptop GPU (Idle: 122 - 254, n=27 W) | |
| Average AMD Radeon RX 6600M (Idle: 113 - 187, n=6 W) | |
| Average AMD Radeon RX 6700M (Idle: n=1 W) | |
| Average NVIDIA GeForce RTX 3060 Laptop GPU (Idle: 94.1 - 202, n=38 W) | |
| Power Consumption / Witcher 3 ultra Efficiency (external Monitor) | |
| MSI Titan GT77 HX 13VI | |
| Razer Blade 16 Early 2023 | |
| Average NVIDIA GeForce RTX 3080 Laptop GPU (0.4696 - 0.736, n=24) | |
| Average NVIDIA GeForce RTX 3070 Ti Laptop GPU (0.4399 - 0.97, n=24) | |
| AMD Radeon RX 7900 XT | |
| Average NVIDIA GeForce RTX 3080 Ti Laptop GPU (0.4432 - 0.69, n=26) | |
| AMD Radeon RX 7900 XTX | |
| NVIDIA GeForce RTX 4080 Founders Edition | |
| Asus TUF Gaming GeForce RTX 4070 Ti | |
| Razer Blade 17 Early 2022 | |
| NVIDIA GeForce RTX 4090 Founders Edition | |
| Average NVIDIA GeForce RTX 3060 Laptop GPU (0.4181 - 0.651, n=33) | |
| Average AMD Radeon RX 6700M (n=1) | |
| MSI Titan GT77 12UHS | |
| Average AMD Radeon RX 6600M (0.4398 - 0.608, n=6) | |
| Average NVIDIA GeForce RTX 3090 (0.268 - 0.3954, n=15) | |
* ... smaller is better
Verdict: Desktop RTX 3090-class performance at 175 W
Nvidia's Ampere generation had a lot going for it in terms of performance compared to Turing, but its launch happened at a time when the global order was going haywire.
As a result, the cards were understocked and overpriced leading to all sorts of scalping shenanigans. Coupled with a fickle and ephemeral crypto boom, many gamers felt that it made economic sense to opt for Ampere-powered laptops instead of desktop cards.
Fast forward to 2023, and most of these harrowing experiences are now behind us. Nvidia's latest Ada GPUs have set themselves very high benchmarks in terms of performance and power-efficiency that they seem like a truly generational leap.
We came away mighty impressed with Ada's performance on the desktop and are happy to witness most of these benefits getting translated on to the laptop side of things as well.
The Nvidia RTX 4080 and RTX 4090 Laptop GPUs ably showcase Ada's performance and efficiency strengths, with the former performing more or less similar to a 350 W desktop RTX 3090. However, these benefits are seen only with the highest-end spec drawing 175 W.
Not all is hunky-dory with Ada mobile, though. The devices we tested allowed the RTX 4080 and RTX 4090 to fully flex their muscles at 150 W with an additional 25 W of Dynamic Boost. Not all laptops in the wild will allow these GPUs to run at these TDPs.
And those that do aren't exactly portable either — the Titan GT77's power supply alone weighs 1.4 kg and its noise levels under peak load can give the impression of being seated in an F16's cockpit.
The other problem is Nvidia's misleading branding. The average customer generally relates better to the numerical branding than the actual GPU spec, so someone at Santa Clara thought it makes perfect marketing sense to christen the top dog as the RTX 4090 Laptop GPU just because it performs better than a desktop RTX 3090!
But those who seek the RTX 4090-powered laptops are not your typical average consumer. And let's not even get into all kinds of performance gotchas that can be expected in the 80 W to 150 W TDP range.
Pricing is another important factor to consider. The laptops we used in this comparison have the potential to drill a big hole in your pockets. So much so that buying a used car may seem a better investment. But then, that's the nature of flagship devices in general.
All said and done, Ada mobile is a welcome step in the right direction. The benefits we see with the top end configurations are sure to trickle down to the mid-range and entry-level offerings as well, and features such as DLSS 3 will certainly help accelerate Ada adoption among mobile gamers.
We will get a more holistic picture of Ada mobile's efficiency improvements as we test more RTX 40 laptops configured at various TDPs in the coming months.
Hopefully, AMD RDNA 3-powered devices will also be available in significant numbers eventually and compete well for the benefit of us all.
Price comparison
