Mobile GeForce RTX 4080 debut: Razer Blade 16 Early 2023 laptop review
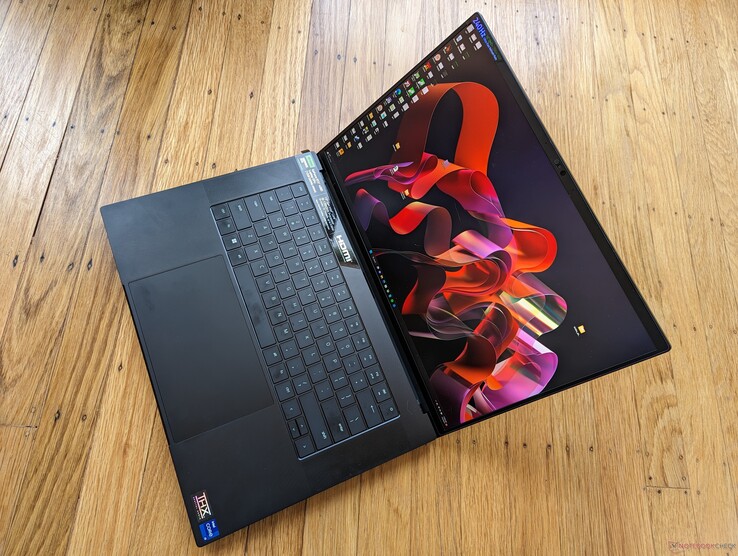
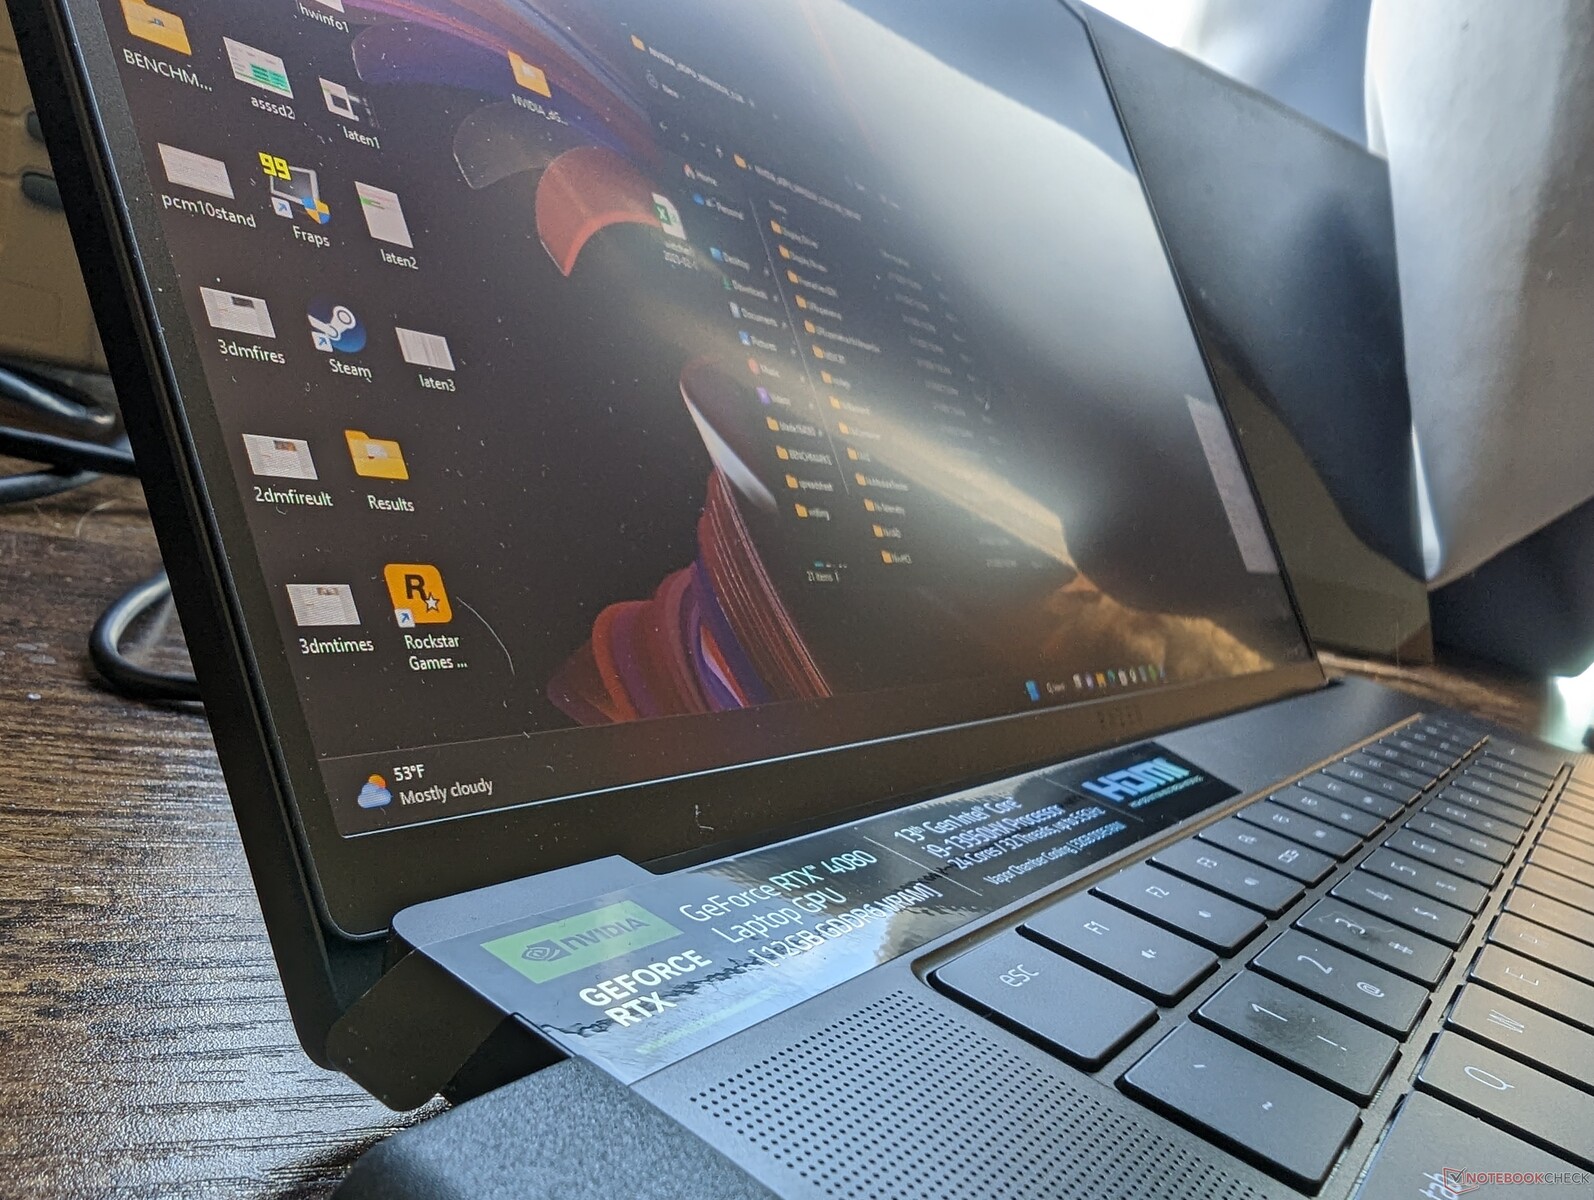
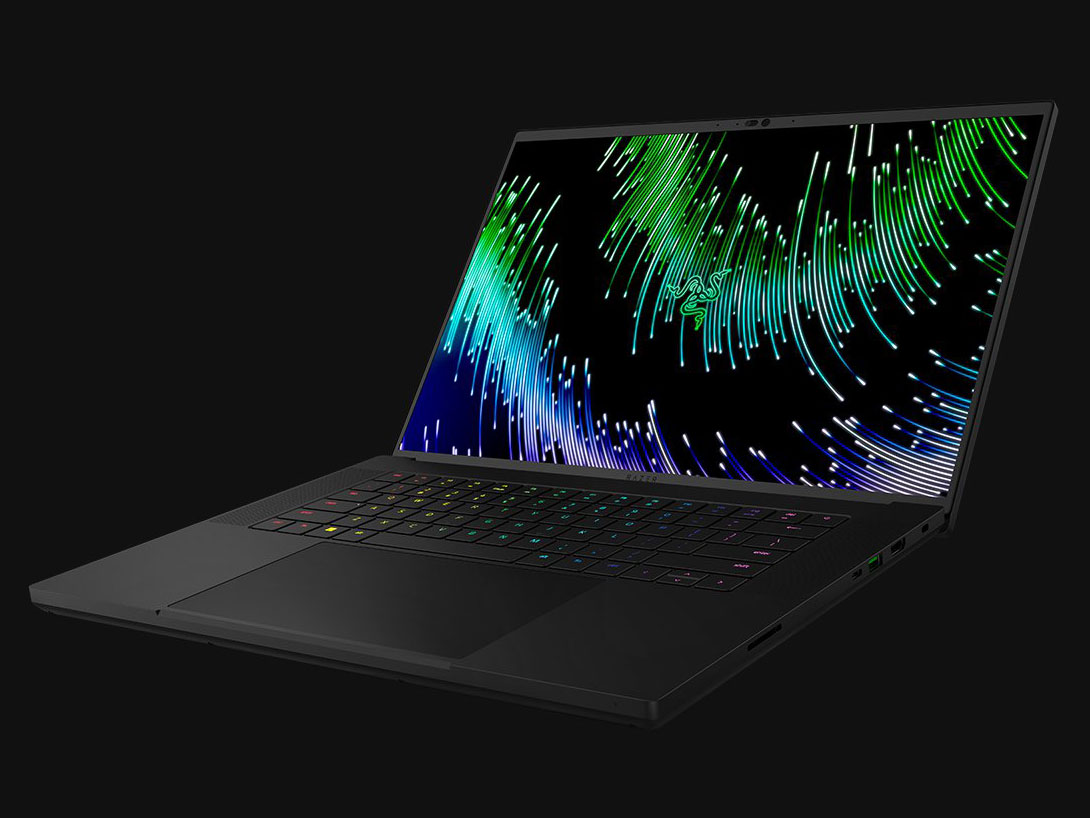
The 2023 Blade 16 is the first 16-inch model in the Blade series. Its launch coincides with the launches of both the mobile Intel 13th gen Raptor Lake CPUs and the mobile Nvidia GeForce RTX 40 Ada Lovelace GPUs. As a high-end gaming machine like the rest of the Blade models, the Blade 16 occupies the increasingly popular 16:10 16-inch space in between the 15.6-inch Blade 15 and 17.3-inch Blade 17.
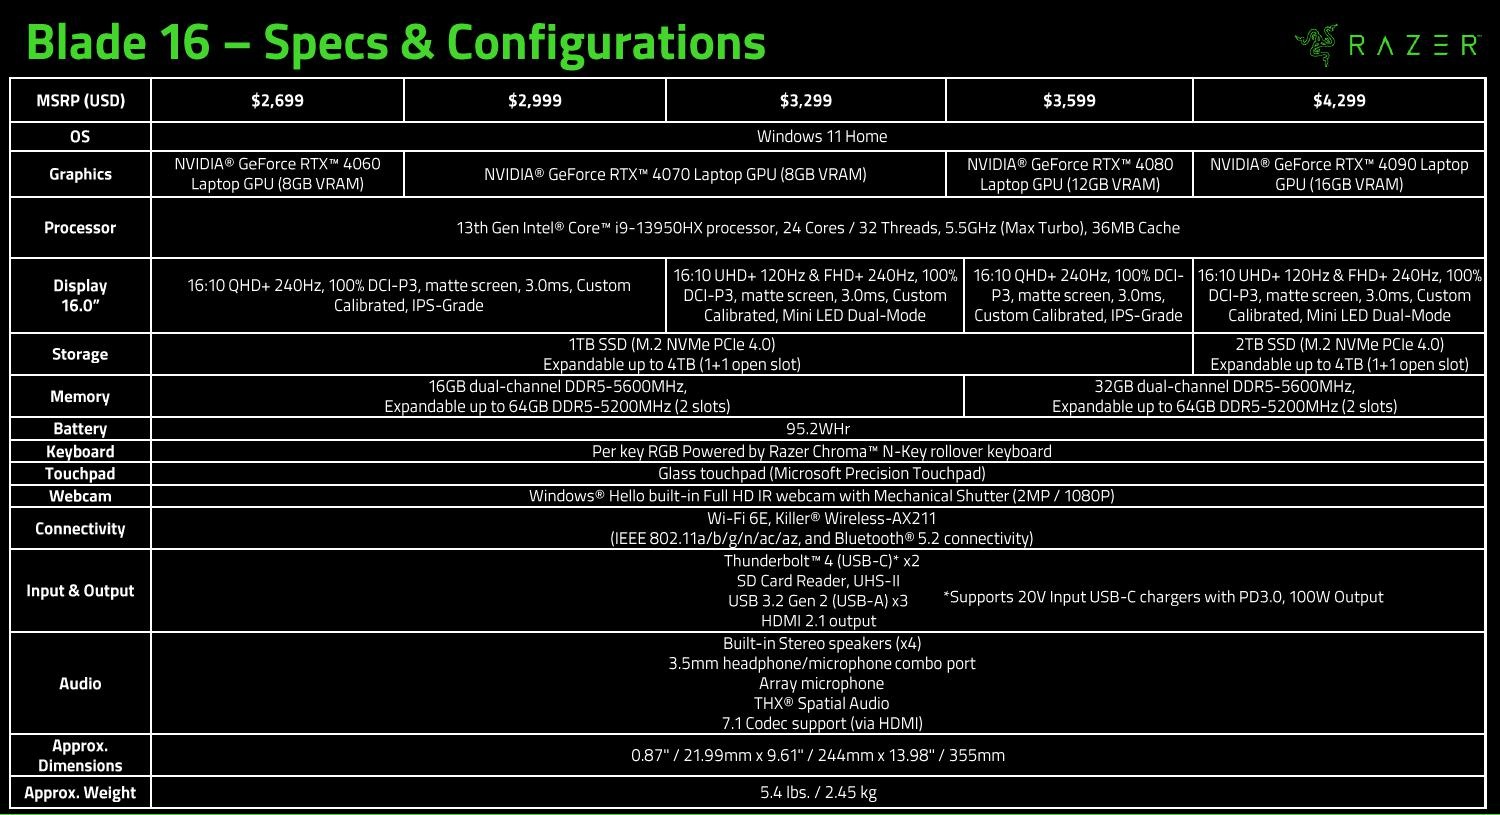
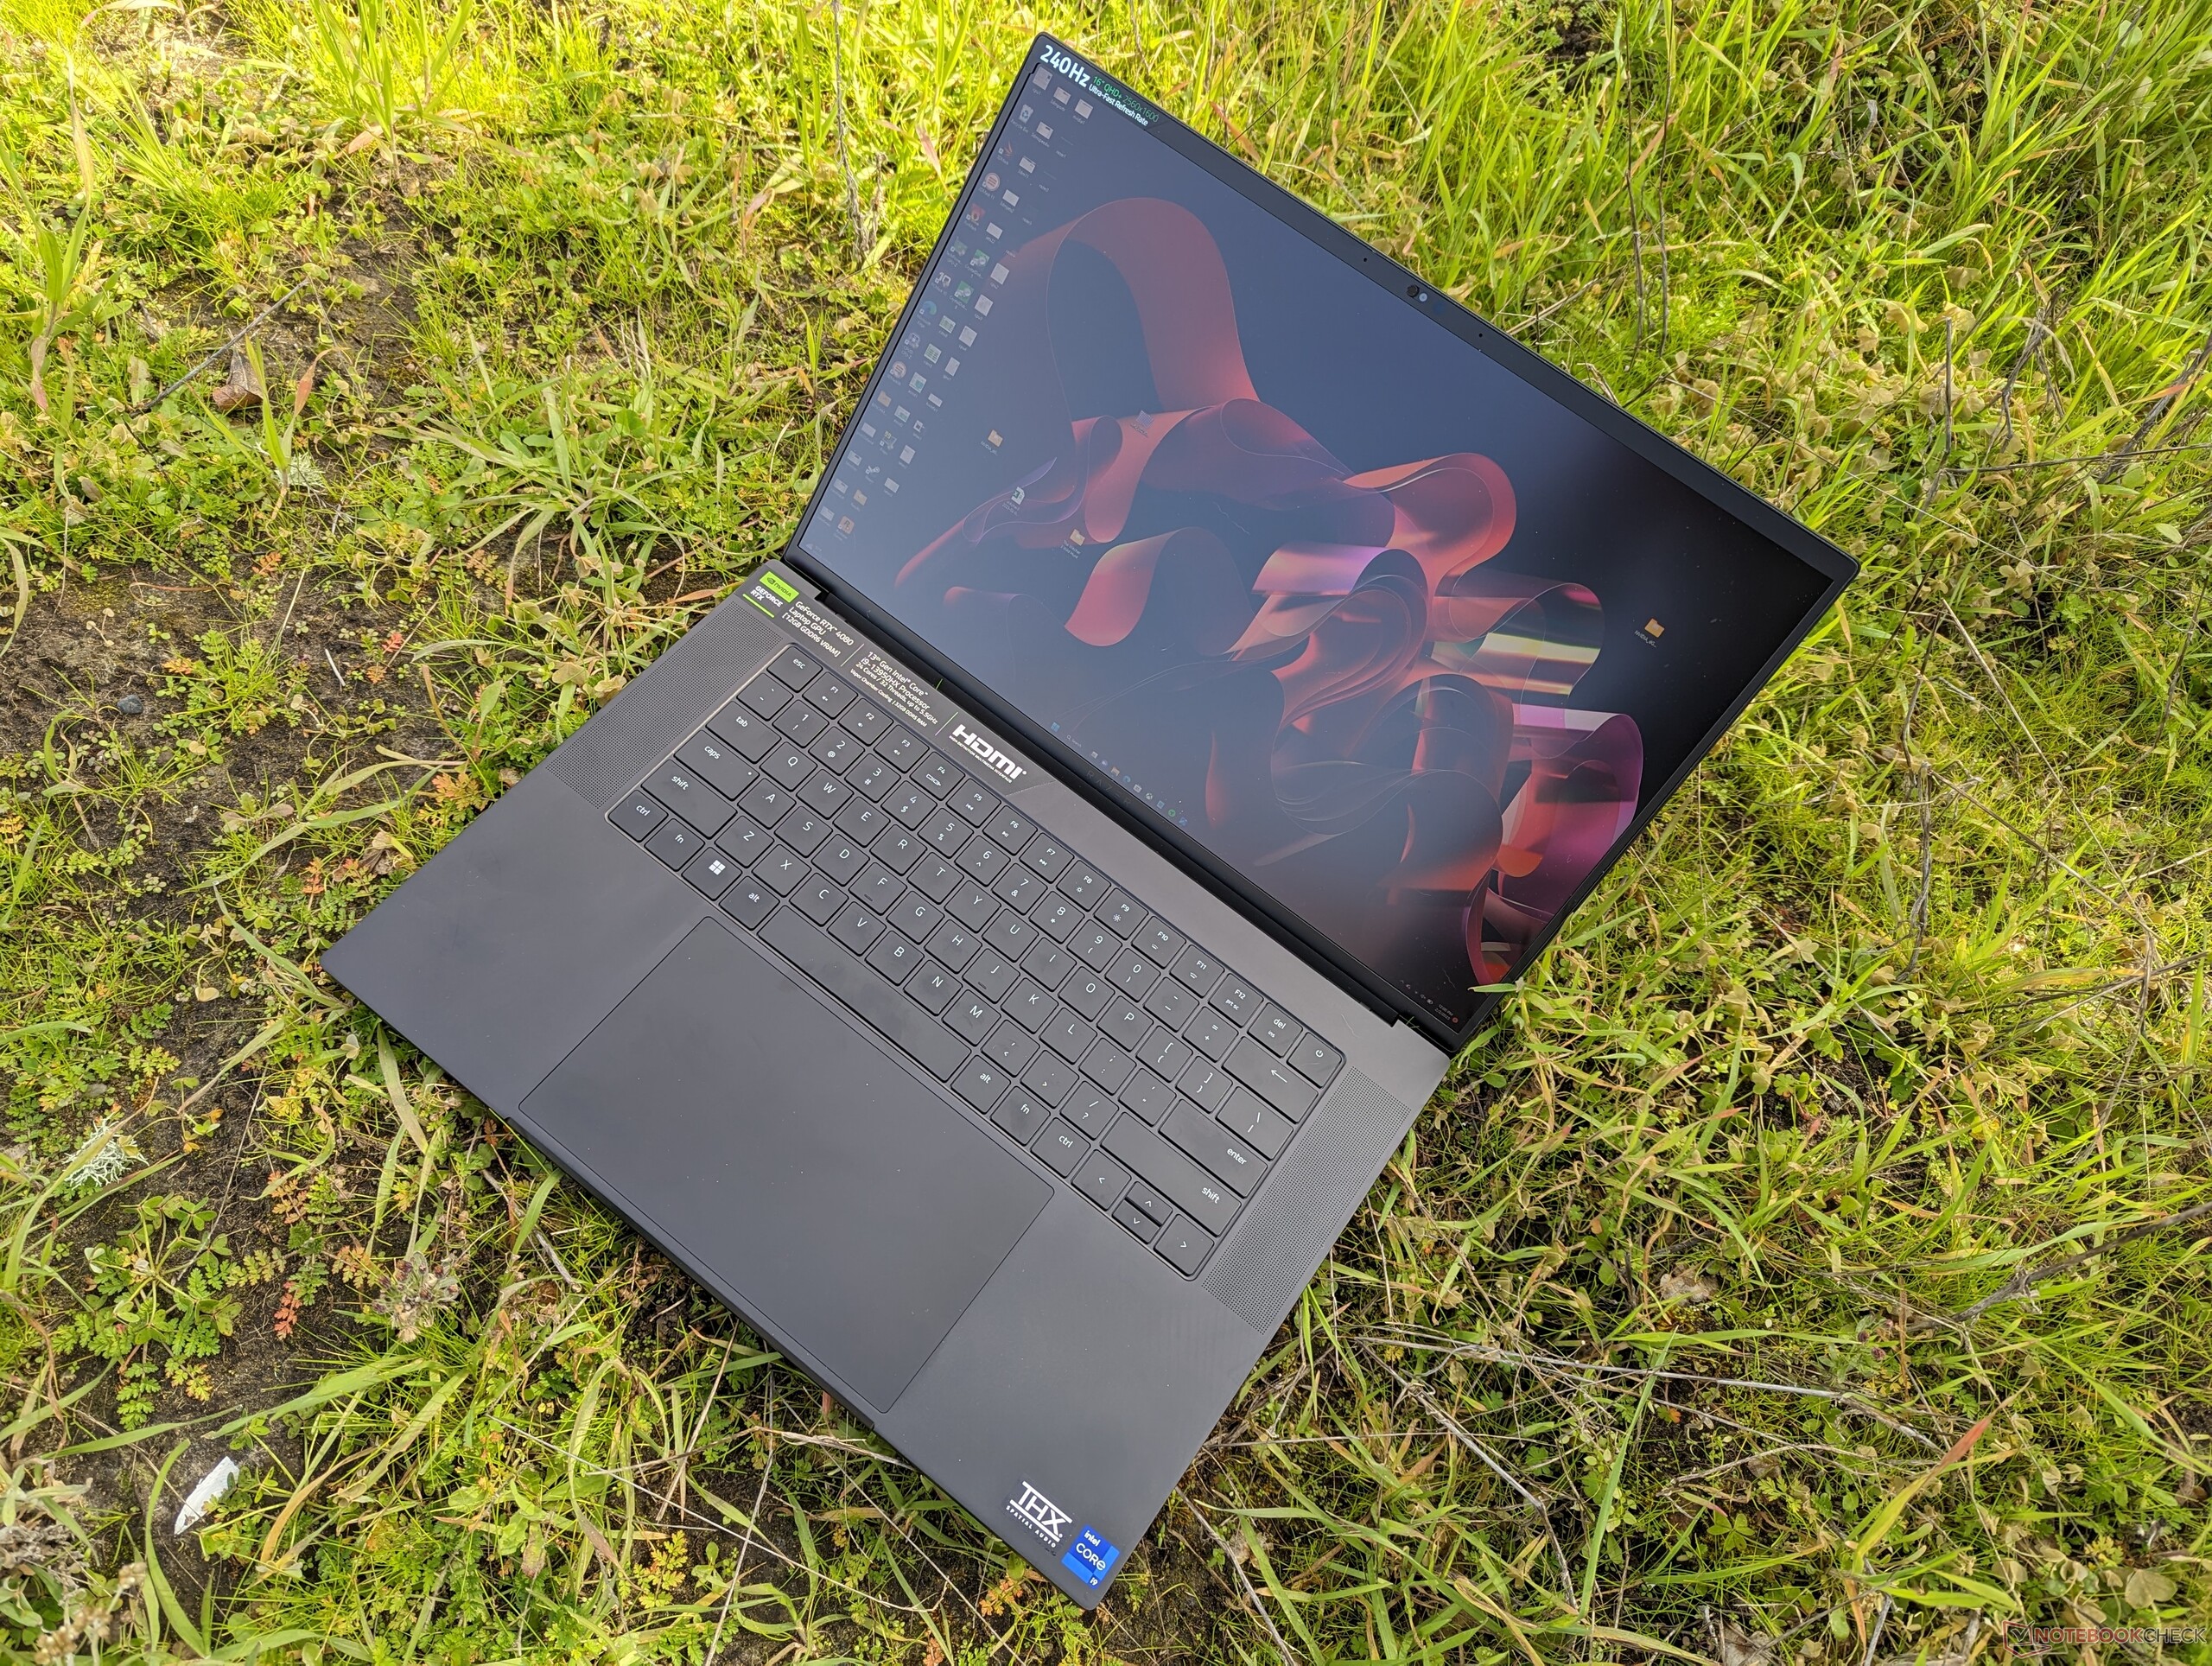
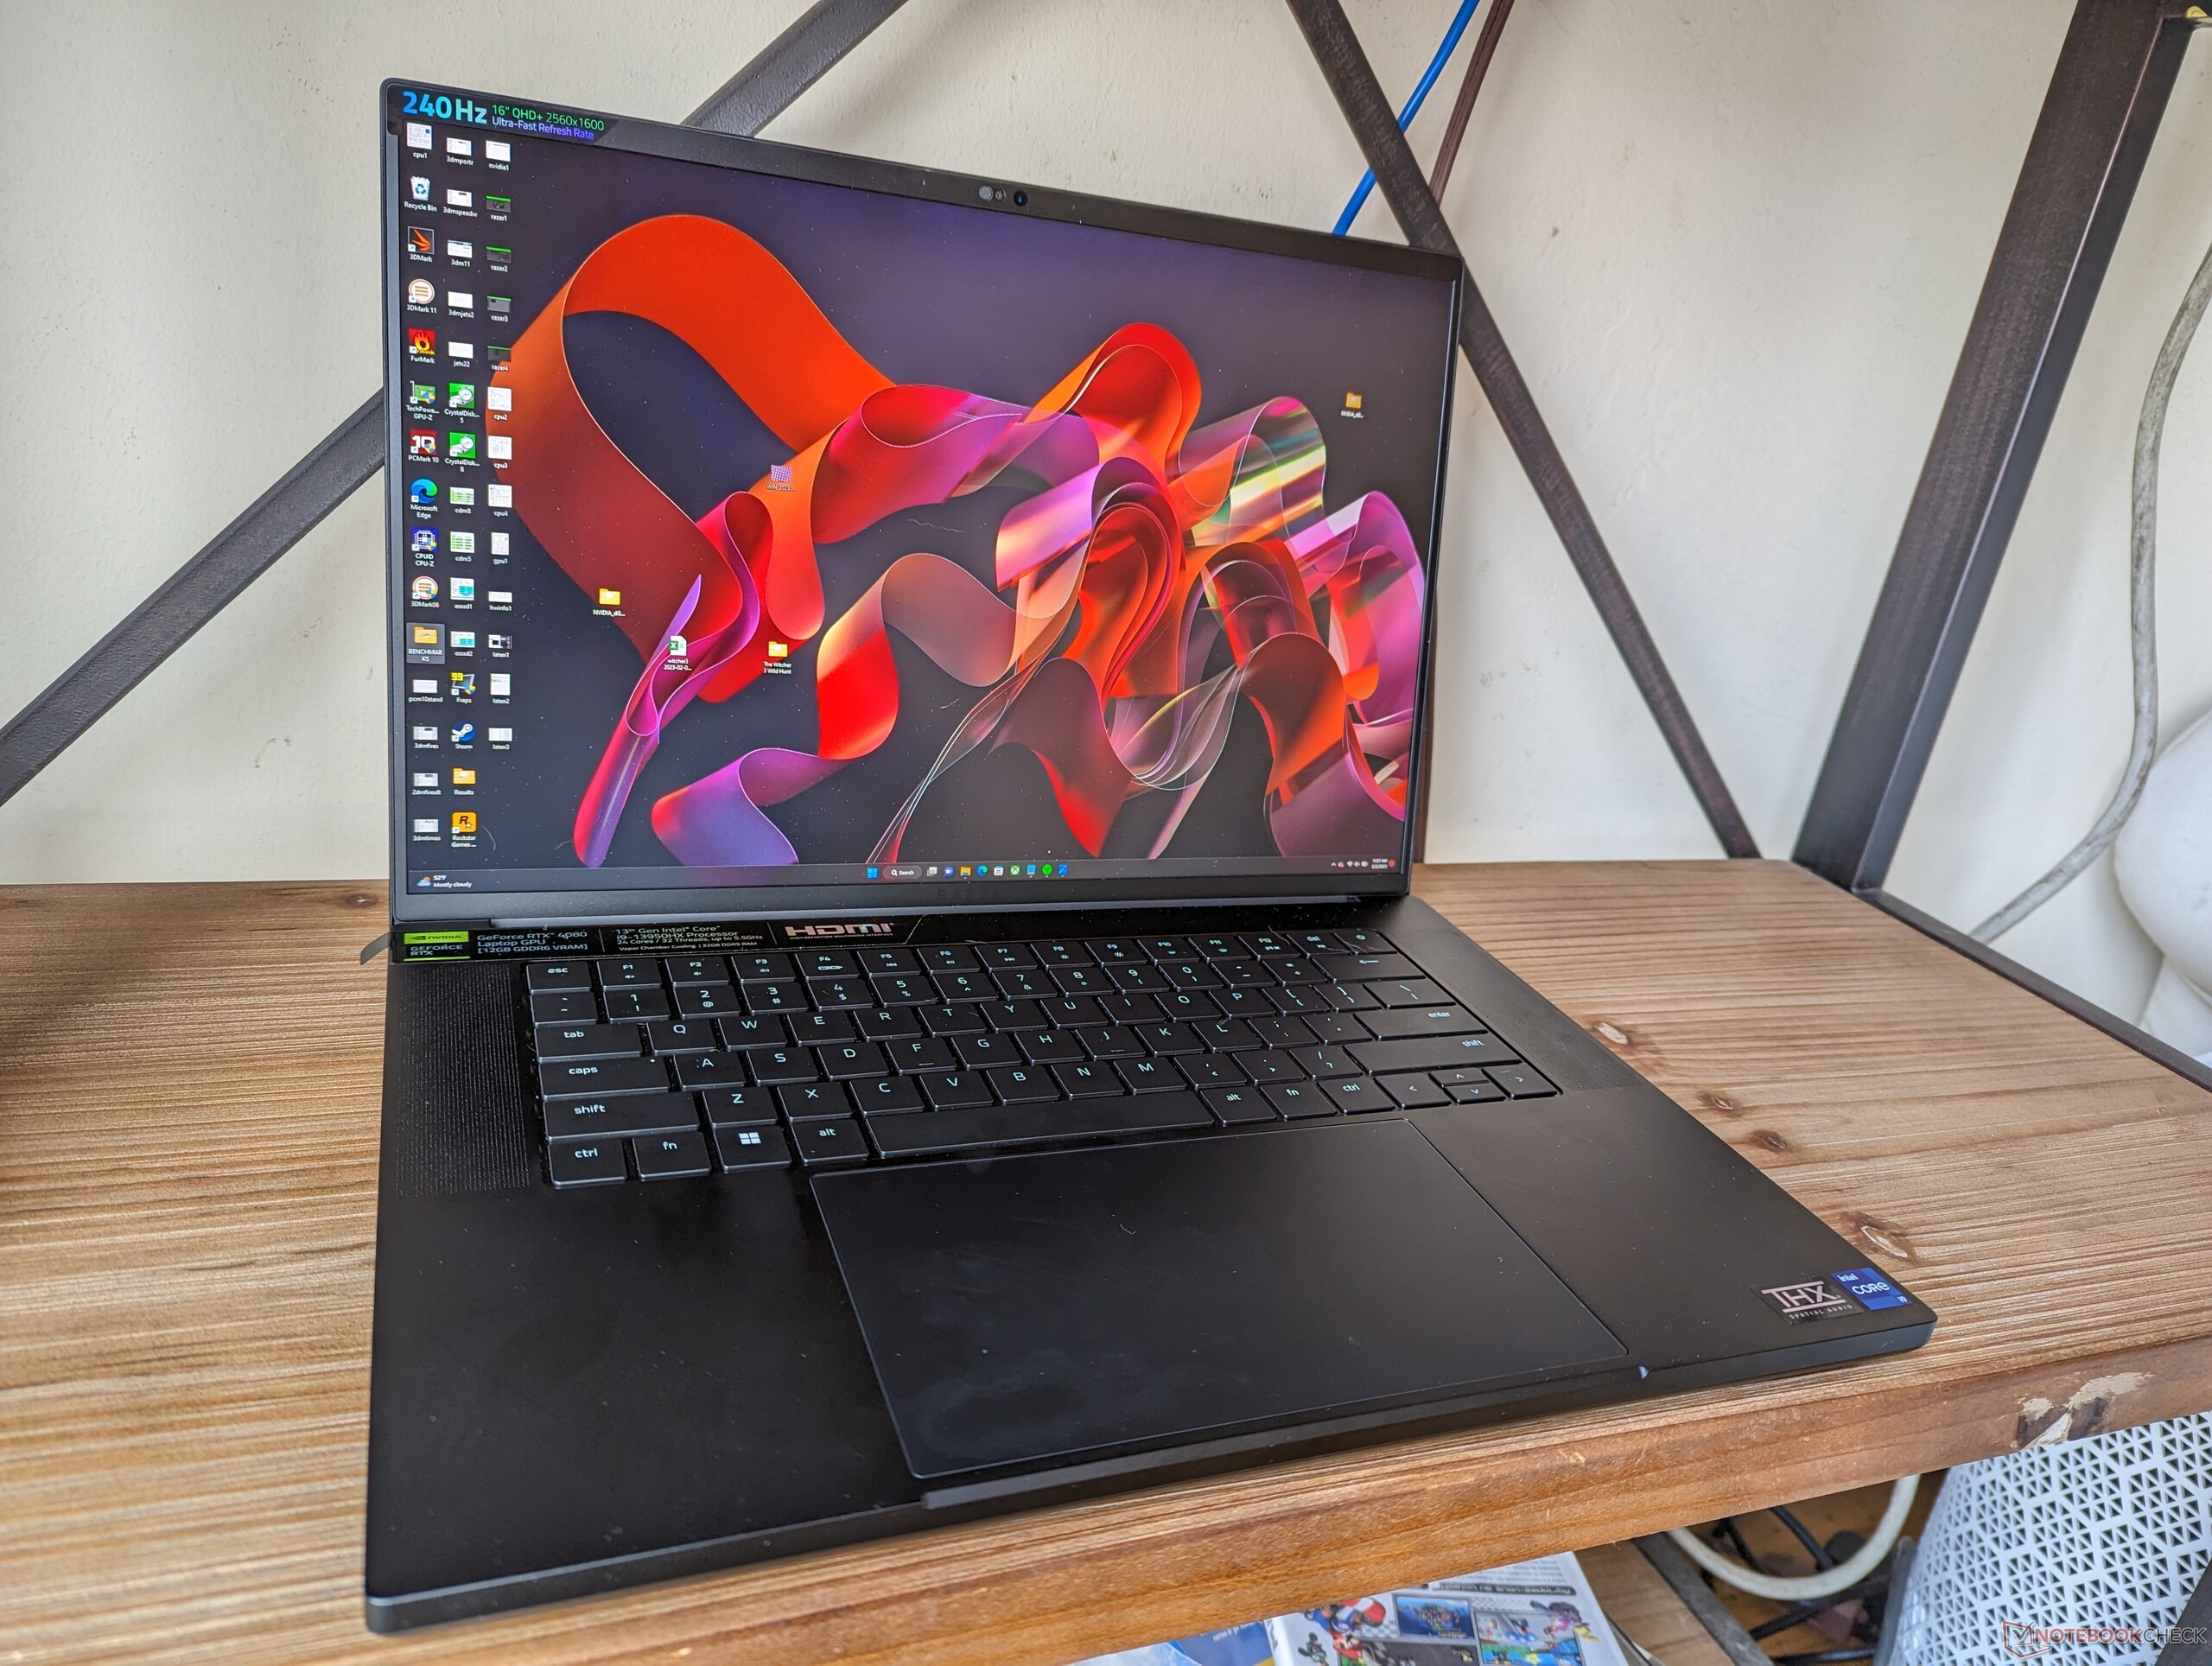
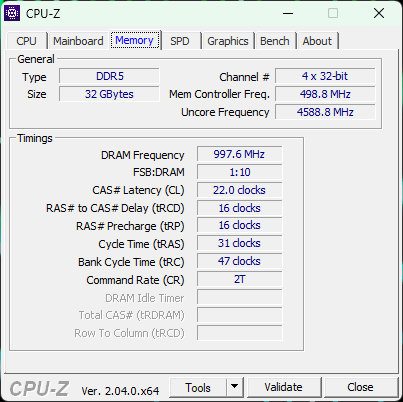
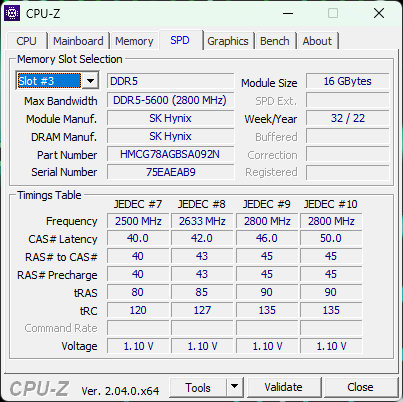
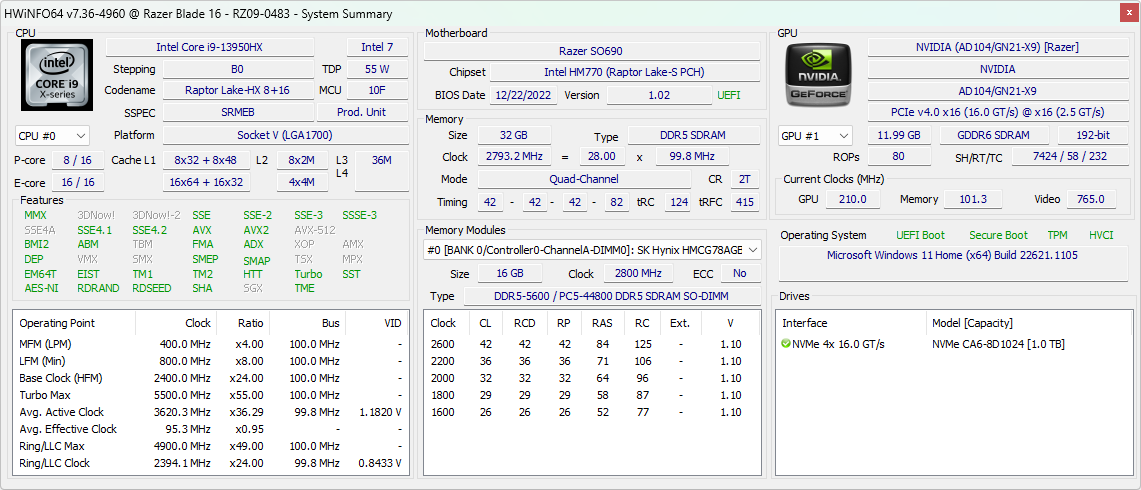
Our review unit is a high-end SKU with the Core i9-13950HX CPU, GeForce RTX 4080 GPU, fast 32 GB DDR5-5600 RAM, and 240 Hz QHD+ display for approximately $3600 USD retail. An even higher-end SKU is available with the same CPU but a fancier 4K UHD+ mini-LED display and RTX 4090 GPU for $4300 USD. Additional options will become available in the future as detailed by the table below.
Alternatives to the Blade 16 include the 16-inch Lenovo Legion S7 16ARHA7, Dell Alienware x16, Asus ROG Zephyrus Duo 16, and the HP Omen 16. MSI has yet to announce a 16-inch gaming laptop as of this writing.
More Razer reviews:
Potential Competitors in Comparison
Rating | Date | Model | Weight | Height | Size | Resolution | Price |
|---|---|---|---|---|---|---|---|
| 91.2 % v7 (old) | 02 / 2023 | Razer Blade 16 Early 2023 i9-13950HX, GeForce RTX 4080 Laptop GPU | 2.4 kg | 21.99 mm | 16.00" | 2560x1600 | |
| 88.3 % v7 (old) | 05 / 2022 | Razer Blade 15 Advanced Model Early 2022 i7-12800H, GeForce RTX 3080 Ti Laptop GPU | 2.1 kg | 16.99 mm | 15.60" | 1920x1080 | |
| 89.3 % v7 (old) | 11 / 2022 | Lenovo Legion S7 16ARHA7 R9 6900HX, Radeon RX 6800S | 2.2 kg | 16.9 mm | 16.00" | 2560x1600 | |
| 86.1 % v7 (old) | 10 / 2022 | Dell G16 7620 i7-12700H, GeForce RTX 3060 Laptop GPU | 2.6 kg | 26.9 mm | 16.00" | 2560x1600 | |
| 88.2 % v7 (old) | 05 / 2022 | Asus ROG Zephyrus Duo 16 GX650RX R9 6900HX, GeForce RTX 3080 Ti Laptop GPU | 2.6 kg | 20.5 mm | 16.00" | 3840x2400 | |
| 86.4 % v7 (old) | 11 / 2022 | HP Omen 16-n0033dx R7 6800H, Radeon RX 6650M | 2.4 kg | 22.6 mm | 16.10" | 1920x1080 |
Case — Blade 13, 14, 15, 17, 18 and now 16
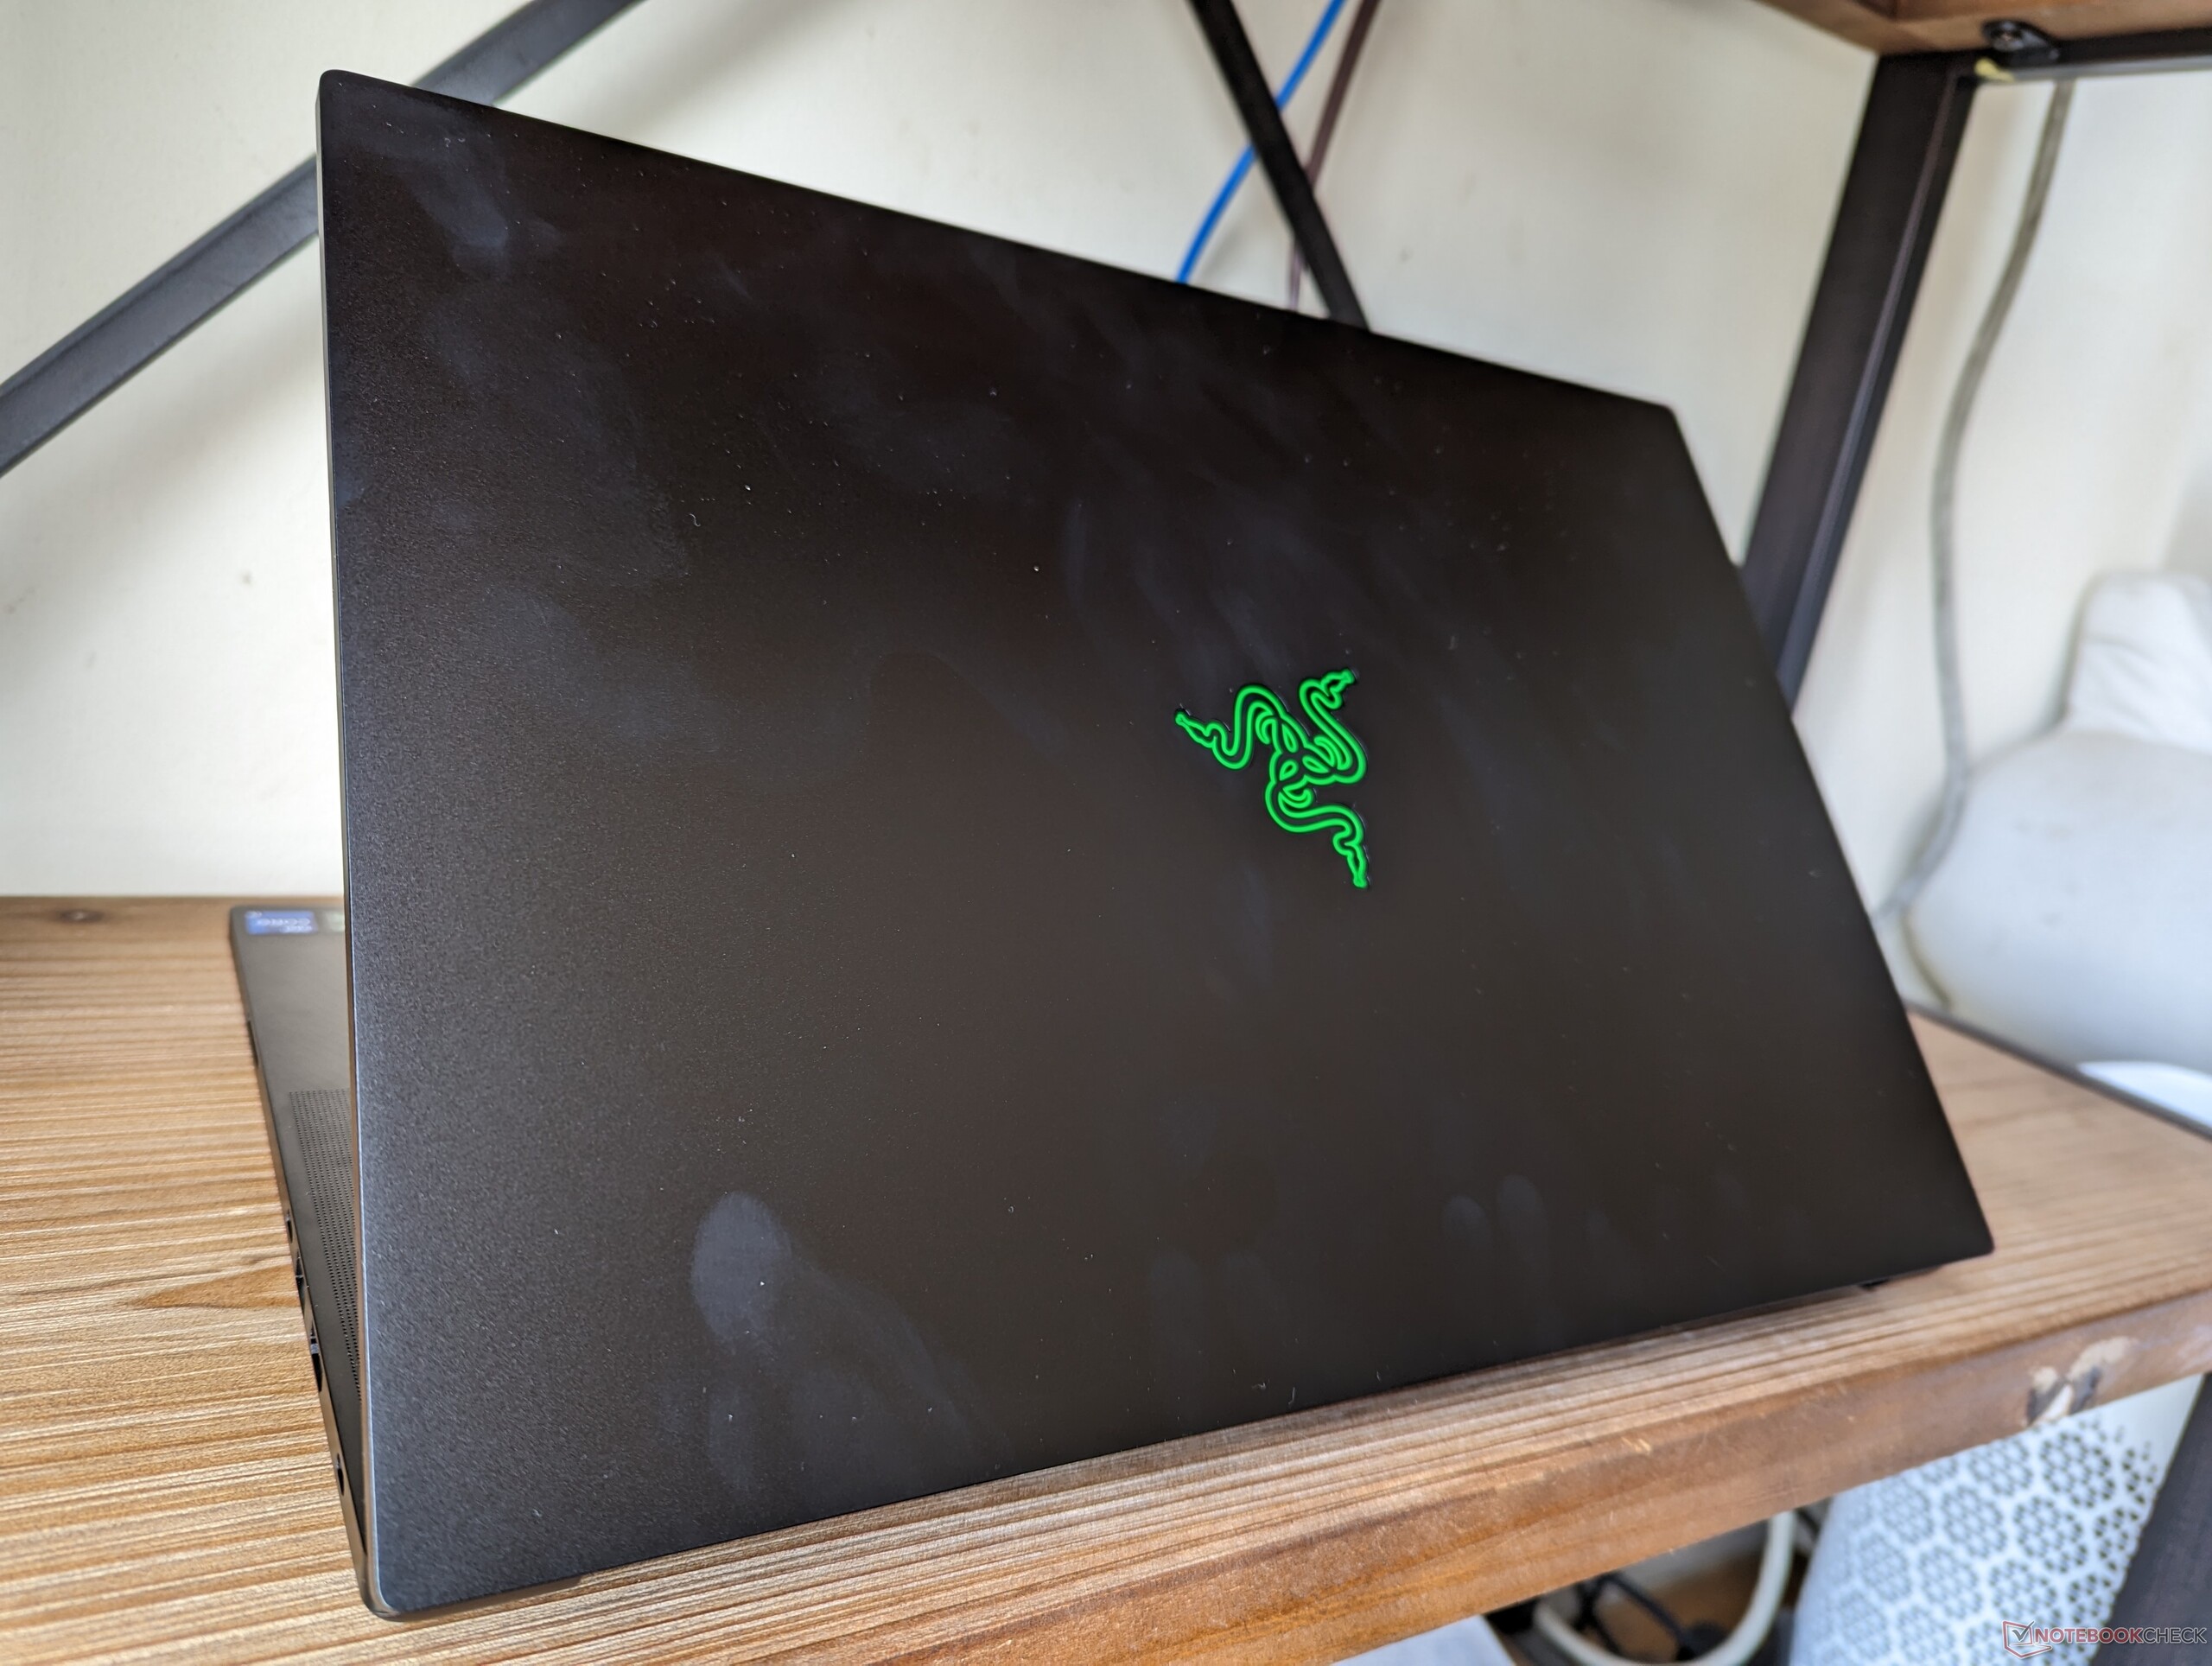
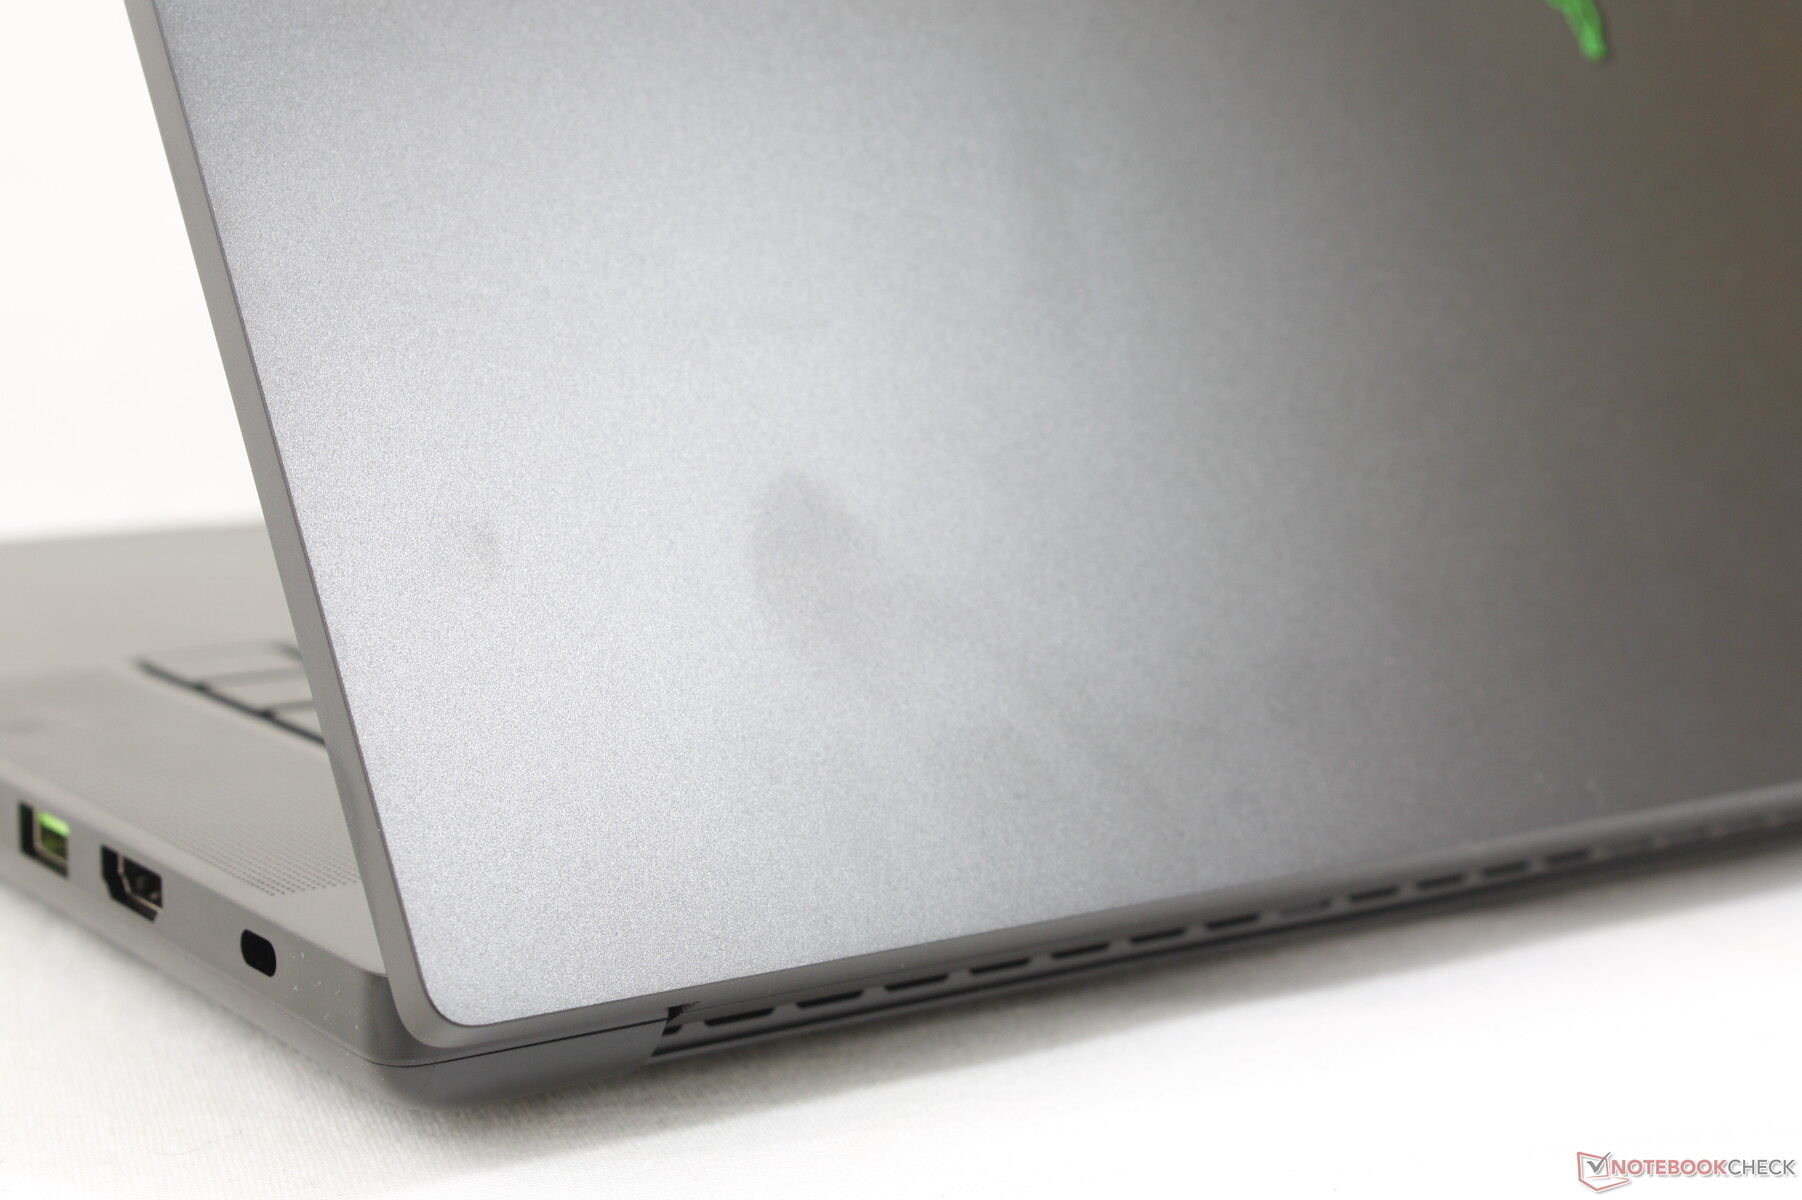
Razer deviates very little from the recognizable Blade design and the Blade 16 is no different. If you've ever handled a Blade Stealth 13, Blade 14, Blade 15, or Blade 17 from 2019 or newer, then you'll already have a very good idea of how the Blade 16 looks and feels. It continues to be one of the strongest designs in terms of rigidity and minimalism and the most "MacBook-like" of any Windows laptop thus far.
Nonetheless, there is one noteworthy update to the chassis not yet found on any other Blade model and that relates to the significantly thinner chin bezel along the bottom of the display. The Blade 14 and Blade 15, for example, have visibly thicker chin bezels than on the Blade 16. Screen-to-body ratio is therefore higher on the Blade 16 at 89 percent and its footprint is relatively small for a 16-inch form factor. Other than that, the design retains the Blade spirit and familiarity that Razer fans admire.
The Blade 16 is thankfully much closer in size and weight on average to the Blade 15 than to the Blade 17 as shown by our comparison chart below. Even so, it is noticeably larger than the Blade 15. Thickness and weight have increased by 5 mm and 300 grams, respectively, to be even thicker than the Blade 17. It still manages to be smaller than the competing HP Omen 16 or Lenovo Legion S7 16 due to the aforementioned high screen-to-body ratio.
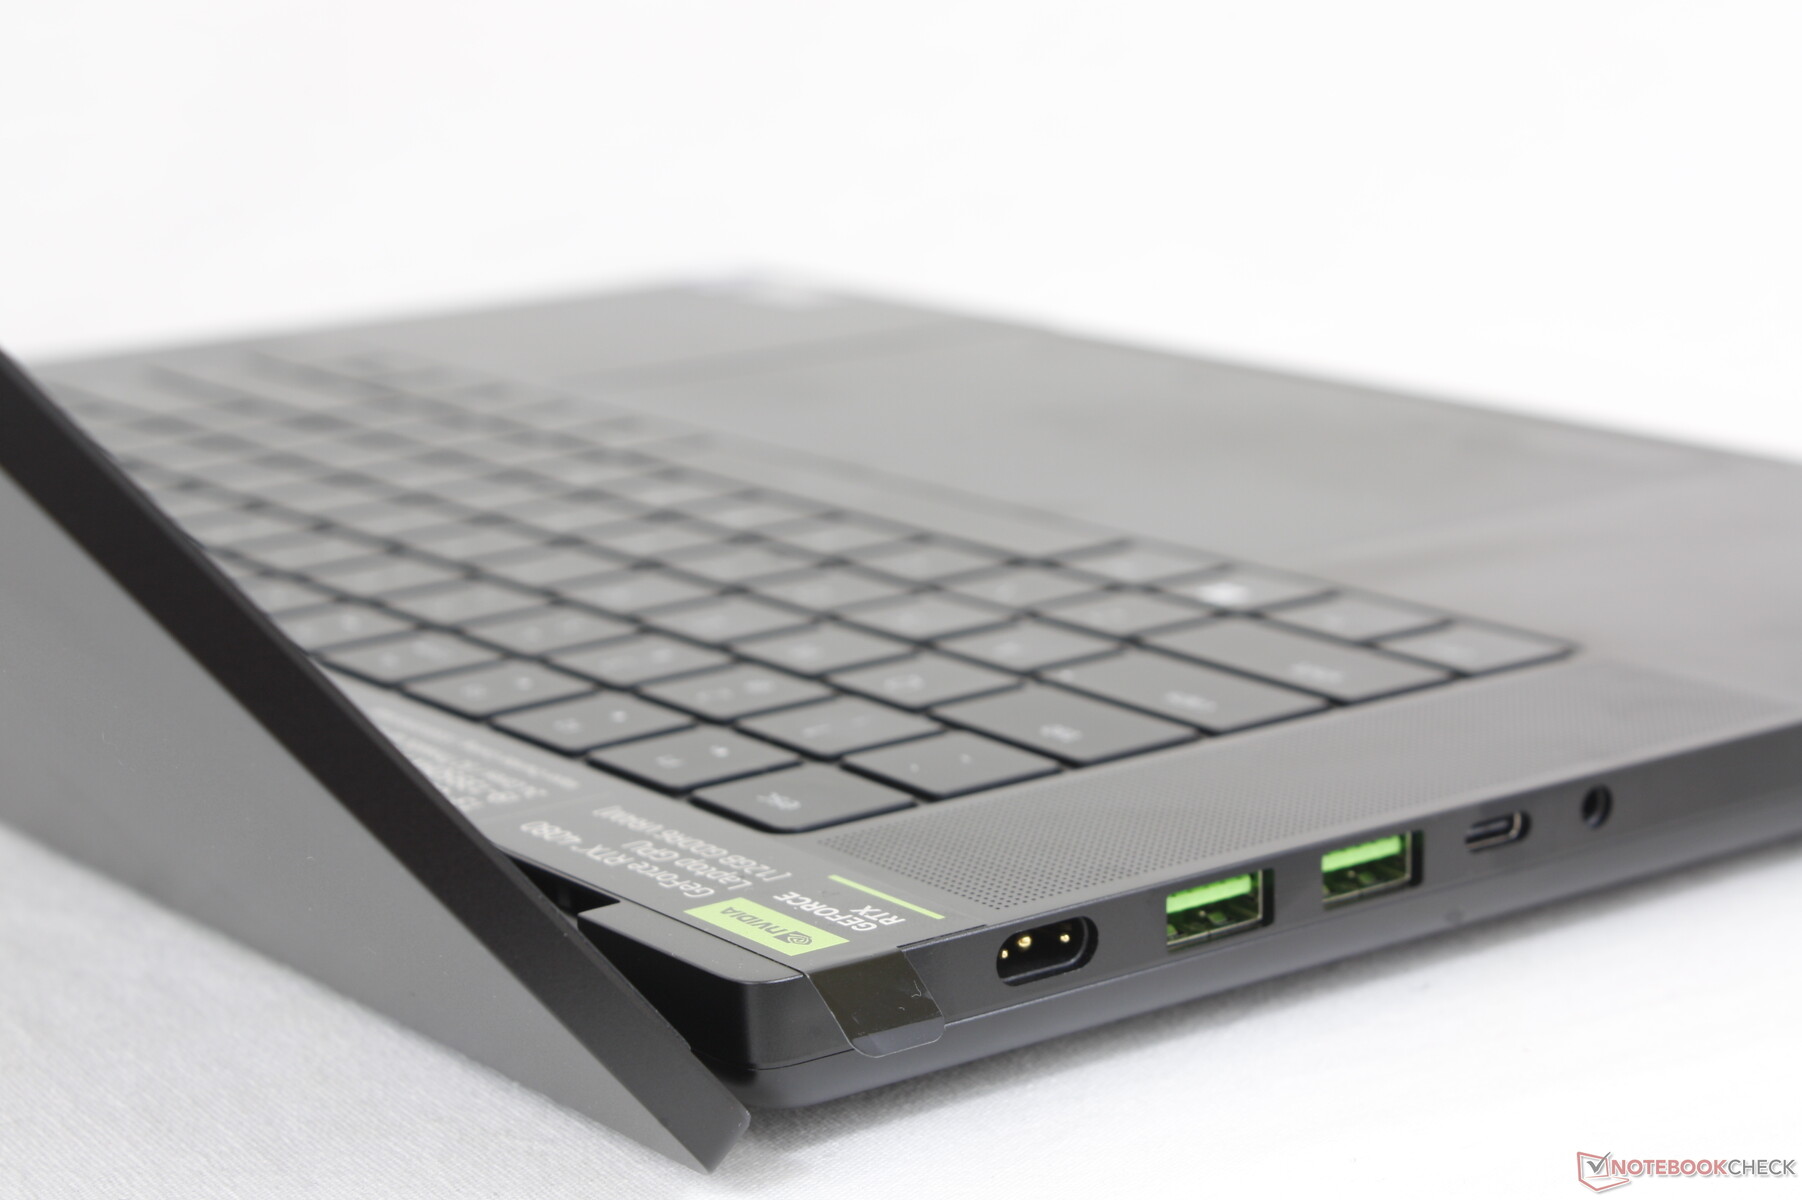
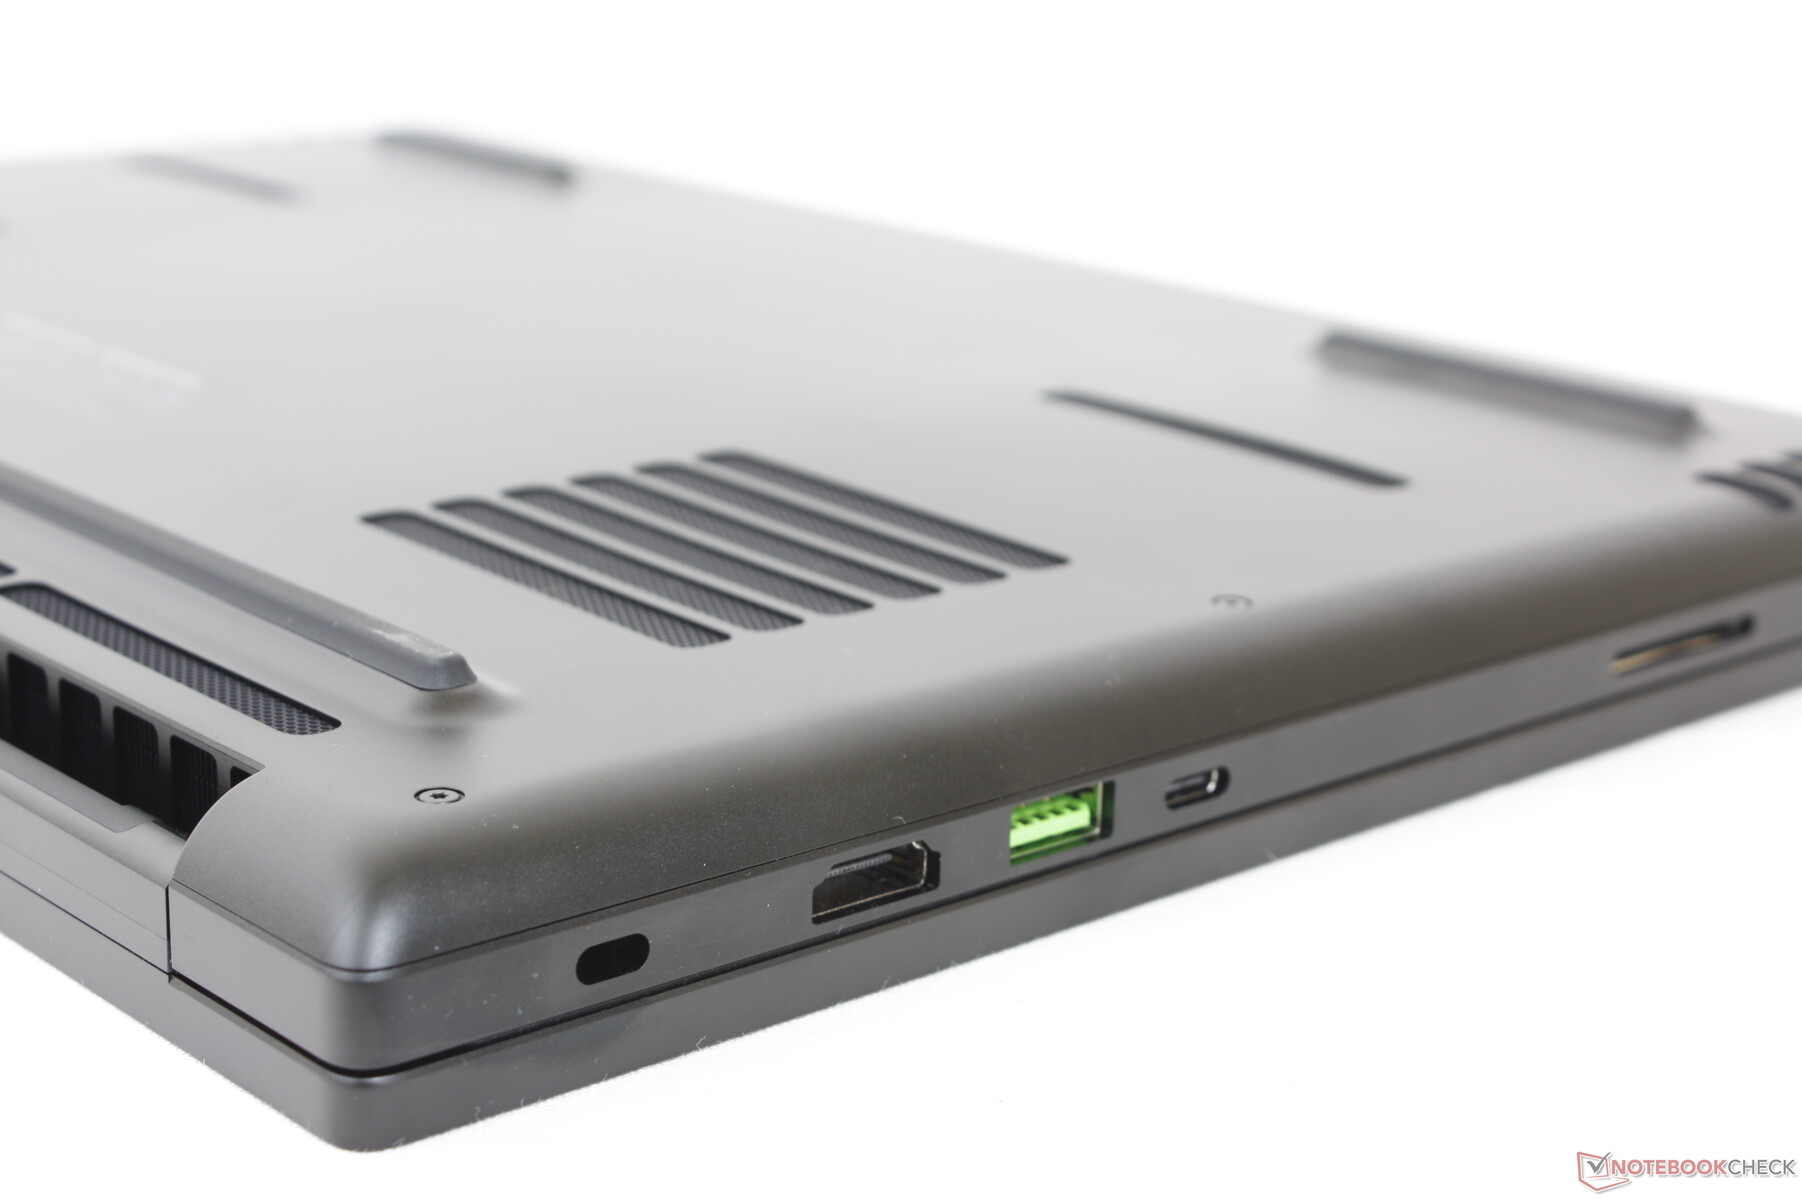
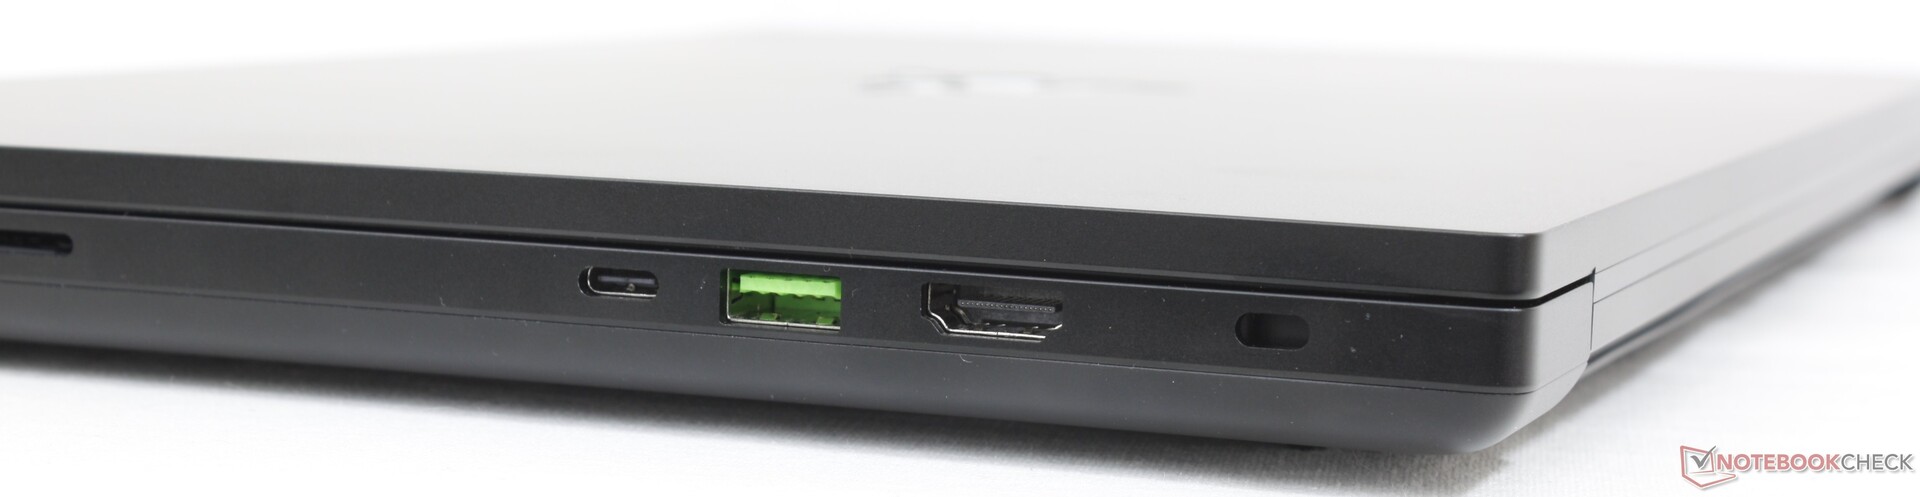
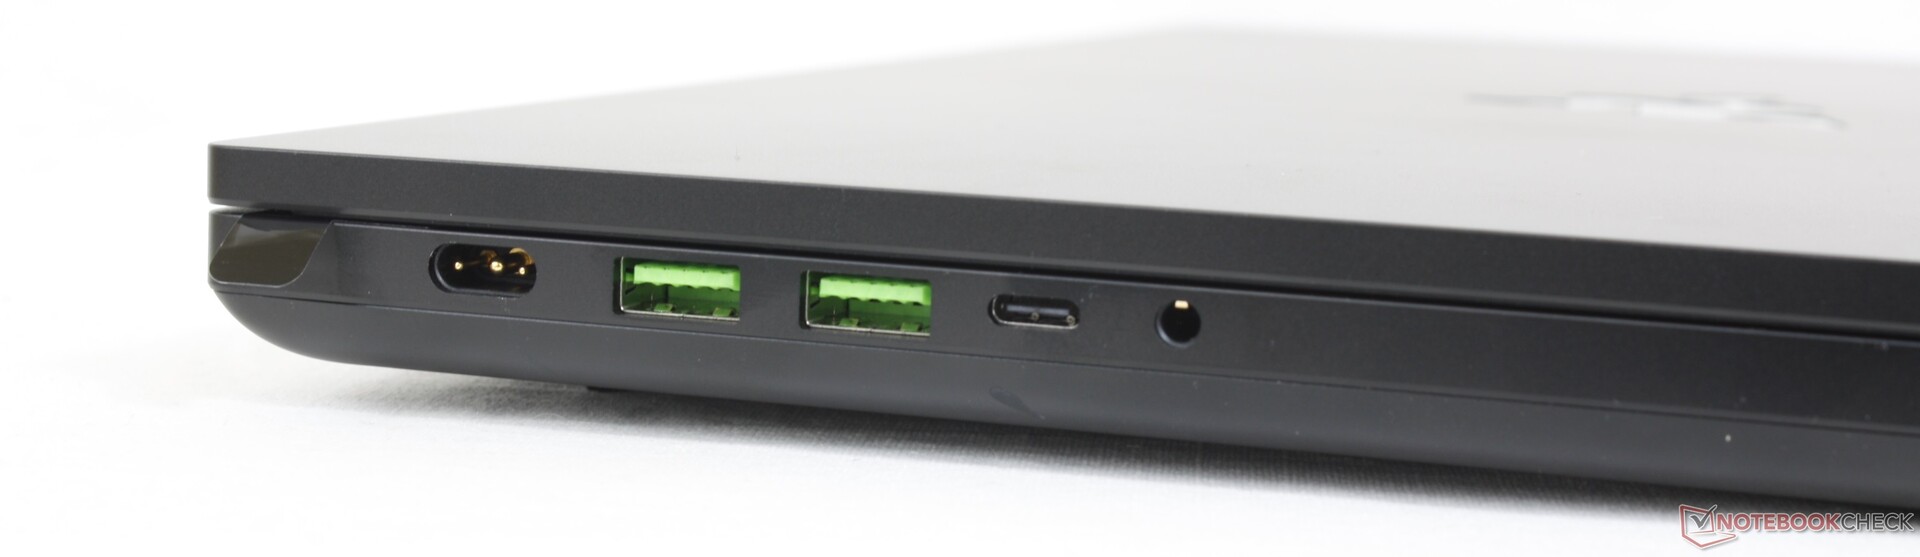
Connectivity — Thunderbolt 4 Support
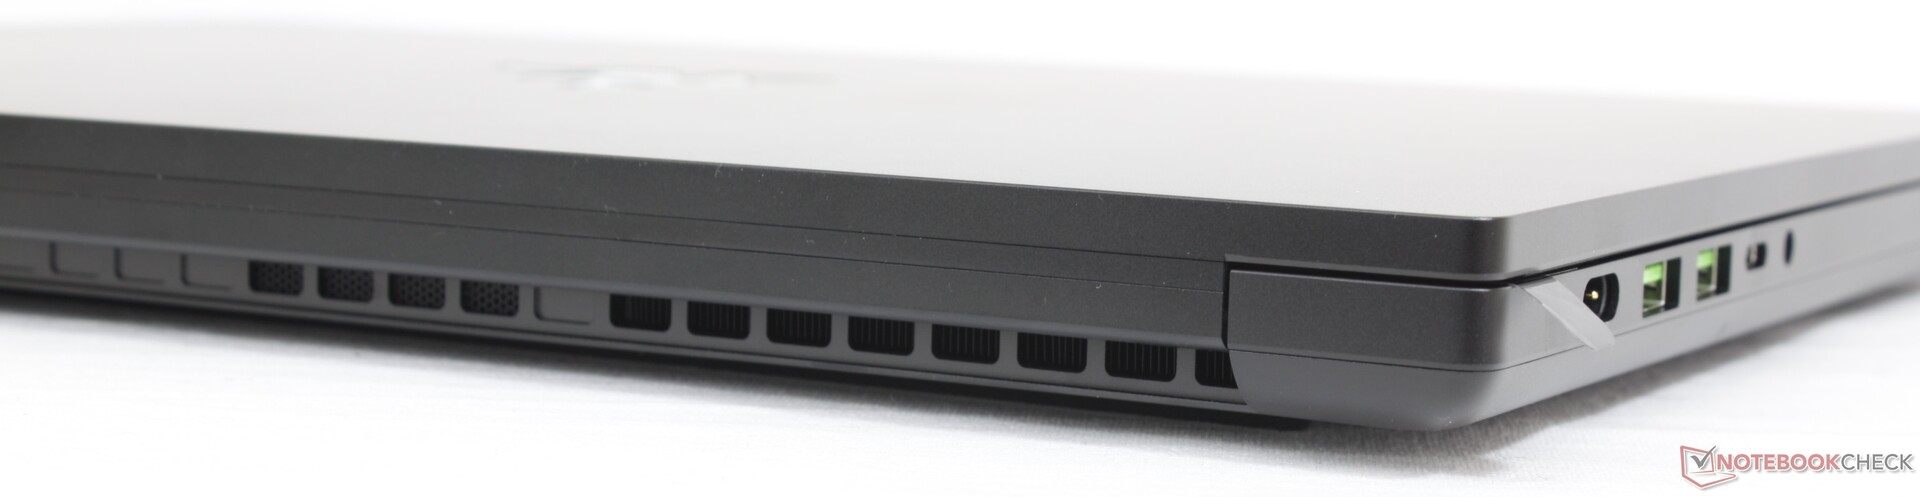
All ports on the Blade 15 Advanced Model have returned on the Blade 16. Users hoping for a dedicated RJ-45 port will have to upgrade to the larger Blade 17 or consider an older Blade 15 Base Model. Keep in mind that Thunderbolt devices are only supported on the USB-C port along the right edge and not the left.
Razer has confirmed that the Blade 16 is compatible with last year's Blade 15 and Blade 17 AC adapters, but performance and/or charging may be slower due to the higher power demands of the Blade 16.
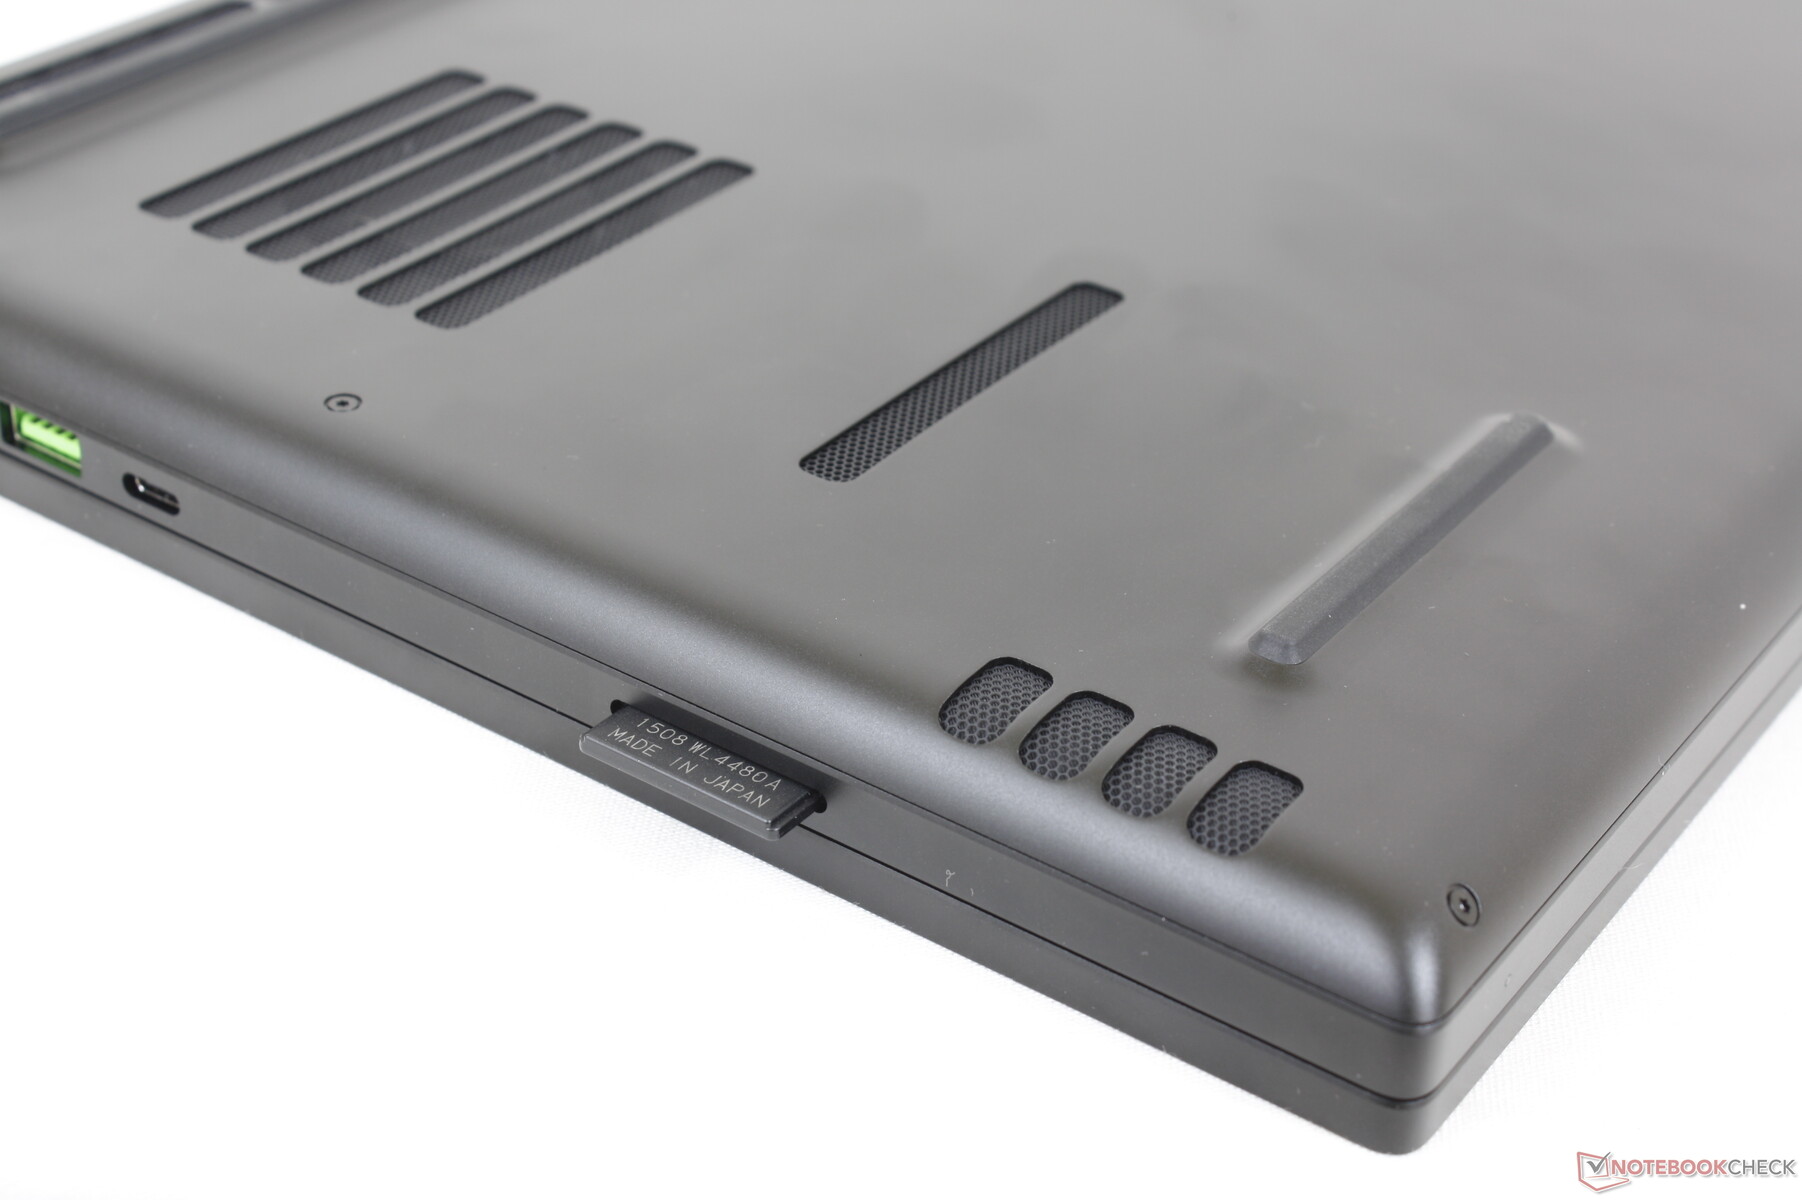
SD Card Reader
Razer has retained the integrated SD card reader from the Blade 15 and Blade 17 series. Transfer rates are roughly 2x faster than the card readers on the Lenovo Legion S7 16, HP Omen 16, and even the MSI GE67 HX.
| SD Card Reader | |
| average JPG Copy Test (av. of 3 runs) | |
| Razer Blade 15 Advanced Model Early 2022 (AV PRO microSD 128 GB V60) | |
| Asus ROG Zephyrus Duo 16 GX650RX (AV PRO microSD 128 GB V60) | |
| Razer Blade 17 (i7-12800H, RTX 3070 Ti) | |
| Razer Blade 16 Early 2023 (AV PRO microSD 128 GB V60) | |
| Lenovo Legion S7 16ARHA7 (AV PRO microSD 128 GB V60) | |
| MSI GE67 HX 12UGS (Toshiba Exceria Pro SDXC 64 GB UHS-II) | |
| HP Omen 16-n0033dx (AV PRO microSD 128 GB V60) | |
| maximum AS SSD Seq Read Test (1GB) | |
| Razer Blade 16 Early 2023 (AV PRO microSD 128 GB V60) | |
| Razer Blade 17 (i7-12800H, RTX 3070 Ti) | |
| Asus ROG Zephyrus Duo 16 GX650RX (AV PRO microSD 128 GB V60) | |
| Lenovo Legion S7 16ARHA7 (AV PRO microSD 128 GB V60) | |
| HP Omen 16-n0033dx (AV PRO microSD 128 GB V60) | |
| MSI GE67 HX 12UGS (Toshiba Exceria Pro SDXC 64 GB UHS-II) | |
Communication
An Intel AX211 comes standard for 6 GHz Wi-Fi 6E and Bluetooth 5.2 connectivity. We experienced no performance issues when paired to our Asus AXE11000 router.
| Networking | |
| iperf3 receive AXE11000 6GHz | |
| Razer Blade 16 Early 2023 | |
| Lenovo Legion S7 16ARHA7 | |
| HP Omen 16-n0033dx | |
| iperf3 receive AXE11000 | |
| Razer Blade 15 Advanced Model Early 2022 | |
| Asus ROG Zephyrus Duo 16 GX650RX | |
| HP Omen 16-n0033dx | |
| Razer Blade 16 Early 2023 | |
| Dell G16 7620 | |
| iperf3 transmit AXE11000 | |
| Asus ROG Zephyrus Duo 16 GX650RX | |
| Razer Blade 15 Advanced Model Early 2022 | |
| HP Omen 16-n0033dx | |
| Razer Blade 16 Early 2023 | |
| Dell G16 7620 | |
| iperf3 transmit AXE11000 6GHz | |
| Lenovo Legion S7 16ARHA7 | |
| HP Omen 16-n0033dx | |
| Razer Blade 16 Early 2023 | |
Webcam
The IR-enabled webcam appears to be the same 2 MP sensor as found on the Blade 17. There is an integrated physical camera shutter for privacy whereas most MSI models utilize an electronic kill switch in lieu of a physical cover.
(February 8, 2023 update: Fixed an error relating to the camera shutter.)


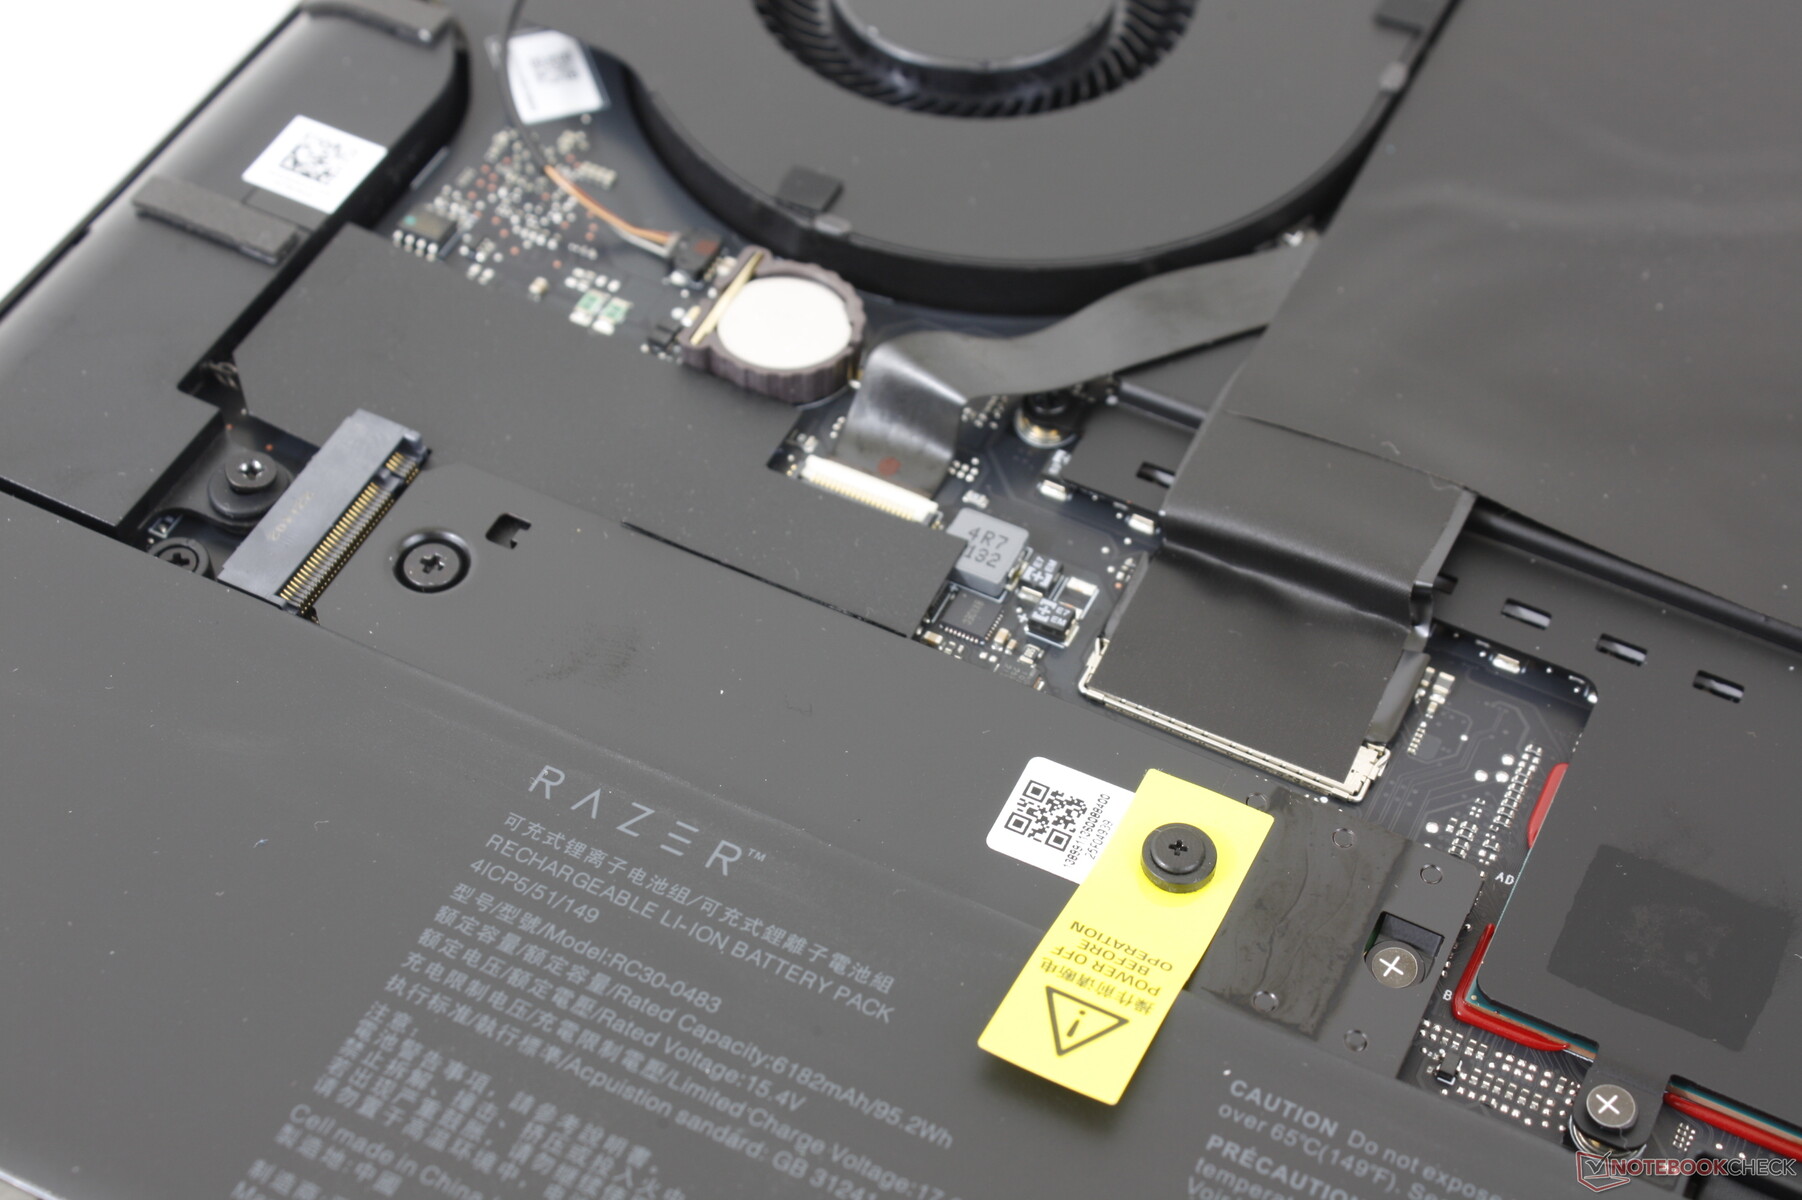
Maintenance
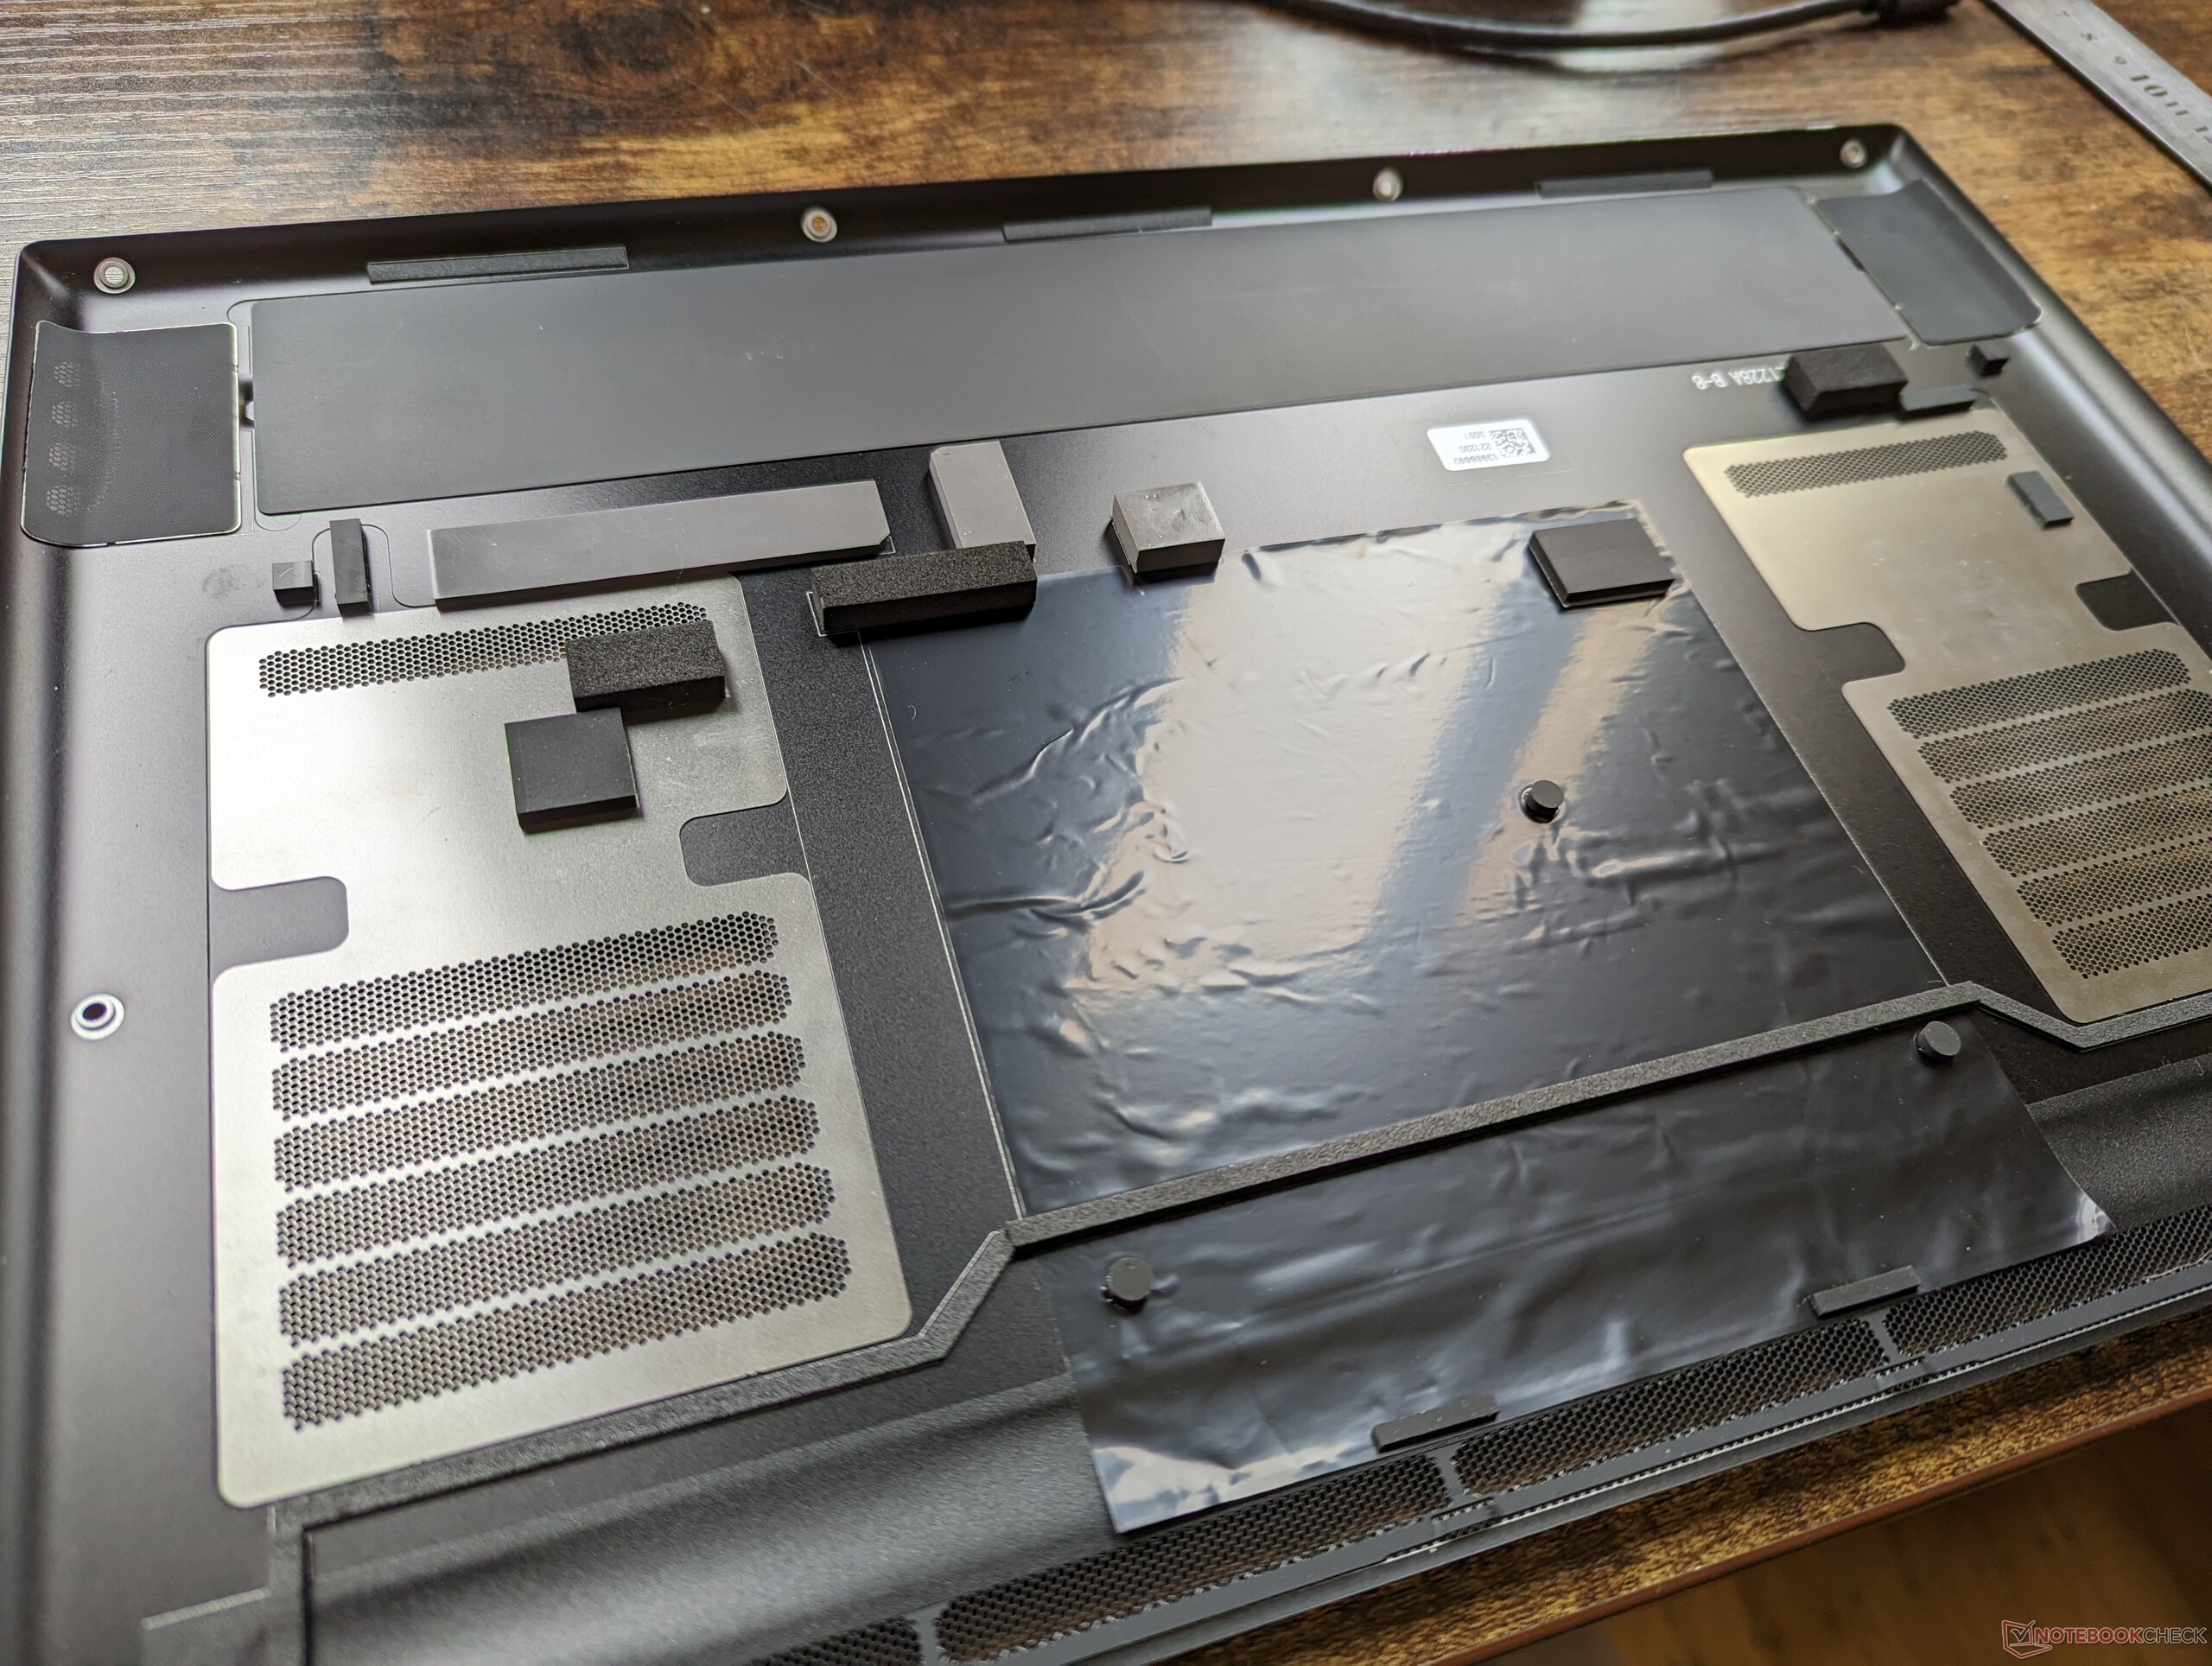
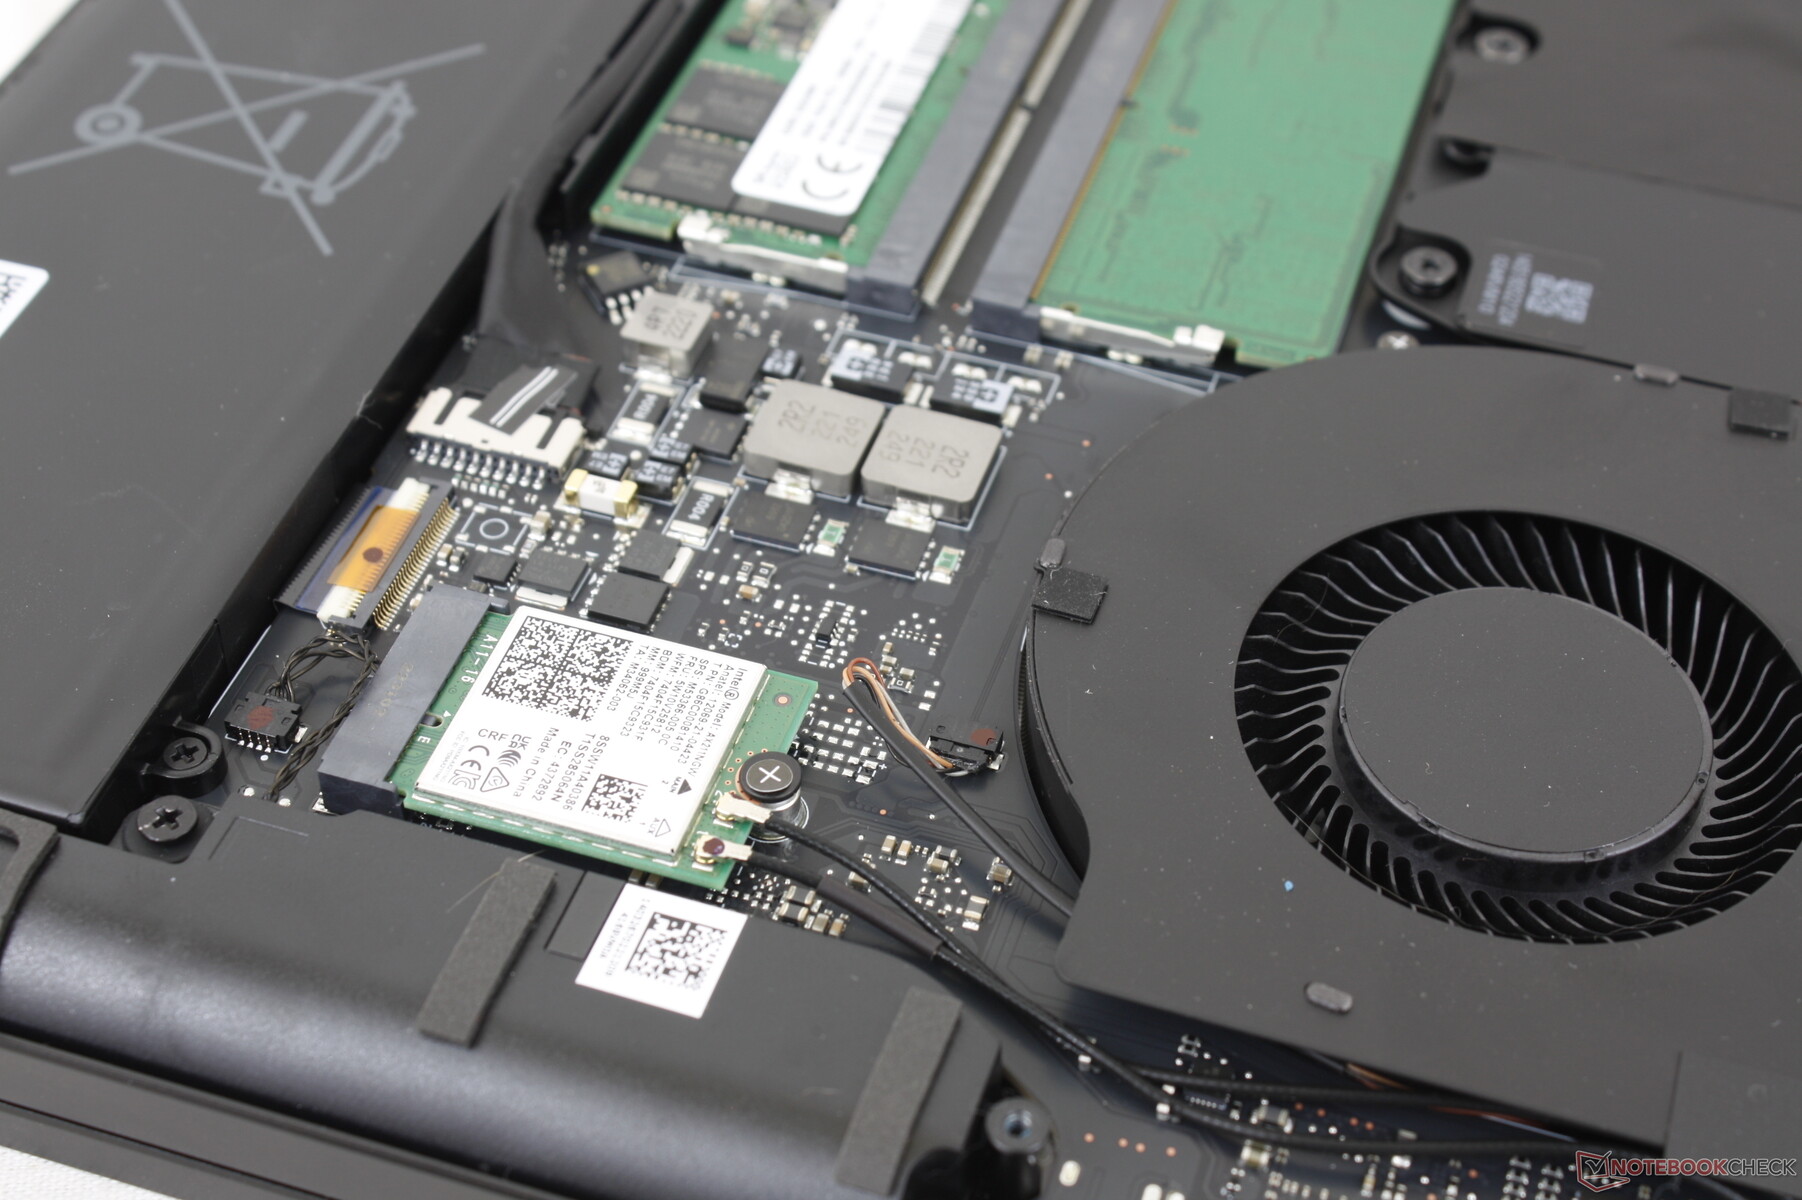
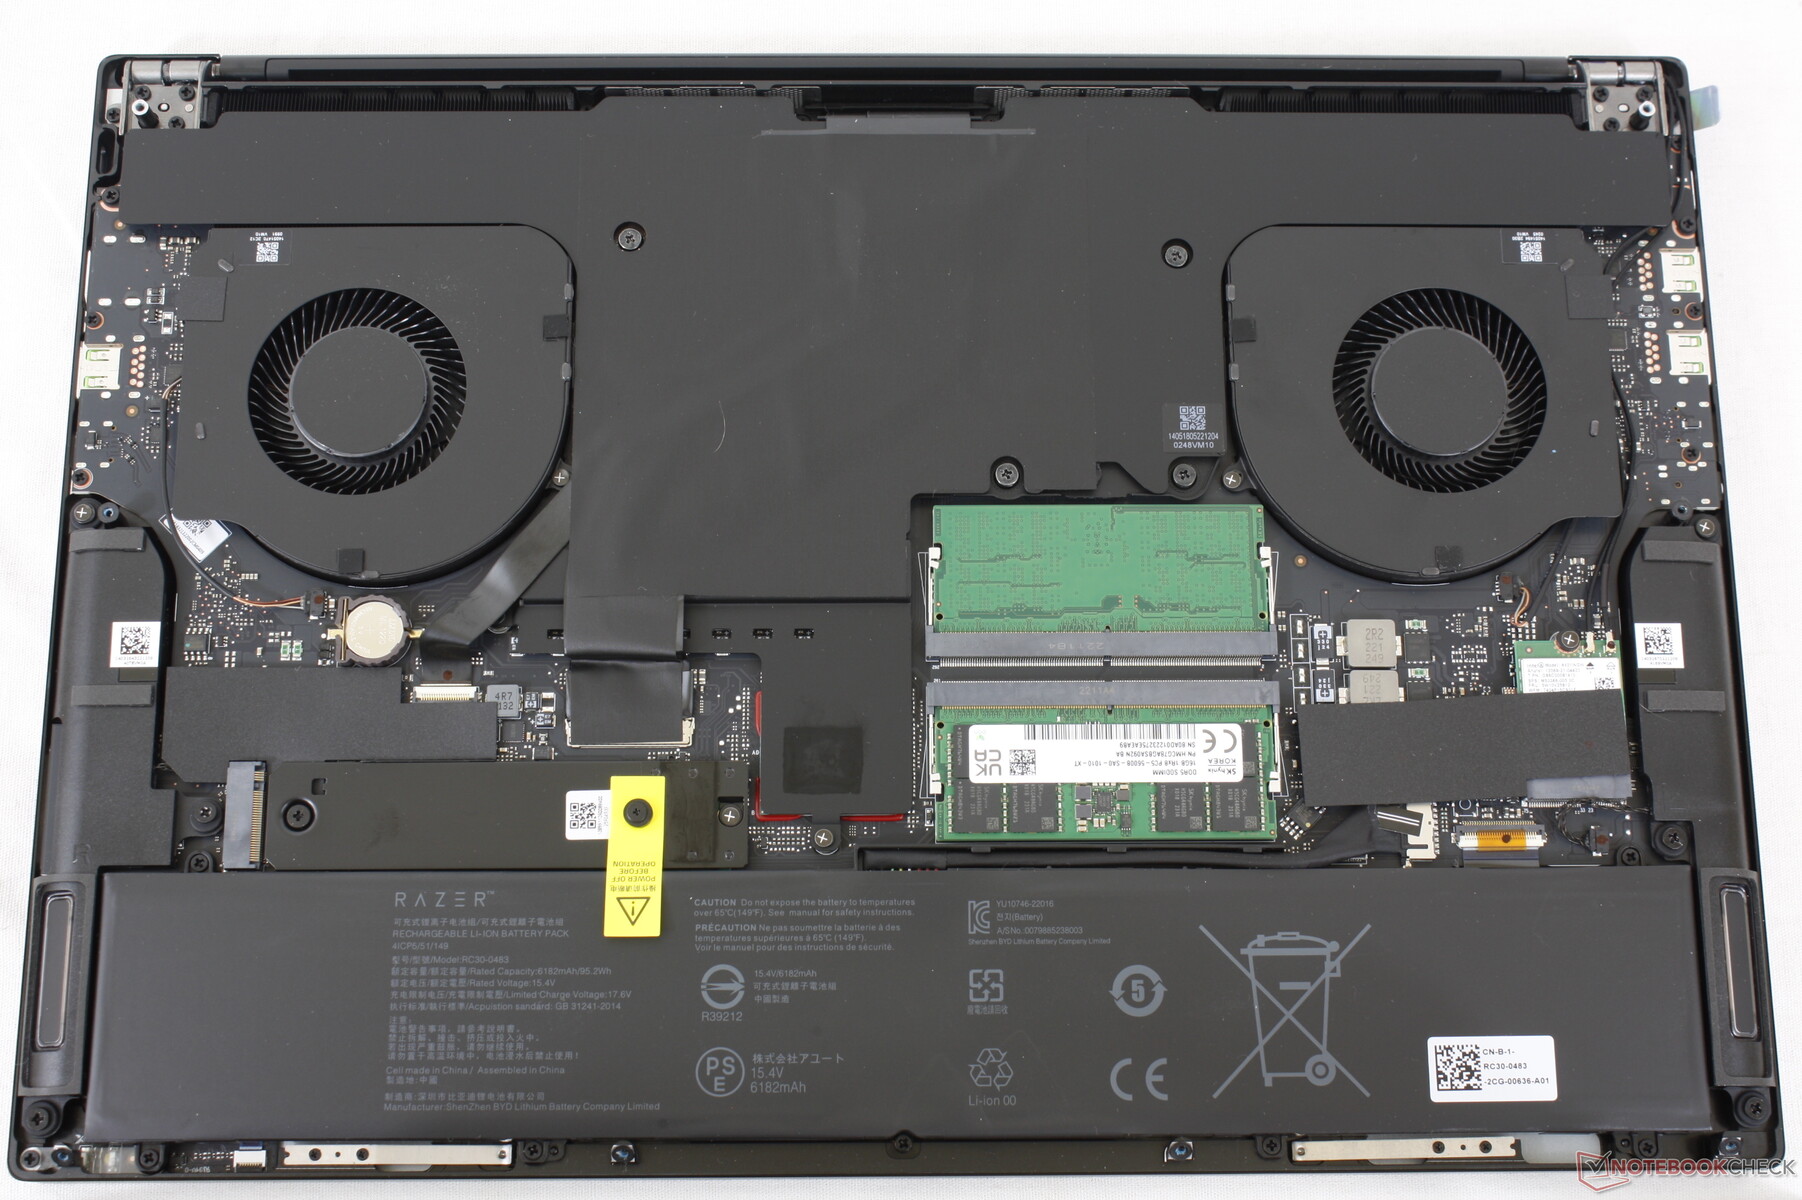
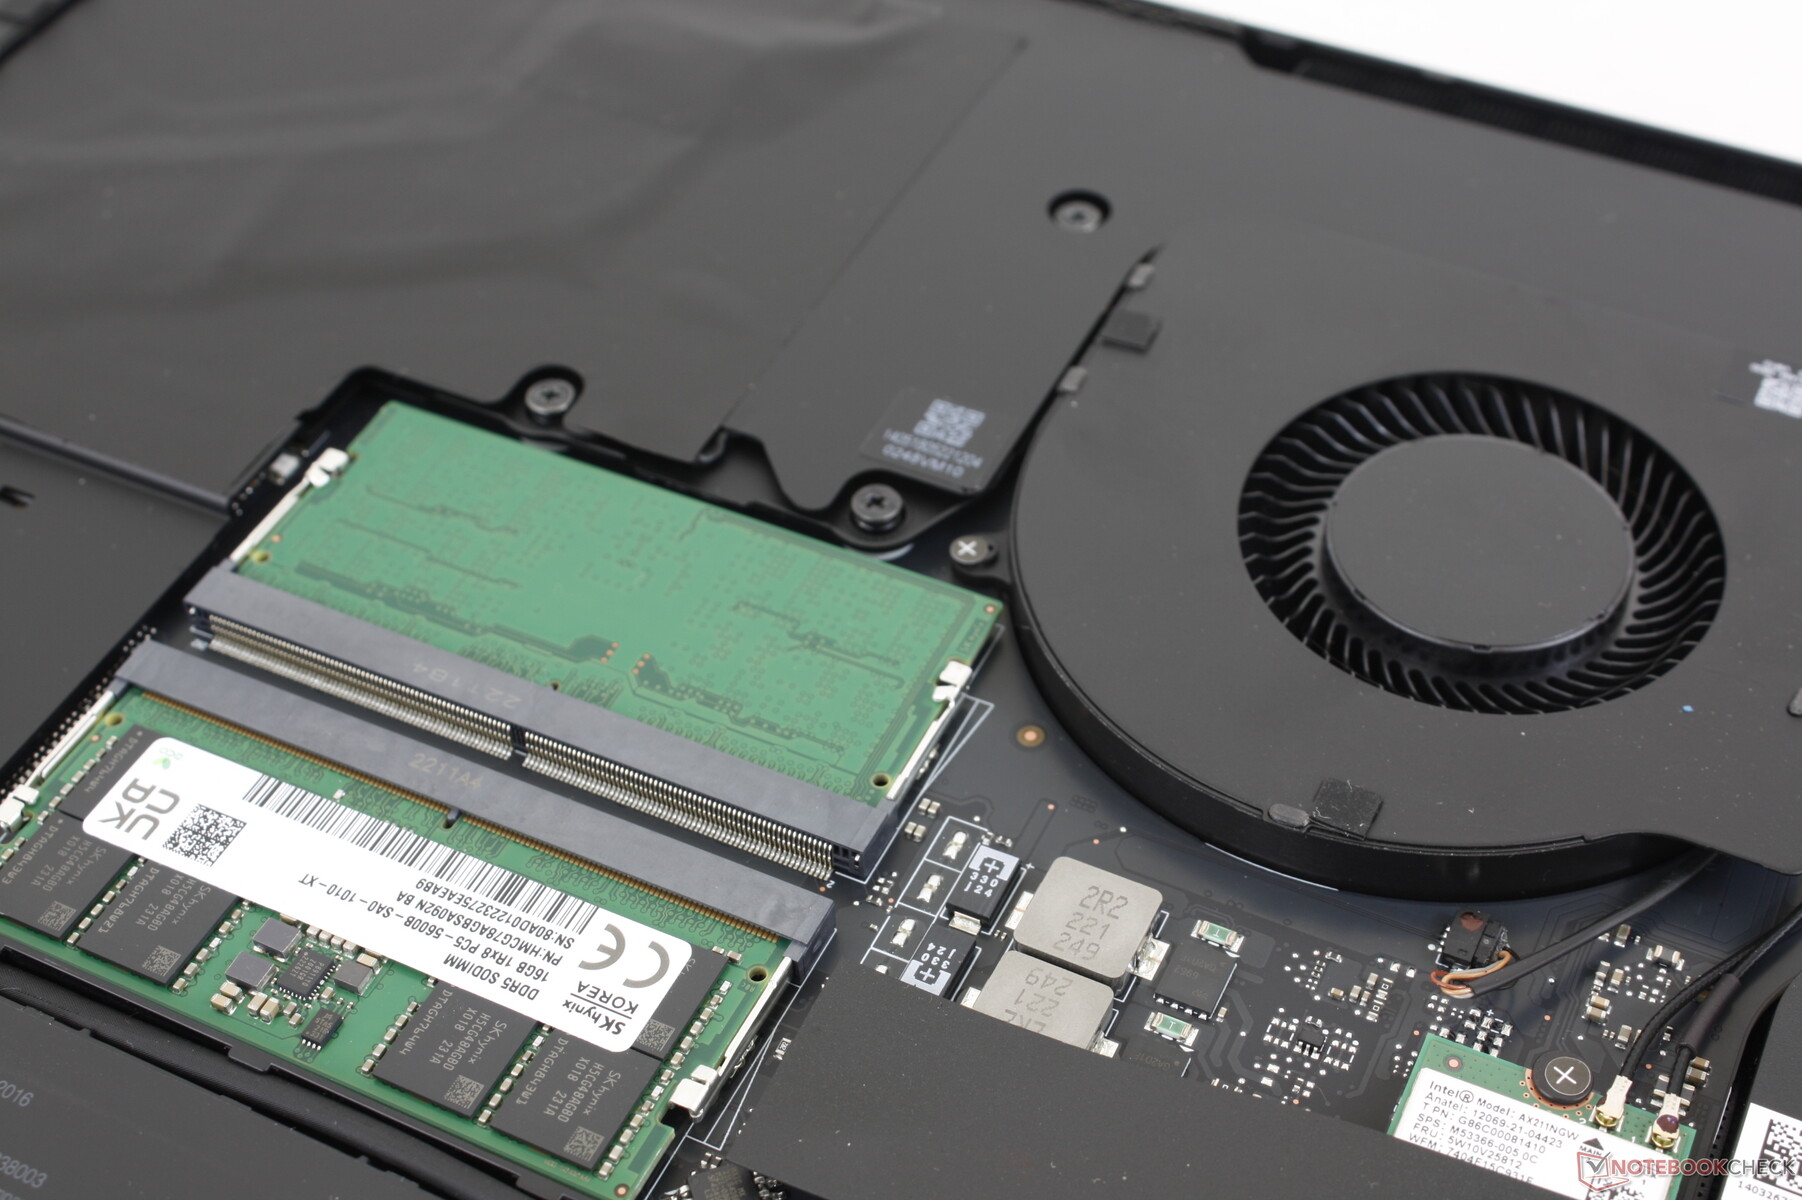
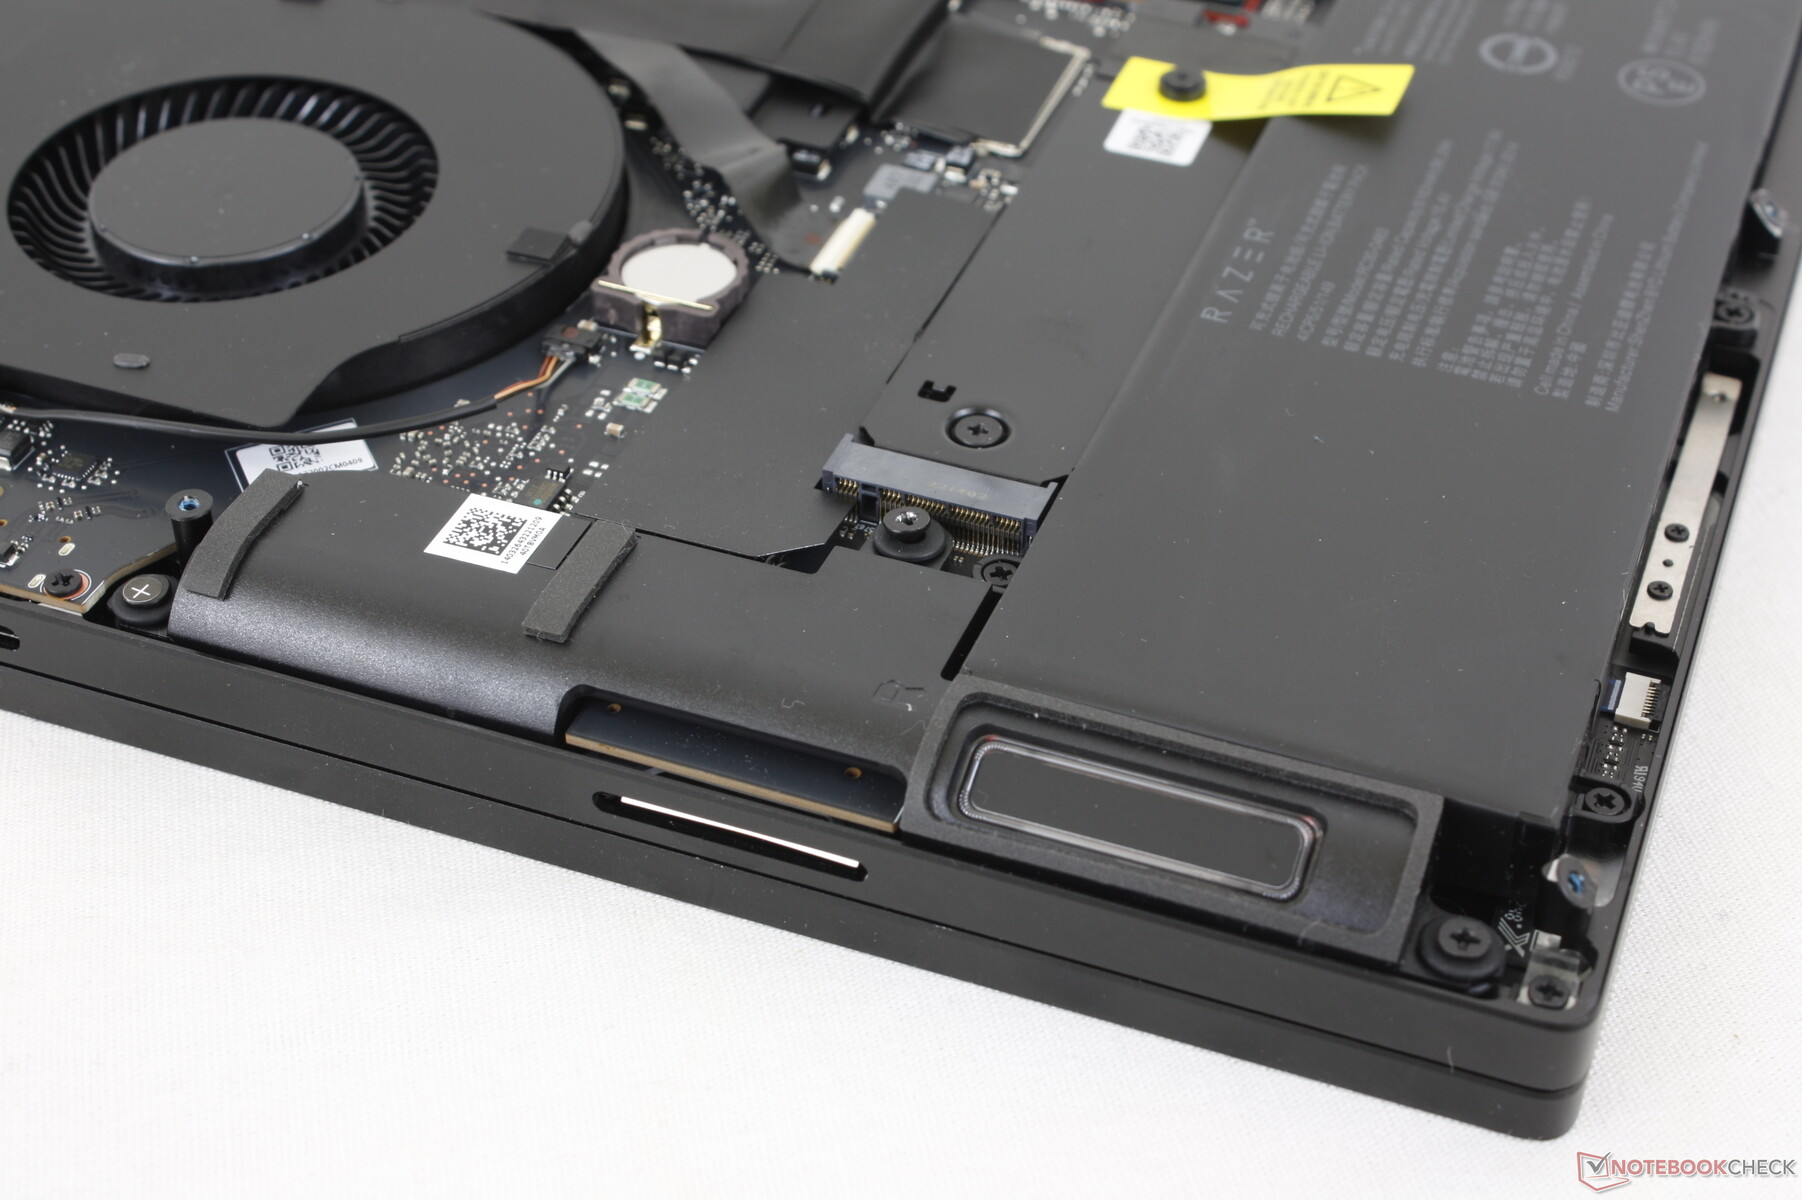
The bottom panel is secured by eight T5 Torx screws for easy servicing. Users have direct access to 2x DDR5 SODIMM slots, 2x M.2 2280 SSD slots, both batteries, and the WLAN module. Up to 64 GB of RAM can be installed, but RAM performance will be capped at 5200 MHz compared to 5600 MHz if installed with 32 GB or lower. The performance ceiling is due to the limitations of the SODIMM interface.
Accessories and Warranty
The retail box includes no extras outside of the AC adapter or paperwork — not even a velvet wiping cloth. A one-year limited manufacturer applies if purchased in the US.
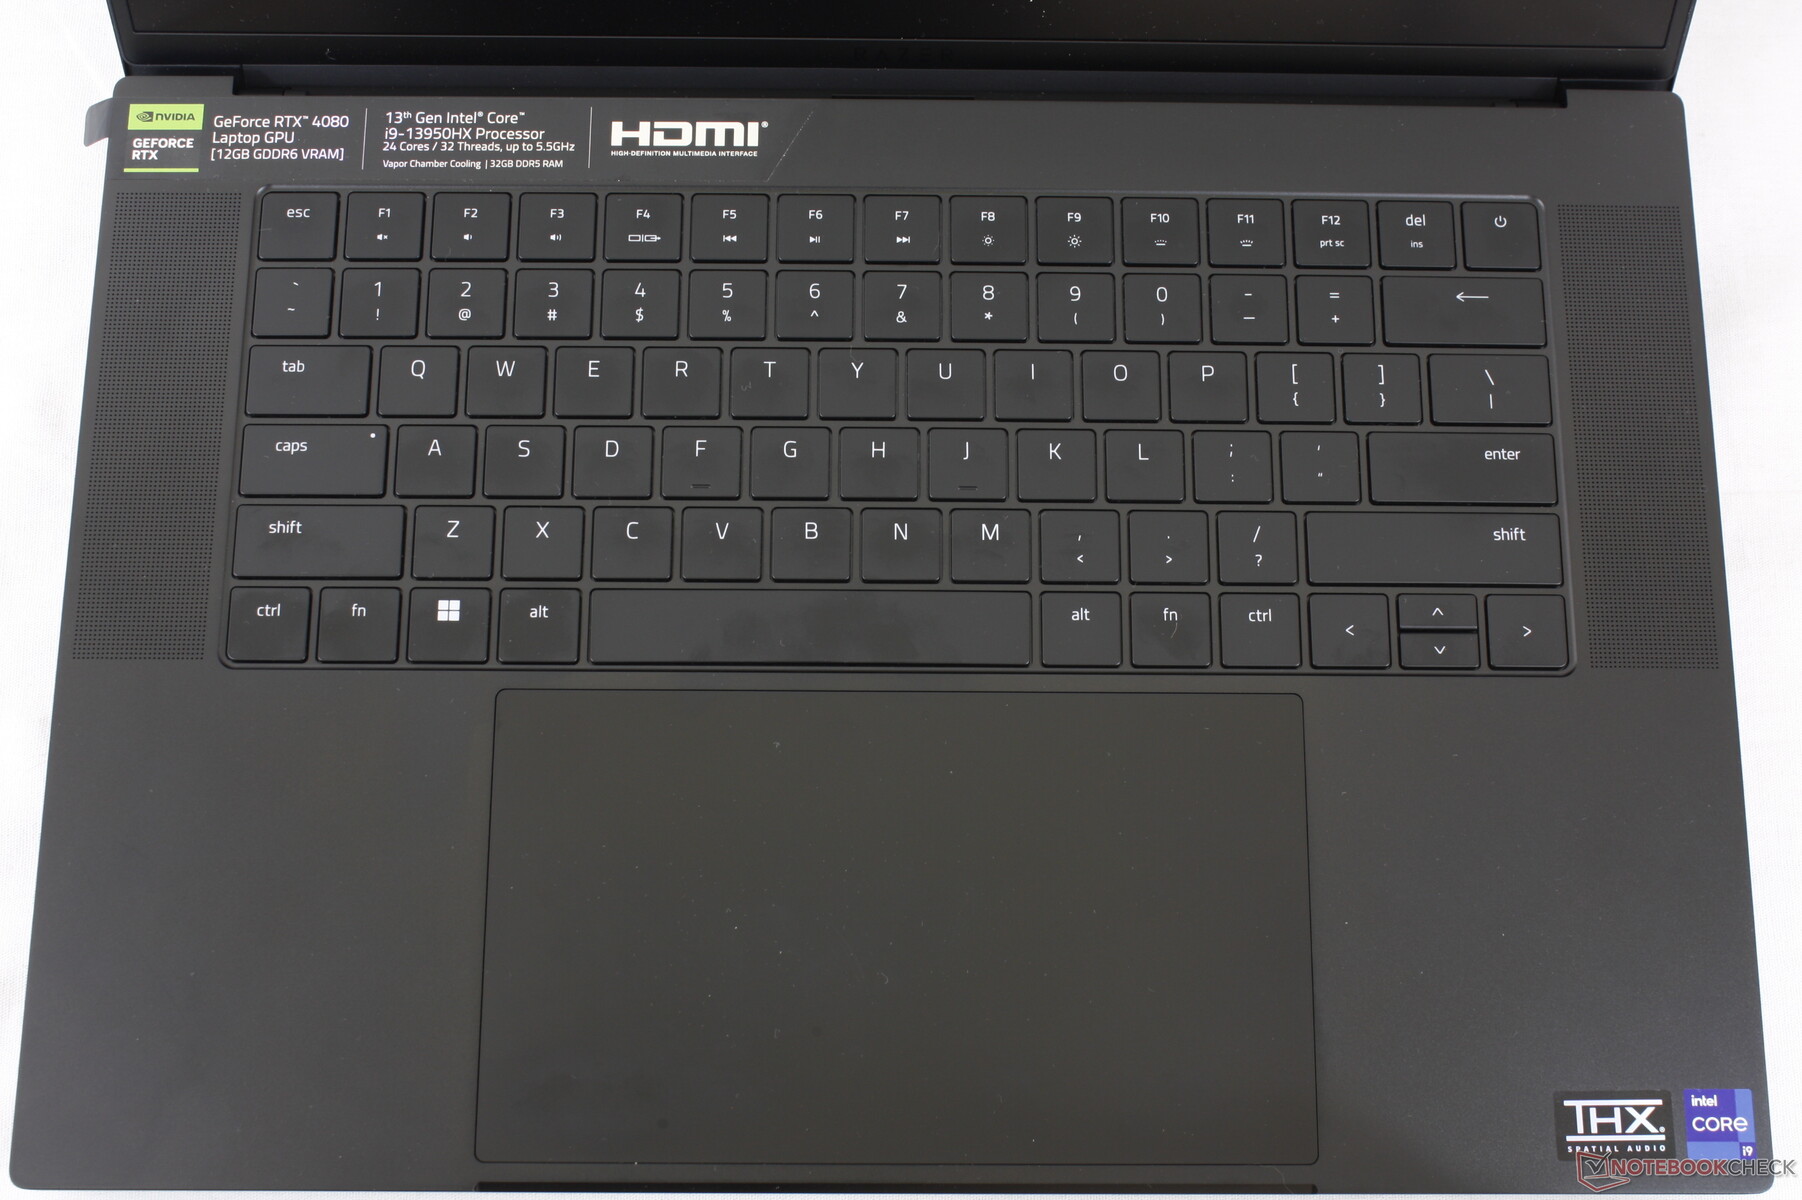
Input Devices — Much Larger Clickpad
Keyboard
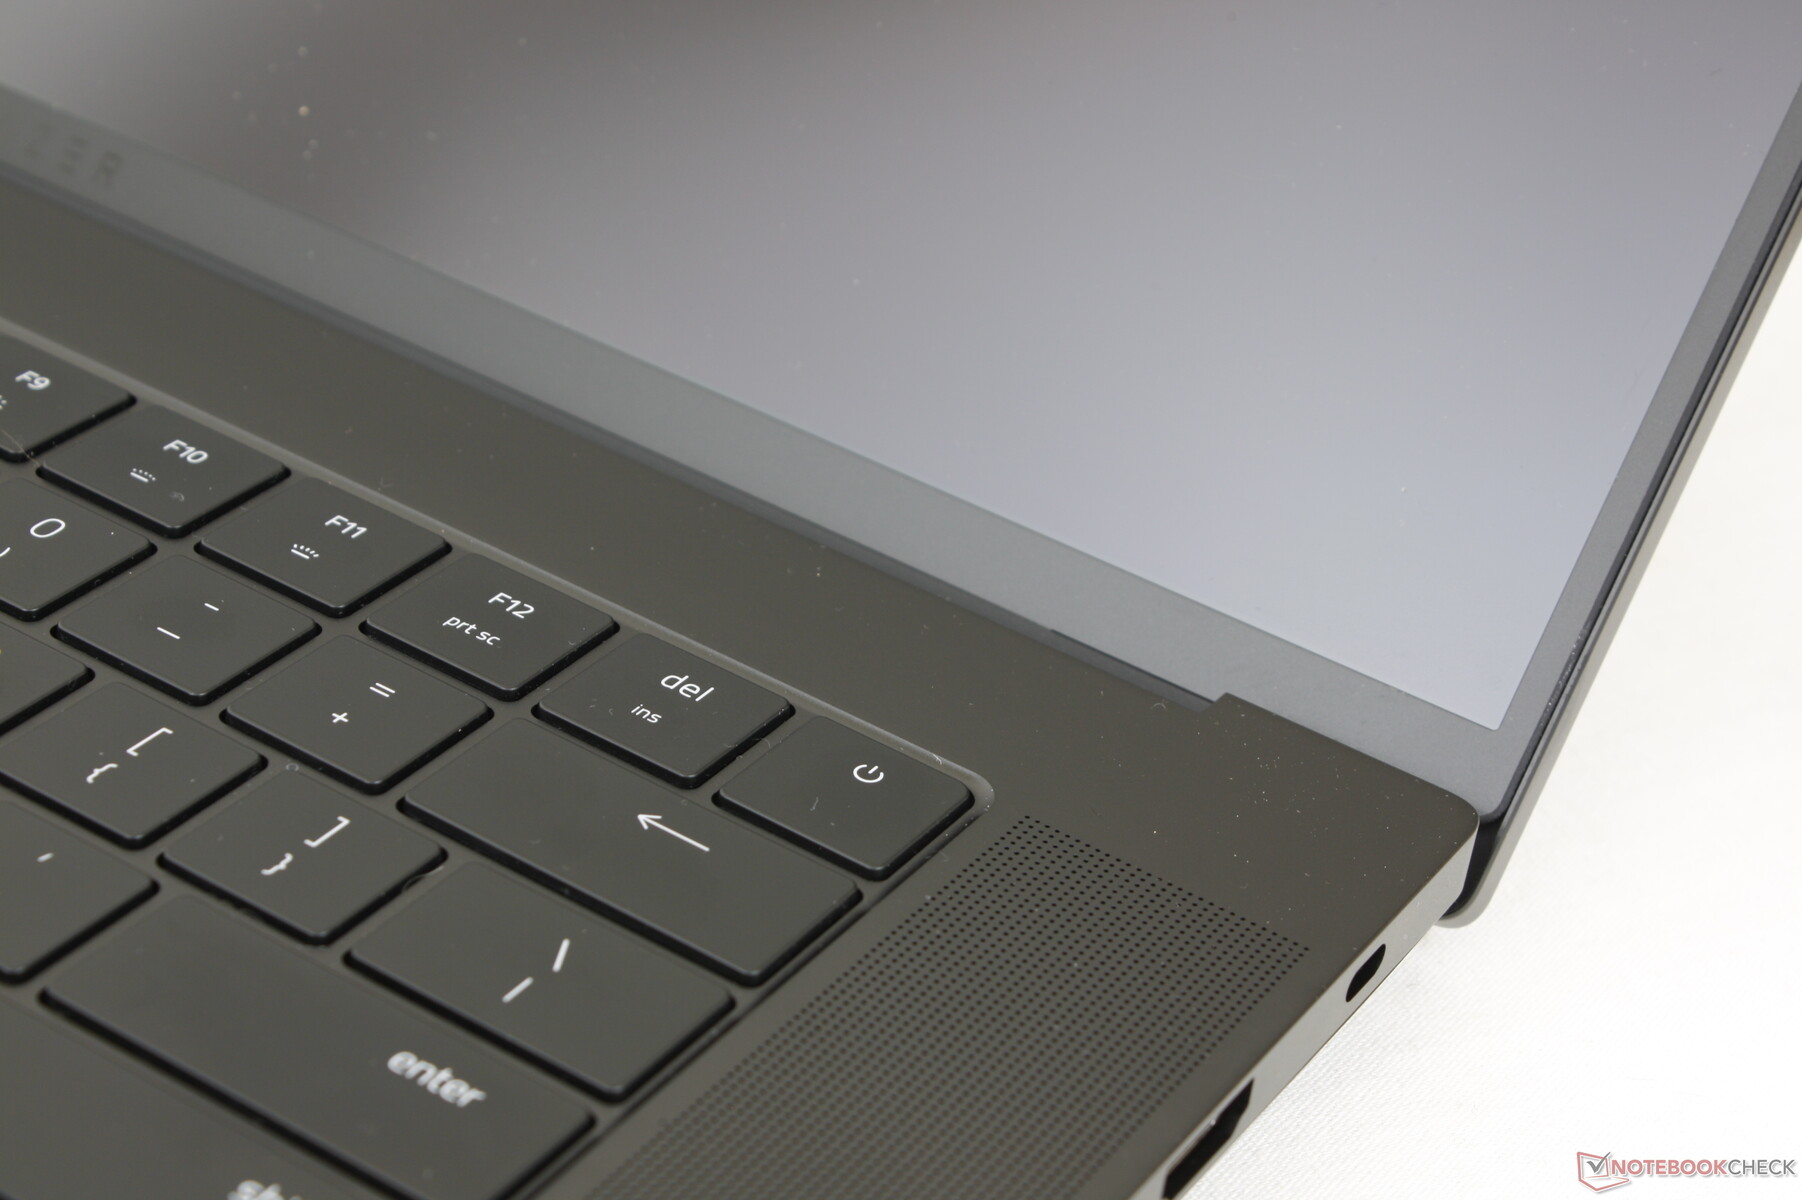
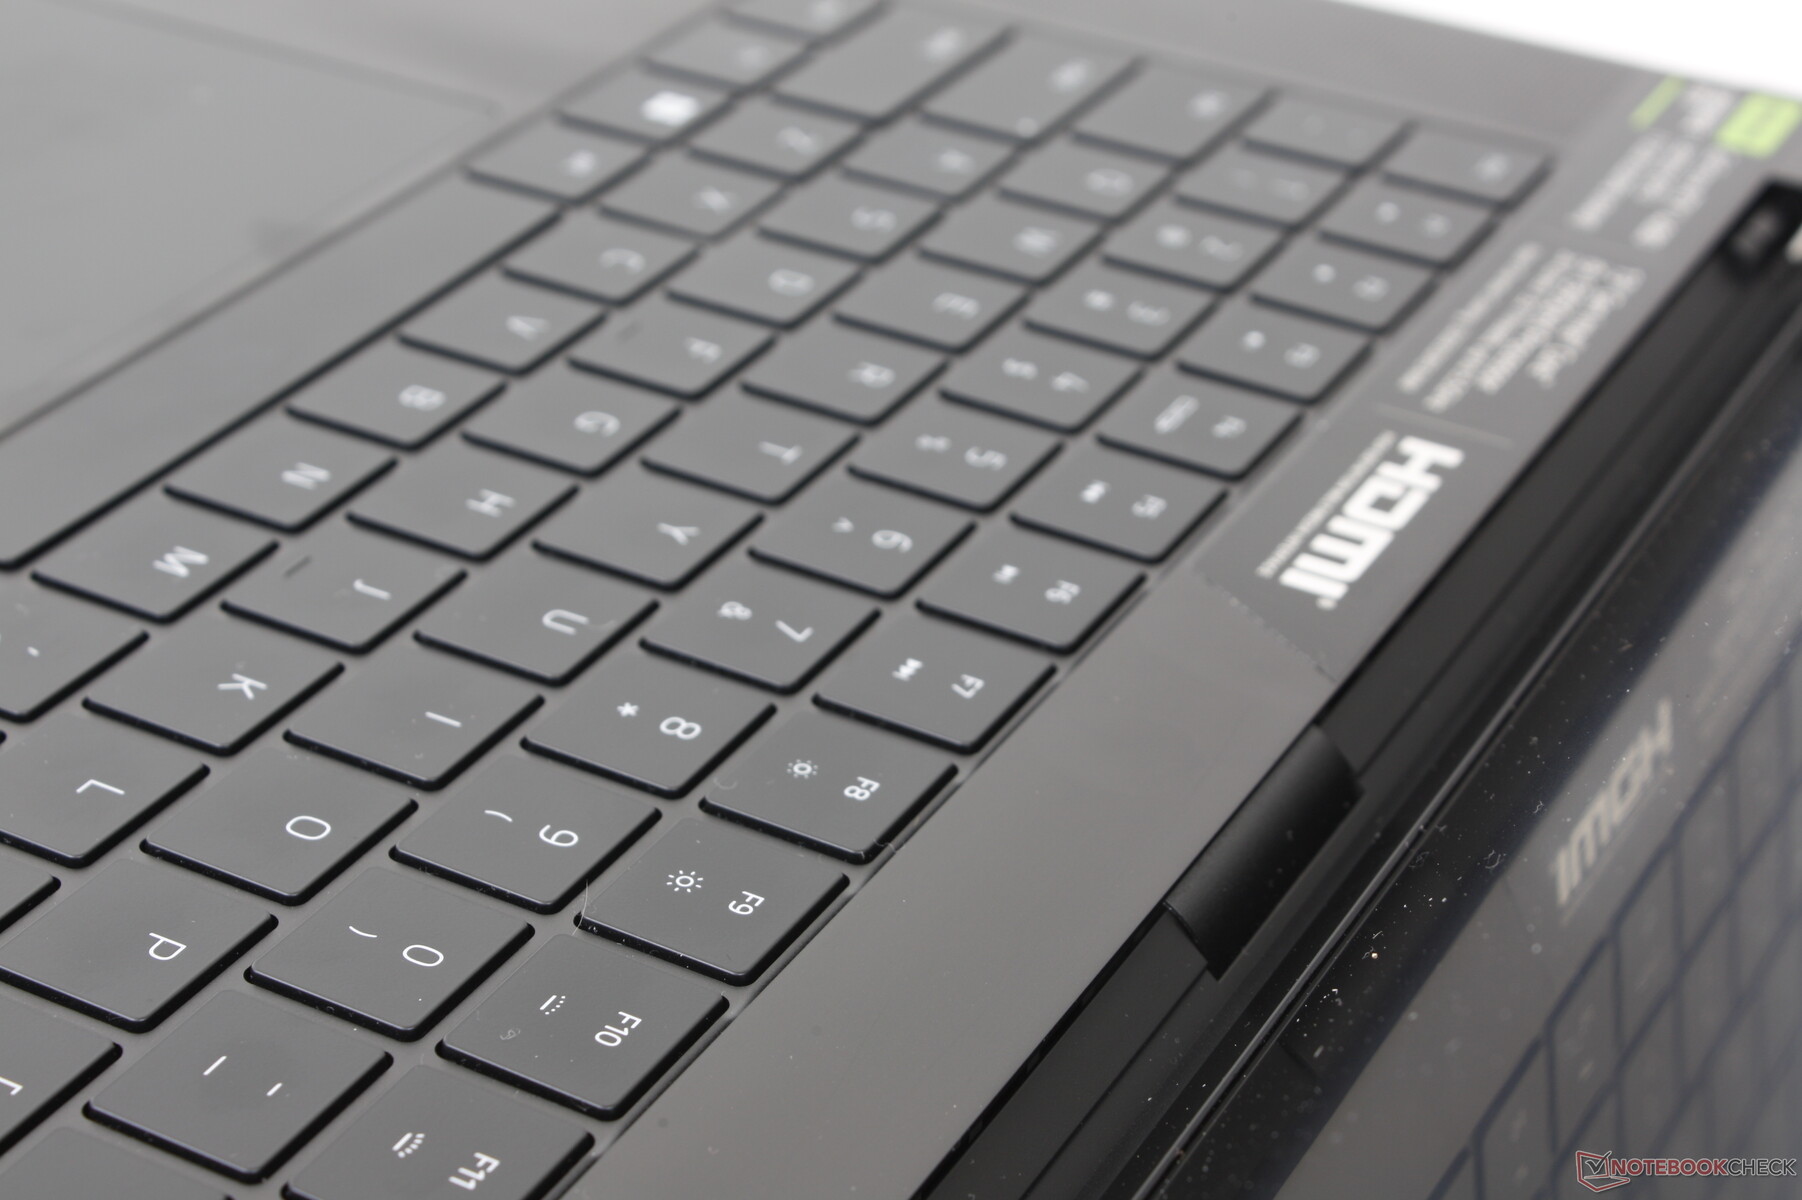
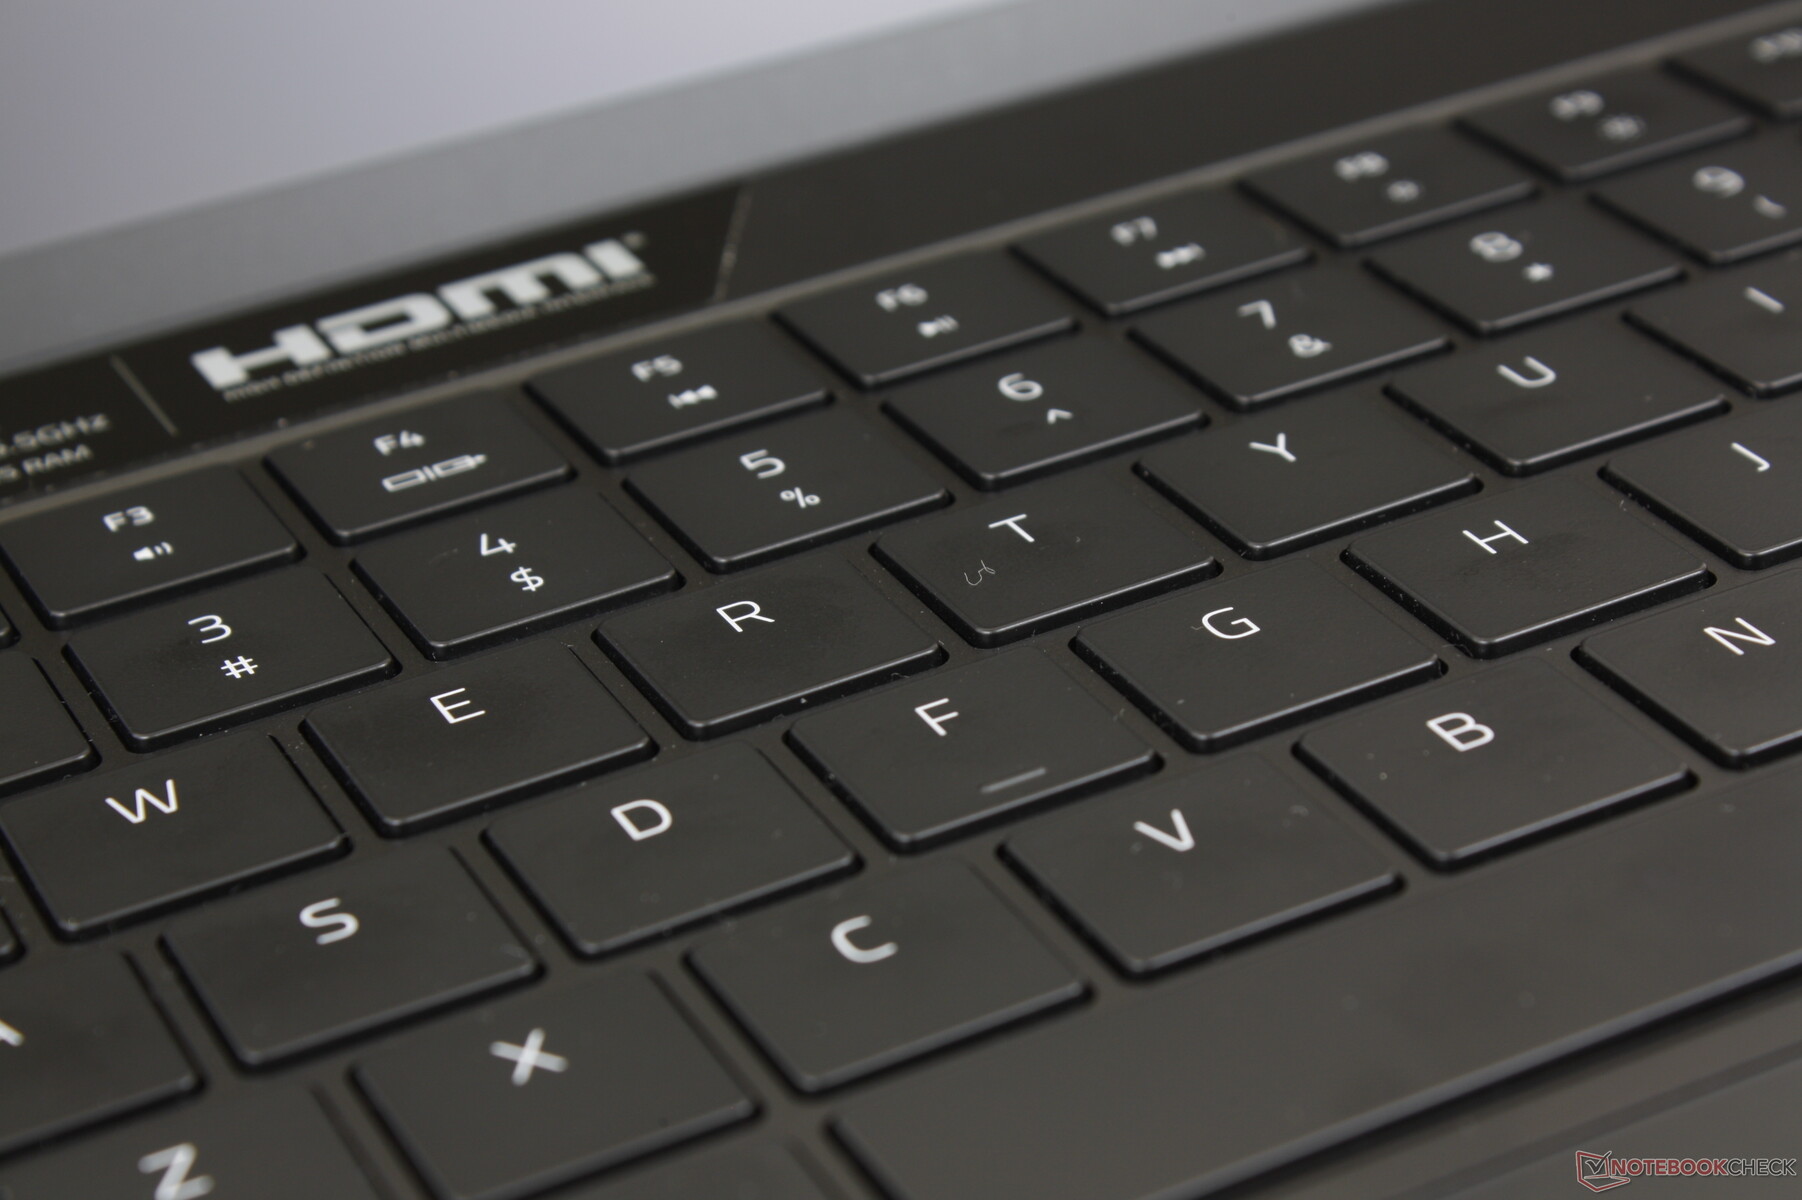
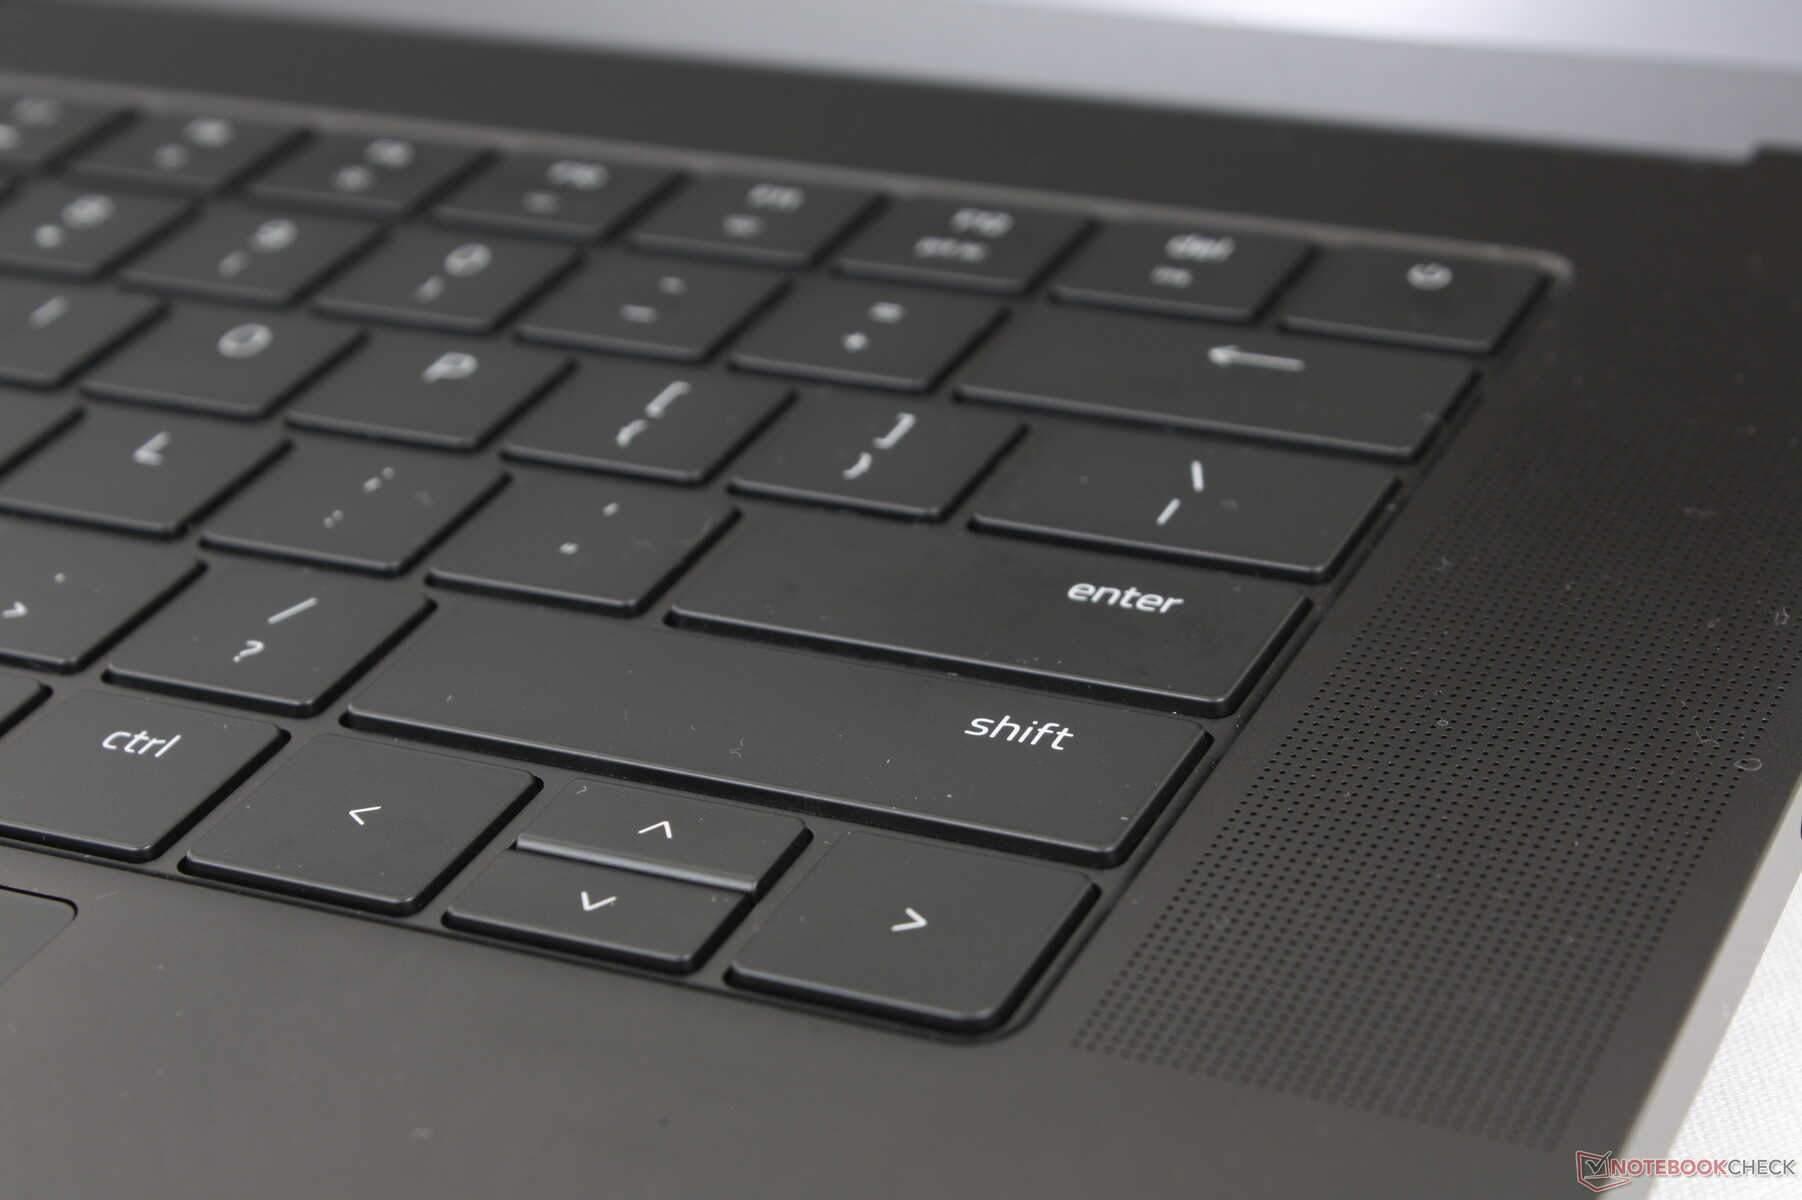
The keyboard remains identical to the 2022 Blade 15 down to the key sizes, travel, font, and per-key RGB lighting. Razer already lengthened the Shift keys between the 2021 and 2022 Blade 15 models and so the Blade 16 has inherited this change. It would have still been nice to see a fingerprint-enabled Power button, though.
Older Blade 15 models incorporated optical key switches, but the feature has all but disappeared on the latest Blade models.
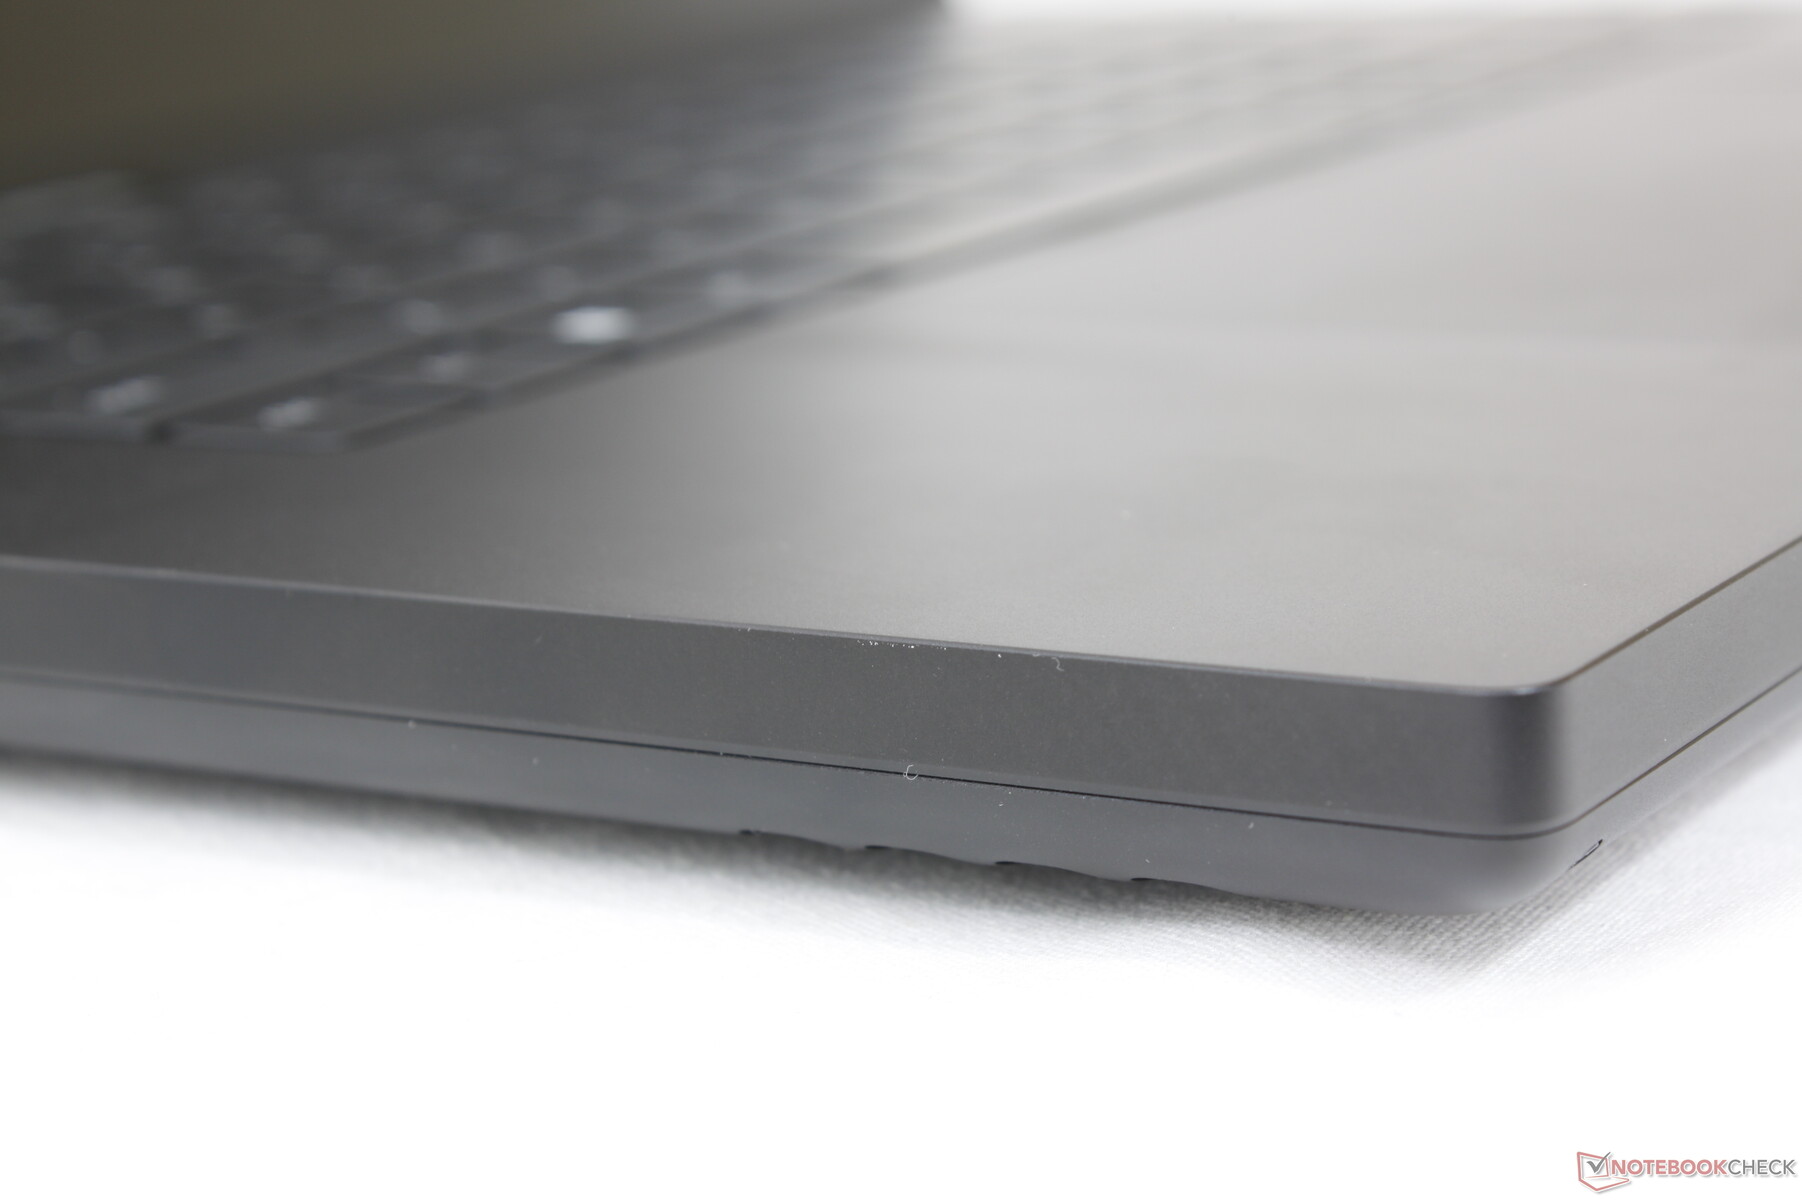
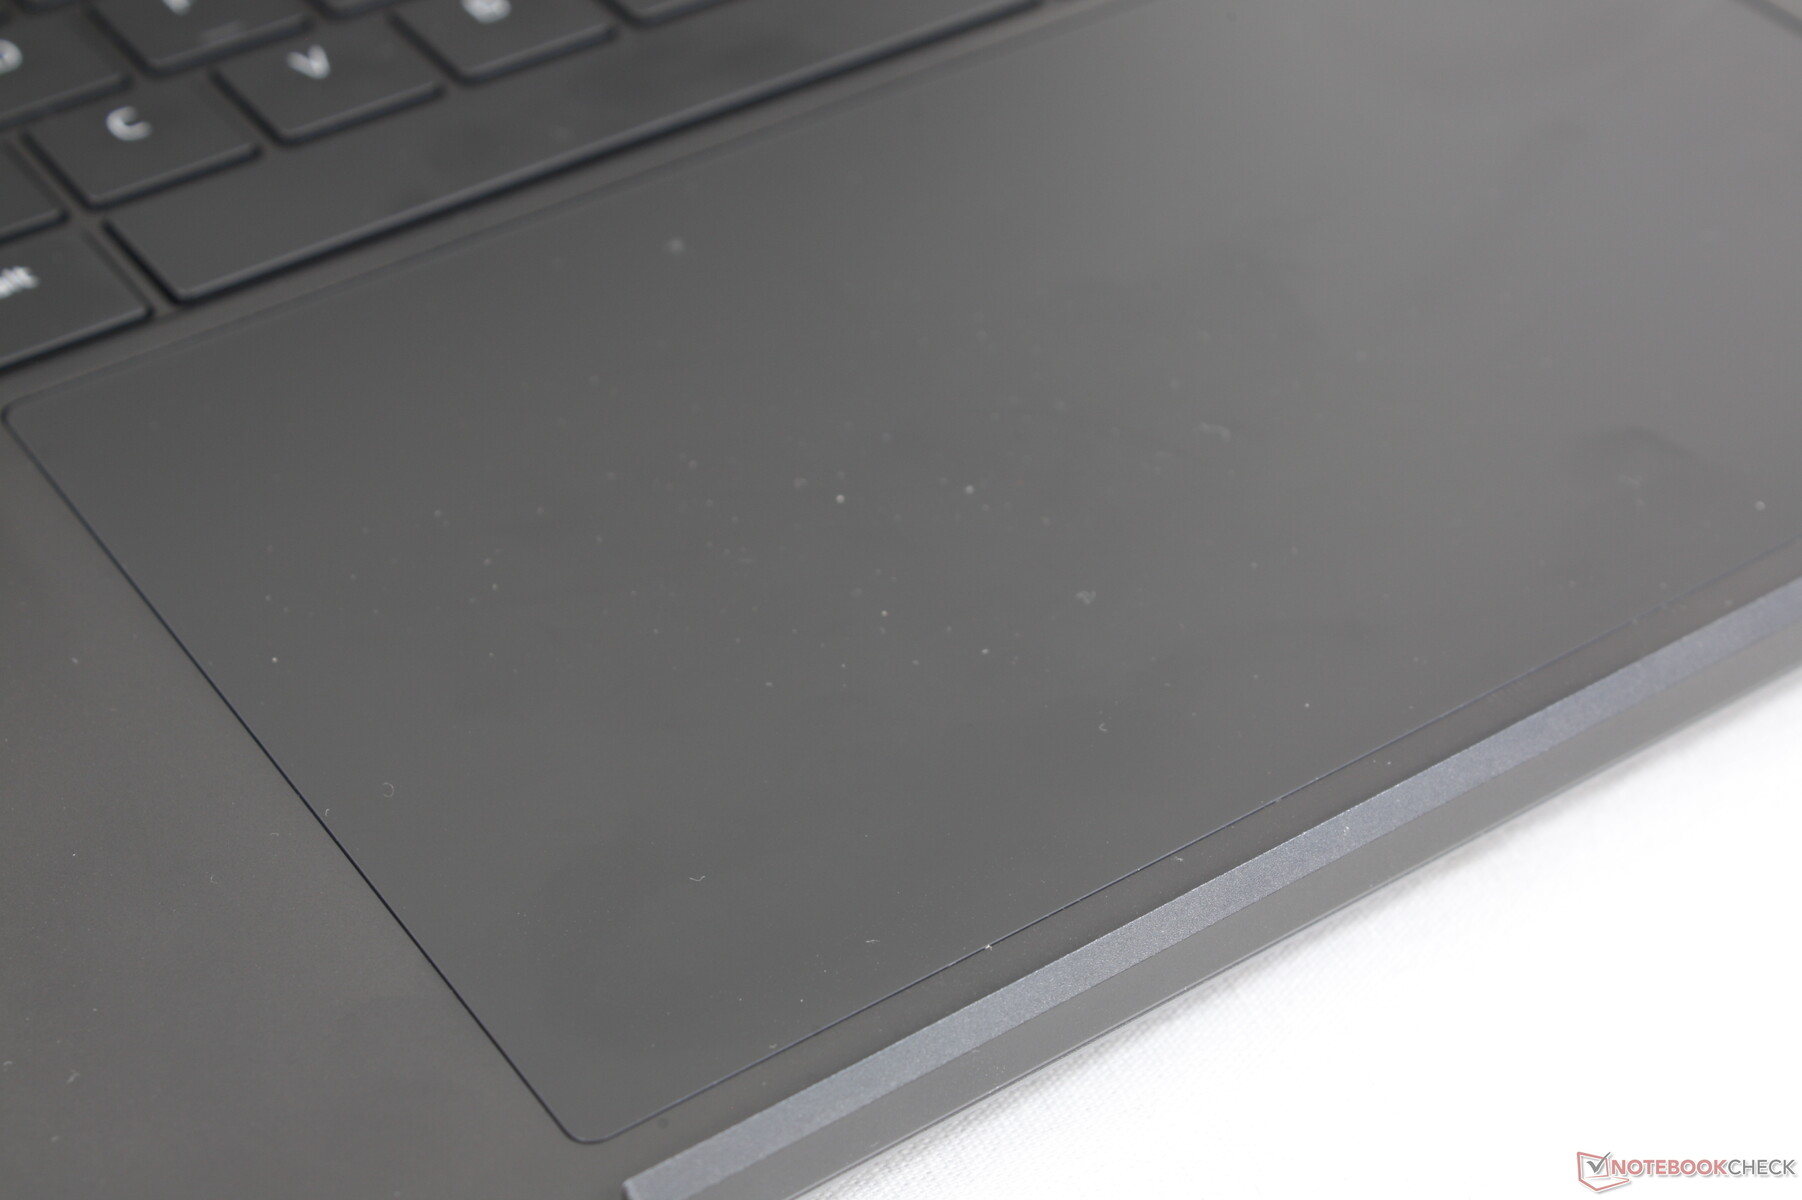
Touchpad
When Razer introduced the larger 17.3-inch Blade Pro or Blade 17, we were surprised to find that its clickpad would be exactly the same size as on the smaller 15.6-inch Blade 15. For the Blade 16, the maker has finally bumped up the surface area from 13 x 8 cm on the Blade 15/17 to a super-spacious 17 x 9.7 cm. Cursor controls and multi-touch inputs are therefore easier, but feedback when clicking is still spongy similar to the existing Blade models or the Dell XPS 15/17. If you find clickpad feedback on the Blade 15 or 17 to be too soft, then the Blade 16 clickpad will feel no different.
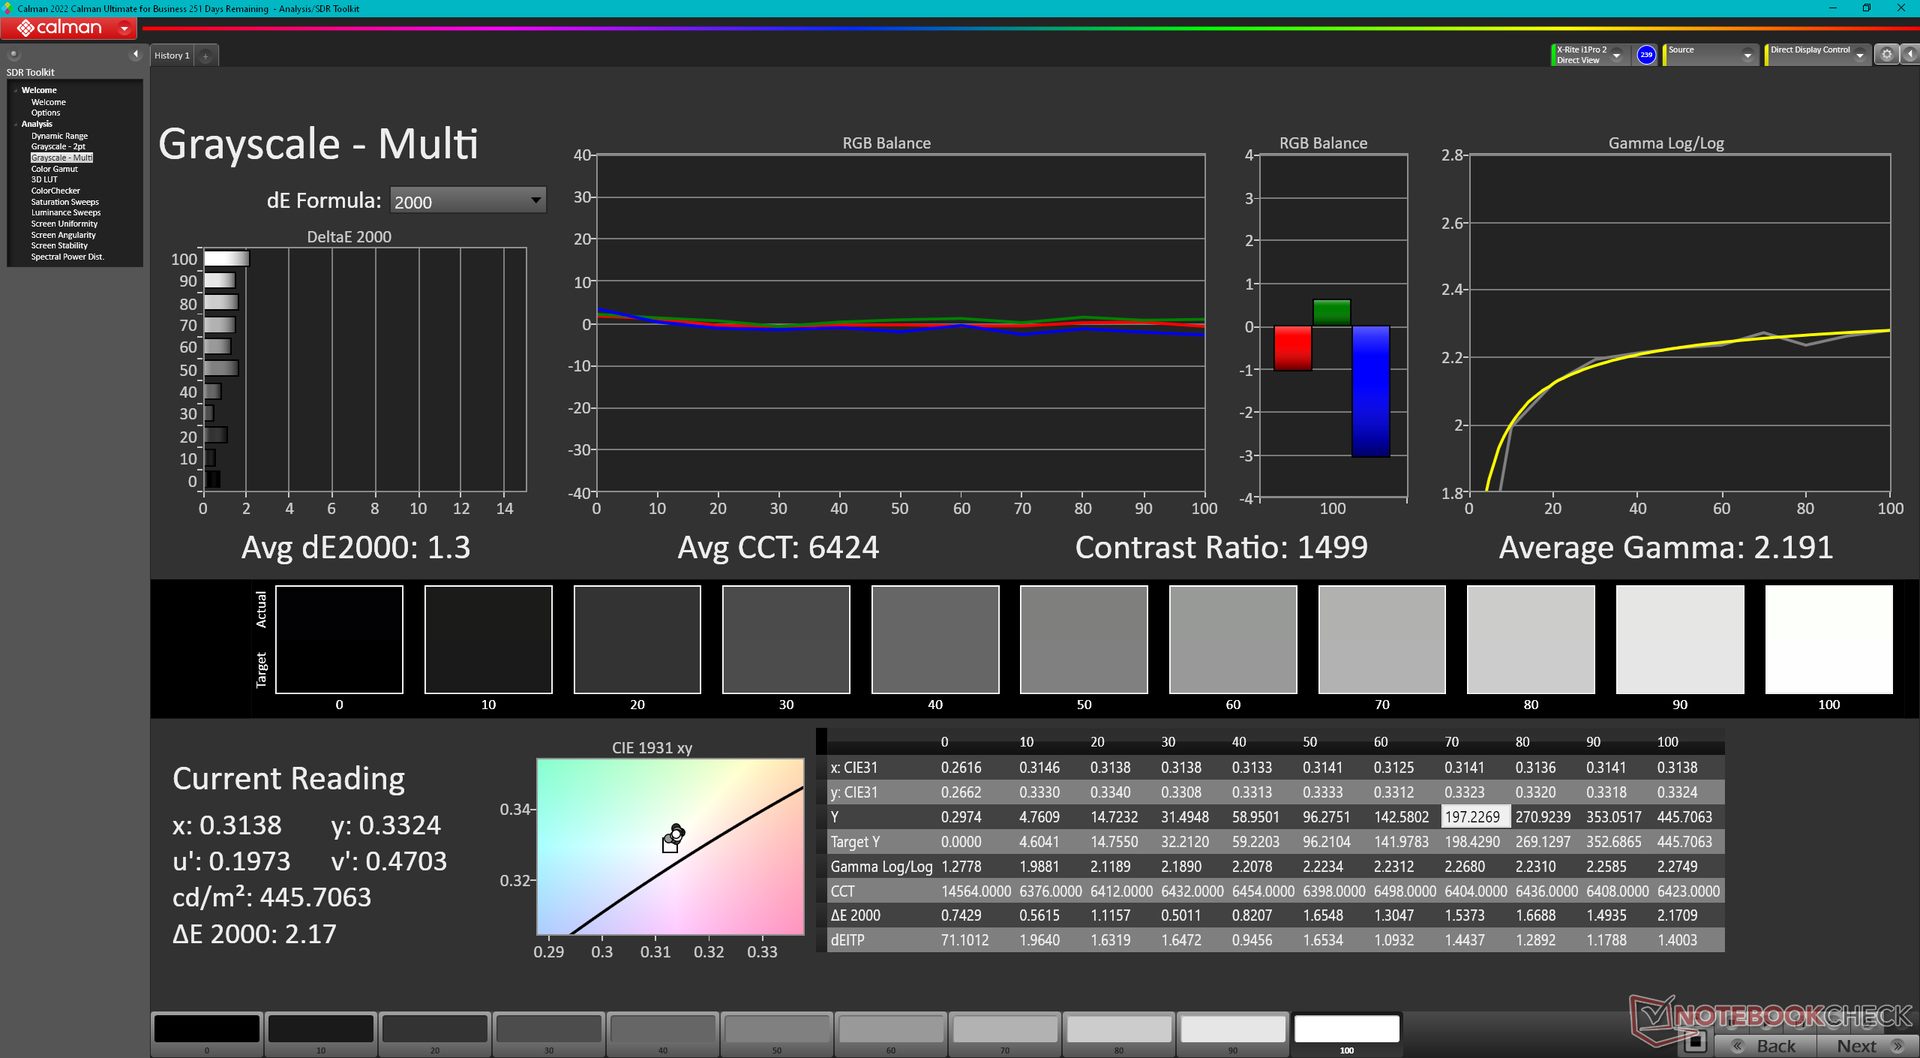
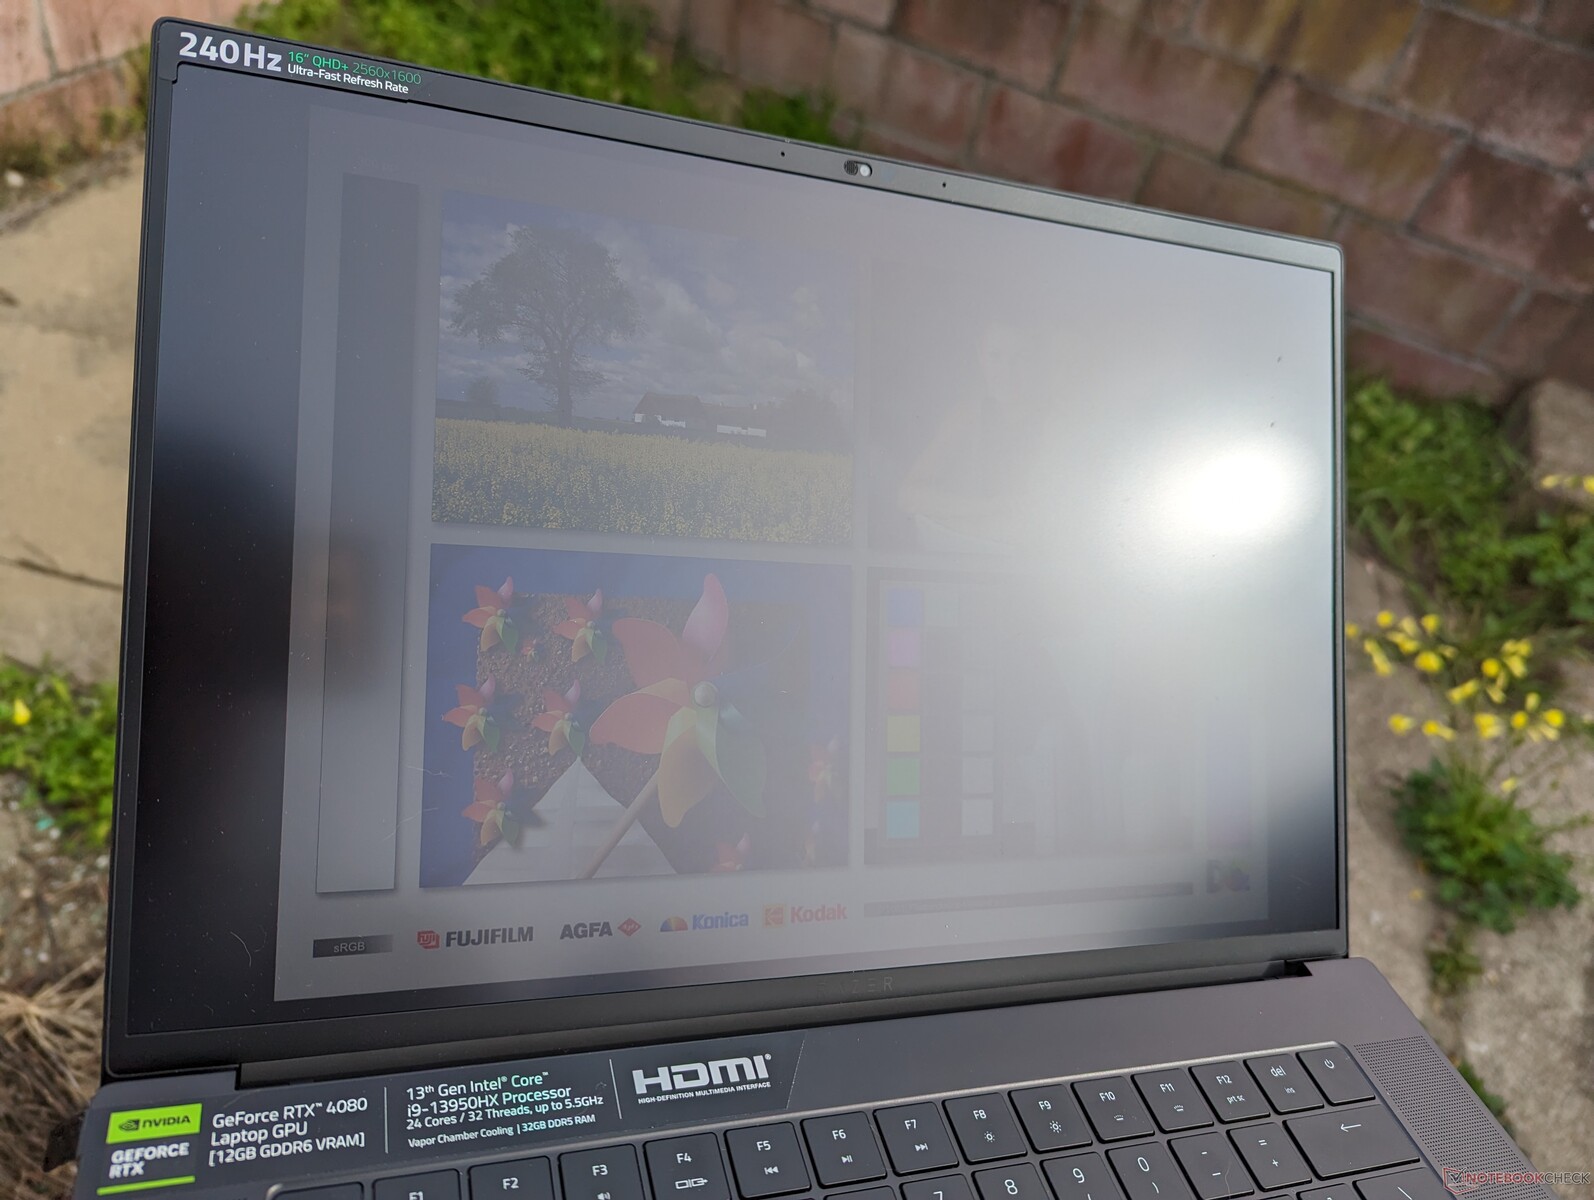
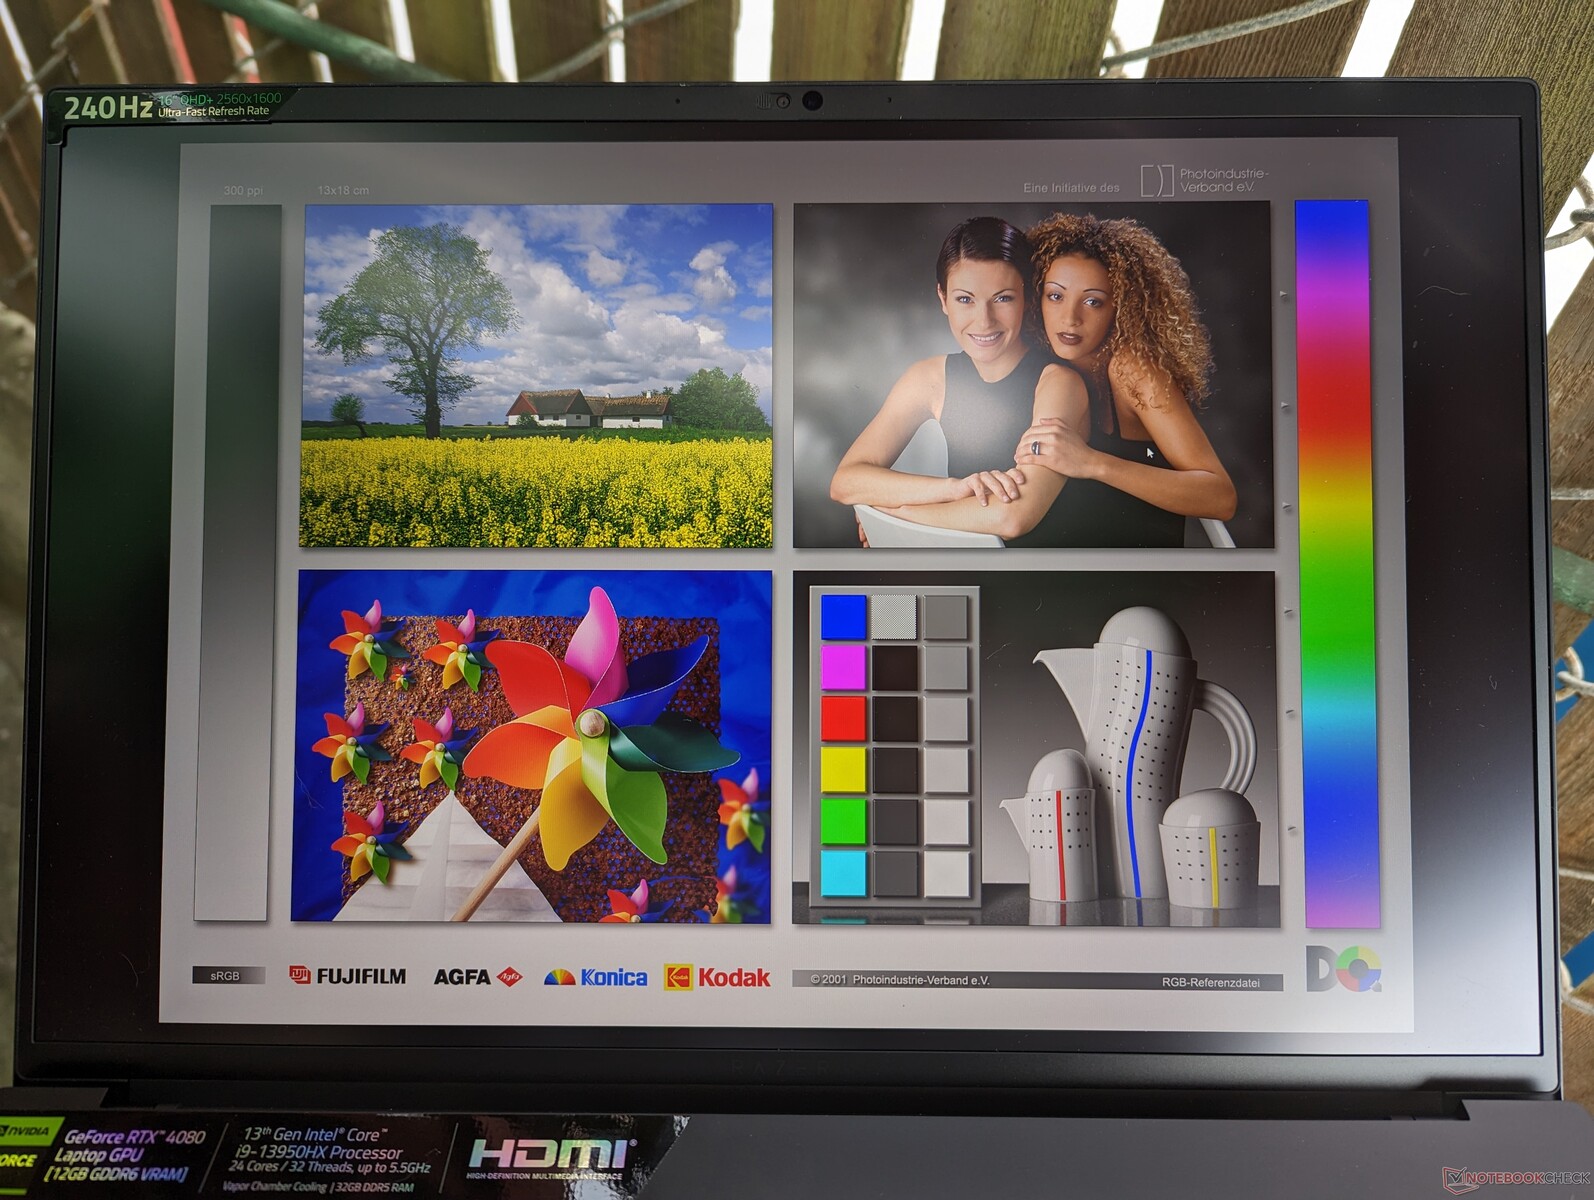
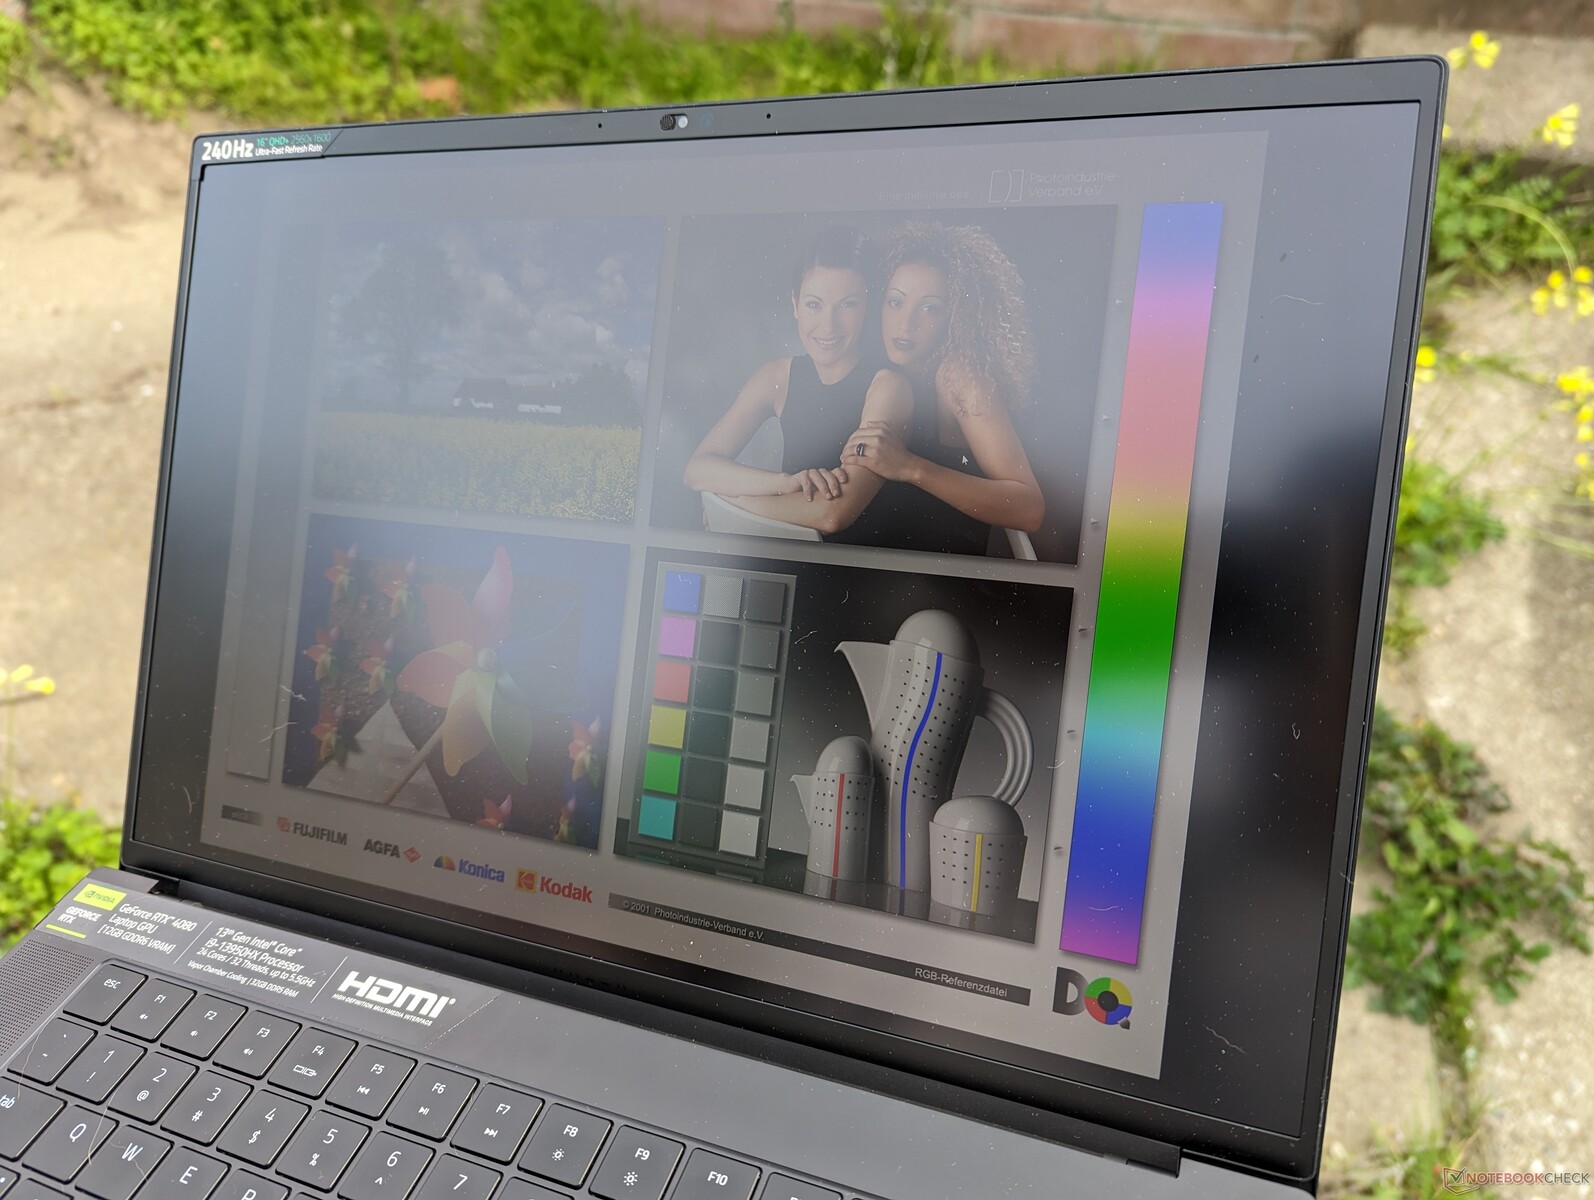
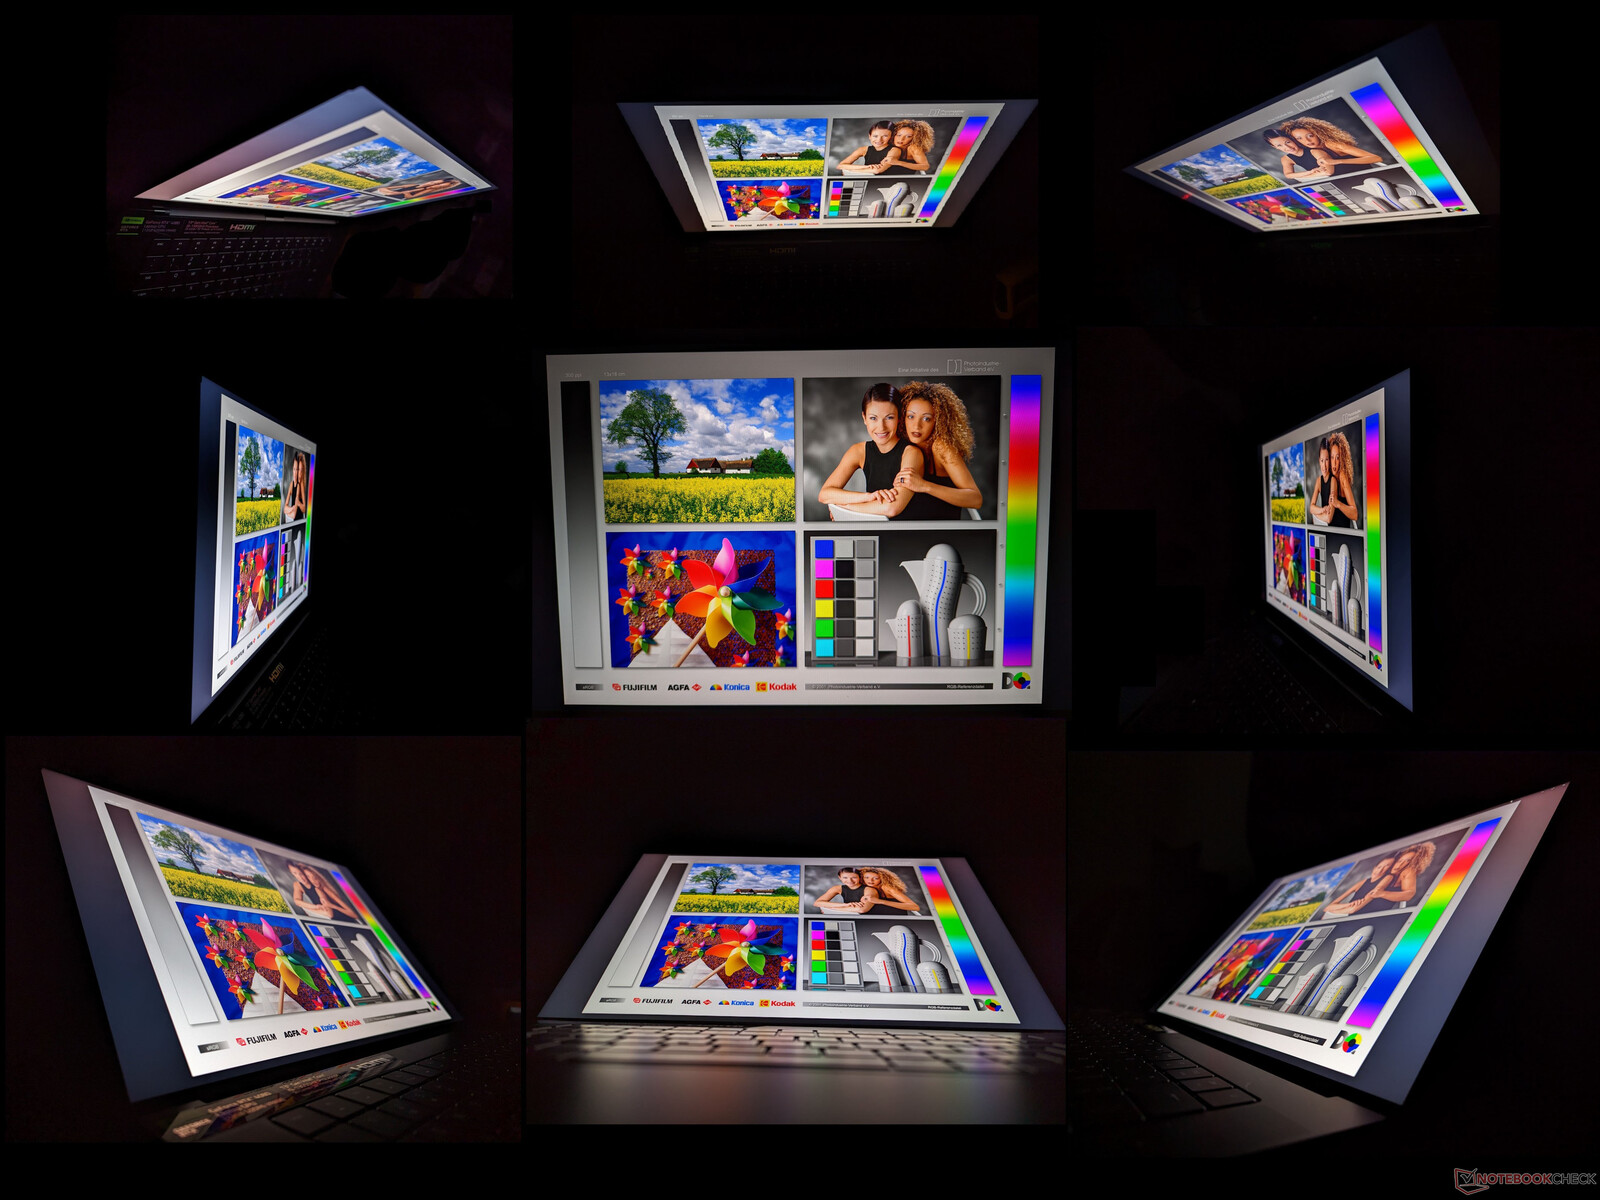
Display — IPS, 240 Hz, QHD+, 16:10, Full AdobeRGB
Two options are available both of which are matte and calibrated at factory:
- QHD+, 240 Hz, 100% DCI-P3, IPS
- Dual-mode (UHD+@120 Hz or FHD+@240 Hz), 100% DCI-P3, mini-LED
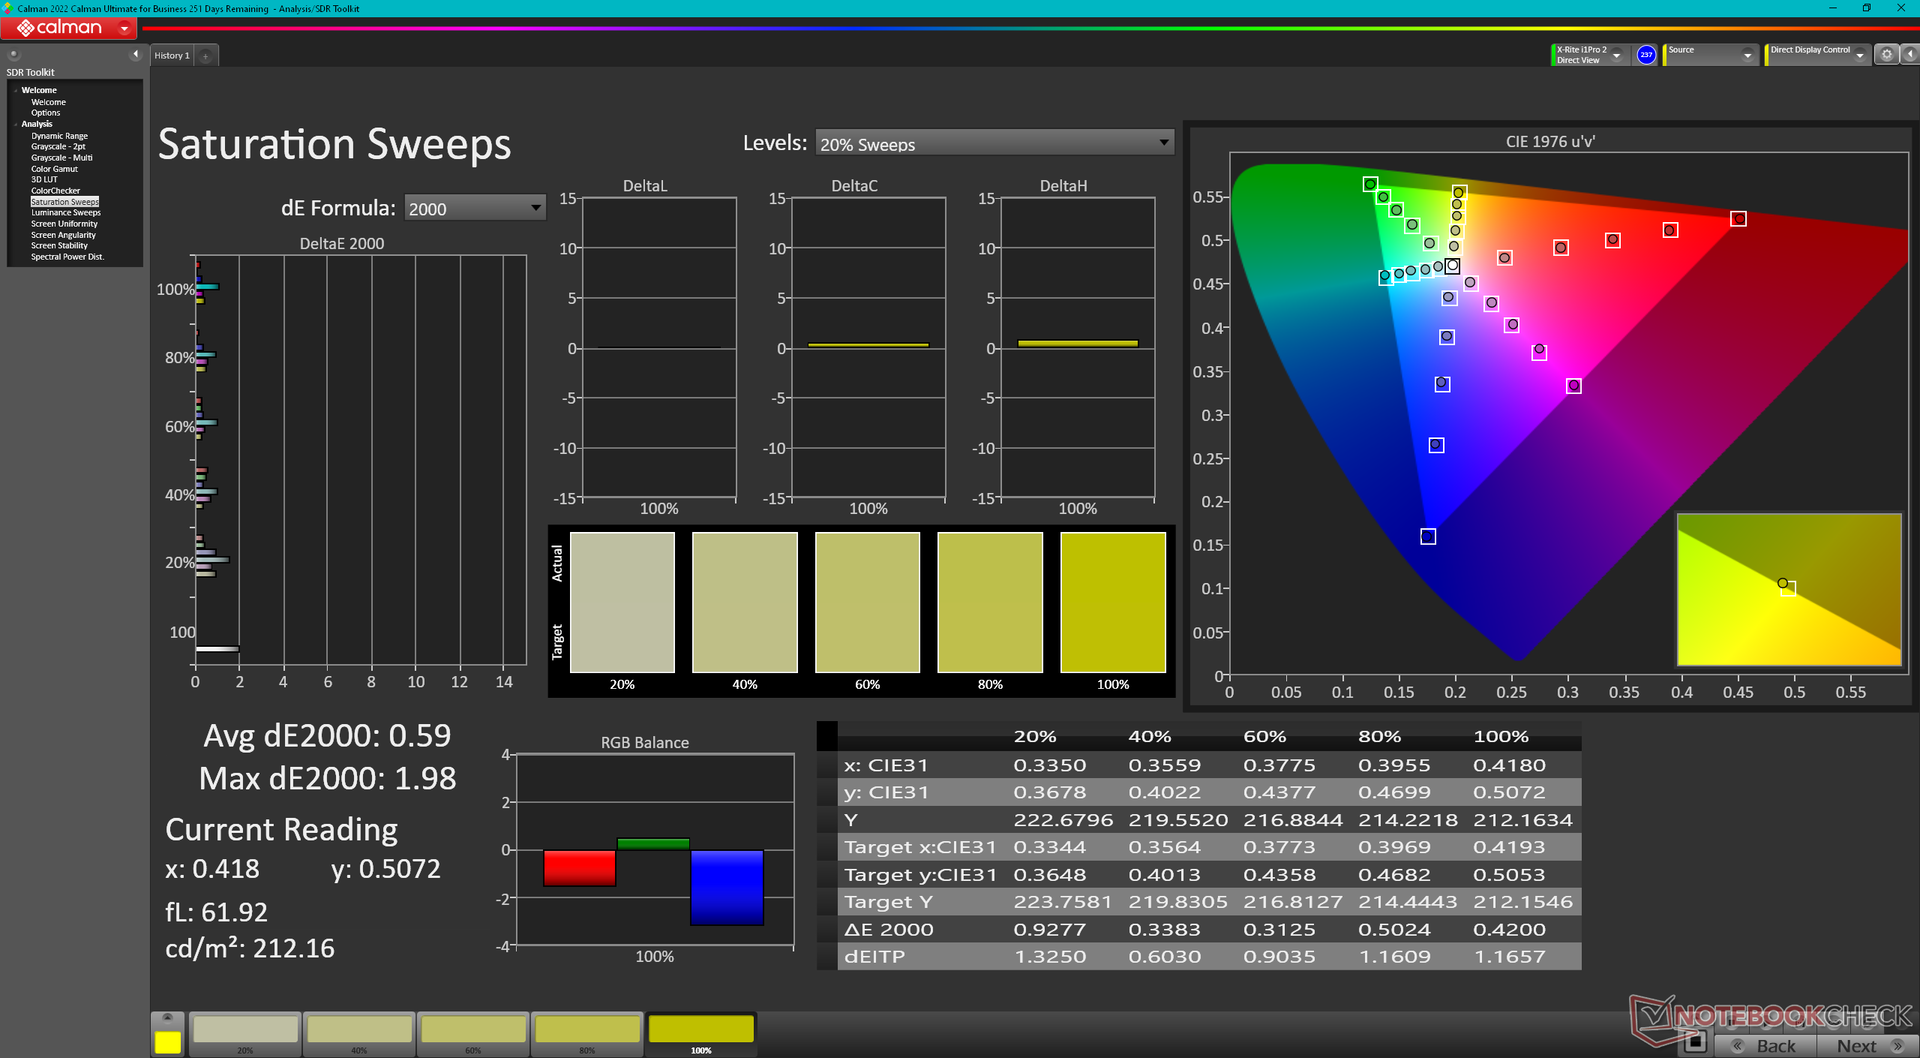
Our measurements below reflect only the bolded option above. The Blade 16 is the first 16-inch laptop to ship with a 240 Hz QHD+ IPS display offering both full DCI-P3 colors and fast black-white response times. Other 16-inch panels with full P3 colors exist, but they are all either UHD+ or OLED with slower native refresh rates. This particular panel is excellent for both gaming and graphics editing alike and we expect to see it on more Creator or Studio-type laptops in the near future.
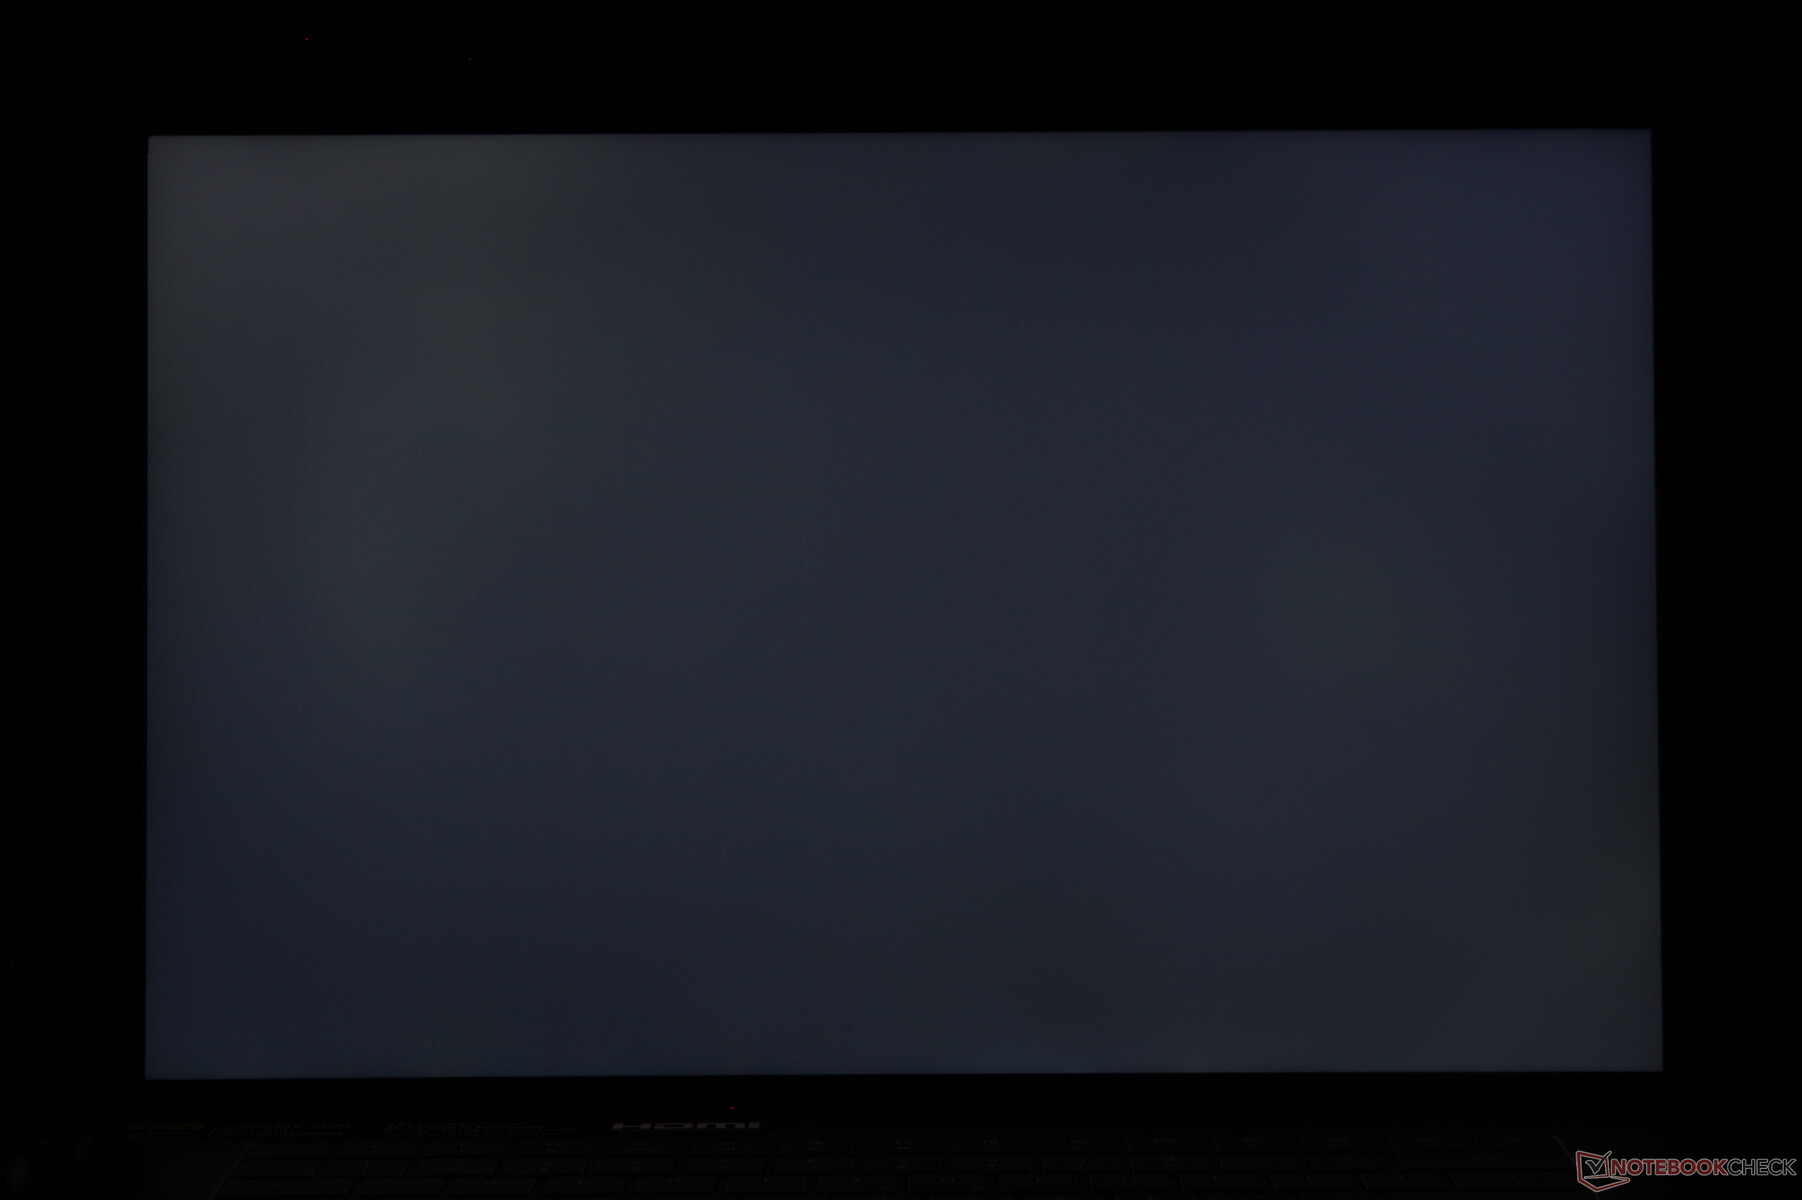
Brightness distribution could be better on our unit considering the high selling price. The bottom half of the screen is dimmer than the top half for a brightness distribution of only 83 percent. Upgrading to the mini-LED SKU will likely solve this minor issue, but the Blade 16 is already expensive as it is.

| |||||||||||||||||||||||||
Brightness Distribution: 83 %
Center on Battery: 456.8 cd/m²
Contrast: 1305:1 (Black: 0.35 cd/m²)
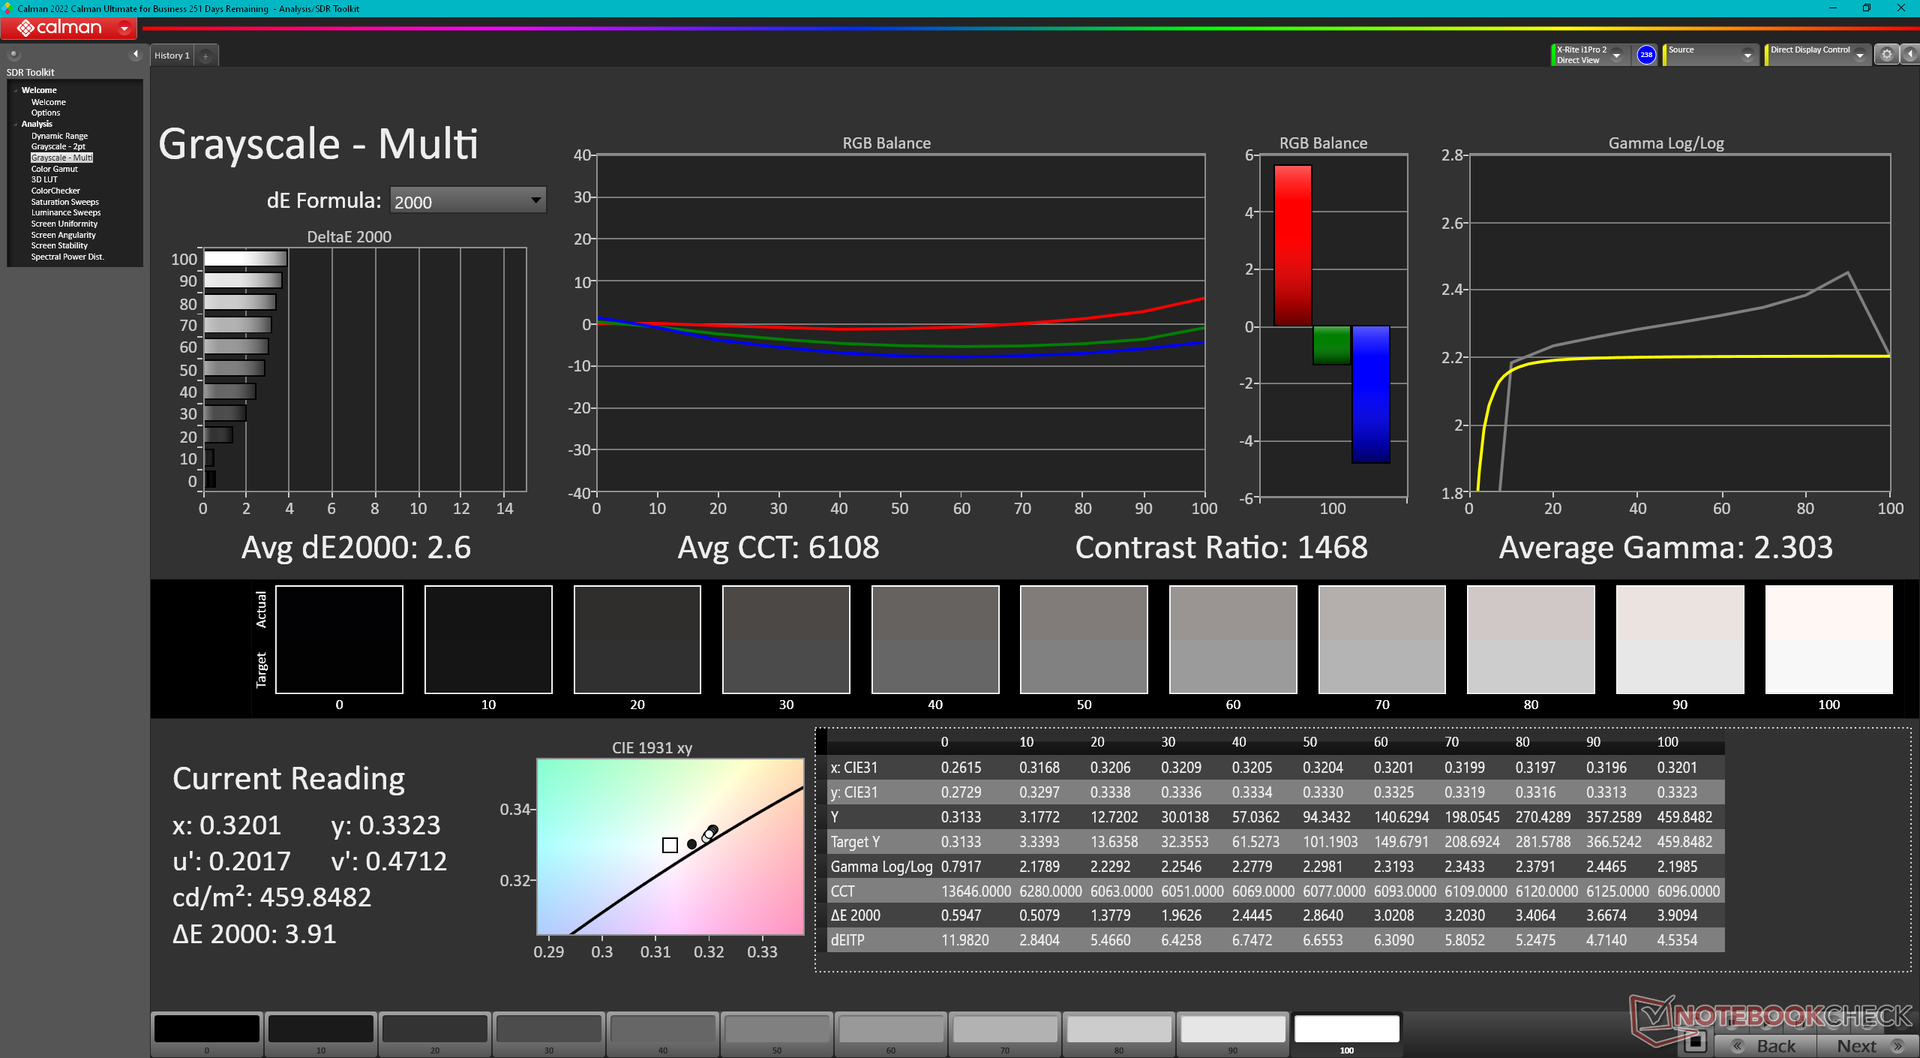
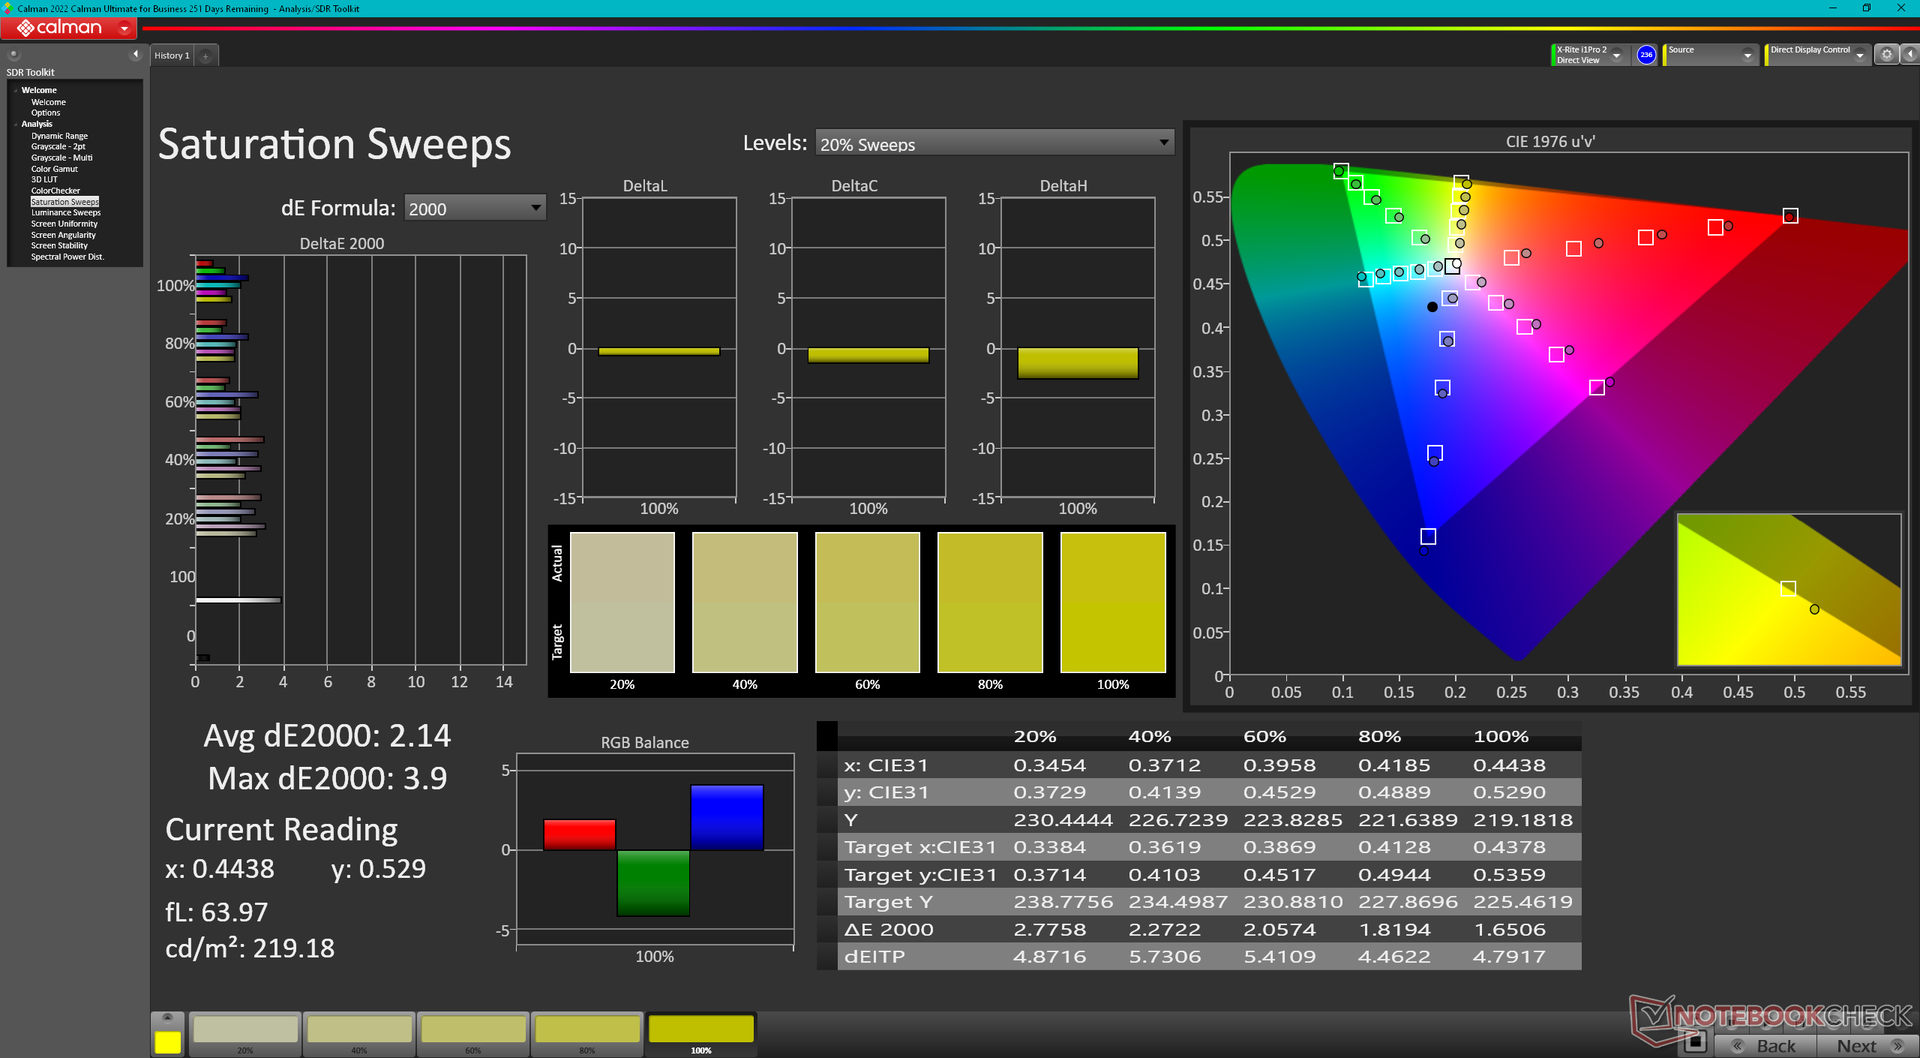
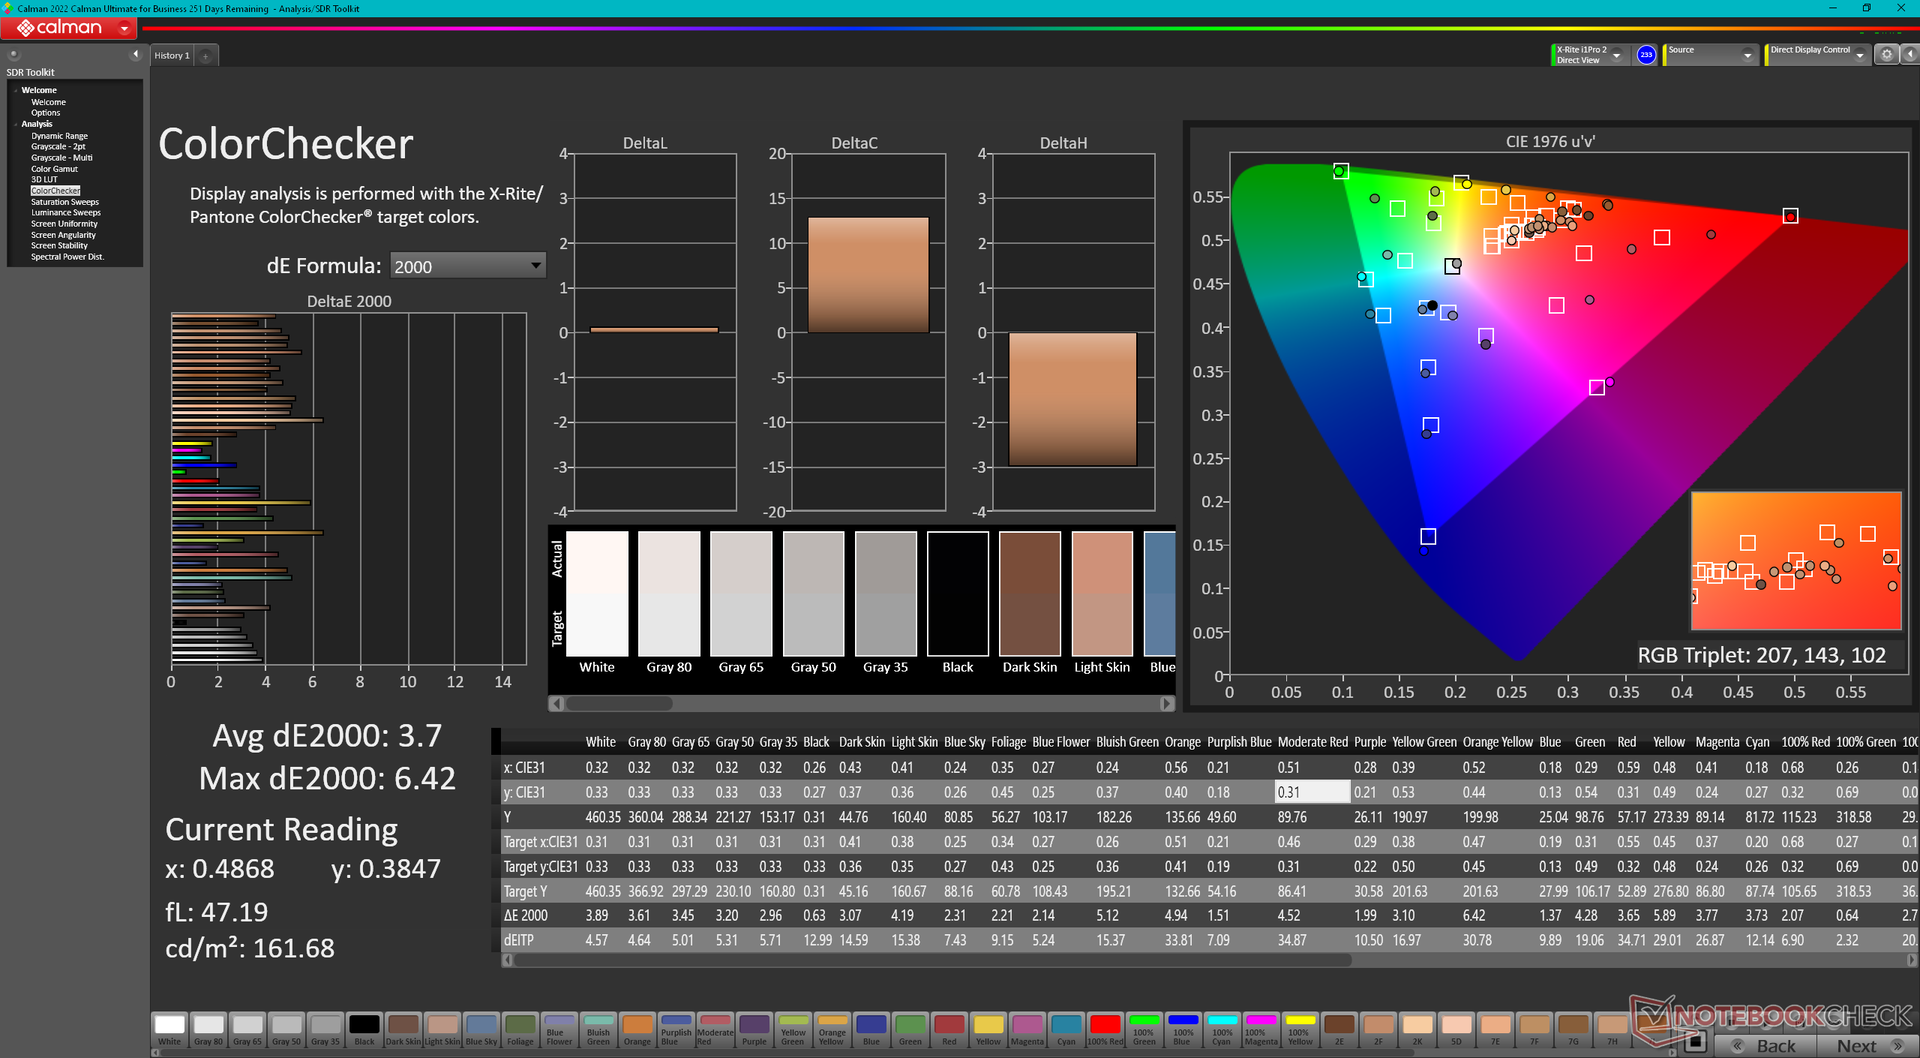
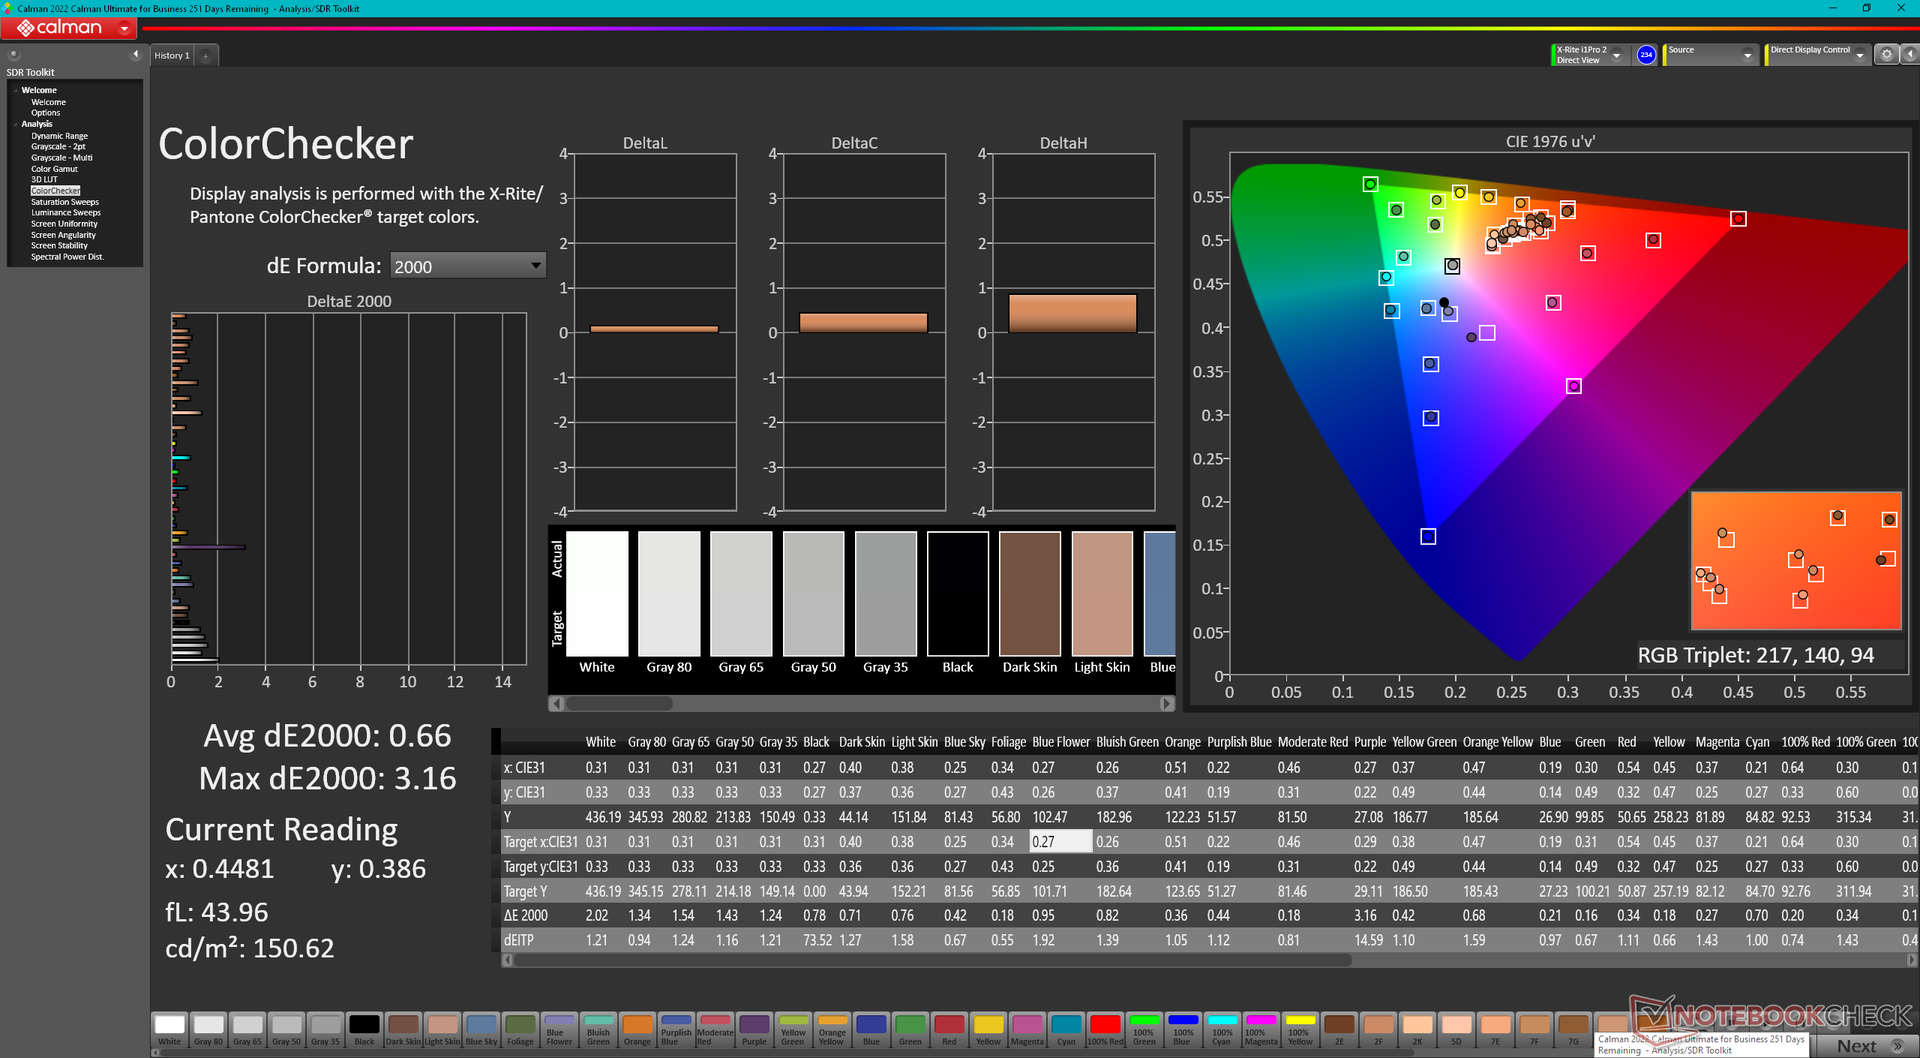
ΔE ColorChecker Argyll: 1.6 (Display P3) Calman: 3.7 | ∀{0.5-29.43 Ø4.73}
calibrated: 0.66
ΔE Greyscale Calman: 2.6 | ∀{0.09-98 Ø4.97}
89.7% AdobeRGB 1998 (Argyll 3D)
100% sRGB (Argyll 3D)
98.5% Display P3 (Argyll 3D)
Gamma: 2.3, Argyll: 98.5
CCT: 6108 K, Argyll: 6626 K
| Razer Blade 16 Early 2023 CSOT T3 MNG007DA4-1, IPS, 2560x1600, 16" | Razer Blade 15 Advanced Model Early 2022 TL156VDXP02-0, IPS, 1920x1080, 15.6" | Lenovo Legion S7 16ARHA7 BOE CQ NE160QDM-NY1, IPS, 2560x1600, 16" | Dell G16 7620 BOE NE16QDM, IPS, 2560x1600, 16" | Asus ROG Zephyrus Duo 16 GX650RX BOE NE160QAM-NX1, IPS-Level, 3840x2400, 16" | HP Omen 16-n0033dx BOE0AAE, IPS, 1920x1080, 16.1" | |
|---|---|---|---|---|---|---|
| Display | -25% | -17% | -18% | -2% | -14% | |
| Display P3 Coverage (%) | 98.5 | 65.3 -34% | 69.8 -29% | 68.3 -31% | 98 -1% | 74.4 -24% |
| sRGB Coverage (%) | 100 | 85.1 -15% | 98.1 -2% | 98 -2% | 99.9 0% | 99.2 -1% |
| AdobeRGB 1998 Coverage (%) | 89.7 | 67.4 -25% | 71.9 -20% | 70.5 -21% | 86.3 -4% | 73.4 -18% |
| Response Times | 24% | -30% | -9% | -34% | -80% | |
| Response Time Grey 50% / Grey 80% * (ms) | 6.6 ? | 4.3 ? 35% | 10 ? -52% | 8.6 ? -30% | 14.6 ? -121% | 17.6 ? -167% |
| Response Time Black / White * (ms) | 12 ? | 10.5 ? 12% | 12.8 ? -7% | 10.4 ? 13% | 5.6 ? 53% | 11.2 ? 7% |
| PWM Frequency (Hz) | ||||||
| Screen | 16% | 9% | -7% | -21% | -28% | |
| Brightness middle (cd/m²) | 456.8 | 330 -28% | 492.4 8% | 369.4 -19% | 459 0% | 373.3 -18% |
| Brightness (cd/m²) | 437 | 315 -28% | 471 8% | 348 -20% | 434 -1% | 361 -17% |
| Brightness Distribution (%) | 83 | 89 7% | 90 8% | 83 0% | 88 6% | 79 -5% |
| Black Level * (cd/m²) | 0.35 | 0.24 31% | 0.4 -14% | 0.32 9% | 0.44 -26% | 0.44 -26% |
| Contrast (:1) | 1305 | 1375 5% | 1231 -6% | 1154 -12% | 1043 -20% | 848 -35% |
| Colorchecker dE 2000 * | 3.7 | 1.47 60% | 1.9 49% | 1.78 52% | 2.97 20% | 2.12 43% |
| Colorchecker dE 2000 max. * | 6.42 | 2.73 57% | 3.81 41% | 4.41 31% | 8.13 -27% | 5.62 12% |
| Colorchecker dE 2000 calibrated * | 0.66 | 0.63 5% | 0.99 -50% | 1.22 -85% | 1.03 -56% | 2.06 -212% |
| Greyscale dE 2000 * | 2.6 | 1.8 31% | 1.7 35% | 3.2 -23% | 4.9 -88% | 2.5 4% |
| Gamma | 2.3 96% | 2.282 96% | 2.36 93% | 2.2 100% | 2.235 98% | 2.3 96% |
| CCT | 6108 106% | 6499 100% | 6497 100% | 6750 96% | 6775 96% | 6408 101% |
| Total Average (Program / Settings) | 5% /
8% | -13% /
-2% | -11% /
-10% | -19% /
-19% | -41% /
-33% |
* ... smaller is better
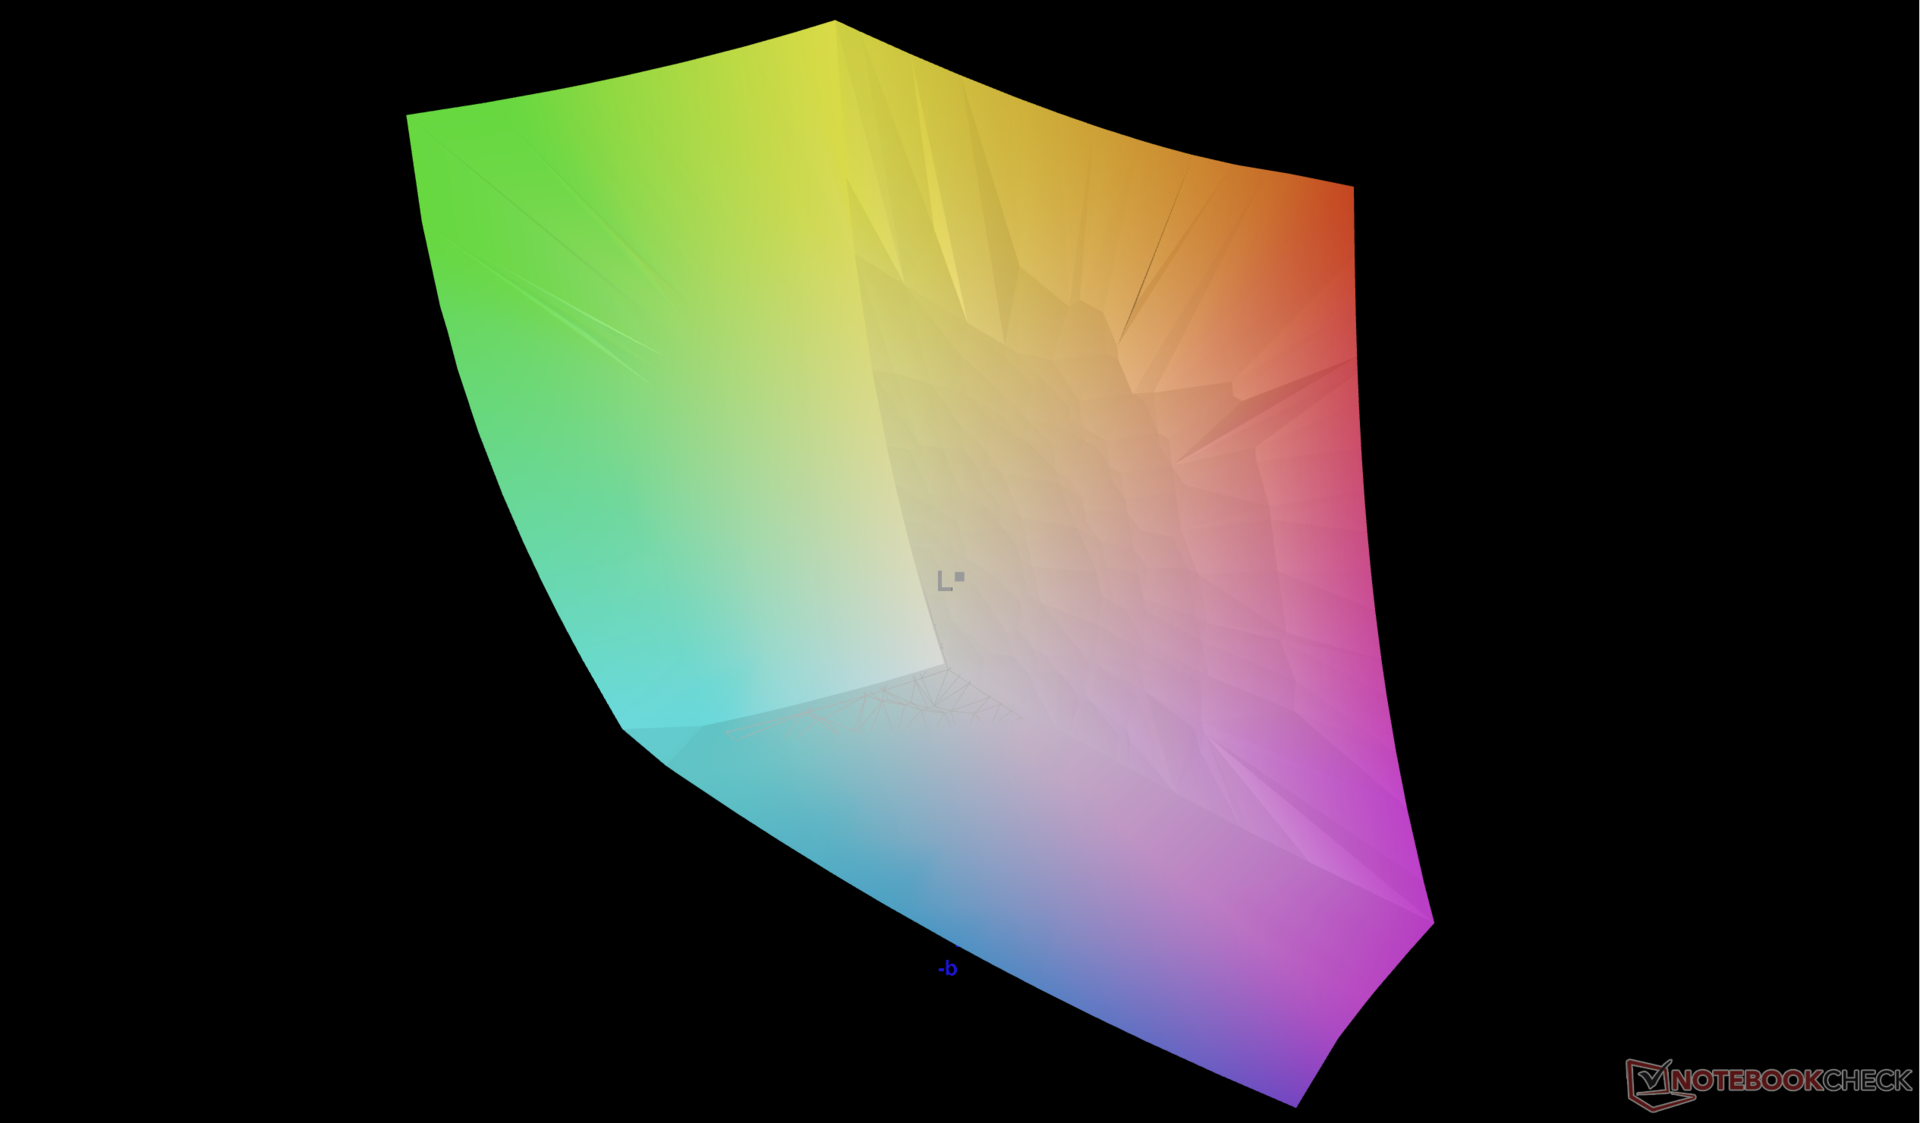
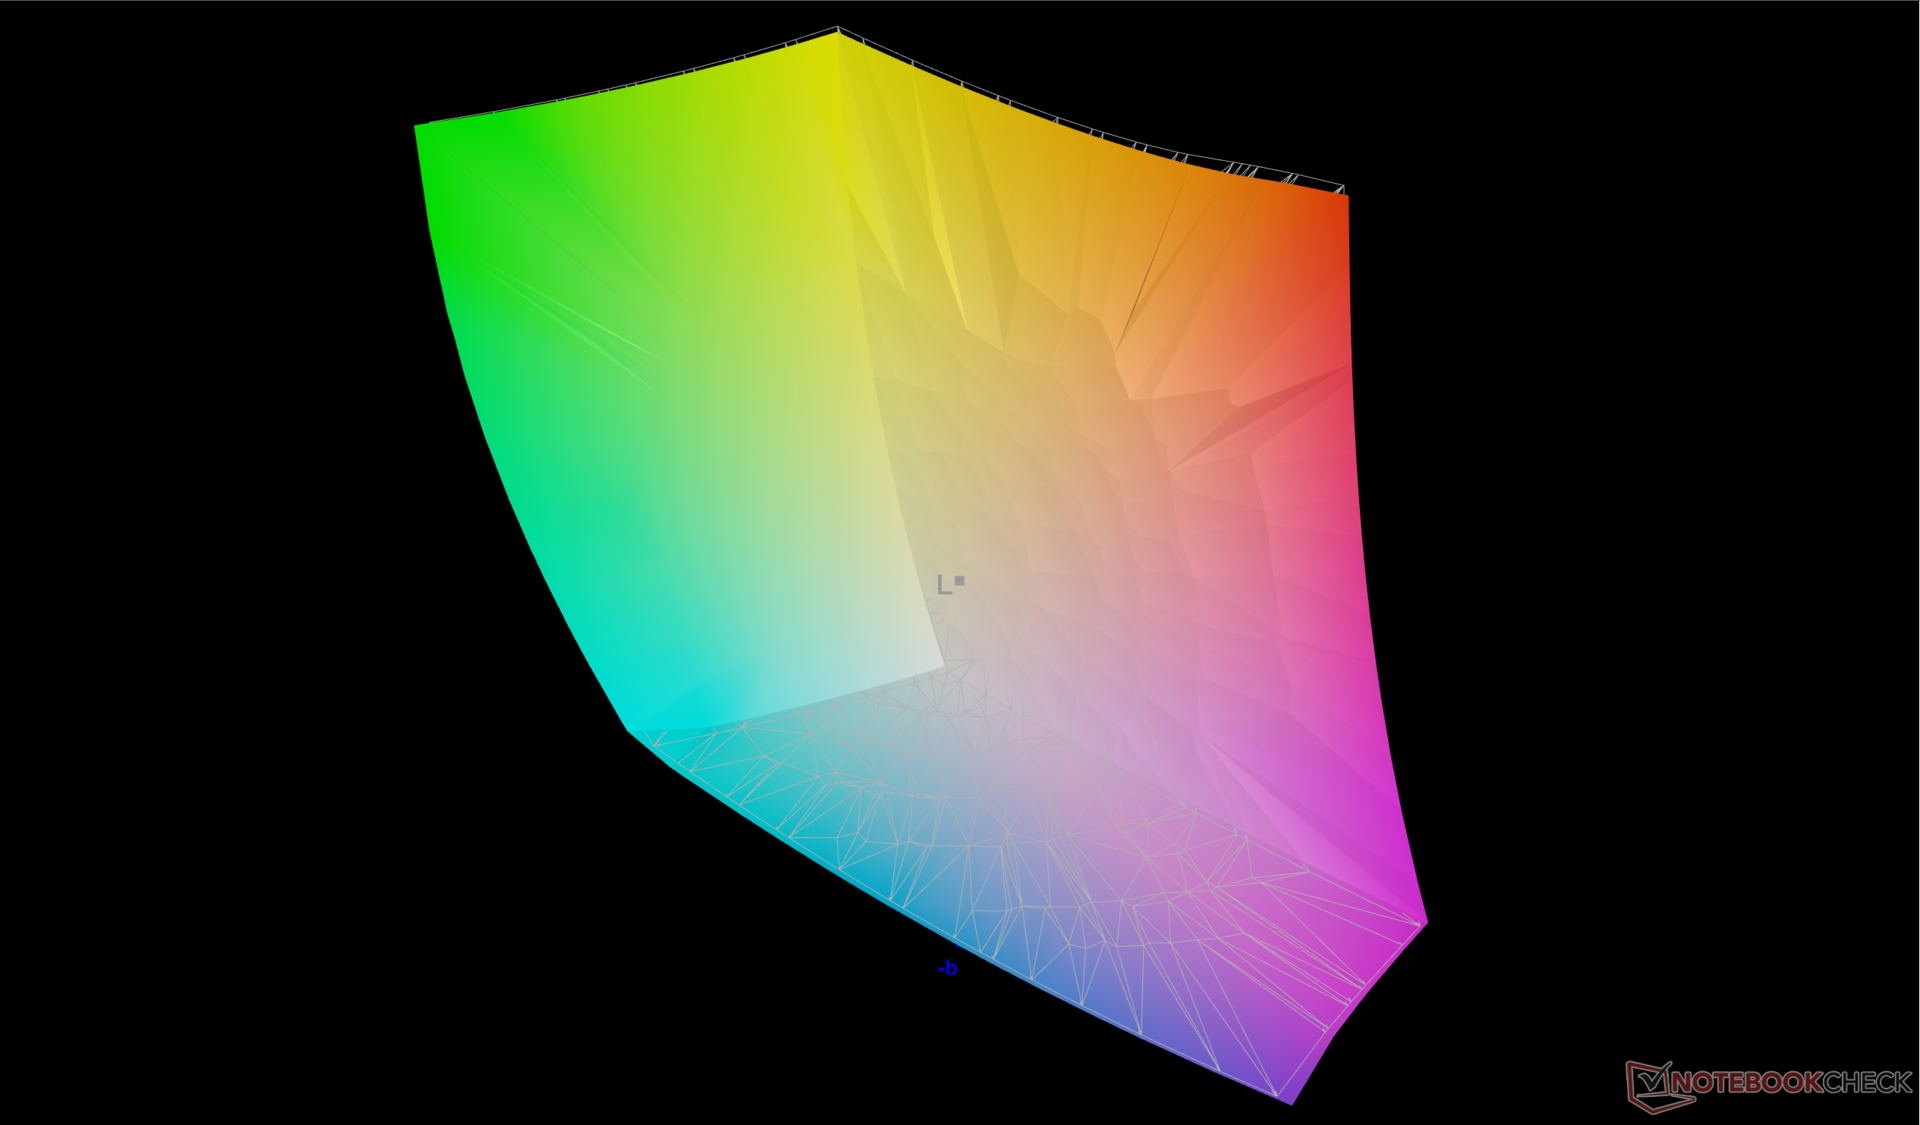
Our X-Rite colorimeter can confirm the full DCI-P3 colors, but the maximum brightness of 466 nits is shy of the 500-nit advertised by the manufacturer. Average grayscale and color deltaE values are nevertheless low at just 2.6 and 3.7, respectively, before any end-user calibration.
Display Response Times
| ↔ Response Time Black to White | ||
|---|---|---|
| 12 ms ... rise ↗ and fall ↘ combined | ↗ 6.8 ms rise | 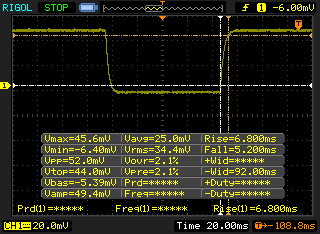 |
| ↘ 5.2 ms fall | ||
| The screen shows good response rates in our tests, but may be too slow for competitive gamers. In comparison, all tested devices range from 0.1 (minimum) to 240 (maximum) ms. » 31 % of all devices are better. This means that the measured response time is better than the average of all tested devices (19.9 ms). | ||
| ↔ Response Time 50% Grey to 80% Grey | ||
| 6.6 ms ... rise ↗ and fall ↘ combined | ↗ 3.4 ms rise | 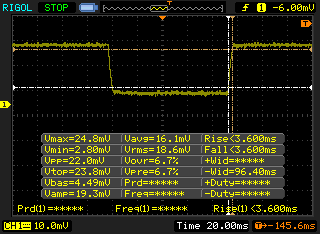 |
| ↘ 3.2 ms fall | ||
| The screen shows very fast response rates in our tests and should be very well suited for fast-paced gaming. In comparison, all tested devices range from 0.165 (minimum) to 636 (maximum) ms. » 19 % of all devices are better. This means that the measured response time is better than the average of all tested devices (31.1 ms). | ||
Screen Flickering / PWM (Pulse-Width Modulation)
| Screen flickering / PWM not detected | 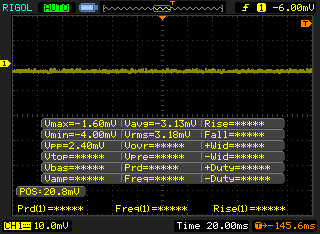 | ||
In comparison: 52 % of all tested devices do not use PWM to dim the display. If PWM was detected, an average of 7798 (minimum: 5 - maximum: 343500) Hz was measured. | |||
Outdoor visibility is decent if under shade as brighter conditions will wash out the screen. The ~450 nit display is brighter than the 1080p panels on the Blade 15 or Omen 16 while being on par with the UHD+ and QHD+ displays of the Zephyrus Duo 16 and Lenovo Legion S7 16, respectively. Cheaper gaming laptops tend to average around 300 nits at best in comparison.
Performance — 13th Gen Intel + Nvidia Ada Lovelace
Testing Conditions
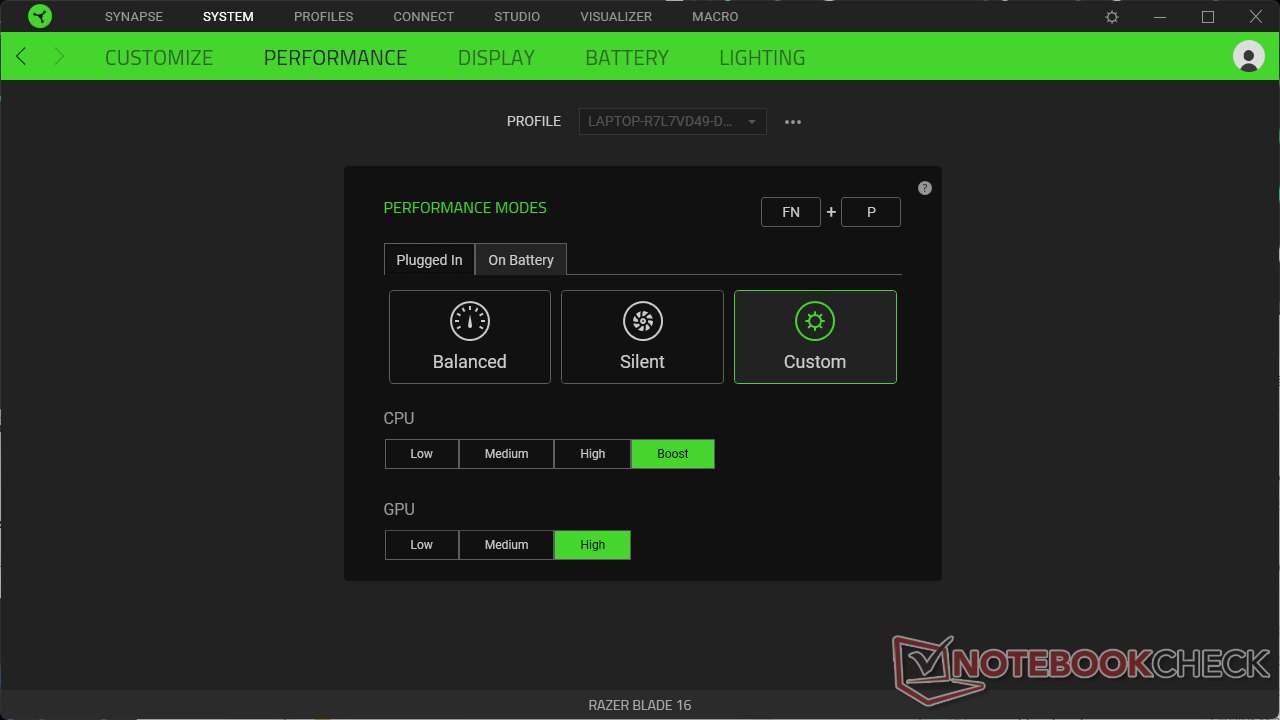
We set our unit to Performance mode via Windows and dGPU mode via the Nvidia Control Panel prior to running any benchmarks below. We also made sure to set the Razer Synapse profile to Custom with the CPU and GPU to Boost and High, respectively, which should be the fastest settings available. It's recommended that owners become familiar with Synapse as it the central hub for Razer settings as shown by a few screenshots below.
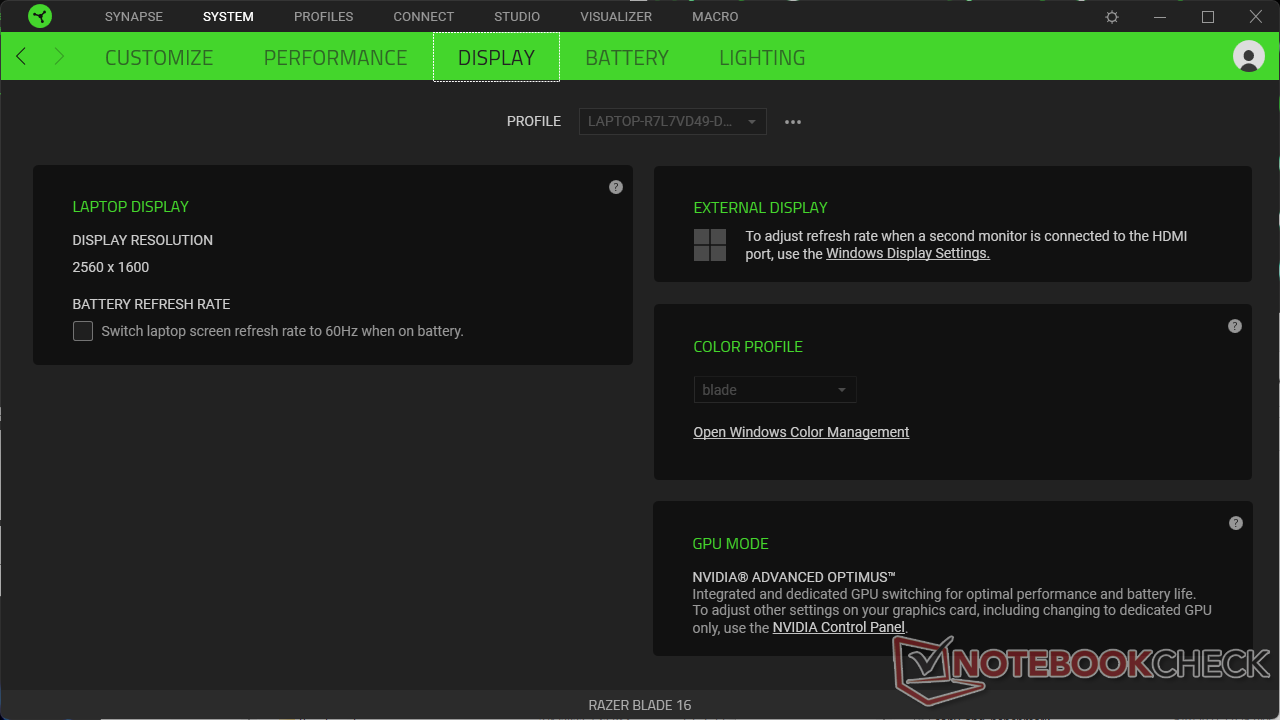
Advanced Optimus comes standard meaning users can switch between Optimus and discrete graphics on the fly via the Nvidia Control Panel without needing a soft reboot. G-Sync is supported albeit only on dGPU mode. Keep in mind that Optimus mode must be enabled at all times if any external monitors are connected.
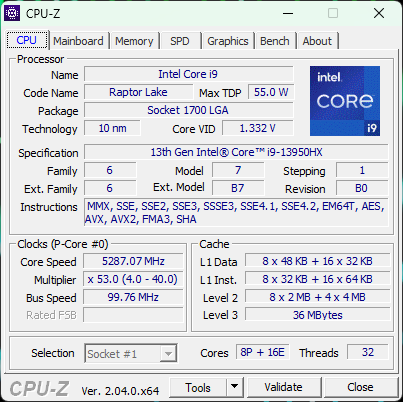
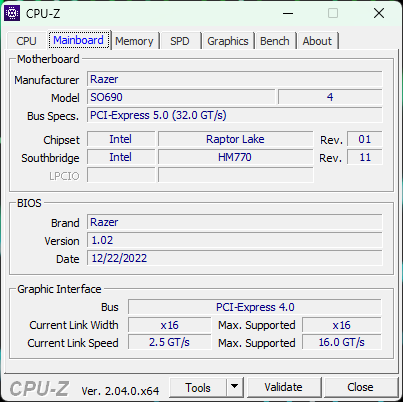
Processor
Our 13th gen Core i9-13950HX is about 30 percent faster than the previous generation champion the Core i9-12900HX. Performance sustainability is excellent as well when running CineBench R15 xT in a loop as shown by our comparison graph below. Results are significantly faster than any 2022 or older Blade 15 or Blade 17 especially since the 2022 Blade 15 had a severely underperforming Core i7-12800H.
On the other hand, single-thread performance has remained flat gen-over-gen. Your applications will have to exploit as many cores and threads as possible to make the most of the 13th gen CPU.
AMD's current fastest mobile CPU, the Zen 3+ Ryzen 9 6900HX, is almost 2x slower than our Core i9-13950HX in multi-threaded applications. All eyes will be on mobile Zen 4 when it launches later this year as it will compete directly with the mobile Raptor Lake series.
Cinebench R15 Multi Loop
Cinebench R23: Multi Core | Single Core
Cinebench R20: CPU (Multi Core) | CPU (Single Core)
Cinebench R15: CPU Multi 64Bit | CPU Single 64Bit
Blender: v2.79 BMW27 CPU
7-Zip 18.03: 7z b 4 | 7z b 4 -mmt1
Geekbench 5.5: Multi-Core | Single-Core
HWBOT x265 Benchmark v2.2: 4k Preset
LibreOffice : 20 Documents To PDF
R Benchmark 2.5: Overall mean
* ... smaller is better
AIDA64: FP32 Ray-Trace | FPU Julia | CPU SHA3 | CPU Queen | FPU SinJulia | FPU Mandel | CPU AES | CPU ZLib | FP64 Ray-Trace | CPU PhotoWorxx
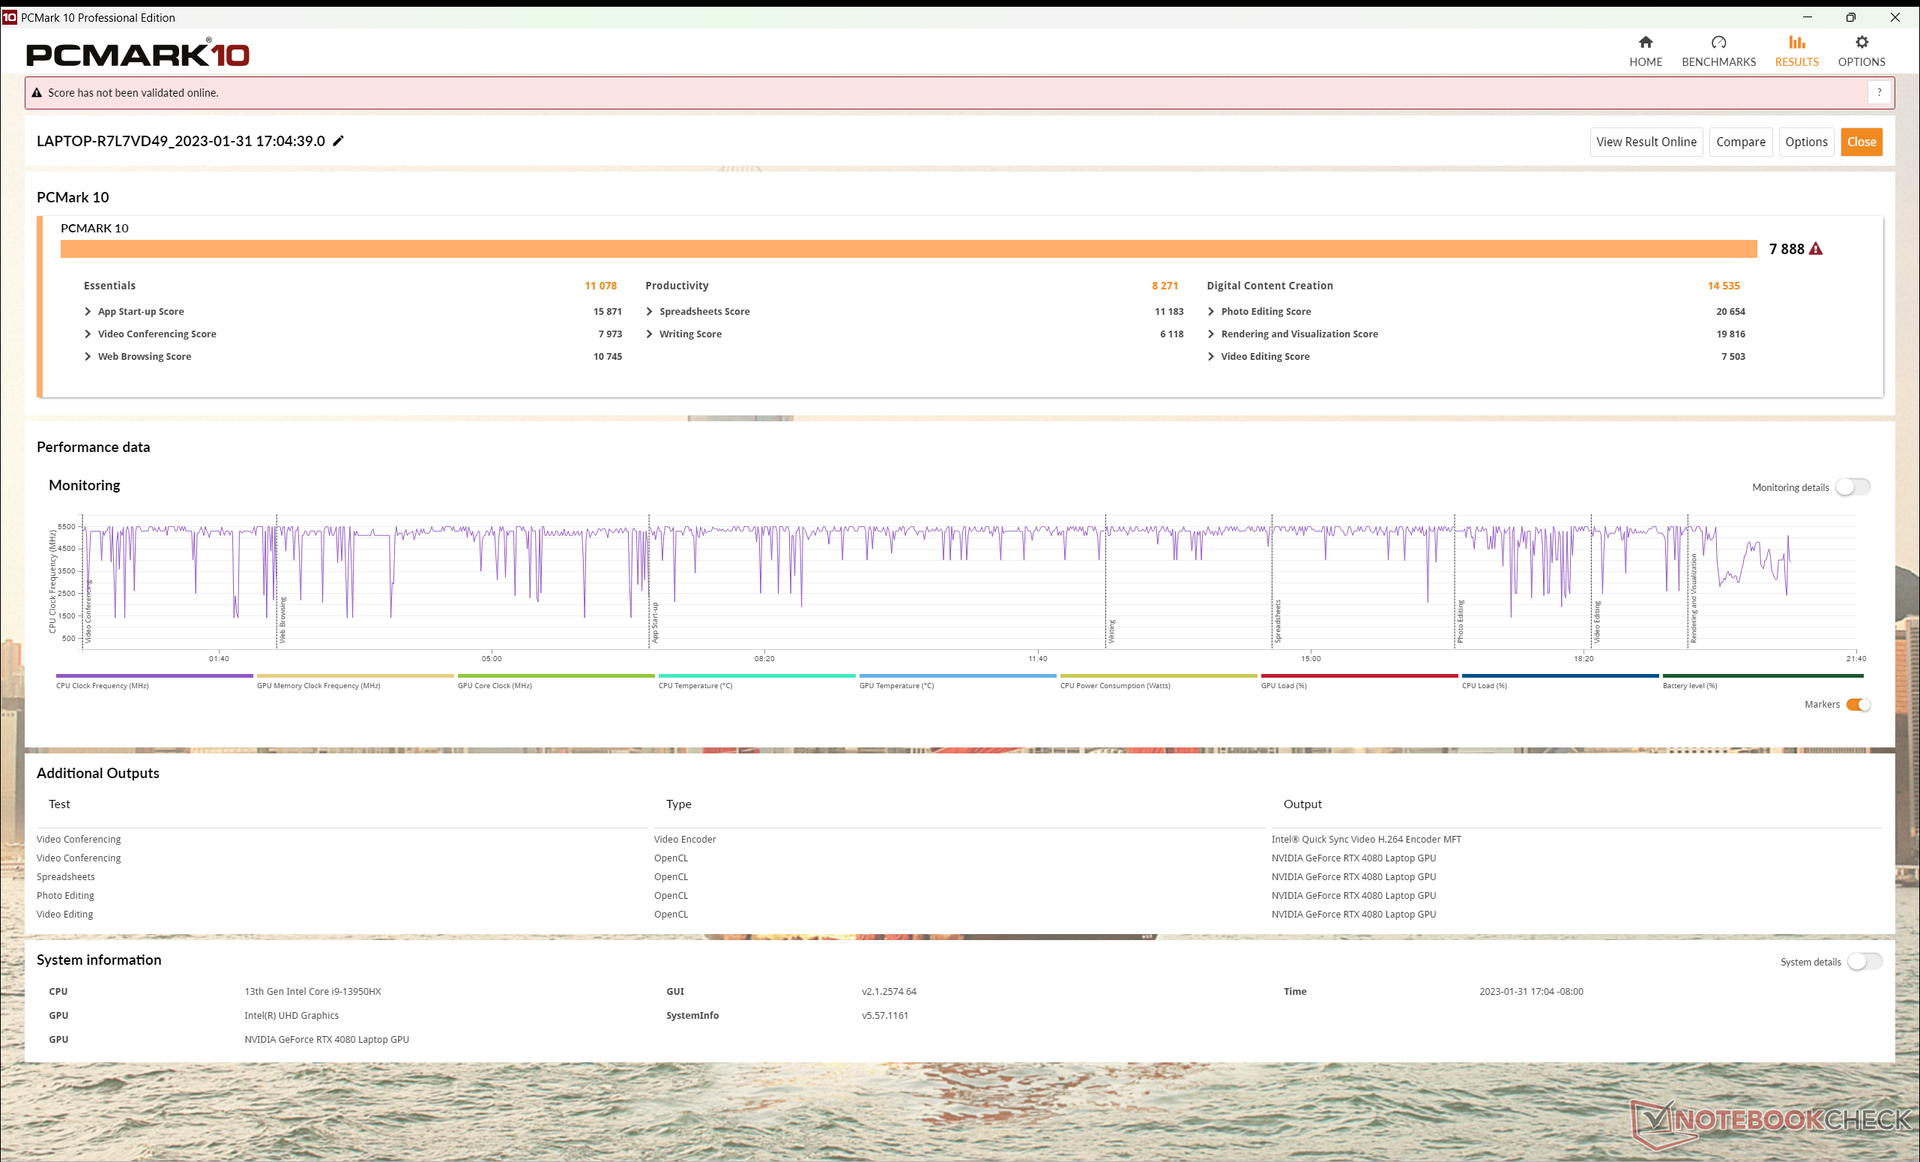
System Performance
PCMark 10 scores are higher than previous generation Blade models on average even if the differences are slight. Gaming laptops with the faster Samsung PM9A1 like the MSI GE67 HX may still have an edge particularly in the Productivity subtest.
CrossMark: Overall | Productivity | Creativity | Responsiveness
| PCMark 10 Score | 7888 points | |
Help | ||
| AIDA64 / Memory Copy | |
| Razer Blade 16 Early 2023 | |
| Razer Blade 16 Early 2023 | |
| Razer Blade 16 Early 2023 | |
| Average Intel Core i9-13950HX (61938 - 78813, n=9) | |
| Average of class Gaming (21750 - 129946, n=109, last 2 years) | |
| Razer Blade 15 Advanced Model Early 2022 | |
| Dell G16 7620 | |
| Asus ROG Zephyrus Duo 16 GX650RX | |
| MSI GE67 HX 12UGS | |
| Lenovo Legion S7 16ARHA7 | |
| HP Omen 16-n0033dx | |
| Razer Blade 17 (i7-12800H, RTX 3070 Ti) | |
| AIDA64 / Memory Read | |
| Razer Blade 16 Early 2023 | |
| Razer Blade 16 Early 2023 | |
| Razer Blade 16 Early 2023 | |
| Average Intel Core i9-13950HX (62368 - 86831, n=9) | |
| Average of class Gaming (22956 - 118858, n=109, last 2 years) | |
| Dell G16 7620 | |
| Razer Blade 15 Advanced Model Early 2022 | |
| MSI GE67 HX 12UGS | |
| Razer Blade 17 (i7-12800H, RTX 3070 Ti) | |
| Asus ROG Zephyrus Duo 16 GX650RX | |
| Lenovo Legion S7 16ARHA7 | |
| HP Omen 16-n0033dx | |
| AIDA64 / Memory Write | |
| Razer Blade 16 Early 2023 | |
| Razer Blade 16 Early 2023 | |
| Razer Blade 16 Early 2023 | |
| Average of class Gaming (22297 - 135096, n=109, last 2 years) | |
| Average Intel Core i9-13950HX (59501 - 80441, n=9) | |
| Razer Blade 15 Advanced Model Early 2022 | |
| MSI GE67 HX 12UGS | |
| Asus ROG Zephyrus Duo 16 GX650RX | |
| Dell G16 7620 | |
| Lenovo Legion S7 16ARHA7 | |
| HP Omen 16-n0033dx | |
| Razer Blade 17 (i7-12800H, RTX 3070 Ti) | |
| AIDA64 / Memory Latency | |
| Average of class Gaming (75.3 - 259, n=109, last 2 years) | |
| Dell G16 7620 | |
| Razer Blade 16 Early 2023 | |
| Razer Blade 16 Early 2023 | |
| Razer Blade 16 Early 2023 | |
| MSI GE67 HX 12UGS | |
| Razer Blade 15 Advanced Model Early 2022 | |
| Asus ROG Zephyrus Duo 16 GX650RX | |
| Average Intel Core i9-13950HX (84.4 - 99.5, n=9) | |
| HP Omen 16-n0033dx | |
| Lenovo Legion S7 16ARHA7 | |
| Razer Blade 17 (i7-12800H, RTX 3070 Ti) | |
* ... smaller is better
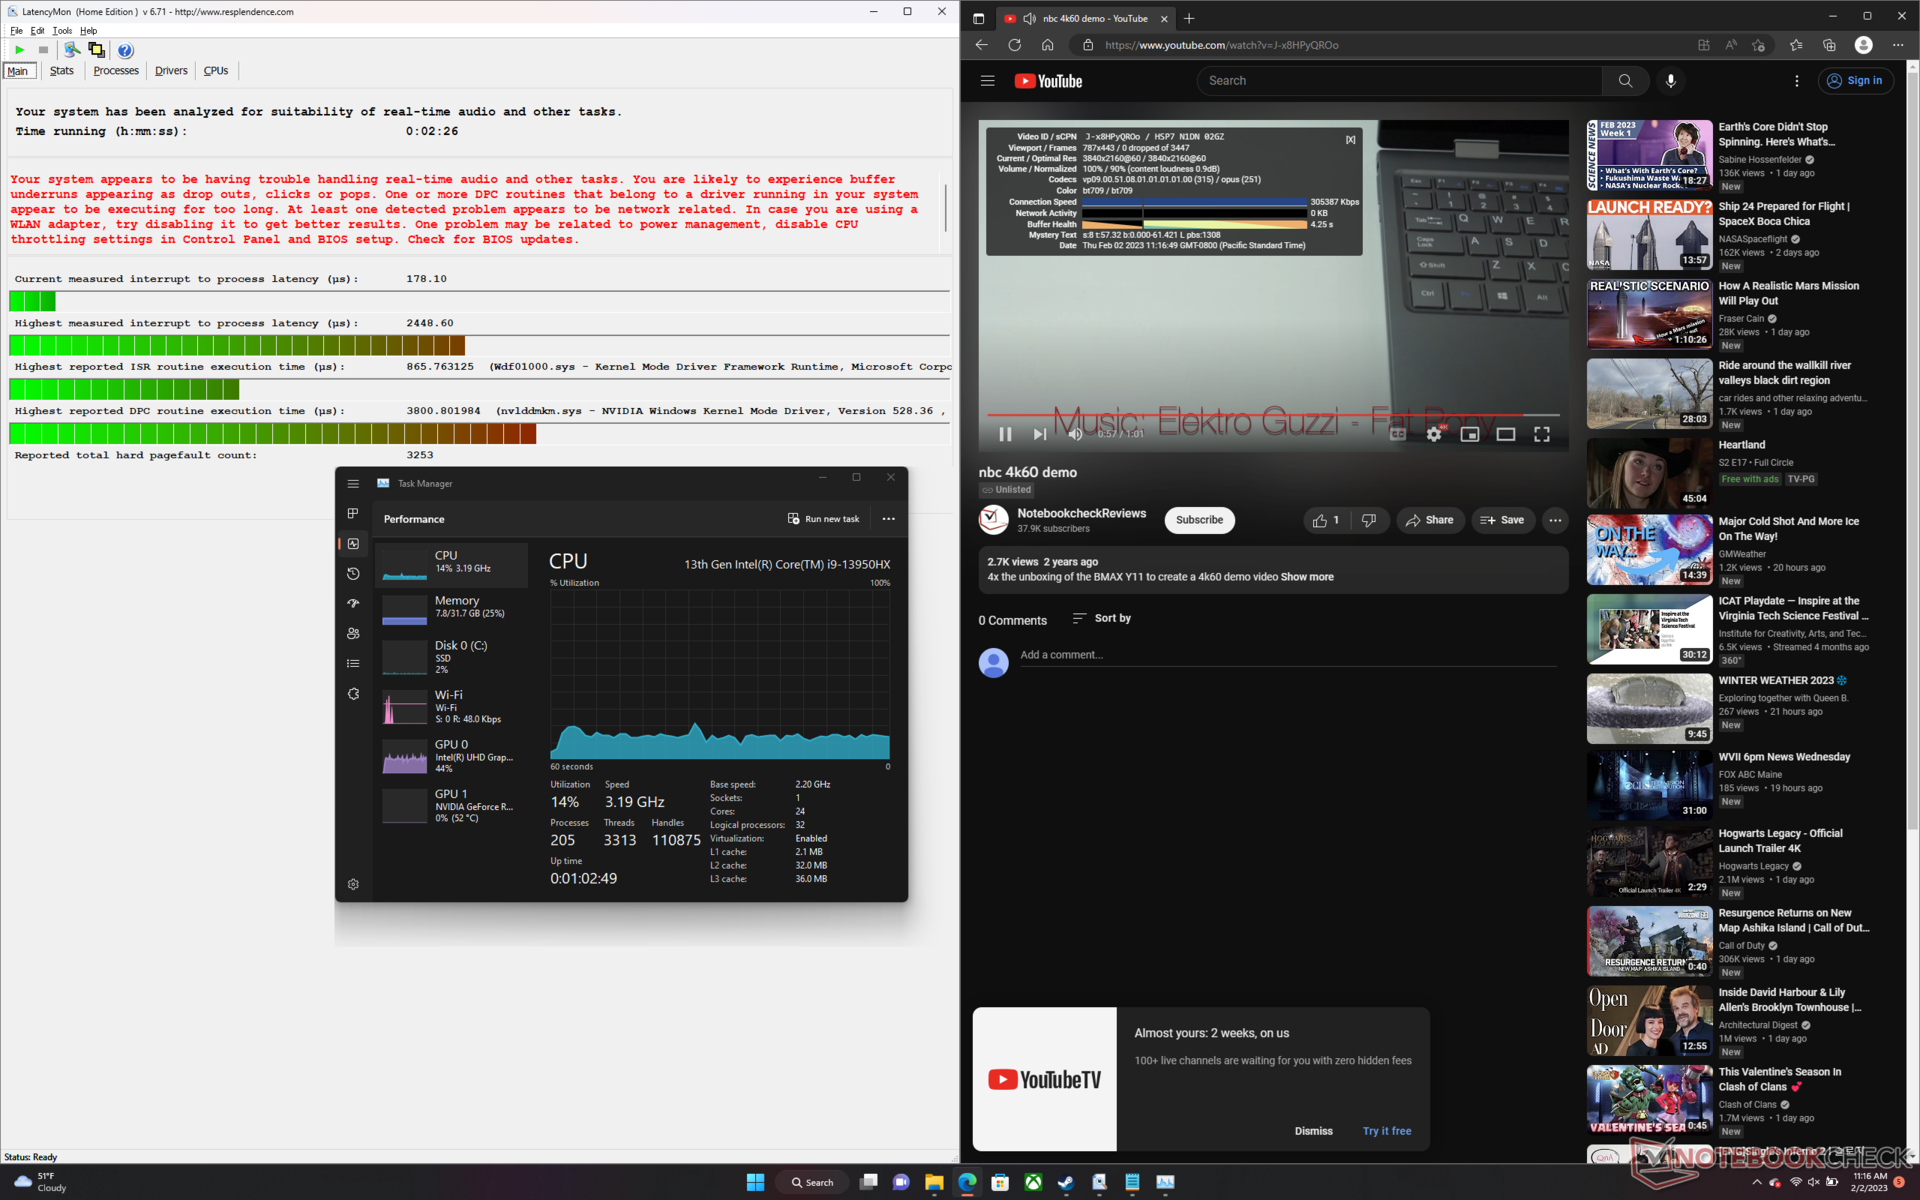
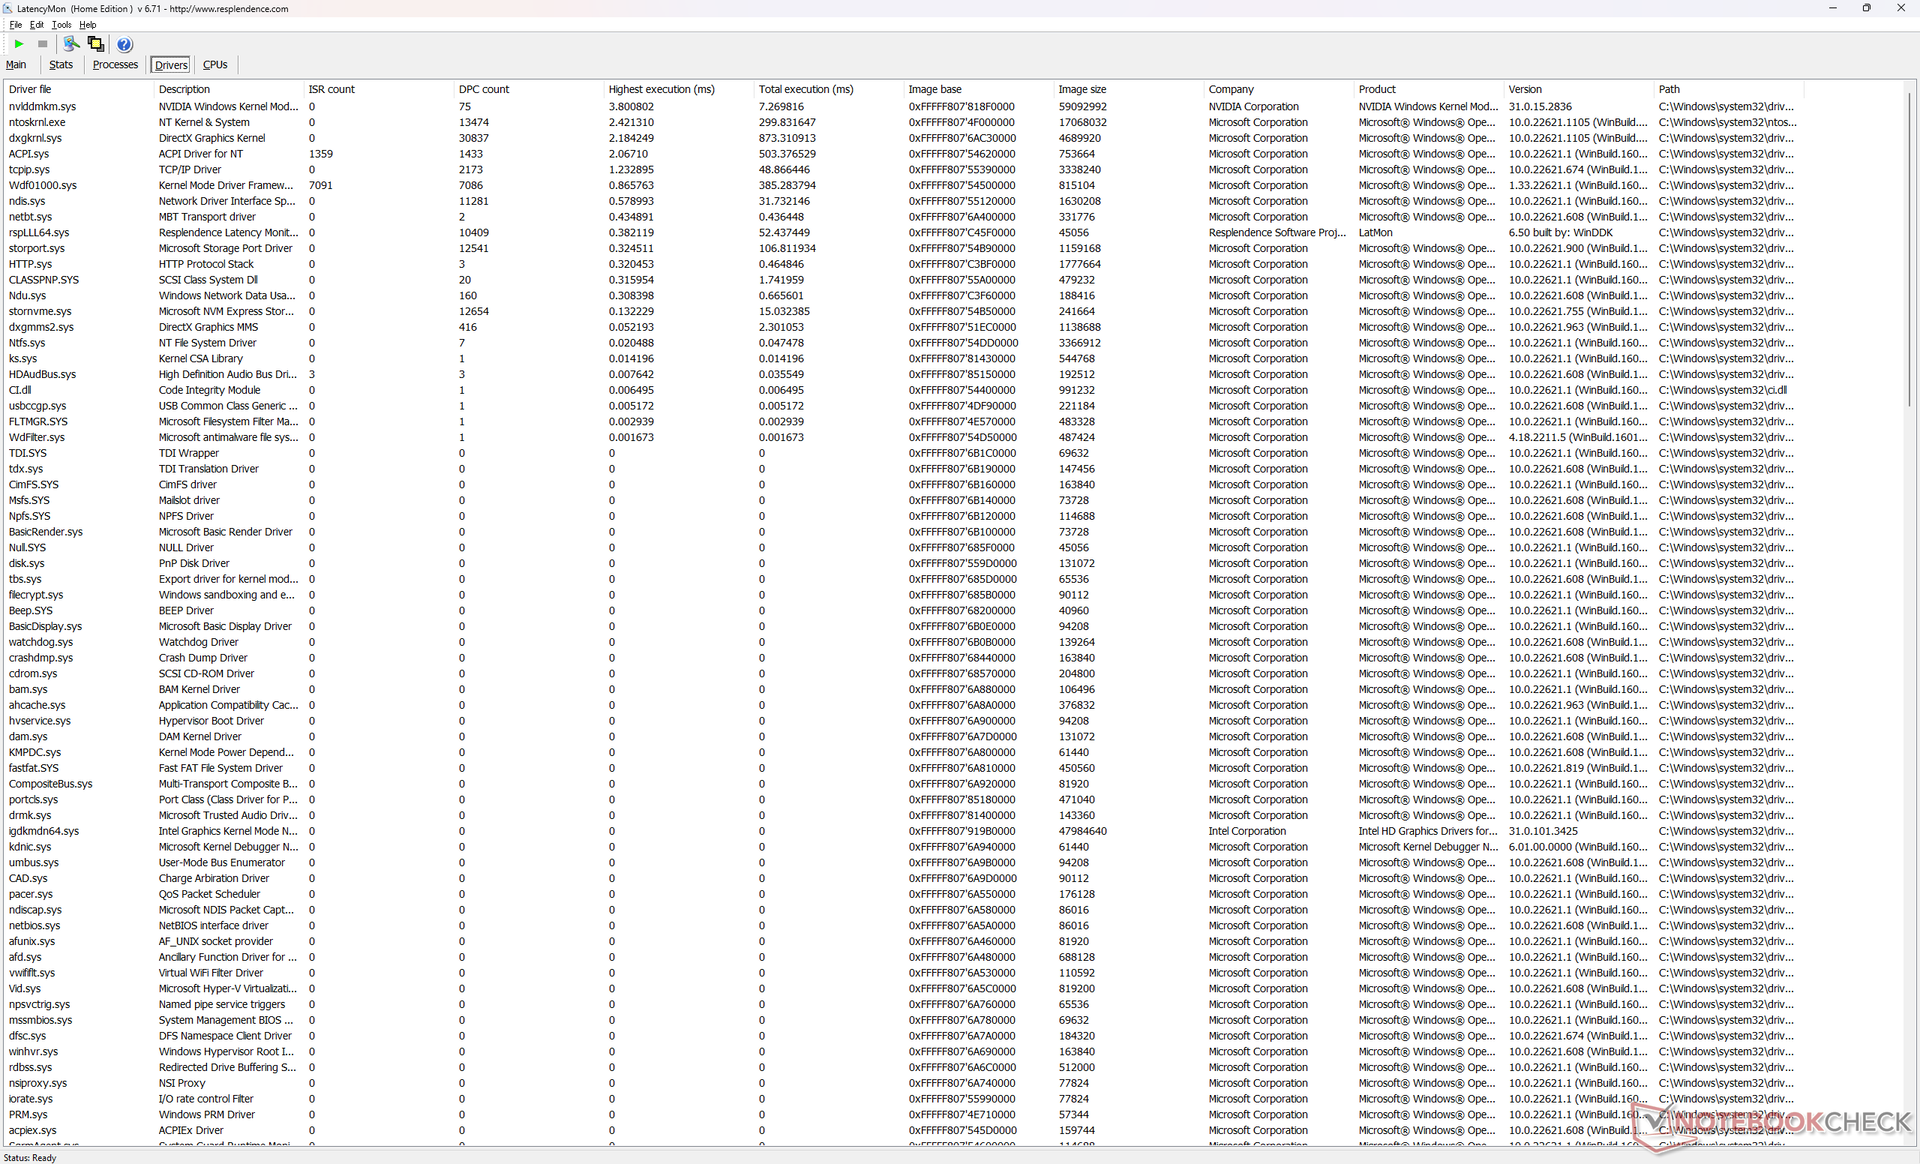
DPC Latency
LatencyMon reveals DPC issues when opening multiple browser tabs on our homepage. 4K video playback at 60 FPS is otherwise smooth and without any dropped frames.
| DPC Latencies / LatencyMon - interrupt to process latency (max), Web, Youtube, Prime95 | |
| Razer Blade 15 Advanced Model Early 2022 | |
| Razer Blade 16 Early 2023 | |
| MSI GE67 HX 12UGS | |
| HP Omen 16-n0033dx | |
| Lenovo Legion S7 16ARHA7 | |
| Dell G16 7620 | |
| Razer Blade 17 (i7-12800H, RTX 3070 Ti) | |
| Asus ROG Zephyrus Duo 16 GX650RX | |
* ... smaller is better
Storage Devices — Supports up to 2x PCIe4 SSDs
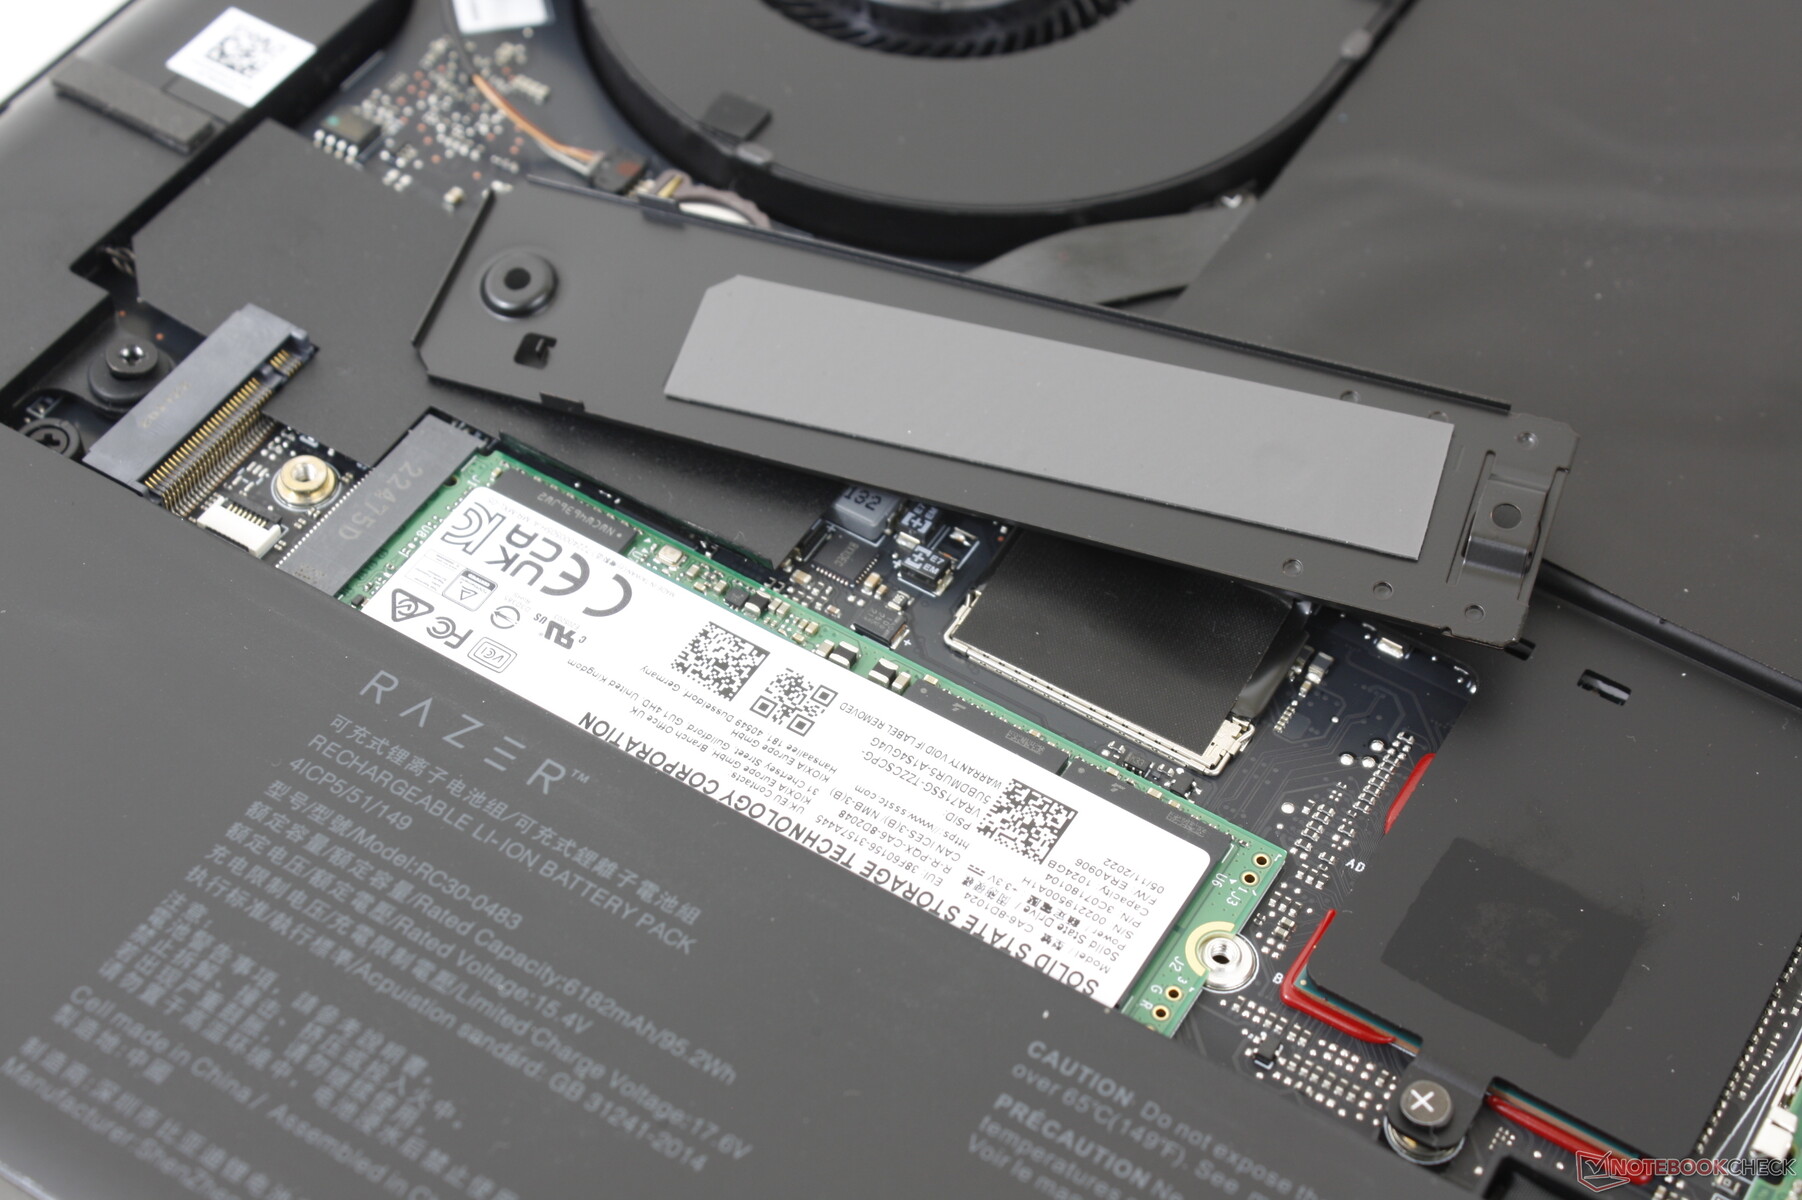
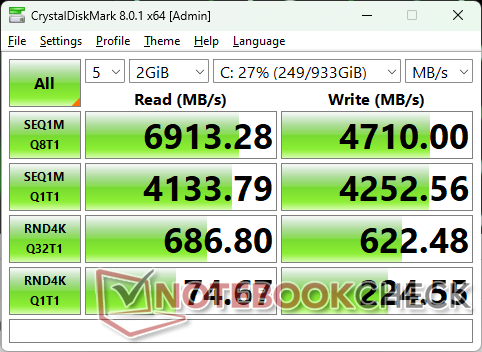
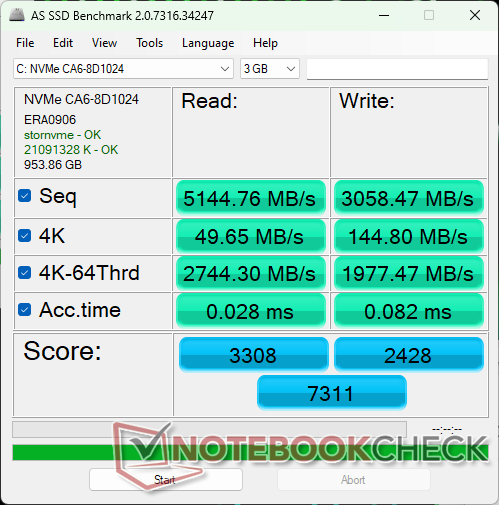
Our Blade 16 unit ships with the same 1 TB SSSTC CA6-8D1024 drive as found on the 2021 and 2022 Blade 15 models. Though sequential transfer rates are still very good at up to 6900 MB/s on our tests, its read and write rates of smaller SEQ Q8 T1 workloads fall behind the competing Samsung PM9A1. Razer is still shipping Blade 17 units with the Samsung drive and so it's likely that current Blade 16 shipments may carry SSDs from both manufacturers.
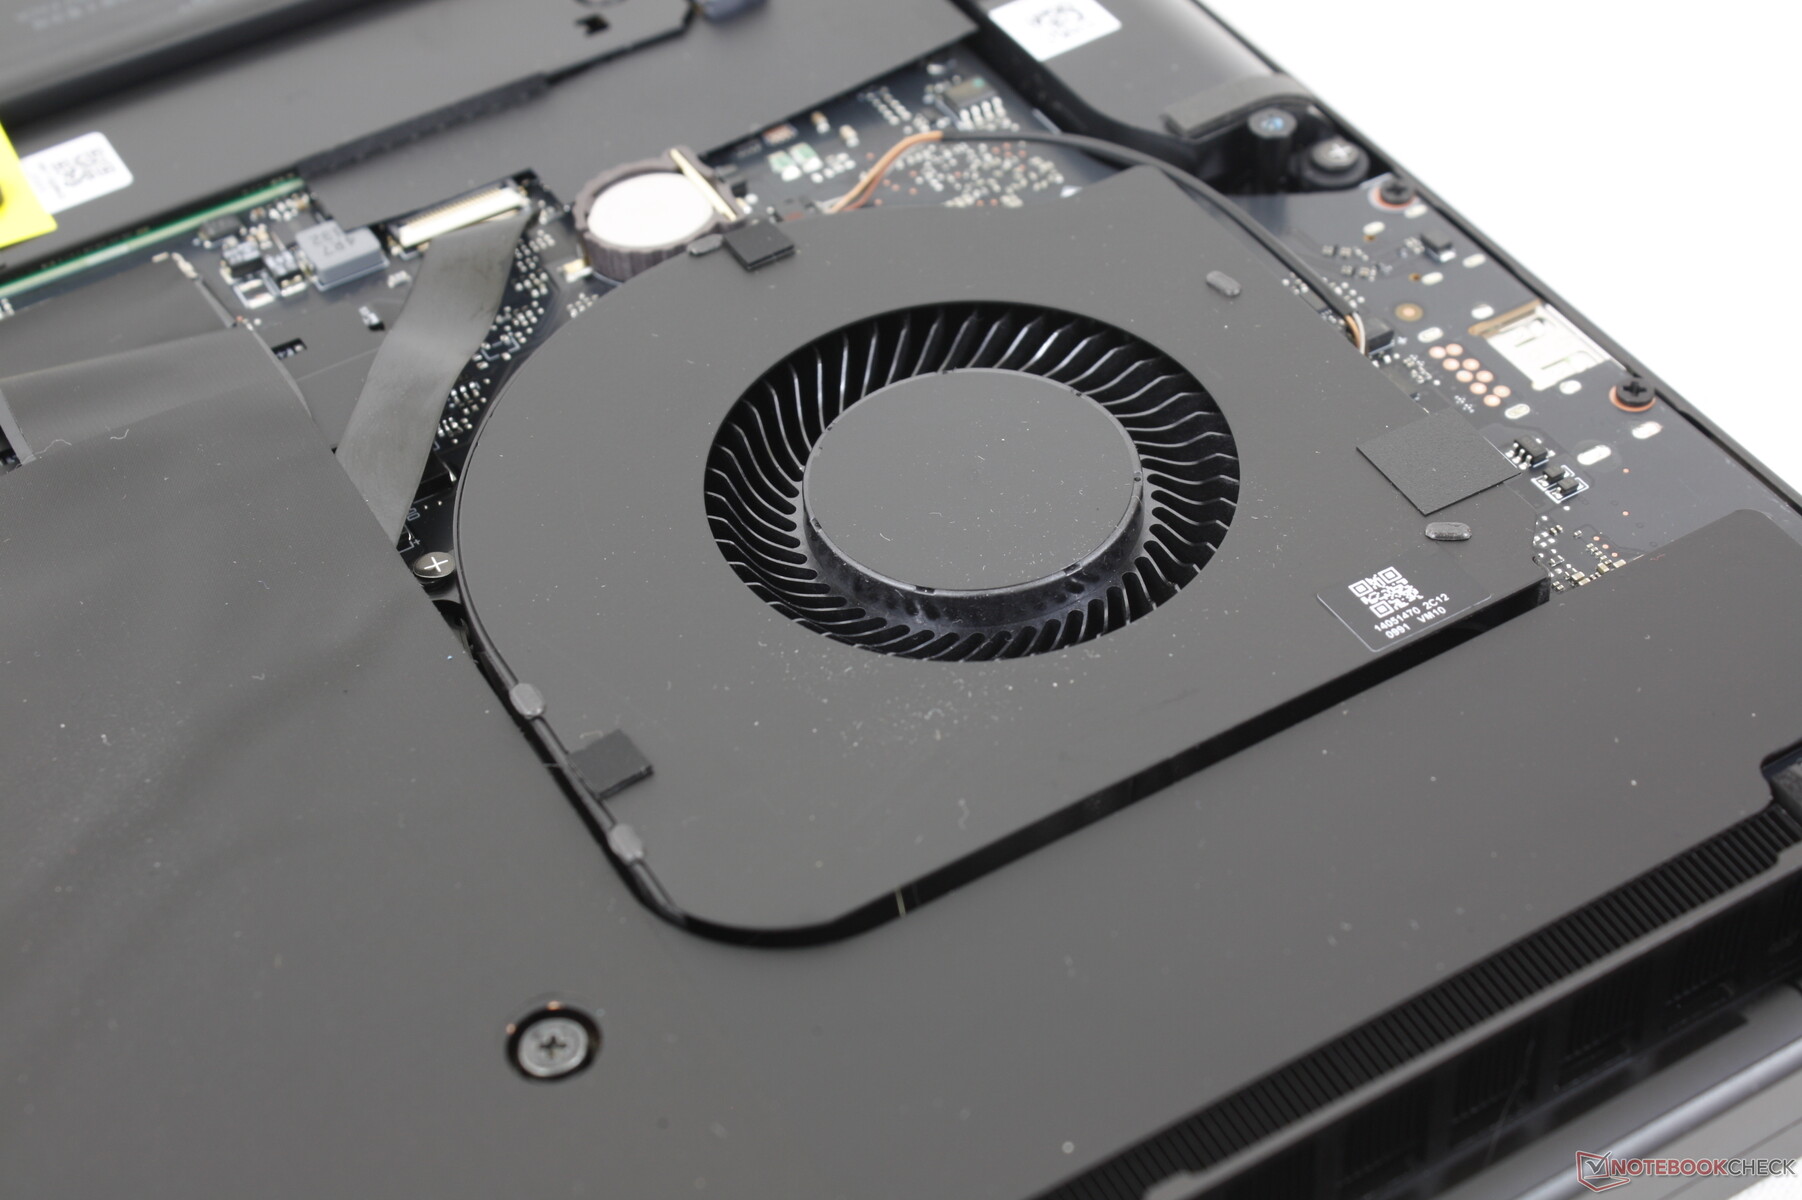
Up to two internal M.2 SSDs are supported much like on the Blade 15 and Blade 17. On the Blade 16, however, Razer has stacked the two drives on top of one another to preserve motherboard space for other components such as the larger battery capacity and cooling solution.

* ... smaller is better
Disk Throttling: DiskSpd Read Loop, Queue Depth 8
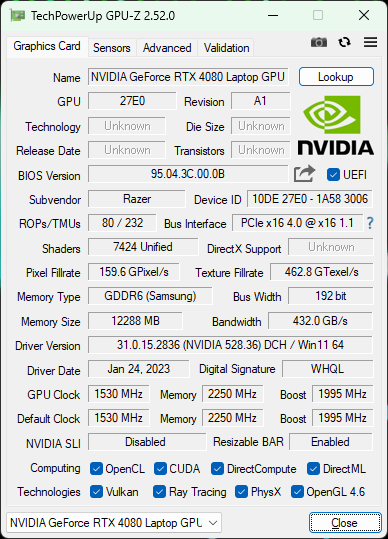
GPU Performance — 175 W TGP GeForce RTX 4080
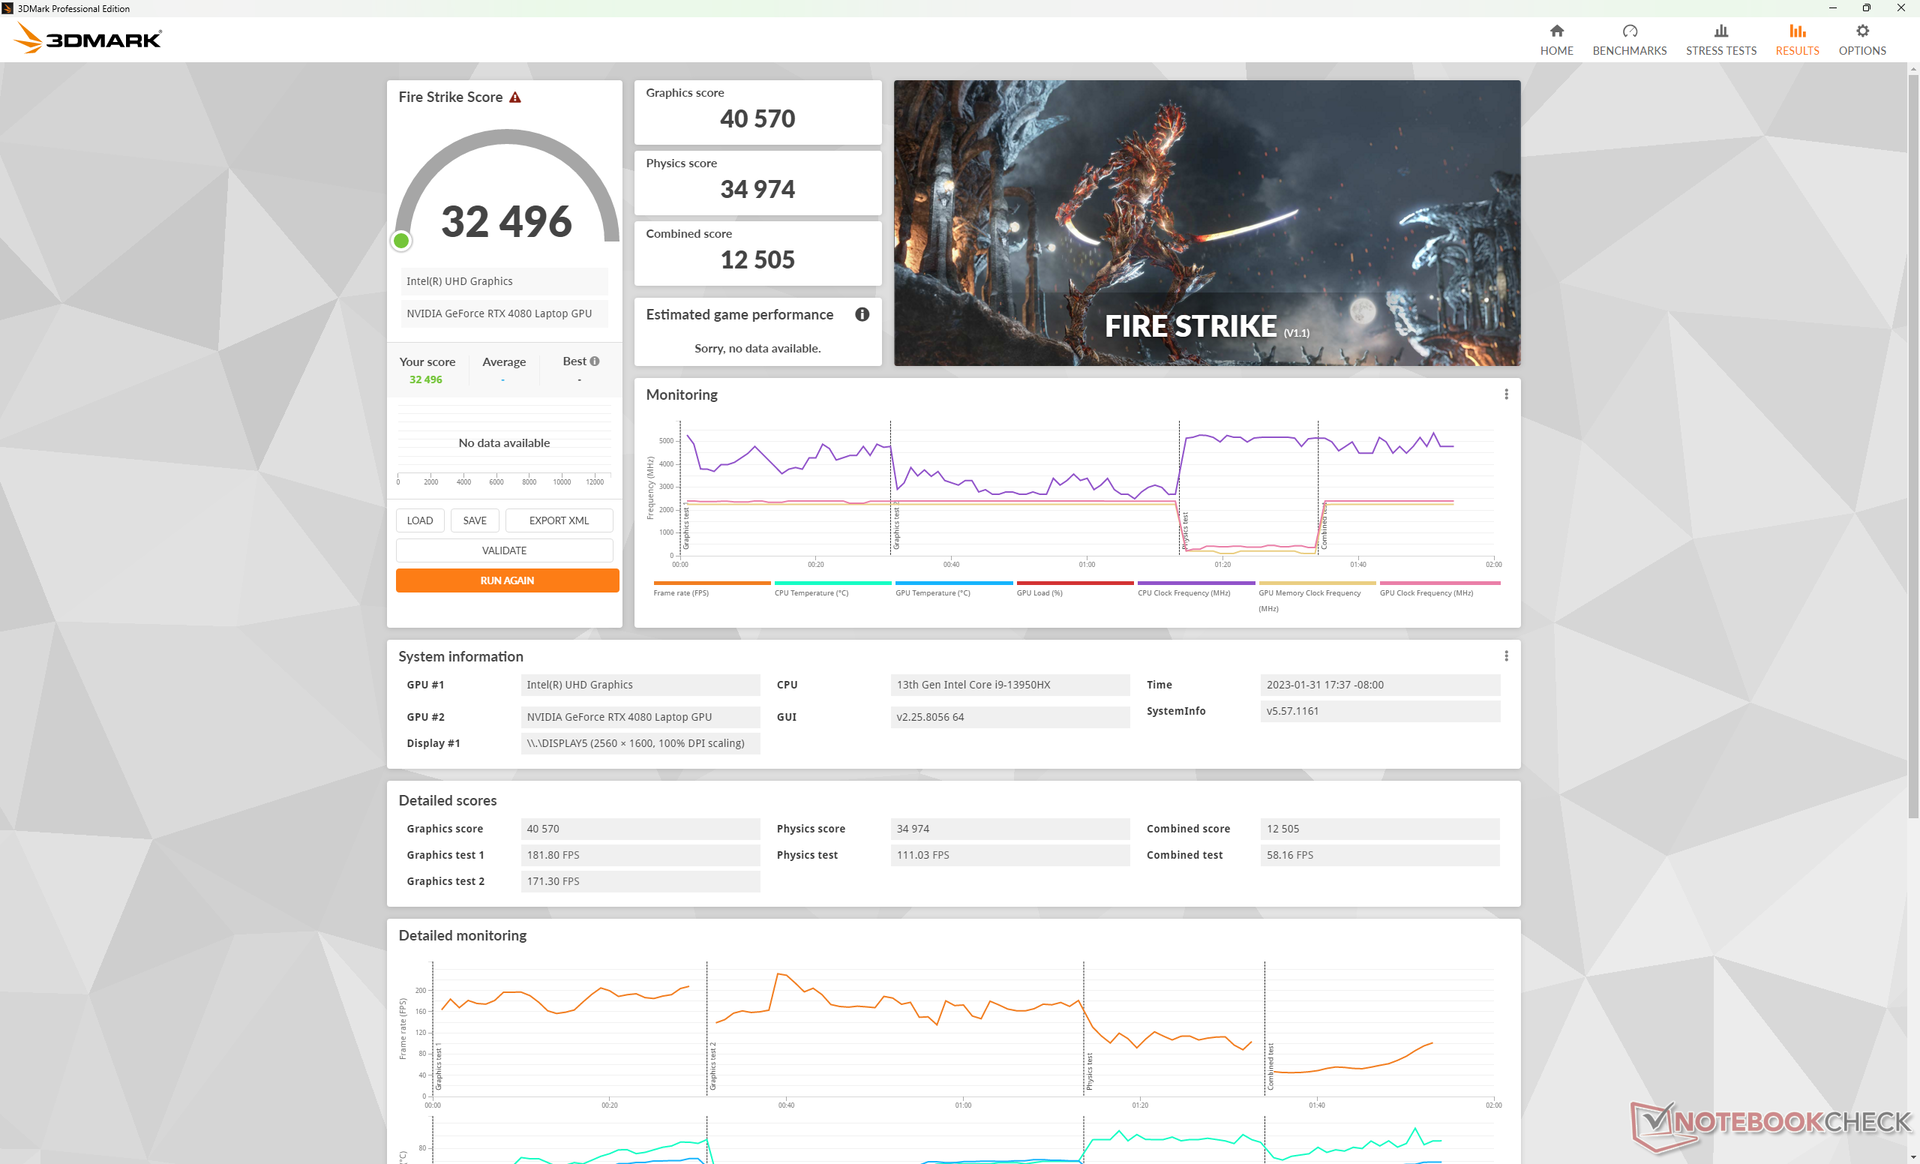
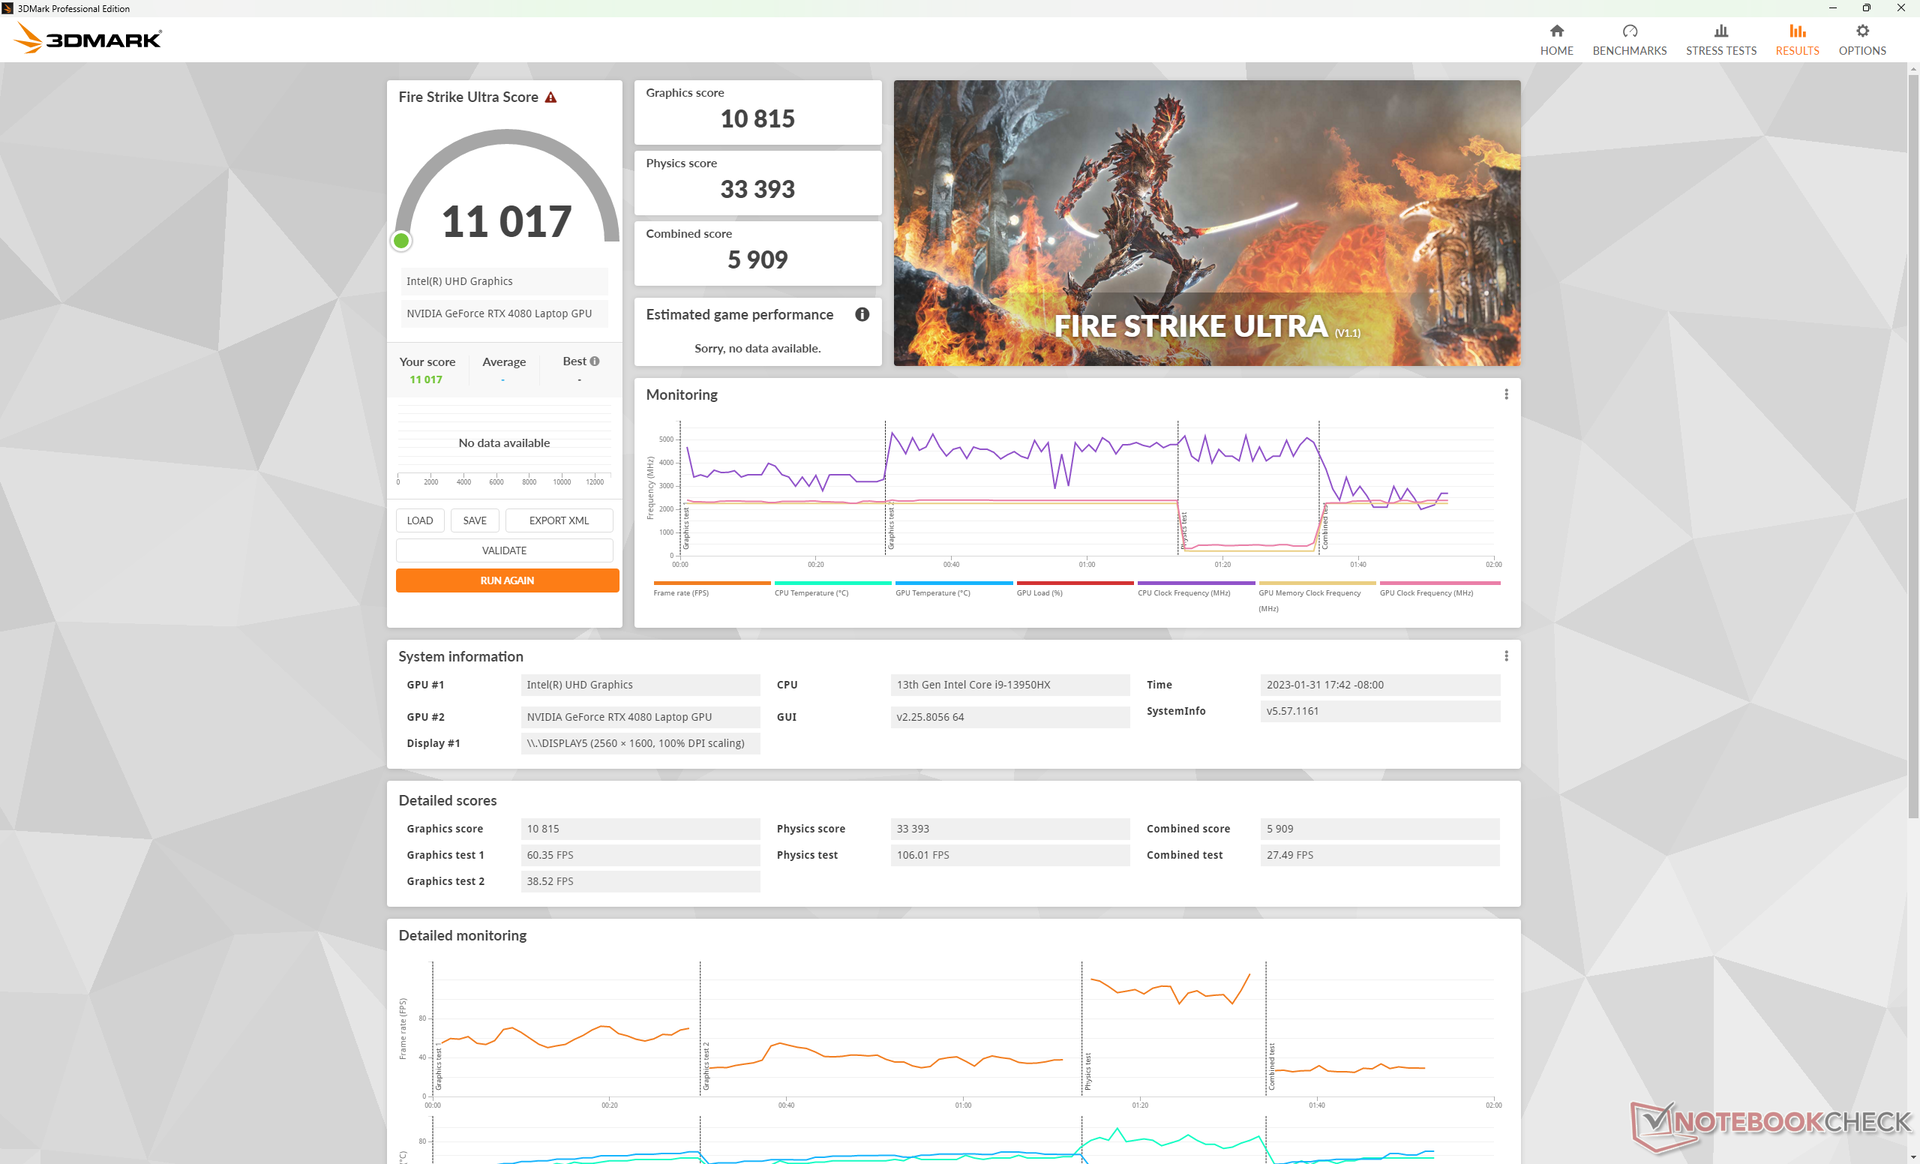
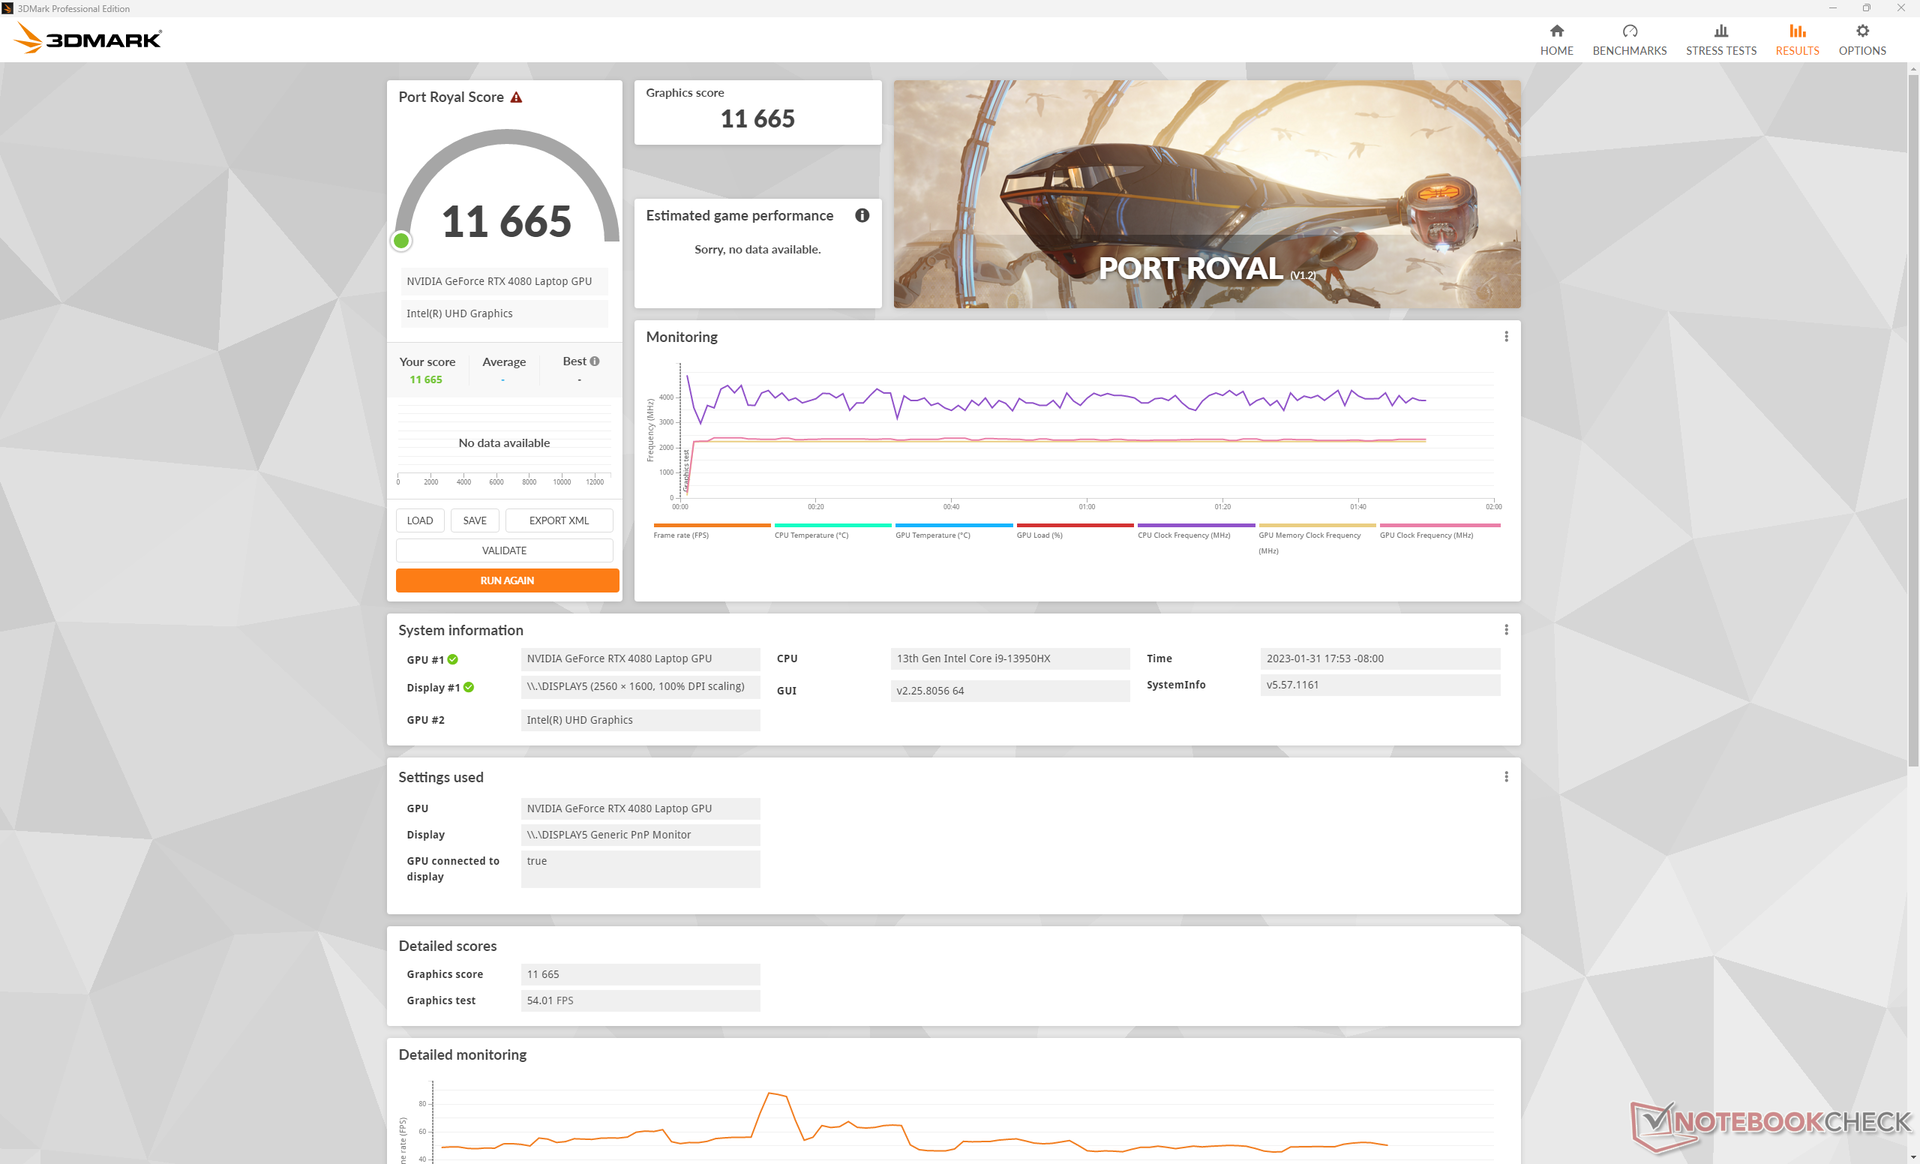
Raw graphics performance is roughly 30 to 50 percent faster than the last generation mobile RTX 3080 Ti which aligns with Nvidia's claim of a 40 percent gen-over-gen improvement. The performance advantages include ray-tracing potential as well with a Port Royal score that is 1.5x to 2.5x faster than most Ampere-based gaming laptops. The mobile GeForce RTX 4080 really is a generational leap after two years of mobile GeForce 30 options.
Performance is even faster by a factor of 2x to 3x if titles support DLSS 3.0. Our tested titles below were run without DLSS for a fairer gen-over-gen comparison, but enabling DLSS 3.0 is recommended in most cases as the minor artifacts or input latency it introduces are vastly overshadowed by the boost in frame rates. Please see our dedicated pages on the mobile GeForce RTX 4080 and 4090 for additional benchmarks and information on the GeForce 40 series. More games will be benchmarked and added in the weeks to follow. Many popular games unfortunately do not support DLSS 3.0 as of this writing including Fortnite and Elden Ring.
Though the mobile RTX 4080 performs well, it still lags behind our desktop GeForce RTX 4080 reference by 35 to 40 percent. Thus, users can expect the mobile RTX 4080 to perform more like a desktop RTX 3080 instead when DLSS 3.0 is disabled.
Running the Blade 16 on Balanced mode instead of Performance mode will impact graphics performance by 10 percent according to Time Spy.

| GFXBench | |
| 3840x2160 4K Aztec Ruins High Tier Offscreen | |
| MSI Titan GT77 HX 13VI | |
| Razer Blade 16 Early 2023 | |
| Average NVIDIA GeForce RTX 4080 Laptop GPU (197.2 - 212, n=2) | |
| Razer Blade 17 Early 2022 | |
| 2560x1440 Aztec Ruins High Tier Offscreen | |
| MSI Titan GT77 HX 13VI | |
| Razer Blade 16 Early 2023 | |
| Average NVIDIA GeForce RTX 4080 Laptop GPU (446 - 485, n=2) | |
| Razer Blade 17 Early 2022 | |
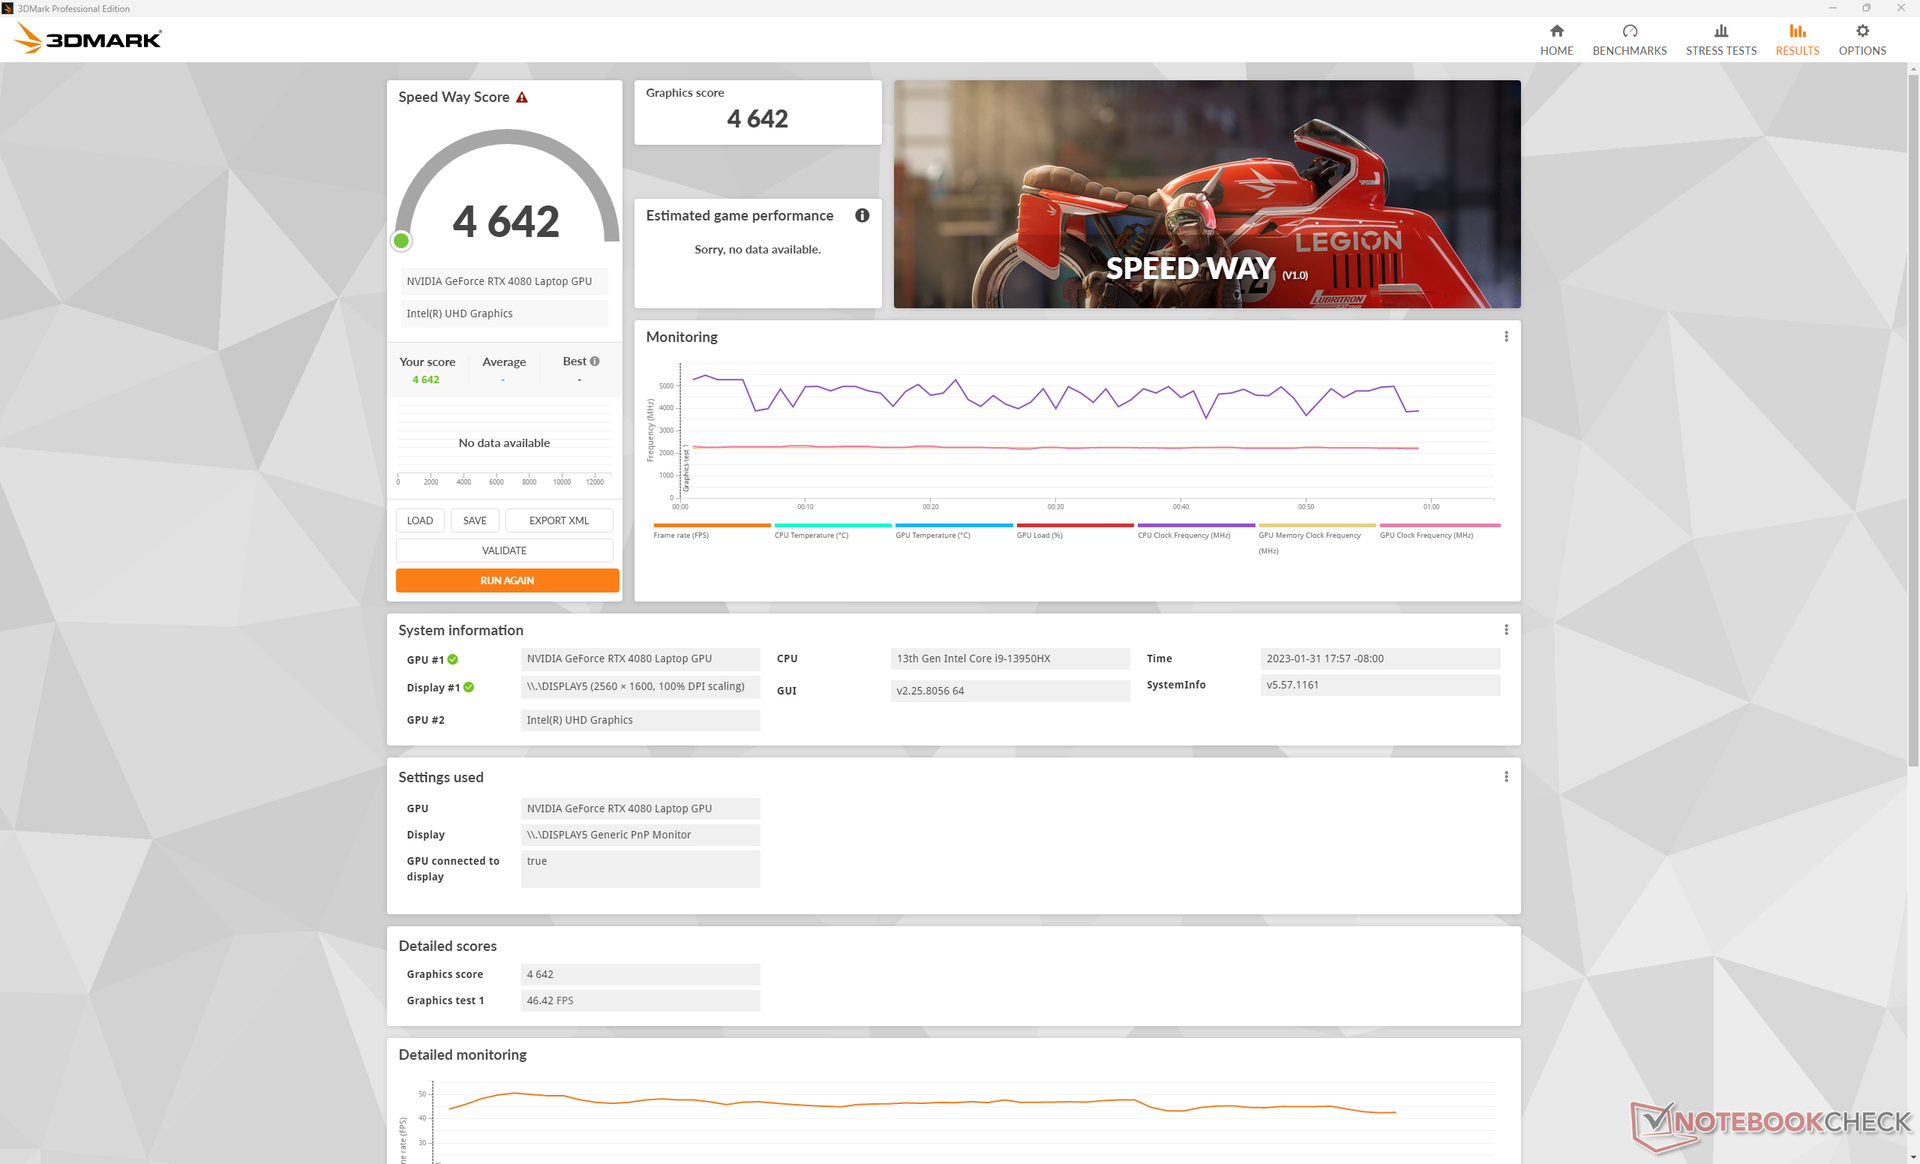
| 3DMark 11 Performance | 41542 points | |
| 3DMark Fire Strike Score | 32496 points | |
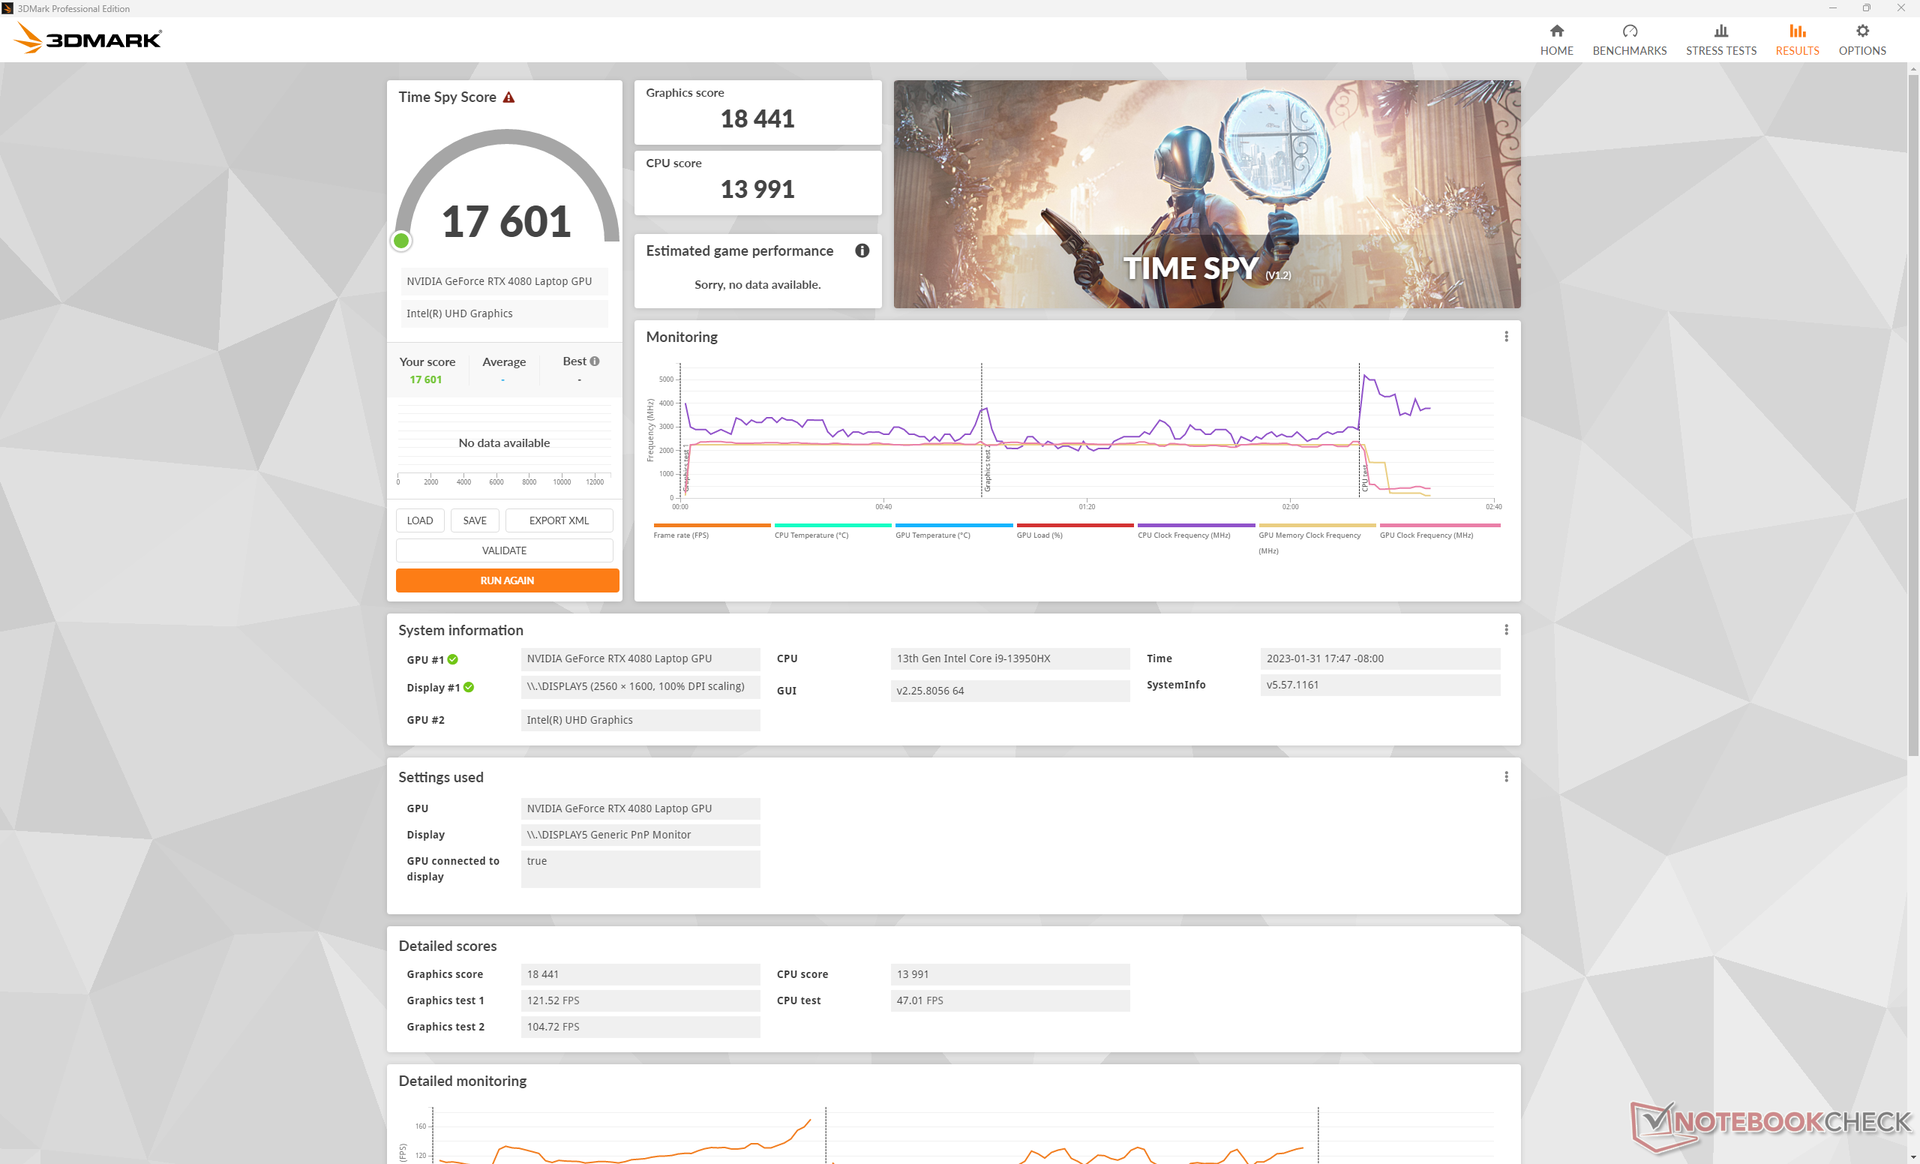
| 3DMark Time Spy Score | 17601 points | |
| 3DMark Steel Nomad Score | 4021 points | |
| 3DMark Steel Nomad Light Score | 16652 points | |
Help | ||
* ... smaller is better
We tested four different games that currently support DLSS 3.0 to see how the new frame generation feature can improve performance. As shown by the table below, our mobile RTX 4080 can barely run demanding games at native 4K and maximum RT settings when DLSS is completely turned off. Enabling DLSS 2.0 + frame generation would improve performance dramatically from sub 30 FPS to over 60 FPS on average. In our experience, artifacts from DLSS are more noticeable on slower-moving titles like Hitman 3 and Dying Light 2 than on F1 22 or Need For Speed Unbound.
| Game | Settings | DLSS Off | DLSS On (Balanced + Frame Generation) | Difference |
|---|---|---|---|---|
| Hitman 3 | 4K Ultra + RT | 28.8 FPS | 70 FPS | +143% |
| Dying Light 2 | 4K Ultra + RT | 28.3 FPS | 73 FPS | +158% |
| F1 22 | 4K Ultra + RT | 37 FPS | 91 FPS | +146% |
| NFS Unbound | 4K Ultra | 65 FPS | 102 FPS | +57% |
Idling on Witcher 3 1080p Ultra shows no significant drops in performance or throttling over time. A Time Spy Stress Test run would result in a final score of 98.5 percent.
Performance efficiency (or average FPS ÷ average power draw) on an external monitor is roughly 30 percent higher than on most high-end gaming laptops running on Ampere GPUs including the Schenker XMG Neo 17 or MSI Titan GT77 12UHS. It's still about 10 percent lower than the MSI Titan GT77 HX 13VI running on the mobile RTX 4090, but this is to be expected since the mobile RTX 4090 in the MSI targets a similar 175 W TGP as the mobile RTX 4080 in our Razer while offering faster performance.
Witcher 3 FPS Chart
| low | med. | high | ultra | QHD DLSS | QHD FSR | QHD | 4K DLSS | 4K FSR | 4K | |
|---|---|---|---|---|---|---|---|---|---|---|
| GTA V (2015) | 186.6 | 185.2 | 183.4 | 140.7 | 125.2 | 143.7 | ||||
| The Witcher 3 (2015) | 609.6 | 462.7 | 353.5 | 176.8 | 120.6 | |||||
| Dota 2 Reborn (2015) | 218 | 204 | 196 | 194.7 | 176.7 | |||||
| Final Fantasy XV Benchmark (2018) | 195.8 | 184.1 | 157.8 | 120.1 | 74.1 | |||||
| X-Plane 11.11 (2018) | 201 | 177.7 | 137 | 117.5 | ||||||
| Strange Brigade (2018) | 438 | 365 | 351 | 323 | 237 | 122.3 | ||||
| Shadow of the Tomb Raider (2018) | 228 | 201 | 196 | 176 | 154 | 84 | ||||
| Metro Exodus (2019) | 197 | 170.4 | 145 | 121.7 | 102 | 67 | ||||
| Control (2019) | 239.1 | 204.7 | 157 | 102 | 50.1 | |||||
| Borderlands 3 (2019) | 207.7 | 176.6 | 158.1 | 133.5 | 108.7 | 59.8 | ||||
| Valorant (2020) | 336 | |||||||||
| Horizon Zero Dawn (2020) | 128 | 112 | ||||||||
| Mafia Definitive Edition (2020) | 280.3 | 184 | 171.3 | 121.6 | 70.4 | |||||
| Watch Dogs Legion (2020) | 140 | 129 | 121 | 110 | 93 | 56 | ||||
| Far Cry 6 (2021) | 181 | 149 | 134 | 125 | 115 | 71 | ||||
| Dying Light 2 (2022) | 184.1 | 160.4 | 140.9 | 97.8 | 48.6 | |||||
| Cyberpunk 2077 1.6 (2022) | 121.1 | 118.1 | 113.8 | 106.2 | 81.2 | 40 | ||||
| Ghostwire Tokyo (2022) | 198.7 | 159.6 | 154 | 145 | 135.9 | 73.1 | ||||
| The Callisto Protocol (2022) | 177.8 | 159.8 | 119.9 | 120.4 | 93.1 | 55.3 | ||||
| Baldur's Gate 3 (2023) | 168.3 | 160 | 121.9 | 120.5 | 66.7 | |||||
| Cyberpunk 2077 (2023) | 110 | 93.6 | 80.6 | 44.4 | 36.2 | 35 | ||||
| Alan Wake 2 (2023) | 66.9 | 37 | ||||||||
| Skull & Bones (2024) | 50 | |||||||||
| Horizon Forbidden West (2024) | 56.1 | 54.8 | 39.5 | |||||||
| F1 24 (2024) | 226 | 236 | 251 | 117.7 | 118.8 | 92.5 | 76.3 | 65 | 38.8 | |
| Black Myth: Wukong (2024) | 110 | 89 | 71 | 42 | 47 | 31 | 33 | 18 | ||
| Star Wars Outlaws (2024) | 84.3 | 81.5 | 74.1 | 64.4 | 59.1 | 47.7 | 35.8 | 20.5 | ||
| Call of Duty Black Ops 6 (2024) | 107 | 100 | 65 | 62 | ||||||
| Stalker 2 (2024) | 63.1 | 50.3 | 30.9 | |||||||
| Marvel Rivals (2024) | 145 | 120 | 88 | 74 | 56 | |||||
| Indiana Jones and the Great Circle (2024) | 96.4 | 80.3 | 51 | |||||||
| Kingdom Come Deliverance 2 (2025) | 92.3 | 92.3 | 71.2 | |||||||
| Monster Hunter Wilds (2025) | 63.3 | 62 | 54.8 | 48 | 34.4 | |||||
| Civilization 7 (2025) | 155.1 | 117.3 | 105.8 | 50.2 | ||||||
| Assassin's Creed Shadows (2025) | 69 | 50 | 52 | 44 | 41 | 32 | ||||
| Doom: The Dark Ages (2025) | 112.5 | 102.8 | 94.6 | 93.8 | 86.6 | 65.4 | 51.9 | 53.1 | 34.7 | |
| F1 25 (2025) | 172.5 | 171.9 | 44.2 | 46.1 | 26.5 | 24.2 | 12.2 | |||
| Borderlands 4 (2025) | 58.5 | 30.5 | 46.1 | 26.2 | ||||||
| Battlefield 6 (2025) | 128.9 | 121.9 | 115.1 | 103.8 | 113.8 | 75.5 | 70.1 | 53.7 | ||
| The Outer Worlds 2 (2025) | 83.7 | 79.7 | 73.6 | 61.1 | 31.1 | 43.4 | ||||
| ARC Raiders (2025) | 88.4 | 89.4 | 68.1 | |||||||
| Anno 117: Pax Romana (2025) | 79.8 | 48.2 | 35.2 | |||||||
| Call of Duty Black Ops 7 (2025) | 58 | 56 | 38 | |||||||
| Resident Evil Requiem (2026) | 66.6 | 46.1 | 21.6 | |||||||
| Death Stranding 2 (2026) | 72.1 | 80 | 60.3 | 37.9 | ||||||
| Crimson Desert (2026) | 104.2 | 88.7 | 76.2 | 69 | 68.1 | 59.3 | 48 | 35.9 | ||
| Pragmata (2026) | 114 | 97.9 | 81 | 64.8 | 44.2 | |||||
| War Thunder (2026) | 304 | 127 | 88.6 | 37.9 | ||||||
| Forza Horizon 6 (2026) | 91 | 78 | 59 | 58 | 44 | 37 | 27 | |||
| 007 First Light (2026) | 78.6 | 69.6 | 55.9 | 51.8 | 28.3 |
Workstation performance is comparable to even recently released RTX A5500 in many scenarios according to Specviewperf benchmarks much like what we discovered on the mobile RTX 4090. Even so, you'll still want a professional GPU for more consistent performance depending on your application as the GeForce series is not optimized for such workloads. Luxmark and Siemens results are inconsistent, for example, and still favor the older Ampere-based RTX A5500.
Emissions — Still Pretty Loud
System Noise
Fan noise is dependent on the Synapse power profile. When gaming on Balanced mode, for example, fan noise would top out at just 42 dB(A) vs 51.6 dB(A) if gaming on Performance mode. Thus, users may want to consider gaming on Balanced mode instead of Performance mode even though it incurs a slight hit to graphics performance as mentioned above.
Overall fan noise behavior is more similar to the Blade 17 than to the Blade 15 which is unfortunate as the Blade 15 is the quieter machine. The MSI GE67 HX is even louder than the Blade 16 when under similar conditions.
It's recommended to run on Quiet or Power Saver mode when web browsing or streaming so the internal fans will remain quieter for longer. If not, they tend to pulse early and loudly if set to Balanced mode or higher. When running 3DMark 06 on Balanced mode, for example, fan noise would steadily increase to 39 dB(A) much earlier in the benchmark compared to just 31 dB(A) on the Lenovo Legion S7 16.
Noise level
| Idle |
| 23 / 23 / 23.6 dB(A) |
| Load |
| 39 / 51.3 dB(A) |
 | ||
30 dB silent 40 dB(A) audible 50 dB(A) loud |
||
min: | ||
| Razer Blade 16 Early 2023 GeForce RTX 4080 Laptop GPU, i9-13950HX, SSSTC CA6-8D1024 | Razer Blade 15 Advanced Model Early 2022 GeForce RTX 3080 Ti Laptop GPU, i7-12800H, Samsung PM9A1 MZVL21T0HCLR | Lenovo Legion S7 16ARHA7 Radeon RX 6800S, R9 6900HX, SK Hynix HFS001TEJ9X115N | Dell G16 7620 GeForce RTX 3060 Laptop GPU, i7-12700H, WDC PC SN810 512GB | Asus ROG Zephyrus Duo 16 GX650RX GeForce RTX 3080 Ti Laptop GPU, R9 6900HX, 2x Samsung SSD 980 Pro 2TB MZ-V8P2T0 (RAID 0) | HP Omen 16-n0033dx Radeon RX 6650M, R7 6800H, Samsung PM9A1 MZVL21T0HCLR | MSI GE67 HX 12UGS GeForce RTX 3070 Ti Laptop GPU, i7-12800HX, Samsung PM9A1 MZVL21T0HCLR | Razer Blade 17 (i7-12800H, RTX 3070 Ti) GeForce RTX 3070 Ti Laptop GPU, i7-12800H, Samsung PM9A1 MZVL21T0HCLR | |
|---|---|---|---|---|---|---|---|---|
| Noise | -5% | 3% | -6% | -9% | -9% | -4% | 2% | |
| off / environment * (dB) | 23 | 26 -13% | 23.1 -0% | 23.2 -1% | 26 -13% | 24.2 -5% | 22.7 1% | 23 -0% |
| Idle Minimum * (dB) | 23 | 26 -13% | 23.1 -0% | 28.3 -23% | 26 -13% | 27.4 -19% | 22.9 -0% | 23 -0% |
| Idle Average * (dB) | 23 | 27 -17% | 23.1 -0% | 28.8 -25% | 27 -17% | 27.4 -19% | 22.9 -0% | 23 -0% |
| Idle Maximum * (dB) | 23.6 | 29 -23% | 23.1 2% | 28.9 -22% | 29 -23% | 28.9 -22% | 22.9 3% | 23 3% |
| Load Average * (dB) | 39 | 37 5% | 31.4 19% | 32.4 17% | 41 -5% | 32.3 17% | 44.4 -14% | 36.92 5% |
| Witcher 3 ultra * (dB) | 51.6 | 44 15% | 51.4 -0% | 48.3 6% | 48 7% | 54.1 -5% | 55.7 -8% | 50 3% |
| Load Maximum * (dB) | 51.3 | 45 12% | 51.2 -0% | 48.1 6% | 50 3% | 57.6 -12% | 57.4 -12% | 50 3% |
* ... smaller is better
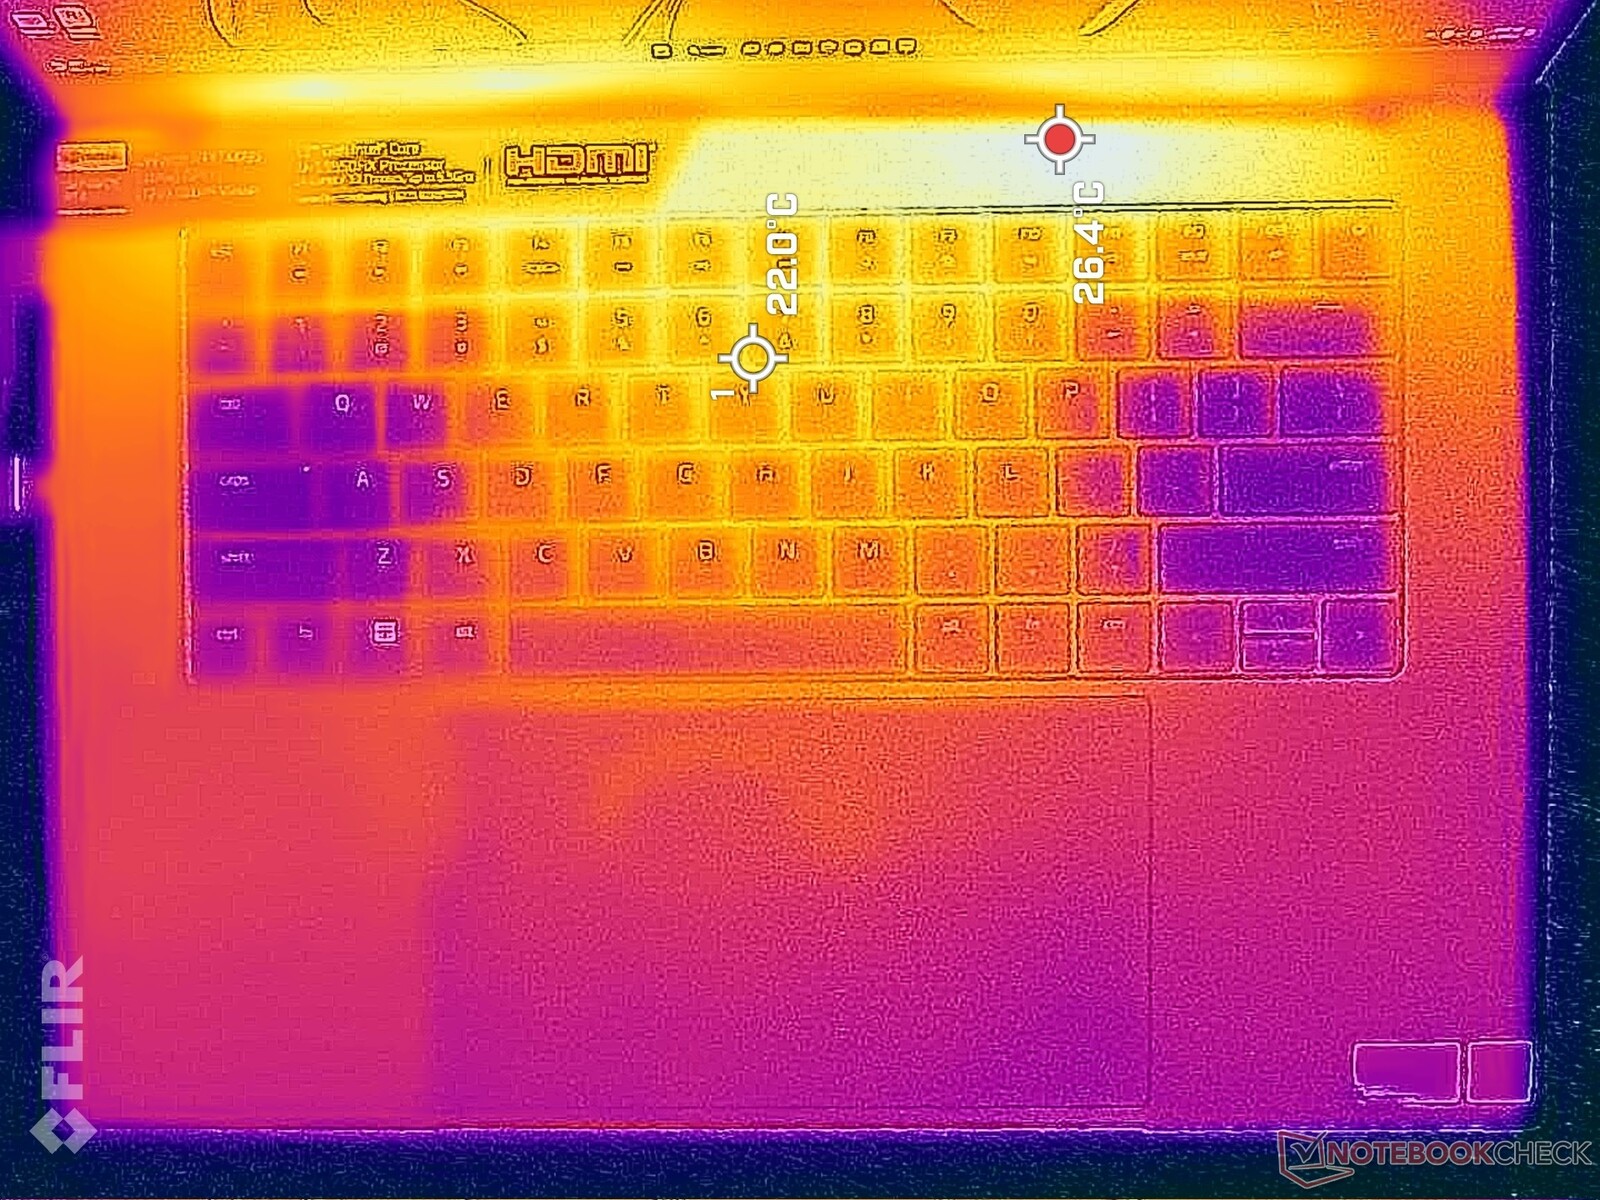
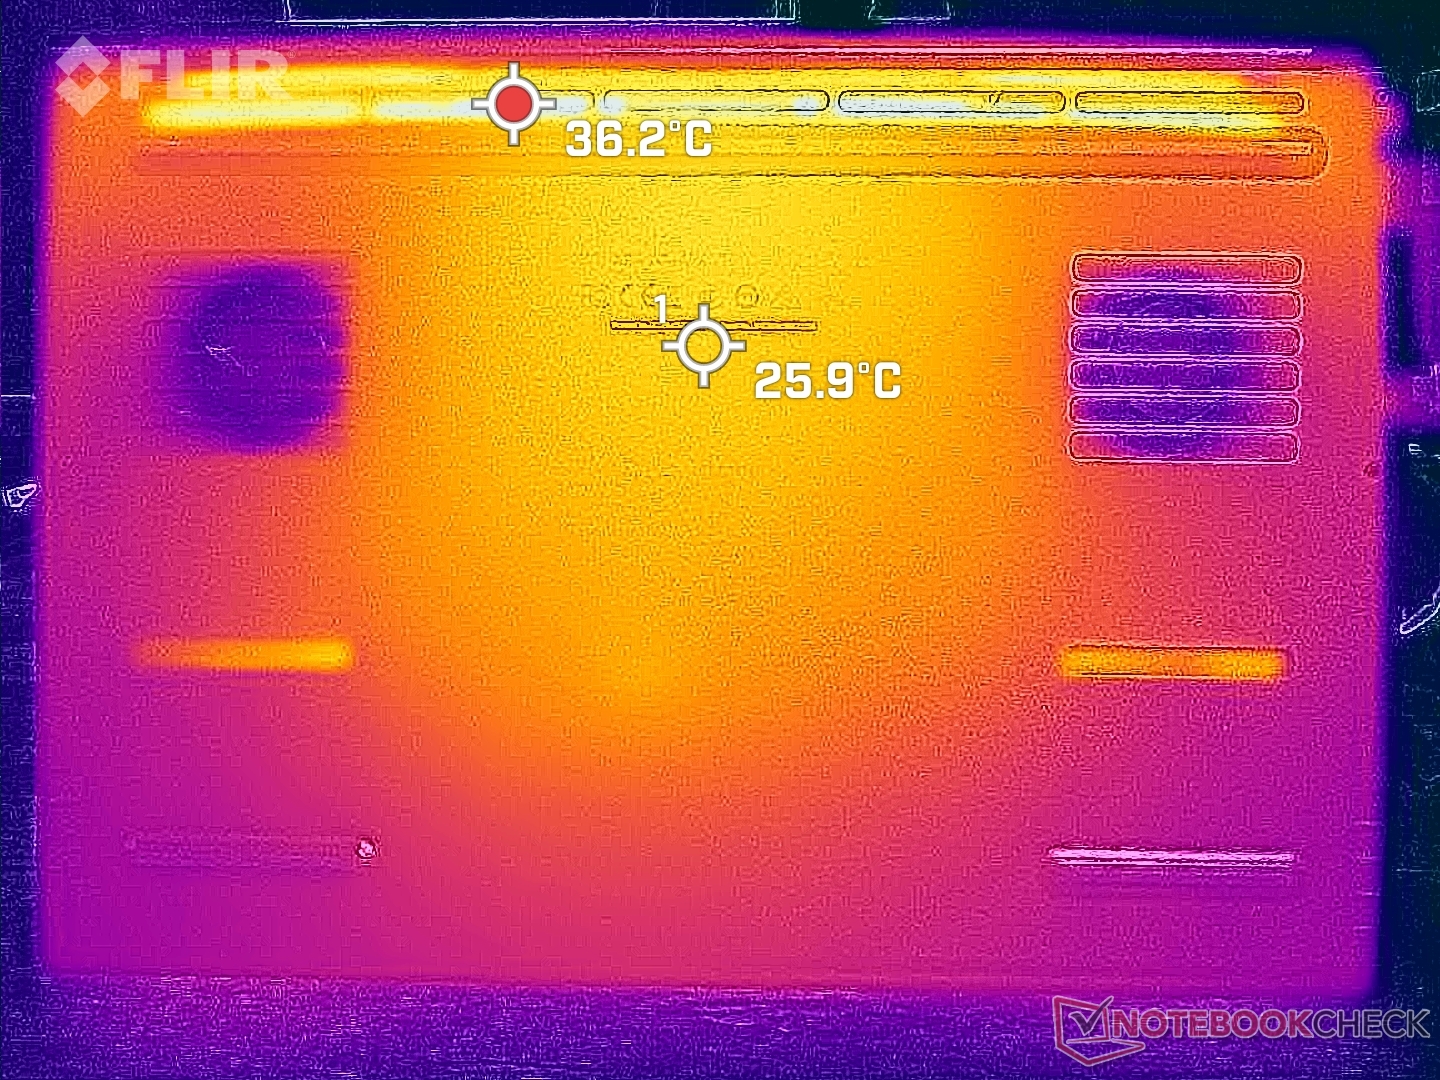
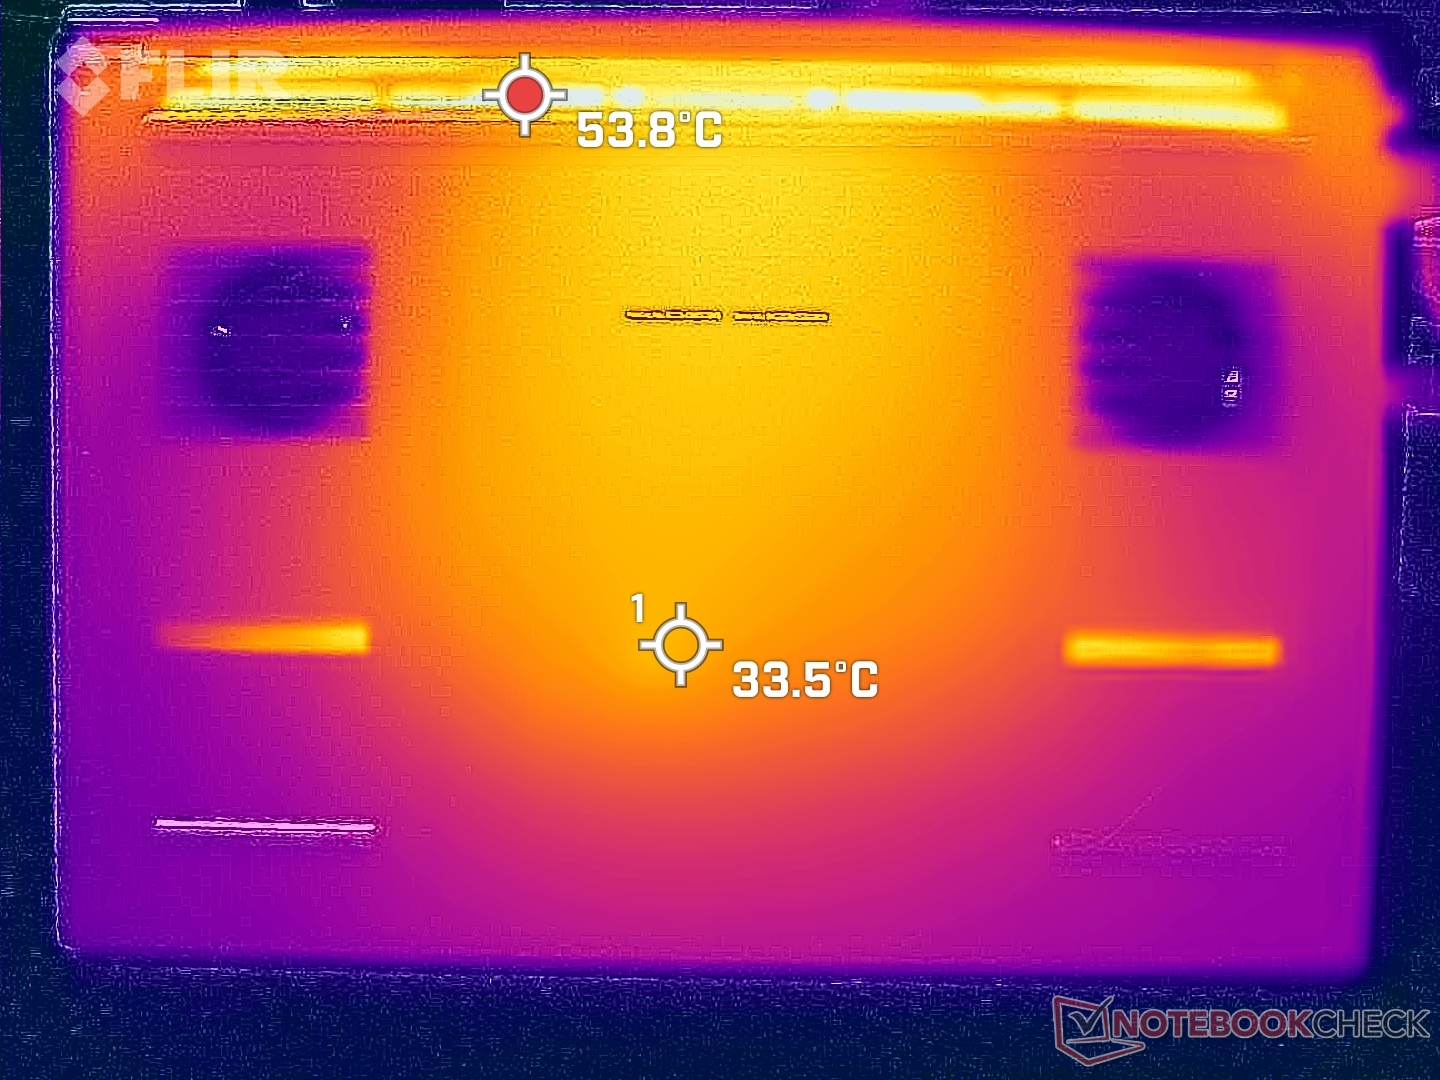
Temperature
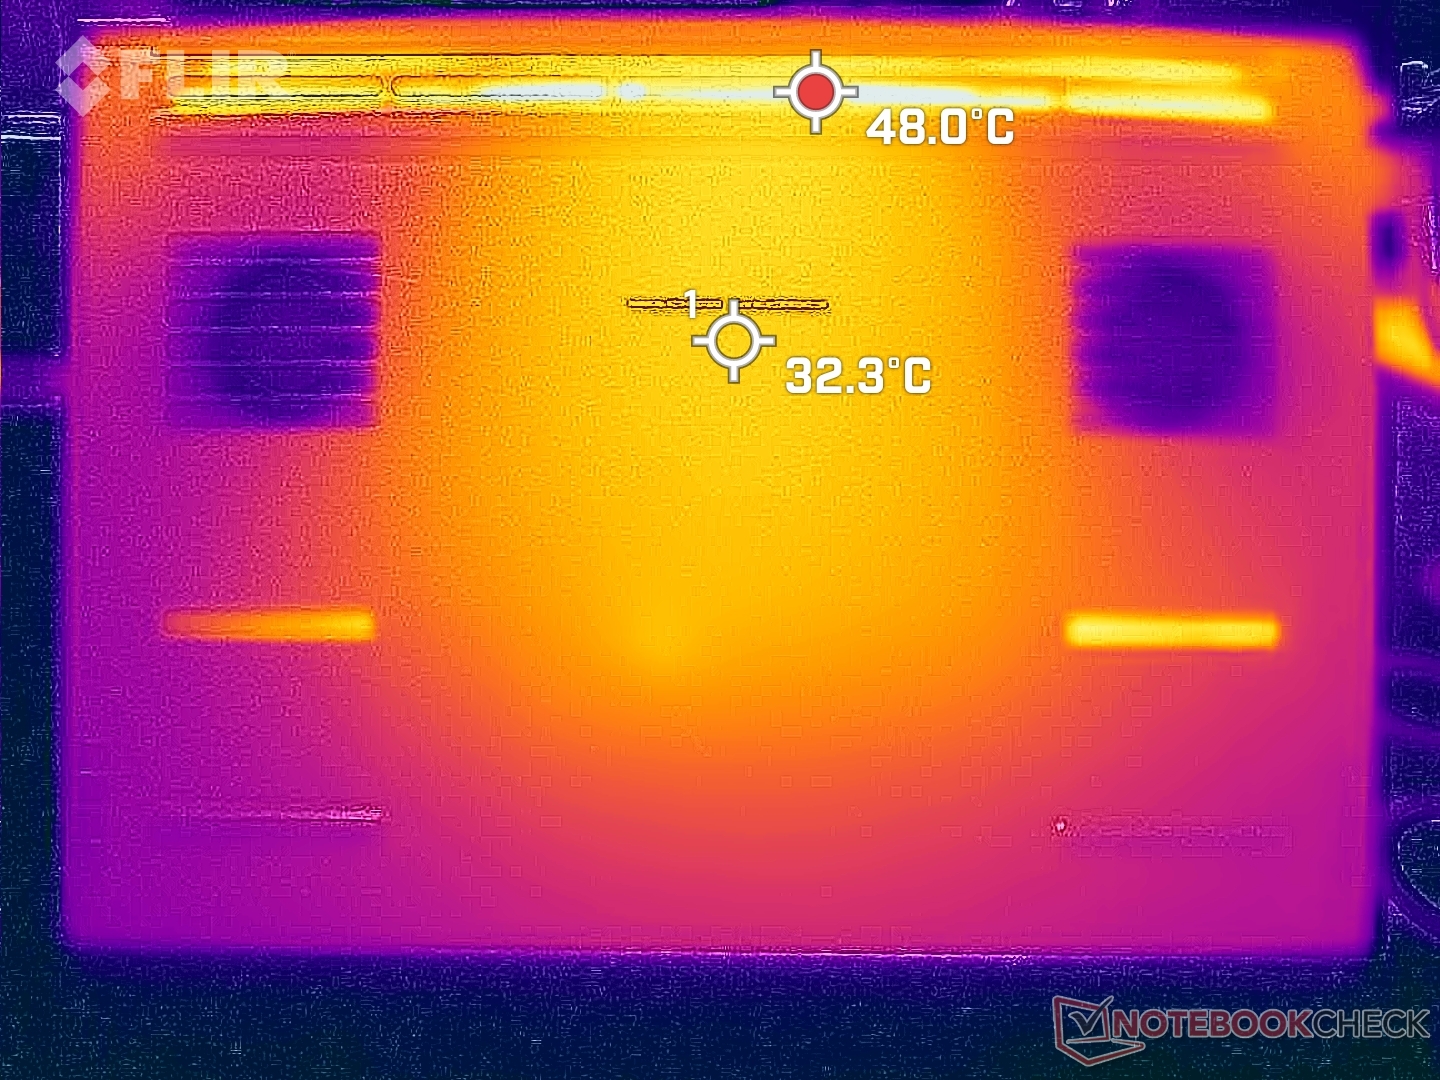
Surface temperatures are warmer than expected when idling or running undemanding loads and cooler than expected when gaming. Hot spots when idling on desktop, for example, can be as high as 32 C on both the top and bottom sides compared to only 21 C to 24 C on the Lenovo Legion Slim 7 16. This can be partly attributed to the inert fans of the Blade 16 leading to higher surface temperatures.
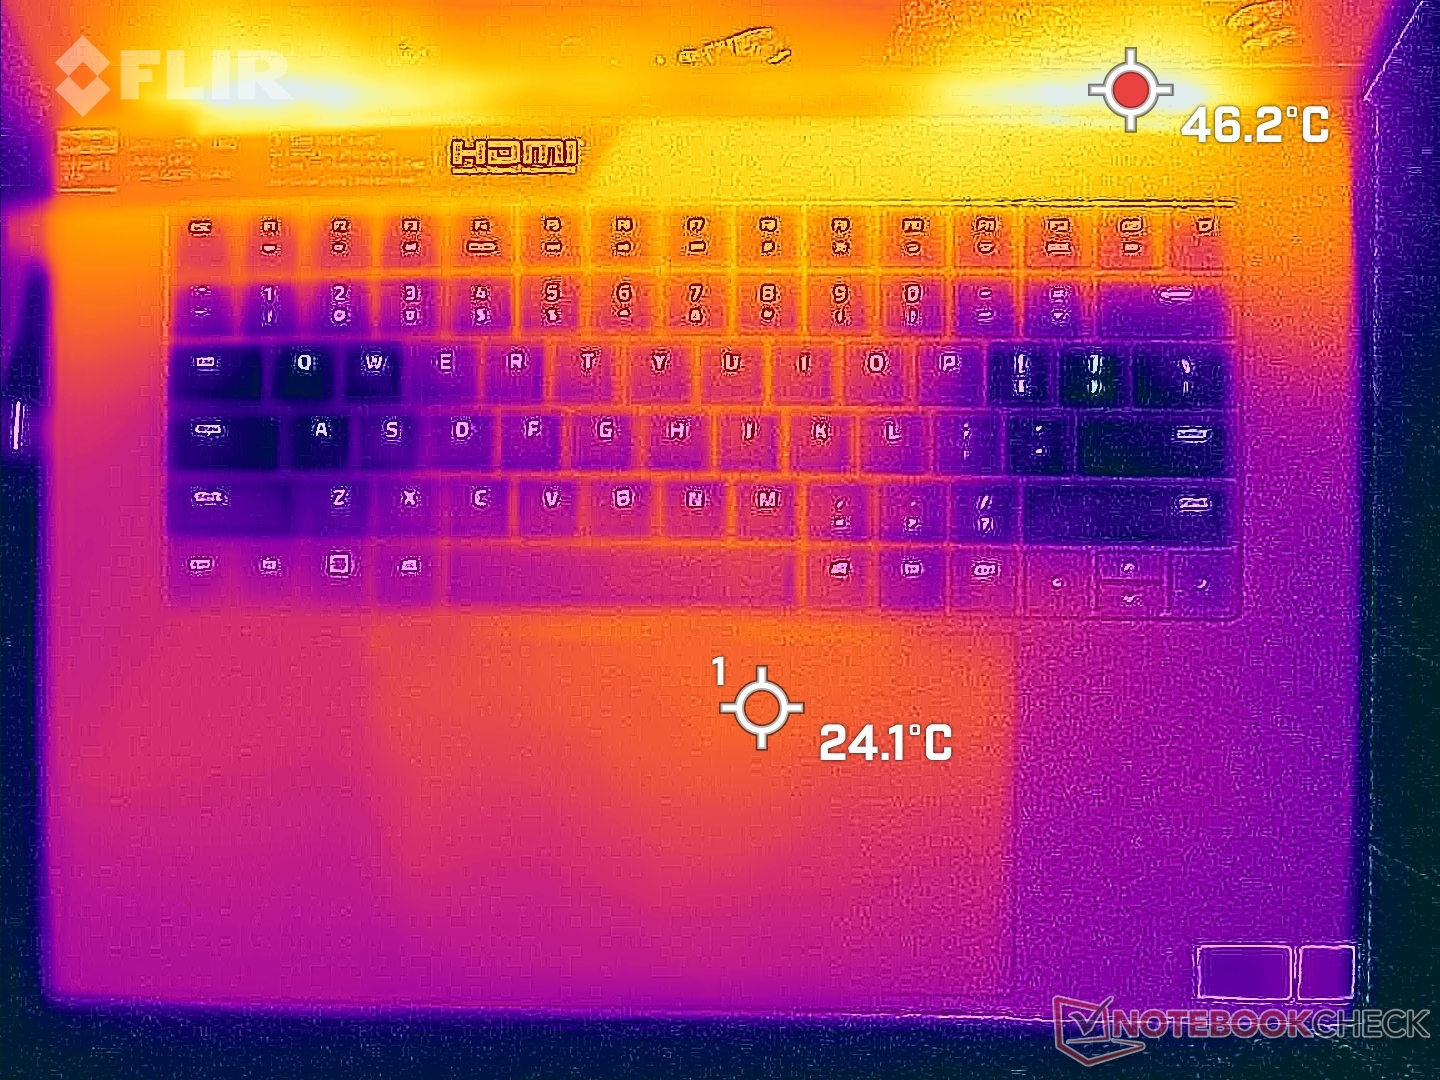
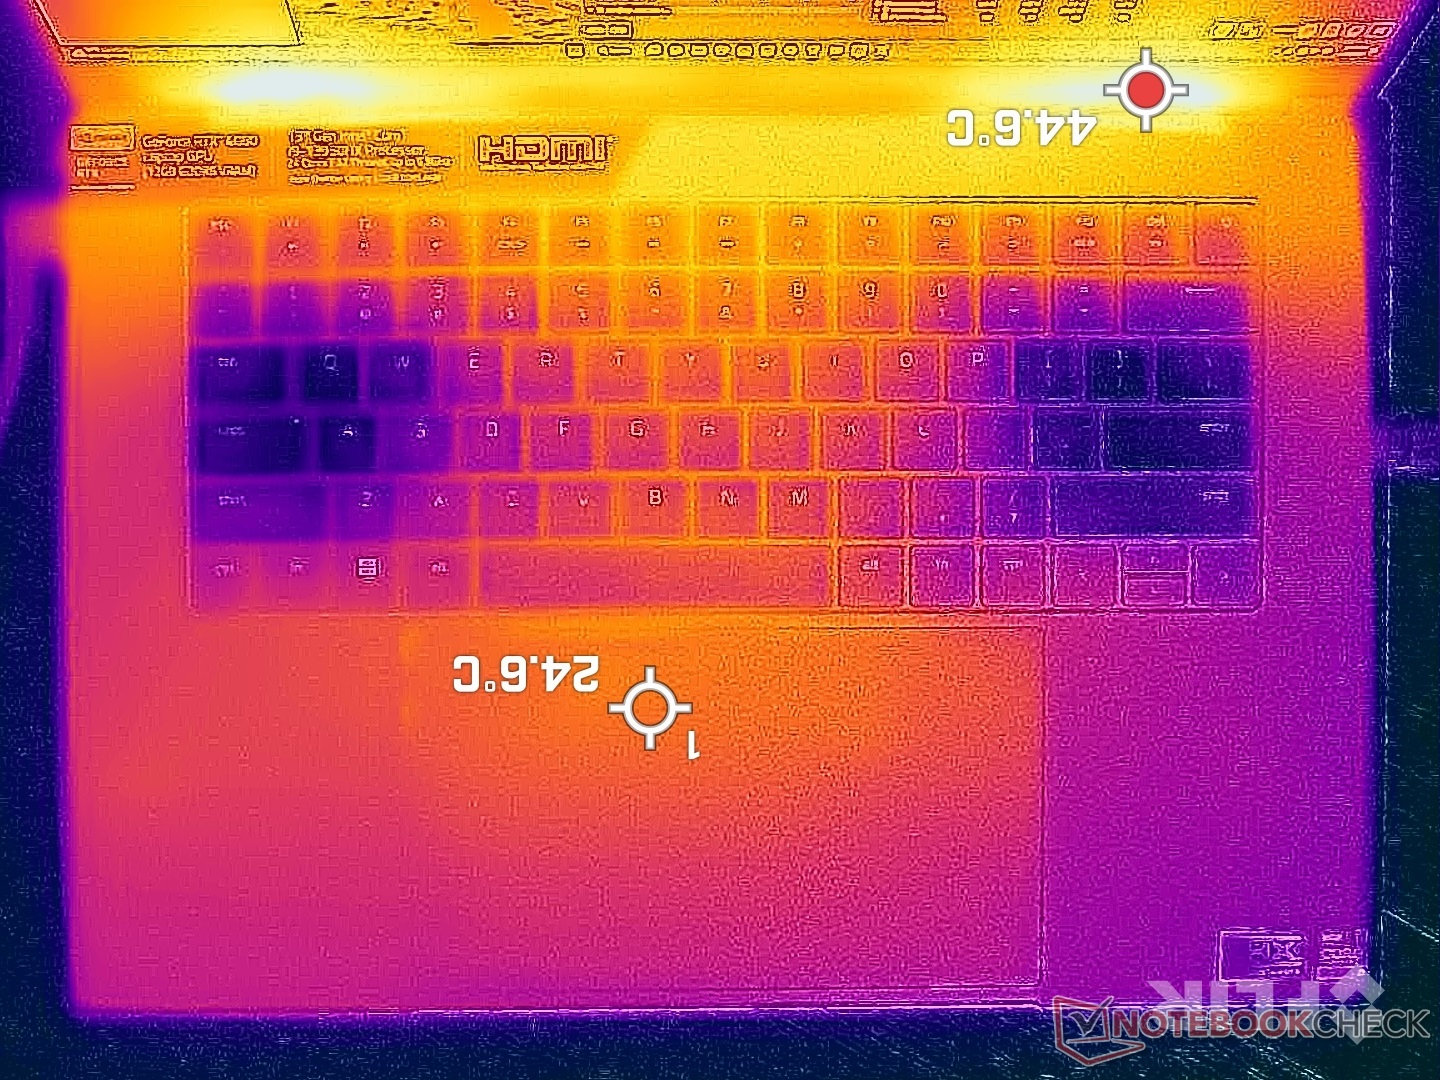
When gaming, surface temperatures are relatively cool especially on the keyboard deck considering the slim all-metal chassis and high performance. The keyboard center reaches only 31 C when running Witcher 3 for long periods compared to 39 C on the aforementioned Lenovo. Our hands or fingers would never feel uncomfortably warm no matter the onscreen load.
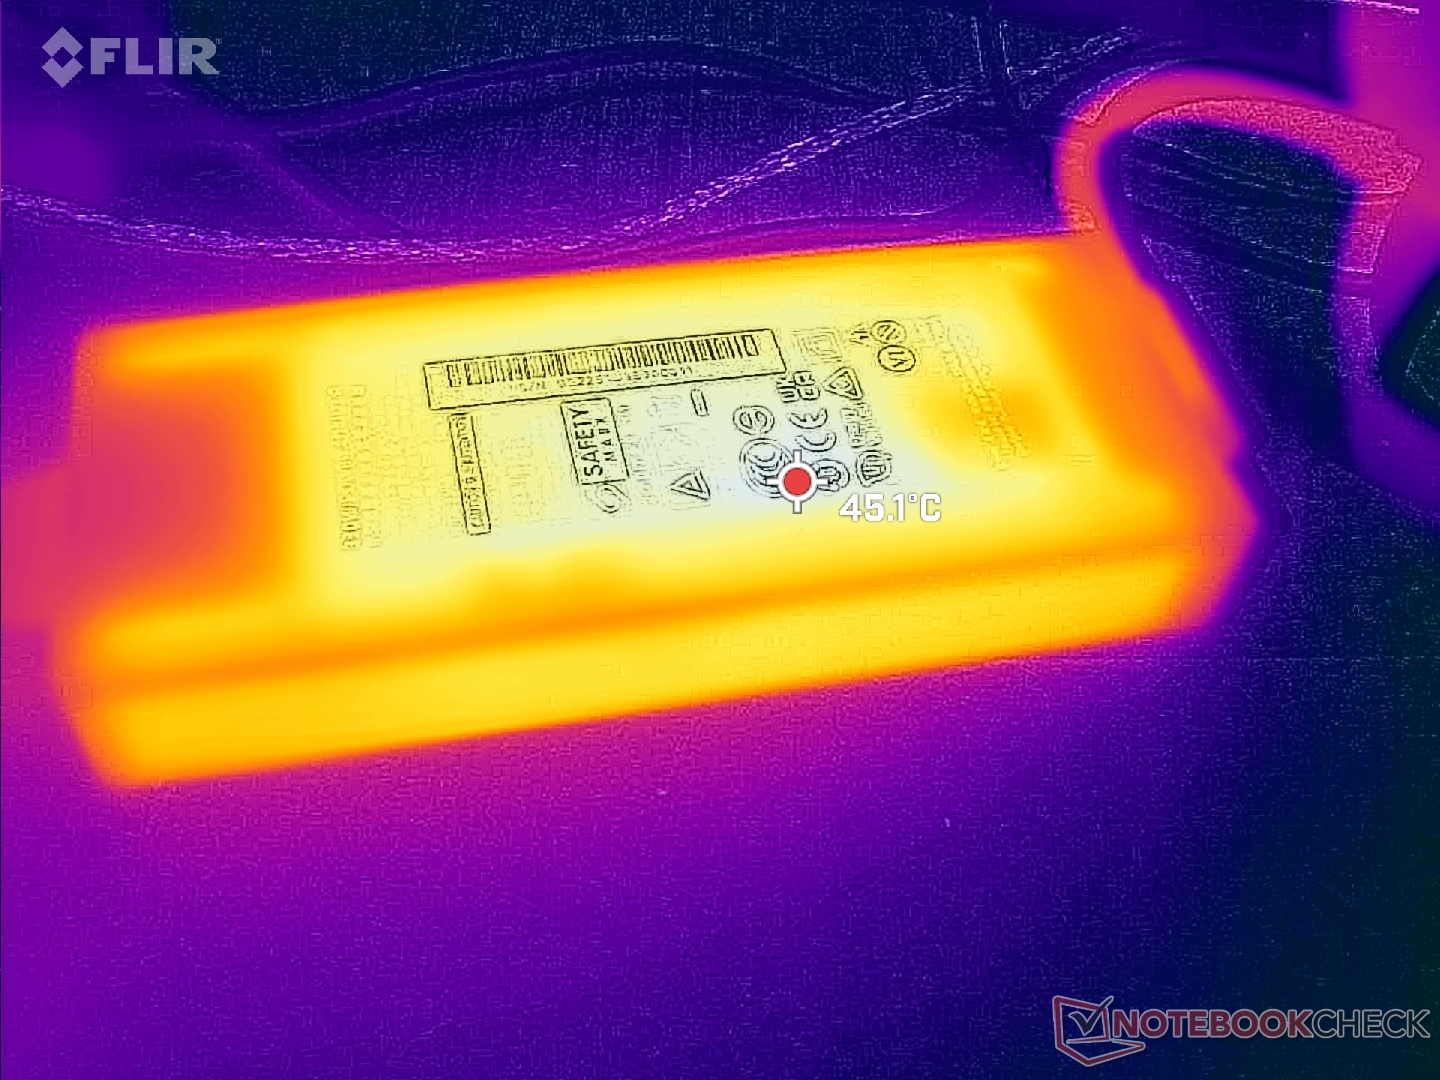
It's also worth mentioning that the new GaN adapter runs much cooler than the older Blade AC adapters where 60 C or warmer surface temperatures were common when under load.
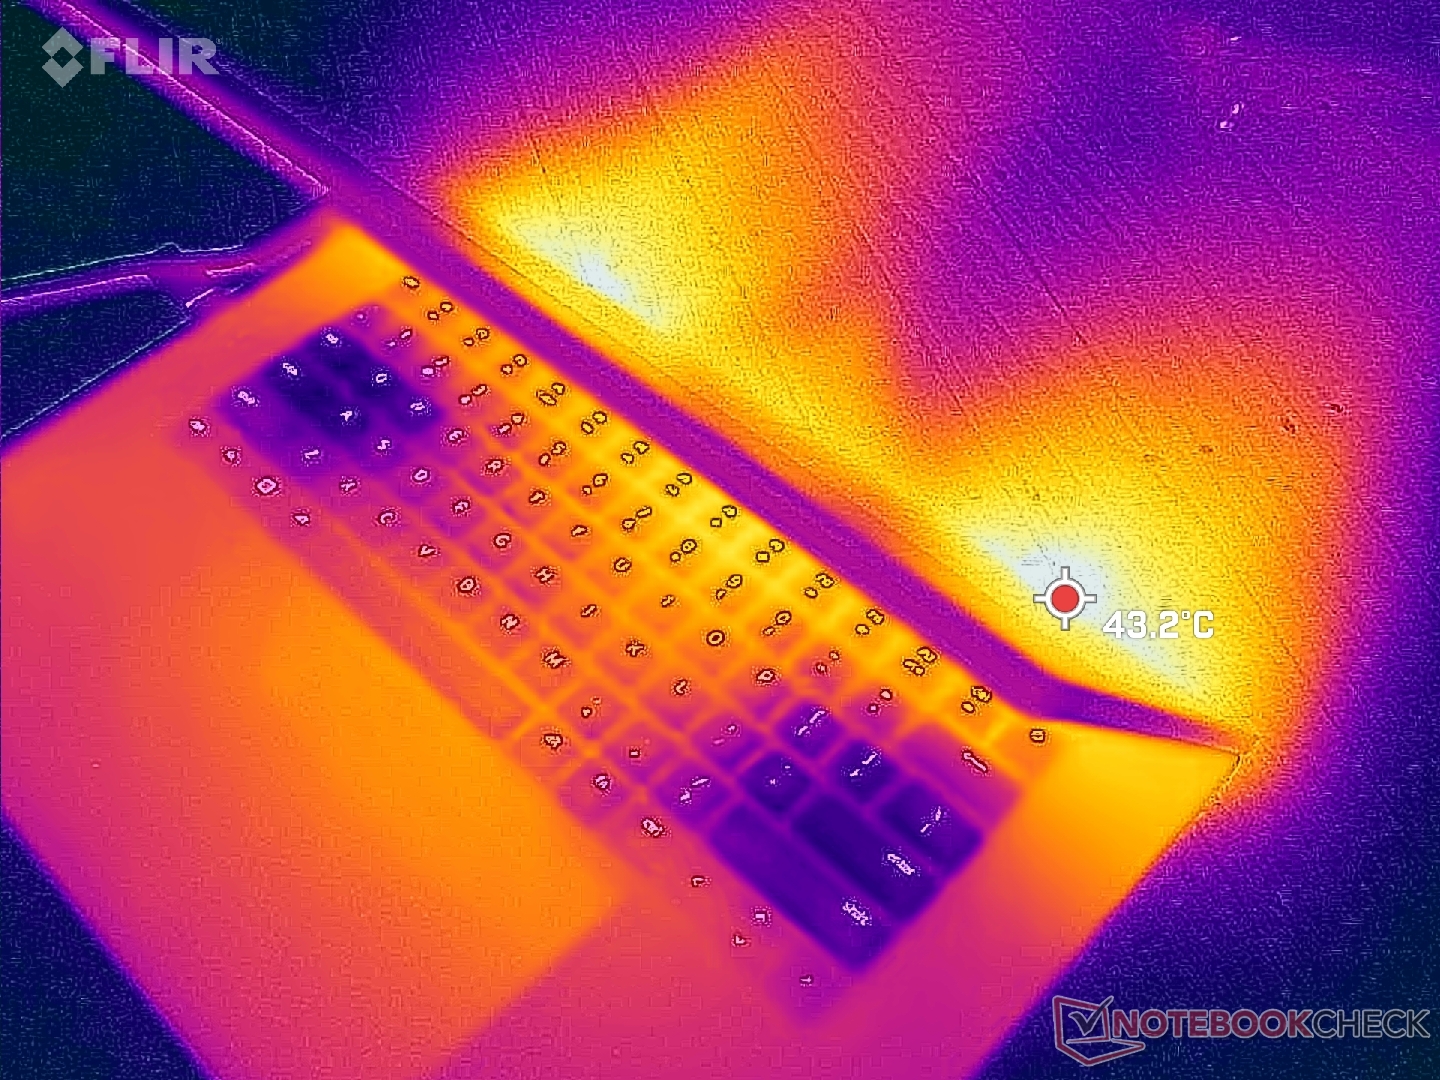
(±) The maximum temperature on the upper side is 40 °C / 104 F, compared to the average of 40.4 °C / 105 F, ranging from 21.2 to 68.8 °C for the class Gaming.
(+) The bottom heats up to a maximum of 37.6 °C / 100 F, compared to the average of 43.2 °C / 110 F
(+) In idle usage, the average temperature for the upper side is 27.3 °C / 81 F, compared to the device average of 33.9 °C / 93 F.
(+) Playing The Witcher 3, the average temperature for the upper side is 31.8 °C / 89 F, compared to the device average of 33.9 °C / 93 F.
(+) The palmrests and touchpad are cooler than skin temperature with a maximum of 30 °C / 86 F and are therefore cool to the touch.
(±) The average temperature of the palmrest area of similar devices was 28.8 °C / 83.8 F (-1.2 °C / -2.2 F).
| Razer Blade 16 Early 2023 Intel Core i9-13950HX, NVIDIA GeForce RTX 4080 Laptop GPU | Razer Blade 15 Advanced Model Early 2022 Intel Core i7-12800H, NVIDIA GeForce RTX 3080 Ti Laptop GPU | Lenovo Legion S7 16ARHA7 AMD Ryzen 9 6900HX, AMD Radeon RX 6800S | Dell G16 7620 Intel Core i7-12700H, NVIDIA GeForce RTX 3060 Laptop GPU | Asus ROG Zephyrus Duo 16 GX650RX AMD Ryzen 9 6900HX, NVIDIA GeForce RTX 3080 Ti Laptop GPU | HP Omen 16-n0033dx AMD Ryzen 7 6800H, AMD Radeon RX 6650M | MSI GE67 HX 12UGS Intel Core i7-12800HX, NVIDIA GeForce RTX 3070 Ti Laptop GPU | |
|---|---|---|---|---|---|---|---|
| Heat | -27% | -5% | -3% | -13% | -4% | 6% | |
| Maximum Upper Side * (°C) | 40 | 53 -33% | 46.6 -17% | 47.6 -19% | 45 -13% | 41.2 -3% | 34.4 14% |
| Maximum Bottom * (°C) | 37.6 | 53 -41% | 50.8 -35% | 54 -44% | 50 -33% | 53.2 -41% | 42 -12% |
| Idle Upper Side * (°C) | 32.4 | 36 -11% | 26.4 19% | 23 29% | 33 -2% | 26.4 19% | 24 26% |
| Idle Bottom * (°C) | 31.4 | 38 -21% | 27.2 13% | 24.6 22% | 33 -5% | 27.8 11% | 33.2 -6% |
* ... smaller is better
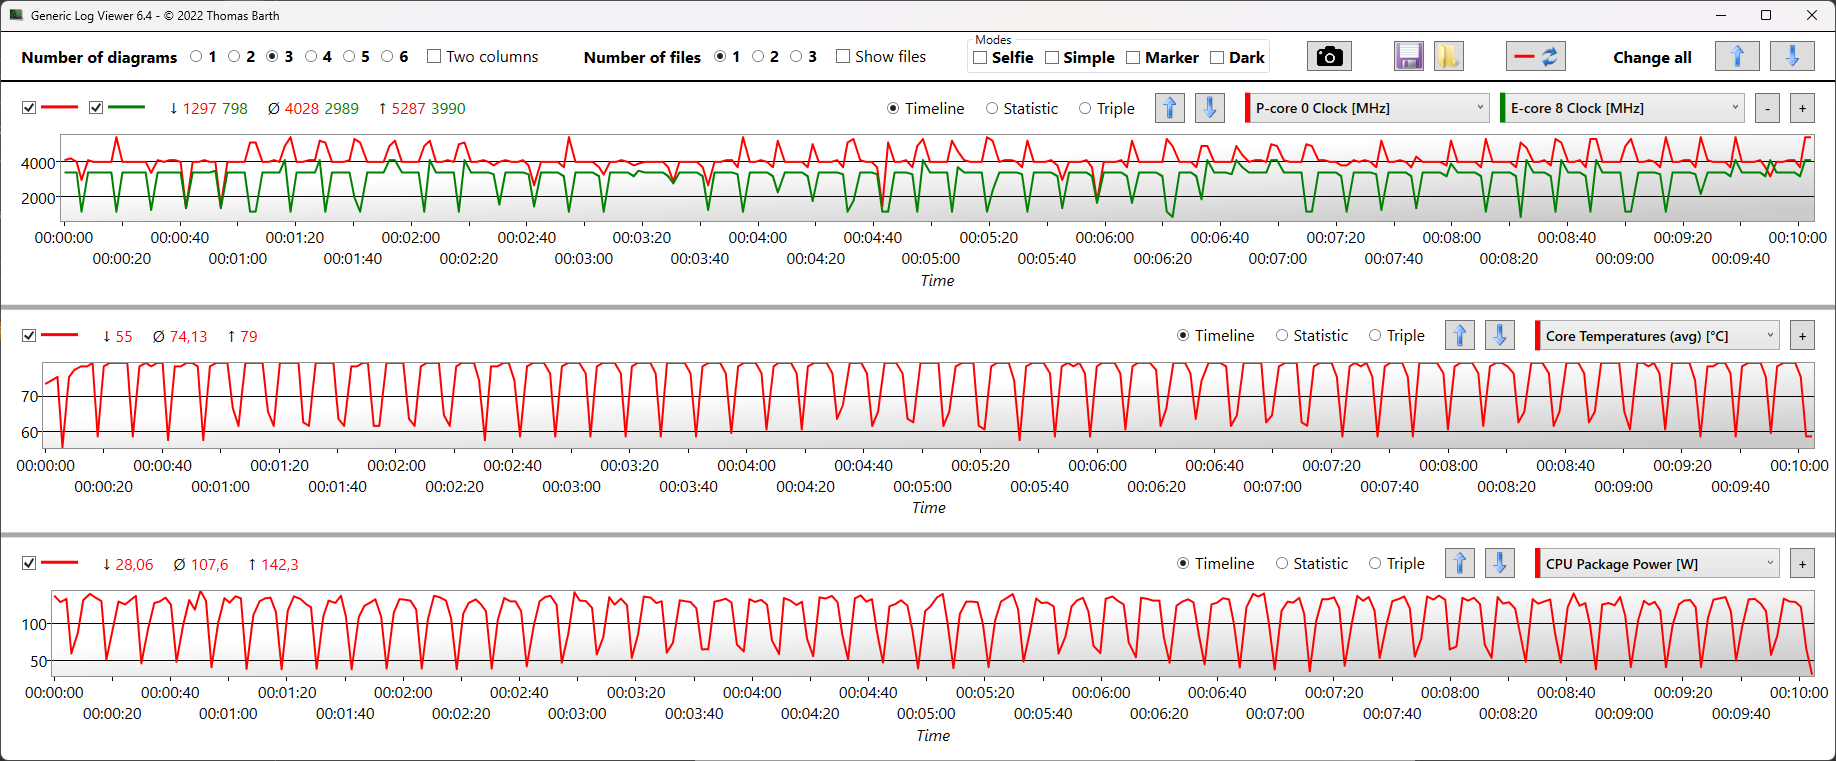
Stress Test
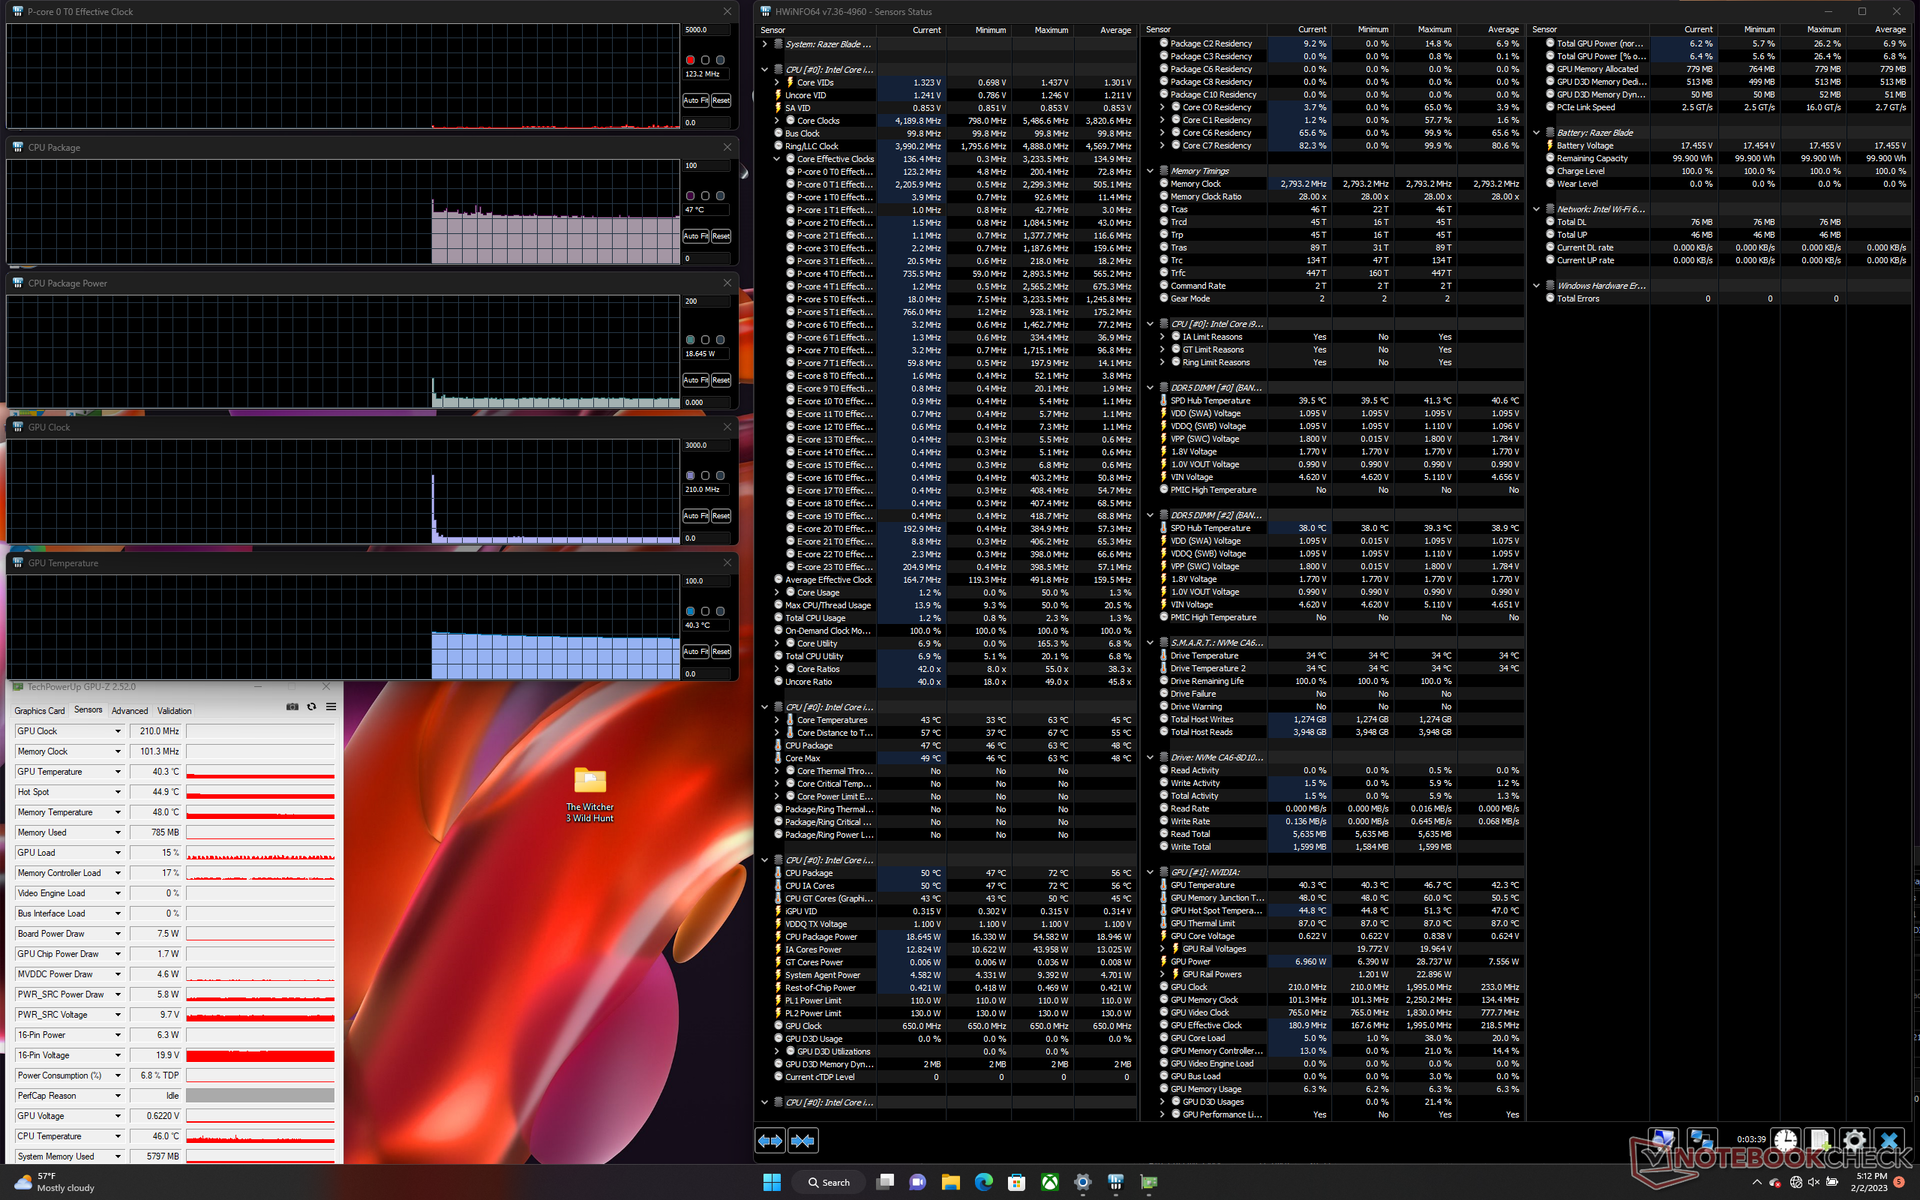
When stressed under Prime95, the CPU would boost to 3.8 GHz and 138 W for about 50 seconds before falling and stabilizing at ~3.1 GHz, 108 W, and 82 C. Maximum Turbo Boost is therefore only temporary even if on the highest Performance settings. Repeating this test on the Core i7-12800HX-powered MSI GE67 HX would result in both higher clock rates and a warmer core temperature of ~3.6 GHz and 87 C, respectively.
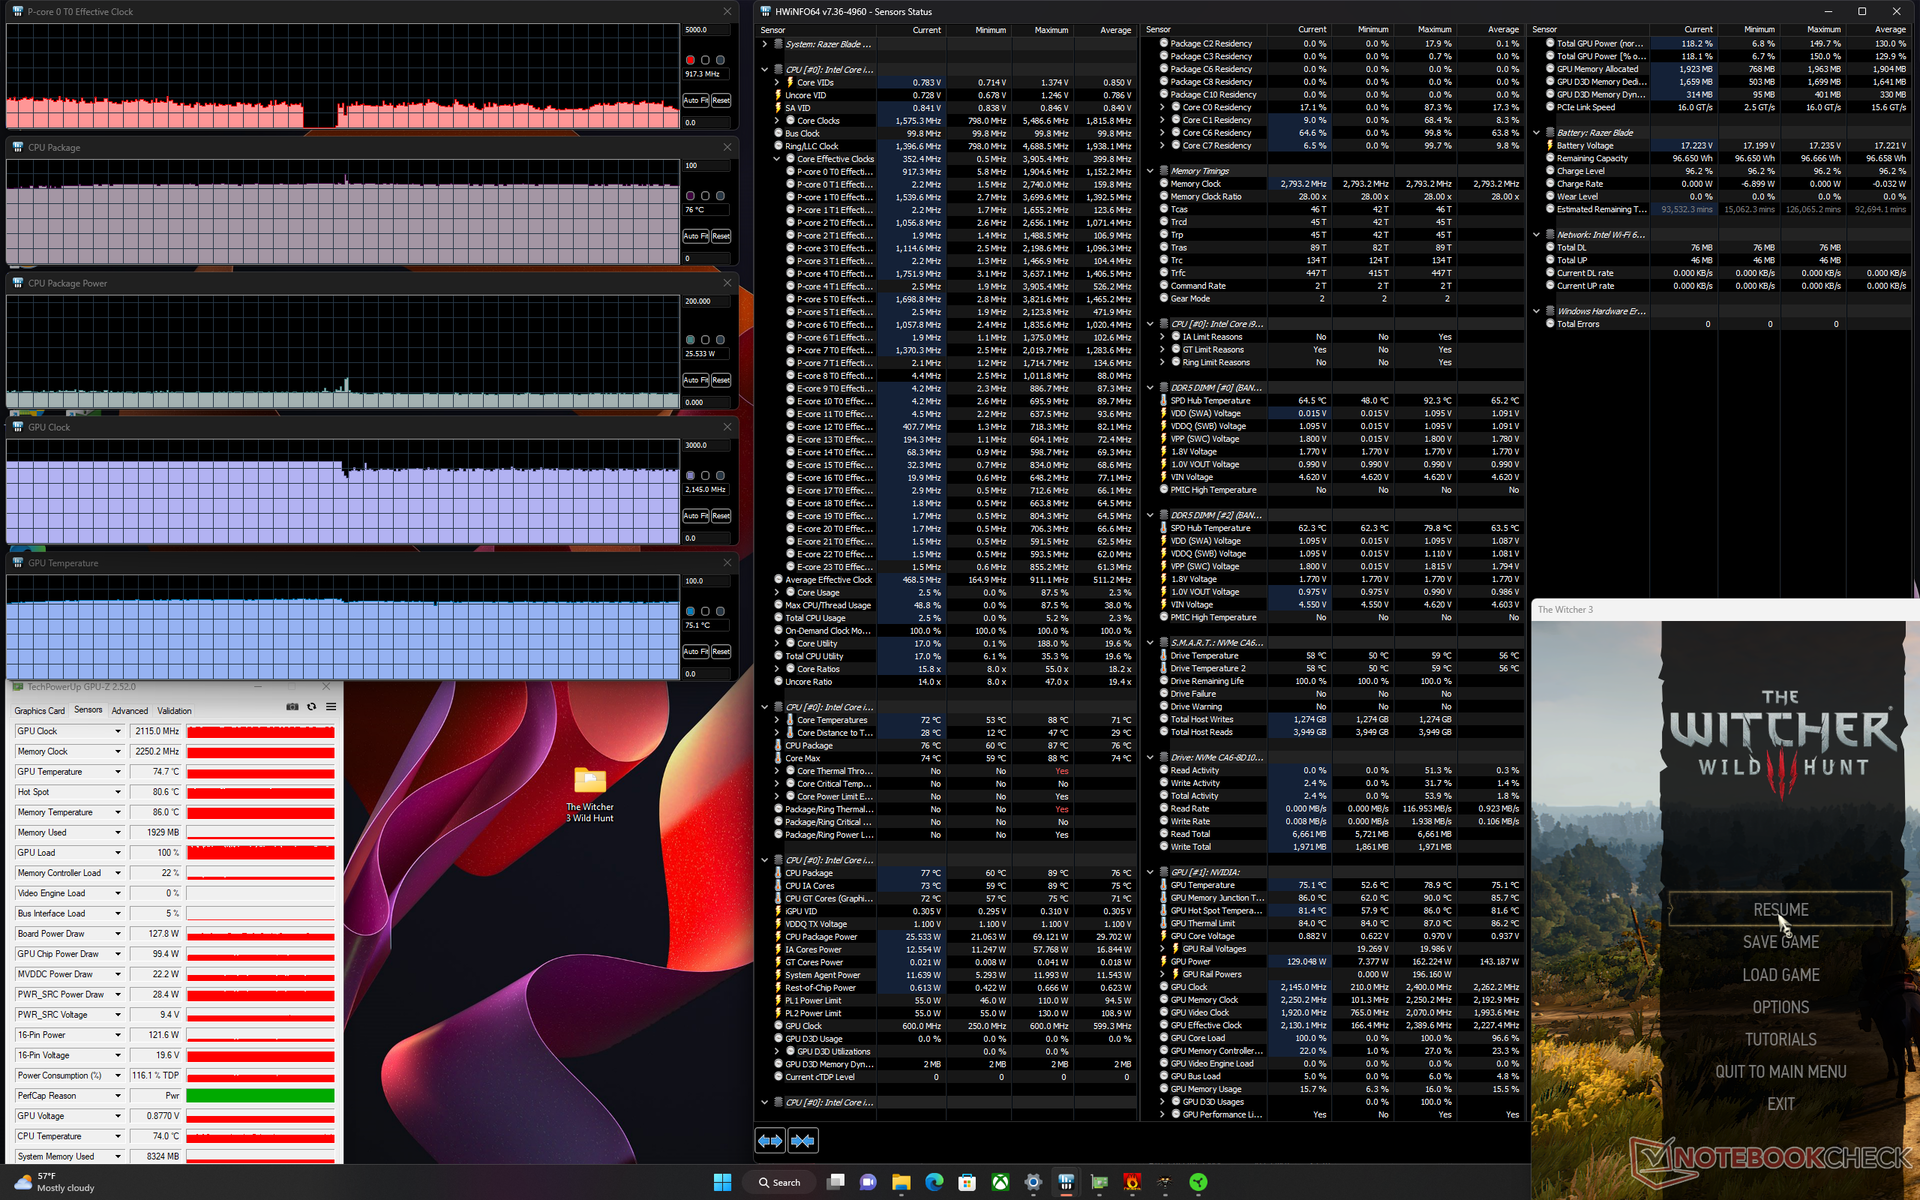
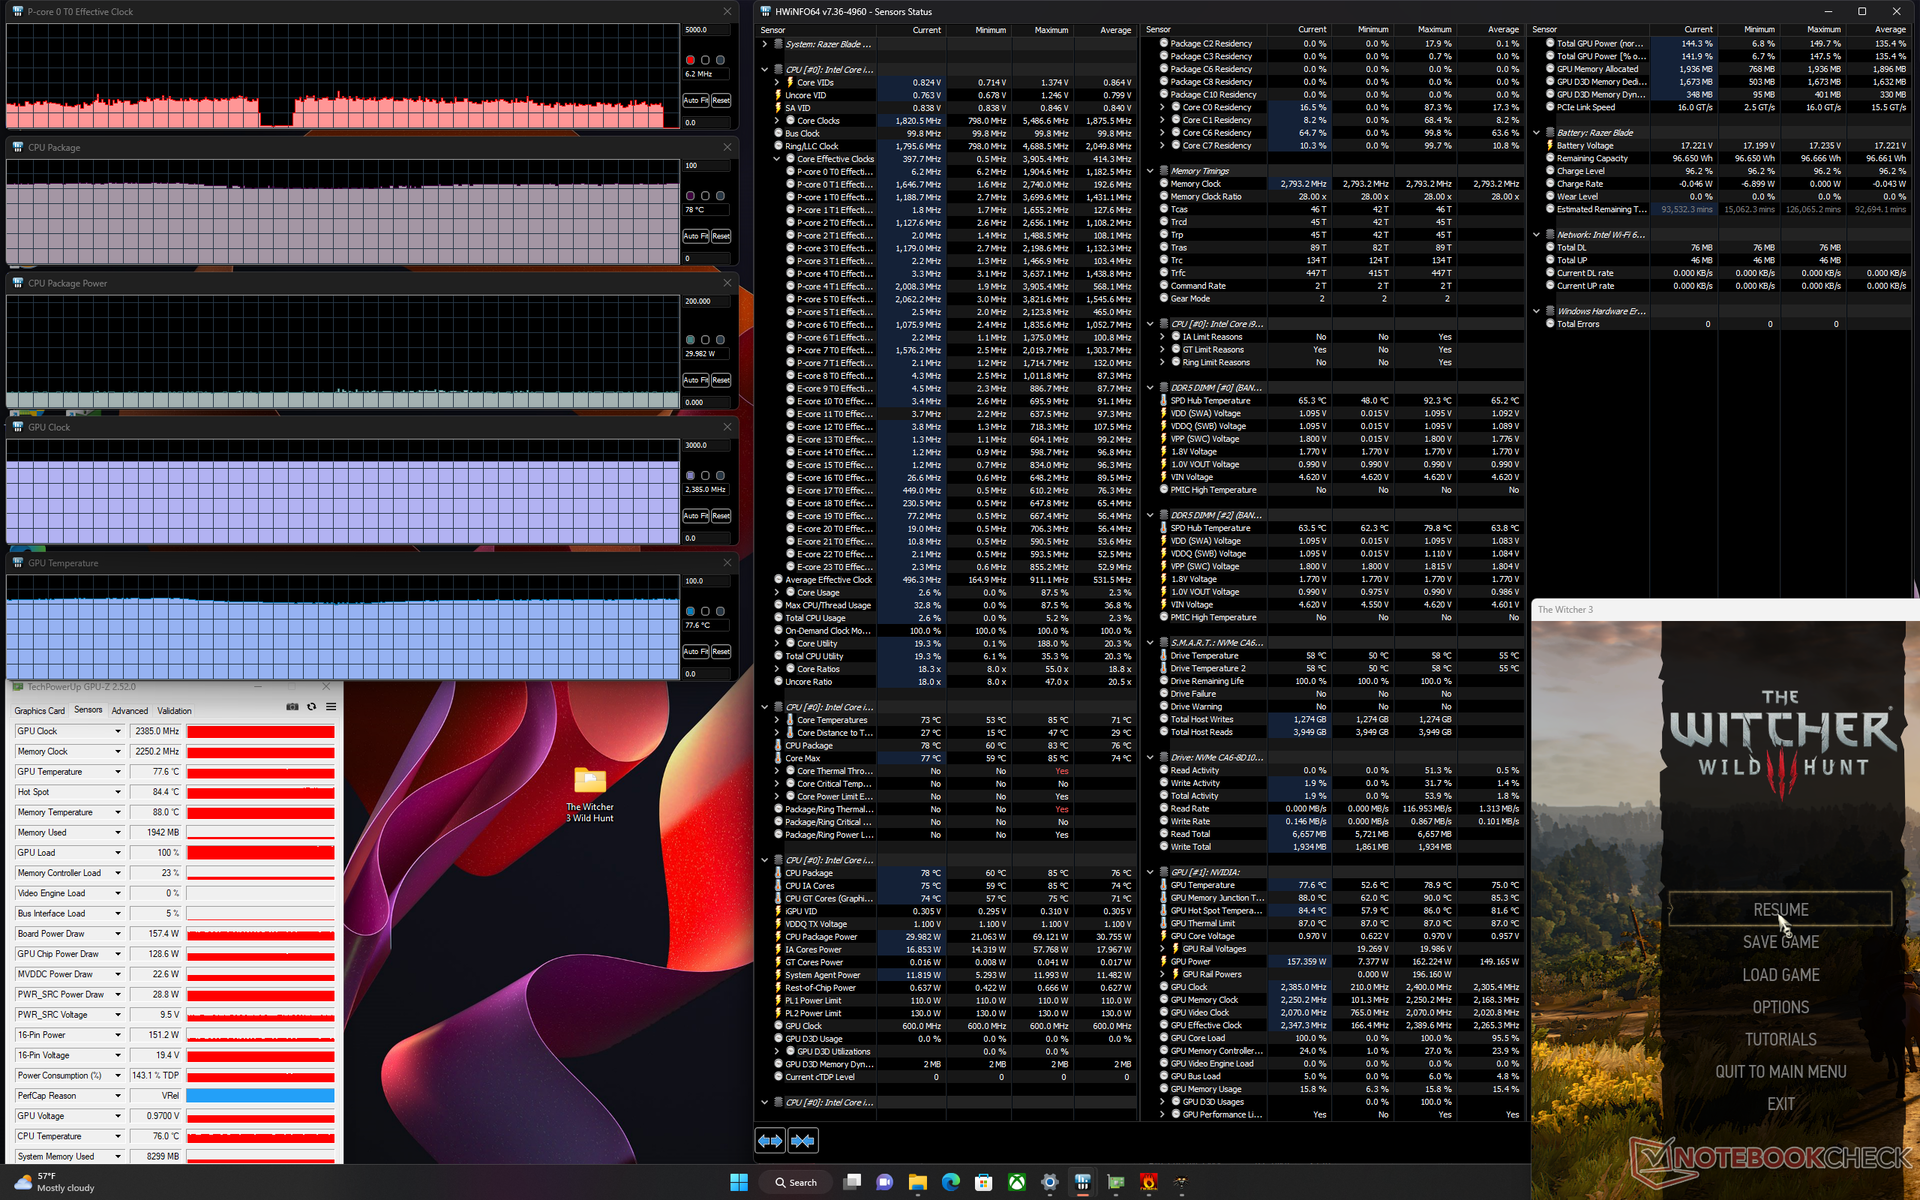
Running Witcher 3 on Performance mode would result in a stable GPU clock rate, memory clock, board power draw, and core temperature of 2385 MHz, 2250 MHz, 157 W, and 78 C, respectively, whereas Balanced mode would drop GPU clock rate, board power draw, and core temperature down to 2115 MHz, 128 W, and 75 C, respectively. Thus, users must remember to enable the Custom performance mode via Synapse and endure the louder maximum fan noise ceiling if they wish to run the GPU at its highest potential. These performance differences between power profiles match our GPU performance observations above.
Repeating the above Witcher 3 test on the 2022 Blade 15 with the 110 W RTX 3080 Ti would result in slower GPU clock rates and a cooler core temperature of 1455 MHz and 67 C, respectively. The Blade 16 may be faster, but it's certainly warmer and more demanding in the process.
Though Razer advertises a peak TGP of 175 W, we're only able to record a maximum stable range between 157 W and 162 W when running demanding games. It'll be interesting to see how future GeForce RTX 4080 laptops will compare in this regard as the Blade 16 is only our first.
Running on battery power limits performance. A Time Spy test on batteries would return Physics and Graphics scores of 8611 and 8085 points, respectively, compared to 13991 and 18441 points when on mains.
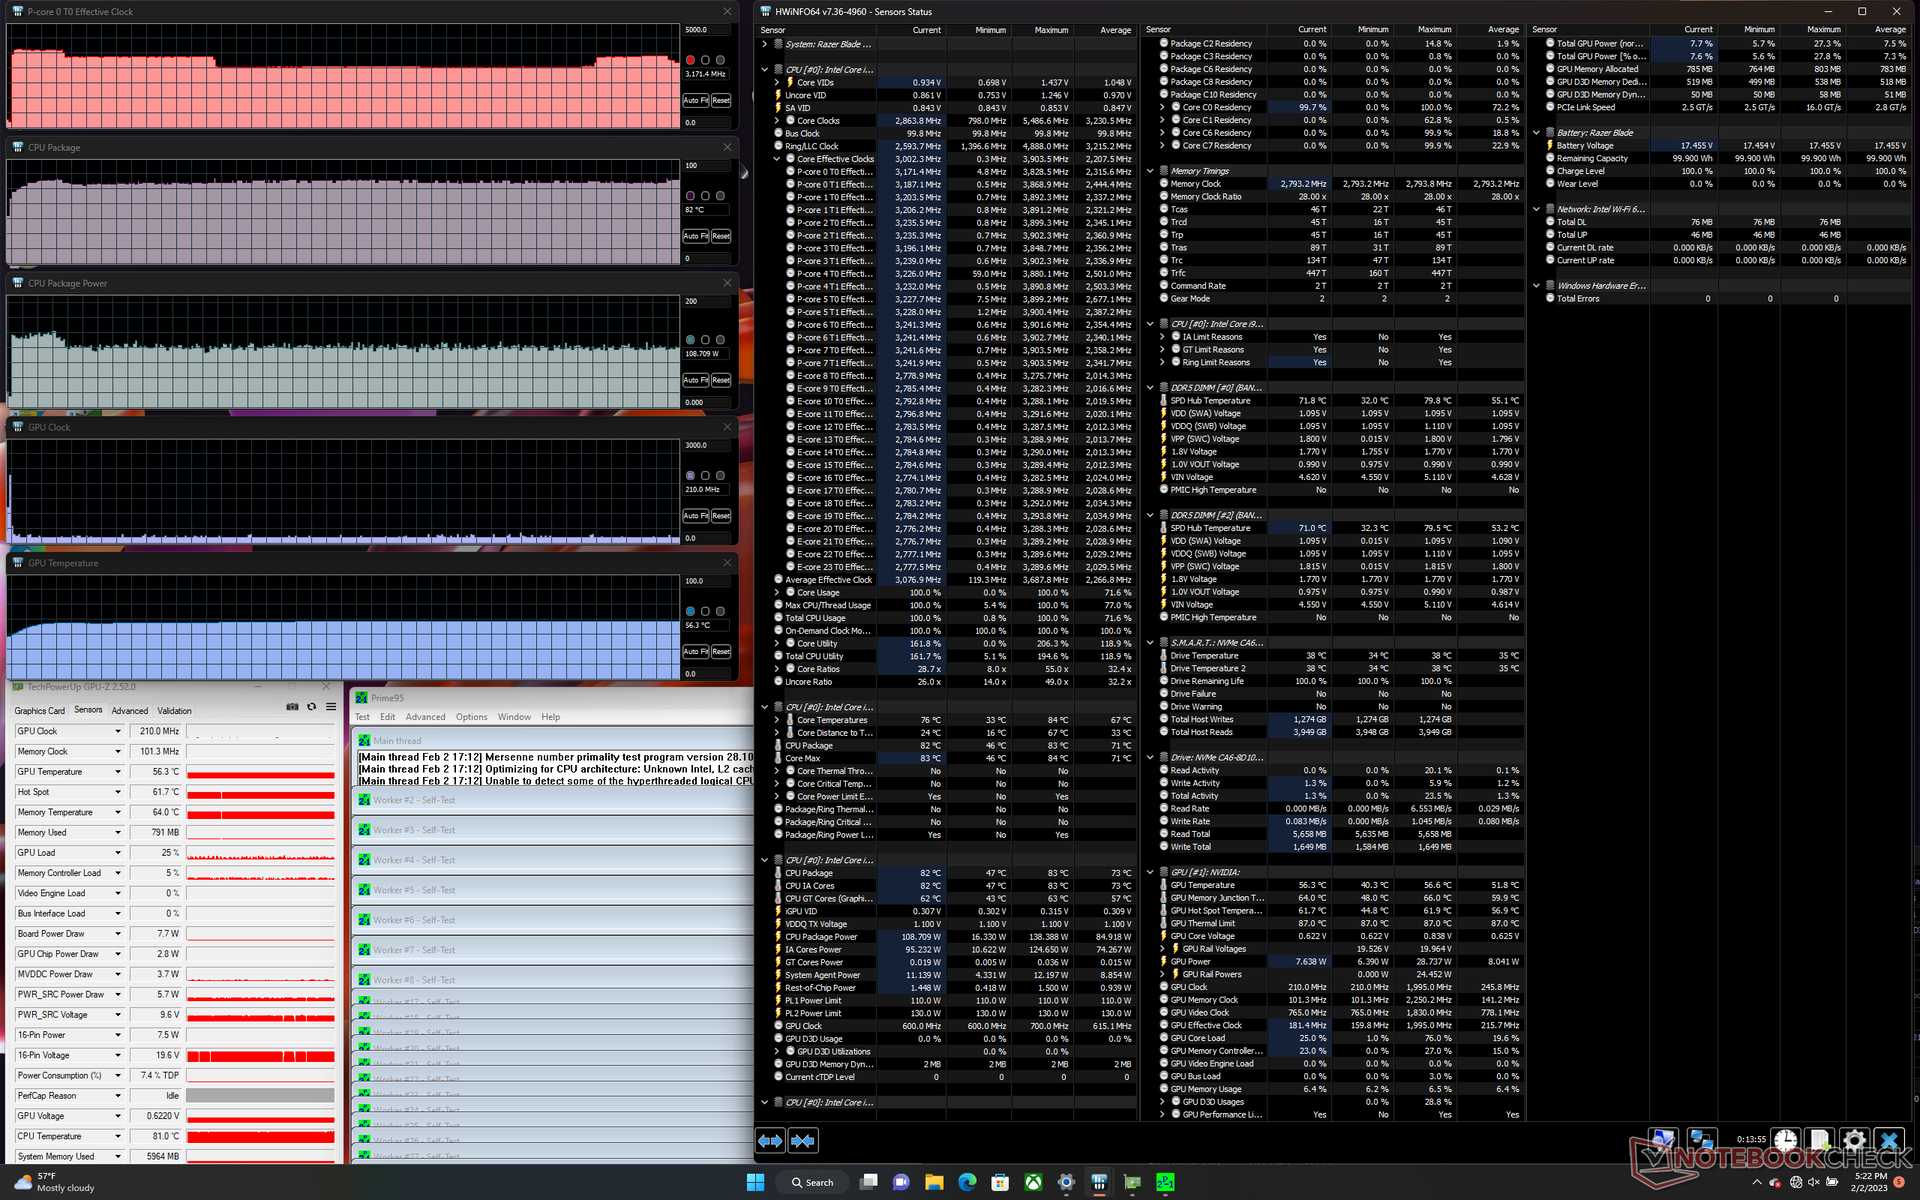
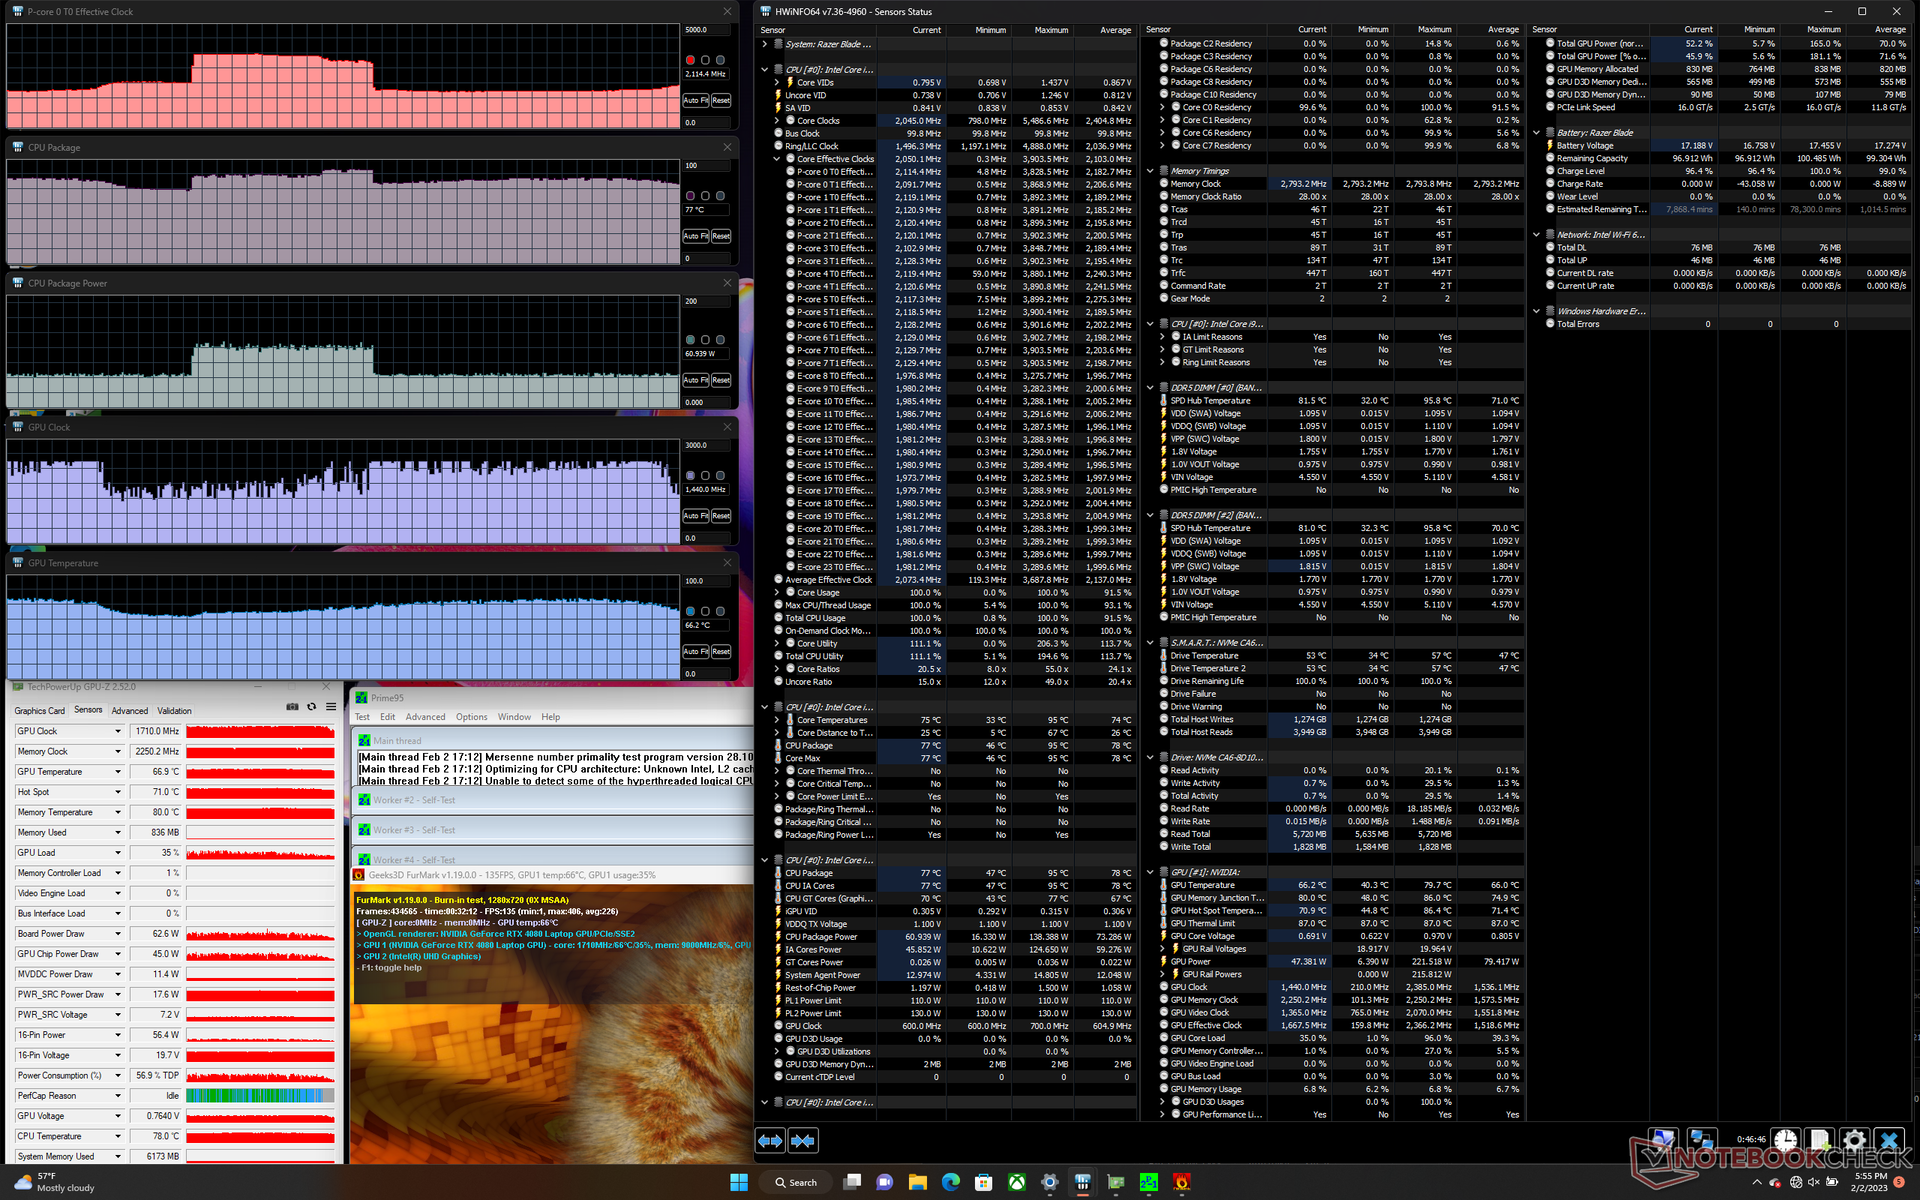
| CPU Clock (GHz) | GPU Clock (MHz) | Average CPU Temperature (°C) | Average GPU Temperature (°C) | |
| System Idle | -- | -- | 47 | 40 |
| Prime95 Stress | 3.0 - 3.5 | -- | 82 | 56 |
| Prime95 + FurMark Stress | ~2.1 | ~1440 - 2357 | 77 - 95 | 62 - 80 |
| Witcher 3 Stress (Balanced profile) | ~1.0 | 2115 | 76 | 75 |
| Witcher 3 (Performance profile) | ~1.3 | 2385 | 78 | 78 |
Speakers
Razer Blade 16 Early 2023 audio analysis
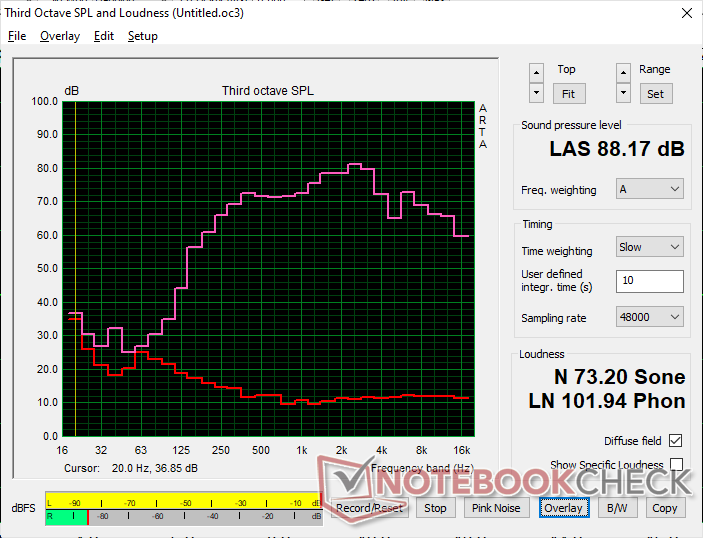
(+) | speakers can play relatively loud (88.2 dB)
Bass 100 - 315 Hz
(-) | nearly no bass - on average 16.4% lower than median
(±) | linearity of bass is average (10.8% delta to prev. frequency)
Mids 400 - 2000 Hz
(+) | balanced mids - only 2.5% away from median
(+) | mids are linear (2.4% delta to prev. frequency)
Highs 2 - 16 kHz
(+) | balanced highs - only 4.9% away from median
(±) | linearity of highs is average (7.9% delta to prev. frequency)
Overall 100 - 16.000 Hz
(+) | overall sound is linear (12.6% difference to median)
Compared to same class
» 16% of all tested devices in this class were better, 3% similar, 81% worse
» The best had a delta of 6%, average was 18%, worst was 132%
Compared to all devices tested
» 11% of all tested devices were better, 2% similar, 86% worse
» The best had a delta of 4%, average was 24%, worst was 134%
Apple MacBook Pro 16 2021 M1 Pro audio analysis
(+) | speakers can play relatively loud (84.7 dB)
Bass 100 - 315 Hz
(+) | good bass - only 3.8% away from median
(+) | bass is linear (5.2% delta to prev. frequency)
Mids 400 - 2000 Hz
(+) | balanced mids - only 1.3% away from median
(+) | mids are linear (2.1% delta to prev. frequency)
Highs 2 - 16 kHz
(+) | balanced highs - only 1.9% away from median
(+) | highs are linear (2.7% delta to prev. frequency)
Overall 100 - 16.000 Hz
(+) | overall sound is linear (4.6% difference to median)
Compared to same class
» 0% of all tested devices in this class were better, 0% similar, 100% worse
» The best had a delta of 5%, average was 17%, worst was 45%
Compared to all devices tested
» 0% of all tested devices were better, 0% similar, 100% worse
» The best had a delta of 4%, average was 24%, worst was 134%
Energy Management — More Demanding Than Before
Power Consumption
All that extra performance doesn't come free as power consumption is some of the highest for any Blade model. Idling on desktop on Performance dGPU mode and at the maximum brightness setting, for example, would demand almost 50 W compared to half that on last year's Blade 15. Dialing the system down to Optimus mode is highly recommended if running undemanding loads as it would cut idling power consumption to just 15 W to 23 W only.
When running Witcher 3 to represent typical gaming loads, power consumption would be roughly 5 percent higher than on 2022 Blade 17 powered by the RTX 3080 Ti and 12th gen Core i9-12900H. Thankfully, the 40 percent boost in raw graphics power gen-to-gen more than makes up for the slight increase in power consumption. Nonetheless, the Blade 16 is still noticeably more demanding than most other Ampere-based gaming laptops including the Asus ROG Zephyrus Duo 16 or 2022 Razer Blade 15 by margins as high as 60 percent.
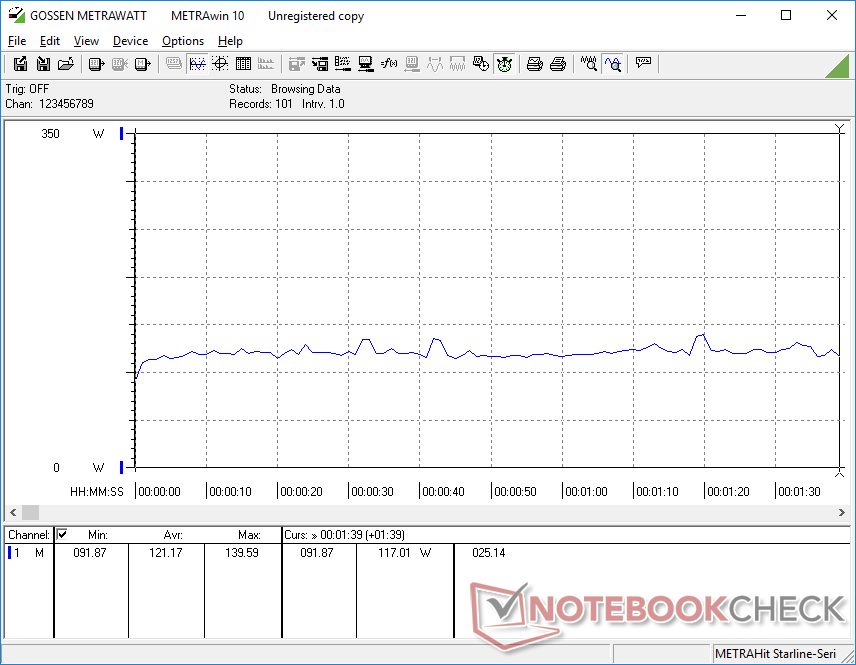
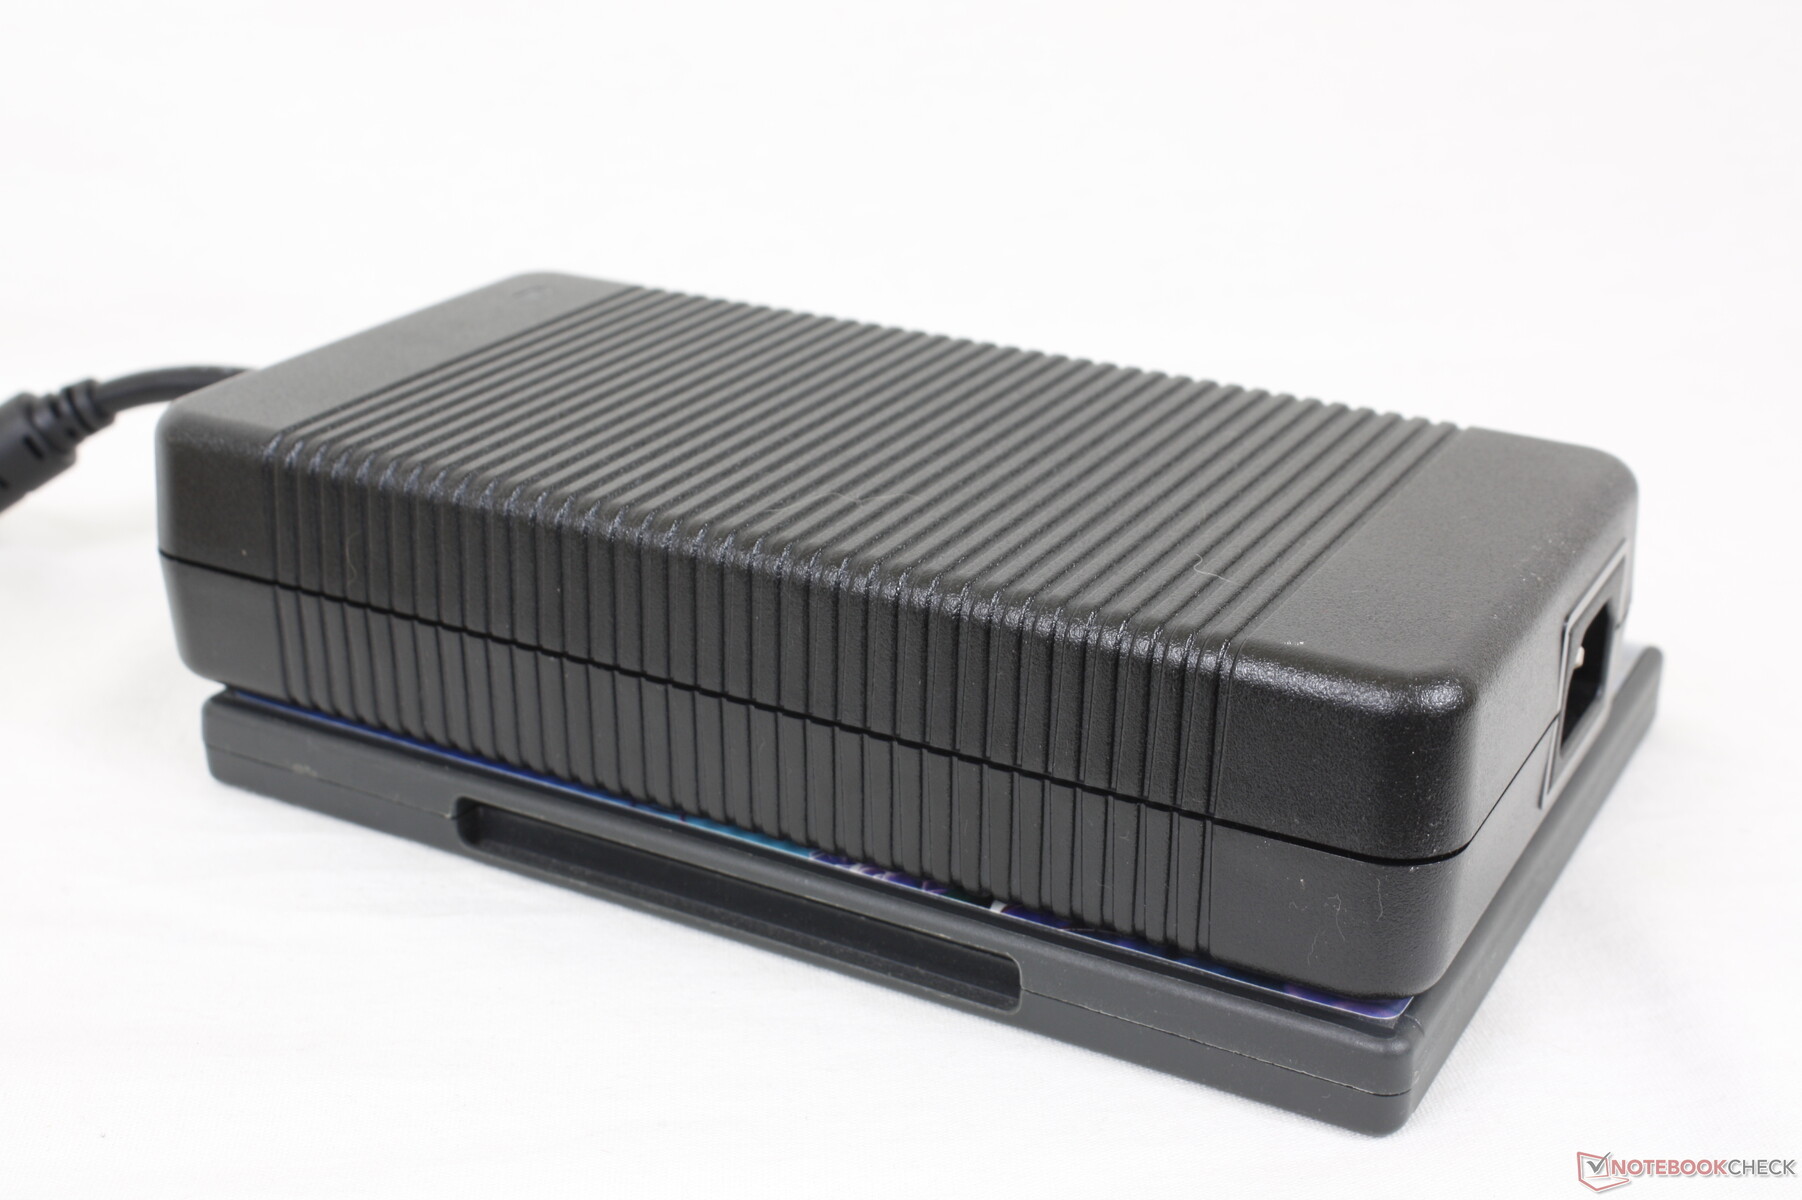
We're able to record a temporary maximum draw of 274 W when initiating both Prime95 and FurMark simultaneously. The included 330 W GaN AC adapter (18 x 7.5 x 2.5 cm) is slightly larger than the older 230 W and 280 W ones, but it is more compact relative to other 330 W AC adapters. The 330 W adapter that ships with the MSI GE67 HX, for example, is much bulkier at 20 x 9.8 x 4.3 cm.
| Off / Standby | |
| Idle | |
| Load |
|
Key:
min: | |
| Razer Blade 16 Early 2023 i9-13950HX, GeForce RTX 4080 Laptop GPU, SSSTC CA6-8D1024, IPS, 2560x1600, 16" | Razer Blade 15 Advanced Model Early 2022 i7-12800H, GeForce RTX 3080 Ti Laptop GPU, Samsung PM9A1 MZVL21T0HCLR, IPS, 1920x1080, 15.6" | Lenovo Legion S7 16ARHA7 R9 6900HX, Radeon RX 6800S, SK Hynix HFS001TEJ9X115N, IPS, 2560x1600, 16" | Dell G16 7620 i7-12700H, GeForce RTX 3060 Laptop GPU, WDC PC SN810 512GB, IPS, 2560x1600, 16" | Asus ROG Zephyrus Duo 16 GX650RX R9 6900HX, GeForce RTX 3080 Ti Laptop GPU, 2x Samsung SSD 980 Pro 2TB MZ-V8P2T0 (RAID 0), IPS-Level, 3840x2400, 16" | HP Omen 16-n0033dx R7 6800H, Radeon RX 6650M, Samsung PM9A1 MZVL21T0HCLR, IPS, 1920x1080, 16.1" | MSI GE67 HX 12UGS i7-12800HX, GeForce RTX 3070 Ti Laptop GPU, Samsung PM9A1 MZVL21T0HCLR, OLED, 1920x1080, 15.6" | |
|---|---|---|---|---|---|---|---|
| Power Consumption | 23% | 36% | 20% | 9% | 36% | 11% | |
| Idle Minimum * (Watt) | 15.2 | 17 -12% | 8.8 42% | 14.4 5% | 19 -25% | 7.9 48% | 16.1 -6% |
| Idle Average * (Watt) | 22.8 | 19 17% | 14.7 36% | 17.8 22% | 24 -5% | 11.5 50% | 17.1 25% |
| Idle Maximum * (Watt) | 49.8 | 25 50% | 19.8 60% | 31.5 37% | 31 38% | 18.3 63% | 26.6 47% |
| Load Average * (Watt) | 121.2 | 108 11% | 85.3 30% | 101.2 17% | 104 14% | 88.1 27% | 116.3 4% |
| Witcher 3 ultra * (Watt) | 242 | 150 38% | 167.5 31% | 176.9 27% | 186.5 23% | 206 15% | 237 2% |
| Load Maximum * (Watt) | 273.7 | 179 35% | 230.7 16% | 242.9 11% | 256 6% | 246.4 10% | 291.1 -6% |
* ... smaller is better
Power Consumption Witcher 3 / Stresstest
Power Consumption external Monitor
Battery Life
At 95 Wh, the battery in the Blade 16 is larger than the battery in both the Blade 15 (80 Wh) and even Blade 17 (82 Wh). Expect WLAN runtime to be about 1 to 2 hours longer for a total of roughly 6 hours.
Charging from empty to full capacity with the included AC adapter takes about an hour and 45 minutes. The system can also be recharged with USB-C adapters albeit at much slower rates.
| Razer Blade 16 Early 2023 i9-13950HX, GeForce RTX 4080 Laptop GPU, 95.2 Wh | Razer Blade 15 Advanced Model Early 2022 i7-12800H, GeForce RTX 3080 Ti Laptop GPU, 80 Wh | Lenovo Legion S7 16ARHA7 R9 6900HX, Radeon RX 6800S, 71 Wh | Dell G16 7620 i7-12700H, GeForce RTX 3060 Laptop GPU, 84 Wh | Asus ROG Zephyrus Duo 16 GX650RX R9 6900HX, GeForce RTX 3080 Ti Laptop GPU, 90 Wh | HP Omen 16-n0033dx R7 6800H, Radeon RX 6650M, 68 Wh | MSI GE67 HX 12UGS i7-12800HX, GeForce RTX 3070 Ti Laptop GPU, 99.9 Wh | |
|---|---|---|---|---|---|---|---|
| Battery runtime | 5% | 2% | -29% | 13% | 2% | 12% | |
| Reader / Idle (h) | 8.9 | 8.1 -9% | 7.1 -20% | 12.5 40% | 10 12% | 8.4 -6% | |
| WiFi v1.3 (h) | 6.1 | 4.9 -20% | 6.2 2% | 5 -18% | 7.8 28% | 7 15% | 5.6 -8% |
| Load (h) | 1.4 | 2 43% | 0.7 -50% | 1 -29% | 1.1 -21% | 2.1 50% | |
| H.264 (h) | 5.9 | 9.3 |
Pros
Cons
Verdict — A Better, But Bigger Blade
As Razer's first 16-inch Blade, the Blade 16 checks off all the right boxes including CPU performance, GPU performance, and that unmistakable Razer design. The 175 W GPU is particularly impressive as last year's alternatives like the Legion Slim 7 16 or Omen 16 have lower-power ~100 W GPUs in comparison. Nonetheless, models from competing manufacturers should fare better once they are properly updated with similar 13th gen Intel CPUs and GeForce 40 GPU options. The upcoming Alienware x16 is the most promising contender to the new Blade thus far.
The new 330 W GaN AC adapter is also worth praising as AC adapters from other makers continue to be much larger. Frequent travelers can definitely appreciate this advantage from Razer.
The Blade 16 and its slim AC adapter balance performance and portability better than any other 16-inch gaming laptop thus far. However, its thicker design may encourage some users to wait for an updated Blade 15 instead.
Perhaps the most noticeable compromises for the gen-to-gen performance gains are the higher power consumption and thicker profile. The Blade 16 draws noticeably more power than most existing 12th gen + RTX 3080 laptops when gaming and so the higher capacity 330 W AC adapter is necessary. The resulting higher cooling demands have made the Blade 16 the thickest model in the series to date including even the Blade 17. It's still a sleek design considering the 16-inch form factor, but it's certainly not as compact or portable as a Blade 15.
Other drawbacks are relatively minor like the spongy clickpad and loud fans are par for the course on many gaming laptops.
As for the mobile GeForce RTX 4080, it can be impressive or disappointing depending on your point of view. From a laptop perspective, it's a respectable leap over the mobile RTX 3080 especially with DLSS 3.0 enabled. From a desktop perspective, however, it's much slower than the RTX 4080 by wider margins than even the mobile RTX 3080 and desktop RTX 3080. Nvidia may want to consider reintroducing the "M" suffix for its mobile GeForce series due to this widening performance gap between the mobile and desktop graphics cards.
Price and Availability
Razer Blade 16 Early 2023
- 02/06/2023 v7 (old)
Allen Ngo
Transparency
The selection of devices to be reviewed is made by our editorial team. The test sample was provided to the author as a loan by the manufacturer or retailer for the purpose of this review. The lender had no influence on this review, nor did the manufacturer receive a copy of this review before publication. There was no obligation to publish this review. As an independent media company, Notebookcheck is not subjected to the authority of manufacturers, retailers or publishers.
This is how Notebookcheck is testing
Every year, Notebookcheck independently reviews hundreds of laptops and smartphones using standardized procedures to ensure that all results are comparable. We have continuously developed our test methods for around 20 years and set industry standards in the process. In our test labs, high-quality measuring equipment is utilized by experienced technicians and editors. These tests involve a multi-stage validation process. Our complex rating system is based on hundreds of well-founded measurements and benchmarks, which maintains objectivity. Further information on our test methods can be found here.
Price comparison
