


NVIDIA GeForce RTX 4090 Laptop GPU
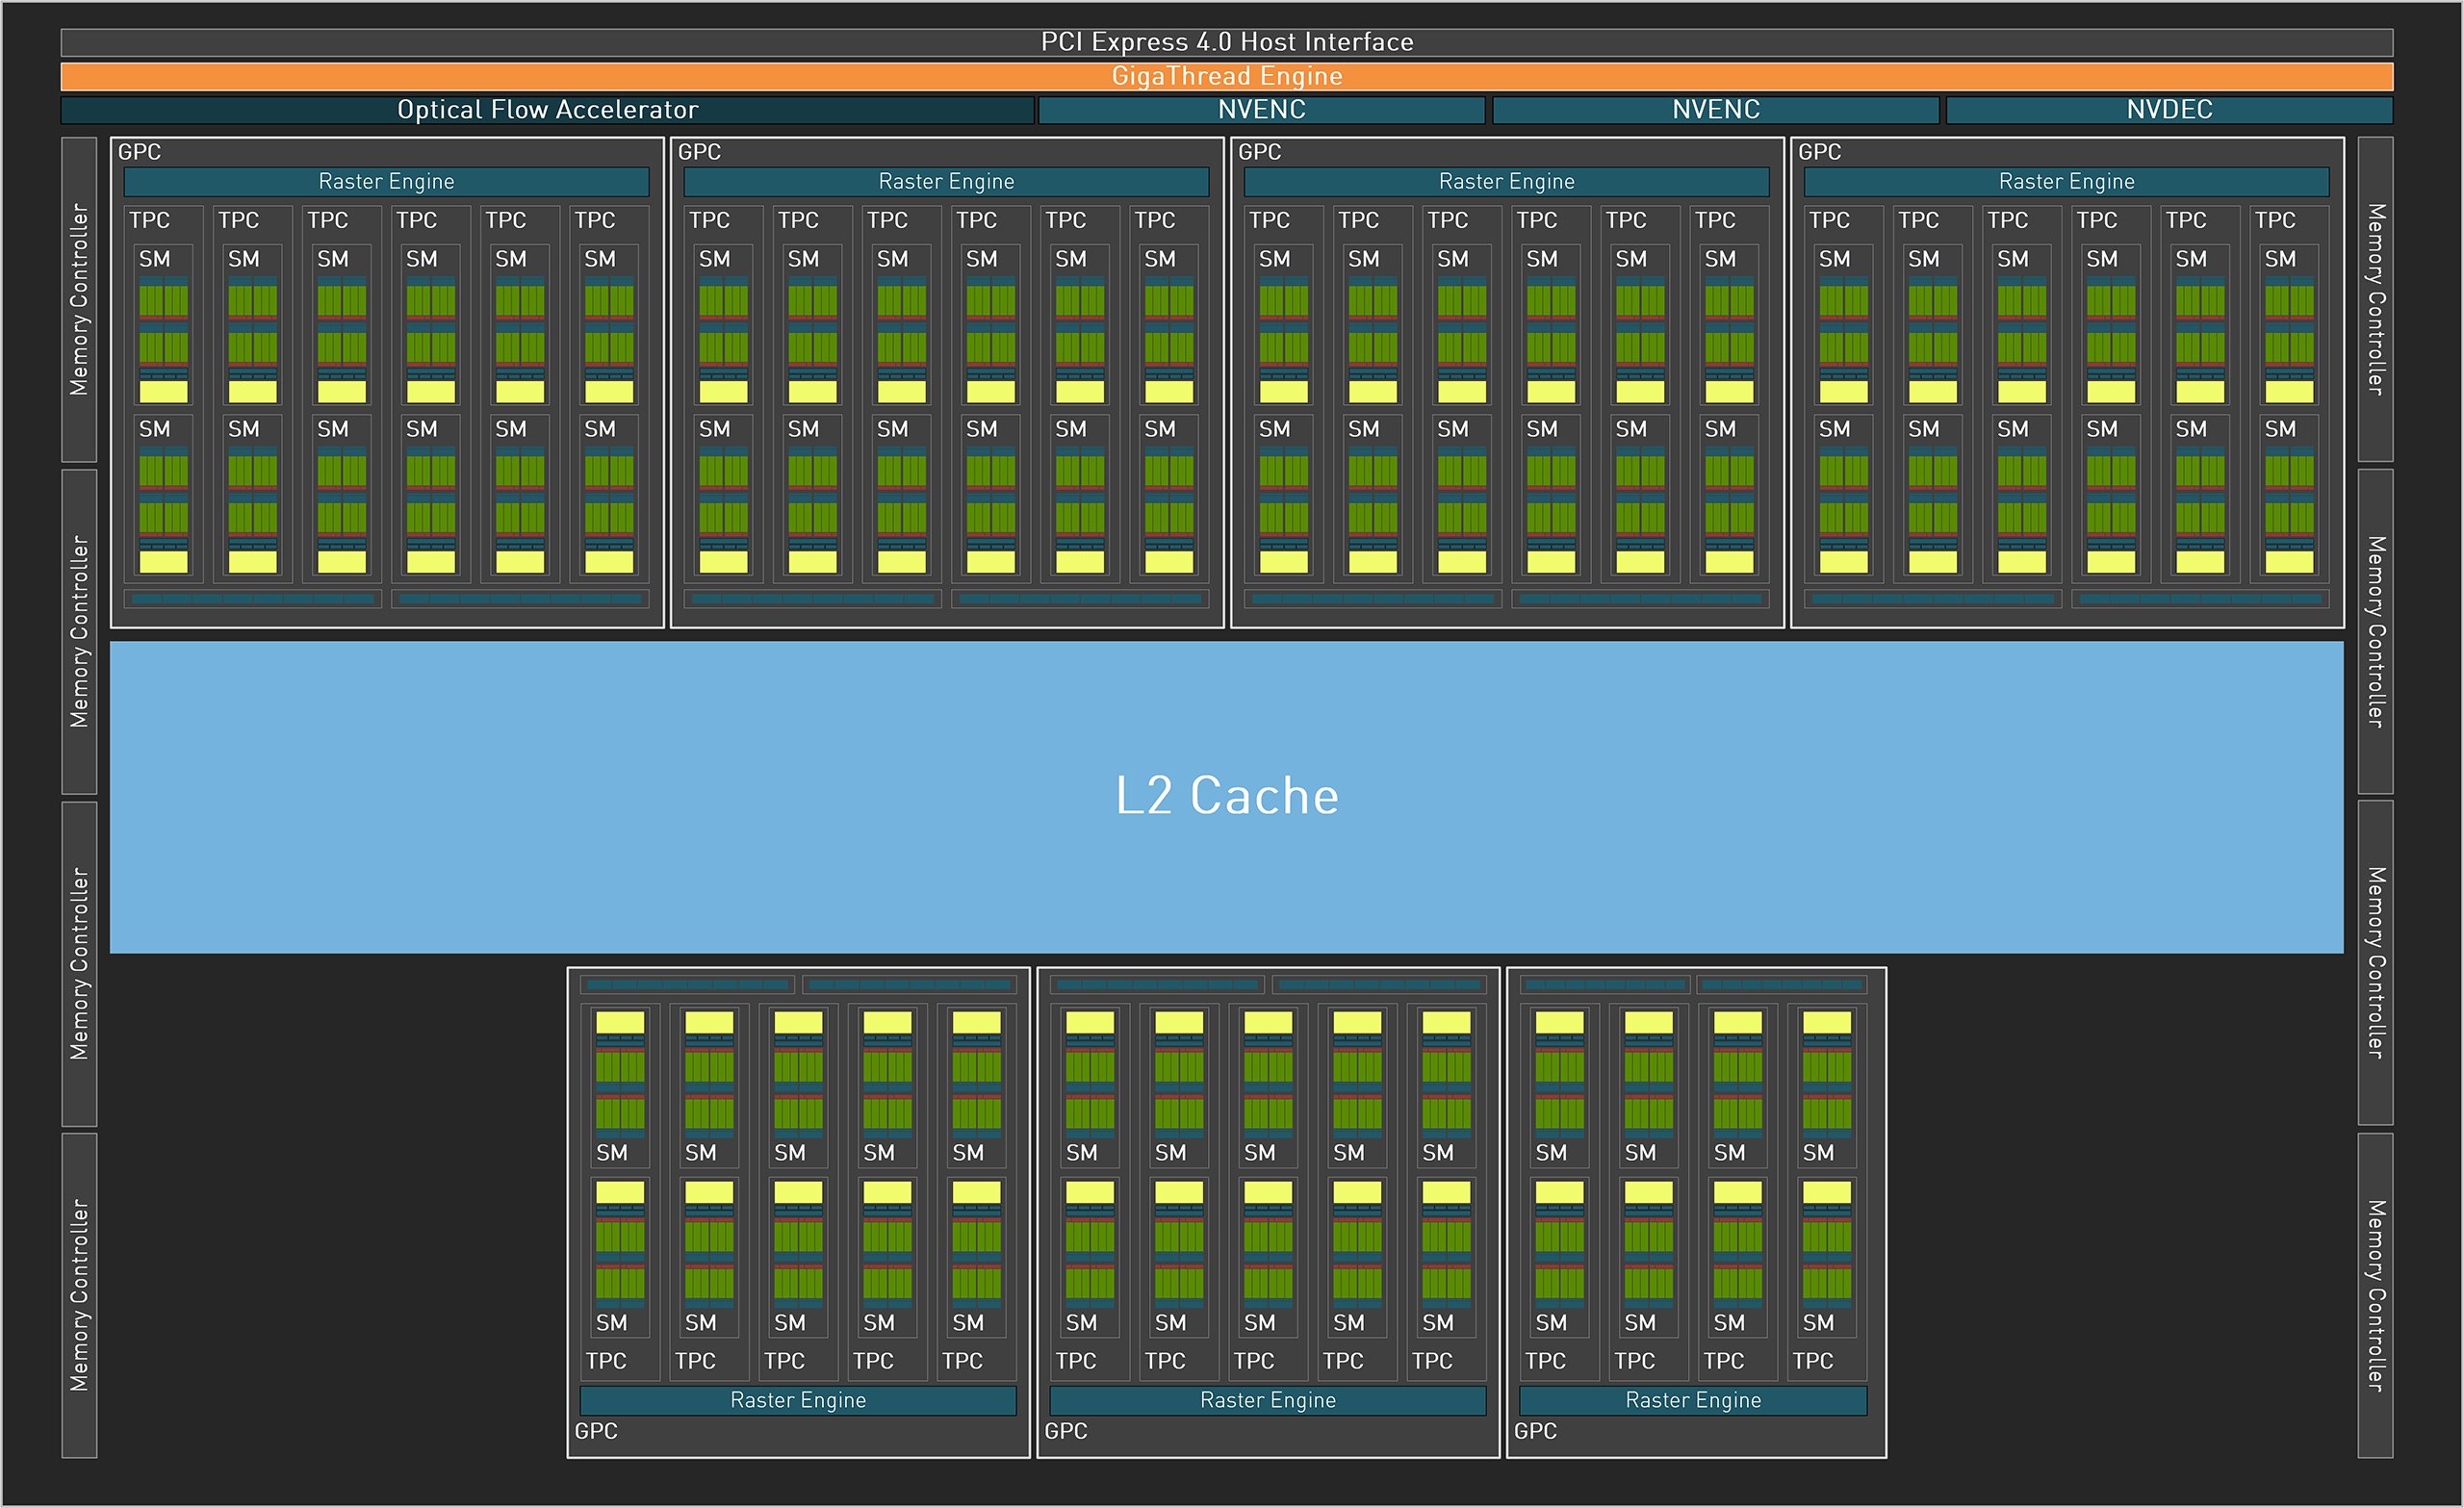
The NVIDIA GeForce RTX 4090 Laptop GPU (Codename GN21-X11) is a high-end laptop GPU. It is based on the AD103 chip as the desktop RTX 4080 and use the Ada Lovelace architecture. The AD103 chip offers a maximum of 10.752 shaders from which inly 9728 are used (e.g., the RTX 4080 Desktop uses 9.728) and a 256 Bit memory bus. The RTX 4090 mobile uses 16 GB GDDR6 dedicated graphics memory with a clock speed of 20 Gbps (effective). The TGP (Total Graphics Power) can be configured between 80 and 150 Watt (+ 15 Watt Dynamic Boost from the CPU) leading to different performance levels (the desktop RTX 4080 uses 320 Watt for comparisons).
The performance depenends on the TGP settings which defines the maximum boost clock (1455 MHz for 80W and up to 2040 MHz for 150W). With 150W the performance should be in the region of the desktop RTX 4080 and therefore best suited for 4k60 or 2k with 120 fps for demanding games. For raytracing, lower resolutions or DLSS is needed.
In our reviews, an average RTX 4090 is clearly the fastest mobile GPU and bests the RTX 4080 Laptop GPU and mobile RTX 3080 Ti easily. 4090M GPUs with lower power limit can however loose up to 20% performance.
In games, fast RTX 4090 models allow gaming in 4k with maximum details. Adding Raytracing may lead to frame rates below 60 fps (e.g. F1 23) and therefore the use of DLSS or reduced settings are advised.
The AD103 chip of the RTX 4090 mobile is manufactured in an improved 5 nm process at TSMC (4N).
GeForce RTX 4000 Laptop GPU Series
| ||||||||||||||||
| Codename | GN21-X11 | |||||||||||||||
| Architecture | Ada Lovelace | |||||||||||||||
| Pipelines | 9728 - unified | |||||||||||||||
| TMUs | 304 | |||||||||||||||
| ROPs | 112 | |||||||||||||||
| Raytracing Cores | 76 | |||||||||||||||
| Tensor / AI Cores | 304 | |||||||||||||||
| Core Speed | 1335 - 2040 (Boost) MHz | |||||||||||||||
| AI GPU | 686 TOPS INT8 | |||||||||||||||
| Cache | L2: 64 MB | |||||||||||||||
| Memory Speed | 20000 effective = 2250 MHz | |||||||||||||||
| Memory Bus Width | 256 Bit | |||||||||||||||
| Memory Type | GDDR6 | |||||||||||||||
| Max. Amount of Memory | 16 GB | |||||||||||||||
| Shared Memory | no | |||||||||||||||
| Memory Bandwidth | 576 GB/s | |||||||||||||||
| API | DirectX 12 Ultimate, Shader 6.7, OpenGL 4.6, OpenCL 3.0, Vulkan 1.3 | |||||||||||||||
| Power Consumption | 150 Watt (80 - 150 Watt TGP) | |||||||||||||||
| Transistor Count | 76.3 Billion | |||||||||||||||
| Man. Technology | 5 nm | |||||||||||||||
| PCIe | 4 x16/x8 | |||||||||||||||
| Displays | 4 Displays (max.), HDMI 2.1, DisplayPort 1.4a | |||||||||||||||
| Notebook Size | large | |||||||||||||||
| Date of Announcement | 03.01.2023 | |||||||||||||||
| Link to Manufacturer Page | www.nvidia.com | |||||||||||||||
| Predecessor | GeForce RTX 3080 Ti Laptop GPU | |||||||||||||||

Benchmarks
| Model | CPU | GPU | RAM | Value |
|---|---|---|---|---|
| Asus ROG Ally Z1 Extreme | Z1 Extreme | GeForce RTX 4090 Laptop GPU 150 W 16 GB | 16 GB | 4401 |
| Asus ROG Zephyrus G16 GU605MY via Asus Deutschland | Ultra 9 185H | GeForce RTX 4090 Laptop GPU 1455 / 2250 MHz 16 GB | 32 GB | 4495 |
| Asus ROG Zephyrus G14 GA402XY via Asus Deutschland | R9 7940HS 80 W / 80 W | GeForce RTX 4090 Laptop GPU 125 W 1455 / 2250 MHz 16 GB | 32 GB | 4544 |
| Asus ROG Flow Z13 ACRNM | i9-13900H | GeForce RTX 4090 Laptop GPU 150 W 16 GB | 32 GB | 5129 |
| Asus ROG Strix Scar 18 2023 G834JY-N6005W | i9-13980HX 0 W / 65 W | GeForce RTX 4090 Laptop GPU 175 W 2090 MHz 16 GB | 32 GB | 5188 |
| Asus Zephyrus Duo 16 GX650PY-NM006W via Asus Deutschland | R9 7945HX 130 W / 120 W | GeForce RTX 4090 Laptop GPU 175 W 2090 / 2275 MHz 16 GB | 32 GB | 5208 |
| Eluktronics Mech-17 GP2 via Eluktronics | i9-13900HX 160 W / 99 W | GeForce RTX 4090 Laptop GPU 175 W 2140 / 2375 MHz 16 GB | 32 GB | 5305 |
| Eurocom Raptor X17 via Eurocom | i9-13900HX 155 W / 110 W | GeForce RTX 4090 Laptop GPU 175 W 2040 / 2250 MHz 16 GB | 64 GB | 5314 |
| Asus ROG Strix Scar 18 G834JYR (2024) via Asus Deutschland | i9-14900HX 120 W / 110 W | GeForce RTX 4090 Laptop GPU 175 W 1455 / 2250 MHz 16 GB | 32 GB | 5319 |
| Medion Erazer Beast X40 2024 via Medion DE | i9-14900HX 160 W / 160 W | GeForce RTX 4090 Laptop GPU 175 W 2040 / 2250 MHz 16 GB | 32 GB | 5327 |
| Medion Erazer Beast X40 via Medion | i9-13900HX 160 W / 160 W | GeForce RTX 4090 Laptop GPU 175 W 2040 / 2375 MHz 16 GB | 32 GB | 5489 |
| Asus ROG Strix Scar 18 2023 G834JY-N6005W | i9-13980HX 175 W / 170 W | GeForce RTX 4090 Laptop GPU 175 W 2090 / 2250 MHz 16 GB | 32 GB | 5496 |
| Razer Blade 16 Early 2023 RTX 4090 via Razer | i9-13950HX 130 W / 110 W | GeForce RTX 4090 Laptop GPU 175 W 16 GB | 32 GB | 5526 |
| Medion Erazer Beast X40 dGPU | i9-13900HX | GeForce RTX 4090 Laptop GPU | 32 GB | 5545 |
| Schenker Key 17 Pro (Early 23) via Schenker Technologies | i9-13900HX 162 W / 135 W | GeForce RTX 4090 Laptop GPU 175 W 2040 / 2250 MHz 16 GB | 32 GB | 5552 |
| Asus ROG Strix Scar 17 G733PYV-LL053X via AMD | R9 7945HX3D 115 W / 100 W | GeForce RTX 4090 Laptop GPU 175 W 2040 / 2250 MHz 16 GB | 32 GB | 5712 |
| MSI Titan 18 HX A14VIG via MSI | i9-14900HX 238 W / 176 W | GeForce RTX 4090 Laptop GPU 175 W 1555 / 2250 MHz 16 GB | 128 GB | 5726 |
| Razer Blade 18 2024 RZ09-0509 via Razer | i9-14900HX 138 W / 117 W | GeForce RTX 4090 Laptop GPU 175 W 1455 / 2250 MHz 16 GB | 32 GB | 5736 |
| MSI Titan GT77 HX 13VI via Intel Deutschland | i9-13950HX 220 W / 150 W | GeForce RTX 4090 Laptop GPU 175 W 2340 / 2250 MHz 16 GB | 64 GB | 5748 |
| Lenovo Legion 9 16IRX8 via Lenovo | i9-13980HX 145 W / 125 W | GeForce RTX 4090 Laptop GPU 175 W 1605 / 2300 MHz 16 GB | 32 GB | 5765 |
| Eurocom Raptor X17 Core i9-14900HX via Eurocom | i9-14900HX 93 W / 63 W | GeForce RTX 4090 Laptop GPU 175 W 2040 / 2250 MHz 16 GB | 32 GB | 5774 |
| Alienware m18 R2 via Dell | i9-14900HX 180 W / 144 W | GeForce RTX 4090 Laptop GPU 175 W 1950 / 2250 MHz 16 GB | 32 GB | 5784 |
| Alienware m18 R1 via Dell | i9-13980HX 198 W / 143 W | GeForce RTX 4090 Laptop GPU 175 W 1975 / 2263 MHz 16 GB | 32 GB | 5794 |
| Medion Erazer Beast X40 dGPU, Cooling | i9-13900HX 160 W / 160 W | GeForce RTX 4090 Laptop GPU 175 W 2040 / 2250 MHz 16 GB | 32 GB | 5822 |
| Asus ROG Strix Scar 17 G733PY-XS96 via Asus | R9 7945HX 128 W / 128 W | GeForce RTX 4090 Laptop GPU 175 W 2090 / 2275 MHz 16 GB | 32 GB | 5829 |
| Schenker Neo 17 2024 Engineering Sample | i9-14900HX | GeForce RTX 4090 Laptop GPU | 32 GB | 5920 |
| Schenker XMG Neo 16 Raptor Lake via Schenker Technologies | i9-13900HX | GeForce RTX 4090 Laptop GPU | 5940 |
| GPU TDP ? | TDP 125 W | TDP 150 W | TDP 175 W |
|---|---|---|---|
| 98% | 82% | 86% | 100% |
| Model | CPU | GPU | RAM | Value |
|---|---|---|---|---|
| Asus ROG Zephyrus G16 GU605MY via Asus Deutschland | Ultra 9 185H | GeForce RTX 4090 Laptop GPU 1455 / 2250 MHz 16 GB | 32 GB | 3915 |
| Asus ROG Zephyrus G14 GA402XY via Asus Deutschland | R9 7940HS 80 W / 80 W | GeForce RTX 4090 Laptop GPU 125 W 1455 / 2250 MHz 16 GB | 32 GB | 3966 |
| Schenker XMG Neo 16 (Early 24) via Schenker Technologies | i9-14900HX 205 W / 205 W | GeForce RTX 4090 Laptop GPU 175 W 2040 / 2250 MHz 16 GB | 32 GB | 5102 |
| Asus ROG Strix Scar 17 G733PYV-LL053X via AMD | R9 7945HX3D 115 W / 100 W | GeForce RTX 4090 Laptop GPU 175 W 2040 / 2250 MHz 16 GB | 32 GB | 5139 |
| Schenker XMG Neo 16 (Early 24) Overboost, Oasis | i9-14900HX 205 W / 205 W | GeForce RTX 4090 Laptop GPU 175 W 2040 / 2250 MHz 16 GB | 32 GB | 5226 |
| GPU TDP ? | TDP 125 W | TDP 175 W |
|---|---|---|
| 76% | 77% | 100% |
| Model | CPU | GPU | RAM | Value |
|---|---|---|---|---|
| Asus ROG Ally Z1 Extreme | Z1 Extreme | GeForce RTX 4090 Laptop GPU 150 W 16 GB | 16 GB | 34577 |
| Razer Blade 16 Early 2023 RTX 4090 via Razer | i9-13950HX 130 W / 110 W | GeForce RTX 4090 Laptop GPU 175 W 16 GB | 32 GB | 130405 |
| Asus ROG Strix Scar 18 2023 G834JY-N6005W | i9-13980HX 175 W / 170 W | GeForce RTX 4090 Laptop GPU 175 W 2090 / 2250 MHz 16 GB | 32 GB | 131230 |
| Schenker XMG Neo 16 (Early 24) via Schenker Technologies | i9-14900HX 205 W / 205 W | GeForce RTX 4090 Laptop GPU 175 W 2040 / 2250 MHz 16 GB | 32 GB | 144599 |
| GPU TDP 150 W | TDP 175 W |
|---|---|
| 26% | 100% |
| Model | CPU | GPU | RAM | Value |
|---|---|---|---|---|
| Asus ROG Zephyrus G16 GU605MY via Asus Deutschland | Ultra 9 185H | GeForce RTX 4090 Laptop GPU 1455 / 2250 MHz 16 GB | 32 GB | 34246 |
| Asus ROG Zephyrus G14 GA402XY via Asus Deutschland | R9 7940HS 80 W / 80 W | GeForce RTX 4090 Laptop GPU 125 W 1455 / 2250 MHz 16 GB | 32 GB | 34519 |
| Razer Blade 16 Early 2023 RTX 4090 via Razer | i9-13950HX 130 W / 110 W | GeForce RTX 4090 Laptop GPU 175 W 16 GB | 32 GB | 40628 |
| Asus Zephyrus Duo 16 GX650PY-NM006W via Asus Deutschland | R9 7945HX 130 W / 120 W | GeForce RTX 4090 Laptop GPU 175 W 2090 / 2275 MHz 16 GB | 32 GB | 40668 |
| Asus ROG Strix Scar 18 2023 G834JY-N6005W | i9-13980HX 175 W / 170 W | GeForce RTX 4090 Laptop GPU 175 W 2090 / 2250 MHz 16 GB | 32 GB | 42607 |
| MSI Titan GT77 HX 13VI via Intel Deutschland | i9-13950HX 220 W / 150 W | GeForce RTX 4090 Laptop GPU 175 W 2340 / 2250 MHz 16 GB | 64 GB | 44487 |
| Schenker XMG Neo 16 (Early 24) via Schenker Technologies | i9-14900HX 205 W / 205 W | GeForce RTX 4090 Laptop GPU 175 W 2040 / 2250 MHz 16 GB | 32 GB | 44948 |
| GPU TDP ? | TDP 125 W | TDP 175 W |
|---|---|---|
| 80% | 81% | 100% |
| Model | CPU | GPU | RAM | Value |
|---|---|---|---|---|
| Asus ROG Strix Scar 18 G834JYR (2024) via Asus Deutschland | i9-14900HX 120 W / 110 W | GeForce RTX 4090 Laptop GPU 175 W 1455 / 2250 MHz 16 GB | 32 GB | 93794 |
| Asus ROG Strix Scar 17 G733PYV-LL053X via AMD | R9 7945HX3D 115 W / 100 W | GeForce RTX 4090 Laptop GPU 175 W 2040 / 2250 MHz 16 GB | 32 GB | 102114 |
| Model | CPU | GPU | RAM | Value |
|---|---|---|---|---|
| Asus ROG Zephyrus G16 GU605MY via Asus Deutschland | Ultra 9 185H | GeForce RTX 4090 Laptop GPU 1455 / 2250 MHz 16 GB | 32 GB | 30964 |
| Razer Blade 16 Early 2023 RTX 4090 via Razer | i9-13950HX 130 W / 110 W | GeForce RTX 4090 Laptop GPU 175 W 16 GB | 32 GB | 31174 |
| Schenker Key 17 Pro (Early 23) via Schenker Technologies | i9-13900HX 162 W / 135 W | GeForce RTX 4090 Laptop GPU 175 W 2040 / 2250 MHz 16 GB | 32 GB | 31208 |
| Asus ROG Flow Z13 ACRNM | i9-13900H | GeForce RTX 4090 Laptop GPU 150 W 16 GB | 32 GB | 32445 |
| Asus ROG Strix Scar 16 G634JYR | i9-14900HX | GeForce RTX 4090 Laptop GPU 175 W 2090 MHz 16 GB | 32 GB | 32518 |
| Medion Erazer Beast X40 2024 via Medion DE | i9-14900HX 160 W / 160 W | GeForce RTX 4090 Laptop GPU 175 W 2040 / 2250 MHz 16 GB | 32 GB | 32572 |
| Schenker Key 17 Pro (M24) via Bestware | i9-14900HX | GeForce RTX 4090 Laptop GPU 175 W 15.6 GB | 32 GB | 32725 |
| Eurocom Raptor X17 via Eurocom | i9-13900HX 155 W / 110 W | GeForce RTX 4090 Laptop GPU 175 W 2040 / 2250 MHz 16 GB | 64 GB | 33425 |
| Asus ROG Zephyrus M16 GU604VY-NM042X via Asus | i9-13900H 140 W / 100 W | GeForce RTX 4090 Laptop GPU 150 W 16 GB | 64 GB | 33550 |
| Asus ROG Strix Scar 18 G834JYR (2024) via Asus Deutschland | i9-14900HX 120 W / 110 W | GeForce RTX 4090 Laptop GPU 175 W 1455 / 2250 MHz 16 GB | 32 GB | 33620 |
| Lenovo Legion Pro 7 16IRX9H, RTX 4090 | i9-14900HX | GeForce RTX 4090 Laptop GPU 175 W 2040 MHz 16 GB | 32 GB | 33787 |
| Acer Predator Helios 18 PH18-72-98MW via Acer Deutschland | i9-14900HX 157 W / 95 W | GeForce RTX 4090 Laptop GPU 175 W 1590 / 2250 MHz 16 GB | 32 GB | 33907 |
| Medion Erazer Beast X40 dGPU | i9-13900HX | GeForce RTX 4090 Laptop GPU | 32 GB | 34117 |
| Razer Blade 18 2024 RZ09-0509 via Razer | i9-14900HX 138 W / 117 W | GeForce RTX 4090 Laptop GPU 175 W 1455 / 2250 MHz 16 GB | 32 GB | 34597 |
| Lenovo Legion 9 16IRX9, RTX 4090 via Lenovo | i9-14900HX | GeForce RTX 4090 Laptop GPU 175 W 16 GB | 64 GB | 34686 |
| Asus ROG Zephyrus G14 GA402XY via Asus Deutschland | R9 7940HS 80 W / 80 W | GeForce RTX 4090 Laptop GPU 125 W 1455 / 2250 MHz 16 GB | 32 GB | 34720 |
| Lenovo Legion Pro 7 RTX4090 via Lenovo Deutschland | i9-13900HX 185 W / 130 W | GeForce RTX 4090 Laptop GPU 175 W 1455 / 2250 MHz 16 GB | 32 GB | 34742 |
| Lenovo Legion 9 16IRX8 via Lenovo | i9-13980HX 145 W / 125 W | GeForce RTX 4090 Laptop GPU 175 W 1605 / 2300 MHz 16 GB | 32 GB | 34752 |
| Razer Blade 16 2024, RTX 4090 via Razer | i9-14900HX 140 W / 60 W | GeForce RTX 4090 Laptop GPU 175 W 16 GB | 32 GB | 34756 |
| Medion Erazer Beast X40 via Medion | i9-13900HX 160 W / 160 W | GeForce RTX 4090 Laptop GPU 175 W 2040 / 2375 MHz 16 GB | 32 GB | 34788 |
| Asus ROG Strix Scar 18 2023 G834JY-N6005W | i9-13980HX 0 W / 65 W | GeForce RTX 4090 Laptop GPU 175 W 2090 MHz 16 GB | 32 GB | 34906 |
| Alienware m18 R2 via Dell | i9-14900HX 180 W / 144 W | GeForce RTX 4090 Laptop GPU 175 W 1950 / 2250 MHz 16 GB | 32 GB | 34966 |
| Schenker XMG Neo 16 Raptor Lake via Schenker Technologies | i9-13900HX | GeForce RTX 4090 Laptop GPU | 35007 | |
| Aorus 17X AZF via Gigabyte Aorus Deutschland | i9-13900HX 157 W / 86 W | GeForce RTX 4090 Laptop GPU 175 W 2040 / 2250 MHz 16 GB | 32 GB | 35428 |
| Alienware m18 R1 via Dell | i9-13980HX 198 W / 143 W | GeForce RTX 4090 Laptop GPU 175 W 1975 / 2263 MHz 16 GB | 32 GB | 35598 |
| Medion Erazer Beast X40 2024 Gaming Mode | i9-14900HX 160 W / 160 W | GeForce RTX 4090 Laptop GPU 175 W 2040 / 2250 MHz 16 GB | 32 GB | 36024 |
| Eurocom Raptor X17 Core i9-14900HX via Eurocom | i9-14900HX 93 W / 63 W | GeForce RTX 4090 Laptop GPU 175 W 2040 / 2250 MHz 16 GB | 32 GB | 36031 |
| Asus ROG Strix Scar 18 2023 G834JY-N6005W | i9-13980HX 175 W / 170 W | GeForce RTX 4090 Laptop GPU 175 W 2090 / 2250 MHz 16 GB | 32 GB | 36408 |
Schenker XMG Neo 16 E23  | i9-13900HX 160 W / 160 W | GeForce RTX 4090 Laptop GPU 175 W 2040 / 2250 MHz 16 GB | 32 GB | 36434 |
| MSI Raider GE78 HX 13VI | i9-13980HX | GeForce RTX 4090 Laptop GPU 175 W 16 GB | 64 GB | 36990 |
| MSI Titan GT77 HX 13VI via Intel Deutschland | i9-13950HX 220 W / 150 W | GeForce RTX 4090 Laptop GPU 175 W 2340 / 2250 MHz 16 GB | 64 GB | 37594 |
| Eluktronics Mech-17 GP2 Liquid Propulsion Package G2 | i9-13900HX | GeForce RTX 4090 Laptop GPU | 37644 | |
| Eluktronics Mech-17 GP2 via Eluktronics | i9-13900HX 160 W / 99 W | GeForce RTX 4090 Laptop GPU 175 W 2140 / 2375 MHz 16 GB | 32 GB | 37682 |
| Medion Erazer Beast X40 dGPU, Cooling | i9-13900HX 160 W / 160 W | GeForce RTX 4090 Laptop GPU 175 W 2040 / 2250 MHz 16 GB | 32 GB | 38392 |
| Schenker XMG Neo 16 (Early 24) via Schenker Technologies | i9-14900HX 205 W / 205 W | GeForce RTX 4090 Laptop GPU 175 W 2040 / 2250 MHz 16 GB | 32 GB | 38597 |
| Schenker XMG Neo 16 (Early 24) Overboost, Oasis | i9-14900HX 205 W / 205 W | GeForce RTX 4090 Laptop GPU 175 W 2040 / 2250 MHz 16 GB | 32 GB | 38848 |
| MSI Titan 18 HX A14VIG via MSI | i9-14900HX 238 W / 176 W | GeForce RTX 4090 Laptop GPU 175 W 1555 / 2250 MHz 16 GB | 128 GB | 38959 |
| Asus Zephyrus Duo 16 GX650PY-NM006W via Asus Deutschland | R9 7945HX 130 W / 120 W | GeForce RTX 4090 Laptop GPU 175 W 2090 / 2275 MHz 16 GB | 32 GB | 40149 |
| Asus ROG Strix Scar 17 G733PYV-LL053X via AMD | R9 7945HX3D 115 W / 100 W | GeForce RTX 4090 Laptop GPU 175 W 2040 / 2250 MHz 16 GB | 32 GB | 41279 |
| Asus ROG Strix Scar 17 G733PY-XS96 via Asus | R9 7945HX 128 W / 128 W | GeForce RTX 4090 Laptop GPU 175 W 2090 / 2275 MHz 16 GB | 32 GB | 43163 |
| GPU TDP ? | TDP 125 W | TDP 150 W | TDP 175 W |
|---|---|---|---|
| 96% | 97% | 92% | 100% |
| Model | CPU | GPU | RAM | Value |
|---|---|---|---|---|
| Asus ROG Zephyrus G16 GU605MY via Asus Deutschland | Ultra 9 185H | GeForce RTX 4090 Laptop GPU 1455 / 2250 MHz 16 GB | 32 GB | 40259 |
| Asus ROG Flow Z13 ACRNM | i9-13900H | GeForce RTX 4090 Laptop GPU 150 W 16 GB | 32 GB | 41210 |
| Asus ROG Zephyrus G14 GA402XY via Asus Deutschland | R9 7940HS 80 W / 80 W | GeForce RTX 4090 Laptop GPU 125 W 1455 / 2250 MHz 16 GB | 32 GB | 42319 |
| Schenker Key 17 Pro (Early 23) via Schenker Technologies | i9-13900HX 162 W / 135 W | GeForce RTX 4090 Laptop GPU 175 W 2040 / 2250 MHz 16 GB | 32 GB | 42372 |
| Asus ROG Strix Scar 16 G634JYR | i9-14900HX | GeForce RTX 4090 Laptop GPU 175 W 2090 MHz 16 GB | 32 GB | 42601 |
| Acer Predator Helios 18 PH18-72-98MW via Acer Deutschland | i9-14900HX 157 W / 95 W | GeForce RTX 4090 Laptop GPU 175 W 1590 / 2250 MHz 16 GB | 32 GB | 43140 |
| Asus ROG Strix Scar 18 G834JYR (2024) via Asus Deutschland | i9-14900HX 120 W / 110 W | GeForce RTX 4090 Laptop GPU 175 W 1455 / 2250 MHz 16 GB | 32 GB | 43477 |
| Lenovo Legion 9 16IRX9, RTX 4090 via Lenovo | i9-14900HX | GeForce RTX 4090 Laptop GPU 175 W 16 GB | 64 GB | 43518 |
| Medion Erazer Beast X40 2024 via Medion DE | i9-14900HX 160 W / 160 W | GeForce RTX 4090 Laptop GPU 175 W 2040 / 2250 MHz 16 GB | 32 GB | 44366 |
| Alienware m18 R2 via Dell | i9-14900HX 180 W / 144 W | GeForce RTX 4090 Laptop GPU 175 W 1950 / 2250 MHz 16 GB | 32 GB | 44492 |
| Asus ROG Zephyrus M16 GU604VY-NM042X via Asus | i9-13900H 140 W / 100 W | GeForce RTX 4090 Laptop GPU 150 W 16 GB | 64 GB | 44568 |
| Razer Blade 18 2024 RZ09-0509 via Razer | i9-14900HX 138 W / 117 W | GeForce RTX 4090 Laptop GPU 175 W 1455 / 2250 MHz 16 GB | 32 GB | 44702 |
| Medion Erazer Beast X40 via Medion | i9-13900HX 160 W / 160 W | GeForce RTX 4090 Laptop GPU 175 W 2040 / 2375 MHz 16 GB | 32 GB | 44759 |
| Eurocom Raptor X17 via Eurocom | i9-13900HX 155 W / 110 W | GeForce RTX 4090 Laptop GPU 175 W 2040 / 2250 MHz 16 GB | 64 GB | 44766 |
| Razer Blade 16 Early 2023 RTX 4090 via Razer | i9-13950HX 130 W / 110 W | GeForce RTX 4090 Laptop GPU 175 W 16 GB | 32 GB | 45431 |
| Schenker Key 17 Pro (M24) via Bestware | i9-14900HX | GeForce RTX 4090 Laptop GPU 175 W 15.6 GB | 32 GB | 45600 |
| Lenovo Legion Pro 7 RTX4090 via Lenovo Deutschland | i9-13900HX 185 W / 130 W | GeForce RTX 4090 Laptop GPU 175 W 1455 / 2250 MHz 16 GB | 32 GB | 45696 |
| Asus ROG Strix Scar 18 2023 G834JY-N6005W | i9-13980HX 0 W / 65 W | GeForce RTX 4090 Laptop GPU 175 W 2090 MHz 16 GB | 32 GB | 46003 |
| Asus ROG Ally Z1 Extreme | Z1 Extreme | GeForce RTX 4090 Laptop GPU 150 W 16 GB | 16 GB | 46022 |
| Medion Erazer Beast X40 dGPU | i9-13900HX | GeForce RTX 4090 Laptop GPU | 32 GB | 46047 |
| Eurocom Raptor X17 Core i9-14900HX via Eurocom | i9-14900HX 93 W / 63 W | GeForce RTX 4090 Laptop GPU 175 W 2040 / 2250 MHz 16 GB | 32 GB | 46191 |
| Schenker XMG Neo 16 Raptor Lake via Schenker Technologies | i9-13900HX | GeForce RTX 4090 Laptop GPU | 46240 | |
| Lenovo Legion 9 16IRX8 via Lenovo | i9-13980HX 145 W / 125 W | GeForce RTX 4090 Laptop GPU 175 W 1605 / 2300 MHz 16 GB | 32 GB | 46386 |
| Razer Blade 16 2024, RTX 4090 via Razer | i9-14900HX 140 W / 60 W | GeForce RTX 4090 Laptop GPU 175 W 16 GB | 32 GB | 46527 |
| Alienware m18 R1 via Dell | i9-13980HX 198 W / 143 W | GeForce RTX 4090 Laptop GPU 175 W 1975 / 2263 MHz 16 GB | 32 GB | 46998 |
| Lenovo Legion Pro 7 16IRX9H, RTX 4090 | i9-14900HX | GeForce RTX 4090 Laptop GPU 175 W 2040 MHz 16 GB | 32 GB | 47085 |
| Medion Erazer Beast X40 2024 Gaming Mode | i9-14900HX 160 W / 160 W | GeForce RTX 4090 Laptop GPU 175 W 2040 / 2250 MHz 16 GB | 32 GB | 47134 |
| Eluktronics Mech-17 GP2 via Eluktronics | i9-13900HX 160 W / 99 W | GeForce RTX 4090 Laptop GPU 175 W 2140 / 2375 MHz 16 GB | 32 GB | 47611 |
| Asus Zephyrus Duo 16 GX650PY-NM006W via Asus Deutschland | R9 7945HX 130 W / 120 W | GeForce RTX 4090 Laptop GPU 175 W 2090 / 2275 MHz 16 GB | 32 GB | 47798 |
| Asus ROG Strix Scar 18 2023 G834JY-N6005W | i9-13980HX 175 W / 170 W | GeForce RTX 4090 Laptop GPU 175 W 2090 / 2250 MHz 16 GB | 32 GB | 48101 |
| Aorus 17X AZF via Gigabyte Aorus Deutschland | i9-13900HX 157 W / 86 W | GeForce RTX 4090 Laptop GPU 175 W 2040 / 2250 MHz 16 GB | 32 GB | 48251 |
| MSI Raider GE78 HX 13VI | i9-13980HX | GeForce RTX 4090 Laptop GPU 175 W 16 GB | 64 GB | 48507 |
| Schenker XMG Neo 16 E23 | i9-13900HX 160 W / 160 W | GeForce RTX 4090 Laptop GPU 175 W 2040 / 2250 MHz 16 GB | 32 GB | 48556 |
| Medion Erazer Beast X40 dGPU, Cooling | i9-13900HX 160 W / 160 W | GeForce RTX 4090 Laptop GPU 175 W 2040 / 2250 MHz 16 GB | 32 GB | 49220 |
| MSI Titan GT77 HX 13VI via Intel Deutschland | i9-13950HX 220 W / 150 W | GeForce RTX 4090 Laptop GPU 175 W 2340 / 2250 MHz 16 GB | 64 GB | 49247 |
| Asus ROG Strix Scar 17 G733PYV-LL053X via AMD | R9 7945HX3D 115 W / 100 W | GeForce RTX 4090 Laptop GPU 175 W 2040 / 2250 MHz 16 GB | 32 GB | 49422 |
| Eluktronics Mech-17 GP2 Liquid Propulsion Package G2 | i9-13900HX | GeForce RTX 4090 Laptop GPU | 50050 | |
| MSI Titan 18 HX A14VIG via MSI | i9-14900HX 238 W / 176 W | GeForce RTX 4090 Laptop GPU 175 W 1555 / 2250 MHz 16 GB | 128 GB | 50532 |
| Schenker XMG Neo 16 (Early 24) Overboost, Oasis | i9-14900HX 205 W / 205 W | GeForce RTX 4090 Laptop GPU 175 W 2040 / 2250 MHz 16 GB | 32 GB | 50743 |
| Schenker XMG Neo 16 (Early 24) via Schenker Technologies | i9-14900HX 205 W / 205 W | GeForce RTX 4090 Laptop GPU 175 W 2040 / 2250 MHz 16 GB | 32 GB | 51946 |
| Asus ROG Strix Scar 17 G733PY-XS96 via Asus | R9 7945HX 128 W / 128 W | GeForce RTX 4090 Laptop GPU 175 W 2090 / 2275 MHz 16 GB | 32 GB | 53059 |
| GPU TDP ? | TDP 125 W | TDP 150 W | TDP 175 W |
|---|---|---|---|
| 98% | 90% | 94% | 100% |
| Model | CPU | GPU | RAM | Value |
|---|---|---|---|---|
| Aorus 17X AZF via Gigabyte Aorus Deutschland | i9-13900HX 157 W / 86 W | GeForce RTX 4090 Laptop GPU 175 W 2040 / 2250 MHz 16 GB | 32 GB | 550855 |
| Razer Blade 16 Early 2023 RTX 4090 via Razer | i9-13950HX 130 W / 110 W | GeForce RTX 4090 Laptop GPU 175 W 16 GB | 32 GB | 566331 |
| Asus ROG Strix Scar 18 2023 G834JY-N6005W | i9-13980HX 175 W / 170 W | GeForce RTX 4090 Laptop GPU 175 W 2090 / 2250 MHz 16 GB | 32 GB | 669833 |
| Model | CPU | GPU | RAM | Value |
|---|---|---|---|---|
| Asus ROG Zephyrus G16 GU605MY via Asus Deutschland | Ultra 9 185H | GeForce RTX 4090 Laptop GPU 1455 / 2250 MHz 16 GB | 32 GB | 15660 |
| Asus ROG Zephyrus M16 GU604VY-NM042X via Asus | i9-13900H 140 W / 100 W | GeForce RTX 4090 Laptop GPU 150 W 16 GB | 64 GB | 15939 |
| Asus ROG Ally Z1 Extreme | Z1 Extreme | GeForce RTX 4090 Laptop GPU 150 W 16 GB | 16 GB | 16023 |
| Asus ROG Zephyrus G14 GA402XY via Asus Deutschland | R9 7940HS 80 W / 80 W | GeForce RTX 4090 Laptop GPU 125 W 1455 / 2250 MHz 16 GB | 32 GB | 16719 |
| Asus ROG Flow Z13 ACRNM | i9-13900H | GeForce RTX 4090 Laptop GPU 150 W 16 GB | 32 GB | 17527 |
| Acer Predator Helios 18 PH18-72-98MW via Acer Deutschland | i9-14900HX 157 W / 95 W | GeForce RTX 4090 Laptop GPU 175 W 1590 / 2250 MHz 16 GB | 32 GB | 18542 |
| Razer Blade 16 Early 2023 RTX 4090 via Razer | i9-13950HX 130 W / 110 W | GeForce RTX 4090 Laptop GPU 175 W 16 GB | 32 GB | 18599 |
| Asus Zephyrus Duo 16 GX650PY-NM006W via Asus Deutschland | R9 7945HX 130 W / 120 W | GeForce RTX 4090 Laptop GPU 175 W 2090 / 2275 MHz 16 GB | 32 GB | 18602 |
| Schenker Key 17 Pro (M24) via Bestware | i9-14900HX | GeForce RTX 4090 Laptop GPU 175 W 15.6 GB | 32 GB | 18674 |
| Razer Blade 16 2024, RTX 4090 via Razer | i9-14900HX 140 W / 60 W | GeForce RTX 4090 Laptop GPU 175 W 16 GB | 32 GB | 18732 |
| Asus ROG Strix Scar 18 2023 G834JY-N6005W MSHybrid | i9-13980HX 0 W / 65 W | GeForce RTX 4090 Laptop GPU 175 W 2090 MHz 16 GB | 32 GB | 18739 |
| Eurocom Raptor X17 via Eurocom | i9-13900HX 155 W / 110 W | GeForce RTX 4090 Laptop GPU 175 W 2040 / 2250 MHz 16 GB | 64 GB | 19502 |
| Asus ROG Strix Scar 18 G834JYR (2024) via Asus Deutschland | i9-14900HX 120 W / 110 W | GeForce RTX 4090 Laptop GPU 175 W 1455 / 2250 MHz 16 GB | 32 GB | 19507 |
| Lenovo Legion Pro 7 16IRX9H, RTX 4090 | i9-14900HX | GeForce RTX 4090 Laptop GPU 175 W 2040 MHz 16 GB | 32 GB | 19636 |
| Medion Erazer Beast X40 2024 via Medion DE | i9-14900HX 160 W / 160 W | GeForce RTX 4090 Laptop GPU 175 W 2040 / 2250 MHz 16 GB | 32 GB | 19655 |
| Medion Erazer Beast X40 via Medion | i9-13900HX 160 W / 160 W | GeForce RTX 4090 Laptop GPU 175 W 2040 / 2375 MHz 16 GB | 32 GB | 19708 |
| Asus ROG Strix Scar 17 G733PYV-LL053X via AMD | R9 7945HX3D 115 W / 100 W | GeForce RTX 4090 Laptop GPU 175 W 2040 / 2250 MHz 16 GB | 32 GB | 19832 |
| Schenker Key 17 Pro (Early 23) via Schenker Technologies | i9-13900HX 162 W / 135 W | GeForce RTX 4090 Laptop GPU 175 W 2040 / 2250 MHz 16 GB | 32 GB | 19893 |
| Lenovo Legion Pro 7 RTX4090 via Lenovo Deutschland | i9-13900HX 185 W / 130 W | GeForce RTX 4090 Laptop GPU 175 W 1455 / 2250 MHz 16 GB | 32 GB | 20039 |
| Aorus 17X AZF via Gigabyte Aorus Deutschland | i9-13900HX 157 W / 86 W | GeForce RTX 4090 Laptop GPU 175 W 2040 / 2250 MHz 16 GB | 32 GB | 20085 |
| Lenovo Legion 9 16IRX9, RTX 4090 via Lenovo | i9-14900HX | GeForce RTX 4090 Laptop GPU 175 W 16 GB | 64 GB | 20099 |
| Asus ROG Strix Scar 18 2023 G834JY-N6005W | i9-13980HX 175 W / 170 W | GeForce RTX 4090 Laptop GPU 175 W 2090 / 2250 MHz 16 GB | 32 GB | 20166 |
| Eluktronics Mech-17 GP2 via Eluktronics | i9-13900HX 160 W / 99 W | GeForce RTX 4090 Laptop GPU 175 W 2140 / 2375 MHz 16 GB | 32 GB | 20223 |
| Asus ROG Strix Scar 16 G634JYR | i9-14900HX | GeForce RTX 4090 Laptop GPU 175 W 2090 MHz 16 GB | 32 GB | 20256 |
| Schenker XMG Neo 16 Raptor Lake via Schenker Technologies | i9-13900HX | GeForce RTX 4090 Laptop GPU | 20292 | |
| Asus ROG Strix Scar 17 G733PY-XS96 via Asus | R9 7945HX 128 W / 128 W | GeForce RTX 4090 Laptop GPU 175 W 2090 / 2275 MHz 16 GB | 32 GB | 20295 |
| Schenker Neo 17 2024 Engineering Sample | i9-14900HX | GeForce RTX 4090 Laptop GPU | 32 GB | 20295 |
| Medion Erazer Beast X40 dGPU | i9-13900HX | GeForce RTX 4090 Laptop GPU | 32 GB | 20461 |
| Razer Blade 18 2024 RZ09-0509 via Razer | i9-14900HX 138 W / 117 W | GeForce RTX 4090 Laptop GPU 175 W 1455 / 2250 MHz 16 GB | 32 GB | 20561 |
| Schenker XMG Neo 16 (Early 24) via Schenker Technologies | i9-14900HX 205 W / 205 W | GeForce RTX 4090 Laptop GPU 175 W 2040 / 2250 MHz 16 GB | 32 GB | 20588 |
| Lenovo Legion 9 16IRX8 via Lenovo | i9-13980HX 145 W / 125 W | GeForce RTX 4090 Laptop GPU 175 W 1605 / 2300 MHz 16 GB | 32 GB | 20744 |
| MSI Titan GT77 HX 13VI via Intel Deutschland | i9-13950HX 220 W / 150 W | GeForce RTX 4090 Laptop GPU 175 W 2340 / 2250 MHz 16 GB | 64 GB | 20862 |
| Schenker XMG Neo 16 E23 | i9-13900HX 160 W / 160 W | GeForce RTX 4090 Laptop GPU 175 W 2040 / 2250 MHz 16 GB | 32 GB | 20883 |
| Medion Erazer Beast X40 dGPU, Cooling | i9-13900HX 160 W / 160 W | GeForce RTX 4090 Laptop GPU 175 W 2040 / 2250 MHz 16 GB | 32 GB | 20935 |
| Schenker XMG Neo 17 2024 Engineering Sample via Schenker Technologies | i9-14900HX | GeForce RTX 4090 Laptop GPU | 20993 | |
| MSI Titan 18 HX A14VIG via MSI | i9-14900HX 238 W / 176 W | GeForce RTX 4090 Laptop GPU 175 W 1555 / 2250 MHz 16 GB | 128 GB | 21280 |
| MSI Raider GE78 HX 13VI | i9-13980HX | GeForce RTX 4090 Laptop GPU 175 W 16 GB | 64 GB | 21343 |
| Medion Erazer Beast X40 2024 Gaming Mode | i9-14900HX 160 W / 160 W | GeForce RTX 4090 Laptop GPU 175 W 2040 / 2250 MHz 16 GB | 32 GB | 21398 |
| Eurocom Raptor X17 Core i9-14900HX via Eurocom | i9-14900HX 93 W / 63 W | GeForce RTX 4090 Laptop GPU 175 W 2040 / 2250 MHz 16 GB | 32 GB | 21496 |
| Alienware m18 R1 via Dell | i9-13980HX 198 W / 143 W | GeForce RTX 4090 Laptop GPU 175 W 1975 / 2263 MHz 16 GB | 32 GB | 21617 |
| Alienware m18 R2 via Dell | i9-14900HX 180 W / 144 W | GeForce RTX 4090 Laptop GPU 175 W 1950 / 2250 MHz 16 GB | 32 GB | 21695 |
| Schenker XMG Neo 16 (Early 24) Overboost, Oasis | i9-14900HX 205 W / 205 W | GeForce RTX 4090 Laptop GPU 175 W 2040 / 2250 MHz 16 GB | 32 GB | 21745 |
| Eluktronics Mech-17 GP2 Liquid Propulsion Package G2 | i9-13900HX | GeForce RTX 4090 Laptop GPU | 22014 |
| GPU TDP ? | TDP 125 W | TDP 150 W | TDP 175 W |
|---|---|---|---|
| 99% | 83% | 82% | 100% |
| Model | CPU | GPU | RAM | Value |
|---|---|---|---|---|
| Asus ROG Zephyrus G16 GU605MY via Asus Deutschland | Ultra 9 185H | GeForce RTX 4090 Laptop GPU 1455 / 2250 MHz 16 GB | 32 GB | 16950 |
| Asus ROG Ally Z1 Extreme | Z1 Extreme | GeForce RTX 4090 Laptop GPU 150 W 16 GB | 16 GB | 17620 |
| Asus ROG Zephyrus M16 GU604VY-NM042X via Asus | i9-13900H 140 W / 100 W | GeForce RTX 4090 Laptop GPU 150 W 16 GB | 64 GB | 17650 |
| Asus ROG Zephyrus G14 GA402XY via Asus Deutschland | R9 7940HS 80 W / 80 W | GeForce RTX 4090 Laptop GPU 125 W 1455 / 2250 MHz 16 GB | 32 GB | 17885 |
| Acer Predator Helios 18 PH18-72-98MW via Acer Deutschland | i9-14900HX 157 W / 95 W | GeForce RTX 4090 Laptop GPU 175 W 1590 / 2250 MHz 16 GB | 32 GB | 18814 |
| Asus ROG Flow Z13 ACRNM | i9-13900H | GeForce RTX 4090 Laptop GPU 150 W 16 GB | 32 GB | 19075 |
| Schenker Key 17 Pro (M24) via Bestware | i9-14900HX | GeForce RTX 4090 Laptop GPU 175 W 15.6 GB | 32 GB | 19741 |
| Asus ROG Strix Scar 18 2023 G834JY-N6005W MSHybrid | i9-13980HX 0 W / 65 W | GeForce RTX 4090 Laptop GPU 175 W 2090 MHz 16 GB | 32 GB | 19758 |
| Razer Blade 16 Early 2023 RTX 4090 via Razer | i9-13950HX 130 W / 110 W | GeForce RTX 4090 Laptop GPU 175 W 16 GB | 32 GB | 19836 |
| Razer Blade 16 2024, RTX 4090 via Razer | i9-14900HX 140 W / 60 W | GeForce RTX 4090 Laptop GPU 175 W 16 GB | 32 GB | 19878 |
| Asus Zephyrus Duo 16 GX650PY-NM006W via Asus Deutschland | R9 7945HX 130 W / 120 W | GeForce RTX 4090 Laptop GPU 175 W 2090 / 2275 MHz 16 GB | 32 GB | 20033 |
| Asus ROG Strix Scar 18 G834JYR (2024) via Asus Deutschland | i9-14900HX 120 W / 110 W | GeForce RTX 4090 Laptop GPU 175 W 1455 / 2250 MHz 16 GB | 32 GB | 20070 |
| Lenovo Legion 9 16IRX9, RTX 4090 via Lenovo | i9-14900HX | GeForce RTX 4090 Laptop GPU 175 W 16 GB | 64 GB | 20416 |
| Eurocom Raptor X17 via Eurocom | i9-13900HX 155 W / 110 W | GeForce RTX 4090 Laptop GPU 175 W 2040 / 2250 MHz 16 GB | 64 GB | 20660 |
| Eluktronics Mech-17 GP2 via Eluktronics | i9-13900HX 160 W / 99 W | GeForce RTX 4090 Laptop GPU 175 W 2140 / 2375 MHz 16 GB | 32 GB | 20738 |
| Asus ROG Strix Scar 16 G634JYR | i9-14900HX | GeForce RTX 4090 Laptop GPU 175 W 2090 MHz 16 GB | 32 GB | 20775 |
| Medion Erazer Beast X40 2024 via Medion DE | i9-14900HX 160 W / 160 W | GeForce RTX 4090 Laptop GPU 175 W 2040 / 2250 MHz 16 GB | 32 GB | 20806 |
| Schenker Neo 17 2024 Engineering Sample | i9-14900HX | GeForce RTX 4090 Laptop GPU | 32 GB | 21074 |
| Aorus 17X AZF via Gigabyte Aorus Deutschland | i9-13900HX 157 W / 86 W | GeForce RTX 4090 Laptop GPU 175 W 2040 / 2250 MHz 16 GB | 32 GB | 21158 |
| Asus ROG Strix Scar 18 2023 G834JY-N6005W | i9-13980HX 175 W / 170 W | GeForce RTX 4090 Laptop GPU 175 W 2090 / 2250 MHz 16 GB | 32 GB | 21167 |
| Razer Blade 18 2024 RZ09-0509 via Razer | i9-14900HX 138 W / 117 W | GeForce RTX 4090 Laptop GPU 175 W 1455 / 2250 MHz 16 GB | 32 GB | 21246 |
| Lenovo Legion Pro 7 16IRX9H, RTX 4090 | i9-14900HX | GeForce RTX 4090 Laptop GPU 175 W 2040 MHz 16 GB | 32 GB | 21251 |
| Medion Erazer Beast X40 via Medion | i9-13900HX 160 W / 160 W | GeForce RTX 4090 Laptop GPU 175 W 2040 / 2375 MHz 16 GB | 32 GB | 21278 |
| Lenovo Legion Pro 7 RTX4090 via Lenovo Deutschland | i9-13900HX 185 W / 130 W | GeForce RTX 4090 Laptop GPU 175 W 1455 / 2250 MHz 16 GB | 32 GB | 21279 |
| Asus ROG Strix Scar 17 G733PYV-LL053X via AMD | R9 7945HX3D 115 W / 100 W | GeForce RTX 4090 Laptop GPU 175 W 2040 / 2250 MHz 16 GB | 32 GB | 21353 |
| Lenovo Legion 9 16IRX8 via Lenovo | i9-13980HX 145 W / 125 W | GeForce RTX 4090 Laptop GPU 175 W 1605 / 2300 MHz 16 GB | 32 GB | 21391 |
| Schenker Key 17 Pro (Early 23) via Schenker Technologies | i9-13900HX 162 W / 135 W | GeForce RTX 4090 Laptop GPU 175 W 2040 / 2250 MHz 16 GB | 32 GB | 21470 |
| Schenker XMG Neo 16 Raptor Lake via Schenker Technologies | i9-13900HX | GeForce RTX 4090 Laptop GPU | 21786 | |
| Medion Erazer Beast X40 dGPU | i9-13900HX | GeForce RTX 4090 Laptop GPU | 32 GB | 21900 |
| Schenker XMG Neo 17 2024 Engineering Sample via Schenker Technologies | i9-14900HX | GeForce RTX 4090 Laptop GPU | 21907 | |
| Eurocom Raptor X17 Core i9-14900HX via Eurocom | i9-14900HX 93 W / 63 W | GeForce RTX 4090 Laptop GPU 175 W 2040 / 2250 MHz 16 GB | 32 GB | 22104 |
| Schenker XMG Neo 16 (Early 24) via Schenker Technologies | i9-14900HX 205 W / 205 W | GeForce RTX 4090 Laptop GPU 175 W 2040 / 2250 MHz 16 GB | 32 GB | 22134 |
| MSI Titan GT77 HX 13VI via Intel Deutschland | i9-13950HX 220 W / 150 W | GeForce RTX 4090 Laptop GPU 175 W 2340 / 2250 MHz 16 GB | 64 GB | 22254 |
| MSI Titan 18 HX A14VIG via MSI | i9-14900HX 238 W / 176 W | GeForce RTX 4090 Laptop GPU 175 W 1555 / 2250 MHz 16 GB | 128 GB | 22256 |
| Alienware m18 R2 via Dell | i9-14900HX 180 W / 144 W | GeForce RTX 4090 Laptop GPU 175 W 1950 / 2250 MHz 16 GB | 32 GB | 22290 |
| MSI Raider GE78 HX 13VI | i9-13980HX | GeForce RTX 4090 Laptop GPU 175 W 16 GB | 64 GB | 22343 |
| Asus ROG Strix Scar 17 G733PY-XS96 via Asus | R9 7945HX 128 W / 128 W | GeForce RTX 4090 Laptop GPU 175 W 2090 / 2275 MHz 16 GB | 32 GB | 22453 |
| Medion Erazer Beast X40 2024 Gaming Mode | i9-14900HX 160 W / 160 W | GeForce RTX 4090 Laptop GPU 175 W 2040 / 2250 MHz 16 GB | 32 GB | 22474 |
| Medion Erazer Beast X40 dGPU, Cooling | i9-13900HX 160 W / 160 W | GeForce RTX 4090 Laptop GPU 175 W 2040 / 2250 MHz 16 GB | 32 GB | 22479 |
| Schenker XMG Neo 16 E23 | i9-13900HX 160 W / 160 W | GeForce RTX 4090 Laptop GPU 175 W 2040 / 2250 MHz 16 GB | 32 GB | 22529 |
| Alienware m18 R1 via Dell | i9-13980HX 198 W / 143 W | GeForce RTX 4090 Laptop GPU 175 W 1975 / 2263 MHz 16 GB | 32 GB | 22547 |
| Schenker XMG Neo 16 (Early 24) Overboost, Oasis | i9-14900HX 205 W / 205 W | GeForce RTX 4090 Laptop GPU 175 W 2040 / 2250 MHz 16 GB | 32 GB | 22717 |
| Eluktronics Mech-17 GP2 Liquid Propulsion Package G2 | i9-13900HX | GeForce RTX 4090 Laptop GPU | 23292 |
| GPU TDP ? | TDP 125 W | TDP 150 W | TDP 175 W |
|---|---|---|---|
| 99% | 84% | 85% | 100% |
| Model | CPU | GPU | RAM | Value |
|---|---|---|---|---|
| Aorus 17X AZF via Gigabyte Aorus Deutschland | i9-13900HX 157 W / 86 W | GeForce RTX 4090 Laptop GPU 175 W 2040 / 2250 MHz 16 GB | 32 GB | 538912 |
| Razer Blade 16 Early 2023 RTX 4090 via Razer | i9-13950HX 130 W / 110 W | GeForce RTX 4090 Laptop GPU 175 W 16 GB | 32 GB | 554375 |
| Asus ROG Strix Scar 18 2023 G834JY-N6005W | i9-13980HX 175 W / 170 W | GeForce RTX 4090 Laptop GPU 175 W 2090 / 2250 MHz 16 GB | 32 GB | 731818 |
| Model | CPU | GPU | RAM | Value |
|---|---|---|---|---|
| Razer Blade 16 Early 2023 RTX 4090 via Razer | i9-13950HX 130 W / 110 W | GeForce RTX 4090 Laptop GPU 175 W 16 GB | 32 GB | 510556 |
| Aorus 17X AZF via Gigabyte Aorus Deutschland | i9-13900HX 157 W / 86 W | GeForce RTX 4090 Laptop GPU 175 W 2040 / 2250 MHz 16 GB | 32 GB | 524379 |
| Asus ROG Strix Scar 18 2023 G834JY-N6005W | i9-13980HX 175 W / 170 W | GeForce RTX 4090 Laptop GPU 175 W 2090 / 2250 MHz 16 GB | 32 GB | 613731 |
| Model | CPU | GPU | RAM | Value |
|---|---|---|---|---|
| Razer Blade 16 Early 2023 RTX 4090 via Razer | i9-13950HX 130 W / 110 W | GeForce RTX 4090 Laptop GPU 175 W 16 GB | 32 GB | 52227 |
| Schenker Key 17 Pro (Early 23) via Schenker Technologies | i9-13900HX 162 W / 135 W | GeForce RTX 4090 Laptop GPU 175 W 2040 / 2250 MHz 16 GB | 32 GB | 54257 |
| Asus ROG Strix Scar 18 2023 G834JY-N6005W | i9-13980HX 0 W / 65 W | GeForce RTX 4090 Laptop GPU 175 W 2090 MHz 16 GB | 32 GB | 56704 |
| Aorus 17X AZF via Gigabyte Aorus Deutschland | i9-13900HX 157 W / 86 W | GeForce RTX 4090 Laptop GPU 175 W 2040 / 2250 MHz 16 GB | 32 GB | 58934 |
| Schenker Key 17 Pro (M24) via Bestware | i9-14900HX | GeForce RTX 4090 Laptop GPU 175 W 15.6 GB | 32 GB | 59382 |
| Acer Predator Helios 18 PH18-72-98MW via Acer Deutschland | i9-14900HX 157 W / 95 W | GeForce RTX 4090 Laptop GPU 175 W 1590 / 2250 MHz 16 GB | 32 GB | 59876 |
| Schenker XMG Neo 16 E23 | i9-13900HX 160 W / 160 W | GeForce RTX 4090 Laptop GPU 175 W 2040 / 2250 MHz 16 GB | 32 GB | 64860 |
| Asus ROG Strix Scar 18 G834JYR (2024) via Asus Deutschland | i9-14900HX 120 W / 110 W | GeForce RTX 4090 Laptop GPU 175 W 1455 / 2250 MHz 16 GB | 32 GB | 65110 |
| Razer Blade 16 2024, RTX 4090 via Razer | i9-14900HX 140 W / 60 W | GeForce RTX 4090 Laptop GPU 175 W 16 GB | 32 GB | 65797 |
| Medion Erazer Beast X40 dGPU, Cooling | i9-13900HX 160 W / 160 W | GeForce RTX 4090 Laptop GPU 175 W 2040 / 2250 MHz 16 GB | 32 GB | 66073 |
| Medion Erazer Beast X40 via Medion | i9-13900HX 160 W / 160 W | GeForce RTX 4090 Laptop GPU 175 W 2040 / 2375 MHz 16 GB | 32 GB | 66757 |
| Lenovo Legion 9 16IRX9, RTX 4090 via Lenovo | i9-14900HX | GeForce RTX 4090 Laptop GPU 175 W 16 GB | 64 GB | 67697 |
| Medion Erazer Beast X40 dGPU | i9-13900HX | GeForce RTX 4090 Laptop GPU | 32 GB | 69068 |
| Asus ROG Strix Scar 18 2023 G834JY-N6005W | i9-13980HX 175 W / 170 W | GeForce RTX 4090 Laptop GPU 175 W 2090 / 2250 MHz 16 GB | 32 GB | 70984 |
| GPU TDP ? | TDP 175 W |
|---|---|
| 100% | 90% |
| Model | CPU | GPU | RAM | Value |
|---|---|---|---|---|
| Schenker Key 17 Pro (Early 23) via Schenker Technologies | i9-13900HX 162 W / 135 W | GeForce RTX 4090 Laptop GPU 175 W 2040 / 2250 MHz 16 GB | 32 GB | 95671 |
| Aorus 17X AZF via Gigabyte Aorus Deutschland | i9-13900HX 157 W / 86 W | GeForce RTX 4090 Laptop GPU 175 W 2040 / 2250 MHz 16 GB | 32 GB | 132812 |
| Schenker Key 17 Pro (M24) via Bestware | i9-14900HX | GeForce RTX 4090 Laptop GPU 175 W 15.6 GB | 32 GB | 137440 |
| Razer Blade 16 Early 2023 RTX 4090 via Razer | i9-13950HX 130 W / 110 W | GeForce RTX 4090 Laptop GPU 175 W 16 GB | 32 GB | 140386 |
| Asus ROG Strix Scar 18 G834JYR (2024) via Asus Deutschland | i9-14900HX 120 W / 110 W | GeForce RTX 4090 Laptop GPU 175 W 1455 / 2250 MHz 16 GB | 32 GB | 141676 |
| Medion Erazer Beast X40 via Medion | i9-13900HX 160 W / 160 W | GeForce RTX 4090 Laptop GPU 175 W 2040 / 2375 MHz 16 GB | 32 GB | 142520 |
| Medion Erazer Beast X40 dGPU, Cooling | i9-13900HX 160 W / 160 W | GeForce RTX 4090 Laptop GPU 175 W 2040 / 2250 MHz 16 GB | 32 GB | 142552 |
| Asus ROG Strix Scar 18 2023 G834JY-N6005W | i9-13980HX 0 W / 65 W | GeForce RTX 4090 Laptop GPU 175 W 2090 MHz 16 GB | 32 GB | 143771 |
| Schenker XMG Neo 16 E23 | i9-13900HX 160 W / 160 W | GeForce RTX 4090 Laptop GPU 175 W 2040 / 2250 MHz 16 GB | 32 GB | 144032 |
| Acer Predator Helios 18 PH18-72-98MW via Acer Deutschland | i9-14900HX 157 W / 95 W | GeForce RTX 4090 Laptop GPU 175 W 1590 / 2250 MHz 16 GB | 32 GB | 145446 |
| Lenovo Legion 9 16IRX9, RTX 4090 via Lenovo | i9-14900HX | GeForce RTX 4090 Laptop GPU 175 W 16 GB | 64 GB | 148437 |
| Razer Blade 16 2024, RTX 4090 via Razer | i9-14900HX 140 W / 60 W | GeForce RTX 4090 Laptop GPU 175 W 16 GB | 32 GB | 152306 |
| Asus ROG Strix Scar 18 2023 G834JY-N6005W | i9-13980HX 175 W / 170 W | GeForce RTX 4090 Laptop GPU 175 W 2090 / 2250 MHz 16 GB | 32 GB | 159724 |
| Medion Erazer Beast X40 dGPU | i9-13900HX | GeForce RTX 4090 Laptop GPU | 32 GB | 164399 |
| GPU TDP ? | TDP 175 W |
|---|---|
| 100% | 85% |
| Model | CPU | GPU | RAM | Value |
|---|---|---|---|---|
| Razer Blade 16 Early 2023 RTX 4090 via Razer | i9-13950HX 130 W / 110 W | GeForce RTX 4090 Laptop GPU 175 W 16 GB | 32 GB | 65684 |
| Aorus 17X AZF via Gigabyte Aorus Deutschland | i9-13900HX 157 W / 86 W | GeForce RTX 4090 Laptop GPU 175 W 2040 / 2250 MHz 16 GB | 32 GB | 69939 |
| Asus ROG Strix Scar 18 2023 G834JY-N6005W | i9-13980HX 175 W / 170 W | GeForce RTX 4090 Laptop GPU 175 W 2090 / 2250 MHz 16 GB | 32 GB | 82037 |
| Model | CPU | GPU | RAM | Value |
|---|---|---|---|---|
| Razer Blade 16 Early 2023 RTX 4090 via Razer | i9-13950HX 130 W / 110 W | GeForce RTX 4090 Laptop GPU 175 W 16 GB | 32 GB | 163096 |
| Aorus 17X AZF via Gigabyte Aorus Deutschland | i9-13900HX 157 W / 86 W | GeForce RTX 4090 Laptop GPU 175 W 2040 / 2250 MHz 16 GB | 32 GB | 165244 |
| Asus ROG Strix Scar 18 2023 G834JY-N6005W | i9-13980HX 175 W / 170 W | GeForce RTX 4090 Laptop GPU 175 W 2090 / 2250 MHz 16 GB | 32 GB | 188250 |
| Model | CPU | GPU | RAM | Value |
|---|---|---|---|---|
| Asus ROG Zephyrus G16 GU605MY via Asus Deutschland | Ultra 9 185H | GeForce RTX 4090 Laptop GPU 1455 / 2250 MHz 16 GB | 32 GB | 38012 |
| Asus ROG Ally Z1 Extreme | Z1 Extreme | GeForce RTX 4090 Laptop GPU 150 W 16 GB | 16 GB | 39551 |
| Schenker Key 17 Pro (M24) via Bestware | i9-14900HX | GeForce RTX 4090 Laptop GPU 175 W 15.6 GB | 32 GB | 40366 |
| Asus ROG Zephyrus M16 GU604VY-NM042X via Asus | i9-13900H 140 W / 100 W | GeForce RTX 4090 Laptop GPU 150 W 16 GB | 64 GB | 41060 |
| Razer Blade 16 Early 2023 RTX 4090 via Razer | i9-13950HX 130 W / 110 W | GeForce RTX 4090 Laptop GPU 175 W 16 GB | 32 GB | 41433 |
| Asus ROG Zephyrus G14 GA402XY via Asus Deutschland | R9 7940HS 80 W / 80 W | GeForce RTX 4090 Laptop GPU 125 W 1455 / 2250 MHz 16 GB | 32 GB | 41745 |
| Medion Erazer Beast X40 2024 via Medion DE | i9-14900HX 160 W / 160 W | GeForce RTX 4090 Laptop GPU 175 W 2040 / 2250 MHz 16 GB | 32 GB | 41974 |
| Eurocom Raptor X17 via Eurocom | i9-13900HX 155 W / 110 W | GeForce RTX 4090 Laptop GPU 175 W 2040 / 2250 MHz 16 GB | 64 GB | 42940 |
| Asus ROG Zephyrus M16 | i9-13900H | GeForce RTX 4090 Laptop GPU 150 W 16 GB | 32 GB | 42983 |
| Asus ROG Strix Scar 18 G834JYR (2024) via Asus Deutschland | i9-14900HX 120 W / 110 W | GeForce RTX 4090 Laptop GPU 175 W 1455 / 2250 MHz 16 GB | 32 GB | 42985 |
| Asus ROG Strix Scar 18 2023 G834JY-N6005W | i9-13980HX 0 W / 65 W | GeForce RTX 4090 Laptop GPU 175 W 2090 MHz 16 GB | 32 GB | 43280 |
| Schenker XMG Neo 16 (Early 24) via Schenker Technologies | i9-14900HX 205 W / 205 W | GeForce RTX 4090 Laptop GPU 175 W 2040 / 2250 MHz 16 GB | 32 GB | 43829 |
| Aorus 17X AZF via Gigabyte Aorus Deutschland | i9-13900HX 157 W / 86 W | GeForce RTX 4090 Laptop GPU 175 W 2040 / 2250 MHz 16 GB | 32 GB | 43896 |
| Acer Predator Helios 18 PH18-72-98MW via Acer Deutschland | i9-14900HX 157 W / 95 W | GeForce RTX 4090 Laptop GPU 175 W 1590 / 2250 MHz 16 GB | 32 GB | 44065 |
| Asus ROG Flow Z13 ACRNM | i9-13900H | GeForce RTX 4090 Laptop GPU 150 W 16 GB | 32 GB | 44202 |
| Razer Blade 16 2024, RTX 4090 via Razer | i9-14900HX 140 W / 60 W | GeForce RTX 4090 Laptop GPU 175 W 16 GB | 32 GB | 44454 |
| XMG Neo 16 E23 | i9-13900HX | GeForce RTX 4090 Laptop GPU 175 W 16 GB | 32 GB | 44496 |
| Schenker Key 17 Pro (Early 23) via Schenker Technologies | i9-13900HX 162 W / 135 W | GeForce RTX 4090 Laptop GPU 175 W 2040 / 2250 MHz 16 GB | 32 GB | 44742 |
| Lenovo Legion Pro 7 RTX4090 via Lenovo Deutschland | i9-13900HX 185 W / 130 W | GeForce RTX 4090 Laptop GPU 175 W 1455 / 2250 MHz 16 GB | 32 GB | 44779 |
| MSI Raider GE78 HX 13VI | i9-13980HX | GeForce RTX 4090 Laptop GPU 175 W 16 GB | 64 GB | 44964 |
| Schenker Neo 17 2024 Engineering Sample | i9-14900HX | GeForce RTX 4090 Laptop GPU | 32 GB | 45209 |
| Lenovo Legion 9 16IRX8 via Lenovo | i9-13980HX 145 W / 125 W | GeForce RTX 4090 Laptop GPU 175 W 1605 / 2300 MHz 16 GB | 32 GB | 45239 |
| Razer Blade 18 2024 RZ09-0509 via Razer | i9-14900HX 138 W / 117 W | GeForce RTX 4090 Laptop GPU 175 W 1455 / 2250 MHz 16 GB | 32 GB | 45938 |
| Asus Zephyrus Duo 16 GX650PY-NM006W via Asus Deutschland | R9 7945HX 130 W / 120 W | GeForce RTX 4090 Laptop GPU 175 W 2090 / 2275 MHz 16 GB | 32 GB | 46207 |
| MSI Titan 18 HX A14VIG via MSI | i9-14900HX 238 W / 176 W | GeForce RTX 4090 Laptop GPU 175 W 1555 / 2250 MHz 16 GB | 128 GB | 46238 |
| Asus ROG Strix Scar 17 G733PY-XS96 via Asus | R9 7945HX 128 W / 128 W | GeForce RTX 4090 Laptop GPU 175 W 2090 / 2275 MHz 16 GB | 32 GB | 46484 |
| Medion Erazer Beast X40 dGPU | i9-13900HX | GeForce RTX 4090 Laptop GPU | 32 GB | 46680 |
| Lenovo Legion 9 16IRX9, RTX 4090 via Lenovo | i9-14900HX | GeForce RTX 4090 Laptop GPU 175 W 16 GB | 64 GB | 46826 |
| Schenker XMG Neo 16 E23 | i9-13900HX 160 W / 160 W | GeForce RTX 4090 Laptop GPU 175 W 2040 / 2250 MHz 16 GB | 32 GB | 46859 |
| Eluktronics Mech-17 GP2 via Eluktronics | i9-13900HX 160 W / 99 W | GeForce RTX 4090 Laptop GPU 175 W 2140 / 2375 MHz 16 GB | 32 GB | 46863 |
| Eurocom Raptor X17 Core i9-14900HX via Eurocom | i9-14900HX 93 W / 63 W | GeForce RTX 4090 Laptop GPU 175 W 2040 / 2250 MHz 16 GB | 32 GB | 46970 |
| Asus ROG Strix Scar 18 2023 G834JY-N6005W | i9-13980HX 175 W / 170 W | GeForce RTX 4090 Laptop GPU 175 W 2090 / 2250 MHz 16 GB | 32 GB | 46985 |
| Medion Erazer Beast X40 via Medion | i9-13900HX 160 W / 160 W | GeForce RTX 4090 Laptop GPU 175 W 2040 / 2375 MHz 16 GB | 32 GB | 47487 |
| Medion Erazer Beast X40 dGPU, Cooling | i9-13900HX 160 W / 160 W | GeForce RTX 4090 Laptop GPU 175 W 2040 / 2250 MHz 16 GB | 32 GB | 47577 |
| Asus ROG Strix Scar 17 G733PYV-LL053X via AMD | R9 7945HX3D 115 W / 100 W | GeForce RTX 4090 Laptop GPU 175 W 2040 / 2250 MHz 16 GB | 32 GB | 47621 |
| Medion Erazer Beast X40 2024 Gaming Mode | i9-14900HX 160 W / 160 W | GeForce RTX 4090 Laptop GPU 175 W 2040 / 2250 MHz 16 GB | 32 GB | 47758 |
| Alienware m18 R2 via Dell | i9-14900HX 180 W / 144 W | GeForce RTX 4090 Laptop GPU 175 W 1950 / 2250 MHz 16 GB | 32 GB | 48622 |
| Schenker XMG Neo 16 Raptor Lake via Schenker Technologies | i9-13900HX | GeForce RTX 4090 Laptop GPU | 48733 | |
| XMG Neo 17 E23 | i9-13900HX | GeForce RTX 4090 Laptop GPU 175 W 16 GB | 32 GB | 48949 |
| MSI Titan GT77 HX 13VI via Intel Deutschland | i9-13950HX 220 W / 150 W | GeForce RTX 4090 Laptop GPU 175 W 2340 / 2250 MHz 16 GB | 64 GB | 49253 |
| Alienware m18 R1 via Dell | i9-13980HX 198 W / 143 W | GeForce RTX 4090 Laptop GPU 175 W 1975 / 2263 MHz 16 GB | 32 GB | 50411 |
| Schenker XMG Neo 16 (Early 24) Overboost, Oasis | i9-14900HX 205 W / 205 W | GeForce RTX 4090 Laptop GPU 175 W 2040 / 2250 MHz 16 GB | 32 GB | 51757 |
| GPU TDP ? | TDP 125 W | TDP 150 W | TDP 175 W |
|---|---|---|---|
| 97% | 91% | 92% | 100% |
| Model | CPU | GPU | RAM | Value |
|---|---|---|---|---|
| Asus ROG Zephyrus G16 GU605MY via Asus Deutschland | Ultra 9 185H | GeForce RTX 4090 Laptop GPU 1455 / 2250 MHz 16 GB | 32 GB | 54073 |
| Asus ROG Zephyrus G14 GA402XY via Asus Deutschland | R9 7940HS 80 W / 80 W | GeForce RTX 4090 Laptop GPU 125 W 1455 / 2250 MHz 16 GB | 32 GB | 56764 |
| Asus ROG Zephyrus M16 GU604VY-NM042X via Asus | i9-13900H 140 W / 100 W | GeForce RTX 4090 Laptop GPU 150 W 16 GB | 64 GB | 58891 |
| Asus ROG Zephyrus M16 | i9-13900H | GeForce RTX 4090 Laptop GPU 150 W 16 GB | 32 GB | 59044 |
| Schenker Key 17 Pro (M24) via Bestware | i9-14900HX | GeForce RTX 4090 Laptop GPU 175 W 15.6 GB | 32 GB | 59715 |
| Acer Predator Helios 18 PH18-72-98MW via Acer Deutschland | i9-14900HX 157 W / 95 W | GeForce RTX 4090 Laptop GPU 175 W 1590 / 2250 MHz 16 GB | 32 GB | 59871 |
| Asus ROG Ally Z1 Extreme | Z1 Extreme | GeForce RTX 4090 Laptop GPU 150 W 16 GB | 16 GB | 60250 |
| Razer Blade 16 Early 2023 RTX 4090 via Razer | i9-13950HX 130 W / 110 W | GeForce RTX 4090 Laptop GPU 175 W 16 GB | 32 GB | 60602 |
| Asus ROG Strix Scar 18 2023 G834JY-N6005W | i9-13980HX 0 W / 65 W | GeForce RTX 4090 Laptop GPU 175 W 2090 MHz 16 GB | 32 GB | 61505 |
| Asus ROG Strix Scar 18 G834JYR (2024) via Asus Deutschland | i9-14900HX 120 W / 110 W | GeForce RTX 4090 Laptop GPU 175 W 1455 / 2250 MHz 16 GB | 32 GB | 61833 |
| Asus Zephyrus Duo 16 GX650PY-NM006W via Asus Deutschland | R9 7945HX 130 W / 120 W | GeForce RTX 4090 Laptop GPU 175 W 2090 / 2275 MHz 16 GB | 32 GB | 62240 |
| Aorus 17X AZF via Gigabyte Aorus Deutschland | i9-13900HX 157 W / 86 W | GeForce RTX 4090 Laptop GPU 175 W 2040 / 2250 MHz 16 GB | 32 GB | 62544 |
| Lenovo Legion Pro 7 RTX4090 via Lenovo Deutschland | i9-13900HX 185 W / 130 W | GeForce RTX 4090 Laptop GPU 175 W 1455 / 2250 MHz 16 GB | 32 GB | 62862 |
| Eurocom Raptor X17 Core i9-14900HX via Eurocom | i9-14900HX 93 W / 63 W | GeForce RTX 4090 Laptop GPU 175 W 2040 / 2250 MHz 16 GB | 32 GB | 63191 |
| Asus ROG Strix Scar 17 G733PY-XS96 via Asus | R9 7945HX 128 W / 128 W | GeForce RTX 4090 Laptop GPU 175 W 2090 / 2275 MHz 16 GB | 32 GB | 63504 |
| Asus ROG Strix Scar 18 2023 G834JY-N6005W | i9-13980HX 175 W / 170 W | GeForce RTX 4090 Laptop GPU 175 W 2090 / 2250 MHz 16 GB | 32 GB | 63818 |
| Lenovo Legion 9 16IRX8 via Lenovo | i9-13980HX 145 W / 125 W | GeForce RTX 4090 Laptop GPU 175 W 1605 / 2300 MHz 16 GB | 32 GB | 63925 |
| MSI Titan 18 HX A14VIG via MSI | i9-14900HX 238 W / 176 W | GeForce RTX 4090 Laptop GPU 175 W 1555 / 2250 MHz 16 GB | 128 GB | 63978 |
| Asus ROG Strix Scar 17 G733PYV-LL053X via AMD | R9 7945HX3D 115 W / 100 W | GeForce RTX 4090 Laptop GPU 175 W 2040 / 2250 MHz 16 GB | 32 GB | 64166 |
| Lenovo Legion 9 16IRX9, RTX 4090 via Lenovo | i9-14900HX | GeForce RTX 4090 Laptop GPU 175 W 16 GB | 64 GB | 64341 |
| Medion Erazer Beast X40 2024 via Medion DE | i9-14900HX 160 W / 160 W | GeForce RTX 4090 Laptop GPU 175 W 2040 / 2250 MHz 16 GB | 32 GB | 64540 |
| Razer Blade 18 2024 RZ09-0509 via Razer | i9-14900HX 138 W / 117 W | GeForce RTX 4090 Laptop GPU 175 W 1455 / 2250 MHz 16 GB | 32 GB | 64952 |
| MSI Raider GE78 HX 13VI | i9-13980HX | GeForce RTX 4090 Laptop GPU 175 W 16 GB | 64 GB | 65531 |
| Asus ROG Flow Z13 ACRNM | i9-13900H | GeForce RTX 4090 Laptop GPU 150 W 16 GB | 32 GB | 65568 |
| Razer Blade 16 2024, RTX 4090 via Razer | i9-14900HX 140 W / 60 W | GeForce RTX 4090 Laptop GPU 175 W 16 GB | 32 GB | 65956 |
| Eluktronics Mech-17 GP2 via Eluktronics | i9-13900HX 160 W / 99 W | GeForce RTX 4090 Laptop GPU 175 W 2140 / 2375 MHz 16 GB | 32 GB | 66008 |
| XMG Neo 16 E23 | i9-13900HX | GeForce RTX 4090 Laptop GPU 175 W 16 GB | 32 GB | 66059 |
| Schenker Neo 17 2024 Engineering Sample | i9-14900HX | GeForce RTX 4090 Laptop GPU | 32 GB | 66129 |
| Eurocom Raptor X17 via Eurocom | i9-13900HX 155 W / 110 W | GeForce RTX 4090 Laptop GPU 175 W 2040 / 2250 MHz 16 GB | 64 GB | 66589 |
| Medion Erazer Beast X40 dGPU | i9-13900HX | GeForce RTX 4090 Laptop GPU | 32 GB | 67073 |
| Medion Erazer Beast X40 via Medion | i9-13900HX 160 W / 160 W | GeForce RTX 4090 Laptop GPU 175 W 2040 / 2375 MHz 16 GB | 32 GB | 68692 |
| MSI Titan GT77 HX 13VI via Intel Deutschland | i9-13950HX 220 W / 150 W | GeForce RTX 4090 Laptop GPU 175 W 2340 / 2250 MHz 16 GB | 64 GB | 69211 |
| Alienware m18 R2 via Dell | i9-14900HX 180 W / 144 W | GeForce RTX 4090 Laptop GPU 175 W 1950 / 2250 MHz 16 GB | 32 GB | 69254 |
| Schenker Key 17 Pro (Early 23) via Schenker Technologies | i9-13900HX 162 W / 135 W | GeForce RTX 4090 Laptop GPU 175 W 2040 / 2250 MHz 16 GB | 32 GB | 69447 |
| Schenker XMG Neo 16 (Early 24) via Schenker Technologies | i9-14900HX 205 W / 205 W | GeForce RTX 4090 Laptop GPU 175 W 2040 / 2250 MHz 16 GB | 32 GB | 69606 |
| Medion Erazer Beast X40 dGPU, Cooling | i9-13900HX 160 W / 160 W | GeForce RTX 4090 Laptop GPU 175 W 2040 / 2250 MHz 16 GB | 32 GB | 69777 |
| Medion Erazer Beast X40 2024 Gaming Mode | i9-14900HX 160 W / 160 W | GeForce RTX 4090 Laptop GPU 175 W 2040 / 2250 MHz 16 GB | 32 GB | 70109 |
| Alienware m18 R1 via Dell | i9-13980HX 198 W / 143 W | GeForce RTX 4090 Laptop GPU 175 W 1975 / 2263 MHz 16 GB | 32 GB | 71383 |
| Schenker XMG Neo 16 Raptor Lake via Schenker Technologies | i9-13900HX | GeForce RTX 4090 Laptop GPU | 71432 | |
| Schenker XMG Neo 16 E23 | i9-13900HX 160 W / 160 W | GeForce RTX 4090 Laptop GPU 175 W 2040 / 2250 MHz 16 GB | 32 GB | 72070 |
| Schenker XMG Neo 16 (Early 24) Overboost, Oasis | i9-14900HX 205 W / 205 W | GeForce RTX 4090 Laptop GPU 175 W 2040 / 2250 MHz 16 GB | 32 GB | 72178 |
| XMG Neo 17 E23 | i9-13900HX | GeForce RTX 4090 Laptop GPU 175 W 16 GB | 32 GB | 73027 |
| GPU TDP ? | TDP 125 W | TDP 150 W | TDP 175 W |
|---|---|---|---|
| 98% | 86% | 93% | 100% |
3DM Vant. Perf. total +
| Model | CPU | GPU | RAM | Value |
|---|---|---|---|---|
| MSI Titan GT77 HX 13VI via Intel Deutschland | i9-13950HX 220 W / 150 W | GeForce RTX 4090 Laptop GPU 175 W 2340 / 2250 MHz 16 GB | 64 GB | 113387 |
| Model | CPU | GPU | RAM | Value |
|---|---|---|---|---|
| MSI Titan GT77 HX 13VI via Intel Deutschland | i9-13950HX 220 W / 150 W | GeForce RTX 4090 Laptop GPU 175 W 2340 / 2250 MHz 16 GB | 64 GB | 132443 |
| Model | CPU | GPU | RAM | Value |
|---|---|---|---|---|
| Aorus 17X AZF via Gigabyte Aorus Deutschland | i9-13900HX 157 W / 86 W | GeForce RTX 4090 Laptop GPU 175 W 2040 / 2250 MHz 16 GB | 32 GB | 61850 |
| Model | CPU | GPU | RAM | Value | |
|---|---|---|---|---|---|
| 3DMark 06 - Standard 1280x1024 | |||||
| Medion Erazer Beast X40 via Medion (3DMark 06 - Standard 1280x1024) | i9-13900HX 160 W / 160 W | GeForce RTX 4090 Laptop GPU 175 W 2040 / 2375 MHz 16 GB | 32 GB | 60717 | |
| Aorus 17X AZF via Gigabyte Aorus Deutschland (3DMark 06 - Standard 1280x1024) | i9-13900HX 157 W / 86 W | GeForce RTX 4090 Laptop GPU 175 W 2040 / 2250 MHz 16 GB | 32 GB | 61681 | |
| Schenker XMG Neo 16 (Early 24) via Schenker Technologies (3DMark 06 - Standard 1280x1024) | i9-14900HX 205 W / 205 W | GeForce RTX 4090 Laptop GPU 175 W 2040 / 2250 MHz 16 GB | 32 GB | 62889 | |
| Asus ROG Strix Scar 18 2023 G834JY-N6005W (3DMark 06 - Standard 1280x1024) | i9-13980HX 175 W / 170 W | GeForce RTX 4090 Laptop GPU 175 W 2090 / 2250 MHz 16 GB | 32 GB | 67702 | |
| MSI Titan GT77 HX 13VI via Intel Deutschland (3DMark 06 - Standard 1280x1024) | i9-13950HX 220 W / 150 W | GeForce RTX 4090 Laptop GPU 175 W 2340 / 2250 MHz 16 GB | 64 GB | 67927 | |
| Model | CPU | GPU | RAM | Value |
|---|---|---|---|---|
| MSI Titan GT77 HX 13VI via Intel Deutschland | i9-13950HX 220 W / 150 W | GeForce RTX 4090 Laptop GPU 175 W 2340 / 2250 MHz 16 GB | 64 GB | 232 |
| Model | CPU | GPU | RAM | Value |
|---|---|---|---|---|
| Lenovo Legion 9 16IRX8 via Lenovo 3.3.3 | i9-13980HX 145 W / 125 W | GeForce RTX 4090 Laptop GPU 175 W 1605 / 2300 MHz 16 GB | 32 GB | 16 |
| Schenker XMG Neo 16 (Early 24) 3.3.3, Overboost, Oasis | i9-14900HX 205 W / 205 W | GeForce RTX 4090 Laptop GPU 175 W 2040 / 2250 MHz 16 GB | 32 GB | 16 |
| MSI Titan GT77 HX 13VI via Intel Deutschland 3.3.3 | i9-13950HX 220 W / 150 W | GeForce RTX 4090 Laptop GPU 175 W 2340 / 2250 MHz 16 GB | 64 GB | 17 |
| Asus ROG Strix Scar 18 2023 G834JY-N6005W 3.3.3 | i9-13980HX 175 W / 170 W | GeForce RTX 4090 Laptop GPU 175 W 2090 / 2250 MHz 16 GB | 32 GB | 17 |
| Razer Blade 16 Early 2023 RTX 4090 via Razer 3.3.3 | i9-13950HX 130 W / 110 W | GeForce RTX 4090 Laptop GPU 175 W 16 GB | 32 GB | 17 |
| MSI Titan GT77 HX 13VI 3.3.3 | i9-13980HX | GeForce RTX 4090 Laptop GPU | 64 GB | 17 |
| Eluktronics Mech-17 GP2 via Eluktronics 3.3.3 | i9-13900HX 160 W / 99 W | GeForce RTX 4090 Laptop GPU 175 W 2140 / 2375 MHz 16 GB | 32 GB | 17 |
| Alienware m18 R1 via Dell 3.3.3 | i9-13980HX 198 W / 143 W | GeForce RTX 4090 Laptop GPU 175 W 1975 / 2263 MHz 16 GB | 32 GB | 17 |
| Asus ROG Strix Scar 17 G733PY-XS96 via Asus 3.3.3 | R9 7945HX 128 W / 128 W | GeForce RTX 4090 Laptop GPU 175 W 2090 / 2275 MHz 16 GB | 32 GB | 17 |
| Asus ROG Strix Scar 18 G834JYR (2024) via Asus Deutschland 3.3.3 | i9-14900HX 120 W / 110 W | GeForce RTX 4090 Laptop GPU 175 W 1455 / 2250 MHz 16 GB | 32 GB | 17 |
| Medion Erazer Beast X40 2024 via Medion DE 3.3.3 | i9-14900HX 160 W / 160 W | GeForce RTX 4090 Laptop GPU 175 W 2040 / 2250 MHz 16 GB | 32 GB | 17 |
| Schenker Neo 17 2024 Engineering Sample 3.3.3 | i9-14900HX | GeForce RTX 4090 Laptop GPU | 32 GB | 17 |
| Schenker XMG Neo 16 (Early 24) via Schenker Technologies 3.3.3 | i9-14900HX 205 W / 205 W | GeForce RTX 4090 Laptop GPU 175 W 2040 / 2250 MHz 16 GB | 32 GB | 17 |
| Schenker XMG Neo 16 Raptor Lake via Schenker Technologies 3.3.3 | i9-13900HX | GeForce RTX 4090 Laptop GPU | 18 | |
| Asus ROG Strix Scar 18 2023 G834JY-N6005W 3.3.3 | i9-13980HX 0 W / 65 W | GeForce RTX 4090 Laptop GPU 175 W 2090 MHz 16 GB | 32 GB | 18 |
| Asus ROG Strix Scar 18 2023 G834JY-N6005W 3.3.3 | i9-13980HX 175 W / 170 W | GeForce RTX 4090 Laptop GPU 175 W 2090 / 2250 MHz 16 GB | 32 GB | 18 |
| Asus ROG Zephyrus M16 GU604VY-NM042X via Asus 3.3.3 | i9-13900H 140 W / 100 W | GeForce RTX 4090 Laptop GPU 150 W 16 GB | 64 GB | 18 |
| Medion Erazer Beast X40 3.3.3, dGPU | i9-13900HX | GeForce RTX 4090 Laptop GPU | 32 GB | 18 |
| Schenker XMG Neo 16 E23 3.3.0 | i9-13900HX 160 W / 160 W | GeForce RTX 4090 Laptop GPU 175 W 2040 / 2250 MHz 16 GB | 32 GB | 18 |
| Lenovo Legion Pro 7 RTX4090 via Lenovo Deutschland | i9-13900HX 185 W / 130 W | GeForce RTX 4090 Laptop GPU 175 W 1455 / 2250 MHz 16 GB | 32 GB | 18 |
| Asus ROG Strix Scar 17 G733PYV-LL053X via AMD 3.3.3 | R9 7945HX3D 115 W / 100 W | GeForce RTX 4090 Laptop GPU 175 W 2040 / 2250 MHz 16 GB | 32 GB | 18 |
| MSI Titan 18 HX A14VIG via MSI 3.3.3 | i9-14900HX 238 W / 176 W | GeForce RTX 4090 Laptop GPU 175 W 1555 / 2250 MHz 16 GB | 128 GB | 18 |
| Razer Blade 16 2024, RTX 4090 via Razer 3.3.3 | i9-14900HX 140 W / 60 W | GeForce RTX 4090 Laptop GPU 175 W 16 GB | 32 GB | 18 |
| Acer Predator Helios 18 PH18-72-98MW via Acer Deutschland 3.3.3 | i9-14900HX 157 W / 95 W | GeForce RTX 4090 Laptop GPU 175 W 1590 / 2250 MHz 16 GB | 32 GB | 18 |
| Alienware m18 R2 via Dell 3.3.3 | i9-14900HX 180 W / 144 W | GeForce RTX 4090 Laptop GPU 175 W 1950 / 2250 MHz 16 GB | 32 GB | 18 |
| Lenovo Legion 9 16IRX9, RTX 4090 via Lenovo 3.3.3 | i9-14900HX | GeForce RTX 4090 Laptop GPU 175 W 16 GB | 64 GB | 18 |
| Schenker Key 17 Pro (M24) via Bestware 3.3.3 | i9-14900HX | GeForce RTX 4090 Laptop GPU 175 W 15.6 GB | 32 GB | 18 |
| Medion Erazer Beast X40 via Medion 3.3.3 | i9-13900HX 160 W / 160 W | GeForce RTX 4090 Laptop GPU 175 W 2040 / 2375 MHz 16 GB | 32 GB | 19 |
| Medion Erazer Beast X40 3.3.3, dGPU, Cooling | i9-13900HX 160 W / 160 W | GeForce RTX 4090 Laptop GPU 175 W 2040 / 2250 MHz 16 GB | 32 GB | 19 |
| Eurocom Raptor X17 via Eurocom 3.3.3 | i9-13900HX 155 W / 110 W | GeForce RTX 4090 Laptop GPU 175 W 2040 / 2250 MHz 16 GB | 64 GB | 19 |
| Medion Erazer Beast X40 2024 3.3.3, Gaming Mode | i9-14900HX 160 W / 160 W | GeForce RTX 4090 Laptop GPU 175 W 2040 / 2250 MHz 16 GB | 32 GB | 19 |
| Eurocom Raptor X17 Core i9-14900HX via Eurocom 3.3.3 | i9-14900HX 93 W / 63 W | GeForce RTX 4090 Laptop GPU 175 W 2040 / 2250 MHz 16 GB | 32 GB | 19 |
| Razer Blade 18 2024 RZ09-0509 via Razer 3.3.3 | i9-14900HX 138 W / 117 W | GeForce RTX 4090 Laptop GPU 175 W 1455 / 2250 MHz 16 GB | 32 GB | 19 |
| Asus Zephyrus Duo 16 GX650PY-NM006W via Asus Deutschland 3.3.3 | R9 7945HX 130 W / 120 W | GeForce RTX 4090 Laptop GPU 175 W 2090 / 2275 MHz 16 GB | 32 GB | 20 |
| Schenker Key 17 Pro (Early 23) via Schenker Technologies 3.3.3 | i9-13900HX 162 W / 135 W | GeForce RTX 4090 Laptop GPU 175 W 2040 / 2250 MHz 16 GB | 32 GB | 20 |
| Asus ROG Zephyrus G16 GU605MY via Asus Deutschland 3.3.3 | Ultra 9 185H | GeForce RTX 4090 Laptop GPU 1455 / 2250 MHz 16 GB | 32 GB | 20 |
| Aorus 17X AZF via Gigabyte Aorus Deutschland 3.3.3 | i9-13900HX 157 W / 86 W | GeForce RTX 4090 Laptop GPU 175 W 2040 / 2250 MHz 16 GB | 32 GB | 21 |
| Asus ROG Zephyrus G14 GA402XY via Asus Deutschland 3.3.3 | R9 7940HS 80 W / 80 W | GeForce RTX 4090 Laptop GPU 125 W 1455 / 2250 MHz 16 GB | 32 GB | 23 |
| Asus ROG Strix Scar 18 G834JYR (2024) 3.3.3, Turbo | i9-14900HX 175 W / 175 W | GeForce RTX 4090 Laptop GPU 175 W 1455 / 2250 MHz 16 GB | 32 GB | 24 |
| GPU TDP ? | TDP 125 W | TDP 150 W | TDP 175 W |
|---|---|---|---|
| 101% | 100% | 101% | 101% |
| Model | CPU | GPU | RAM | Value |
|---|---|---|---|---|
| Eluktronics Mech-17 GP2 via Eluktronics 3.3.3 | i9-13900HX 160 W / 99 W | GeForce RTX 4090 Laptop GPU 175 W 2140 / 2375 MHz 16 GB | 32 GB | 9 |
| Asus ROG Strix Scar 18 2023 G834JY-N6005W 3.3.3 | i9-13980HX 175 W / 170 W | GeForce RTX 4090 Laptop GPU 175 W 2090 / 2250 MHz 16 GB | 32 GB | 10 |
| Medion Erazer Beast X40 3.3.3, dGPU | i9-13900HX | GeForce RTX 4090 Laptop GPU | 32 GB | 10 |
| Lenovo Legion 9 16IRX8 via Lenovo 3.3.3 | i9-13980HX 145 W / 125 W | GeForce RTX 4090 Laptop GPU 175 W 1605 / 2300 MHz 16 GB | 32 GB | 10 |
| MSI Titan 18 HX A14VIG via MSI 3.3.3 | i9-14900HX 238 W / 176 W | GeForce RTX 4090 Laptop GPU 175 W 1555 / 2250 MHz 16 GB | 128 GB | 10 |
| MSI Titan GT77 HX 13VI via Intel Deutschland 3.3.3 | i9-13950HX 220 W / 150 W | GeForce RTX 4090 Laptop GPU 175 W 2340 / 2250 MHz 16 GB | 64 GB | 11 |
| Schenker XMG Neo 16 Raptor Lake via Schenker Technologies 3.3.3 | i9-13900HX | GeForce RTX 4090 Laptop GPU | 11 | |
| Razer Blade 16 Early 2023 RTX 4090 via Razer 3.3.3 | i9-13950HX 130 W / 110 W | GeForce RTX 4090 Laptop GPU 175 W 16 GB | 32 GB | 11 |
| MSI Titan GT77 HX 13VI 3.3.3 | i9-13980HX | GeForce RTX 4090 Laptop GPU | 64 GB | 11 |
| Asus ROG Strix Scar 17 G733PY-XS96 via Asus 3.3.3 | R9 7945HX 128 W / 128 W | GeForce RTX 4090 Laptop GPU 175 W 2090 / 2275 MHz 16 GB | 32 GB | 11 |
| Eurocom Raptor X17 via Eurocom 3.3.3 | i9-13900HX 155 W / 110 W | GeForce RTX 4090 Laptop GPU 175 W 2040 / 2250 MHz 16 GB | 64 GB | 11 |
| Schenker Key 17 Pro (Early 23) via Schenker Technologies 3.3.3 | i9-13900HX 162 W / 135 W | GeForce RTX 4090 Laptop GPU 175 W 2040 / 2250 MHz 16 GB | 32 GB | 11 |
| Asus ROG Strix Scar 17 G733PYV-LL053X via AMD 3.3.3 | R9 7945HX3D 115 W / 100 W | GeForce RTX 4090 Laptop GPU 175 W 2040 / 2250 MHz 16 GB | 32 GB | 11 |
| Medion Erazer Beast X40 2024 via Medion DE 3.3.3 | i9-14900HX 160 W / 160 W | GeForce RTX 4090 Laptop GPU 175 W 2040 / 2250 MHz 16 GB | 32 GB | 11 |
| Medion Erazer Beast X40 2024 3.3.3, Gaming Mode | i9-14900HX 160 W / 160 W | GeForce RTX 4090 Laptop GPU 175 W 2040 / 2250 MHz 16 GB | 32 GB | 11 |
| Schenker Neo 17 2024 Engineering Sample 3.3.3 | i9-14900HX | GeForce RTX 4090 Laptop GPU | 32 GB | 11 |
| Asus ROG Strix Scar 18 2023 G834JY-N6005W 3.3.3 | i9-13980HX 0 W / 65 W | GeForce RTX 4090 Laptop GPU 175 W 2090 MHz 16 GB | 32 GB | 12 |
| Medion Erazer Beast X40 3.3.3, dGPU, Cooling | i9-13900HX 160 W / 160 W | GeForce RTX 4090 Laptop GPU 175 W 2040 / 2250 MHz 16 GB | 32 GB | 12 |
| Lenovo Legion Pro 7 RTX4090 via Lenovo Deutschland 3.3.3 | i9-13900HX 185 W / 130 W | GeForce RTX 4090 Laptop GPU 175 W 1455 / 2250 MHz 16 GB | 32 GB | 12 |
| Asus ROG Strix Scar 18 G834JYR (2024) via Asus Deutschland 3.3.3 | i9-14900HX 120 W / 110 W | GeForce RTX 4090 Laptop GPU 175 W 1455 / 2250 MHz 16 GB | 32 GB | 12 |
| Razer Blade 16 2024, RTX 4090 via Razer 3.3.3 | i9-14900HX 140 W / 60 W | GeForce RTX 4090 Laptop GPU 175 W 16 GB | 32 GB | 12 |
| Eurocom Raptor X17 Core i9-14900HX via Eurocom 3.3.3 | i9-14900HX 93 W / 63 W | GeForce RTX 4090 Laptop GPU 175 W 2040 / 2250 MHz 16 GB | 32 GB | 12 |
| Alienware m18 R2 via Dell 3.3.3 | i9-14900HX 180 W / 144 W | GeForce RTX 4090 Laptop GPU 175 W 1950 / 2250 MHz 16 GB | 32 GB | 12 |
| Schenker XMG Neo 16 (Early 24) 3.3.3, Overboost, Oasis | i9-14900HX 205 W / 205 W | GeForce RTX 4090 Laptop GPU 175 W 2040 / 2250 MHz 16 GB | 32 GB | 12 |
| Asus Zephyrus Duo 16 GX650PY-NM006W via Asus Deutschland 3.3.3 | R9 7945HX 130 W / 120 W | GeForce RTX 4090 Laptop GPU 175 W 2090 / 2275 MHz 16 GB | 32 GB | 13 |
| Schenker XMG Neo 16 E23 3.3.0 | i9-13900HX 160 W / 160 W | GeForce RTX 4090 Laptop GPU 175 W 2040 / 2250 MHz 16 GB | 32 GB | 13 |
| Asus ROG Flow Z13 ACRNM 3.3.3 | i9-13900H | GeForce RTX 4090 Laptop GPU 150 W 16 GB | 32 GB | 13 |
| Asus ROG Zephyrus G14 GA402XY via Asus Deutschland 3.3.3 | R9 7940HS 80 W / 80 W | GeForce RTX 4090 Laptop GPU 125 W 1455 / 2250 MHz 16 GB | 32 GB | 13 |
| Schenker XMG Neo 17 2024 Engineering Sample via Schenker Technologies 3.3.3 | i9-14900HX | GeForce RTX 4090 Laptop GPU | 13 | |
| Acer Predator Helios 18 PH18-72-98MW via Acer Deutschland 3.3.3 | i9-14900HX 157 W / 95 W | GeForce RTX 4090 Laptop GPU 175 W 1590 / 2250 MHz 16 GB | 32 GB | 13 |
| Asus ROG Zephyrus G16 GU605MY via Asus Deutschland 3.3.3 | Ultra 9 185H | GeForce RTX 4090 Laptop GPU 1455 / 2250 MHz 16 GB | 32 GB | 13 |
| Lenovo Legion 9 16IRX9, RTX 4090 via Lenovo 3.3.3 | i9-14900HX | GeForce RTX 4090 Laptop GPU 175 W 16 GB | 64 GB | 13 |
| Schenker XMG Neo 16 (Early 24) via Schenker Technologies 3.3.3 | i9-14900HX 205 W / 205 W | GeForce RTX 4090 Laptop GPU 175 W 2040 / 2250 MHz 16 GB | 32 GB | 13 |
| Schenker Key 17 Pro (M24) via Bestware 3.3.3 | i9-14900HX | GeForce RTX 4090 Laptop GPU 175 W 15.6 GB | 32 GB | 13 |
| Medion Erazer Beast X40 via Medion 3.3.3 | i9-13900HX 160 W / 160 W | GeForce RTX 4090 Laptop GPU 175 W 2040 / 2375 MHz 16 GB | 32 GB | 14 |
| Aorus 17X AZF via Gigabyte Aorus Deutschland 3.3.3 | i9-13900HX 157 W / 86 W | GeForce RTX 4090 Laptop GPU 175 W 2040 / 2250 MHz 16 GB | 32 GB | 14 |
| Razer Blade 18 2024 RZ09-0509 via Razer 3.3.3 | i9-14900HX 138 W / 117 W | GeForce RTX 4090 Laptop GPU 175 W 1455 / 2250 MHz 16 GB | 32 GB | 14 |
| Asus ROG Zephyrus M16 GU604VY-NM042X via Asus 3.3.3 | i9-13900H 140 W / 100 W | GeForce RTX 4090 Laptop GPU 150 W 16 GB | 64 GB | 15 |
| Asus ROG Strix Scar 18 G834JYR (2024) 3.3.3, Turbo | i9-14900HX 175 W / 175 W | GeForce RTX 4090 Laptop GPU 175 W 1455 / 2250 MHz 16 GB | 32 GB | 19 |
| GPU TDP ? | TDP 125 W | TDP 150 W | TDP 175 W |
|---|---|---|---|
| 101% | 100% | 100% | 101% |
specvp12 sw-03 +
| Model | CPU | GPU | RAM | Value |
|---|---|---|---|---|
| Aorus 17X AZF via Gigabyte Aorus Deutschland | i9-13900HX 157 W / 86 W | GeForce RTX 4090 Laptop GPU 175 W 2040 / 2250 MHz 16 GB | 32 GB | 110 |
| Model | CPU | GPU | RAM | Value |
|---|---|---|---|---|
| Aorus 17X AZF via Gigabyte Aorus Deutschland | i9-13900HX 157 W / 86 W | GeForce RTX 4090 Laptop GPU 175 W 2040 / 2250 MHz 16 GB | 32 GB | 19.2 |
| Model | CPU | GPU | RAM | Value |
|---|---|---|---|---|
| Aorus 17X AZF via Gigabyte Aorus Deutschland | i9-13900HX 157 W / 86 W | GeForce RTX 4090 Laptop GPU 175 W 2040 / 2250 MHz 16 GB | 32 GB | 278 |
| Model | CPU | GPU | RAM | Value |
|---|---|---|---|---|
| Aorus 17X AZF via Gigabyte Aorus Deutschland | i9-13900HX 157 W / 86 W | GeForce RTX 4090 Laptop GPU 175 W 2040 / 2250 MHz 16 GB | 32 GB | 157 |
| Model | CPU | GPU | RAM | Value |
|---|---|---|---|---|
| Aorus 17X AZF via Gigabyte Aorus Deutschland | i9-13900HX 157 W / 86 W | GeForce RTX 4090 Laptop GPU 175 W 2040 / 2250 MHz 16 GB | 32 GB | 277 |
| Model | CPU | GPU | RAM | Value |
|---|---|---|---|---|
| Aorus 17X AZF via Gigabyte Aorus Deutschland | i9-13900HX 157 W / 86 W | GeForce RTX 4090 Laptop GPU 175 W 2040 / 2250 MHz 16 GB | 32 GB | 42.3 |
| Model | CPU | GPU | RAM | Value |
|---|---|---|---|---|
| Aorus 17X AZF via Gigabyte Aorus Deutschland | i9-13900HX 157 W / 86 W | GeForce RTX 4090 Laptop GPU 175 W 2040 / 2250 MHz 16 GB | 32 GB | 103 |
| Model | CPU | GPU | RAM | Value |
|---|---|---|---|---|
| Aorus 17X AZF via Gigabyte Aorus Deutschland | i9-13900HX 157 W / 86 W | GeForce RTX 4090 Laptop GPU 175 W 2040 / 2250 MHz 16 GB | 32 GB | 196 |
| Model | CPU | GPU | RAM | Value |
|---|---|---|---|---|
| Aorus 17X AZF via Gigabyte Aorus Deutschland | i9-13900HX 157 W / 86 W | GeForce RTX 4090 Laptop GPU 175 W 2040 / 2250 MHz 16 GB | 32 GB | 410 |
| Model | CPU | GPU | RAM | Value |
|---|---|---|---|---|
| Asus Zephyrus Duo 16 GX650PY-NM006W via Asus Deutschland | R9 7945HX 130 W / 120 W | GeForce RTX 4090 Laptop GPU 175 W 2090 / 2275 MHz 16 GB | 32 GB | 140.08 |
| Aorus 17X AZF via Gigabyte Aorus Deutschland | i9-13900HX 157 W / 86 W | GeForce RTX 4090 Laptop GPU 175 W 2040 / 2250 MHz 16 GB | 32 GB | 156 |
| MSI Titan GT77 HX 13VI via Intel Deutschland | i9-13950HX 220 W / 150 W | GeForce RTX 4090 Laptop GPU 175 W 2340 / 2250 MHz 16 GB | 64 GB | 159.12 |
| Model | CPU | GPU | RAM | Value |
|---|---|---|---|---|
| Asus Zephyrus Duo 16 GX650PY-NM006W via Asus Deutschland | R9 7945HX 130 W / 120 W | GeForce RTX 4090 Laptop GPU 175 W 2090 / 2275 MHz 16 GB | 32 GB | 31.45 |
| Aorus 17X AZF via Gigabyte Aorus Deutschland | i9-13900HX 157 W / 86 W | GeForce RTX 4090 Laptop GPU 175 W 2040 / 2250 MHz 16 GB | 32 GB | 33.1 |
| MSI Titan GT77 HX 13VI via Intel Deutschland | i9-13950HX 220 W / 150 W | GeForce RTX 4090 Laptop GPU 175 W 2340 / 2250 MHz 16 GB | 64 GB | 34.38 |
| Model | CPU | GPU | RAM | Value |
|---|---|---|---|---|
| Asus Zephyrus Duo 16 GX650PY-NM006W via Asus Deutschland | R9 7945HX 130 W / 120 W | GeForce RTX 4090 Laptop GPU 175 W 2090 / 2275 MHz 16 GB | 32 GB | 230.78 |
| Aorus 17X AZF via Gigabyte Aorus Deutschland | i9-13900HX 157 W / 86 W | GeForce RTX 4090 Laptop GPU 175 W 2040 / 2250 MHz 16 GB | 32 GB | 257 |
| MSI Titan GT77 HX 13VI via Intel Deutschland | i9-13950HX 220 W / 150 W | GeForce RTX 4090 Laptop GPU 175 W 2340 / 2250 MHz 16 GB | 64 GB | 281.1 |
| Model | CPU | GPU | RAM | Value |
|---|---|---|---|---|
| Aorus 17X AZF via Gigabyte Aorus Deutschland | i9-13900HX 157 W / 86 W | GeForce RTX 4090 Laptop GPU 175 W 2040 / 2250 MHz 16 GB | 32 GB | 119 |
| Asus Zephyrus Duo 16 GX650PY-NM006W via Asus Deutschland | R9 7945HX 130 W / 120 W | GeForce RTX 4090 Laptop GPU 175 W 2090 / 2275 MHz 16 GB | 32 GB | 120.28 |
| MSI Titan GT77 HX 13VI via Intel Deutschland | i9-13950HX 220 W / 150 W | GeForce RTX 4090 Laptop GPU 175 W 2340 / 2250 MHz 16 GB | 64 GB | 122.82 |
| Model | CPU | GPU | RAM | Value |
|---|---|---|---|---|
| Asus Zephyrus Duo 16 GX650PY-NM006W via Asus Deutschland | R9 7945HX 130 W / 120 W | GeForce RTX 4090 Laptop GPU 175 W 2090 / 2275 MHz 16 GB | 32 GB | 494.02 |
| Aorus 17X AZF via Gigabyte Aorus Deutschland | i9-13900HX 157 W / 86 W | GeForce RTX 4090 Laptop GPU 175 W 2040 / 2250 MHz 16 GB | 32 GB | 576 |
| MSI Titan GT77 HX 13VI via Intel Deutschland | i9-13950HX 220 W / 150 W | GeForce RTX 4090 Laptop GPU 175 W 2340 / 2250 MHz 16 GB | 64 GB | 600.78 |
| Model | CPU | GPU | RAM | Value |
|---|---|---|---|---|
| Asus Zephyrus Duo 16 GX650PY-NM006W via Asus Deutschland | R9 7945HX 130 W / 120 W | GeForce RTX 4090 Laptop GPU 175 W 2090 / 2275 MHz 16 GB | 32 GB | 70.56 |
| Aorus 17X AZF via Gigabyte Aorus Deutschland | i9-13900HX 157 W / 86 W | GeForce RTX 4090 Laptop GPU 175 W 2040 / 2250 MHz 16 GB | 32 GB | 72.8 |
| MSI Titan GT77 HX 13VI via Intel Deutschland | i9-13950HX 220 W / 150 W | GeForce RTX 4090 Laptop GPU 175 W 2340 / 2250 MHz 16 GB | 64 GB | 74.73 |
| Model | CPU | GPU | RAM | Value |
|---|---|---|---|---|
| Asus Zephyrus Duo 16 GX650PY-NM006W via Asus Deutschland | R9 7945HX 130 W / 120 W | GeForce RTX 4090 Laptop GPU 175 W 2090 / 2275 MHz 16 GB | 32 GB | 377.82 |
| Aorus 17X AZF via Gigabyte Aorus Deutschland | i9-13900HX 157 W / 86 W | GeForce RTX 4090 Laptop GPU 175 W 2040 / 2250 MHz 16 GB | 32 GB | 430 |
| MSI Titan GT77 HX 13VI via Intel Deutschland | i9-13950HX 220 W / 150 W | GeForce RTX 4090 Laptop GPU 175 W 2340 / 2250 MHz 16 GB | 64 GB | 461.26 |
| Model | CPU | GPU | RAM | Value |
|---|---|---|---|---|
| Asus Zephyrus Duo 16 GX650PY-NM006W via Asus Deutschland | R9 7945HX 130 W / 120 W | GeForce RTX 4090 Laptop GPU 175 W 2090 / 2275 MHz 16 GB | 32 GB | 266.33 |
| Aorus 17X AZF via Gigabyte Aorus Deutschland | i9-13900HX 157 W / 86 W | GeForce RTX 4090 Laptop GPU 175 W 2040 / 2250 MHz 16 GB | 32 GB | 270 |
| MSI Titan GT77 HX 13VI via Intel Deutschland | i9-13950HX 220 W / 150 W | GeForce RTX 4090 Laptop GPU 175 W 2340 / 2250 MHz 16 GB | 64 GB | 281.44 |
| Model | CPU | GPU | RAM | Value |
|---|---|---|---|---|
| Aorus 17X AZF via Gigabyte Aorus Deutschland | i9-13900HX 157 W / 86 W | GeForce RTX 4090 Laptop GPU 175 W 2040 / 2250 MHz 16 GB | 32 GB | 305 |
| Asus Zephyrus Duo 16 GX650PY-NM006W via Asus Deutschland | R9 7945HX 130 W / 120 W | GeForce RTX 4090 Laptop GPU 175 W 2090 / 2275 MHz 16 GB | 32 GB | 338.22 |
| MSI Titan GT77 HX 13VI via Intel Deutschland | i9-13950HX 220 W / 150 W | GeForce RTX 4090 Laptop GPU 175 W 2340 / 2250 MHz 16 GB | 64 GB | 372.51 |
| Model | CPU | GPU | RAM | Value |
|---|---|---|---|---|
| Schenker Key 17 Pro (M24) via Bestware | i9-14900HX | GeForce RTX 4090 Laptop GPU 175 W 15.6 GB | 32 GB | 473.12 |
| Model | CPU | GPU | RAM | Value |
|---|---|---|---|---|
| Asus Zephyrus Duo 16 GX650PY-NM006W via Asus Deutschland | R9 7945HX 130 W / 120 W | GeForce RTX 4090 Laptop GPU 175 W 2090 / 2275 MHz 16 GB | 32 GB | 426.16 |
| Medion Erazer Beast X40 2024 via Medion DE | i9-14900HX 160 W / 160 W | GeForce RTX 4090 Laptop GPU 175 W 2040 / 2250 MHz 16 GB | 32 GB | 441.1 |
| Asus ROG Strix Scar 18 G834JYR (2024) via Asus Deutschland | i9-14900HX 120 W / 110 W | GeForce RTX 4090 Laptop GPU 175 W 1455 / 2250 MHz 16 GB | 32 GB | 482.1 |
| MSI Titan GT77 HX 13VI via Intel Deutschland | i9-13950HX 220 W / 150 W | GeForce RTX 4090 Laptop GPU 175 W 2340 / 2250 MHz 16 GB | 64 GB | 499.25 |
| Medion Erazer Beast X40 2024 Gaming Mode | i9-14900HX 160 W / 160 W | GeForce RTX 4090 Laptop GPU 175 W 2040 / 2250 MHz 16 GB | 32 GB | 515 |
| Model | CPU | GPU | RAM | Value |
|---|---|---|---|---|
| Asus Zephyrus Duo 16 GX650PY-NM006W via Asus Deutschland | R9 7945HX 130 W / 120 W | GeForce RTX 4090 Laptop GPU 175 W 2090 / 2275 MHz 16 GB | 32 GB | 31.26 |
| Medion Erazer Beast X40 via Medion | i9-13900HX 160 W / 160 W | GeForce RTX 4090 Laptop GPU 175 W 2040 / 2375 MHz 16 GB | 32 GB | 33.6 |
| Schenker Key 17 Pro (Early 23) via Schenker Technologies | i9-13900HX 162 W / 135 W | GeForce RTX 4090 Laptop GPU 175 W 2040 / 2250 MHz 16 GB | 32 GB | 33.6 |
| MSI Titan GT77 HX 13VI via Intel Deutschland | i9-13950HX 220 W / 150 W | GeForce RTX 4090 Laptop GPU 175 W 2340 / 2250 MHz 16 GB | 64 GB | 34.28 |
| Schenker Key 17 Pro (M24) via Bestware | i9-14900HX | GeForce RTX 4090 Laptop GPU 175 W 15.6 GB | 32 GB | 35.65 |
| Medion Erazer Beast X40 2024 via Medion DE | i9-14900HX 160 W / 160 W | GeForce RTX 4090 Laptop GPU 175 W 2040 / 2250 MHz 16 GB | 32 GB | 35.9 |
| Asus ROG Strix Scar 18 G834JYR (2024) via Asus Deutschland | i9-14900HX 120 W / 110 W | GeForce RTX 4090 Laptop GPU 175 W 1455 / 2250 MHz 16 GB | 32 GB | 36.2 |
| Medion Erazer Beast X40 2024 Gaming Mode | i9-14900HX 160 W / 160 W | GeForce RTX 4090 Laptop GPU 175 W 2040 / 2250 MHz 16 GB | 32 GB | 37.6 |
| Model | CPU | GPU | RAM | Value |
|---|---|---|---|---|
| Medion Erazer Beast X40 2024 via Medion DE | i9-14900HX 160 W / 160 W | GeForce RTX 4090 Laptop GPU 175 W 2040 / 2250 MHz 16 GB | 32 GB | 50 |
| Asus ROG Strix Scar 18 G834JYR (2024) via Asus Deutschland | i9-14900HX 120 W / 110 W | GeForce RTX 4090 Laptop GPU 175 W 1455 / 2250 MHz 16 GB | 32 GB | 51.58 |
| Medion Erazer Beast X40 2024 Gaming Mode | i9-14900HX 160 W / 160 W | GeForce RTX 4090 Laptop GPU 175 W 2040 / 2250 MHz 16 GB | 32 GB | 54.3 |
| Asus Zephyrus Duo 16 GX650PY-NM006W via Asus Deutschland | R9 7945HX 130 W / 120 W | GeForce RTX 4090 Laptop GPU 175 W 2090 / 2275 MHz 16 GB | 32 GB | 55.09 |
| Schenker Key 17 Pro (M24) via Bestware | i9-14900HX | GeForce RTX 4090 Laptop GPU 175 W 15.6 GB | 32 GB | 55.66 |
| MSI Titan GT77 HX 13VI via Intel Deutschland | i9-13950HX 220 W / 150 W | GeForce RTX 4090 Laptop GPU 175 W 2340 / 2250 MHz 16 GB | 64 GB | 56.7 |
| Medion Erazer Beast X40 via Medion | i9-13900HX 160 W / 160 W | GeForce RTX 4090 Laptop GPU 175 W 2040 / 2375 MHz 16 GB | 32 GB | 59.5 |
| Schenker Key 17 Pro (Early 23) via Schenker Technologies | i9-13900HX 162 W / 135 W | GeForce RTX 4090 Laptop GPU 175 W 2040 / 2250 MHz 16 GB | 32 GB | 59.9 |
| Model | CPU | GPU | RAM | Value |
|---|---|---|---|---|
| Medion Erazer Beast X40 via Medion | i9-13900HX 160 W / 160 W | GeForce RTX 4090 Laptop GPU 175 W 2040 / 2375 MHz 16 GB | 32 GB | 528.8 |
| Schenker Key 17 Pro (Early 23) via Schenker Technologies | i9-13900HX 162 W / 135 W | GeForce RTX 4090 Laptop GPU 175 W 2040 / 2250 MHz 16 GB | 32 GB | 530.5 |
| Medion Erazer Beast X40 2024 via Medion DE | i9-14900HX 160 W / 160 W | GeForce RTX 4090 Laptop GPU 175 W 2040 / 2250 MHz 16 GB | 32 GB | 584.3 |
| MSI Titan GT77 HX 13VI via Intel Deutschland | i9-13950HX 220 W / 150 W | GeForce RTX 4090 Laptop GPU 175 W 2340 / 2250 MHz 16 GB | 64 GB | 610.71 |
| Asus ROG Strix Scar 18 G834JYR (2024) via Asus Deutschland | i9-14900HX 120 W / 110 W | GeForce RTX 4090 Laptop GPU 175 W 1455 / 2250 MHz 16 GB | 32 GB | 631.3 |
| Schenker Key 17 Pro (M24) via Bestware | i9-14900HX | GeForce RTX 4090 Laptop GPU 175 W 15.6 GB | 32 GB | 660.1 |
| Medion Erazer Beast X40 2024 Gaming Mode | i9-14900HX 160 W / 160 W | GeForce RTX 4090 Laptop GPU 175 W 2040 / 2250 MHz 16 GB | 32 GB | 686.6 |
| Model | CPU | GPU | RAM | Value |
|---|---|---|---|---|
| Asus ROG Strix Scar 18 G834JYR (2024) via Asus Deutschland | i9-14900HX 120 W / 110 W | GeForce RTX 4090 Laptop GPU 175 W 1455 / 2250 MHz 16 GB | 32 GB | 70.6 |
| Asus Zephyrus Duo 16 GX650PY-NM006W via Asus Deutschland | R9 7945HX 130 W / 120 W | GeForce RTX 4090 Laptop GPU 175 W 2090 / 2275 MHz 16 GB | 32 GB | 70.65 |
| Schenker Key 17 Pro (M24) via Bestware | i9-14900HX | GeForce RTX 4090 Laptop GPU 175 W 15.6 GB | 32 GB | 70.75 |
| Medion Erazer Beast X40 2024 via Medion DE | i9-14900HX 160 W / 160 W | GeForce RTX 4090 Laptop GPU 175 W 2040 / 2250 MHz 16 GB | 32 GB | 71.1 |
| MSI Titan GT77 HX 13VI via Intel Deutschland | i9-13950HX 220 W / 150 W | GeForce RTX 4090 Laptop GPU 175 W 2340 / 2250 MHz 16 GB | 64 GB | 74.95 |
| Medion Erazer Beast X40 via Medion | i9-13900HX 160 W / 160 W | GeForce RTX 4090 Laptop GPU 175 W 2040 / 2375 MHz 16 GB | 32 GB | 76.1 |
| Schenker Key 17 Pro (Early 23) via Schenker Technologies | i9-13900HX 162 W / 135 W | GeForce RTX 4090 Laptop GPU 175 W 2040 / 2250 MHz 16 GB | 32 GB | 76.5 |
| Medion Erazer Beast X40 2024 Gaming Mode | i9-14900HX 160 W / 160 W | GeForce RTX 4090 Laptop GPU 175 W 2040 / 2250 MHz 16 GB | 32 GB | 76.5 |
| Model | CPU | GPU | RAM | Value |
|---|---|---|---|---|
| Asus Zephyrus Duo 16 GX650PY-NM006W via Asus Deutschland | R9 7945HX 130 W / 120 W | GeForce RTX 4090 Laptop GPU 175 W 2090 / 2275 MHz 16 GB | 32 GB | 113.27 |
| Asus ROG Strix Scar 18 G834JYR (2024) via Asus Deutschland | i9-14900HX 120 W / 110 W | GeForce RTX 4090 Laptop GPU 175 W 1455 / 2250 MHz 16 GB | 32 GB | 123.9 |
| Schenker Key 17 Pro (M24) via Bestware | i9-14900HX | GeForce RTX 4090 Laptop GPU 175 W 15.6 GB | 32 GB | 128.81 |
| Schenker Key 17 Pro (Early 23) via Schenker Technologies | i9-13900HX 162 W / 135 W | GeForce RTX 4090 Laptop GPU 175 W 2040 / 2250 MHz 16 GB | 32 GB | 130.6 |
| Medion Erazer Beast X40 via Medion | i9-13900HX 160 W / 160 W | GeForce RTX 4090 Laptop GPU 175 W 2040 / 2375 MHz 16 GB | 32 GB | 131.4 |
| Medion Erazer Beast X40 2024 via Medion DE | i9-14900HX 160 W / 160 W | GeForce RTX 4090 Laptop GPU 175 W 2040 / 2250 MHz 16 GB | 32 GB | 138.9 |
| MSI Titan GT77 HX 13VI via Intel Deutschland | i9-13950HX 220 W / 150 W | GeForce RTX 4090 Laptop GPU 175 W 2340 / 2250 MHz 16 GB | 64 GB | 138.99 |
| Medion Erazer Beast X40 2024 Gaming Mode | i9-14900HX 160 W / 160 W | GeForce RTX 4090 Laptop GPU 175 W 2040 / 2250 MHz 16 GB | 32 GB | 141.9 |
| Model | CPU | GPU | RAM | Value |
|---|---|---|---|---|
| Asus Zephyrus Duo 16 GX650PY-NM006W via Asus Deutschland | R9 7945HX 130 W / 120 W | GeForce RTX 4090 Laptop GPU 175 W 2090 / 2275 MHz 16 GB | 32 GB | 17.84 |
| Schenker Key 17 Pro (M24) via Bestware | i9-14900HX | GeForce RTX 4090 Laptop GPU 175 W 15.6 GB | 32 GB | 110.42 |
| Medion Erazer Beast X40 2024 via Medion DE | i9-14900HX 160 W / 160 W | GeForce RTX 4090 Laptop GPU 175 W 2040 / 2250 MHz 16 GB | 32 GB | 111.4 |
| Asus ROG Strix Scar 18 G834JYR (2024) via Asus Deutschland | i9-14900HX 120 W / 110 W | GeForce RTX 4090 Laptop GPU 175 W 1455 / 2250 MHz 16 GB | 32 GB | 111.7 |
| Medion Erazer Beast X40 via Medion | i9-13900HX 160 W / 160 W | GeForce RTX 4090 Laptop GPU 175 W 2040 / 2375 MHz 16 GB | 32 GB | 112.8 |
| Schenker Key 17 Pro (Early 23) via Schenker Technologies | i9-13900HX 162 W / 135 W | GeForce RTX 4090 Laptop GPU 175 W 2040 / 2250 MHz 16 GB | 32 GB | 113.5 |
| MSI Titan GT77 HX 13VI via Intel Deutschland | i9-13950HX 220 W / 150 W | GeForce RTX 4090 Laptop GPU 175 W 2340 / 2250 MHz 16 GB | 64 GB | 116.64 |
| Medion Erazer Beast X40 2024 Gaming Mode | i9-14900HX 160 W / 160 W | GeForce RTX 4090 Laptop GPU 175 W 2040 / 2250 MHz 16 GB | 32 GB | 117.2 |
| Model | CPU | GPU | RAM | Value |
|---|---|---|---|---|
| Schenker Key 17 Pro (Early 23) via Schenker Technologies | i9-13900HX 162 W / 135 W | GeForce RTX 4090 Laptop GPU 175 W 2040 / 2250 MHz 16 GB | 32 GB | 128 |
| Medion Erazer Beast X40 2024 via Medion DE | i9-14900HX 160 W / 160 W | GeForce RTX 4090 Laptop GPU 175 W 2040 / 2250 MHz 16 GB | 32 GB | 203.2 |
| Asus ROG Strix Scar 18 G834JYR (2024) via Asus Deutschland | i9-14900HX 120 W / 110 W | GeForce RTX 4090 Laptop GPU 175 W 1455 / 2250 MHz 16 GB | 32 GB | 203.8 |
| Asus Zephyrus Duo 16 GX650PY-NM006W via Asus Deutschland | R9 7945HX 130 W / 120 W | GeForce RTX 4090 Laptop GPU 175 W 2090 / 2275 MHz 16 GB | 32 GB | 206.67 |
| Medion Erazer Beast X40 via Medion | i9-13900HX 160 W / 160 W | GeForce RTX 4090 Laptop GPU 175 W 2040 / 2375 MHz 16 GB | 32 GB | 206.8 |
| Schenker Key 17 Pro (M24) via Bestware | i9-14900HX | GeForce RTX 4090 Laptop GPU 175 W 15.6 GB | 32 GB | 207.52 |
| MSI Titan GT77 HX 13VI via Intel Deutschland | i9-13950HX 220 W / 150 W | GeForce RTX 4090 Laptop GPU 175 W 2340 / 2250 MHz 16 GB | 64 GB | 212.6 |
| Medion Erazer Beast X40 2024 Gaming Mode | i9-14900HX 160 W / 160 W | GeForce RTX 4090 Laptop GPU 175 W 2040 / 2250 MHz 16 GB | 32 GB | 220.5 |
| Model | CPU | GPU | RAM | Value |
|---|---|---|---|---|
| MSI Titan GT77 HX 13VI via Intel Deutschland | i9-13950HX 220 W / 150 W | GeForce RTX 4090 Laptop GPU 175 W 2340 / 2250 MHz 16 GB | 64 GB | 207.55 |
| Model | CPU | GPU | RAM | Value |
|---|---|---|---|---|
| Schenker Key 17 Pro (Early 23) via Schenker Technologies | i9-13900HX 162 W / 135 W | GeForce RTX 4090 Laptop GPU 175 W 2040 / 2250 MHz 16 GB | 32 GB | 27.3 |
| MSI Titan GT77 HX 13VI via Intel Deutschland | i9-13950HX 220 W / 150 W | GeForce RTX 4090 Laptop GPU 175 W 2340 / 2250 MHz 16 GB | 64 GB | 28.23 |
| Aorus 17X AZF via Gigabyte Aorus Deutschland | i9-13900HX 157 W / 86 W | GeForce RTX 4090 Laptop GPU 175 W 2040 / 2250 MHz 16 GB | 32 GB | 32.8 |
| Model | CPU | GPU | RAM | Value |
|---|---|---|---|---|
| MSI Titan GT77 HX 13VI via Intel Deutschland | i9-13950HX 220 W / 150 W | GeForce RTX 4090 Laptop GPU 175 W 2340 / 2250 MHz 16 GB | 64 GB | 24.42 |
| Schenker Key 17 Pro (Early 23) via Schenker Technologies | i9-13900HX 162 W / 135 W | GeForce RTX 4090 Laptop GPU 175 W 2040 / 2250 MHz 16 GB | 32 GB | 27.33 |
| Aorus 17X AZF via Gigabyte Aorus Deutschland | i9-13900HX 157 W / 86 W | GeForce RTX 4090 Laptop GPU 175 W 2040 / 2250 MHz 16 GB | 32 GB | 56 |
| Model | CPU | GPU | RAM | Value |
|---|---|---|---|---|
| Schenker Key 17 Pro (Early 23) via Schenker Technologies | i9-13900HX 162 W / 135 W | GeForce RTX 4090 Laptop GPU 175 W 2040 / 2250 MHz 16 GB | 32 GB | 269.8 |
| MSI Titan GT77 HX 13VI via Intel Deutschland | i9-13950HX 220 W / 150 W | GeForce RTX 4090 Laptop GPU 175 W 2340 / 2250 MHz 16 GB | 64 GB | 371.75 |
| Aorus 17X AZF via Gigabyte Aorus Deutschland | i9-13900HX 157 W / 86 W | GeForce RTX 4090 Laptop GPU 175 W 2040 / 2250 MHz 16 GB | 32 GB | 474 |
| Model | CPU | GPU | RAM | Value |
|---|---|---|---|---|
| Aorus 17X AZF via Gigabyte Aorus Deutschland | i9-13900HX 157 W / 86 W | GeForce RTX 4090 Laptop GPU 175 W 2040 / 2250 MHz 16 GB | 32 GB | 75 |
| MSI Titan GT77 HX 13VI via Intel Deutschland | i9-13950HX 220 W / 150 W | GeForce RTX 4090 Laptop GPU 175 W 2340 / 2250 MHz 16 GB | 64 GB | 112.25 |
| Schenker Key 17 Pro (Early 23) via Schenker Technologies | i9-13900HX 162 W / 135 W | GeForce RTX 4090 Laptop GPU 175 W 2040 / 2250 MHz 16 GB | 32 GB | 118.3 |
| Model | CPU | GPU | RAM | Value |
|---|---|---|---|---|
| Schenker Key 17 Pro (Early 23) via Schenker Technologies | i9-13900HX 162 W / 135 W | GeForce RTX 4090 Laptop GPU 175 W 2040 / 2250 MHz 16 GB | 32 GB | 110.8 |
| MSI Titan GT77 HX 13VI via Intel Deutschland | i9-13950HX 220 W / 150 W | GeForce RTX 4090 Laptop GPU 175 W 2340 / 2250 MHz 16 GB | 64 GB | 117.51 |
| Aorus 17X AZF via Gigabyte Aorus Deutschland | i9-13900HX 157 W / 86 W | GeForce RTX 4090 Laptop GPU 175 W 2040 / 2250 MHz 16 GB | 32 GB | 132 |
| Model | CPU | GPU | RAM | Value |
|---|---|---|---|---|
| Schenker Key 17 Pro (Early 23) via Schenker Technologies | i9-13900HX 162 W / 135 W | GeForce RTX 4090 Laptop GPU 175 W 2040 / 2250 MHz 16 GB | 32 GB | 63.7 |
| MSI Titan GT77 HX 13VI via Intel Deutschland | i9-13950HX 220 W / 150 W | GeForce RTX 4090 Laptop GPU 175 W 2340 / 2250 MHz 16 GB | 64 GB | 65.16 |
| Aorus 17X AZF via Gigabyte Aorus Deutschland | i9-13900HX 157 W / 86 W | GeForce RTX 4090 Laptop GPU 175 W 2040 / 2250 MHz 16 GB | 32 GB | 109 |
| Model | CPU | GPU | RAM | Value |
|---|---|---|---|---|
| Schenker Key 17 Pro (Early 23) via Schenker Technologies | i9-13900HX 162 W / 135 W | GeForce RTX 4090 Laptop GPU 175 W 2040 / 2250 MHz 16 GB | 32 GB | 76.6 |
| MSI Titan GT77 HX 13VI via Intel Deutschland | i9-13950HX 220 W / 150 W | GeForce RTX 4090 Laptop GPU 175 W 2340 / 2250 MHz 16 GB | 64 GB | 147.71 |
| Aorus 17X AZF via Gigabyte Aorus Deutschland | i9-13900HX 157 W / 86 W | GeForce RTX 4090 Laptop GPU 175 W 2040 / 2250 MHz 16 GB | 32 GB | 199 |
| Model | CPU | GPU | RAM | Value |
|---|---|---|---|---|
| Asus ROG Strix Scar 17 G733PYV-LL053X via AMD | R9 7945HX3D 115 W / 100 W | GeForce RTX 4090 Laptop GPU 175 W 2040 / 2250 MHz 16 GB | 32 GB | 6822 |
| Aorus 17X AZF via Gigabyte Aorus Deutschland | i9-13900HX 157 W / 86 W | GeForce RTX 4090 Laptop GPU 175 W 2040 / 2250 MHz 16 GB | 32 GB | 15678 |
| MSI Titan GT77 HX 13VI via Intel Deutschland | i9-13950HX 220 W / 150 W | GeForce RTX 4090 Laptop GPU 175 W 2340 / 2250 MHz 16 GB | 64 GB | 16004 |
| Asus Zephyrus Duo 16 GX650PY-NM006W via Asus Deutschland | R9 7945HX 130 W / 120 W | GeForce RTX 4090 Laptop GPU 175 W 2090 / 2275 MHz 16 GB | 32 GB | 21698 |
| Asus ROG Strix Scar 18 2023 G834JY-N6005W | i9-13980HX 175 W / 170 W | GeForce RTX 4090 Laptop GPU 175 W 2090 / 2250 MHz 16 GB | 32 GB | 24410 |
| Model | CPU | GPU | RAM | Value |
|---|---|---|---|---|
| Asus Zephyrus Duo 16 GX650PY-NM006W via Asus Deutschland | R9 7945HX 130 W / 120 W | GeForce RTX 4090 Laptop GPU 175 W 2090 / 2275 MHz 16 GB | 32 GB | 182.2 |
| MSI Titan GT77 HX 13VI via Intel Deutschland | i9-13950HX 220 W / 150 W | GeForce RTX 4090 Laptop GPU 175 W 2340 / 2250 MHz 16 GB | 64 GB | 199.4 |
| Asus ROG Strix Scar 17 G733PYV-LL053X via AMD | R9 7945HX3D 115 W / 100 W | GeForce RTX 4090 Laptop GPU 175 W 2040 / 2250 MHz 16 GB | 32 GB | 203.2 |
| Asus ROG Strix Scar 18 2023 G834JY-N6005W | i9-13980HX 175 W / 170 W | GeForce RTX 4090 Laptop GPU 175 W 2090 / 2250 MHz 16 GB | 32 GB | 204.24 |
| Aorus 17X AZF via Gigabyte Aorus Deutschland | i9-13900HX 157 W / 86 W | GeForce RTX 4090 Laptop GPU 175 W 2040 / 2250 MHz 16 GB | 32 GB | 208.27 |
Cinebench R15 OpenGL 64 Bit +
| Model | CPU | GPU | RAM | Value |
|---|---|---|---|---|
| Asus ROG Zephyrus G14 GA402XY via Asus Deutschland | R9 7940HS 80 W / 80 W | GeForce RTX 4090 Laptop GPU 125 W 1455 / 2250 MHz 16 GB | 32 GB | 174.3 |
| Asus ROG Zephyrus G16 GU605MY via Asus Deutschland | Ultra 9 185H | GeForce RTX 4090 Laptop GPU 1455 / 2250 MHz 16 GB | 32 GB | 192.9 |
| Asus ROG Zephyrus M16 GU604VY-NM042X via Asus | i9-13900H 140 W / 100 W | GeForce RTX 4090 Laptop GPU 150 W 16 GB | 64 GB | 221 |
| Asus ROG Strix Scar 18 2023 G834JY-N6005W | i9-13980HX 0 W / 65 W | GeForce RTX 4090 Laptop GPU 175 W 2090 MHz 16 GB | 32 GB | 233 |
| Lenovo Legion 9 16IRX9, RTX 4090 via Lenovo | i9-14900HX | GeForce RTX 4090 Laptop GPU 175 W 16 GB | 64 GB | 241 |
| Schenker XMG Neo 16 Raptor Lake via Schenker Technologies | i9-13900HX | GeForce RTX 4090 Laptop GPU | 259 | |
| Medion Erazer Beast X40 via Medion | i9-13900HX 160 W / 160 W | GeForce RTX 4090 Laptop GPU 175 W 2040 / 2375 MHz 16 GB | 32 GB | 261 |
| Razer Blade 16 2024, RTX 4090 via Razer | i9-14900HX 140 W / 60 W | GeForce RTX 4090 Laptop GPU 175 W 16 GB | 32 GB | 262 |
| Eurocom Raptor X17 via Eurocom | i9-13900HX 155 W / 110 W | GeForce RTX 4090 Laptop GPU 175 W 2040 / 2250 MHz 16 GB | 64 GB | 263 |
| Schenker XMG Neo 16 Raptor Lake via Schenker Technologies | i9-13900HX | GeForce RTX 4090 Laptop GPU | 264 | |
| Medion Erazer Beast X40 dGPU, Cooling | i9-13900HX 160 W / 160 W | GeForce RTX 4090 Laptop GPU 175 W 2040 / 2250 MHz 16 GB | 32 GB | 267 |
| MSI Titan 18 HX A14VIG via MSI | i9-14900HX 238 W / 176 W | GeForce RTX 4090 Laptop GPU 175 W 1555 / 2250 MHz 16 GB | 128 GB | 267 |
| Acer Predator Helios 18 PH18-72-98MW via Acer Deutschland | i9-14900HX 157 W / 95 W | GeForce RTX 4090 Laptop GPU 175 W 1590 / 2250 MHz 16 GB | 32 GB | 269 |
| Schenker Key 17 Pro (Early 23) via Schenker Technologies | i9-13900HX 162 W / 135 W | GeForce RTX 4090 Laptop GPU 175 W 2040 / 2250 MHz 16 GB | 32 GB | 271 |
| Razer Blade 18 2024 RZ09-0509 via Razer | i9-14900HX 138 W / 117 W | GeForce RTX 4090 Laptop GPU 175 W 1455 / 2250 MHz 16 GB | 32 GB | 271 |
| Medion Erazer Beast X40 dGPU, Cooling | i9-13900HX 160 W / 160 W | GeForce RTX 4090 Laptop GPU 175 W 2040 / 2250 MHz 16 GB | 32 GB | 275 |
| Alienware m18 R2 via Dell | i9-14900HX 180 W / 144 W | GeForce RTX 4090 Laptop GPU 175 W 1950 / 2250 MHz 16 GB | 32 GB | 275 |
| Asus ROG Strix Scar 18 G834JYR (2024) via Asus Deutschland | i9-14900HX 120 W / 110 W | GeForce RTX 4090 Laptop GPU 175 W 1455 / 2250 MHz 16 GB | 32 GB | 277 |
| Medion Erazer Beast X40 2024 Gaming Mode | i9-14900HX 160 W / 160 W | GeForce RTX 4090 Laptop GPU 175 W 2040 / 2250 MHz 16 GB | 32 GB | 278 |
| Alienware m18 R1 via Dell | i9-13980HX 198 W / 143 W | GeForce RTX 4090 Laptop GPU 175 W 1975 / 2263 MHz 16 GB | 32 GB | 279 |
| Schenker Key 17 Pro (M24) via Bestware | i9-14900HX | GeForce RTX 4090 Laptop GPU 175 W 15.6 GB | 32 GB | 279 |
| Asus ROG Strix Scar 18 G834JYR (2024) Turbo | i9-14900HX 175 W / 175 W | GeForce RTX 4090 Laptop GPU 175 W 1455 / 2250 MHz 16 GB | 32 GB | 280 |
| Asus Zephyrus Duo 16 GX650PY-NM006W via Asus Deutschland | R9 7945HX 130 W / 120 W | GeForce RTX 4090 Laptop GPU 175 W 2090 / 2275 MHz 16 GB | 32 GB | 281 |
| Asus Zephyrus Duo 16 GX650PY-NM006W via Asus Deutschland | R9 7945HX 130 W / 120 W | GeForce RTX 4090 Laptop GPU 175 W 2090 / 2275 MHz 16 GB | 32 GB | 281 |
| Lenovo Legion Pro 7 RTX4090 via Lenovo Deutschland | i9-13900HX 185 W / 130 W | GeForce RTX 4090 Laptop GPU 175 W 1455 / 2250 MHz 16 GB | 32 GB | 281 |
| MSI Raider GE78 HX 13VI | i9-13980HX | GeForce RTX 4090 Laptop GPU 175 W 16 GB | 64 GB | 281 |
| Schenker XMG Neo 16 (Early 24) via Schenker Technologies | i9-14900HX 205 W / 205 W | GeForce RTX 4090 Laptop GPU 175 W 2040 / 2250 MHz 16 GB | 32 GB | 281 |
| MSI Titan GT77 HX 13VI via Intel Deutschland | i9-13950HX 220 W / 150 W | GeForce RTX 4090 Laptop GPU 175 W 2340 / 2250 MHz 16 GB | 64 GB | 283 |
| Asus Zephyrus Duo 16 GX650PY-NM006W via Asus Deutschland | R9 7945HX 130 W / 120 W | GeForce RTX 4090 Laptop GPU 175 W 2090 / 2275 MHz 16 GB | 32 GB | 283 |
| Asus Zephyrus Duo 16 GX650PY-NM006W via Asus Deutschland | R9 7945HX 130 W / 120 W | GeForce RTX 4090 Laptop GPU 175 W 2090 / 2275 MHz 16 GB | 32 GB | 283 |
| Lenovo Legion 9 16IRX8 via Lenovo | i9-13980HX 145 W / 125 W | GeForce RTX 4090 Laptop GPU 175 W 1605 / 2300 MHz 16 GB | 32 GB | 283 |
| Schenker XMG Neo 16 (Early 24) | i9-14900HX 205 W / 205 W | GeForce RTX 4090 Laptop GPU 175 W 2040 / 2250 MHz 16 GB | 32 GB | 287 |
| Razer Blade 16 Early 2023 RTX 4090 via Razer | i9-13950HX 130 W / 110 W | GeForce RTX 4090 Laptop GPU 175 W 16 GB | 32 GB | 290 |
| Schenker XMG Neo 16 E23 | i9-13900HX 160 W / 160 W | GeForce RTX 4090 Laptop GPU 175 W 2040 / 2250 MHz 16 GB | 32 GB | 290 |
| MSI Titan GT77 HX 13VI | i9-13980HX | GeForce RTX 4090 Laptop GPU | 64 GB | 292 |
| Aorus 17X AZF via Gigabyte Aorus Deutschland | i9-13900HX 157 W / 86 W | GeForce RTX 4090 Laptop GPU 175 W 2040 / 2250 MHz 16 GB | 32 GB | 295.32 |
| Eluktronics Mech-17 GP2 via Eluktronics | i9-13900HX 160 W / 99 W | GeForce RTX 4090 Laptop GPU 175 W 2140 / 2375 MHz 16 GB | 32 GB | 300 |
| Eurocom Raptor X17 Core i9-14900HX via Eurocom | i9-14900HX 93 W / 63 W | GeForce RTX 4090 Laptop GPU 175 W 2040 / 2250 MHz 16 GB | 32 GB | 301 |
| Asus ROG Strix Scar 17 G733PY-XS96 via Asus | R9 7945HX 128 W / 128 W | GeForce RTX 4090 Laptop GPU 175 W 2090 / 2275 MHz 16 GB | 32 GB | 309 |
| Medion Erazer Beast X40 2024 via Medion DE | i9-14900HX 160 W / 160 W | GeForce RTX 4090 Laptop GPU 175 W 2040 / 2250 MHz 16 GB | 32 GB | 313 |
| Asus ROG Strix Scar 18 2023 G834JY-N6005W | i9-13980HX 175 W / 170 W | GeForce RTX 4090 Laptop GPU 175 W 2090 / 2250 MHz 16 GB | 32 GB | 322 |
| Asus ROG Strix Scar 17 G733PYV-LL053X via AMD | R9 7945HX3D 115 W / 100 W | GeForce RTX 4090 Laptop GPU 175 W 2040 / 2250 MHz 16 GB | 32 GB | 351 |
| GPU TDP ? | TDP 125 W | TDP 150 W | TDP 175 W |
|---|---|---|---|
| 89% | 62% | 78% | 100% |
| Model | CPU | GPU | RAM | Value |
|---|---|---|---|---|
| MSI Titan GT77 HX 13VI via Intel Deutschland | i9-13950HX 220 W / 150 W | GeForce RTX 4090 Laptop GPU 175 W 2340 / 2250 MHz 16 GB | 64 GB | 99.6 |
| Schenker XMG Neo 16 Raptor Lake via Schenker Technologies | i9-13900HX | GeForce RTX 4090 Laptop GPU | 99.6 | |
| Schenker XMG Neo 16 Raptor Lake via Schenker Technologies | i9-13900HX | GeForce RTX 4090 Laptop GPU | 99.6 | |
| Asus ROG Strix Scar 18 2023 G834JY-N6005W | i9-13980HX 0 W / 65 W | GeForce RTX 4090 Laptop GPU 175 W 2090 MHz 16 GB | 32 GB | 99.6 |
| Asus ROG Strix Scar 18 2023 G834JY-N6005W | i9-13980HX 175 W / 170 W | GeForce RTX 4090 Laptop GPU 175 W 2090 / 2250 MHz 16 GB | 32 GB | 99.6 |
| Asus ROG Zephyrus M16 GU604VY-NM042X via Asus | i9-13900H 140 W / 100 W | GeForce RTX 4090 Laptop GPU 150 W 16 GB | 64 GB | 99.6 |
| Razer Blade 16 Early 2023 RTX 4090 via Razer | i9-13950HX 130 W / 110 W | GeForce RTX 4090 Laptop GPU 175 W 16 GB | 32 GB | 99.6 |
| Medion Erazer Beast X40 via Medion | i9-13900HX 160 W / 160 W | GeForce RTX 4090 Laptop GPU 175 W 2040 / 2375 MHz 16 GB | 32 GB | 99.6 |
| Asus Zephyrus Duo 16 GX650PY-NM006W via Asus Deutschland | R9 7945HX 130 W / 120 W | GeForce RTX 4090 Laptop GPU 175 W 2090 / 2275 MHz 16 GB | 32 GB | 99.6 |
| Asus Zephyrus Duo 16 GX650PY-NM006W via Asus Deutschland | R9 7945HX 130 W / 120 W | GeForce RTX 4090 Laptop GPU 175 W 2090 / 2275 MHz 16 GB | 32 GB | 99.6 |
| Asus Zephyrus Duo 16 GX650PY-NM006W via Asus Deutschland | R9 7945HX 130 W / 120 W | GeForce RTX 4090 Laptop GPU 175 W 2090 / 2275 MHz 16 GB | 32 GB | 99.6 |
| Asus Zephyrus Duo 16 GX650PY-NM006W via Asus Deutschland | R9 7945HX 130 W / 120 W | GeForce RTX 4090 Laptop GPU 175 W 2090 / 2275 MHz 16 GB | 32 GB | 99.6 |
| Asus Zephyrus Duo 16 GX650PY-NM006W via Asus Deutschland | R9 7945HX 130 W / 120 W | GeForce RTX 4090 Laptop GPU 175 W 2090 / 2275 MHz 16 GB | 32 GB | 99.6 |
| Asus Zephyrus Duo 16 GX650PY-NM006W via Asus Deutschland | R9 7945HX 130 W / 120 W | GeForce RTX 4090 Laptop GPU 175 W 2090 / 2275 MHz 16 GB | 32 GB | 99.6 |
| MSI Titan GT77 HX 13VI | i9-13980HX | GeForce RTX 4090 Laptop GPU | 64 GB | 99.6 |
| Eluktronics Mech-17 GP2 via Eluktronics | i9-13900HX 160 W / 99 W | GeForce RTX 4090 Laptop GPU 175 W 2140 / 2375 MHz 16 GB | 32 GB | 99.6 |
| Medion Erazer Beast X40 dGPU, Cooling | i9-13900HX 160 W / 160 W | GeForce RTX 4090 Laptop GPU 175 W 2040 / 2250 MHz 16 GB | 32 GB | 99.6 |
| Medion Erazer Beast X40 dGPU, Cooling | i9-13900HX 160 W / 160 W | GeForce RTX 4090 Laptop GPU 175 W 2040 / 2250 MHz 16 GB | 32 GB | 99.6 |
| Schenker XMG Neo 16 E23 | i9-13900HX 160 W / 160 W | GeForce RTX 4090 Laptop GPU 175 W 2040 / 2250 MHz 16 GB | 32 GB | 99.6 |
| Aorus 17X AZF via Gigabyte Aorus Deutschland | i9-13900HX 157 W / 86 W | GeForce RTX 4090 Laptop GPU 175 W 2040 / 2250 MHz 16 GB | 32 GB | 99.6 |
| Alienware m18 R1 via Dell | i9-13980HX 198 W / 143 W | GeForce RTX 4090 Laptop GPU 175 W 1975 / 2263 MHz 16 GB | 32 GB | 99.6 |
| Asus ROG Strix Scar 17 G733PY-XS96 via Asus | R9 7945HX 128 W / 128 W | GeForce RTX 4090 Laptop GPU 175 W 2090 / 2275 MHz 16 GB | 32 GB | 99.6 |
| Asus ROG Zephyrus G14 GA402XY via Asus Deutschland | R9 7940HS 80 W / 80 W | GeForce RTX 4090 Laptop GPU 125 W 1455 / 2250 MHz 16 GB | 32 GB | 99.6 |
| Eurocom Raptor X17 via Eurocom | i9-13900HX 155 W / 110 W | GeForce RTX 4090 Laptop GPU 175 W 2040 / 2250 MHz 16 GB | 64 GB | 99.6 |
| Schenker Key 17 Pro (Early 23) via Schenker Technologies | i9-13900HX 162 W / 135 W | GeForce RTX 4090 Laptop GPU 175 W 2040 / 2250 MHz 16 GB | 32 GB | 99.6 |
| Lenovo Legion Pro 7 RTX4090 via Lenovo Deutschland | i9-13900HX 185 W / 130 W | GeForce RTX 4090 Laptop GPU 175 W 1455 / 2250 MHz 16 GB | 32 GB | 99.6 |
| Asus ROG Strix Scar 17 G733PYV-LL053X via AMD | R9 7945HX3D 115 W / 100 W | GeForce RTX 4090 Laptop GPU 175 W 2040 / 2250 MHz 16 GB | 32 GB | 99.6 |
| Lenovo Legion 9 16IRX8 via Lenovo | i9-13980HX 145 W / 125 W | GeForce RTX 4090 Laptop GPU 175 W 1605 / 2300 MHz 16 GB | 32 GB | 99.6 |
| MSI Raider GE78 HX 13VI | i9-13980HX | GeForce RTX 4090 Laptop GPU 175 W 16 GB | 64 GB | 99.6 |
| Asus ROG Strix Scar 18 G834JYR (2024) via Asus Deutschland | i9-14900HX 120 W / 110 W | GeForce RTX 4090 Laptop GPU 175 W 1455 / 2250 MHz 16 GB | 32 GB | 99.6 |
| MSI Titan 18 HX A14VIG via MSI | i9-14900HX 238 W / 176 W | GeForce RTX 4090 Laptop GPU 175 W 1555 / 2250 MHz 16 GB | 128 GB | 99.6 |
| Razer Blade 16 2024, RTX 4090 via Razer | i9-14900HX 140 W / 60 W | GeForce RTX 4090 Laptop GPU 175 W 16 GB | 32 GB | 99.6 |
| Asus ROG Strix Scar 18 G834JYR (2024) Turbo | i9-14900HX 175 W / 175 W | GeForce RTX 4090 Laptop GPU 175 W 1455 / 2250 MHz 16 GB | 32 GB | 99.6 |
| Medion Erazer Beast X40 2024 via Medion DE | i9-14900HX 160 W / 160 W | GeForce RTX 4090 Laptop GPU 175 W 2040 / 2250 MHz 16 GB | 32 GB | 99.6 |
| Medion Erazer Beast X40 2024 Gaming Mode | i9-14900HX 160 W / 160 W | GeForce RTX 4090 Laptop GPU 175 W 2040 / 2250 MHz 16 GB | 32 GB | 99.6 |
| Acer Predator Helios 18 PH18-72-98MW via Acer Deutschland | i9-14900HX 157 W / 95 W | GeForce RTX 4090 Laptop GPU 175 W 1590 / 2250 MHz 16 GB | 32 GB | 99.6 |
| Eurocom Raptor X17 Core i9-14900HX via Eurocom | i9-14900HX 93 W / 63 W | GeForce RTX 4090 Laptop GPU 175 W 2040 / 2250 MHz 16 GB | 32 GB | 99.6 |
| Alienware m18 R2 via Dell | i9-14900HX 180 W / 144 W | GeForce RTX 4090 Laptop GPU 175 W 1950 / 2250 MHz 16 GB | 32 GB | 99.6 |
| Asus ROG Zephyrus G16 GU605MY via Asus Deutschland | Ultra 9 185H | GeForce RTX 4090 Laptop GPU 1455 / 2250 MHz 16 GB | 32 GB | 99.6 |
| Razer Blade 18 2024 RZ09-0509 via Razer | i9-14900HX 138 W / 117 W | GeForce RTX 4090 Laptop GPU 175 W 1455 / 2250 MHz 16 GB | 32 GB | 99.6 |
| Lenovo Legion 9 16IRX9, RTX 4090 via Lenovo | i9-14900HX | GeForce RTX 4090 Laptop GPU 175 W 16 GB | 64 GB | 99.6 |
| Schenker XMG Neo 16 (Early 24) via Schenker Technologies | i9-14900HX 205 W / 205 W | GeForce RTX 4090 Laptop GPU 175 W 2040 / 2250 MHz 16 GB | 32 GB | 99.6 |
| Schenker XMG Neo 16 (Early 24) Overboost, Oasis | i9-14900HX 205 W / 205 W | GeForce RTX 4090 Laptop GPU 175 W 2040 / 2250 MHz 16 GB | 32 GB | 99.6 |
| Schenker Key 17 Pro (M24) via Bestware | i9-14900HX | GeForce RTX 4090 Laptop GPU 175 W 15.6 GB | 32 GB | 99.6 |
| GPU TDP ? | TDP 125 W | TDP 150 W | TDP 175 W |
|---|---|---|---|
| 100% | 100% | 100% | 100% |
| Model | CPU | GPU | RAM | Value |
|---|---|---|---|---|
| Asus ROG Strix Scar 17 G733PYV-LL053X via AMD | R9 7945HX3D 115 W / 100 W | GeForce RTX 4090 Laptop GPU 175 W 2040 / 2250 MHz 16 GB | 32 GB | 238.8 |
| MSI Titan GT77 HX 13VI via Intel Deutschland | i9-13950HX 220 W / 150 W | GeForce RTX 4090 Laptop GPU 175 W 2340 / 2250 MHz 16 GB | 64 GB | 239.5 |
| Asus ROG Strix Scar 18 2023 G834JY-N6005W Vulkan | i9-13980HX 175 W / 170 W | GeForce RTX 4090 Laptop GPU 175 W 2090 / 2250 MHz 16 GB | 32 GB | 246 |
| Model | CPU | GPU | RAM | Value |
|---|---|---|---|---|
| Asus ROG Strix Scar 17 G733PYV-LL053X via AMD | R9 7945HX3D 115 W / 100 W | GeForce RTX 4090 Laptop GPU 175 W 2040 / 2250 MHz 16 GB | 32 GB | 518.3 |
| MSI Titan GT77 HX 13VI via Intel Deutschland | i9-13950HX 220 W / 150 W | GeForce RTX 4090 Laptop GPU 175 W 2340 / 2250 MHz 16 GB | 64 GB | 522 |
| Asus ROG Strix Scar 18 2023 G834JY-N6005W Vulkan | i9-13980HX 175 W / 170 W | GeForce RTX 4090 Laptop GPU 175 W 2090 / 2250 MHz 16 GB | 32 GB | 550 |
| Model | CPU | GPU | RAM | Value |
|---|---|---|---|---|
| Asus ROG Strix Scar 17 G733PYV-LL053X via AMD | R9 7945HX3D 115 W / 100 W | GeForce RTX 4090 Laptop GPU 175 W 2040 / 2250 MHz 16 GB | 32 GB | 1091 |
| MSI Titan GT77 HX 13VI via Intel Deutschland | i9-13950HX 220 W / 150 W | GeForce RTX 4090 Laptop GPU 175 W 2340 / 2250 MHz 16 GB | 64 GB | 1157 |
| Asus ROG Strix Scar 18 2023 G834JY-N6005W Vulkan | i9-13980HX 175 W / 170 W | GeForce RTX 4090 Laptop GPU 175 W 2090 / 2250 MHz 16 GB | 32 GB | 1350 |
| Model | CPU | GPU | RAM | Value |
|---|---|---|---|---|
| MSI Titan GT77 HX 13VI via Intel Deutschland | i9-13950HX 220 W / 150 W | GeForce RTX 4090 Laptop GPU 175 W 2340 / 2250 MHz 16 GB | 64 GB | 888 |
| Asus ROG Strix Scar 17 G733PYV-LL053X via AMD | R9 7945HX3D 115 W / 100 W | GeForce RTX 4090 Laptop GPU 175 W 2040 / 2250 MHz 16 GB | 32 GB | 916 |
| Model | CPU | GPU | RAM | Value |
|---|---|---|---|---|
| MSI Titan GT77 HX 13VI via Intel Deutschland | i9-13950HX 220 W / 150 W | GeForce RTX 4090 Laptop GPU 175 W 2340 / 2250 MHz 16 GB | 64 GB | 993 |
| Model | CPU | GPU | RAM | Value |
|---|---|---|---|---|
| MSI Titan GT77 HX 13VI via Intel Deutschland | i9-13950HX 220 W / 150 W | GeForce RTX 4090 Laptop GPU 175 W 2340 / 2250 MHz 16 GB | 64 GB | 1057 |
GFXBench T-Rex HD Offscreen C24Z16 +
| Model | CPU | GPU | RAM | Value |
|---|---|---|---|---|
| MSI Titan GT77 HX 13VI via Intel Deutschland | i9-13950HX 220 W / 150 W | GeForce RTX 4090 Laptop GPU 175 W 2340 / 2250 MHz 16 GB | 64 GB | 4088 |
| Model | CPU | GPU | RAM | Value |
|---|---|---|---|---|
| Asus ROG Strix Scar 17 G733PY-XS96 via Asus bc7 | R9 7945HX 128 W / 128 W | GeForce RTX 4090 Laptop GPU 175 W 2090 / 2275 MHz 16 GB | 32 GB | 104.6 |
| Aorus 17X AZF via Gigabyte Aorus Deutschland bc7 | i9-13900HX 157 W / 86 W | GeForce RTX 4090 Laptop GPU 175 W 2040 / 2250 MHz 16 GB | 32 GB | 125.8 |
| Lenovo Legion Pro 7 RTX4090 via Lenovo Deutschland bc7 | i9-13900HX 185 W / 130 W | GeForce RTX 4090 Laptop GPU 175 W 1455 / 2250 MHz 16 GB | 32 GB | 1746 |
| Asus ROG Zephyrus G16 GU605MY via Asus Deutschland bc7 | Ultra 9 185H | GeForce RTX 4090 Laptop GPU 1455 / 2250 MHz 16 GB | 32 GB | 1806 |
| Lenovo Legion 9 16IRX9, RTX 4090 via Lenovo bc7 | i9-14900HX | GeForce RTX 4090 Laptop GPU 175 W 16 GB | 64 GB | 2245 |
| Razer Blade 16 2024, RTX 4090 via Razer bc7 | i9-14900HX 140 W / 60 W | GeForce RTX 4090 Laptop GPU 175 W 16 GB | 32 GB | 2295 |
| Lenovo Legion 9 16IRX8 via Lenovo bc7 | i9-13980HX 145 W / 125 W | GeForce RTX 4090 Laptop GPU 175 W 1605 / 2300 MHz 16 GB | 32 GB | 2426 |
| Alienware m18 R2 via Dell bc7 | i9-14900HX 180 W / 144 W | GeForce RTX 4090 Laptop GPU 175 W 1950 / 2250 MHz 16 GB | 32 GB | 2480 |
| Eurocom Raptor X17 Core i9-14900HX via Eurocom bc7 | i9-14900HX 93 W / 63 W | GeForce RTX 4090 Laptop GPU 175 W 2040 / 2250 MHz 16 GB | 32 GB | 2497 |
| MSI Titan 18 HX A14VIG via MSI bc7 | i9-14900HX 238 W / 176 W | GeForce RTX 4090 Laptop GPU 175 W 1555 / 2250 MHz 16 GB | 128 GB | 2507 |
| Eurocom Raptor X17 via Eurocom bc7 | i9-13900HX 155 W / 110 W | GeForce RTX 4090 Laptop GPU 175 W 2040 / 2250 MHz 16 GB | 64 GB | 2536 |
| Asus ROG Strix Scar 18 2023 G834JY-N6005W bc7 | i9-13980HX 175 W / 170 W | GeForce RTX 4090 Laptop GPU 175 W 2090 / 2250 MHz 16 GB | 32 GB | 2544 |
| GPU TDP ? | TDP 175 W |
|---|---|
| 92% | 100% |
| Model | CPU | GPU | RAM | Value |
|---|---|---|---|---|
| Alienware m18 R1 via Dell bc7 | i9-13980HX 198 W / 143 W | GeForce RTX 4090 Laptop GPU 175 W 1975 / 2263 MHz 16 GB | 32 GB | 3.64 |
| Asus ROG Strix Scar 17 G733PY-XS96 via Asus bc7 | R9 7945HX 128 W / 128 W | GeForce RTX 4090 Laptop GPU 175 W 2090 / 2275 MHz 16 GB | 32 GB | 3.64 |
| Eurocom Raptor X17 via Eurocom bc7 | i9-13900HX 155 W / 110 W | GeForce RTX 4090 Laptop GPU 175 W 2040 / 2250 MHz 16 GB | 64 GB | 3.64 |
| Lenovo Legion 9 16IRX8 via Lenovo bc7 | i9-13980HX 145 W / 125 W | GeForce RTX 4090 Laptop GPU 175 W 1605 / 2300 MHz 16 GB | 32 GB | 3.64 |
| MSI Titan 18 HX A14VIG via MSI bc7 | i9-14900HX 238 W / 176 W | GeForce RTX 4090 Laptop GPU 175 W 1555 / 2250 MHz 16 GB | 128 GB | 3.64 |
| Eurocom Raptor X17 Core i9-14900HX via Eurocom bc7 | i9-14900HX 93 W / 63 W | GeForce RTX 4090 Laptop GPU 175 W 2040 / 2250 MHz 16 GB | 32 GB | 3.64 |
| Alienware m18 R2 via Dell bc7 | i9-14900HX 180 W / 144 W | GeForce RTX 4090 Laptop GPU 175 W 1950 / 2250 MHz 16 GB | 32 GB | 3.64 |
| Aorus 17X AZF via Gigabyte Aorus Deutschland bc7 | i9-13900HX 157 W / 86 W | GeForce RTX 4090 Laptop GPU 175 W 2040 / 2250 MHz 16 GB | 32 GB | 9.73 |
| Razer Blade 16 2024, RTX 4090 via Razer bc7 | i9-14900HX 140 W / 60 W | GeForce RTX 4090 Laptop GPU 175 W 16 GB | 32 GB | 235 |
| Model | CPU | GPU | RAM | Value |
|---|---|---|---|---|
| Razer Blade 18 2024 RZ09-0509 via Razer | i9-14900HX 138 W / 117 W | GeForce RTX 4090 Laptop GPU 175 W 1455 / 2250 MHz 16 GB | 32 GB | 159127 |
| Asus ROG Zephyrus G16 GU605MY via Asus Deutschland 6.2.1 | Ultra 9 185H | GeForce RTX 4090 Laptop GPU 1455 / 2250 MHz 16 GB | 32 GB | 161798 |
| Razer Blade 16 2024, RTX 4090 via Razer 6.2.1 | i9-14900HX 140 W / 60 W | GeForce RTX 4090 Laptop GPU 175 W 16 GB | 32 GB | 167047 |
| Acer Predator Helios 18 PH18-72-98MW via Acer Deutschland 6.2.1 | i9-14900HX 157 W / 95 W | GeForce RTX 4090 Laptop GPU 175 W 1590 / 2250 MHz 16 GB | 32 GB | 168252 |
| MSI Titan 18 HX A14VIG via MSI 6.2.1 | i9-14900HX 238 W / 176 W | GeForce RTX 4090 Laptop GPU 175 W 1555 / 2250 MHz 16 GB | 128 GB | 171038 |
| Asus ROG Strix Scar 18 G834JYR (2024) 6.2.1, Turbo | i9-14900HX 175 W / 175 W | GeForce RTX 4090 Laptop GPU 175 W 1455 / 2250 MHz 16 GB | 32 GB | 180809 |
| Lenovo Legion 9 16IRX8 via Lenovo | i9-13980HX 145 W / 125 W | GeForce RTX 4090 Laptop GPU 175 W 1605 / 2300 MHz 16 GB | 32 GB | 181225 |
| Eurocom Raptor X17 Core i9-14900HX via Eurocom 6.2.1 | i9-14900HX 93 W / 63 W | GeForce RTX 4090 Laptop GPU 175 W 2040 / 2250 MHz 16 GB | 32 GB | 188259 |
| Alienware m18 R2 via Dell 6.2.1 | i9-14900HX 180 W / 144 W | GeForce RTX 4090 Laptop GPU 175 W 1950 / 2250 MHz 16 GB | 32 GB | 190316 |
| Lenovo Legion 9 16IRX9, RTX 4090 via Lenovo 6.2.1 | i9-14900HX | GeForce RTX 4090 Laptop GPU 175 W 16 GB | 64 GB | 190540 |
| Schenker XMG Neo 16 (Early 24) via Schenker Technologies 6.2.1 | i9-14900HX 205 W / 205 W | GeForce RTX 4090 Laptop GPU 175 W 2040 / 2250 MHz 16 GB | 32 GB | 190820 |
| Asus ROG Strix Scar 18 G834JYR (2024) via Asus Deutschland 6.2.1 | i9-14900HX 120 W / 110 W | GeForce RTX 4090 Laptop GPU 175 W 1455 / 2250 MHz 16 GB | 32 GB | 191635 |
| Asus ROG Strix Scar 17 G733PYV-LL053X via AMD | R9 7945HX3D 115 W / 100 W | GeForce RTX 4090 Laptop GPU 175 W 2040 / 2250 MHz 16 GB | 32 GB | 192262 |
| Schenker Neo 17 2024 Engineering Sample | i9-14900HX | GeForce RTX 4090 Laptop GPU | 32 GB | 194751 |
| Schenker XMG Neo 16 (Early 24) 6.2.1, Overboost, Oasis | i9-14900HX 205 W / 205 W | GeForce RTX 4090 Laptop GPU 175 W 2040 / 2250 MHz 16 GB | 32 GB | 199154 |
| Schenker Key 17 Pro (M24) via Bestware 6.2.1 | i9-14900HX | GeForce RTX 4090 Laptop GPU 175 W 15.6 GB | 32 GB | 199476 |
| Medion Erazer Beast X40 2024 6.2.1, Gaming Mode | i9-14900HX 160 W / 160 W | GeForce RTX 4090 Laptop GPU 175 W 2040 / 2250 MHz 16 GB | 32 GB | 205116 |
| MSI Raider GE78 HX 13VI | i9-13980HX | GeForce RTX 4090 Laptop GPU 175 W 16 GB | 64 GB | 205902 |
| Medion Erazer Beast X40 2024 via Medion DE 6.2.1 | i9-14900HX 160 W / 160 W | GeForce RTX 4090 Laptop GPU 175 W 2040 / 2250 MHz 16 GB | 32 GB | 207373 |
| Schenker XMG Neo 17 2024 Engineering Sample via Schenker Technologies 6.2.1 | i9-14900HX | GeForce RTX 4090 Laptop GPU | 209521 |
| GPU TDP ? | TDP 175 W |
|---|---|
| 100% | 99% |
| Model | CPU | GPU | RAM | Value |
|---|---|---|---|---|
| Alienware m18 R2 via Dell 6.2.1 | i9-14900HX 180 W / 144 W | GeForce RTX 4090 Laptop GPU 175 W 1950 / 2250 MHz 16 GB | 32 GB | 128748 |
| Asus ROG Zephyrus G16 GU605MY via Asus Deutschland 6.2.1 | Ultra 9 185H | GeForce RTX 4090 Laptop GPU 1455 / 2250 MHz 16 GB | 32 GB | 132767 |
| Schenker Key 17 Pro (M24) via Bestware 6.2.1 | i9-14900HX | GeForce RTX 4090 Laptop GPU 175 W 15.6 GB | 32 GB | 133197 |
| Lenovo Legion 9 16IRX8 via Lenovo | i9-13980HX 145 W / 125 W | GeForce RTX 4090 Laptop GPU 175 W 1605 / 2300 MHz 16 GB | 32 GB | 136811 |
| Eurocom Raptor X17 Core i9-14900HX via Eurocom 6.2.1 | i9-14900HX 93 W / 63 W | GeForce RTX 4090 Laptop GPU 175 W 2040 / 2250 MHz 16 GB | 32 GB | 139795 |
| Lenovo Legion 9 16IRX9, RTX 4090 via Lenovo 6.2.1 | i9-14900HX | GeForce RTX 4090 Laptop GPU 175 W 16 GB | 64 GB | 148584 |
| Schenker XMG Neo 16 (Early 24) 6.2.1, Overboost, Oasis | i9-14900HX 205 W / 205 W | GeForce RTX 4090 Laptop GPU 175 W 2040 / 2250 MHz 16 GB | 32 GB | 149336 |
| MSI Titan 18 HX A14VIG via MSI 6.2.1 | i9-14900HX 238 W / 176 W | GeForce RTX 4090 Laptop GPU 175 W 1555 / 2250 MHz 16 GB | 128 GB | 156636 |
| MSI Raider GE78 HX 13VI | i9-13980HX | GeForce RTX 4090 Laptop GPU 175 W 16 GB | 64 GB | 157602 |
| Asus ROG Strix Scar 17 G733PYV-LL053X via AMD | R9 7945HX3D 115 W / 100 W | GeForce RTX 4090 Laptop GPU 175 W 2040 / 2250 MHz 16 GB | 32 GB | 157614 |
| Asus ROG Strix Scar 18 G834JYR (2024) 6.2.1, Turbo | i9-14900HX 175 W / 175 W | GeForce RTX 4090 Laptop GPU 175 W 1455 / 2250 MHz 16 GB | 32 GB | 161388 |
| Schenker XMG Neo 16 (Early 24) via Schenker Technologies 6.2.1 | i9-14900HX 205 W / 205 W | GeForce RTX 4090 Laptop GPU 175 W 2040 / 2250 MHz 16 GB | 32 GB | 164105 |
| Asus ROG Strix Scar 18 G834JYR (2024) via Asus Deutschland 6.2.1 | i9-14900HX 120 W / 110 W | GeForce RTX 4090 Laptop GPU 175 W 1455 / 2250 MHz 16 GB | 32 GB | 165748 |
| Medion Erazer Beast X40 2024 via Medion DE 6.2.1 | i9-14900HX 160 W / 160 W | GeForce RTX 4090 Laptop GPU 175 W 2040 / 2250 MHz 16 GB | 32 GB | 178630 |
| Razer Blade 16 2024, RTX 4090 via Razer 6.2.1 | i9-14900HX 140 W / 60 W | GeForce RTX 4090 Laptop GPU 175 W 16 GB | 32 GB | 178909 |
| Medion Erazer Beast X40 2024 6.2.1, Gaming Mode | i9-14900HX 160 W / 160 W | GeForce RTX 4090 Laptop GPU 175 W 2040 / 2250 MHz 16 GB | 32 GB | 196201 |
| GPU TDP ? | TDP 175 W |
|---|---|
| 85% | 100% |
| Model | CPU | GPU | RAM | Value |
|---|---|---|---|---|
| MSI Titan GT77 HX 13VI via Intel Deutschland | i9-13950HX 220 W / 150 W | GeForce RTX 4090 Laptop GPU 175 W 2340 / 2250 MHz 16 GB | 64 GB | 8614 |
| Aorus 17X AZF via Gigabyte Aorus Deutschland | i9-13900HX 157 W / 86 W | GeForce RTX 4090 Laptop GPU 175 W 2040 / 2250 MHz 16 GB | 32 GB | 9032 |
| Model | CPU | GPU | RAM | Value |
|---|---|---|---|---|
| Aorus 17X AZF via Gigabyte Aorus Deutschland | i9-13900HX 157 W / 86 W | GeForce RTX 4090 Laptop GPU 175 W 2040 / 2250 MHz 16 GB | 32 GB | 19782 |
| MSI Titan GT77 HX 13VI via Intel Deutschland | i9-13950HX 220 W / 150 W | GeForce RTX 4090 Laptop GPU 175 W 2340 / 2250 MHz 16 GB | 64 GB | 20001 |
| Model | CPU | GPU | RAM | Value |
|---|---|---|---|---|
| Aorus 17X AZF via Gigabyte Aorus Deutschland | i9-13900HX 157 W / 86 W | GeForce RTX 4090 Laptop GPU 175 W 2040 / 2250 MHz 16 GB | 32 GB | 30767 |
| Asus ROG Strix Scar 18 2023 G834JY-N6005W | i9-13980HX 175 W / 170 W | GeForce RTX 4090 Laptop GPU 175 W 2090 / 2250 MHz 16 GB | 32 GB | 49892 |
| MSI Titan GT77 HX 13VI via Intel Deutschland | i9-13950HX 220 W / 150 W | GeForce RTX 4090 Laptop GPU 175 W 2340 / 2250 MHz 16 GB | 64 GB | 52066 |
| Model | CPU | GPU | RAM | Value |
|---|---|---|---|---|
| Lenovo Legion Pro 7 RTX4090 via Lenovo Deutschland | i9-13900HX 185 W / 130 W | GeForce RTX 4090 Laptop GPU 175 W 1455 / 2250 MHz 16 GB | 32 GB | 126.7 |
| Asus ROG Zephyrus G16 GU605MY via Asus Deutschland | Ultra 9 185H | GeForce RTX 4090 Laptop GPU 1455 / 2250 MHz 16 GB | 32 GB | 148.5 |
| Asus ROG Zephyrus G14 GA402XY via Asus Deutschland | R9 7940HS 80 W / 80 W | GeForce RTX 4090 Laptop GPU 125 W 1455 / 2250 MHz 16 GB | 32 GB | 160.1 |
| Asus ROG Zephyrus M16 GU604VY-NM042X via Asus | i9-13900H 140 W / 100 W | GeForce RTX 4090 Laptop GPU 150 W 16 GB | 64 GB | 183 |
| Medion Erazer Beast X40 2024 via Medion DE | i9-14900HX 160 W / 160 W | GeForce RTX 4090 Laptop GPU 175 W 2040 / 2250 MHz 16 GB | 32 GB | 207 |
| Acer Predator Helios 18 PH18-72-98MW via Acer Deutschland | i9-14900HX 157 W / 95 W | GeForce RTX 4090 Laptop GPU 175 W 1590 / 2250 MHz 16 GB | 32 GB | 209 |
| Asus ROG Strix Scar 18 2023 G834JY-N6005W | i9-13980HX 0 W / 65 W | GeForce RTX 4090 Laptop GPU 175 W 2090 MHz 16 GB | 32 GB | 217 |
| MSI Titan GT77 HX 13VI via Intel Deutschland | i9-13950HX 220 W / 150 W | GeForce RTX 4090 Laptop GPU 175 W 2340 / 2250 MHz 16 GB | 64 GB | 218 |
| Asus ROG Strix Scar 18 G834JYR (2024) via Asus Deutschland | i9-14900HX 120 W / 110 W | GeForce RTX 4090 Laptop GPU 175 W 1455 / 2250 MHz 16 GB | 32 GB | 220 |
| Lenovo Legion 9 16IRX9, RTX 4090 via Lenovo | i9-14900HX | GeForce RTX 4090 Laptop GPU 175 W 16 GB | 64 GB | 222 |
| Razer Blade 16 2024, RTX 4090 via Razer | i9-14900HX 140 W / 60 W | GeForce RTX 4090 Laptop GPU 175 W 16 GB | 32 GB | 226 |
| Schenker XMG Neo 16 (Early 24) via Schenker Technologies | i9-14900HX 205 W / 205 W | GeForce RTX 4090 Laptop GPU 175 W 2040 / 2250 MHz 16 GB | 32 GB | 232 |
| Schenker Key 17 Pro (M24) via Bestware | i9-14900HX | GeForce RTX 4090 Laptop GPU 175 W 15.6 GB | 32 GB | 235 |
| Asus Zephyrus Duo 16 GX650PY-NM006W via Asus Deutschland | R9 7945HX 130 W / 120 W | GeForce RTX 4090 Laptop GPU 175 W 2090 / 2275 MHz 16 GB | 32 GB | 236 |
| Schenker Key 17 Pro (M24) via Bestware | i9-14900HX | GeForce RTX 4090 Laptop GPU 175 W 15.6 GB | 32 GB | 236.8 |
| Razer Blade 16 Early 2023 RTX 4090 via Razer | i9-13950HX 130 W / 110 W | GeForce RTX 4090 Laptop GPU 175 W 16 GB | 32 GB | 239 |
| Aorus 17X AZF via Gigabyte Aorus Deutschland | i9-13900HX 157 W / 86 W | GeForce RTX 4090 Laptop GPU 175 W 2040 / 2250 MHz 16 GB | 32 GB | 239 |
| Schenker Key 17 Pro (Early 23) via Schenker Technologies | i9-13900HX 162 W / 135 W | GeForce RTX 4090 Laptop GPU 175 W 2040 / 2250 MHz 16 GB | 32 GB | 242 |
| Asus ROG Strix Scar 17 G733PYV-LL053X via AMD | R9 7945HX3D 115 W / 100 W | GeForce RTX 4090 Laptop GPU 175 W 2040 / 2250 MHz 16 GB | 32 GB | 242 |
| Asus ROG Strix Scar 18 2023 G834JY-N6005W | i9-13980HX 175 W / 170 W | GeForce RTX 4090 Laptop GPU 175 W 2090 / 2250 MHz 16 GB | 32 GB | 243 |
| Medion Erazer Beast X40 via Medion | i9-13900HX 160 W / 160 W | GeForce RTX 4090 Laptop GPU 175 W 2040 / 2375 MHz 16 GB | 32 GB | 243 |
| Eluktronics Mech-17 GP2 via Eluktronics | i9-13900HX 160 W / 99 W | GeForce RTX 4090 Laptop GPU 175 W 2140 / 2375 MHz 16 GB | 32 GB | 244 |
| Schenker XMG Neo 16 E23 | i9-13900HX 160 W / 160 W | GeForce RTX 4090 Laptop GPU 175 W 2040 / 2250 MHz 16 GB | 32 GB | 245 |
| Lenovo Legion 9 16IRX8 via Lenovo | i9-13980HX 145 W / 125 W | GeForce RTX 4090 Laptop GPU 175 W 1605 / 2300 MHz 16 GB | 32 GB | 246 |
| Asus ROG Strix Scar 17 G733PY-XS96 via Asus | R9 7945HX 128 W / 128 W | GeForce RTX 4090 Laptop GPU 175 W 2090 / 2275 MHz 16 GB | 32 GB | 248 |
| Eurocom Raptor X17 via Eurocom | i9-13900HX 155 W / 110 W | GeForce RTX 4090 Laptop GPU 175 W 2040 / 2250 MHz 16 GB | 64 GB | 251 |
| MSI Titan 18 HX A14VIG via MSI | i9-14900HX 238 W / 176 W | GeForce RTX 4090 Laptop GPU 175 W 1555 / 2250 MHz 16 GB | 128 GB | 256 |
| Alienware m18 R1 via Dell | i9-13980HX 198 W / 143 W | GeForce RTX 4090 Laptop GPU 175 W 1975 / 2263 MHz 16 GB | 32 GB | 264 |
| Alienware m18 R2 via Dell | i9-14900HX 180 W / 144 W | GeForce RTX 4090 Laptop GPU 175 W 1950 / 2250 MHz 16 GB | 32 GB | 295 |
| GPU TDP ? | TDP 125 W | TDP 150 W | TDP 175 W |
|---|---|---|---|
| 117% | 115% | 110% | 100% |
| Model | CPU | GPU | RAM | Value |
|---|---|---|---|---|
| Asus ROG Zephyrus G14 GA402XY via Asus Deutschland | R9 7940HS 80 W / 80 W | GeForce RTX 4090 Laptop GPU 125 W 1455 / 2250 MHz 16 GB | 32 GB | 159.1 |
| Asus ROG Zephyrus M16 GU604VY-NM042X via Asus | i9-13900H 140 W / 100 W | GeForce RTX 4090 Laptop GPU 150 W 16 GB | 64 GB | 197 |
| Acer Predator Helios 18 PH18-72-98MW via Acer Deutschland | i9-14900HX 157 W / 95 W | GeForce RTX 4090 Laptop GPU 175 W 1590 / 2250 MHz 16 GB | 32 GB | 210 |
| Lenovo Legion 9 16IRX9, RTX 4090 via Lenovo | i9-14900HX | GeForce RTX 4090 Laptop GPU 175 W 16 GB | 64 GB | 230 |
| Razer Blade 16 2024, RTX 4090 via Razer | i9-14900HX 140 W / 60 W | GeForce RTX 4090 Laptop GPU 175 W 16 GB | 32 GB | 231 |
| Razer Blade 16 Early 2023 RTX 4090 via Razer | i9-13950HX 130 W / 110 W | GeForce RTX 4090 Laptop GPU 175 W 16 GB | 32 GB | 242 |
| Asus ROG Strix Scar 18 2023 G834JY-N6005W | i9-13980HX 0 W / 65 W | GeForce RTX 4090 Laptop GPU 175 W 2090 MHz 16 GB | 32 GB | 244 |
| Asus Zephyrus Duo 16 GX650PY-NM006W via Asus Deutschland | R9 7945HX 130 W / 120 W | GeForce RTX 4090 Laptop GPU 175 W 2090 / 2275 MHz 16 GB | 32 GB | 244 |
| Asus ROG Strix Scar 18 G834JYR (2024) via Asus Deutschland | i9-14900HX 120 W / 110 W | GeForce RTX 4090 Laptop GPU 175 W 1455 / 2250 MHz 16 GB | 32 GB | 244 |
| MSI Titan GT77 HX 13VI via Intel Deutschland | i9-13950HX 220 W / 150 W | GeForce RTX 4090 Laptop GPU 175 W 2340 / 2250 MHz 16 GB | 64 GB | 250 |
| Lenovo Legion 9 16IRX8 via Lenovo | i9-13980HX 145 W / 125 W | GeForce RTX 4090 Laptop GPU 175 W 1605 / 2300 MHz 16 GB | 32 GB | 252 |
| Asus ROG Strix Scar 17 G733PYV-LL053X via AMD | R9 7945HX3D 115 W / 100 W | GeForce RTX 4090 Laptop GPU 175 W 2040 / 2250 MHz 16 GB | 32 GB | 257 |
| Schenker Key 17 Pro (Early 23) via Schenker Technologies | i9-13900HX 162 W / 135 W | GeForce RTX 4090 Laptop GPU 175 W 2040 / 2250 MHz 16 GB | 32 GB | 267 |
| Medion Erazer Beast X40 2024 via Medion DE | i9-14900HX 160 W / 160 W | GeForce RTX 4090 Laptop GPU 175 W 2040 / 2250 MHz 16 GB | 32 GB | 274 |
| Asus ROG Strix Scar 17 G733PY-XS96 via Asus | R9 7945HX 128 W / 128 W | GeForce RTX 4090 Laptop GPU 175 W 2090 / 2275 MHz 16 GB | 32 GB | 275 |
| Aorus 17X AZF via Gigabyte Aorus Deutschland | i9-13900HX 157 W / 86 W | GeForce RTX 4090 Laptop GPU 175 W 2040 / 2250 MHz 16 GB | 32 GB | 276 |
| Lenovo Legion Pro 7 RTX4090 via Lenovo Deutschland | i9-13900HX 185 W / 130 W | GeForce RTX 4090 Laptop GPU 175 W 1455 / 2250 MHz 16 GB | 32 GB | 277 |
| Medion Erazer Beast X40 via Medion | i9-13900HX 160 W / 160 W | GeForce RTX 4090 Laptop GPU 175 W 2040 / 2375 MHz 16 GB | 32 GB | 285 |
| Eluktronics Mech-17 GP2 via Eluktronics | i9-13900HX 160 W / 99 W | GeForce RTX 4090 Laptop GPU 175 W 2140 / 2375 MHz 16 GB | 32 GB | 286 |
| Eurocom Raptor X17 via Eurocom | i9-13900HX 155 W / 110 W | GeForce RTX 4090 Laptop GPU 175 W 2040 / 2250 MHz 16 GB | 64 GB | 286 |
| Asus ROG Strix Scar 18 2023 G834JY-N6005W | i9-13980HX 175 W / 170 W | GeForce RTX 4090 Laptop GPU 175 W 2090 / 2250 MHz 16 GB | 32 GB | 289 |
| Schenker XMG Neo 16 E23 | i9-13900HX 160 W / 160 W | GeForce RTX 4090 Laptop GPU 175 W 2040 / 2250 MHz 16 GB | 32 GB | 291 |
| Schenker XMG Neo 16 (Early 24) via Schenker Technologies | i9-14900HX 205 W / 205 W | GeForce RTX 4090 Laptop GPU 175 W 2040 / 2250 MHz 16 GB | 32 GB | 297 |
| MSI Titan 18 HX A14VIG via MSI | i9-14900HX 238 W / 176 W | GeForce RTX 4090 Laptop GPU 175 W 1555 / 2250 MHz 16 GB | 128 GB | 306 |
| Alienware m18 R1 via Dell | i9-13980HX 198 W / 143 W | GeForce RTX 4090 Laptop GPU 175 W 1975 / 2263 MHz 16 GB | 32 GB | 307 |
| Alienware m18 R2 via Dell | i9-14900HX 180 W / 144 W | GeForce RTX 4090 Laptop GPU 175 W 1950 / 2250 MHz 16 GB | 32 GB | 351 |
| GPU TDP 125 W | TDP 150 W | TDP 175 W |
|---|---|---|
| 125% | 116% | 100% |
| GPU TDP ? | TDP 125 W | TDP 150 W | TDP 175 W |
|---|---|---|---|
| 100% | 194% | 169% | 119% |
| Model | CPU | GPU | RAM | Value |
|---|---|---|---|---|
| Asus ROG Strix Scar 18 2023 G834JY-N6005W | i9-13980HX 175 W / 170 W | GeForce RTX 4090 Laptop GPU 175 W 2090 / 2250 MHz 16 GB | 32 GB | 259 |
| Model | CPU | GPU | RAM | Value |
|---|---|---|---|---|
| Alienware m18 R2 via Dell | i9-14900HX 180 W / 144 W | GeForce RTX 4090 Laptop GPU 175 W 1950 / 2250 MHz 16 GB | 32 GB | 0.575 |
| MSI Titan 18 HX A14VIG via MSI | i9-14900HX 238 W / 176 W | GeForce RTX 4090 Laptop GPU 175 W 1555 / 2250 MHz 16 GB | 128 GB | 0.629 |
| Eurocom Raptor X17 Core i9-14900HX via Eurocom | i9-14900HX 93 W / 63 W | GeForce RTX 4090 Laptop GPU 175 W 2040 / 2250 MHz 16 GB | 32 GB | 0.644 |
| Eurocom Raptor X17 via Eurocom | i9-13900HX 155 W / 110 W | GeForce RTX 4090 Laptop GPU 175 W 2040 / 2250 MHz 16 GB | 64 GB | 0.682 |
| Razer Blade 16 Early 2023 RTX 4090 via Razer | i9-13950HX 130 W / 110 W | GeForce RTX 4090 Laptop GPU 175 W 16 GB | 32 GB | 0.683 |
| Asus Zephyrus Duo 16 GX650PY-NM006W via Asus Deutschland | R9 7945HX 130 W / 120 W | GeForce RTX 4090 Laptop GPU 175 W 2090 / 2275 MHz 16 GB | 32 GB | 0.692 |
| Schenker XMG Neo 16 (Early 24) via Schenker Technologies | i9-14900HX 205 W / 205 W | GeForce RTX 4090 Laptop GPU 175 W 2040 / 2250 MHz 16 GB | 32 GB | 0.695 |
| Schenker Key 17 Pro (Early 23) via Schenker Technologies | i9-13900HX 162 W / 135 W | GeForce RTX 4090 Laptop GPU 175 W 2040 / 2250 MHz 16 GB | 32 GB | 0.705 |
| Razer Blade 18 2024 RZ09-0509 via Razer | i9-14900HX 138 W / 117 W | GeForce RTX 4090 Laptop GPU 175 W 1455 / 2250 MHz 16 GB | 32 GB | 0.707 |
| Lenovo Legion Pro 7 RTX4090 via Lenovo Deutschland | i9-13900HX 185 W / 130 W | GeForce RTX 4090 Laptop GPU 175 W 1455 / 2250 MHz 16 GB | 32 GB | 0.709 |
| Eluktronics Mech-17 GP2 via Eluktronics | i9-13900HX 160 W / 99 W | GeForce RTX 4090 Laptop GPU 175 W 2140 / 2375 MHz 16 GB | 32 GB | 0.712 |
| Asus ROG Strix Scar 18 G834JYR (2024) via Asus Deutschland | i9-14900HX 120 W / 110 W | GeForce RTX 4090 Laptop GPU 175 W 1455 / 2250 MHz 16 GB | 32 GB | 0.717 |
| Aorus 17X AZF via Gigabyte Aorus Deutschland | i9-13900HX 157 W / 86 W | GeForce RTX 4090 Laptop GPU 175 W 2040 / 2250 MHz 16 GB | 32 GB | 0.719 |
| Medion Erazer Beast X40 2024 via Medion DE | i9-14900HX 160 W / 160 W | GeForce RTX 4090 Laptop GPU 175 W 2040 / 2250 MHz 16 GB | 32 GB | 0.729 |
| Asus ROG Strix Scar 17 G733PY-XS96 via Asus | R9 7945HX 128 W / 128 W | GeForce RTX 4090 Laptop GPU 175 W 2090 / 2275 MHz 16 GB | 32 GB | 0.733 |
| Schenker XMG Neo 16 E23 | i9-13900HX 160 W / 160 W | GeForce RTX 4090 Laptop GPU 175 W 2040 / 2250 MHz 16 GB | 32 GB | 0.738 |
| Medion Erazer Beast X40 via Medion | i9-13900HX 160 W / 160 W | GeForce RTX 4090 Laptop GPU 175 W 2040 / 2375 MHz 16 GB | 32 GB | 0.743 |
| MSI Titan GT77 HX 13VI via Intel Deutschland | i9-13950HX 220 W / 150 W | GeForce RTX 4090 Laptop GPU 175 W 2340 / 2250 MHz 16 GB | 64 GB | 0.751 |
| Acer Predator Helios 18 PH18-72-98MW via Acer Deutschland | i9-14900HX 157 W / 95 W | GeForce RTX 4090 Laptop GPU 175 W 1590 / 2250 MHz 16 GB | 32 GB | 0.789 |
| Asus ROG Strix Scar 17 G733PYV-LL053X via AMD | R9 7945HX3D 115 W / 100 W | GeForce RTX 4090 Laptop GPU 175 W 2040 / 2250 MHz 16 GB | 32 GB | 0.79 |
| Lenovo Legion 9 16IRX8 via Lenovo | i9-13980HX 145 W / 125 W | GeForce RTX 4090 Laptop GPU 175 W 1605 / 2300 MHz 16 GB | 32 GB | 0.822 |
| Razer Blade 16 2024, RTX 4090 via Razer | i9-14900HX 140 W / 60 W | GeForce RTX 4090 Laptop GPU 175 W 16 GB | 32 GB | 0.823 |
| Asus ROG Zephyrus M16 GU604VY-NM042X via Asus | i9-13900H 140 W / 100 W | GeForce RTX 4090 Laptop GPU 150 W 16 GB | 64 GB | 0.856 |
| Asus ROG Zephyrus G14 GA402XY via Asus Deutschland | R9 7940HS 80 W / 80 W | GeForce RTX 4090 Laptop GPU 125 W 1455 / 2250 MHz 16 GB | 32 GB | 0.876 |
| GPU TDP 125 W | TDP 150 W | TDP 175 W |
|---|---|---|
| 100% | 98% | 82% |
| Model | CPU | GPU | RAM | Value |
|---|---|---|---|---|
| Alienware m18 R2 via Dell | i9-14900HX 180 W / 144 W | GeForce RTX 4090 Laptop GPU 175 W 1950 / 2250 MHz 16 GB | 32 GB | 0.586 |
| MSI Titan 18 HX A14VIG via MSI | i9-14900HX 238 W / 176 W | GeForce RTX 4090 Laptop GPU 175 W 1555 / 2250 MHz 16 GB | 128 GB | 0.69 |
| Schenker XMG Neo 16 (Early 24) via Schenker Technologies | i9-14900HX 205 W / 205 W | GeForce RTX 4090 Laptop GPU 175 W 2040 / 2250 MHz 16 GB | 32 GB | 0.707 |
| Razer Blade 16 Early 2023 RTX 4090 via Razer | i9-13950HX 130 W / 110 W | GeForce RTX 4090 Laptop GPU 175 W 16 GB | 32 GB | 0.722 |
| Lenovo Legion Pro 7 RTX4090 via Lenovo Deutschland | i9-13900HX 185 W / 130 W | GeForce RTX 4090 Laptop GPU 175 W 1455 / 2250 MHz 16 GB | 32 GB | 0.722 |
| Eurocom Raptor X17 via Eurocom | i9-13900HX 155 W / 110 W | GeForce RTX 4090 Laptop GPU 175 W 2040 / 2250 MHz 16 GB | 64 GB | 0.724 |
| Aorus 17X AZF via Gigabyte Aorus Deutschland | i9-13900HX 157 W / 86 W | GeForce RTX 4090 Laptop GPU 175 W 2040 / 2250 MHz 16 GB | 32 GB | 0.725 |
| Medion Erazer Beast X40 via Medion | i9-13900HX 160 W / 160 W | GeForce RTX 4090 Laptop GPU 175 W 2040 / 2375 MHz 16 GB | 32 GB | 0.73 |
| Asus Zephyrus Duo 16 GX650PY-NM006W via Asus Deutschland | R9 7945HX 130 W / 120 W | GeForce RTX 4090 Laptop GPU 175 W 2090 / 2275 MHz 16 GB | 32 GB | 0.732 |
| Asus ROG Strix Scar 18 G834JYR (2024) via Asus Deutschland | i9-14900HX 120 W / 110 W | GeForce RTX 4090 Laptop GPU 175 W 1455 / 2250 MHz 16 GB | 32 GB | 0.738 |
| Asus ROG Strix Scar 17 G733PY-XS96 via Asus | R9 7945HX 128 W / 128 W | GeForce RTX 4090 Laptop GPU 175 W 2090 / 2275 MHz 16 GB | 32 GB | 0.741 |
| Medion Erazer Beast X40 2024 via Medion DE | i9-14900HX 160 W / 160 W | GeForce RTX 4090 Laptop GPU 175 W 2040 / 2250 MHz 16 GB | 32 GB | 0.745 |
| Schenker XMG Neo 16 E23 | i9-13900HX 160 W / 160 W | GeForce RTX 4090 Laptop GPU 175 W 2040 / 2250 MHz 16 GB | 32 GB | 0.746 |
| Eluktronics Mech-17 GP2 via Eluktronics | i9-13900HX 160 W / 99 W | GeForce RTX 4090 Laptop GPU 175 W 2140 / 2375 MHz 16 GB | 32 GB | 0.756 |
| Schenker Key 17 Pro (Early 23) via Schenker Technologies | i9-13900HX 162 W / 135 W | GeForce RTX 4090 Laptop GPU 175 W 2040 / 2250 MHz 16 GB | 32 GB | 0.772 |
| MSI Titan GT77 HX 13VI via Intel Deutschland | i9-13950HX 220 W / 150 W | GeForce RTX 4090 Laptop GPU 175 W 2340 / 2250 MHz 16 GB | 64 GB | 0.796 |
| Asus ROG Strix Scar 17 G733PYV-LL053X via AMD | R9 7945HX3D 115 W / 100 W | GeForce RTX 4090 Laptop GPU 175 W 2040 / 2250 MHz 16 GB | 32 GB | 0.805 |
| Lenovo Legion 9 16IRX8 via Lenovo | i9-13980HX 145 W / 125 W | GeForce RTX 4090 Laptop GPU 175 W 1605 / 2300 MHz 16 GB | 32 GB | 0.828 |
| Acer Predator Helios 18 PH18-72-98MW via Acer Deutschland | i9-14900HX 157 W / 95 W | GeForce RTX 4090 Laptop GPU 175 W 1590 / 2250 MHz 16 GB | 32 GB | 0.857 |
| Razer Blade 16 2024, RTX 4090 via Razer | i9-14900HX 140 W / 60 W | GeForce RTX 4090 Laptop GPU 175 W 16 GB | 32 GB | 0.866 |
| Asus ROG Zephyrus M16 GU604VY-NM042X via Asus | i9-13900H 140 W / 100 W | GeForce RTX 4090 Laptop GPU 150 W 16 GB | 64 GB | 0.904 |
| Asus ROG Zephyrus G14 GA402XY via Asus Deutschland | R9 7940HS 80 W / 80 W | GeForce RTX 4090 Laptop GPU 125 W 1455 / 2250 MHz 16 GB | 32 GB | 0.947 |
| GPU TDP 125 W | TDP 150 W | TDP 175 W |
|---|---|---|
| 100% | 95% | 79% |
| Model | CPU | GPU | RAM | Value |
|---|---|---|---|---|
| Asus ROG Zephyrus G16 GU605MY via Asus Deutschland | Ultra 9 185H | GeForce RTX 4090 Laptop GPU 1455 / 2250 MHz 16 GB | 32 GB | 157.3 |
| Schenker Key 17 Pro (M24) via Bestware | i9-14900HX | GeForce RTX 4090 Laptop GPU 175 W 15.6 GB | 32 GB | 274 |
| GPU TDP ? | TDP 175 W |
|---|---|
| 236% | 100% |
| Model | CPU | GPU | RAM | Value |
|---|---|---|---|---|
| Asus ROG Zephyrus G16 GU605MY via Asus Deutschland | Ultra 9 185H | GeForce RTX 4090 Laptop GPU 1455 / 2250 MHz 16 GB | 32 GB | 165.5 |
| Asus ROG Strix Scar 17 G733PYV-LL053X via AMD | R9 7945HX3D 115 W / 100 W | GeForce RTX 4090 Laptop GPU 175 W 2040 / 2250 MHz 16 GB | 32 GB | 272 |
| Schenker Key 17 Pro (M24) via Bestware | i9-14900HX | GeForce RTX 4090 Laptop GPU 175 W 15.6 GB | 32 GB | 280 |
| Schenker Neo 17 2024 Engineering Sample | i9-14900HX | GeForce RTX 4090 Laptop GPU | 32 GB | 318 |
| GPU TDP ? | TDP 175 W |
|---|---|
| 107% | 100% |
| Model | CPU | GPU | RAM | Value |
|---|---|---|---|---|
| Schenker Neo 17 2024 Engineering Sample | i9-14900HX | GeForce RTX 4090 Laptop GPU | 32 GB | 0.3758 |
| Asus ROG Strix Scar 17 G733PYV-LL053X via AMD | R9 7945HX3D 115 W / 100 W | GeForce RTX 4090 Laptop GPU 175 W 2040 / 2250 MHz 16 GB | 32 GB | 0.537 |
| GPU TDP ? | TDP 175 W |
|---|---|
| 70% | 100% |
| Model | CPU | GPU | RAM | Value |
|---|---|---|---|---|
| Razer Blade 16 Early 2023 RTX 4090 via Razer | i9-13950HX 130 W / 110 W | GeForce RTX 4090 Laptop GPU 175 W 16 GB | 32 GB | 46.7 |
| Razer Blade 16 2024, RTX 4090 via Razer | i9-14900HX 140 W / 60 W | GeForce RTX 4090 Laptop GPU 175 W 16 GB | 32 GB | 46.81 |
| Acer Predator Helios 18 PH18-72-98MW via Acer Deutschland | i9-14900HX 157 W / 95 W | GeForce RTX 4090 Laptop GPU 175 W 1590 / 2250 MHz 16 GB | 32 GB | 49 |
| Asus ROG Strix Scar 18 G834JYR (2024) via Asus Deutschland | i9-14900HX 120 W / 110 W | GeForce RTX 4090 Laptop GPU 175 W 1455 / 2250 MHz 16 GB | 32 GB | 50 |
| Medion Erazer Beast X40 2024 via Medion DE | i9-14900HX 160 W / 160 W | GeForce RTX 4090 Laptop GPU 175 W 2040 / 2250 MHz 16 GB | 32 GB | 50 |
| Eluktronics Mech-17 GP2 via Eluktronics | i9-13900HX 160 W / 99 W | GeForce RTX 4090 Laptop GPU 175 W 2140 / 2375 MHz 16 GB | 32 GB | 50.7 |
| Medion Erazer Beast X40 via Medion | i9-13900HX 160 W / 160 W | GeForce RTX 4090 Laptop GPU 175 W 2040 / 2375 MHz 16 GB | 32 GB | 51 |
| Asus Zephyrus Duo 16 GX650PY-NM006W via Asus Deutschland | R9 7945HX 130 W / 120 W | GeForce RTX 4090 Laptop GPU 175 W 2090 / 2275 MHz 16 GB | 32 GB | 51.2 |
| Alienware m18 R1 via Dell | i9-13980HX 198 W / 143 W | GeForce RTX 4090 Laptop GPU 175 W 1975 / 2263 MHz 16 GB | 32 GB | 51.3 |
| Asus ROG Strix Scar 17 G733PY-XS96 via Asus | R9 7945HX 128 W / 128 W | GeForce RTX 4090 Laptop GPU 175 W 2090 / 2275 MHz 16 GB | 32 GB | 51.4 |
| Alienware m18 R2 via Dell | i9-14900HX 180 W / 144 W | GeForce RTX 4090 Laptop GPU 175 W 1950 / 2250 MHz 16 GB | 32 GB | 52.1 |
| Asus ROG Zephyrus G14 GA402XY via Asus Deutschland | R9 7940HS 80 W / 80 W | GeForce RTX 4090 Laptop GPU 125 W 1455 / 2250 MHz 16 GB | 32 GB | 52.2 |
| Lenovo Legion 9 16IRX8 via Lenovo | i9-13980HX 145 W / 125 W | GeForce RTX 4090 Laptop GPU 175 W 1605 / 2300 MHz 16 GB | 32 GB | 52.2 |
| Lenovo Legion Pro 7 RTX4090 via Lenovo Deutschland | i9-13900HX 185 W / 130 W | GeForce RTX 4090 Laptop GPU 175 W 1455 / 2250 MHz 16 GB | 32 GB | 53 |
| MSI Titan GT77 HX 13VI via Intel Deutschland | i9-13950HX 220 W / 150 W | GeForce RTX 4090 Laptop GPU 175 W 2340 / 2250 MHz 16 GB | 64 GB | 53.3 |
| Asus ROG Strix Scar 17 G733PYV-LL053X via AMD | R9 7945HX3D 115 W / 100 W | GeForce RTX 4090 Laptop GPU 175 W 2040 / 2250 MHz 16 GB | 32 GB | 53.4 |
| Schenker XMG Neo 16 (Early 24) via Schenker Technologies | i9-14900HX 205 W / 205 W | GeForce RTX 4090 Laptop GPU 175 W 2040 / 2250 MHz 16 GB | 32 GB | 54 |
| Razer Blade 18 2024 RZ09-0509 via Razer | i9-14900HX 138 W / 117 W | GeForce RTX 4090 Laptop GPU 175 W 1455 / 2250 MHz 16 GB | 32 GB | 54.1 |
| Lenovo Legion 9 16IRX9, RTX 4090 via Lenovo | i9-14900HX | GeForce RTX 4090 Laptop GPU 175 W 16 GB | 64 GB | 55.32 |
| Schenker XMG Neo 16 E23 | i9-13900HX 160 W / 160 W | GeForce RTX 4090 Laptop GPU 175 W 2040 / 2250 MHz 16 GB | 32 GB | 57 |
| Aorus 17X AZF via Gigabyte Aorus Deutschland | i9-13900HX 157 W / 86 W | GeForce RTX 4090 Laptop GPU 175 W 2040 / 2250 MHz 16 GB | 32 GB | 57 |
| MSI Titan 18 HX A14VIG via MSI | i9-14900HX 238 W / 176 W | GeForce RTX 4090 Laptop GPU 175 W 1555 / 2250 MHz 16 GB | 128 GB | 57.3 |
| Asus ROG Zephyrus M16 GU604VY-NM042X via Asus | i9-13900H 140 W / 100 W | GeForce RTX 4090 Laptop GPU 150 W 16 GB | 64 GB | 57.5 |
| Eurocom Raptor X17 via Eurocom | i9-13900HX 155 W / 110 W | GeForce RTX 4090 Laptop GPU 175 W 2040 / 2250 MHz 16 GB | 64 GB | 60.8 |
| Eurocom Raptor X17 Core i9-14900HX via Eurocom | i9-14900HX 93 W / 63 W | GeForce RTX 4090 Laptop GPU 175 W 2040 / 2250 MHz 16 GB | 32 GB | 61.6 |
| Schenker Key 17 Pro (Early 23) via Schenker Technologies | i9-13900HX 162 W / 135 W | GeForce RTX 4090 Laptop GPU 175 W 2040 / 2250 MHz 16 GB | 32 GB | 62 |
| GPU TDP 125 W | TDP 150 W | TDP 175 W |
|---|---|---|
| 91% | 100% | 93% |
| Model | CPU | GPU | RAM | Value |
|---|---|---|---|---|
| Acer Predator Helios 18 PH18-72-98MW via Acer Deutschland | i9-14900HX 157 W / 95 W | GeForce RTX 4090 Laptop GPU 175 W 1590 / 2250 MHz 16 GB | 32 GB | 1950 |
| Asus ROG Strix Scar 18 G834JYR (2024) via Asus Deutschland | i9-14900HX 120 W / 110 W | GeForce RTX 4090 Laptop GPU 175 W 1455 / 2250 MHz 16 GB | 32 GB | 2025 |
| Medion Erazer Beast X40 2024 via Medion DE | i9-14900HX 160 W / 160 W | GeForce RTX 4090 Laptop GPU 175 W 2040 / 2250 MHz 16 GB | 32 GB | 2055 |
| Lenovo Legion Pro 7 RTX4090 via Lenovo Deutschland | i9-13900HX 185 W / 130 W | GeForce RTX 4090 Laptop GPU 175 W 1455 / 2250 MHz 16 GB | 32 GB | 2130 |
| Aorus 17X AZF via Gigabyte Aorus Deutschland | i9-13900HX 157 W / 86 W | GeForce RTX 4090 Laptop GPU 175 W 2040 / 2250 MHz 16 GB | 32 GB | 2145 |
| Schenker XMG Neo 16 E23 | i9-13900HX 160 W / 160 W | GeForce RTX 4090 Laptop GPU 175 W 2040 / 2250 MHz 16 GB | 32 GB | 2235 |
| Schenker XMG Neo 16 (Early 24) via Schenker Technologies | i9-14900HX 205 W / 205 W | GeForce RTX 4090 Laptop GPU 175 W 2040 / 2250 MHz 16 GB | 32 GB | 2235 |
 - Average benchmark values
* Smaller numbers mean a higher performance
Game Benchmarks
The following benchmarks stem from our benchmarks of review laptops. The performance depends on the used graphics memory, clock rate, processor, system settings, drivers, and operating systems. So the results don't have to be representative for all laptops with this GPU. For detailed information on the benchmark results, click on the fps number.

007 First Light
2026AMD Ryzen 9 7945HX 2.5GHz
GeForce RTX 4090 Laptop GPU
min: 23.6 fps, P0.1: 35.5 fps, P1: 57.1 fps, max: 118.8 fps
AMD Ryzen 9 7945HX 2.5GHz
GeForce RTX 4090 Laptop GPU
min: 18.3 fps, P0.1: 43.3 fps, P1: 57.5 fps, max: 78.9 fps
AMD Ryzen 9 7945HX 2.5GHz
GeForce RTX 4090 Laptop GPU
min: 30 fps, P0.1: 30.4 fps, P1: 31.5 fps, max: 41 fps
AMD Ryzen 9 7945HX 2.5GHz
GeForce RTX 4090 Laptop GPU
min: 34.5 fps, P0.1: 40.3 fps, P1: 56.2 fps, max: 72.5 fps
AMD Ryzen 9 7945HX 2.5GHz
GeForce RTX 4090 Laptop GPU
min: 28.8 fps, P0.1: 35.6 fps, P1: 51.3 fps, max: 108.2 fps

Forza Horizon 6
2026AMD Ryzen 9 7945HX 2.5GHz
GeForce RTX 4090 Laptop GPU
P0.1: 59 fpsP1: 69 fps
AMD Ryzen 9 7945HX 2.5GHz
GeForce RTX 4090 Laptop GPU
P0.1: 41 fpsP1: 47 fps
AMD Ryzen 9 7945HX 2.5GHz
GeForce RTX 4090 Laptop GPU
P0.1: 29 fpsP1: 36 fps
AMD Ryzen 9 7945HX 2.5GHz
GeForce RTX 4090 Laptop GPU
P0.1: 27 fpsP1: 28 fps

War Thunder
2026AMD Ryzen 9 7945HX 2.5GHz
GeForce RTX 4090 Laptop GPU
min: 87 fps
AMD Ryzen 9 7945HX 2.5GHz
GeForce RTX 4090 Laptop GPU
min: 67 fps
AMD Ryzen 9 7945HX 2.5GHz
GeForce RTX 4090 Laptop GPU
min: 39.4 fps

Pragmata
2026AMD Ryzen 9 7945HX 2.5GHz
GeForce RTX 4090 Laptop GPU
min: 42.3 fps, P0.1: 53.3 fps, P1: 66.7 fps, max: 154.3 fps
AMD Ryzen 9 7945HX 2.5GHz
GeForce RTX 4090 Laptop GPU
min: 37.5 fps, P0.1: 42.4 fps, P1: 50.2 fps, max: 119.1 fps
AMD Ryzen 9 7945HX 2.5GHz
GeForce RTX 4090 Laptop GPU
min: 40.1 fps, P0.1: 41.3 fps, P1: 44.5 fps, max: 69.8 fps
AMD Ryzen 9 7945HX 2.5GHz
GeForce RTX 4090 Laptop GPU
min: 37.8 fps, P0.1: 54.6 fps, P1: 65.3 fps, max: 98.3 fps
AMD Ryzen 9 7945HX 2.5GHz
GeForce RTX 4090 Laptop GPU
min: 37.9 fps, P0.1: 54.5 fps, P1: 70 fps, max: 143.5 fps

Death Stranding 2
2026AMD Ryzen 9 7945HX 2.5GHz
GeForce RTX 4090 Laptop GPU
min: 37.6 fps, P0.1: 70.1 fps, P1: 74.4 fps, max: 109 fps
AMD Ryzen 9 7945HX 2.5GHz
GeForce RTX 4090 Laptop GPU
min: 59.1 fps, P0.1: 61.2 fps, P1: 63.4 fps, max: 76.1 fps
AMD Ryzen 9 7945HX 2.5GHz
GeForce RTX 4090 Laptop GPU
min: 35.6 fps, P0.1: 36.9 fps, P1: 39.1 fps, max: 48.8 fps
AMD Ryzen 9 7945HX 2.5GHz
GeForce RTX 4090 Laptop GPU
min: 34 fps, P0.1: 55.8 fps, P1: 59.3 fps, max: 73.3 fps
AMD Ryzen 9 7945HX 2.5GHz
GeForce RTX 4090 Laptop GPU
min: 66.8 fps, P0.1: 69.2 fps, P1: 71.6 fps, max: 105 fps

Crimson Desert
2026AMD Ryzen 9 7945HX 2.5GHz
GeForce RTX 4090 Laptop GPU
min: 26.7 fps, P0.1: 37.8 fps, P1: 40 fps, max: 163 fps
AMD Ryzen 9 7945HX 2.5GHz
GeForce RTX 4090 Laptop GPU
min: 22.9 fps, P0.1: 26.6 fps, P1: 32 fps, max: 162.1 fps
AMD Ryzen 9 7945HX 2.5GHz
GeForce RTX 4090 Laptop GPU
min: 31.9 fps, P0.1: 32 fps, P1: 32 fps, max: 55.3 fps
AMD Ryzen 9 7945HX 2.5GHz
GeForce RTX 4090 Laptop GPU
min: 14.5 fps, P0.1: 20.5 fps, P1: 26.7 fps, max: 80.8 fps
AMD Ryzen 9 7945HX 2.5GHz
GeForce RTX 4090 Laptop GPU
min: 31.9 fps, P0.1: 32 fps, P1: 39.9 fps, max: 163.3 fps

AMD Ryzen 9 7945HX 2.5GHz
GeForce RTX 4090 Laptop GPU
min: 39.9 fps, P0.1: 42.8 fps, P1: 46.8 fps, max: 94.8 fps
AMD Ryzen 9 7945HX 2.5GHz
GeForce RTX 4090 Laptop GPU
min: 35.6 fps, P0.1: 38 fps, P1: 47.5 fps, max: 61.1 fps
AMD Ryzen 9 7945HX 2.5GHz
GeForce RTX 4090 Laptop GPU
min: 25.2 fps, P0.1: 25.3 fps, P1: 25.8 fps, max: 31.7 fps

AMD Ryzen 9 7945HX 2.5GHz
GeForce RTX 4090 Laptop GPU
P1: 60 fps
AMD Ryzen 9 7945HX 2.5GHz
GeForce RTX 4090 Laptop GPU
P1: 40 fps
AMD Ryzen 9 7945HX 2.5GHz
GeForce RTX 4090 Laptop GPU
P1: 20 fps

Anno 117: Pax Romana
2025AMD Ryzen 9 7945HX 2.5GHz
GeForce RTX 4090 Laptop GPU
AMD Ryzen 9 7945HX 2.5GHz
GeForce RTX 4090 Laptop GPU
AMD Ryzen 9 7945HX 2.5GHz
GeForce RTX 4090 Laptop GPU
AMD Ryzen 9 7945HX 2.5GHz
GeForce RTX 4090 Laptop GPU
AMD Ryzen 9 7945HX 2.5GHz
GeForce RTX 4090 Laptop GPU

ARC Raiders
2025AMD Ryzen 9 7945HX 2.5GHz
GeForce RTX 4090 Laptop GPU
min: 45.5 fps, P0.1: 129.7 fps, P1: 164.5 fps, max: 315 fps
AMD Ryzen 9 7945HX 2.5GHz
GeForce RTX 4090 Laptop GPU
min: 99.7 fps, P0.1: 145.4 fps, P1: 161.5 fps, max: 266 fps
AMD Ryzen 9 7945HX 2.5GHz
GeForce RTX 4090 Laptop GPU
min: 125.3 fps, P0.1: 143.6 fps, P1: 156.4 fps, max: 233 fps
AMD Ryzen 9 7945HX 2.5GHz
GeForce RTX 4090 Laptop GPU
min: 106.8 fps, P0.1: 107.3 fps, P1: 109.3 fps, max: 126.5 fps
AMD Ryzen 9 7945HX 2.5GHz
GeForce RTX 4090 Laptop GPU
min: 80.3 fps, P0.1: 81.1 fps, P1: 82.8 fps, max: 93.5 fps
AMD Ryzen 9 7945HX 2.5GHz
GeForce RTX 4090 Laptop GPU
min: 43.9 fps, P0.1: 46.2 fps, P1: 47.3 fps, max: 52.5 fps

The Outer Worlds 2
2025AMD Ryzen 9 7945HX 2.5GHz
GeForce RTX 4090 Laptop GPU
min: 39.4 fps, P0.1: 45.2 fps, P1: 65.9 fps, max: 88.7 fps
AMD Ryzen 9 7945HX 2.5GHz
GeForce RTX 4090 Laptop GPU
min: 42.8 fps, P0.1: 43 fps, P1: 44.5 fps, max: 59.1 fps
AMD Ryzen 9 7945HX 2.5GHz
GeForce RTX 4090 Laptop GPU
min: 23.2 fps, P0.1: 23.2 fps, P1: 23.8 fps, max: 30.2 fps
AMD Ryzen 9 7945HX 2.5GHz
GeForce RTX 4090 Laptop GPU
min: 27.4 fps, P0.1: 30.1 fps, P1: 34.5 fps, max: 53 fps

Battlefield 6
2025AMD Ryzen 9 7945HX 2.5GHz
GeForce RTX 4090 Laptop GPU
min: 63 fps, P0.1: 76.6 fps, P1: 92 fps, max: 153.7 fps
AMD Ryzen 9 7945HX 2.5GHz
GeForce RTX 4090 Laptop GPU
min: 26.7 fps, P0.1: 60.4 fps, P1: 69.8 fps, max: 107.9 fps
AMD Ryzen 9 7945HX 2.5GHz
GeForce RTX 4090 Laptop GPU
min: 22.4 fps, P0.1: 37.3 fps, P1: 42.2 fps, max: 62.8 fps
AMD Ryzen 9 7945HX 2.5GHz
GeForce RTX 4090 Laptop GPU
min: 27.9 fps, P0.1: 63.8 fps, P1: 83.2 fps, max: 138.2 fps

Borderlands 4
2025AMD Ryzen 9 7945HX 2.5GHz
GeForce RTX 4090 Laptop GPU
min: 47.2 fps, P0.1: 51 fps, P1: 62.3 fps, max: 101.3 fps
AMD Ryzen 9 7945HX 2.5GHz
GeForce RTX 4090 Laptop GPU
min: 49.7 fps, P0.1: 52 fps, P1: 56.3 fps, max: 90.2 fps
AMD Ryzen 9 7945HX 2.5GHz
GeForce RTX 4090 Laptop GPU
min: 24.3 fps, P0.1: 35.1 fps, P1: 40.8 fps, max: 73.7 fps
AMD Ryzen 9 7945HX 2.5GHz
GeForce RTX 4090 Laptop GPU
min: 11.1 fps, P0.1: 16.4 fps, P1: 25.1 fps, max: 58.5 fps

F1 25
20251246724
AMD Ryzen 9 7945HX 2.5GHz
GeForce RTX 4090 Laptop GPU
min: 67 fps, P1: 154 fps, max: 408 fps
1246724
AMD Ryzen 9 7945HX 2.5GHz
GeForce RTX 4090 Laptop GPU
min: 52 fps, P1: 147 fps, max: 375 fps
1246724
AMD Ryzen 9 7945HX 2.5GHz
GeForce RTX 4090 Laptop GPU
min: 69 fps, P1: 141 fps, max: 370 fps
1246724
AMD Ryzen 9 7945HX 2.5GHz
GeForce RTX 4090 Laptop GPU
min: 25 fps, P1: 34 fps, max: 221 fps
1246724
AMD Ryzen 9 7945HX 2.5GHz
GeForce RTX 4090 Laptop GPU
min: 18 fps, P1: 20 fps, max: 108 fps
1246724
AMD Ryzen 9 7945HX 2.5GHz
GeForce RTX 4090 Laptop GPU
min: 9 fps, P1: 9 fps, max: 106 fps
1246724
AMD Ryzen 9 7945HX 2.5GHz
GeForce RTX 4090 Laptop GPU
min: 17 fps, P1: 18 fps, max: 60 fps
1246724
AMD Ryzen 9 7945HX 2.5GHz
GeForce RTX 4090 Laptop GPU
min: 35 fps, P1: 38 fps, max: 111 fps
AMD Ryzen 9 7945HX 2.5GHz
GeForce RTX 4090 Laptop GPU
min: 34 fps, P1: 77 fps, max: 155 fps

Doom: The Dark Ages
2025AMD Ryzen 9 7945HX 2.5GHz
GeForce RTX 4090 Laptop GPU
min: 84.6 fps, P0.1: 86 fps, P1: 92.3 fps, max: 179.8 fps
AMD Ryzen 9 7945HX 2.5GHz
GeForce RTX 4090 Laptop GPU
min: 18.1 fps, P0.1: 83.4 fps, P1: 89.1 fps, max: 396 fps
AMD Ryzen 9 7945HX 2.5GHz
GeForce RTX 4090 Laptop GPU
min: 69.6 fps, P0.1: 75.9 fps, P1: 83.7 fps, max: 151.8 fps
AMD Ryzen 9 7945HX 2.5GHz
GeForce RTX 4090 Laptop GPU
min: 57.9 fps, P0.1: 62.1 fps, P1: 70.9 fps, max: 151.9 fps
AMD Ryzen 9 7945HX 2.5GHz
GeForce RTX 4090 Laptop GPU
min: 49.7 fps, P0.1: 54.1 fps, P1: 60.5 fps, max: 87.8 fps
AMD Ryzen 9 7945HX 2.5GHz
GeForce RTX 4090 Laptop GPU
min: 30.5 fps, P0.1: 31.3 fps, P1: 33.4 fps, max: 45.7 fps
AMD Ryzen 9 7945HX 2.5GHz
GeForce RTX 4090 Laptop GPU
min: 46 fps, P0.1: 46.1 fps, P1: 48.3 fps, max: 69.1 fps
AMD Ryzen 9 7945HX 2.5GHz
GeForce RTX 4090 Laptop GPU
min: 55.1 fps, P0.1: 59.2 fps, P1: 67.4 fps, max: 131 fps

AMD Ryzen 9 7945HX 2.5GHz
GeForce RTX 4090 Laptop GPU
min: 19.1 fps, P0.1: 23.7 fps, P1: 43.1 fps, max: 72.6 fps
AMD Ryzen 9 7945HX 2.5GHz
GeForce RTX 4090 Laptop GPU
min: 20.2 fps, P0.1: 21.5 fps, P1: 35.3 fps, max: 52.3 fps
AMD Ryzen 9 7945HX 2.5GHz
GeForce RTX 4090 Laptop GPU
min: 10.8 fps, P0.1: 13.9 fps, P1: 22.2 fps, max: 30.9 fps
AMD Ryzen 9 7945HX 2.5GHz
GeForce RTX 4090 Laptop GPU
min: 20.5 fps, P0.1: 23.3 fps, P1: 44.2 fps, max: 66.2 fps

Intel Core i9-14900HX 1.6GHz
GeForce RTX 4090 Laptop GPU
min: 46 fps, P0.1: 72 fps, P1: 86 fps, max: 158 fps
Intel Core i9-14900HX 1.6GHz
GeForce RTX 4090 Laptop GPU
min: 64 fps, P0.1: 73 fps, P1: 79 fps, max: 132 fps
Intel Core i9-14900HX 1.6GHz
GeForce RTX 4090 Laptop GPU
min: 23 fps, P0.1: 49 fps, P1: 65 fps, max: 145 fps
AMD Ryzen 9 7945HX3D 2.3GHz
GeForce RTX 4090 Laptop GPU
Intel Core i9-14900HX 1.6GHz
GeForce RTX 4090 Laptop GPU
min: 40 fps, P0.1: 44 fps, P1: 46 fps, max: 119 fps
Intel Core i9-14900HX 1.6GHz
GeForce RTX 4090 Laptop GPU
min: 16 fps, P0.1: 21 fps, P1: 34 fps, max: 129 fps
AMD Ryzen 9 7945HX3D 2.3GHz
GeForce RTX 4090 Laptop GPU
Intel Core i9-14900HX 1.6GHz
GeForce RTX 4090 Laptop GPU
min: 10 fps, P0.1: 35 fps, P1: 40 fps, max: 62 fps
Intel Core i9-14900HX 1.6GHz
GeForce RTX 4090 Laptop GPU
min: 20 fps, P0.1: 22 fps, P1: 30 fps, max: 122 fps
Intel Core i9-14900HX 1.6GHz
GeForce RTX 4090 Laptop GPU
min: 10 fps, P0.1: 18 fps, P1: 25 fps, max: 93 fps
AMD Ryzen 9 7945HX3D 2.3GHz
GeForce RTX 4090 Laptop GPU
AMD Ryzen 9 7945HX3D 2.3GHz
GeForce RTX 4090 Laptop GPU
AMD Ryzen 9 7945HX3D 2.3GHz
GeForce RTX 4090 Laptop GPU
Intel Core i9-14900HX 1.6GHz
GeForce RTX 4090 Laptop GPU
min: 21 fps, P0.1: 24 fps, P1: 36 fps, max: 123 fps
Intel Core i9-14900HX 1.6GHz
GeForce RTX 4090 Laptop GPU
min: 46 fps, P0.1: 47 fps, P1: 48 fps, max: 77 fps
AMD Ryzen 9 7945HX3D 2.3GHz
GeForce RTX 4090 Laptop GPU
Intel Core i9-14900HX 1.6GHz
GeForce RTX 4090 Laptop GPU
min: 60 fps, P0.1: 65 fps, P1: 76 fps, max: 117 fps
Intel Core i9-14900HX 1.6GHz
GeForce RTX 4090 Laptop GPU
min: 67 fps, P0.1: 70 fps, P1: 74 fps, max: 110 fps
AMD Ryzen 9 7945HX3D 2.3GHz
GeForce RTX 4090 Laptop GPU

Civilization 7
2025AMD Ryzen 9 7945HX 2.5GHz
GeForce RTX 4090 Laptop GPU
min: 28.1 fps, P0.1: 34.6 fps, P1: 39.9 fps, max: 338 fps
AMD Ryzen 9 7945HX 2.5GHz
GeForce RTX 4090 Laptop GPU
min: 26.1 fps, P0.1: 34.8 fps, P1: 40.6 fps, max: 321 fps
AMD Ryzen 9 7945HX 2.5GHz
GeForce RTX 4090 Laptop GPU
min: 28.8 fps, P0.1: 35.5 fps, P1: 40.8 fps, max: 310 fps

Monster Hunter Wilds
2025AMD Ryzen 9 7945HX 2.5GHz
GeForce RTX 4090 Laptop GPU
AMD Ryzen 9 7945HX 2.5GHz
GeForce RTX 4090 Laptop GPU
AMD Ryzen 9 7945HX 2.5GHz
GeForce RTX 4090 Laptop GPU
AMD Ryzen 9 7945HX3D 2.3GHz
GeForce RTX 4090 Laptop GPU
AMD Ryzen 9 7945HX 2.5GHz
GeForce RTX 4090 Laptop GPU
AMD Ryzen 9 7945HX3D 2.3GHz
GeForce RTX 4090 Laptop GPU
AMD Ryzen 9 7945HX 2.5GHz
GeForce RTX 4090 Laptop GPU
AMD Ryzen 9 7945HX3D 2.3GHz
GeForce RTX 4090 Laptop GPU
AMD Ryzen 9 7945HX 2.5GHz
GeForce RTX 4090 Laptop GPU
AMD Ryzen 9 7945HX3D 2.3GHz
GeForce RTX 4090 Laptop GPU
AMD Ryzen 9 7945HX 2.5GHz
GeForce RTX 4090 Laptop GPU
AMD Ryzen 9 7945HX3D 2.3GHz
GeForce RTX 4090 Laptop GPU

AMD Ryzen 9 7945HX 2.5GHz
GeForce RTX 4090 Laptop GPU
min: 71.1 fps, P0.1: 78.7 fps, P1: 90.1 fps, max: 145.6 fps
AMD Ryzen 9 7945HX 2.5GHz
GeForce RTX 4090 Laptop GPU
min: 72.6 fps, P0.1: 75.1 fps, P1: 76.3 fps, max: 104.9 fps
AMD Ryzen 9 7945HX 2.5GHz
GeForce RTX 4090 Laptop GPU
min: 40.2 fps, P0.1: 42.7 fps, P1: 44.3 fps, max: 54.3 fps
AMD Ryzen 9 7945HX 2.5GHz
GeForce RTX 4090 Laptop GPU
min: 54.5 fps, P0.1: 60.6 fps, P1: 62.8 fps, max: 83.7 fps
AMD Ryzen 9 7945HX 2.5GHz
GeForce RTX 4090 Laptop GPU
min: 54.1 fps, P0.1: 76.4 fps, P1: 89.6 fps, max: 138.2 fps

Intel Core i9-13900HX 1.6GHz
GeForce RTX 4090 Laptop GPU
min: 85.1 fps, P0.1: 102.5 fps, P1: 104.3 fps, max: 283 fps
Intel Core i9-13900HX 1.6GHz
GeForce RTX 4090 Laptop GPU
min: 84.4 fps, P0.1: 86.6 fps, P1: 93.1 fps, max: 275 fps
Intel Core i9-14900HX 1.6GHz
GeForce RTX 4090 Laptop GPU
P0.1: 61.4 fpsP1: 86.7 fps
Intel Core i9-14900HX 1.6GHz
GeForce RTX 4090 Laptop GPU
P0.1: 58.8 fpsP1: 85.6 fps
Intel Core i9-13900HX 1.6GHz
GeForce RTX 4090 Laptop GPU
min: 68.8 fps, P0.1: 77.2 fps, P1: 84.8 fps, max: 265 fps
AMD Ryzen 9 7945HX3D 2.3GHz
GeForce RTX 4090 Laptop GPU
Intel Core i9-13900HX 1.6GHz
GeForce RTX 4090 Laptop GPU
min: 73.9 fps, P0.1: 75.3 fps, P1: 82 fps, max: 243 fps
Intel Core i9-14900HX 1.6GHz
GeForce RTX 4090 Laptop GPU
P0.1: 54 fpsP1: 66.7 fps
Intel Core i9-14900HX 1.6GHz
GeForce RTX 4090 Laptop GPU
P0.1: 44.5 fpsP1: 67.9 fps
AMD Ryzen 9 7945HX3D 2.3GHz
GeForce RTX 4090 Laptop GPU
Intel Core i9-14900HX 1.6GHz
GeForce RTX 4090 Laptop GPU
P0.1: 37.4 fpsP1: 46.3 fps
Intel Core i9-13900HX 1.6GHz
GeForce RTX 4090 Laptop GPU
min: 50.7 fps, P0.1: 51.1 fps, P1: 52.8 fps, max: 68.9 fps
AMD Ryzen 9 7945HX3D 2.3GHz
GeForce RTX 4090 Laptop GPU
Intel Core i9-14900HX 1.6GHz
GeForce RTX 4090 Laptop GPU
P0.1: 45.6 fpsP1: 49.9 fps
Intel Core i9-14900HX 1.6GHz
GeForce RTX 4090 Laptop GPU
P0.1: 53.7 fpsP1: 77.1 fps
AMD Ryzen 9 7945HX3D 2.3GHz
GeForce RTX 4090 Laptop GPU
AMD Ryzen 9 7945HX3D 2.3GHz
GeForce RTX 4090 Laptop GPU
Intel Core i9-14900HX 1.6GHz
GeForce RTX 4090 Laptop GPU
P0.1: 31.3 fpsP1: 33 fps
Intel Core i9-13900HX 1.6GHz
GeForce RTX 4090 Laptop GPU
min: 32.1 fps, P0.1: 43.1 fps, P1: 58.6 fps, max: 311 fps

Marvel Rivals
20241.1.2943358
AMD Ryzen 9 7945HX 2.5GHz
GeForce RTX 4090 Laptop GPU
min: 88 fps, P1: 97.06 fps, max: 194 fps
1.1.2943358
AMD Ryzen 9 7945HX 2.5GHz
GeForce RTX 4090 Laptop GPU
min: 81 fps, P1: 89.47 fps, max: 168 fps
1.1.2943358
AMD Ryzen 9 7945HX 2.5GHz
GeForce RTX 4090 Laptop GPU
min: 64 fps, P1: 73.21 fps, max: 138 fps
1.1.2943358
AMD Ryzen 9 7945HX 2.5GHz
GeForce RTX 4090 Laptop GPU
min: 56 fps, P1: 64.9 fps, max: 116 fps
1.1.2943358
AMD Ryzen 9 7945HX 2.5GHz
GeForce RTX 4090 Laptop GPU
min: 56 fps, P1: 57.27 fps, max: 93 fps

Stalker 2
2024AMD Ryzen 9 7945HX 2.5GHz
GeForce RTX 4090 Laptop GPU
min: 27.4 fps, P0.1: 29.8 fps, P1: 40.5 fps, max: 93.8 fps
AMD Ryzen 9 7945HX 2.5GHz
GeForce RTX 4090 Laptop GPU
min: 18.1 fps, P0.1: 27.3 fps, P1: 36.4 fps, max: 90.8 fps
AMD Ryzen 9 7945HX 2.5GHz
GeForce RTX 4090 Laptop GPU
min: 21.2 fps, P0.1: 21.5 fps, P1: 26.2 fps, max: 77.9 fps
AMD Ryzen 9 7945HX 2.5GHz
GeForce RTX 4090 Laptop GPU
min: 33.2 fps, P0.1: 35.3 fps, P1: 51.6 fps, max: 155.2 fps
AMD Ryzen 9 7945HX 2.5GHz
GeForce RTX 4090 Laptop GPU
min: 32.3 fps, P0.1: 44.2 fps, P1: 63.1 fps, max: 299 fps
AMD Ryzen 9 7945HX 2.5GHz
GeForce RTX 4090 Laptop GPU
min: 28 fps, P0.1: 29.2 fps, P1: 42.1 fps, max: 92 fps

Intel Core i9-14900HX 1.6GHz
GeForce RTX 4090 Laptop GPU
P1: 94 fps
AMD Ryzen 9 7945HX3D 2.3GHz
GeForce RTX 4090 Laptop GPU
AMD Ryzen 9 7945HX 2.5GHz
GeForce RTX 4090 Laptop GPU
P1: 64 fps
Intel Core i9-14900HX 1.6GHz
GeForce RTX 4090 Laptop GPU
P1: 74 fps
AMD Ryzen 9 7945HX3D 2.3GHz
GeForce RTX 4090 Laptop GPU
Intel Core i9-14900HX 1.6GHz
GeForce RTX 4090 Laptop GPU
P1: 49 fps
AMD Ryzen 9 7945HX 2.5GHz
GeForce RTX 4090 Laptop GPU
P1: 56 fps
AMD Ryzen 9 7945HX3D 2.3GHz
GeForce RTX 4090 Laptop GPU
Intel Core i9-14900HX 1.6GHz
GeForce RTX 4090 Laptop GPU
P1: 50 fps
AMD Ryzen 9 7945HX 2.5GHz
GeForce RTX 4090 Laptop GPU
P1: 55 fps
AMD Ryzen 9 7945HX3D 2.3GHz
GeForce RTX 4090 Laptop GPU
AMD Ryzen 9 7945HX 2.5GHz
GeForce RTX 4090 Laptop GPU
P1: 52 fps
Intel Core i9-14900HX 1.6GHz
GeForce RTX 4090 Laptop GPU
P1: 82 fps
AMD Ryzen 9 7945HX3D 2.3GHz
GeForce RTX 4090 Laptop GPU
AMD Ryzen 9 7945HX 2.5GHz
GeForce RTX 4090 Laptop GPU
P1: 98 fps
AMD Ryzen 9 7945HX 2.5GHz
GeForce RTX 4090 Laptop GPU
P1: 95 fps

Until Dawn
2024Intel Core i9-13900HX 1.6GHz
GeForce RTX 4090 Laptop GPU
min: 45.4 fps, P0.1: 85.1 fps, P1: 96 fps, max: 211 fps
Intel Core i9-13900HX 1.6GHz
GeForce RTX 4090 Laptop GPU
min: 41 fps, P0.1: 50.1 fps, P1: 88.8 fps, max: 226 fps
Intel Core i9-13900HX 1.6GHz
GeForce RTX 4090 Laptop GPU
min: 23.3 fps, P0.1: 33.8 fps, P1: 67.3 fps, max: 199 fps
Intel Core i9-13900HX 1.6GHz
GeForce RTX 4090 Laptop GPU
min: 29.3 fps, P0.1: 37 fps, P1: 58.2 fps, max: 174.2 fps
Intel Core i9-13900HX 1.6GHz
GeForce RTX 4090 Laptop GPU
min: 28.7 fps, P0.1: 38.4 fps, P1: 45.8 fps, max: 128.5 fps
Intel Core i9-13900HX 1.6GHz
GeForce RTX 4090 Laptop GPU
min: 23.7 fps, P0.1: 24.7 fps, P1: 30.5 fps, max: 68.8 fps
Intel Core i9-13900HX 1.6GHz
GeForce RTX 4090 Laptop GPU
min: 16.4 fps, P0.1: 28.6 fps, P1: 41.3 fps, max: 101.5 fps
Intel Core i9-13900HX 1.6GHz
GeForce RTX 4090 Laptop GPU
min: 31.7 fps, P0.1: 34.3 fps, P1: 62.4 fps, max: 170 fps

EA Sports FC 25
2024Intel Core i9-13900HX 1.6GHz
GeForce RTX 4090 Laptop GPU
min: 52.2 fps, P0.1: 148.1 fps, P1: 177.2 fps, max: 324 fps
Intel Core i9-13900HX 1.6GHz
GeForce RTX 4090 Laptop GPU
min: 75.3 fps, P0.1: 103.2 fps, P1: 123.7 fps, max: 216 fps
Intel Core i9-13900HX 1.6GHz
GeForce RTX 4090 Laptop GPU
min: 52.6 fps, P0.1: 82.9 fps, P1: 121.6 fps, max: 221 fps
Intel Core i9-13900HX 1.6GHz
GeForce RTX 4090 Laptop GPU
min: 47.4 fps, P0.1: 86.4 fps, P1: 114.6 fps, max: 187.2 fps
Intel Core i9-13900HX 1.6GHz
GeForce RTX 4090 Laptop GPU
min: 40 fps, P0.1: 76.3 fps, P1: 97.9 fps, max: 171.6 fps

God of War Ragnarök
2024Intel Core i9-13900HX 1.6GHz
GeForce RTX 4090 Laptop GPU
min: 50 fps, P0.1: 156 fps, P1: 181.3 fps, max: 378 fps
Intel Core i9-13900HX 1.6GHz
GeForce RTX 4090 Laptop GPU
min: 138 fps, P0.1: 154 fps, P1: 167.7 fps, max: 290 fps
Intel Core i9-13900HX 1.6GHz
GeForce RTX 4090 Laptop GPU
min: 105.3 fps, P0.1: 139.4 fps, P1: 152.4 fps, max: 260 fps
Intel Core i9-13900HX 1.6GHz
GeForce RTX 4090 Laptop GPU
min: 116.1 fps, P0.1: 131.4 fps, P1: 141.5 fps, max: 247 fps
Intel Core i9-13900HX 1.6GHz
GeForce RTX 4090 Laptop GPU
min: 79.1 fps, P0.1: 97.7 fps, P1: 108.3 fps, max: 192 fps
AMD Ryzen 9 7945HX 2.5GHz
GeForce RTX 4090 Laptop GPU
min: 49.4 fps, P0.1: 83.8 fps, P1: 91.6 fps, max: 246 fps
Intel Core i9-13900HX 1.6GHz
GeForce RTX 4090 Laptop GPU
min: 55.8 fps, P0.1: 63.5 fps, P1: 67.5 fps, max: 85.8 fps
AMD Ryzen 9 7945HX 2.5GHz
GeForce RTX 4090 Laptop GPU
min: 57.3 fps, P0.1: 72.1 fps, P1: 74.8 fps, max: 136.1 fps
Intel Core i9-13900HX 1.6GHz
GeForce RTX 4090 Laptop GPU
min: 67.3 fps, P0.1: 93.4 fps, P1: 99.4 fps, max: 214 fps
AMD Ryzen 9 7945HX 2.5GHz
GeForce RTX 4090 Laptop GPU
min: 75.1 fps, P0.1: 95.1 fps, P1: 102.1 fps, max: 218 fps
Intel Core i9-13900HX 1.6GHz
GeForce RTX 4090 Laptop GPU
min: 112.6 fps, P0.1: 128.3 fps, P1: 144 fps, max: 230 fps
AMD Ryzen 9 7945HX 2.5GHz
GeForce RTX 4090 Laptop GPU
min: 66.6 fps, P0.1: 71.2 fps, P1: 90 fps, max: 284 fps

Final Fantasy XVI
2024Intel Core i9-13900HX 1.6GHz
GeForce RTX 4090 Laptop GPU
min: 47.3 fps, P0.1: 58.7 fps, P1: 89.3 fps, max: 168.1 fps
Intel Core i9-13900HX 1.6GHz
GeForce RTX 4090 Laptop GPU
min: 53.7 fps, P0.1: 69.4 fps, P1: 88.5 fps, max: 160.9 fps
Intel Core i9-13900HX 1.6GHz
GeForce RTX 4090 Laptop GPU
min: 59.3 fps, P0.1: 63.8 fps, P1: 76.1 fps, max: 149.2 fps
Intel Core i9-13900HX 1.6GHz
GeForce RTX 4090 Laptop GPU
min: 49.7 fps, P0.1: 53.2 fps, P1: 72.3 fps, max: 144.1 fps
Intel Core i9-13900HX 1.6GHz
GeForce RTX 4090 Laptop GPU
min: 39.9 fps, P0.1: 42.9 fps, P1: 52.3 fps, max: 100.6 fps
AMD Ryzen 9 7945HX 2.5GHz
GeForce RTX 4090 Laptop GPU
min: 40.4 fps, P0.1: 46.4 fps, P1: 54.7 fps, max: 108.8 fps
Intel Core i9-13900HX 1.6GHz
GeForce RTX 4090 Laptop GPU
min: 27.1 fps, P0.1: 28.3 fps, P1: 32.5 fps, max: 67.1 fps
Intel Core i9-13900HX 1.6GHz
GeForce RTX 4090 Laptop GPU
min: 34.7 fps, P0.1: 40.2 fps, P1: 45.5 fps, max: 83.1 fps
AMD Ryzen 9 7945HX 2.5GHz
GeForce RTX 4090 Laptop GPU
min: 47.9 fps, P0.1: 51.2 fps, P1: 57.9 fps, max: 122.3 fps
Intel Core i9-13900HX 1.6GHz
GeForce RTX 4090 Laptop GPU
min: 46.9 fps, P0.1: 55.1 fps, P1: 68.9 fps, max: 145.3 fps
AMD Ryzen 9 7945HX 2.5GHz
GeForce RTX 4090 Laptop GPU
min: 51.1 fps, P0.1: 53.2 fps, P1: 62.6 fps, max: 120.4 fps

Space Marine 2
2024Intel Core i9-13900HX 1.6GHz
GeForce RTX 4090 Laptop GPU
min: 3.78 fps, P0.1: 10.8 fps, P1: 48.6 fps, max: 98.8 fps
Intel Core i9-13900HX 1.6GHz
GeForce RTX 4090 Laptop GPU
min: 33.1 fps, P0.1: 35.8 fps, P1: 53.5 fps, max: 88.9 fps
Intel Core i9-13900HX 1.6GHz
GeForce RTX 4090 Laptop GPU
min: 20.8 fps, P0.1: 28.6 fps, P1: 45.1 fps, max: 86.4 fps
Intel Core i9-13900HX 1.6GHz
GeForce RTX 4090 Laptop GPU
min: 27.5 fps, P0.1: 34.3 fps, P1: 56.4 fps, max: 84.6 fps
Intel Core i9-13900HX 1.6GHz
GeForce RTX 4090 Laptop GPU
min: 24.1 fps, P0.1: 26 fps, P1: 38.3 fps, max: 82.9 fps
Intel Core i9-13900HX 1.6GHz
GeForce RTX 4090 Laptop GPU
min: 23.4 fps, P0.1: 29.5 fps, P1: 41.5 fps, max: 61.4 fps
Intel Core i9-13900HX 1.6GHz
GeForce RTX 4090 Laptop GPU
min: 25.3 fps, P0.1: 31.8 fps, P1: 52.6 fps, max: 80.2 fps
Intel Core i9-13900HX 1.6GHz
GeForce RTX 4090 Laptop GPU
min: 18.9 fps, P0.1: 27.8 fps, P1: 41.5 fps, max: 83.9 fps

Star Wars Outlaws
2024Intel Core i9-13900HX 1.6GHz
GeForce RTX 4090 Laptop GPU
min: 15 fps, P0.1: 29.2 fps, P1: 55.3 fps, max: 144.6 fps
Intel Core i9-13900HX 1.6GHz
GeForce RTX 4090 Laptop GPU
min: 25.3 fps, P0.1: 31.7 fps, P1: 54.5 fps, max: 146.8 fps
Intel Core i9-13900HX 1.6GHz
GeForce RTX 4090 Laptop GPU
min: 31 fps, P0.1: 33.5 fps, P1: 56.3 fps, max: 143.2 fps
Intel Core i9-13900HX 1.6GHz
GeForce RTX 4090 Laptop GPU
min: 23.9 fps, P0.1: 37.1 fps, P1: 50.5 fps, max: 141.4 fps
Intel Core i9-13900HX 1.6GHz
GeForce RTX 4090 Laptop GPU
min: 25.8 fps, P0.1: 29.6 fps, P1: 46.7 fps, max: 116 fps
Intel Core i9-13900HX 1.6GHz
GeForce RTX 4090 Laptop GPU
min: 26.1 fps, P0.1: 26.6 fps, P1: 27.6 fps, max: 41.4 fps
Intel Core i9-13900HX 1.6GHz
GeForce RTX 4090 Laptop GPU
min: 19.3 fps, P0.1: 37.8 fps, P1: 44.8 fps, max: 112 fps

Black Myth: Wukong
2024AMD Ryzen 9 7945HX 2.5GHz
GeForce RTX 4090 Laptop GPU
min: 85 fps, max: 188 fps
AMD Ryzen 9 7945HX 2.5GHz
GeForce RTX 4090 Laptop GPU
min: 76 fps, max: 144 fps
Intel Core Ultra 9 185H 3.8GHz
GeForce RTX 4090 Laptop GPU
min: 38 fps, max: 80 fps
AMD Ryzen 9 7945HX 2.5GHz
GeForce RTX 4090 Laptop GPU
min: 72 fps, max: 107 fps
Intel Core Ultra 9 185H 3.8GHz
GeForce RTX 4090 Laptop GPU
min: 29 fps, max: 47 fps
Intel Core i9-14900HX 1.6GHz
GeForce RTX 4090 Laptop GPU
min: 8 fps, max: 60 fps
Intel Core i9-14900HX 1.6GHz
GeForce RTX 4090 Laptop GPU
min: 15 fps, max: 63 fps
Intel Core Ultra 9 185H 3.8GHz
GeForce RTX 4090 Laptop GPU
min: 45 fps, max: 29 fps
Intel Core i9-14900HX 1.6GHz
GeForce RTX 4090 Laptop GPU
min: 32 fps, max: 45 fps
AMD Ryzen 9 7945HX 2.5GHz
GeForce RTX 4090 Laptop GPU
min: 34 fps, max: 46 fps
Intel Core i9-14900HX 1.6GHz
GeForce RTX 4090 Laptop GPU
min: 36 fps, max: 48 fps
Intel Core i9-14900HX 1.6GHz
GeForce RTX 4090 Laptop GPU
min: 18 fps, max: 27 fps
AMD Ryzen 9 7945HX 2.5GHz
GeForce RTX 4090 Laptop GPU
min: 19 fps, max: 28 fps
Intel Core i9-14900HX 1.6GHz
GeForce RTX 4090 Laptop GPU
min: 12 fps, max: 29 fps
AMD Ryzen 9 7945HX 2.5GHz
GeForce RTX 4090 Laptop GPU
AMD Ryzen 9 7945HX 2.5GHz
GeForce RTX 4090 Laptop GPU
Intel Core Ultra 9 185H 3.8GHz
GeForce RTX 4090 Laptop GPU
min: 30 fps, max: 53 fps
Intel Core i9-14900HX 1.6GHz
GeForce RTX 4090 Laptop GPU
min: 36 fps, max: 67 fps
Intel Core i9-14900HX 1.6GHz
GeForce RTX 4090 Laptop GPU
min: 47 fps, max: 75 fps
Intel Core i9-14900HX 1.6GHz
GeForce RTX 4090 Laptop GPU
min: 48 fps, max: 81 fps
Intel Core i9-14900HX 1.6GHz
GeForce RTX 4090 Laptop GPU
min: 65 fps, max: 96 fps
Intel Core Ultra 9 185H 3.8GHz
GeForce RTX 4090 Laptop GPU
min: 47 fps, max: 72 fps

Once Human
2024Intel Core i9-13900HX 1.6GHz
GeForce RTX 4090 Laptop GPU
min: 31.7 fps, P0.1: 44.4 fps, P1: 128.2 fps, max: 386 fps
Intel Core i9-13900HX 1.6GHz
GeForce RTX 4090 Laptop GPU
min: 12 fps, P0.1: 29.8 fps, P1: 109.2 fps, max: 331 fps
Intel Core i9-13900HX 1.6GHz
GeForce RTX 4090 Laptop GPU
min: 28.7 fps, P0.1: 42.4 fps, P1: 100 fps, max: 315 fps
Intel Core i9-13900HX 1.6GHz
GeForce RTX 4090 Laptop GPU
min: 26.1 fps, P0.1: 40.4 fps, P1: 74.9 fps, max: 306 fps
Intel Core i9-13900HX 1.6GHz
GeForce RTX 4090 Laptop GPU
min: 17.5 fps, P0.1: 22.6 fps, P1: 35.6 fps, max: 334 fps

The First Descendant
2024Intel Core i9-13900HX 1.6GHz
GeForce RTX 4090 Laptop GPU
min: 51.3 fps, P0.1: 106.6 fps, P1: 134.9 fps, max: 263 fps
Intel Core i9-13900HX 1.6GHz
GeForce RTX 4090 Laptop GPU
min: 83.4 fps, P0.1: 94.2 fps, P1: 121.4 fps, max: 218 fps
Intel Core i9-13900HX 1.6GHz
GeForce RTX 4090 Laptop GPU
min: 46.1 fps, P0.1: 90 fps, P1: 109 fps, max: 179.8 fps
Intel Core i9-13900HX 1.6GHz
GeForce RTX 4090 Laptop GPU
min: 66.2 fps, P0.1: 69.9 fps, P1: 73.5 fps, max: 150.4 fps
Intel Core i9-13900HX 1.6GHz
GeForce RTX 4090 Laptop GPU
min: 38.8 fps, P0.1: 38.8 fps, P1: 41.5 fps, max: 71.5 fps
Intel Core i9-13900HX 1.6GHz
GeForce RTX 4090 Laptop GPU
min: 43.5 fps, P0.1: 43.7 fps, P1: 45 fps, max: 71.8 fps

F1 24
20241122588
Intel Core Ultra 9 185H 3.8GHz
GeForce RTX 4090 Laptop GPU
min: 127 fps, P1: 128 fps, max: 277 fps
1119215
Intel Core i9-14900HX 1.6GHz
GeForce RTX 4090 Laptop GPU
min: 275 fps, P1: 201 fps, max: 408 fps
1122588
Intel Core Ultra 9 185H 3.8GHz
GeForce RTX 4090 Laptop GPU
min: 132 fps, P1: 139 fps, max: 265 fps
1118244
Intel Core i9-14900HX 1.6GHz
GeForce RTX 4090 Laptop GPU
min: 40 fps, P1: 174 fps, max: 402 fps
1119215
Intel Core i9-14900HX 1.6GHz
GeForce RTX 4090 Laptop GPU
min: 291 fps, P1: 221 fps, max: 413 fps
1122588
Intel Core Ultra 9 185H 3.8GHz
GeForce RTX 4090 Laptop GPU
min: 176 fps, P1: 143 fps, max: 251 fps
1119215
Intel Core i9-14900HX 1.6GHz
GeForce RTX 4090 Laptop GPU
min: 239 fps, P1: 183 fps, max: 335 fps
1118244
Intel Core i9-14900HX 1.6GHz
GeForce RTX 4090 Laptop GPU
min: 46 fps, P1: 189 fps, max: 362 fps
1122588
Intel Core Ultra 9 185H 3.8GHz
GeForce RTX 4090 Laptop GPU
min: 55 fps, P1: 58 fps, max: 103 fps
1118244
Intel Core i9-14900HX 1.6GHz
GeForce RTX 4090 Laptop GPU
min: 14 fps, P1: 69 fps, max: 138 fps
1119215
Intel Core i9-14900HX 1.6GHz
GeForce RTX 4090 Laptop GPU
min: 78 fps, P1: 90 fps, max: 147 fps
1222678
AMD Ryzen 9 7945HX3D 2.3GHz
GeForce RTX 4090 Laptop GPU
min: 85 fps, P1: 92 fps, max: 172 fps
1122588
Intel Core Ultra 9 185H 3.8GHz
GeForce RTX 4090 Laptop GPU
min: 49 fps, P1: 47 fps, max: 68 fps
1118244
Intel Core i9-14900HX 1.6GHz
GeForce RTX 4090 Laptop GPU
min: 2 fps, P1: 56 fps, max: 89 fps
1119215
Intel Core i9-14900HX 1.6GHz
GeForce RTX 4090 Laptop GPU
min: 69 fps, P1: 68 fps, max: 100 fps
1222678
AMD Ryzen 9 7945HX3D 2.3GHz
GeForce RTX 4090 Laptop GPU
min: 79 fps, P1: 78 fps, max: 118 fps
1122588
Intel Core Ultra 9 185H 3.8GHz
GeForce RTX 4090 Laptop GPU
min: 25 fps, P1: 24 fps, max: 35 fps
1222678
AMD Ryzen 9 7945HX3D 2.3GHz
GeForce RTX 4090 Laptop GPU
min: 41 fps, P1: 40 fps, max: 59 fps
1122588
Intel Core Ultra 9 185H 3.8GHz
GeForce RTX 4090 Laptop GPU
min: 32 fps, P1: 41 fps, max: 59 fps
1222678
AMD Ryzen 9 7945HX3D 2.3GHz
GeForce RTX 4090 Laptop GPU
min: 70 fps, P1: 68 fps, max: 100 fps
1122588
Intel Core Ultra 9 185H 3.8GHz
GeForce RTX 4090 Laptop GPU
min: 54 fps, P1: 59 fps, max: 103 fps
1119215
Intel Core i9-14900HX 1.6GHz
GeForce RTX 4090 Laptop GPU
min: 76 fps, P1: 87 fps, max: 145 fps
1222678
AMD Ryzen 9 7945HX3D 2.3GHz
GeForce RTX 4090 Laptop GPU
min: 94 fps, P1: 101 fps, max: 178 fps
1119215
Intel Core i9-14900HX 1.6GHz
GeForce RTX 4090 Laptop GPU
min: 78 fps, P1: 85 fps, max: 144 fps

Intel Core i9-13900HX 1.6GHz
GeForce RTX 4090 Laptop GPU
min: 41.4 fps, P0.1: 53.3 fps, P1: 90.7 fps, max: 156.3 fps
Intel Core i9-14900HX 1.6GHz
GeForce RTX 4090 Laptop GPU
min: 72.9 fps, P0.1: 81.2 fps, P1: 90.7 fps, max: 169.7 fps
Intel Core i9-13900HX 1.6GHz
GeForce RTX 4090 Laptop GPU
min: 49.5 fps, P0.1: 59.9 fps, P1: 78.9 fps, max: 141.4 fps
Intel Core i9-14900HX 1.6GHz
GeForce RTX 4090 Laptop GPU
min: 53.8 fps, P0.1: 67 fps, P1: 79.3 fps, max: 151.5 fps
Intel Core i9-13900HX 1.6GHz
GeForce RTX 4090 Laptop GPU
min: 31.1 fps, P0.1: 50.5 fps, P1: 62.7 fps, max: 128 fps
Intel Core i9-14900HX 1.6GHz
GeForce RTX 4090 Laptop GPU
min: 51 fps, P0.1: 56.6 fps, P1: 64.4 fps, max: 153.5 fps
Intel Core i9-13900HX 1.6GHz
GeForce RTX 4090 Laptop GPU
min: 36.2 fps, P0.1: 41.4 fps, P1: 46.1 fps, max: 114.2 fps
Intel Core i9-14900HX 1.6GHz
GeForce RTX 4090 Laptop GPU
min: 43 fps, P0.1: 46.4 fps, P1: 50.4 fps, max: 83.2 fps
Intel Core i9-13900HX 1.6GHz
GeForce RTX 4090 Laptop GPU
min: 25.1 fps, P0.1: 25.4 fps, P1: 26.7 fps, max: 35.3 fps
Intel Core i9-13900HX 1.6GHz
GeForce RTX 4090 Laptop GPU
min: 28.8 fps, P0.1: 39.3 fps, P1: 43.8 fps, max: 102.3 fps
Intel Core i9-14900HX 1.6GHz
GeForce RTX 4090 Laptop GPU
min: 40.3 fps, P0.1: 63.5 fps, P1: 72.6 fps, max: 141.6 fps