Alienware m18 R1 laptop review: Bigger and heavier than the MSI Titan GT77
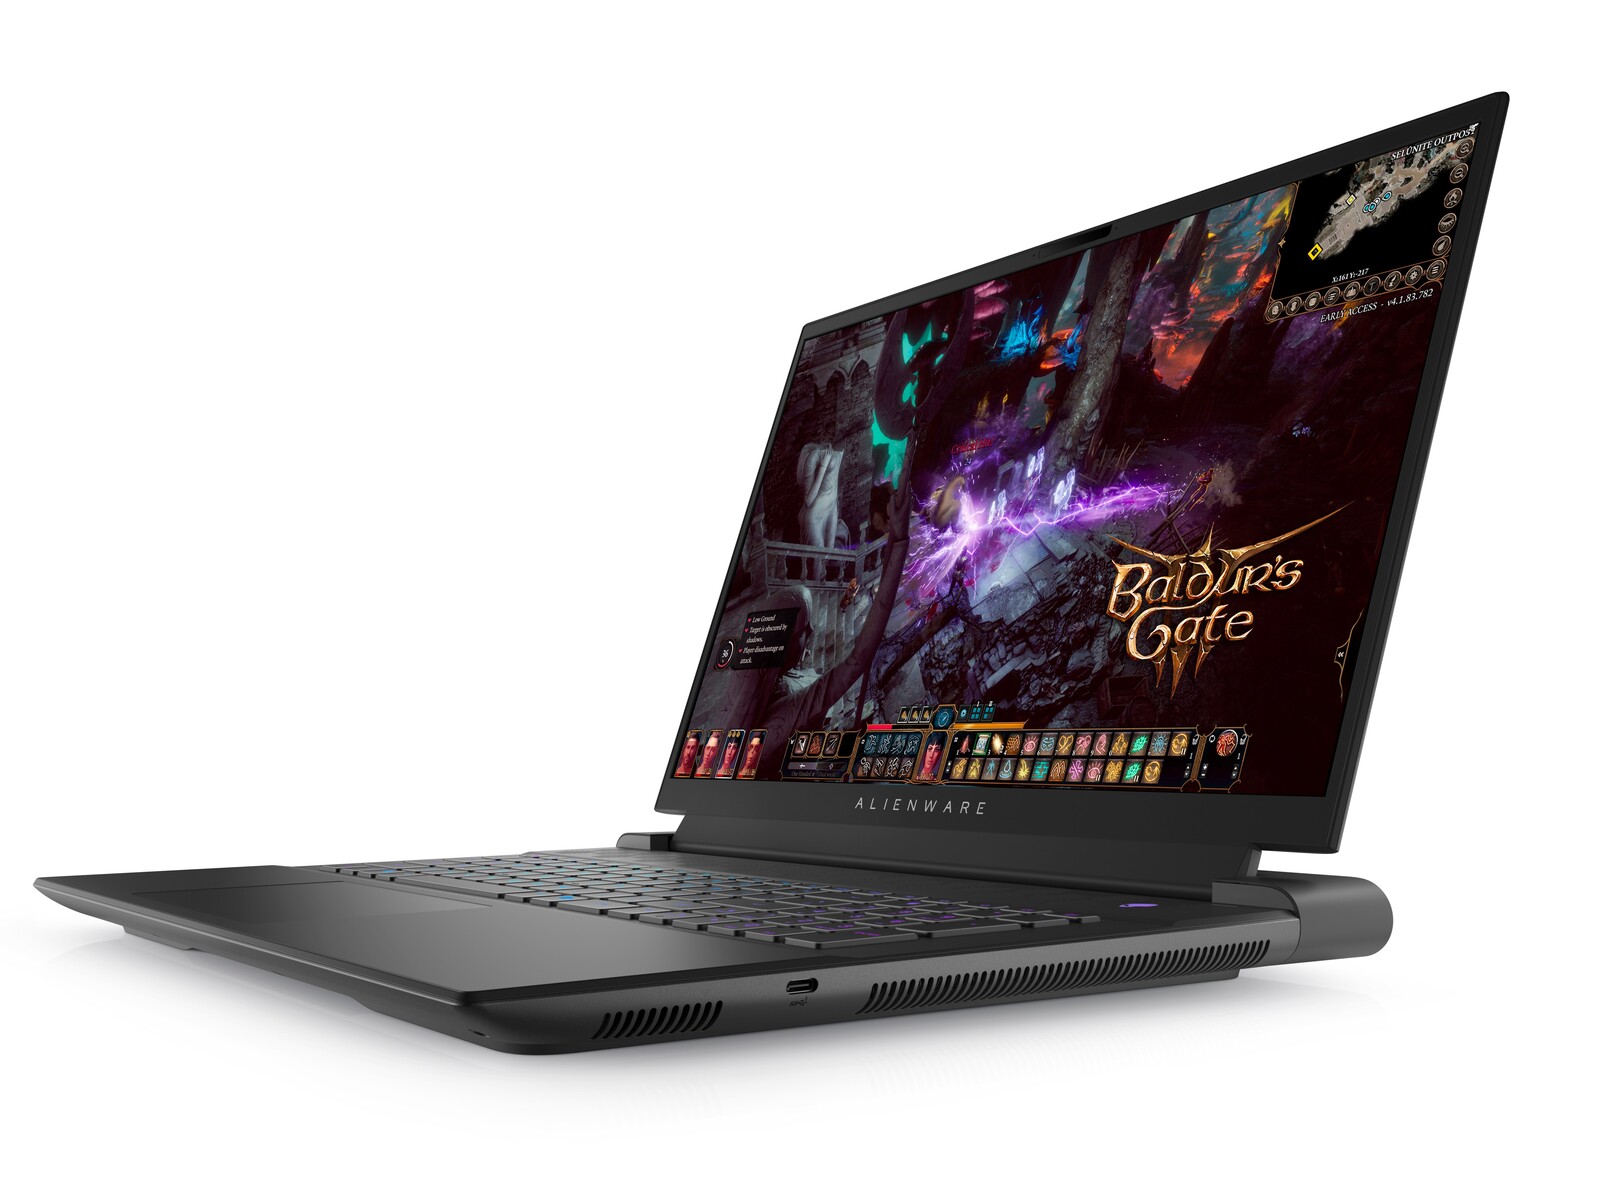
Unveiled earlier this year alongside the mobile Intel Raptor Lake-H series and mobile Ada Lovelace GeForce RTX 40 series, the flagship Alienware m18 R1 is the first 18-inch model in its family since 2013. A lot has changed since then, of course, but performance hunters who want something larger than the usual 17-inch solution may find a lot to like from an 18-inch form factor where features and thermals can be maximized.
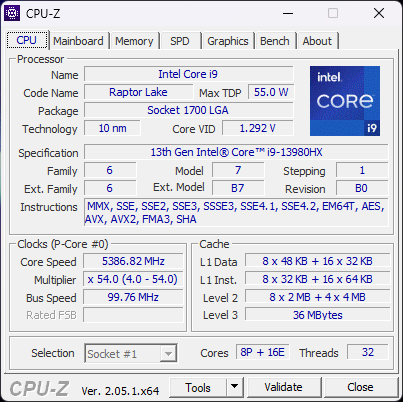
Our configuration in review is a higher-end specification with the 13th gen Core i9-13980HX CPU, 175 W GeForce RTX 4090, membrane-based RGB keyboard, and 1200p 480 Hz IPS display for approximately $2900 USD. Other SKUs are available from the RTX 4060, Core i7-13700HX, and 1600p 165 Hz display with CherryMX ultra low-profile mechanical keyboard. All configurations otherwise support G-Sync and full DCI-P3 colors.
Direct competitors include other 18-inch gaming laptops like the Razer Blade 18 or Asus ROG Strix Scar 18. MSI has yet to announce a new 18-inch model at the time of writing.
More Dell reviews:
Potential Competitors in Comparison
Rating | Date | Model | Weight | Height | Size | Resolution | Price |
|---|---|---|---|---|---|---|---|
| 90.7 % v7 (old) | 04 / 2023 | Alienware m18 R1 i9-13980HX, GeForce RTX 4090 Laptop GPU | 3.9 kg | 26.7 mm | 18.00" | 1920x1200 | |
| 91.4 % v7 (old) | 02 / 2023 | Razer Blade 18 RTX 4070 i9-13950HX, GeForce RTX 4070 Laptop GPU | 3 kg | 21.9 mm | 18.00" | 2560x1600 | |
| 86.6 % v7 (old) | 02 / 2023 | Asus ROG Strix Scar 18 2023 G834JY-N6005W i9-13980HX, GeForce RTX 4090 Laptop GPU | 3.1 kg | 30.8 mm | 18.00" | 2560x1600 | |
| 88.3 % v7 (old) | 03 / 2023 | MSI GE78HX 13VH-070US i9-13950HX, GeForce RTX 4080 Laptop GPU | 3 kg | 23 mm | 17.00" | 2560x1600 | |
| 89.9 % v7 (old) | 03 / 2023 | Eluktronics Mech-17 GP2 i9-13900HX, GeForce RTX 4090 Laptop GPU | 2.9 kg | 27 mm | 17.00" | 2560x1600 | |
| 89 % v7 (old) | 02 / 2023 | MSI Titan GT77 HX 13VI i9-13950HX, GeForce RTX 4090 Laptop GPU | 3.5 kg | 23 mm | 17.30" | 3840x2160 |
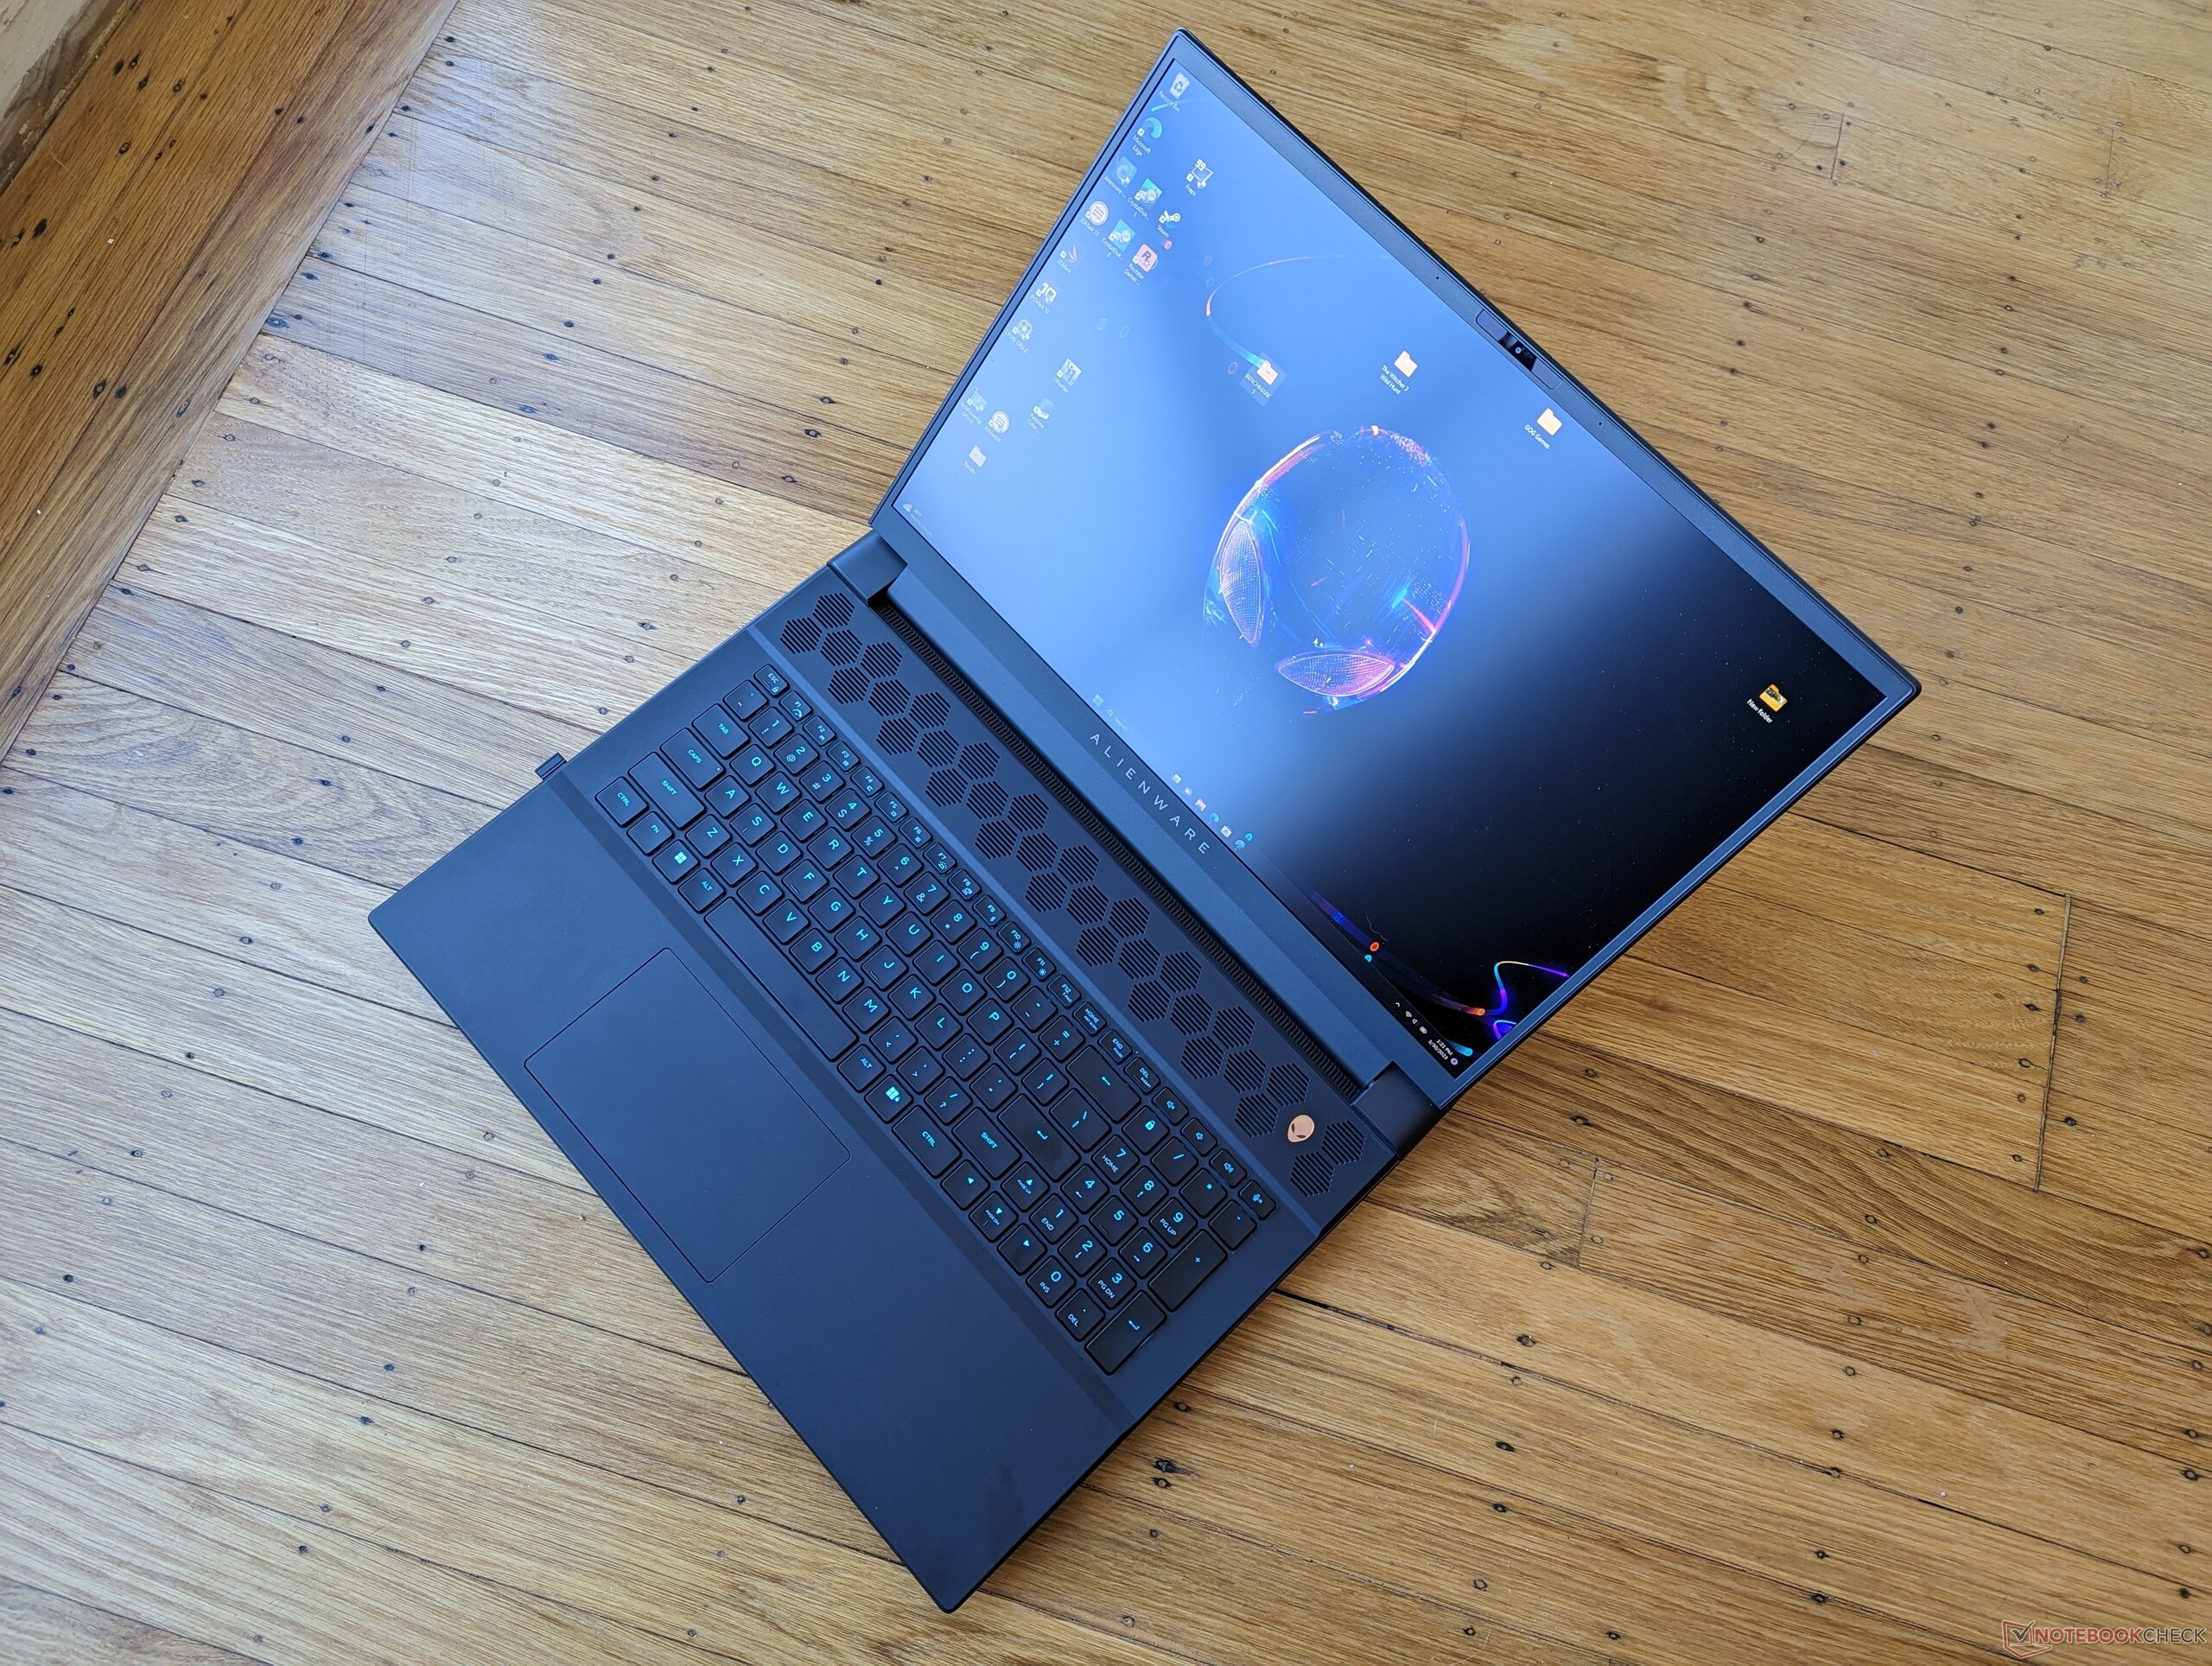
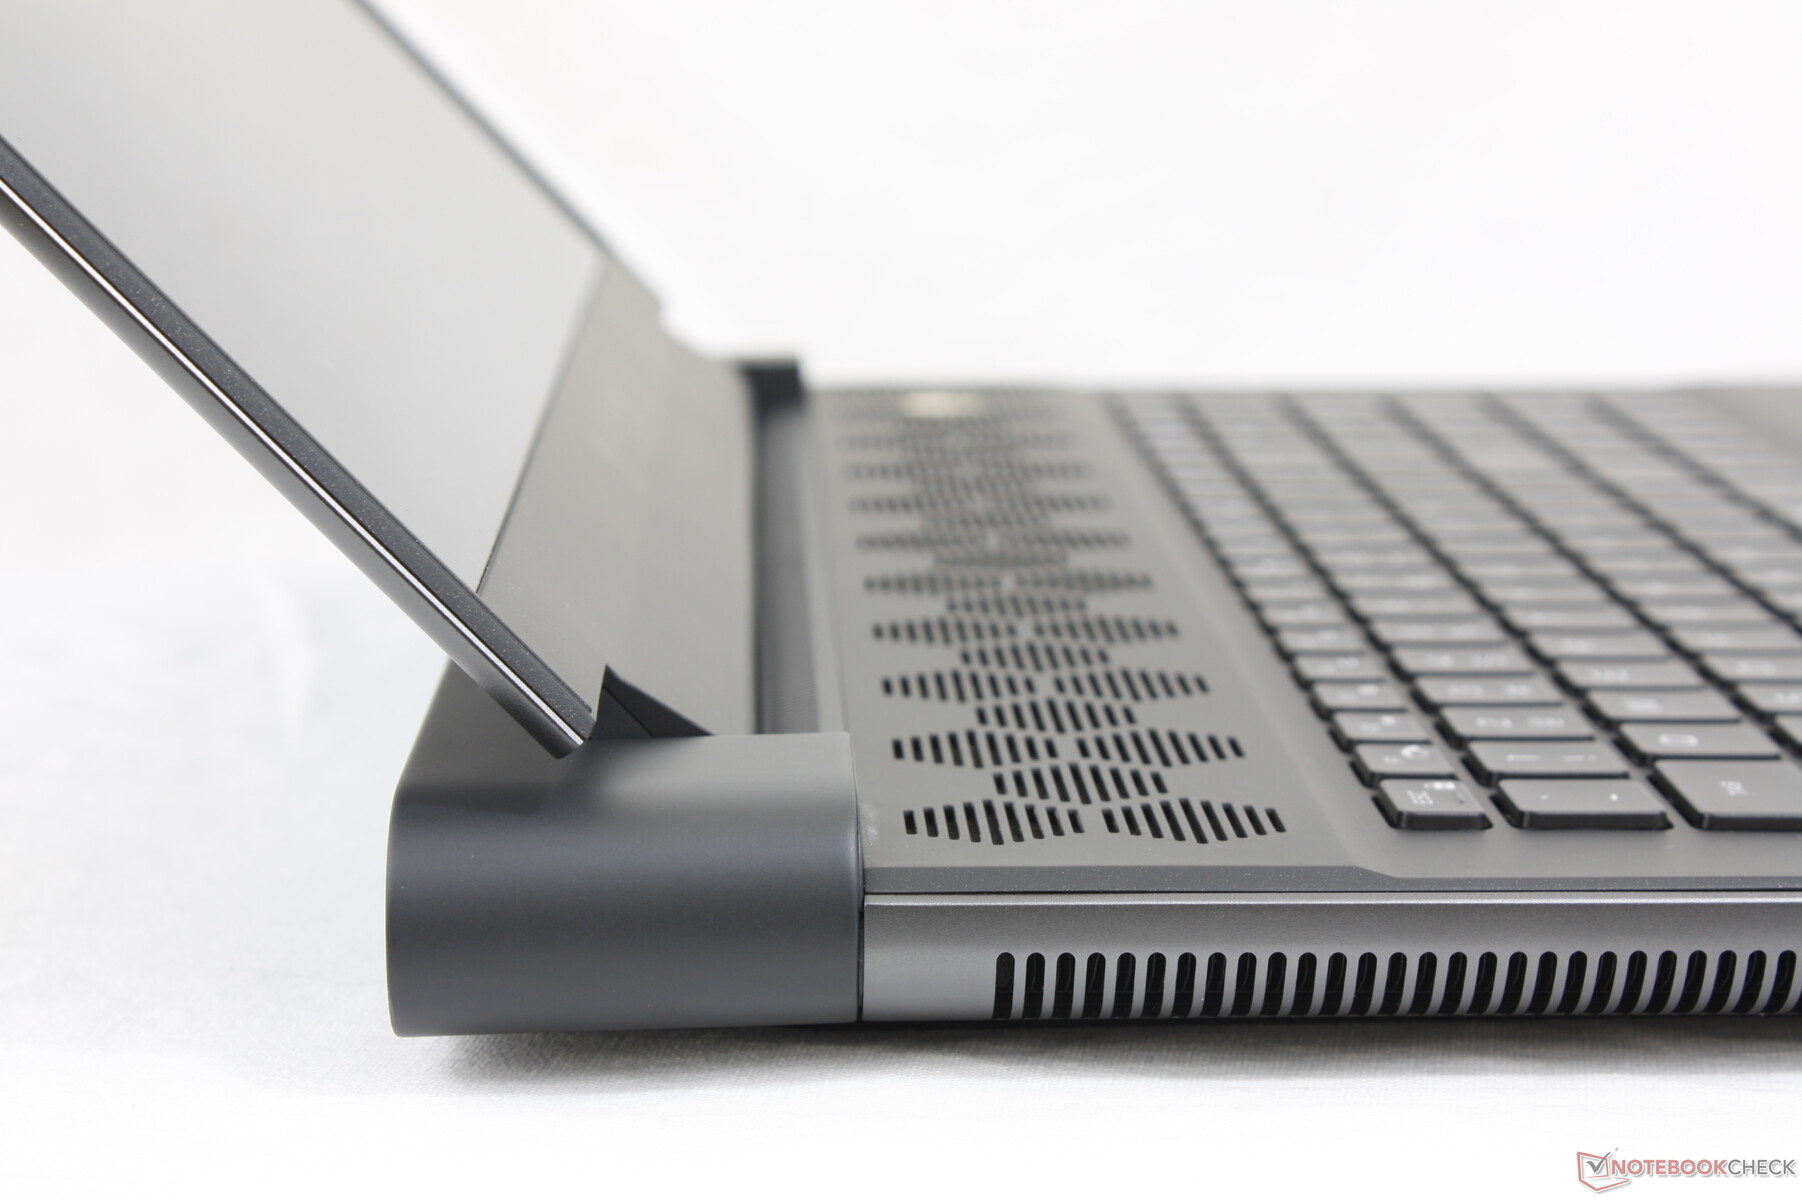
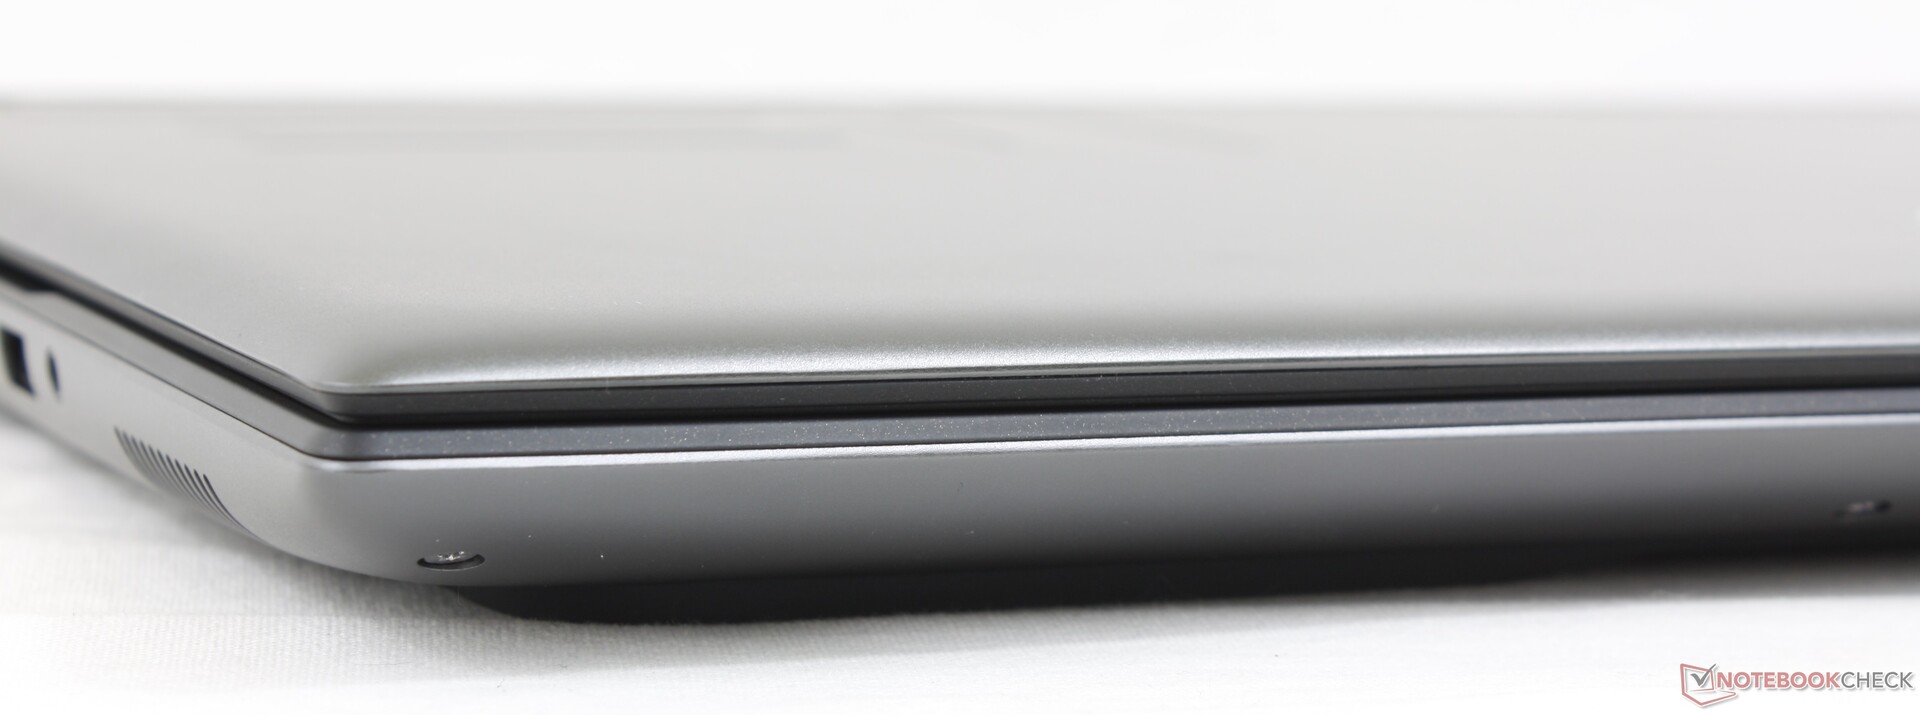
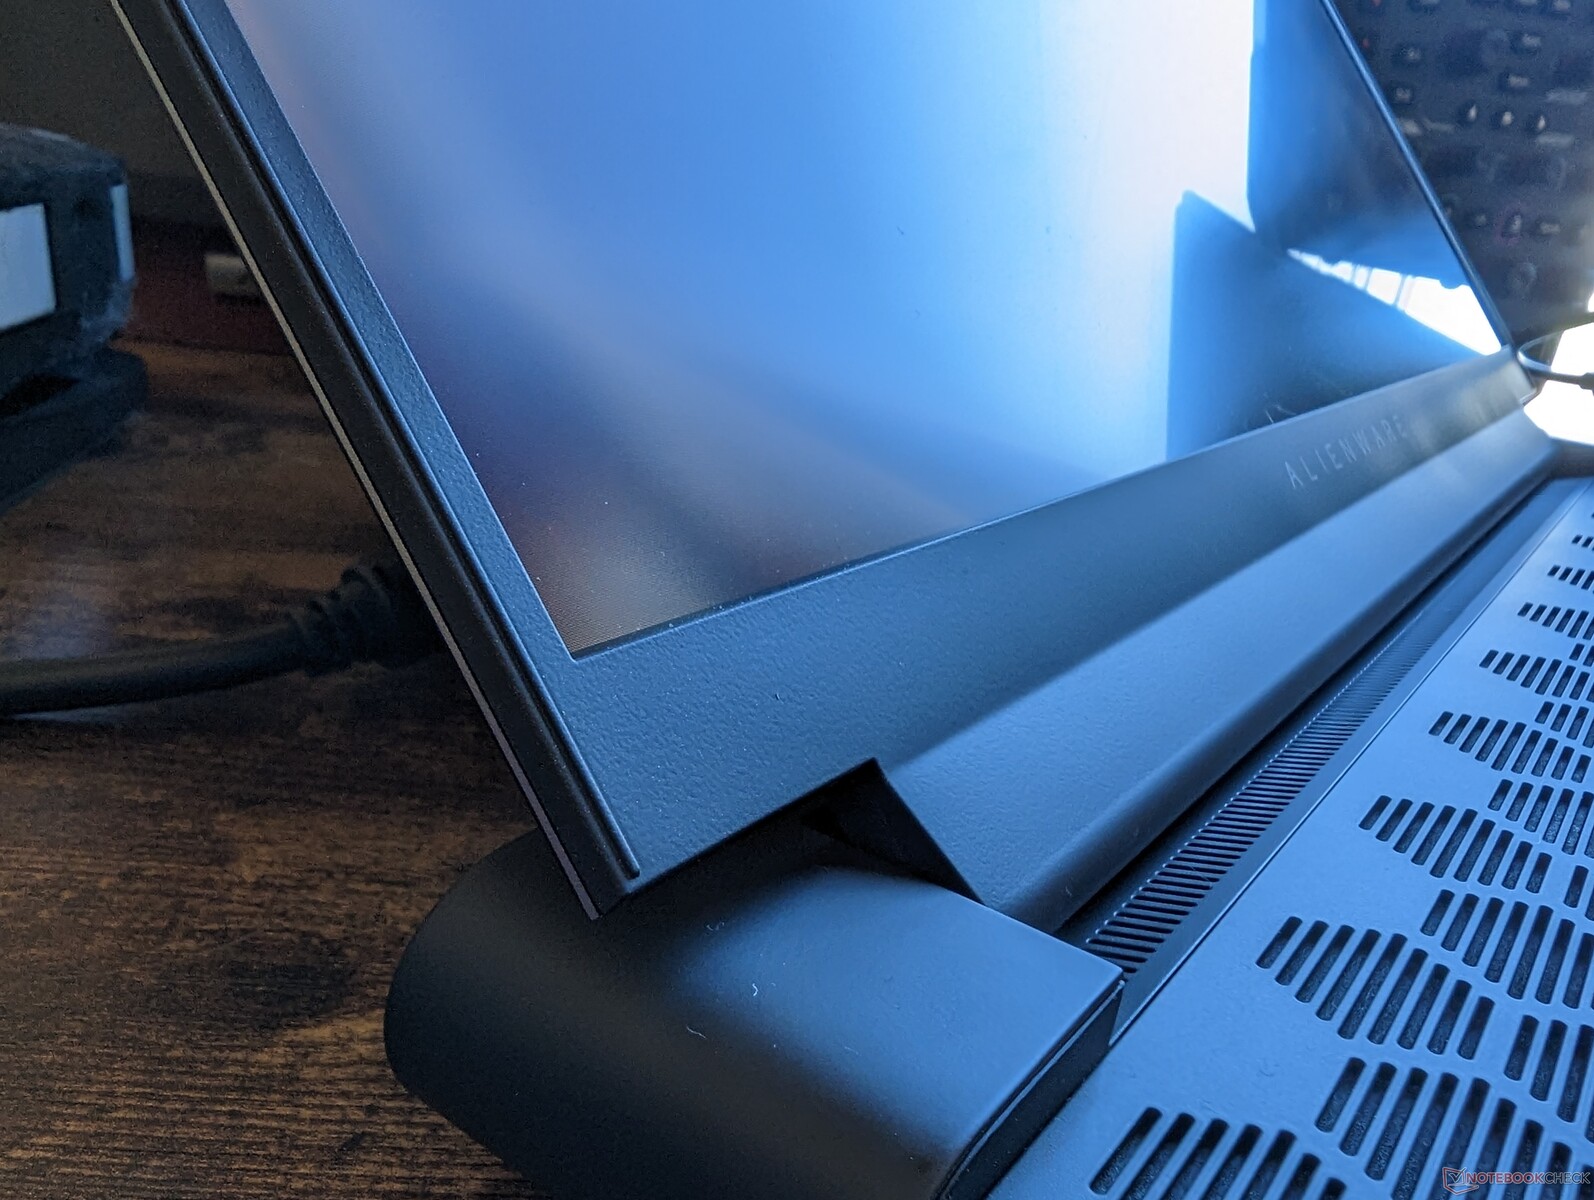
Case — Legend 3 Design
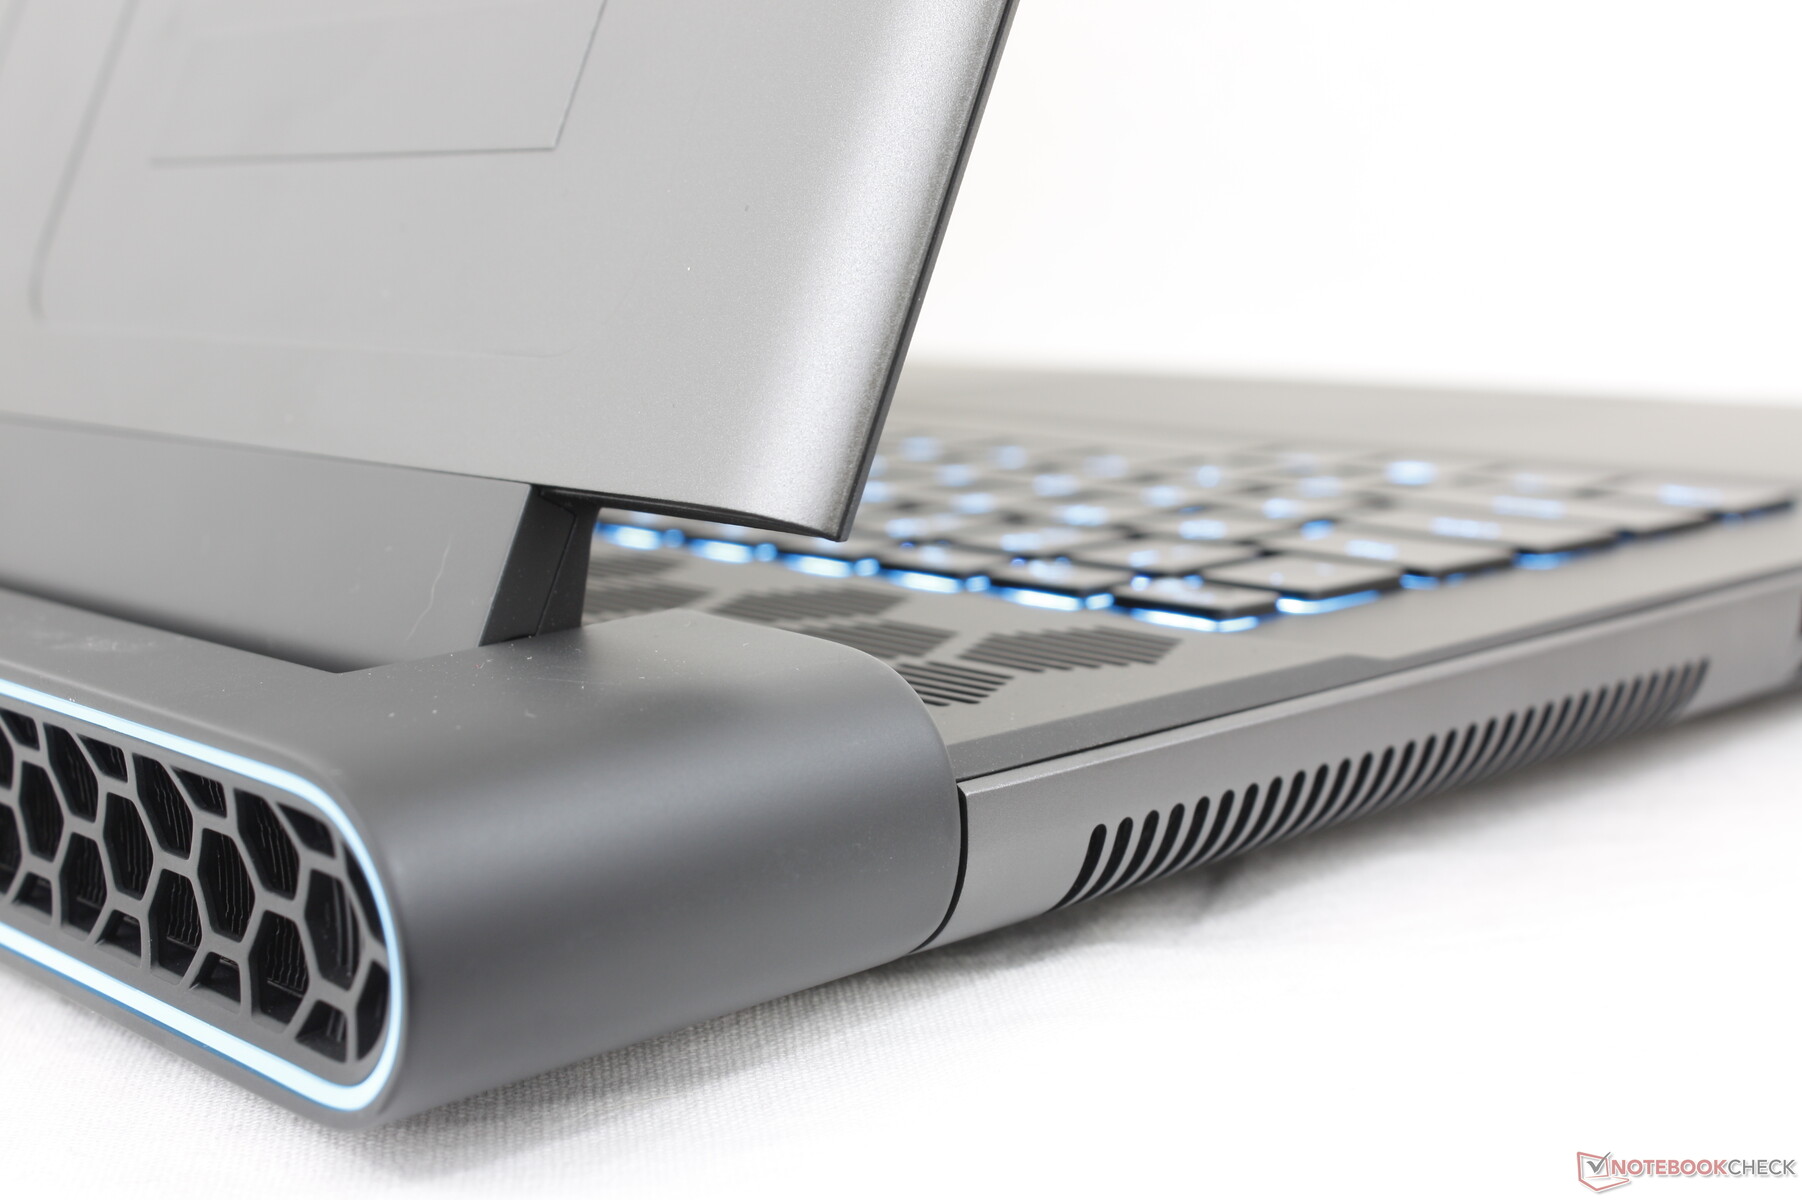
Chassis impressions are similar to the recent Alienware x17 R2 since the Alienware m18 R1 uses similar materials. Its dense construction and tight alignment between materials show that you don't need a unibody design like the Razer Blade 18 for a high quality feel. Everything from the center of the keyboard to the outer lid are firmer and more resistant to any twisting or depressions than on many other gaming laptops including the MSI GE78.
The matte rubberized keyboard deck can be a mixed bag since it readily collects unsightly grease and fingerprints over time.
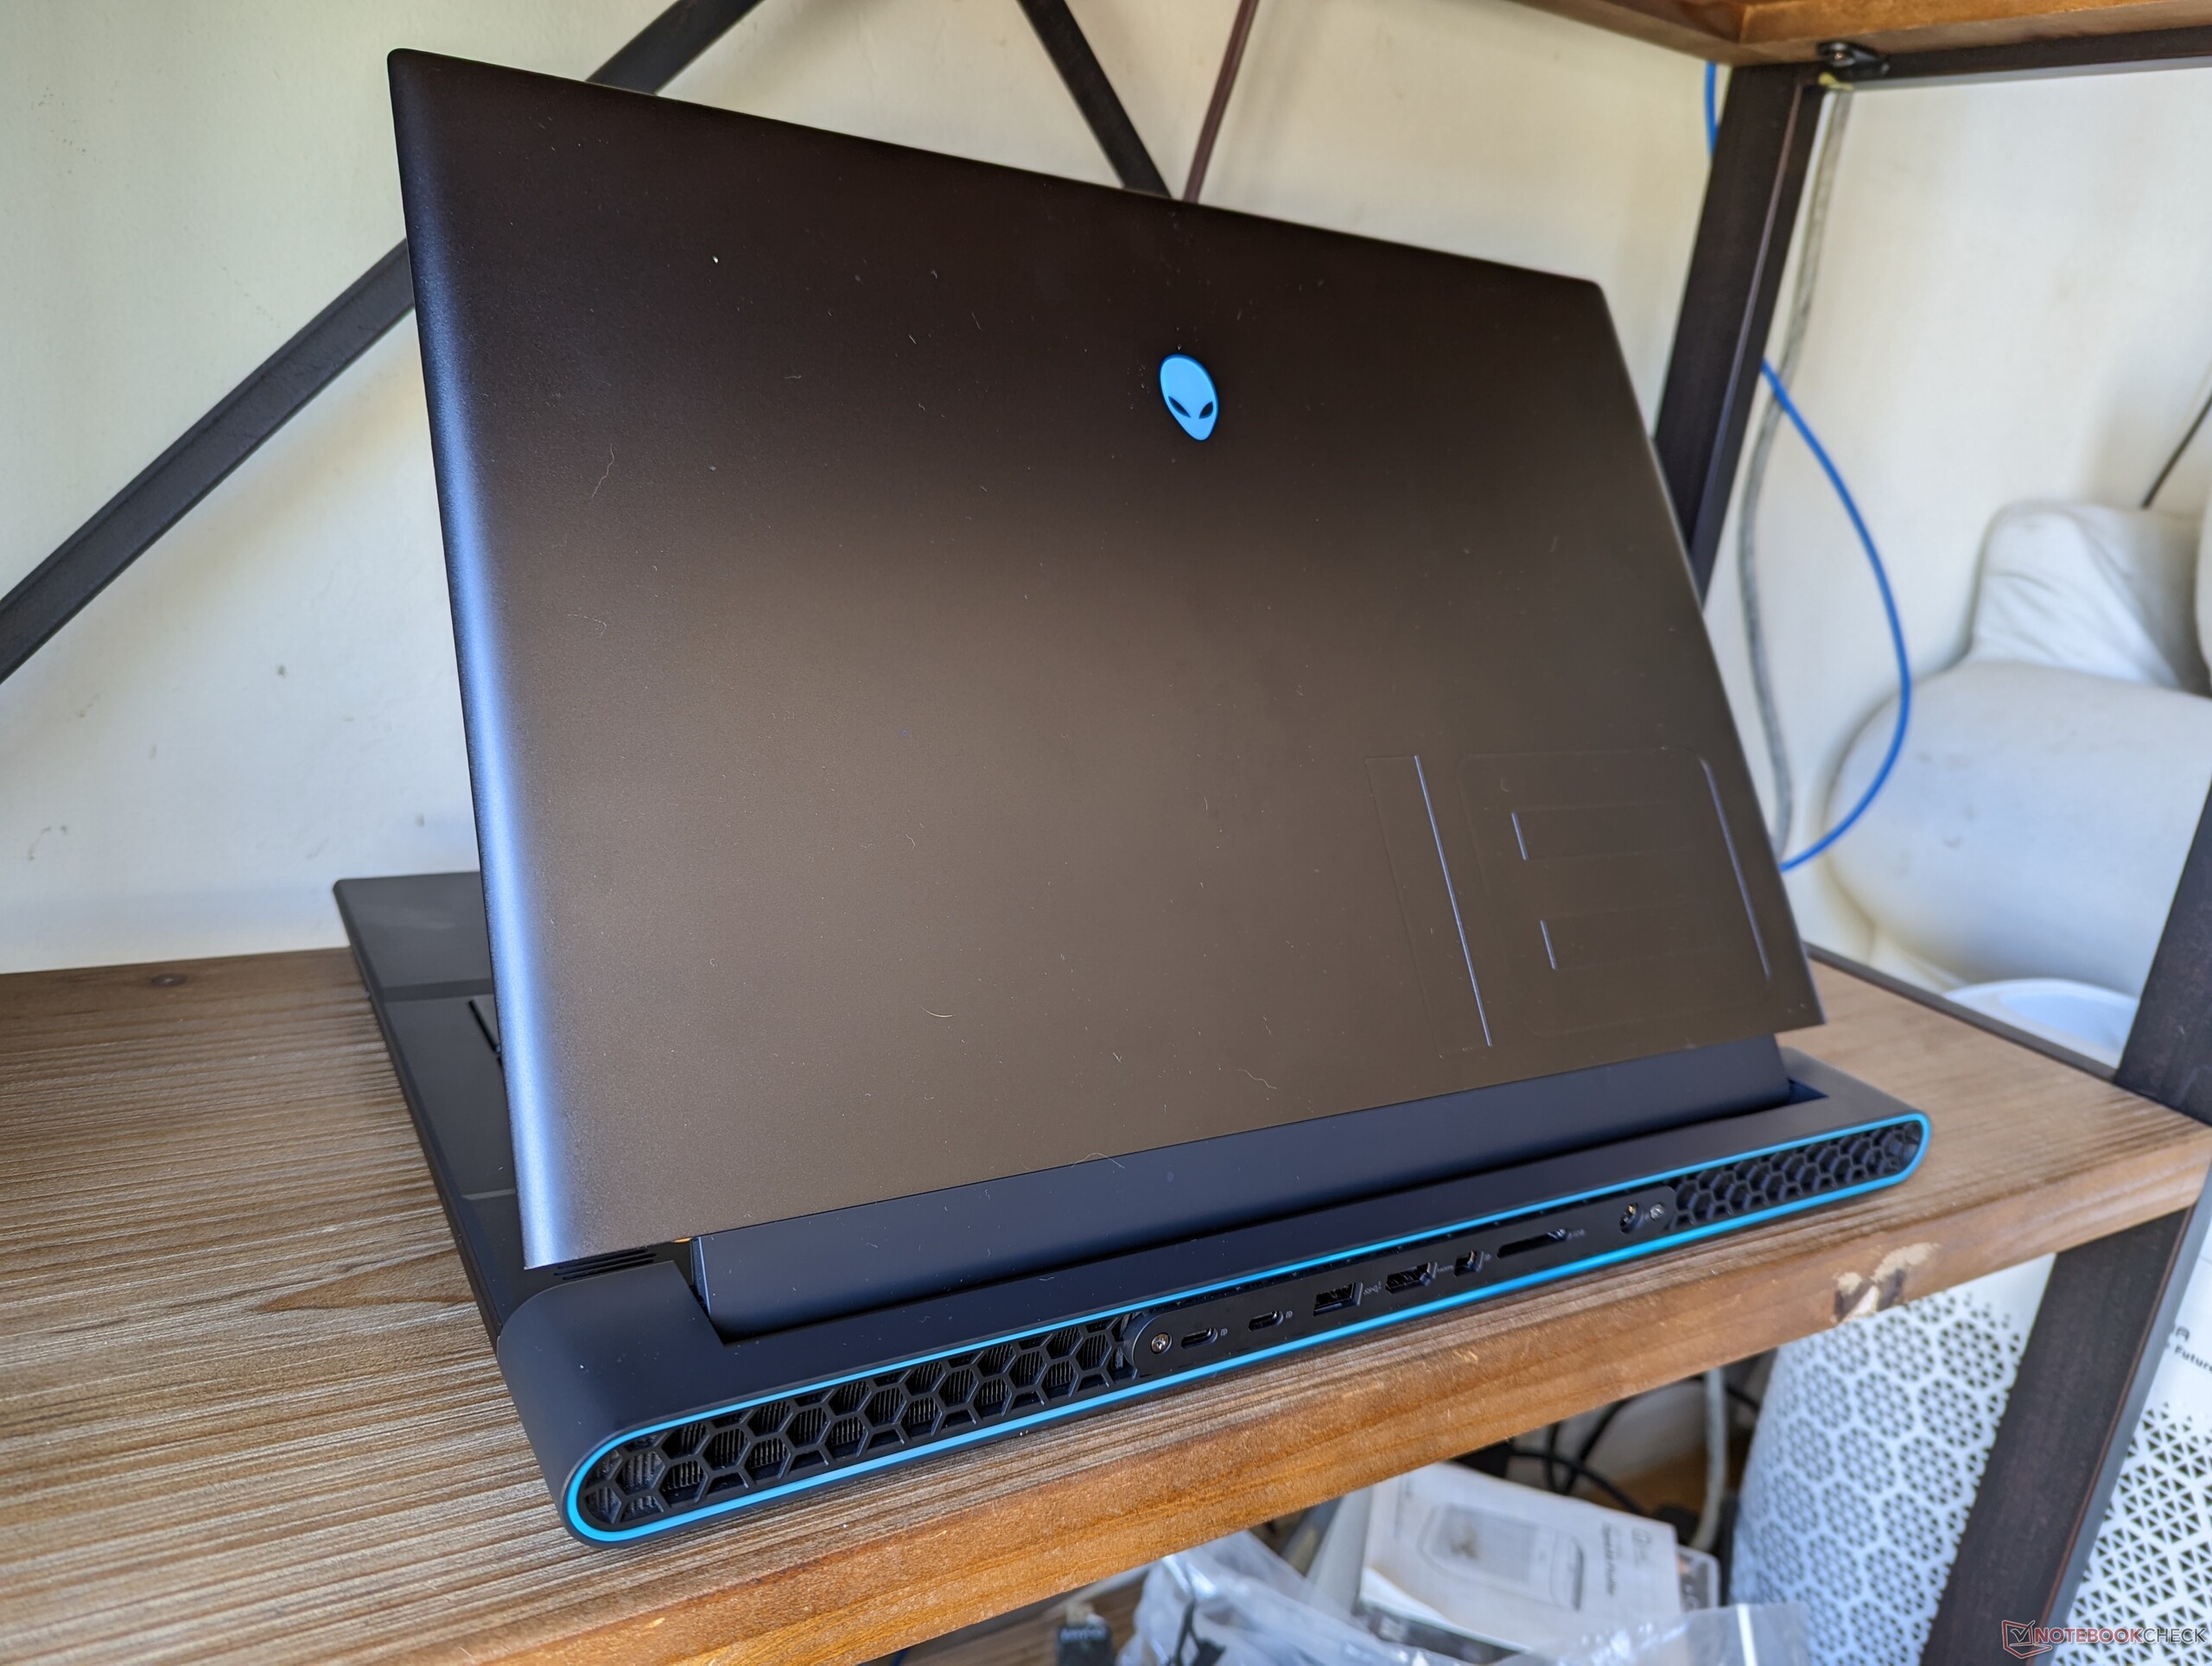
The Alienware model is significantly heavier than the 18-inch Blade 18 or ROG Strix Scar 18 by almost a full kilogram each to be one of the heaviest laptops of the year. In fact, our delivery courier even commented on how heavy the shipping box was relative to its small size. Much of the weight can be attributed to the extended rear, thicker profile, and vapor chamber cooler all intended to improve cooling. If you care about travel weight, then you might want to consider the MSI Titan GT77 instead which is actually lighter and thinner than our Alienware.
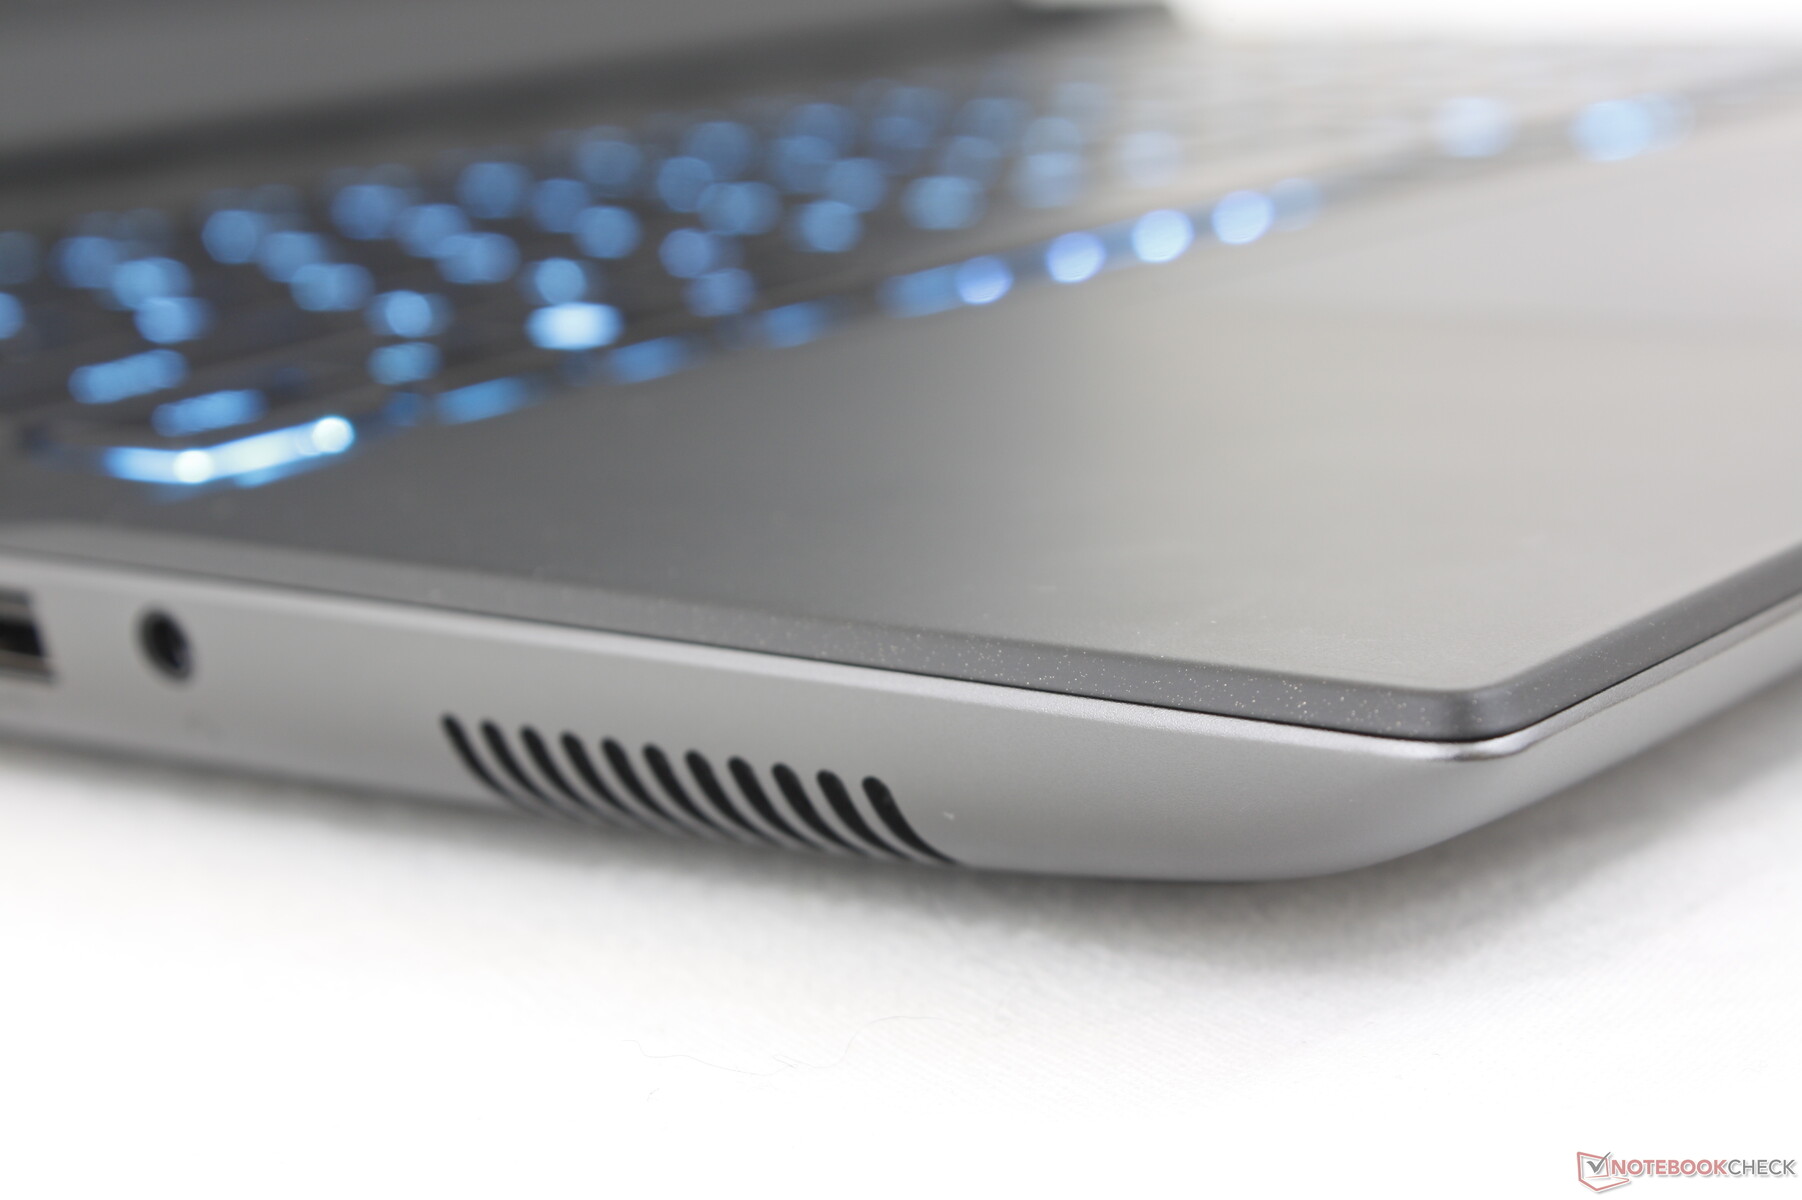
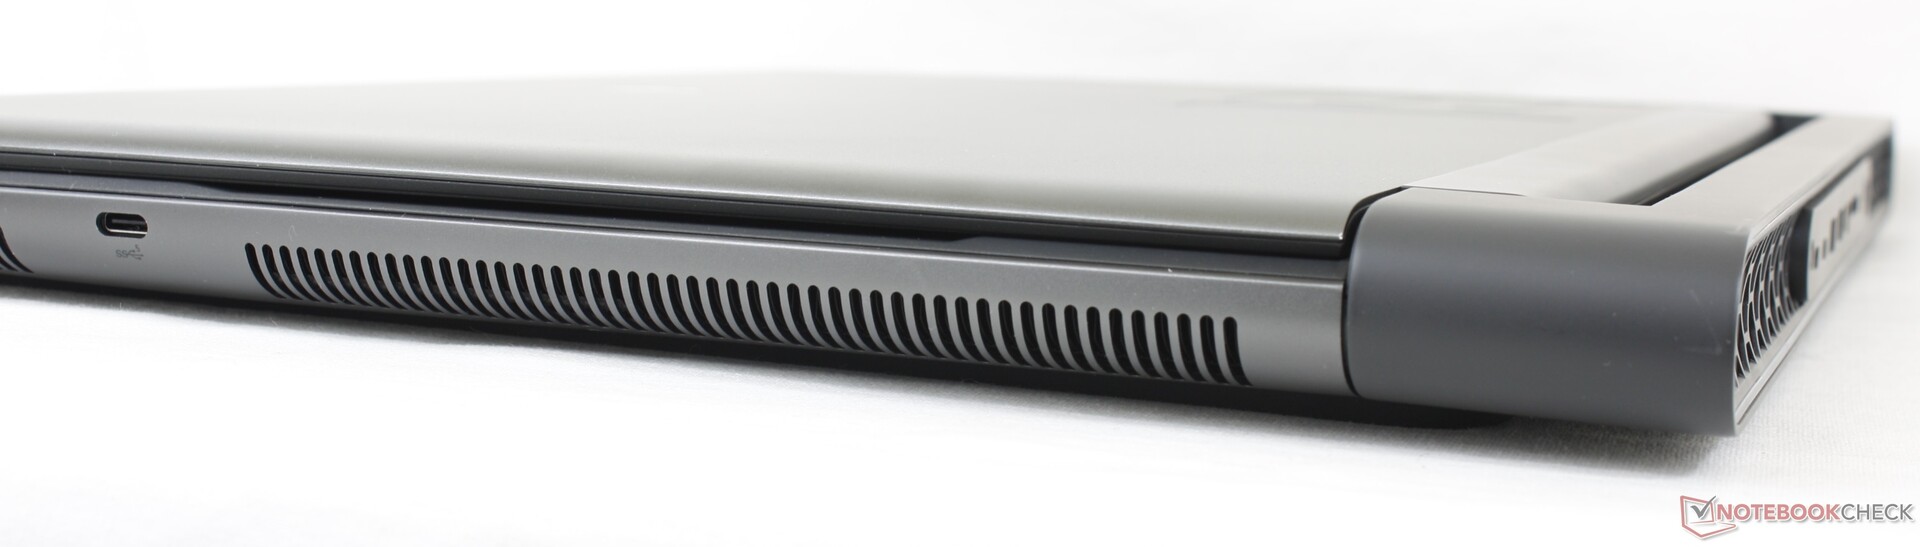
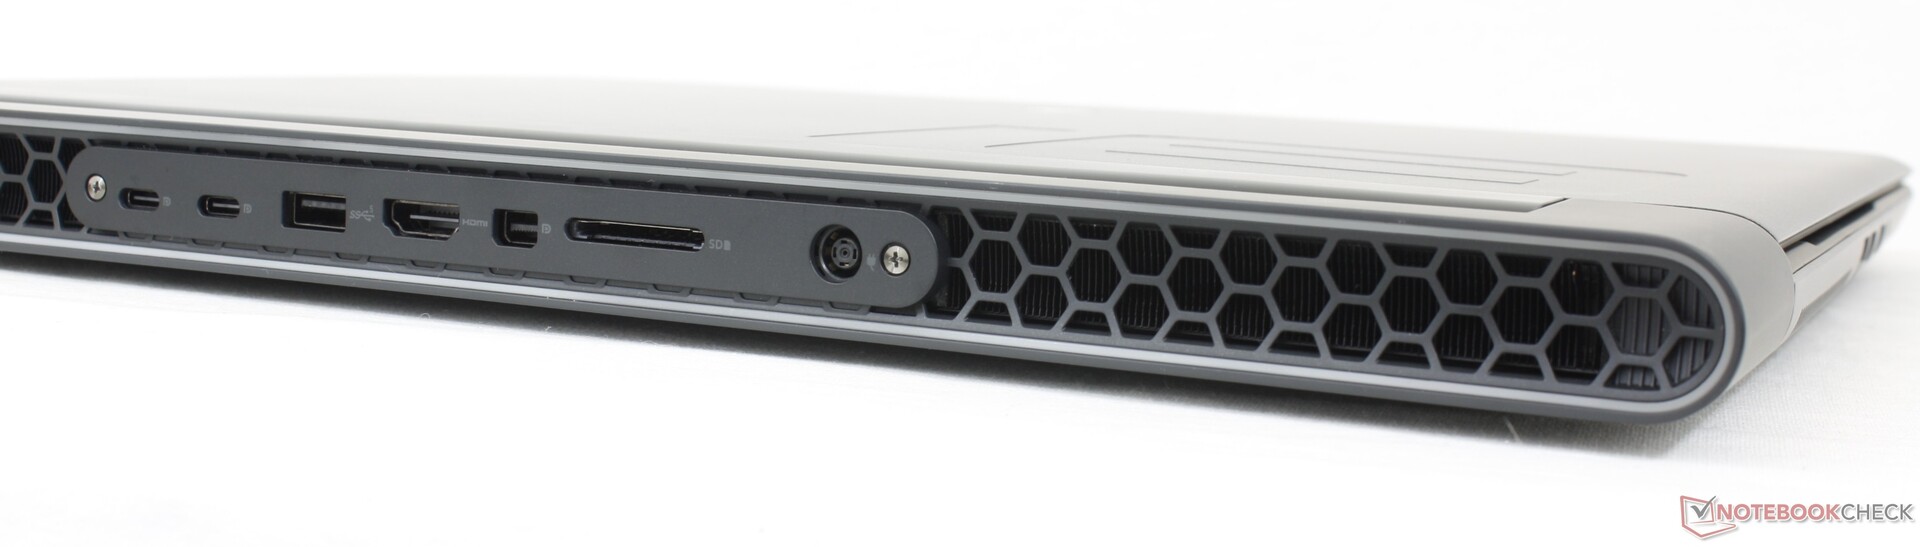
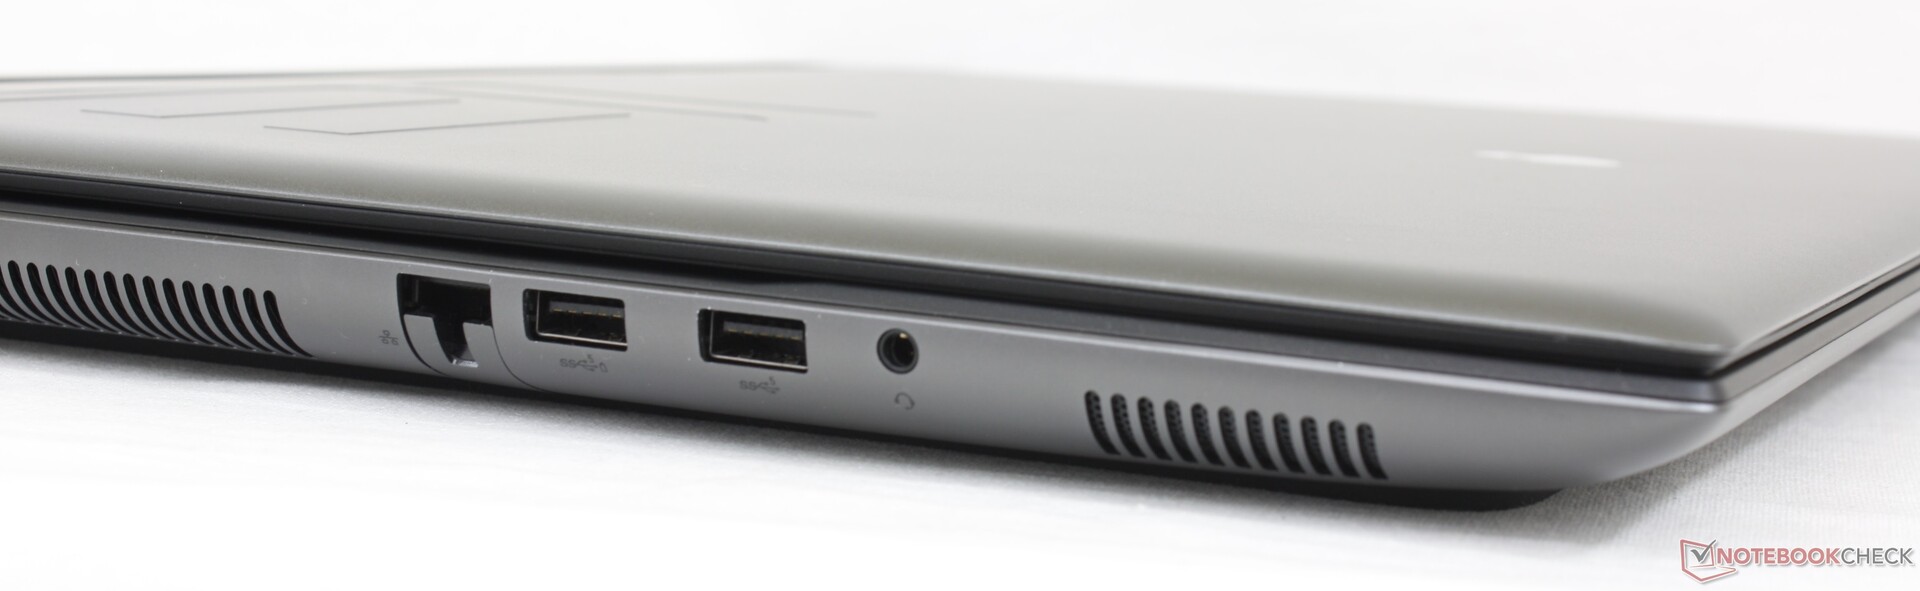
Connectivity — More Than Usual
There are more integrated ports on the Alienware than on the competing Razer Blade 18 or Asus ROG Strix Scar 18. The catch, however, is that most of the ports are tightly packed along the rear edge which makes them a bit more difficult to access.
USB-C monitors are only supported on the two rear USB-C ports as the third USB-C port along the right edge does not support video-out.
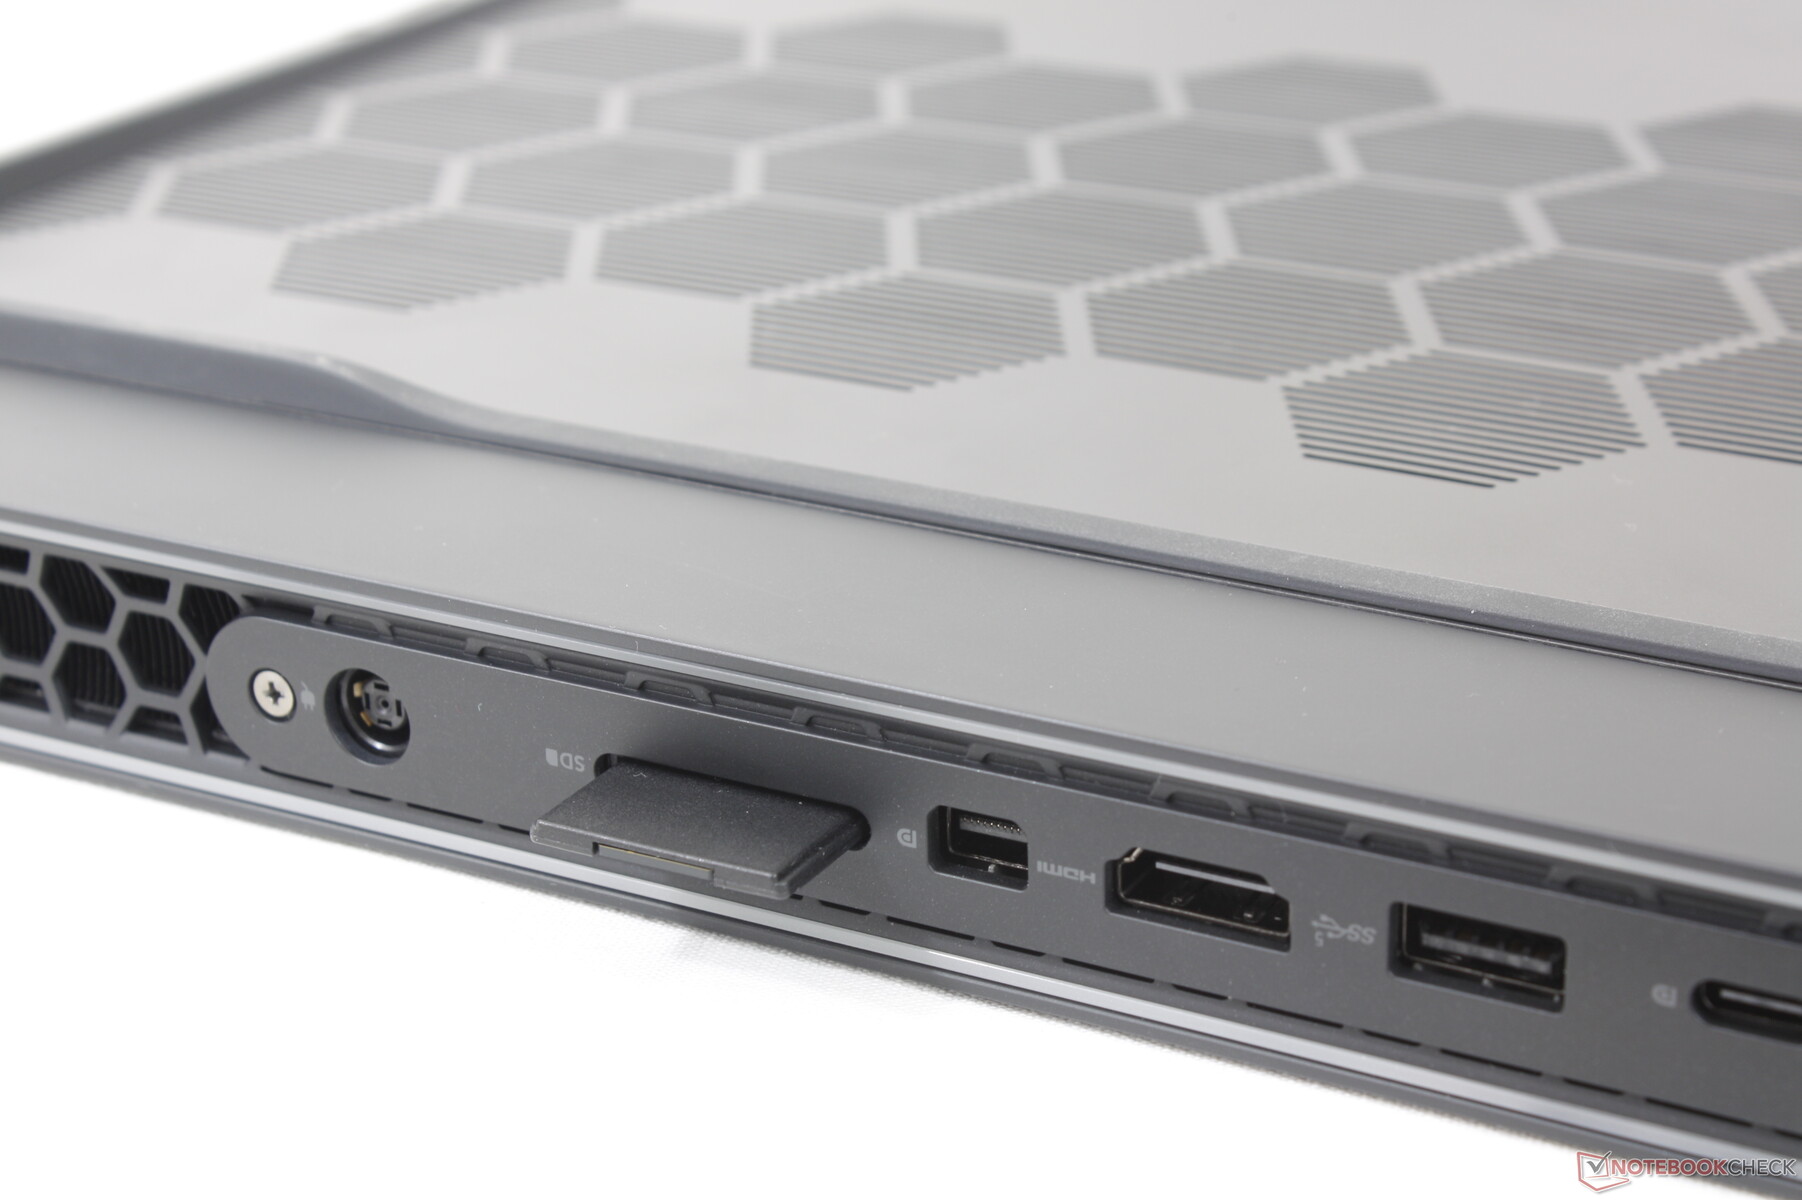
SD Card Reader
The integrated SD card reader is along the rear of the unit unlike on most other laptops. Transfer rates are nonetheless very fast at over 2x the speeds on the MSI Titan GT77.
| SD Card Reader | |
| average JPG Copy Test (av. of 3 runs) | |
| Razer Blade 18 RTX 4070 (Angelibird AV Pro V60) | |
| Alienware m18 R1 (Angelibird AV Pro V60) | |
| Alienware x17 R2 P48E (AV Pro V60) | |
| MSI Titan GT77 HX 13VI (Angelibird AV Pro V60) | |
| Eluktronics Mech-17 GP2 (Angelibird AV Pro V60) | |
| maximum AS SSD Seq Read Test (1GB) | |
| Alienware x17 R2 P48E (AV Pro V60) | |
| Alienware m18 R1 (Angelibird AV Pro V60) | |
| Razer Blade 18 RTX 4070 (Angelibird AV Pro V60) | |
| Eluktronics Mech-17 GP2 (Angelibird AV Pro V60) | |
| MSI Titan GT77 HX 13VI (Angelibird AV Pro V60) | |
Communication
An Intel Killer 1675i comes standard for Wi-Fi 6E and Bluetooth 5.2 compatibility. Killer is an Intel sub-brand optimized for gaming laptops and so the Killer 1675i is essentially an Intel AX211 at heart. Performance is excellent and reliable when paired to our Asus AXE11000 test router.
| Networking | |
| iperf3 transmit AX12 | |
| Alienware x17 R2 P48E | |
| iperf3 receive AX12 | |
| Alienware x17 R2 P48E | |
| iperf3 transmit AXE11000 | |
| MSI Titan GT77 HX 13VI | |
| Asus ROG Strix Scar 18 2023 G834JY-N6005W | |
| Eluktronics Mech-17 GP2 | |
| Alienware m18 R1 | |
| Razer Blade 18 RTX 4070 | |
| iperf3 receive AXE11000 | |
| Asus ROG Strix Scar 18 2023 G834JY-N6005W | |
| MSI Titan GT77 HX 13VI | |
| Razer Blade 18 RTX 4070 | |
| Eluktronics Mech-17 GP2 | |
| Alienware m18 R1 | |
| iperf3 transmit AXE11000 6GHz | |
| Alienware m18 R1 | |
| Razer Blade 18 RTX 4070 | |
| iperf3 receive AXE11000 6GHz | |
| Razer Blade 18 RTX 4070 | |
| Alienware m18 R1 | |
Webcam
The 2 MP webcam is typical on most laptops these days, but we're slightly disappointed to not see a 5 MP sensor given how large the chassis is. IR comes standard while a webcam shutter is absent unlike on the Razer Blade 18.


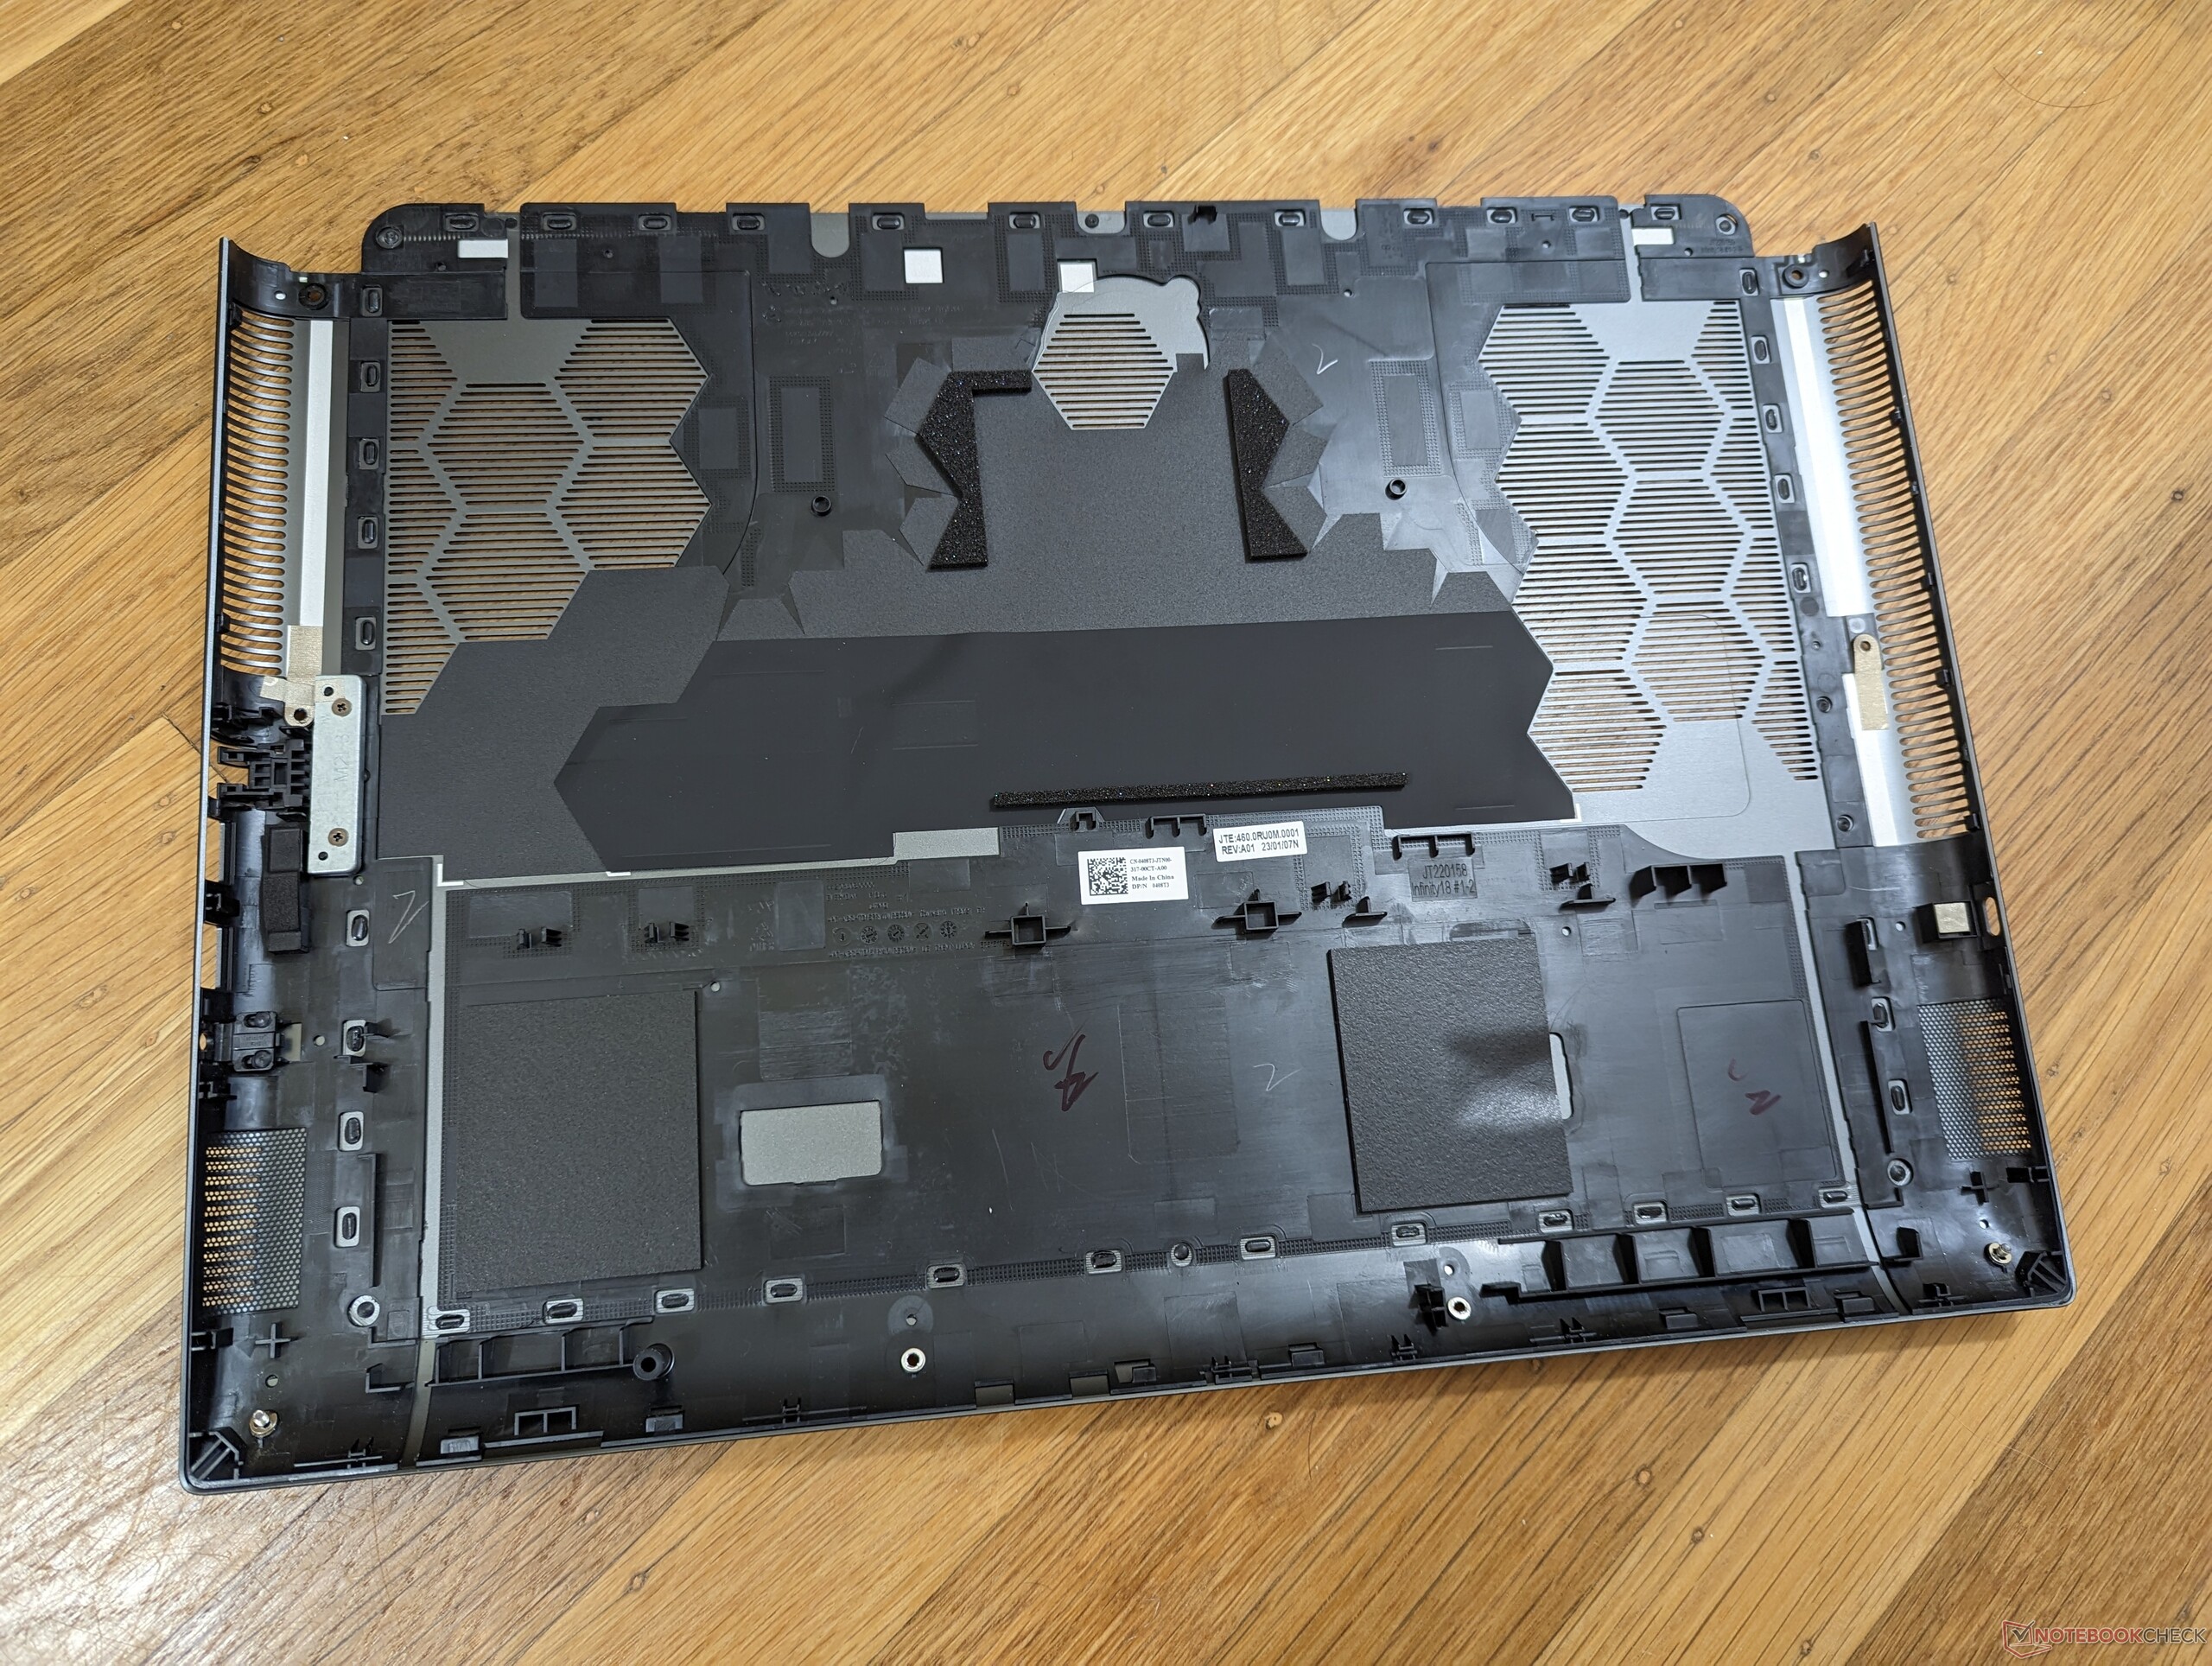
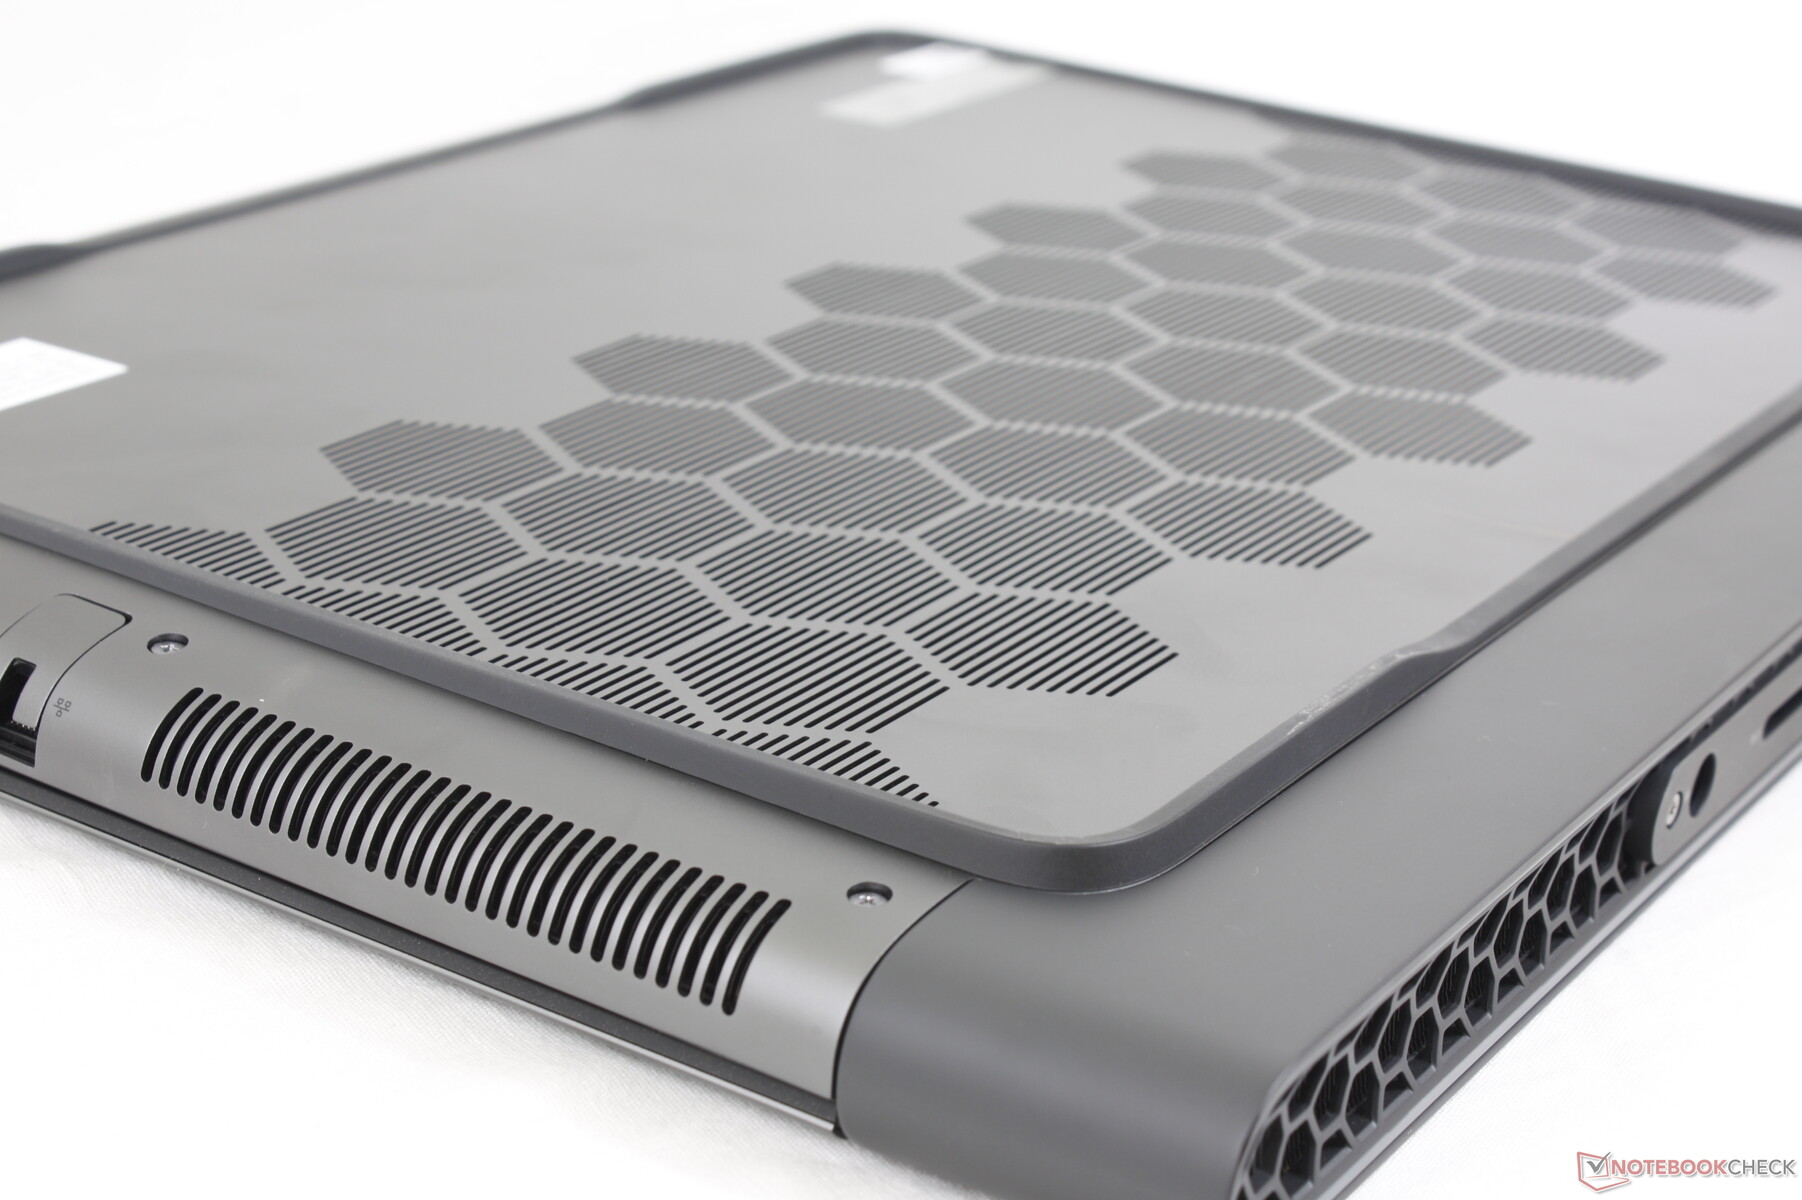
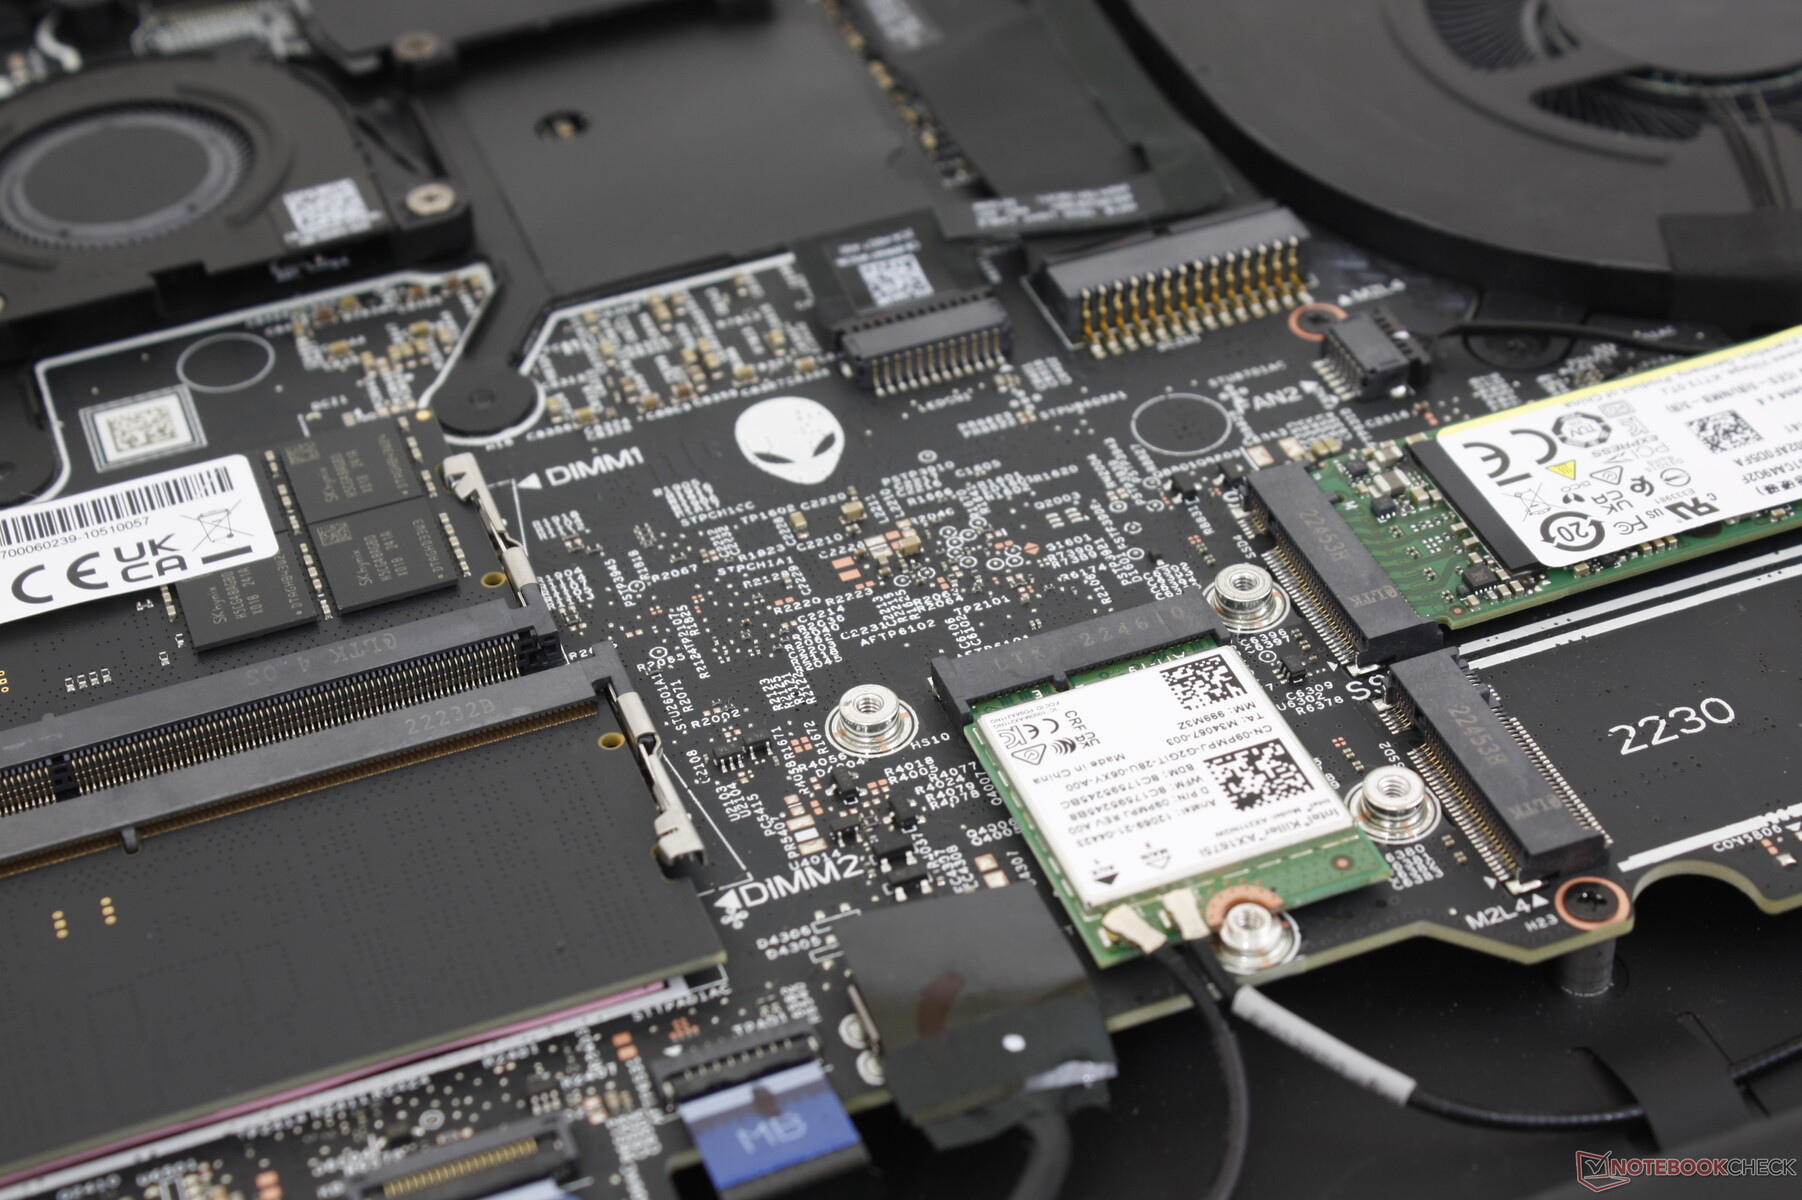
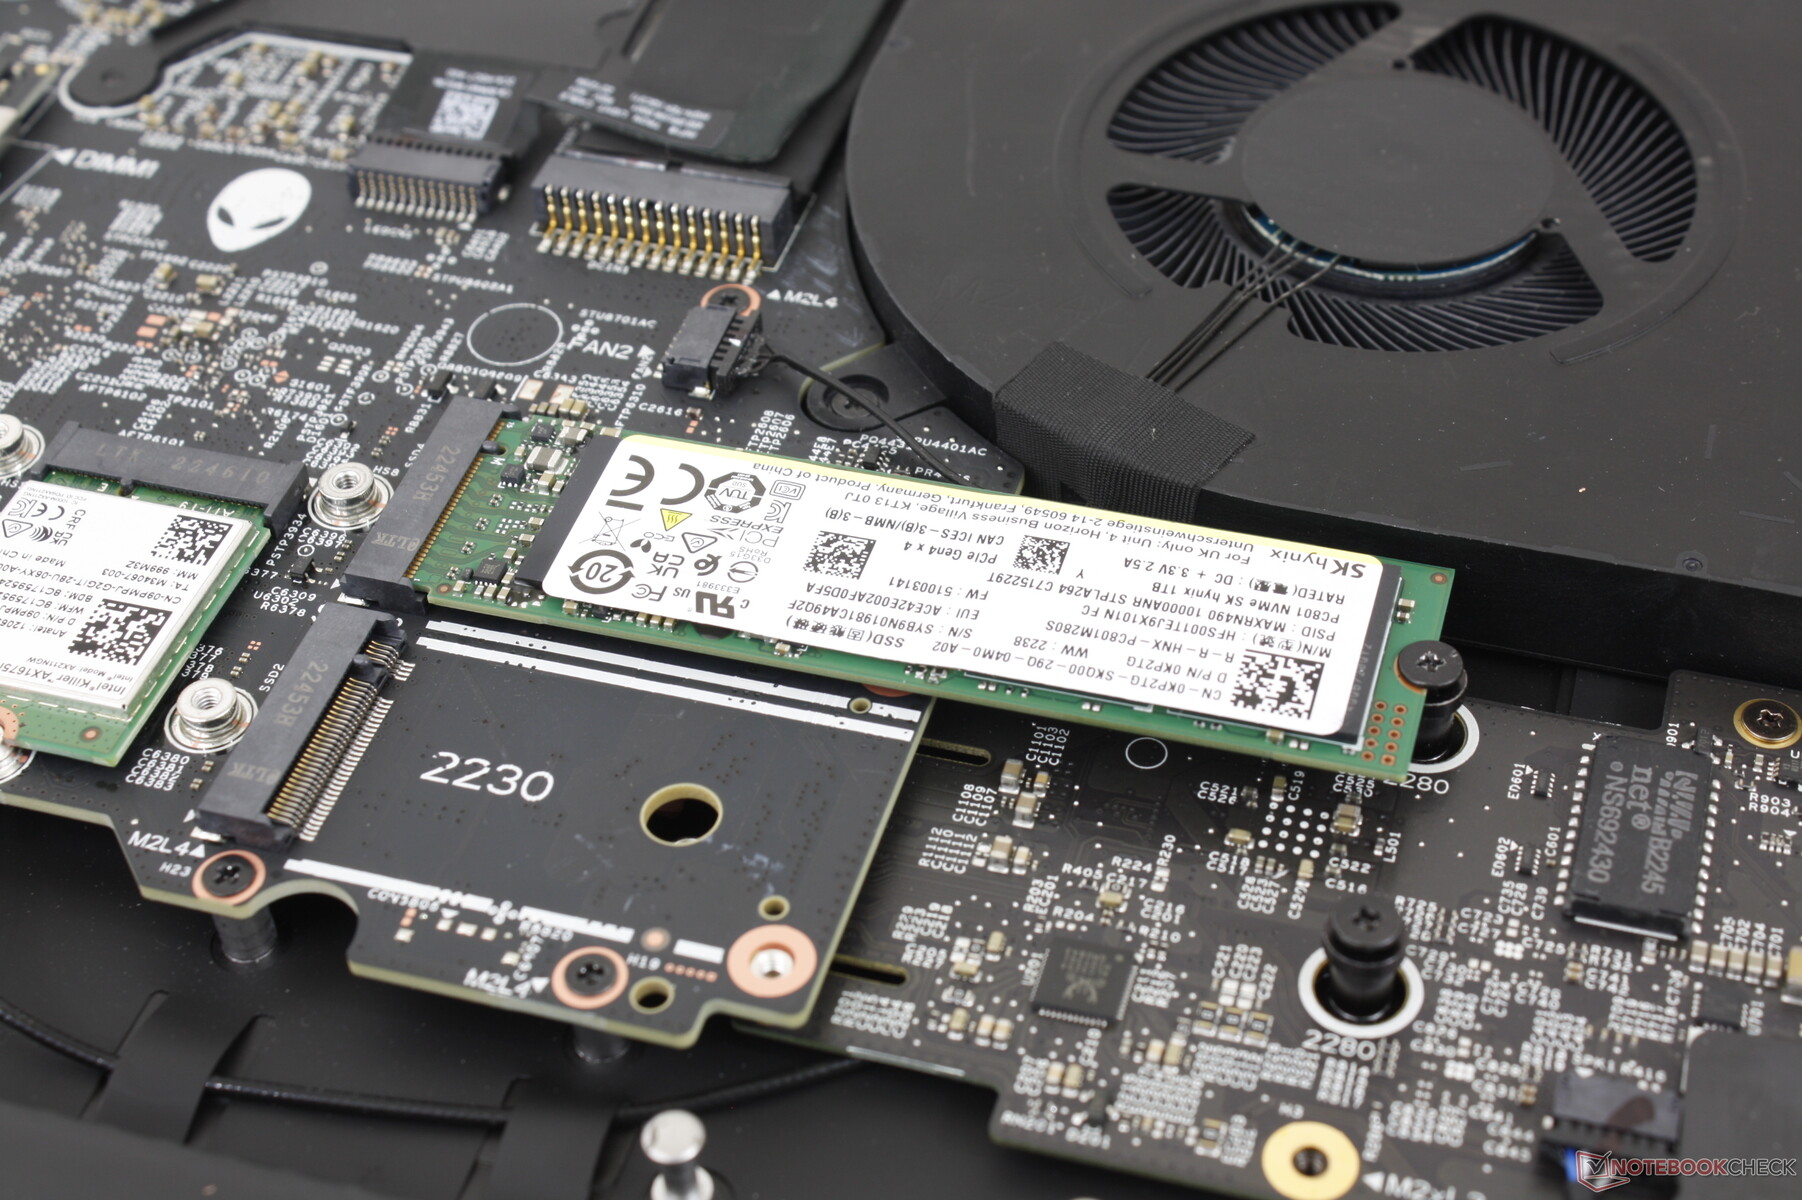
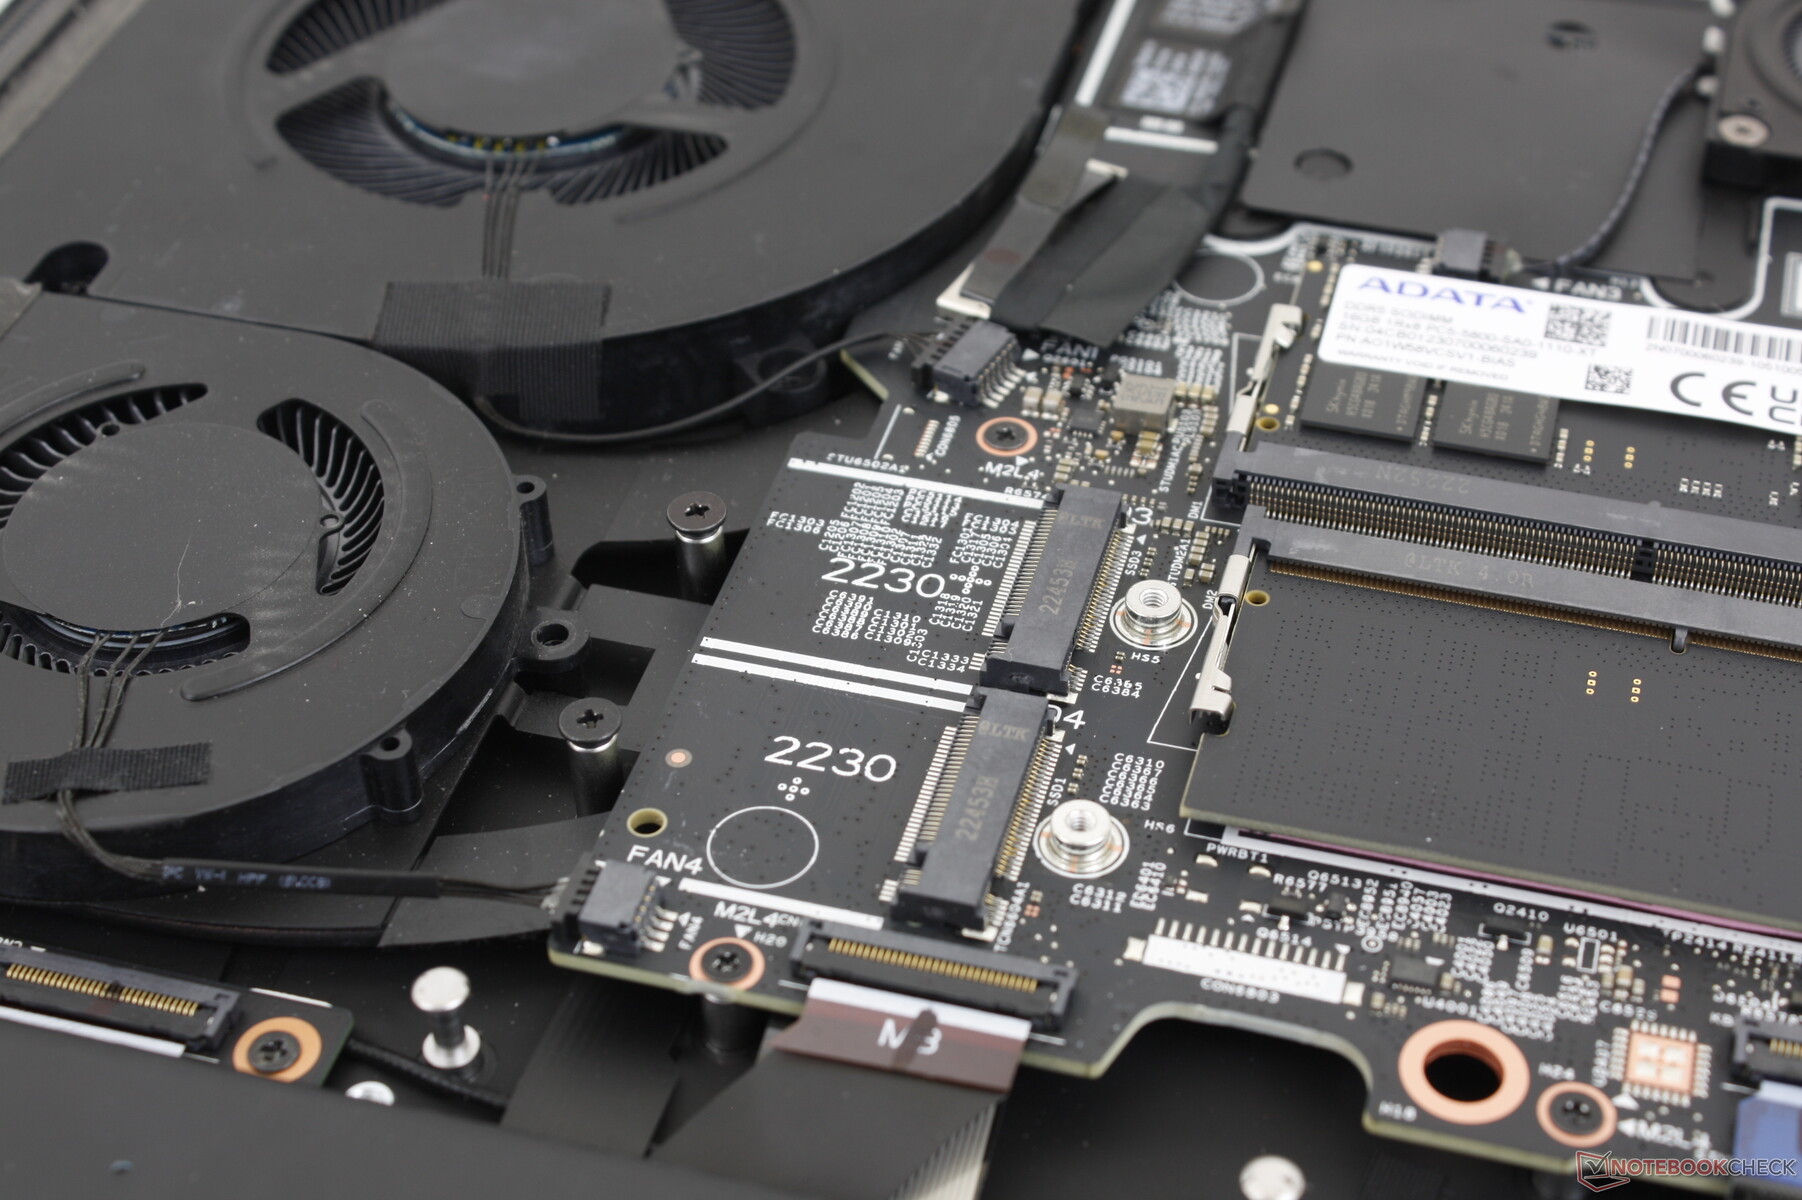
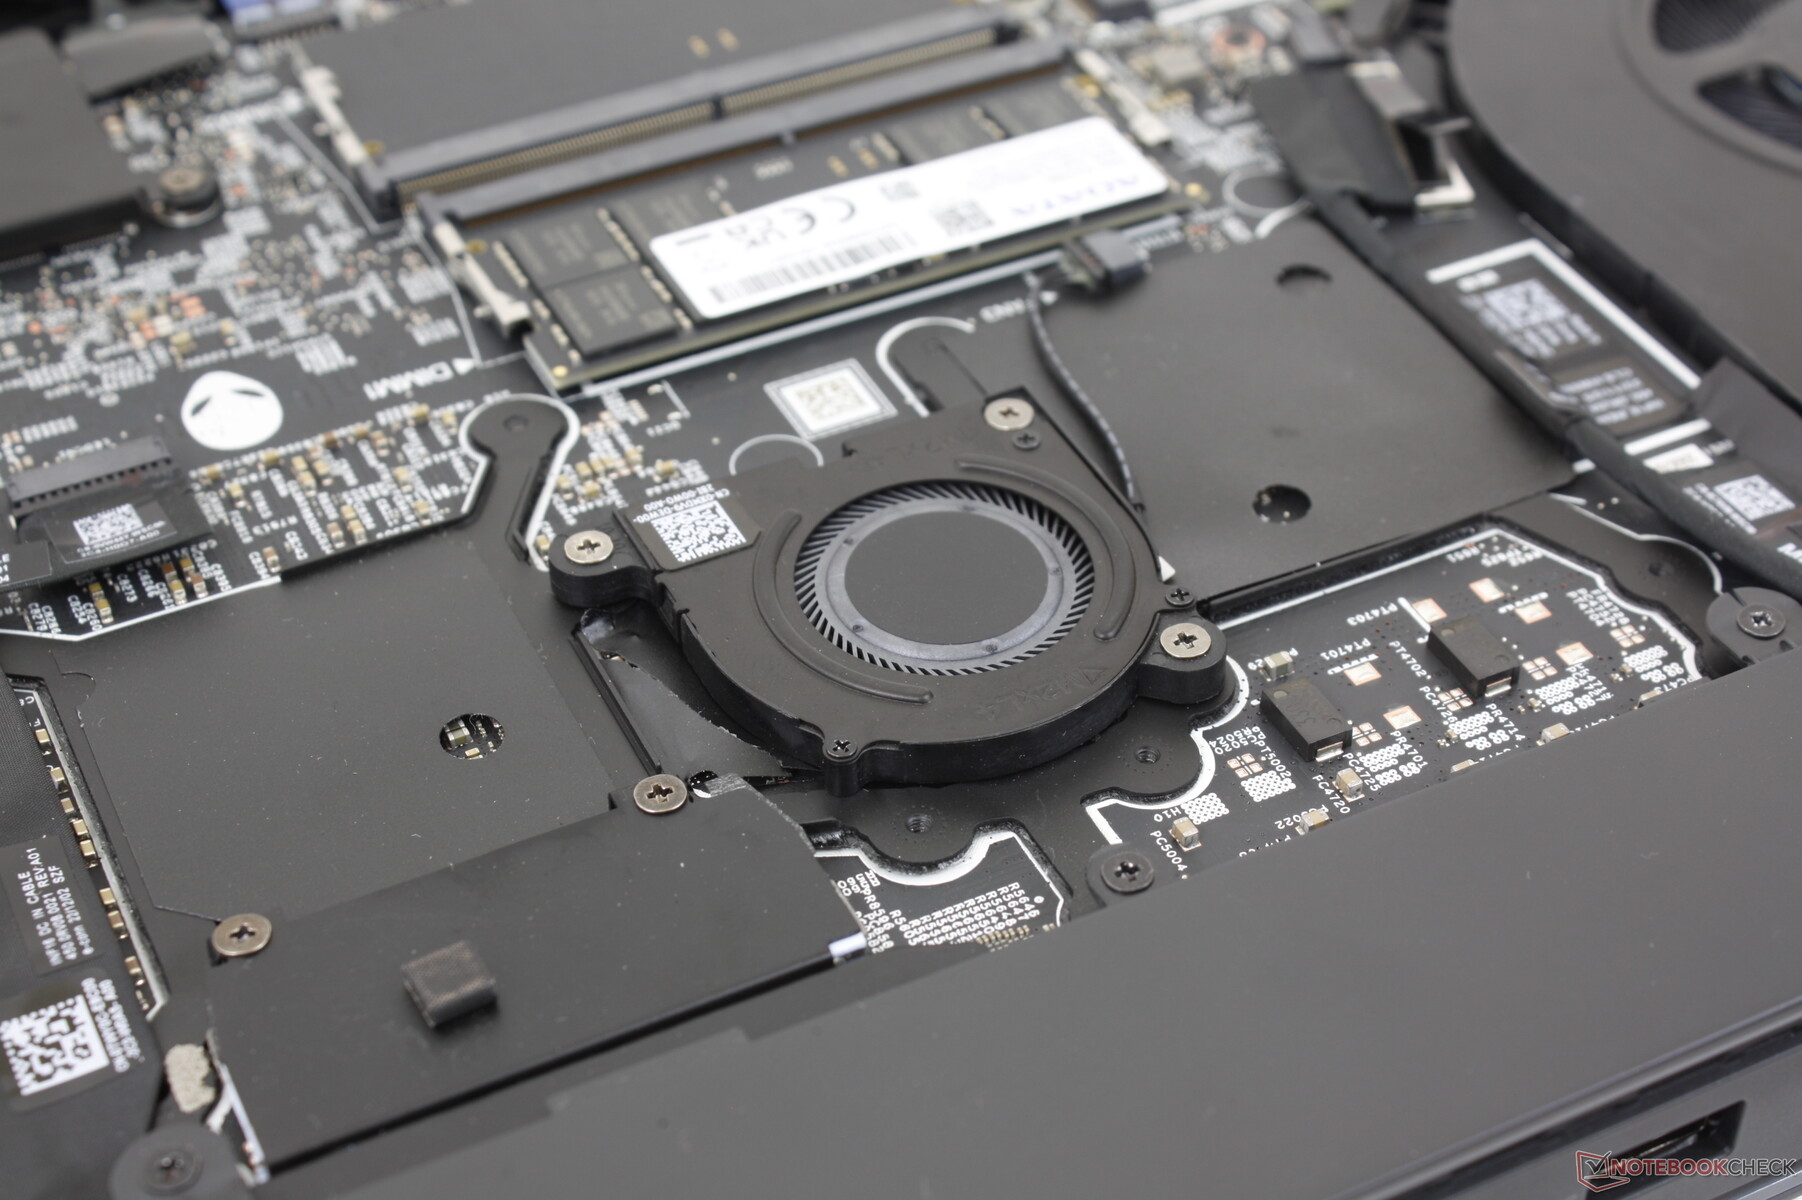
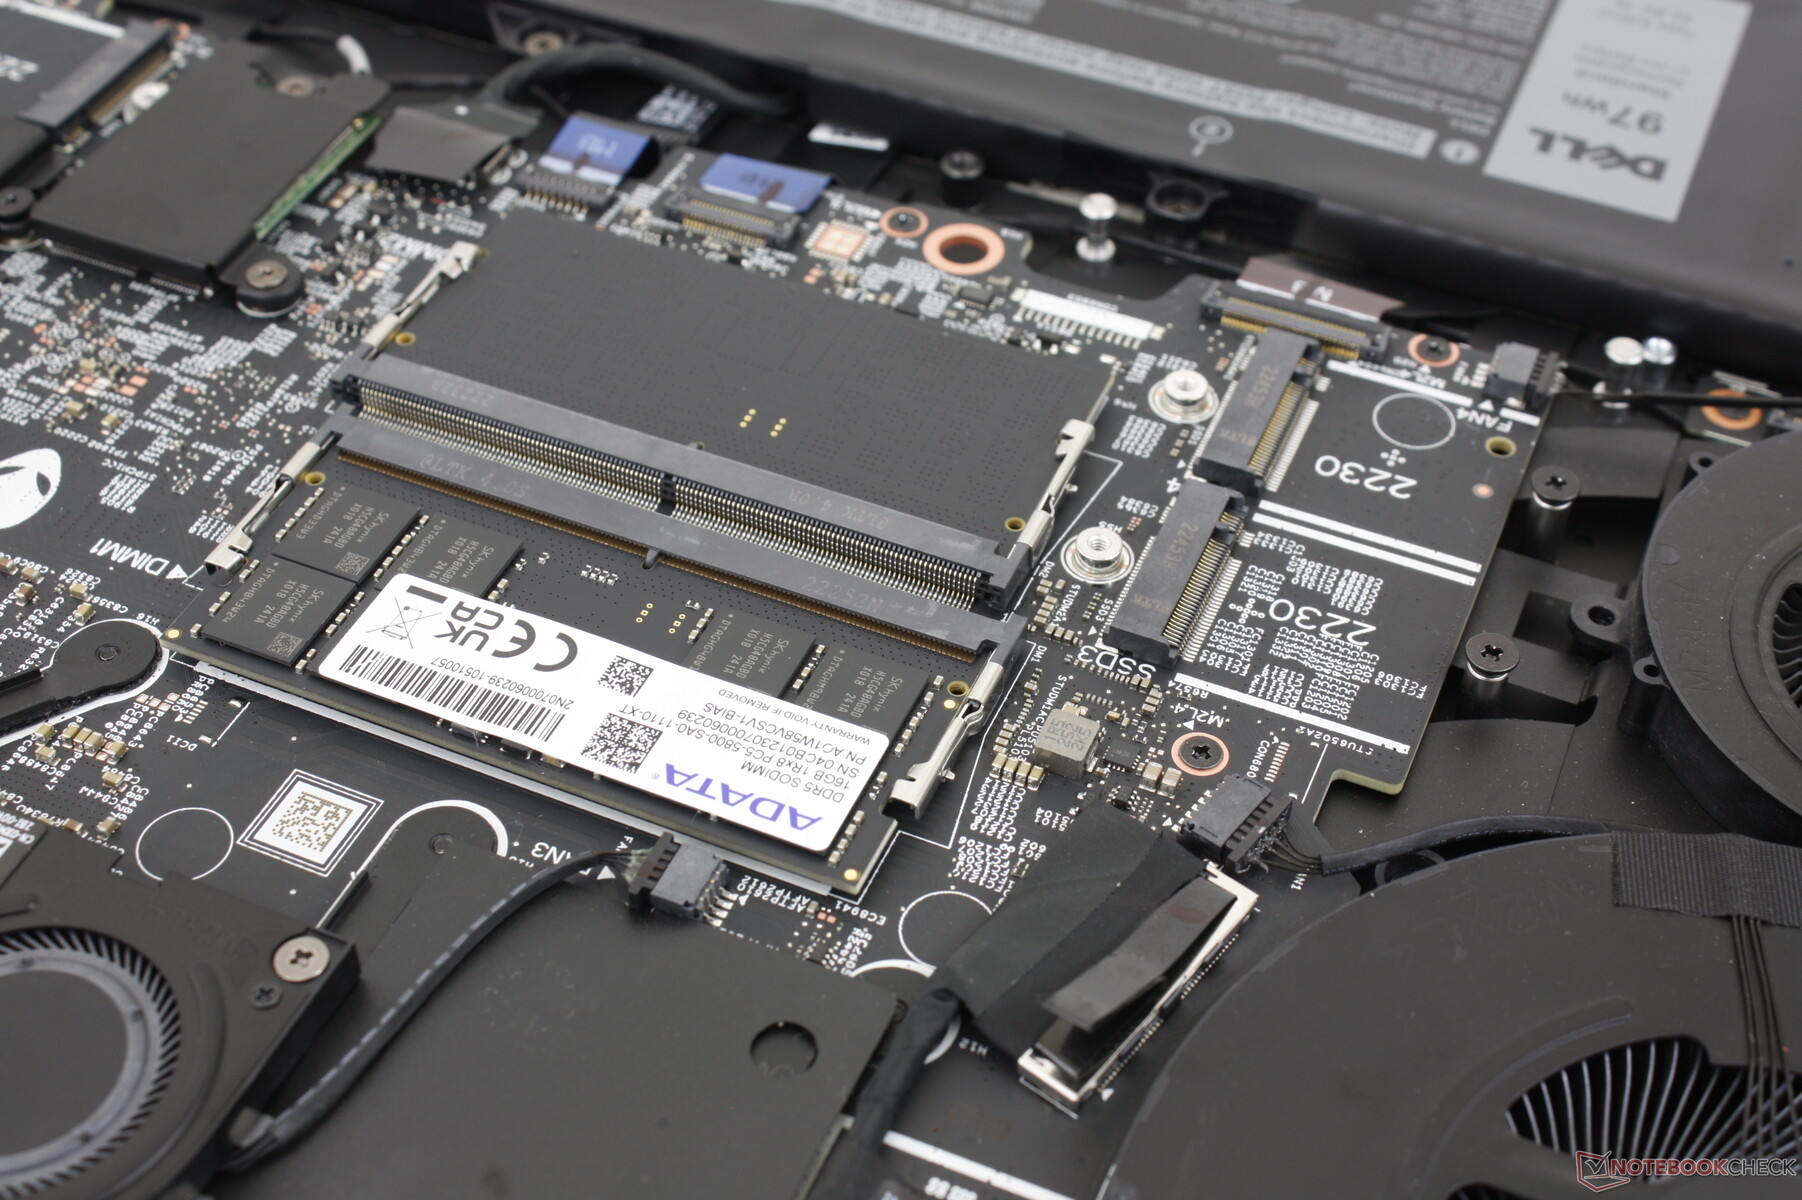
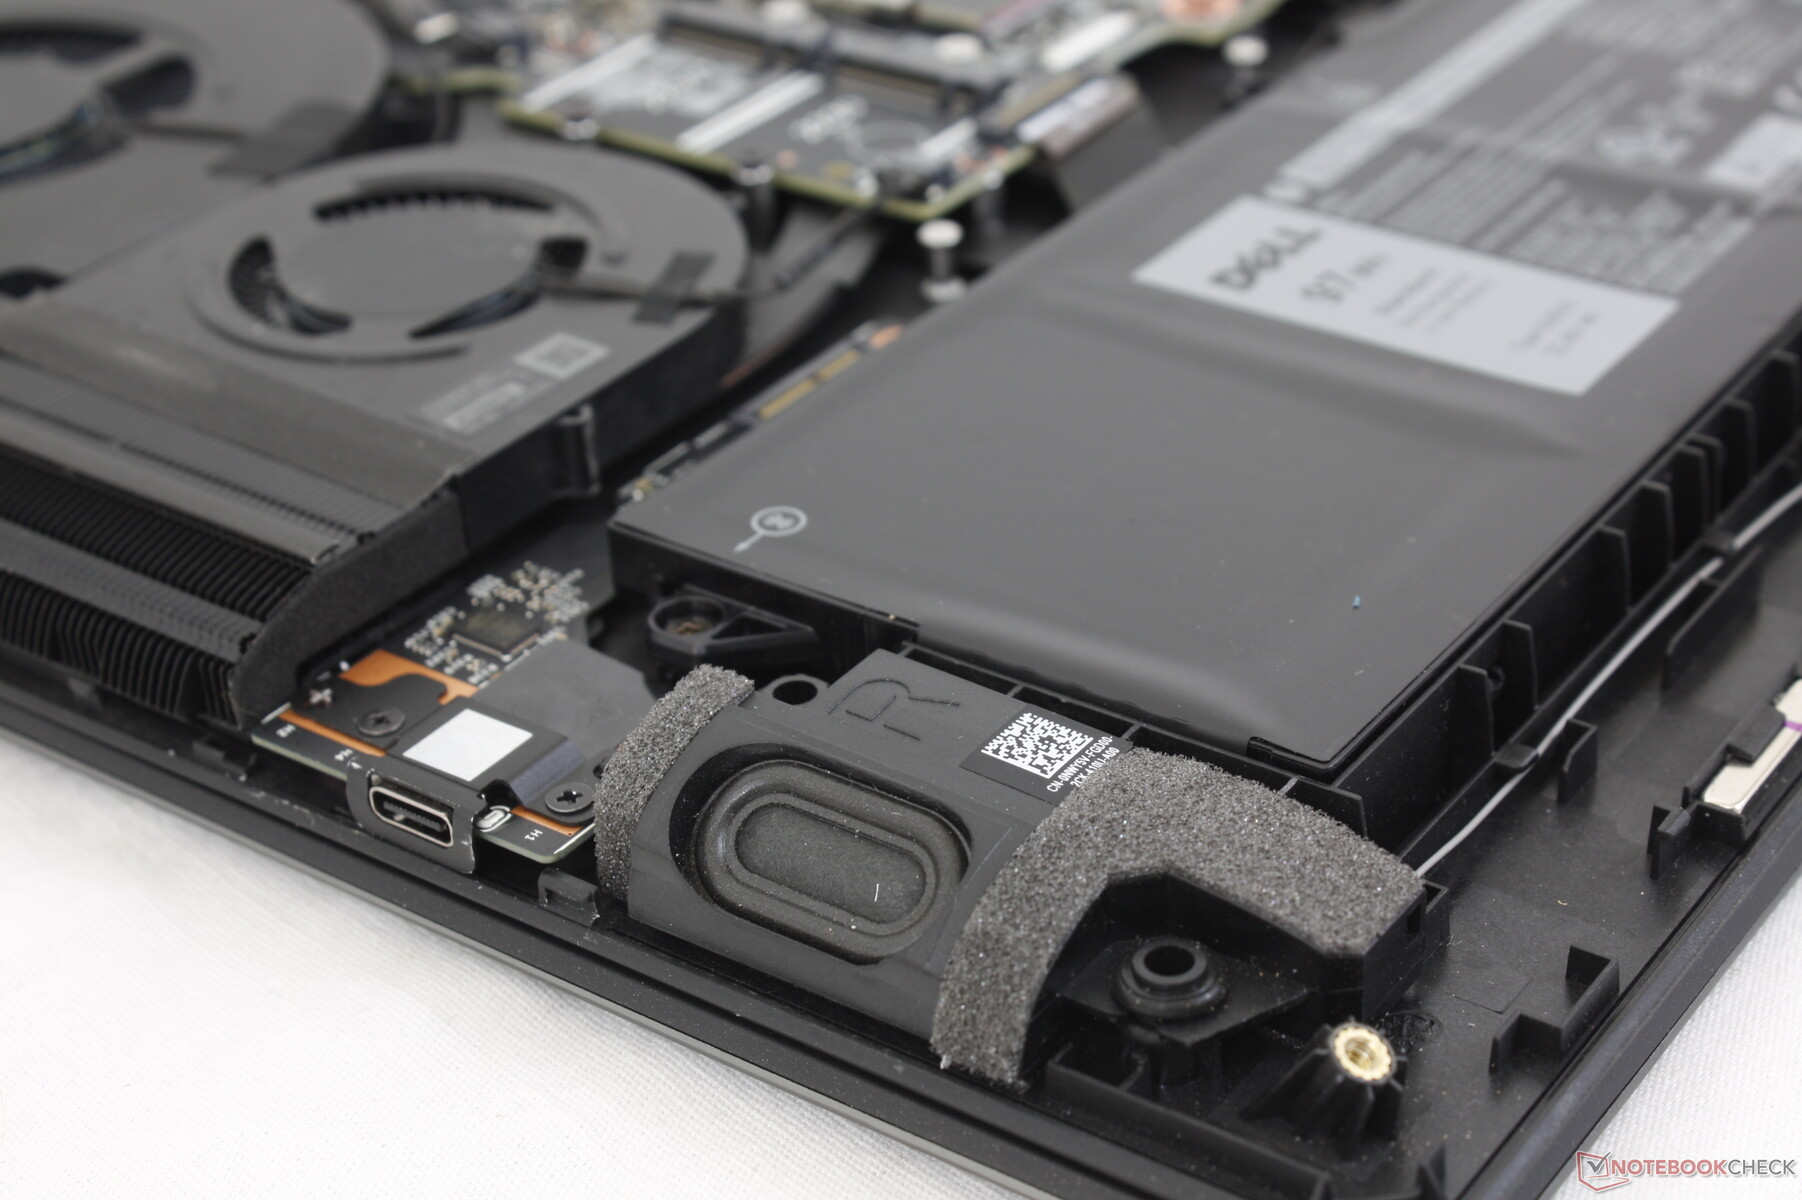
Maintenance
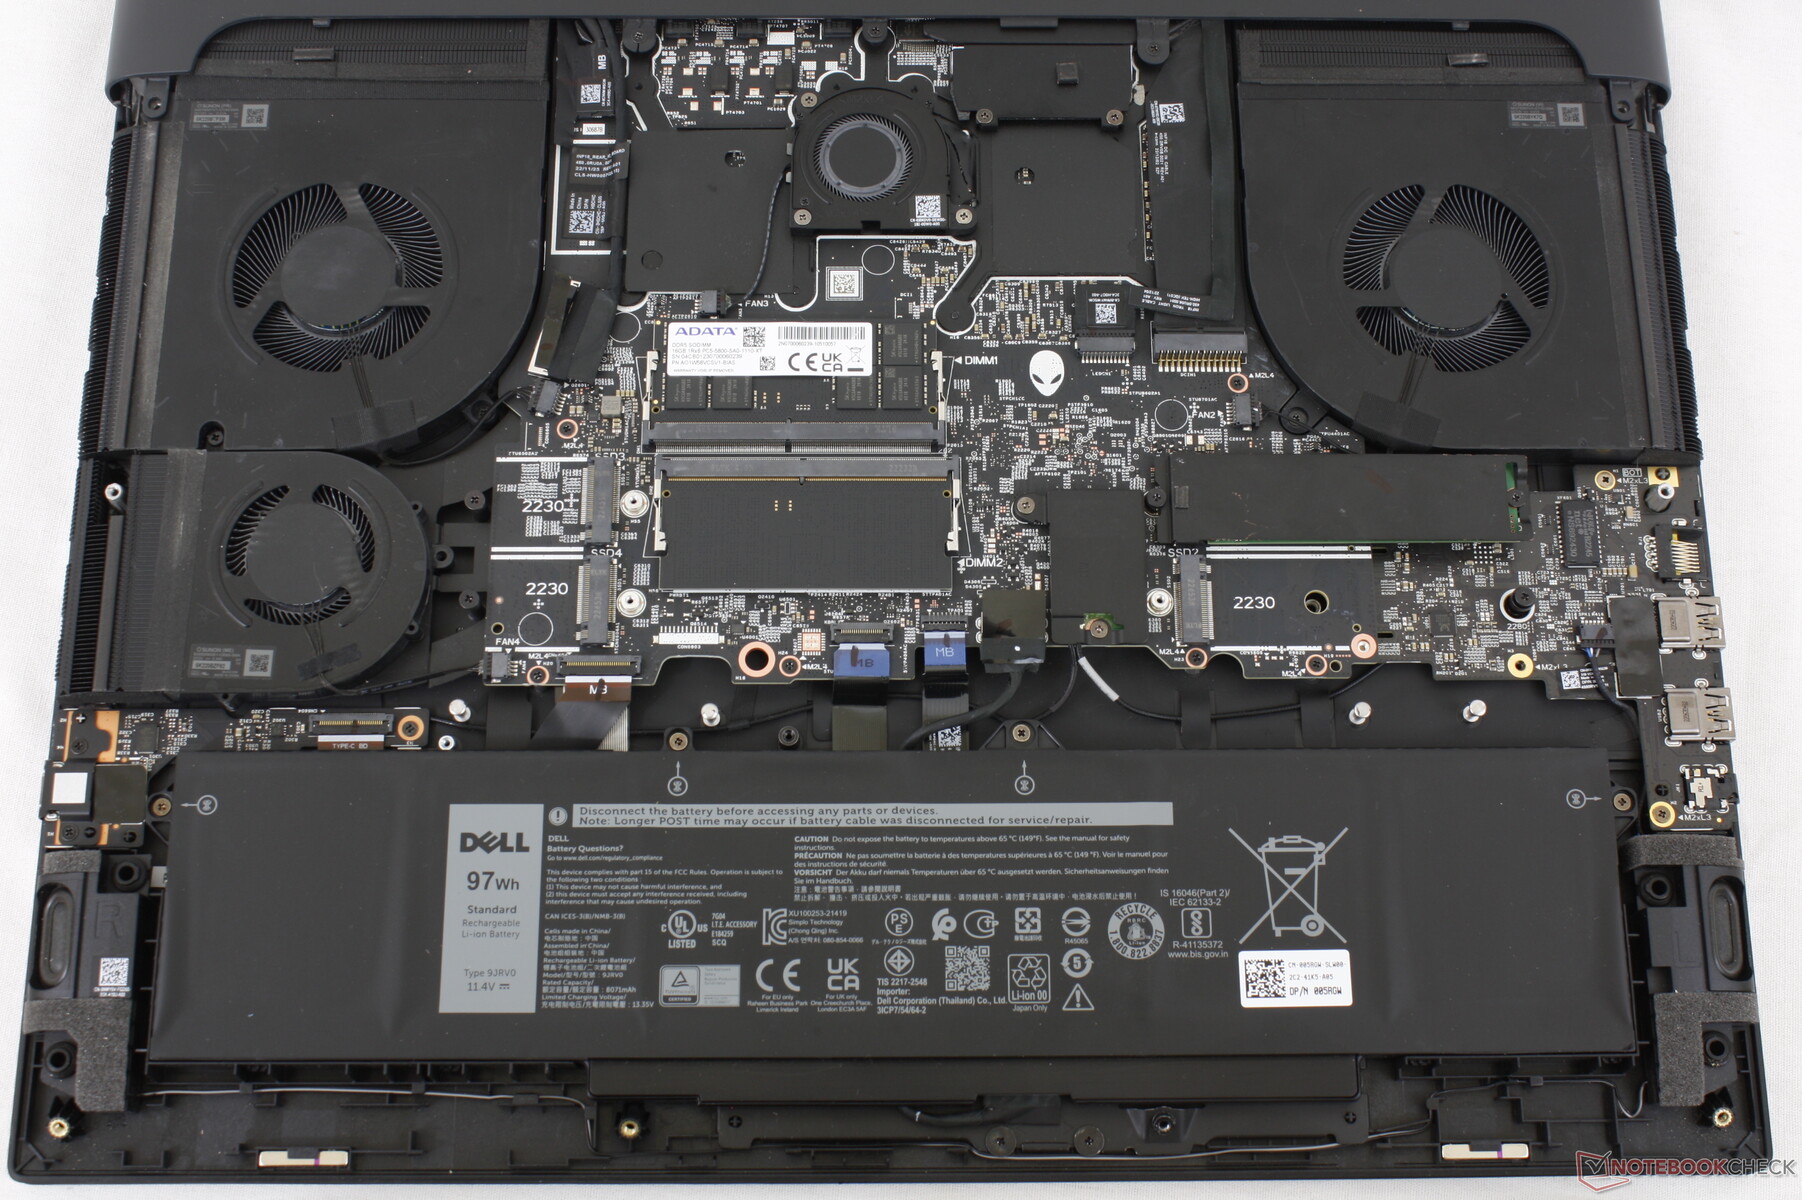
The bottom panel comes off very easily with just a Philips screwdriver. In comparison, the bottom panel on the new MSI GE78 requires more fiddling and tearing of an anti-tamper sticker.
Users have direct access to the battery, removable WLAN module, 4x M.2 SSD slots, and 2x DDR5 SODIMM slots. This is one of the very few laptops with support for four internal NVMe SSDs (2x M.2 2230 + 2x M.2 2280). It would have been interesting to see CAMM instead of SODIMM here especially since Dell has been championing the faster RAM technology.
Accessories and Warranty
There are no extras in the box other than the AC adapter and paperwork. Note that Dell has dropped its proprietary Alienware docking port and so the older Alienware eGPU docking station is no longer supported.
The standard one-year limited warranty applies if purchased in the US.
Input Devices — Comfortable Keyboard, Spongy Touchpad
Keyboard
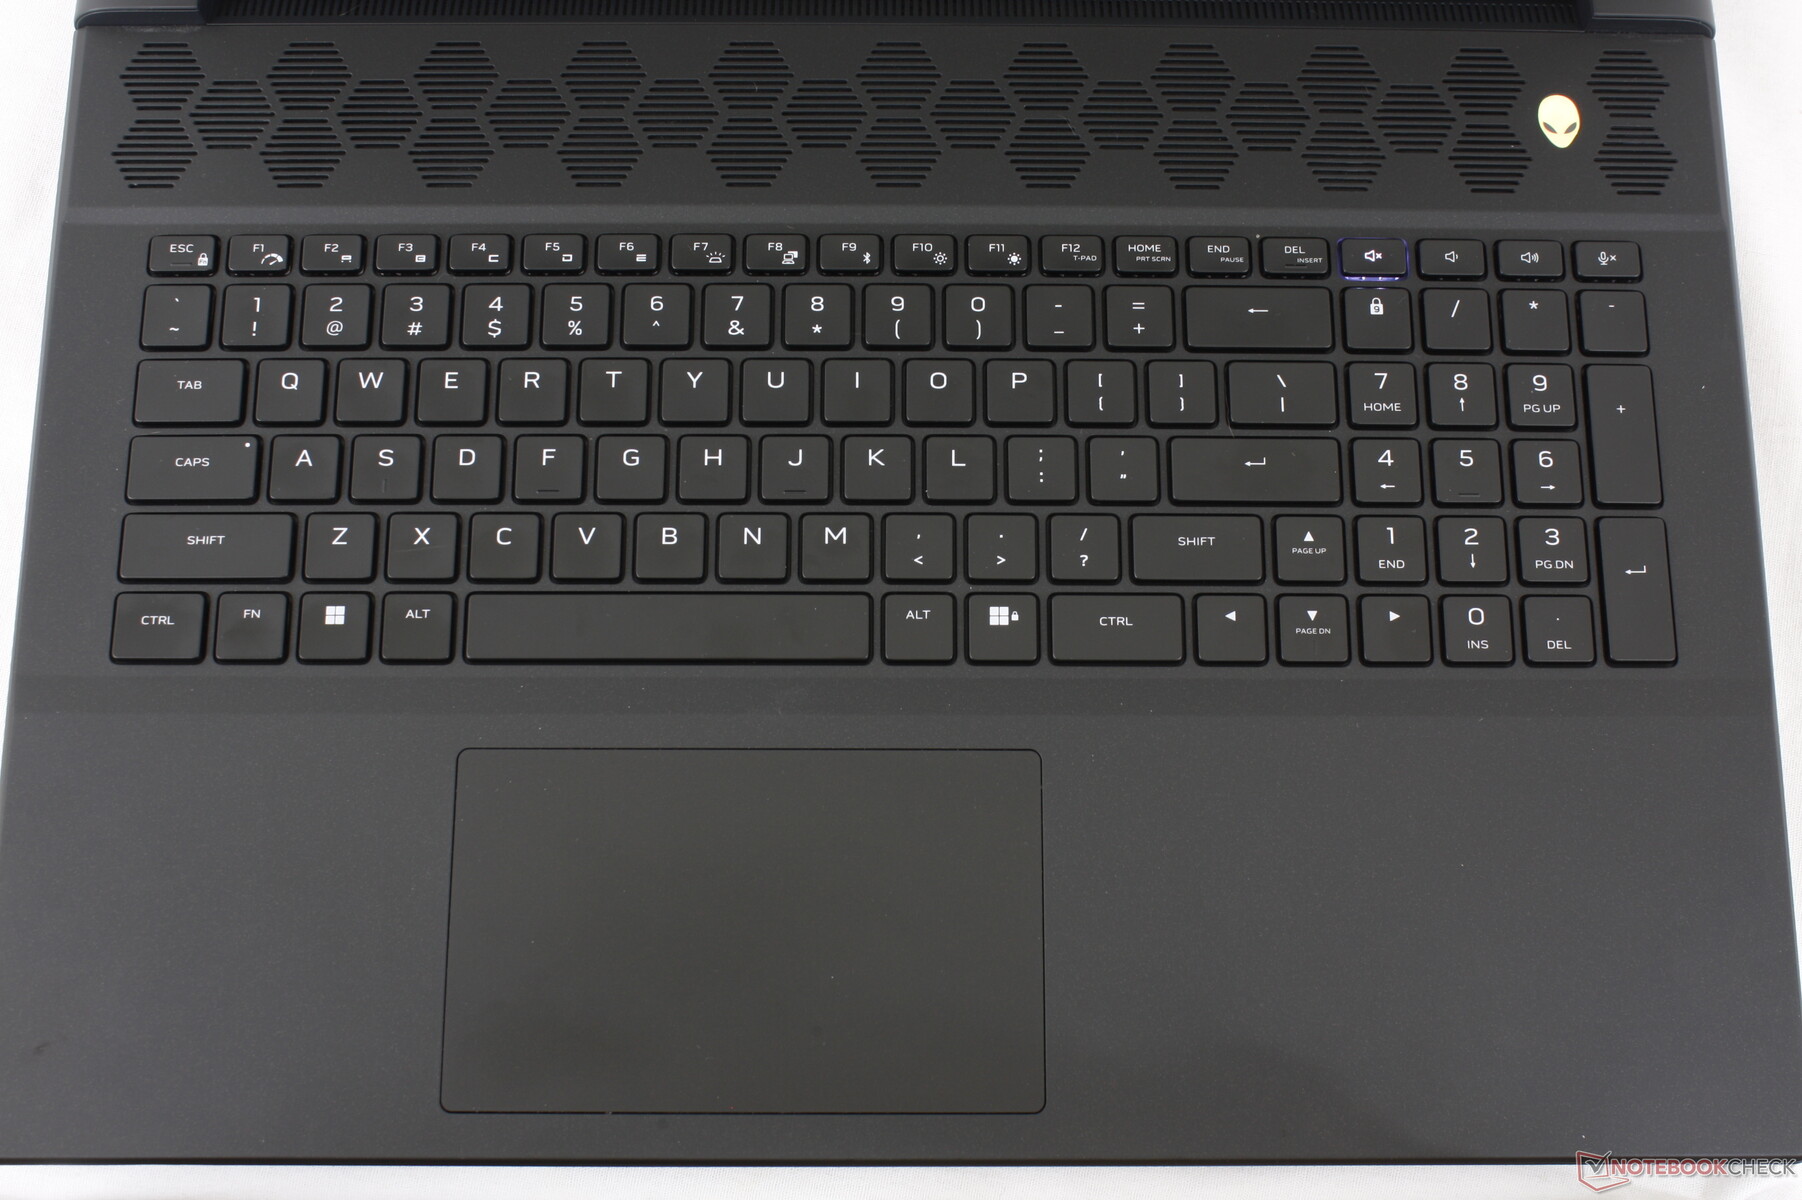
The membrane-based keys on our unit are probably the best we've used on any gaming laptop. Travel feels deeper and with firmer feedback than the keys on the MSI GE78 or Razer Blade 18. There's very little to complain about the keyboard here in terms of comfort.
The optional CherryMX mechanical switches are likely to be clickier but much louder. These switches are probably the same ones that Dell offers for the existing Alienware M15 and M17 series.
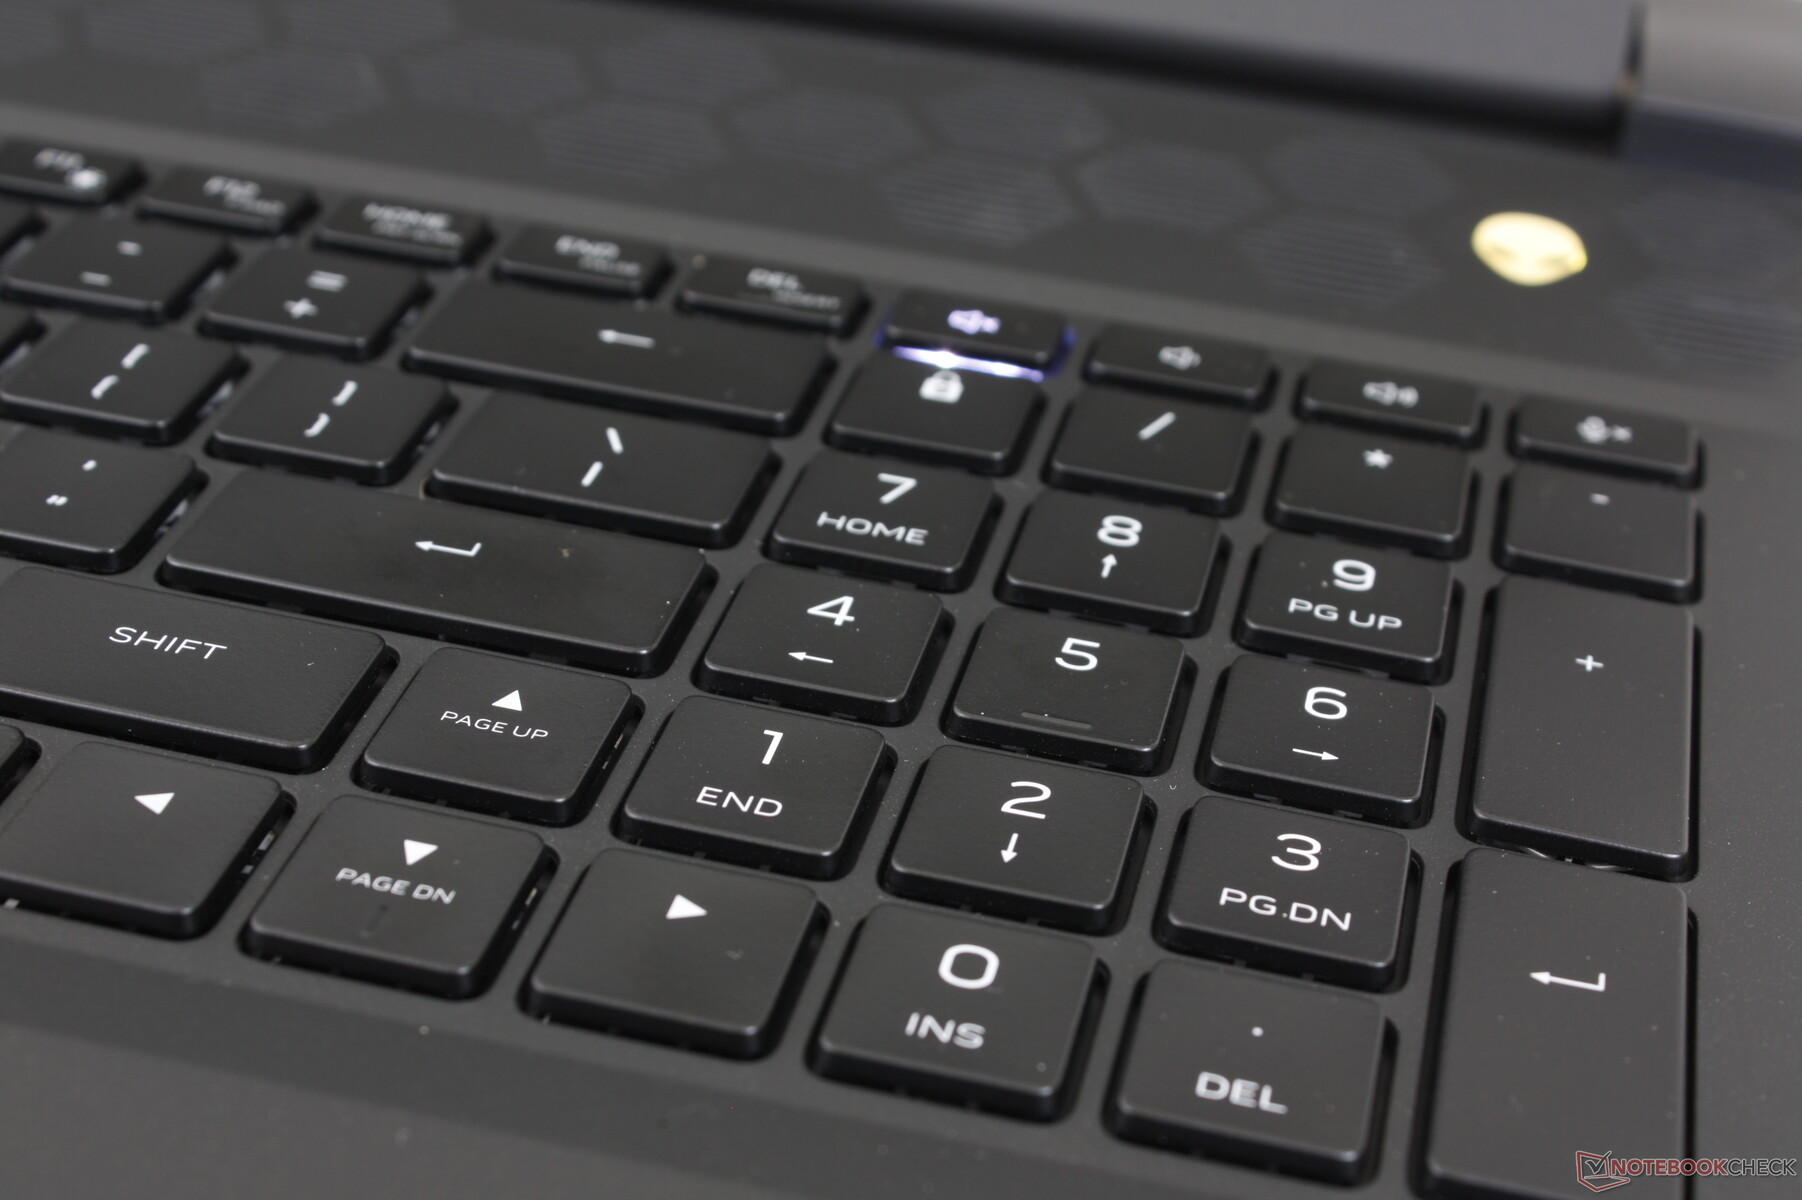
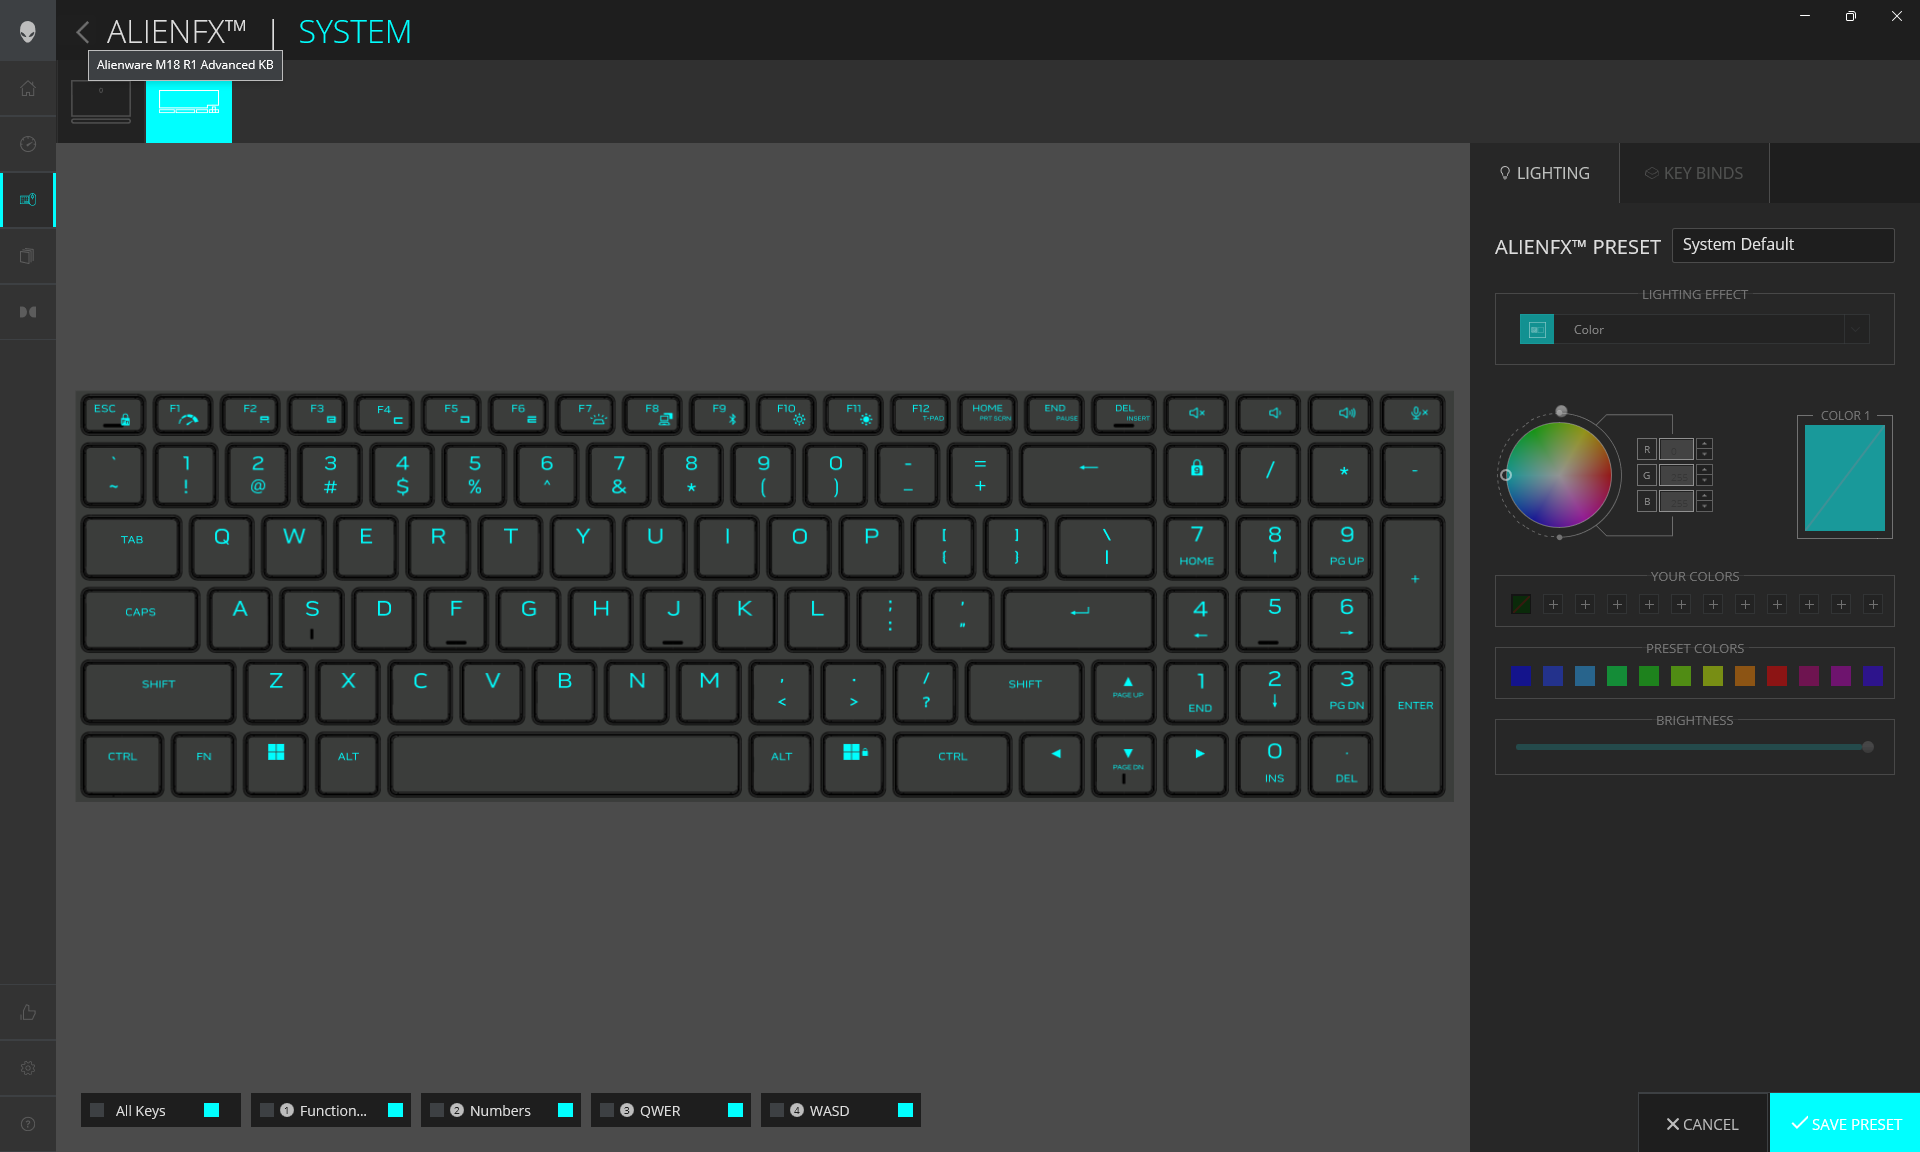
All key symbols are illuminated when the backlight is active unlike on older Alienware x15/x17 models where the secondary symbols are unlit.
Touchpad
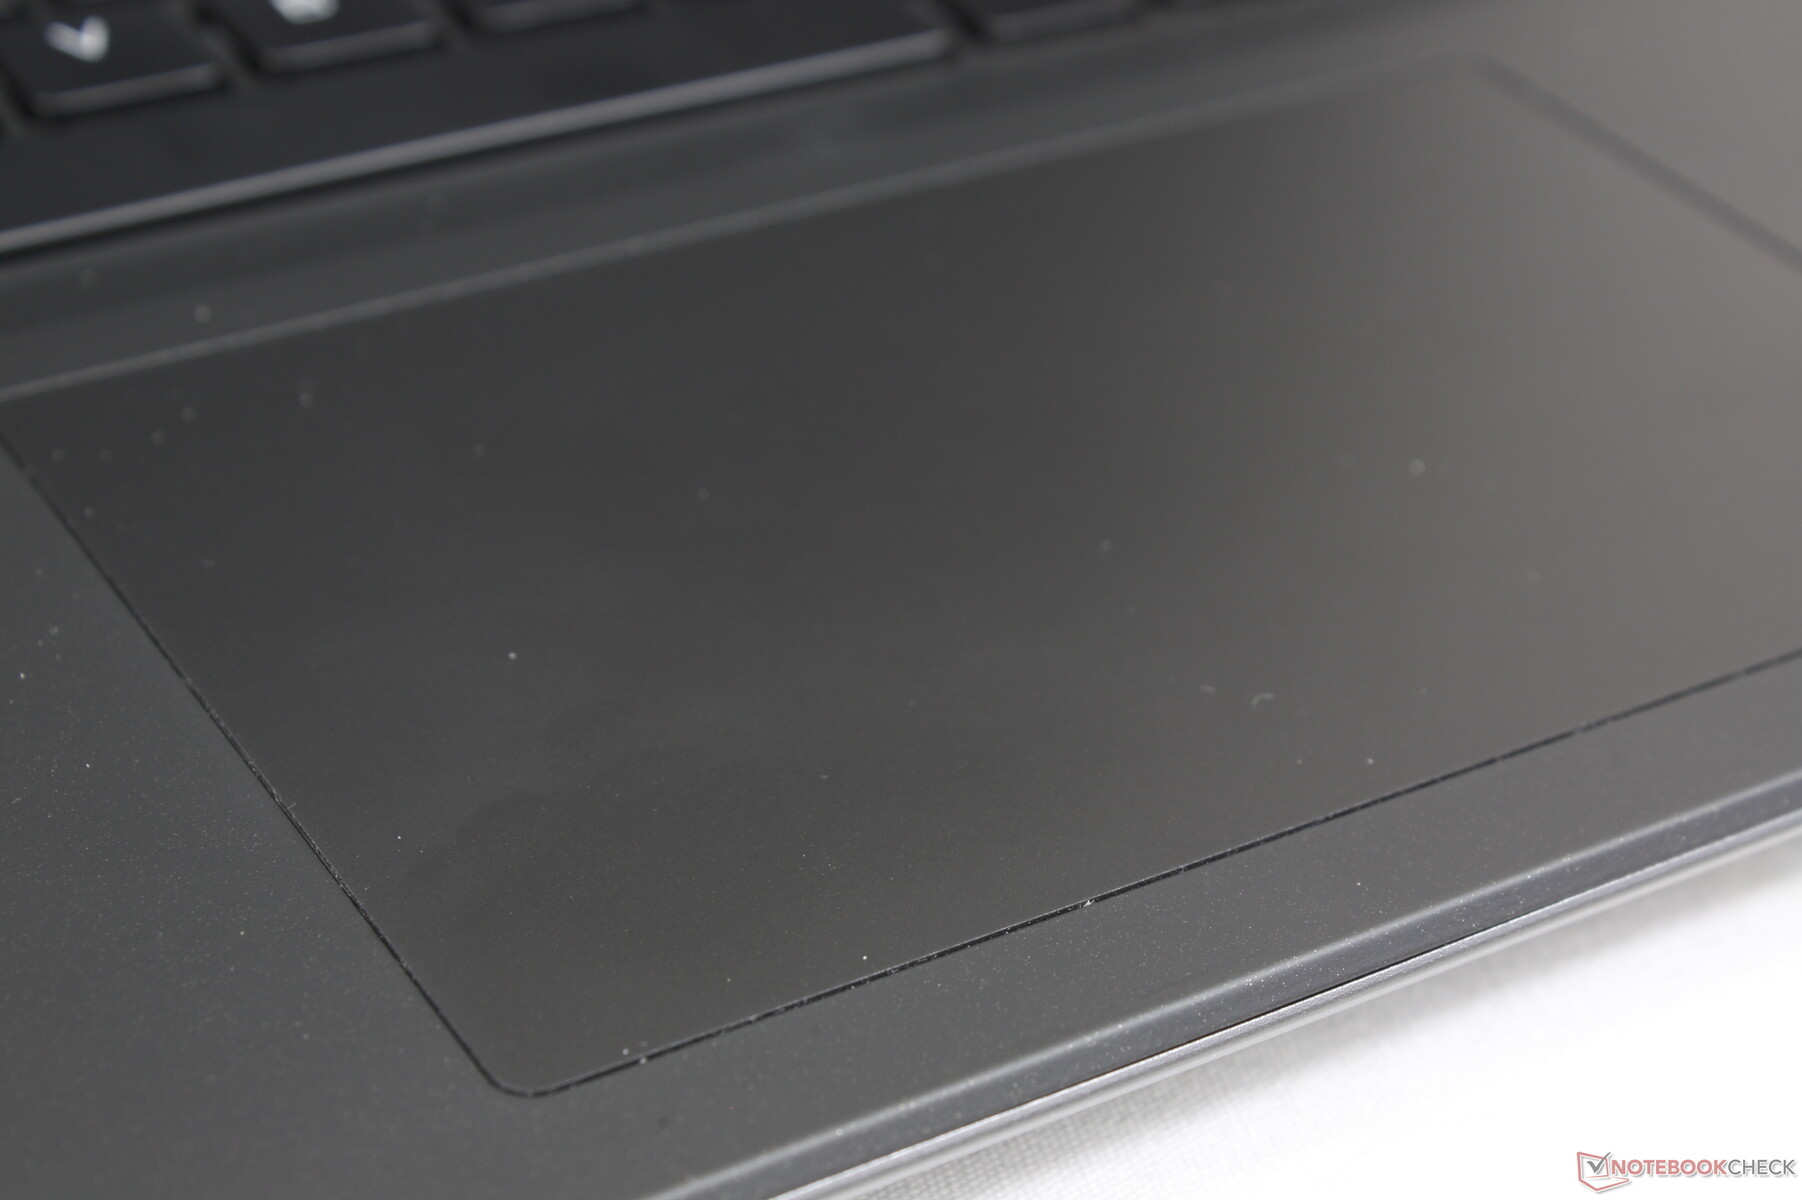
Surface area is nearly identical to the clickpad on the MSI GE78 (13.2 x 8 cm vs. 13 x 8.2 cm) despite the larger 18-inch form factor of the Alienware. Though traction is smooth with minimal sticking when gliding, feedback when clicking is on the soft side which makes the experience unsatisfying. Double-clicking can feel tiring as well since each click requires a bit more force from the finger than on most other laptops.

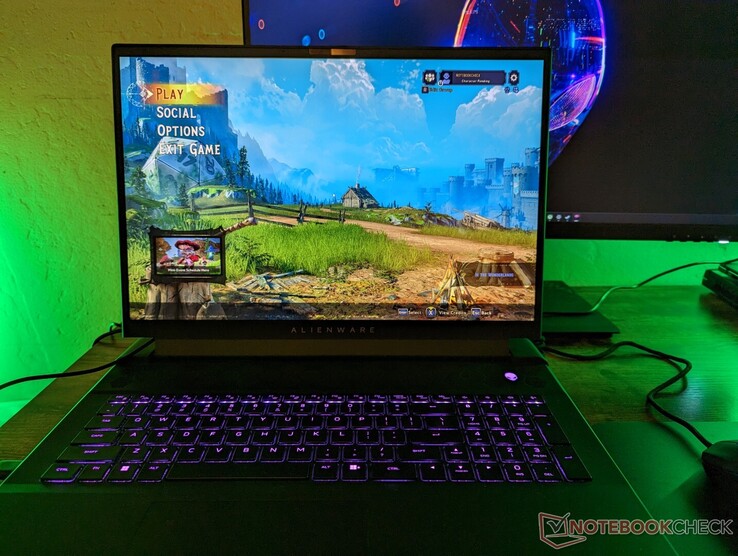
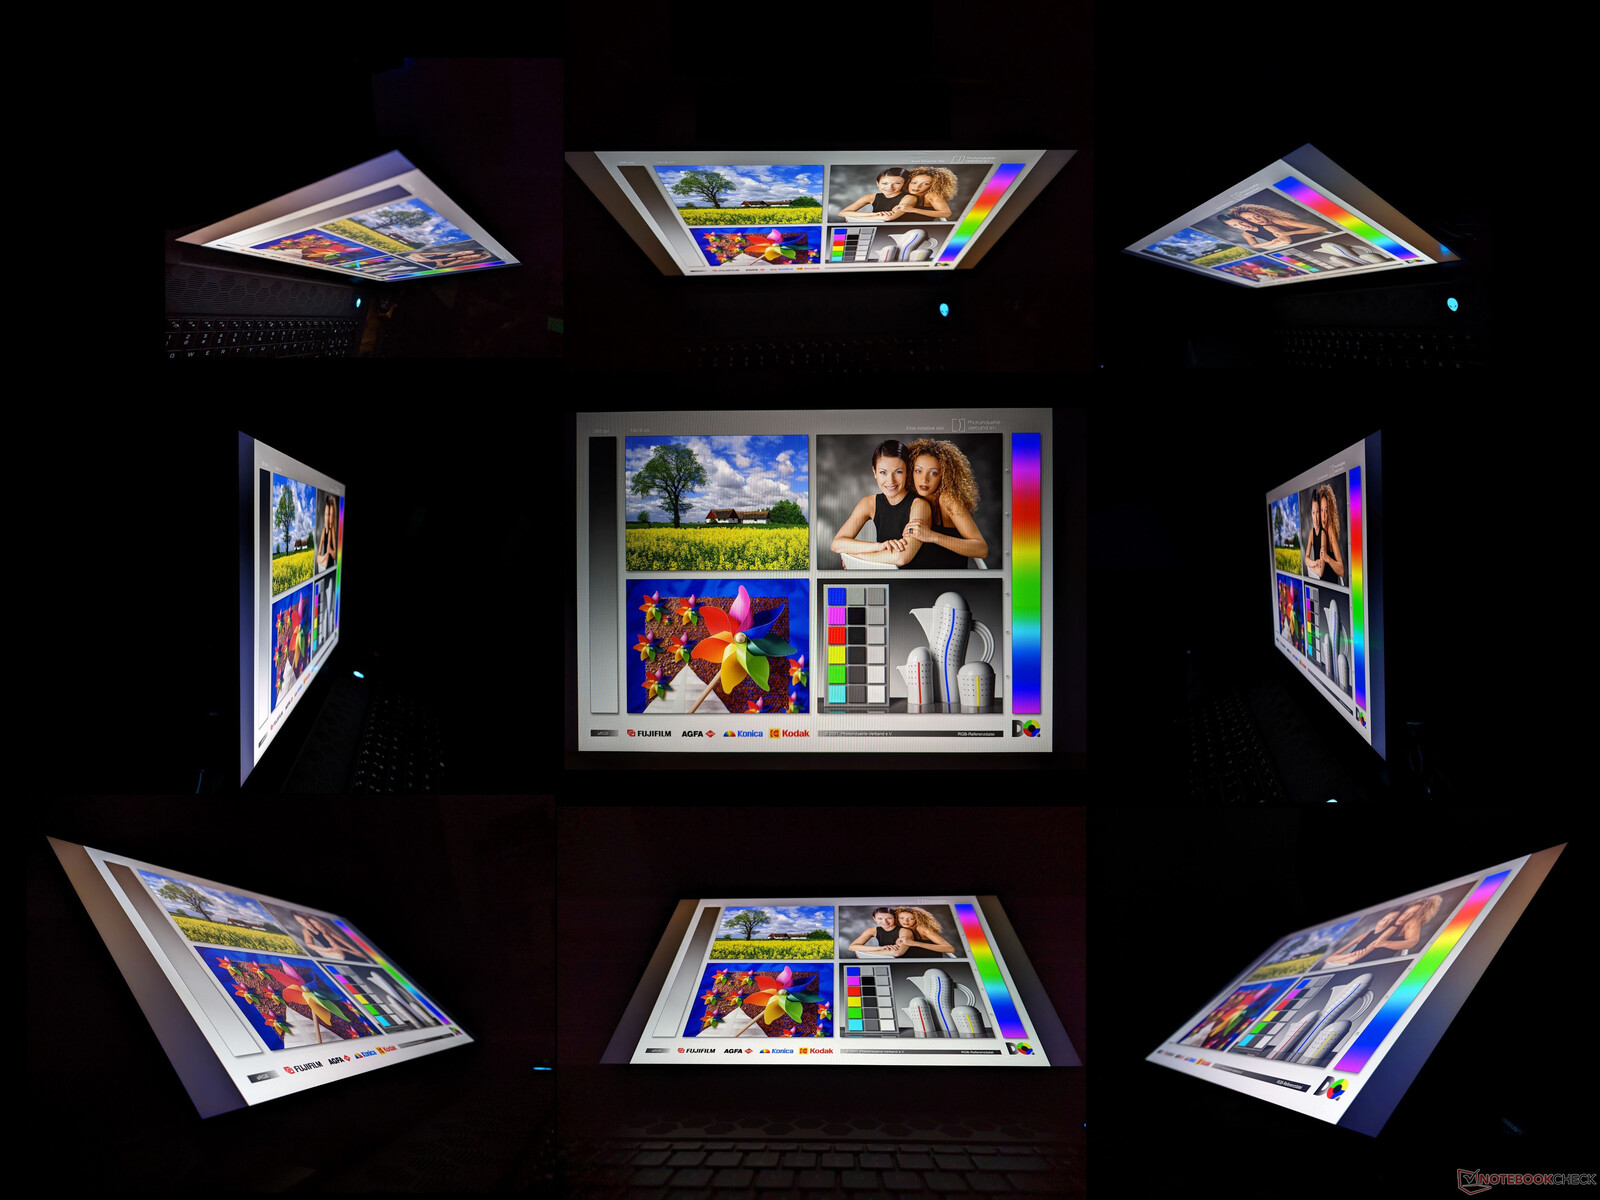
Display — Extremely Fast 480 Hz Refresh Rate
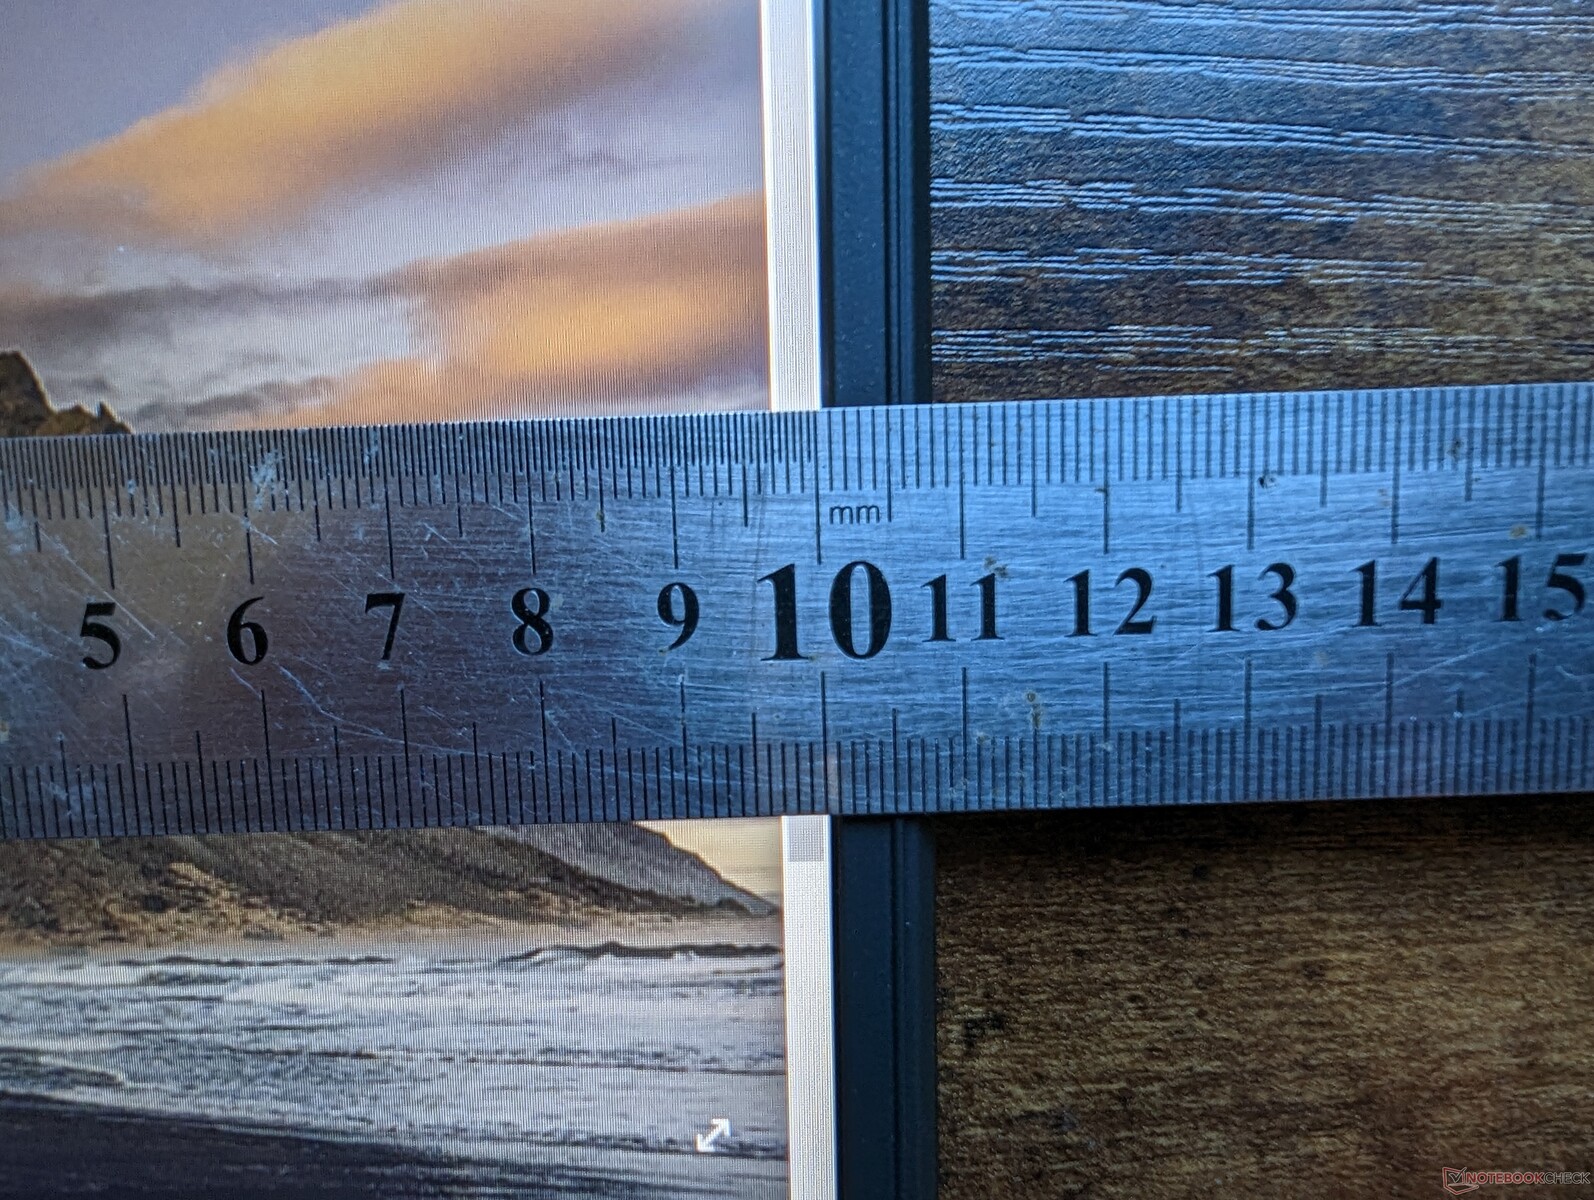
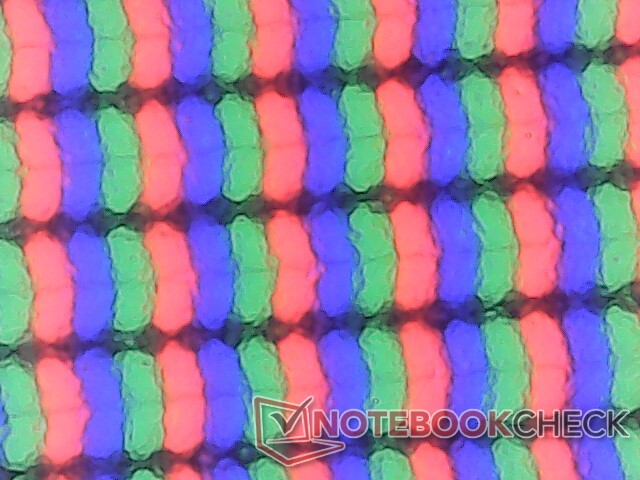
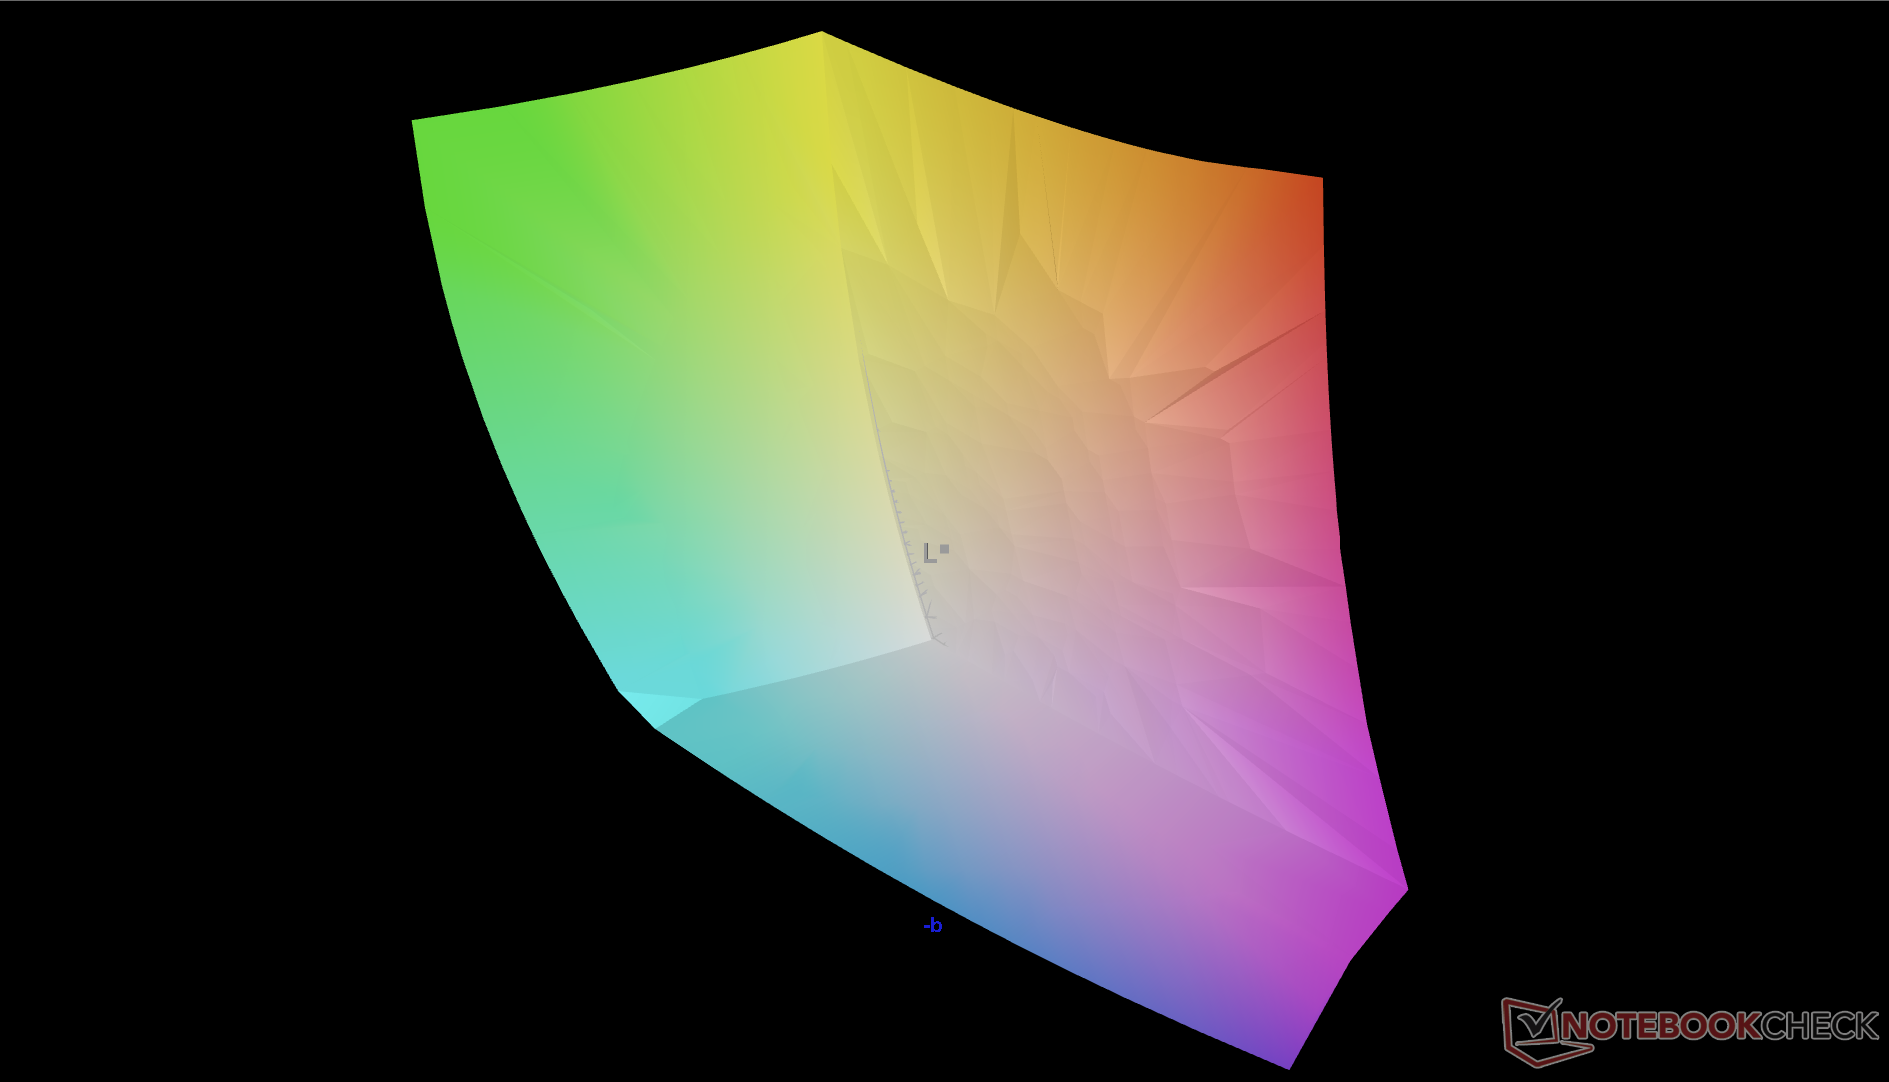
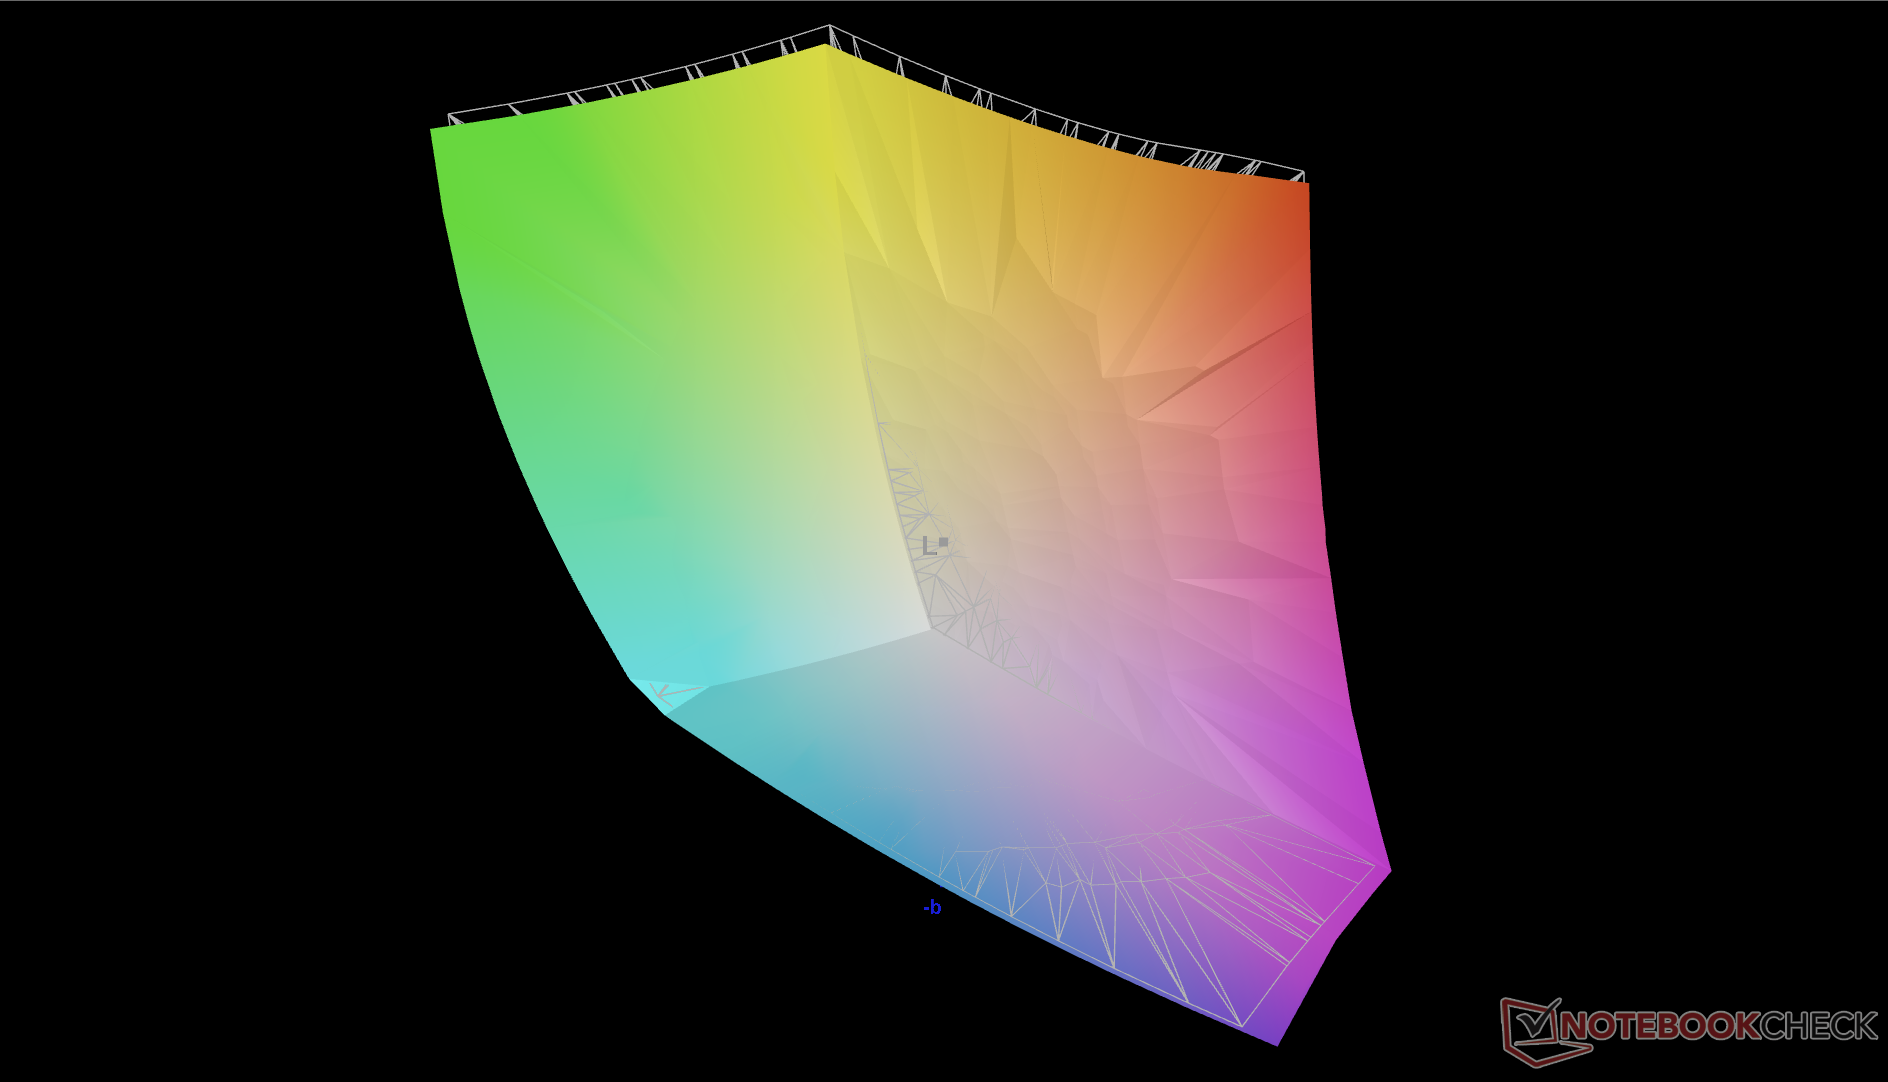
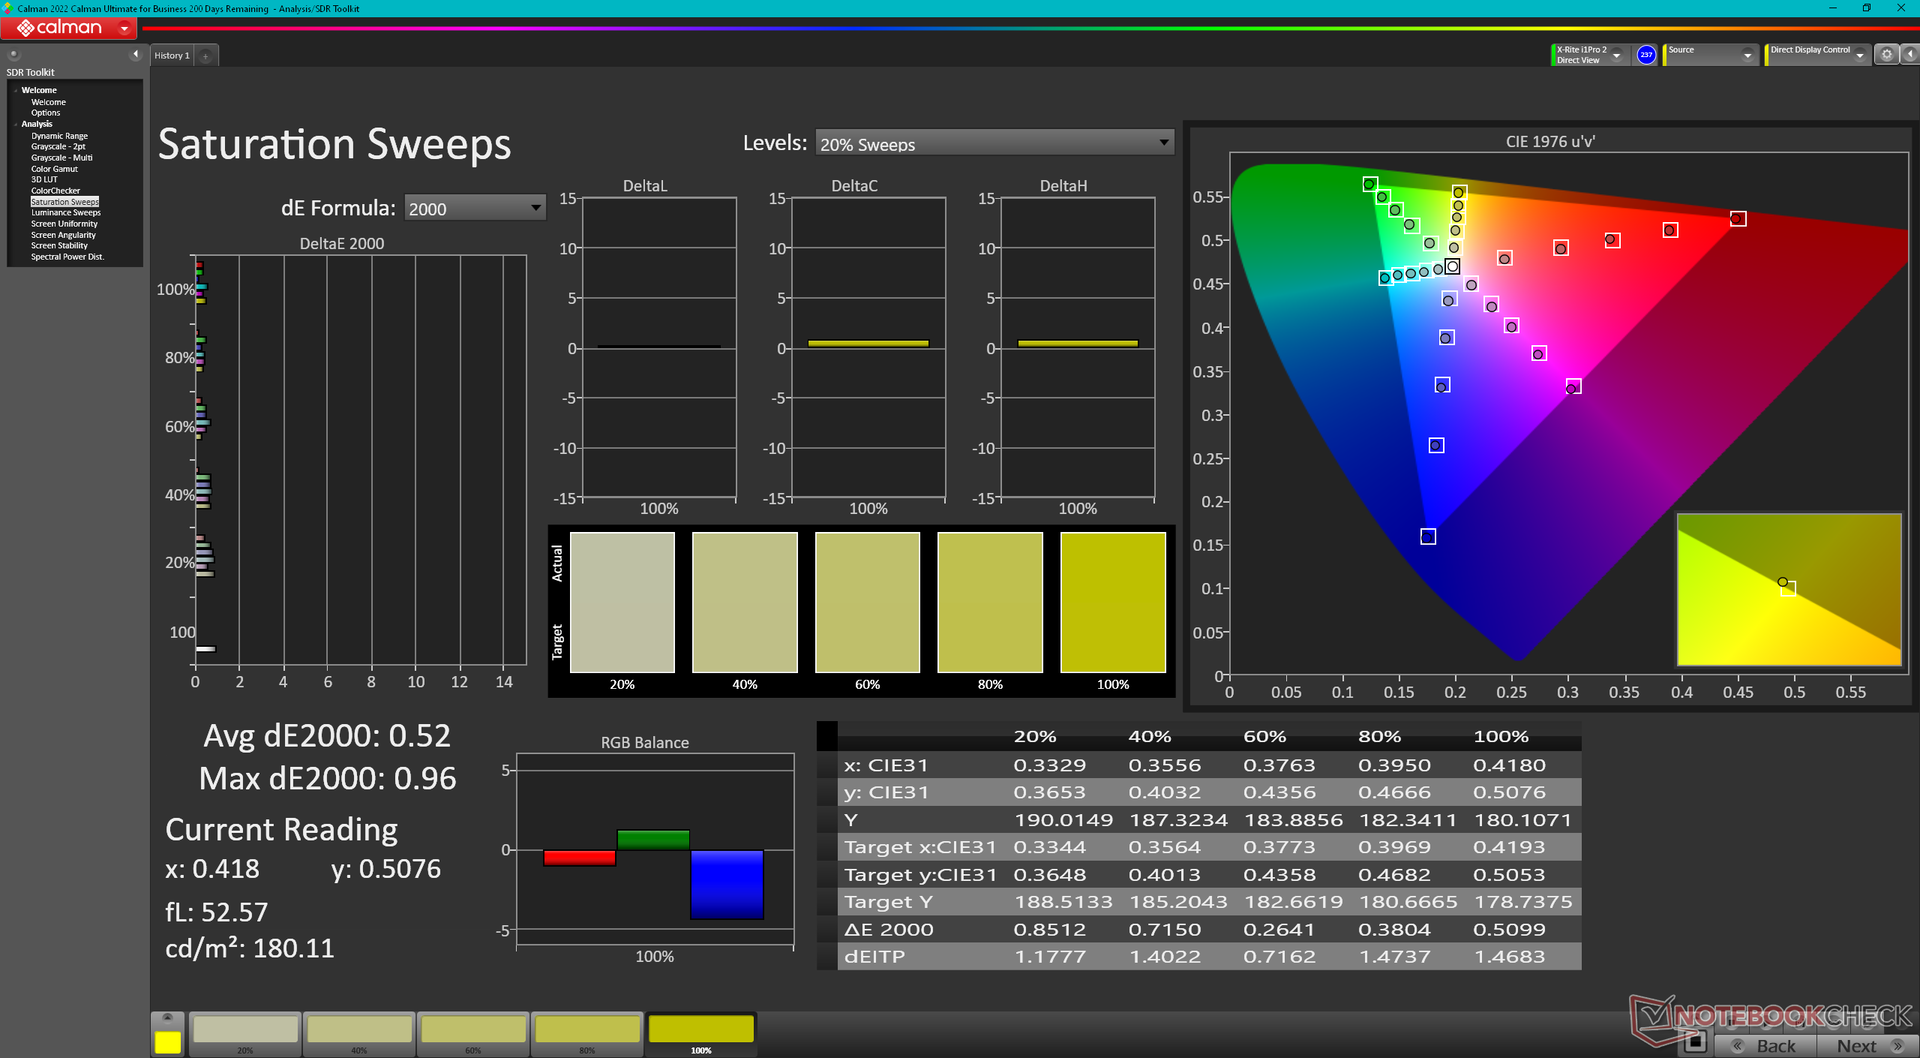
The Alienware ships with a 1200p Chi Mei 180JME panel in contrast to the 1600p AU Optronics B180QAN01.0 or BOE NE180QDM panels on the Razer Blade 18 and Asus ROG Strix Scar 18, respectively. The unique characteristic separating this Chi Mei panel from the other two is its 2x faster native refresh rate of 480 Hz instead of 240 Hz. Otherwise, all three panels share similar color coverages, pixel response times, and contrast ratios. The full P3 colors and fast refresh rate make this particular Alienware model suitable for both gaming and graphics editing alike.
A second display option is available with a higher 1600p native resolution but lower 165 Hz refresh rate.
| |||||||||||||||||||||||||
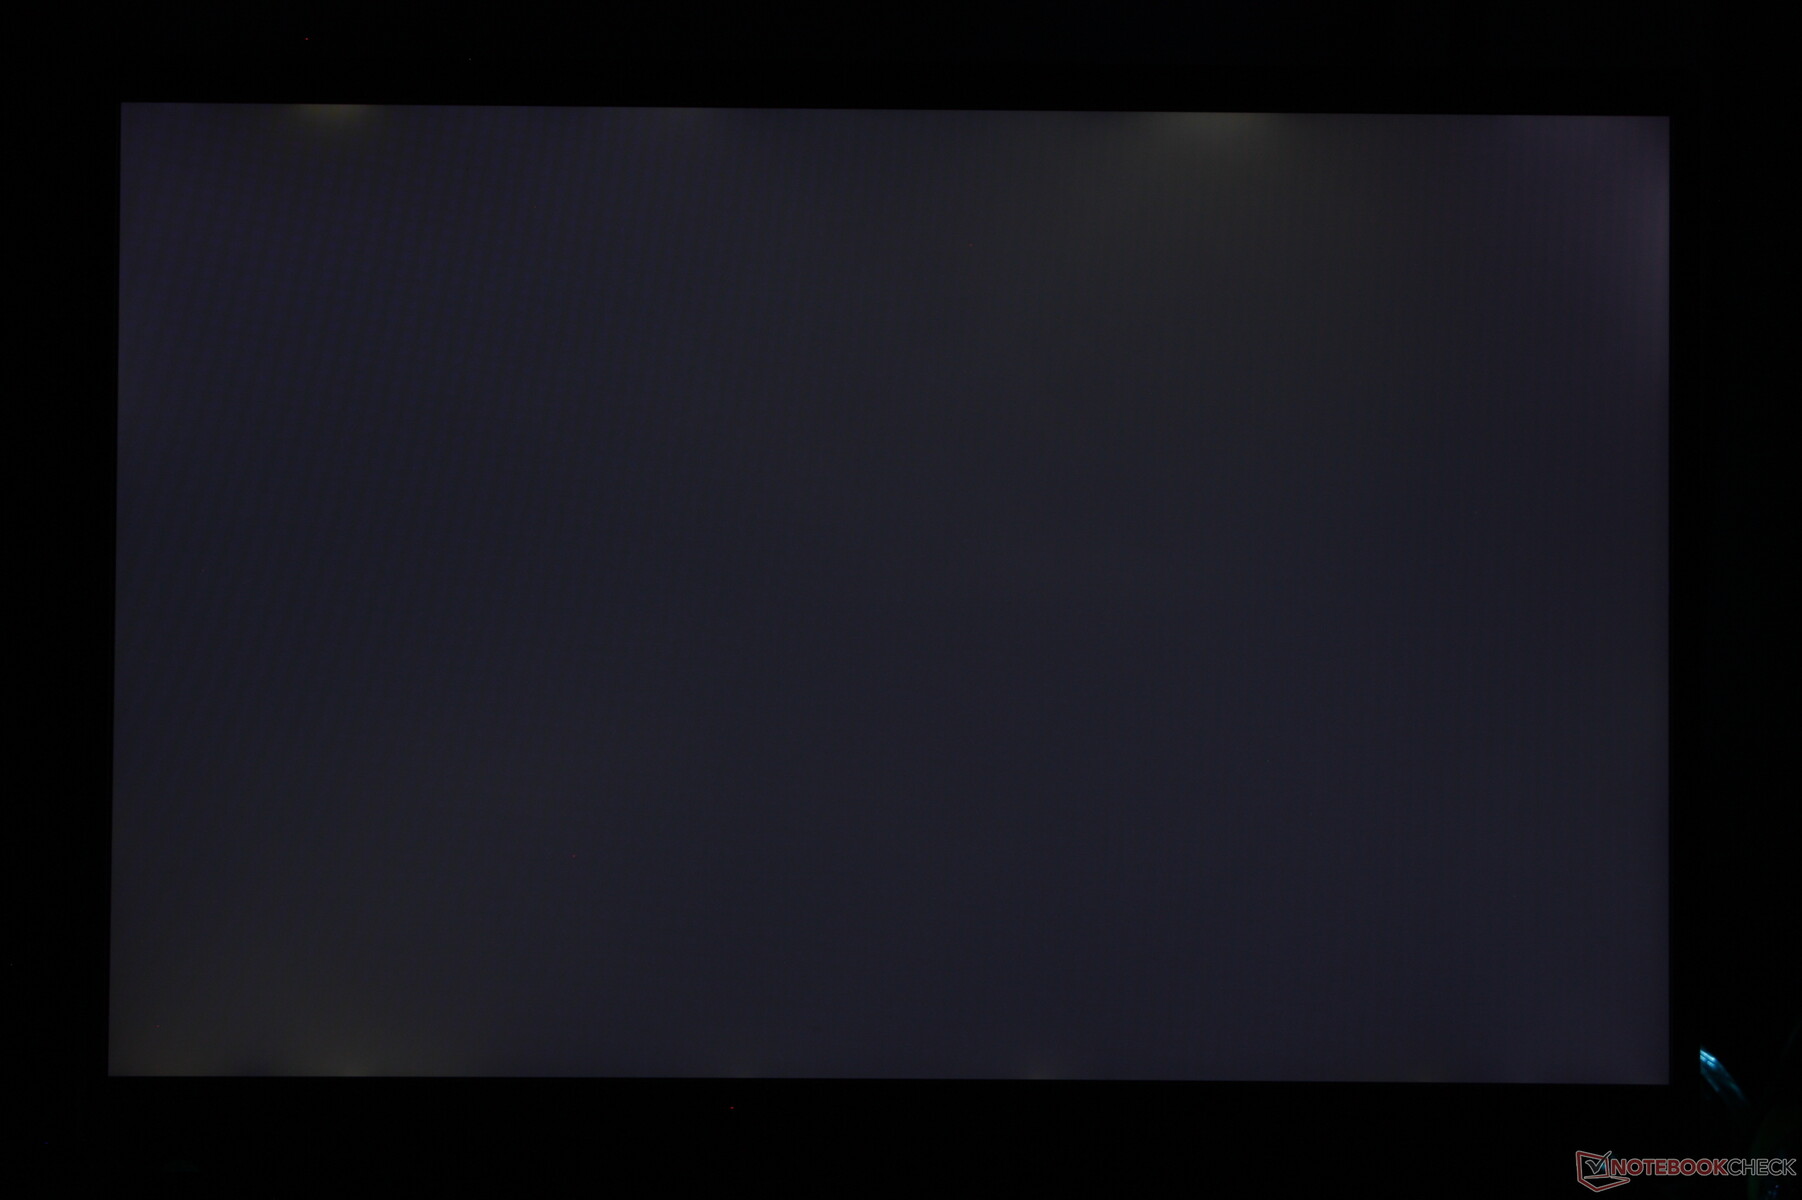
Brightness Distribution: 97 %
Center on Battery: 372.8 cd/m²
Contrast: 1165:1 (Black: 0.32 cd/m²)
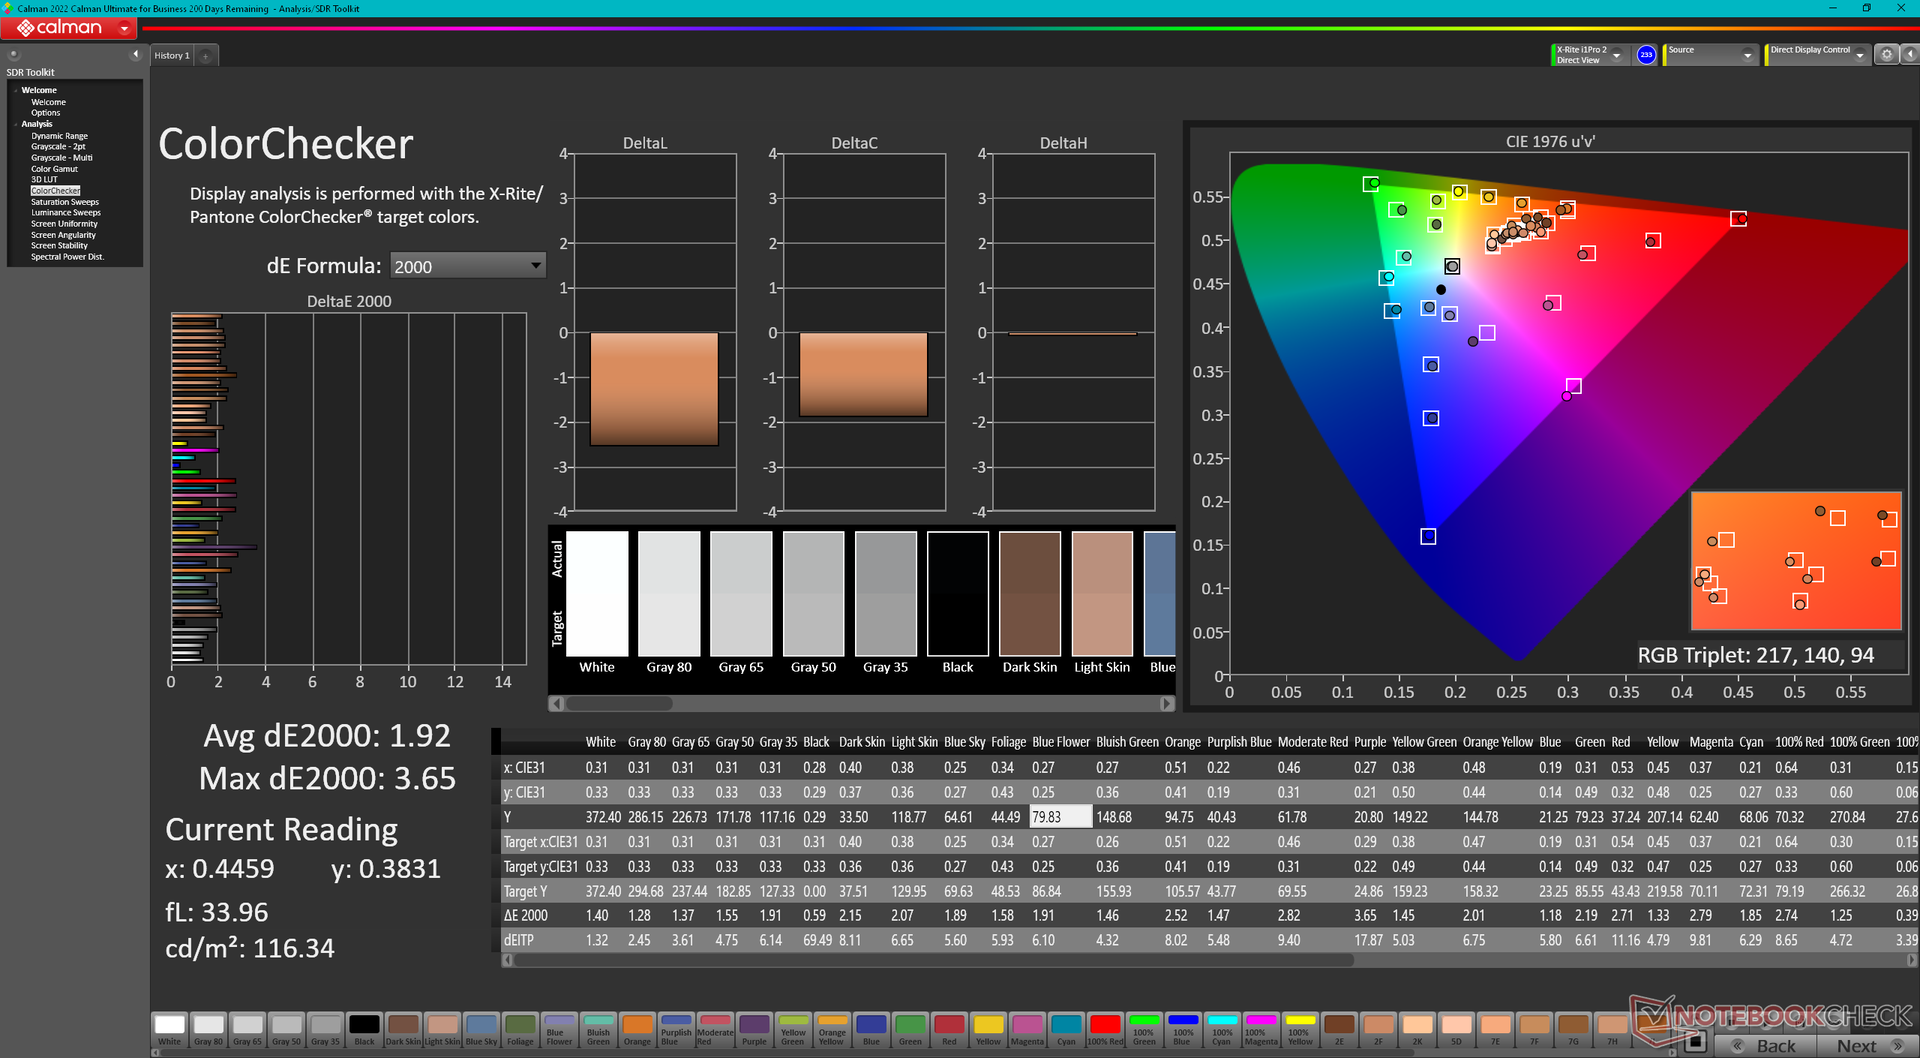
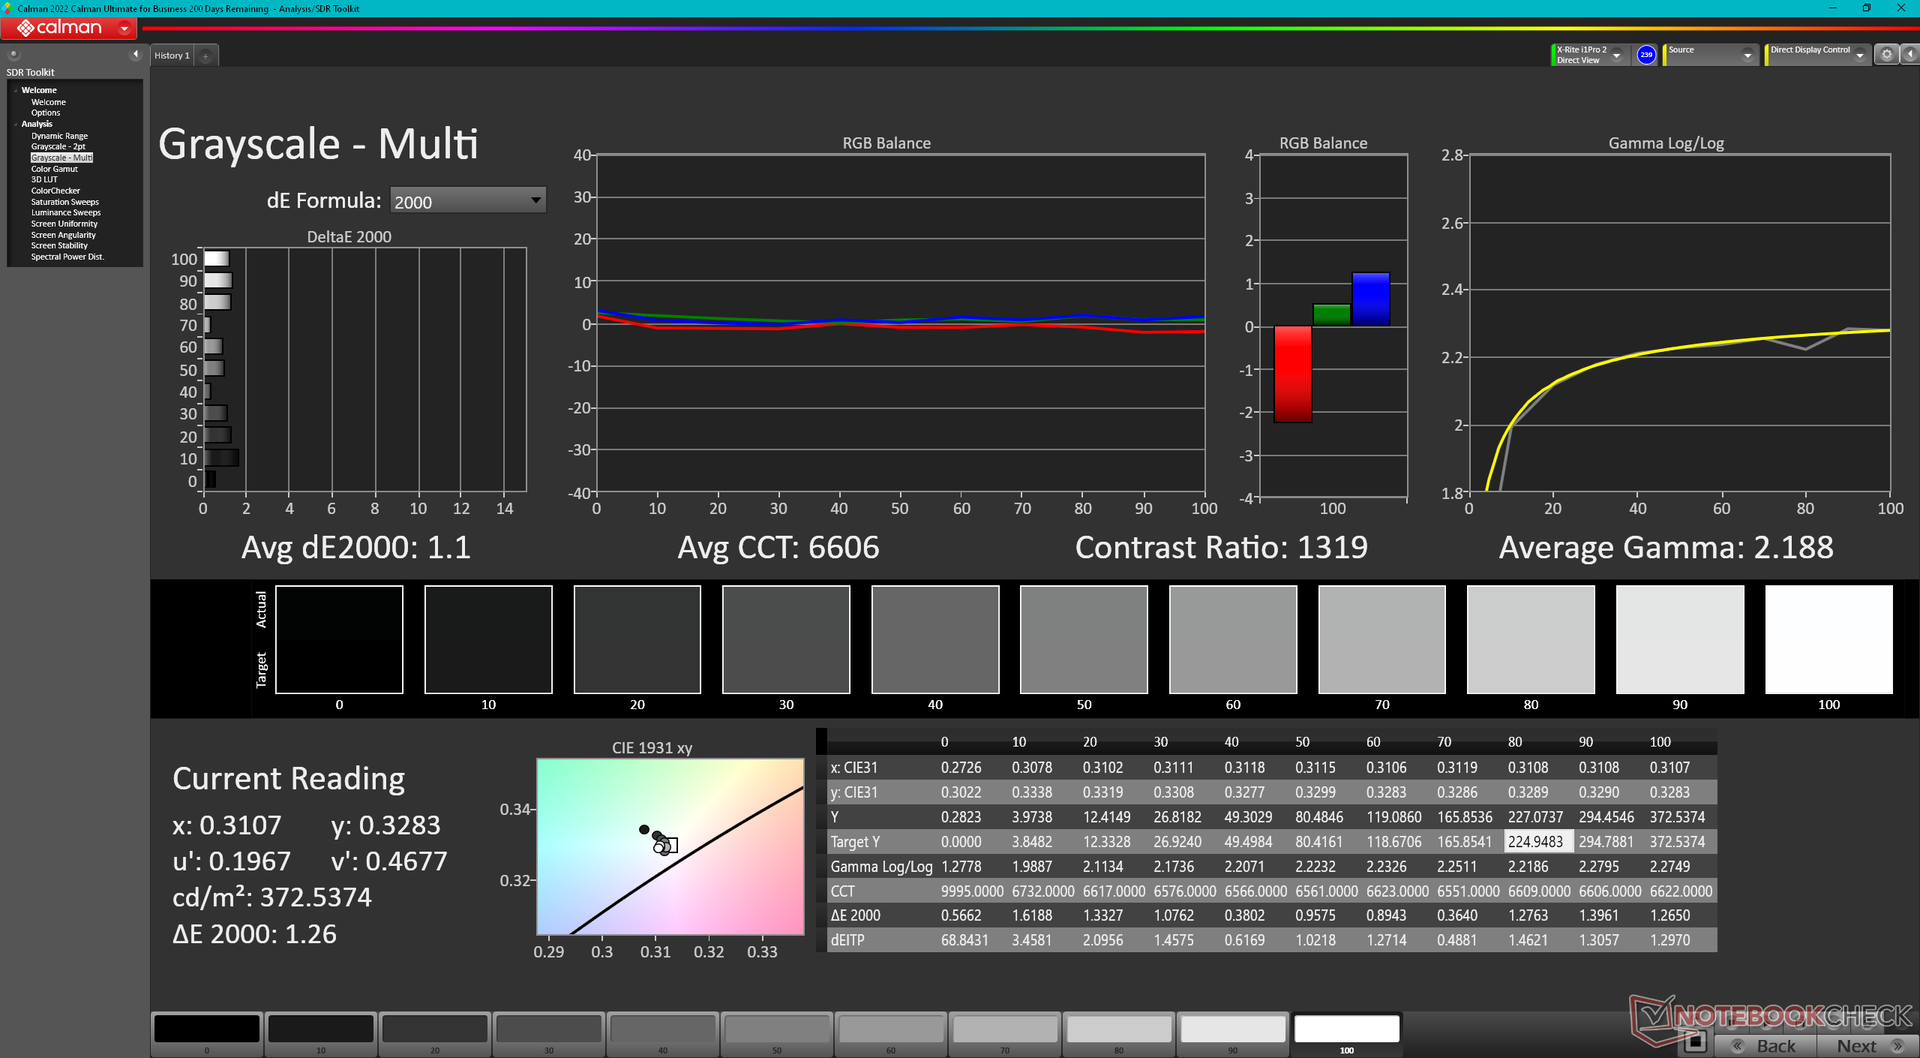
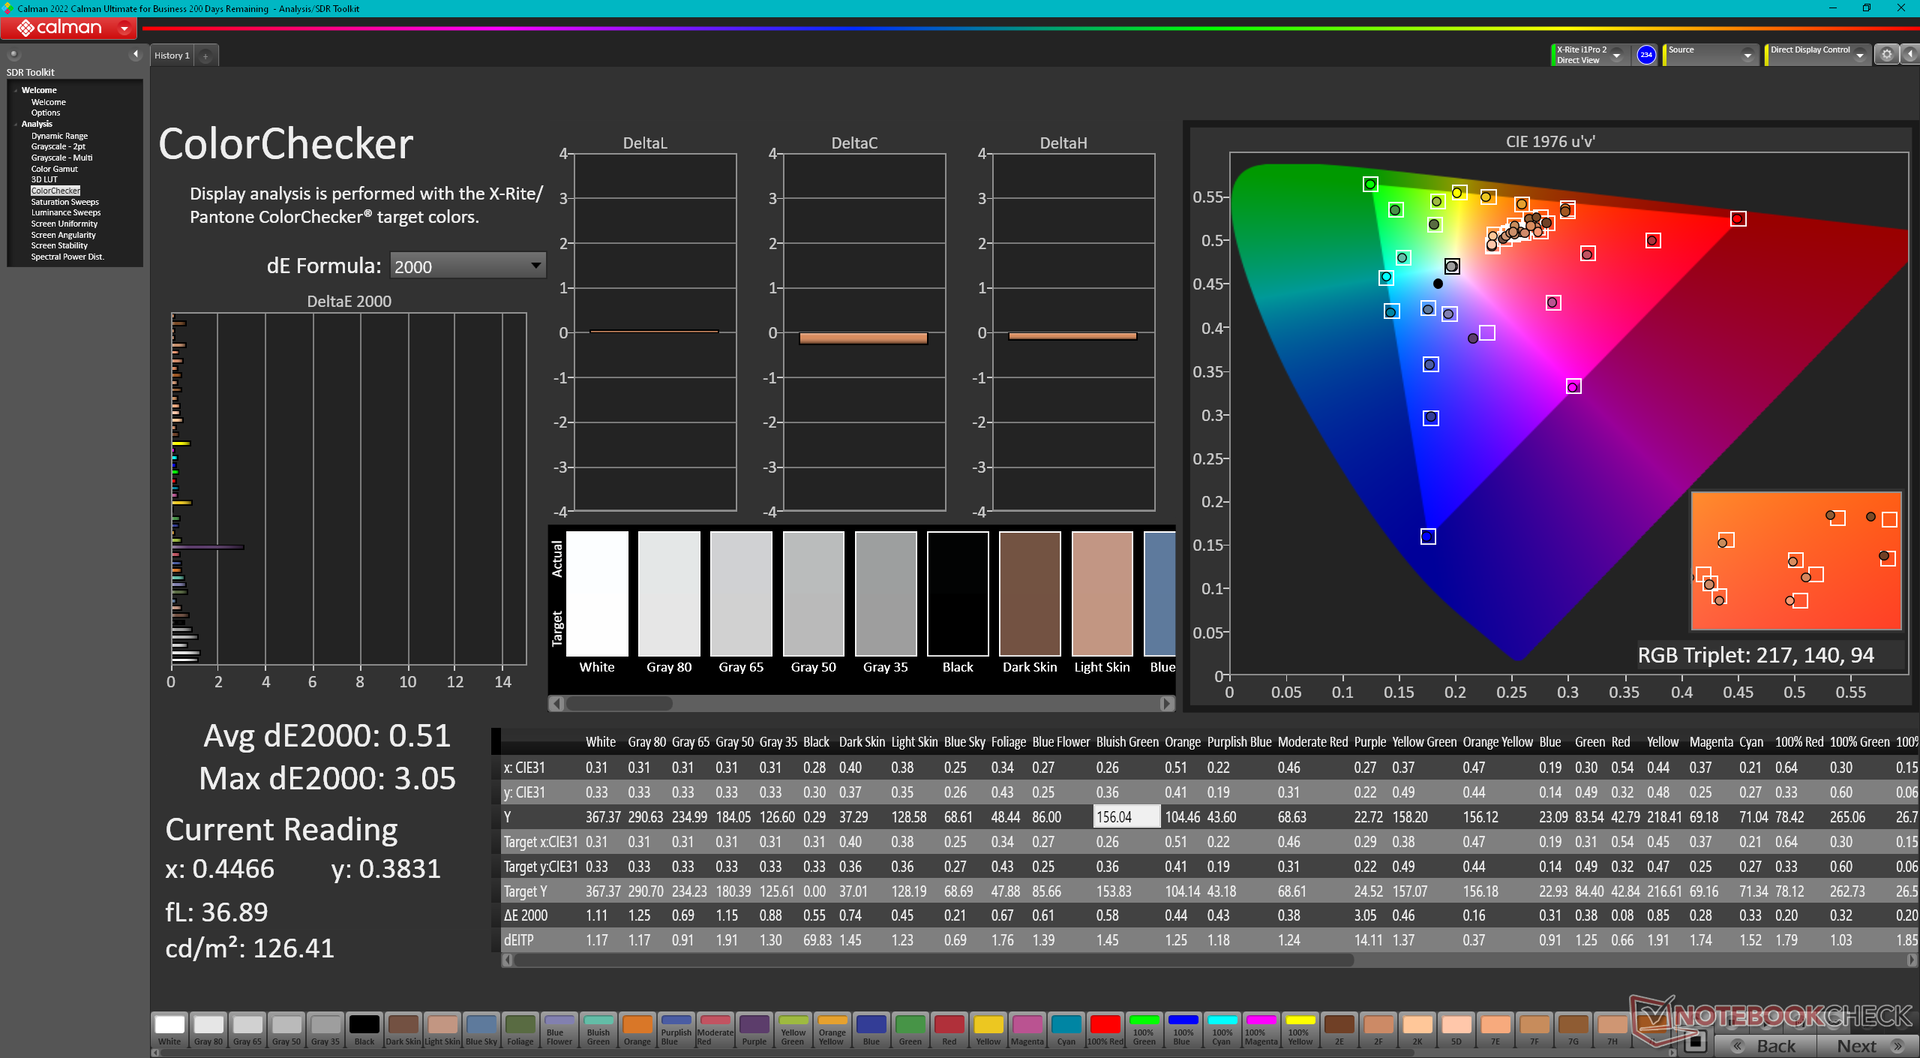
ΔE ColorChecker Calman: 1.92 | ∀{0.5-29.43 Ø4.73}
calibrated: 0.51
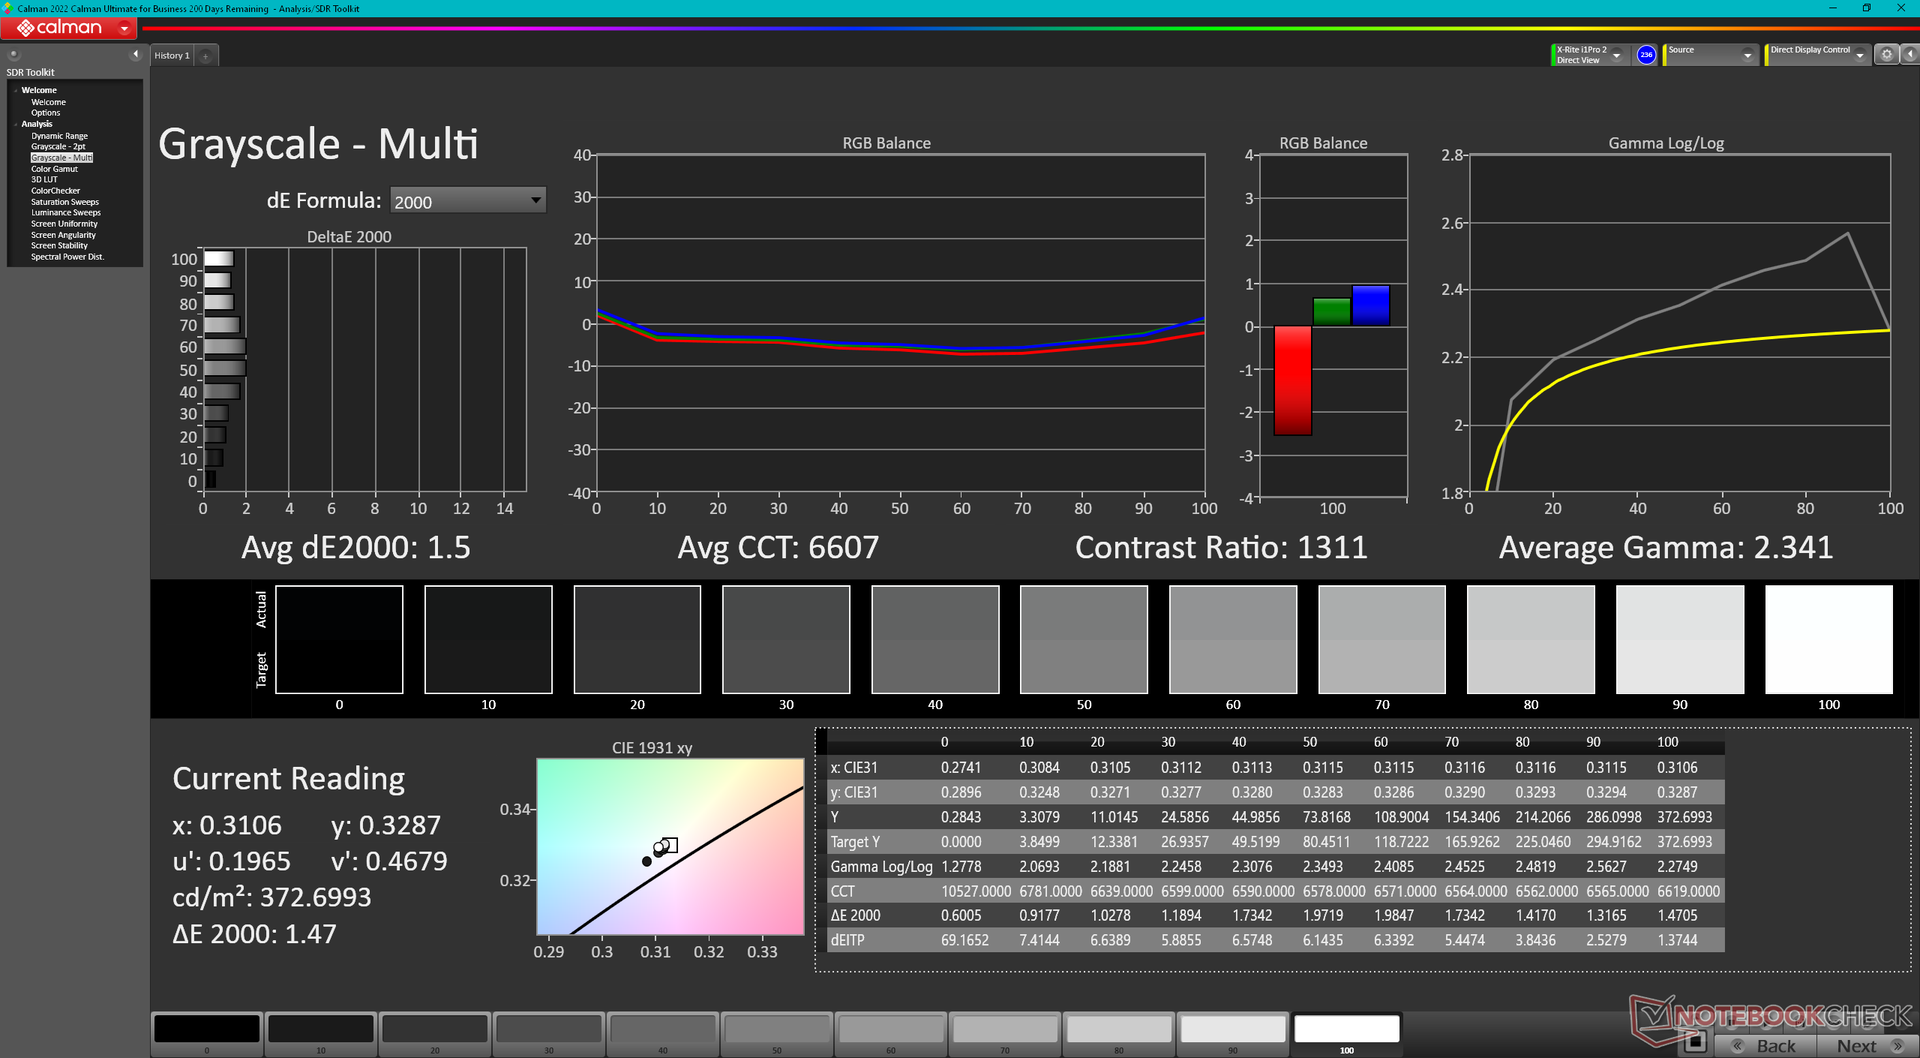
ΔE Greyscale Calman: 1.5 | ∀{0.09-98 Ø4.97}
89.8% AdobeRGB 1998 (Argyll 3D)
100% sRGB (Argyll 3D)
97.7% Display P3 (Argyll 3D)
Gamma: 2.34
CCT: 6607 K
| Alienware m18 R1 Chi Mei 180JME, IPS, 1920x1200, 18" | Razer Blade 18 RTX 4070 AU Optronics B180QAN01.0, IPS, 2560x1600, 18" | Asus ROG Strix Scar 18 2023 G834JY-N6005W NE180QDM-NZ2, IPS, 2560x1600, 18" | Eluktronics Mech-17 GP2 BOE NE170QDM-NZ1, IPS, 2560x1600, 17" | MSI Titan GT77 HX 13VI B173ZAN06.C, Mini-LED, 3840x2160, 17.3" | Alienware x17 R2 P48E AU Optronics B173HAN, IPS, 1920x1080, 17.3" | |
|---|---|---|---|---|---|---|
| Display | -2% | -2% | -17% | 0% | -10% | |
| Display P3 Coverage (%) | 97.7 | 96.9 -1% | 97.2 -1% | 69.1 -29% | 94.9 -3% | 79.2 -19% |
| sRGB Coverage (%) | 100 | 99.8 0% | 99.9 0% | 99.7 0% | 99.9 0% | 99.8 0% |
| AdobeRGB 1998 Coverage (%) | 89.8 | 85.3 -5% | 84.9 -5% | 69.8 -22% | 92.4 3% | 79.6 -11% |
| Response Times | -11% | -34% | -148% | -675% | -153% | |
| Response Time Grey 50% / Grey 80% * (ms) | 3 ? | 4.2 ? -40% | 5.41 ? -80% | 12 ? -300% | 38.4 ? -1180% | 12.4 ? -313% |
| Response Time Black / White * (ms) | 9.9 ? | 8 ? 19% | 8.62 ? 13% | 9.4 ? 5% | 26.6 ? -169% | 9.2 ? 7% |
| PWM Frequency (Hz) | 2380 ? | |||||
| Screen | -68% | -141% | -17% | 57715% | -48% | |
| Brightness middle (cd/m²) | 372.8 | 549.6 47% | 490 31% | 417.3 12% | 606 63% | 365.4 -2% |
| Brightness (cd/m²) | 367 | 524 43% | 468 28% | 387 5% | 602 64% | 344 -6% |
| Brightness Distribution (%) | 97 | 89 -8% | 86 -11% | 87 -10% | 93 -4% | 85 -12% |
| Black Level * (cd/m²) | 0.32 | 0.53 -66% | 0.54 -69% | 0.42 -31% | 0.0001 100% | 0.29 9% |
| Contrast (:1) | 1165 | 1037 -11% | 907 -22% | 994 -15% | 6060000 520072% | 1260 8% |
| Colorchecker dE 2000 * | 1.92 | 3.32 -73% | 4.97 -159% | 2.14 -11% | 4.8 -150% | 3.17 -65% |
| Colorchecker dE 2000 max. * | 3.65 | 6.63 -82% | 11.02 -202% | 4.09 -12% | 8.2 -125% | 7.69 -111% |
| Colorchecker dE 2000 calibrated * | 0.51 | 2.7 -429% | 2.97 -482% | 0.42 18% | 1.8 -253% | 0.51 -0% |
| Greyscale dE 2000 * | 1.5 | 2 -33% | 7.2 -380% | 3.1 -107% | 6.5 -333% | 5.3 -253% |
| Gamma | 2.34 94% | 2.29 96% | 2.161 102% | 2.19 100% | 2.63 84% | 2.18 101% |
| CCT | 6607 98% | 6319 103% | 6515 100% | 6040 108% | 6596 99% | 5879 111% |
| Total Average (Program / Settings) | -27% /
-46% | -59% /
-96% | -61% /
-36% | 19013% /
37006% | -70% /
-55% |
* ... smaller is better
The display comes pre-calibrated for accurate colors and grayscale out of the box. Calibrating the panel further ourselves would not significantly improve average deltaE values and so an end-user calibration is not necessary.

Display Response Times
| ↔ Response Time Black to White | ||
|---|---|---|
| 9.9 ms ... rise ↗ and fall ↘ combined | ↗ 5.4 ms rise | 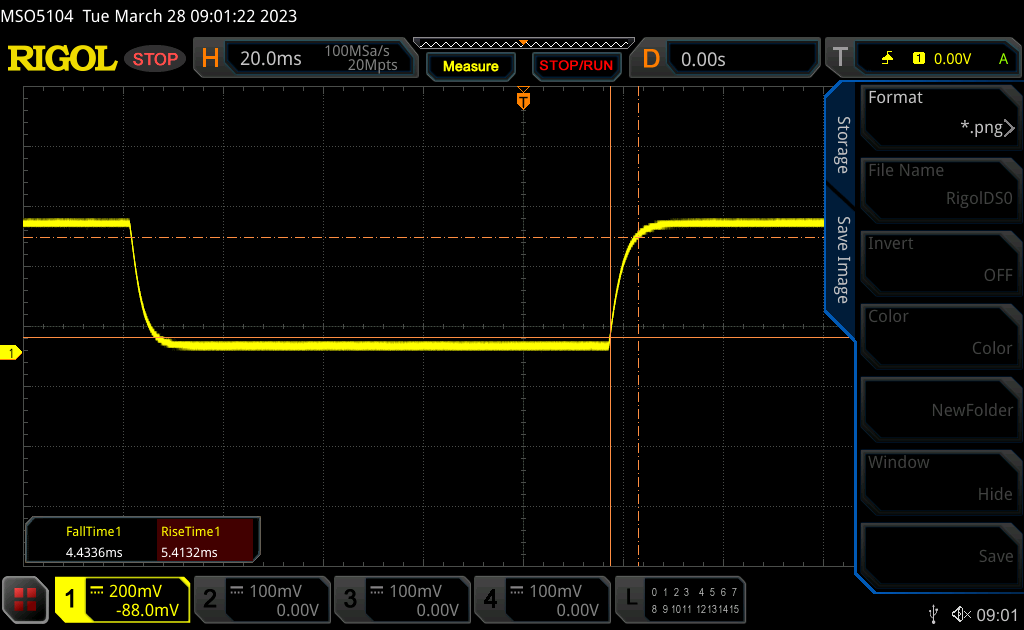 |
| ↘ 4.5 ms fall | ||
| The screen shows fast response rates in our tests and should be suited for gaming. In comparison, all tested devices range from 0.1 (minimum) to 240 (maximum) ms. » 27 % of all devices are better. This means that the measured response time is better than the average of all tested devices (19.9 ms). | ||
| ↔ Response Time 50% Grey to 80% Grey | ||
| 3 ms ... rise ↗ and fall ↘ combined | ↗ 1.5 ms rise | 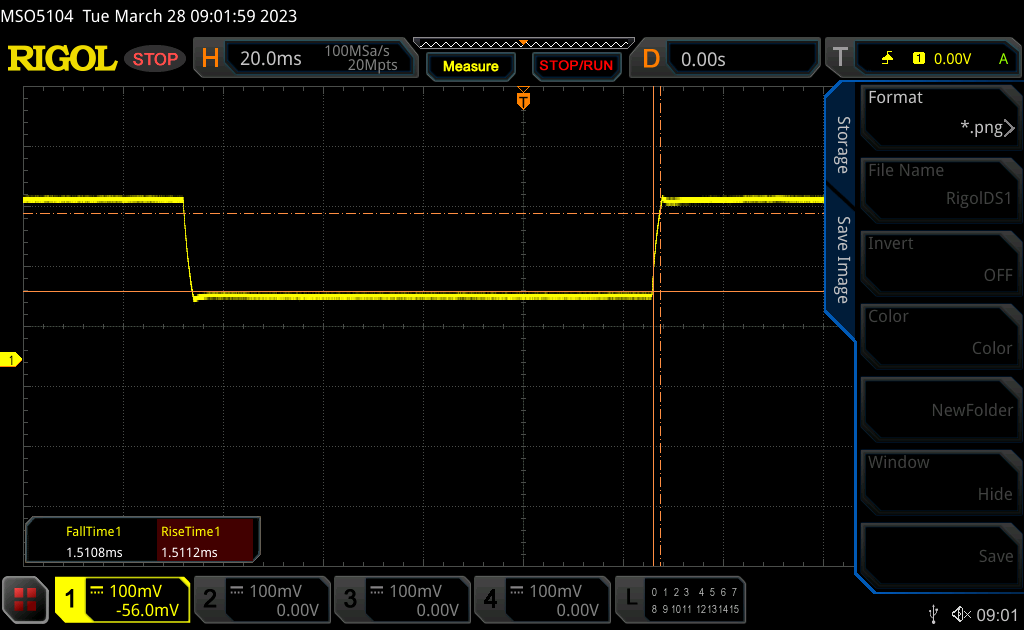 |
| ↘ 1.5 ms fall | ||
| The screen shows very fast response rates in our tests and should be very well suited for fast-paced gaming. In comparison, all tested devices range from 0.165 (minimum) to 636 (maximum) ms. » 13 % of all devices are better. This means that the measured response time is better than the average of all tested devices (31.1 ms). | ||
Screen Flickering / PWM (Pulse-Width Modulation)
| Screen flickering / PWM not detected | 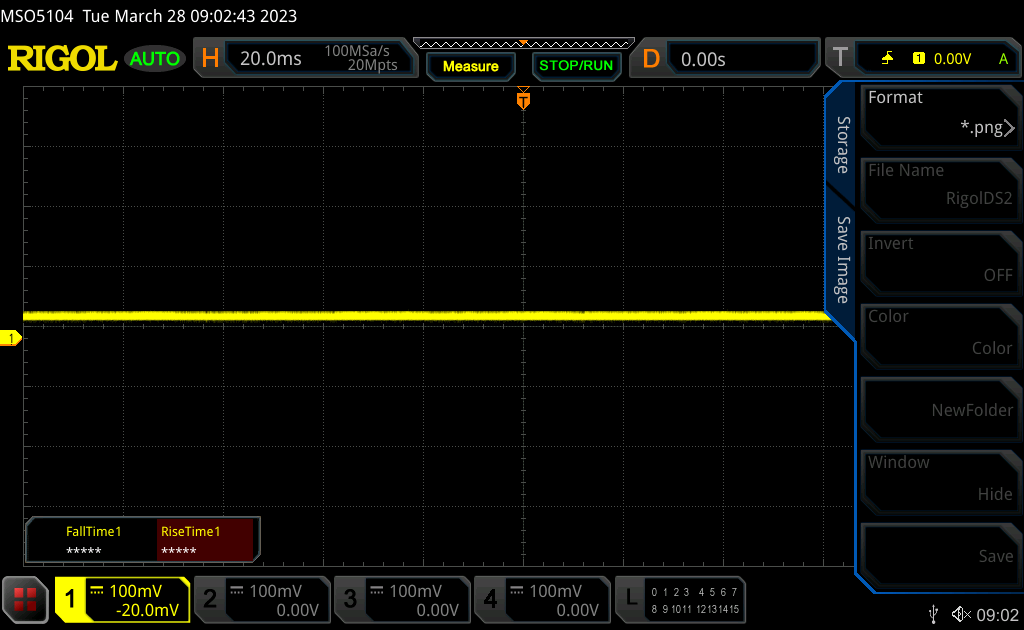 | ||
In comparison: 52 % of all tested devices do not use PWM to dim the display. If PWM was detected, an average of 7798 (minimum: 5 - maximum: 343500) Hz was measured. | |||
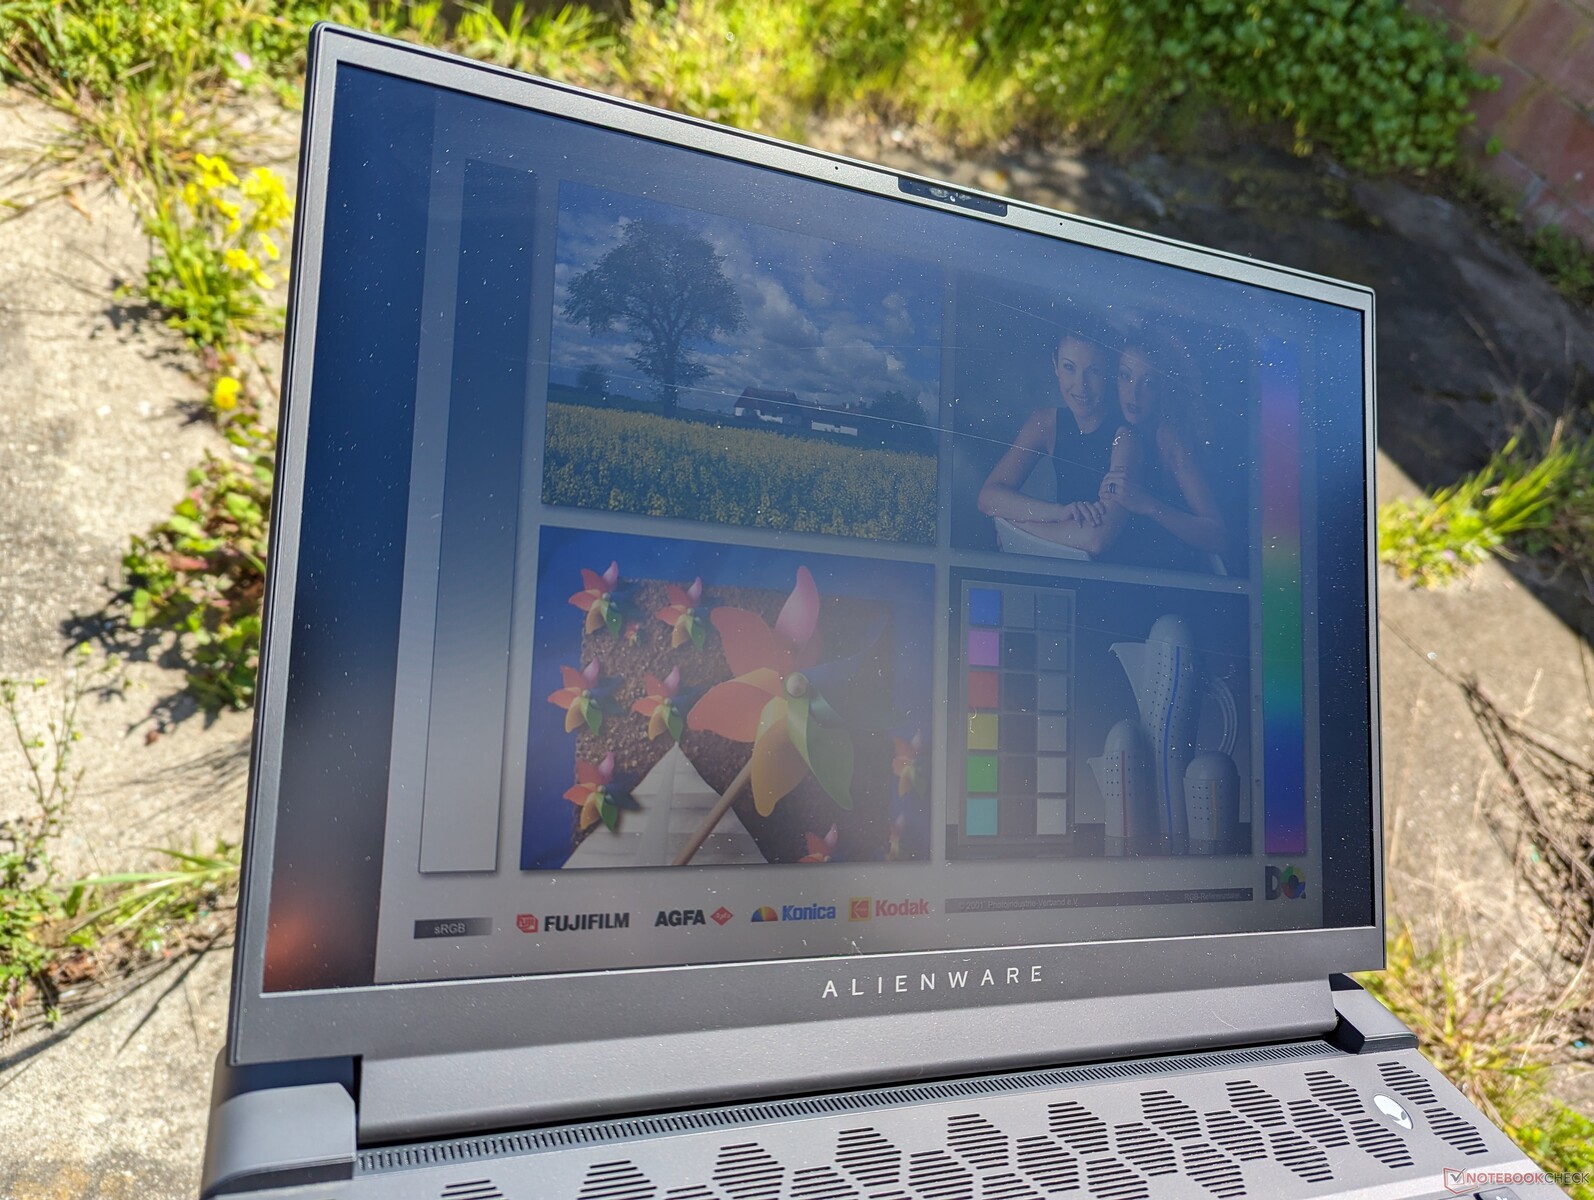
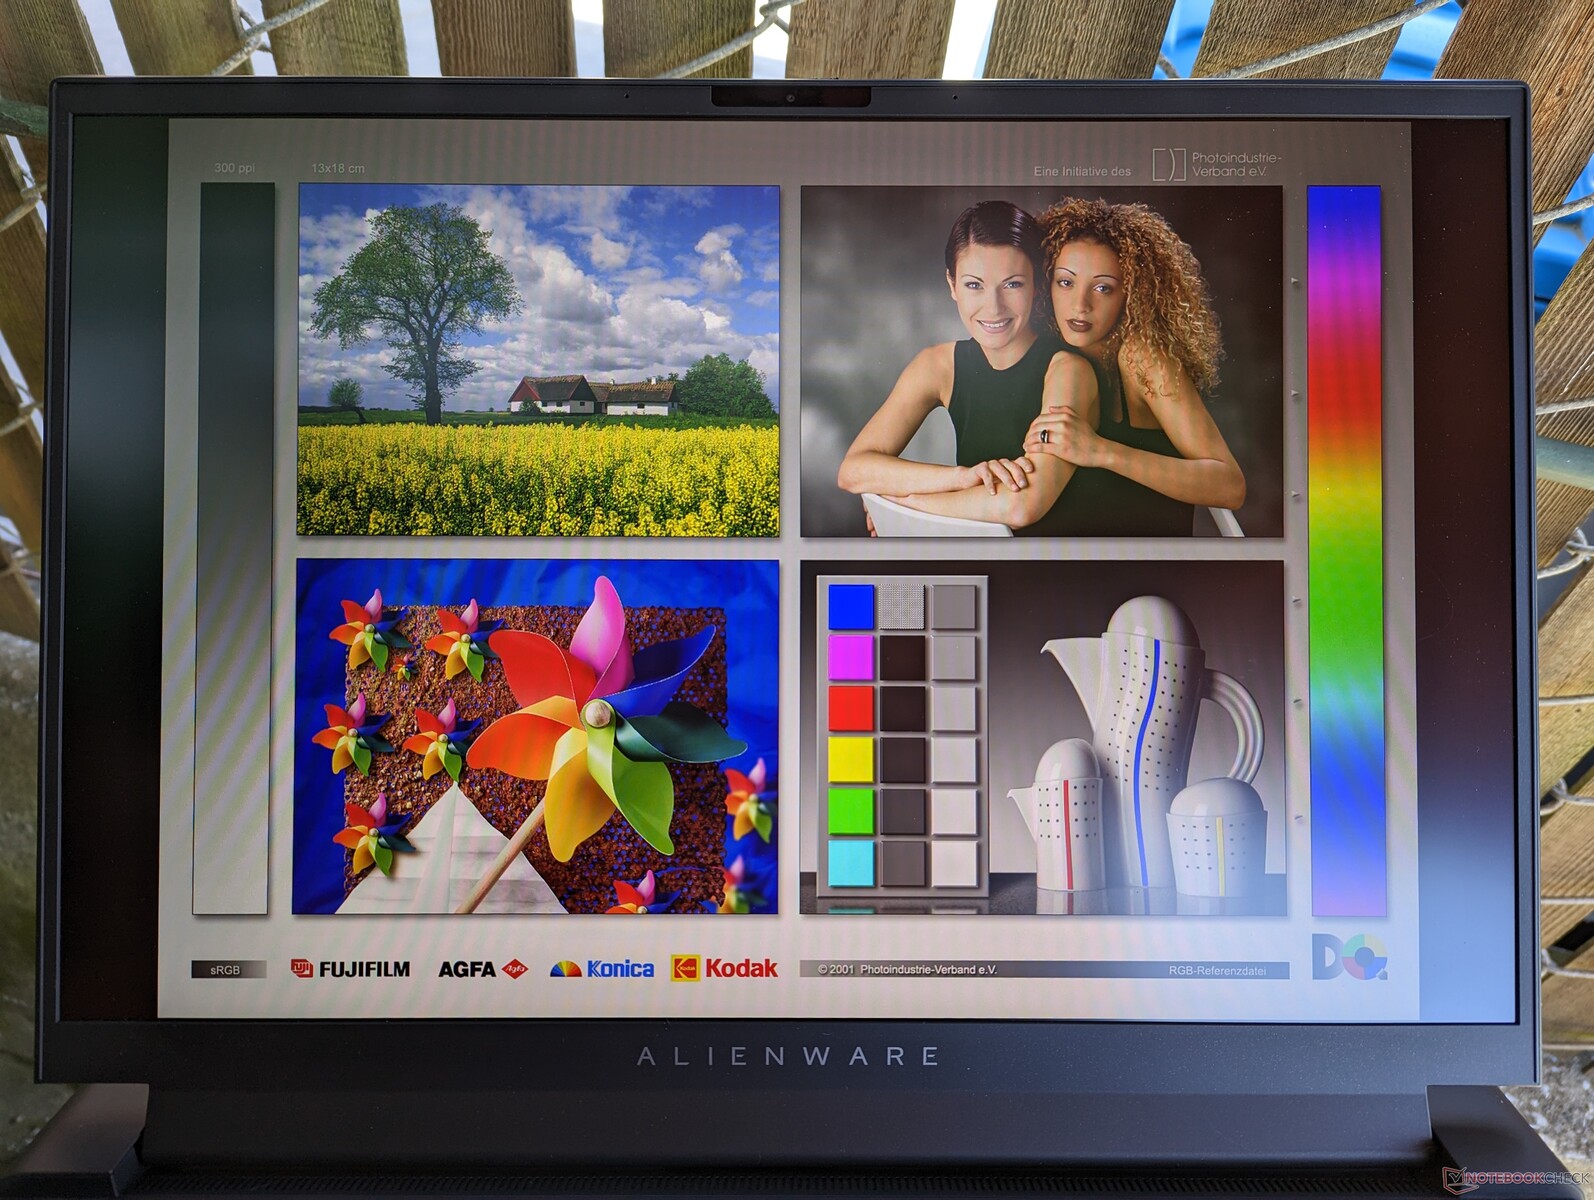
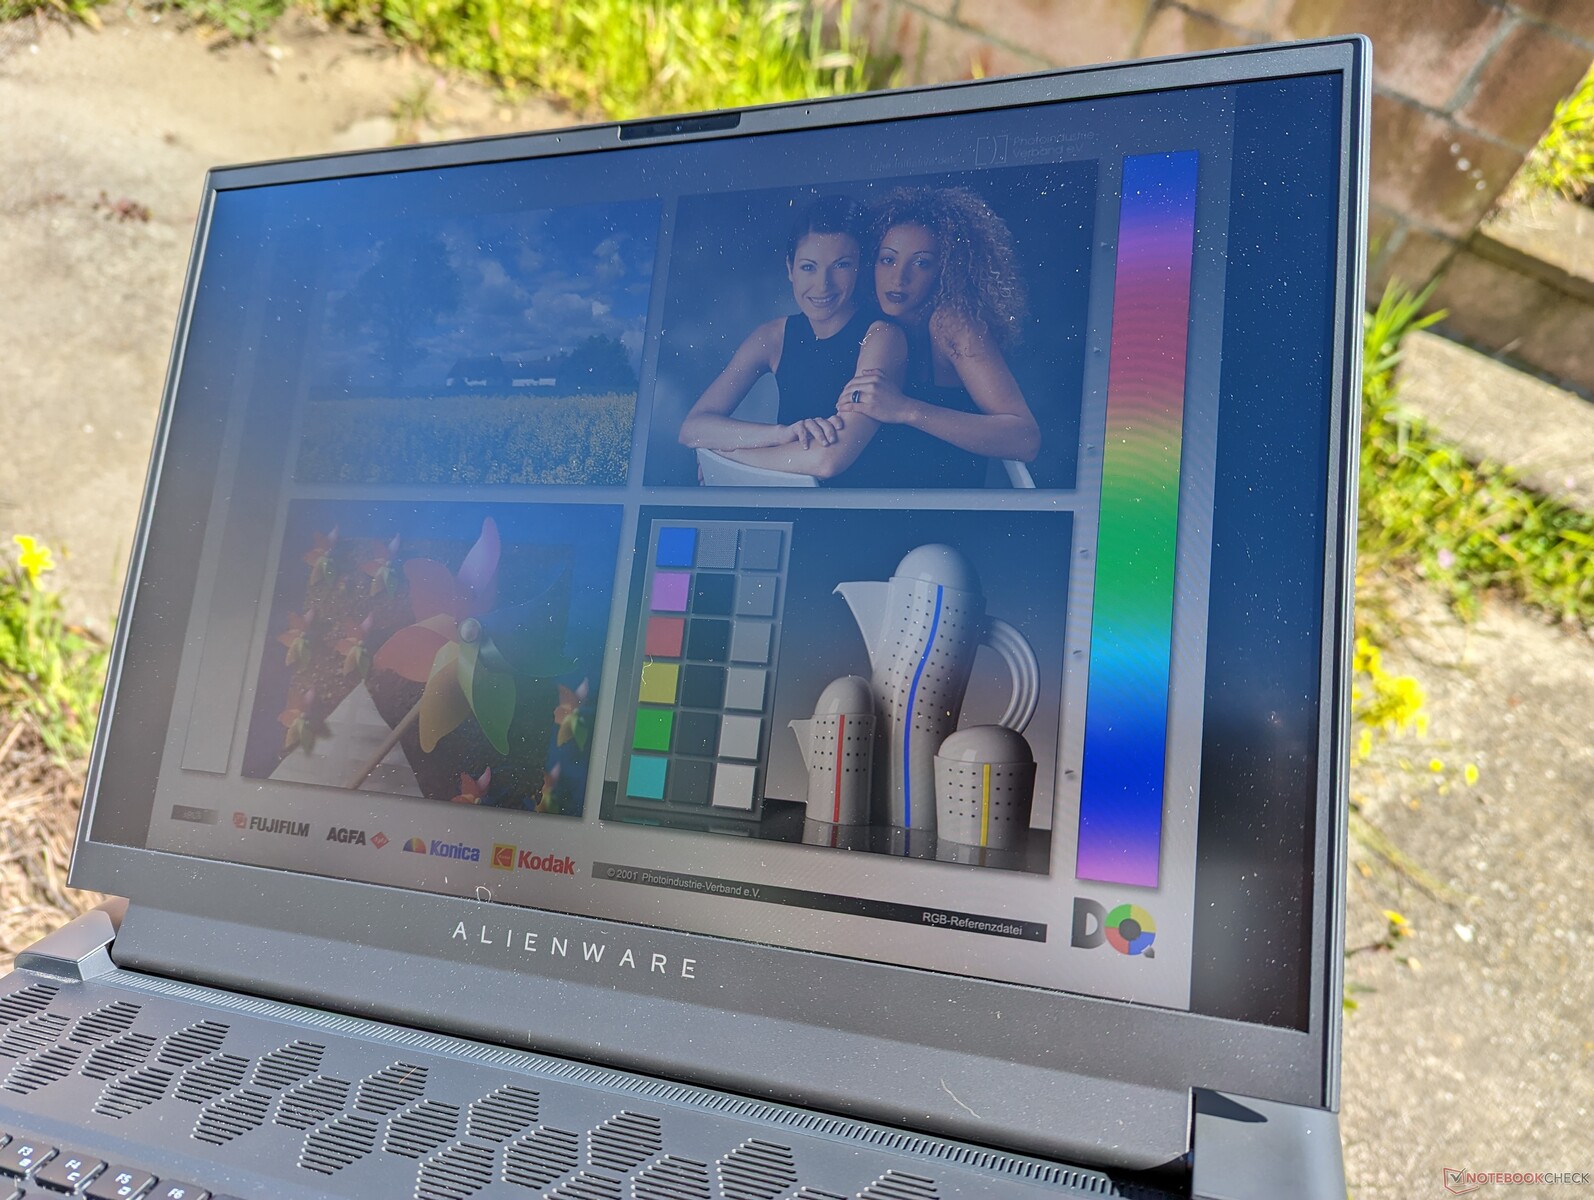
Outdoor visibility is average for the category as the displays on most gaming laptops typically range between 300 to 400 nits. Even so, the immense weight of the Alienware discourages outdoor usage. The Blade 18 and Titan GT77 are brighter for better visibility outdoors.
Performance — Intel 13th Gen + Nvidia Ada Lovelace
Testing Conditions
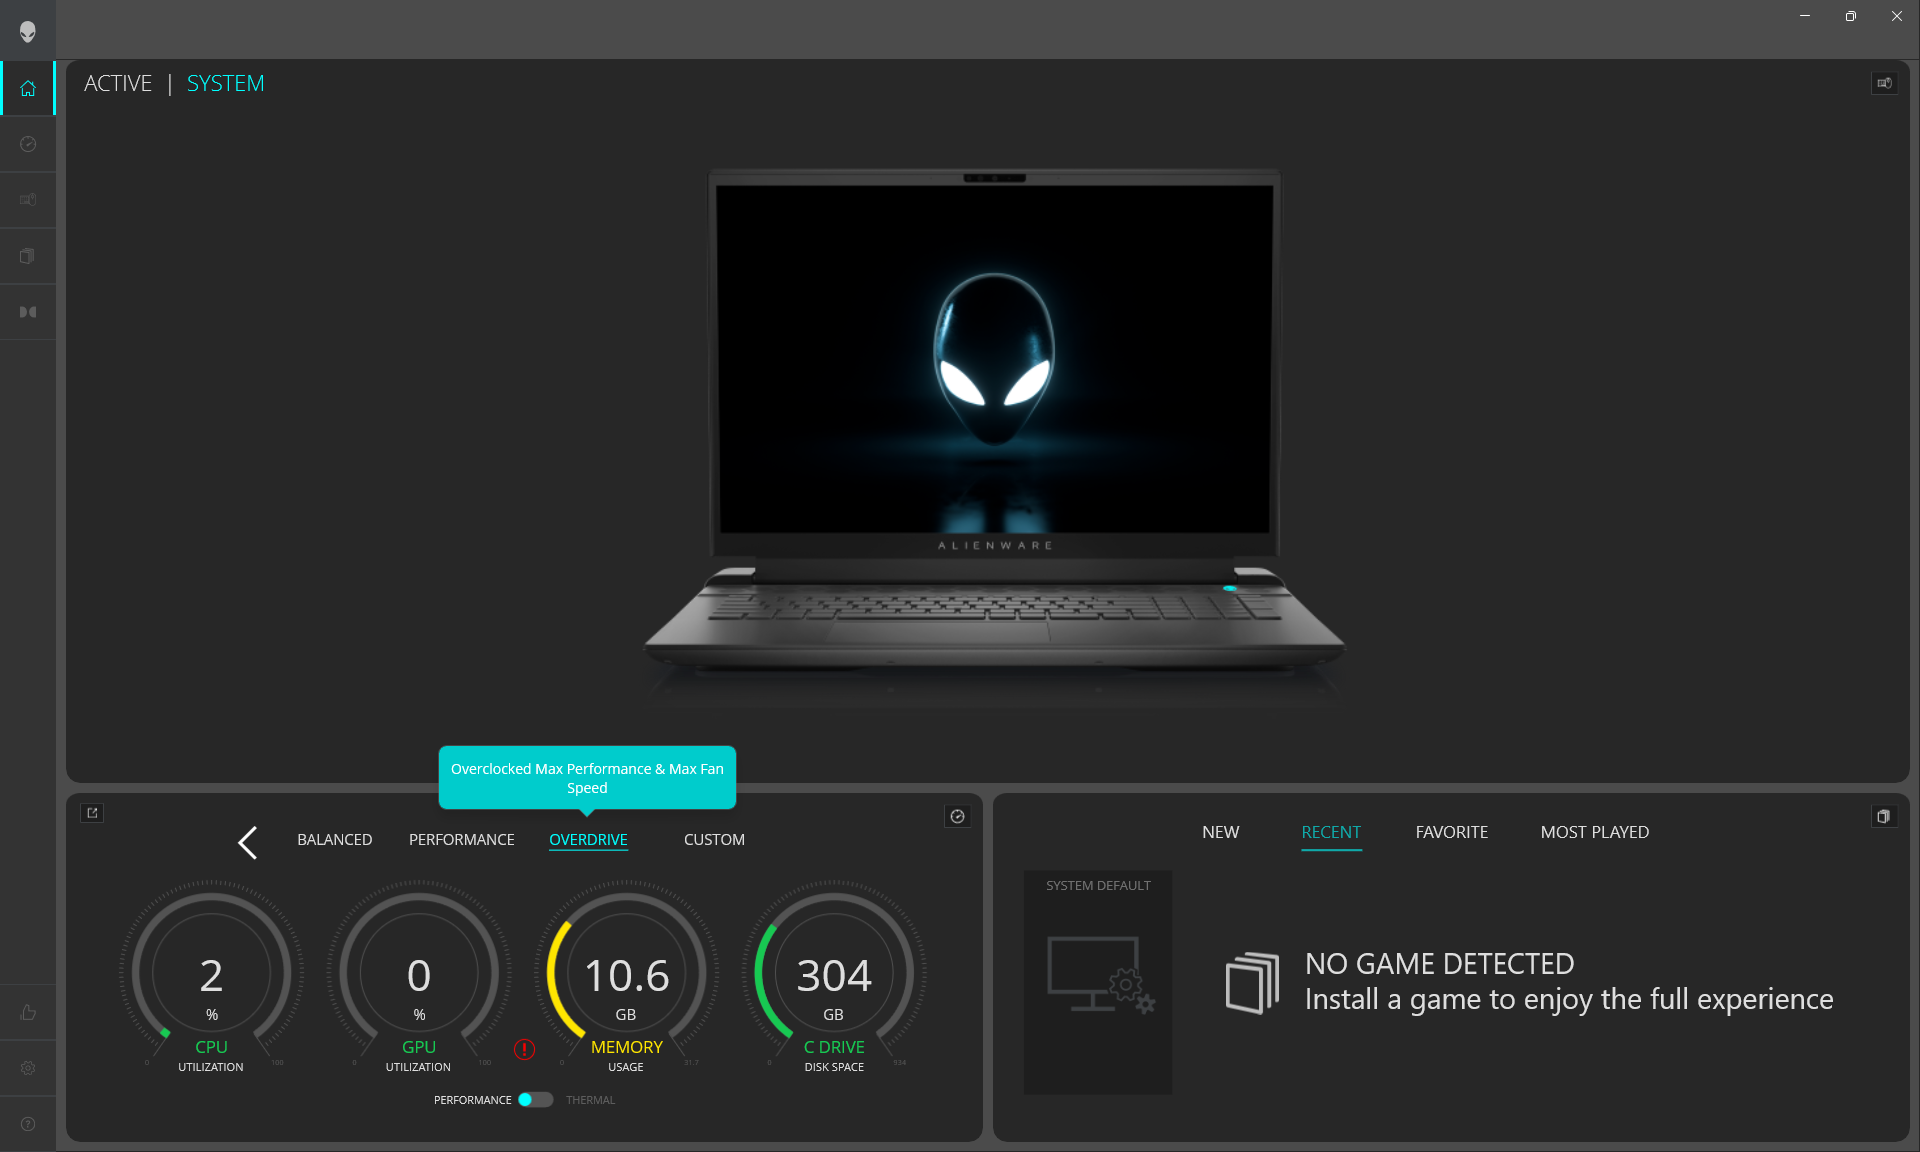
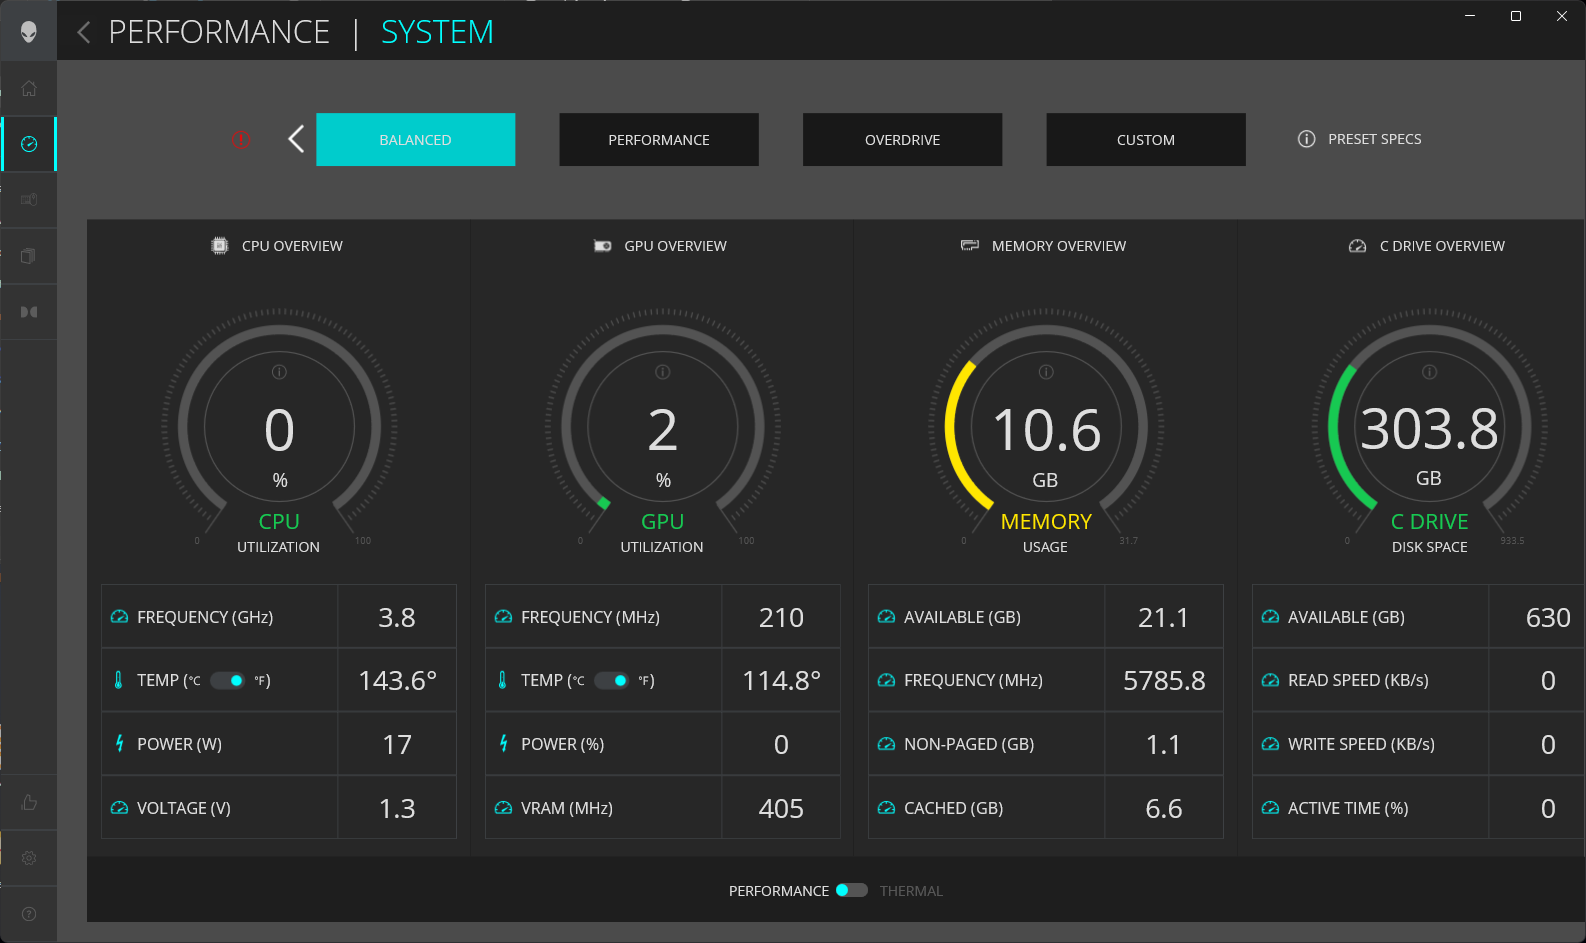
We set our unit to Performance mode via Windows, discrete GPU mode via Nvidia Control Panel, and Overdrive mode via Alienware Command Center prior to running any benchmarks below. Dell has completely refreshed the Command Center software this year to be easier to use and with larger font sizes than before. It still loads very slowly, however, especially when compared to the speedier MSI Center or the Schenker Control Center equivalents.
We experienced a couple of bugs with Alienware Command Center worth mentioning even after updating to the latest version at the time of writing. Firstly, the software fails to load if an external monitor is connected. Secondly, the internal fans would sometimes continue to run very loudly even when the system is sleeping or hibernating on Performance or Overdrive modes.
Advanced Optimus is supported meaning users can switch between discrete GPU and Optimus modes via Nvidia Control Panel without needing to reboot. G-Sync is available only on dGPU mode while Optimus automatically engages if an external monitor is connected.
Processor
Processor performance is one of the fastest of any mobile CPU currently in the market. Users can expect single-thread and multi-thread gains of about 10 percent and 75 percent, respectively, over the 12th gen Core i9-12900HK in the older Alienware x17 R2. AMD's top Zen 4 competitor the Ryzen 9 7945HX falls short in single-threaded loads by about 10 to 15 percent.
Despite the massive performance leap over Alder Lake-H, the performance gaps between the Core i9-13900HX, Core i9-13950HX, and Core i9-13980HX are very minor at under 5 percent. Thus, if given the choice between the three CPUs, you may want to save some dough by opting for the "slower" i9-13900HX.
The lowest CPU option available is the Core i7-13700HX which is slower than our i9-13980HX by about 33 percent.
Cinebench R15 Multi Loop
Cinebench R23: Multi Core | Single Core
Cinebench R20: CPU (Multi Core) | CPU (Single Core)
Cinebench R15: CPU Multi 64Bit | CPU Single 64Bit
Blender: v2.79 BMW27 CPU
7-Zip 18.03: 7z b 4 | 7z b 4 -mmt1
Geekbench 5.5: Multi-Core | Single-Core
HWBOT x265 Benchmark v2.2: 4k Preset
LibreOffice : 20 Documents To PDF
R Benchmark 2.5: Overall mean
* ... smaller is better
AIDA64: FP32 Ray-Trace | FPU Julia | CPU SHA3 | CPU Queen | FPU SinJulia | FPU Mandel | CPU AES | CPU ZLib | FP64 Ray-Trace | CPU PhotoWorxx
| Performance rating | |
| Alienware m18 R1 | |
| Eluktronics Mech-17 GP2 | |
| MSI Titan GT77 HX 13VI | |
| Asus ROG Strix Scar 18 2023 G834JY-N6005W | |
| Average Intel Core i9-13980HX | |
| Razer Blade 18 RTX 4070 | |
| Alienware x17 R2 P48E | |
| AIDA64 / FP32 Ray-Trace | |
| Alienware m18 R1 | |
| MSI Titan GT77 HX 13VI | |
| Asus ROG Strix Scar 18 2023 G834JY-N6005W | |
| Eluktronics Mech-17 GP2 | |
| Average Intel Core i9-13980HX (21332 - 29553, n=9) | |
| Razer Blade 18 RTX 4070 | |
| Alienware x17 R2 P48E | |
| AIDA64 / FPU Julia | |
| Alienware m18 R1 | |
| MSI Titan GT77 HX 13VI | |
| Asus ROG Strix Scar 18 2023 G834JY-N6005W | |
| Average Intel Core i9-13980HX (108001 - 148168, n=9) | |
| Eluktronics Mech-17 GP2 | |
| Razer Blade 18 RTX 4070 | |
| Alienware x17 R2 P48E | |
| AIDA64 / CPU SHA3 | |
| Alienware m18 R1 | |
| MSI Titan GT77 HX 13VI | |
| Eluktronics Mech-17 GP2 | |
| Asus ROG Strix Scar 18 2023 G834JY-N6005W | |
| Average Intel Core i9-13980HX (5264 - 7142, n=9) | |
| Razer Blade 18 RTX 4070 | |
| Alienware x17 R2 P48E | |
| AIDA64 / CPU Queen | |
| Alienware m18 R1 | |
| Asus ROG Strix Scar 18 2023 G834JY-N6005W | |
| Eluktronics Mech-17 GP2 | |
| MSI Titan GT77 HX 13VI | |
| Average Intel Core i9-13980HX (126758 - 143409, n=9) | |
| Razer Blade 18 RTX 4070 | |
| Alienware x17 R2 P48E | |
| AIDA64 / FPU SinJulia | |
| Eluktronics Mech-17 GP2 | |
| Asus ROG Strix Scar 18 2023 G834JY-N6005W | |
| MSI Titan GT77 HX 13VI | |
| Alienware m18 R1 | |
| Average Intel Core i9-13980HX (13785 - 17117, n=9) | |
| Razer Blade 18 RTX 4070 | |
| Alienware x17 R2 P48E | |
| AIDA64 / FPU Mandel | |
| Alienware m18 R1 | |
| MSI Titan GT77 HX 13VI | |
| Asus ROG Strix Scar 18 2023 G834JY-N6005W | |
| Eluktronics Mech-17 GP2 | |
| Average Intel Core i9-13980HX (53398 - 73758, n=9) | |
| Razer Blade 18 RTX 4070 | |
| Alienware x17 R2 P48E | |
| AIDA64 / CPU AES | |
| Eluktronics Mech-17 GP2 | |
| MSI Titan GT77 HX 13VI | |
| Alienware m18 R1 | |
| Asus ROG Strix Scar 18 2023 G834JY-N6005W | |
| Average Intel Core i9-13980HX (105169 - 136520, n=9) | |
| Razer Blade 18 RTX 4070 | |
| Alienware x17 R2 P48E | |
| AIDA64 / CPU ZLib | |
| MSI Titan GT77 HX 13VI | |
| Asus ROG Strix Scar 18 2023 G834JY-N6005W | |
| Alienware m18 R1 | |
| Eluktronics Mech-17 GP2 | |
| Average Intel Core i9-13980HX (1513 - 2039, n=9) | |
| Razer Blade 18 RTX 4070 | |
| Alienware x17 R2 P48E | |
| AIDA64 / FP64 Ray-Trace | |
| Alienware m18 R1 | |
| MSI Titan GT77 HX 13VI | |
| Asus ROG Strix Scar 18 2023 G834JY-N6005W | |
| Eluktronics Mech-17 GP2 | |
| Average Intel Core i9-13980HX (11431 - 16325, n=9) | |
| Razer Blade 18 RTX 4070 | |
| Alienware x17 R2 P48E | |
| AIDA64 / CPU PhotoWorxx | |
| Alienware m18 R1 | |
| Razer Blade 18 RTX 4070 | |
| Average Intel Core i9-13980HX (37069 - 52949, n=9) | |
| Eluktronics Mech-17 GP2 | |
| Asus ROG Strix Scar 18 2023 G834JY-N6005W | |
| MSI Titan GT77 HX 13VI | |
| Alienware x17 R2 P48E | |
System Performance
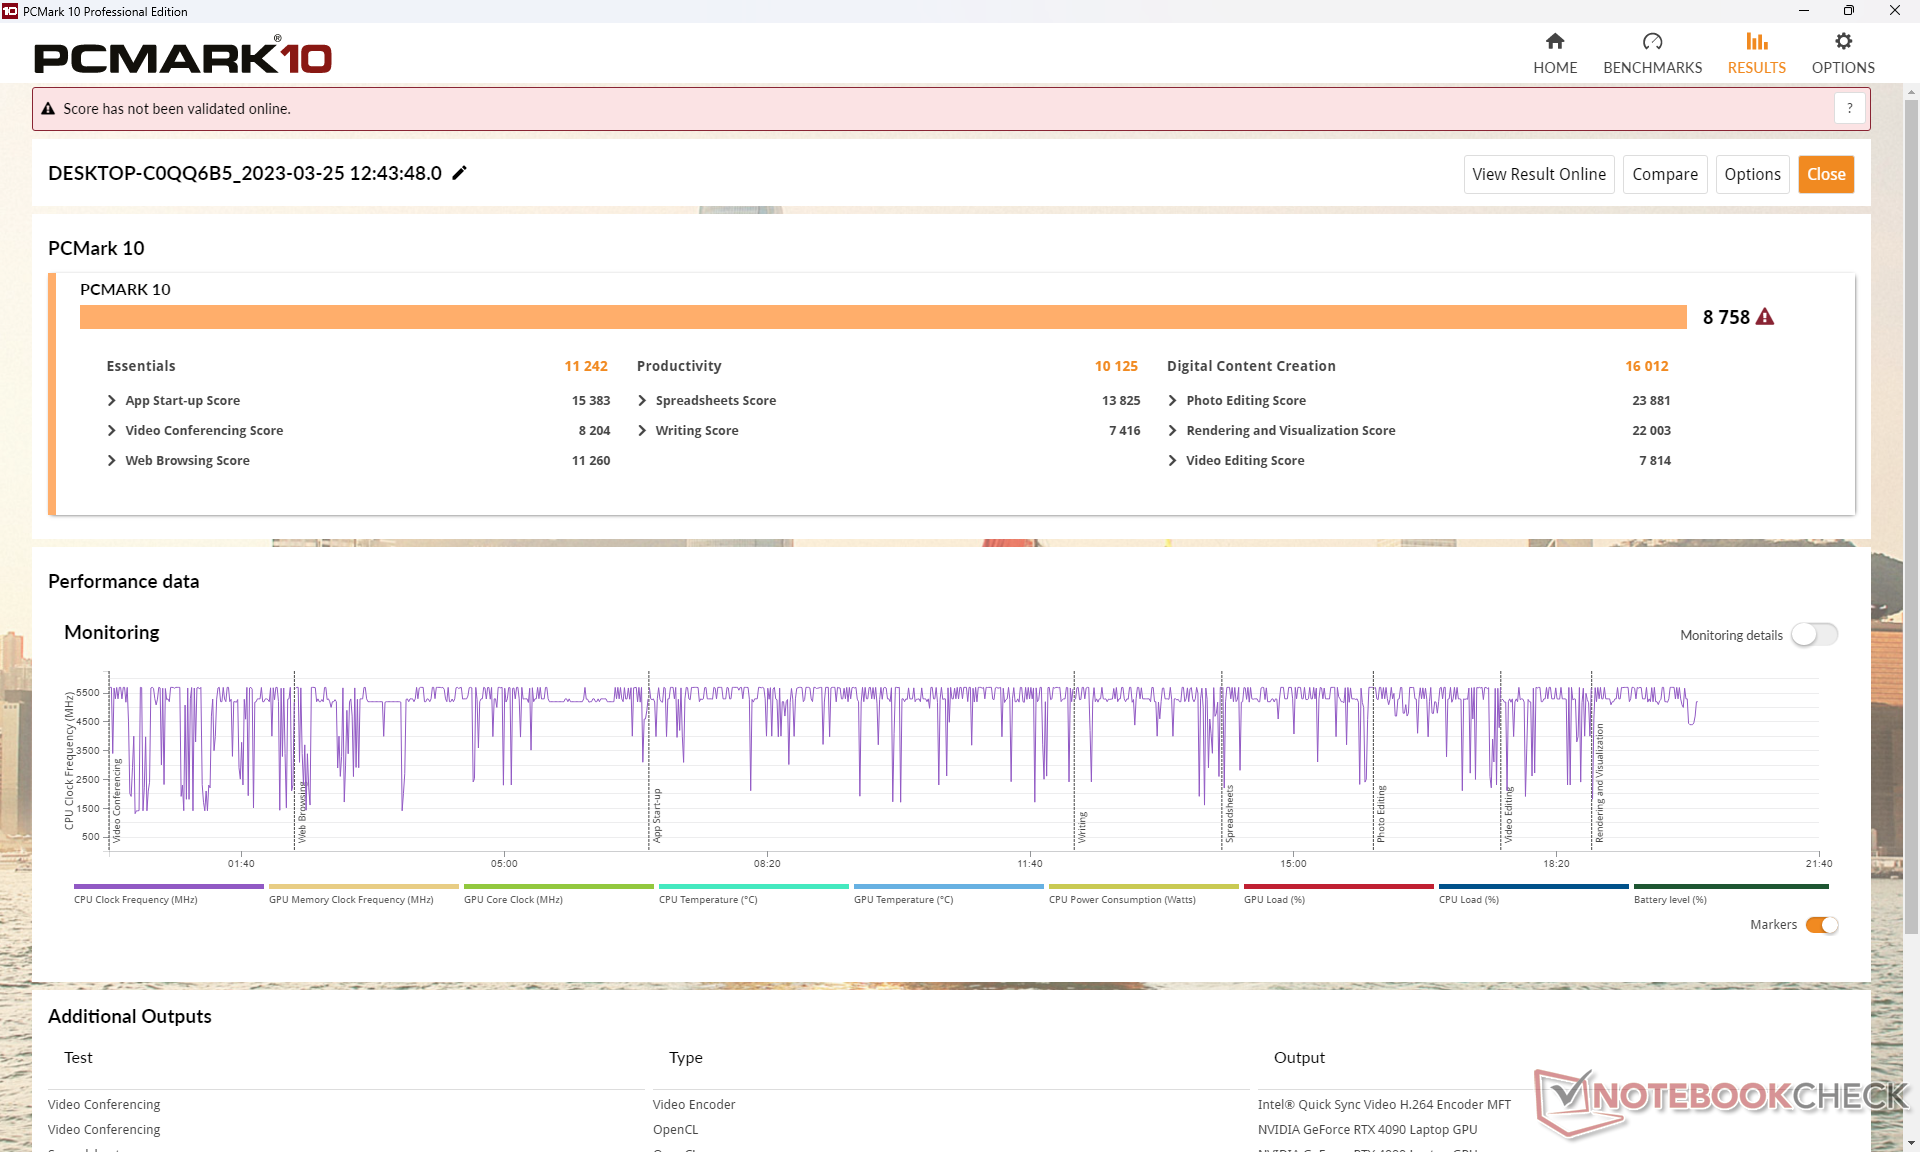
PCMark 10 scores are comparable to other flagship gaming laptops with similar 13th gen Intel CPUs and GeForce 40 GPUs like the Asus ROG Strix Scar 18 or MSI Titan GT77 HX. Our Alienware also manages to edge out the older Alienware x17 R2 running on two Samsung PM9A1 SSDs in RAID 0.
CrossMark: Overall | Productivity | Creativity | Responsiveness
| PCMark 10 / Score | |
| Eluktronics Mech-17 GP2 | |
| MSI Titan GT77 HX 13VI | |
| Average Intel Core i9-13980HX, NVIDIA GeForce RTX 4090 Laptop GPU (8650 - 9068, n=4) | |
| Asus ROG Strix Scar 18 2023 G834JY-N6005W | |
| Alienware m18 R1 | |
| Alienware x17 R2 P48E | |
| Razer Blade 18 RTX 4070 | |
| PCMark 10 / Essentials | |
| Eluktronics Mech-17 GP2 | |
| MSI Titan GT77 HX 13VI | |
| Razer Blade 18 RTX 4070 | |
| Average Intel Core i9-13980HX, NVIDIA GeForce RTX 4090 Laptop GPU (11215 - 11644, n=3) | |
| Alienware m18 R1 | |
| Alienware x17 R2 P48E | |
| PCMark 10 / Productivity | |
| Eluktronics Mech-17 GP2 | |
| Average Intel Core i9-13980HX, NVIDIA GeForce RTX 4090 Laptop GPU (10125 - 11067, n=3) | |
| Alienware x17 R2 P48E | |
| Alienware m18 R1 | |
| MSI Titan GT77 HX 13VI | |
| Razer Blade 18 RTX 4070 | |
| PCMark 10 / Digital Content Creation | |
| MSI Titan GT77 HX 13VI | |
| Alienware m18 R1 | |
| Average Intel Core i9-13980HX, NVIDIA GeForce RTX 4090 Laptop GPU (15052 - 16012, n=3) | |
| Eluktronics Mech-17 GP2 | |
| Alienware x17 R2 P48E | |
| Razer Blade 18 RTX 4070 | |
| CrossMark / Overall | |
| Eluktronics Mech-17 GP2 | |
| Alienware m18 R1 | |
| MSI Titan GT77 HX 13VI | |
| Razer Blade 18 RTX 4070 | |
| Asus ROG Strix Scar 18 2023 G834JY-N6005W | |
| Average Intel Core i9-13980HX, NVIDIA GeForce RTX 4090 Laptop GPU (1935 - 2176, n=4) | |
| Alienware x17 R2 P48E | |
| CrossMark / Productivity | |
| Eluktronics Mech-17 GP2 | |
| Alienware m18 R1 | |
| MSI Titan GT77 HX 13VI | |
| Razer Blade 18 RTX 4070 | |
| Asus ROG Strix Scar 18 2023 G834JY-N6005W | |
| Average Intel Core i9-13980HX, NVIDIA GeForce RTX 4090 Laptop GPU (1764 - 2005, n=4) | |
| Alienware x17 R2 P48E | |
| CrossMark / Creativity | |
| Eluktronics Mech-17 GP2 | |
| Alienware m18 R1 | |
| Asus ROG Strix Scar 18 2023 G834JY-N6005W | |
| MSI Titan GT77 HX 13VI | |
| Average Intel Core i9-13980HX, NVIDIA GeForce RTX 4090 Laptop GPU (2267 - 2469, n=4) | |
| Razer Blade 18 RTX 4070 | |
| Alienware x17 R2 P48E | |
| CrossMark / Responsiveness | |
| Alienware m18 R1 | |
| Razer Blade 18 RTX 4070 | |
| MSI Titan GT77 HX 13VI | |
| Eluktronics Mech-17 GP2 | |
| Average Intel Core i9-13980HX, NVIDIA GeForce RTX 4090 Laptop GPU (1556 - 1904, n=4) | |
| Alienware x17 R2 P48E | |
| Asus ROG Strix Scar 18 2023 G834JY-N6005W | |
| PCMark 10 Score | 8758 points | |
Help | ||
| AIDA64 / Memory Copy | |
| Alienware m18 R1 | |
| Razer Blade 18 RTX 4070 | |
| Average Intel Core i9-13980HX (62189 - 80776, n=9) | |
| Eluktronics Mech-17 GP2 | |
| Asus ROG Strix Scar 18 2023 G834JY-N6005W | |
| MSI Titan GT77 HX 13VI | |
| Alienware x17 R2 P48E | |
| AIDA64 / Memory Read | |
| Alienware m18 R1 | |
| Razer Blade 18 RTX 4070 | |
| Average Intel Core i9-13980HX (62624 - 89096, n=9) | |
| Eluktronics Mech-17 GP2 | |
| Asus ROG Strix Scar 18 2023 G834JY-N6005W | |
| MSI Titan GT77 HX 13VI | |
| Alienware x17 R2 P48E | |
| AIDA64 / Memory Write | |
| Alienware m18 R1 | |
| Razer Blade 18 RTX 4070 | |
| Average Intel Core i9-13980HX (59912 - 79917, n=9) | |
| Eluktronics Mech-17 GP2 | |
| Asus ROG Strix Scar 18 2023 G834JY-N6005W | |
| MSI Titan GT77 HX 13VI | |
| Alienware x17 R2 P48E | |
| AIDA64 / Memory Latency | |
| Alienware x17 R2 P48E | |
| MSI Titan GT77 HX 13VI | |
| Asus ROG Strix Scar 18 2023 G834JY-N6005W | |
| Eluktronics Mech-17 GP2 | |
| Average Intel Core i9-13980HX (79.4 - 93.2, n=9) | |
| Razer Blade 18 RTX 4070 | |
| Alienware m18 R1 | |
* ... smaller is better
DPC Latency
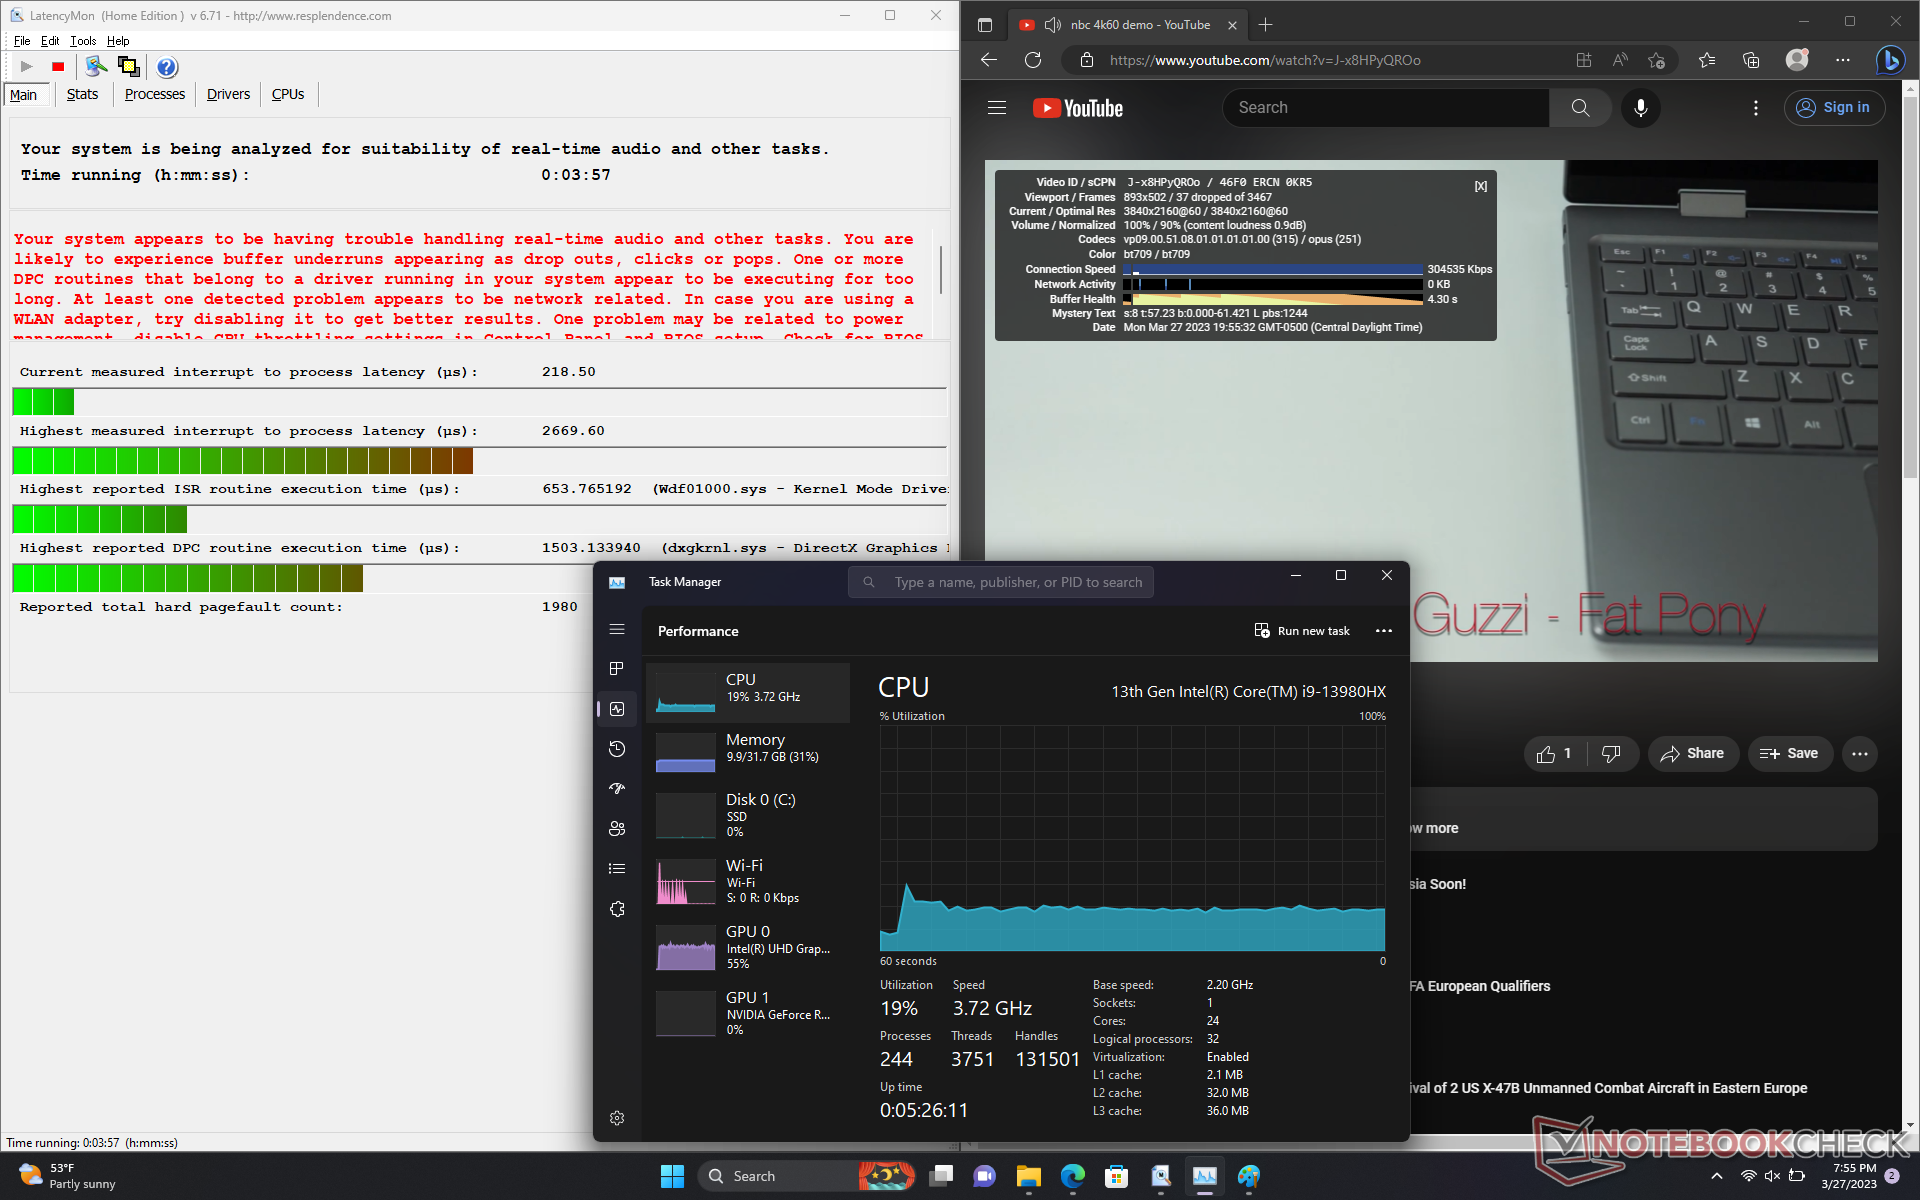
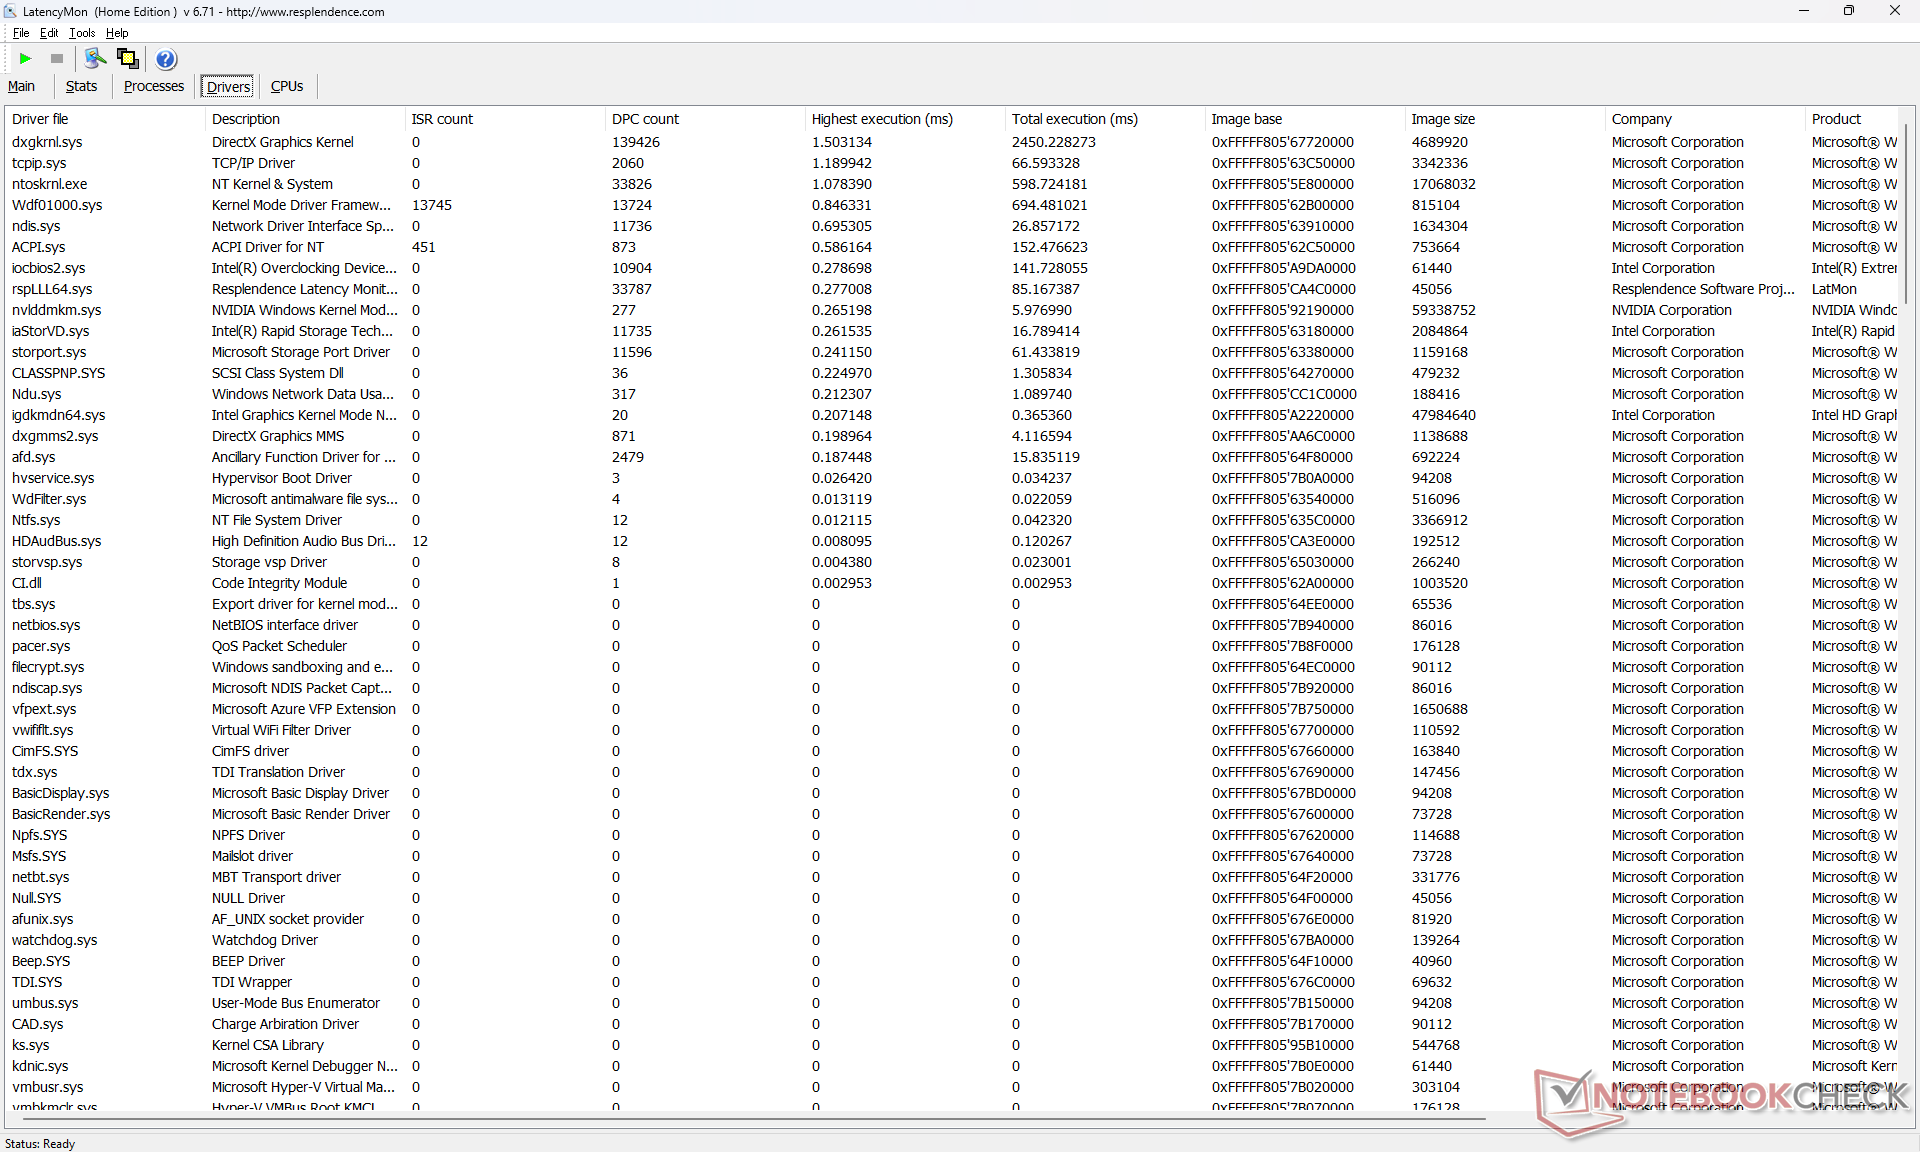
LatencyMon reveals DPC issues when opening multiple browser tabs of our homepage. Additionally, the system has issues playing back 4K video content as we're able to record 37 dropped frames during our minute-long test video even after repeat testing. CPU and iGPU utilization are unusually high as well at 19 percent and 55 percent, respectively. These observations suggest poor handling of background processes that may impact the activity in focus.
For what it's worth, Nvidia has acknowledged a bug related to an increase in DPC latency with graphics driver 531.29. Hopefully a fix can come soon either way.
| DPC Latencies / LatencyMon - interrupt to process latency (max), Web, Youtube, Prime95 | |
| MSI Titan GT77 HX 13VI | |
| Alienware m18 R1 | |
| Razer Blade 18 RTX 4070 | |
| Alienware x17 R2 P48E | |
| Asus ROG Strix Scar 18 2023 G834JY-N6005W | |
| Eluktronics Mech-17 GP2 | |
* ... smaller is better
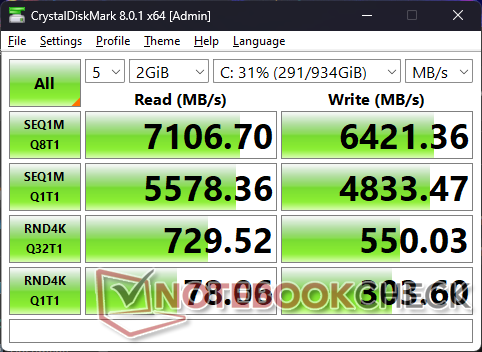
Storage Devices — Four M.2 Drives Total
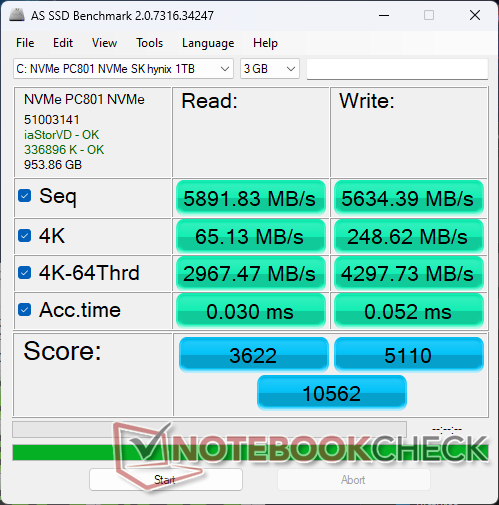
Our unit comes configured with an SK Hynix PC801 PCIe4 x4 NVMe SSD for sequential read and write rates of up to 7000 MB/s and 6500 MB/s, respectively. Performance is competitive against the Samsung PMA1 series and our drive exhibits no issues maintaining maximum speeds with no throttling.
The Alienware does not support PCIe5 NVMe SSDs unlike on the MSI GE78 or GT77 series. Nonetheless, it supports more internal SSDs than on most other laptops.

| Drive Performance rating - Percent | |
| Alienware m18 R1 | |
| MSI Titan GT77 HX 13VI | |
| Razer Blade 18 RTX 4070 | |
| Alienware x17 R2 P48E | |
| Asus ROG Strix Scar 18 2023 G834JY-N6005W | |
| Eluktronics Mech-17 GP2 | |
* ... smaller is better
Disk Throttling: DiskSpd Read Loop, Queue Depth 8
GPU Performance — 175 W GeForce RTX 4090
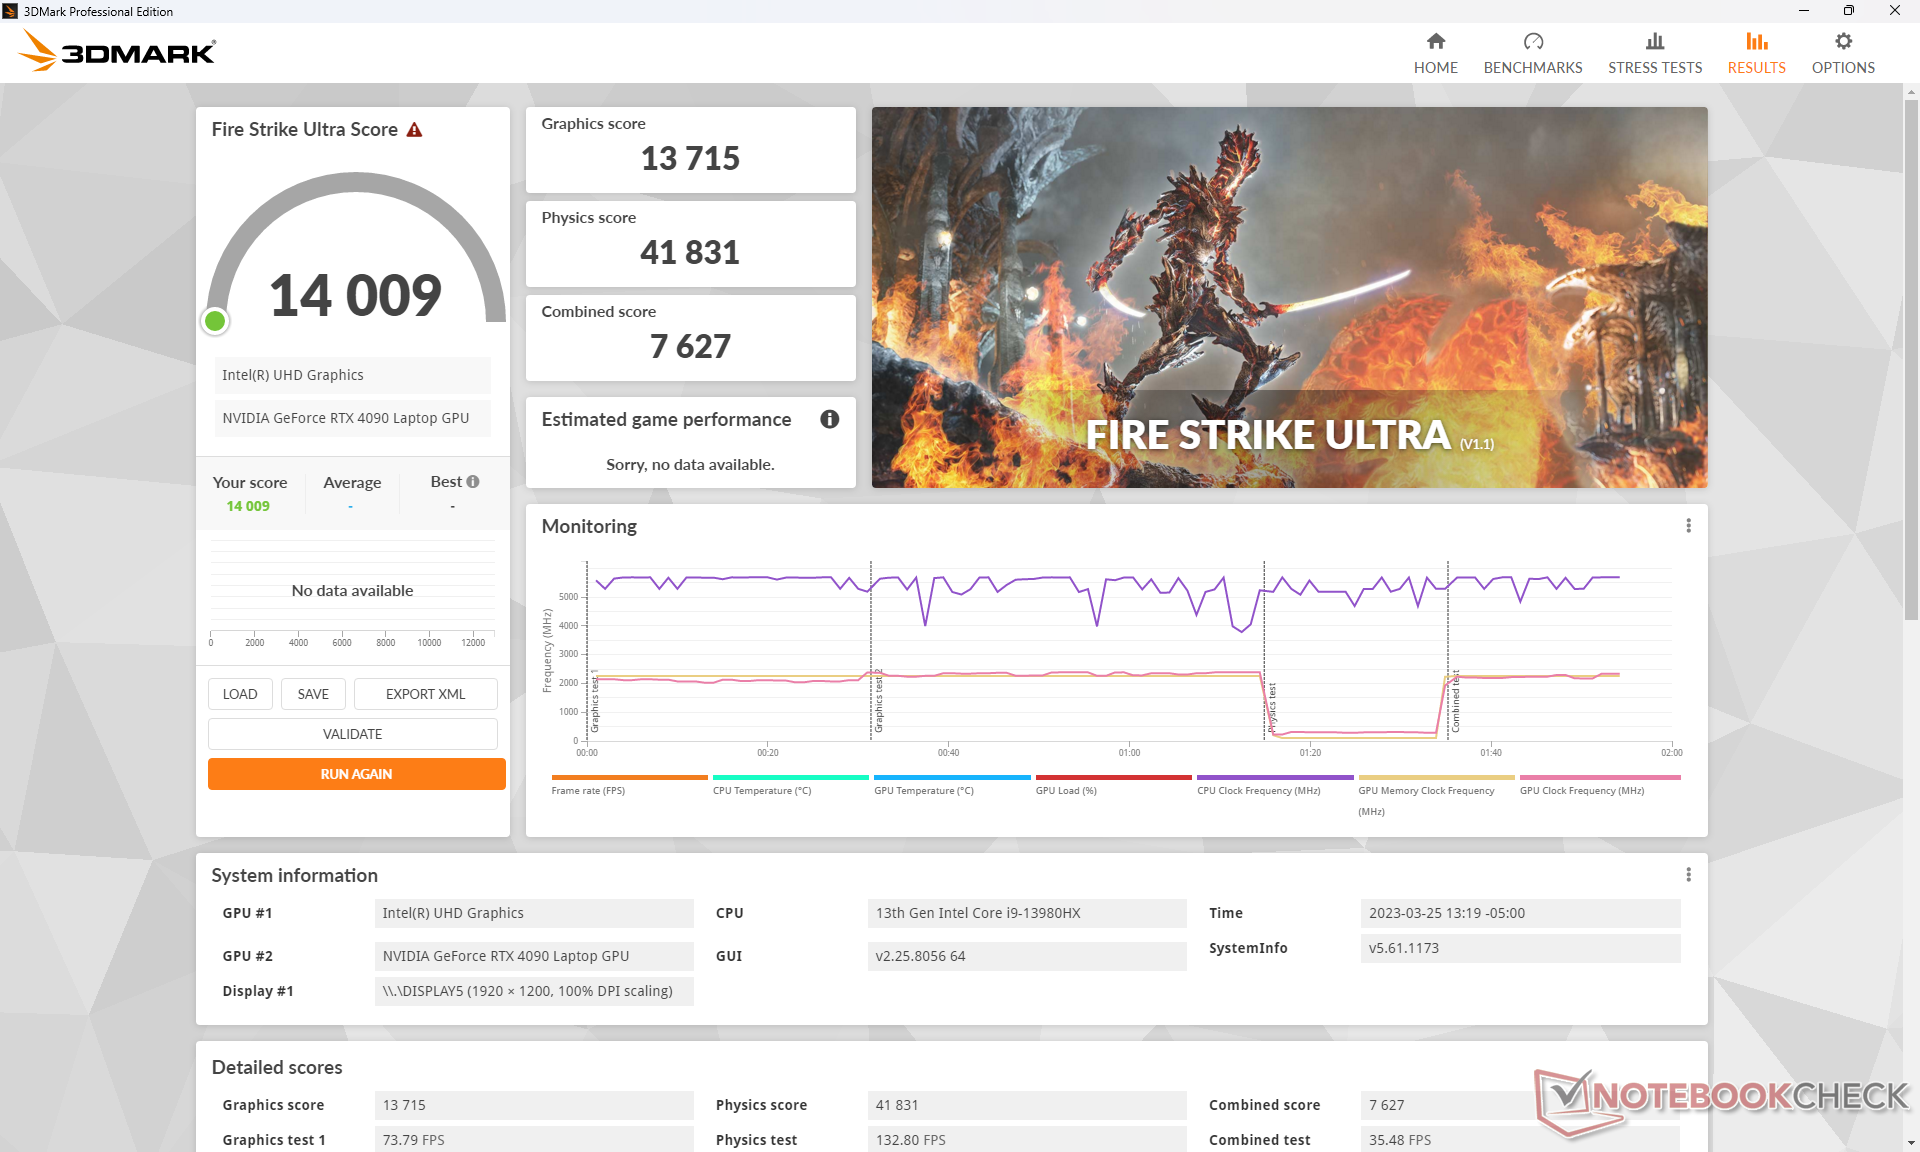
Overall graphics performance from the mobile GeForce RTX 4090 is most similar to the desktop GeForce RTX 4070. It offers enough performance to play any current game at 4K Ultra settings including F1 22. If ray-tracing is enabled, however, it's recommended to enable DLSS or frame generation where supported to keep frame rates afloat.
When compared to the last generation mobile RTX 3080 Ti, the mobile RTX 4090 offers between 40 to 70 percent faster performance while maintaining a similar 175 W power envelope.
Running Fire Strike on Overdrive mode shows no major advantages when compared to the quieter Performance mode as their final scores would be almost identical. Repeating the test on Balanced mode, however, would result in a 5 percent and 9 percent drop in GPU and CPU performance, respectively.
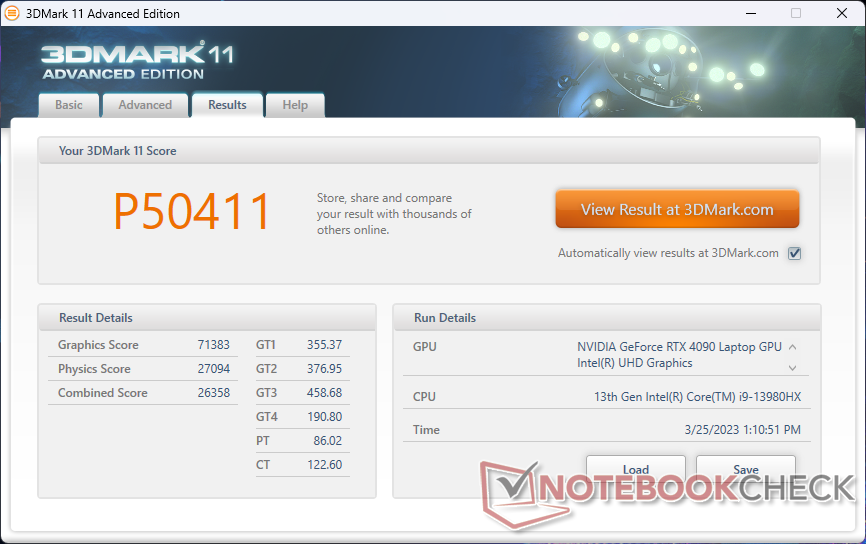
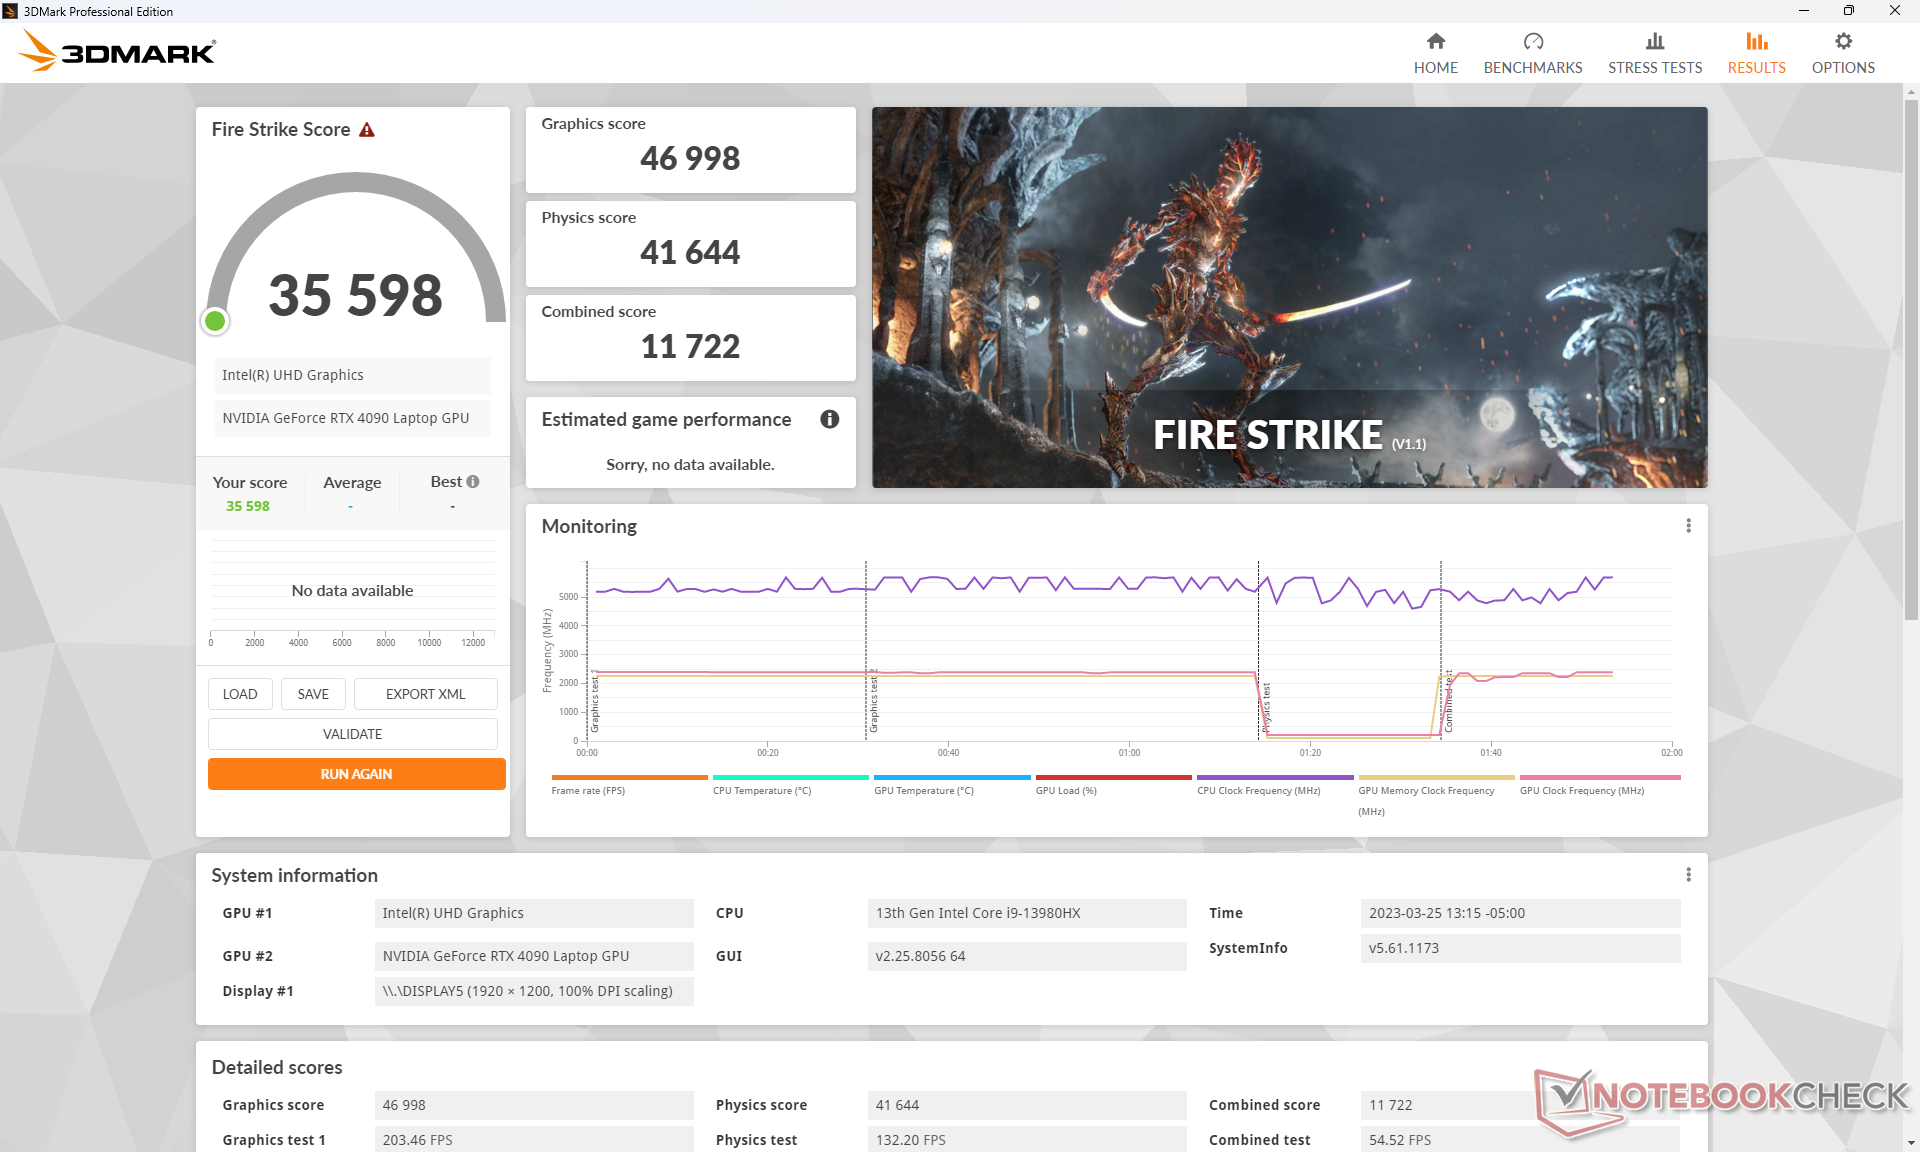
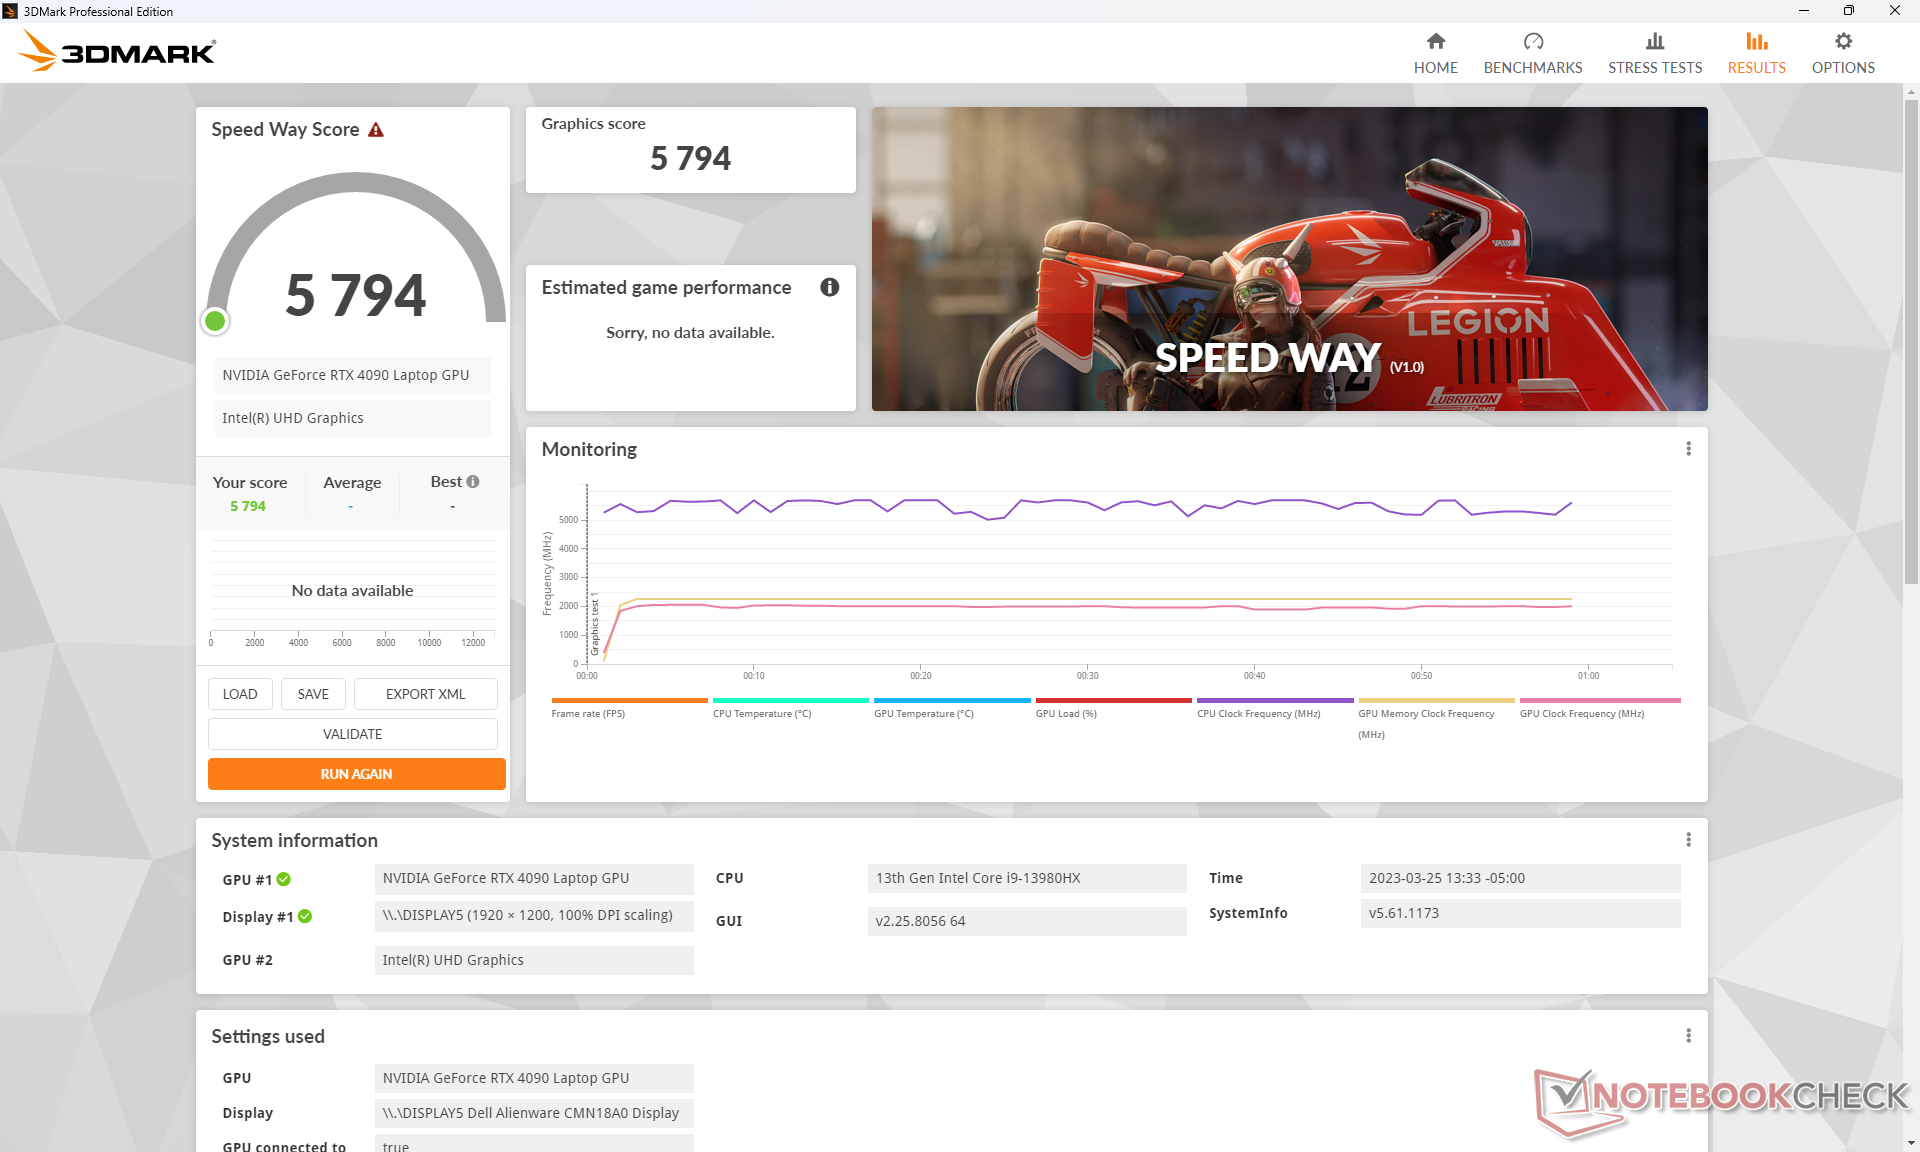
| 3DMark 11 Performance | 50411 points | |
| 3DMark Fire Strike Score | 35598 points | |
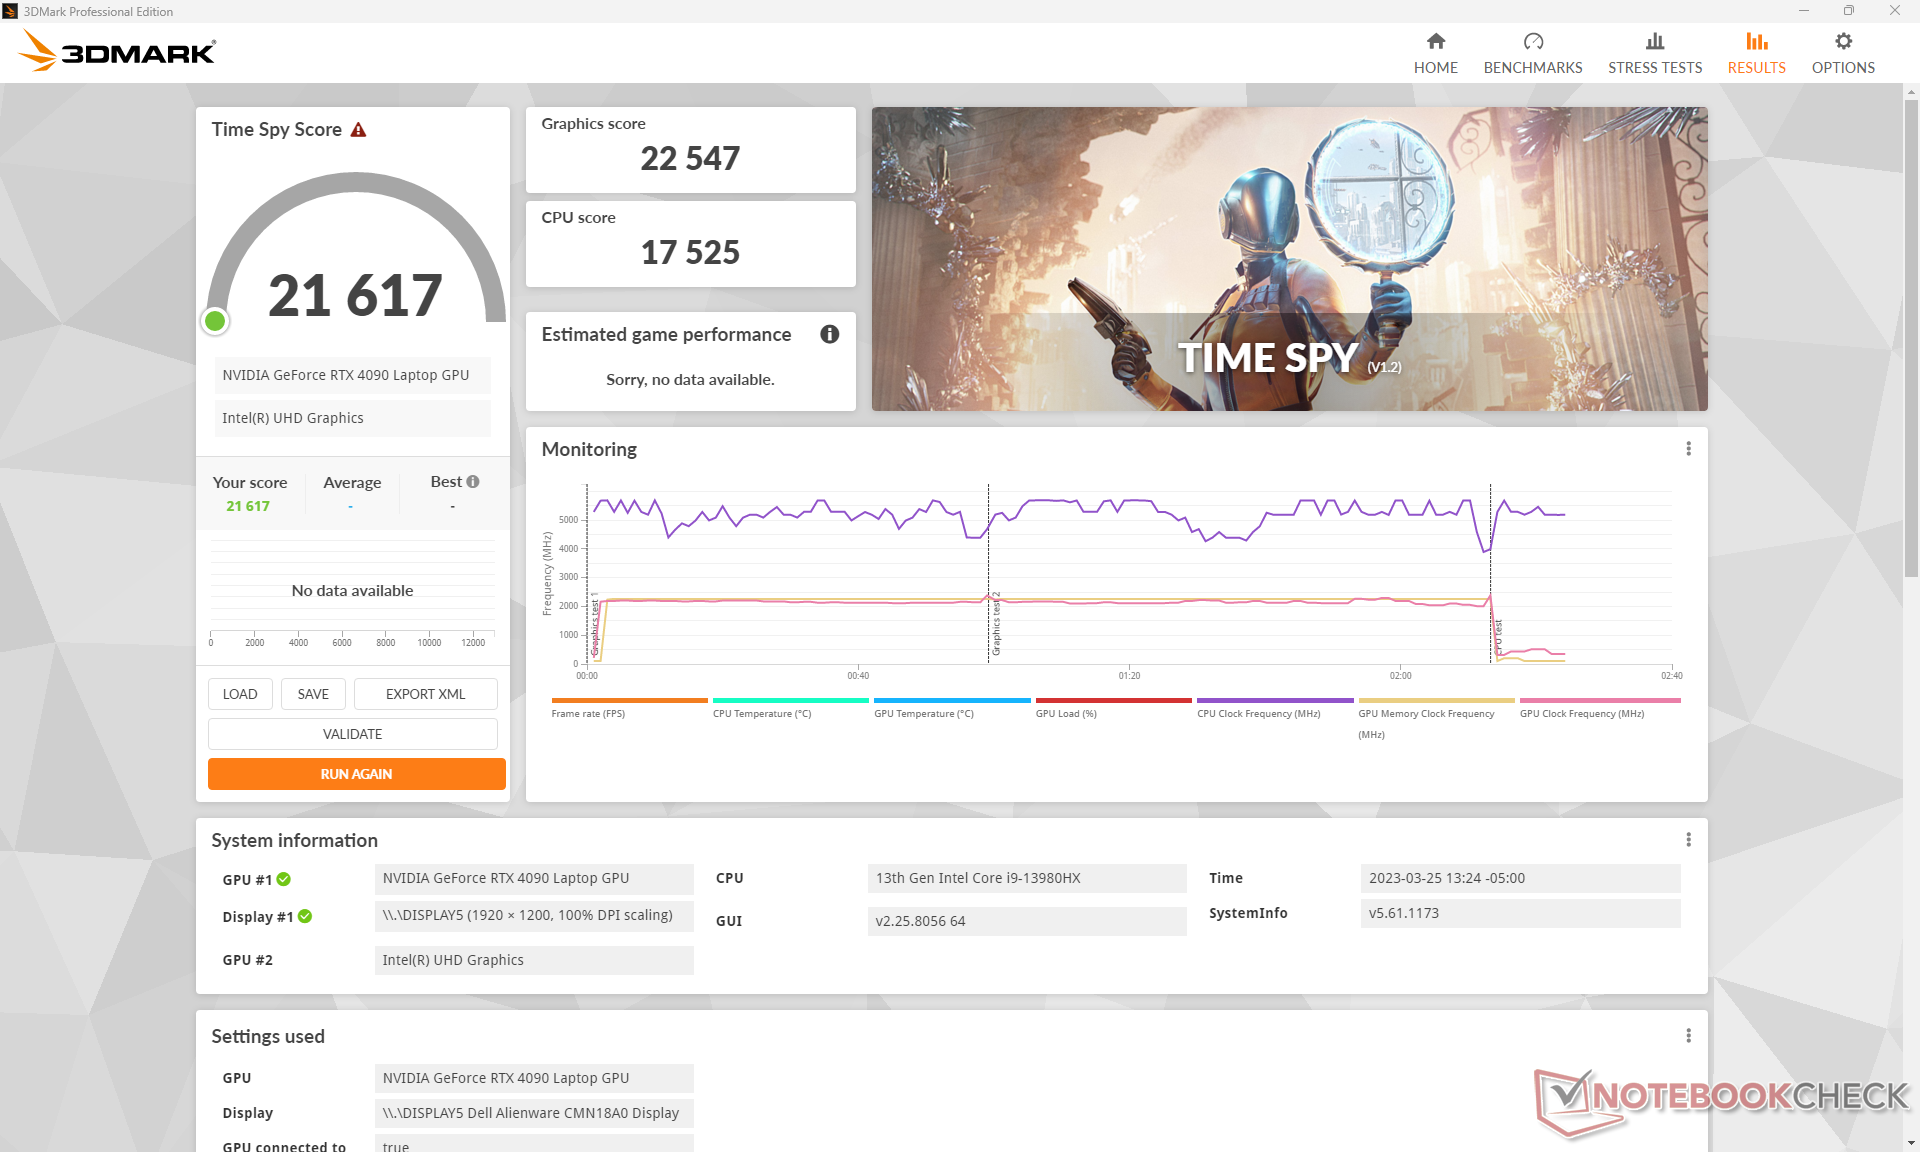
| 3DMark Time Spy Score | 21617 points | |
Help | ||
* ... smaller is better
Witcher 3 FPS Chart
| low | med. | high | ultra | QHD | 4K | |
|---|---|---|---|---|---|---|
| GTA V (2015) | 186.7 | 185.3 | 184.5 | 149 | 145.5 | 176.4 |
| The Witcher 3 (2015) | 649.2 | 563.8 | 441.6 | 213.9 | 165.6 | |
| Dota 2 Reborn (2015) | 251 | 220 | 210 | 194.2 | 190.2 | |
| Final Fantasy XV Benchmark (2018) | 231 | 227 | 194.8 | 159.5 | 92.6 | |
| X-Plane 11.11 (2018) | 210 | 187.1 | 143.5 | 124 | ||
| Strange Brigade (2018) | 475 | 388 | 388 | 373 | 308 | 159.8 |
| Cyberpunk 2077 1.6 (2022) | 157.2 | 151.8 | 148.2 | 127.92 | 102.16 | 49.99 |
| Tiny Tina's Wonderlands (2022) | 359.1 | 301.8 | 232.5 | 187.7 | 133.8 | 71.3 |
| F1 22 (2022) | 336 | 320 | 318 | 144.7 | 92.2 | 45.5 |
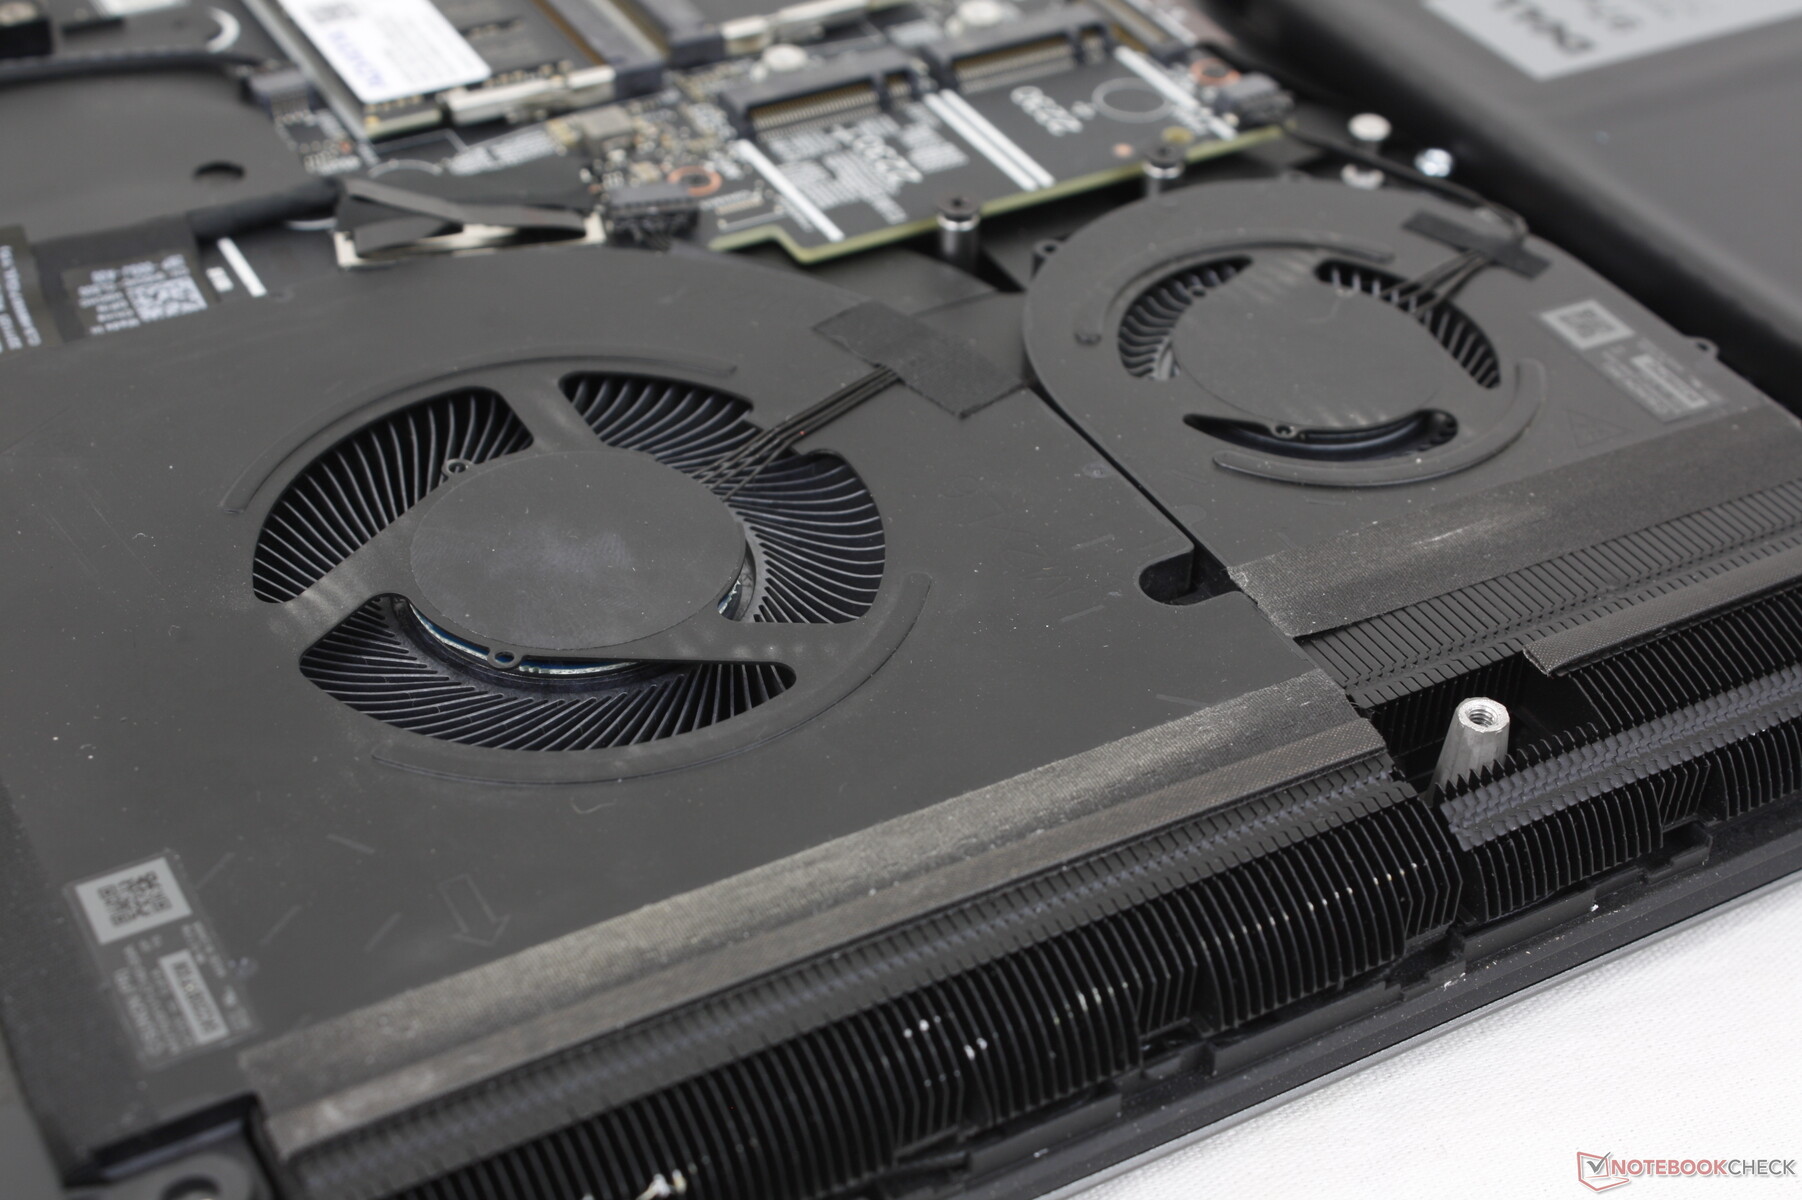
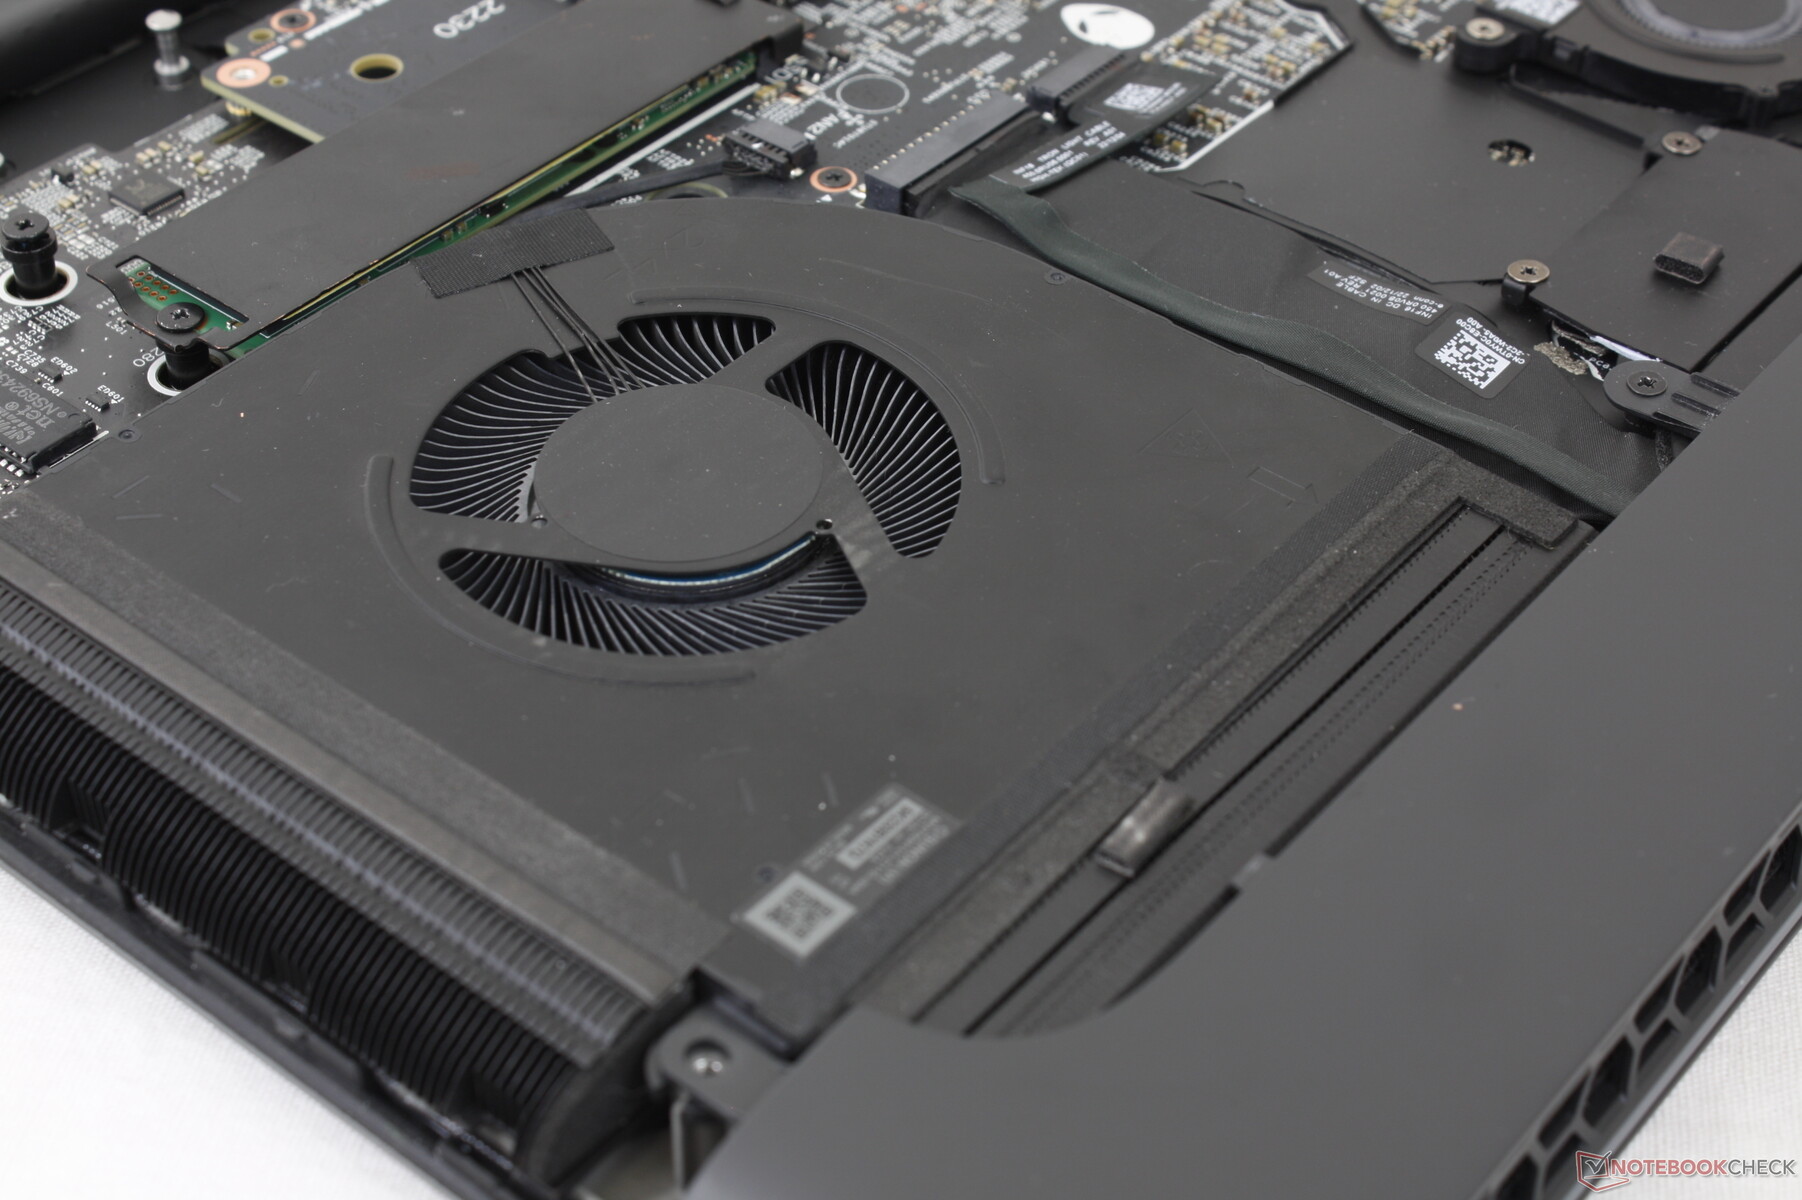
Emissions — Four Fast & Furious Fans
System Noise
If you thought a laptop with four fans would be loud, then you'd be... well, absolutely right. Gaming on Performance mode would induce a fan noise of 51 dB(A) which is similar to the Eluktronics Mech-17 GP2 but louder than the Razer Blade 18. If gaming on Overdrive mode, fan noise would be even louder at almost 57 dB(A). Anything above 50 dB(A) requires a pair of good headphones to drown out the whirring fans. Keep in mind that Overdrive mode is not necessary for most games as our Stress Test section below will show.
Thankfully, the system is better at remaining quiet during lower loads as the fans do not pulse when on lower profile settings. Thus, you can still browse the web or stream video content at comfortable fan noise levels.

Noise level
| Idle |
| 23 / 23 / 23 dB(A) |
| Load |
| 35.6 / 56.7 dB(A) |
 | ||
30 dB silent 40 dB(A) audible 50 dB(A) loud |
||
min: | ||
| Alienware m18 R1 GeForce RTX 4090 Laptop GPU, i9-13980HX, SK hynix PC801 HFS001TEJ9X101N | Razer Blade 18 RTX 4070 GeForce RTX 4070 Laptop GPU, i9-13950HX, SSSTC CA6-8D1024 | Asus ROG Strix Scar 18 2023 G834JY-N6005W GeForce RTX 4090 Laptop GPU, i9-13980HX, 2x Samsung PM9A1 MZVL21T0HCLR (RAID 0) | Eluktronics Mech-17 GP2 GeForce RTX 4090 Laptop GPU, i9-13900HX, Samsung PM9A1 MZVL21T0HCLR | MSI Titan GT77 HX 13VI GeForce RTX 4090 Laptop GPU, i9-13950HX, Samsung PM9A1 MZVL22T0HBLB | Alienware x17 R2 P48E GeForce RTX 3080 Ti Laptop GPU, i9-12900HK, 2x Samsung PM9A1 1TB (RAID 0) | |
|---|---|---|---|---|---|---|
| Noise | -3% | -15% | -13% | -20% | 2% | |
| off / environment * (dB) | 22.8 | 23.5 -3% | 23.9 -5% | 25.2 -11% | 24.6 -8% | 22.7 -0% |
| Idle Minimum * (dB) | 23 | 23.8 -3% | 23.9 -4% | 28 -22% | 29.2 -27% | 23.1 -0% |
| Idle Average * (dB) | 23 | 23.8 -3% | 32.6 -42% | 28 -22% | 29.2 -27% | 23.1 -0% |
| Idle Maximum * (dB) | 23 | 26.8 -17% | 32.6 -42% | 30.4 -32% | 29.2 -27% | 23.1 -0% |
| Load Average * (dB) | 35.6 | 37.3 -5% | 35.9 -1% | 41 -15% | 50.7 -42% | 31.9 10% |
| Witcher 3 ultra * (dB) | 51.3 | 48 6% | 50.7 1% | 53.3 -4% | 52.5 -2% | |
| Load Maximum * (dB) | 56.7 | 53.5 6% | 55.8 2% | 52.6 7% | 61 -8% | 52.5 7% |
* ... smaller is better
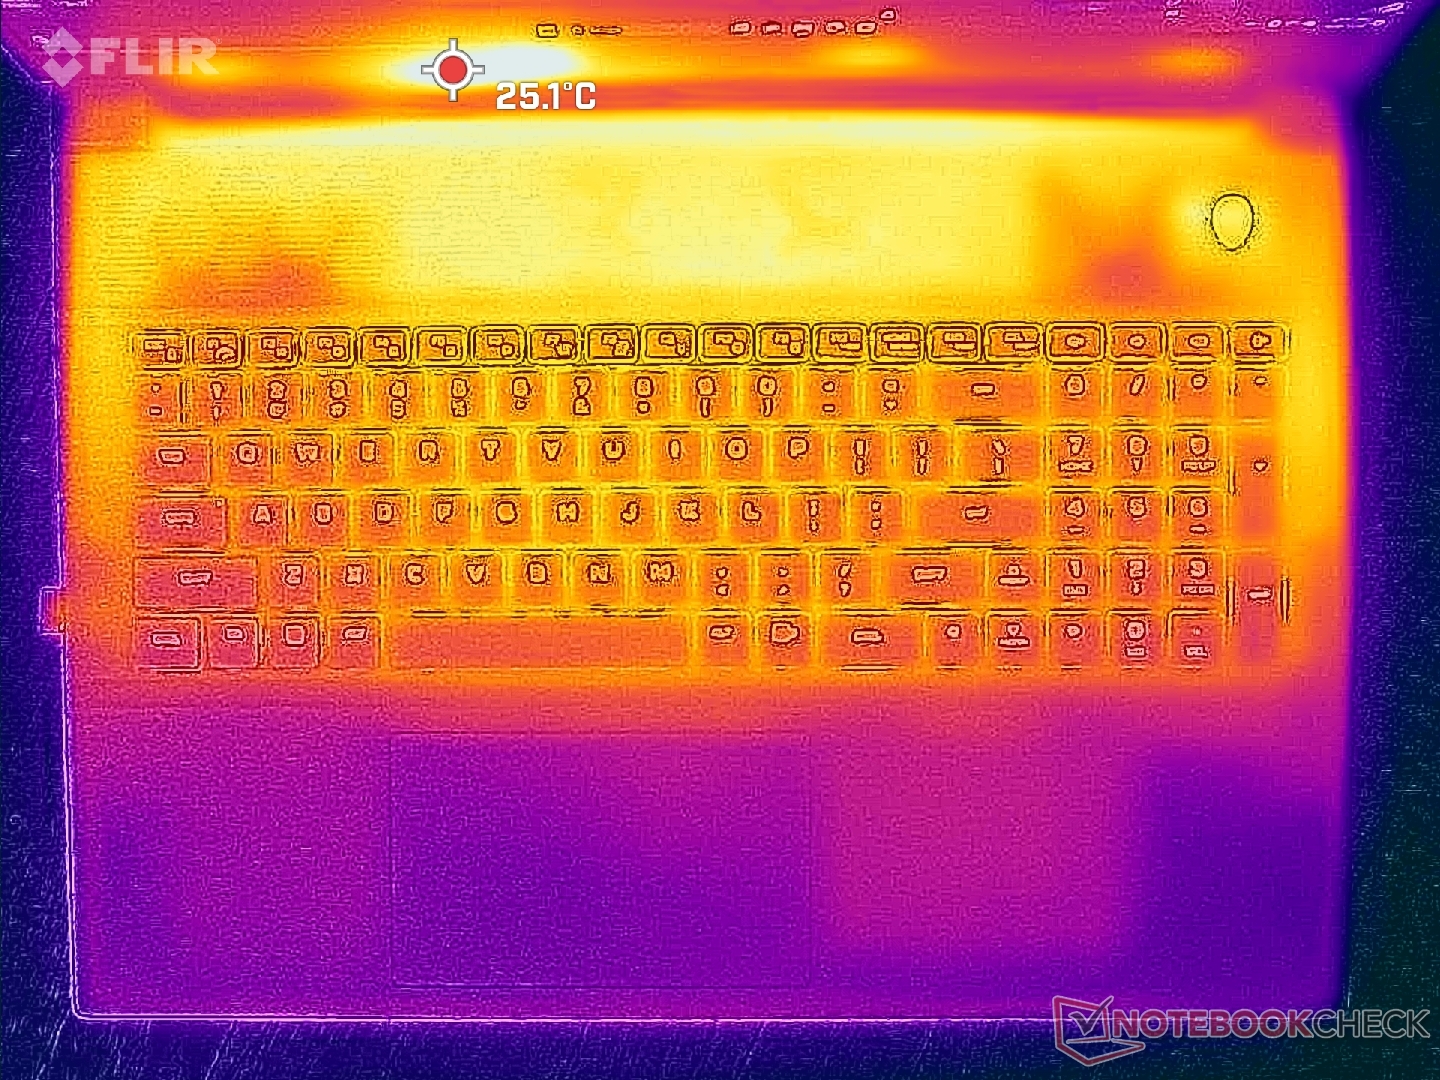
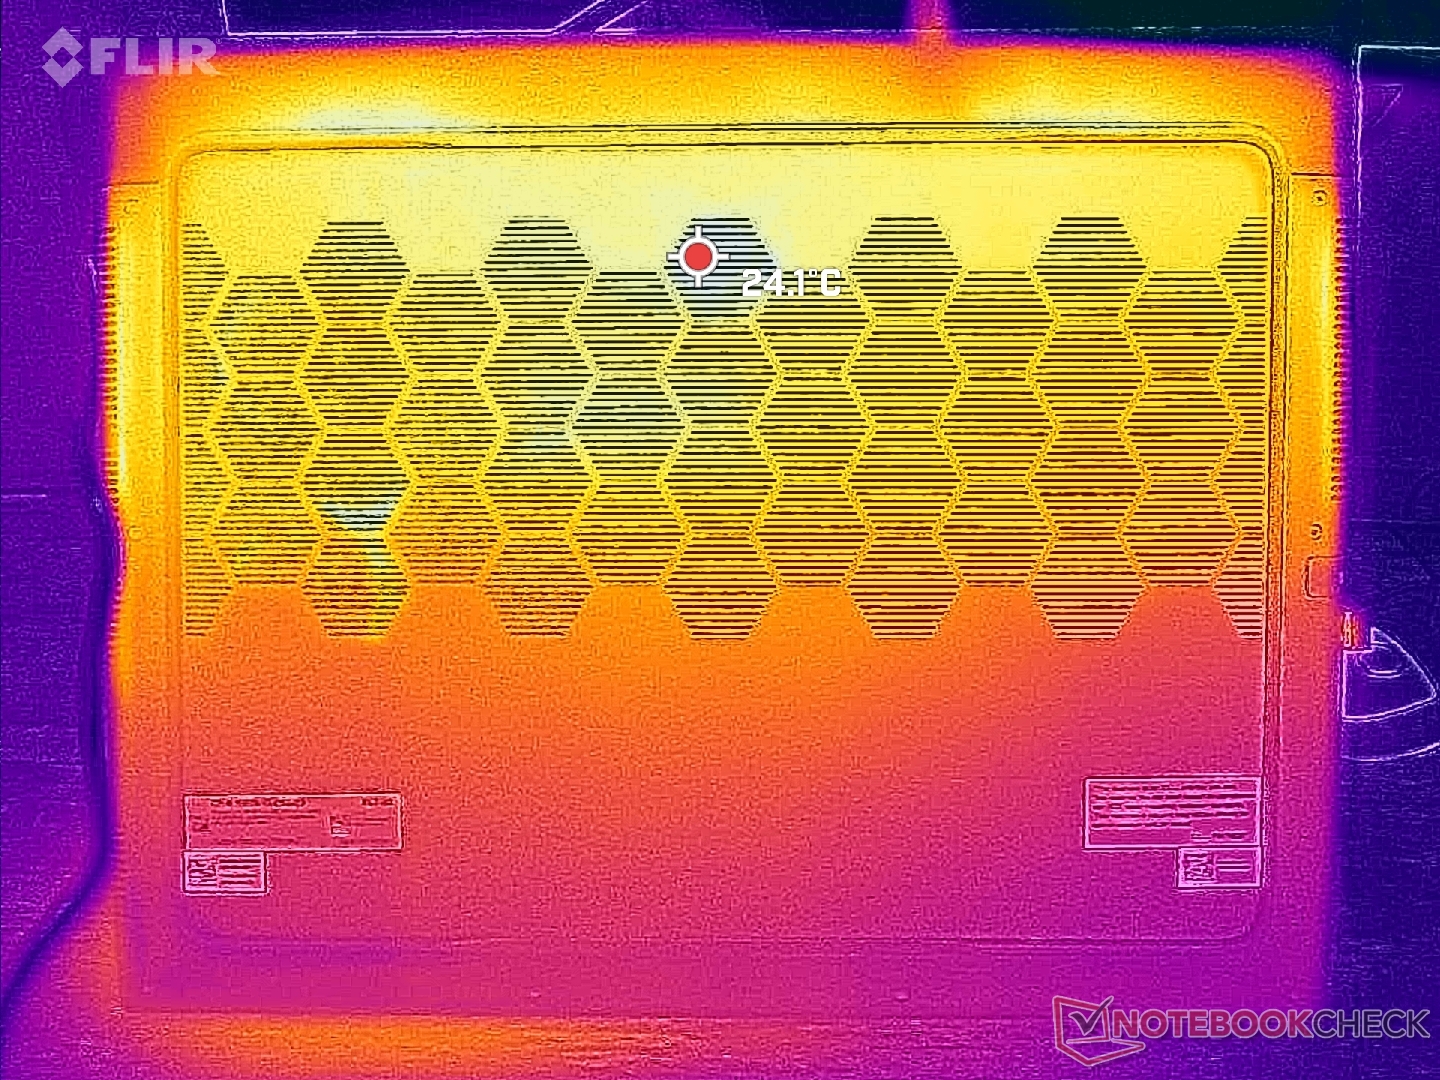
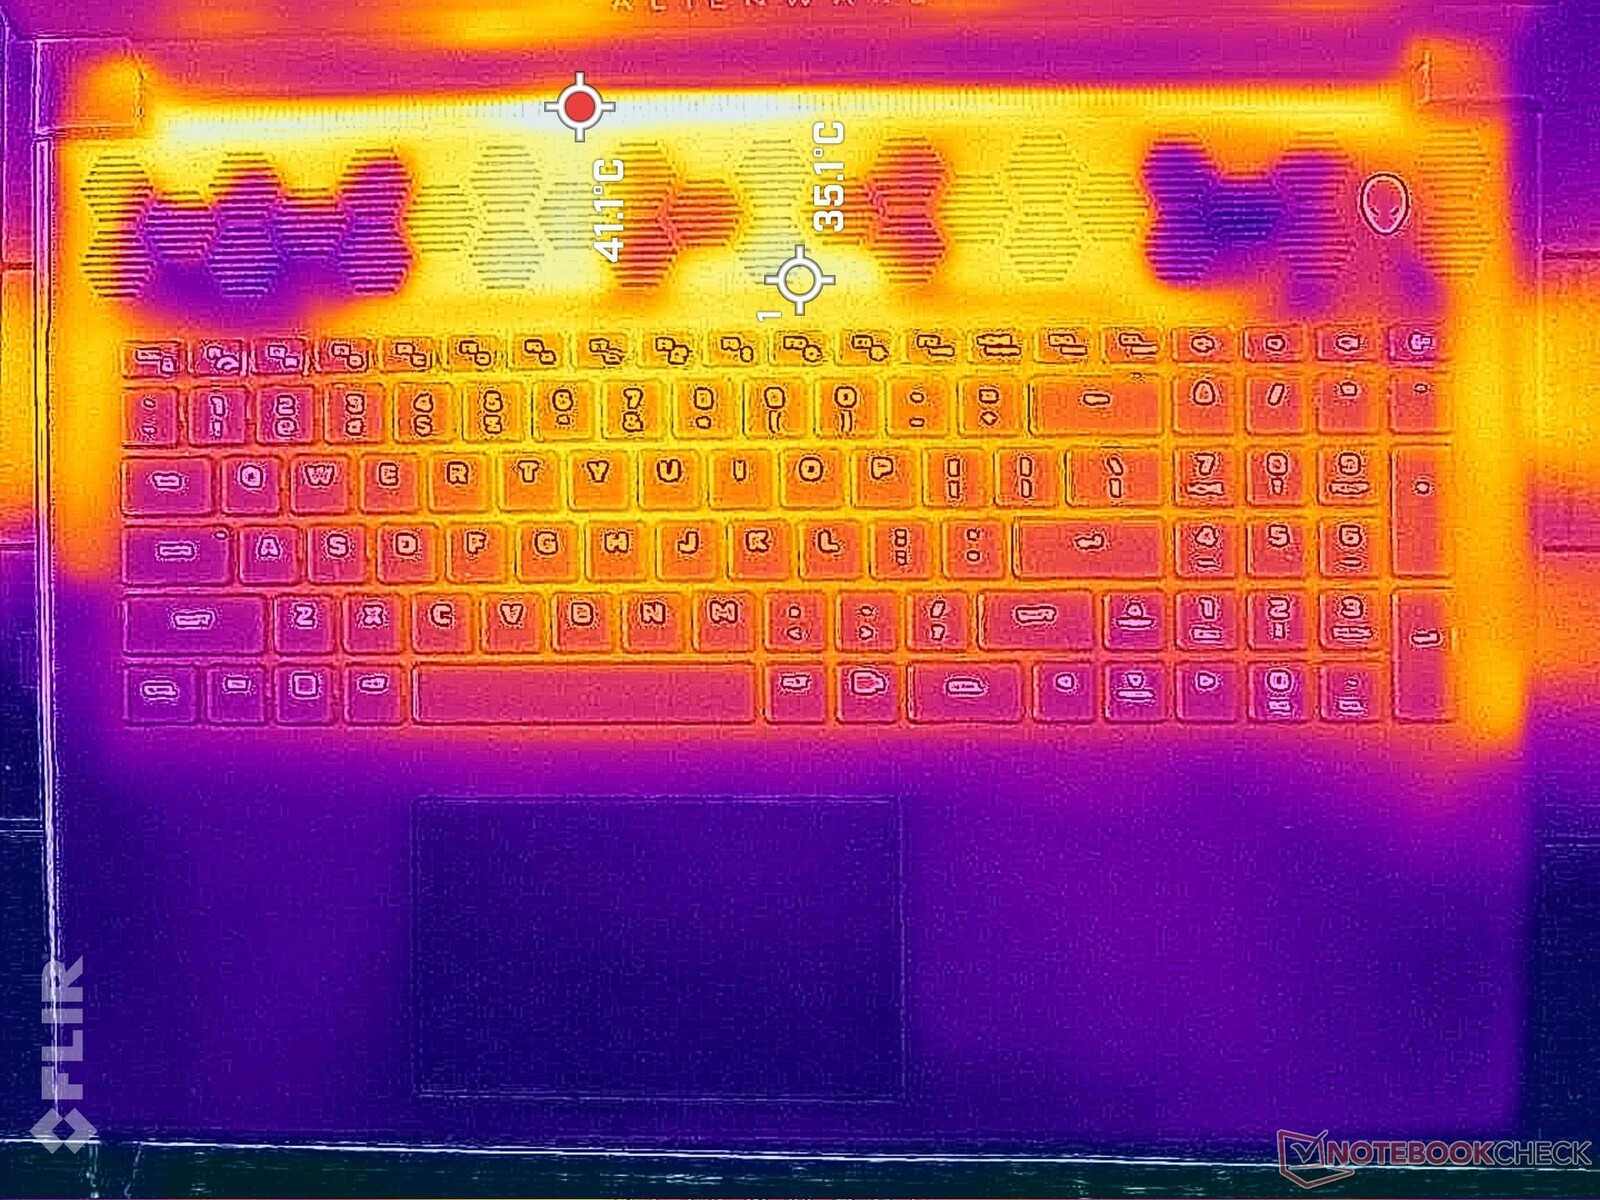
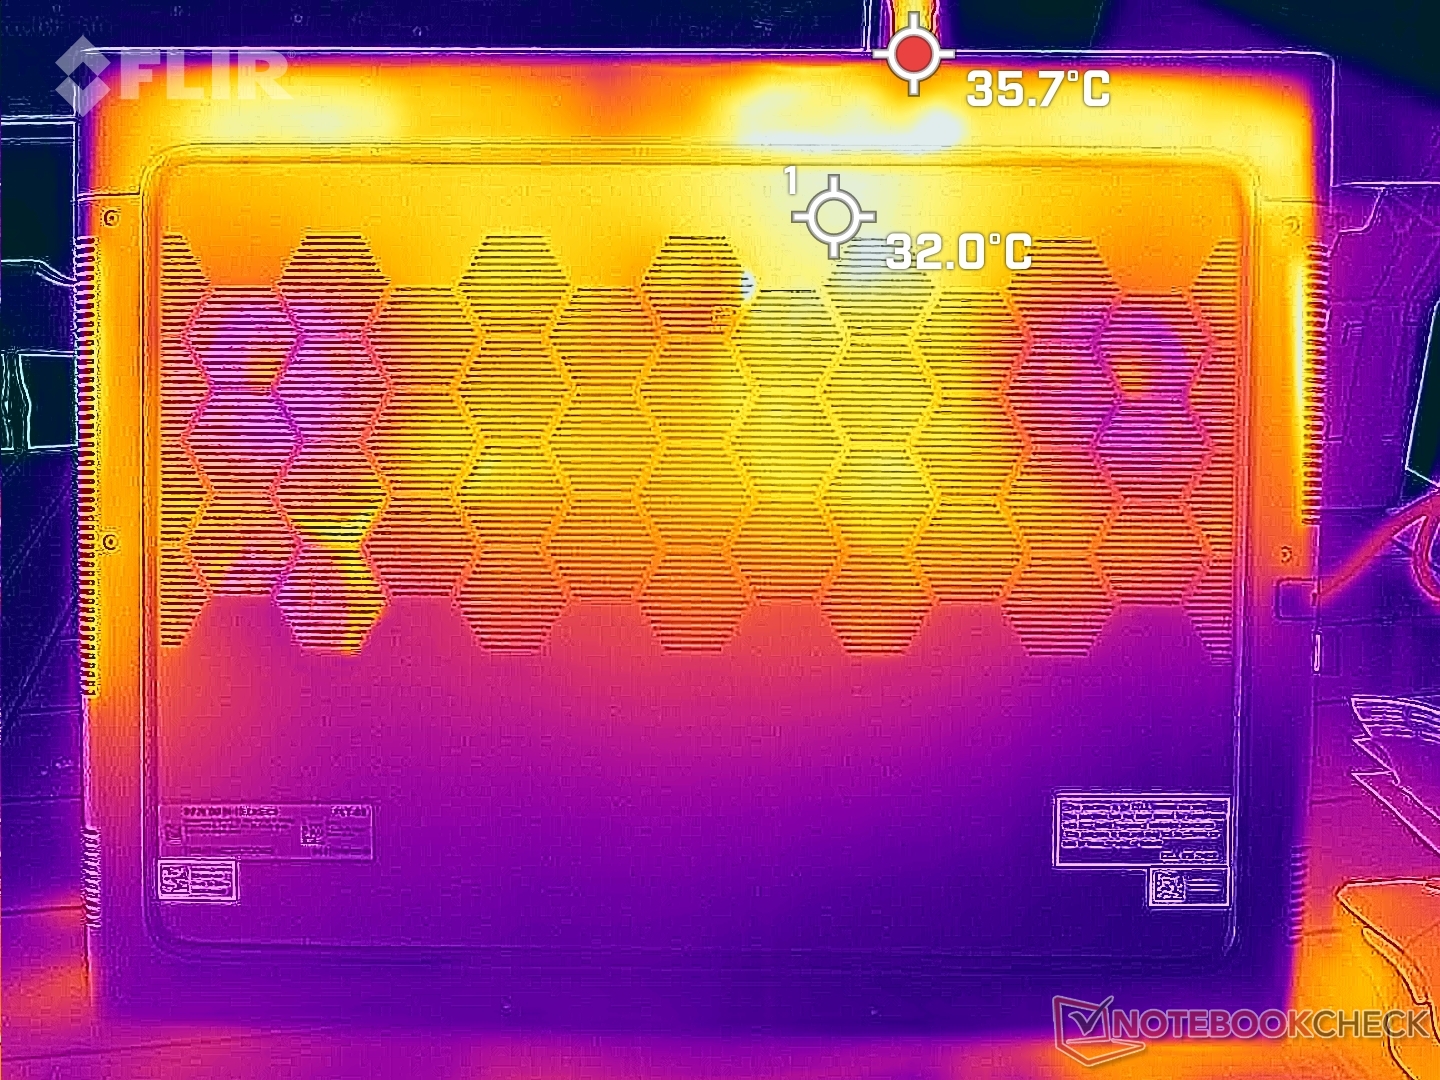
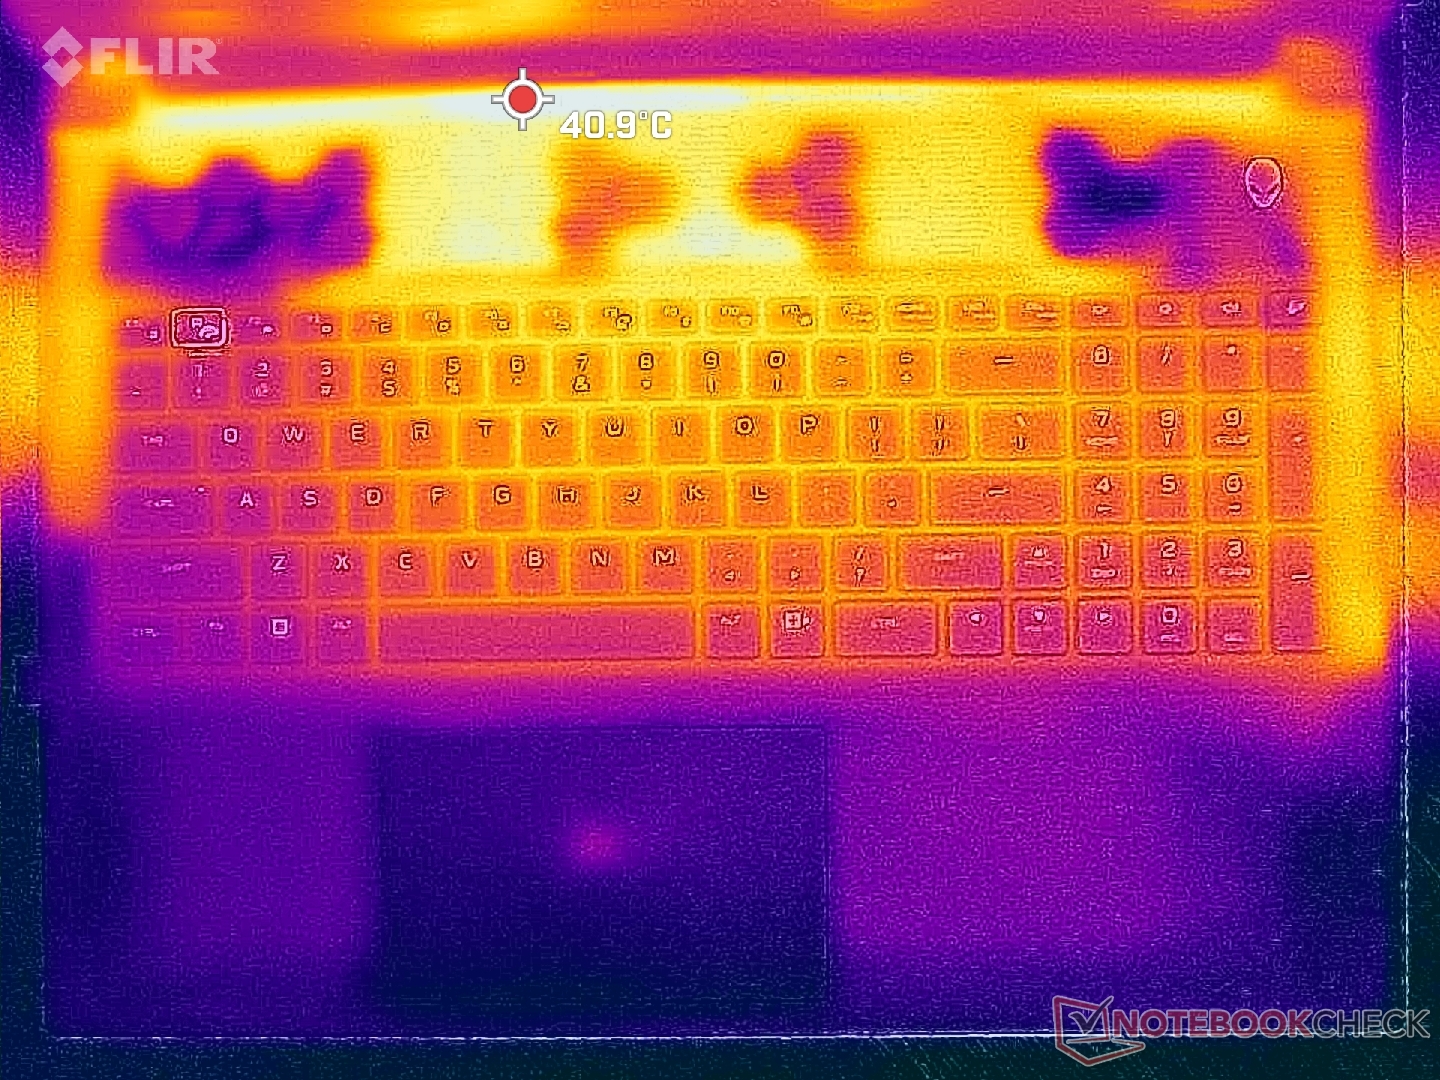
Temperature
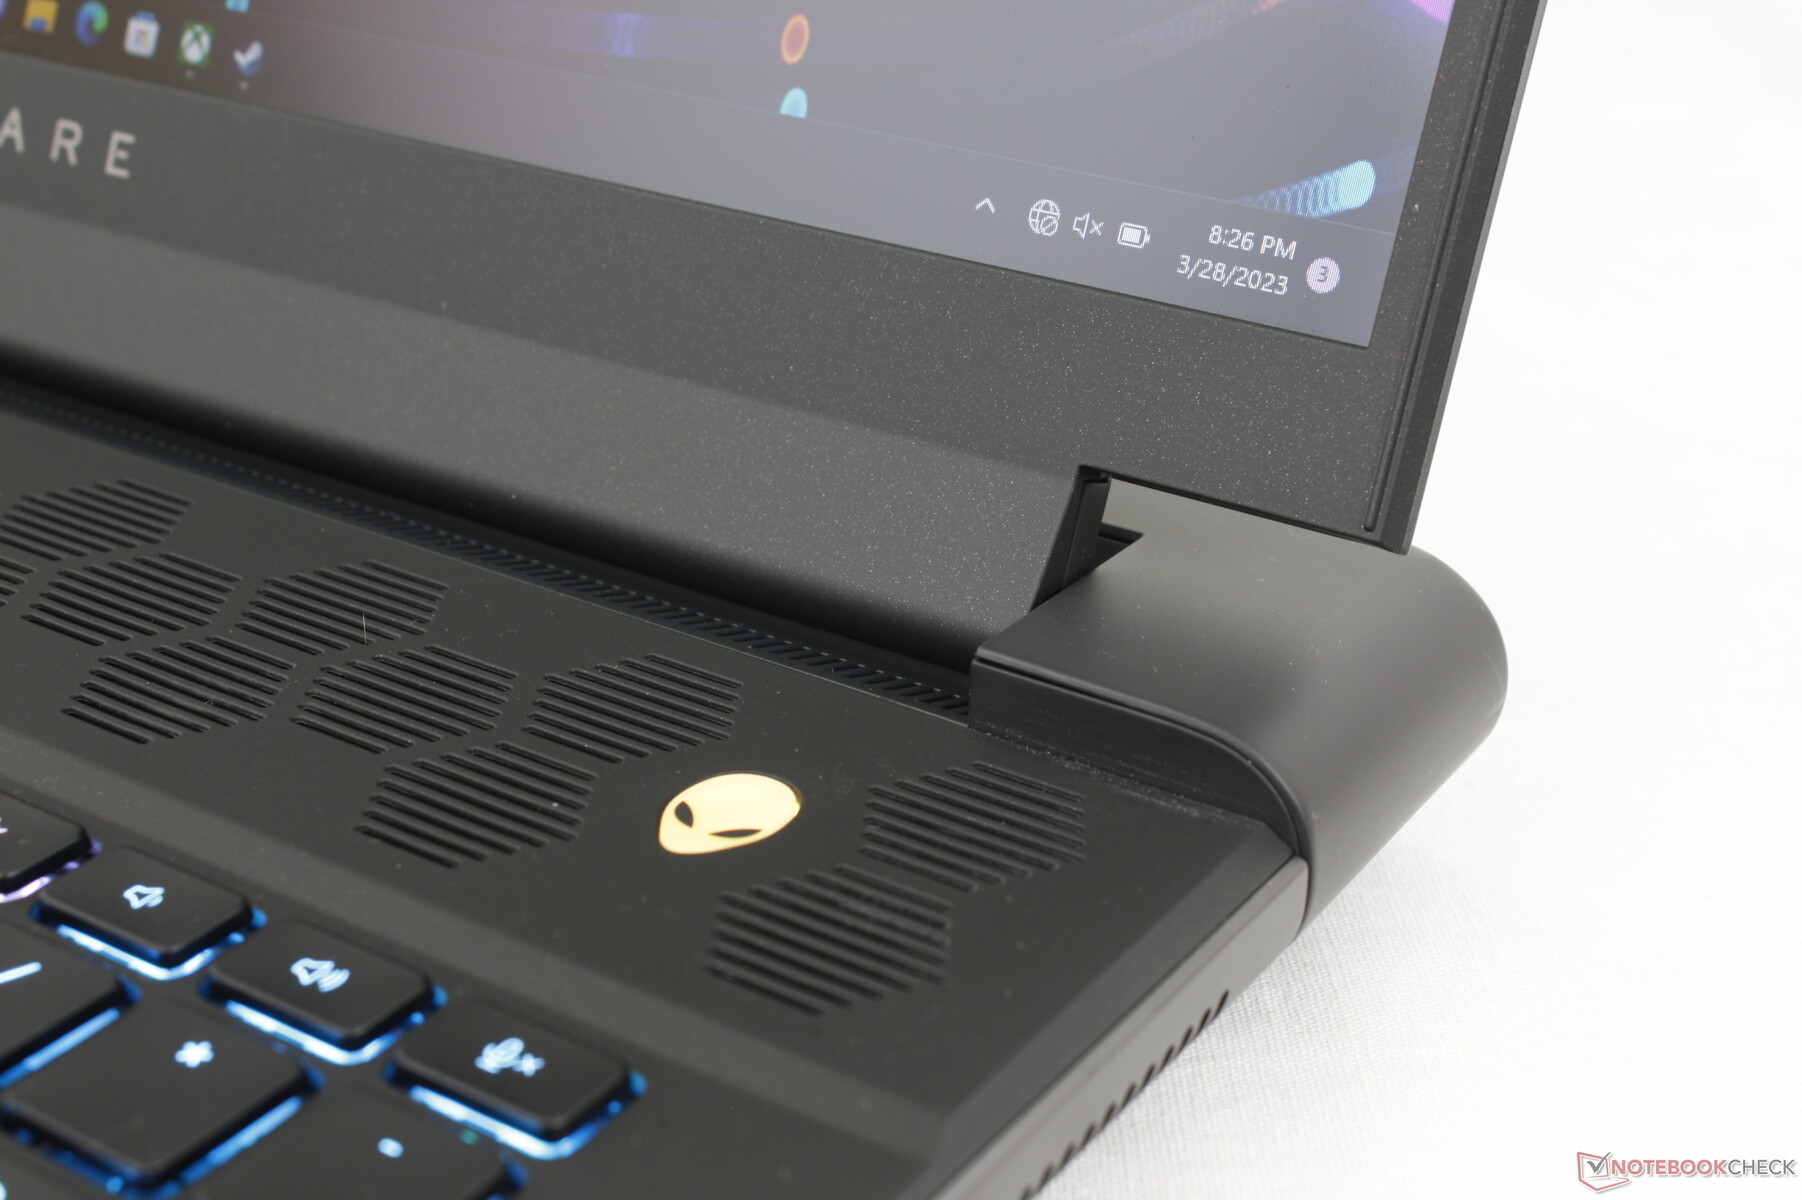
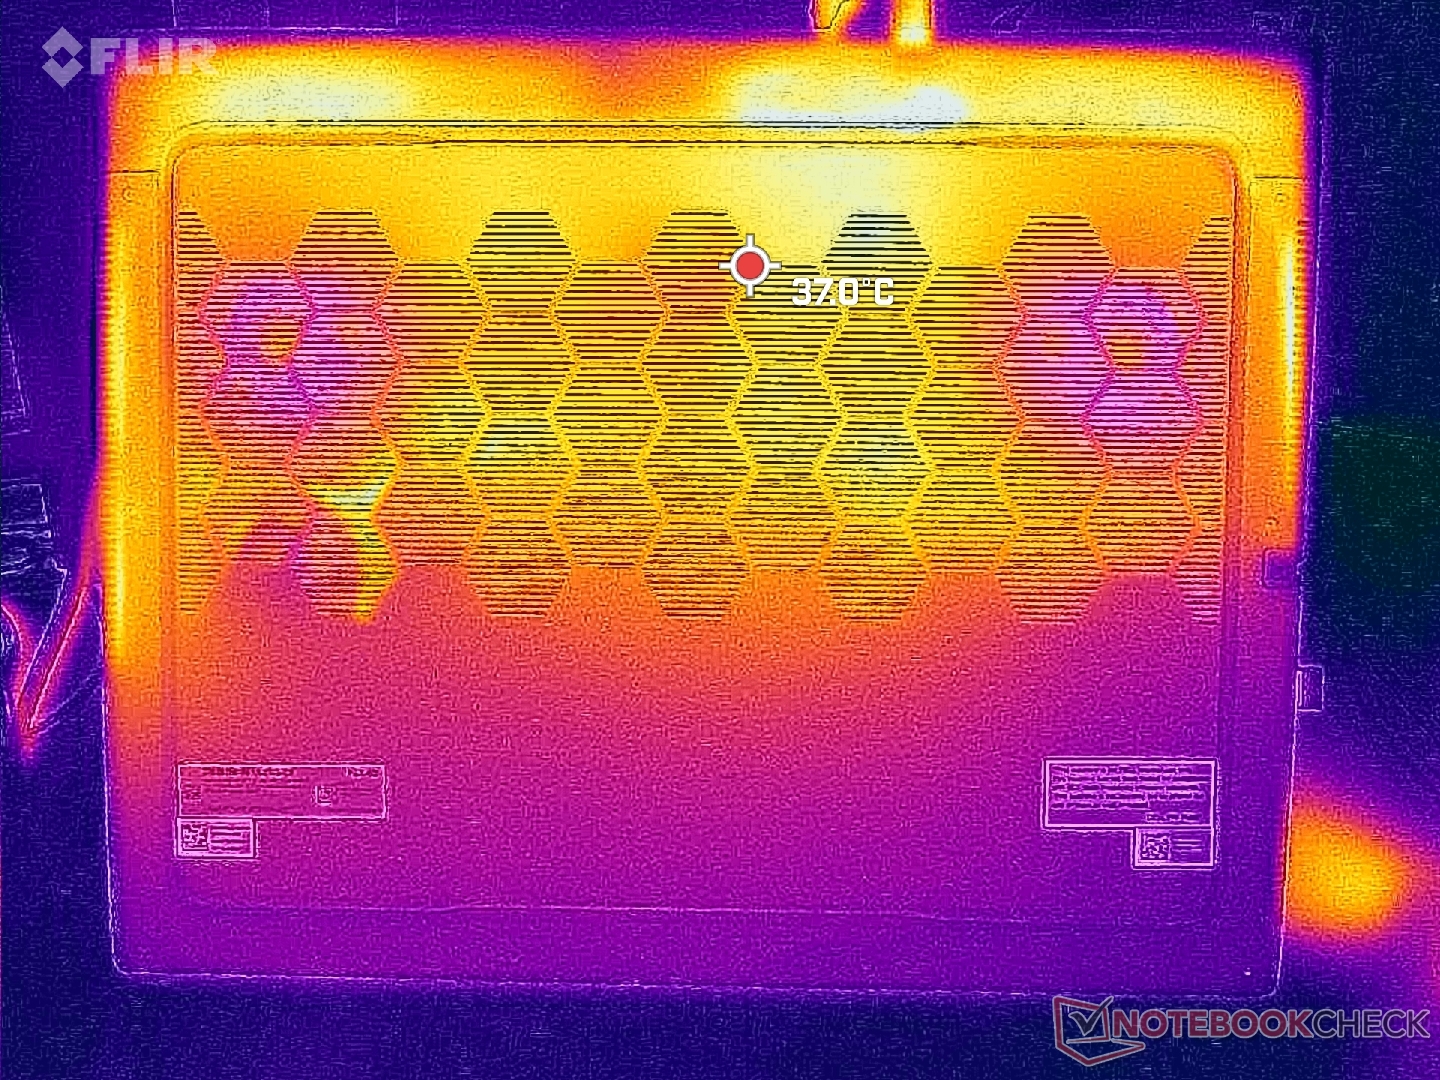
Surface temperatures are not an issue due in part to the ample ventilation grilles on almost every side of the large chassis. The warmest spots are along the rear away from the keyboard keys and palm rests to keep hands comfortable.
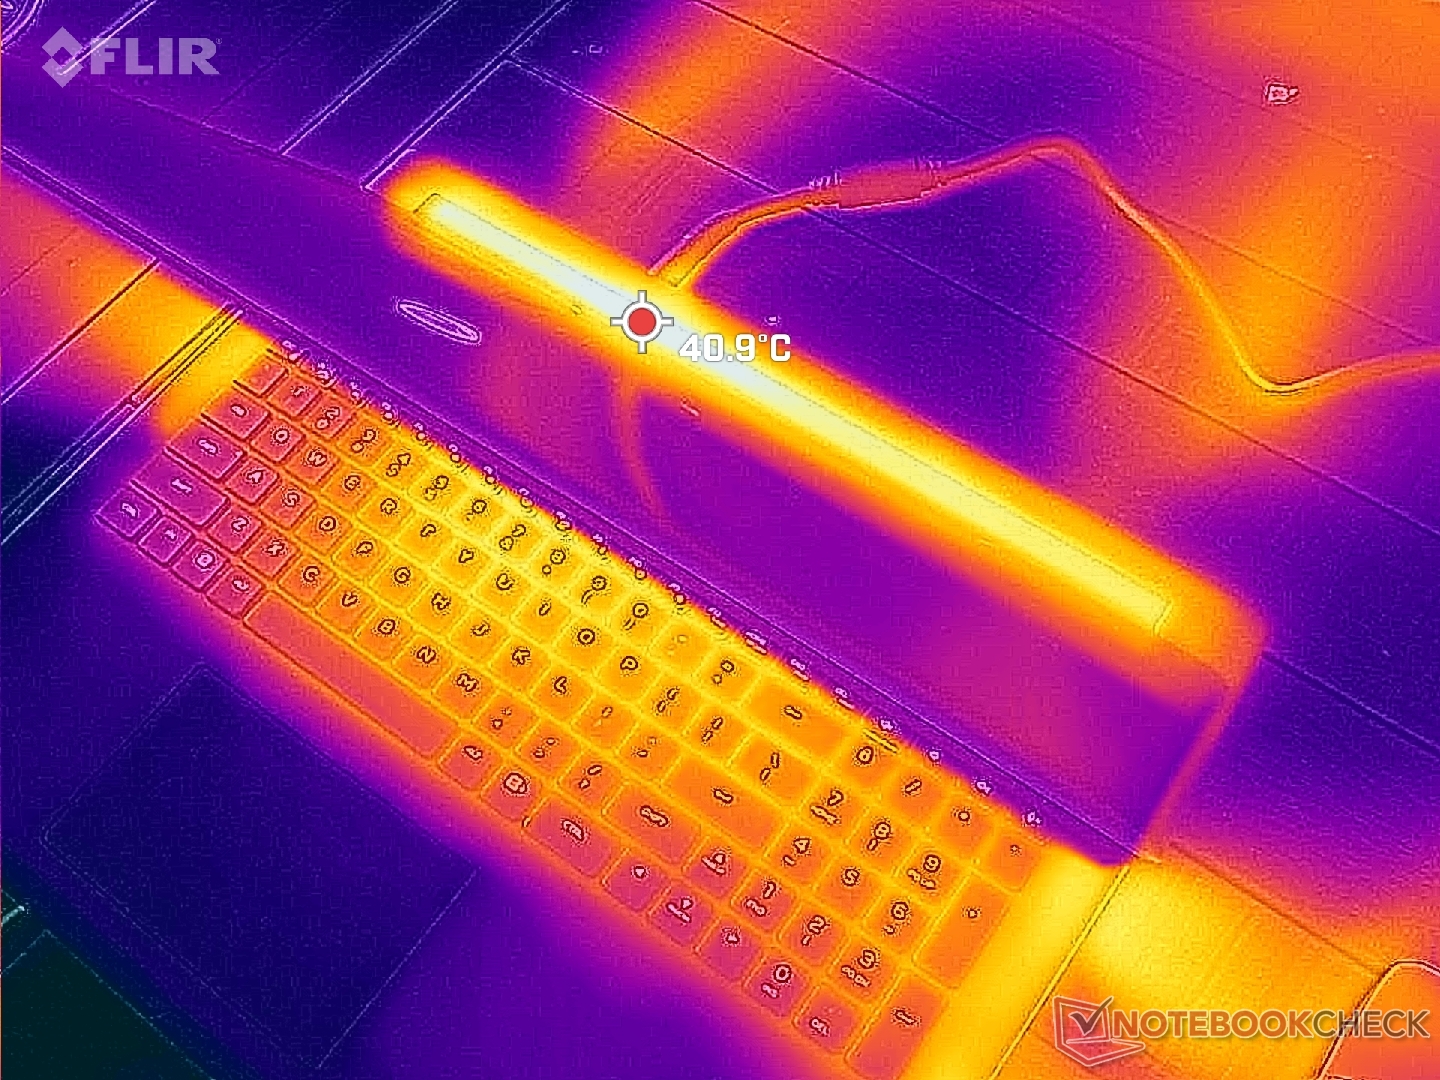
(+) The maximum temperature on the upper side is 39 °C / 102 F, compared to the average of 40.4 °C / 105 F, ranging from 21.2 to 68.8 °C for the class Gaming.
(+) The bottom heats up to a maximum of 36.4 °C / 98 F, compared to the average of 43.2 °C / 110 F
(+) In idle usage, the average temperature for the upper side is 25.2 °C / 77 F, compared to the device average of 33.9 °C / 93 F.
(+) Playing The Witcher 3, the average temperature for the upper side is 29.8 °C / 86 F, compared to the device average of 33.9 °C / 93 F.
(+) The palmrests and touchpad are cooler than skin temperature with a maximum of 23.8 °C / 74.8 F and are therefore cool to the touch.
(+) The average temperature of the palmrest area of similar devices was 28.8 °C / 83.8 F (+5 °C / 9 F).
| Alienware m18 R1 Intel Core i9-13980HX, NVIDIA GeForce RTX 4090 Laptop GPU | Razer Blade 18 RTX 4070 Intel Core i9-13950HX, NVIDIA GeForce RTX 4070 Laptop GPU | Asus ROG Strix Scar 18 2023 G834JY-N6005W Intel Core i9-13980HX, NVIDIA GeForce RTX 4090 Laptop GPU | Eluktronics Mech-17 GP2 Intel Core i9-13900HX, NVIDIA GeForce RTX 4090 Laptop GPU | MSI Titan GT77 HX 13VI Intel Core i9-13950HX, NVIDIA GeForce RTX 4090 Laptop GPU | Alienware x17 R2 P48E Intel Core i9-12900HK, NVIDIA GeForce RTX 3080 Ti Laptop GPU | |
|---|---|---|---|---|---|---|
| Heat | -7% | -20% | -9% | -4% | -15% | |
| Maximum Upper Side * (°C) | 39 | 39.2 -1% | 54 -38% | 39 -0% | 40.6 -4% | 49.6 -27% |
| Maximum Bottom * (°C) | 36.4 | 35.6 2% | 46 -26% | 44 -21% | 41.1 -13% | 42.4 -16% |
| Idle Upper Side * (°C) | 29.2 | 31.8 -9% | 30 -3% | 31 -6% | 26.2 10% | 29.2 -0% |
| Idle Bottom * (°C) | 27.8 | 33.2 -19% | 31 -12% | 29.8 -7% | 30.3 -9% | 32 -15% |
* ... smaller is better
Stress Test
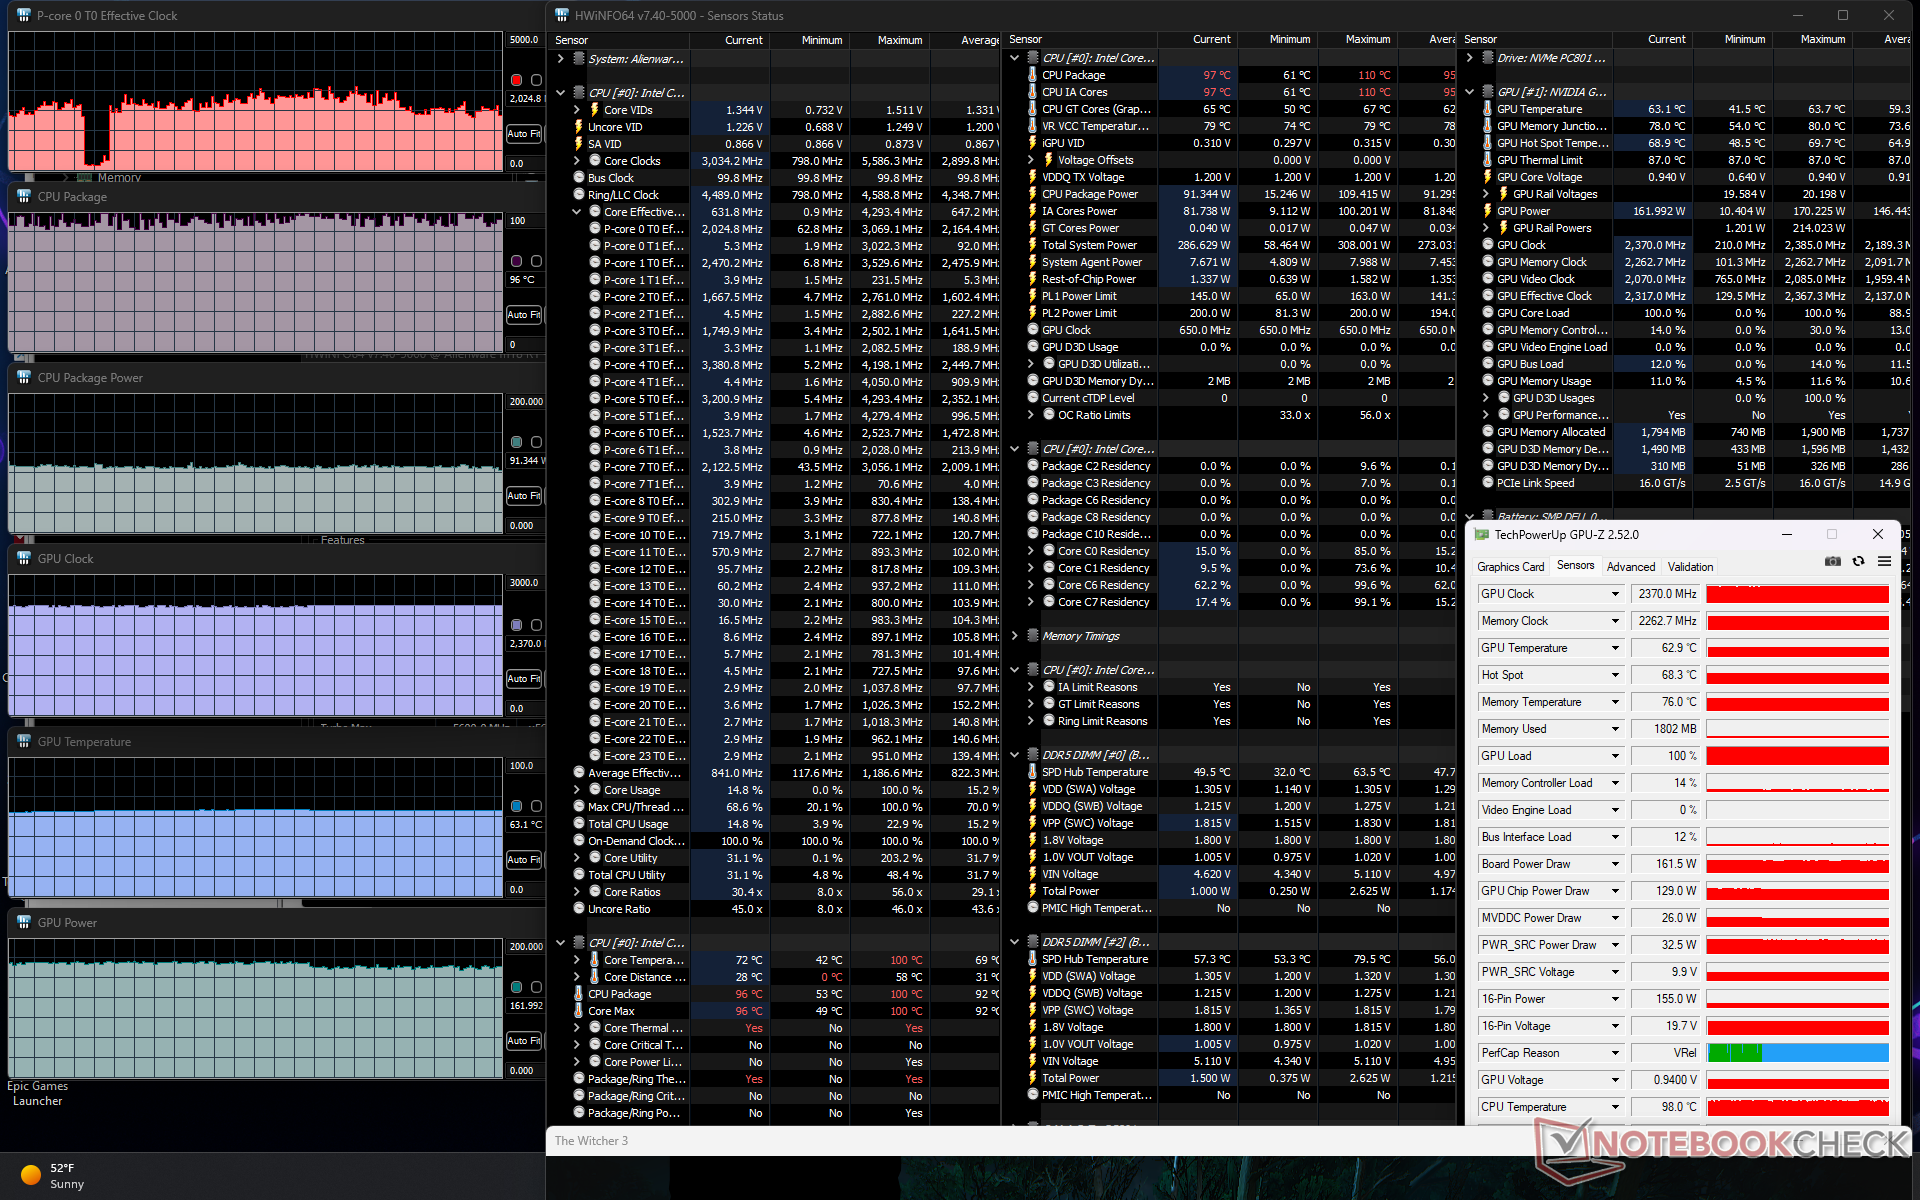
When running Prime95 to stress the CPU, clock rates and board power draw would spike to 4.5 GHz and 198 W, respectively, lasting for just a few seconds or until core temperature reaches 99 C. Thereafter, the CPU would drop to 4.2 GHz and 175 W for the next few minutes before finally stabilizing at 3.4 GHz, 143 W, and 99 C. Maximum Turbo Boost is therefore not sustainable no matter the power mode. CPU temperatures are also extreme even for a gaming laptop.
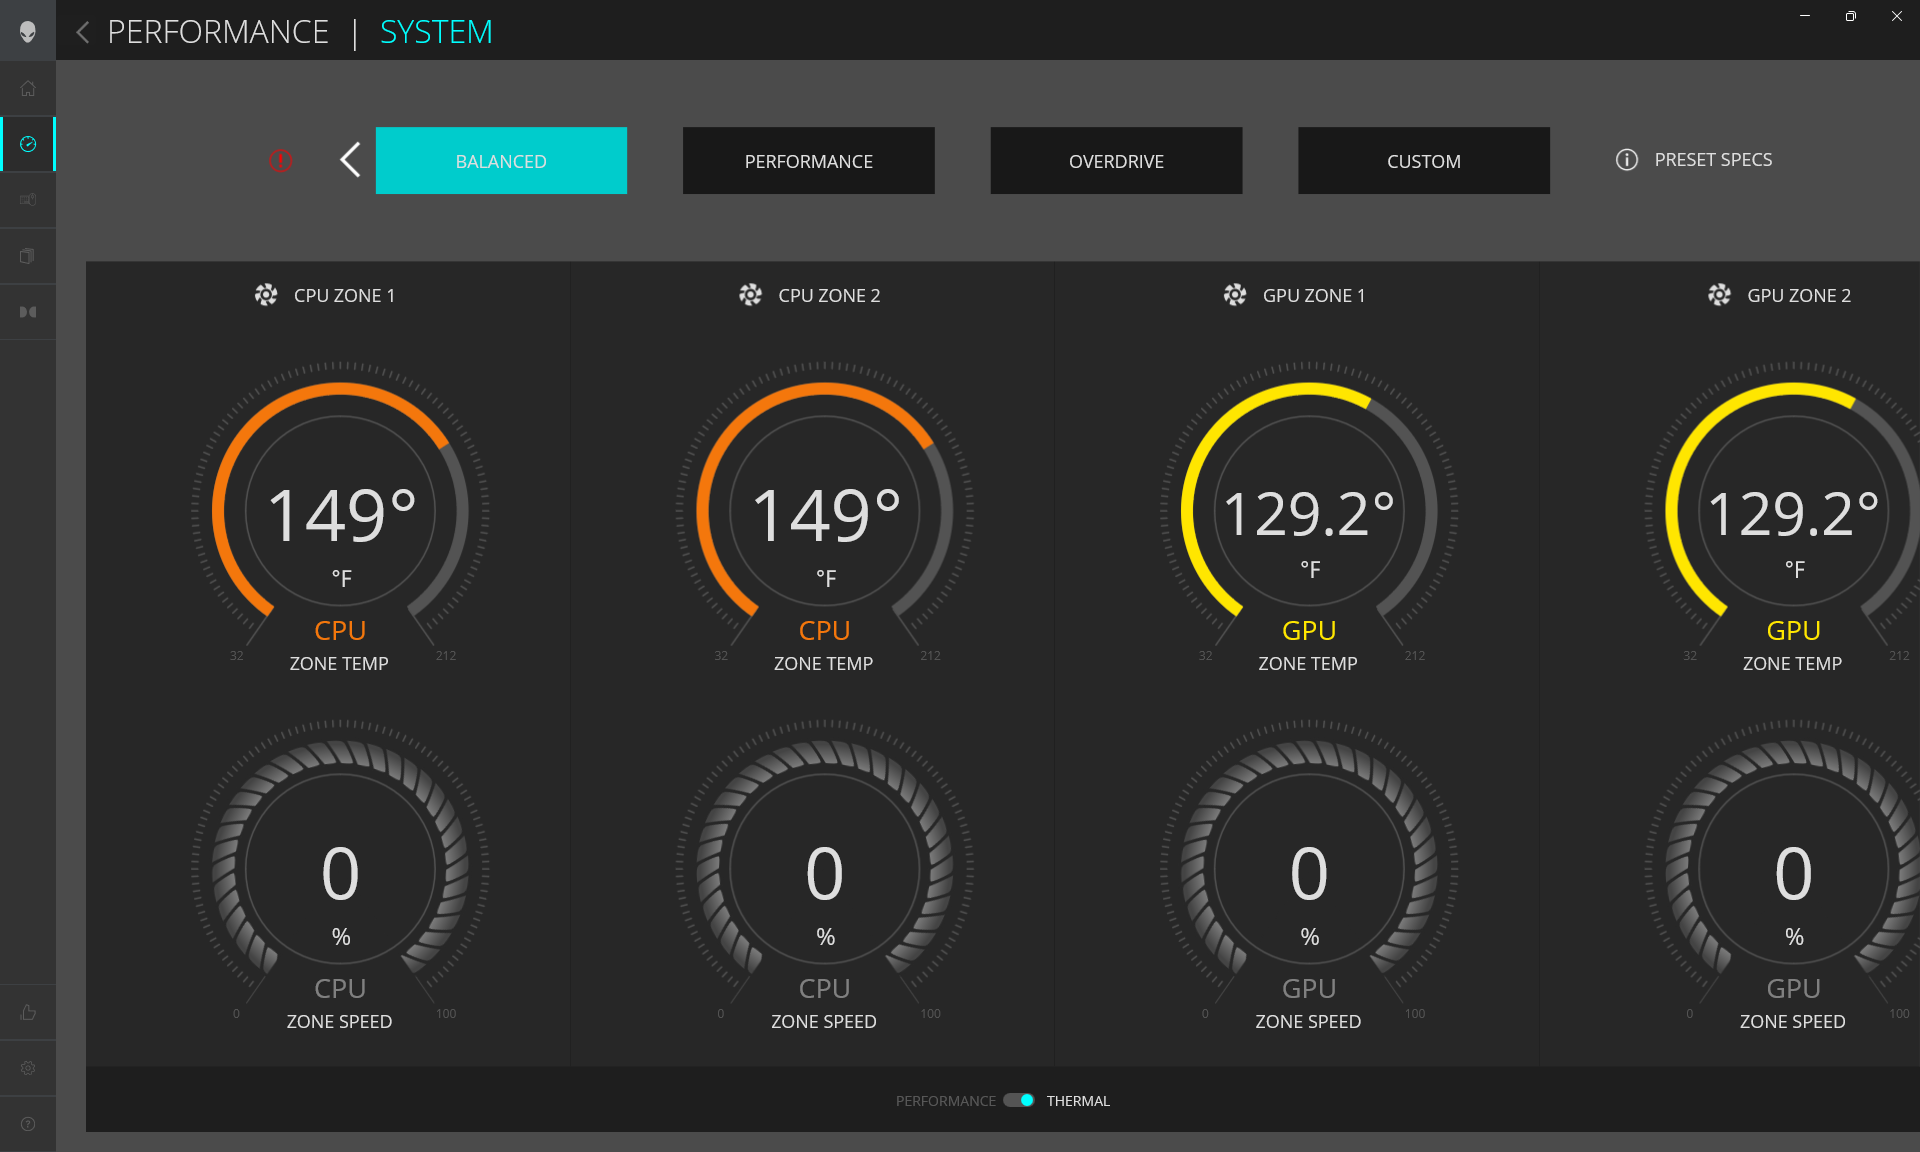
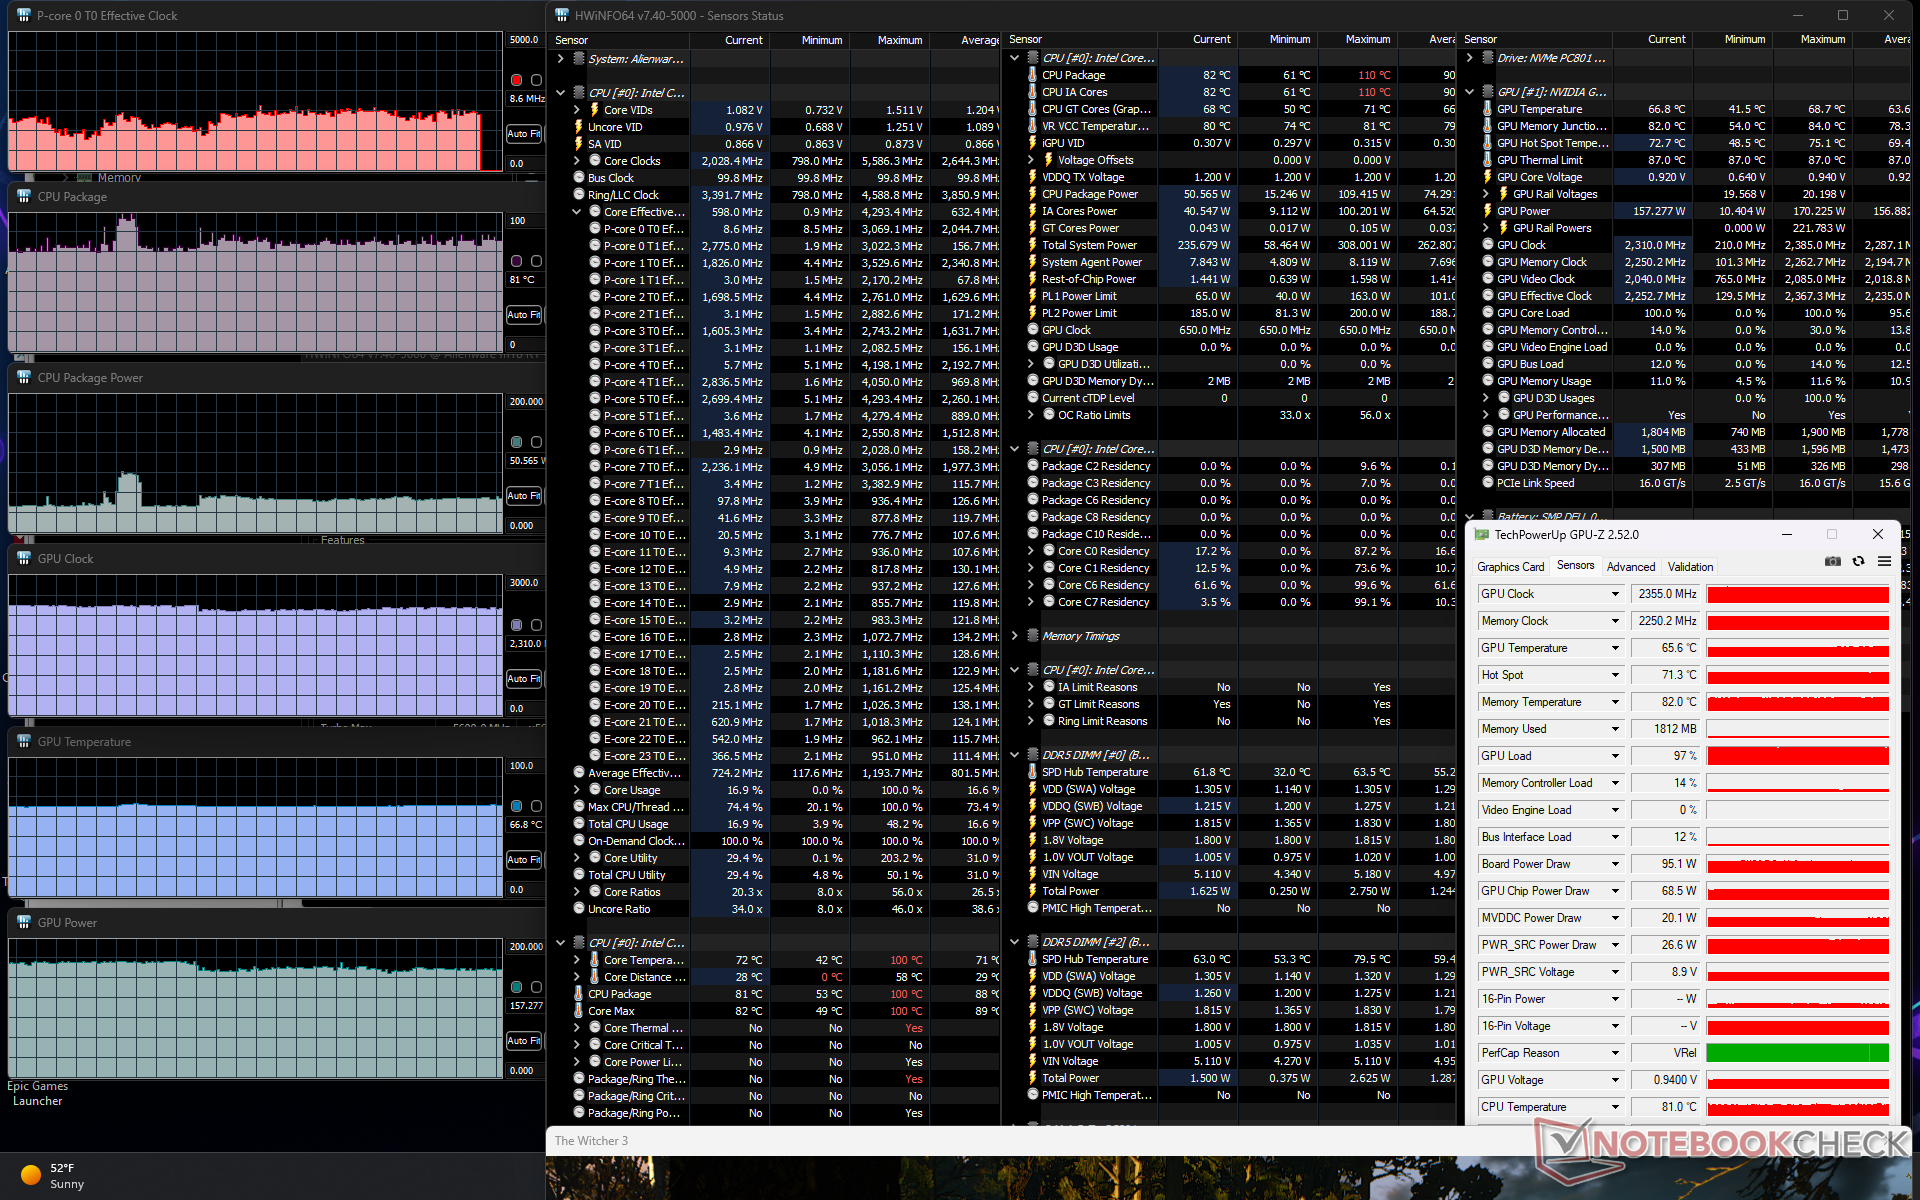
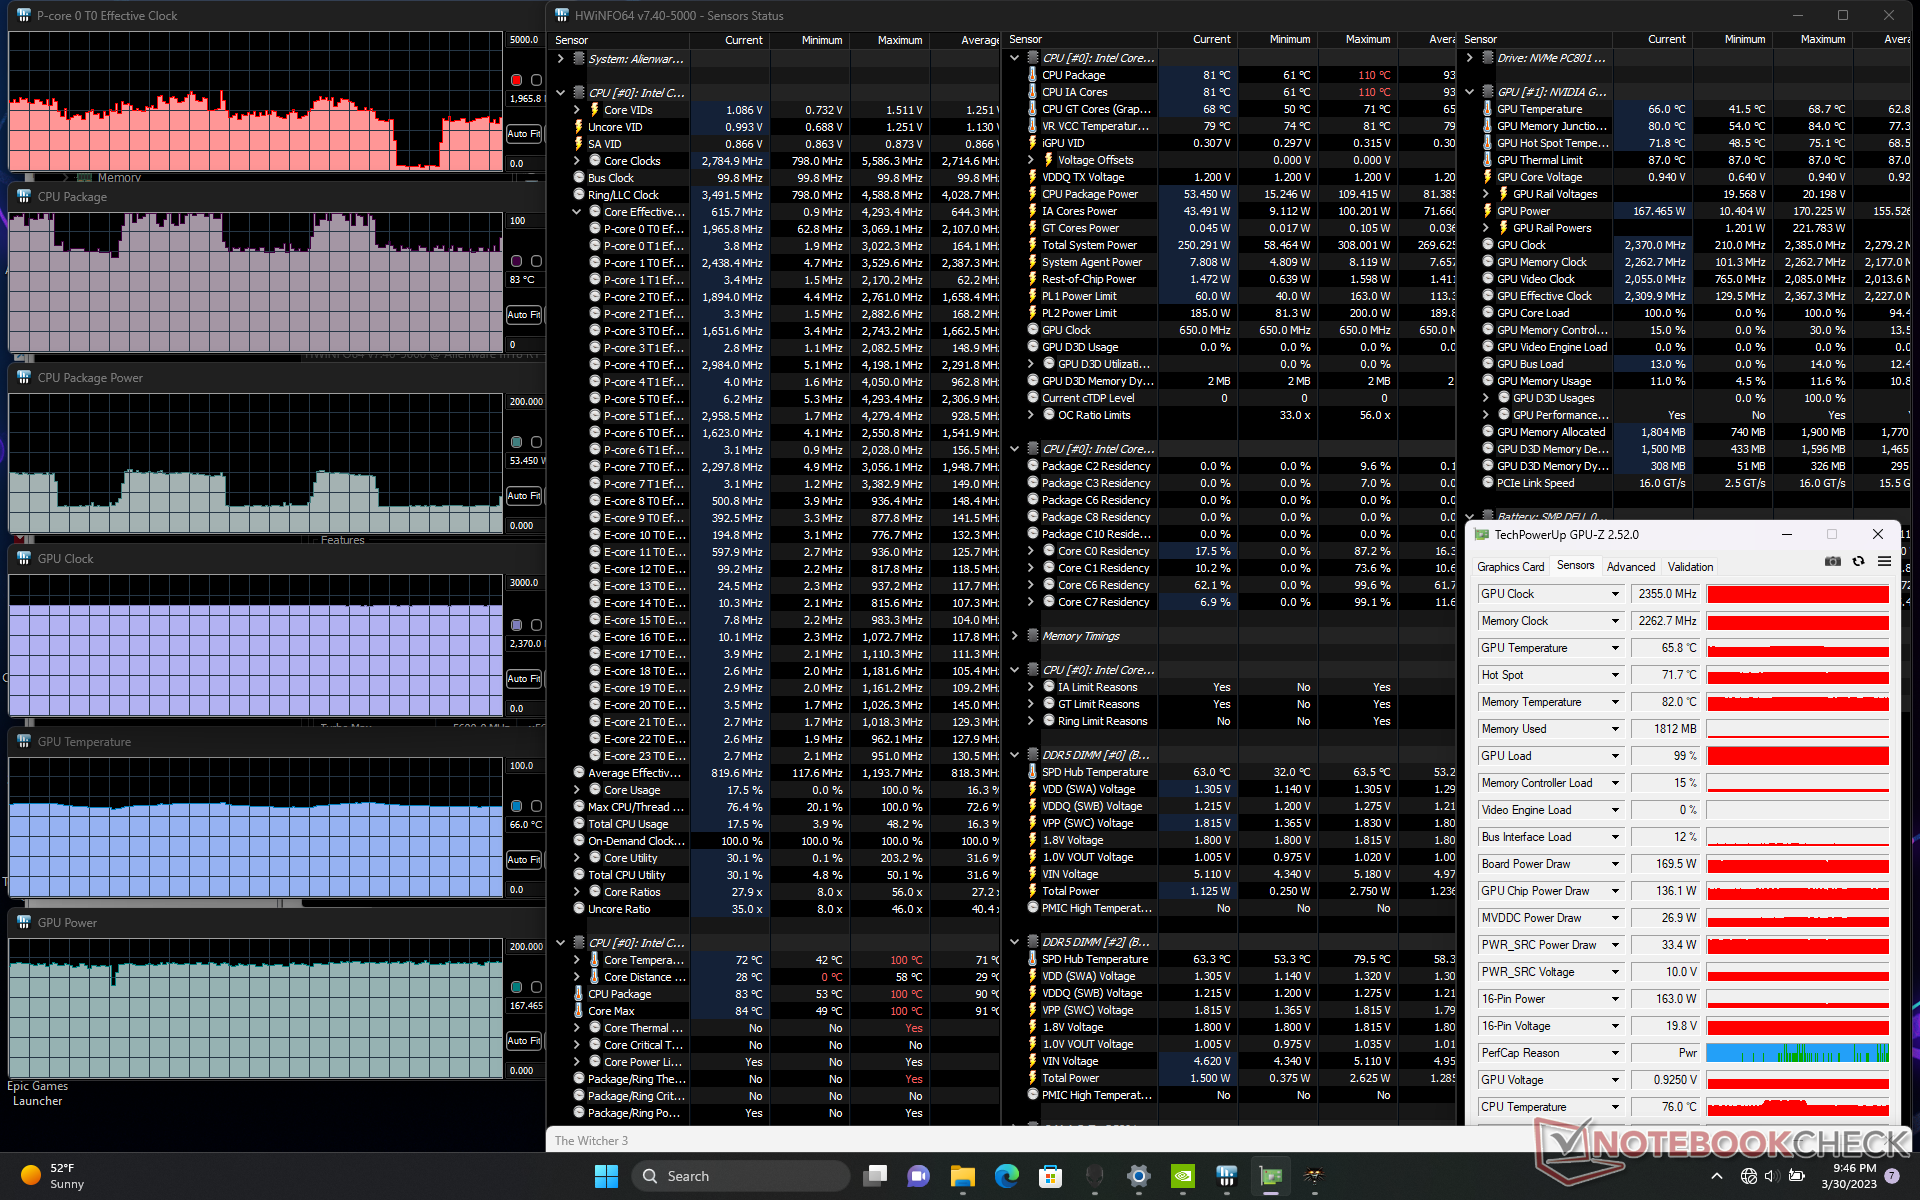
GPU clock rates, temperature, and board power draw would stabilize at 2370 MHz, 63 C, and 162 W, respectively, when running Witcher 3 on Overdrive mode. Note that GPU performance is not impacted when running on the quieter Performance mode which aligns with our Fire Strike observations from above. Instead, it's the CPU that takes a slight hit in performance. Since most games are GPU bound, we recommend gaming on Performance rather than the louder Overdrive mode if fan noise is a concern.
Running on battery power limits performance as expected. A Fire Strike test on batteries would return Physics and Graphics scores of 25319 and 18778 points, respectively, compared to 41644 and 46998 points when on mains.
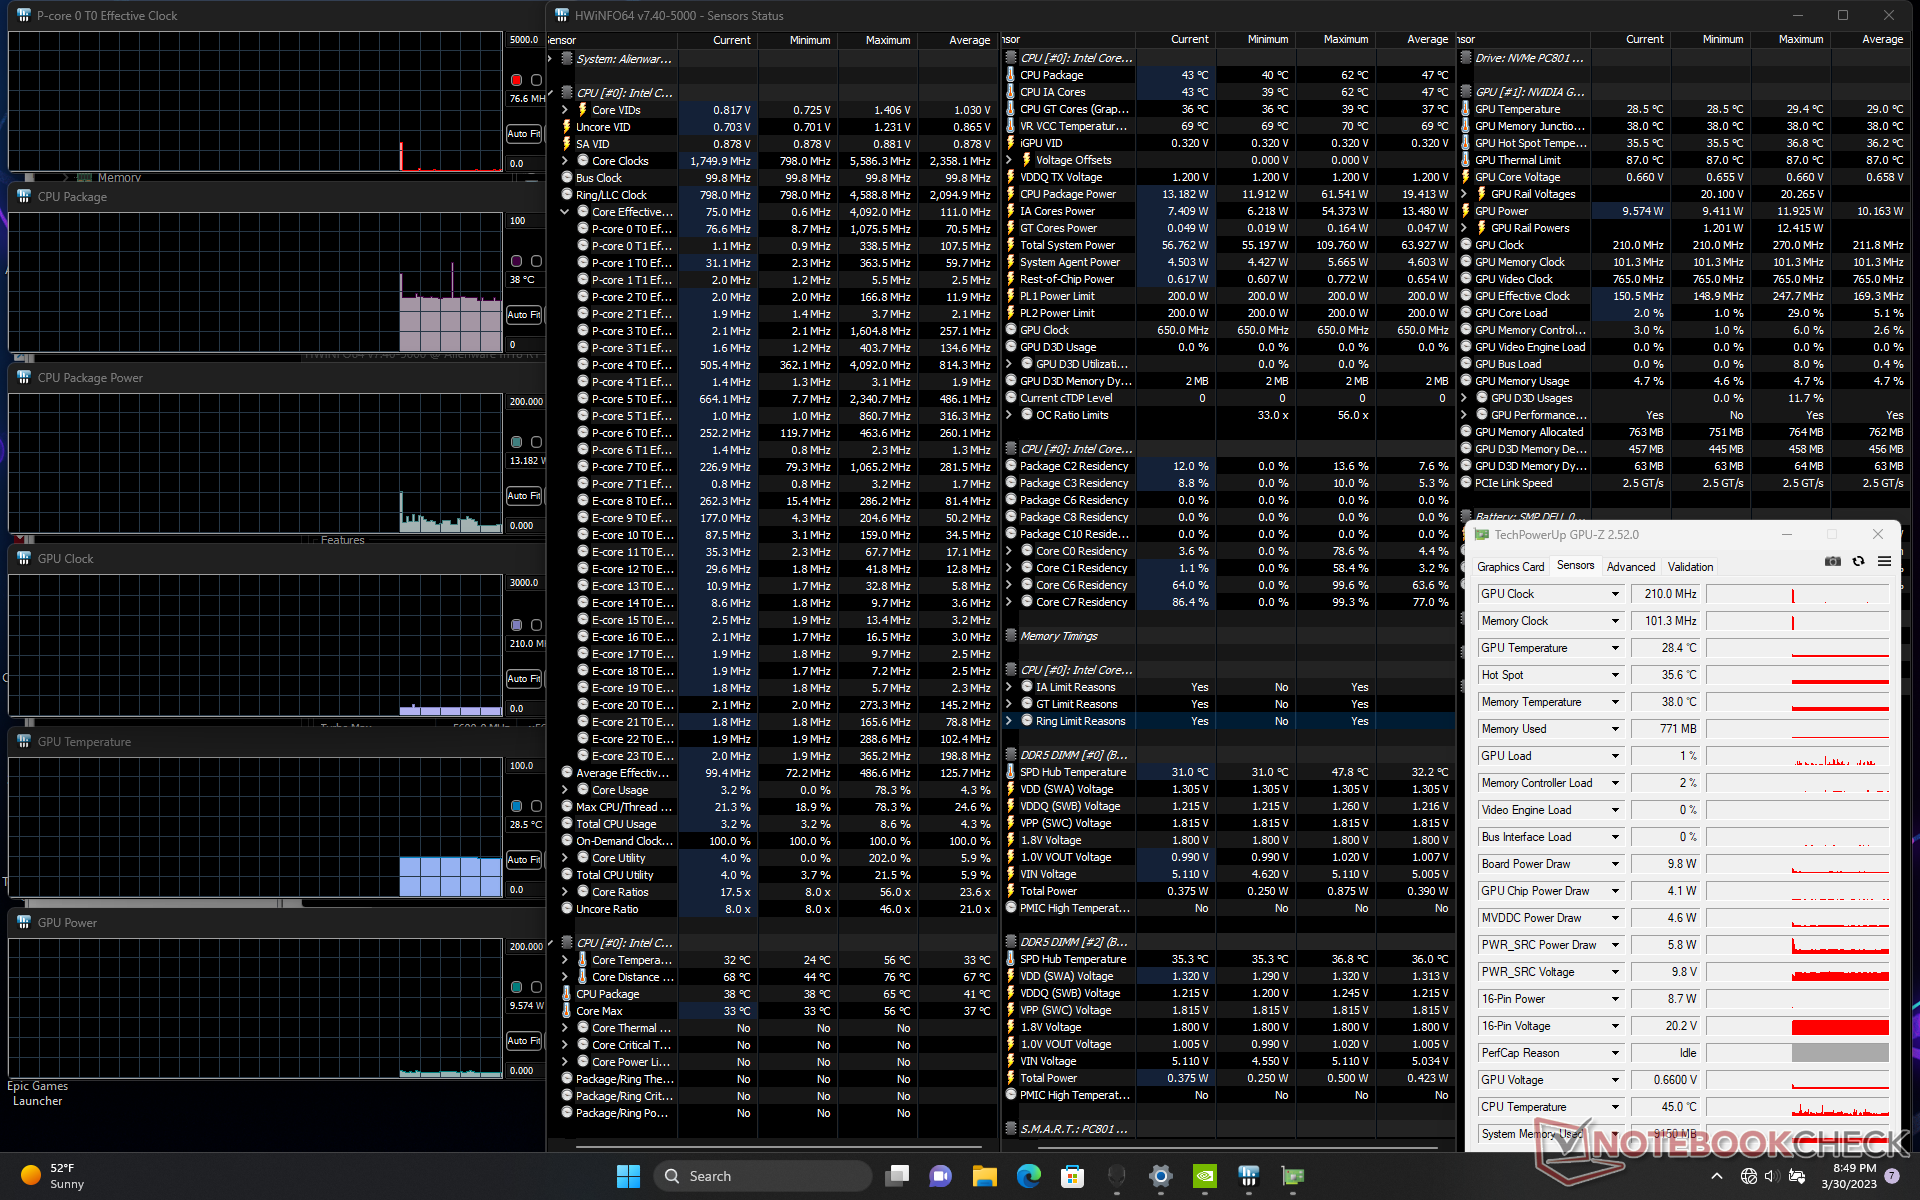
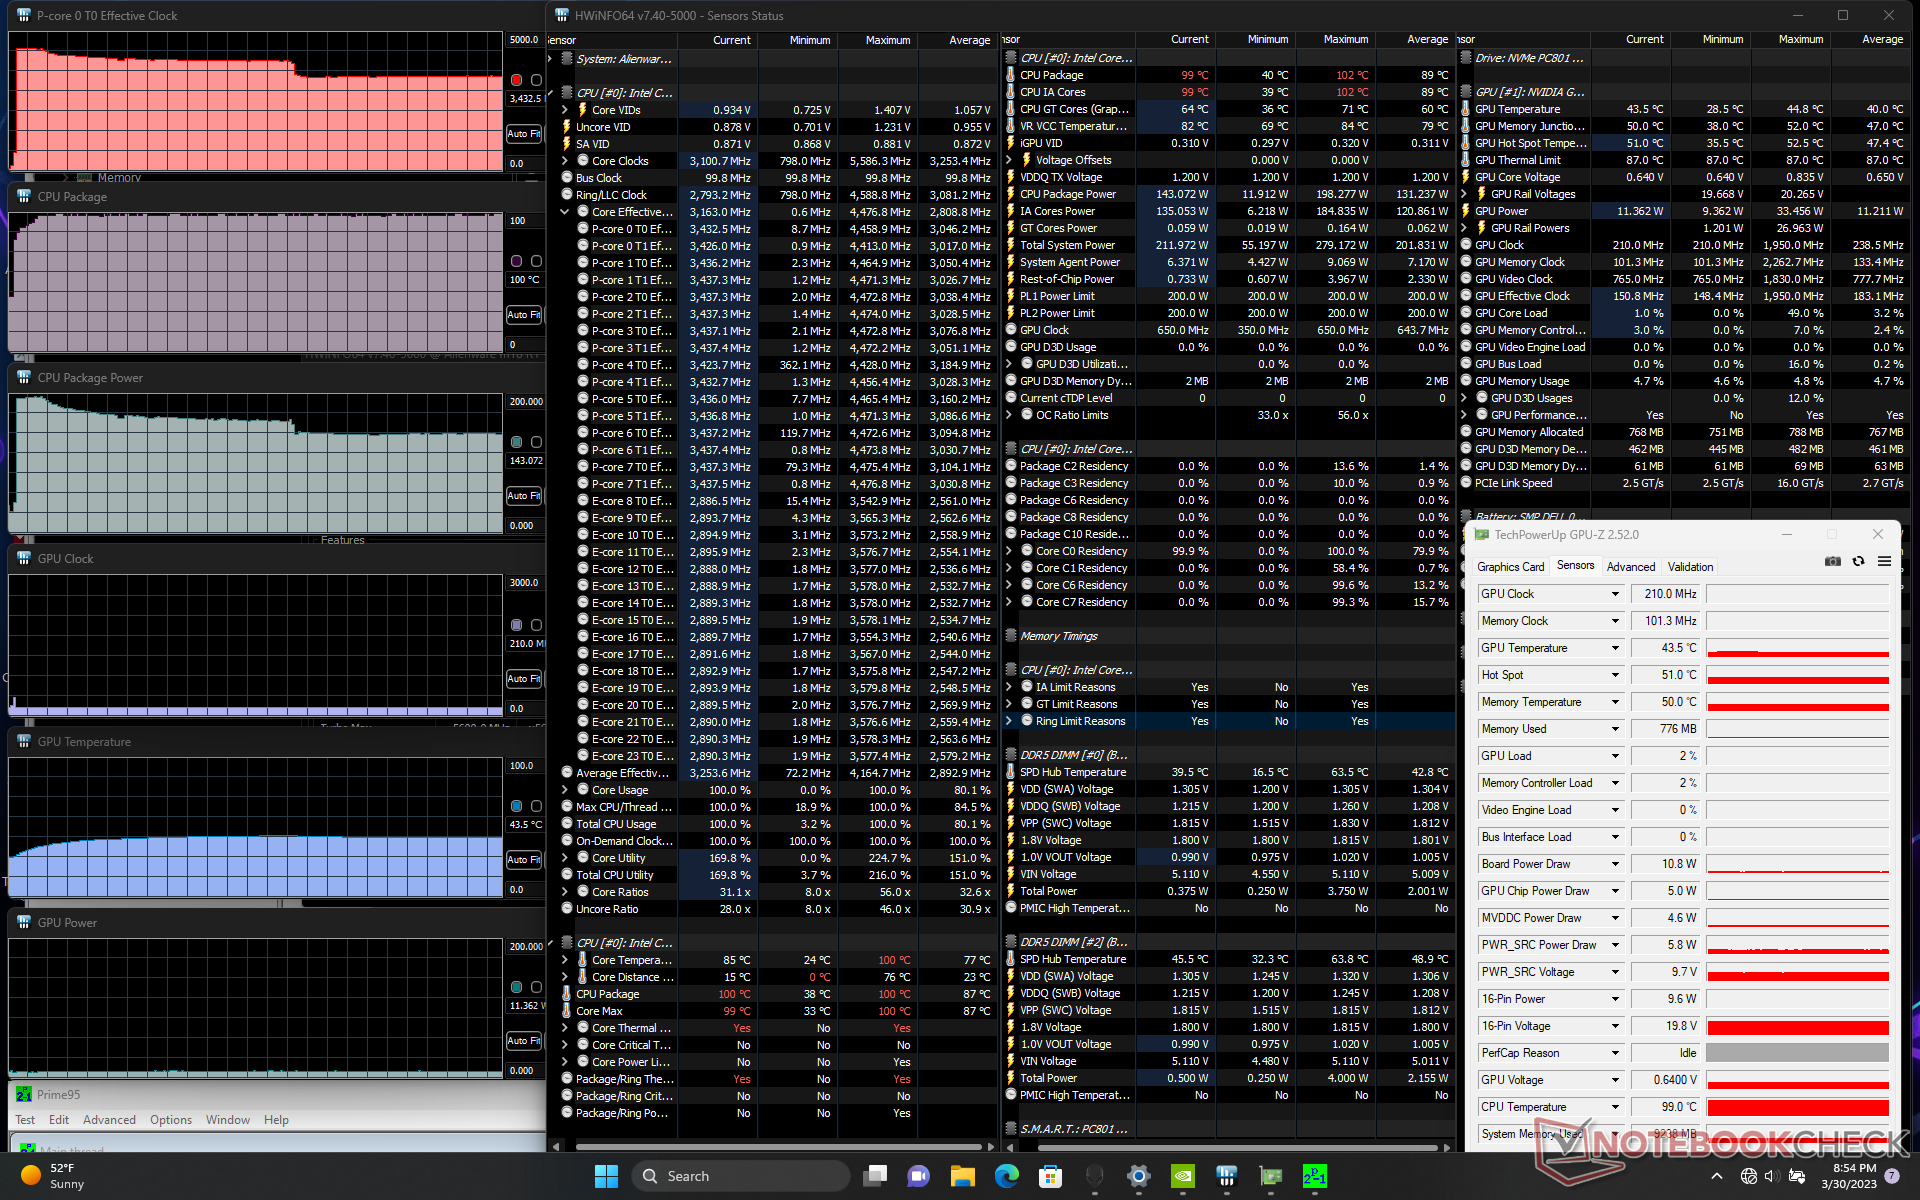
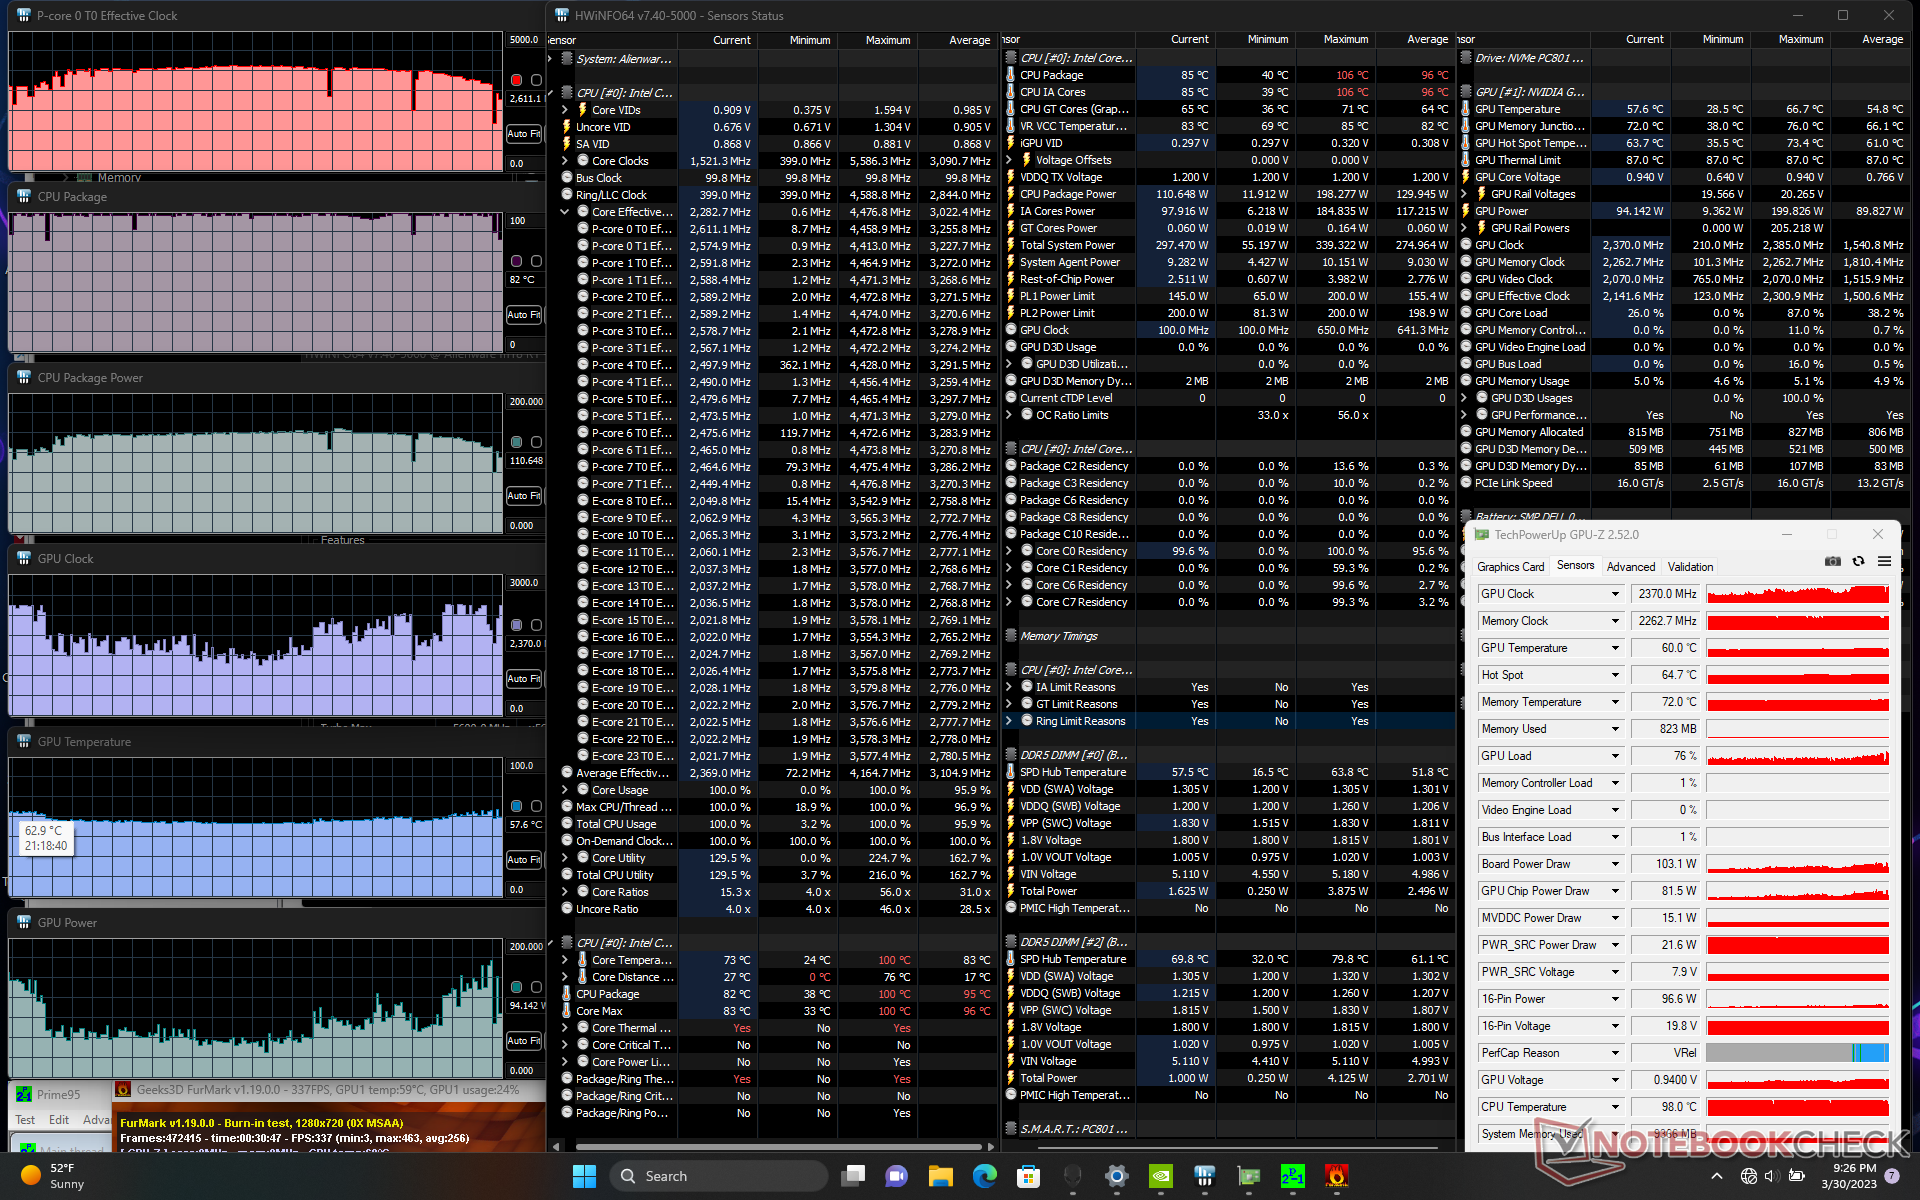
| CPU Clock (GHz) | GPU Clock (MHz) | Average CPU Temperature (°C) | Average GPU Temperature (°C) | |
| System Idle | -- | -- | 38 | 29 |
| Prime95 Stress | 3.4 | -- | 100 | 44 |
| Prime95 + FurMark Stress | 2.6+ | 1070 - 2370 | 82 - 100 | 57 |
| Witcher 3 Stress (Overdrive mode) | ~2.0+ | 2370 | 96 | 63 |
| Witcher 3 Stress (Performance mode) | ~1.8+ | 2370 | 81 | 66 |
| Witcher 3 Stress (Balanced mode) | ~1.8 | 2310 | 81 | 67 |
Speakers
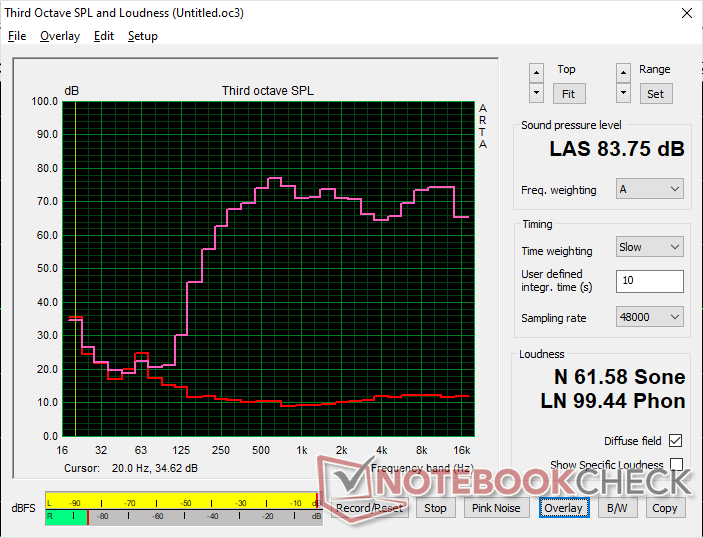
Alienware m18 R1 audio analysis
(+) | speakers can play relatively loud (83.8 dB)
Bass 100 - 315 Hz
(-) | nearly no bass - on average 22.4% lower than median
(±) | linearity of bass is average (13.4% delta to prev. frequency)
Mids 400 - 2000 Hz
(+) | balanced mids - only 3.2% away from median
(+) | mids are linear (4.4% delta to prev. frequency)
Highs 2 - 16 kHz
(+) | balanced highs - only 3.2% away from median
(+) | highs are linear (4% delta to prev. frequency)
Overall 100 - 16.000 Hz
(+) | overall sound is linear (14.6% difference to median)
Compared to same class
» 28% of all tested devices in this class were better, 7% similar, 65% worse
» The best had a delta of 6%, average was 18%, worst was 132%
Compared to all devices tested
» 19% of all tested devices were better, 4% similar, 77% worse
» The best had a delta of 4%, average was 24%, worst was 134%
Apple MacBook Pro 16 2021 M1 Pro audio analysis
(+) | speakers can play relatively loud (84.7 dB)
Bass 100 - 315 Hz
(+) | good bass - only 3.8% away from median
(+) | bass is linear (5.2% delta to prev. frequency)
Mids 400 - 2000 Hz
(+) | balanced mids - only 1.3% away from median
(+) | mids are linear (2.1% delta to prev. frequency)
Highs 2 - 16 kHz
(+) | balanced highs - only 1.9% away from median
(+) | highs are linear (2.7% delta to prev. frequency)
Overall 100 - 16.000 Hz
(+) | overall sound is linear (4.6% difference to median)
Compared to same class
» 0% of all tested devices in this class were better, 0% similar, 100% worse
» The best had a delta of 5%, average was 17%, worst was 45%
Compared to all devices tested
» 0% of all tested devices were better, 0% similar, 100% worse
» The best had a delta of 4%, average was 24%, worst was 134%
Energy Management — Over 300 W When Gaming
Power Consumption
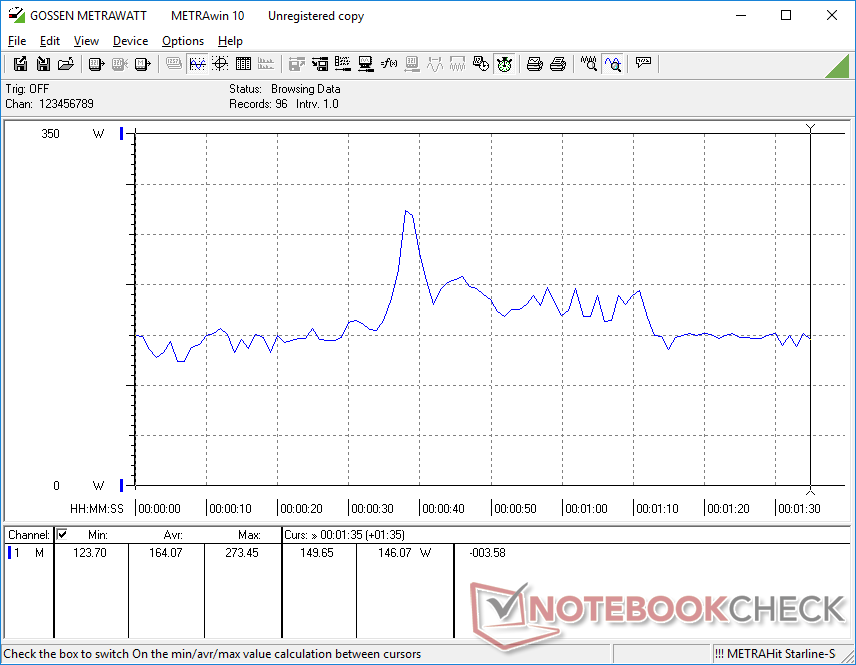
The system is unsurprisingly very demanding even when not running any applications. We're able to record a bare minimum of 21 W when idling on Power Saver mode, Optimus mode, and the lowest brightness setting. Idling on Performance or Turbo mode would increase idling consumption by over 2x and so it's highly recommended to avoid the higher profile settings if the extra horsepower isn't needed.
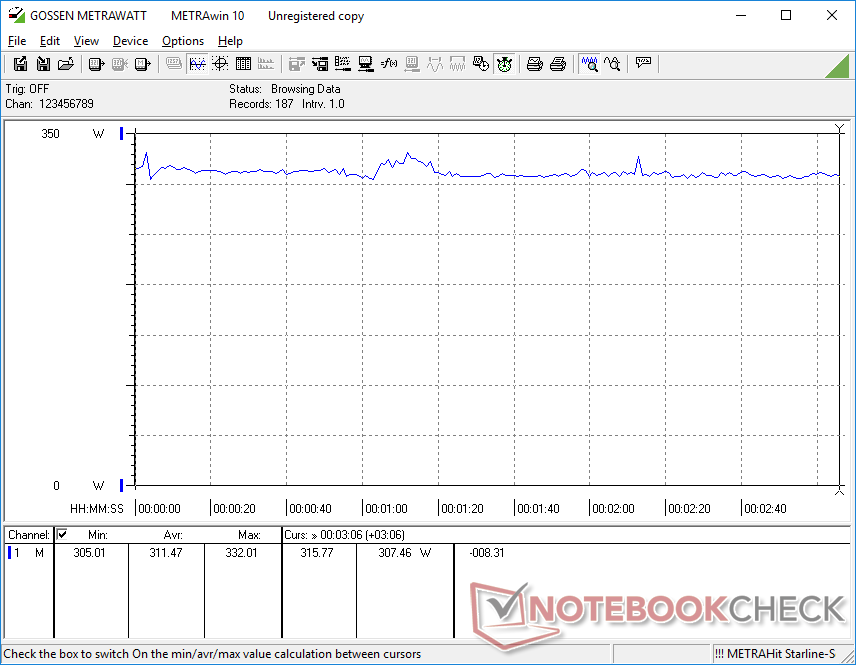
Running Witcher 3 to represent typical gaming loads would draw 311 W or over 50 W more than on last year's RTX 3080 Ti-powered Alienware x17 R2. Thus, while performance is faster gen over gen, users will still have to pay for it through higher power bills because of the more demanding CPU.
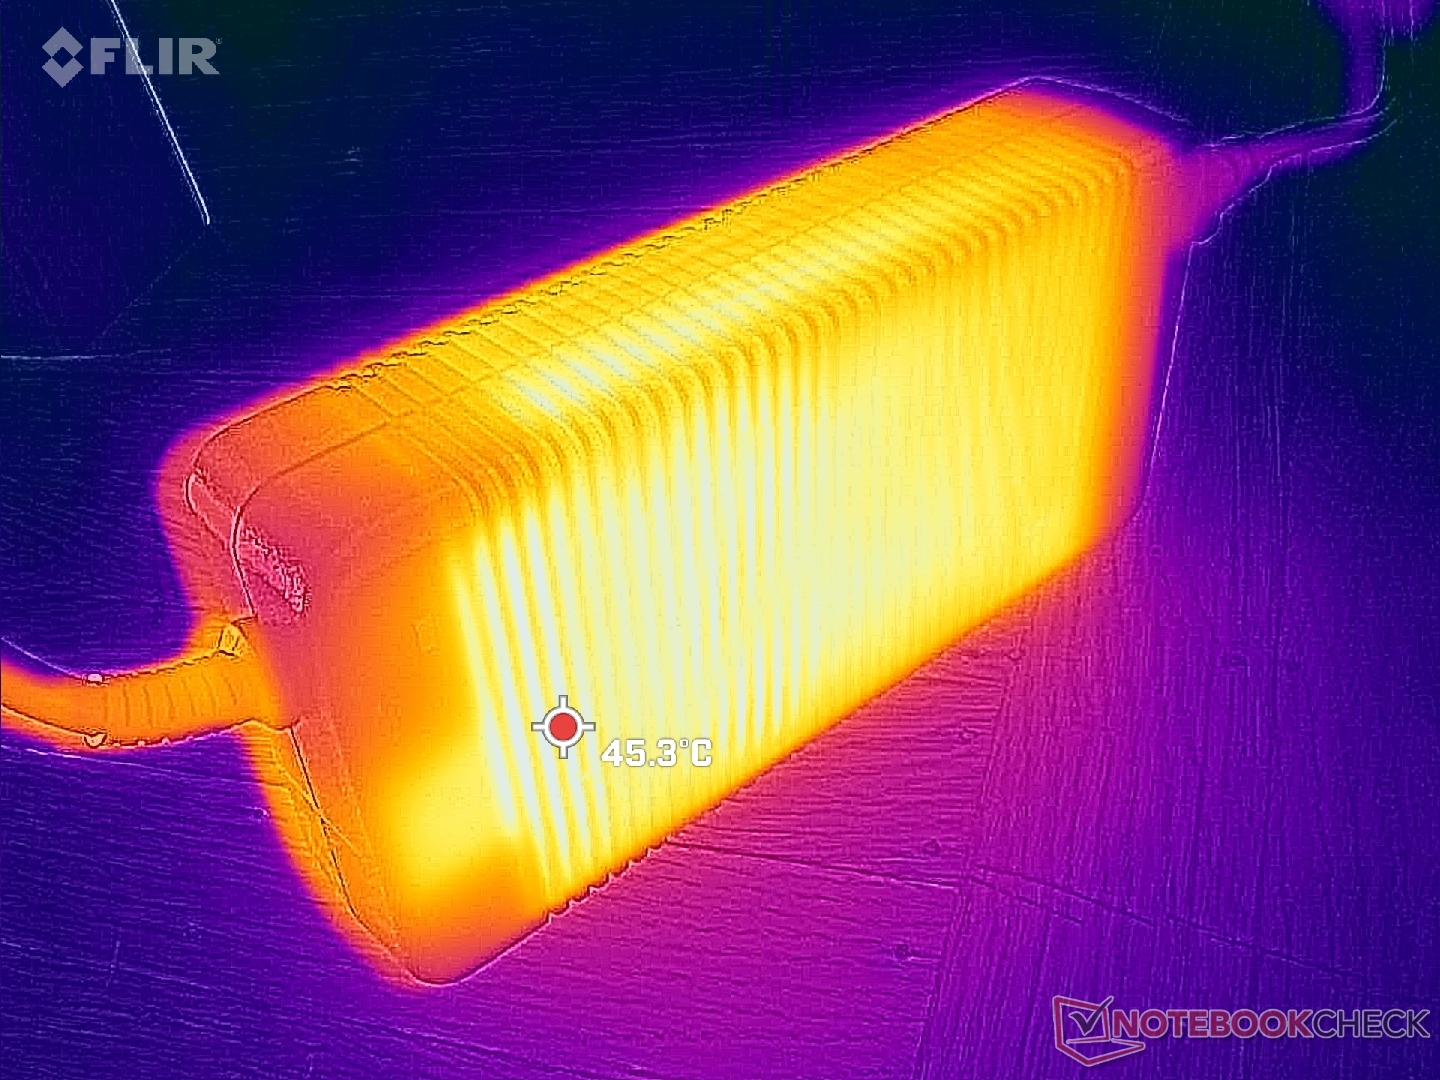
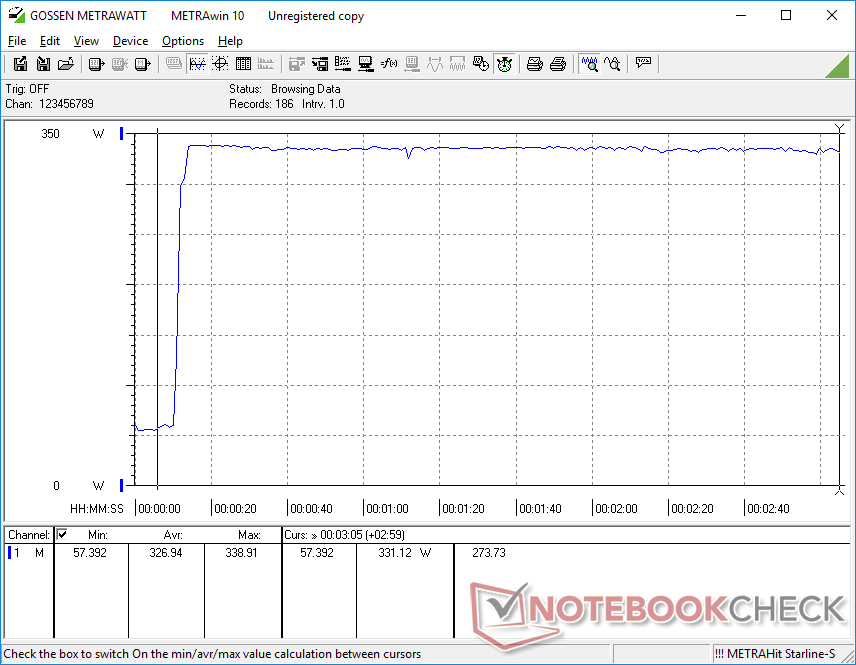
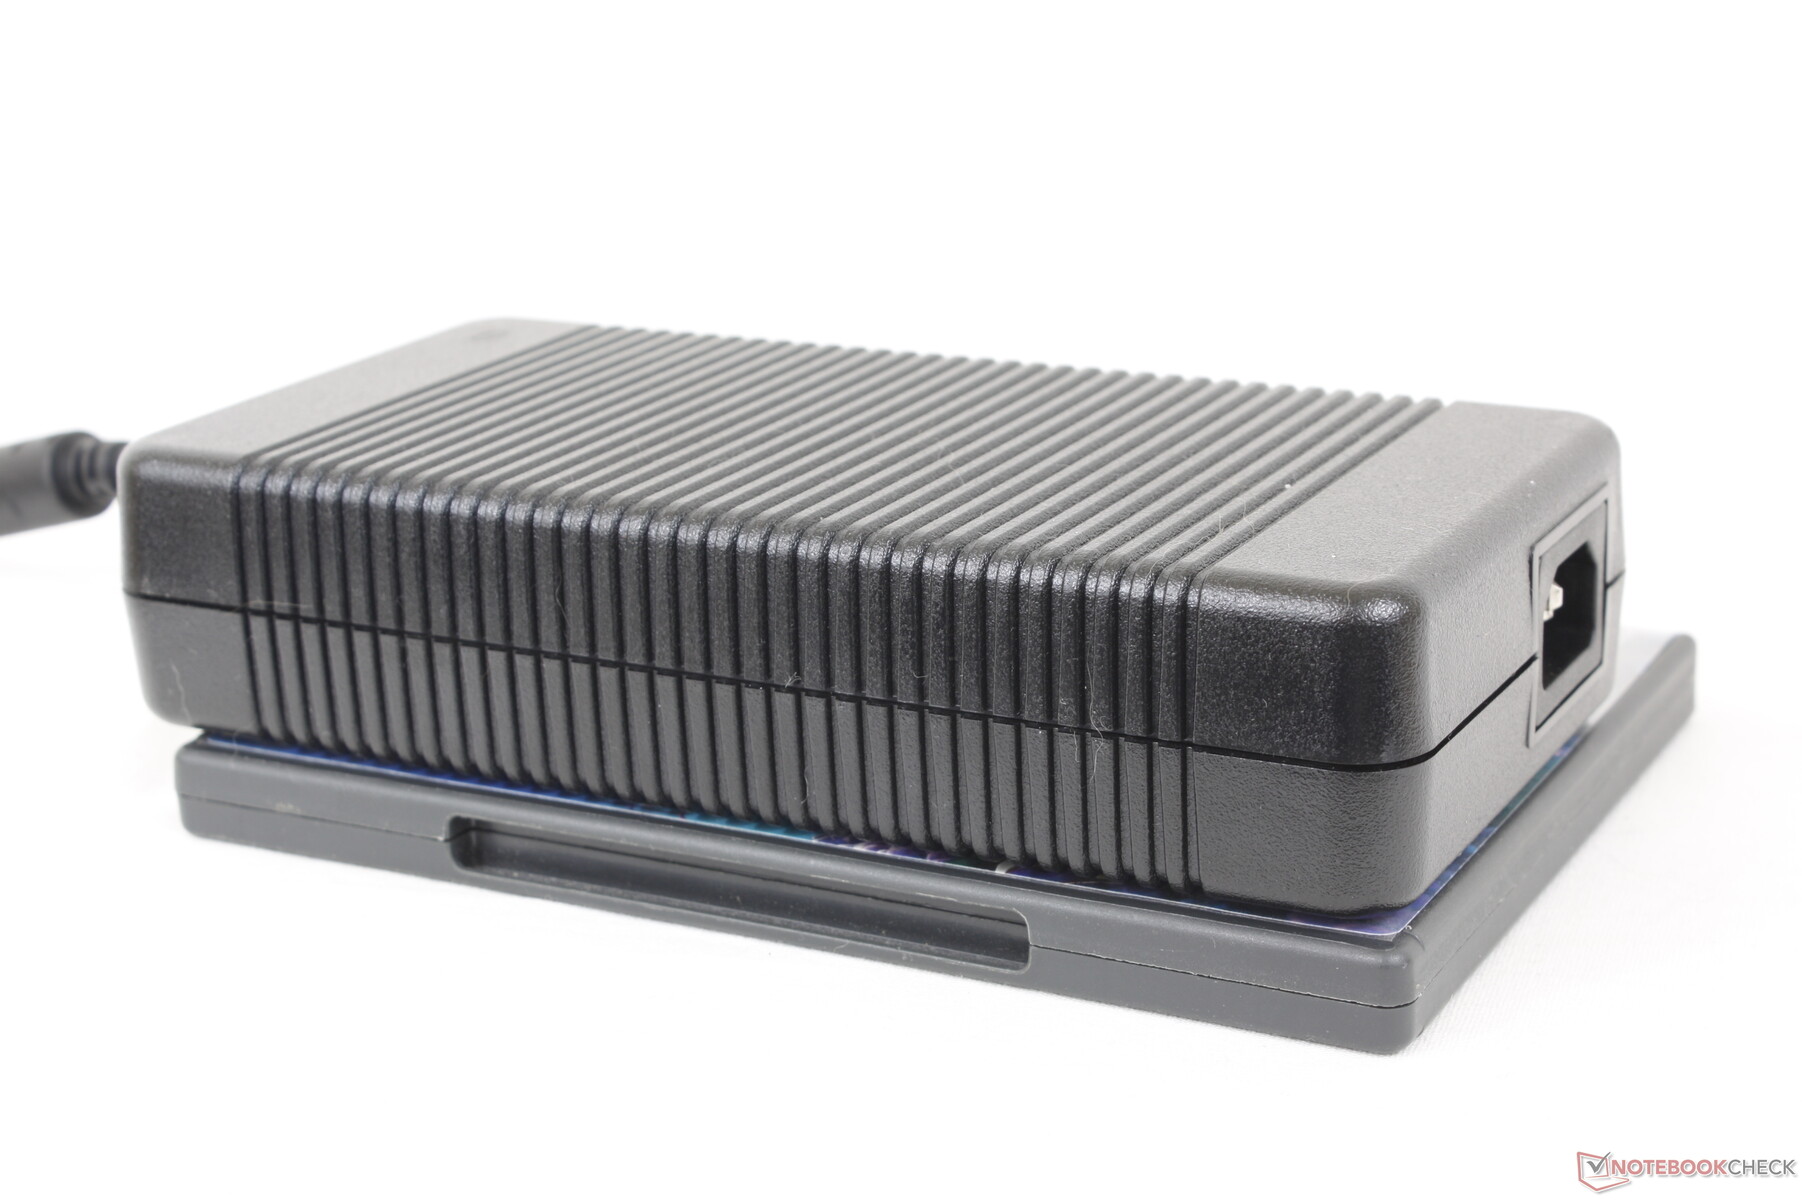
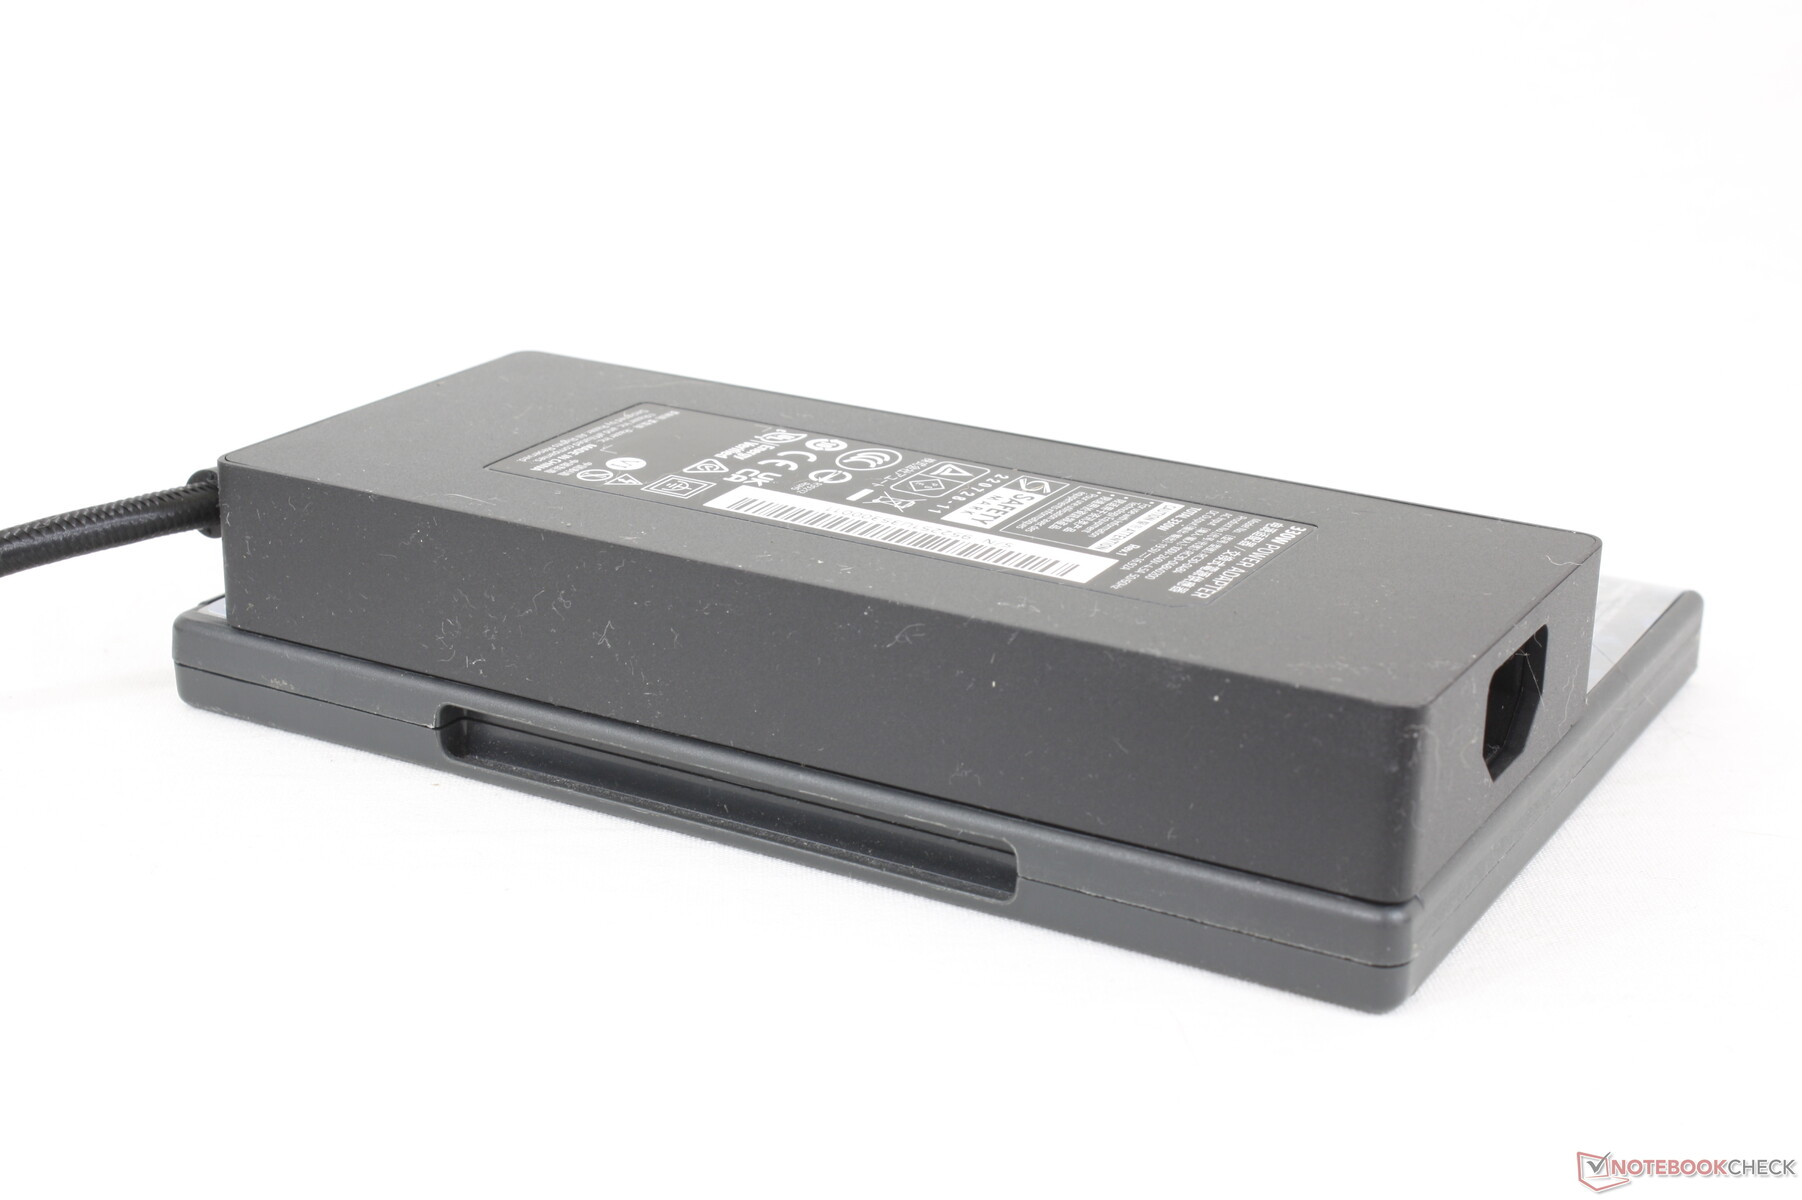
We're able to record a maximum draw of 339 W when both the CPU and GPU are at 100 percent utilization. The bulky AC adapter (~19.5 x 9.8 x 4 cm) is rated for 330 W and so our fully configured unit is making the most of the power available. Keep in mind that the charge rate of the laptop battery slows when gaming. In fact, we can observe our battery falling from 100 percent to 91 percent when running extremely demanding loads like Prime95 and FurMark simultaneously.

| Off / Standby | |
| Idle | |
| Load |
|
Key:
min: | |
| Alienware m18 R1 i9-13980HX, GeForce RTX 4090 Laptop GPU, SK hynix PC801 HFS001TEJ9X101N, IPS, 1920x1200, 18" | Razer Blade 18 RTX 4070 i9-13950HX, GeForce RTX 4070 Laptop GPU, SSSTC CA6-8D1024, IPS, 2560x1600, 18" | Asus ROG Strix Scar 18 2023 G834JY-N6005W i9-13980HX, GeForce RTX 4090 Laptop GPU, 2x Samsung PM9A1 MZVL21T0HCLR (RAID 0), IPS, 2560x1600, 18" | MSI GE78HX 13VH-070US i9-13950HX, GeForce RTX 4080 Laptop GPU, Samsung PM9A1 MZVL22T0HBLB, IPS, 2560x1600, 17" | Eluktronics Mech-17 GP2 i9-13900HX, GeForce RTX 4090 Laptop GPU, Samsung PM9A1 MZVL21T0HCLR, IPS, 2560x1600, 17" | MSI Titan GT77 HX 13VI i9-13950HX, GeForce RTX 4090 Laptop GPU, Samsung PM9A1 MZVL22T0HBLB, Mini-LED, 3840x2160, 17.3" | |
|---|---|---|---|---|---|---|
| Power Consumption | 7% | 11% | 20% | 21% | 20% | |
| Idle Minimum * (Watt) | 21.6 | 24.5 -13% | 17.3 20% | 16.1 25% | 14 35% | 14 35% |
| Idle Average * (Watt) | 25.2 | 34.1 -35% | 27 -7% | 24 5% | 19.3 23% | 21.6 14% |
| Idle Maximum * (Watt) | 56.7 | 47.7 16% | 46 19% | 34 40% | 36.8 35% | 24.8 56% |
| Load Average * (Watt) | 164.1 | 140 15% | 133 19% | 123.6 25% | 117.2 29% | 122.5 25% |
| Witcher 3 ultra * (Watt) | 311 | 202 35% | 286 8% | 304 2% | 265 15% | |
| Load Maximum * (Watt) | 338.9 | 261 23% | 329 3% | 285.7 16% | 342.5 -1% | 418 -23% |
* ... smaller is better
Power Consumption Witcher 3 / Stresstest
Power Consumption external Monitor
Battery Life — Not Terrible For The Size
Battery life has never been a strong point for the Alienware series. Last year's Alienware x17 R2, for example, would only last for a couple of hours even when just browsing the web. The Alienware m18 includes a higher capacity battery (97 Wh vs. 87 Wh) with better power management for noticeably longer browsing runtimes of around 4 hours. It's certainly not as long as a typical Ultrabook, but it's not bad for a such large gaming laptop.
Charging from empty to full takes around 2 hours with the included barrel AC adapter. USB-C chargers are not supported which is a shame because it means you're tethered to the ginormous 330 W AC adapter wherever you go.
| Alienware m18 R1 i9-13980HX, GeForce RTX 4090 Laptop GPU, 97 Wh | Razer Blade 18 RTX 4070 i9-13950HX, GeForce RTX 4070 Laptop GPU, 91.7 Wh | Asus ROG Strix Scar 18 2023 G834JY-N6005W i9-13980HX, GeForce RTX 4090 Laptop GPU, 90 Wh | Eluktronics Mech-17 GP2 i9-13900HX, GeForce RTX 4090 Laptop GPU, 99 Wh | MSI Titan GT77 HX 13VI i9-13950HX, GeForce RTX 4090 Laptop GPU, 99.9 Wh | Alienware x17 R2 P48E i9-12900HK, GeForce RTX 3080 Ti Laptop GPU, 87 Wh | |
|---|---|---|---|---|---|---|
| Battery runtime | 35% | 47% | 19% | 62% | -23% | |
| Reader / Idle (h) | 5.6 | 7 25% | 3.9 -30% | |||
| WiFi v1.3 (h) | 4.3 | 4 -7% | 7.1 65% | 5.1 19% | 5.3 23% | 2 -53% |
| Load (h) | 0.7 | 1.3 86% | 0.9 29% | 1.4 100% | 0.8 14% | |
| H.264 (h) | 7 | 6 | ||||
| Witcher 3 ultra (h) | 0.9 |
Pros
Cons
Verdict — Nine Pounds Of Pure Power
Alienware laptops have always had that "performance at all cost" mentality and the Alienware m18 R1 is no exception. This machine is not afraid to be one of the largest, heaviest, or even loudest laptops in the market if it means it can squeeze just a bit more performance out of the CPU and GPU or incorporate more features that zealous gamers might appreciate. Users who intend to exploit the 4x M.2 SSDs, vast port options, integrated numpad, and fast 480 Hz refresh rate and don't mind the bulky weight or ginormous AC adapter will have a lot more to enjoy about the Alienware m18 R1.
If you want to maximize performance and features even if it means a much heavier and larger laptop, then the Alienware m18 R1 is for you.
If the above auxiliary features don't excite you, then you can get nearly the same core performance from the noticeably lighter Razer Blade 18 or Asus ROG Strix 18. We would also like to see improvements to the new Alienware Command Center software as it loads unusually slowly at times.
Price and Availability
The Alienware m18 R1 is now shipping directly from Dell starting at $2100 USD for the Core i7/RTX 4060 configuration up to over $5000 USD if fully configured. Our unit as reviewed retails for about $3700 USD. The model is not yet widely available at other major retailers at the time of writing.
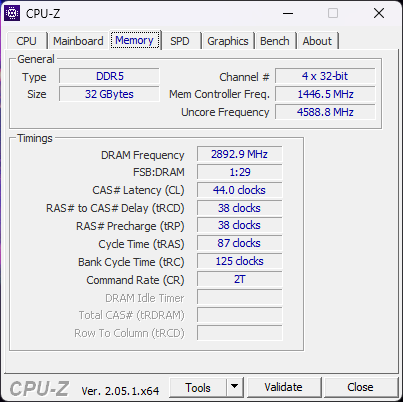
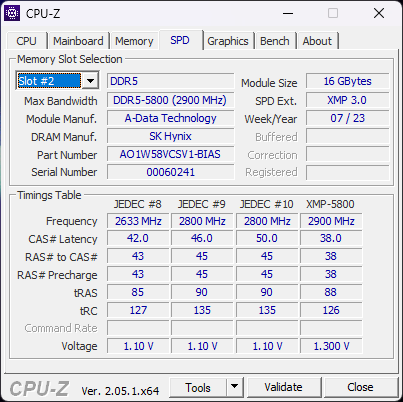
Additionally, SKUs with XMP 5800 MHz DDR5 RAM like the one we reviewed will be made available at a future date. The first orderable configurations will max out at 4800MHz DDR5 RAM only.
Alienware m18 R1
- 04/01/2023 v7 (old)
Allen Ngo
