Intel Core i9-13900HK performance debut: Alienware x16 R1 laptop review

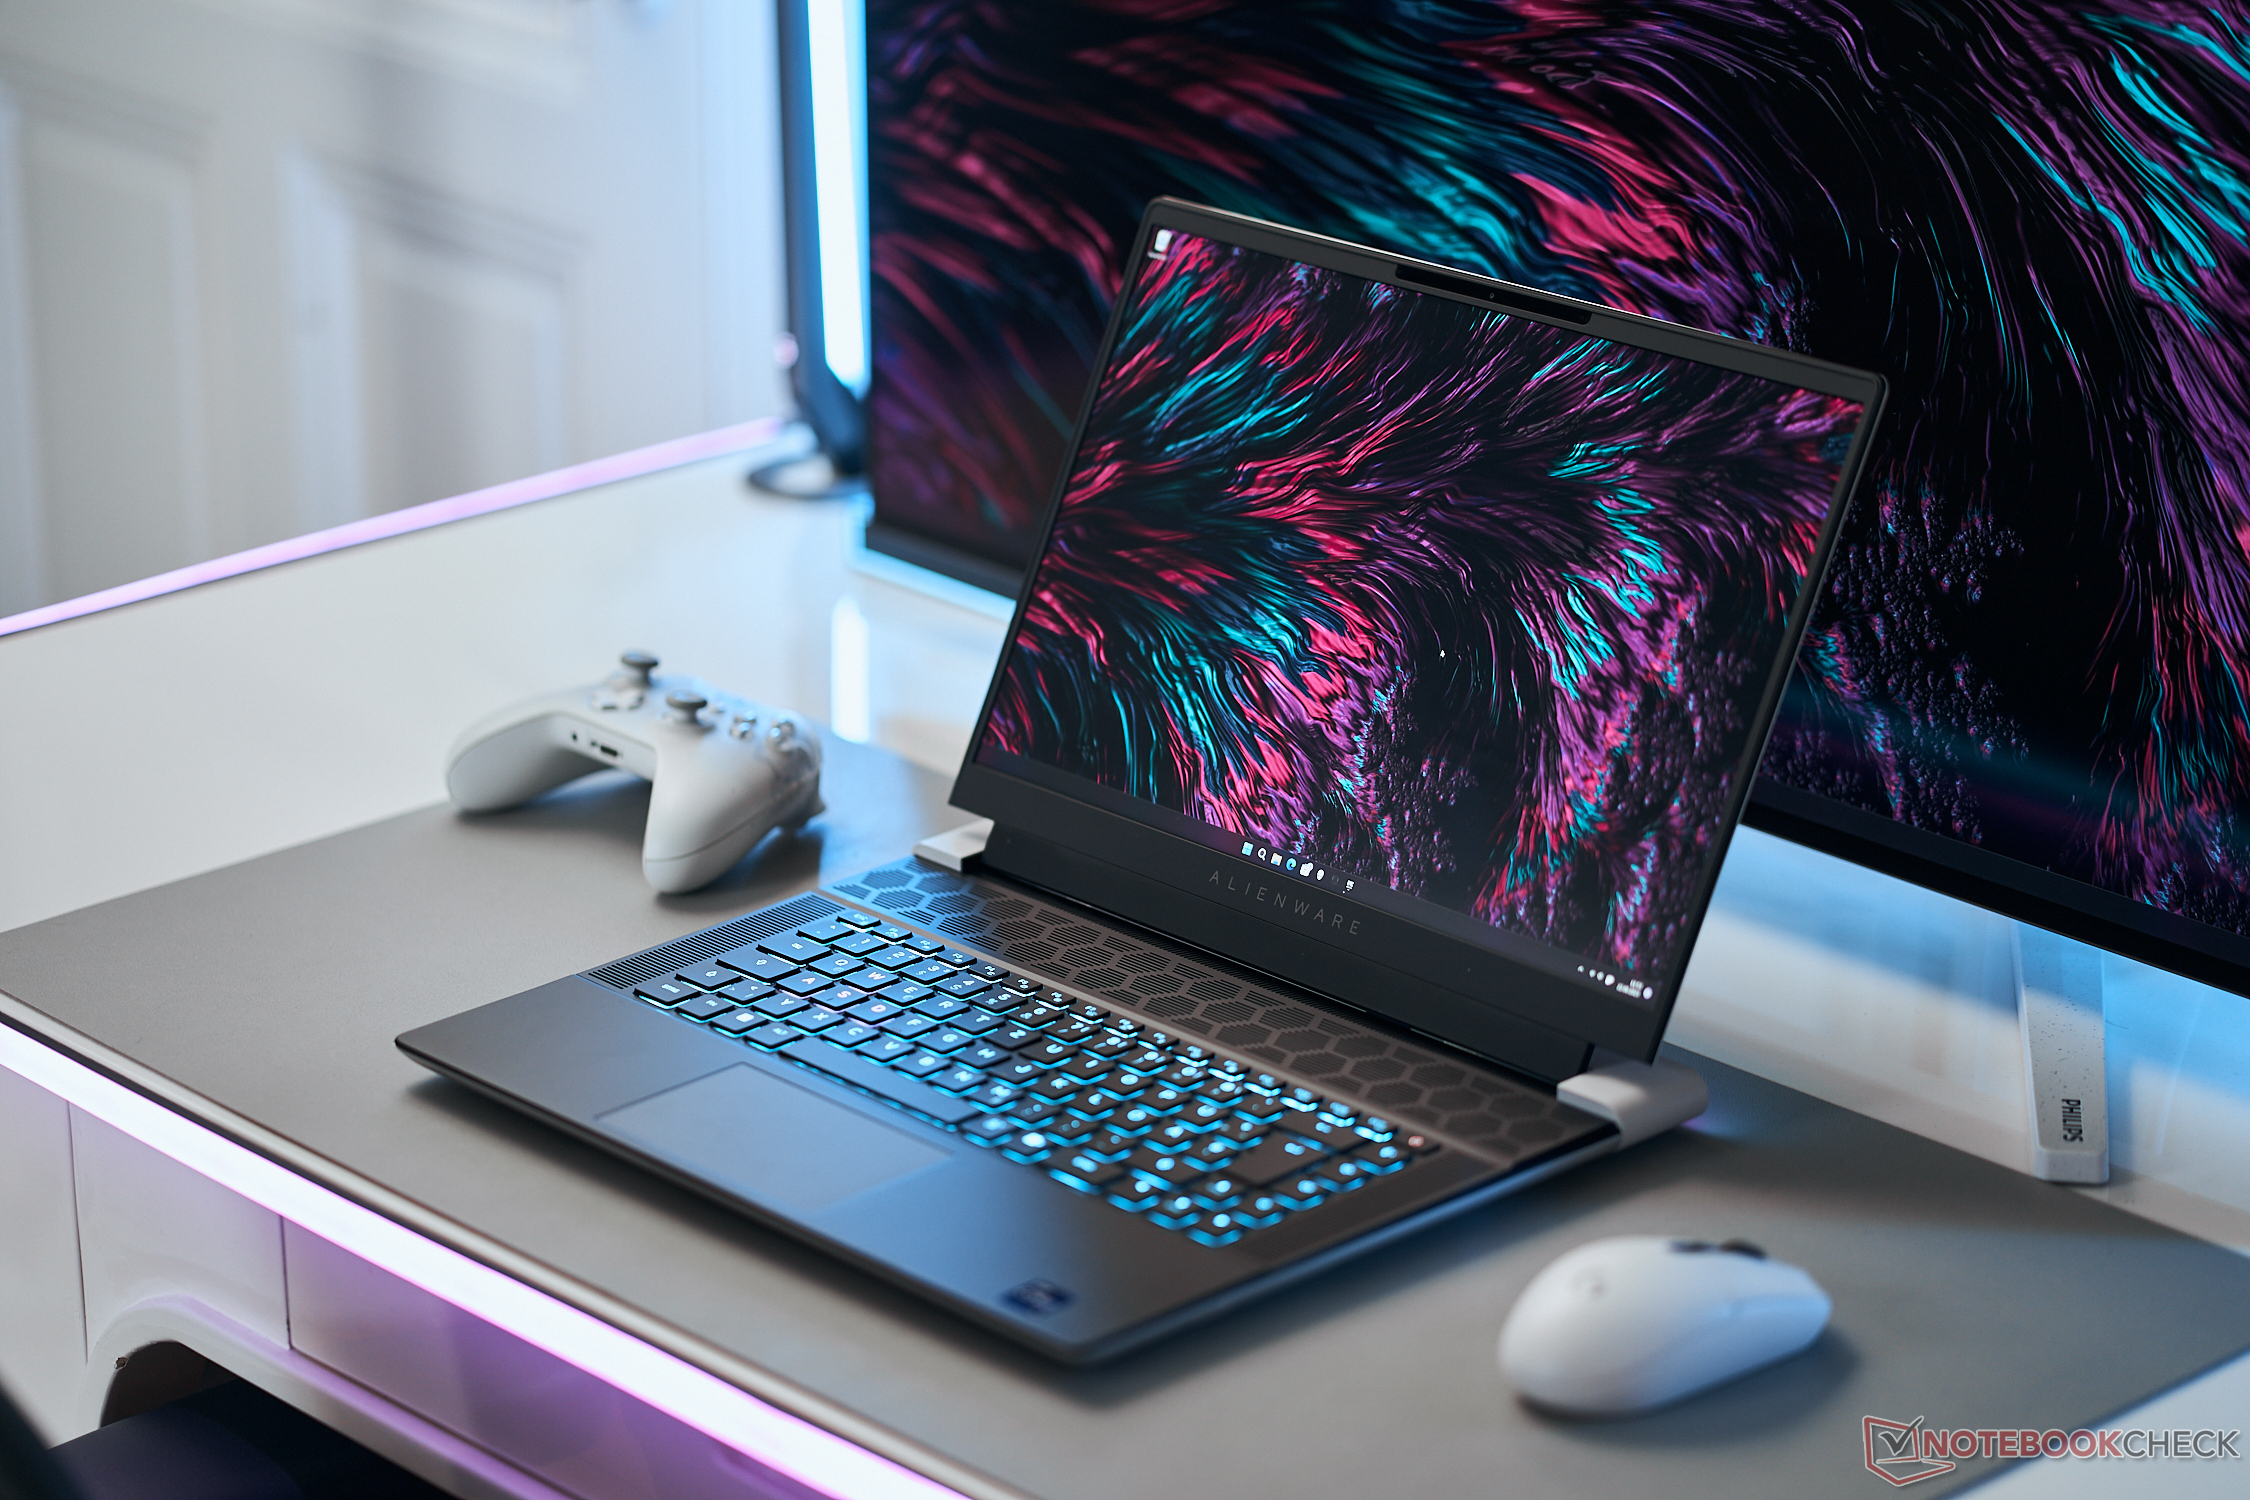
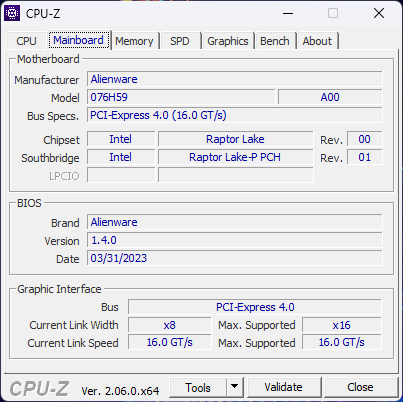
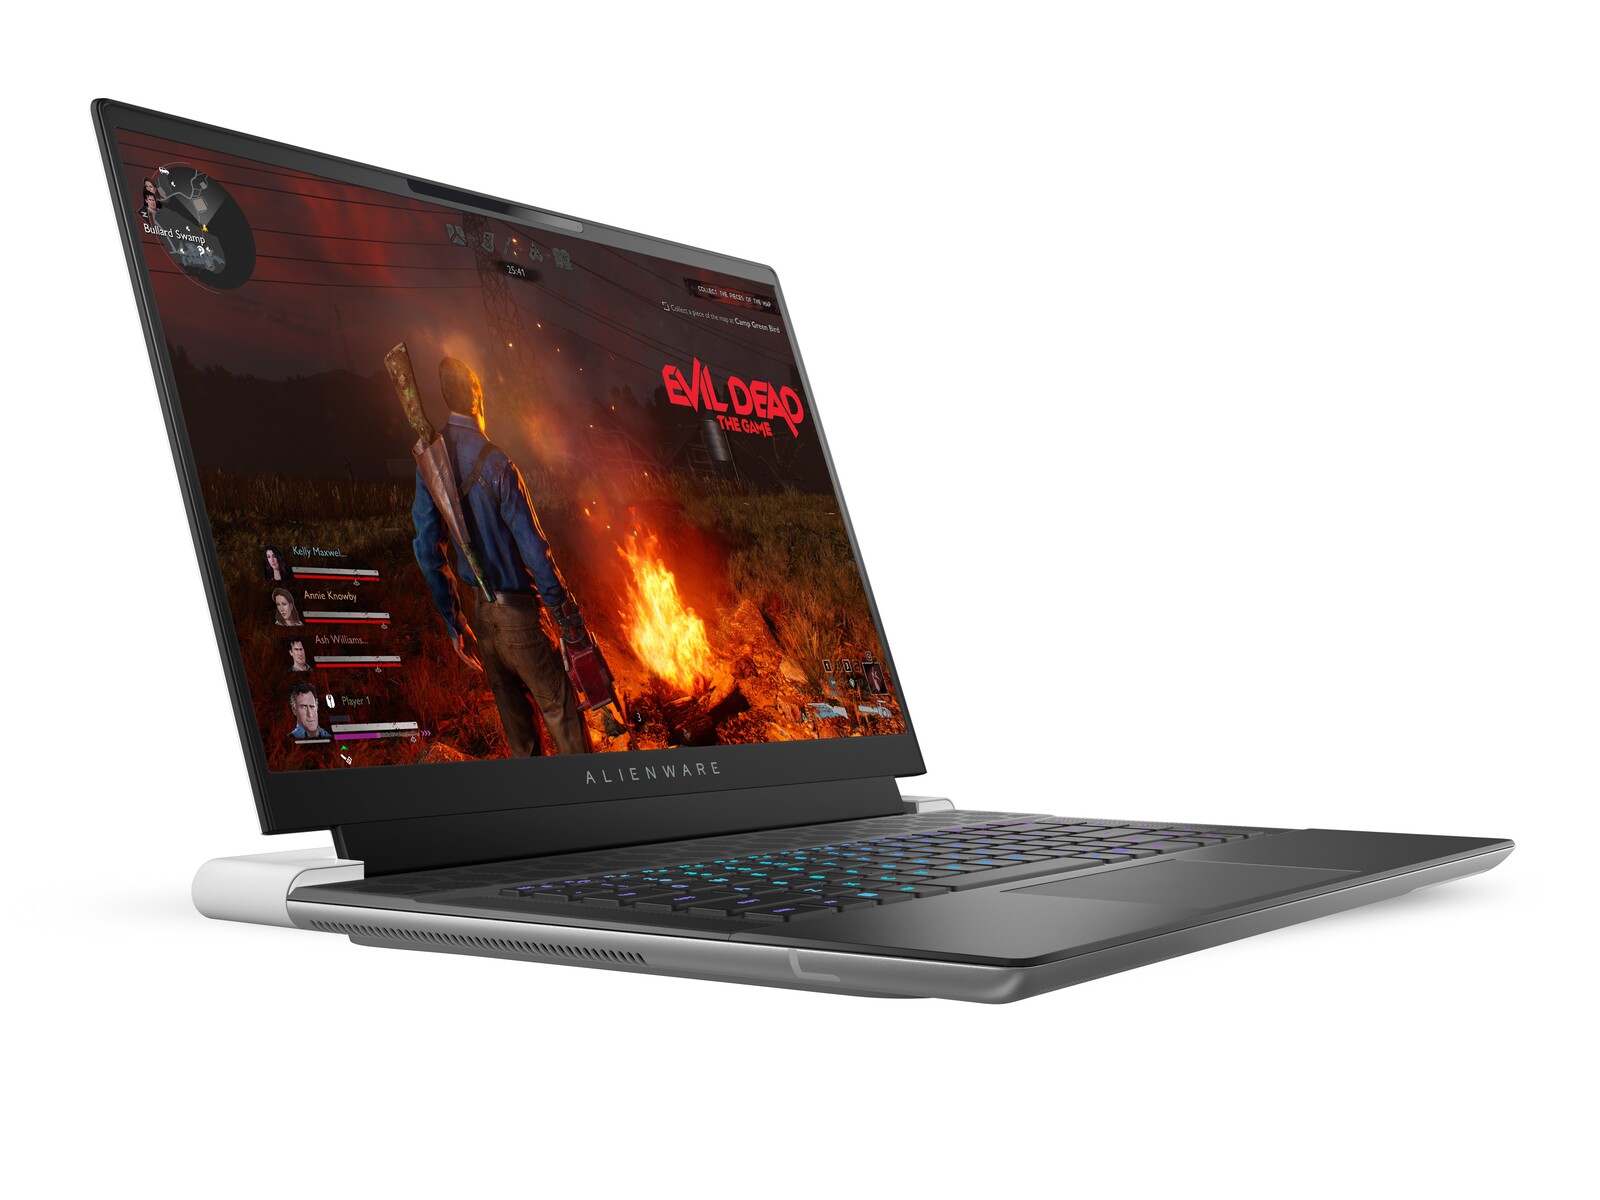
Unveiled at CES 2023, the Alienware x16 R1 is the second 16-inch model in the family following the thicker and more powerful Alienware m16 which we have yet to review. The two models complement the existing 14-inch, 15-inch, 17-inch and 18-inch Alienware options already in the market.
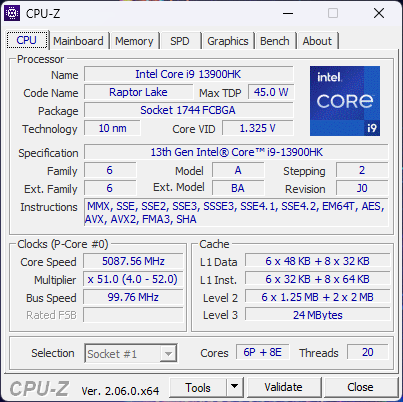
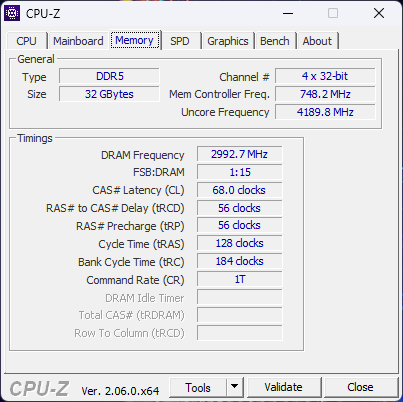
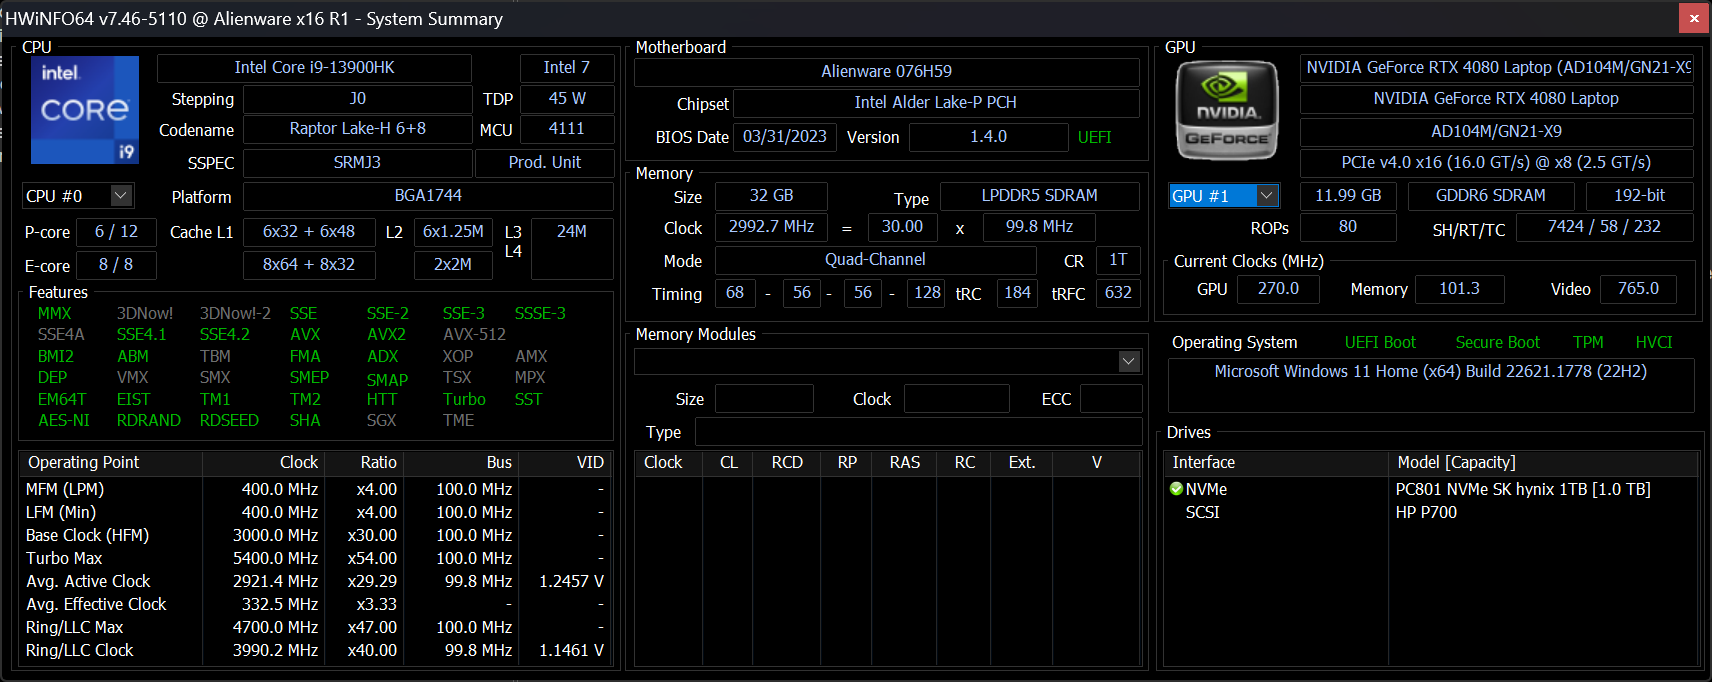
Our test unit is a higher-end configuration with the 13th gen Raptor Lake Core i9-13900HK CPU, GeForce RTX 4080 GPU, and 16.0-inch 2560 x 1600 240 Hz IPS display for approximately $3350 USD. Cheaper or more expensive configurations are available ranging from the Core i7-13620H, 1200p display, and RTX 4050 GPU up to the RTX 4090 for $2200 to over $4000.
Alternatives to the Alienware x16 R1 include other 16-inch gaming laptops like the Lenovo Legion Pro 7, Asus ROG Zephyrus M16, Razer Blade 16, or the HP Omen 16. This particular size category has been growing in popularity over the past couple of years.
More Dell reviews:
Potential Competitors in Comparison
Rating | Date | Model | Weight | Height | Size | Resolution | Price |
|---|---|---|---|---|---|---|---|
| 88.4 % v7 (old) | 06 / 2023 | Alienware x16 R1 i9-13900HK, GeForce RTX 4080 Laptop GPU | 2.6 kg | 18.57 mm | 16.00" | 2560x1600 | |
| 88.8 % v7 (old) | 06 / 2023 | Lenovo Legion Pro 7 RTX4090 i9-13900HX, GeForce RTX 4090 Laptop GPU | 2.7 kg | 26 mm | 16.00" | 2560x1600 | |
| 89.4 % v7 (old) | 03 / 2023 | Asus ROG Zephyrus M16 GU604VY-NM042X i9-13900H, GeForce RTX 4090 Laptop GPU | 2.3 kg | 22.9 mm | 16.00" | 2560x1600 | |
| 91.2 % v7 (old) | 02 / 2023 | Razer Blade 16 Early 2023 i9-13950HX, GeForce RTX 4080 Laptop GPU | 2.4 kg | 21.99 mm | 16.00" | 2560x1600 | |
| 86.1 % v7 (old) | 10 / 2022 | Dell G16 7620 i7-12700H, GeForce RTX 3060 Laptop GPU | 2.6 kg | 26.9 mm | 16.00" | 2560x1600 | |
| 86.1 % v7 (old) | 01 / 2023 | Alienware m17 R5 (R9 6900HX, RX 6850M XT) R9 6900HX, Radeon RX 6850M XT | 3.4 kg | 26.7 mm | 17.00" | 3840x2160 |
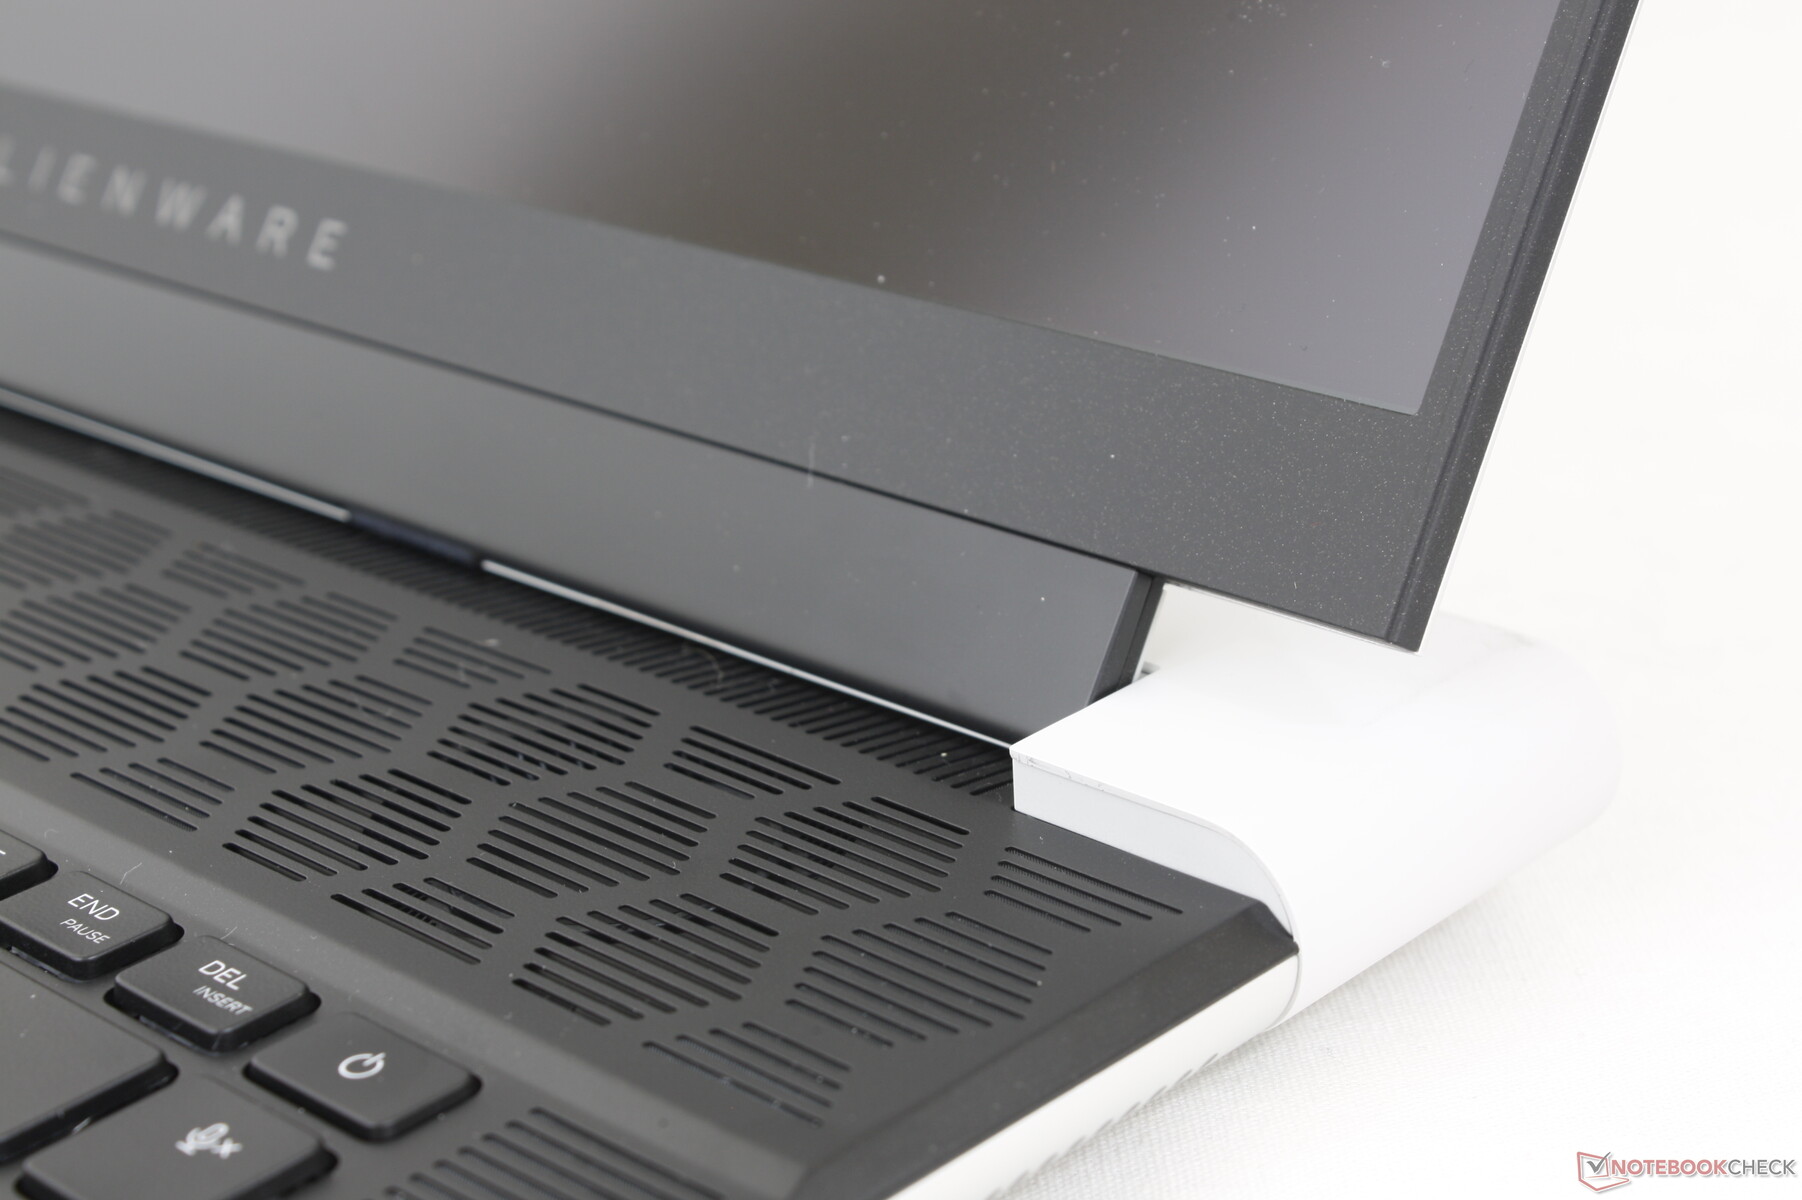
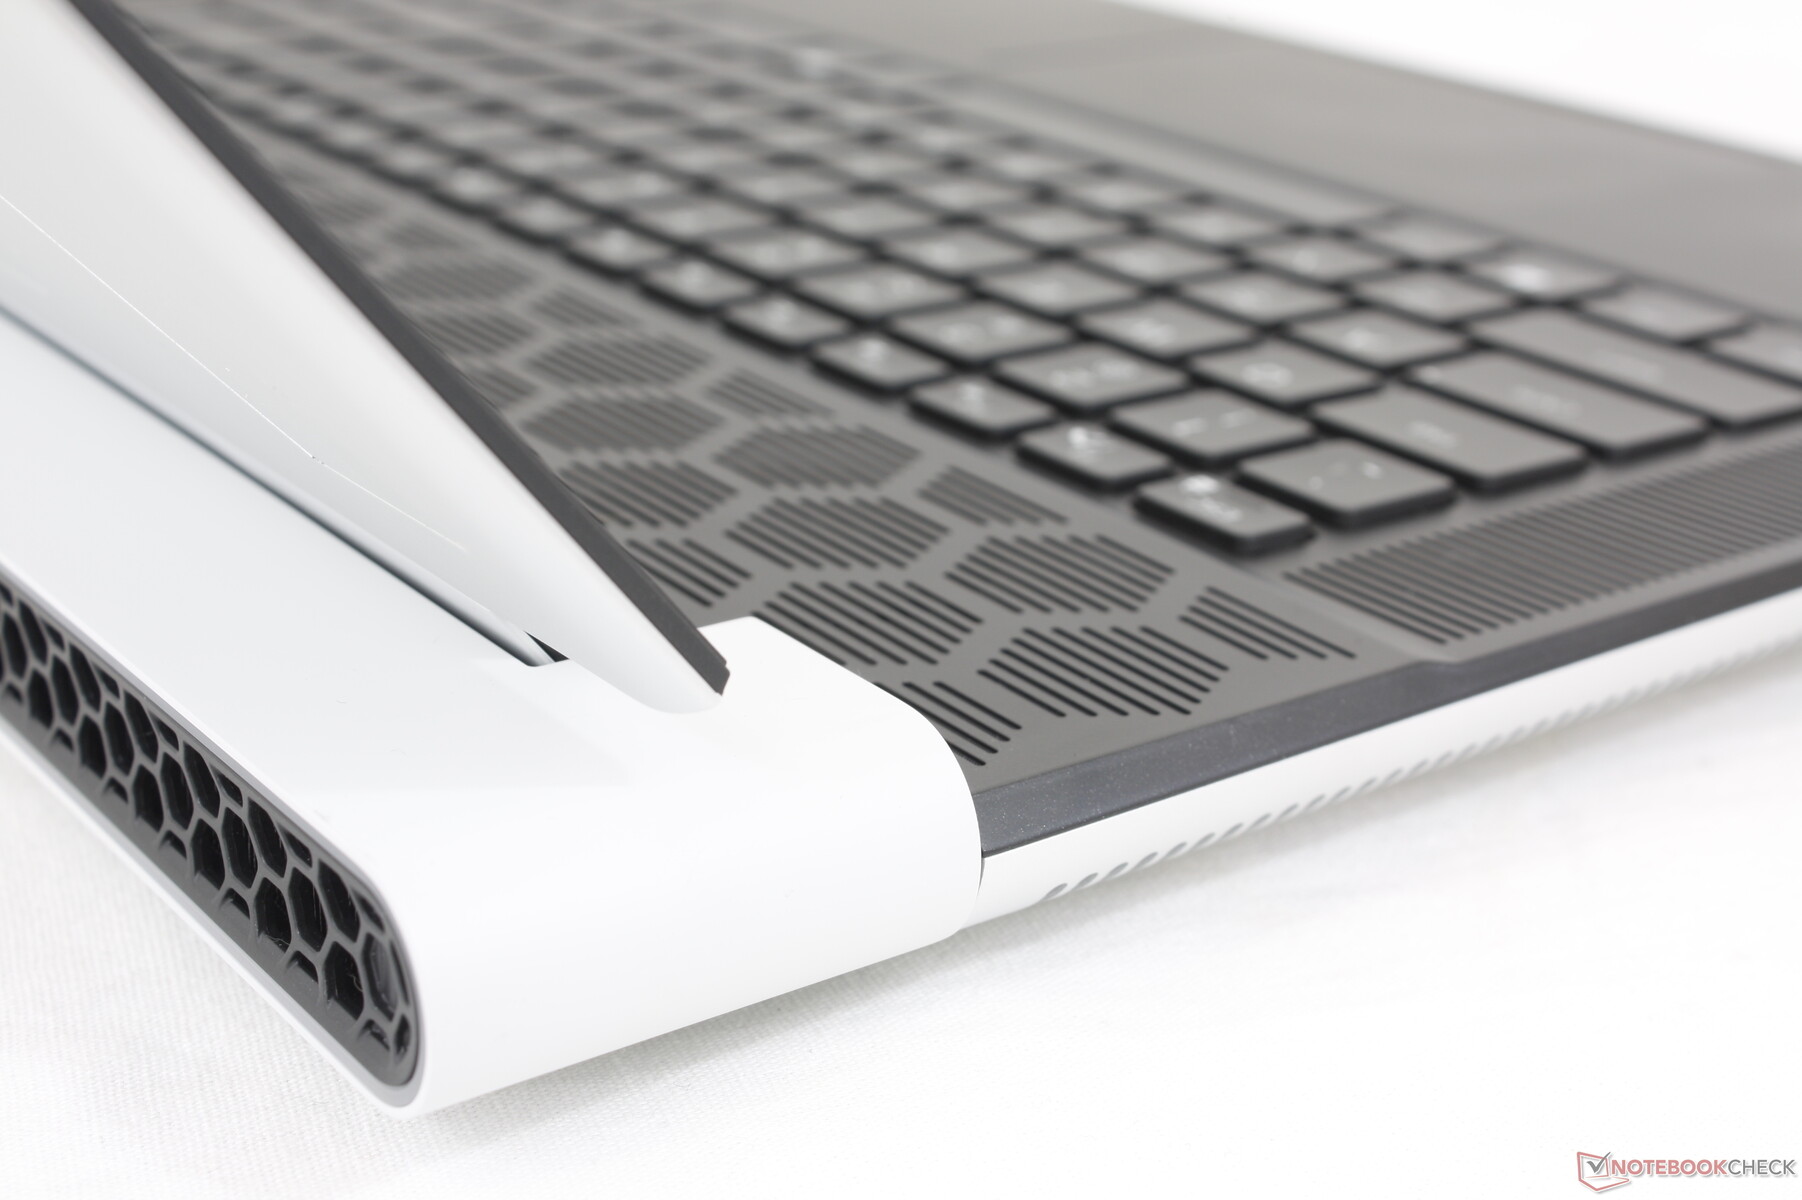
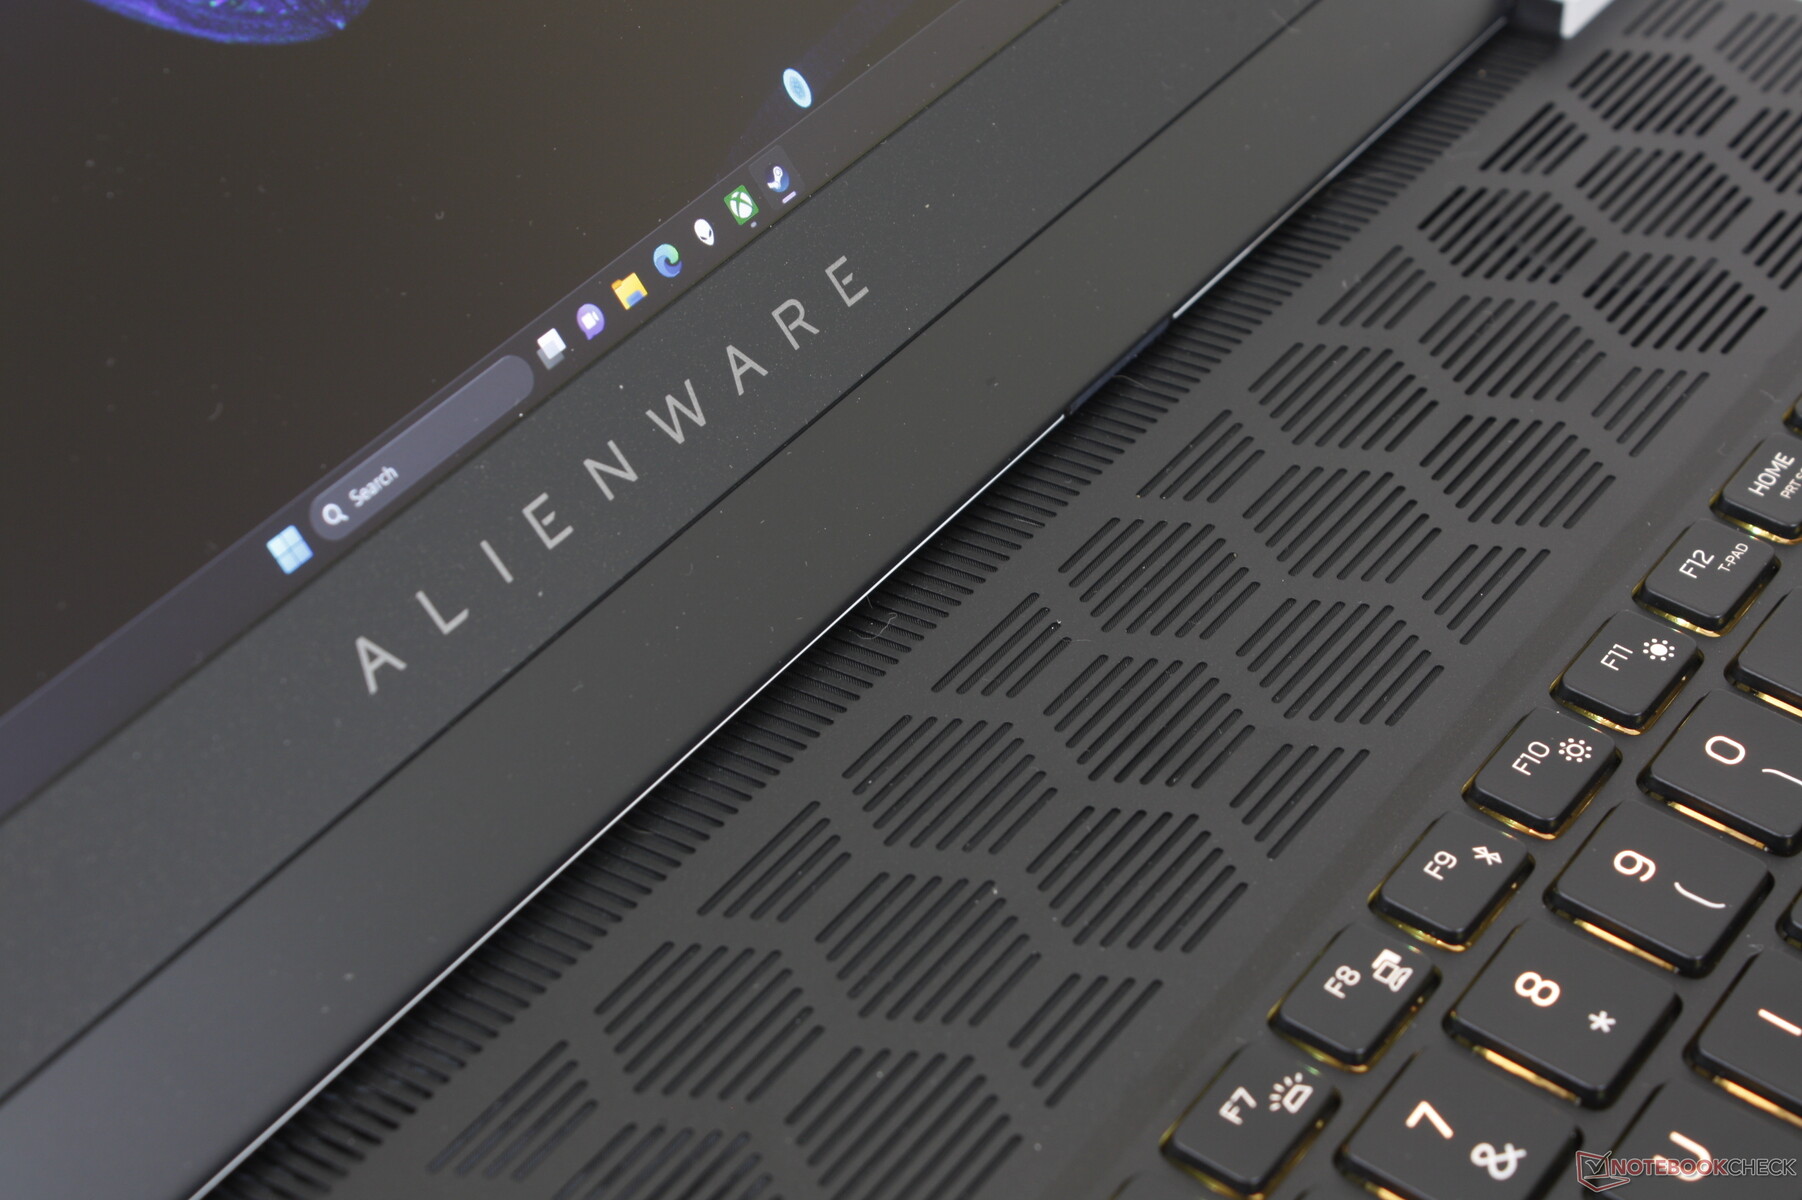
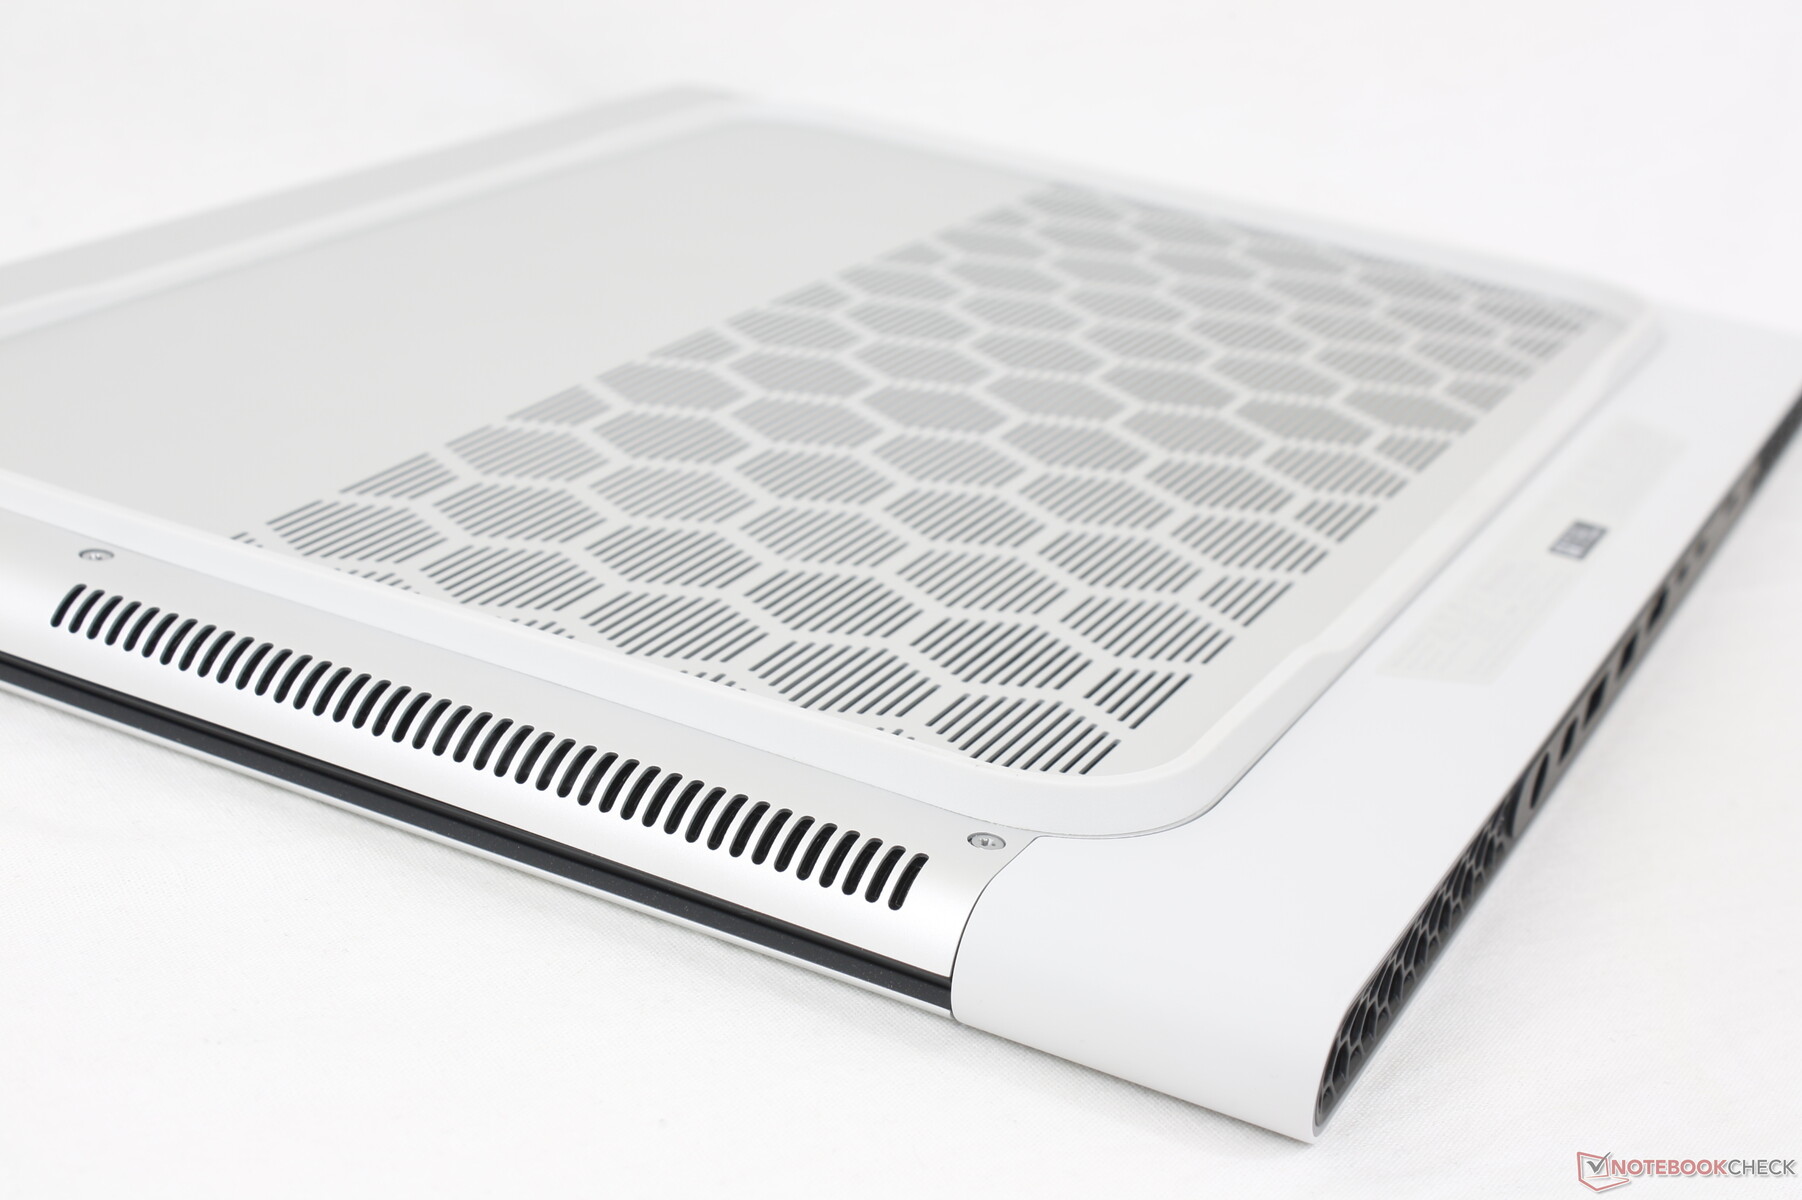
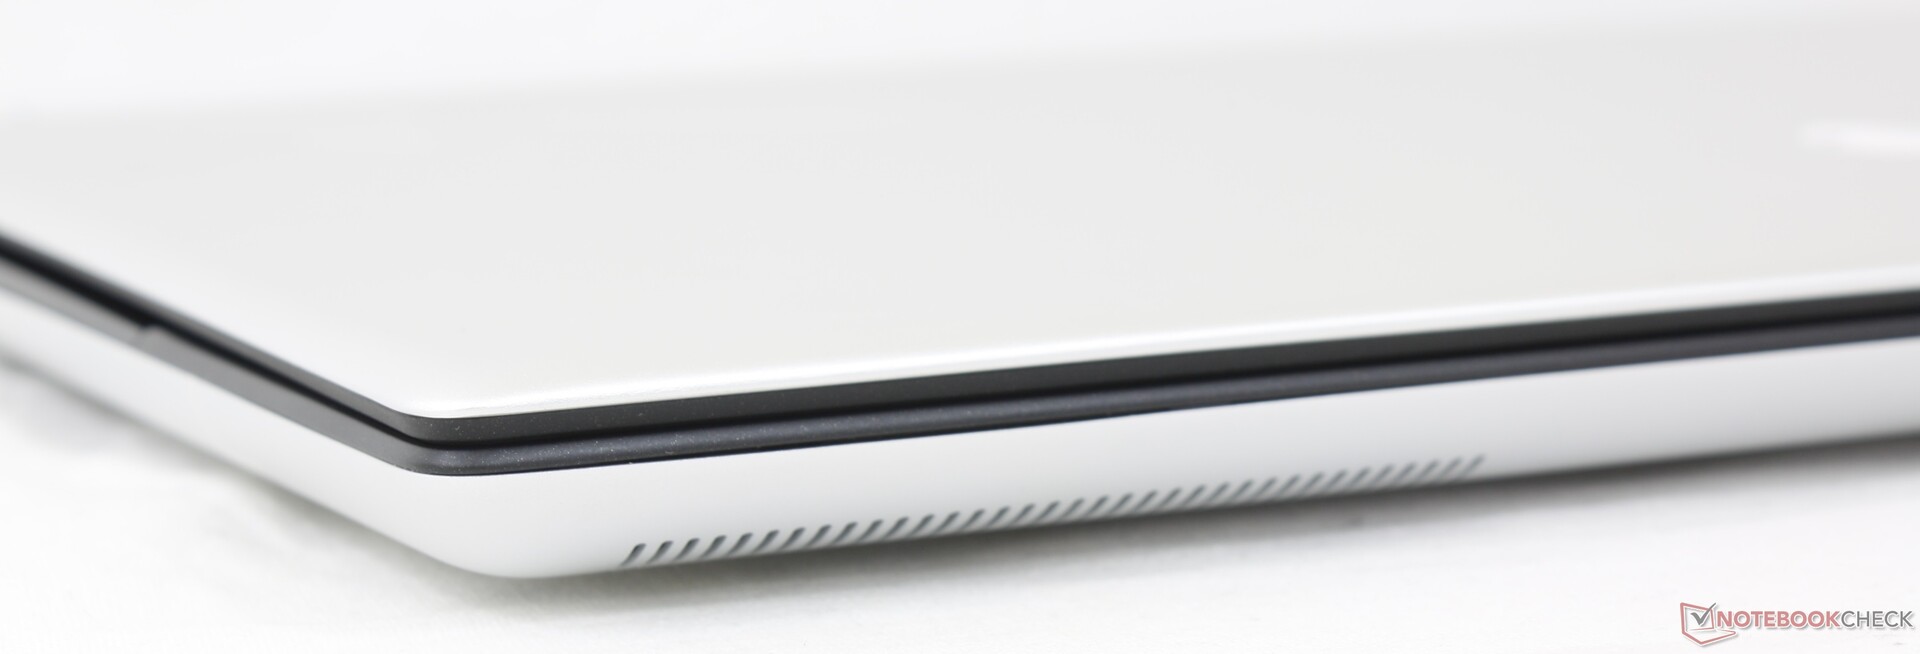
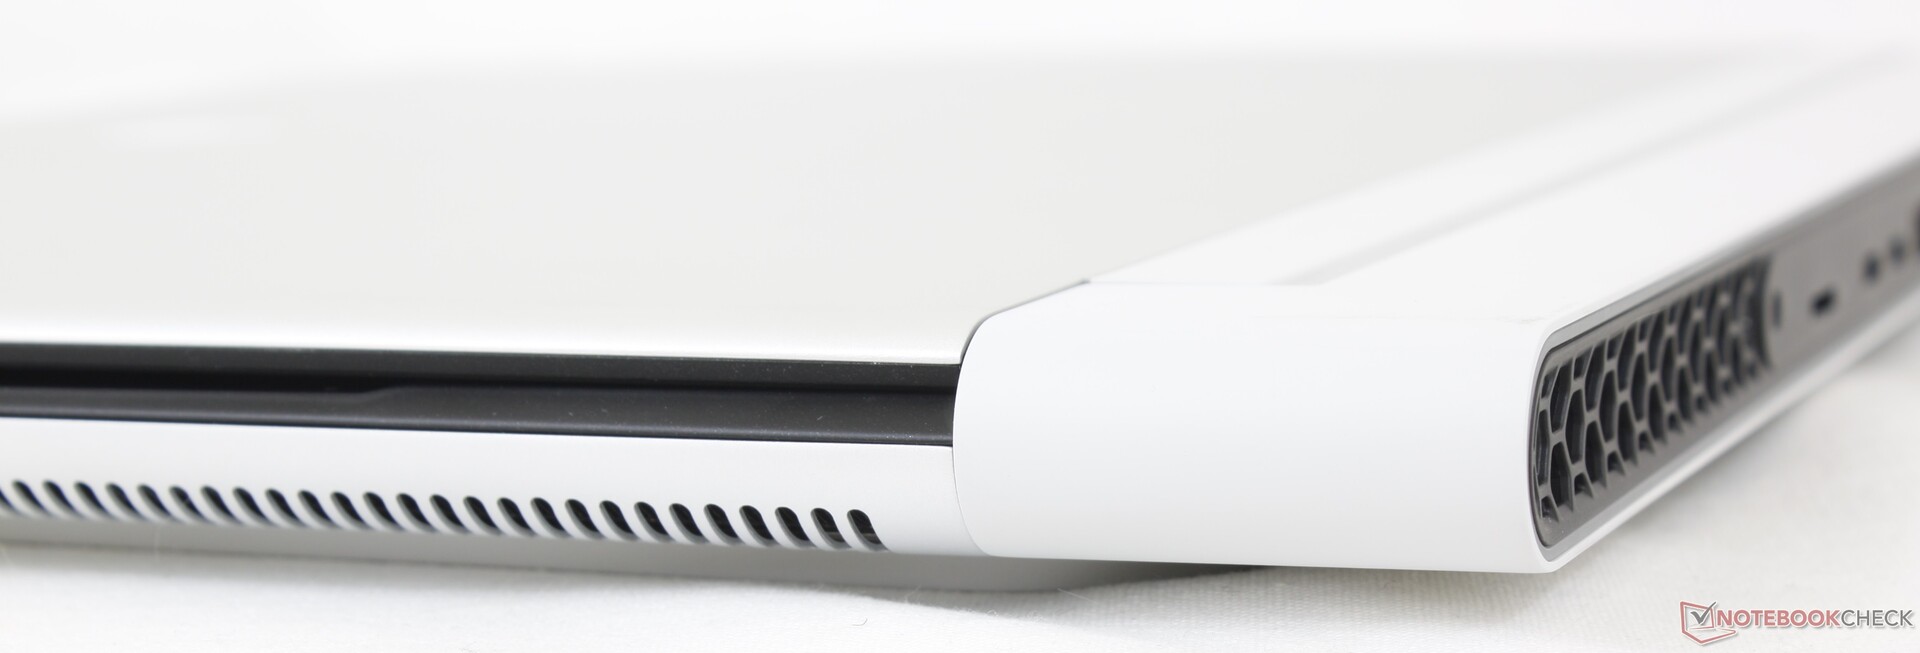
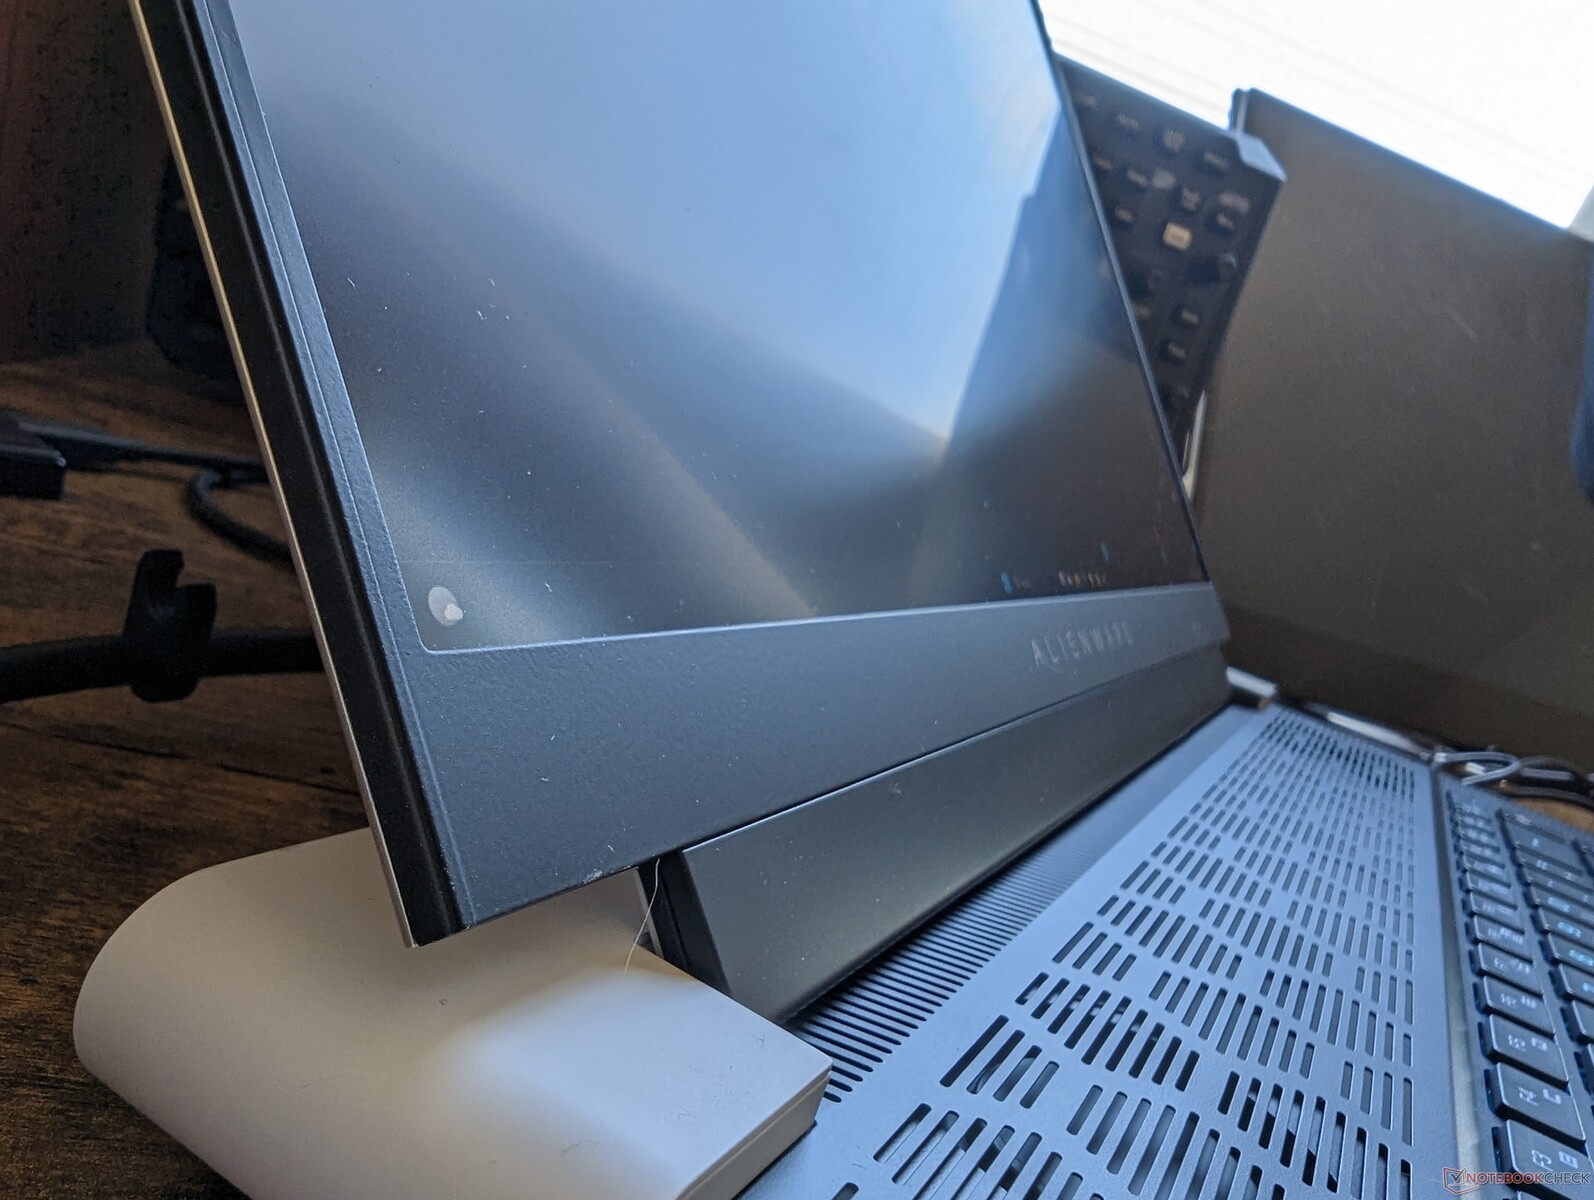
Case — Distinctly Alienware
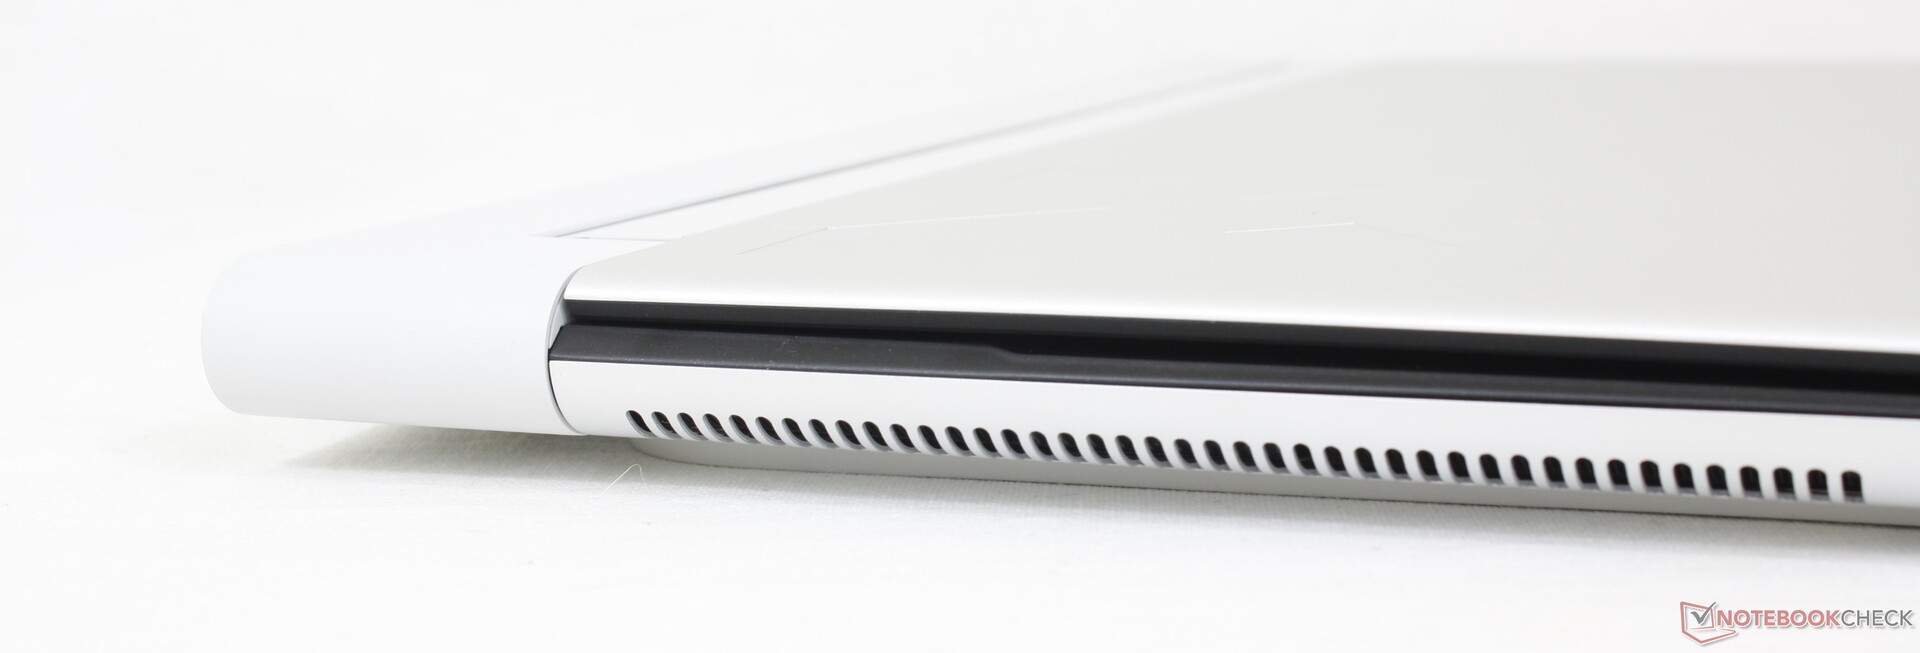
The chassis has a lot in common with the Alienware x15 R2 and X17 R2 since they all share the Legend 3 design language. The two-tone black and white, anodized aluminum and magnesium alloy, and RGB ring along the rear help to visually distinguish the Alienware series from the ocean of other gaming laptops. Whether it's more attractive or desirable than competing models is down to user preference.
Chassis rigidity is excellent especially around the base where twisting and warping are at a minimum. The lid and hinges, however, are not as rigid as we would like when compared to the stiffer displays on the Asus Strix Scar series or the Blade 16.
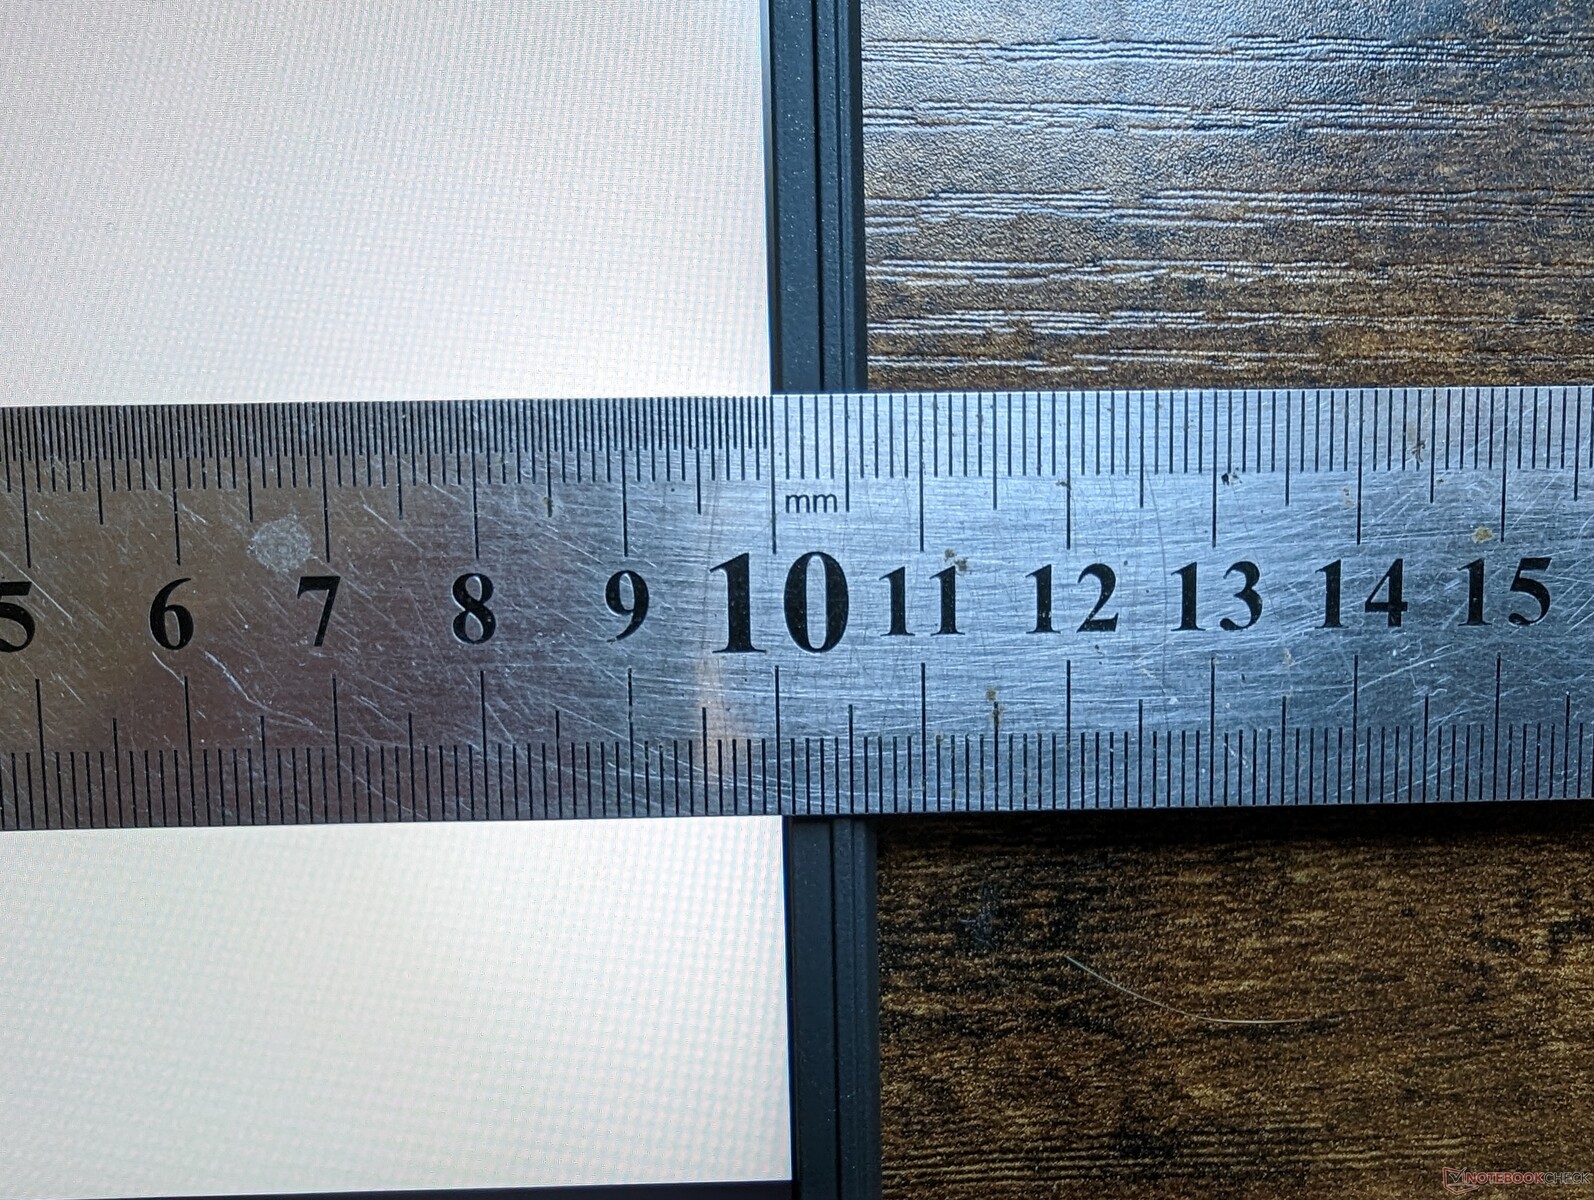
At under 19 mm, the Alienware x16 is one of the thinnest 16-inch gaming laptops in the market thinner than even the Razer Blade 16. Unfortunately, the system is wider and longer for a much larger footprint and so its overall volume is not any smaller than many competitors. For example, the Alienware is almost 4 mm thinner than the Blade 16, but it's longer by over 40 mm and heavier by about 200 grams as a consequence.
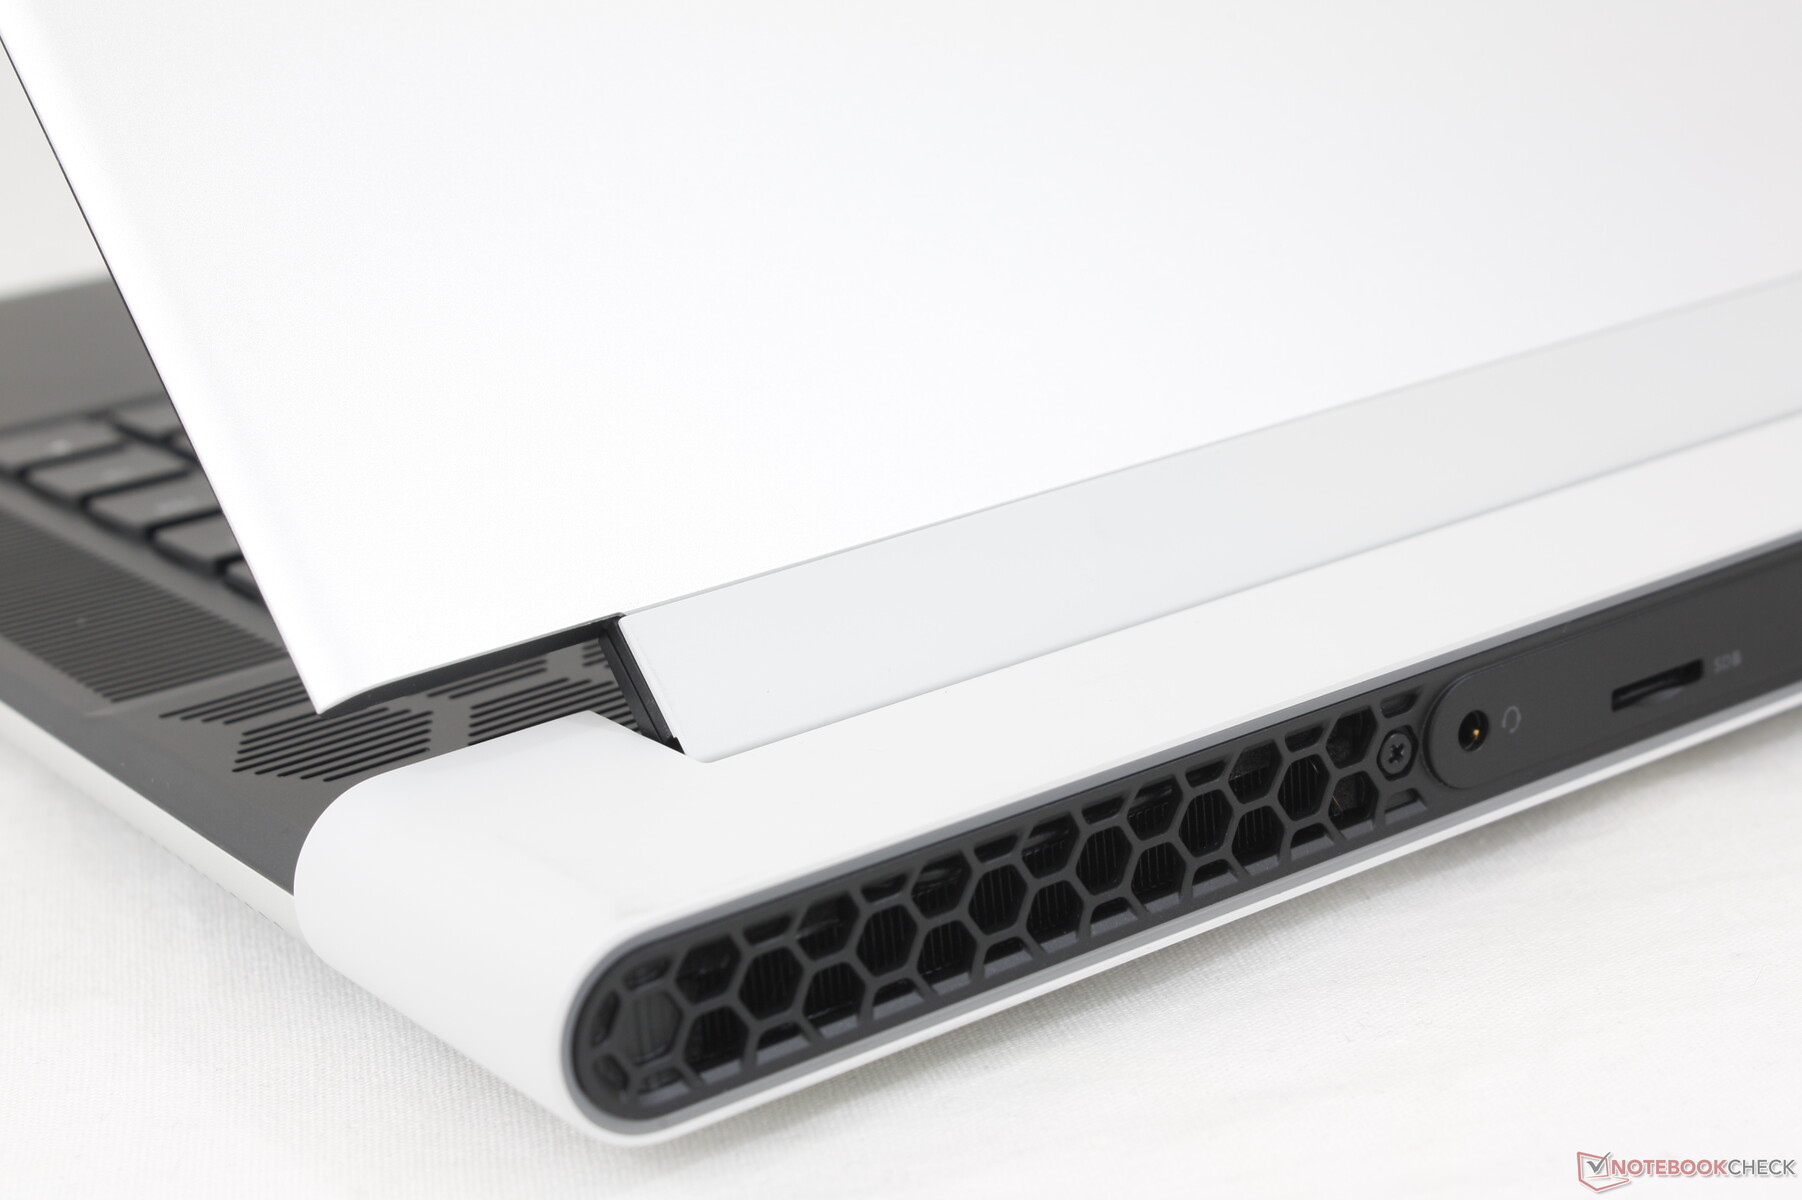
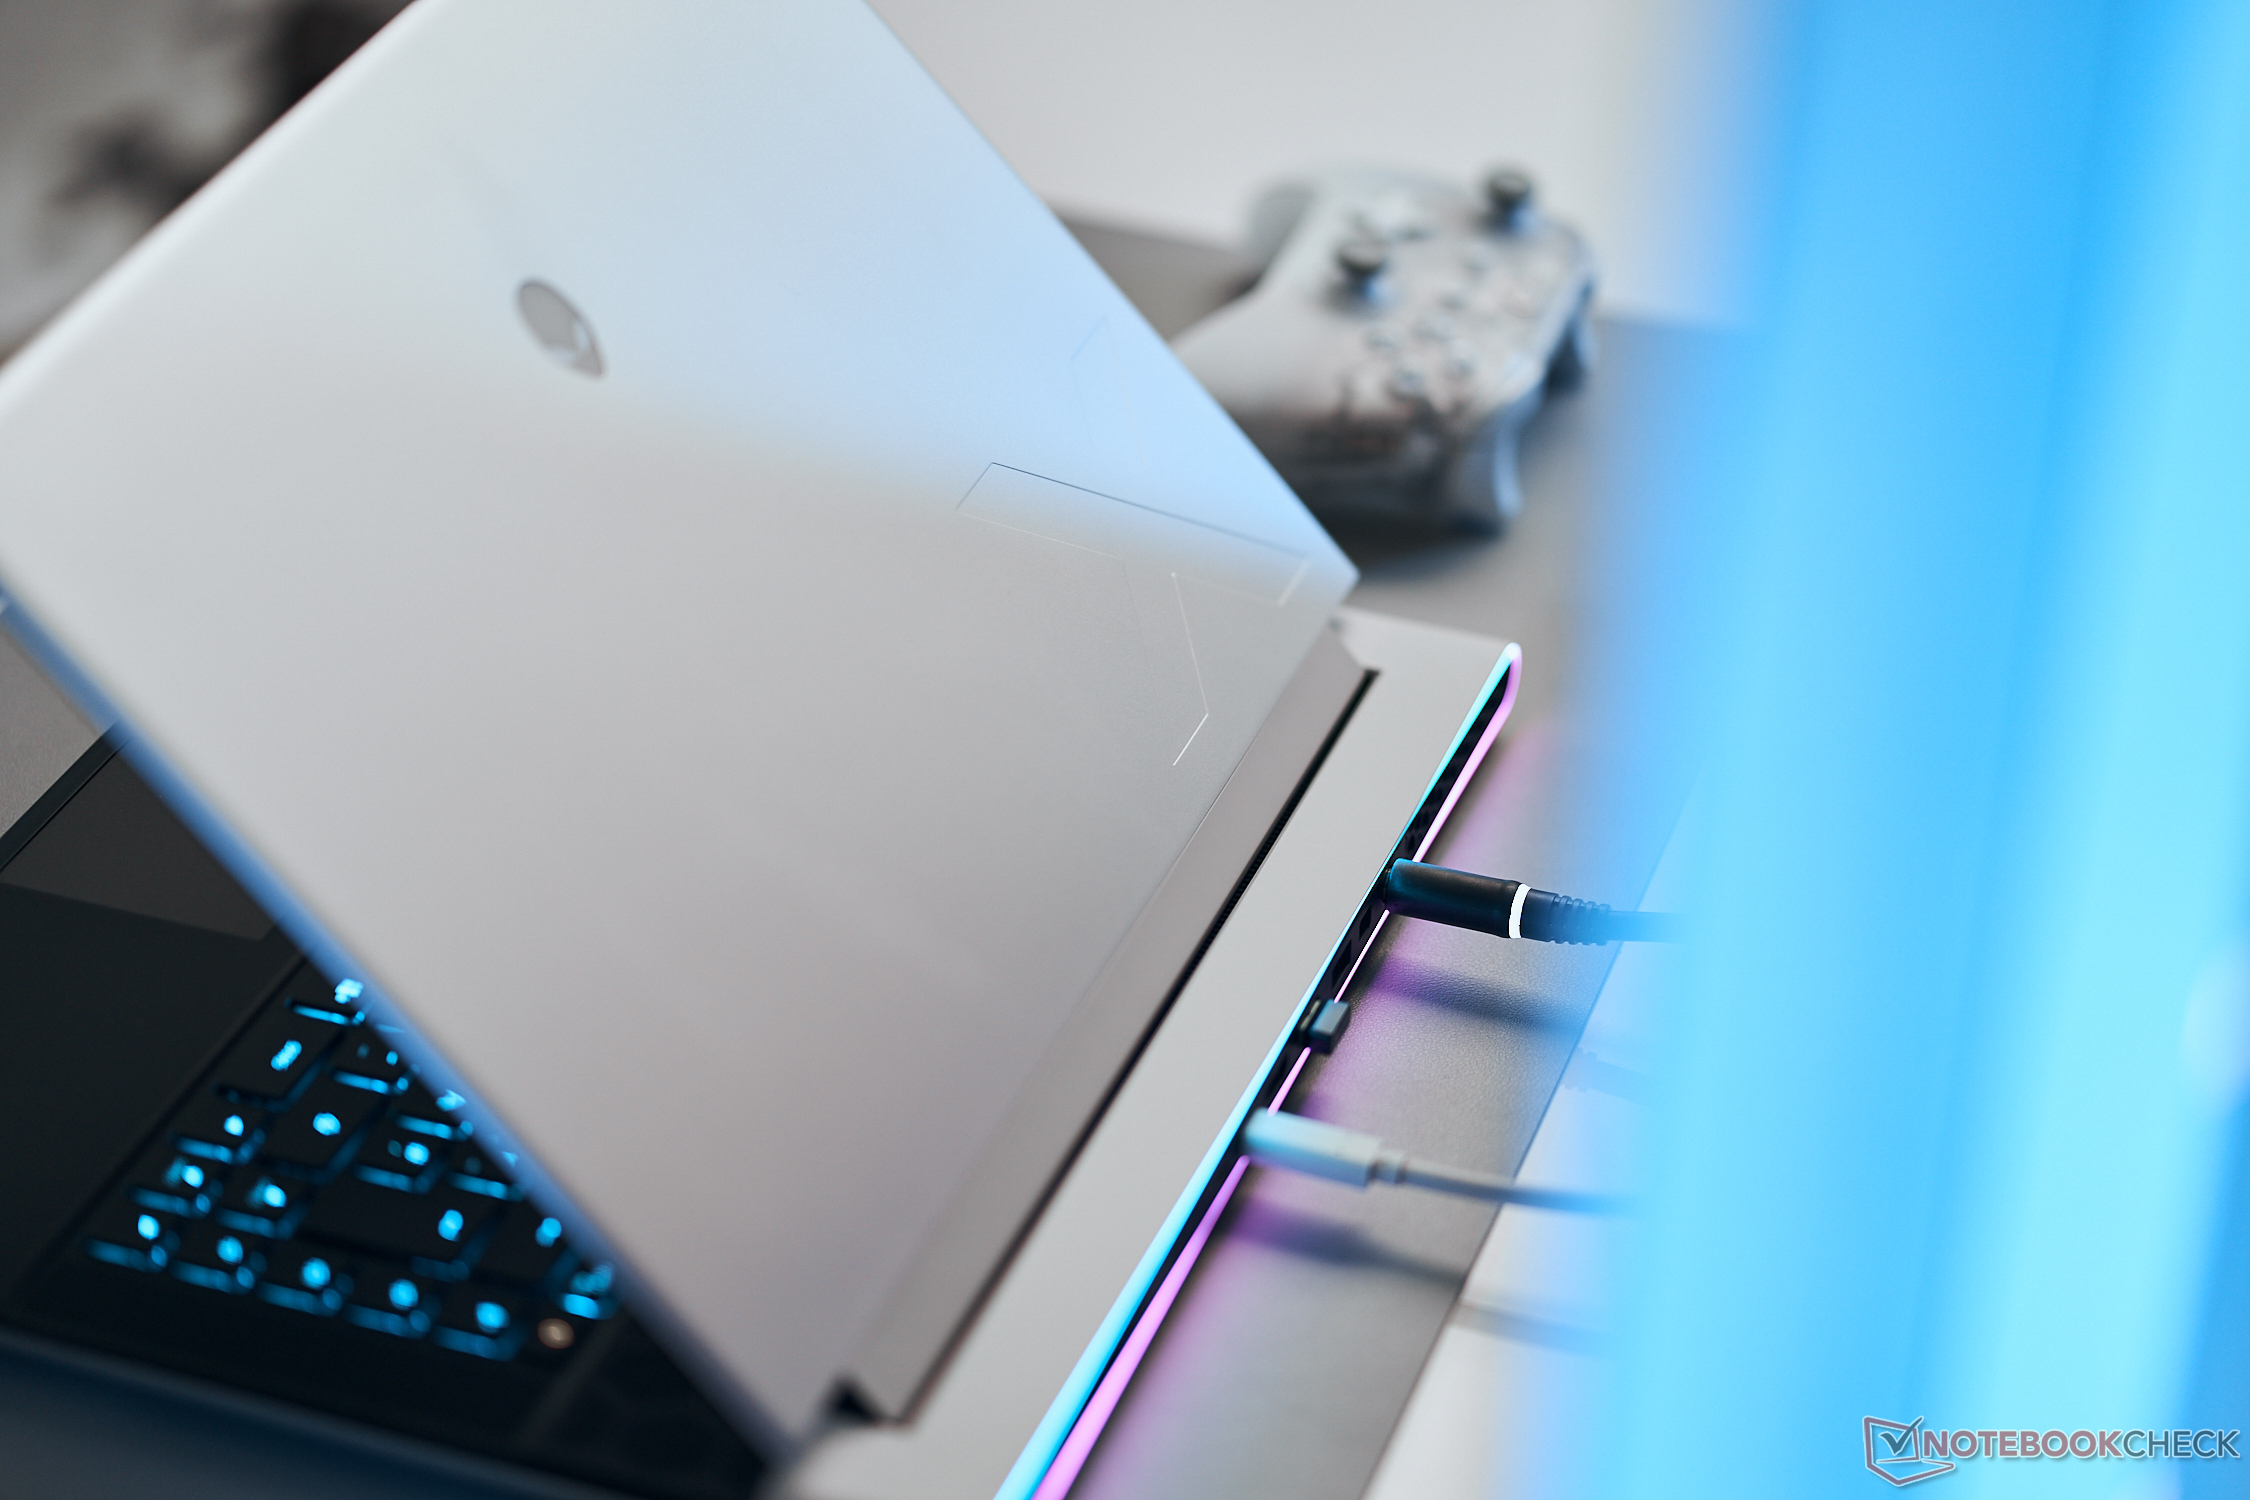
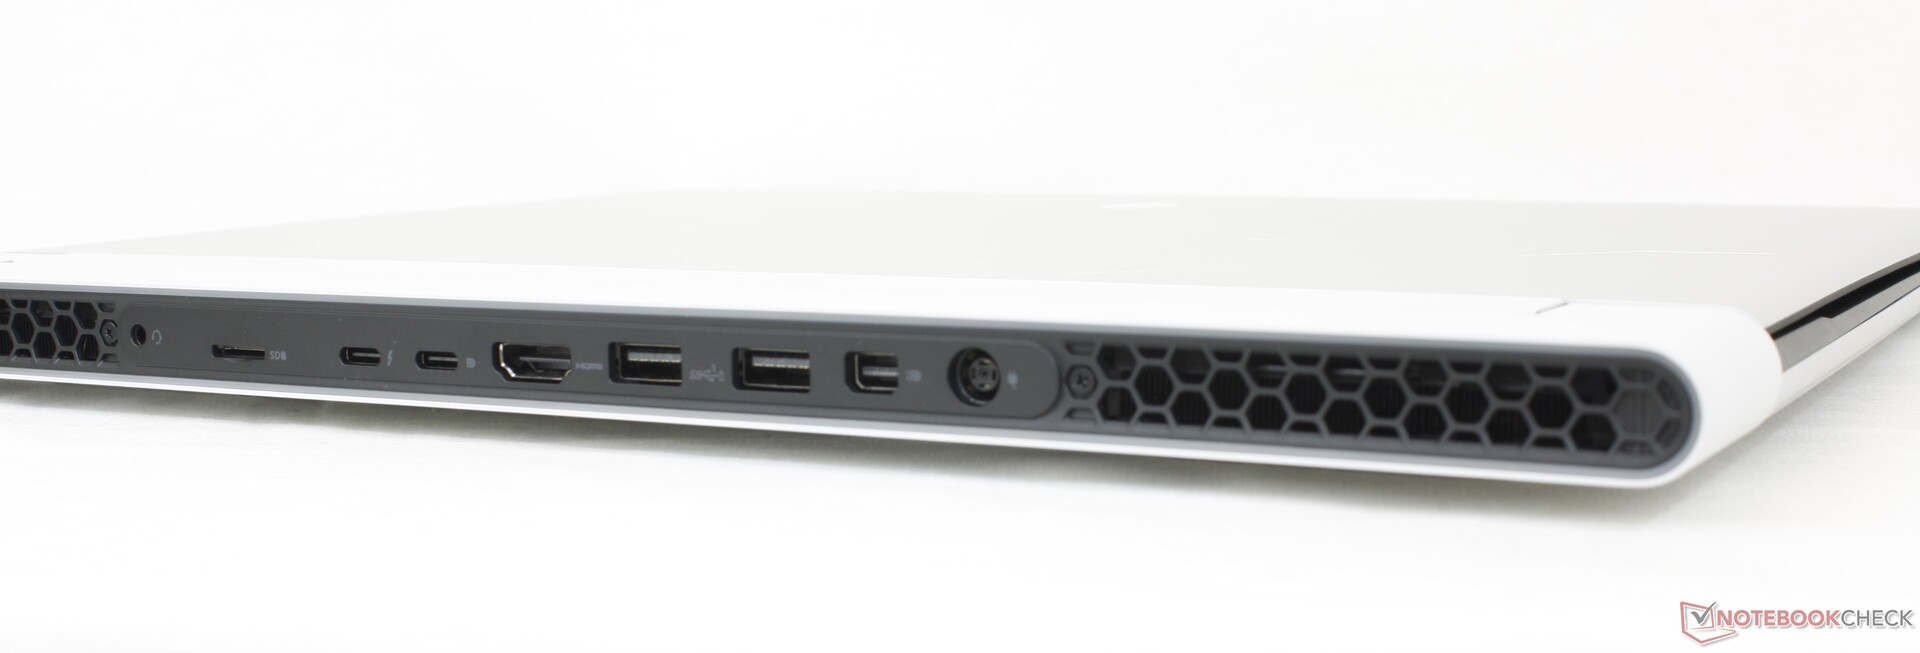
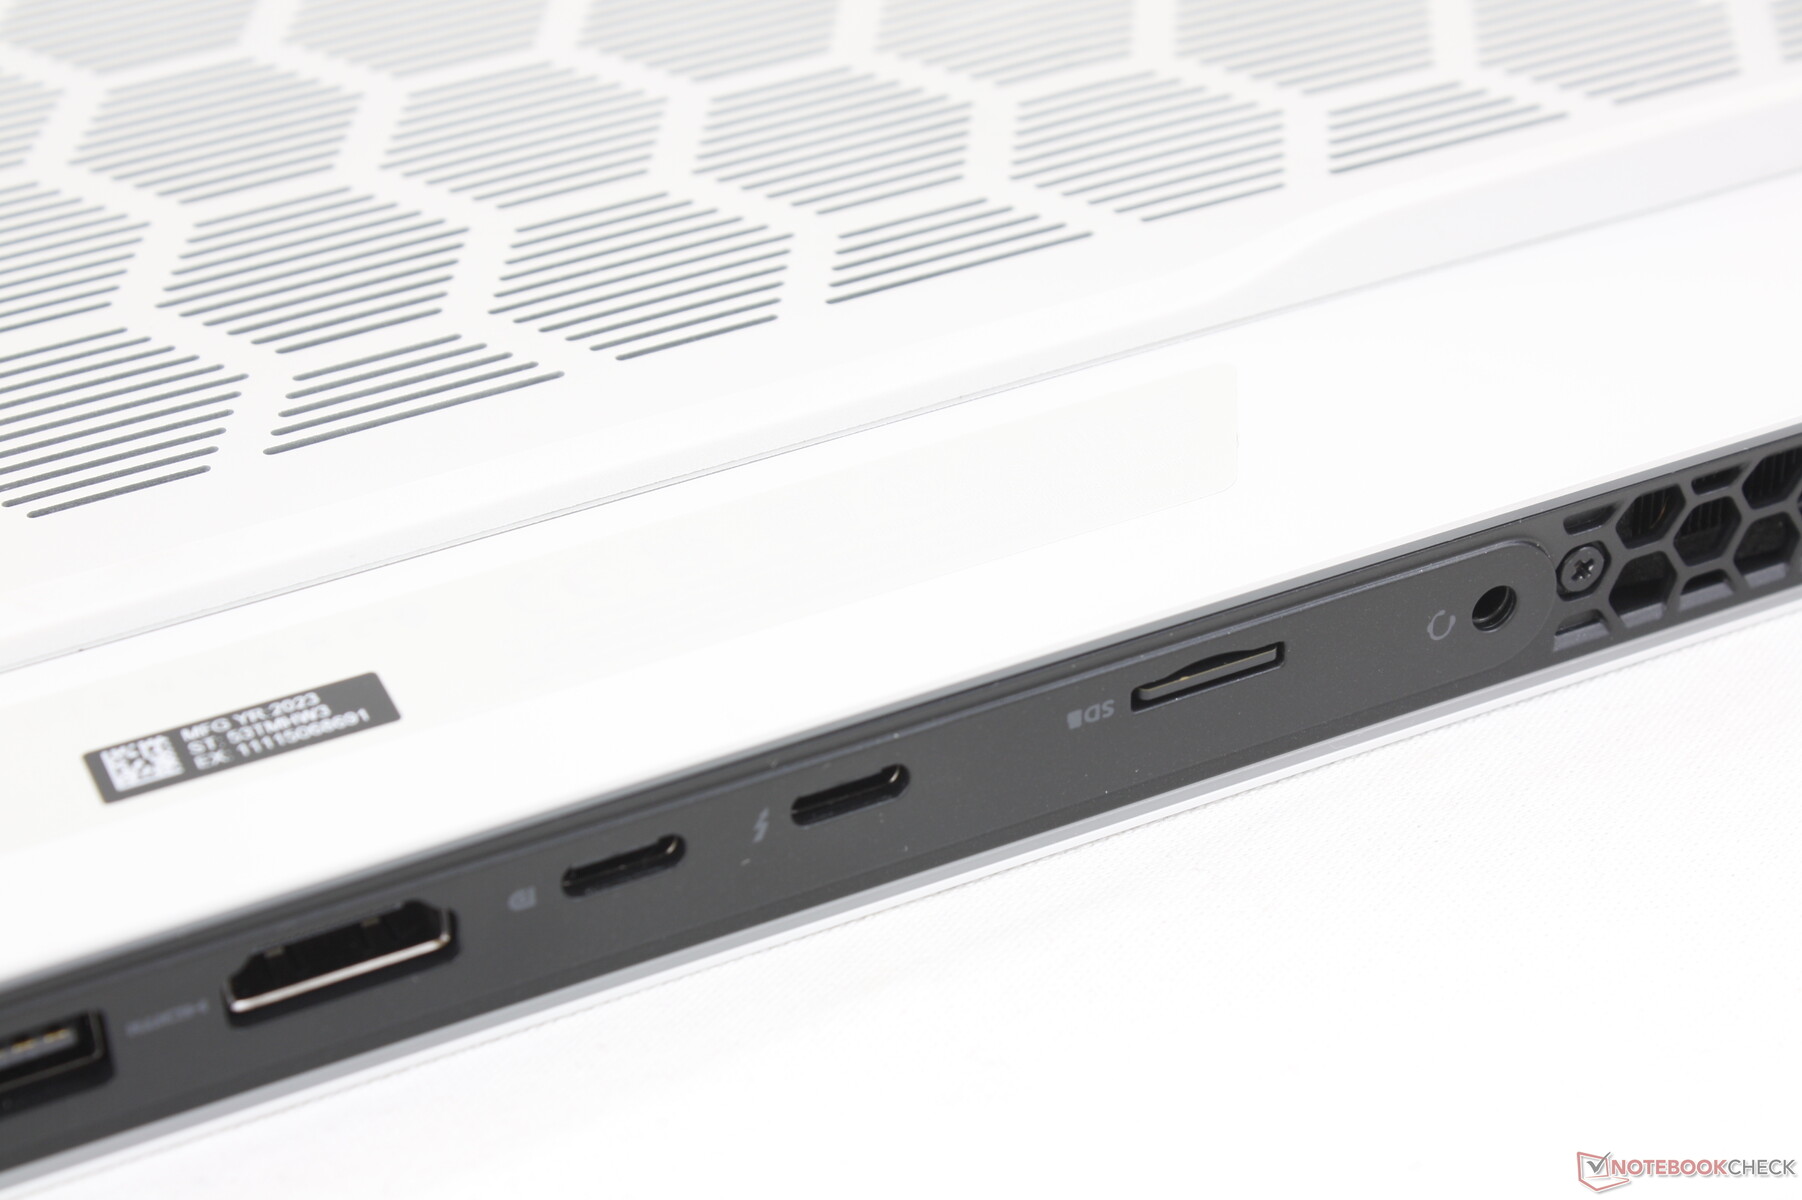
Connectivity — Nothing On The Sides
All ports are along the rear which can be both a blessing and a hassle. On one hand, the lack of any side ports means no unsightly or distracting cables. On the other hand, the positioning of the ports is not ideal especially for the commonly used USB ports.
Keep in mind that Thunderbolt 4 is supported on only one of the two USB-C ports.
SD Card Reader
AS SSD reports a sequential read rate of 256.1 MB/s while a real-world test transferring 1 GB of photos would be much slower at just 57 MB/s with our UHS-II MicroSD test card even after multiple retries.
Unlike on most other laptops, the MicroSD reader is along the rear of the chassis instead of the sides.
| SD Card Reader | |
| average JPG Copy Test (av. of 3 runs) | |
| Asus ROG Zephyrus M16 GU604VY-NM042X | |
| Razer Blade 16 Early 2023 (AV PRO microSD 128 GB V60) | |
| Alienware x16 R1 (AV PRO microSD 128 GB V60) | |
| maximum AS SSD Seq Read Test (1GB) | |
| Alienware x16 R1 (AV PRO microSD 128 GB V60) | |
| Razer Blade 16 Early 2023 (AV PRO microSD 128 GB V60) | |
| Asus ROG Zephyrus M16 GU604VY-NM042X | |
Communication
| Networking | |
| iperf3 transmit AXE11000 | |
| Lenovo Legion Pro 7 16IRX8H | |
| Razer Blade 16 Early 2023 | |
| Alienware x16 R1 | |
| Alienware m17 R5 (R9 6900HX, RX 6850M XT) | |
| Dell G16 7620 | |
| iperf3 receive AXE11000 | |
| Lenovo Legion Pro 7 16IRX8H | |
| Razer Blade 16 Early 2023 | |
| Alienware x16 R1 | |
| Dell G16 7620 | |
| Alienware m17 R5 (R9 6900HX, RX 6850M XT) | |
| iperf3 transmit AXE11000 6GHz | |
| Asus ROG Zephyrus M16 GU604VY-NM042X | |
| Razer Blade 16 Early 2023 | |
| Alienware x16 R1 | |
| iperf3 receive AXE11000 6GHz | |
| Asus ROG Zephyrus M16 GU604VY-NM042X | |
| Razer Blade 16 Early 2023 | |
| Alienware x16 R1 | |
Webcam
A 2MP webcam comes standard alongside IR for Hello support. There is no privacy shutter at all, however.


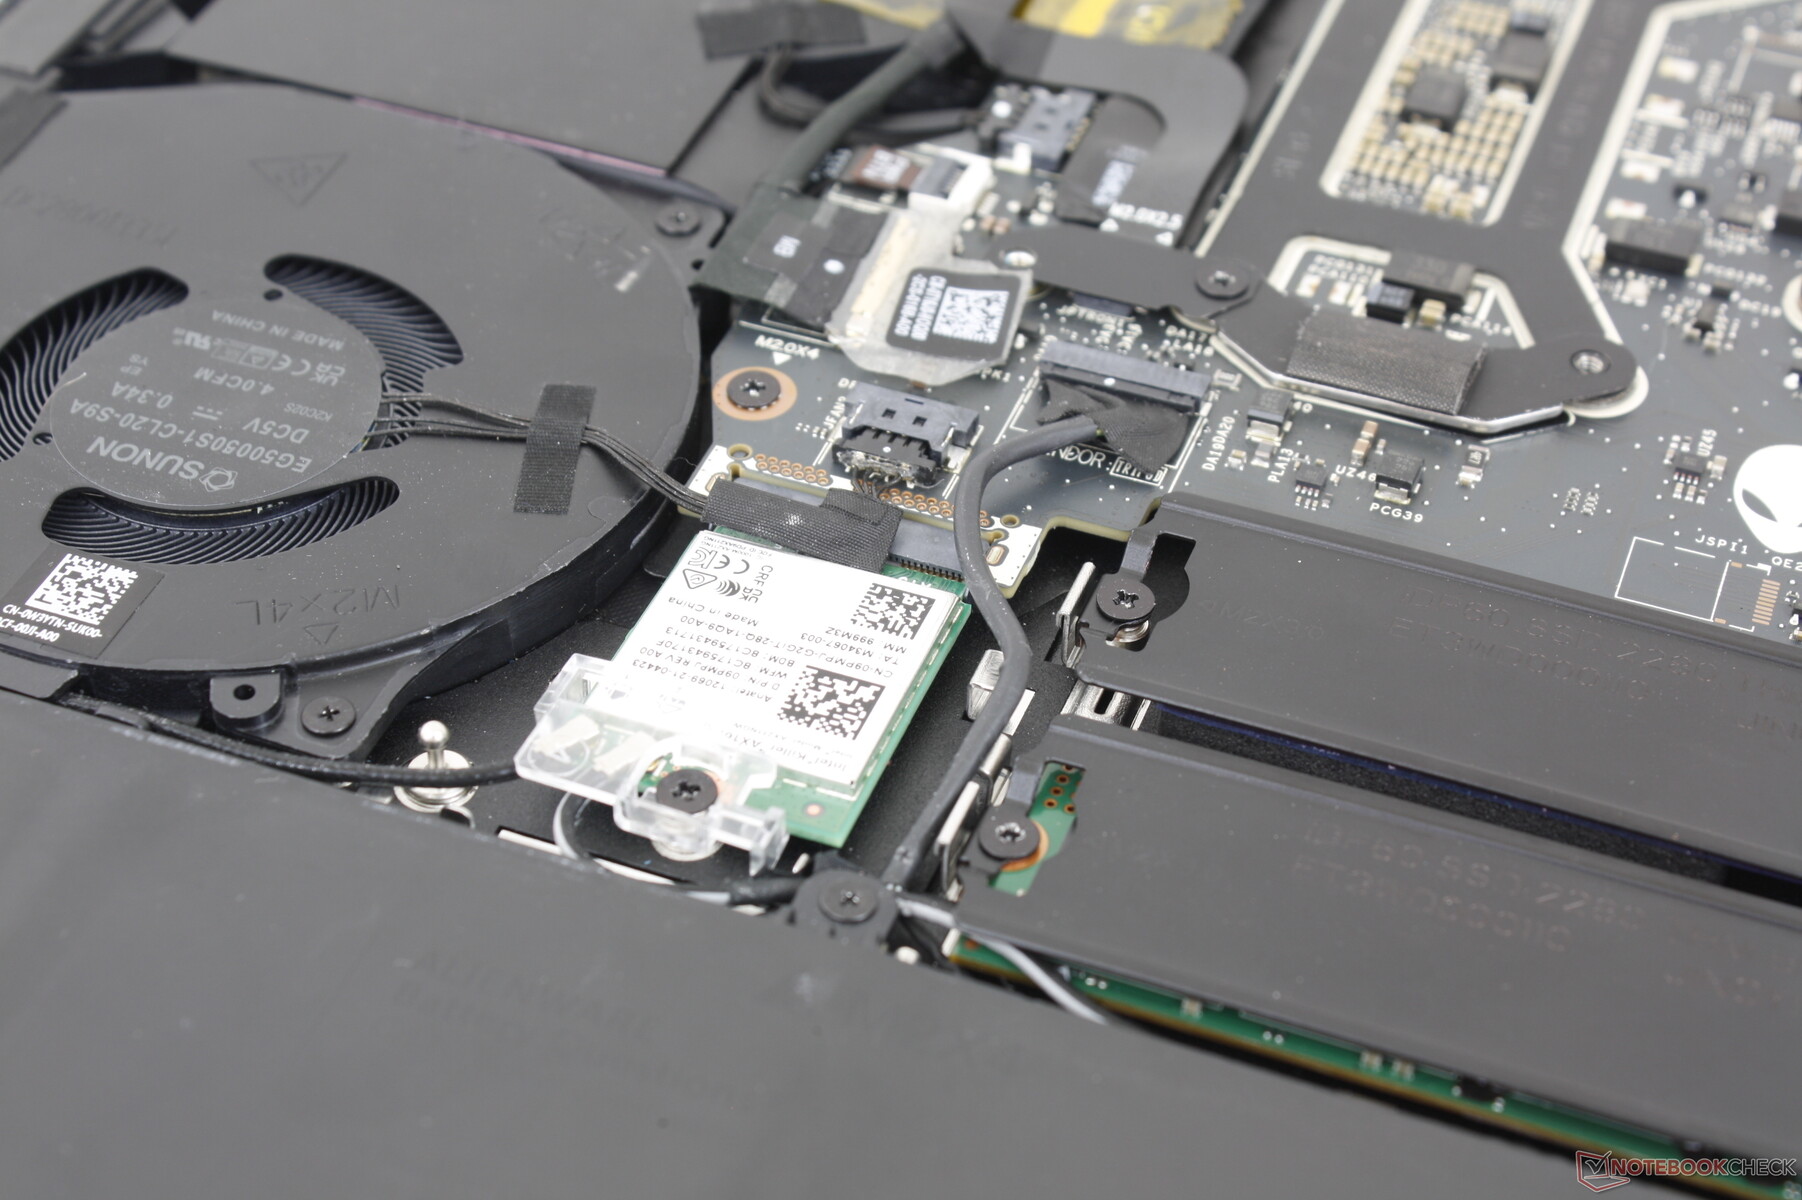
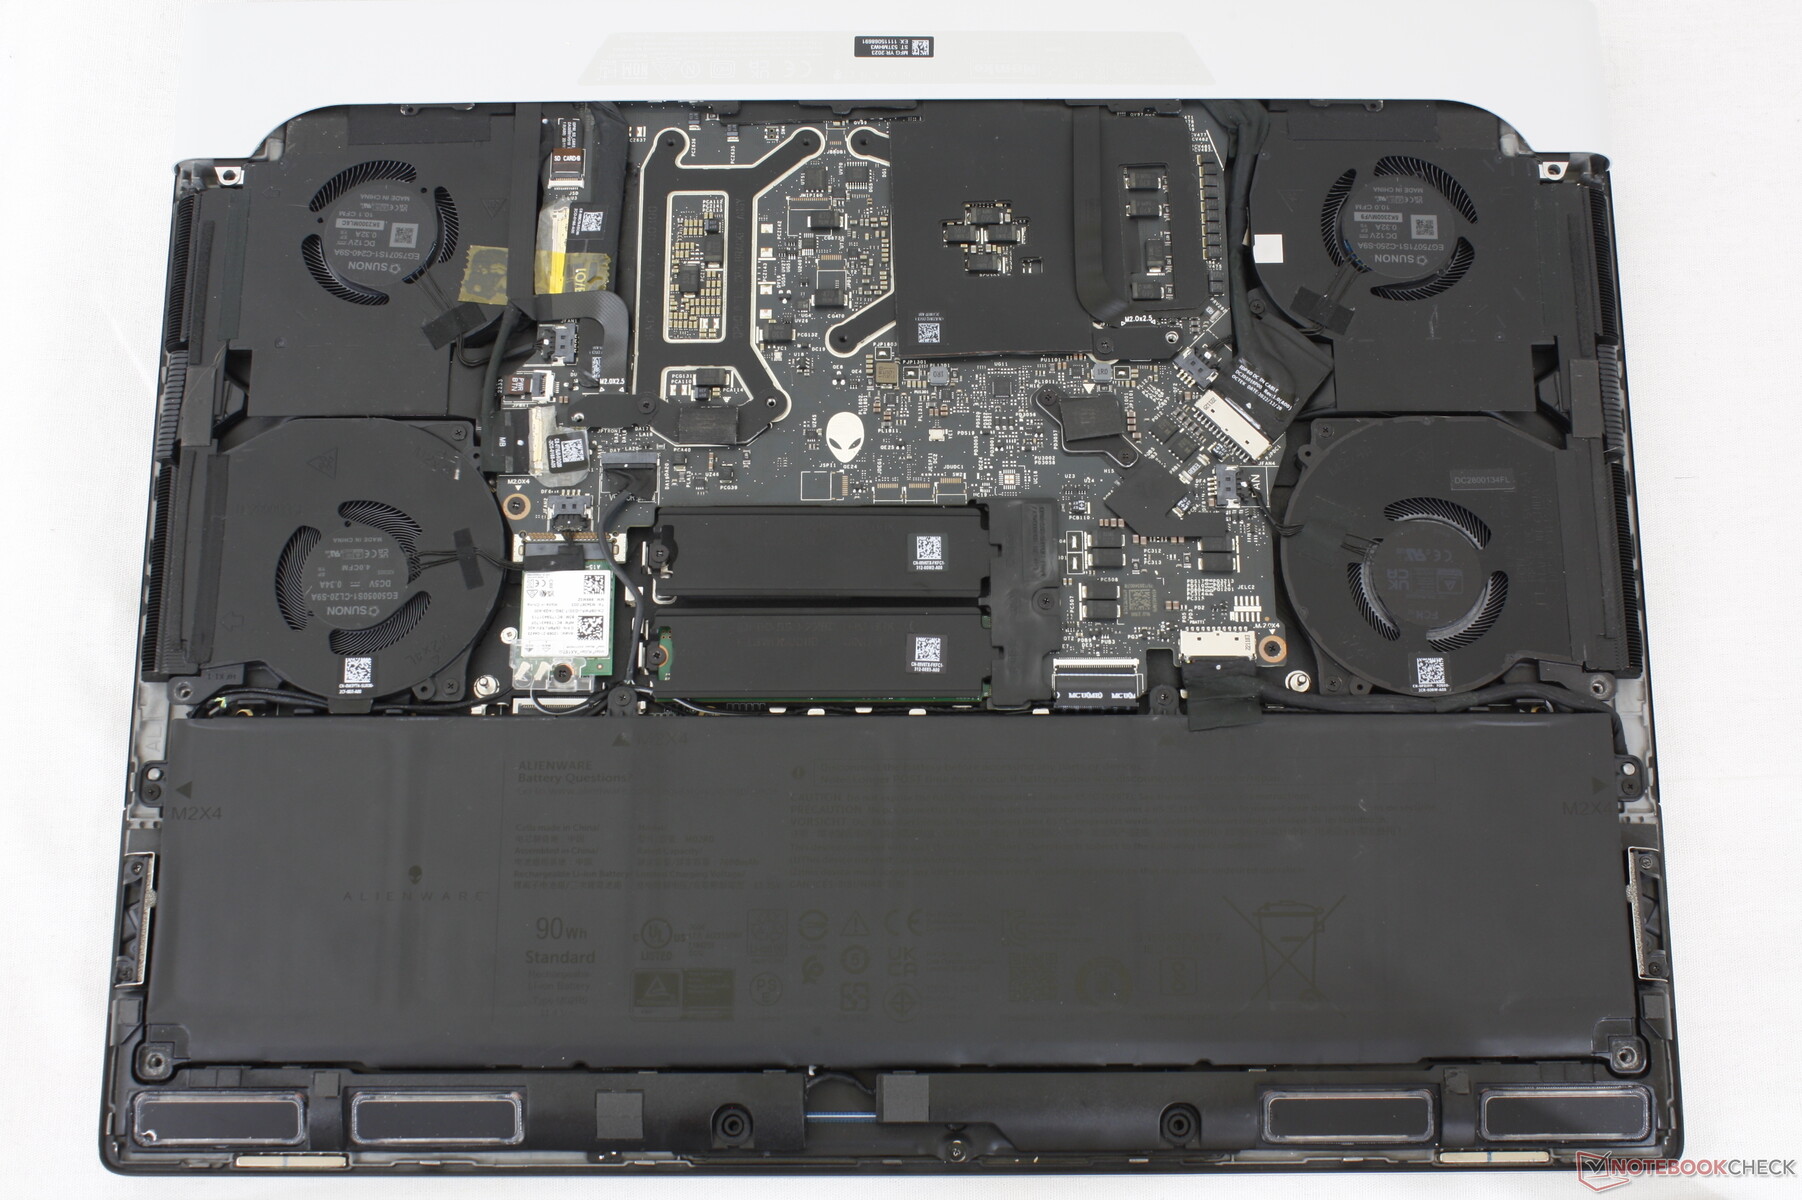
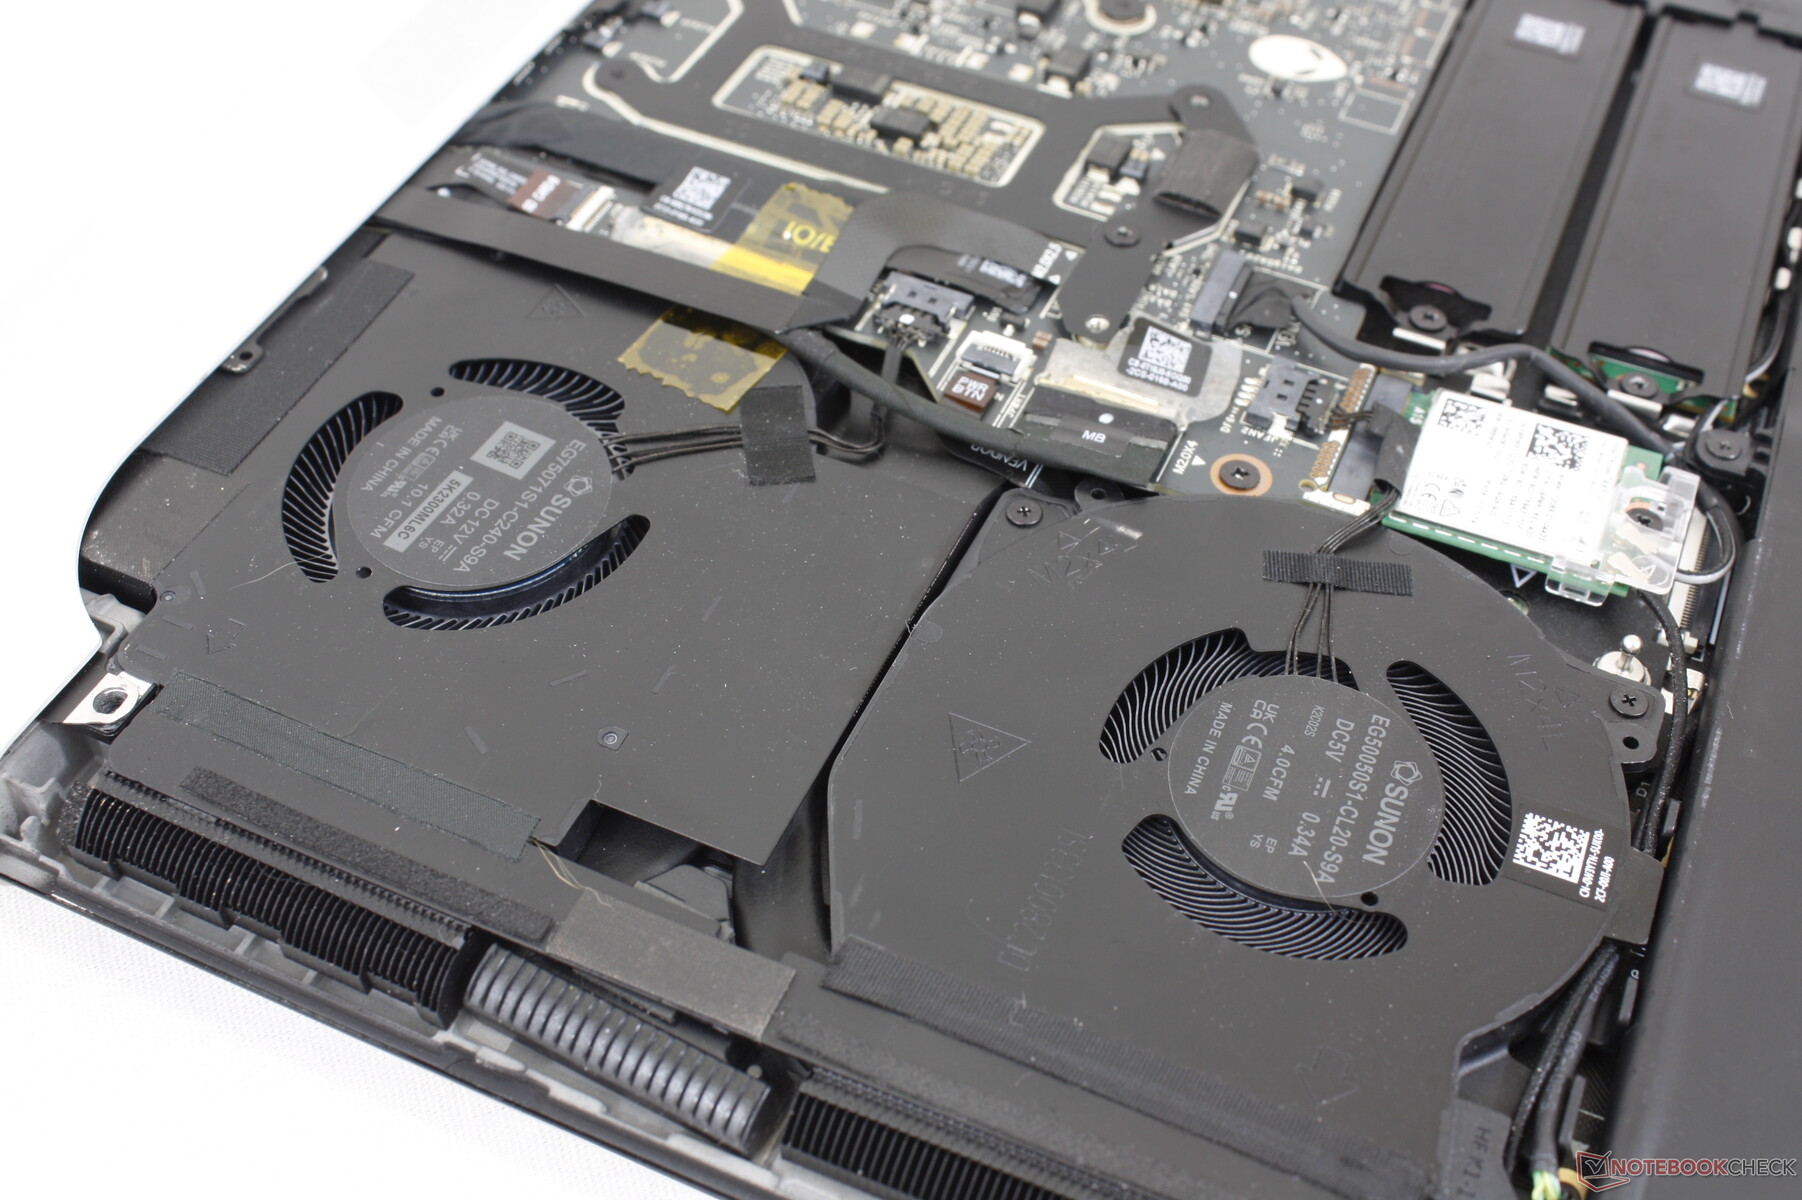
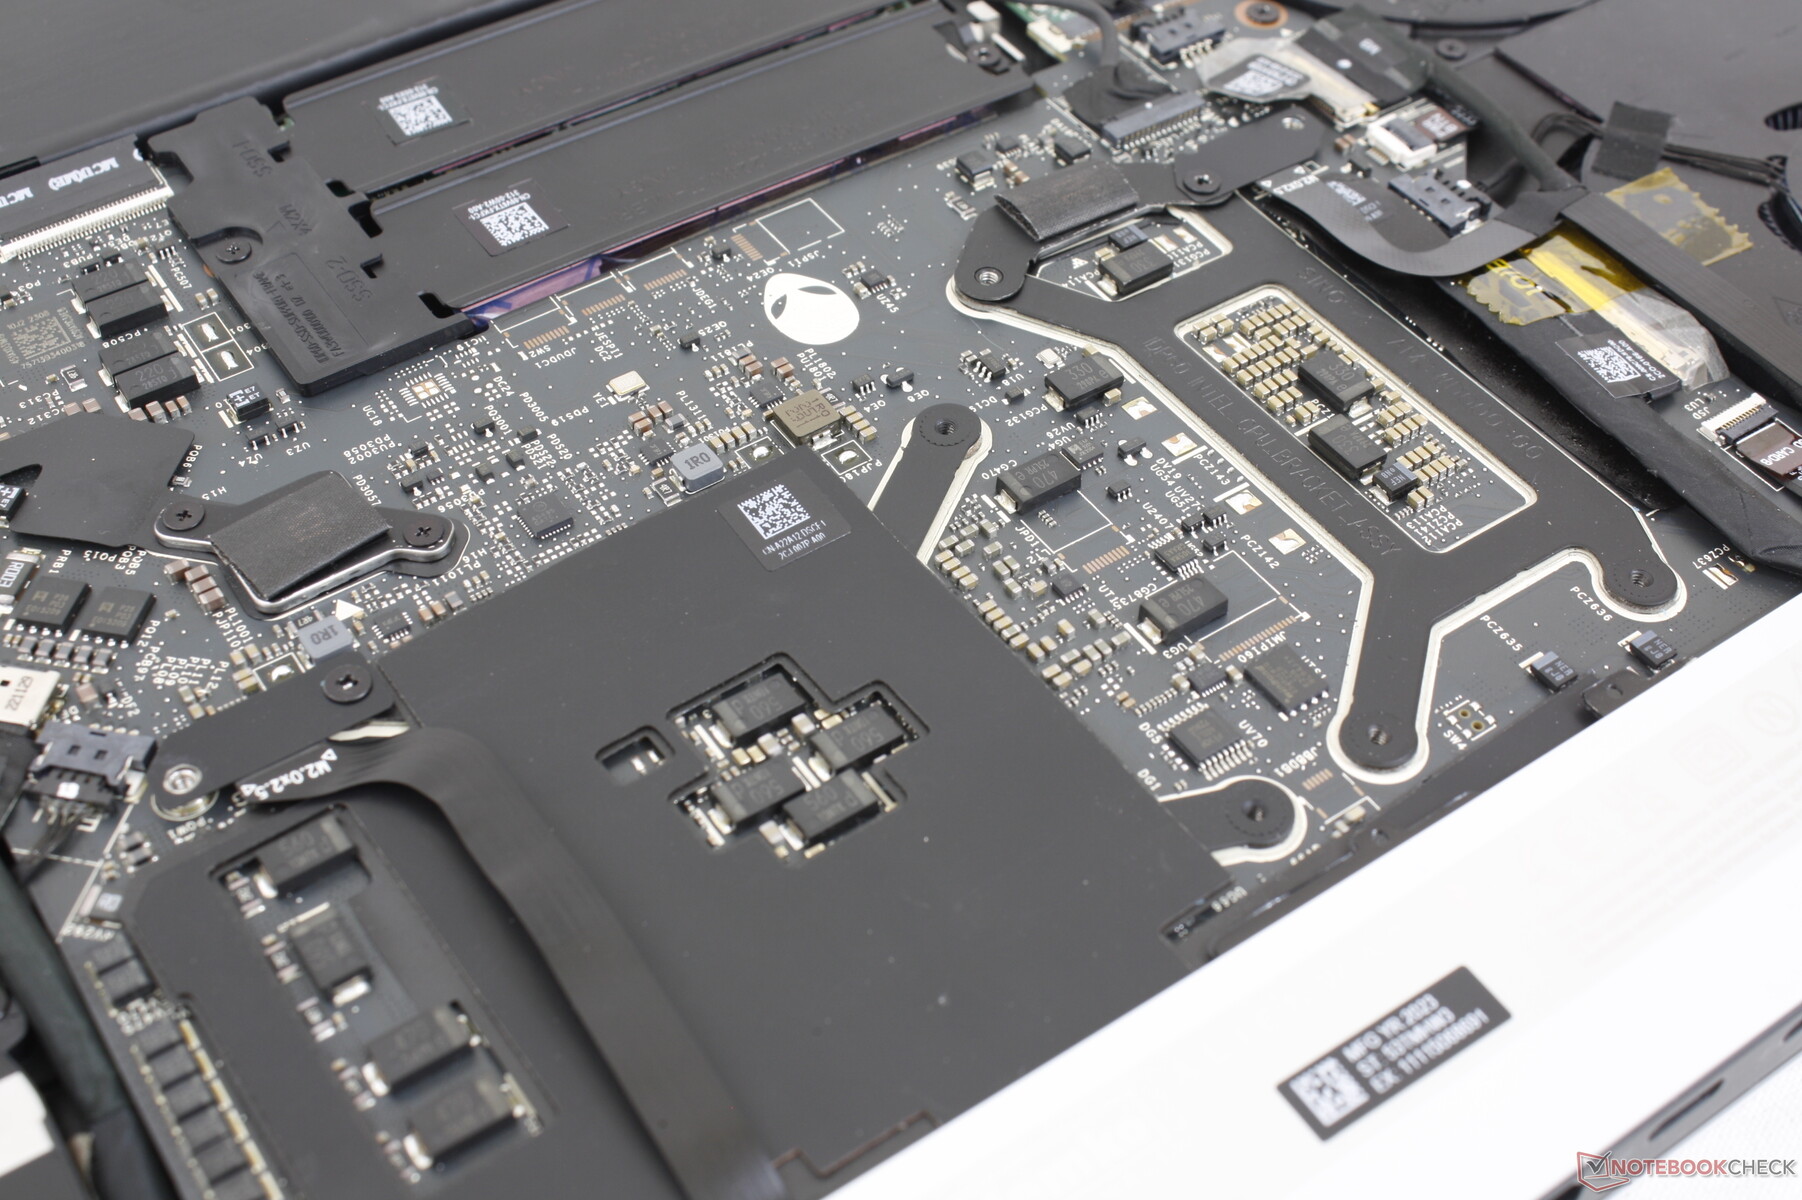
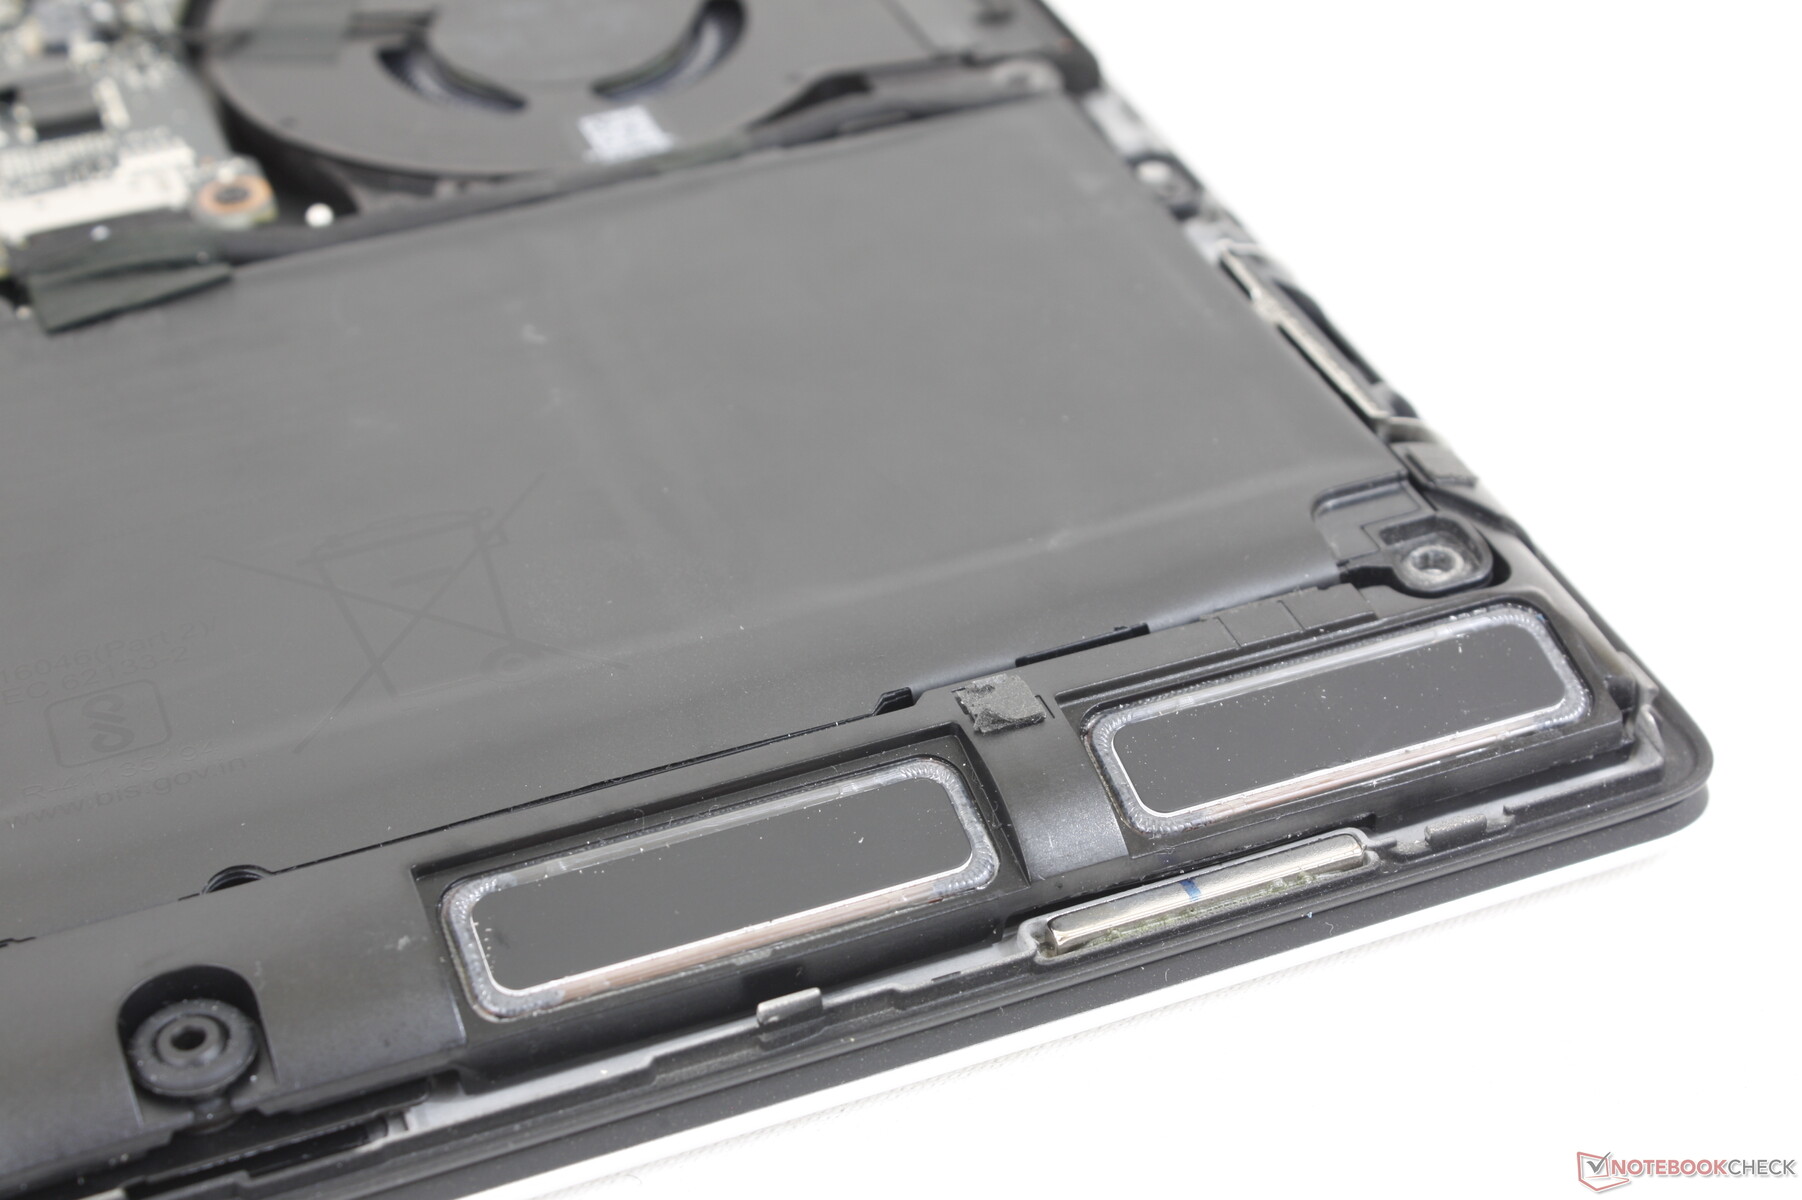
Maintenance
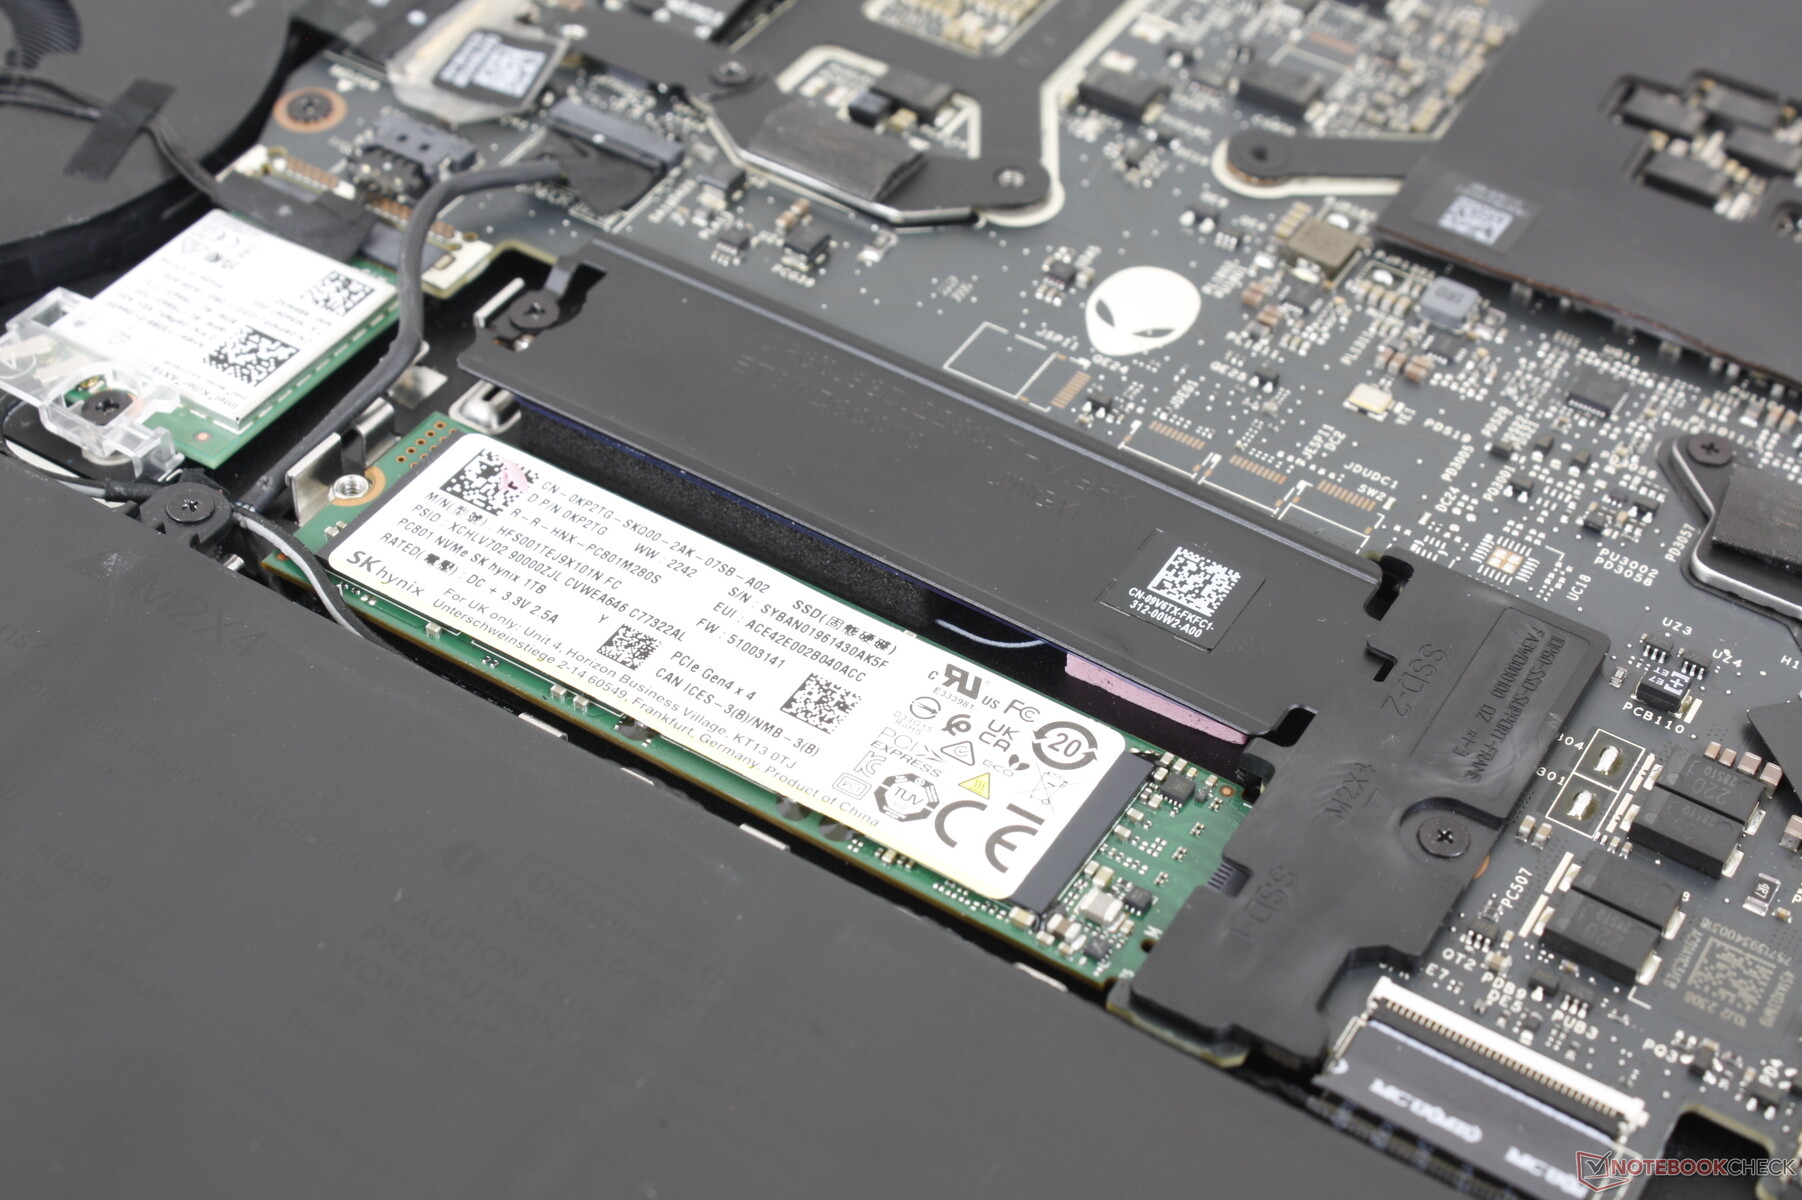
The bottom panel is secured by just six Phillips screws for easy removal. Owners have direct access to two M.2 2280 SSD slots, battery, and the removable WLAN module.
Accessories And Warranty
There are no extras in the box other than the AC adapter and paperwork. The usual one-year limited manufacturer warranty applies if purchased in the US.
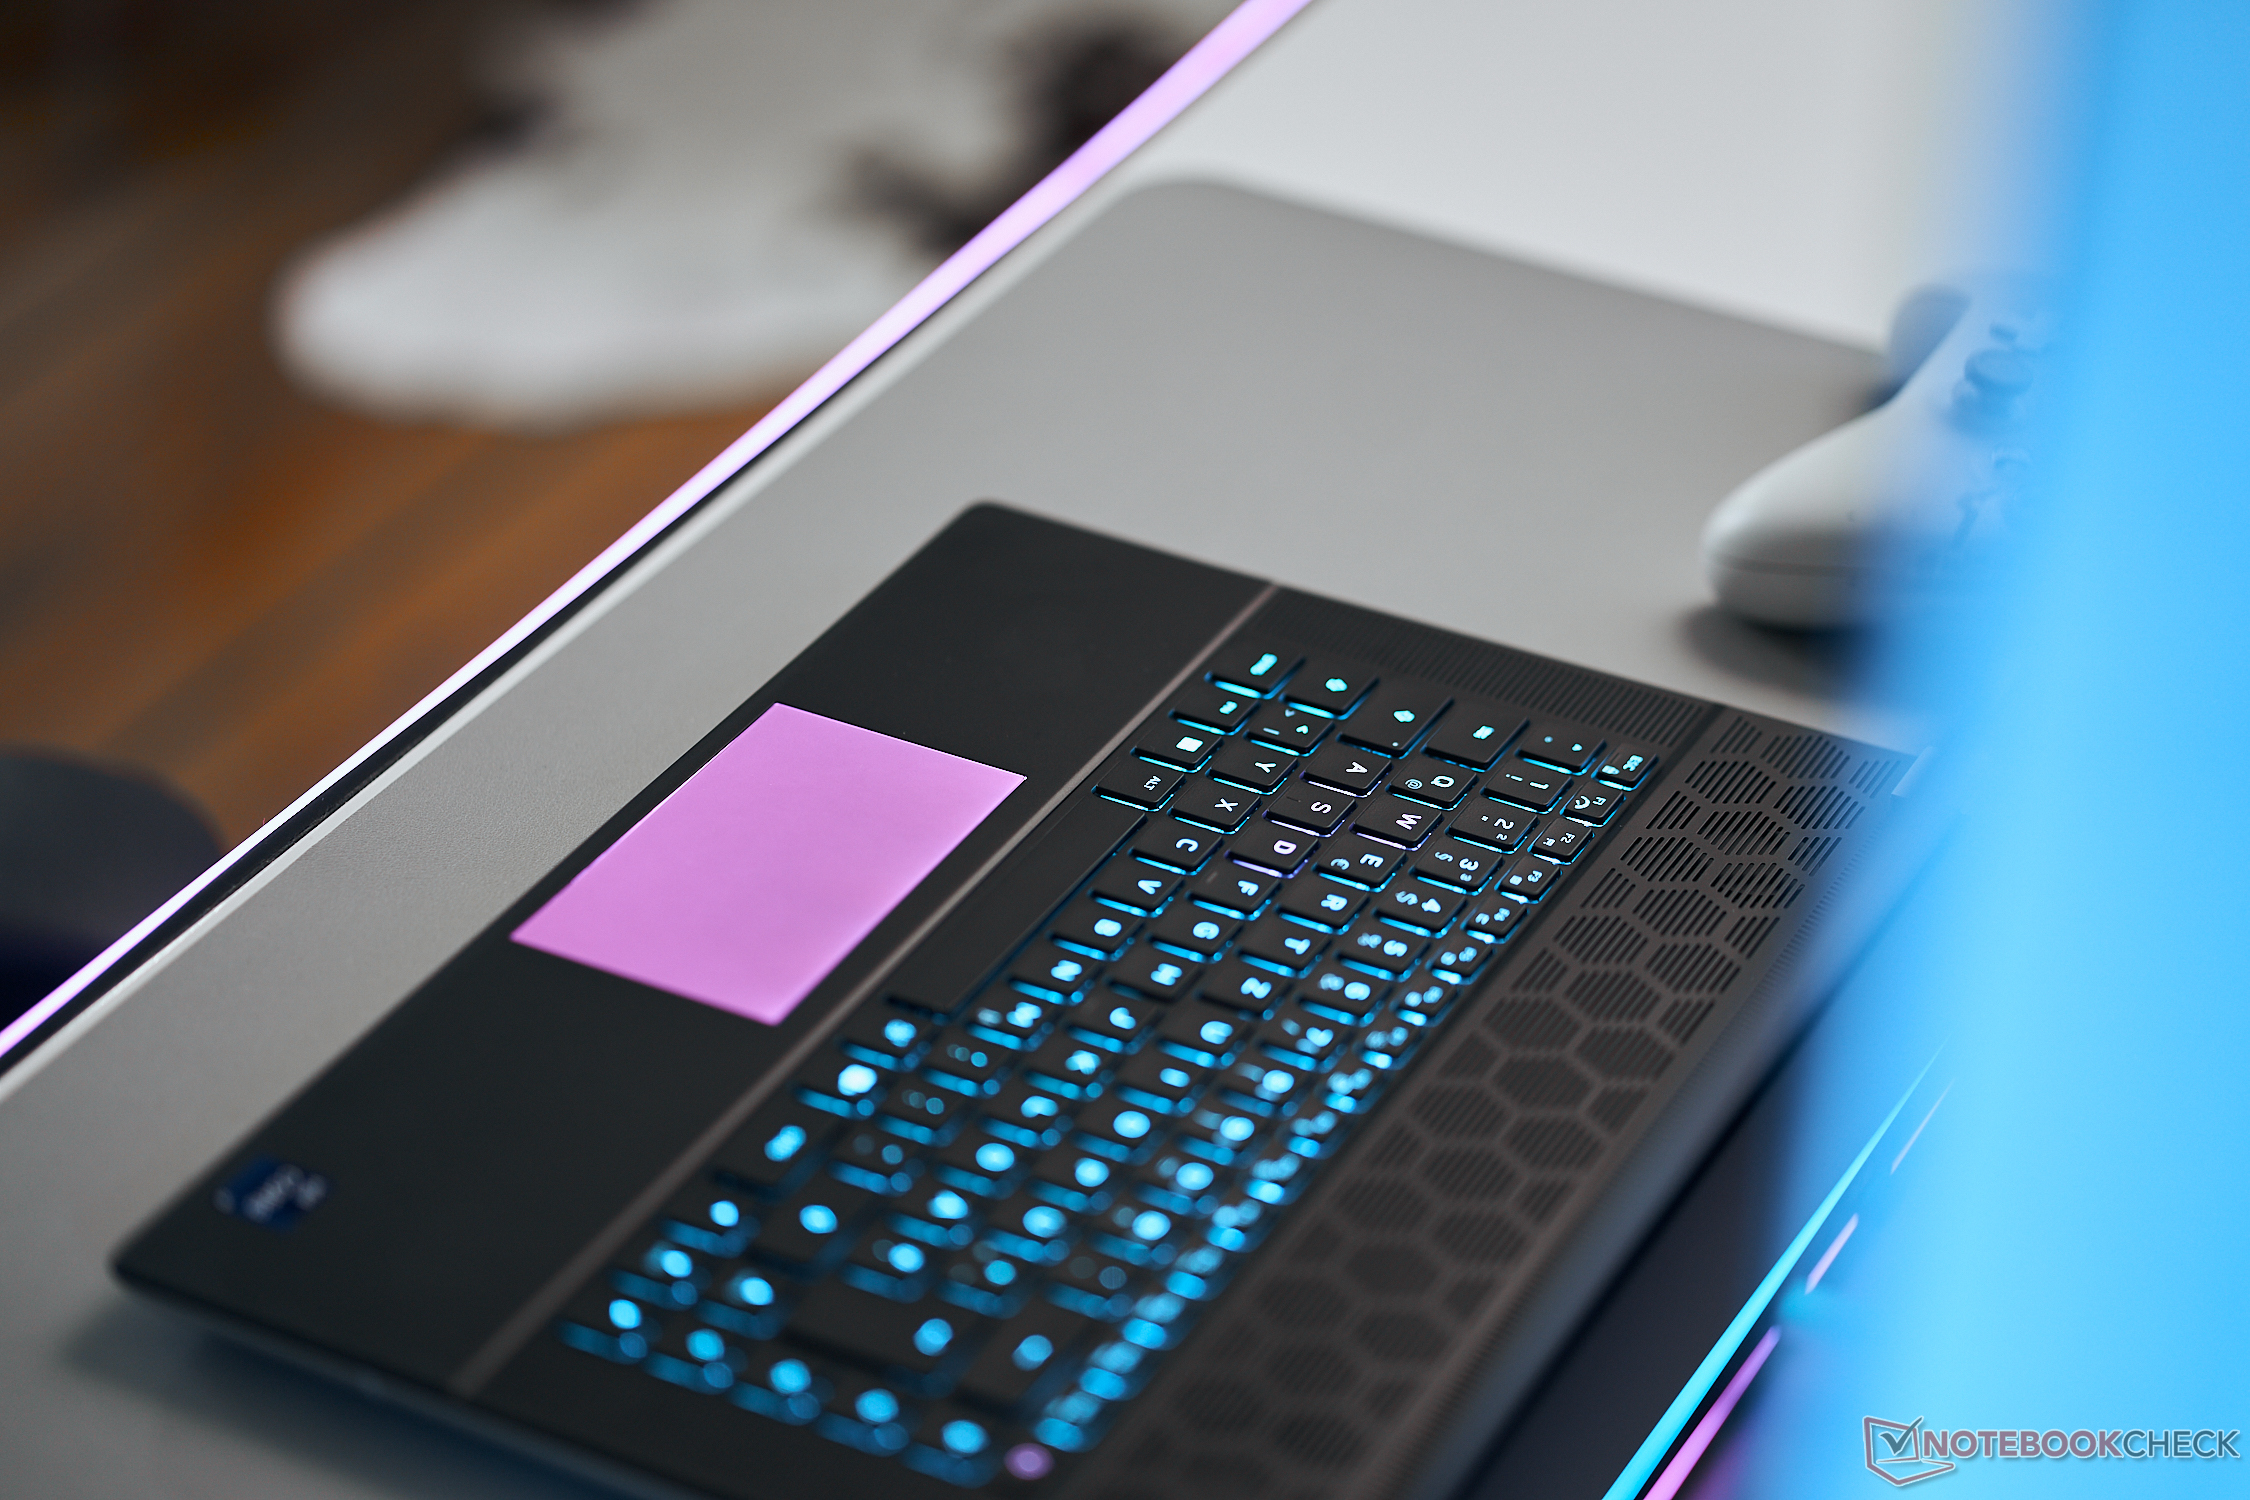
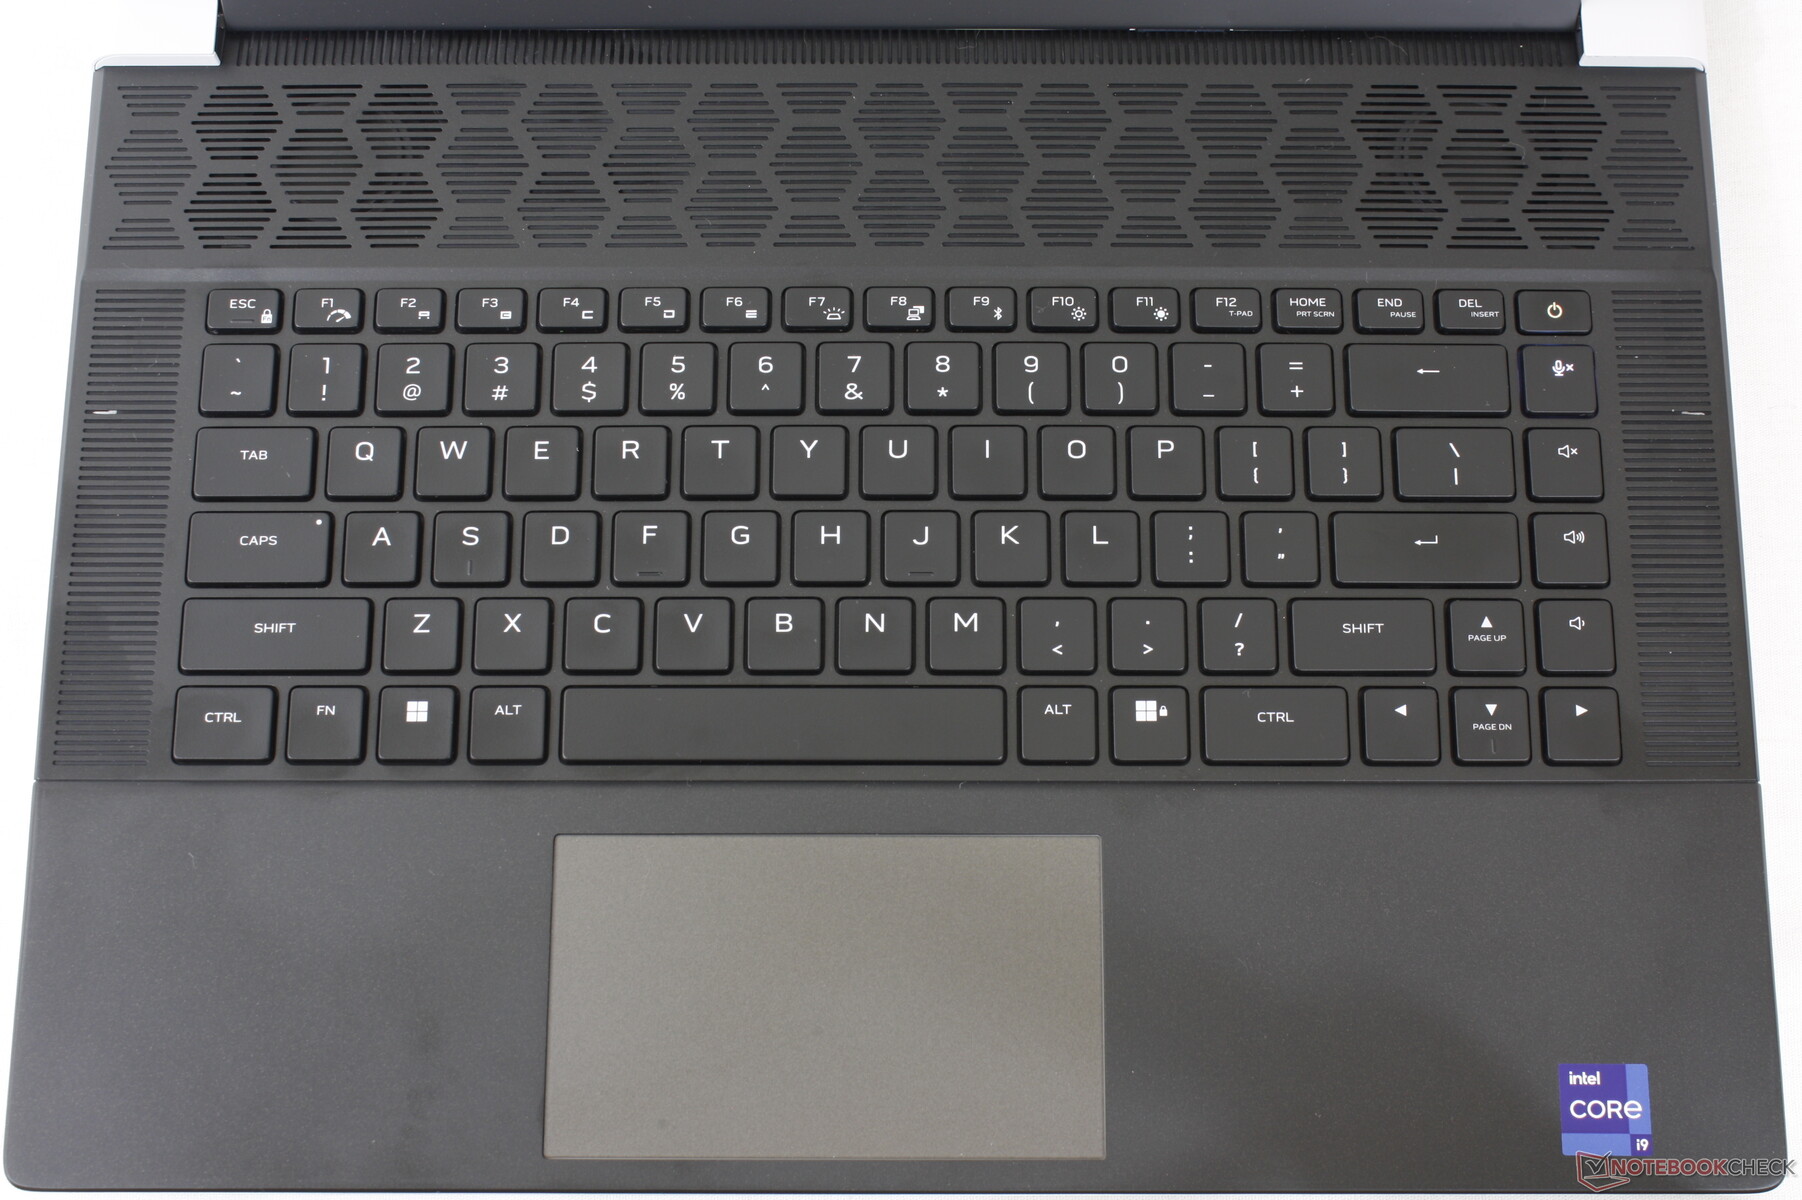
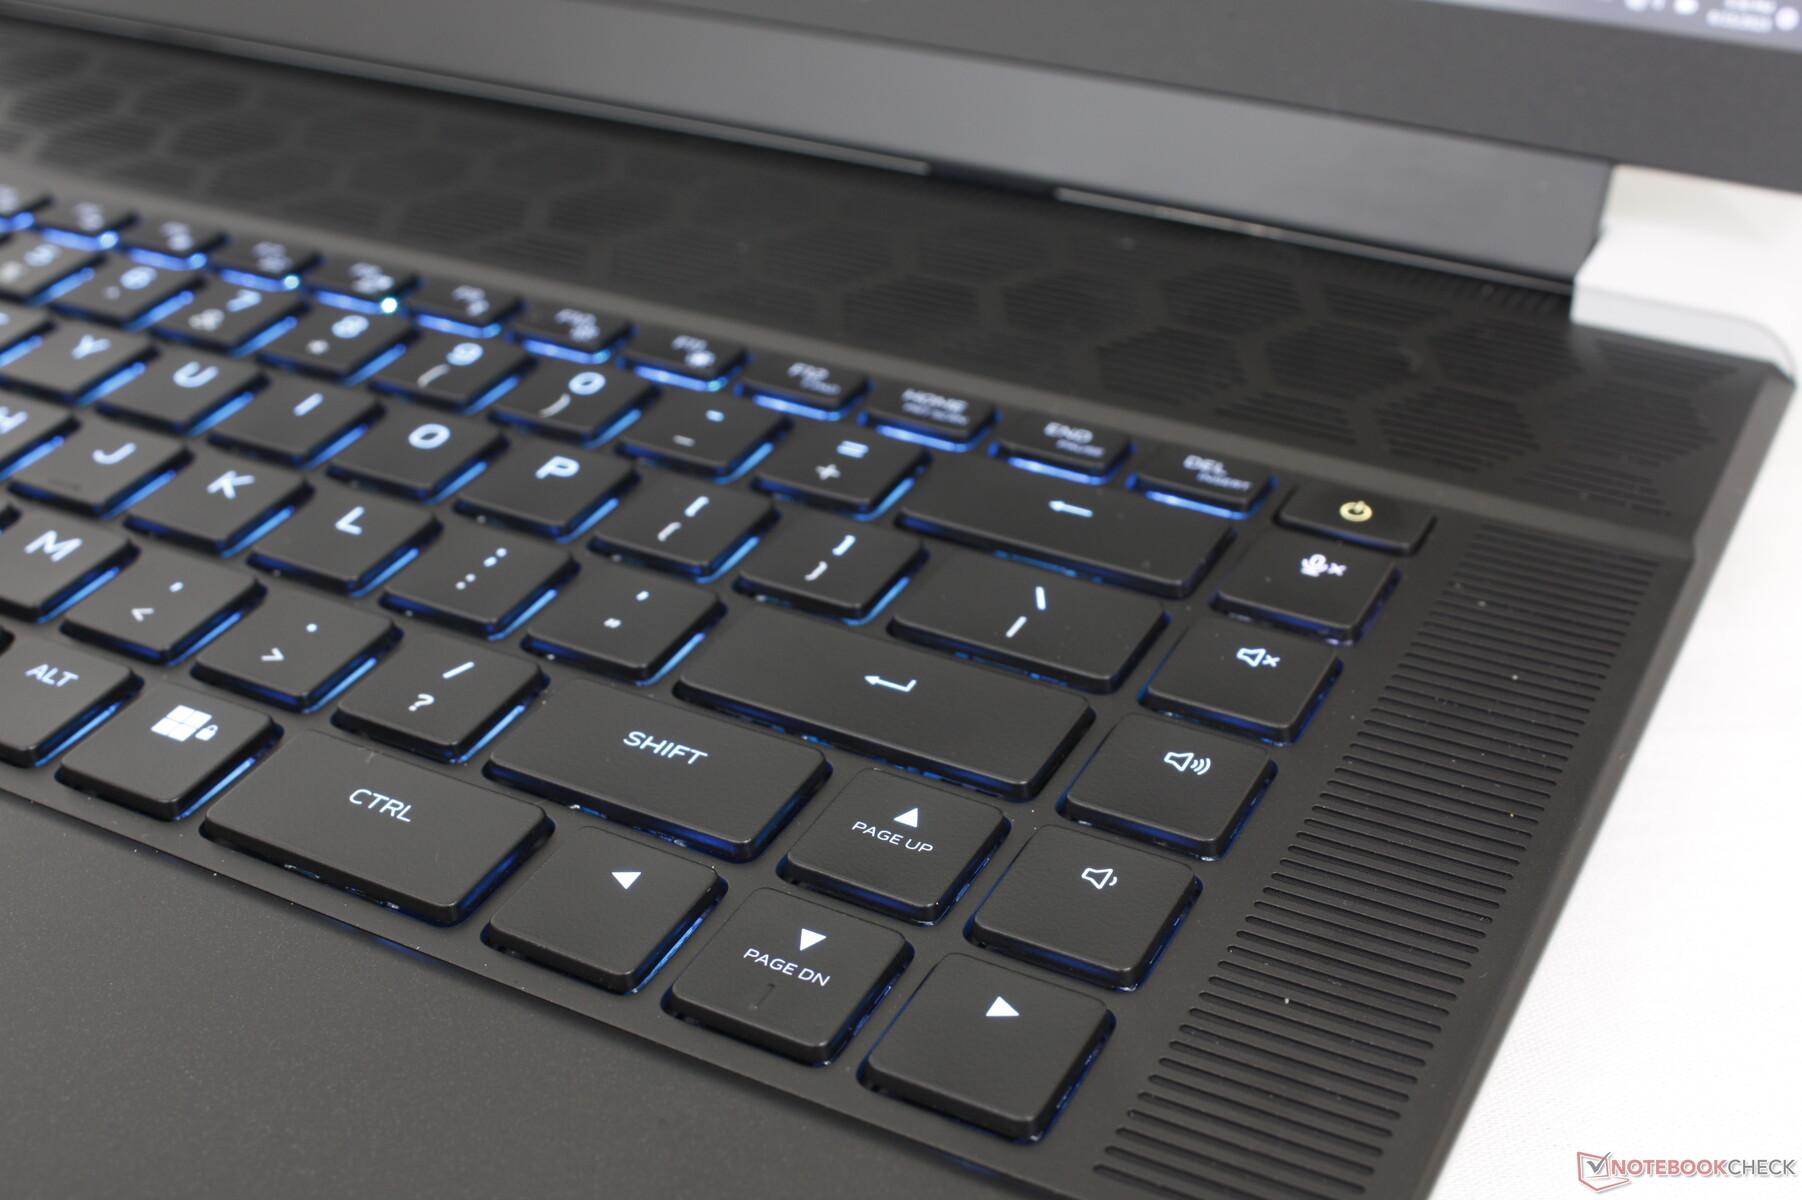
Input Devices — Mechanical Keys Are Loud And Proud
Keyboard
Dell offers two keyboard options: standard membrane-based keys and CherryMX ultra low-profile keys each with per-key RGB lighting. Our test unit comes equipped with the latter and the typing experience is night and day when compared to the membrane-based keys on most other gaming laptops. The 1.8 mm key travel is deeper than the more typical 1.5 mm and feedback is much firmer and clickier for a more satisfying feel. It's difficult to go back to typing on something like the Razer Blade 16 after being accustomed to the CherryMX keys of the Alienware x16.
The main drawback, of course, is the significantly louder clatter of the mechanical keys. Thus, you may want to consider the standard non-mechanical option if you intend to use the laptop in noise-sensitive environments like classrooms or tight dorm rooms.
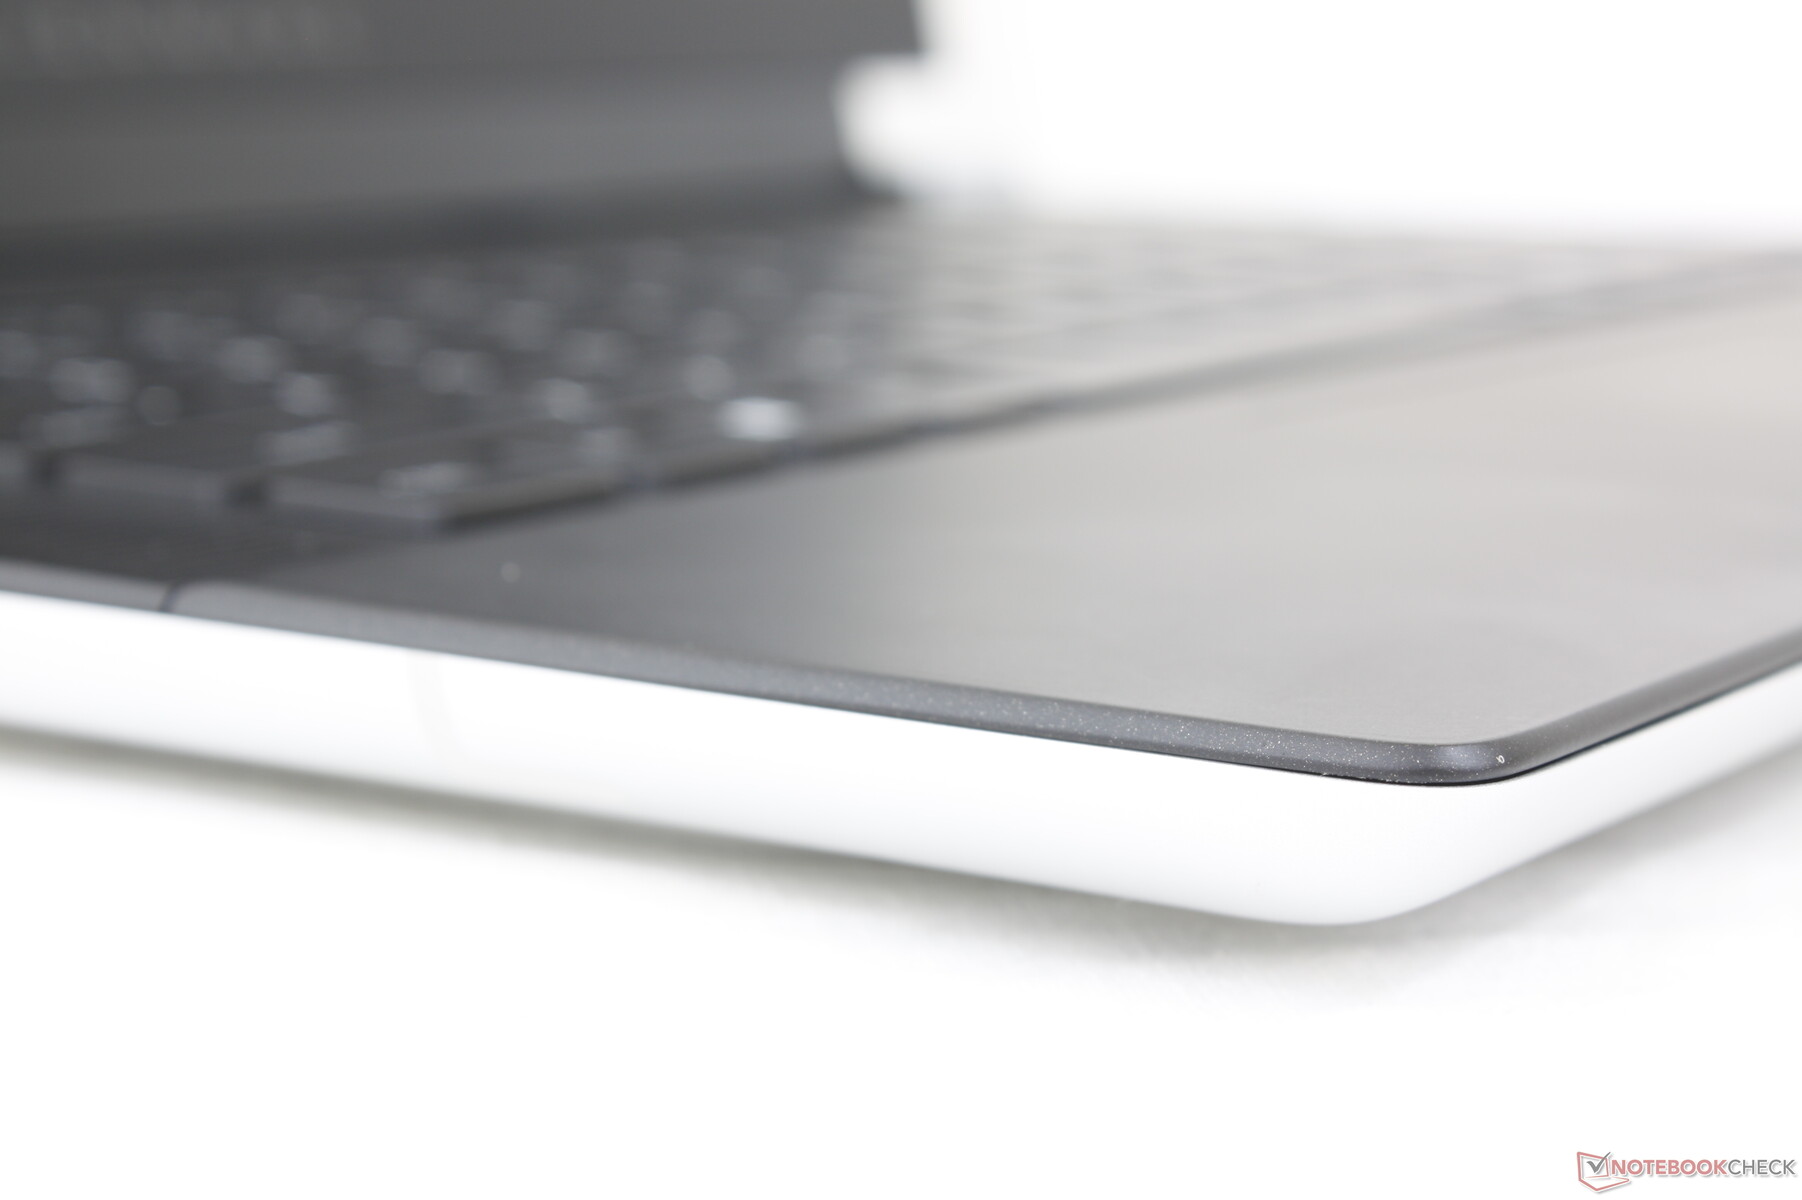
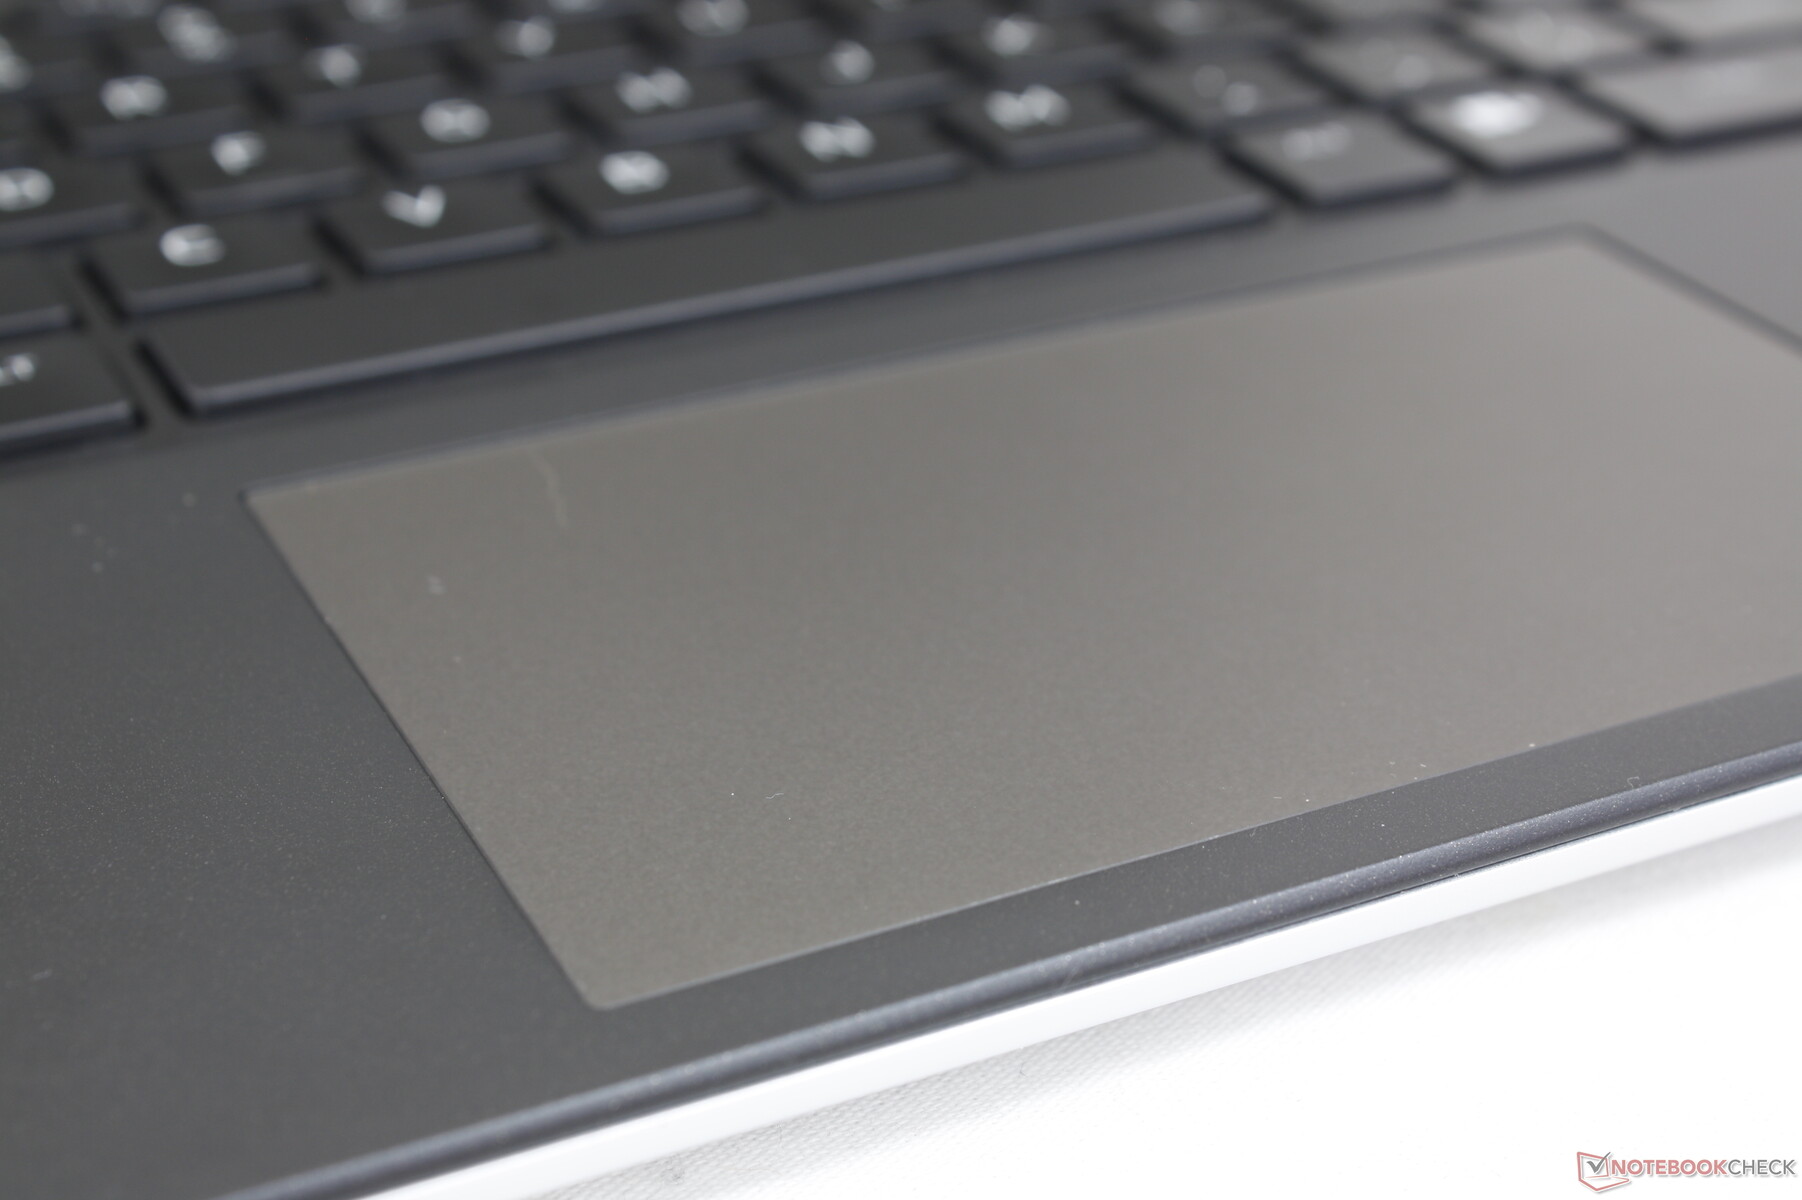
Touchpad
The clickpad is one of the smallest for a 16-inch gaming laptop at just 11.2 x 6.5 cm compared to 17 x 9.7 cm and 12 x 7.5 cm on the Blade 16 and Legion Pro 5 16, respectively. The smaller size is due to the large cooling solution and ventilation grilles occupying more space along the back half of the system. Gliding is smooth with only slight sticking when moving at slower speeds for more accurate clicks.
Feedback when clicking is light and very shallow for an unsatisfying feel. Based on this and the small surface area, it's clear that Dell is expecting most users to have a USB mouse ready to go.

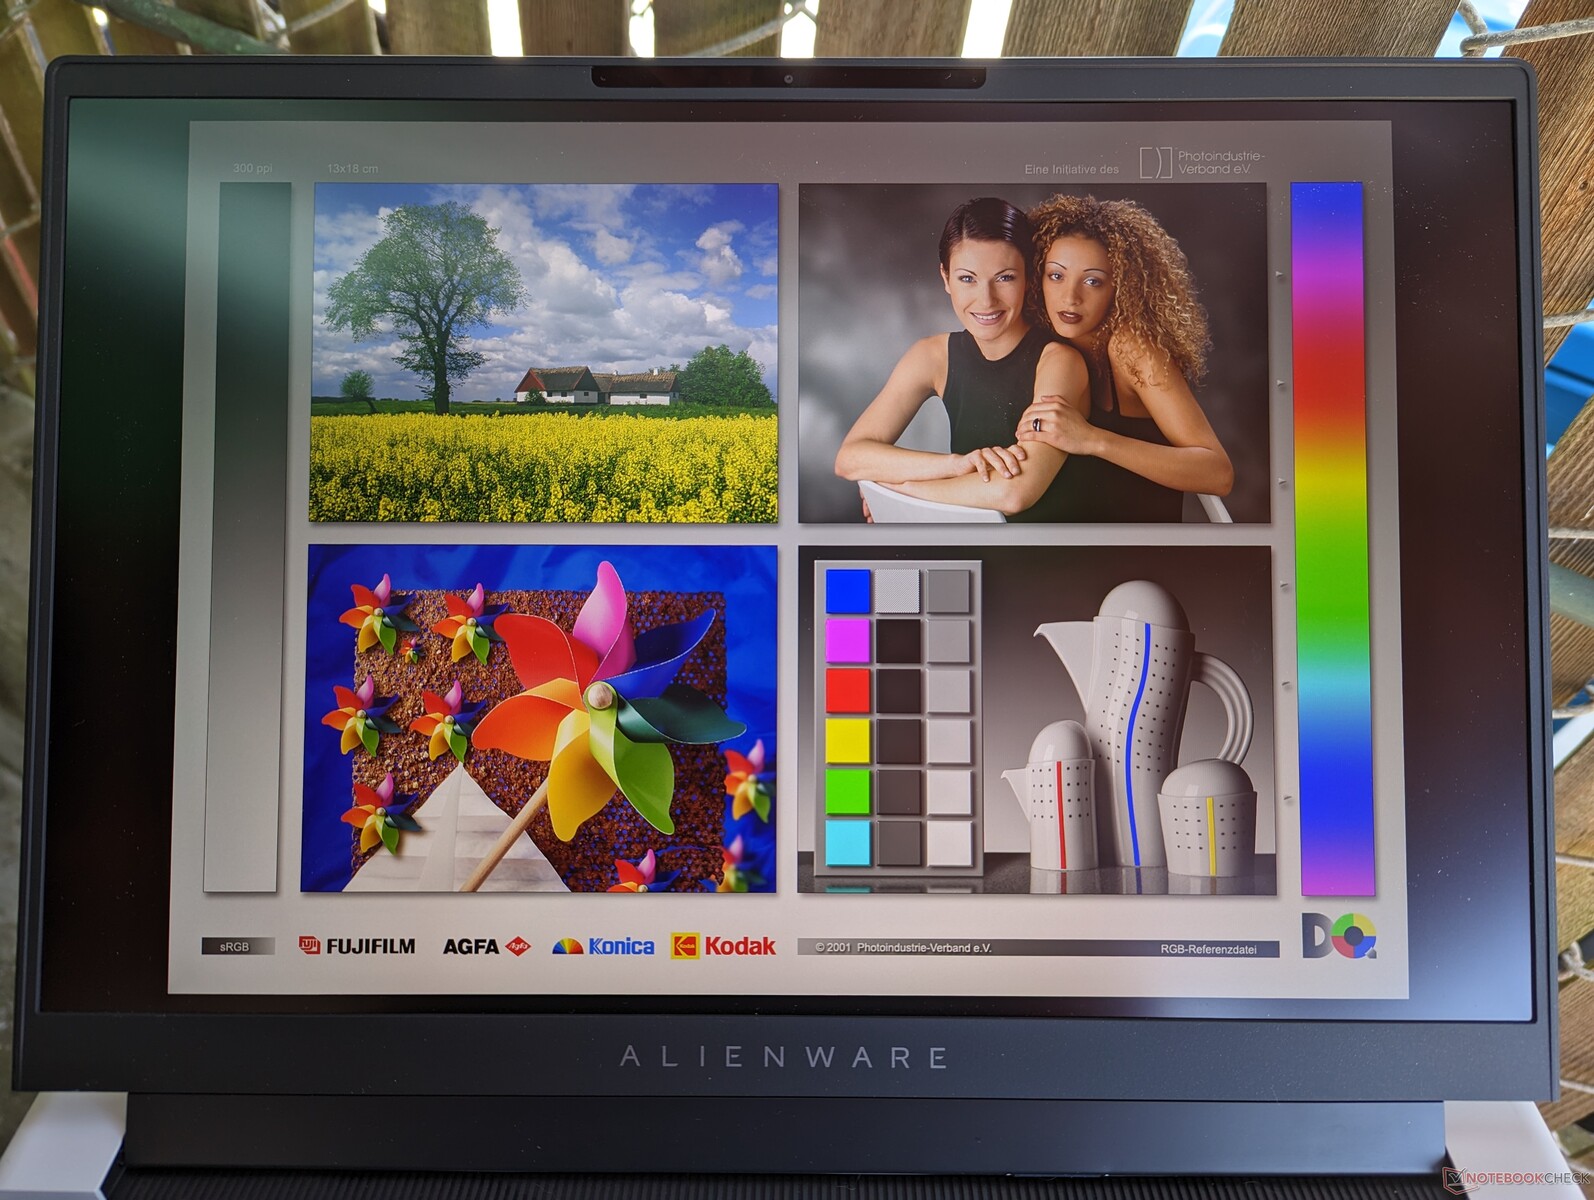
Display — No Bad Option
Three display options are available and our measurements reflect only the option in bold:
- 2560 x 1600, 165 Hz, 3 ms, 100% sRGB, G-Sync
- 1920 x 1200, 480 Hz, 3 ms, 100% DCI-P3, G-Sync
- 2560 x 1600, 240 Hz, 3 ms, 100% DCI-P3, G-Sync
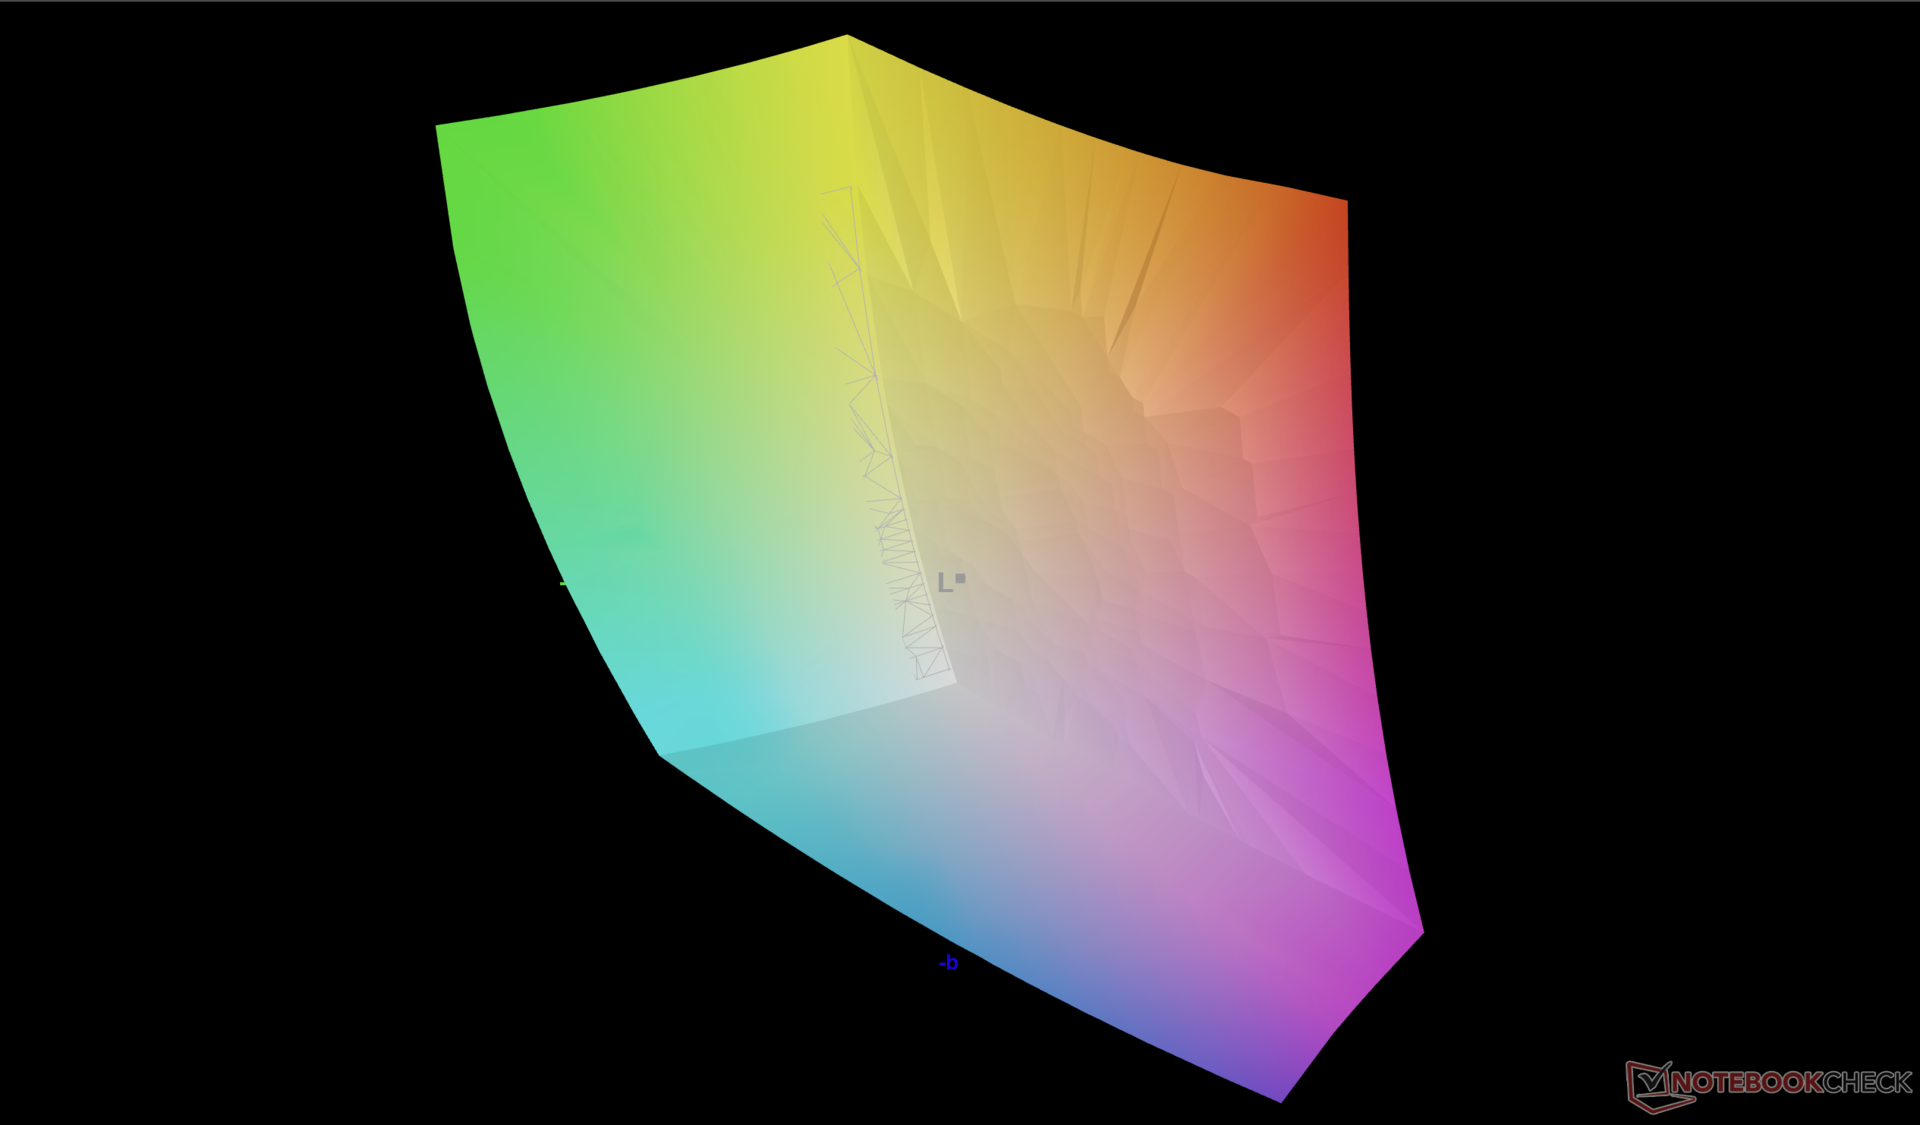
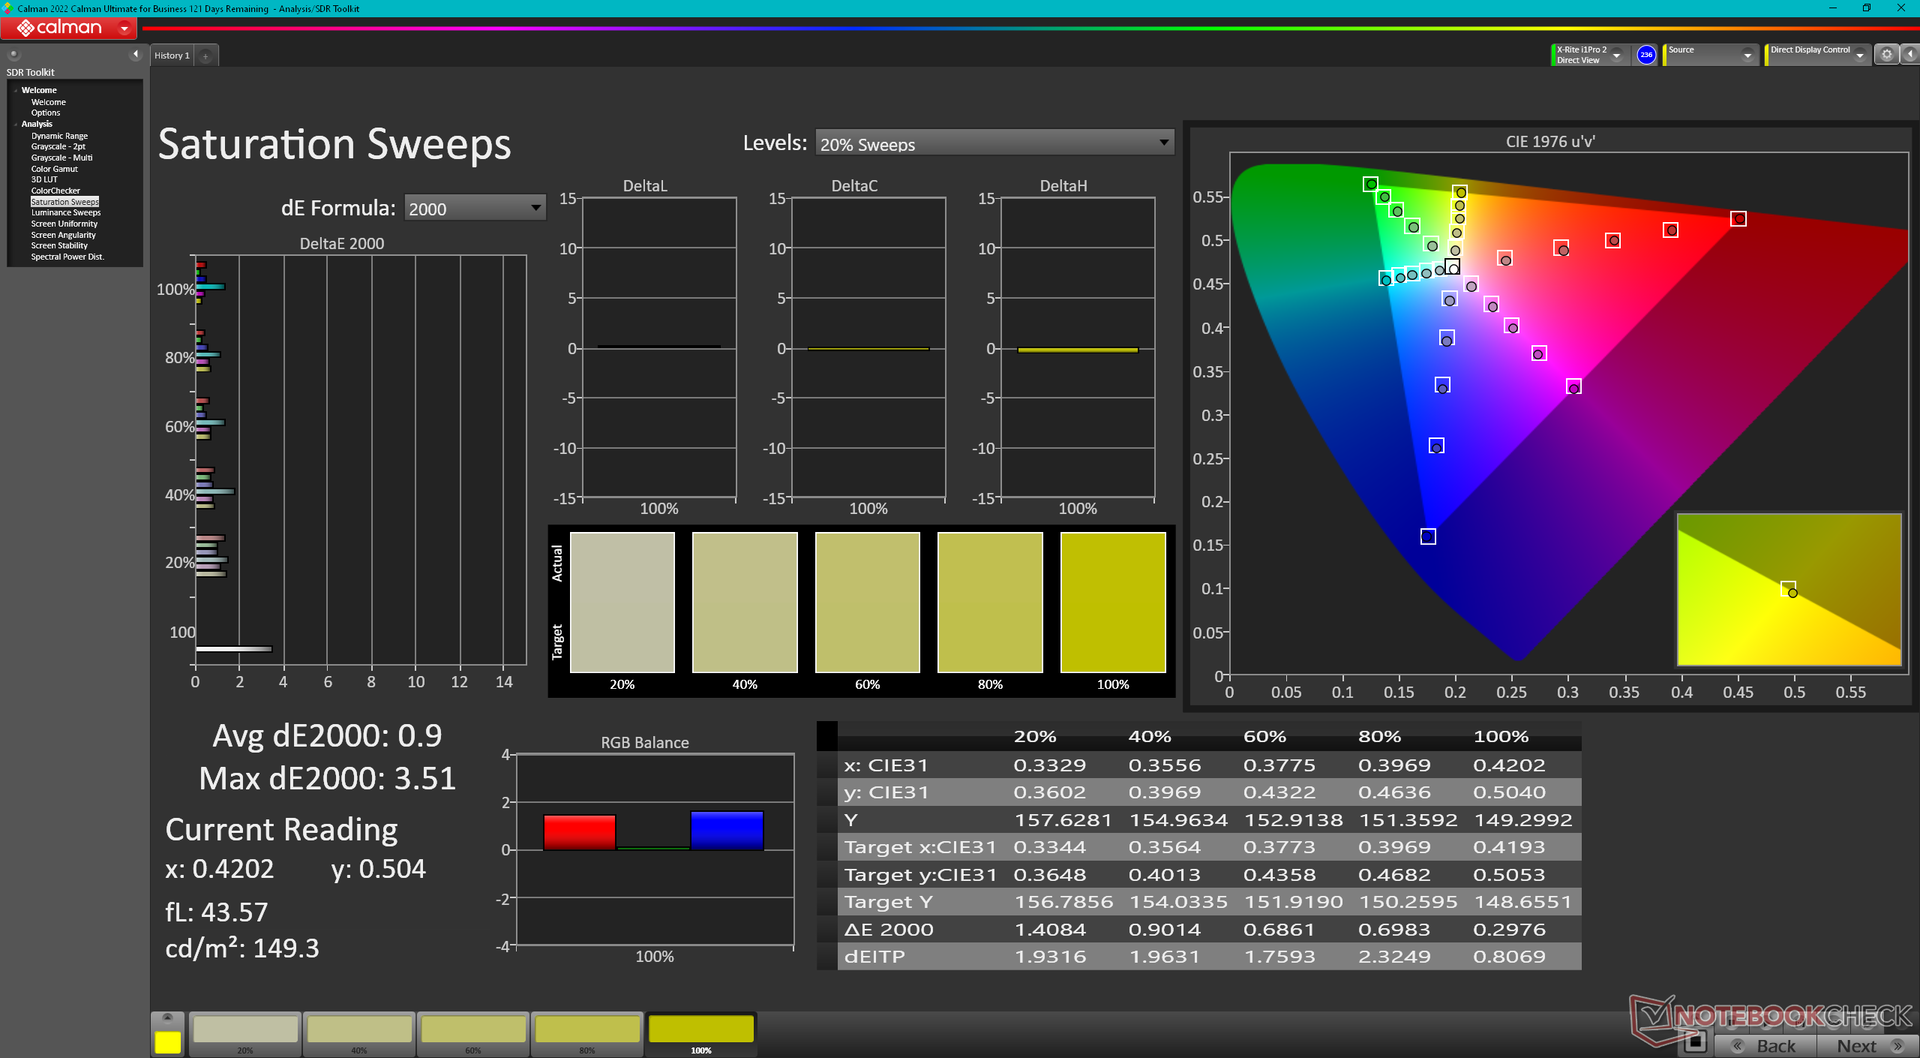
There is certainly no bad or "wrong" panel since all panels are fit for gaming purposes with their fast refresh rates and fast response times. With that said, our configured 1600p240 panel is the sweet spot for most users as the 1200p480 option sacrifices resolution and the 1600p165 option has shallower colors. The viewing experience is comparable to the Blade 16 while being better than the Dell G16 and Lenovo Legion Pro 7 16 in terms of color range.
| |||||||||||||||||||||||||
Brightness Distribution: 89 %
Center on Battery: 302.2 cd/m²
Contrast: 1162:1 (Black: 0.26 cd/m²)
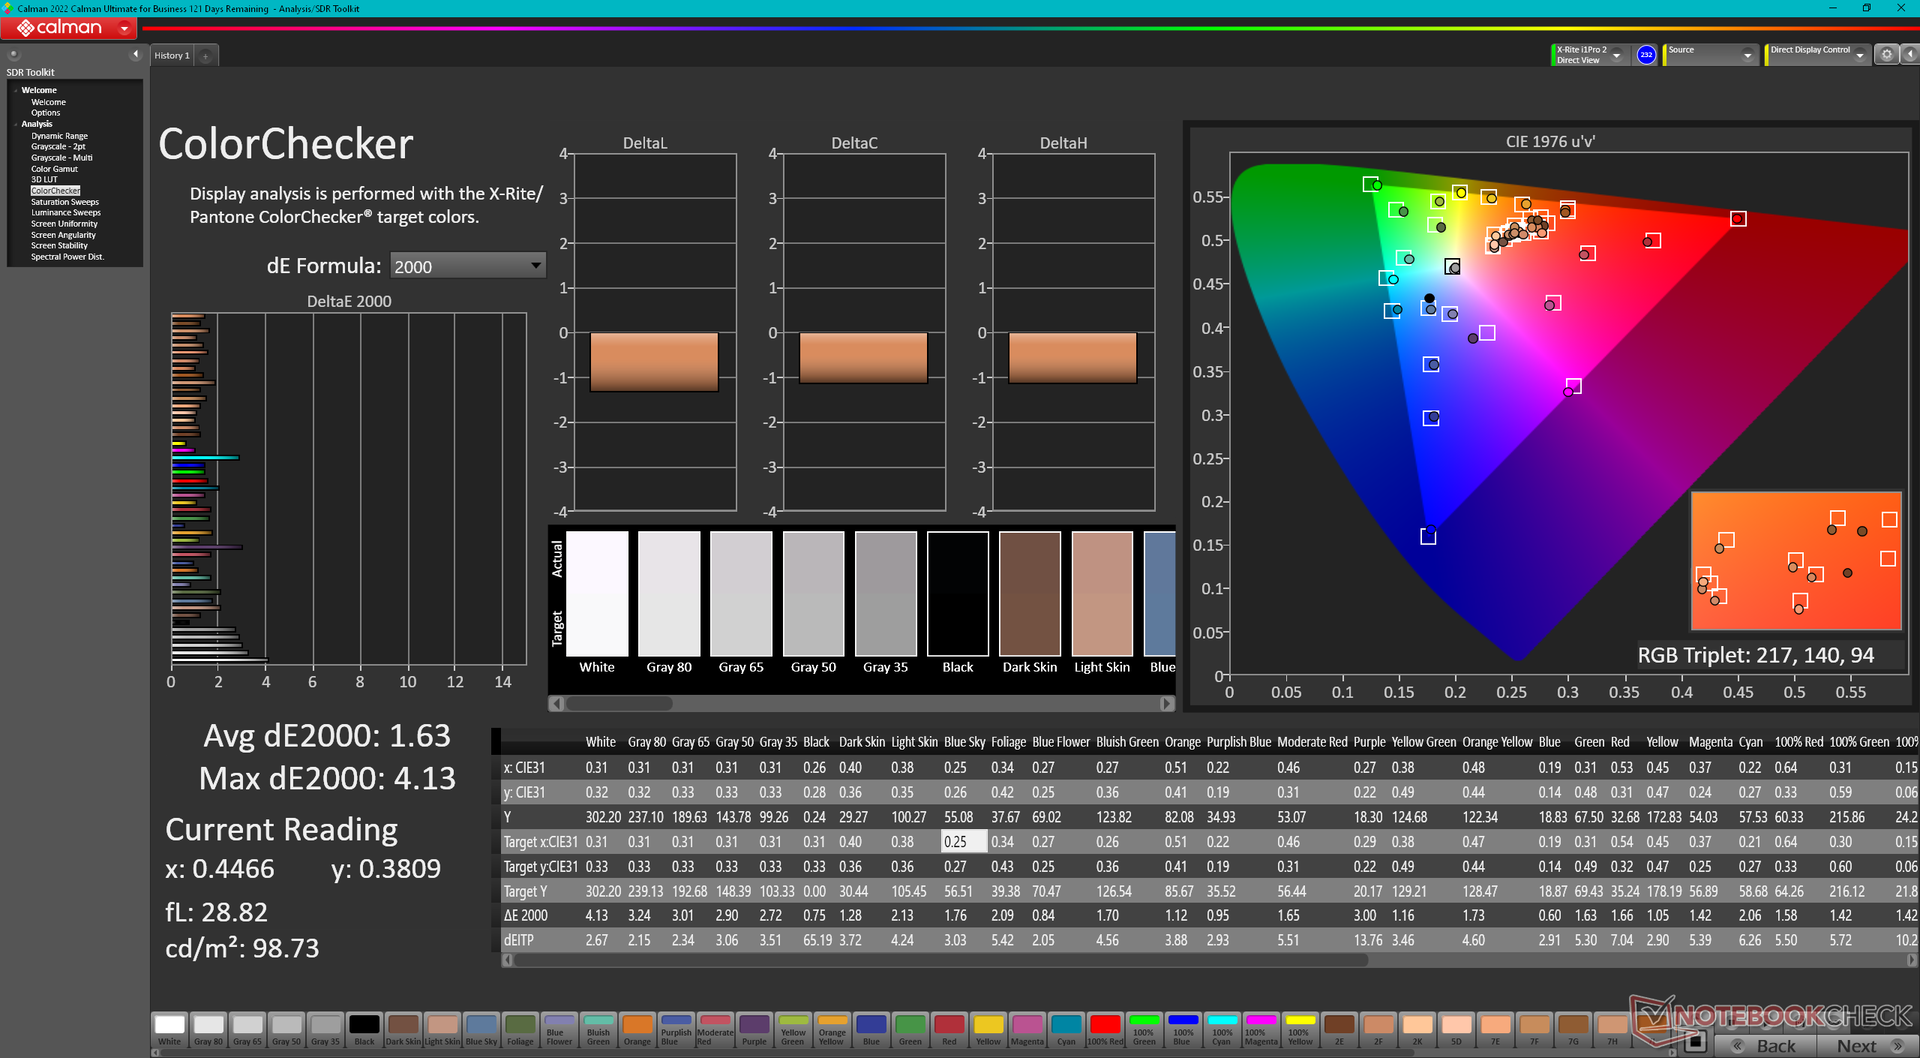
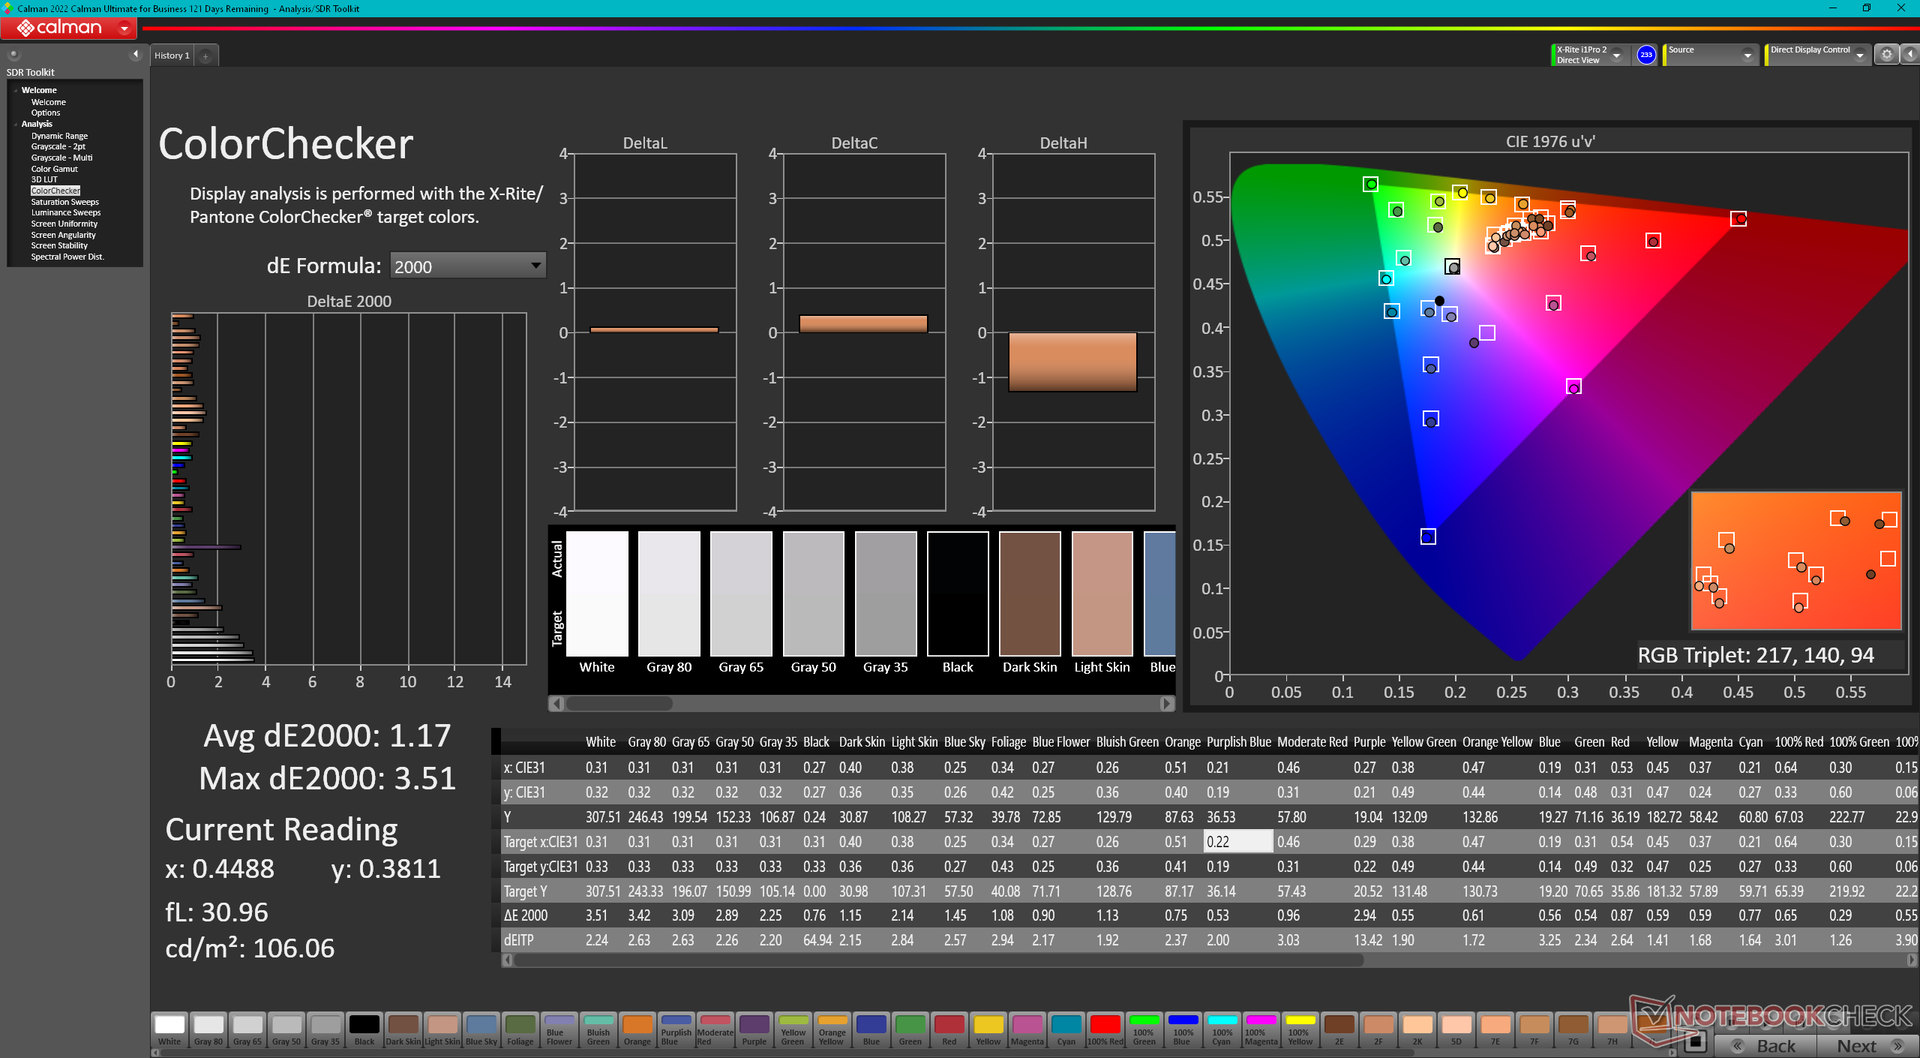
ΔE ColorChecker Calman: 1.63 | ∀{0.5-29.43 Ø4.71}
calibrated: 1.17
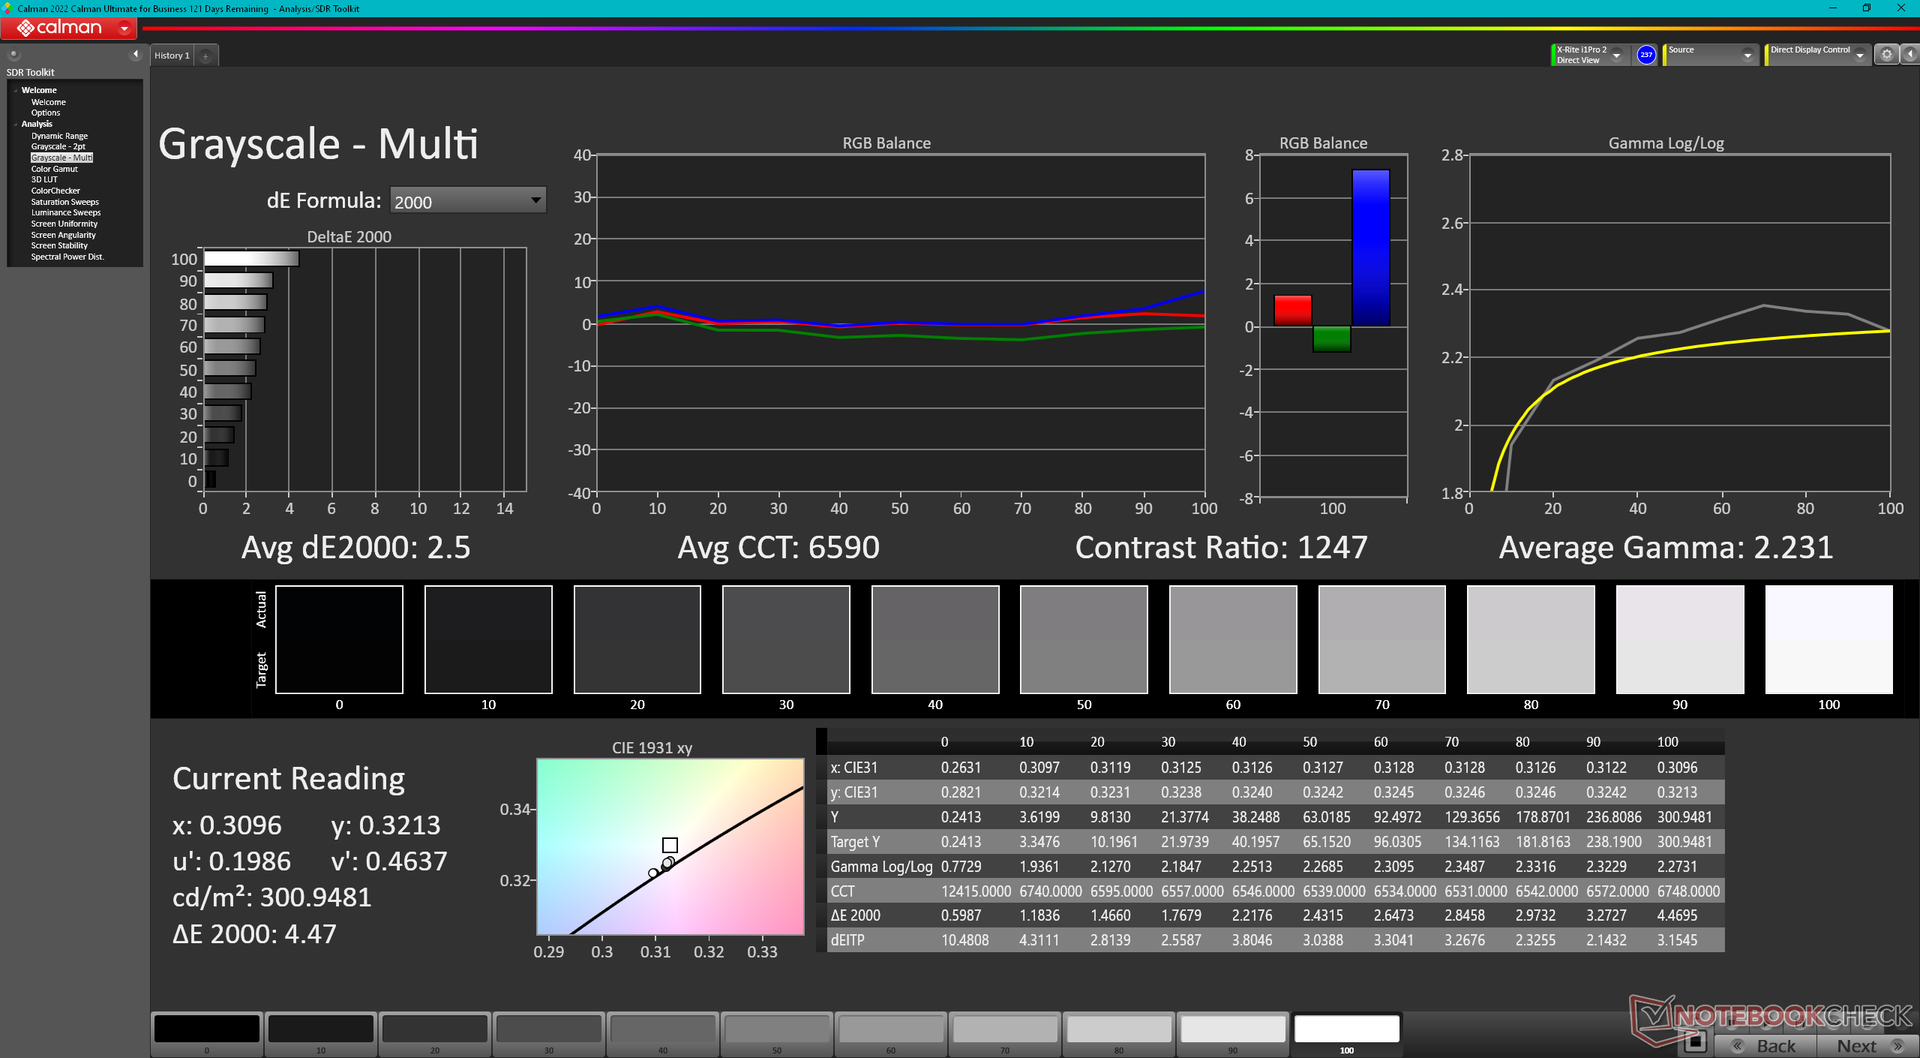
ΔE Greyscale Calman: 2.5 | ∀{0.09-98 Ø4.96}
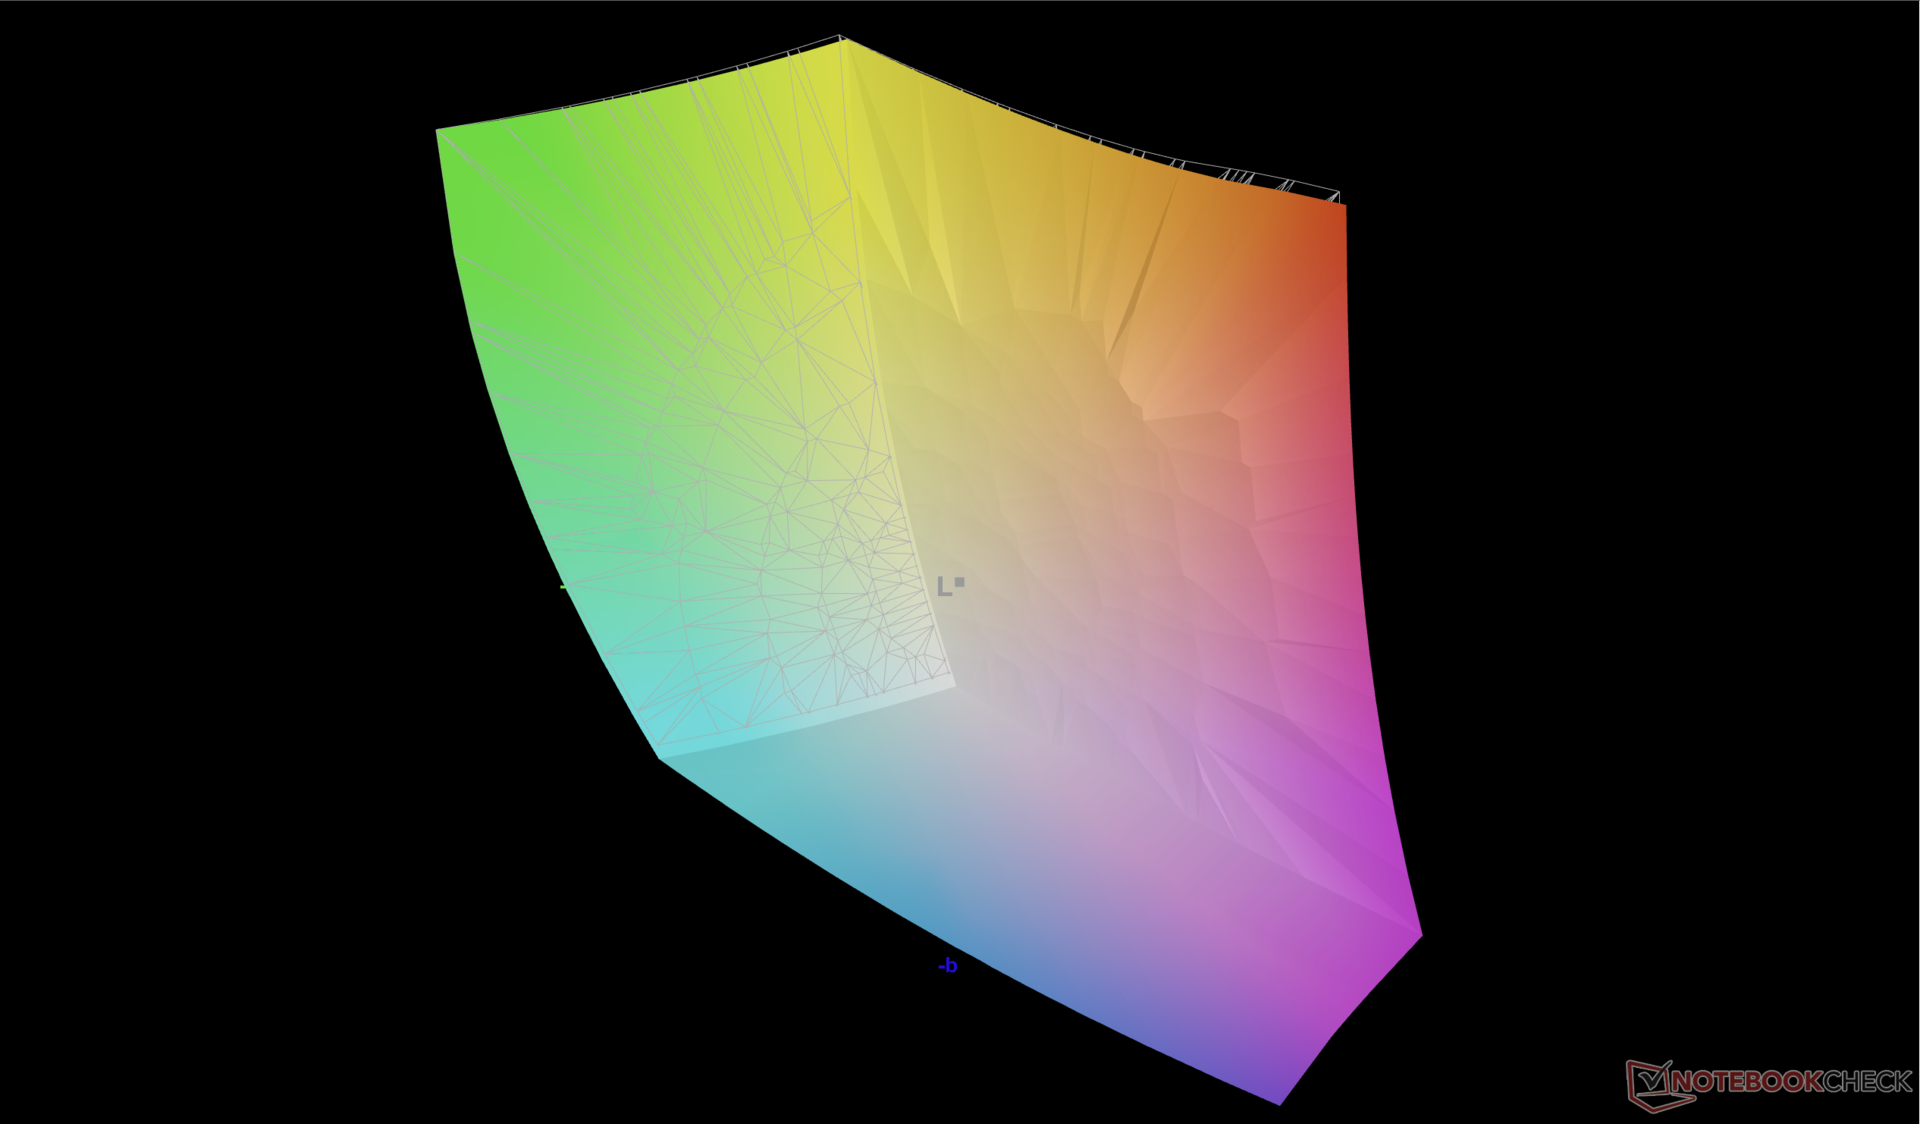
88.6% AdobeRGB 1998 (Argyll 3D)
100% sRGB (Argyll 3D)
99.2% Display P3 (Argyll 3D)
Gamma: 2.23
CCT: 6590 K
| Alienware x16 R1 BOE NE16NZ4, IPS, 2560x1600, 16" | Asus ROG Zephyrus M16 GU604VY-NM042X BOE0B74 (NE160QDM-NM4, IPS, 2560x1600, 16" | Razer Blade 16 Early 2023 CSOT T3 MNG007DA4-1, IPS, 2560x1600, 16" | Dell G16 7620 BOE NE16QDM, IPS, 2560x1600, 16" | Alienware m17 R5 (R9 6900HX, RX 6850M XT) AU Optronics AUODBA3, IPS, 3840x2160, 17" | Lenovo Legion Pro 7 16IRX8H MNG007DA2-3 (CSO1628), IPS, 2560x1600, 16" | |
|---|---|---|---|---|---|---|
| Display | 1% | 0% | -18% | -1% | -17% | |
| Display P3 Coverage (%) | 99.2 | 99.33 0% | 98.5 -1% | 68.3 -31% | 97.2 -2% | 69.1 -30% |
| sRGB Coverage (%) | 100 | 99.9 0% | 100 0% | 98 -2% | 99.6 0% | 99.7 0% |
| AdobeRGB 1998 Coverage (%) | 88.6 | 90.01 2% | 89.7 1% | 70.5 -20% | 88.4 0% | 71.2 -20% |
| Response Times | -542% | -23% | -35% | -118% | -49% | |
| Response Time Grey 50% / Grey 80% * (ms) | 5.1 ? | 50.8 ? -896% | 6.6 ? -29% | 8.6 ? -69% | 16.4 ? -222% | 12.3 ? -141% |
| Response Time Black / White * (ms) | 10.3 ? | 29.6 ? -187% | 12 ? -17% | 10.4 ? -1% | 11.6 ? -13% | 5.9 ? 43% |
| PWM Frequency (Hz) | 12000 | |||||
| Screen | 247% | -8% | -4% | -80% | 31% | |
| Brightness middle (cd/m²) | 302.2 | 634 110% | 456.8 51% | 369.4 22% | 484 60% | 511 69% |
| Brightness (cd/m²) | 285 | 627 120% | 437 53% | 348 22% | 449 58% | 469 65% |
| Brightness Distribution (%) | 89 | 92 3% | 83 -7% | 83 -7% | 87 -2% | 86 -3% |
| Black Level * (cd/m²) | 0.26 | 0.03 88% | 0.35 -35% | 0.32 -23% | 0.55 -112% | 0.4 -54% |
| Contrast (:1) | 1162 | 21133 1719% | 1305 12% | 1154 -1% | 880 -24% | 1278 10% |
| Colorchecker dE 2000 * | 1.63 | 0.89 45% | 3.7 -127% | 1.78 -9% | 4.8 -194% | 0.95 42% |
| Colorchecker dE 2000 max. * | 4.13 | 1.79 57% | 6.42 -55% | 4.41 -7% | 7.48 -81% | 2.07 50% |
| Colorchecker dE 2000 calibrated * | 1.17 | 0.91 22% | 0.66 44% | 1.22 -4% | 4.74 -305% | 0.91 22% |
| Greyscale dE 2000 * | 2.5 | 1.13 55% | 2.6 -4% | 3.2 -28% | 5.5 -120% | 0.6 76% |
| Gamma | 2.23 99% | 2.47 89% | 2.3 96% | 2.2 100% | 2.42 91% | 2.176 101% |
| CCT | 6590 99% | 6497 100% | 6108 106% | 6750 96% | 6148 106% | 6545 99% |
| Total Average (Program / Settings) | -98% /
81% | -10% /
-8% | -19% /
-11% | -66% /
-68% | -12% /
9% |
* ... smaller is better
The display is well-calibrated out of the box with average grayscale and color deltaE values of just 2.5 and 1.63, respectively. Attempting to calibrate the display even further with our X-Rite colorimeter would result in just very minor gains and so an end-user calibration is not necessary.


Display Response Times
| ↔ Response Time Black to White | ||
|---|---|---|
| 10.3 ms ... rise ↗ and fall ↘ combined | ↗ 5.4 ms rise | 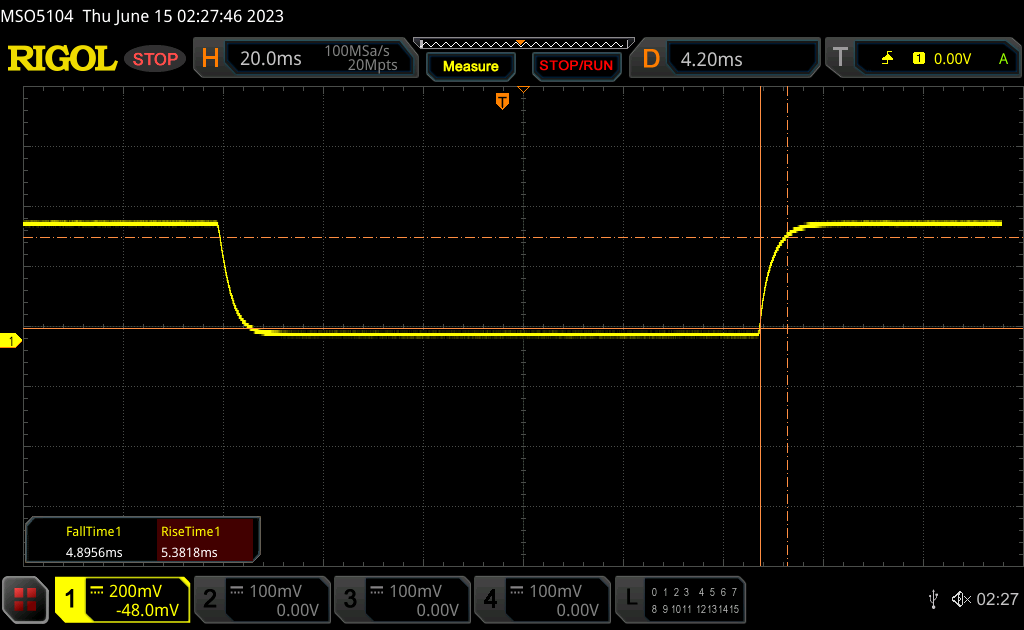 |
| ↘ 4.9 ms fall | ||
| The screen shows good response rates in our tests, but may be too slow for competitive gamers. In comparison, all tested devices range from 0.1 (minimum) to 240 (maximum) ms. » 28 % of all devices are better. This means that the measured response time is better than the average of all tested devices (19.8 ms). | ||
| ↔ Response Time 50% Grey to 80% Grey | ||
| 5.1 ms ... rise ↗ and fall ↘ combined | ↗ 2.4 ms rise | 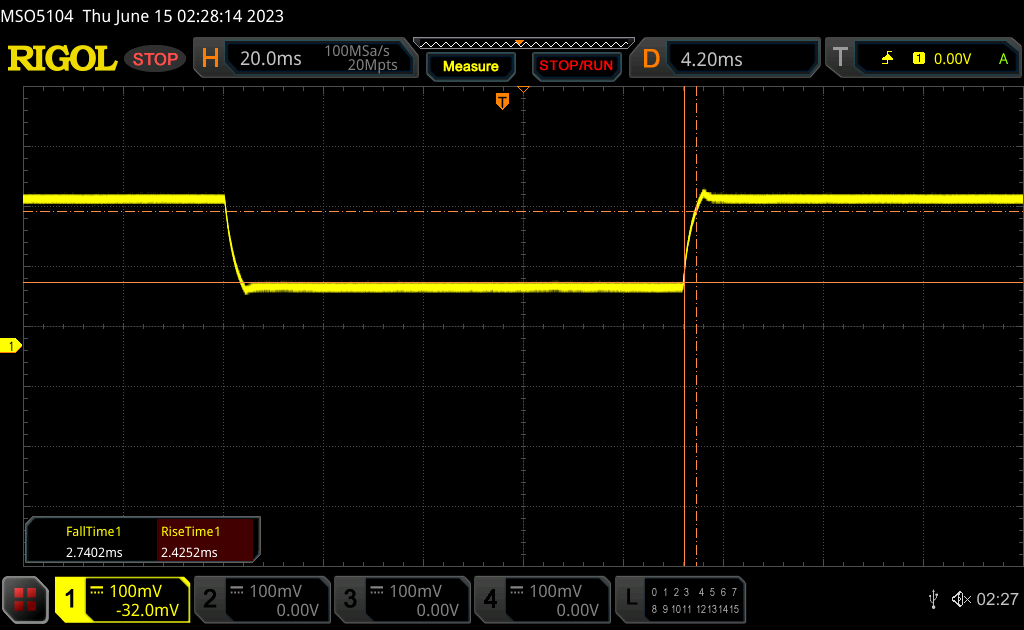 |
| ↘ 2.7 ms fall | ||
| The screen shows very fast response rates in our tests and should be very well suited for fast-paced gaming. In comparison, all tested devices range from 0.165 (minimum) to 636 (maximum) ms. » 17 % of all devices are better. This means that the measured response time is better than the average of all tested devices (30.9 ms). | ||
Screen Flickering / PWM (Pulse-Width Modulation)
| Screen flickering / PWM not detected | 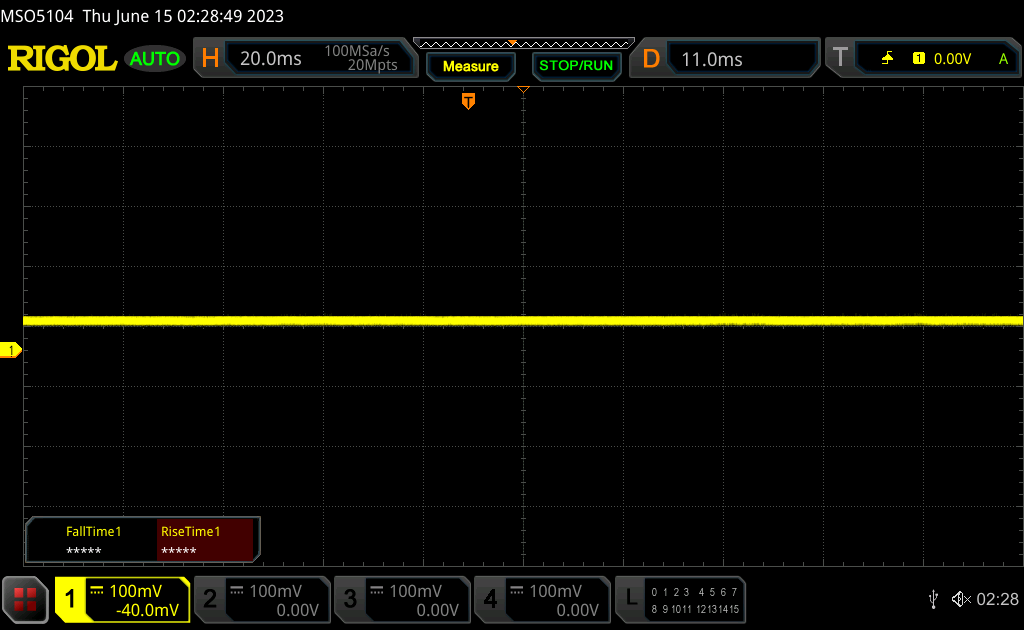 | ||
In comparison: 52 % of all tested devices do not use PWM to dim the display. If PWM was detected, an average of 7744 (minimum: 5 - maximum: 343500) Hz was measured. | |||
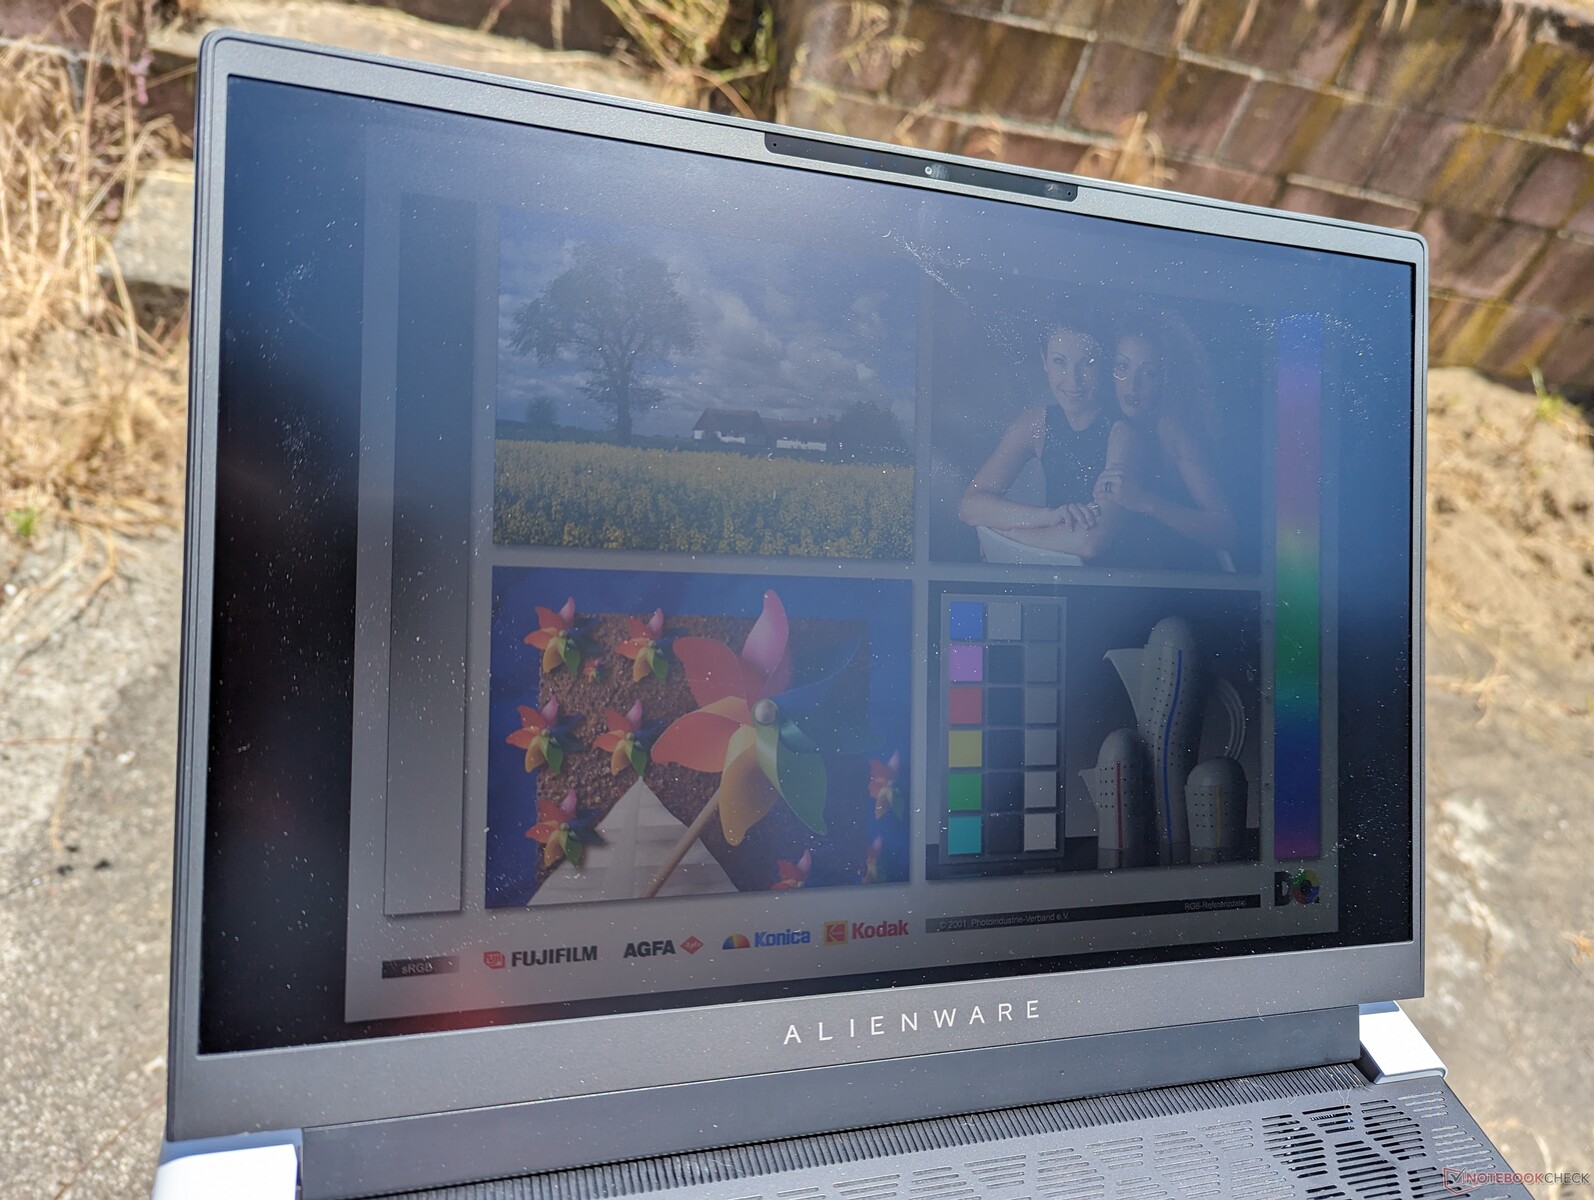
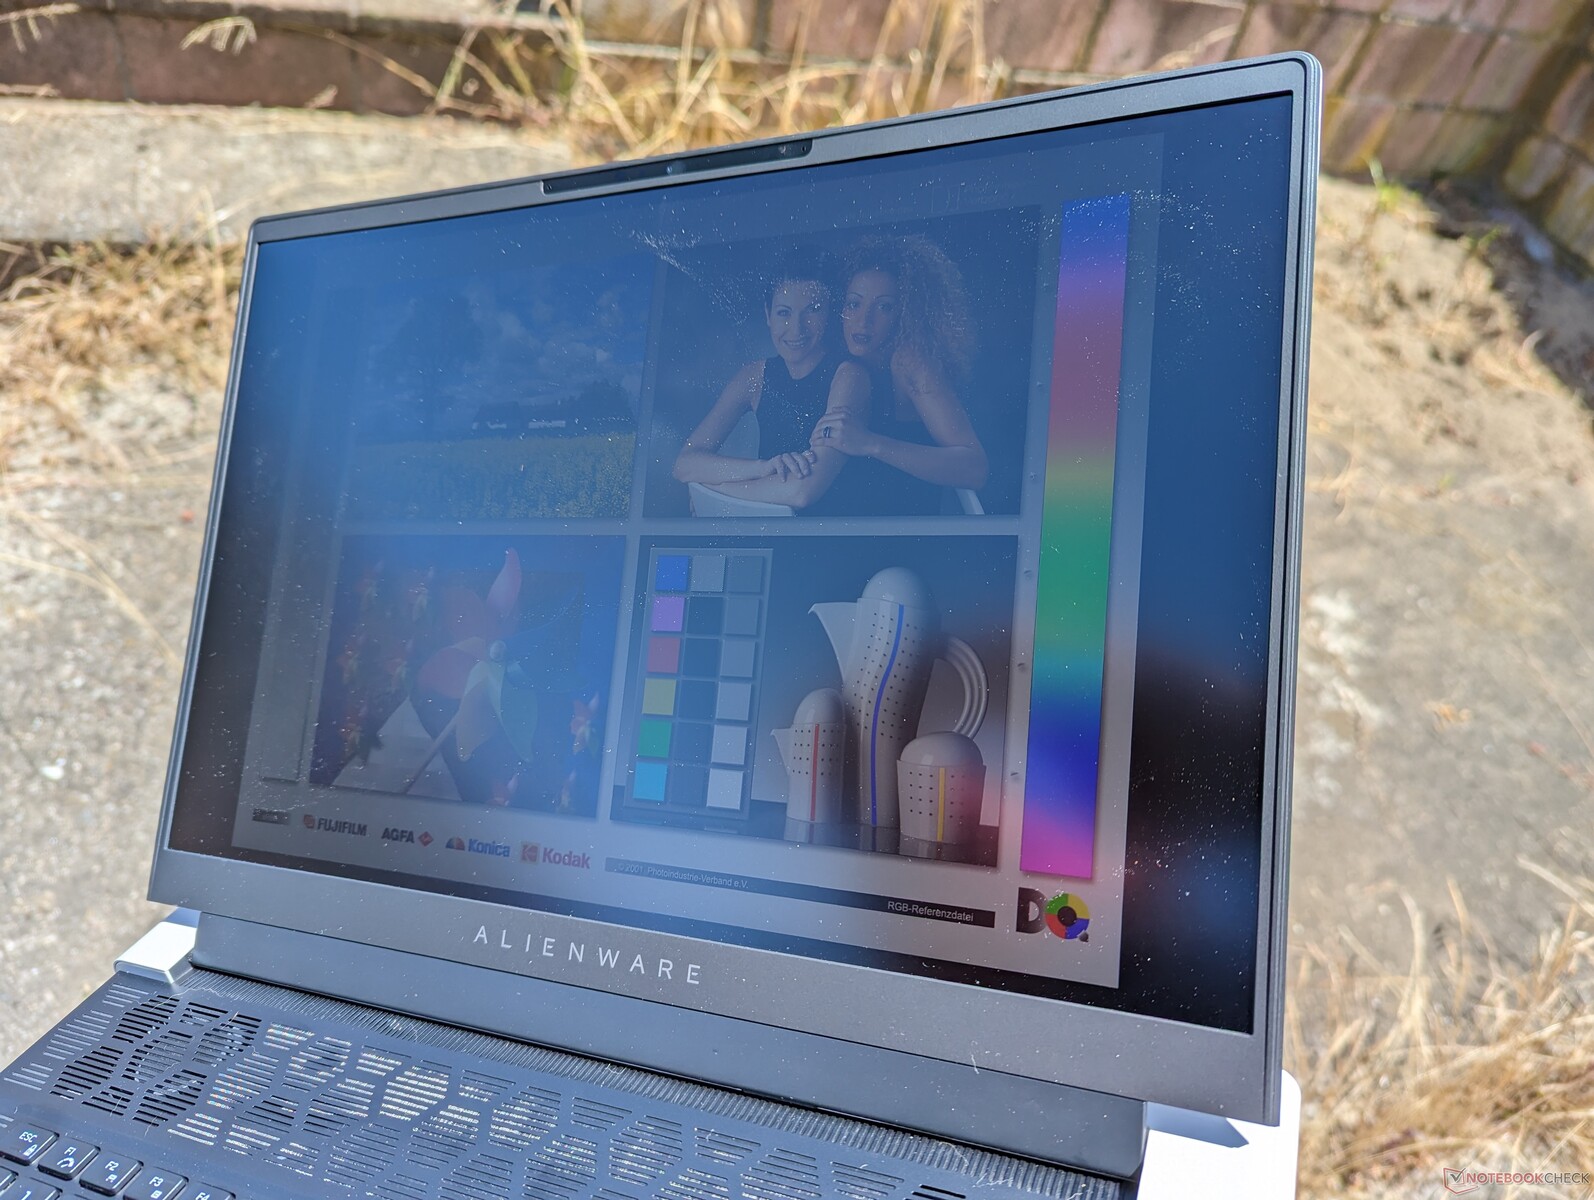
Outdoor visibility is not as great as on other 16-inch gaming laptops like the Zephyrus M16, Blade 16, or Legion Pro 7 16 since the display on the Alienware is noticeably dimmer. Combine this with the relatively large footprint and the Alienware x16 R1 is definitely not an outdoor-friendly laptop despite the thin chassis design.
Performance — Meh CPU, Impressive GPU
Testing Conditions
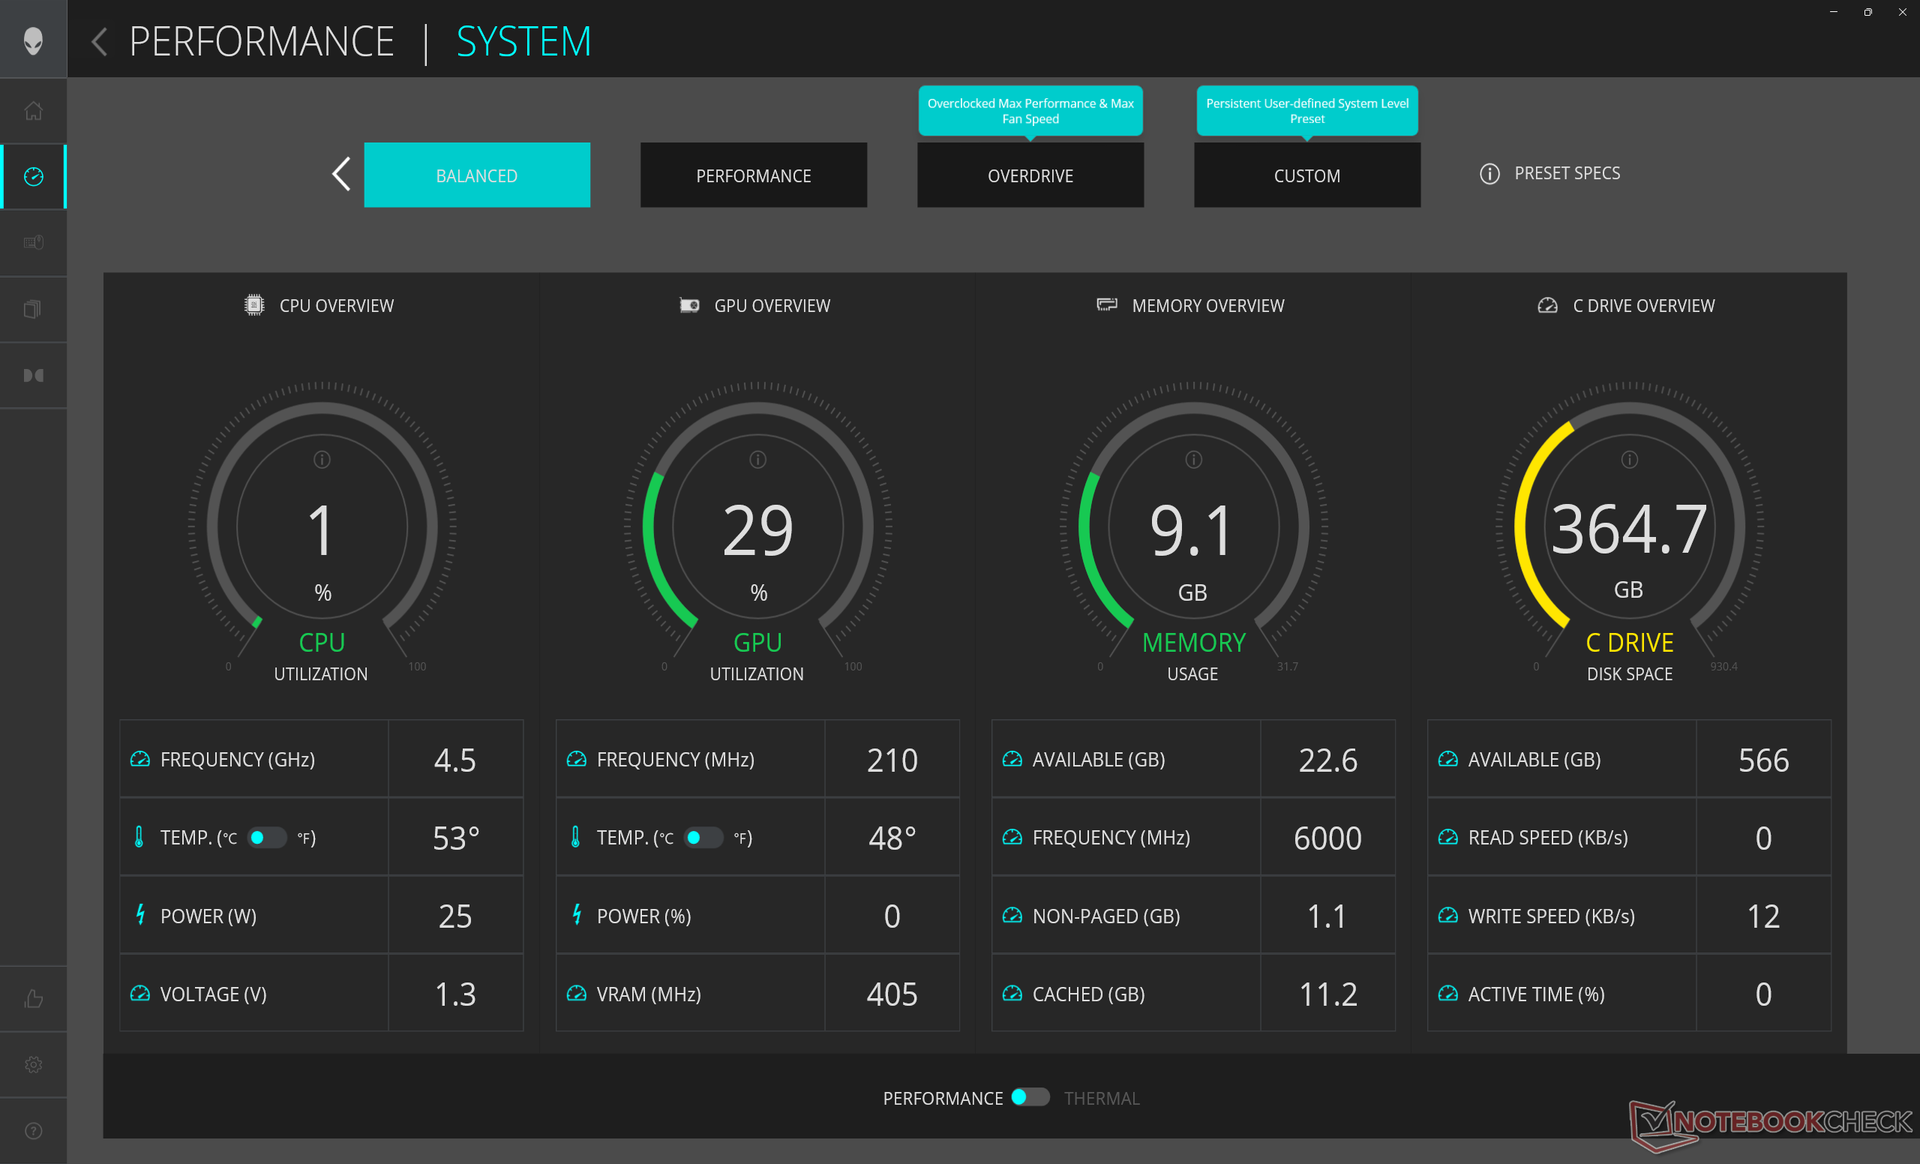
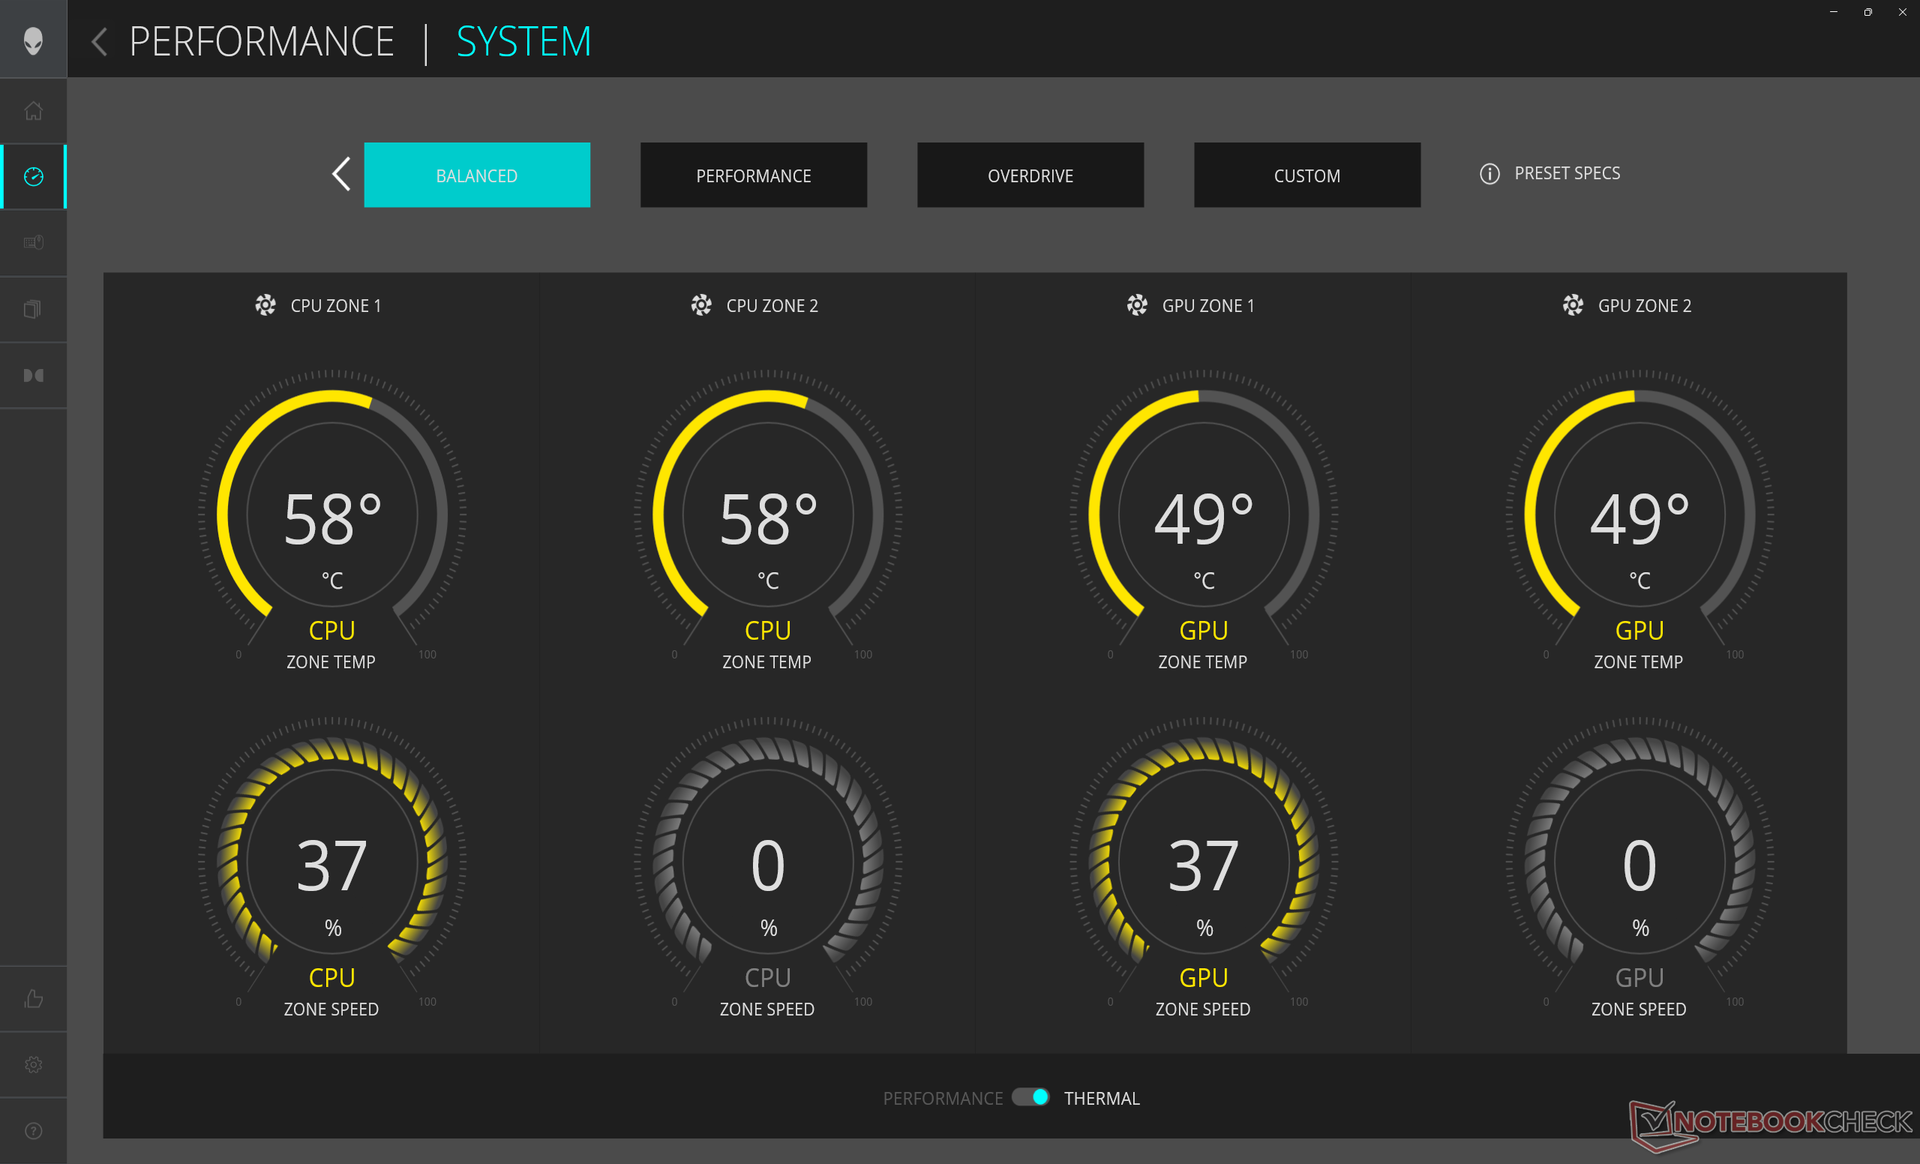
We set our unit to Overdrive mode via Alienware Command Center (ACC) and High Performance mode via Windows prior to running the benchmarks below. We also made sure to set the graphics to dGPU mode only as opposed to Optimus via Nvidia Control Panel. Annoyingly, the ACC power profiles are not synced with Windows and so it is possible to have conflicting profiles active (i.e., one set to Power Saver and the other on Performance).
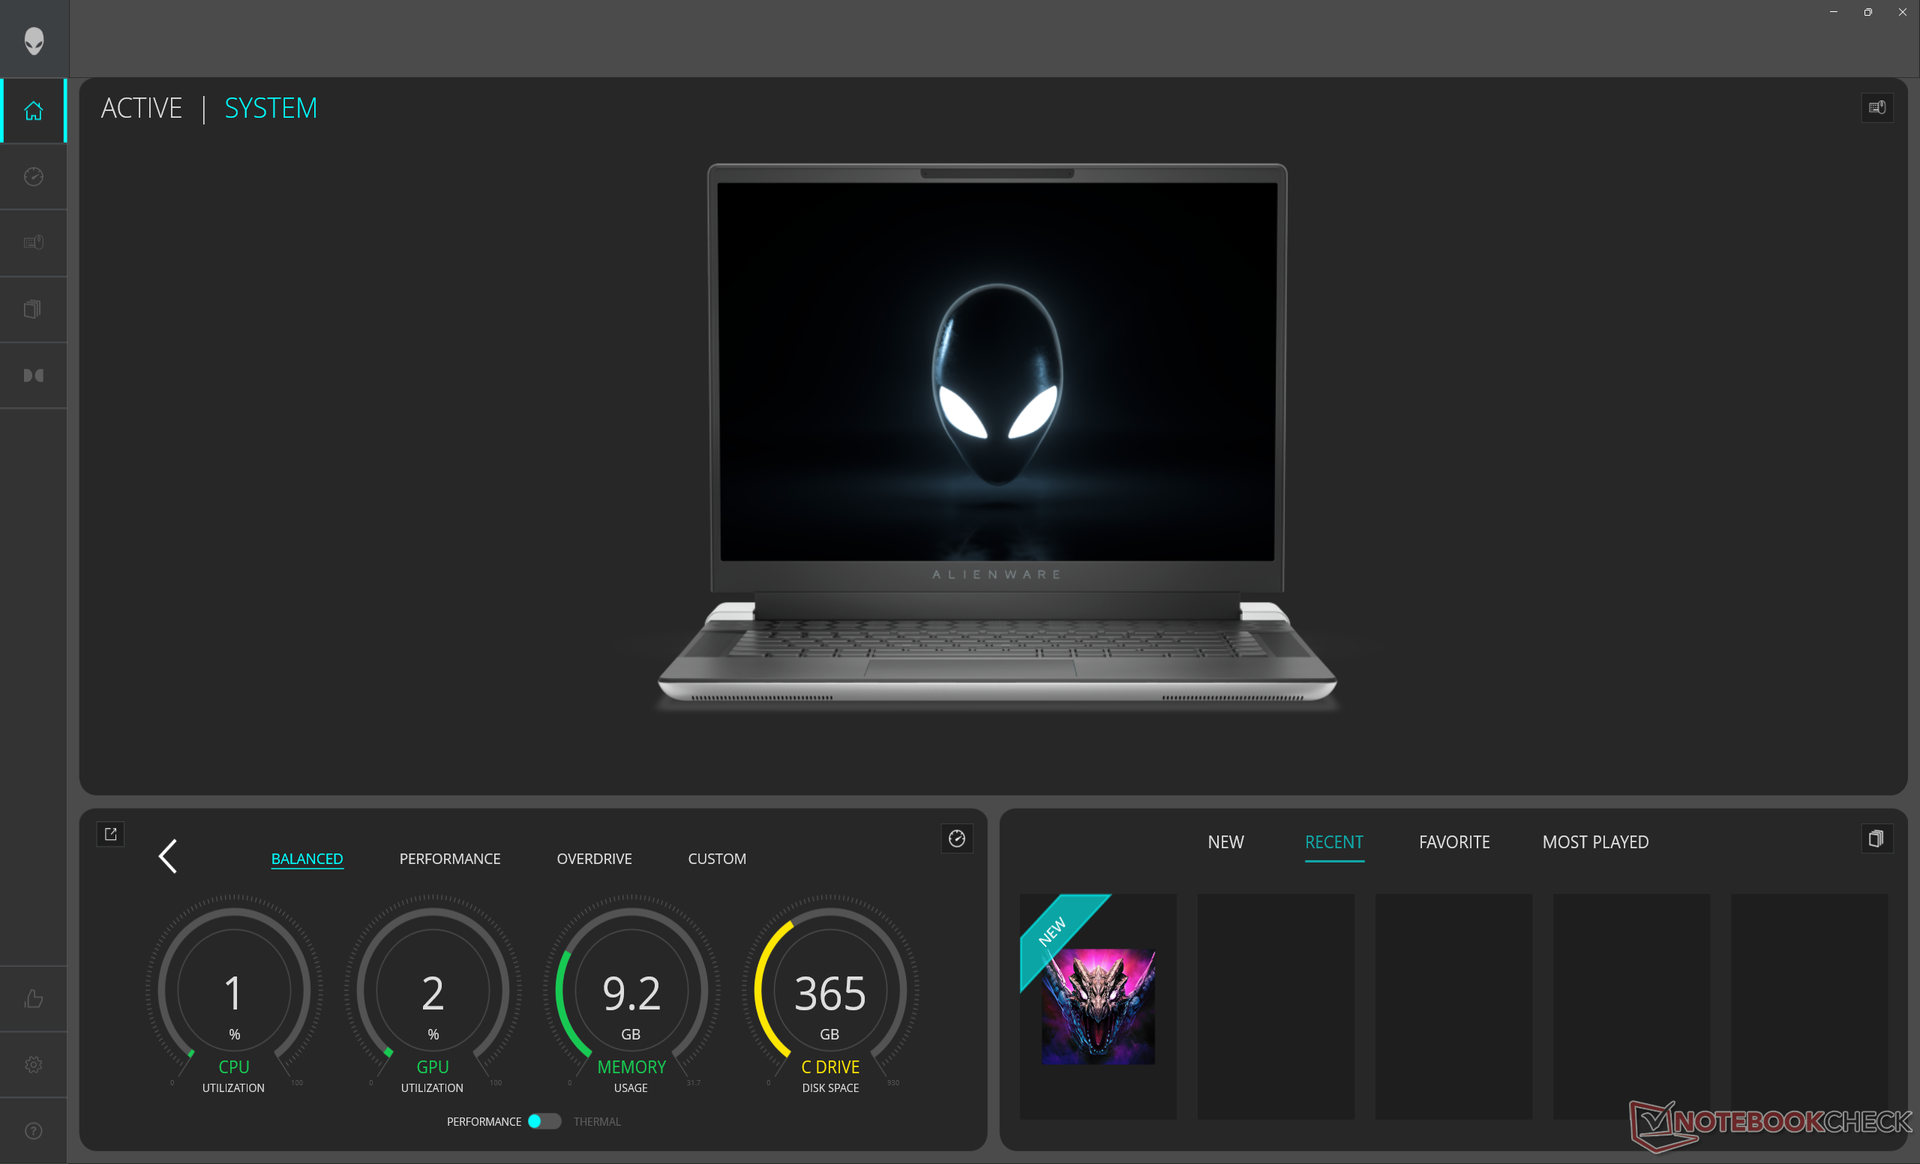
ACC should not be confused with My Alienware. The former is a control hub for system vitals, RGB settings, power profiles, and gaming settings while the latter is a nexus for Dell support, mobile connect, and optional accessories.
Advanced Optimus or MUX is supported on all SKUs. Keep in mind that G-Sync is active for the internal monitor if set to dGPU mode only.
Processor
It's important to note that the model maxes out at the Core i9-13900HK and not the Core i9-13900HX the latter of which can offer 50 to 60 percent faster multi-thread performance. Overall performance from our Core i7-13900HK is therefore nearly identical to the less expensive Core i9-13900H and comparable to the competing Ryzen 7 7745HX. For faster performance, gamers may want to consider the thicker Alienware m16 or Lenovo Legion Pro 7 instead as they can be configured with the Core i7-13900HX.
Downgrading to the less expensive i7-13620H or i7-13700H configurations is expected to impact processor performance by about 15 to 20 percent based on our time with the MSI Katana 17 and the Dell XPS 17 9730.
Cinebench R15 Multi Loop
Cinebench R20: CPU (Multi Core) | CPU (Single Core)
Cinebench R23: Multi Core | Single Core
Cinebench R15: CPU Multi 64Bit | CPU Single 64Bit
Blender: v2.79 BMW27 CPU
7-Zip 18.03: 7z b 4 | 7z b 4 -mmt1
Geekbench 5.5: Multi-Core | Single-Core
HWBOT x265 Benchmark v2.2: 4k Preset
LibreOffice : 20 Documents To PDF
R Benchmark 2.5: Overall mean
* ... smaller is better
AIDA64: FP32 Ray-Trace | FPU Julia | CPU SHA3 | CPU Queen | FPU SinJulia | FPU Mandel | CPU AES | CPU ZLib | FP64 Ray-Trace | CPU PhotoWorxx
| Performance rating | |
| Lenovo Legion Pro 7 RTX4090 | |
| Razer Blade 16 Early 2023 | |
| Asus ROG Zephyrus M16 GU604VY-NM042X | |
| Alienware x16 R1 | |
| Alienware m17 R5 (R9 6900HX, RX 6850M XT) | |
| Dell G16 7620 | |
| Average Intel Core i9-13900HK | |
| AIDA64 / CPU Queen | |
| Lenovo Legion Pro 7 RTX4090 | |
| Razer Blade 16 Early 2023 | |
| Razer Blade 16 Early 2023 | |
| Asus ROG Zephyrus M16 GU604VY-NM042X | |
| Alienware x16 R1 | |
| Alienware m17 R5 (R9 6900HX, RX 6850M XT) | |
| Dell G16 7620 | |
| Average Intel Core i9-13900HK (75615 - 118166, n=4) | |
System Performance
CrossMark: Overall | Productivity | Creativity | Responsiveness
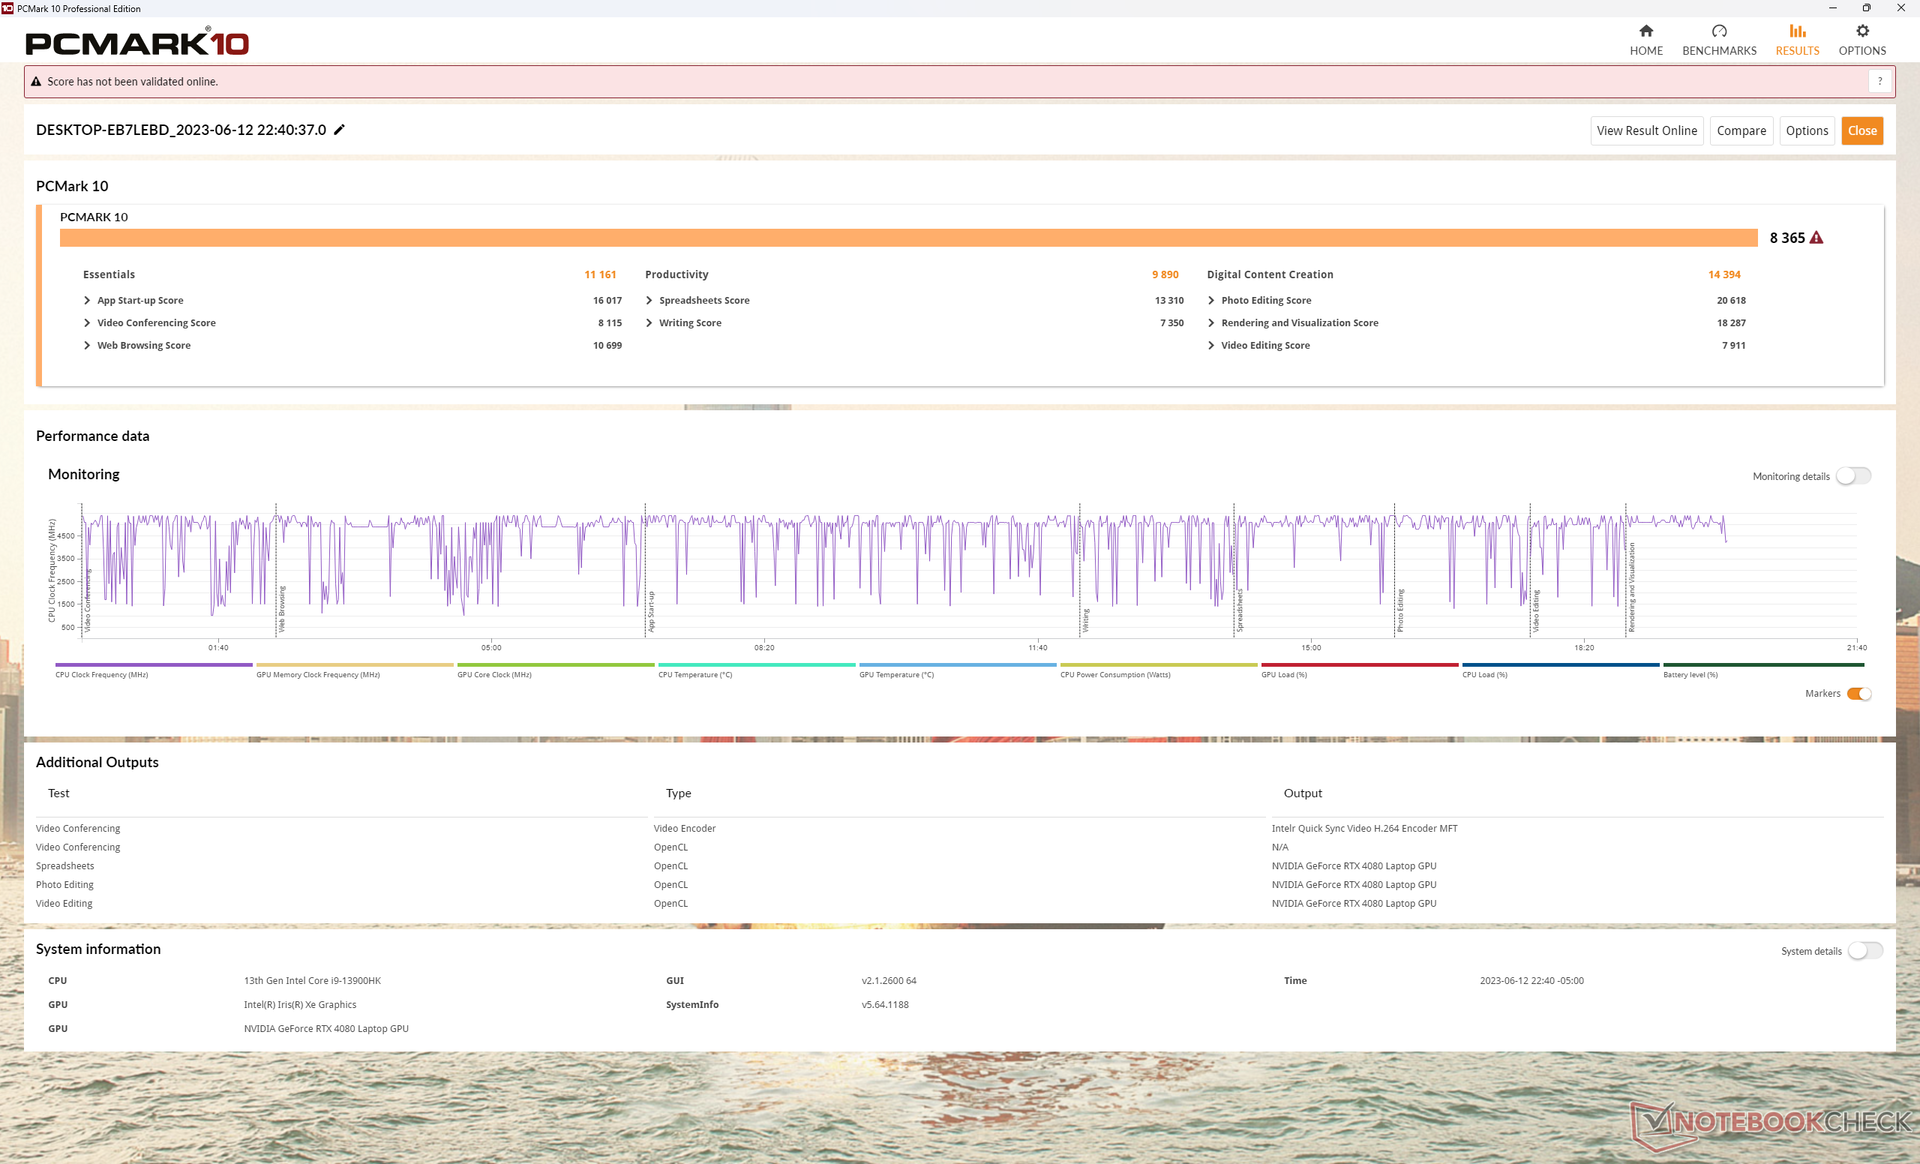
| PCMark 10 / Score | |
| Alienware x16 R1 | |
| Average Intel Core i9-13900HK, NVIDIA GeForce RTX 4080 Laptop GPU (n=1) | |
| Asus ROG Zephyrus M16 GU604VY-NM042X | |
| Lenovo Legion Pro 7 RTX4090 | |
| Razer Blade 16 Early 2023 | |
| Alienware m17 R5 (R9 6900HX, RX 6850M XT) | |
| Dell G16 7620 | |
| PCMark 10 / Essentials | |
| Asus ROG Zephyrus M16 GU604VY-NM042X | |
| Alienware x16 R1 | |
| Average Intel Core i9-13900HK, NVIDIA GeForce RTX 4080 Laptop GPU (n=1) | |
| Lenovo Legion Pro 7 RTX4090 | |
| Razer Blade 16 Early 2023 | |
| Dell G16 7620 | |
| Alienware m17 R5 (R9 6900HX, RX 6850M XT) | |
| PCMark 10 / Productivity | |
| Asus ROG Zephyrus M16 GU604VY-NM042X | |
| Alienware x16 R1 | |
| Average Intel Core i9-13900HK, NVIDIA GeForce RTX 4080 Laptop GPU (n=1) | |
| Alienware m17 R5 (R9 6900HX, RX 6850M XT) | |
| Lenovo Legion Pro 7 RTX4090 | |
| Dell G16 7620 | |
| Razer Blade 16 Early 2023 | |
| PCMark 10 / Digital Content Creation | |
| Lenovo Legion Pro 7 RTX4090 | |
| Razer Blade 16 Early 2023 | |
| Alienware x16 R1 | |
| Average Intel Core i9-13900HK, NVIDIA GeForce RTX 4080 Laptop GPU (n=1) | |
| Asus ROG Zephyrus M16 GU604VY-NM042X | |
| Alienware m17 R5 (R9 6900HX, RX 6850M XT) | |
| Dell G16 7620 | |
| CrossMark / Overall | |
| Asus ROG Zephyrus M16 GU604VY-NM042X | |
| Alienware x16 R1 | |
| Average Intel Core i9-13900HK, NVIDIA GeForce RTX 4080 Laptop GPU (n=1) | |
| Dell G16 7620 | |
| Alienware m17 R5 (R9 6900HX, RX 6850M XT) | |
| Razer Blade 16 Early 2023 | |
| CrossMark / Productivity | |
| Asus ROG Zephyrus M16 GU604VY-NM042X | |
| Alienware x16 R1 | |
| Average Intel Core i9-13900HK, NVIDIA GeForce RTX 4080 Laptop GPU (n=1) | |
| Dell G16 7620 | |
| Alienware m17 R5 (R9 6900HX, RX 6850M XT) | |
| Razer Blade 16 Early 2023 | |
| CrossMark / Creativity | |
| Asus ROG Zephyrus M16 GU604VY-NM042X | |
| Alienware x16 R1 | |
| Average Intel Core i9-13900HK, NVIDIA GeForce RTX 4080 Laptop GPU (n=1) | |
| Dell G16 7620 | |
| Razer Blade 16 Early 2023 | |
| Alienware m17 R5 (R9 6900HX, RX 6850M XT) | |
| CrossMark / Responsiveness | |
| Alienware x16 R1 | |
| Average Intel Core i9-13900HK, NVIDIA GeForce RTX 4080 Laptop GPU (n=1) | |
| Asus ROG Zephyrus M16 GU604VY-NM042X | |
| Dell G16 7620 | |
| Razer Blade 16 Early 2023 | |
| Alienware m17 R5 (R9 6900HX, RX 6850M XT) | |
| PCMark 10 Score | 8365 points | |
Help | ||
| AIDA64 / Memory Latency | |
| Alienware x16 R1 | |
| Dell G16 7620 | |
| Razer Blade 16 Early 2023 | |
| Razer Blade 16 Early 2023 | |
| Razer Blade 16 Early 2023 | |
| Average Intel Core i9-13900HK (83 - 115.3, n=4) | |
| Alienware m17 R5 (R9 6900HX, RX 6850M XT) | |
| Asus ROG Zephyrus M16 GU604VY-NM042X | |
| Lenovo Legion Pro 7 RTX4090 | |
* ... smaller is better
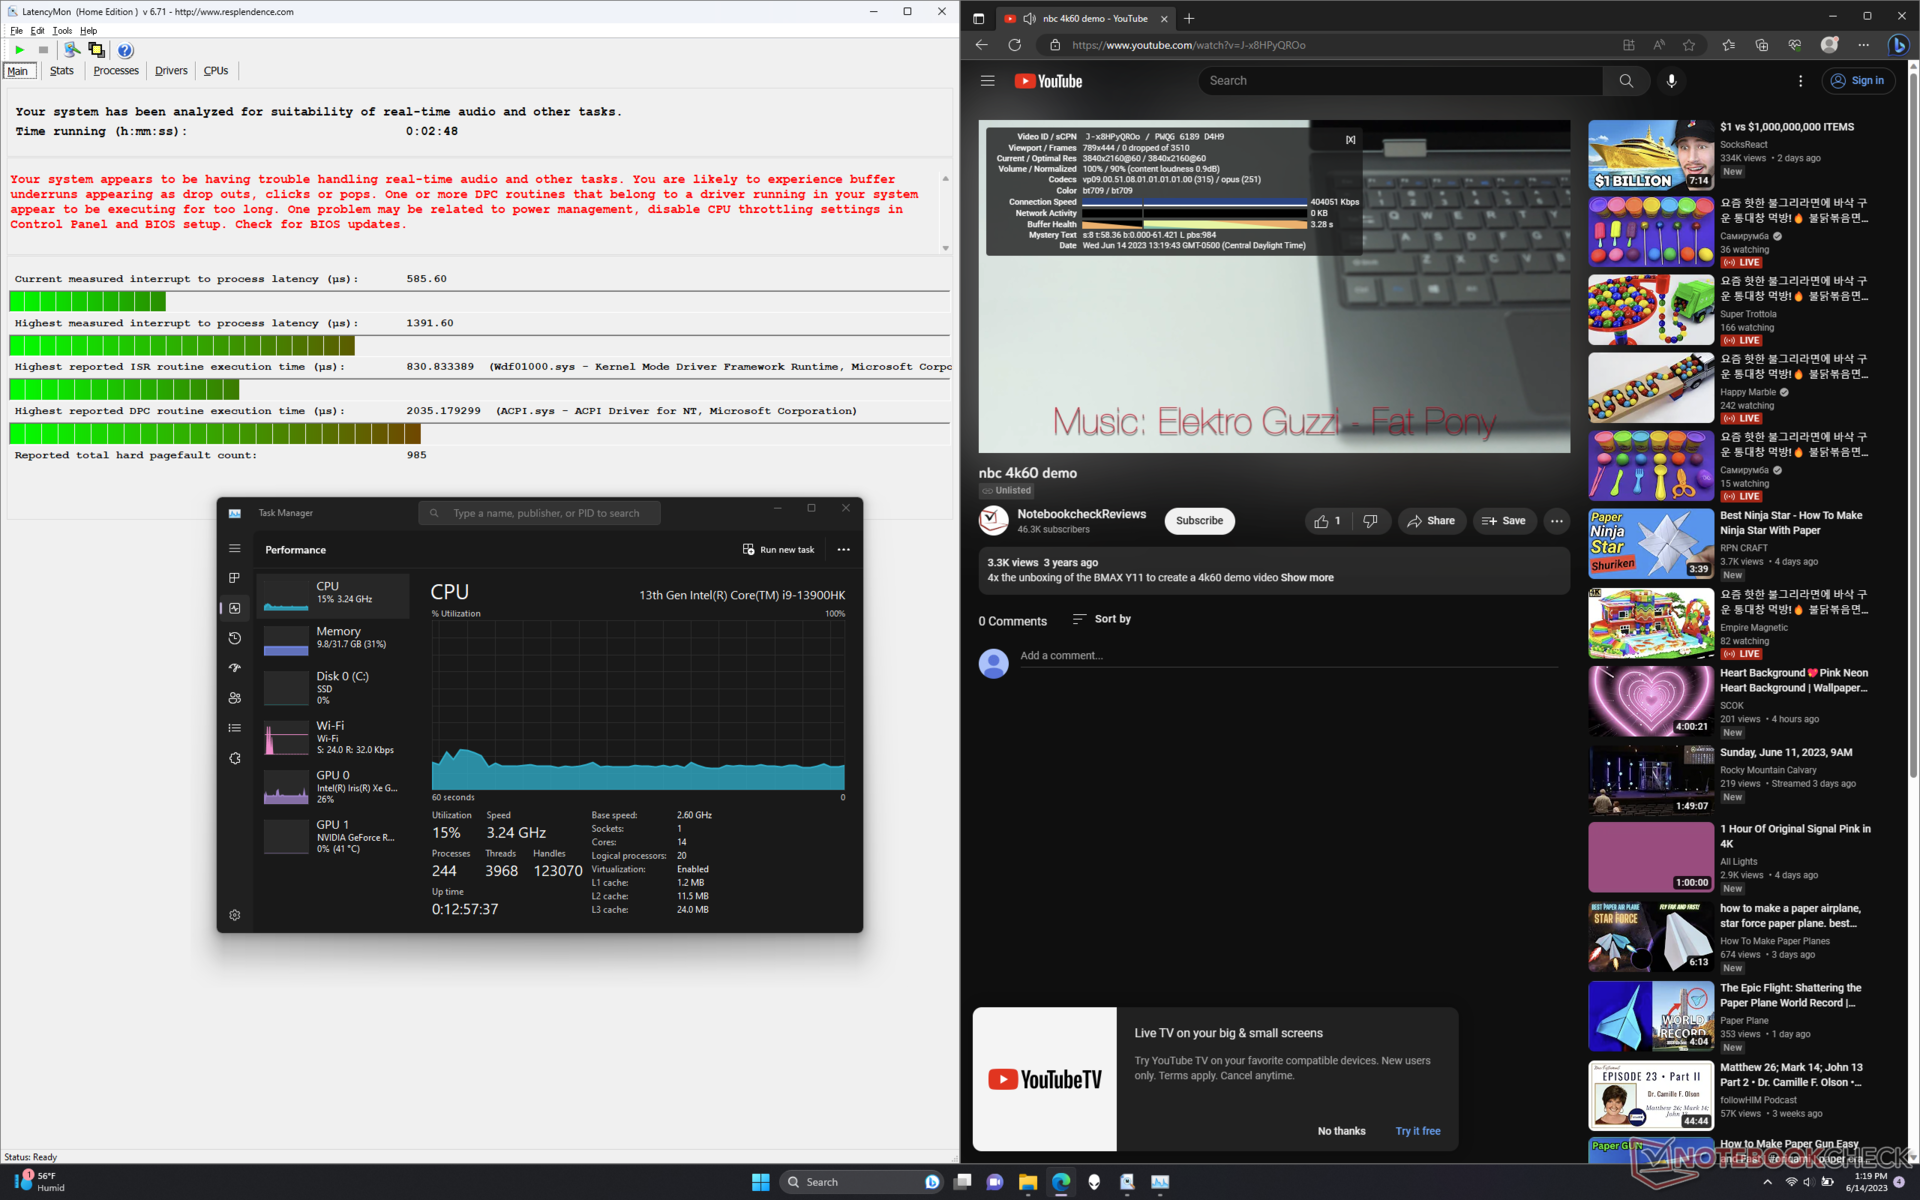
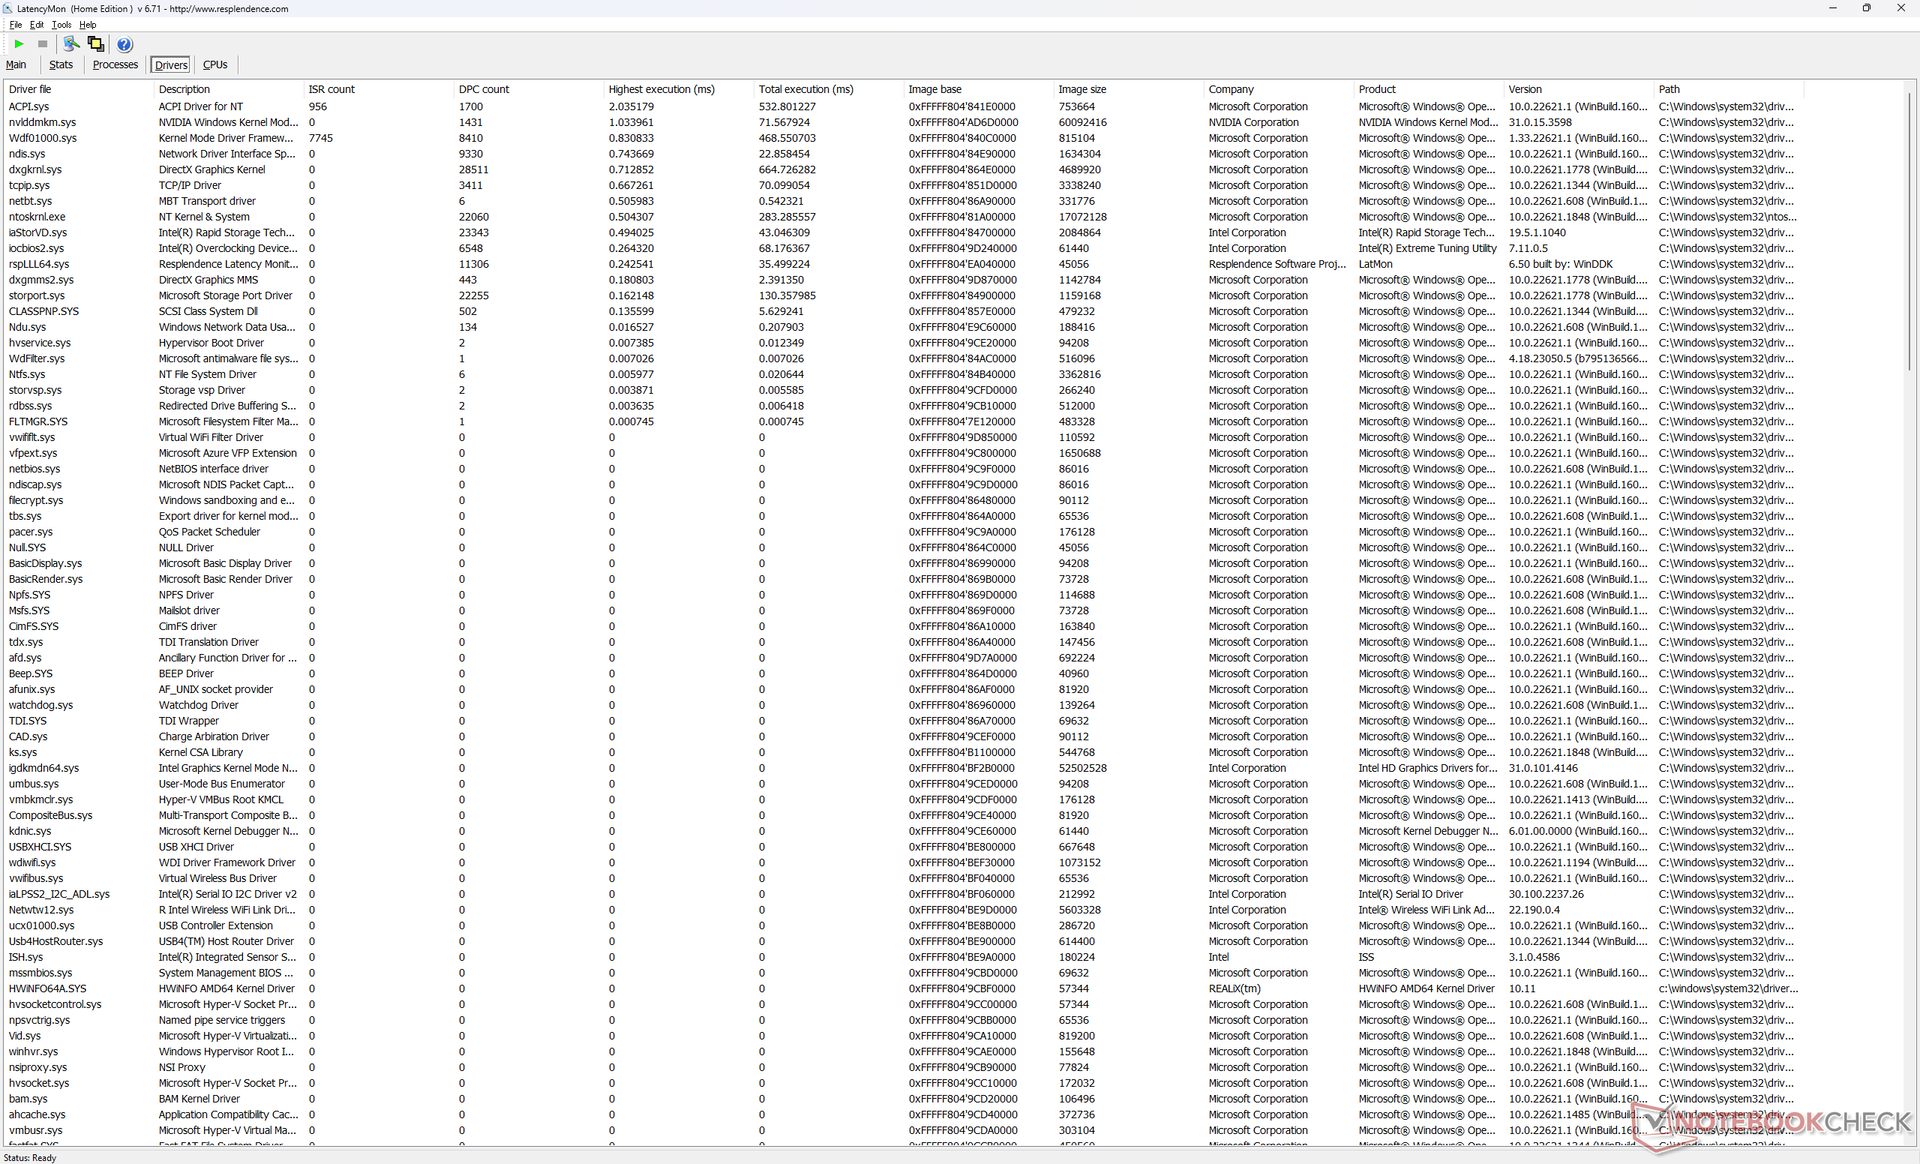
DPC Latency
LatencyMon reveals DPC issues when opening multiple browser tabs of our homepage. 4K video playback at 60 FPS is otherwise perfect with no dropped frames.
| DPC Latencies / LatencyMon - interrupt to process latency (max), Web, Youtube, Prime95 | |
| Lenovo Legion Pro 7 RTX4090 | |
| Asus ROG Zephyrus M16 GU604VY-NM042X | |
| Razer Blade 16 Early 2023 | |
| Alienware x16 R1 | |
| Alienware m17 R5 (R9 6900HX, RX 6850M XT) | |
| Dell G16 7620 | |
* ... smaller is better
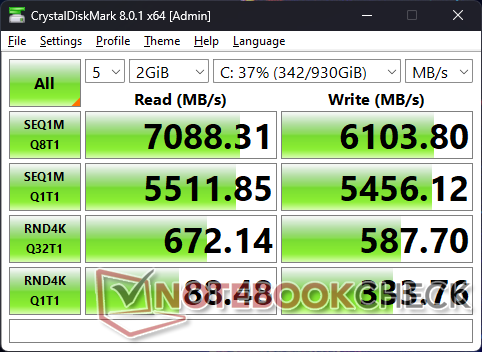
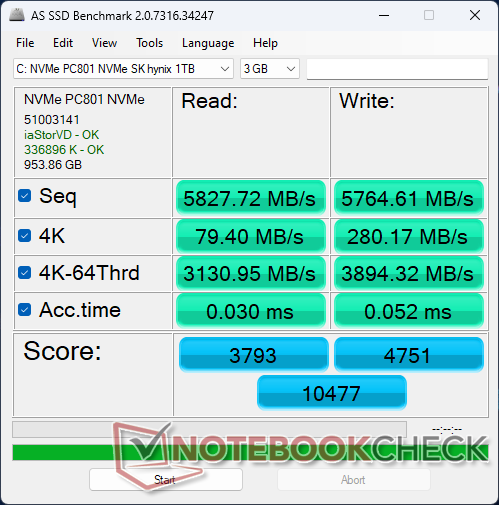
Storage Devices
The PCIe4 x4 SK Hynix PC801 drive in our unit can reach read rates of up to 7100 MB/s to be comparable to the popular Samsung PM9A1. Unfortunately, the drive has issues maintaining its maximum transfer rate for extended periods likely due to insufficient cooling. When running DiskSpd in a loop, for example, read rates would dip to as low as 3400 MB/s after just a few minutes into the stress test as shown by the graph below. Results would not improve after repeat testing.

| Drive Performance rating - Percent | |
| Alienware x16 R1 | |
| Lenovo Legion Pro 7 RTX4090 | |
| Dell G16 7620 | |
| Asus ROG Zephyrus M16 GU604VY-NM042X | |
| Razer Blade 16 Early 2023 | |
| Alienware m17 R5 (R9 6900HX, RX 6850M XT) | |
* ... smaller is better
Disk Throttling: DiskSpd Read Loop, Queue Depth 8
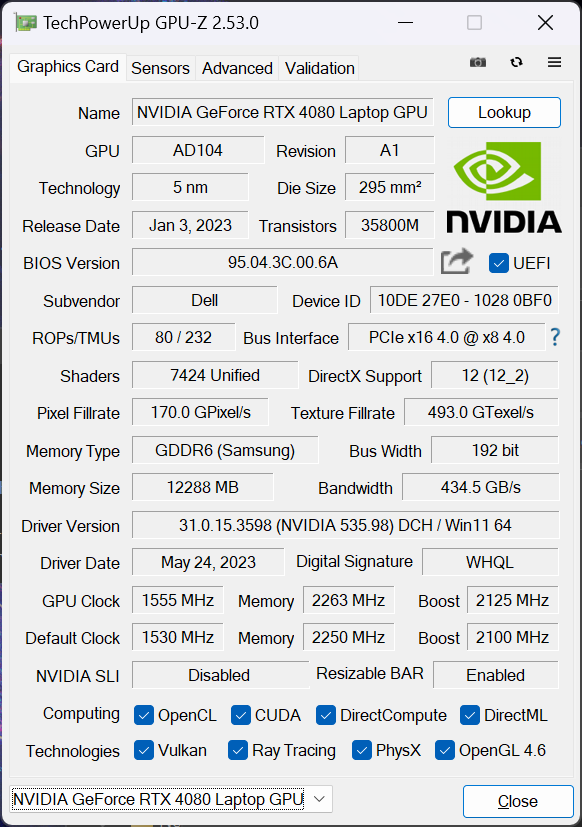
GPU Performance — 175 W GeForce RTX 4080
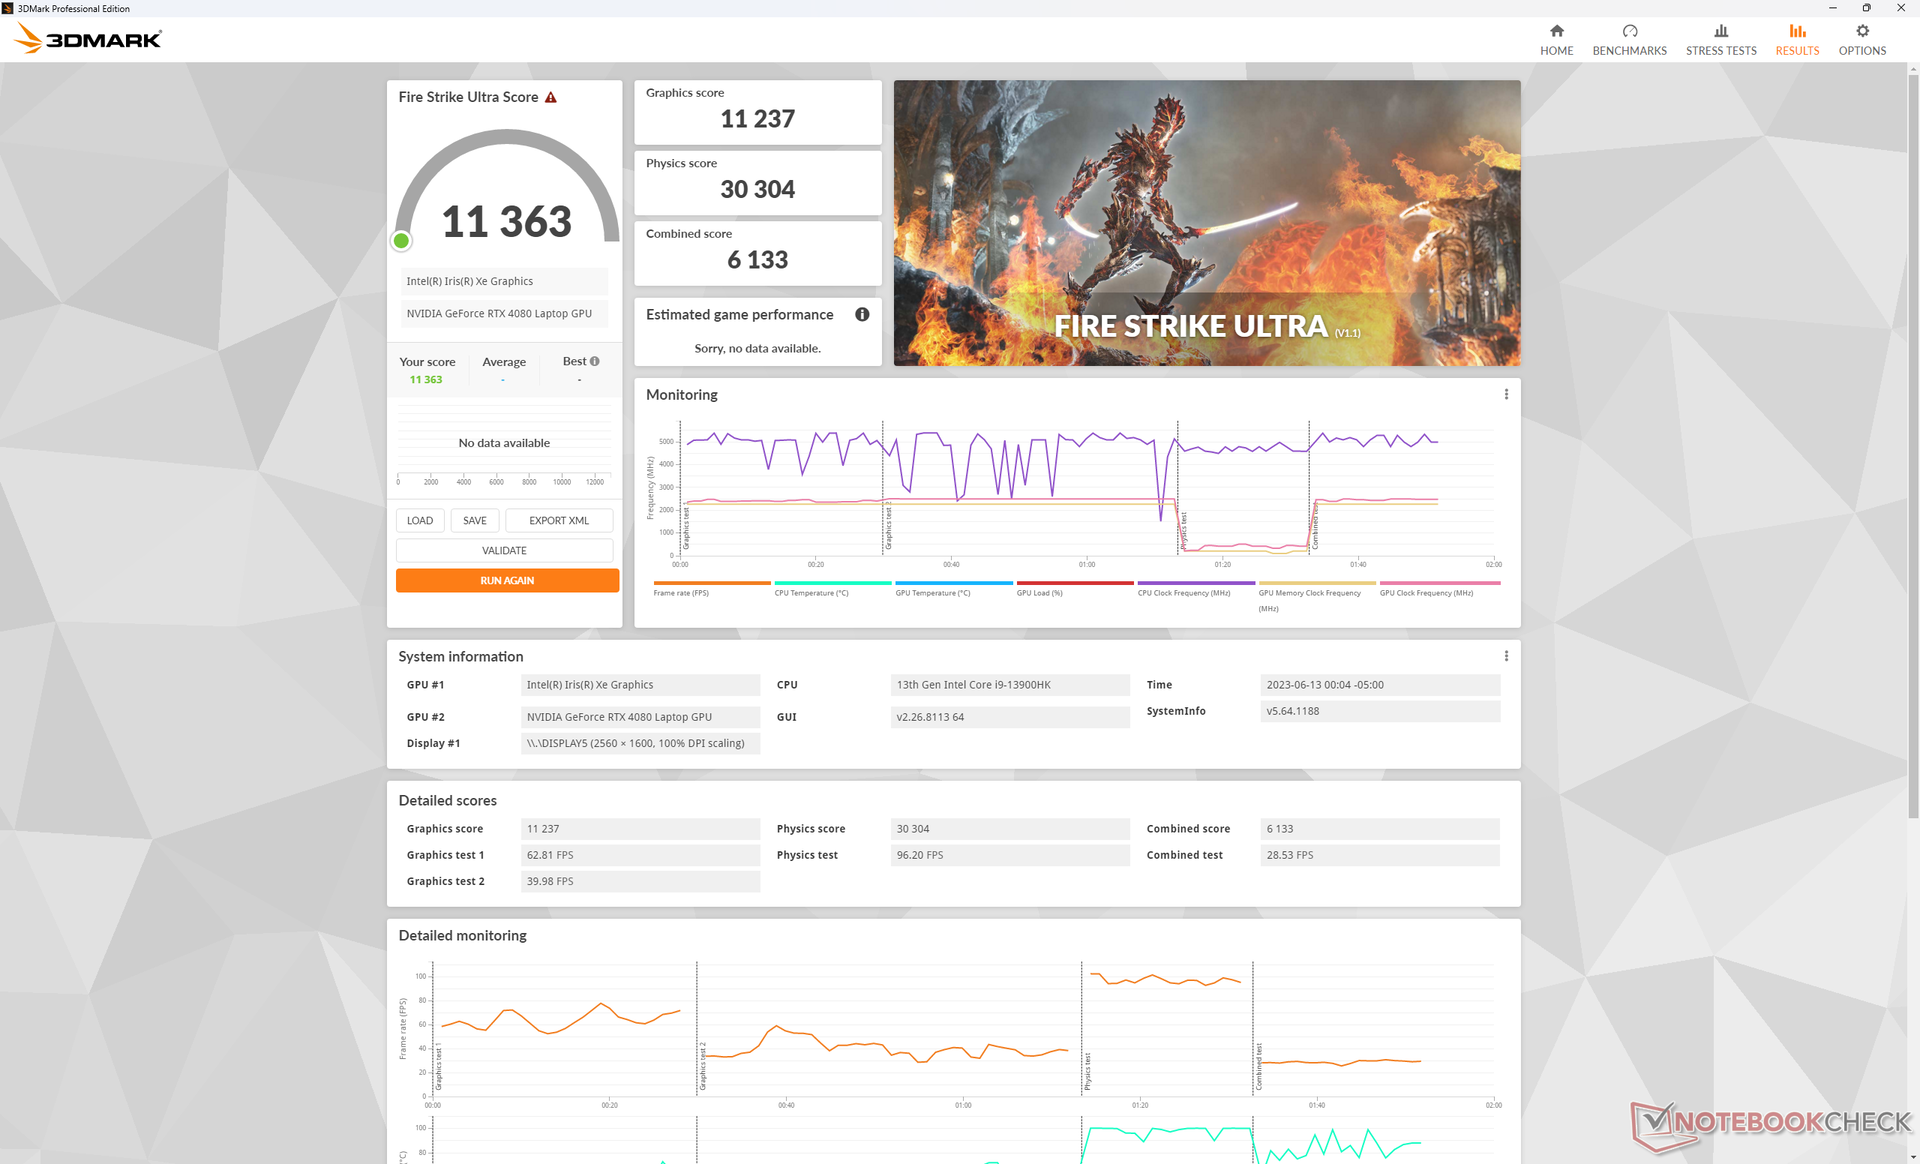
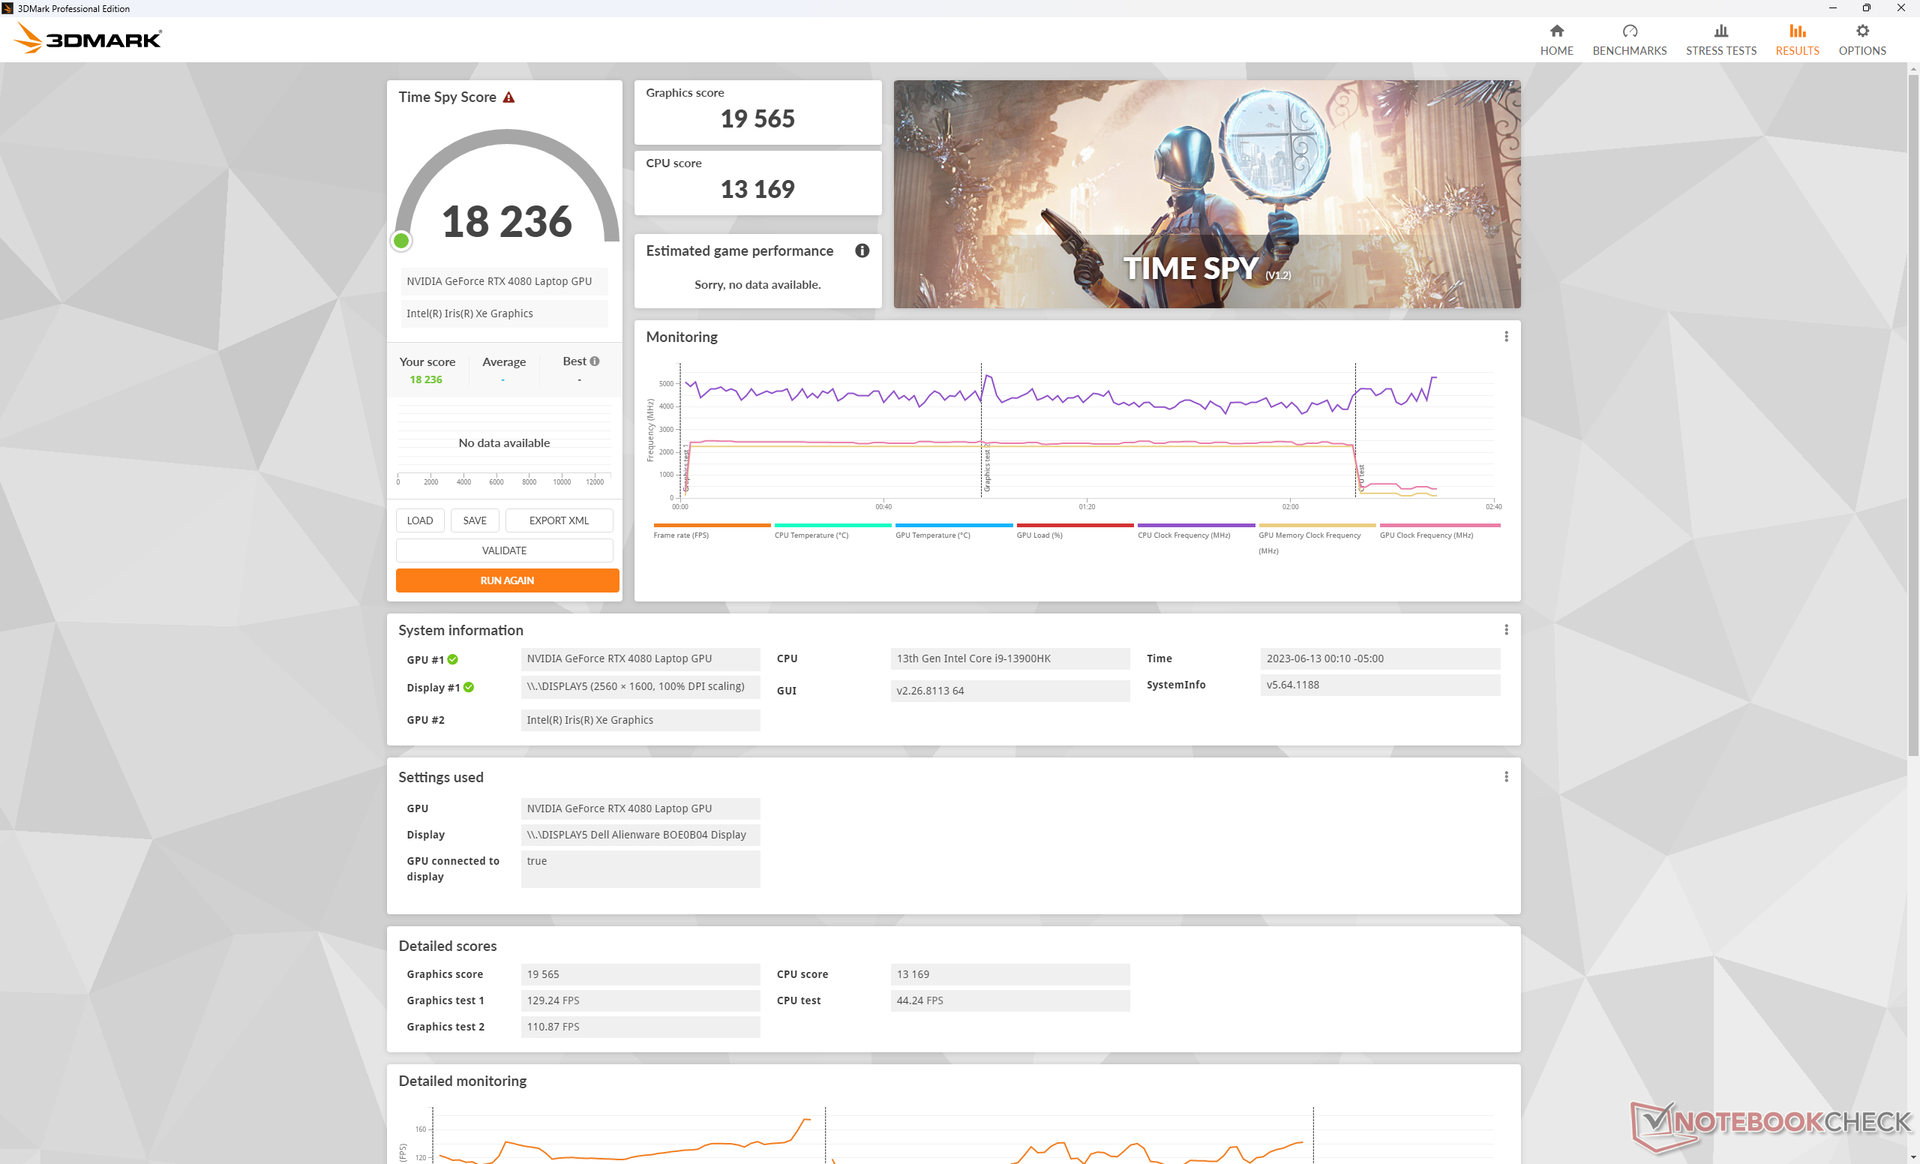
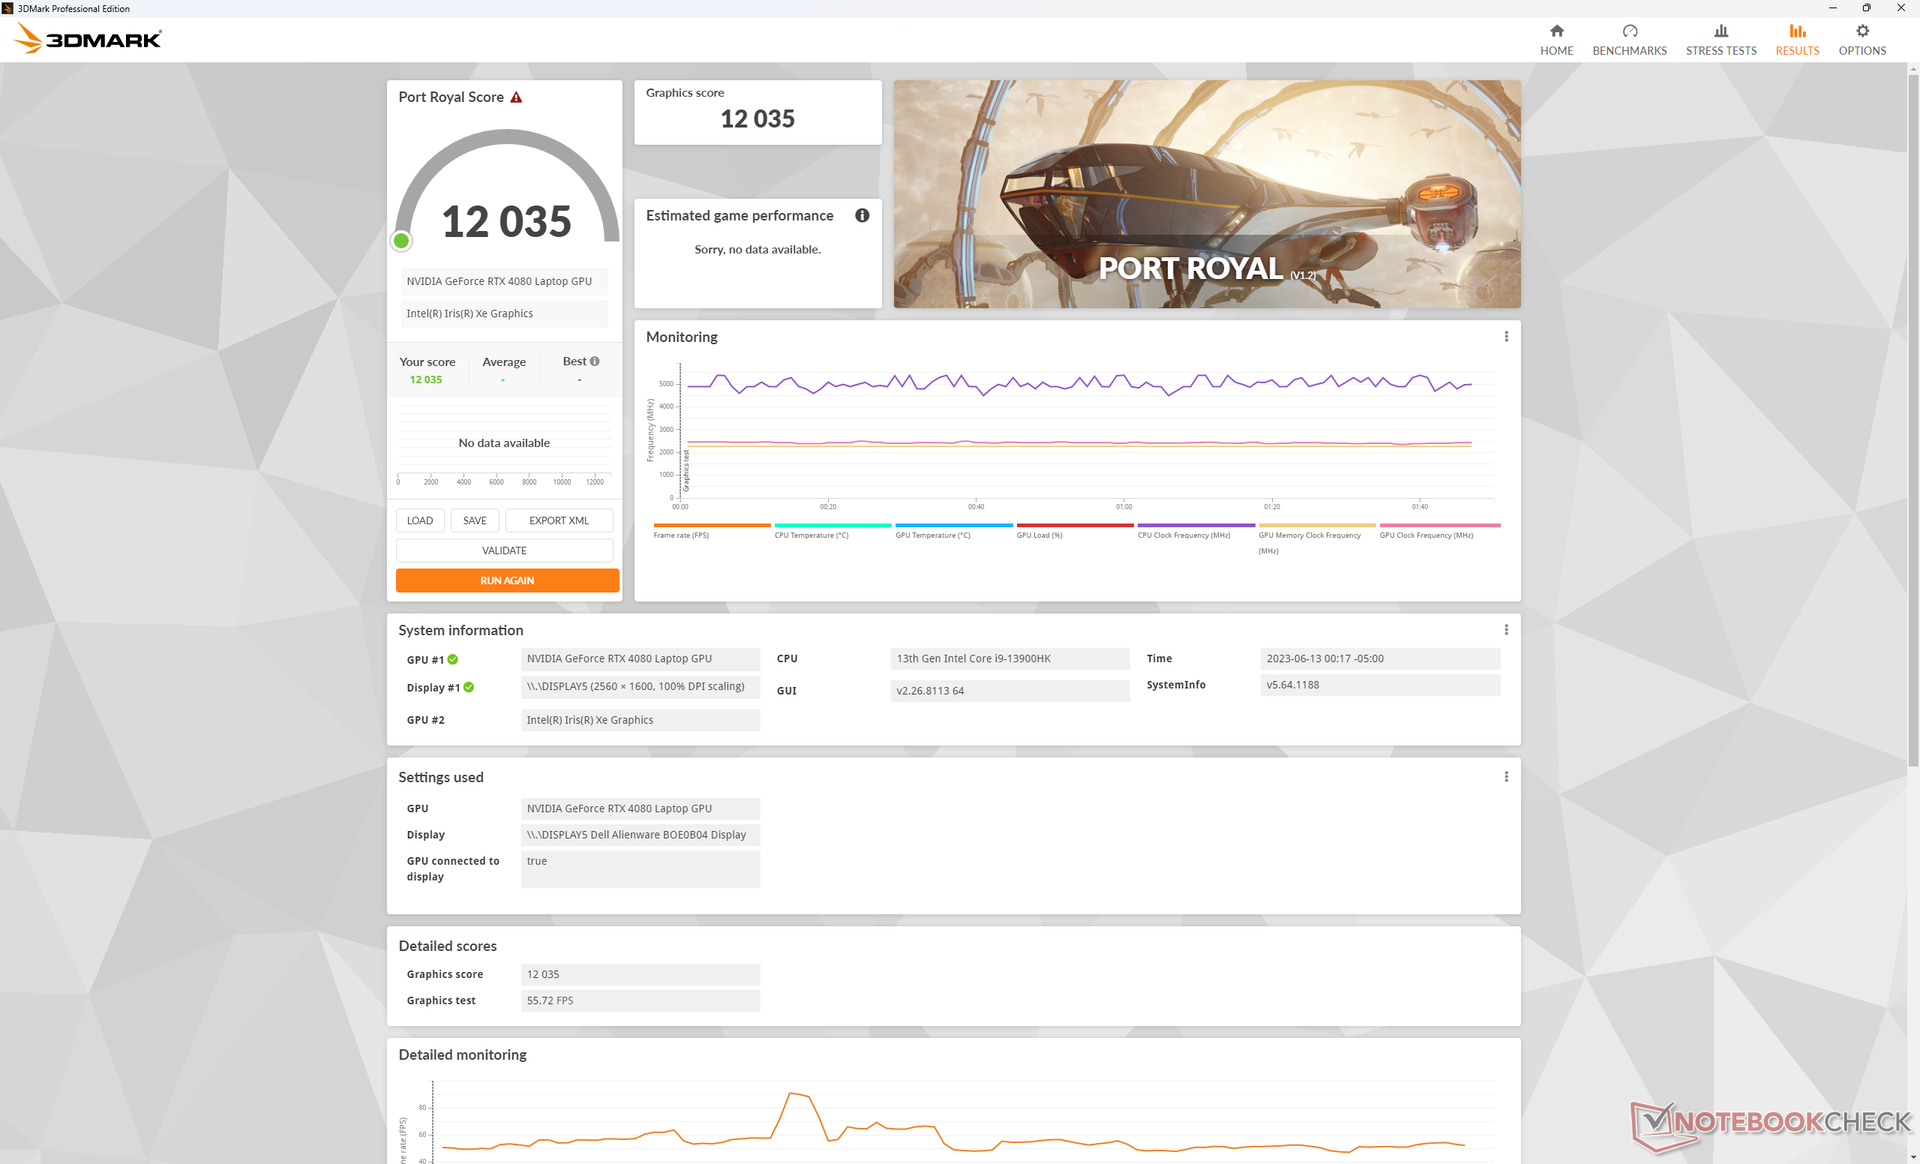
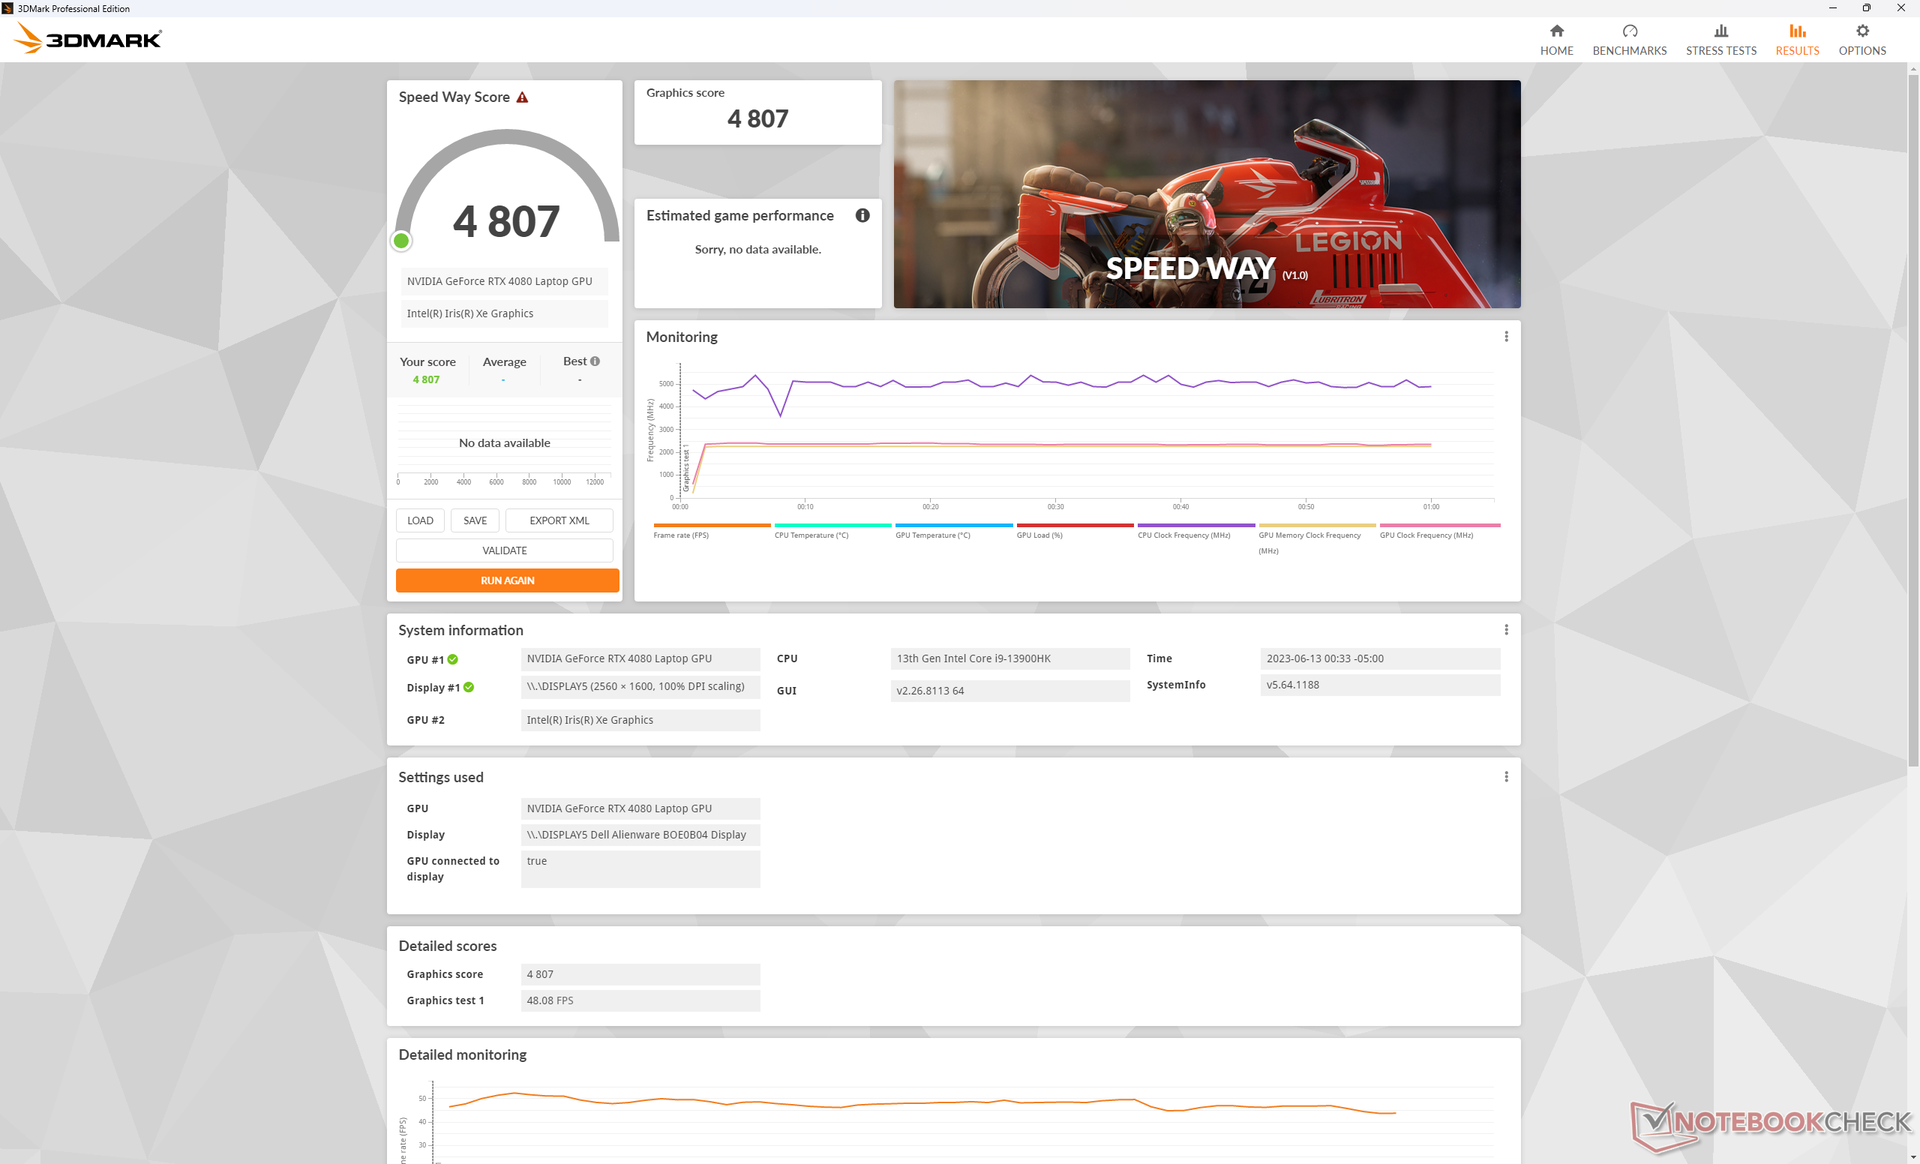
The GeForce RTX 4080 in our Alienware x16 is about 5 to 10 percent faster than the average laptop in our database equipped with the same RTX 4080 GPU. The advantage may not seem like a lot, but it's enough to propel the system to be one of the fastest RTX 4080 gaming laptops you can buy. 3DMark results are only within 10 percent of the RTX 4090 in the Asus Zephyrus Duo 16, for example.
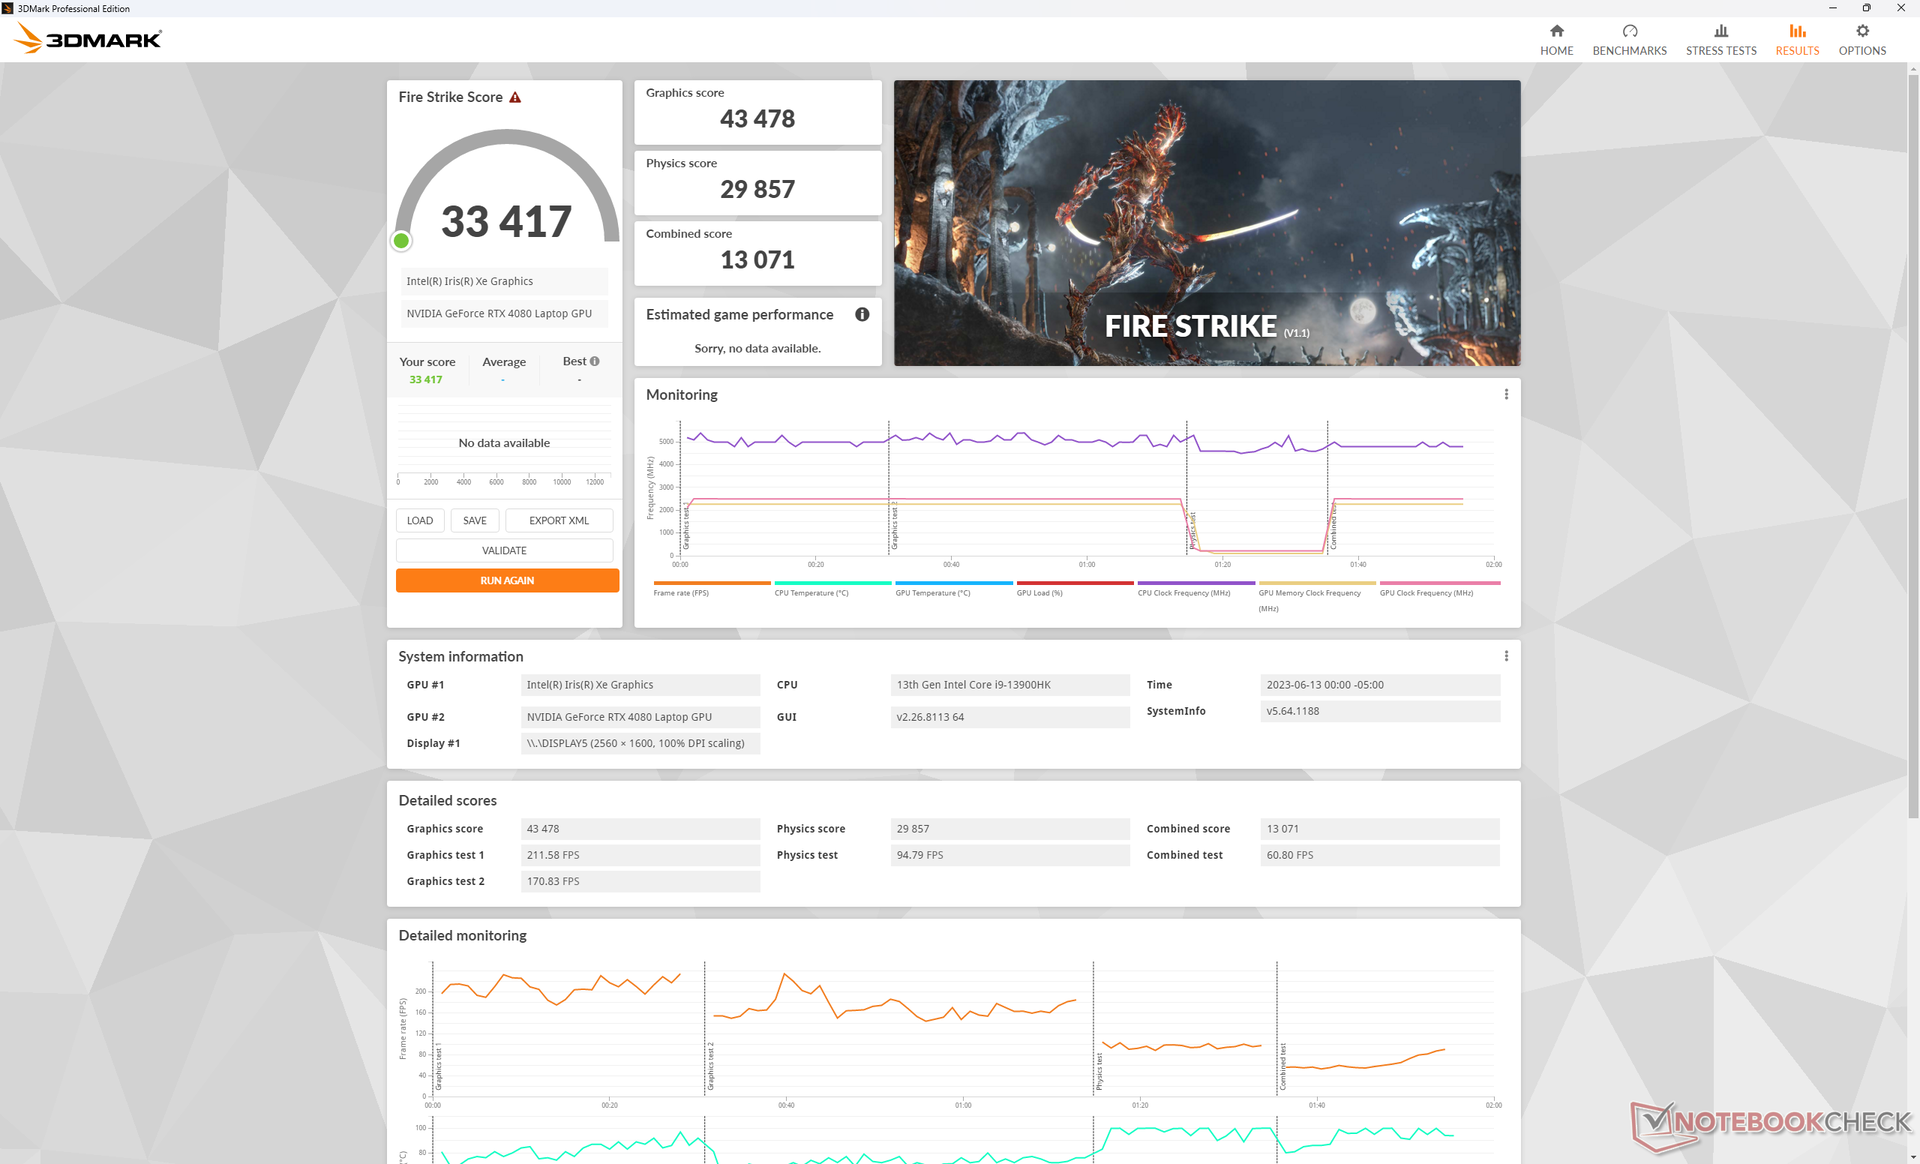
Interestingly, 3DMark scores would fall by only just a few percentage points when running on the quieter Performance and Balanced modes instead of on the highest Overdrive mode as shown by the table below. This will be important to keep in mind for the Stress Test and System Noise sections below.
Downgrading to the RTX 4070 option is expected to impact performance by as much as 30 to 35 percent while upgrading to the RTX 4090 is expected to increase performance by about 10 percent.
| Power Profile Setting | Fire Strike Physics Score | Fire Strike GPU Score | Fire Strike Combined Score |
| Overdrive | 29857 | 43478 | 13071 |
| Performance | 27890 (-7%) | 43605 (-0%) | 12961 (-1%) |
| Balanced | 28704 (-4%) | 41909 (-4%) | 12476 (-5%) |
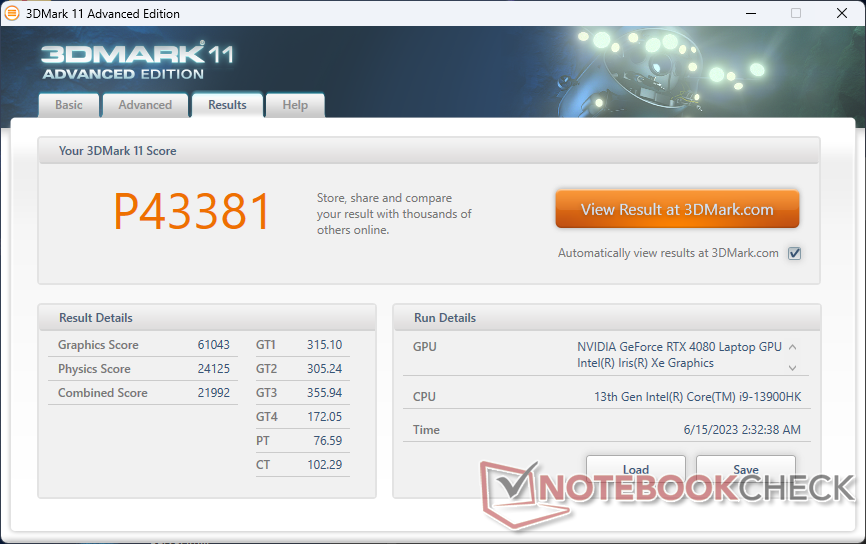
| 3DMark 11 Performance | 43381 points | |
| 3DMark Fire Strike Score | 33417 points | |
| 3DMark Time Spy Score | 18236 points | |
Help | ||
* ... smaller is better
Gaming Performance
All games are playable at the native QHD+ resolution with stable frame rates at or above 60 FPS. Even 4K gaming is possible on an external monitor with most settings on high to maximum including Returnal and F122. For triple-digit frame rates, however, you'll want to enable DLSS 2 or DLSS 3 where available to better exploit the high refresh rate of the monitor.
Witcher 3 FPS Chart
| low | med. | high | ultra | QHD | 4K | |
|---|---|---|---|---|---|---|
| GTA V (2015) | 185.8 | 180.4 | 176.4 | 120.3 | 115.4 | 142.9 |
| The Witcher 3 (2015) | 425.6 | 352.7 | 306.5 | 160.2 | 115 | |
| Dota 2 Reborn (2015) | 178.8 | 164 | 159.7 | 146.8 | 129.4 | |
| Final Fantasy XV Benchmark (2018) | 211 | 195.5 | 164.2 | 132.4 | 76.2 | |
| X-Plane 11.11 (2018) | 145.3 | 134.5 | 104.2 | 90.5 | ||
| Strange Brigade (2018) | 469 | 373 | 350 | 325 | 237 | 120.5 |
| Shadow of the Tomb Raider (2018) | 165 | 143 | 84 | |||
| Far Cry 6 (2021) | 121 | 112 | 73 | |||
| Cyberpunk 2077 1.6 (2022) | 158 | 150.9 | 141.2 | 133.6 | 84.4 | 38.5 |
| Tiny Tina's Wonderlands (2022) | 256.6 | 217.3 | 183.3 | 156.4 | 111.1 | 58.6 |
| F1 22 (2022) | 265 | 259 | 244 | 110 | 79 | 39 |
| Call of Duty Modern Warfare 2 2022 (2022) | 139 | 110 | 67 | |||
| Returnal (2023) | 116 | 117 | 114 | 109 | 79 | 43 |
Emissions
System Noise — Lots Of Power Profile Options
Fan noise is directly tied to the ACC power profile settings. If not gaming, it's recommended to have ACC set to Balanced mode or Quiet mode as the fans tend to pulse much more frequently when on Performance mode or Overdrive mode.
Running Witcher 3 on Performance mode and Overdrive mode would result in a fan noise of 50 dB(A) and 55 dB(A), respectively. Since frame rate loss is minimal between the Performance and Overdrive modes as mentioned in our GPU Performance section above, you can have a noticeably quieter gaming experience when set to Performance mode. Fan noise would be even quieter on Balanced mode without significantly impacting frame rates. 50+ dB(A) is still very loud, of course, but that is nonetheless a common range on competing models like the Lenovo Legion Pro 7 or Razer Blade 16.
Noise level
| Idle |
| 23.1 / 25.8 / 25.8 dB(A) |
| Load |
| 39.3 / 54.8 dB(A) |
 | ||
30 dB silent 40 dB(A) audible 50 dB(A) loud |
||
min: | ||
| Alienware x16 R1 GeForce RTX 4080 Laptop GPU, i9-13900HK, SK hynix PC801 HFS001TEJ9X101N | Lenovo Legion Pro 7 RTX4090 GeForce RTX 4090 Laptop GPU, i9-13900HX, Samsung PM9A1 MZVL21T0HCLR | Asus ROG Zephyrus M16 GU604VY-NM042X GeForce RTX 4090 Laptop GPU, i9-13900H, Samsung PM9A1 MZVL22T0HBLB | Razer Blade 16 Early 2023 GeForce RTX 4080 Laptop GPU, i9-13950HX, SSSTC CA6-8D1024 | Dell G16 7620 GeForce RTX 3060 Laptop GPU, i7-12700H, WDC PC SN810 512GB | Alienware m17 R5 (R9 6900HX, RX 6850M XT) Radeon RX 6850M XT, R9 6900HX, SSSTC CA6-8D1024 | |
|---|---|---|---|---|---|---|
| Noise | -17% | -10% | 3% | -2% | 2% | |
| off / environment * (dB) | 22.7 | 25 -10% | 24 -6% | 23 -1% | 23.2 -2% | 23 -1% |
| Idle Minimum * (dB) | 23.1 | 28 -21% | 24 -4% | 23 -0% | 28.3 -23% | 23 -0% |
| Idle Average * (dB) | 25.8 | 30 -16% | 29.96 -16% | 23 11% | 28.8 -12% | 28.11 -9% |
| Idle Maximum * (dB) | 25.8 | 38 -47% | 34.27 -33% | 23.6 9% | 28.9 -12% | 28.11 -9% |
| Load Average * (dB) | 39.3 | 48 -22% | 35.89 9% | 39 1% | 32.4 18% | 30.62 22% |
| Witcher 3 ultra * (dB) | 49.9 | 53 -6% | 57.5 -15% | 51.6 -3% | 48.3 3% | 49.75 -0% |
| Load Maximum * (dB) | 54.8 | 55 -0% | 57.54 -5% | 51.3 6% | 48.1 12% | 50.17 8% |
* ... smaller is better
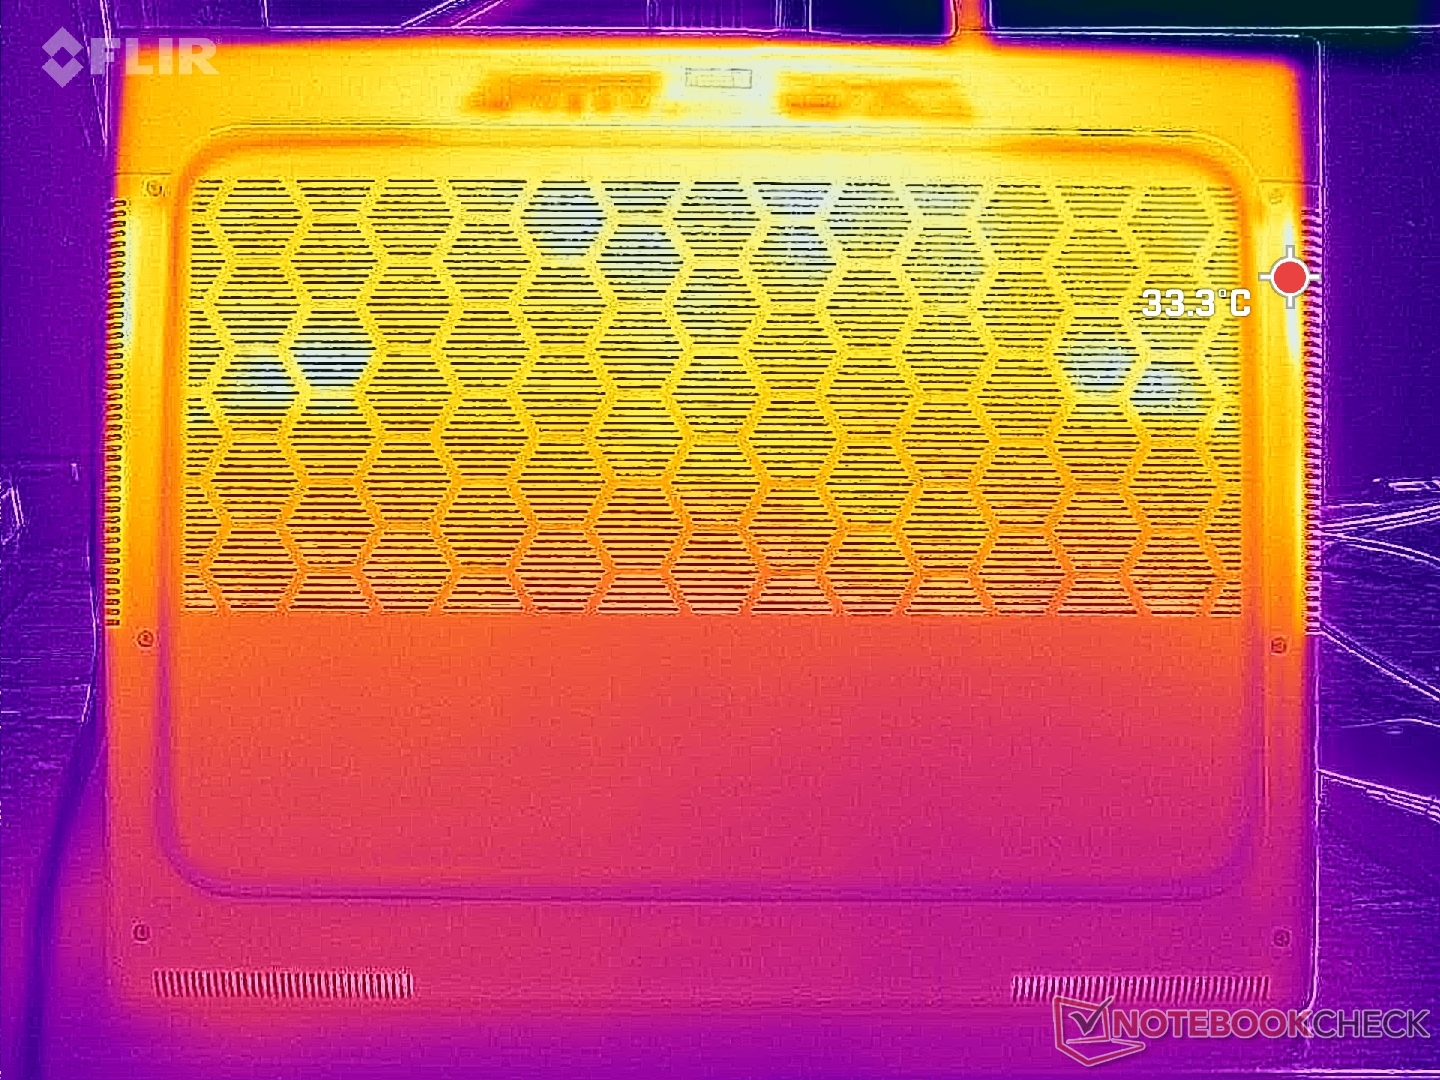
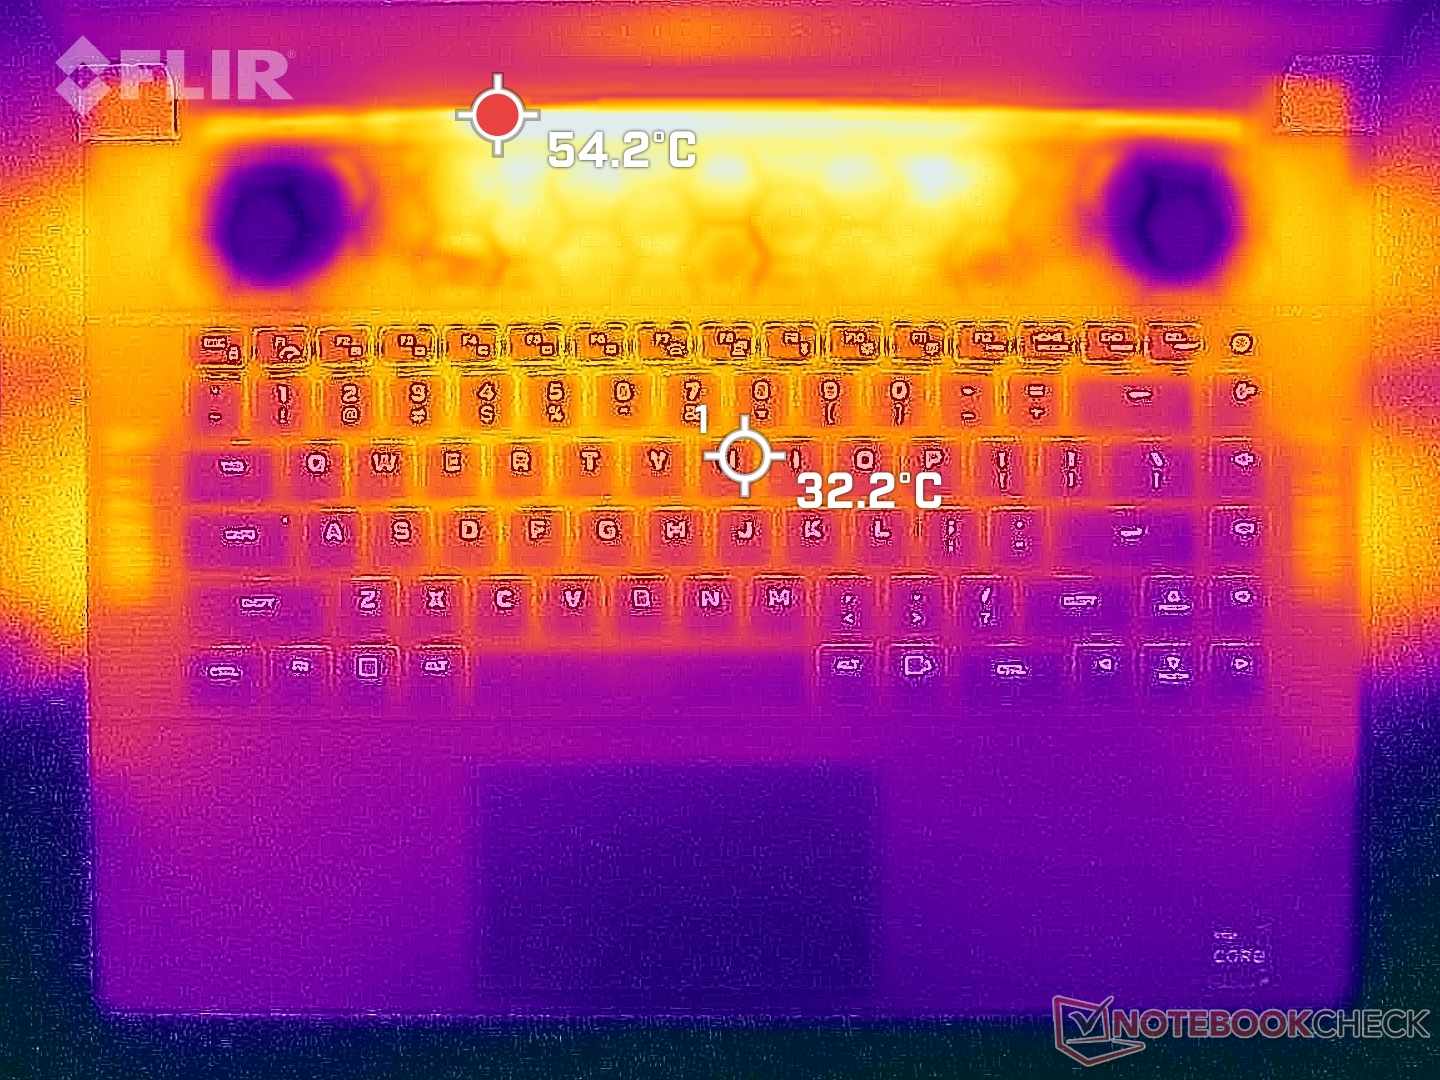
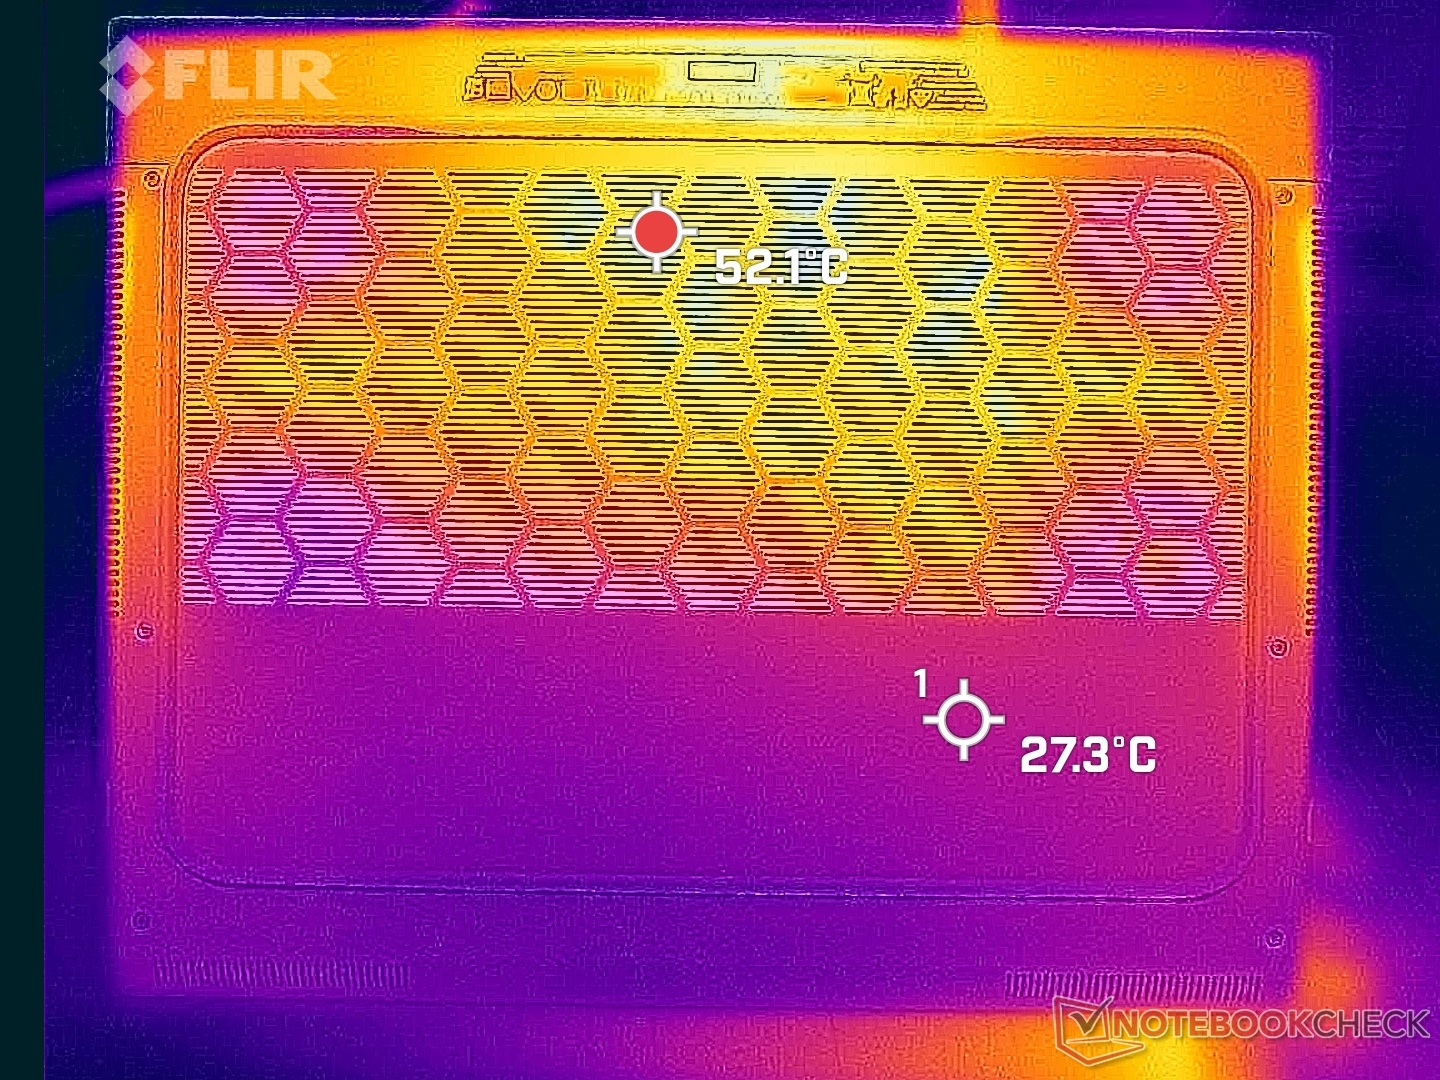
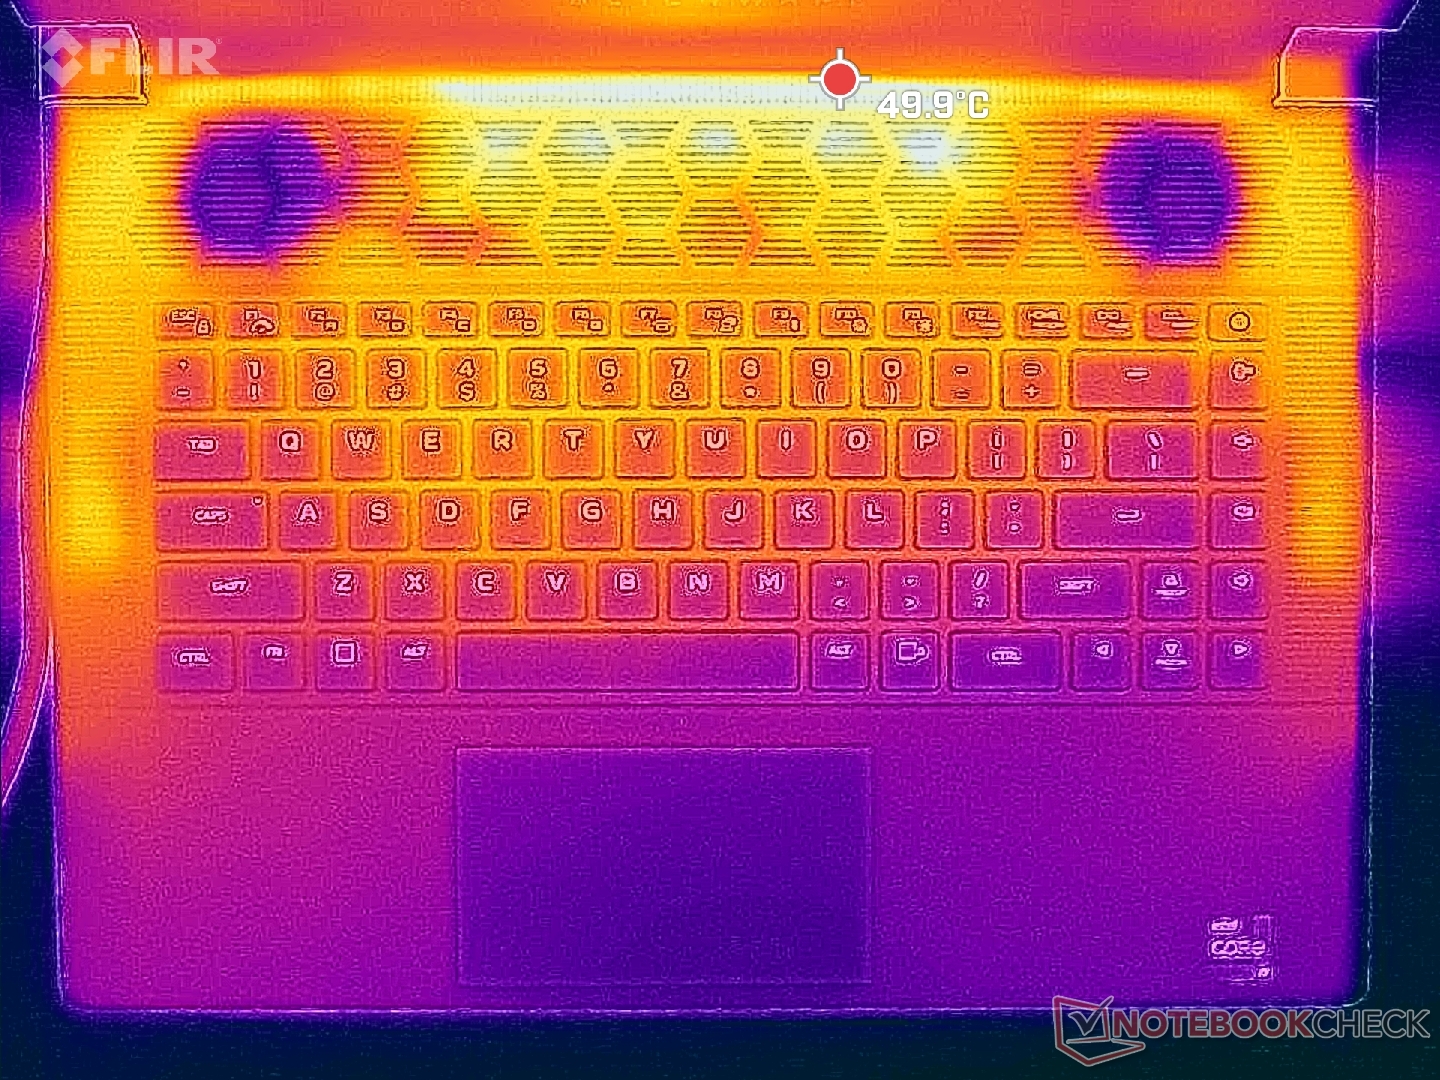
Temperature
Surface temperatures can be very warm due to the thin profile design. Hot spots can reach about 50 C on the top and bottom compared to just 40 C on the Blade 16. Thankfully, these hot spots are toward the rear and away from the palm rests.
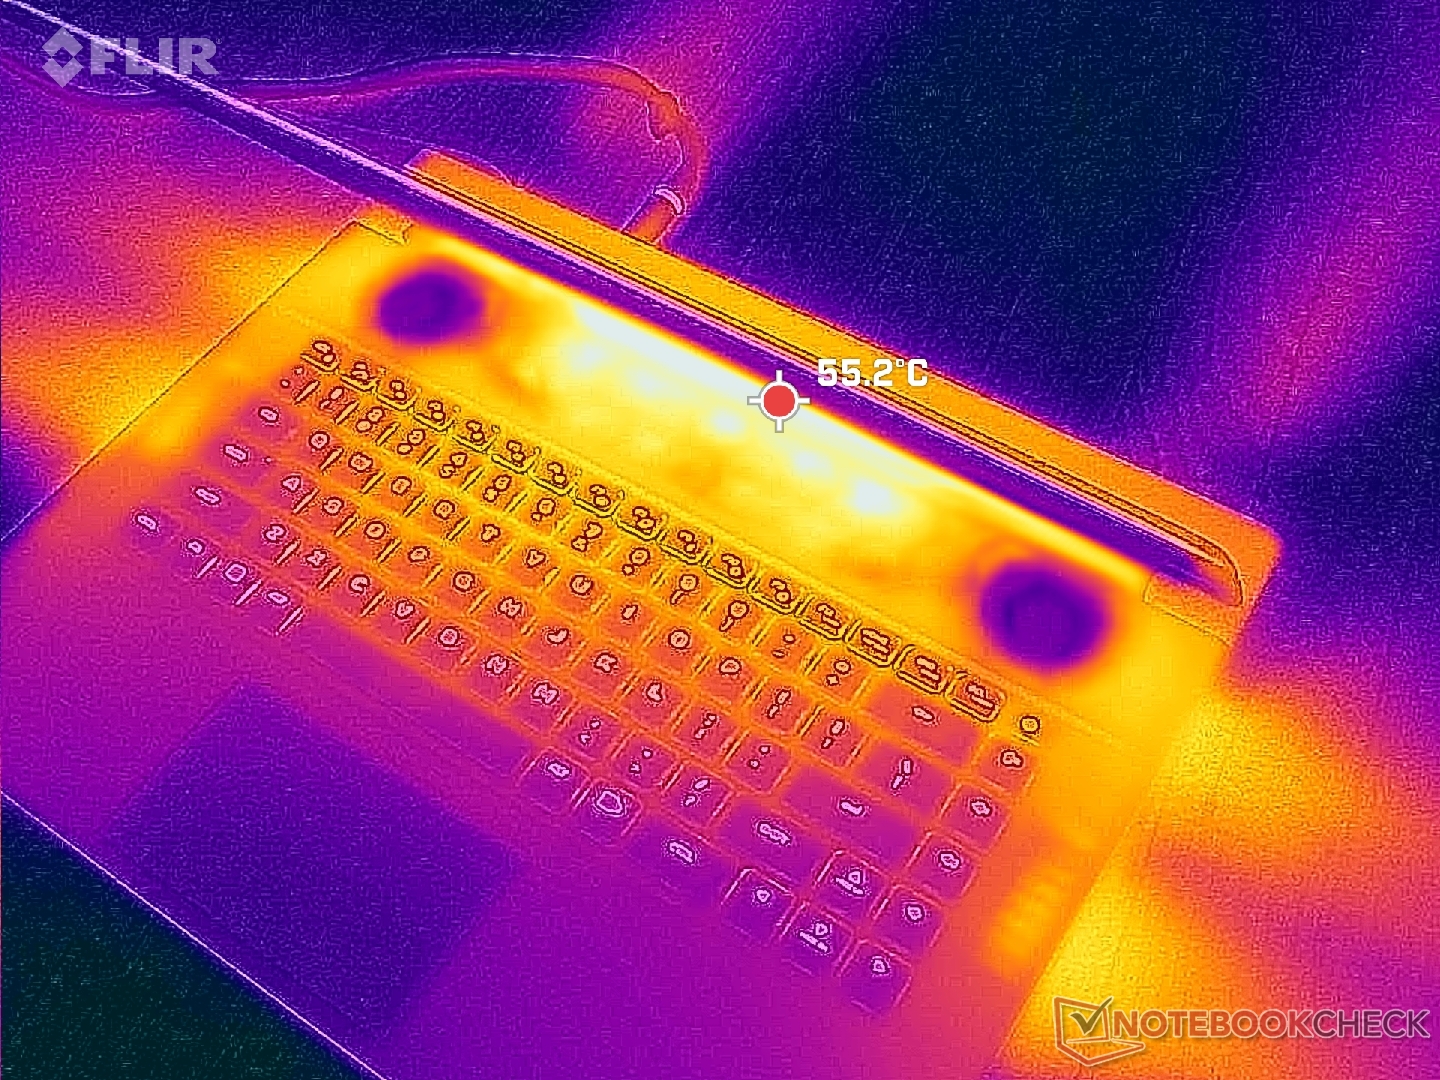
(-) The maximum temperature on the upper side is 47.2 °C / 117 F, compared to the average of 40.4 °C / 105 F, ranging from 21.2 to 68.8 °C for the class Gaming.
(-) The bottom heats up to a maximum of 47.8 °C / 118 F, compared to the average of 43.2 °C / 110 F
(+) In idle usage, the average temperature for the upper side is 30.8 °C / 87 F, compared to the device average of 33.9 °C / 93 F.
(±) Playing The Witcher 3, the average temperature for the upper side is 38 °C / 100 F, compared to the device average of 33.9 °C / 93 F.
(+) The palmrests and touchpad are cooler than skin temperature with a maximum of 30.6 °C / 87.1 F and are therefore cool to the touch.
(±) The average temperature of the palmrest area of similar devices was 28.8 °C / 83.8 F (-1.8 °C / -3.3 F).


| Alienware x16 R1 Intel Core i9-13900HK, NVIDIA GeForce RTX 4080 Laptop GPU | Lenovo Legion Pro 7 RTX4090 Intel Core i9-13900HX, NVIDIA GeForce RTX 4090 Laptop GPU | Asus ROG Zephyrus M16 GU604VY-NM042X Intel Core i9-13900H, NVIDIA GeForce RTX 4090 Laptop GPU | Razer Blade 16 Early 2023 Intel Core i9-13950HX, NVIDIA GeForce RTX 4080 Laptop GPU | Dell G16 7620 Intel Core i7-12700H, NVIDIA GeForce RTX 3060 Laptop GPU | Alienware m17 R5 (R9 6900HX, RX 6850M XT) AMD Ryzen 9 6900HX, AMD Radeon RX 6850M XT | |
|---|---|---|---|---|---|---|
| Heat | -4% | 6% | 15% | 14% | 2% | |
| Maximum Upper Side * (°C) | 47.2 | 53 -12% | 50 -6% | 40 15% | 47.6 -1% | 53 -12% |
| Maximum Bottom * (°C) | 47.8 | 59 -23% | 58 -21% | 37.6 21% | 54 -13% | 56 -17% |
| Idle Upper Side * (°C) | 36.8 | 34 8% | 26 29% | 32.4 12% | 23 37% | 30 18% |
| Idle Bottom * (°C) | 35.8 | 32 11% | 28 22% | 31.4 12% | 24.6 31% | 29 19% |
* ... smaller is better
Stress Test
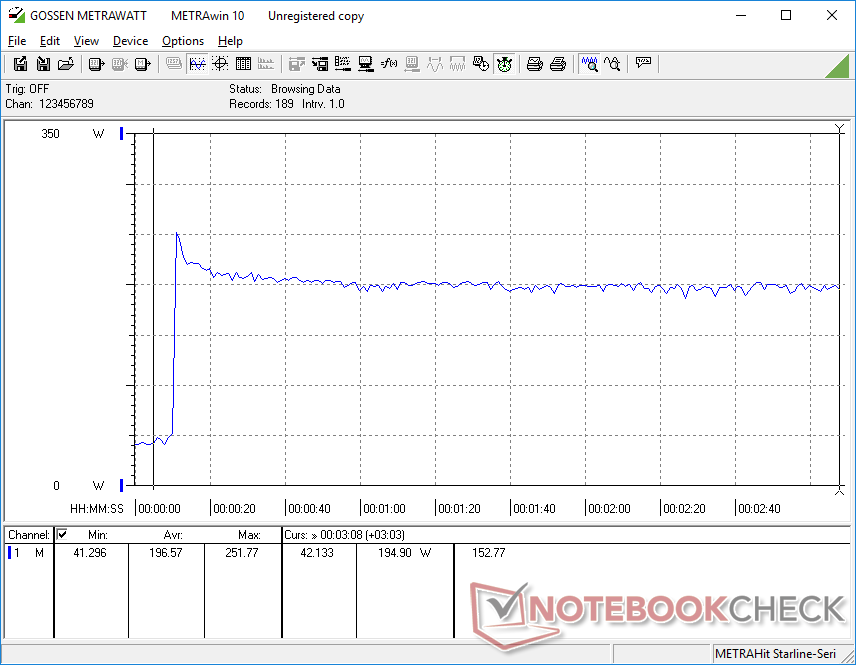
CPU clock rate, board power draw, and core temperature would spike to 4.5 GHz, 178 W, and 99 C, respectively, when initiating Prime95 stress. The CPU would eventually stabilize at 3.8 GHz, 123 W, and 99 C after just a couple of minutes. With core temperatures being this high, it's clear that the processor is pushing the cooling solution to its limits in order to sustain the highest Turbo Boost clock rates possible. Repeating this same test on the Blade 16, for example would result in a cooler stable core temperature of 82 C.
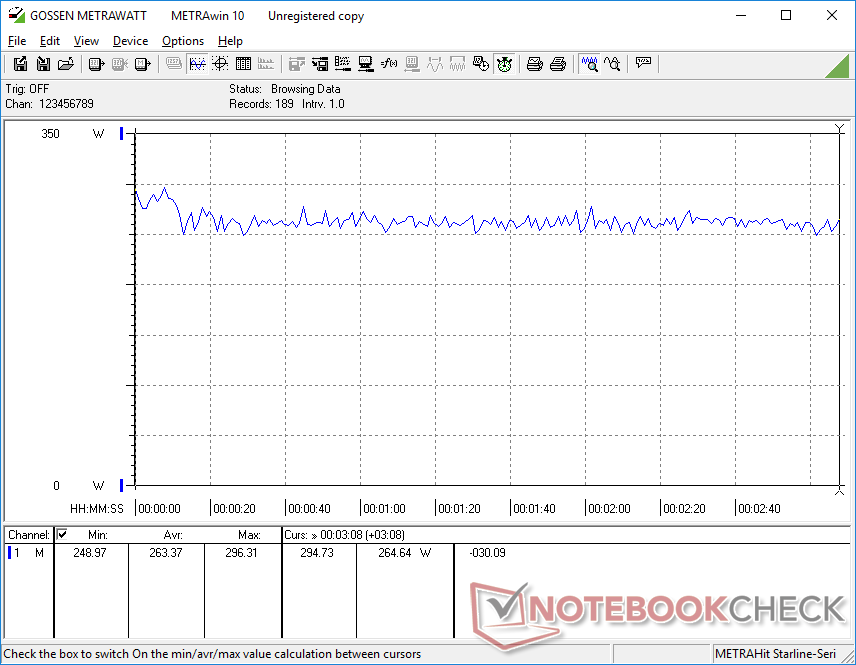
When running Witcher 3 on Overdrive mode to represent typical gaming loads, the GPU would stabilize at around 166 W against a target of 175 W. Interestingly, board power draw would barely fall to just 161 W when on Balanced mode as shown by the screenshots below to represent a very marginal performance deficit relative to the significantly quieter fan noise when compared to Overdrive mode. Owners may therefore consider gaming on Balanced mode instead of the louder Performance or Overdrive modes.
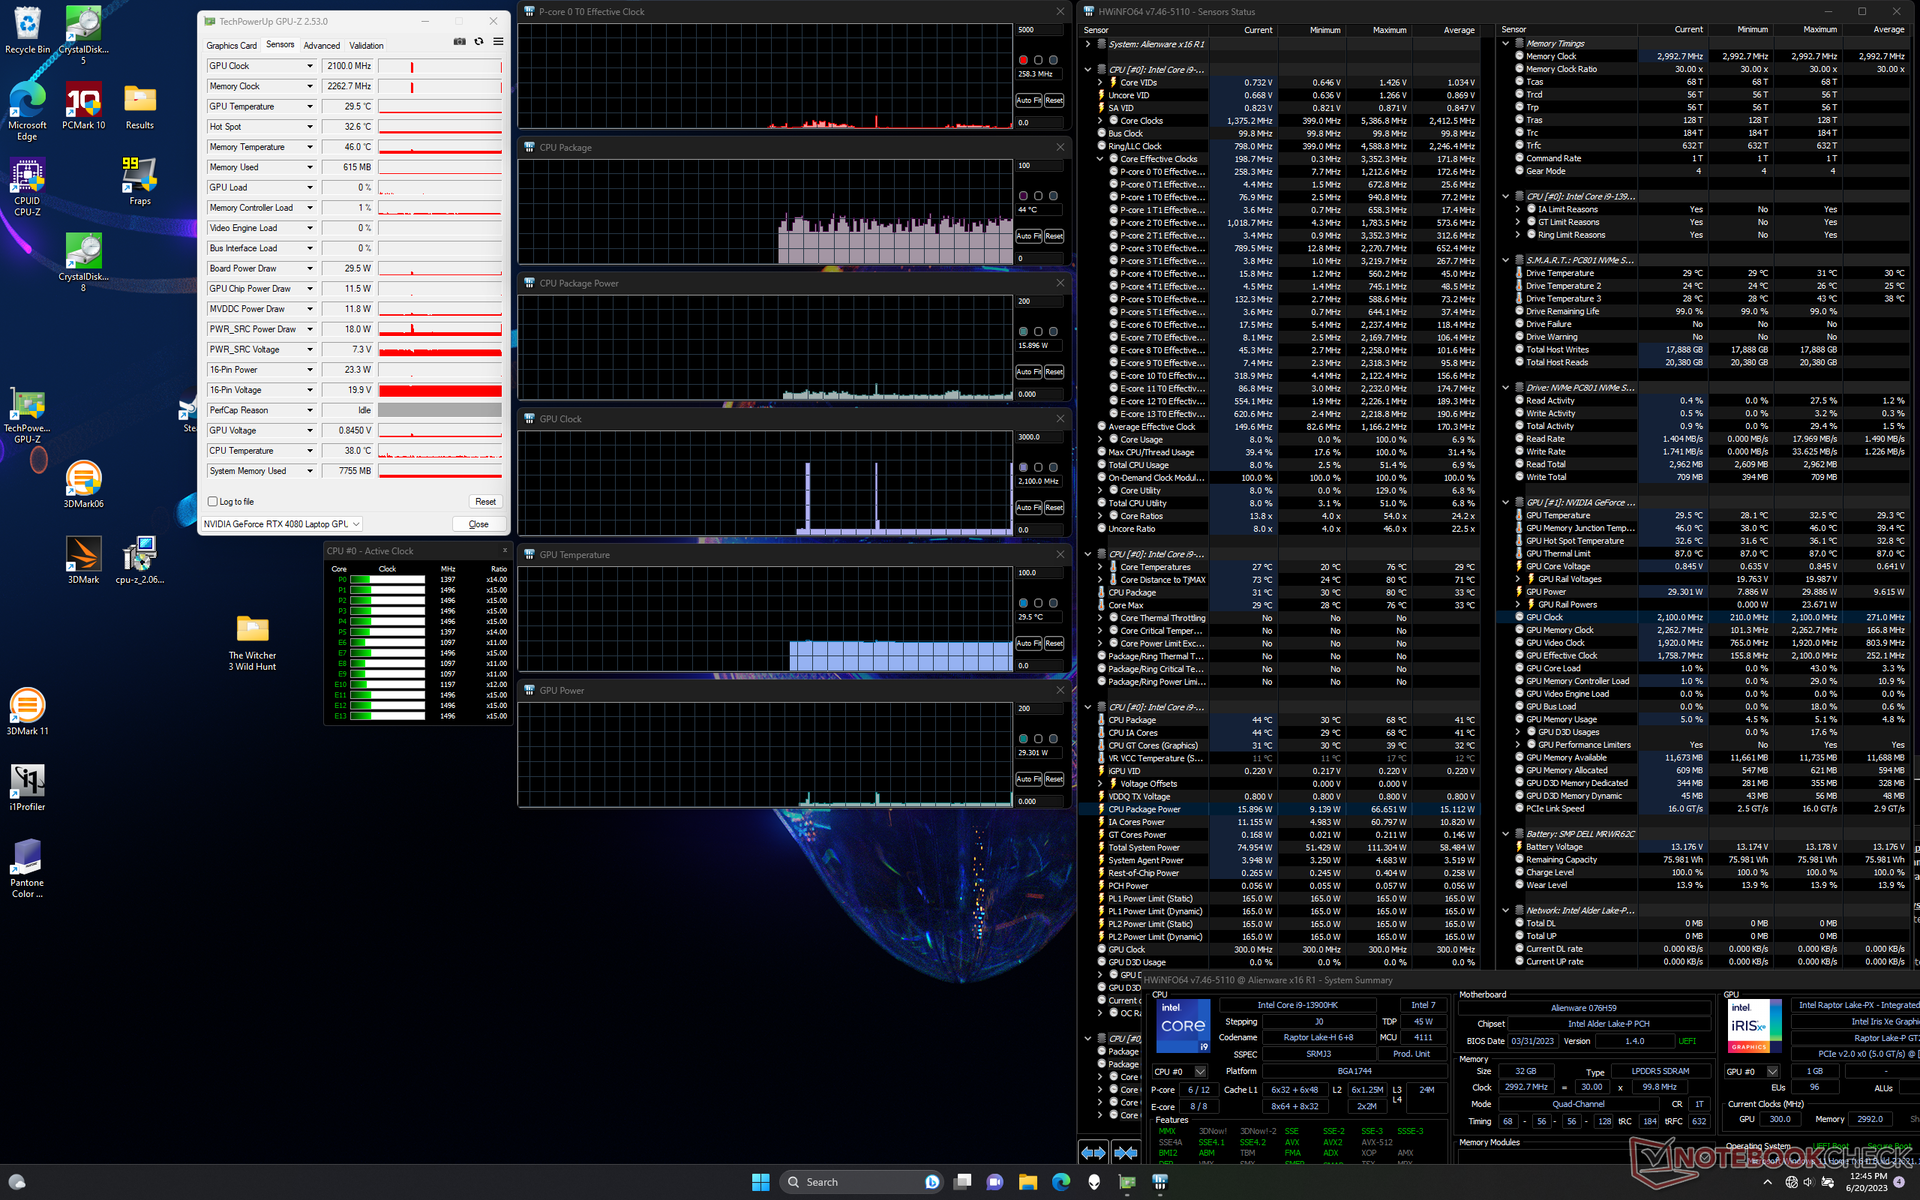

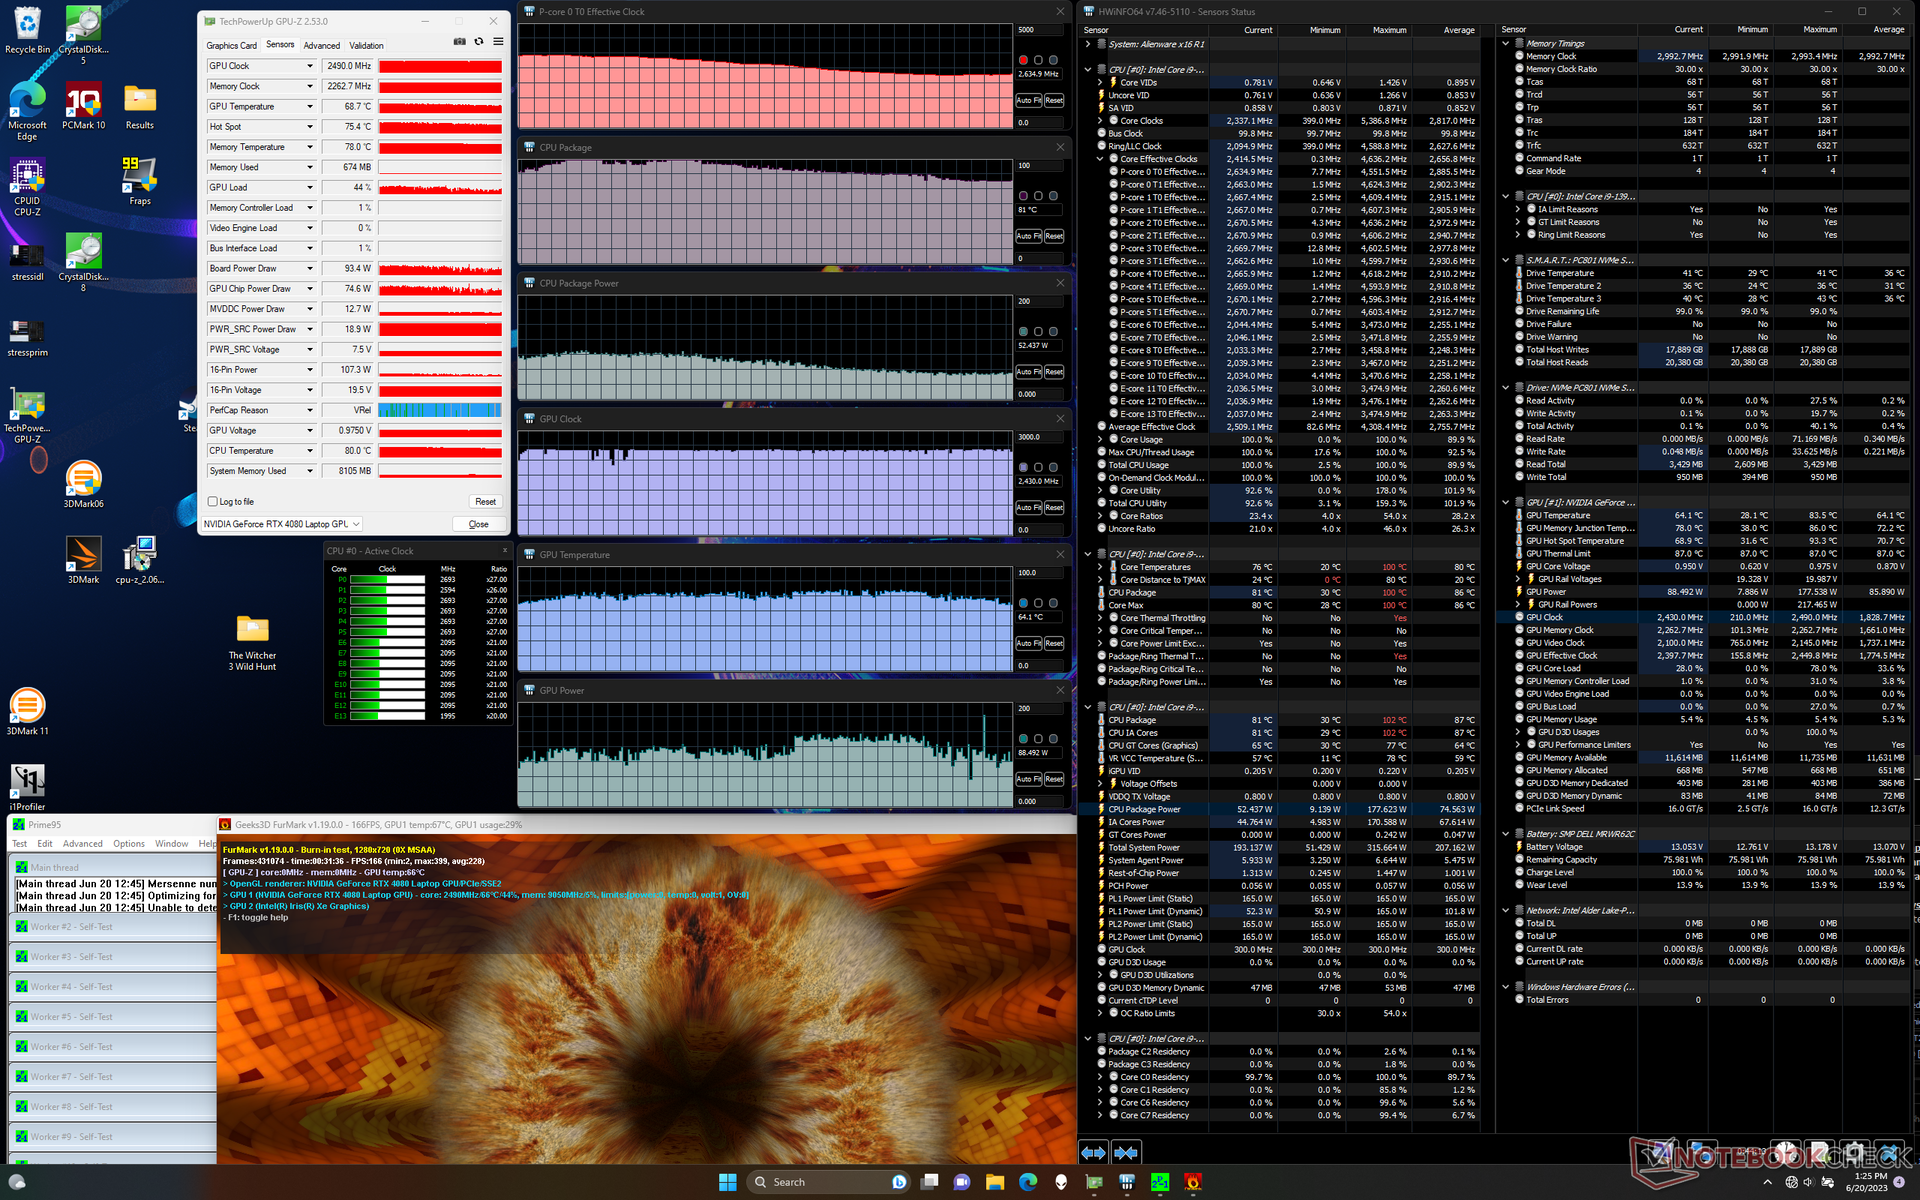

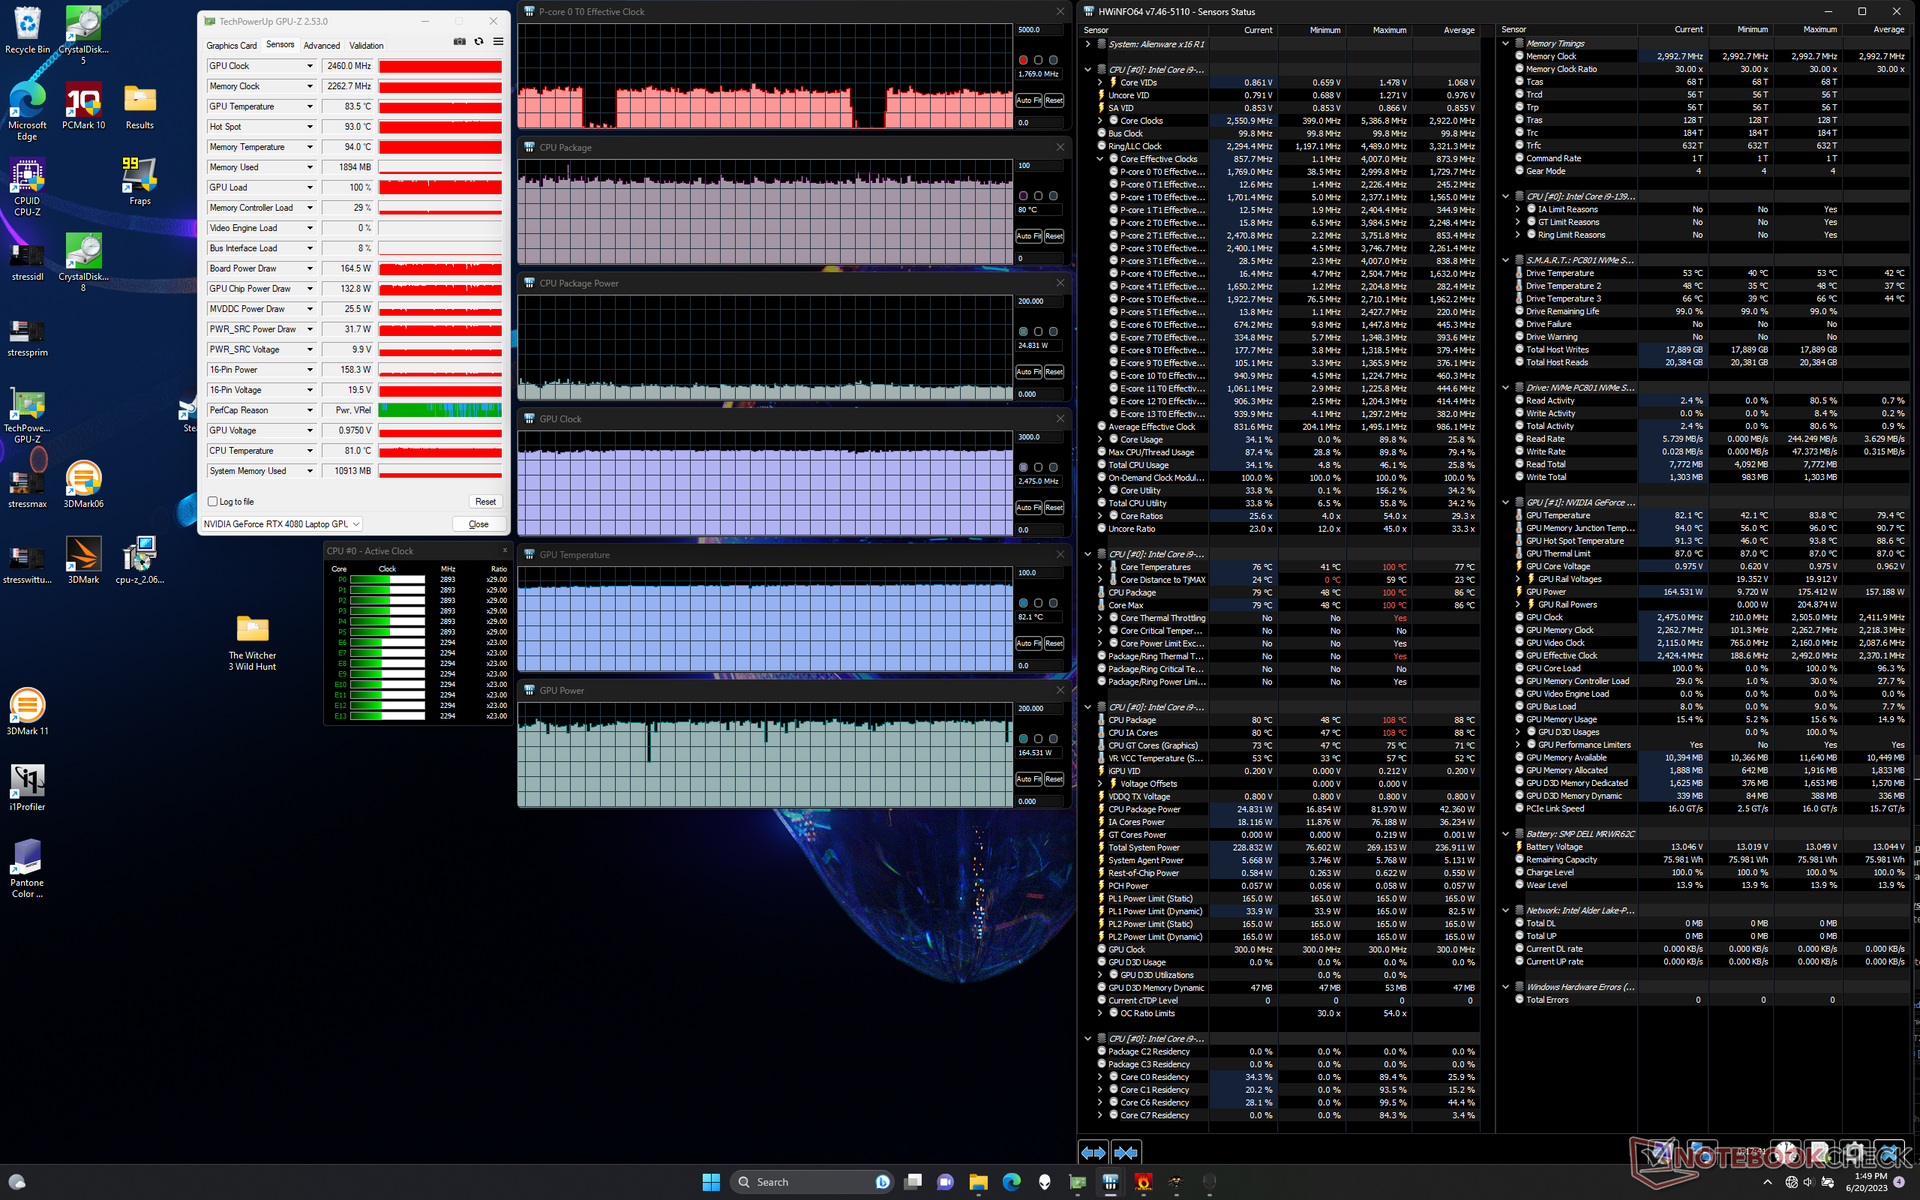
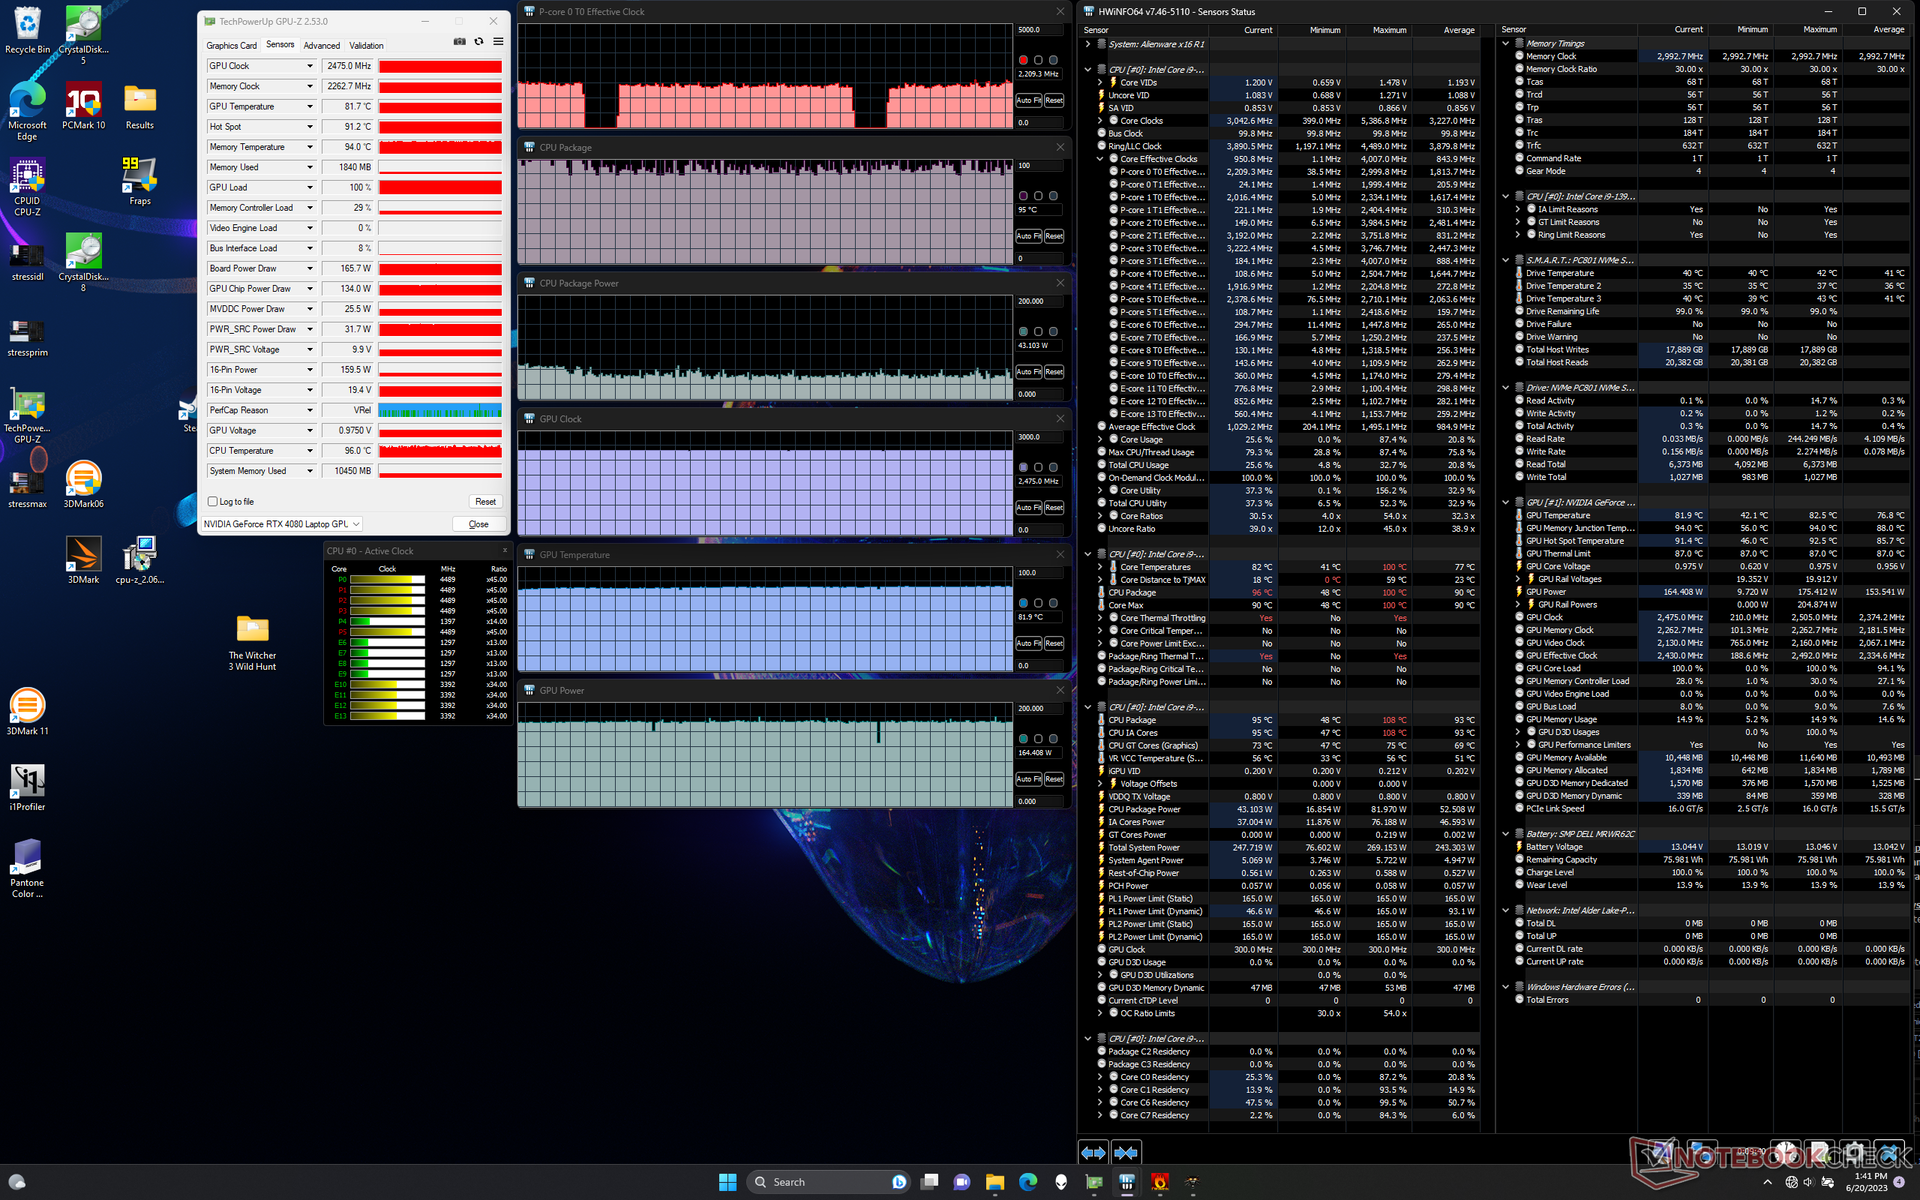
| CPU Clock (GHz) | GPU Clock (MHz) | Average CPU Temperature (°C) | Average GPU Temperature (°C) | |
| System Idle | -- | -- | 44 | 30 |
| Prime95 Stress | 3.8 | -- | 99 | 51 |
| Prime95 + FurMark Stress | 2.5 - 3.6 | 2475 | 82 - 100 | 72 - 77 |
| Witcher 3 Stress (Balanced mode) | ~1.8 | 2460 | 81 | 85 |
| Witcher 3 Stress (Performance mode) | ~1.8 | 2460 | 80 | 82 |
| Witcher 3 Stress (Overdrive mode) | ~2.2 | 2475 | 95 | 82 |
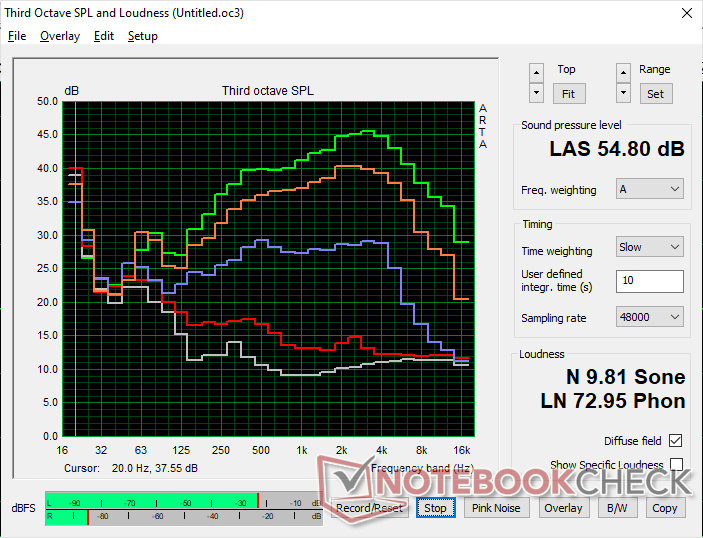
Speakers

Alienware x16 R1 audio analysis
(+) | speakers can play relatively loud (87.3 dB)
Bass 100 - 315 Hz
(±) | reduced bass - on average 7.3% lower than median
(±) | linearity of bass is average (9.1% delta to prev. frequency)
Mids 400 - 2000 Hz
(+) | balanced mids - only 2.2% away from median
(+) | mids are linear (3.8% delta to prev. frequency)
Highs 2 - 16 kHz
(+) | balanced highs - only 3.6% away from median
(+) | highs are linear (3.3% delta to prev. frequency)
Overall 100 - 16.000 Hz
(+) | overall sound is linear (7.9% difference to median)
Compared to same class
» 1% of all tested devices in this class were better, 1% similar, 98% worse
» The best had a delta of 6%, average was 18%, worst was 132%
Compared to all devices tested
» 2% of all tested devices were better, 1% similar, 98% worse
» The best had a delta of 4%, average was 23%, worst was 134%
Apple MacBook Pro 16 2021 M1 Pro audio analysis
(+) | speakers can play relatively loud (84.7 dB)
Bass 100 - 315 Hz
(+) | good bass - only 3.8% away from median
(+) | bass is linear (5.2% delta to prev. frequency)
Mids 400 - 2000 Hz
(+) | balanced mids - only 1.3% away from median
(+) | mids are linear (2.1% delta to prev. frequency)
Highs 2 - 16 kHz
(+) | balanced highs - only 1.9% away from median
(+) | highs are linear (2.7% delta to prev. frequency)
Overall 100 - 16.000 Hz
(+) | overall sound is linear (4.6% difference to median)
Compared to same class
» 0% of all tested devices in this class were better, 0% similar, 100% worse
» The best had a delta of 5%, average was 17%, worst was 45%
Compared to all devices tested
» 0% of all tested devices were better, 0% similar, 100% worse
» The best had a delta of 4%, average was 23%, worst was 134%
Energy Management
Power Consumption — High As Expected
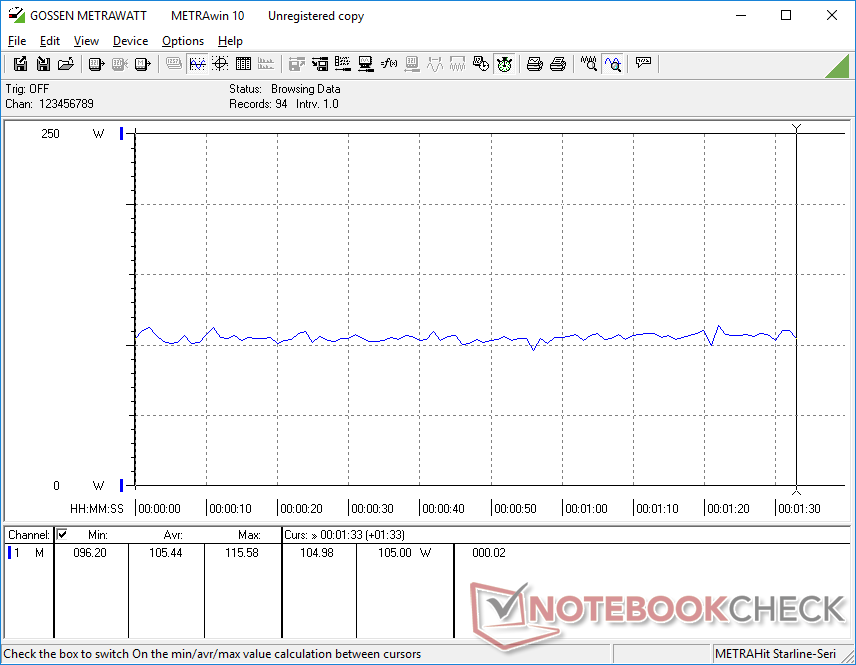
Power consumption ranges between 25 W and 50 W when idling on desktop depending on the power profile, GPU, and brightness settings. This range is on the high side even for the category as other 16-inch models like the Razer Blade 16 or Alienware m17 can reach as low as 15 W when on similar minimum power settings.
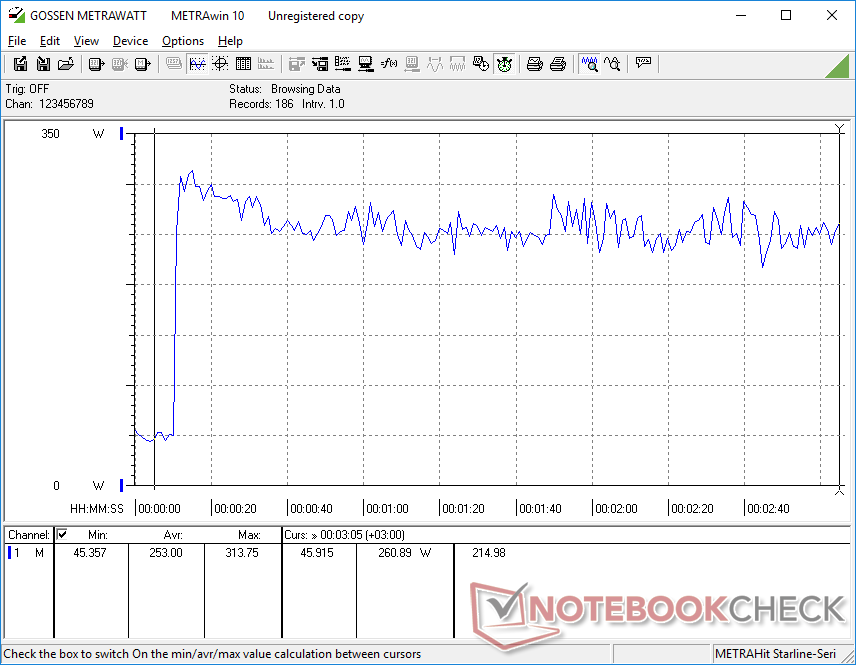
Gaming demands about 263 W which is in between the Asus ROG Strix G16 and MSI GE78 HX each with the same RTX 4080 GPU. Perhaps more notably, the RTX 4090-powered Asus ROG Zephyrus M16 consumes 20 percent less power while providing roughly the same graphics performance as our RTX 4080-powered Alienware.
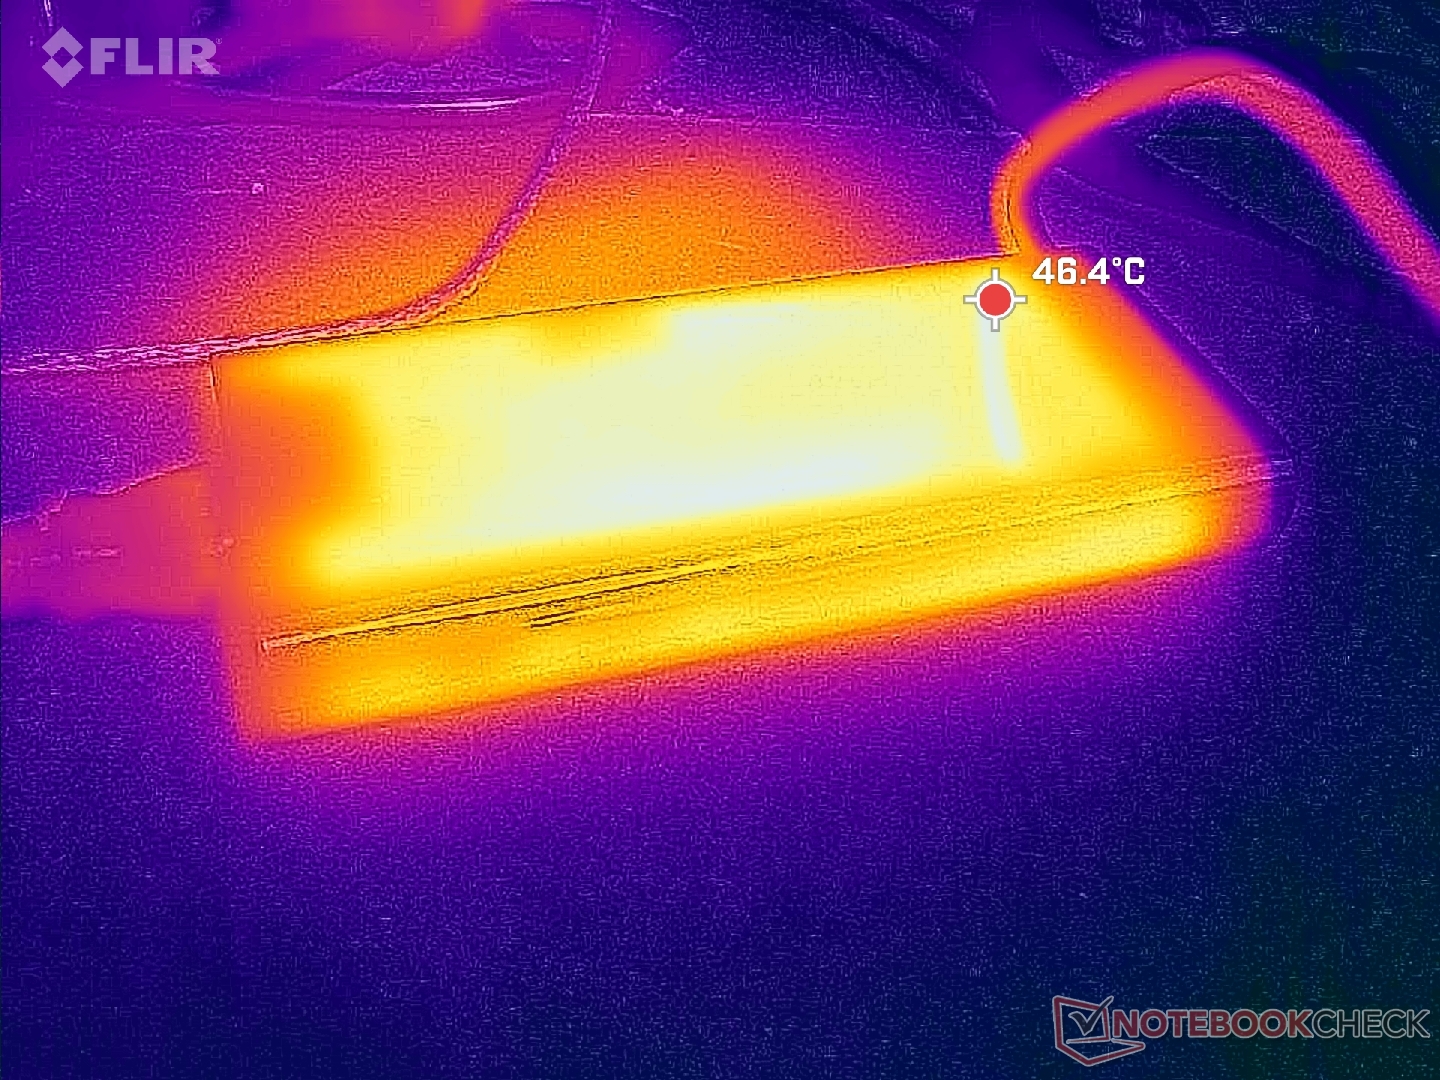
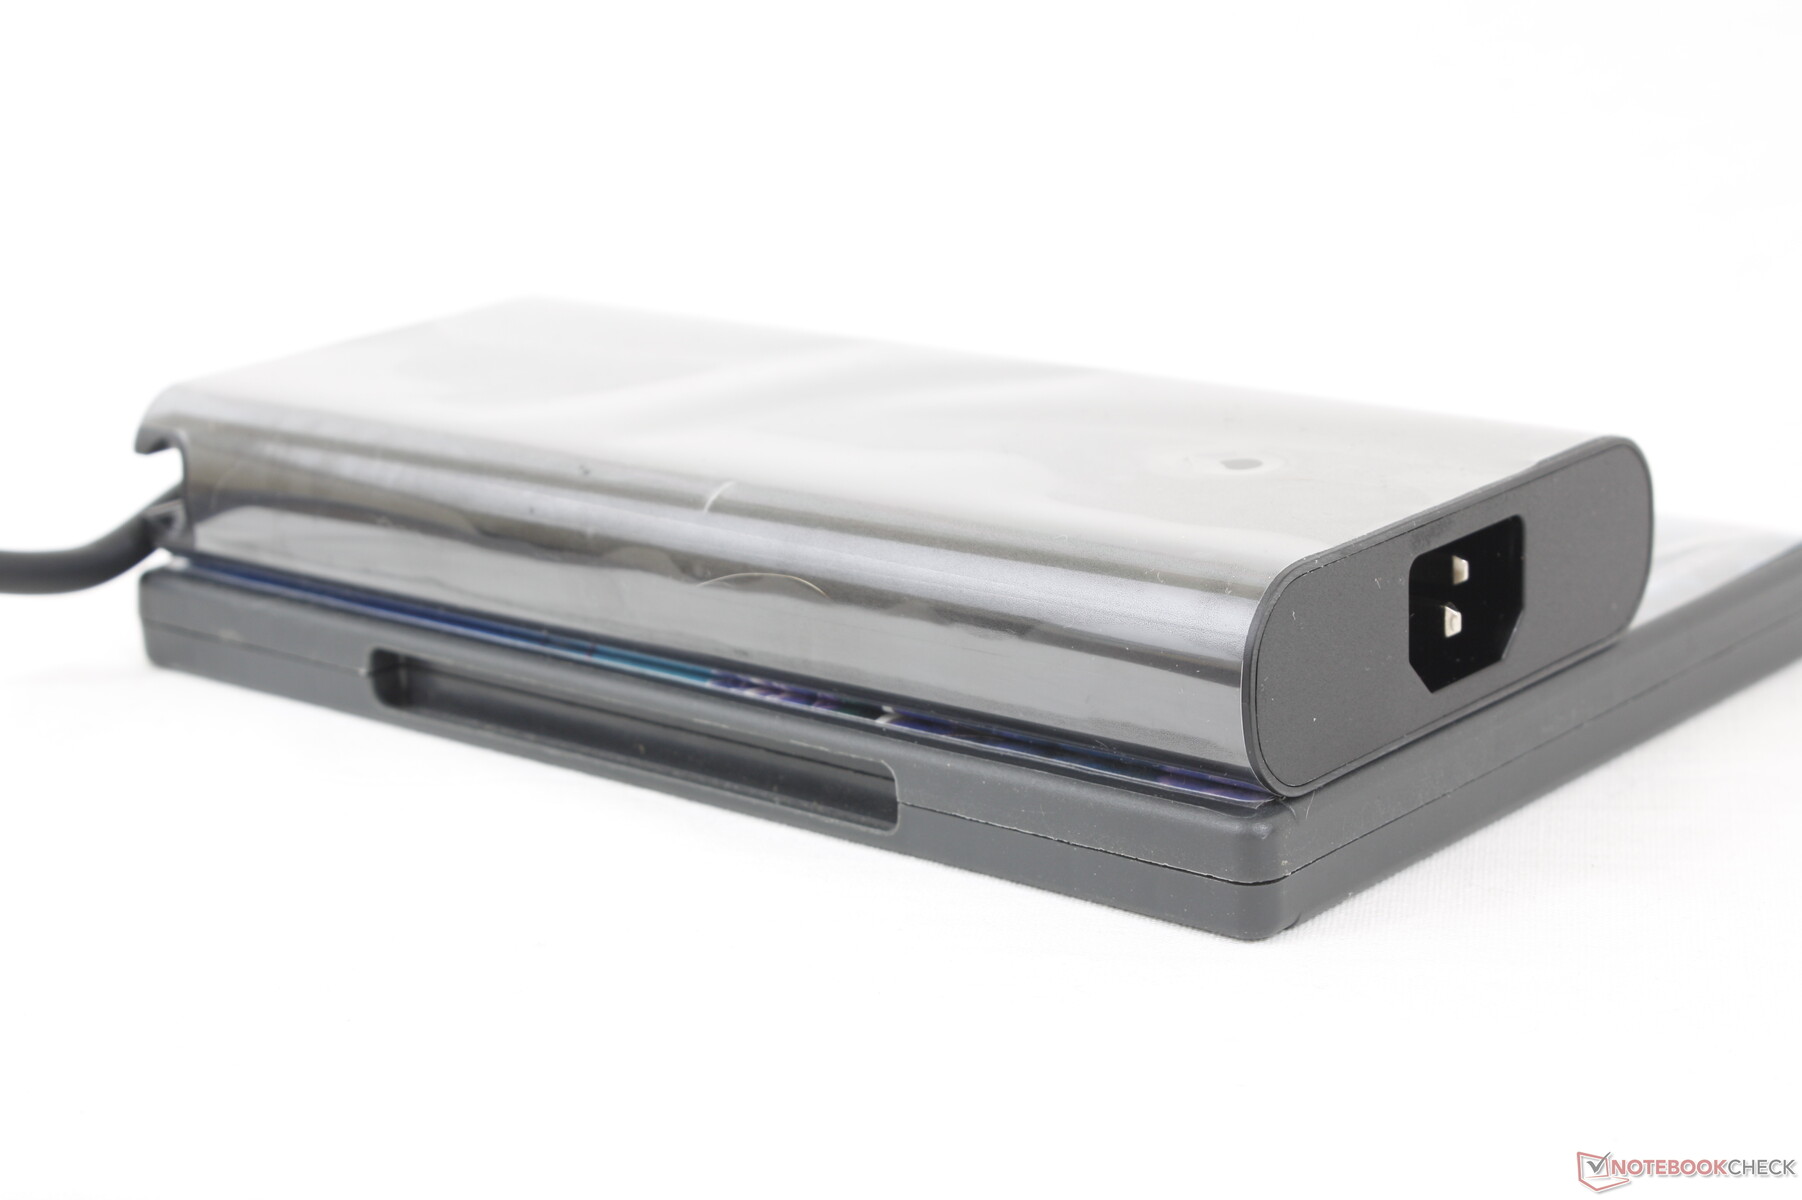
We're able to measure a maximum temporary consumption of 313 W from the medium-large (~18.3 x 8.6 x 2.6 cm) 330 W AC adapter when both the CPU and GPU are at 100 percent utilization. The charging rate slows when running such demanding loads.
| Off / Standby | |
| Idle | |
| Load |
|
Key:
min: | |
| Alienware x16 R1 i9-13900HK, GeForce RTX 4080 Laptop GPU, SK hynix PC801 HFS001TEJ9X101N, IPS, 2560x1600, 16" | Lenovo Legion Pro 7 RTX4090 i9-13900HX, GeForce RTX 4090 Laptop GPU, Samsung PM9A1 MZVL21T0HCLR, IPS, 2560x1600, 16" | Asus ROG Zephyrus M16 GU604VY-NM042X i9-13900H, GeForce RTX 4090 Laptop GPU, Samsung PM9A1 MZVL22T0HBLB, IPS, 2560x1600, 16" | Razer Blade 16 Early 2023 i9-13950HX, GeForce RTX 4080 Laptop GPU, SSSTC CA6-8D1024, IPS, 2560x1600, 16" | Dell G16 7620 i7-12700H, GeForce RTX 3060 Laptop GPU, WDC PC SN810 512GB, IPS, 2560x1600, 16" | Alienware m17 R5 (R9 6900HX, RX 6850M XT) R9 6900HX, Radeon RX 6850M XT, SSSTC CA6-8D1024, IPS, 3840x2160, 17" | |
|---|---|---|---|---|---|---|
| Power Consumption | 5% | 21% | 12% | 30% | 33% | |
| Idle Minimum * (Watt) | 25.2 | 20 21% | 20 21% | 15.2 40% | 14.4 43% | 13 48% |
| Idle Average * (Watt) | 29.9 | 25 16% | 24 20% | 22.8 24% | 17.8 40% | 16.5 45% |
| Idle Maximum * (Watt) | 49.8 | 35 30% | 25 50% | 49.8 -0% | 31.5 37% | 17 66% |
| Load Average * (Watt) | 105.4 | 136 -29% | 107 -2% | 121.2 -15% | 101.2 4% | 93 12% |
| Witcher 3 ultra * (Watt) | 263 | 282 -7% | 208 21% | 242 8% | 176.9 33% | 239 9% |
| Load Maximum * (Watt) | 313.8 | 320 -2% | 267 15% | 273.7 13% | 242.9 23% | 251 20% |
* ... smaller is better
Power Consumption Witcher 3 / Stresstest
Power Consumption external Monitor
Battery Life
We're only able to clock in 2.5 hours of runtime during our WLAN browsing test even with ACC set to Battery mode and the system to iGPU Optimus mode. Repeat testing would result in similar numbers. We don't expect long runtimes from gaming laptops, but this is still much shorter when compared to competing platforms. Dell claims a browsing runtime of over 7 hours which we can only obtain when idling on desktop at the lowest brightness setting. Results are unusual as our Alienware x17 would last twice as long as our Alienware x16 when under the same WLAN test.
Charging from empty to full takes about two hours with the included AC adapter. The system can recharge via USB-C adapters as well including the 130 W adapters that ship with XPS models.
| Alienware x16 R1 i9-13900HK, GeForce RTX 4080 Laptop GPU, 90 Wh | Asus ROG Zephyrus M16 GU604VY-NM042X i9-13900H, GeForce RTX 4090 Laptop GPU, 90 Wh | Razer Blade 16 Early 2023 i9-13950HX, GeForce RTX 4080 Laptop GPU, 95.2 Wh | Dell G16 7620 i7-12700H, GeForce RTX 3060 Laptop GPU, 84 Wh | Alienware m17 R5 (R9 6900HX, RX 6850M XT) R9 6900HX, Radeon RX 6850M XT, 97 Wh | Lenovo Legion Pro 7 16IRX8H i9-13900HX, GeForce RTX 4080 Laptop GPU, 99.9 Wh | |
|---|---|---|---|---|---|---|
| Battery runtime | 193% | 89% | 32% | 125% | 97% | |
| Reader / Idle (h) | 7.3 | 8.9 22% | 7.1 -3% | 6.4 -12% | ||
| WiFi v1.3 (h) | 2.5 | 4.3 72% | 6.1 144% | 5 100% | 4.8 92% | 5.1 104% |
| Load (h) | 0.7 | 2.9 314% | 1.4 100% | 0.7 0% | 1.8 157% | 2.1 200% |
| H.264 (h) | 4.8 | 4.9 |
Pros
Cons
Verdict — Succeeds In Chasing Both Thinness And Graphics
It's commonly understood that laptop performance is inversely proportional to thinness. The Alienware x16 challenges this by being one of the thinnest in its size category while still outperforming major competitors like the Razer Blade 16, Asus ROG Strix G16, or HP Omen 17 in terms of graphics performance. It's impressive that the model is able to squeeze in a 175 W GeForce RTX GPU given the ultra-thin profile.
If you're looking to maximize GPU performance while minimizing thinness, then the Alienware x16 should be near the top of your list.
There are nonetheless several drawbacks some of which are unique to the Alienware x16. Firstly, just because it's super thin doesn't mean it's super small or lightweight as the system is very large in terms of length and width to make up for the thinner Z height. Secondly, the lack of any ports along the sides can make connecting monitors or accessories a bit of a hassle each time. And lastly, the Core i9-13900HK offers just marginal improvements over the last generation Core i9-12900H since it is nowhere near as powerful as the Core i9-13900HX which is available on the thicker Alienware m16 and not the Alienware x16. Concessions in footprint, port positioning, and CPU performance were likely necessary in order to maximize GPU power.
Price and Availability
Dell is now shipping the Alienware x16 to consumers starting at $2200 for the base configuration to $3350 USD for our reviewed configuration.
Alienware x16 R1
- 06/22/2023 v7 (old)
Allen Ngo
