Reviews for the Intel Core i9-12900H processor
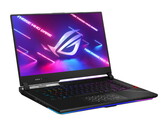
Asus ROG Strix Scar 15 G533zm review: Modern RTX 3060 gaming laptop with many strengths
After checking out the Scar 15 G533zw with an RTX 3070 Ti, we have now also got our hands on the G533zm with an RTX 3060. The Scar laptop is customisable and offers many modern features, such Wi-Fi 6E, DDR5 RAM and Thunderbolt 4. In our review, we’ll discuss whether this features are enough to justify the fairly steep price of €1,999 (US$2,166) for an RTX 3060 gaming laptop.
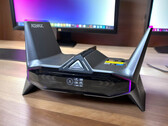
Intel Core i9-12900H, NVIDIA GeForce RTX 3060 Laptop GPU, 15.6", 2.3 kgBeelink GTI12 Ultra EX Docking Station mini PC review: More affordable than expected
Mini PC eGPU docking stations were both uncommon and pricey just a few years ago, but the Beelink EX dock is one of the least expensive options thus far without needing to sacrifice features or quality along the way.
Intel Core i9-12900H, NVIDIA GeForce RTX 3070, 1.3 kgAcemagic M2A Starship review: Gaming PC with futuristic spaceship look relies on Intel Core i9-12900H and Nvidia GeForce RTX 3080 laptop GPU
With the M2A Starship, Acemagic has a very eye-catching gaming PC in its portfolio. The unusual spaceship-like design of the mini-PC attracts attention, however, there is familiar hardware already used in the Acemagic Tank03. In this review, we analyzed the practical performance of the Intel Core i9-12900H and the NvidiaGeForce-RTX-3080 laptop GPU in the unique housing.
Intel Core i9-12900H, NVIDIA GeForce RTX 3080 Laptop GPU, 2.1 kgGeekom XT12 Pro review: Stylish NUC mini-PC alternative with Intel Core i9-12900H, 32 GB DDR4 RAM and 1 TB SSD
Geekom presented the XT12 Pro a few days ago as a powerful and efficient NUC mini-PC. However, based on an Intel Core i9-12900H, you have to make do with a slightly older processor. Using numerous measurements and benchmarks, we have analyzed whether Geekom can keep its promise of efficiency here and how well the XT12 Pro performs against the competition.
Intel Core i9-12900H, Iris Xe G7 96EUs, 545 gAcemagic Tank 03 gaming PC review: Small mini PC with Intel Core i9-12900H and Nvidia GeForce RTX 3080 GPU also masters current games
With the Tank 03, Acemagic offers a very special mini PC in its portfolio that stands out with a huge performance packed into the smallest amount of space. At least, this is what is promised by the technical specifications. Find out in this review, what the Intel Core i9-12900H in combination with the Nvidia GeForce RTX-3080 Laptop GPU can do in practice. As a special feature, the mini PC also offers three different performance profiles that we also examine in detail.
Intel Core i9-12900H, NVIDIA GeForce RTX 3080 Laptop GPU, 2.2 kgAcemagic Tank03: NVIDIA GeForce RTX 3080 Laptop GPU
Review » Acemagic Tank 03 gaming PC review: Small mini PC with Intel Core i9-12900H and Nvidia GeForce RTX 3080 GPU also masters current games
Review » Acemagic Tank 03 gaming PC review: Small mini PC with Intel Core i9-12900H and Nvidia GeForce RTX 3080 GPU also masters current games
Razer Blade 15 OLED (Early 2022): NVIDIA GeForce RTX 3070 Ti Laptop GPU, 15.60", 2 kg
Review » Razer Blade 15 OLED (early 2022) review: A compact gaming laptop with an RTX 3070 Ti
Asus ProArt StudioBook 16 H7600ZW: NVIDIA GeForce RTX 3070 Ti Laptop GPU, 16.00", 2.4 kg
Review » Asus ProArt StudioBook 16 H7600ZW Review: The definitive MacBook Pro alternative for content creators
Asus ROG Zephyrus M16 GU603Z: NVIDIA GeForce RTX 3070 Ti Laptop GPU, 16.00", 2.1 kg
Review » Asus ROG Zephyrus M16 laptop review: A well-rounded gaming package
Minisforum Neptune Series NAD9: Intel Iris Xe Graphics G7 96EUs, 1.2 kg
Review » Minisforum Neptune Series NAD9 desktop PC review: Compact powerhouse with Intel Core i9-12900H
Asus ZenBook Pro 16X OLED UX7602ZM-ME115W: NVIDIA GeForce RTX 3060 Laptop GPU, 16.00", 2.4 kg
Review » Asus Zenbook Pro 16X OLED review - Extreme laptop with a special trick
Acer Predator Triton 300 SE: NVIDIA GeForce RTX 3060 Laptop GPU, 14.00", 1.7 kg
Review » Acer Predator Triton 300 SE PT314 review: Liquid metal cooling for a 14-inch laptop
Uniwell Technology GM7AG8N Liquid Cooling Box: NVIDIA GeForce RTX 3080 Ti Laptop GPU, 17.00", 2.7 kg
Review » Liquid cooling box runs quieter than expected: Uniwell Technology GM7AG8N laptop review
Alienware x15 R2 P111F: NVIDIA GeForce RTX 3080 Ti Laptop GPU, 15.60", 2.4 kg
Review » Alienware x15 R2 Laptop Review: Ultrabook-like UFO soars with Core i9-12900H and 140 W RTX 3080 Ti
MSI Creator Z17 A12UGST-054: NVIDIA GeForce RTX 3070 Ti Laptop GPU, 17.00", 2.5 kg
Review » MSI Creator Z17 Laptop review: What are creatives and gamers getting for around 4,000 Euro?
Dell Precision 5000 5470: NVIDIA RTX A1000 Laptop GPU, 14.00", 1.6 kg
Review » Dell Precision 5470 workstation review: Nvidia RTX A1000 debut
Schenker XMG Pro 17 E22: NVIDIA GeForce RTX 3080 Ti Laptop GPU, 17.30", 2.8 kg
Review » Schenker XMG Pro 17 E22 review: Gaming laptop with RTX 3080 Ti delivers the goods
Razer Blade 17 Early 2022: NVIDIA GeForce RTX 3080 Ti Laptop GPU, 17.30", 2.8 kg
Review » Razer Blade 17 (Early 2022) review: Elegant 4k gaming laptop with a bright screen
MSI Creator Z16P B12UHST: NVIDIA GeForce RTX 3080 Ti Laptop GPU, 16.00", 2.4 kg
Review » MSI Creator Z16P laptop in review: Creative work with an i9 and the RTX 3080 Ti
Asus ROG Strix Scar 15 G533ZW-LN106WS: NVIDIA GeForce RTX 3070 Ti Laptop GPU, 15.60", 2.3 kg
Review » Asus ROG Strix Scar 15 G533ZW Laptop Review: 1440p 240 Hz gaming powerhouse with Alder Lake Core i9 and 150 W RTX 3070 Ti
MSI Pulse GL66 12UEK: NVIDIA GeForce RTX 3060 Laptop GPU, 15.60", 2.3 kg
Review » MSI Pulse GL66 review: Is the i9-12900H improving the RTX-3060 gaming laptop or only making it more expensive?
MSI Vector GP66 12UGS: NVIDIA GeForce RTX 3070 Ti Laptop GPU, 15.60", 2.3 kg
Review » MSI Vector GP66 12UGS laptop review: 150 W TGP GeForce RTX 3070 Ti sweet spot
Asus ROG Flow Z13 GZ301ZE: NVIDIA GeForce RTX 3050 Ti Laptop GPU, 13.40", 1.2 kg
Review » Asus ROG Flow Z13 in review: Gaming tablet with powerful Alder Lake i9 CPU
Schenker Uniwill Technology GM7AG8P: NVIDIA GeForce RTX 3080 Ti Laptop GPU, 17.30", 2.3 kg
Review » Intel Core i9-12900H debut: Uniwill Technology GM7AG8P laptop review
Acer Nitro 5 AN515-58, i9-12900H RTX 4060: NVIDIA GeForce RTX 4060 Laptop GPU, 15.60", 2.6 kg
External Review » Acer Nitro 5 AN515-58, i9-12900H RTX 4060
Acer Nitro 5 AN517-55-96S6: NVIDIA GeForce RTX 4060 Laptop GPU, 17.30", 3 kg
External Review » Acer Nitro 5 AN517-55-96S6
Asus ZenBook Pro 16X OLED UX7602ZM-ME115W: NVIDIA GeForce RTX 3060 Laptop GPU, 16.00", 2.4 kg
External Review » Asus ZenBook Pro 16X OLED UX7602ZM-ME115W
MSI Crosshair 15 B12UEZ, i9-12900H: NVIDIA GeForce RTX 3060 Laptop GPU, 15.60", 2.3 kg
External Review » MSI Crosshair 15 B12UEZ, i9-12900H
Acer Predator Helios 300 PH315-55-98R7: NVIDIA GeForce RTX 3070 Ti Laptop GPU, 15.60", 2.6 kg
External Review » Acer Predator Helios 300 PH315-55-98R7
Razer Blade 15 OLED (Early 2022): NVIDIA GeForce RTX 3070 Ti Laptop GPU, 15.60", 2 kg
External Review » Razer Blade 15 OLED (Early 2022)
Alienware x15 R2 P111F: NVIDIA GeForce RTX 3080 Ti Laptop GPU, 15.60", 2.4 kg
External Review » Alienware x15 R2 P111F
HP ZBook Studio 16 G9, i9-12900H RTX 3080 Ti: NVIDIA GeForce RTX 3080 Ti Laptop GPU, 16.00", 1.7 kg
External Review » HP ZBook Studio 16 G9, i9-12900H RTX 3080 Ti
HP Omen 16-k0097ng: NVIDIA GeForce RTX 3070 Ti Laptop GPU, 16.10", 2.4 kg
External Review » HP Omen 16-k0097ng
Acer Predator Helios 300 PH315-55s-98TX: NVIDIA GeForce RTX 3080 Laptop GPU, 15.60", 2.6 kg
External Review » Acer Predator Helios 300 PH315-55s-98TX
Acer Predator Helios 300 PH317-56-94RD: NVIDIA GeForce RTX 3080 Laptop GPU, 17.30", 3 kg
External Review » Acer Predator Helios 300 PH317-56-94RD
Asus ROG Strix SCAR 15 G533ZX-LN060W: NVIDIA GeForce RTX 3080 Ti Laptop GPU, 15.60", 2.4 kg
External Review » Asus ROG Strix SCAR 15 G533ZX-LN060W
HP ZBook Studio 16 G9 62U30EA: NVIDIA RTX A3000 Laptop GPU, 16.00", 1.7 kg
External Review » HP ZBook Studio 16 G9 62U30EA
Asus ProArt StudioBook 16 H7600ZM-L2038X: NVIDIA GeForce RTX 3060 Laptop GPU, 16.00", 2.4 kg
External Review » Asus ProArt StudioBook 16 H7600ZM-L2038X
Lenovo Legion 5 Pro 16IAH7H, i9-12900H RTX 3070 Ti: NVIDIA GeForce RTX 3070 Ti Laptop GPU, 16.00", 2.5 kg
External Review » Lenovo Legion 5 Pro 16IAH7H, i9-12900H RTX 3070 Ti
Razer Blade 15 2022 RZ09-0421NGG3-R3G1: NVIDIA GeForce RTX 3070 Ti Laptop GPU, 15.60", 2 kg
External Review » Razer Blade 15 2022 RZ09-0421NGG3-R3G1
Acer Predator Helios 300 PH315-55-902L: NVIDIA GeForce RTX 3070 Ti Laptop GPU, 15.60", 2.6 kg
External Review » Acer Predator Helios 300 PH315-55-902L
HP Envy 16-h0795ng: NVIDIA GeForce RTX 3060 Laptop GPU, 16.00", 2.7 kg
External Review » HP Envy 16-h0795ng
Dell Precision 5000 5470: NVIDIA RTX A1000 Laptop GPU, 14.00", 1.6 kg
External Review » Dell Precision 5000 5470
MSI Pulse GL76 12UGK-091UK: NVIDIA GeForce RTX 3070 Laptop GPU, 17.30", 2.6 kg
External Review » MSI Pulse GL76 12UGK-091UK
Acer Predator Triton 300SE PT314-52s-99PC: NVIDIA GeForce RTX 3060 Laptop GPU, 14.00", 1.7 kg
External Review » Acer Predator Triton 300SE PT314-52s-99PC
MSI Creator Pro Z17 A12UMST: NVIDIA RTX A5500 Laptop GPU, 17.00", 2.5 kg
External Review » MSI Creator Pro Z17 A12UMST
MSI Creator Z16P B12UGST: NVIDIA GeForce RTX 3070 Ti Laptop GPU, 16.00", 2.4 kg
External Review » MSI Creator Z16P B12UGST
Dell XPS 15 9520, i9-12900H 3050 Ti: NVIDIA GeForce RTX 3050 Ti Laptop GPU, 15.60", 1.9 kg
External Review » Dell XPS 15 9520, i9-12900H 3050 Ti
Dell Precision 15 3571, 12900H RTX A1000: NVIDIA RTX A1000 Laptop GPU, 15.60", 1.8 kg
External Review » Dell Precision 15 3571, 12900H RTX A1000
MSI Pulse GL66 12UEK: NVIDIA GeForce RTX 3060 Laptop GPU, 15.60", 2.3 kg
External Review » MSI Pulse GL66 12UEK
MSI Stealth GS66 12UGS-025: NVIDIA GeForce RTX 3070 Ti Laptop GPU, 15.60", 2.1 kg
External Review » MSI Stealth GS66 12UGS-025
Origin PC EVO17-S 2022, i9 3080 Ti: NVIDIA GeForce RTX 3080 Ti Laptop GPU, 17.30", 2.7 kg
External Review » Origin PC EVO17-S 2022, i9 3080 Ti
MSI Creator Z17 A12UHST-052: NVIDIA GeForce RTX 3080 Ti Laptop GPU, 17.30", 2.5 kg
External Review » MSI Creator Z17 A12UHST-052
Asus Zenbook Pro 14 Duo UX8402ZE-M3030W: NVIDIA GeForce RTX 3050 Ti Laptop GPU, 14.50", 1.8 kg
External Review » Asus Zenbook Pro Duo 14 UX8402ZE-M3030W
Asus Zenbook Pro 16X UX7602ZM-ME023W: NVIDIA GeForce RTX 3060 Laptop GPU, 16.00", 2.4 kg
External Review » Asus Zenbook Pro 16X UX7602ZM-ME023W
Asus ROG Strix G17 G733ZM-LL034W: NVIDIA GeForce RTX 3060 Laptop GPU, 17.30", 2.9 kg
External Review » Asus ROG Strix G17 G733ZM-LL034W
Asus ZenBook 14X UX5401ZA-L7078W: Intel Iris Xe Graphics G7 96EUs, 14.00", 1.4 kg
External Review » Asus ZenBook 14X UX5401ZA-L7078W
Asus ROG Strix Scar 15 G533ZW-AS94: NVIDIA GeForce RTX 3070 Ti Laptop GPU, 15.60", 2.4 kg
External Review » Asus ROG Strix Scar 15 G533ZW-AS94
Acer Predator Triton 500SE PT516-52s-98LC: NVIDIA GeForce RTX 3080 Ti Laptop GPU, 16.00", 2.4 kg
External Review » Acer Predator Triton 500SE PT516-52s-98LC
Razer Blade 17 Early 2022: NVIDIA GeForce RTX 3080 Ti Laptop GPU, 17.30", 2.8 kg
External Review » Razer Blade 17 Early 2022
Asus ROG Zephyrus M16 GU603ZX-K8001W: NVIDIA GeForce RTX 3080 Ti Laptop GPU, 16.00", 1.9 kg
External Review » Asus ROG Zephyrus M16 GU603ZX-K8001W
MSI Stealth GS66 12UHS-091: NVIDIA GeForce RTX 3080 Ti Laptop GPU, 15.60", 2.1 kg
External Review » MSI Stealth GS66 12UHS-091
MSI Creator Z16P B12UHST-046: NVIDIA GeForce RTX 3080 Ti Laptop GPU, 16.00", 2.3 kg
External Review » MSI Creator Z16P B12UHST-046
Asus ROG Zephyrus M16 GU603ZW-K8062W: NVIDIA GeForce RTX 3070 Ti Laptop GPU, 16.00", 1.9 kg
External Review » Asus ROG Zephyrus M16 GU603ZW-K8062W
Asus ROG Strix G17 G733ZX-LL009W: NVIDIA GeForce RTX 3080 Ti Laptop GPU, 17.30", 2.9 kg
External Review » Asus ROG Strix G17 G733ZX-LL009W
Asus ROG Strix Scar 15 G533zm: NVIDIA GeForce RTX 3060 Laptop GPU, 15.60", 2.3 kg
External Review » Asus ROG Strix Scar 15 G533zm
Asus ROG Strix Scar 15 G533ZW-LN106WS: NVIDIA GeForce RTX 3070 Ti Laptop GPU, 15.60", 2.3 kg
External Review » Asus ROG Strix Scar 15 G533ZW-LN106WS
Asus ROG Strix Scar 15 G533ZW-LN017W: NVIDIA GeForce RTX 3070 Ti Laptop GPU, 15.60", 2.4 kg
External Review » Asus ROG Strix Scar 15 G533ZW-LN017W
Asus ROG Strix Scar 15 G533ZX-XS96: NVIDIA GeForce RTX 3080 Ti Laptop GPU, 15.60", 2.4 kg
External Review » Asus ROG Strix Scar 15 G533ZX-XS96
Asus ROG Strix G17 G733ZW-LL103W: NVIDIA GeForce RTX 3070 Ti Laptop GPU, 17.30", 2.9 kg
External Review » Asus ROG Strix G17 G733ZW-LL103W
MSI Stealth GS77 12UHS-063: NVIDIA GeForce RTX 3080 Ti Laptop GPU, 17.30", 2.8 kg
External Review » MSI Stealth GS77 12UHS-063
Asus ROG Flow Z13 GZ301ZE: NVIDIA GeForce RTX 3050 Ti Laptop GPU, 13.40", 1.2 kg
External Review » Asus ROG Flow Z13 GZ301ZE
Acemagic M2A: NVIDIA GeForce RTX 3080 Laptop GPU, 2.1 kg
» Acemagic anniversary 2026: Big discount campaign on mini PCs, laptops and NAS systems
Acemagic Tank03: NVIDIA GeForce RTX 3080 Laptop GPU, 2.2 kg
» Acemagic anniversary 2026: Big discount campaign on mini PCs, laptops and NAS systems
Beelink GTI12 Ultra EX Docking Station: NVIDIA GeForce RTX 3070, 1.3 kg
» Beelink makes EX mini PC eGPU dock free for anyone to build with open-source documentation
» Beelink makes EX mini PC eGPU dock free for anyone to build with open-source documentation
Asus ROG Zephyrus M16 GU603Z: NVIDIA GeForce RTX 3070 Ti Laptop GPU, 16.00", 2.1 kg
» Asus ROG Zephyrus M16 (2022) test: A great gaming laptop with well-rounded equipment
Asus ZenBook Pro 16X OLED UX7602ZM-ME115W: NVIDIA GeForce RTX 3060 Laptop GPU, 16.00", 2.4 kg
» Asus Zenbook Pro 16X OLED reviewed: What does AAS-Ultra bring to the table?
Acer Predator Triton 300 SE: NVIDIA GeForce RTX 3060 Laptop GPU, 14.00", 1.7 kg
» Acer Predator Triton 300 SE is insanely loud at up to 60 dB(A) when gaming
Schenker XMG Pro 17 E22: NVIDIA GeForce RTX 3080 Ti Laptop GPU, 17.30", 2.8 kg
» Schenker XMG Pro 17 E22: Graphics performance above all
Razer Blade 17 Early 2022: NVIDIA GeForce RTX 3080 Ti Laptop GPU, 17.30", 2.8 kg
» Razer Blade 17 (Early 2022): High priced and power hungry
MSI Creator Z16P B12UHST: NVIDIA GeForce RTX 3080 Ti Laptop GPU, 16.00", 2.4 kg
» Creator flagship for high performance: MSI Creator Z16P
MSI Pulse GL66 12UEK: NVIDIA GeForce RTX 3060 Laptop GPU, 15.60", 2.3 kg
» MSI Pulse GL66 test: RTX-3060 gamer with Alder Lake i9 in need for optimization
MSI Vector GP66 12UGS: NVIDIA GeForce RTX 3070 Ti Laptop GPU, 15.60", 2.3 kg
» MSI GP66 Leopard vs. Vector GP66: What's the difference?
Schenker Uniwill Technology GM7AG8P: NVIDIA GeForce RTX 3080 Ti Laptop GPU, 17.30", 2.3 kg
» 27 AMD Ryzen 9 5900HX PCs vs. the Core i9-12900H: Intel comes out on top, but there's a catch