Reviews for the Intel Core i7-10710U processor
Getac B360 rugged laptop review: Bright 1400-nit touchscreen
The B360 is one of the few 13.3-inch rugged laptops in the market, but it doesn't skimp on accessible features or display quality. However, its use of an older Comet Lake-U processor means owners will be missing out on the more advanced features of Intel Tiger Lake.
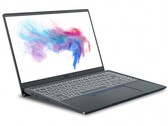
Intel Core i7-10710U, UHD Graphics 620, 13.3", 2.4 kgMSI Prestige 14 A10SC-009 laptop review: Comet Lake for content creators
The MSI Prestige 14 is a small powerhouse with a design and equipment that are convincing. We also like the keyboard with its normal-sized arrow keys very much. Our detailed review clarifies how the 14-inch laptop performs for creatives.
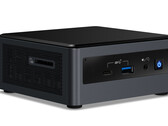
Intel Core i7-10710U, NVIDIA GeForce GTX 1650 Max-Q, 14", 1.3 kgIntel Frost Canyon NUC offers 6 cores and 12 threads
The new Intel Performance Kit NUC10i7FNHAA packs two storage devices, 16 GB of memory and a modern hexa-core SoC into a tiny case. We have summarized here how well the Intel NUC 10 performed in the test.
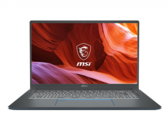
Intel Core i7-10710U, UHD Graphics 620, 697 gMSI Prestige 15 A10SC Laptop Review: One of the Best Dell XPS 15 Alternatives
Low-power Intel with low-power Nvidia work great together for anyone interested in a high-performance ultra-thin laptop. If MSI can address the throttling, then the Prestige 15 can give other popular 15.6-inch Ultrabooks from Dell, HP, and Asus a run for the money.
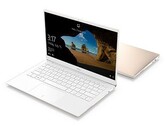
Intel Core i7-10710U, NVIDIA GeForce GTX 1650 Max-Q, 15.6", 1.7 kgDell XPS 13 7390 Core i7-10710U Laptop Review: Faster Than The Core i5 XPS 15
After an impressive showing with the XPS 13 7390 2-in-1, the original XPS 13 clamshell deserves some love, too. Dell is putting the XPS 13 back in the spotlight with the Intel Comet Lake-U Core i7-10710U to be one of the first subnotebooks shipping with a full-fledged hexa-core ULV CPU.
Intel Core i7-10710U, UHD Graphics 620, 13.3", 1.2 kgMSI Prestige 14 i7-10710U: NVIDIA GeForce GTX 1650 Max-Q, 14.00", 1.3 kg
Review » MSI Prestige 14 Hands-On Laptop Review: Faster than ever and still great for content creators
HP EliteBook x360 1040 G7 1Q6B4ES: Intel UHD Graphics 620, 14.00", 1.4 kg
External Review » HP EliteBook x360 1040 G7 1Q6B4ES
MSI Prestige 15 A10SC-014: NVIDIA GeForce GTX 1650 Max-Q, 15.60", 1.7 kg
External Review » MSI Prestige 15 A10SC-014
HP EliteBook 840 G7-1J6E9EA: Intel UHD Graphics 620, 14.00", 1.5 kg
External Review » HP EliteBook 840 G7-1J6E9EA
MSI Prestige 14 A10SC-067XES: NVIDIA GeForce GTX 1650 Mobile, 14.00", 1.3 kg
External Review » MSI Prestige 14 A10SC-067XES
MSI Prestige 14 A10RB: NVIDIA GeForce MX250, 14.00", 1.3 kg
External Review » MSI Prestige 14 A10RB
Dynabook Satellite Pro L50-G-151: Intel UHD Graphics 620, 15.60", 1.7 kg
External Review » Dynabook Satellite Pro L50-G-151
MSI Prestige 14 A10SC-009: NVIDIA GeForce GTX 1650 Max-Q, 14.00", 1.3 kg
External Review » MSI Prestige 14 A10SC-009
MSI Prestige 14 A10SC-096NE: NVIDIA GeForce GTX 1650 Mobile, 14.00", 1.3 kg
External Review » MSI Prestige 14 A10SC-096NE
MSI Modern 14 A10RB: NVIDIA GeForce MX250, 14.00", 1.2 kg
External Review » MSI Modern 14 A10RB
MSI Prestige 15 A10SC-007ES: NVIDIA GeForce GTX 1650 Mobile, 15.60", 1.7 kg
External Review » MSI Prestige 15 A10SC-007ES
MSI Prestige 14 A10SC-012ES: NVIDIA GeForce GTX 1650 Mobile, 14.00", 1.3 kg
External Review » MSI Prestige 14 A10SC-012ES
MSI Prestige 15 A10SC-008ES: Intel UHD Graphics 620, 15.60", 1.7 kg
External Review » MSI Prestige 15 A10SC-008ES
MSI Prestige 15 A10SC-029NL: NVIDIA GeForce GTX 1650 Max-Q, 15.60", 1.6 kg
External Review » MSI Prestige 15 A10SC-029NL
MSI Prestige 15 A10SC-044XES: NVIDIA GeForce GTX 1650 Max-Q, 15.60", 1.7 kg
External Review » MSI Prestige 15 A10SC-044XES
MSI Prestige 14 A10SC-004NL: NVIDIA GeForce GTX 1650 Max-Q, 14.00", 1.3 kg
External Review » MSI Prestige 14 A10SC-004NL
MSI Prestige 15 A10SC-060XES: NVIDIA GeForce GTX 1650 Max-Q, 15.60", 1.7 kg
External Review » MSI Prestige 15 A10SC-060XES
Dell XPS 13 7390 Core i7-10710U: Intel UHD Graphics 620, 13.30", 1.2 kg
External Review » Dell XPS 13 7390 Core i7-10710U
MSI Prestige 15 A10SC: NVIDIA GeForce GTX 1650 Max-Q, 15.60", 1.7 kg
External Review » MSI Prestige 15 A10SC
MSI Prestige 15 A10SC-011: NVIDIA GeForce GTX 1650 Max-Q, 15.60", 1.6 kg
External Review » MSI Prestige 15 A10SC-011
MSI Prestige 14 i7-10710U: NVIDIA GeForce GTX 1650 Max-Q, 14.00", 1.3 kg
External Review » MSI Prestige 14 i7-10710U
MSI Prestige 14 A10SC-009: NVIDIA GeForce GTX 1650 Max-Q, 14.00", 1.3 kg
» MSI Prestige 14: Compactly-packed performance