Reviews for the Intel Core i3-1005G1 processor
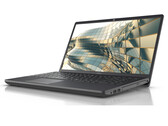
Fujitsu Lifebook A3510 review: An affordable office laptop with a maintenance flap
The Lifebook A3510 produces relatively low emissions, does not have a lot of weight (1.8 kg, ~4 lb) and also includes a DVD drive onboard. The operating system is Windows 10 Pro with the ability to upgrade to Windows 11. A positive feature is a maintenance flap that gives access to the SSD, RAM, and battery.
Intel Core i3-1005G1, UHD Graphics G1 (Ice Lake 32 EU), 15.6", 1.8 kgTeclast TBOLT F15 Pro in review: Low-priced 15-inch laptop for basic tasks
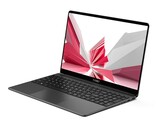
With the F15 Pro, the Chinese manufacturer Teclast offers a 15-inch laptop with an aluminum case and Core i3 processor from Intel. There are also enough ports and an IPS display. What else can you expect for around 500 Euros (~$588)?
Intel Core i3-1005G1, UHD Graphics G1 (Ice Lake 32 EU), 15.6", 1.9 kgLenovo V17-IIL review: A quiet home office laptop with a good display
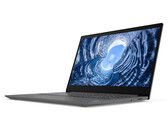
With the V17-IIL, Lenovo delivers a work device for desk usage. The 17.3-inch laptop scores with low operating noise, a low heat development, and a well-rounded IPS display. The unstable case prohibits mobile usage.
Intel Core i3-1005G1, UHD Graphics G1 (Ice Lake 32 EU), 17.3", 2.2 kgBeelink SEi10 Mini PC Review: A Cheaper Intel NUC
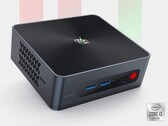
If you want an Intel NUC but are turned off by its price, then the new Beelink mini PC will be a great alternative without needing to sacrifice any core features.
Intel Core i3-1005G1, UHD Graphics G1 (Ice Lake 32 EU), 350 gLenovo IdeaPad 3 14IIL05 in review: Quiet office laptop with mediocre battery life
Lenovo's 14-incher scores with low operating noise and low temperatures. An Ice Lake Core i3 processor, an NVMe SSD and a matte IPS screen are found on board. The operating system is Windows 10 Home in S mode.
Intel Core i3-1005G1, UHD Graphics G1 (Ice Lake 32 EU), 14", 1.6 kgDell XPS 13 7390 2-in-1 Core i3: Intel UHD Graphics G1 (Ice Lake 32 EU), 13.40", 1.3 kg
Review » Hot Ice: Dell XPS 13 7390 2-in-1 Core i3 Laptop Review
Acer Aspire 5 A514-53-3970: Intel UHD Graphics G1 (Ice Lake 32 EU), 14.00", 1.7 kg
External Review » Acer Aspire 5 A514-53-3970
Medion Akoya E14409, i3-1005G1: Intel UHD Graphics G1 (Ice Lake 32 EU), 14.00", 1.6 kg
External Review » Medion Akoya E14409, i3-1005G1
Asus VivoBook 15 F515JA-BR1840: Intel UHD Graphics G1 (Ice Lake 32 EU), 15.60", 1.8 kg
External Review » Asus VivoBook 15 F515JA-BR1840
Allview Allbook i: Intel UHD Graphics G1 (Ice Lake 32 EU), 15.60", 2 kg
External Review » Allview Allbook i
Fujitsu LifeBook A3510-FPC04905BP: Intel UHD Graphics G1 (Ice Lake 32 EU), 15.60", 2 kg
External Review » Fujitsu LifeBook A3510-FPC04905BP
Asus VivoBook 15 F512JA-AS34: Intel UHD Graphics G1 (Ice Lake 32 EU), 15.60", 1.8 kg
External Review » Asus VivoBook 15 F512JA-AS34
Asus F415JA-BV393T: Intel UHD Graphics G1 (Ice Lake 32 EU), 14.00", 1.6 kg
External Review » Asus F415JA-BV393T
Acer Aspire 3 A317-52-36L5: Intel UHD Graphics G1 (Ice Lake 32 EU), 17.30", 2.7 kg
External Review » Acer Aspire 3 A317-52-36L5
Acer Aspire 5 A515-55-35SE: Intel UHD Graphics G1 (Ice Lake 32 EU), 15.60", 1.8 kg
External Review » Acer Aspire 5 A515-55-35SE
Asus VivoBook 15 F515JA-AH31: Intel UHD Graphics G1 (Ice Lake 32 EU), 15.60", 1.8 kg
External Review » Asus VivoBook 15 F515JA-AH31
HP 240 G8, i3-1005G1: Intel UHD Graphics G1 (Ice Lake 32 EU), 14.00", 1.5 kg
External Review » HP 240 G8, i3-1005G1
Asus VivoBook 15 R565J: Intel UHD Graphics G1 (Ice Lake 32 EU), 15.60", 1.8 kg
External Review » Asus VivoBook 15 R565J
Asus VivoBook 15 F515JA-BR097T: Intel UHD Graphics G1 (Ice Lake 32 EU), 15.60", 1.8 kg
External Review » Asus VivoBook 15 F515JA-BR097T
Asus VivoBook 15 R543MA-GQ1264: Intel UHD Graphics G1 (Ice Lake 32 EU), 15.60"
External Review » Asus VivoBook 15 R543MA-GQ1264
Lenovo IdeaPad 3 15IIL05-4GSP: Intel UHD Graphics G1 (Ice Lake 32 EU), 15.60", 1.9 kg
External Review » Lenovo IdeaPad 3i 15IIL05-4GSP
Lenovo IdeaPad Flex 5 15IIL05-81X3002BMH: Intel UHD Graphics G1 (Ice Lake 32 EU), 15.60", 1.8 kg
External Review » Lenovo IdeaPad Flex 5 15IIL05-81X3002BMH
Dell Vostro 15 3501: Intel UHD Graphics G1 (Ice Lake 32 EU), 15.60", 1.9 kg
External Review » Dell Vostro 15 3501
HP 340S G7, i3-1005G1: Intel UHD Graphics G1 (Ice Lake 32 EU), 14.00", 1.4 kg
External Review » HP 340S G7, i3-1005G1
Lenovo IdeaPad Flex 5 15IIL05-81X3007XGE: Intel UHD Graphics G1 (Ice Lake 32 EU), 15.60", 1.8 kg
External Review » Lenovo IdeaPad Flex 5 15IIL05-81X3007XGE
HP 14s-dq1931nd: Intel UHD Graphics G1 (Ice Lake 32 EU), 14.00", 1.5 kg
External Review » HP 14s-dq1931nd
Asus Vivobook X509JA-EJ371T: Intel UHD Graphics G1 (Ice Lake 32 EU), 15.60", 1.9 kg
External Review » Asus Vivobook X509JA-EJ371T
Asus ZenBook 14 UX425JA, i3-1005G1: Intel UHD Graphics G1 (Ice Lake 32 EU), 14.00", 1.1 kg
External Review » Asus ZenBook 14 UX425JA, i3-1005G1
HP 14s-dq1040ns: Intel UHD Graphics G1 (Ice Lake 32 EU), 14.00", 1.5 kg
External Review » HP 14s-dq1040ns
HP 17-by3099ng: Intel UHD Graphics G1 (Ice Lake 32 EU), 17.30", 2.4 kg
External Review » HP 17-by3099ng
Lenovo IdeaPad 3 15IIL05-81WE00KYGE: Intel UHD Graphics G1 (Ice Lake 32 EU), 15.60", 1.9 kg
External Review » Lenovo IdeaPad 3 15IIL05-81WE00KYGE
HP 15s-fq1111tu: Intel UHD Graphics G1 (Ice Lake 32 EU), 15.60", 1.7 kg
External Review » HP 15s-fq1111tu
HP 15s-fq1075ns: Intel UHD Graphics G1 (Ice Lake 32 EU), 15.60", 1.7 kg
External Review » HP 15s-fq1075ns
Asus VivoBook 15 S512JA-BR192T: Intel UHD Graphics G1 (Ice Lake 32 EU), 15.60", 1.6 kg
External Review » Asus VivoBook 15 S512JA-BR192T
Lenovo Ideapad S145-15IIL-81W800BMGE: Intel UHD Graphics G1 (Ice Lake 32 EU), 15.60", 1.9 kg
External Review » Lenovo Ideapad S145-15IIL-81W800BMGE
Lenovo IdeaPad 3 14IIL05: Intel UHD Graphics G1 (Ice Lake 32 EU), 14.00", 1.6 kg
External Review » Lenovo IdeaPad 3 14IIL05
Acer Aspire 5 A514-53-30VS: Intel UHD Graphics G1 (Ice Lake 32 EU), 14.00", 1.6 kg
External Review » Acer Aspire 5 A514-53-30VS
Asus VivoBook X409JA i3-1005G1: Intel UHD Graphics G1 (Ice Lake 32 EU), 14.00", 1.5 kg
External Review » Asus VivoBook X409JA i3-1005G1
Asus VivoBook 15 R521JA-EJ113T: Intel UHD Graphics G1 (Ice Lake 32 EU), 15.60", 1.9 kg
External Review » Asus VivoBook 15 R521JA-EJ113T
HP 14s-dq1001ns: Intel UHD Graphics G1 (Ice Lake 32 EU), 14.00", 1.5 kg
External Review » HP 14s-dq1001ns
HP Pavilion 13-an1033tu: Intel UHD Graphics G1 (Ice Lake 32 EU), 13.30", 1.3 kg
External Review » HP Pavilion 13-an1033tu
HP 14s-dq1002ns: Intel UHD Graphics G1 (Ice Lake 32 EU), 14.00", 1.5 kg
External Review » HP 14s-dq1002ns
HP 14s-DQ1013TU: Intel UHD Graphics G1 (Ice Lake 32 EU), 14.00", 1.5 kg
External Review » HP 14s-DQ1013TU
HP 15s-fq1013ns: Intel UHD Graphics G1 (Ice Lake 32 EU), 15.60", 1.7 kg
External Review » HP 15s-fq1013ns
Lenovo Ideapad S340-14IIL-81VV0032GE: Intel UHD Graphics G1 (Ice Lake 32 EU), 14.00", 1.6 kg
External Review » Lenovo Ideapad S340-14IIL-81VV0032GE
Acer Swift 3 SF314-57, i3-1005G1: Intel UHD Graphics G1 (Ice Lake 32 EU), 14.00", 1.2 kg
External Review » Acer Swift 3 SF314-57, i3-1005G1
Fujitsu Lifebook A3510 (FPC04905BP): Intel UHD Graphics G1 (Ice Lake 32 EU), 15.60", 1.8 kg
» Fujitsu Lifebook A3510: With Power Delivery, maintenance cover, and DVD burner
Lenovo V17-IIL 82GX008TGE: Intel UHD Graphics G1 (Ice Lake 32 EU), 17.30", 2.2 kg
» Lenovo V17-IIL: Low operating noise, low heat development, up to 36 GB RAM