Notebookcheck Logo

Intel Celeron N5095

Intel Celeron N5095

The Celeron N5095 is an inexpensive quad-core SoC of the Jasper Lake product family designed for use in affordable SFF desktops and laptops. It features four Tremont CPU cores running at 2 GHz that Boost to up to 2.9 GHz with no thread-doubling Hyper-Threading technology in sight. A pretty basic iGPU is present as well.

The only difference between the N5095 and the N5095A is that the latter comes with support for more proprietary Intel technologies such as the Smart Sound DSP, Wake on Voice and HD Audio.

Architecture and Features

Tremont brings many improvements over Goldmont Plus, the architecture that we know from the N5030 and myriads of other N-class CPUs. An up to 30% boost in single-thread performance is to be expected thanks to smarter prefetchers, branch prediction improvements and other refinements, according to Intel. These new chips are physically larger than their immediate predecessors as a result. Either way, this is still a "small" core rather than a "big" one according to ChipsAndCheese.

The Celeron has 1.5 MB of L2 and 4 MB of L3 cache and is compatible with DDR4-2933 and LPDDR4x-2933 memory or slower. Support for Intel CNVi Wi-Fi 6 modules is baked into the chip, as are 8 PCIe 3.0 lanes for NVMe SSD speeds up to 3.9 GB/s. USB 4 or Thunderbolt aren't supported however.

Please also note that the Celeron gets soldered to the motherboard (BGA1338 socket interface) for good and is thus not user-replaceable.

Performance

The average N5095 in our database is about as fast as the Core i3-10110U, Core i3-1005G1, Celeron N5105 and also the Ryzen 3 3200U in multi-threaded workloads. Which is just enough for the most basic of tasks in late 2024.

Performance will get a significant hit if the power target is set to 10 W or 6 W instead of the Intel-recommended 15 W value.

Graphics

The DirectX 12.1-capable 16 EU UHD Graphics runs at up to 750 MHz and is in many respects similar to what Ice Lake CPUs come equipped with. This graphics adapter is capable of driving up to 3 SUHD displays simultaneously; HEVC, AVC, VP9, MPEG-2 and other popular video codecs can all be hardware-decoded. AV1 and VVC can't.

As far as gaming is concerned, it is reasonable to expect playable framerates in really old games (like Dota 2 Reborn) provided one sticks to lower resolutions such as HD 720p.

Power consumption

While most N-class chips have a 6 W long-term power target, the Celeron N5095 has a 15 W TDP to mimic much faster U-class Core processors. This isn't a great CPU for passively cooled designs.

The N5095 is built with the same 10 nm Intel process as Ice Lake-U processors for pretty unimpressive power efficiency, as of late 2024.
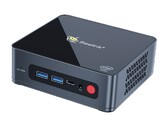
CodenameJasper Lake
SeriesIntel Jasper Lake

Series: Jasper Lake Jasper Lake

Intel Pentium Silver N6005 compare2 - 3.3 GHz4 / 4 cores4 MB L3
Intel Pentium Silver N6000 compare1.1 - 3.3 GHz4 / 4 cores4 MB L3
Intel Celeron N5095A compare2 - 2.9 GHz4 / 4 cores4 MB L3
Intel Celeron N5095 « 2 - 2.9 GHz4 / 4 cores4 MB L3
Intel Celeron N5105 compare2 - 2.9 GHz4 / 4 cores4 MB L3
Intel Celeron N5100 compare1.1 - 2.8 GHz4 / 4 cores4 MB L3
Intel Celeron N4505 compare2 - 2.9 GHz2 / 2 cores4 MB L3
Intel Celeron N4500 compare1.1 - 2.8 GHz2 / 2 cores4 MB L3
Clock Rate2000 - 2900 MHz
Level 2 Cache1.5 MB
Level 3 Cache4 MB
Number of Cores / Threads4 / 4
4 x 2.9 GHz Intel Tremont
Power Consumption (TDP = Thermal Design Power)15 Watt
Manufacturing Technology10 nm
Max. Temperature105 °C
SocketBGA1338
FeaturesDDR4-2933/LPDDR4x-2933 RAM, PCIe 3, GNA, MMX, SSE, SSE2, SSE3, SSSE3, SSE4.1, SSE4.2, VMX, SMEP, SMAP, EIST, TM1, TM2, Turbo, SST, AES-NI, RDRAND, RDSEED, SHA
GPUIntel UHD Graphics (Jasper Lake 16 EU) (450 - 750 MHz)
64 Bit64 Bit support
Architecturex86
Announcement Date01/11/2021
Product Link (external)ark.intel.com

Benchmarks

Performance Rating - CB R15 + R20 + 7-Zip + X265 + Blender + 3DM11 CPU
20.6 pt (34%)
Restrict / Search: Model: Max. age: years
Cinebench R23 - Cinebench R23 Multi Core
min: 2150     avg: 2174     median: 2164 (2%)     max: 2219 Points
Restrict / Search: Model: Max. age: years
Cinebench R23 - Cinebench R23 Single Core
min: 587     avg: 608     median: 611 (26%)     max: 621 Points
Restrict / Search: Model: Max. age: years
Cinebench R20 - Cinebench R20 CPU (Single Core)
min: 228     avg: 234     median: 234 (26%)     max: 239 Points
Cinebench R20 - Cinebench R20 CPU (Multi Core)
min: 804     avg: 825     median: 827 (2%)     max: 844 Points
Cinebench R15 - Cinebench R15 CPU Multi 64 Bit
min: 221     avg: 343     median: 364 (2%)     max: 379 Points
Restrict / Search: Model: Max. age: years
020406080100120140160180200220240260280300320340360Tooltip
Cinebench R15 - Cinebench R15 CPU Single 64 Bit
min: 95.4     avg: 103.9     median: 106 (30%)     max: 109 Points
Restrict / Search: Model: Max. age: years
Cinebench R11.5 - Cinebench R11.5 CPU Multi 64 Bit
min: 4.65     avg: 4.7     median: 4.7 (6%)     max: 4.76 Points
Cinebench R11.5 - Cinebench R11.5 CPU Single 64 Bit
min: 1.25     avg: 1.3     median: 1.3 (30%)     max: 1.29 Points
Cinebench R10 - Cinebench R10 Rend. Single (32bit)
min: 3527     avg: 3545     median: 3544.5 (21%)     max: 3562 points
Cinebench R10 - Cinebench R10 Rend. Multi (32bit)
min: 12218     avg: 12283     median: 12283 (9%)     max: 12348 points
Cinebench R10 - Cinebench R10 Rend. Multi (64bit)
min: 16442     avg: 16860     median: 16860 (11%)     max: 17278 Points
Cinebench R10 - Cinebench R10 Rend. Single (64bit)
min: 5224     avg: 5338     median: 5337.5 (7%)     max: 5451 Points
wPrime 2.10 - wPrime 2.0 1024m *
min: 605.375     avg: 611     median: 611.4 (7%)     max: 617.326 s
wPrime 2.10 - wPrime 2.0 32m *
min: 19.202     avg: 19.5     median: 19.5 (4%)     max: 19.779 s
WinRAR - WinRAR 4.0
min: 1630     avg: 1706     median: 1705.5 (3%)     max: 1781 points
7-Zip 18.03 - 7-Zip 18.03 Multi Thread 4 runs
min: 10924     avg: 11024     median: 11013 (6%)     max: 11168 MIPS
7-Zip 18.03 - 7-Zip 18.03 Single Thread 4 runs
min: 2935     avg: 3074     median: 3100 (37%)     max: 3124 MIPS
X264 HD Benchmark 4.0 - x264 Pass 2
min: 24.75     avg: 25     median: 25 (8%)     max: 25.25 fps
X264 HD Benchmark 4.0 - x264 Pass 1
min: 112.75     avg: 116.5     median: 116.5 (27%)     max: 120.25 fps
HWBOT x265 Benchmark v2.2 - HWBOT x265 4k Preset
min: 1.9     avg: 2     median: 2 (4%)     max: 2.05 fps
00.20.40.60.811.11.31.51.71.92.12.32.52.72.93.13.23.43.6Tooltip
TrueCrypt - TrueCrypt Serpent
0.2 GB/s (6%)
TrueCrypt - TrueCrypt Twofish
0.4 GB/s (6%)
TrueCrypt - TrueCrypt AES
2.5 GB/s (7%)
Blender - Blender 3.3 Classroom CPU *
2936 Seconds (37%)
Blender - Blender 2.79 BMW27 CPU *
min: 1502     avg: 1548     median: 1547 (11%)     max: 1624 Seconds
R Benchmark 2.5 - R Benchmark 2.5 *
min: 1.16     avg: 1.2     median: 1.2 (25%)     max: 1.2 sec
3DMark 06 - CPU - 3DMark 06 - CPU
min: 5266     avg: 5272     median: 5272 (11%)     max: 5278 Points
Super Pi mod 1.5 XS 1M - Super Pi mod 1.5 XS 1M *
20.5 s (4%)
Super Pi mod 1.5 XS 2M - Super Pi mod 1.5 XS 2M *
45.7 s (2%)
Super Pi Mod 1.5 XS 32M - Super Pi mod 1.5 XS 32M *
1039 s (5%)
3DMark 11 - 3DM11 Performance Physics
min: 4224     avg: 4309     median: 4287 (11%)     max: 4439 Points
3DMark - 3DMark Ice Storm Physics
min: 41689     avg: 42092     median: 42091.5 (34%)     max: 42494 Points
3DMark - 3DMark Ice Storm Extreme Physics
min: 41654     avg: 42066     median: 42065.5 (34%)     max: 42477 Points
3DMark - 3DMark Ice Storm Unlimited Physics
min: 46730     avg: 47458     median: 47458 (39%)     max: 48186 Points
3DMark - 3DMark Cloud Gate Physics
min: 3720     avg: 3823     median: 3846 (10%)     max: 3888 Points
3DMark - 3DMark Fire Strike Standard Physics
min: 5400     avg: 5496     median: 5499 (10%)     max: 5572 Points
3DMark - 3DMark Time Spy CPU
min: 1595     avg: 1649     median: 1656 (7%)     max: 1696 Points
Geekbench 5.5 - Geekbench 5.1 - 5.5 64 Bit Single-Core
min: 637     avg: 649     median: 650.5 (25%)     max: 659 points
Restrict / Search: Model: Max. age: years
Geekbench 5.5 - Geekbench 5.1 - 5.5 64 Bit Multi-Core
min: 1933     avg: 2010     median: 2028 (4%)     max: 2052 points
Geekbench 5.0 - Geekbench 5.0 64 Bit Single-Core
min: 628     avg: 644     median: 646.5 (3%)     max: 655 points
Geekbench 5.0 - Geekbench 5.0 64 Bit Multi-Core
min: 1985     avg: 2029     median: 2030.5 (6%)     max: 2070 points
Geekbench 4.4 - Geekbench 4.1 - 4.4 64 Bit Single-Core
min: 2858     avg: 2896     median: 2900 (29%)     max: 2929 points
Geekbench 4.4 - Geekbench 4.1 - 4.4 64 Bit Multi-Core
min: 7759     avg: 7856     median: 7842 (8%)     max: 7968 points
Mozilla Kraken 1.1 - Kraken 1.1 Total Score *
min: 1557     avg: 1578     median: 1571.5 (2%)     max: 1619 ms
WebXPRT 4 - WebXPRT 4 Score
min: 94.2     avg: 95.2     median: 95.2 (26%)     max: 96.2 Points
WebXPRT 3 - WebXPRT 3 Score
min: 114.3     avg: 123.4     median: 125.3 (22%)     max: 127.2 Points
CrossMark - CrossMark Overall
min: 473     avg: 486     median: 490 (18%)     max: 495 Points
Power Consumption - Prime95 Power Consumption - external Monitor *
min: 24.1     avg: 24.4     median: 24.4 (4%)     max: 24.8 Watt
0510152025Tooltip
Power Consumption - Cinebench R15 Multi Power Consumption - external Monitor *
min: 20.7     avg: 22     median: 22.1 (4%)     max: 23 Watt
05101520Tooltip
Power Consumption - Idle Power Consumption - external Monitor *
4.9 Watt (3%)
012345Tooltip
Power Consumption - Power Efficiency - Cinebench R15 Multi external Monitor
min: 15.6     avg: 17     median: 17.2 (13%)     max: 18.3 Points per Watt
- Range of benchmark values for this graphics card
red legend - Average benchmark values for this graphics card
* Smaller numbers mean a higher performance

Add one or more devices and compare

In the following list you can select (and also search for) devices that should be added to the comparison. You can select more than one device.

search for model:
v1.29
log 18. 10:56:15

#0 ran 0s before starting gpusingle class +0s ... 0s

#1 no ids found in url (should be separated by "_") +0s ... 0s

#2 not redirecting to Ajax server +0s ... 0s

#3 did not recreate cache, as it is less than 5 days old! Created at Sun, 16 Mar 2025 06:02:38 +0100 +0.003s ... 0.003s

#4 composed specs +0.038s ... 0.041s

#5 did output specs +0s ... 0.041s

#6 getting avg benchmarks for device 13189 +0.041s ... 0.083s

#7 got single benchmarks 13189 +0.036s ... 0.119s

#8 got avg benchmarks for devices +0s ... 0.119s

#9 min, max, avg, median took s +2.975s ... 3.094s

#10 return log +0.009s ... 3.102s

Please share our article, every link counts!
Mail Logo

» Mobile CPU Comparison
Comparison of all mobile CPU series

» Mobile Processors - Benchmarklist
Benchmarklist of all known CPUs that are used in laptops (desktop and laptop CPUs)

Other CPUs of the series Jasper Lake

» Intel Pentium Silver N6005
   4x 2 GHz - 3.3 GHz
» Intel Pentium Silver N6000
   4x 1.1 GHz - 3.3 GHz
» Intel Celeron N5095A
   4x 2 GHz - 2.9 GHz
» Intel Celeron N5095
   4x 2 GHz - 2.9 GHz
» Intel Celeron N5105
   4x 2 GHz - 2.9 GHz
» Intel Celeron N5100
   4x 1.1 GHz - 2.8 GHz
» Intel Celeron N4505
   2x 2 GHz - 2.9 GHz
» Intel Celeron N4500
   2x 1.1 GHz - 2.8 GHz

Surrounding CPUs

+ Intel Core i7-660LM
   2x 2.27 GHz - 3.07 GHz
+ Intel Core 2 Extreme X7900
   2x 2.8 GHz
+ Intel Core 2 Quad Q9100
   4x 2.26 GHz
+ Intel Core i5-3317U
   2x 1.7 GHz - 2.6 GHz
+ Intel Celeron N5095A
   4x 2 GHz - 2.9 GHz
» Intel Celeron N5095
   4x 2 GHz - 2.9 GHz
- Intel Celeron N5105
   4x 2 GHz - 2.9 GHz
- Intel Celeron N5100
   4x 1.1 GHz - 2.8 GHz
- AMD Athlon Silver 3050e
   2x 1.4 GHz - 2.8 GHz
- AMD 3020e
   2x 1.2 GHz - 2.6 GHz
- Intel Pentium Silver N5030
   4x 1.1 GHz - 3.1 GHz
Klaus Hinum (Update: 2024-09-23)