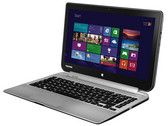
Notebookcheck Logo

Intel Core i3-4020Y

Intel 4020Y

The Intel Core i3-4020Y is an ULV (ultra low voltage) dual-core processor for ultrabooks and tablets which has been presented in Q3/2013. It is based on the Haswell architecture and manufactured in 22nm. Due to Hyperthreading, the two cores can handle up to four threads in parallel, leading to better utilization of the CPU. Each core offers a base speed of 1.5 GHz (no Turbo Boost support).

Haswell is the successor to the Ivy Bridge architecture with improvements on both GPU and CPU performance. The CPUs are produced in 22nm and offer an optimized branch prediction as well as additional execution ports, improving the performance per clock by almost 10 percent. Furthermore, new features like AVX2 and FMA should increase the performance in future applications.

The performance of the Core i3-4020Y is about 10 - 15 percent higher compared to the Ivy Bridge based Core i3-3229Y. When using new instructions such as AVX2, the performance can be even better. Thus, the CPU has sufficient power for office and multimedia purposes as well as most applications.

The integrated HD Graphics 4200 offers 20 Execution Units (EUs) clocked at 200 - 850 MHz (with Turbo Boost), making it somewhat faster than the former HD Graphics 4000 (at similar clocks). However, the HD 4200 is significantly slower than the HD 5000 of other ULV models (with a higher TDP).

The i3-4020Y is rated at a TDP of 11.5 watts (SDP 6 watts) including graphics card, memory controller, VRMs and the integrated chipset.  Therefore, the CPU is suited for very small ultrabooks or tablets, but usually still needs active cooling.

SeriesIntel Core i3
CodenameHaswell

Series: Core i3 Haswell

Intel Core i3-4110M compare2.6 GHz2 / 4 cores3 MB L3
Intel Core i3-4100M compare2.5 GHz2 / 4 cores3 MB L3
Intel Core i3-4000M compare2.4 GHz2 / 4 cores3 MB L3
Intel Core i3-4100E compare2.4 GHz2 / 4 cores3 MB L3
Intel Core i3-4158U compare2 GHz2 / 4 cores3 MB L3
Intel Core i3-4120U compare2 GHz2 / 4 cores3 MB L3
Intel Core i3-4030U compare1.9 GHz2 / 4 cores3 MB L3
Intel Core i3-4025U compare1.9 GHz2 / 4 cores3 MB L3
Intel Core i3-4100U compare1.8 GHz2 / 4 cores3 MB L3
Intel Core i3-4010U compare1.7 GHz2 / 4 cores3 MB L3
Intel Core i3-4005U compare1.7 GHz2 / 4 cores3 MB L3
Intel Core i3-4102E compare1.6 GHz2 / 4 cores3 MB L3
Intel Core i3-4030Y compare1.6 GHz2 / 4 cores3 MB L3
Intel Core i3-4020Y « 1.5 GHz2 / 4 cores3 MB L3
Intel Core i3-4012Y compare1.5 GHz2 / 4 cores3 MB L3
Intel Core i3-4010Y compare1.3 GHz2 / 4 cores3 MB L3
Clock Rate1500 MHz
Level 1 Cache128 KB
Level 2 Cache512 KB
Level 3 Cache3 MB
Number of Cores / Threads2 / 4
Power Consumption (TDP = Thermal Design Power)11.5 Watt
Manufacturing Technology22 nm
Max. Temperature100 °C
SocketFCBGA1168
FeaturesHD Graphics 4200 (200 - 850 MHz), DDR3(L)-1600 Memory Controller, HyperThreading, AVX, AVX2, Quick Sync, Virtualization, AES-NI
GPUIntel HD Graphics 4200 (200 - 850 MHz)
64 Bit64 Bit support
Architecturex86
Starting Price$304 U.S.
Announcement Date09/01/2013
Product Link (external)Intel Core i3 4020Y

Benchmarks

Cinebench R11.5 - Cinebench R11.5 CPU Multi 64 Bit
min: 1.54     avg: 1.6     median: 1.6 (2%)     max: 1.63 Points
Cinebench R11.5 - Cinebench R11.5 CPU Single 64 Bit
min: 0.62     avg: 0.6     median: 0.6 (16%)     max: 0.67 Points
Cinebench R10 - Cinebench R10 Rend. Single (32bit)
min: 1001     avg: 1621     median: 1621 (10%)     max: 2241 points
Cinebench R10 - Cinebench R10 Rend. Multi (64bit)
min: 4701     avg: 5602     median: 5602 (4%)     max: 6503 Points
Cinebench R10 - Cinebench R10 Rend. Single (64bit)
min: 2615     avg: 2778     median: 2777.5 (15%)     max: 2940 Points
Super Pi Mod 1.5 XS 32M - Super Pi mod 1.5 XS 32M *
min: 1220     avg: 1221     median: 1220.5 (5%)     max: 1221 s
3DMark 11 - 3DM11 Performance Physics
min: 1908     avg: 2061     median: 2061 (6%)     max: 2214 Points
3DMark - 3DMark Ice Storm Physics
min: 16987     avg: 17518     median: 17517.5 (14%)     max: 18048 Points
3DMark - 3DMark Cloud Gate Physics
min: 1501     avg: 1536     median: 1536 (4%)     max: 1571 Points
3DMark - 3DMark Fire Strike Standard Physics
min: 1793     avg: 1977     median: 1977 (4%)     max: 2161 Points
Geekbench 3 - Geekbench 3 32 Bit Multi-Core
min: 2952     avg: 3140     median: 3140 (6%)     max: 3328 points
Geekbench 3 - Geekbench 3 32 Bit Single-Core
min: 1481     avg: 1526     median: 1525.5 (30%)     max: 1570 points
- Range of benchmark values for this graphics card
- Average benchmark values for this graphics card
* Smaller numbers mean a higher performance

Add one or more devices and compare

In the following list you can select (and also search for) devices that should be added to the comparison. You can select more than one device.

restrict list: