The performance in multi-threaded applications of the 18 core CPU is excellent, however in gaming and workloads with less threads, fast clocked consumer CPUs like the Core i9-9900K are faster.
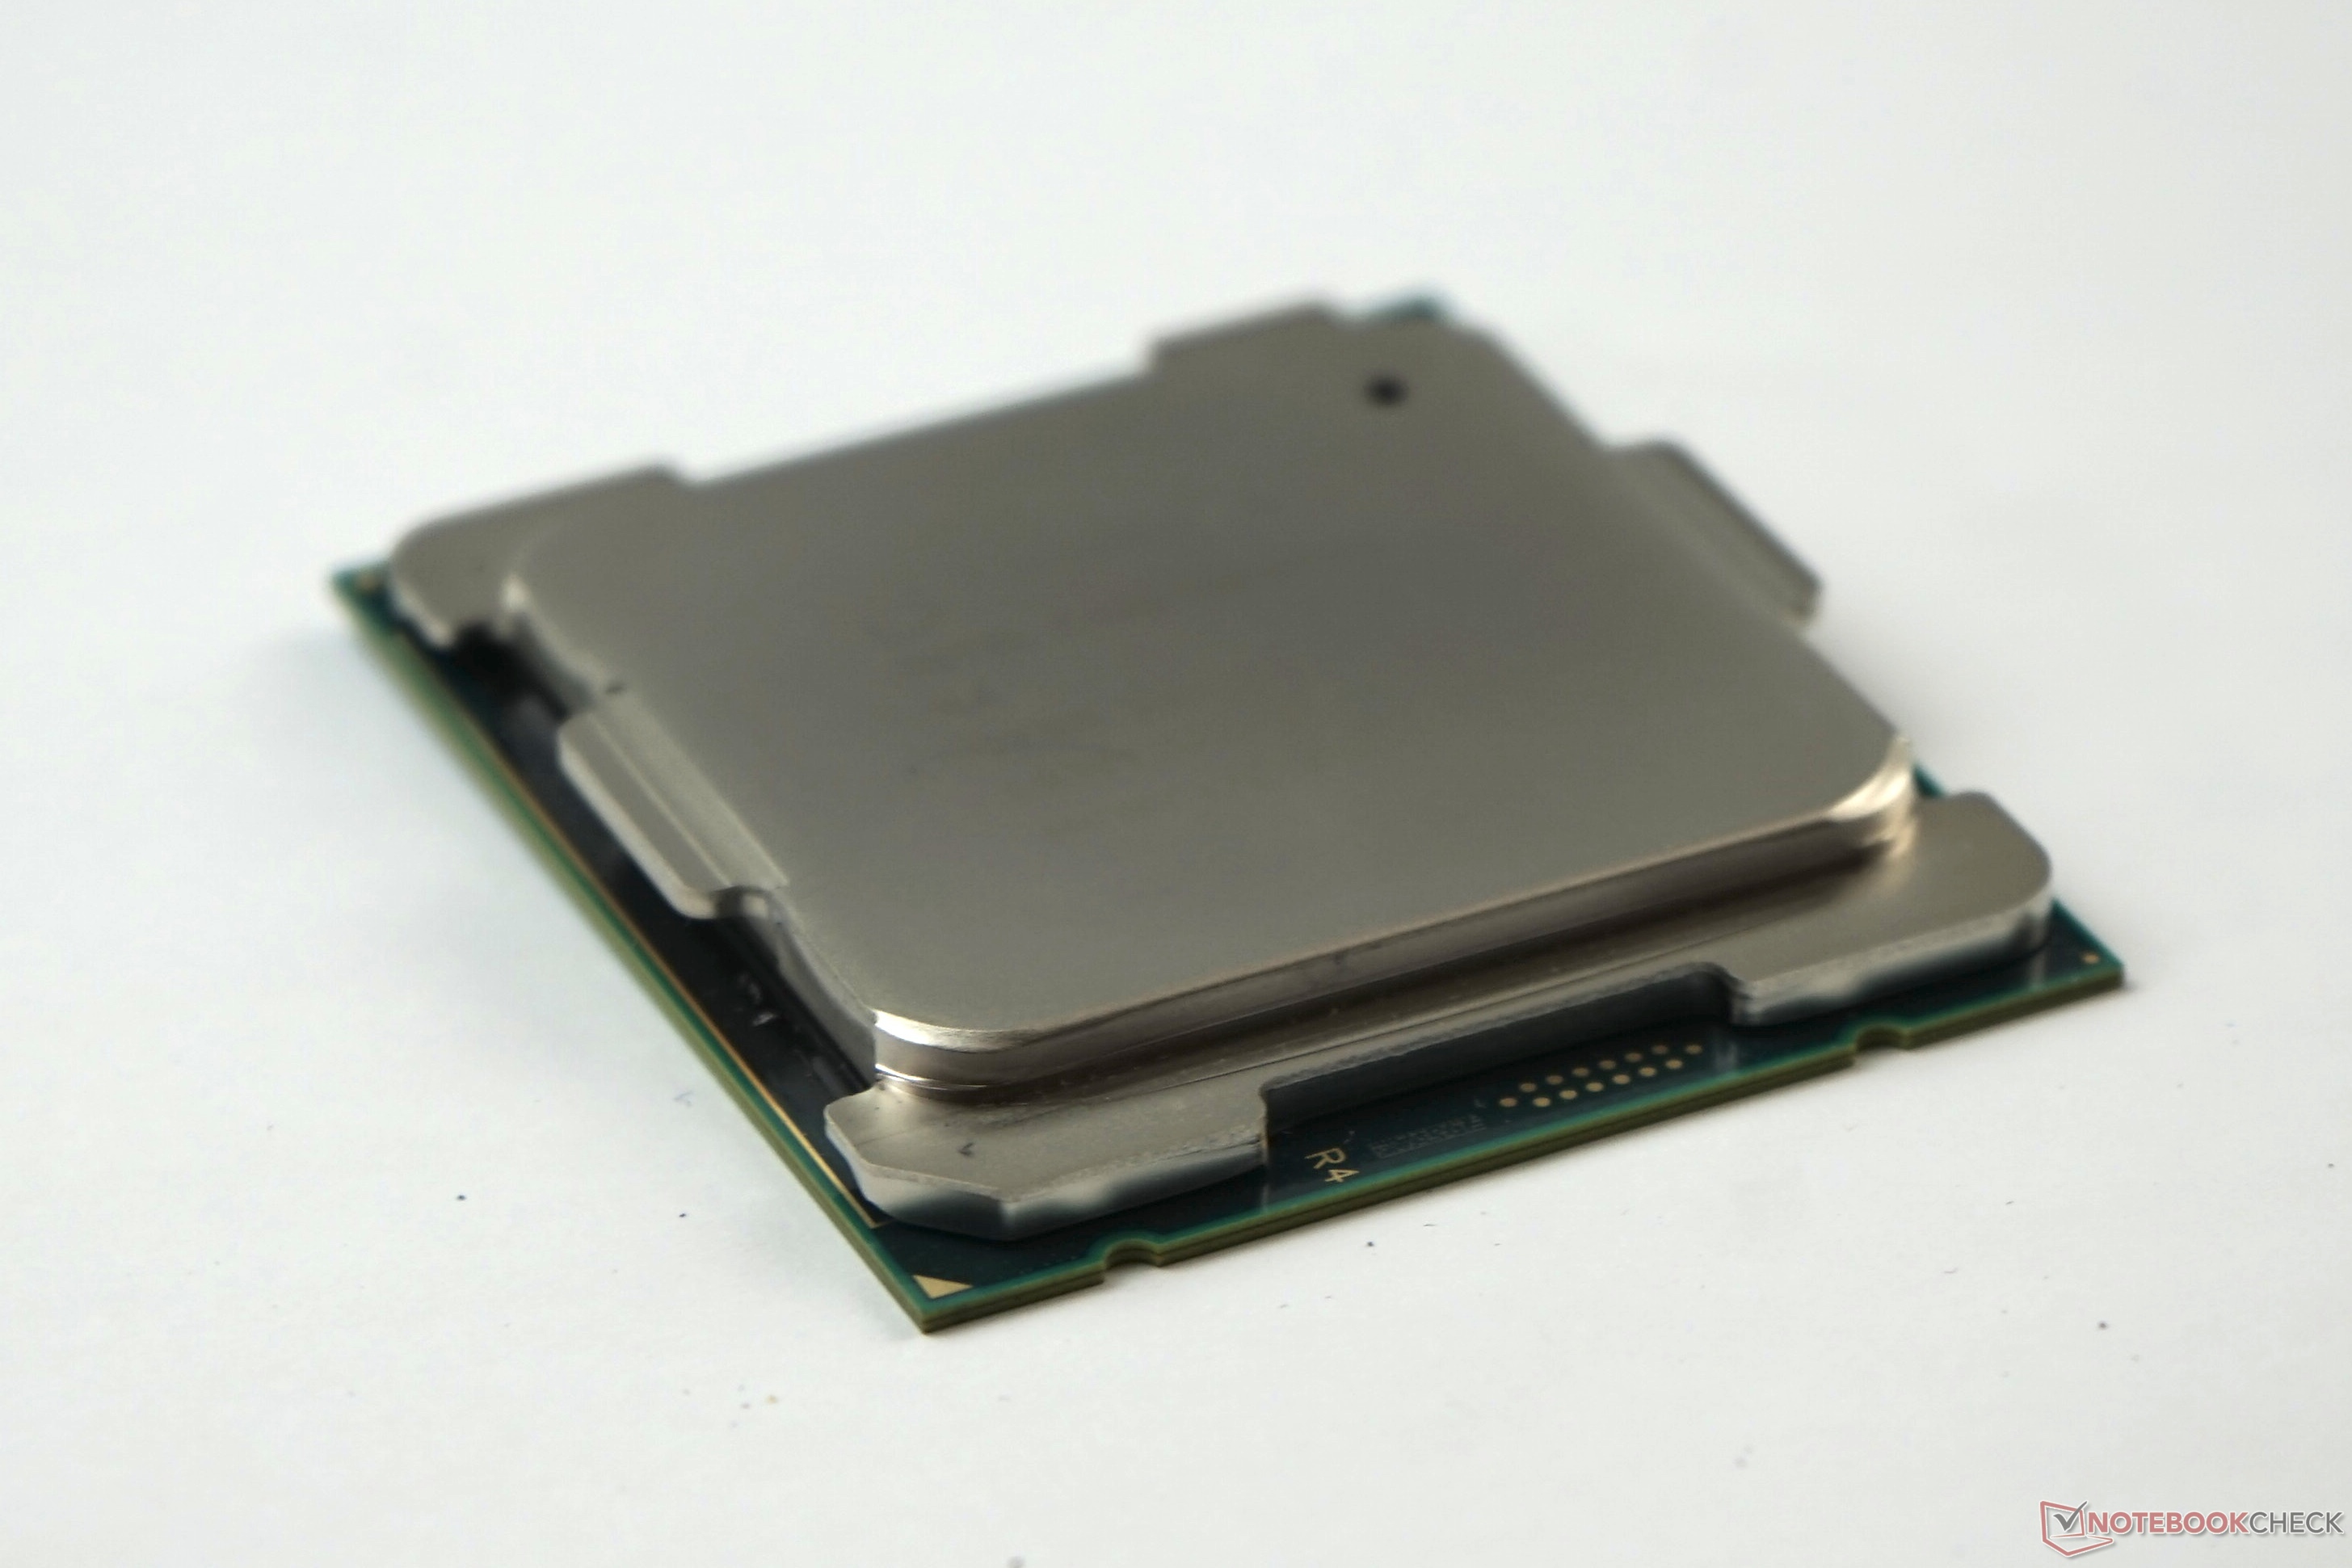
The CPU is specified with a TDP of 165 Watt and therefore needs a big and capable cooling system.
Codename Cascade Lake Series Intel Core i9 (Desktop) Clock Rate 3000 - 4600 MHz Level 1 Cache 1.1 MB Level 2 Cache 18 MB Level 3 Cache 24.8 MB Number of Cores / Threads 18 / 36 Power Consumption (TDP = Thermal Design Power) 165 Watt Manufacturing Technology 14 nm Max. Temperature 86 °C Socket FCLGA-2066 (LGA) Features Quad-Channel DDR4-2933 Memory Controller, HyperThreading, AVX, AVX2, AES-NI, TSX-NI, Quick Sync, Virtualization, vPro 64 Bit 64 Bit support Architecture x86 Starting Price $979 U.S. Announcement Date 10/02/2019 Product Link (external) ark.intel.com
Performance Rating - CB R15 + R20 + 7-Zip + X265 + Blender + 3DM11 CPU
Cinebench R20 - Cinebench R20 CPU (Single Core)
min: 487 avg: 489.5 median: 489.5 (53%) max: 492 Points
...
...
Intel Core Ultra 7 270K Plus
Cinebench R20 - Cinebench R20 CPU (Multi Core)
min: 8220 avg: 8533 median: 8532.5 (21%) max: 8845 Points
...
AMD Ryzen 7 9850X3D
...
Cinebench R15 - Cinebench R15 CPU Multi 64 Bit
min: 3632 avg: 3712 median: 3744 (24%) max: 3761 Points
...
AMD Ryzen 7 9850X3D
...
0 80 160 240 320 400 480 560 640 720 800 880 960 1040 1120 1200 1280 1360 1440 1520 1600 1680 1760 1840 1920 2000 2080 2160 2240 2320 2400 2480 2560 2640 2720 2800 2880 2960 3040 3120 3200 3280 3360 3440 3520 3600 3680 3760 Tooltip Asus X299 Prime Desktop: Ø3596 (3541.7-3632.07)
Asus X299 Prime Desktop DDR4-3200: Ø3704 (3571.43-3760.81)
Cinebench R15 - Cinebench R15 CPU Single 64 Bit
min: 204 avg: 207.3 median: 208 (58%) max: 210 Points
Cinebench R11.5 - Cinebench R11.5 CPU Multi 64 Bit
...
AMD Ryzen 7 9850X3D
...
Intel Core Ultra 7 270K Plus
Cinebench R11.5 - Cinebench R11.5 CPU Single 64 Bit
Cinebench R10 - Cinebench R10 Rend. Single (32bit)
Cinebench R10 - Cinebench R10 Rend. Multi (32bit)
...
AMD Ryzen 7 9850X3D
...
wPrime 2.10 - wPrime 2.0 1024m *
...
Intel Core Ultra 7 270K Plus
AMD Ryzen 7 9850X3D
Intel Core Ultra 5 250K Plus
...
VIA C3-M C3-M-1200
wPrime 2.10 - wPrime 2.0 32m *
7-Zip 18.03 - 7-Zip 18.03 Multi Thread 4 runs
min: 93061 avg: 93077 median: 93076.5 (53%) max: 93092 MIPS
...
AMD Ryzen 7 9850X3D
...
7-Zip 18.03 - 7-Zip 18.03 Single Thread 4 runs
min: 5333 avg: 5371 median: 5370.5 (61%) max: 5408 MIPS
...
...
AMD Ryzen 7 9850X3D
X264 HD Benchmark 4.0 - x264 Pass 2
Intel Pentium 4 2.4 GHz
...
...
X264 HD Benchmark 4.0 - x264 Pass 1
HWBOT x265 Benchmark v2.2 - HWBOT x265 4k Preset
min: 26.2 avg: 27 median: 27 (47%) max: 27.8 fps
0 5 10 15 20 25 30 35 Tooltip Asus X299 Prime Desktop DDR4-3200: Ø25.8 (1.21-33.3)
Asus X299 Prime Desktop: Ø27.2 (1.25-35.2)
TrueCrypt - TrueCrypt Serpent
...
Intel Core Ultra 5 250K Plus
...
TrueCrypt - TrueCrypt Twofish
...
AMD Ryzen 7 9850X3D
...
TrueCrypt - TrueCrypt AES
...
Intel Core Ultra 5 250K Plus
Intel Core Ultra 7 270K Plus
AMD Ryzen 7 9850X3D
...
Blender - Blender 2.79 BMW27 CPU *
min: 125 avg: 130 median: 130 (1%) max: 135 Seconds
...
AMD Ryzen 7 9850X3D
...
3DMark 06 - CPU - 3DMark 06 - CPU
Super Pi mod 1.5 XS 1M - Super Pi mod 1.5 XS 1M *
Super Pi mod 1.5 XS 2M - Super Pi mod 1.5 XS 2M *
Super Pi Mod 1.5 XS 32M - Super Pi mod 1.5 XS 32M *
3DMark 11 - 3DM11 Performance Physics
3DMark - 3DMark Ice Storm Unlimited Physics
...
...
Intel Core Ultra 5 250K Plus
3DMark - 3DMark Cloud Gate Physics
...
...
Intel Core Ultra 7 270K Plus
3DMark - 3DMark Fire Strike Standard Physics
...
...
Intel Core Ultra 7 270K Plus
3DMark - 3DMark Time Spy CPU
...
...
Intel Core Ultra 7 270K Plus
Geekbench 6.7 - Geekbench 6.7.1 Single-Core
Model CPU GPU RAM Value Apple Mac Pro (Late 2019) i9-10980XE 1593
Geekbench 6.7 - Geekbench 6.7.1 Multi-Core
Model CPU GPU RAM Value Apple Mac Pro (Late 2019) i9-10980XE 11650
Geekbench 5.5 - Geekbench 5.1 - 5.5 64 Bit Single-Core
Geekbench 5.5 - Geekbench 5.1 - 5.5 64 Bit Multi-Core
...
AMD Ryzen 7 9850X3D
...
Geekbench 5.0 - Geekbench 5.0 64 Bit Single-Core
min: 1208 avg: 1240 median: 1239.5 (5%) max: 1271 points
...
...
AMD Ryzen 7 9850X3D
Geekbench 5.0 - Geekbench 5.0 64 Bit Multi-Core
min: 15598 avg: 15744 median: 15743.5 (50%) max: 15889 points
...
AMD Ryzen 7 9850X3D
...
Geekbench 4.4 - Geekbench 4.1 - 4.4 64 Bit Single-Core
min: 5769 avg: 5795 median: 5794.5 (53%) max: 5820 points
Geekbench 4.4 - Geekbench 4.1 - 4.4 64 Bit Multi-Core
min: 50801 avg: 54223 median: 54222.5 (52%) max: 57644 points
...
...
Intel Core Ultra 7 270K Plus
Geekbench 3 - Geekbench 3 32 Bit Multi-Core
Geekbench 3 - Geekbench 3 32 Bit Single-Core
Geekbench 3 - Geekbench 3 64 Bit Multi-Core
Geekbench 3 - Geekbench 3 64 Bit Single-Core
Geekbench 2 - 32 Bit - Geekbench Stream
Geekbench 2 - 32 Bit - Geekbench Memory
Geekbench 2 - 32 Bit - Geekbench Floating Point
Geekbench 2 - 32 Bit - Geekbench Integer
Geekbench 2 - 32 Bit - Geekbench Total Score
Mozilla Kraken 1.1 - Kraken 1.1 Total Score *
Sunspider - Sunspider 1.0 Total Score *
Octane V2 - Octane V2 Total Score
WebXPRT 3 - WebXPRT 3 Score
Power Consumption - Prime95 Power Consumption - external Monitor *
...
Intel Core Ultra 5 250K Plus
AMD Ryzen 7 9850X3D
...
Power Consumption - Cinebench R15 Multi Power Consumption - external Monitor *
...
Intel Core Ultra 7 270K Plus
...
Power Consumption - Power Efficiency - Cinebench R15 Multi external Monitor
11.9 Points per Watt (9%)
- Range of benchmark values
- Average benchmark values
* Smaller numbers mean a higher performance
log 19. 12:47:56
#0 ran 0s before starting gpusingle class +0s ... 0s
#1 no ids found in url (should be separated by "_") +0s ... 0s
#2 not redirecting to Ajax server +0s ... 0s
#3 did not recreate cache, as it is less than 5 days old! Created at Fri, 19 Jun 2026 05:27:47 +0200 +0.003s ... 0.003s
#4 composed specs +0.012s ... 0.015s
#5 did output specs +0s ... 0.015s
#6 getting avg benchmarks for device 11561 +0.05s ... 0.065s
#7 got single benchmarks 11561 +0.009s ... 0.074s
#8 got avg benchmarks for devices +0s ... 0.074s
#9 min, max, avg, median took s +2.989s ... 3.062s
#10 return log +0.515s ... 3.578s