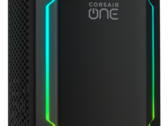
Notebookcheck Logo

Intel Core i9-9900K

The Intel Core i9-9900K is a high end desktop processor based on the Coffee Lake architecture. At the time of announcement in late 2018, the 9900K is the fastest Coffee Lake CPU and offers an open multiplicator for easy overclocking. The CPU integrates 8 cores (16 threads) clocked at 3.6 - 5 GHz and it needs a new Z390 based mainboard.

Thanks to the two additional cores, the performance in multi-threaded applications is up to 25 % faster than the older Core i7-8700K. The single thread performance is only slightly faster due to the higher clock speeds. As a high end desktop CPU, the i9-9900K is suited even for very demanding applications and perfect for 3D gaming.

The integrated Intel UHD Graphics 630 graphics card is clocked at up to 1.2 GHz and offers no advantage compared to previous generations. As it is a very low end GPU, only some low demanding games like Hearthstone can be played with it (see GPU page for benchmarks).

Intel specifies the TDP at 95 Watt, so if the CPU is used in laptops a big and chunky cooling system is needed to avoid throttling and lower clock speeds under sustained loads. When overclocking the CPU, the power consumption can easily rise up to 200 Watt and higher.

SeriesIntel Coffee Lake
CodenameCoffee Lake-R

Series: Coffee Lake Coffee Lake-R

Intel Core i9-9900KS compare4 - 5 GHz8 / 16 cores16 MB L3
Intel Core i9-9900K « 3.6 - 5 GHz8 / 16 cores16 MB L3
Intel Core i7-9700K compare3.6 - 4.9 GHz8 / 8 cores12 MB L3
Intel Core i7-9700 compare3 - 4.7 GHz8 / 8 cores12 MB L3
Intel Core i5-9600K compare3.7 - 4.6 GHz6 / 6 cores9 MB L3
Intel Core i9-9900T compare2.1 - 4.4 GHz8 / 16 cores16 MB L3
Intel Core i5-9400F compare2.9 - 4.1 GHz6 / 6 cores9 MB L3
Intel Core i3-9100F compare3.6 - 4.2 GHz4 / 4 cores6 MB L3
Clock Rate3600 - 5000 MHz
Level 1 Cache512 KB
Level 2 Cache2 MB
Level 3 Cache16 MB
Number of Cores / Threads8 / 16
Power Consumption (TDP = Thermal Design Power)95 Watt
Manufacturing Technology14++ nm
Die Size178 mm2
Max. Temperature100 °C
SocketFCLGA1151
FeaturesDual-Channel DDR4-2666 Memory Controller, HyperThreading, AVX, AVX2, AES-NI, TSX-NI, Quick Sync, Virtualization, vPro
GPUIntel UHD Graphics 630 (350 - 1200 MHz)
64 Bit64 Bit support
Architecturex86
Starting Price$488 U.S.
Announcement Date10/08/2018
Product Link (external)www.intel.de

Benchmarks

Performance Rating - CB R15 + R20 + 7-Zip + X265 + Blender + 3DM11 CPU
37.2 pt (52%)
Cinebench R23 - Cinebench R23 Multi Core
12397 Points (12%)
202 -98%
...
11838 -5%
11992 -3%
12157 -2%
12294 -1%
12370 0%
Intel Core i5-12400F
12380 0%
12389 0%
12393 0%
12394 0%
Intel Core i9-9900K
12397
12433 0%
12503 1%
12533 1%
12629 2%
12733 3%
12735 3%
12768 3%
12831 4%
12941 4%
...
AMD Ryzen Threadripper PRO 7995WX
107681 769%
0%
100%
Cinebench R20 - Cinebench R20 CPU (Single Core)
min: 495     avg: 502     median: 502 (56%)     max: 509 Points
Cinebench R20 - Cinebench R20 CPU (Multi Core)
min: 4816     avg: 4871     median: 4871 (12%)     max: 4926 Points
Cinebench R15 - Cinebench R15 CPU Multi 64 Bit
min: 1623     avg: 1939     median: 1979 (12%)     max: 2040 Points
31 -98%
...
1859 -4%
1859 -4%
1863 -4%
1863 -4%
1894 -2%
AMD Ryzen 7 7840S
1901 -2%
1913 -1%
1926 -1%
1927 -1%
Intel Core i9-9900K
1939
1956 1%
1968 1%
1968 1%
1968 1%
1987 2%
1992 3%
2019 4%
2027 5%
2027 5%
...
AMD Ryzen Threadripper PRO 7995WX
15842 717%
0%
100%
01052103154205256307358409451050115512601365147015751680178518901995Tooltip
Cinebench R15 - Cinebench R15 CPU Single 64 Bit
min: 203     avg: 210.6     median: 212 (64%)     max: 218 Points
Cinebench R11.5 - Cinebench R11.5 CPU Multi 64 Bit
min: 17.37     avg: 20.7     median: 21.4 (28%)     max: 21.76 Points
Cinebench R11.5 - Cinebench R11.5 CPU Single 64 Bit
min: 2.33     avg: 2.4     median: 2.4 (59%)     max: 2.44 Points
Cinebench R10 - Cinebench R10 Rend. Single (32bit)
min: 7786     avg: 7924     median: 7933 (48%)     max: 8042 points
Cinebench R10 - Cinebench R10 Rend. Multi (32bit)
min: 36683     avg: 45846     median: 48778.5 (35%)     max: 49142 points
Cinebench R10 - Cinebench R10 Rend. Multi (64bit)
min: 63009     avg: 63708     median: 63976 (44%)     max: 64138 Points
Cinebench R10 - Cinebench R10 Rend. Single (64bit)
min: 10167     avg: 10218     median: 10192 (55%)     max: 10294 Points
wPrime 2.10 - wPrime 2.0 1024m *
min: 85.6     avg: 91.9     median: 91.3 (1%)     max: 98.7 s
wPrime 2.10 - wPrime 2.0 32m *
min: 3.276     avg: 4     median: 3.6 (1%)     max: 5.203 s
WinRAR - WinRAR 4.0
min: 7315     avg: 7775     median: 7633 (12%)     max: 8518 points
7-Zip 18.03 - 7-Zip 18.03 Multli Thread 4 runs
min: 43248     avg: 48207     median: 48207 (28%)     max: 53166 MIPS
7-Zip 18.03 - 7-Zip 18.03 Single Thread 4 runs
min: 5311     avg: 5411     median: 5410.5 (65%)     max: 5510 MIPS
X264 HD Benchmark 4.0 - x264 Pass 2
min: 90.9     avg: 110     median: 114.3 (40%)     max: 120.5 fps
X264 HD Benchmark 4.0 - x264 Pass 1
min: 252.7     avg: 260.9     median: 260.5 (60%)     max: 270 fps
HWBOT x265 Benchmark v2.2 - HWBOT x265 4k Preset
min: 12.36     avg: 14.8     median: 15.8 (28%)     max: 16.3 fps
0510152025Tooltip
TrueCrypt - TrueCrypt Serpent
min: 0.8     avg: 1.1     median: 1.2 (35%)     max: 1.2 GB/s
TrueCrypt - TrueCrypt AES
min: 7.8     avg: 10.4     median: 11.1 (29%)     max: 11.5 GB/s
Blender - Blender 2.79 BMW27 CPU *
min: 219.2     avg: 239.7     median: 223.8 (2%)     max: 276.1 Seconds
3DMark 06 - CPU - 3DMark 06 - CPU
min: 10312     avg: 13253     median: 14281.5 (30%)     max: 14409 Points
Super Pi mod 1.5 XS 1M - Super Pi mod 1.5 XS 1M *
min: 7.545     avg: 7.7     median: 7.7 (2%)     max: 7.823 s
Super Pi mod 1.5 XS 2M - Super Pi mod 1.5 XS 2M *
min: 16.73     avg: 17     median: 16.9 (1%)     max: 17.25 s
Super Pi Mod 1.5 XS 32M - Super Pi mod 1.5 XS 32M *
min: 413.8     avg: 429.5     median: 432.2 (2%)     max: 440 s
3DMark Vantage - 3DM Vant. Perf. CPU no Physx
min: 58733     avg: 65154     median: 65153.5 (61%)     max: 71574 Points
3DMark 11 - 3DM11 Performance Physics
min: 16598     avg: 17566     median: 17264 (47%)     max: 19169 Points
3DMark - 3DMark Ice Storm Physics
min: 64697     avg: 67569     median: 67554.5 (55%)     max: 72059 Points
3DMark - 3DMark Ice Storm Extreme Physics
min: 67420     avg: 68874     median: 67813 (55%)     max: 72450 Points
3DMark - 3DMark Ice Storm Unlimited Physics
min: 67259     avg: 68959     median: 68173.5 (57%)     max: 72229 Points
3DMark - 3DMark Cloud Gate Physics
min: 16435     avg: 17955     median: 17969 (45%)     max: 18694 Points
3DMark - 3DMark Fire Strike Standard Physics
min: 21585     avg: 24141     median: 24497.5 (44%)     max: 25010 Points
3DMark - 3DMark Time Spy CPU
min: 9413     avg: 10630     median: 10593 (45%)     max: 11298 Points
Geekbench 5.5 - Geekbench 5.1 - 5.4 64 Bit Multi-Core
8845 points (16%)
Geekbench 4.4 - Geekbench 4.1 - 4.4 64 Bit Single-Core
min: 6014     avg: 6113     median: 6049 (61%)     max: 6339 points
Geekbench 4.4 - Geekbench 4.1 - 4.4 64 Bit Multi-Core
min: 26616     avg: 31703     median: 32981 (37%)     max: 34233 points
Octane V2 - Octane V2 Total Score
min: 38473     avg: 40081     median: 40081 (37%)     max: 41689 Points
Power Consumption - Prime95 Power Consumption - external Monitor *
202 Watt (35%)
Power Consumption - Cinebench R15 Multi Power Consumption - external Monitor *
203.2 Watt (37%)
- Range of benchmark values for this graphics card
- Average benchmark values for this graphics card
* Smaller numbers mean a higher performance

Add one or more devices and compare

In the following list you can select (and also search for) devices that should be added to the comparison. You can select more than one device.

restrict list: