Eurocom Sky X7C (i9-9900K, RTX 2080, FHD 144 Hz) Clevo P775TM1-G Laptop Review
There are plenty of GeForce RTX laptops to choose from ranging from the super-light MSI GS65 to the larger Asus ROG G703. Almost all of them, however, are equipped with "only" 45 W mobile CPUs or soldered GPUs for limited customization and reduced performance. The Eurocom Sky series addresses these concerns by offering full-fledged LGA 1151 and MXM 3.0 sockets to run full-power CPUs and GPUs at higher TDP envelopes for faster desktop-like performance.
The Sky X7C we have today shares the same Clevo P775TM1-G chassis as the Schenker XMG Ultra 17 and also the last Sky X7C we reviewed. As a result, we recommend checking out the existing reviews we have below on more information about the chassis and its features. We'll be jumping right into the performance of the Core i9-9900K CPU and RTX 2080 GPU to see how these desktop-class processors compare against the common mobile Core i7-8750H and Max-Q varieties.
Systems with the same Clevo P775TM1-G chassis:
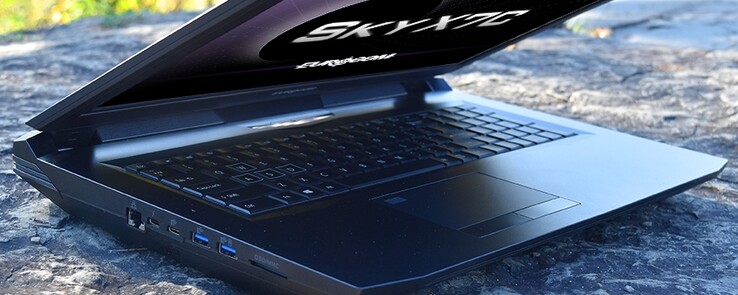
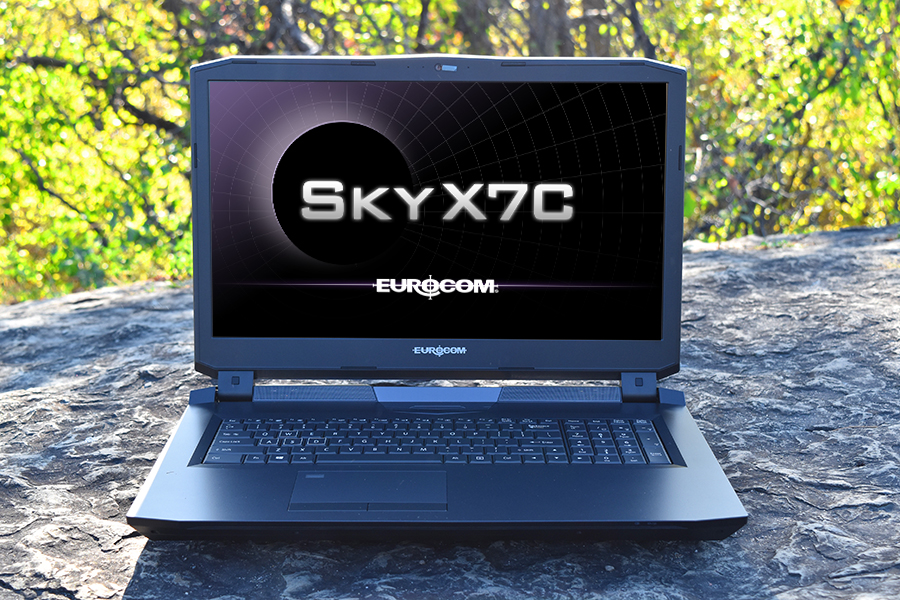
Case
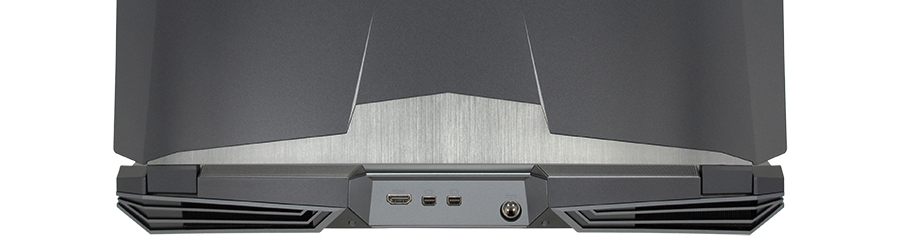
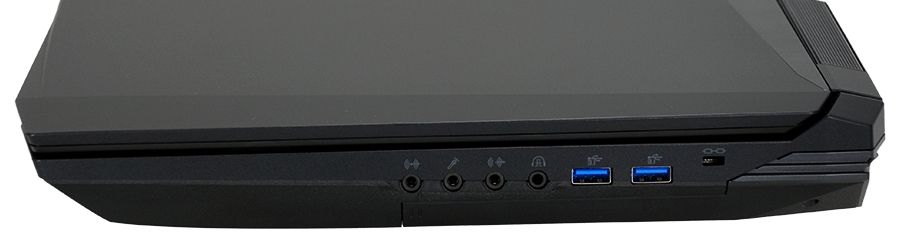
Connectivity
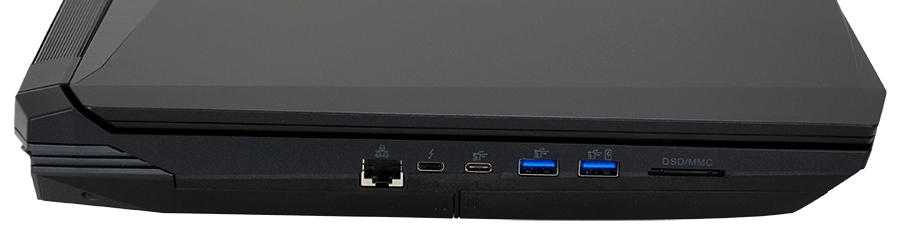
SD Card Reader
| SD Card Reader | |
| average JPG Copy Test (av. of 3 runs) | |
| Eurocom Sky X7C i9-9900K (Toshiba Exceria Pro SDXC 64 GB UHS-II) | |
| Asus ROG G703GX (Toshiba Exceria Pro SDXC 64 GB UHS-II) | |
| MSI GT75 8RG-090 Titan (Toshiba Exceria Pro SDXC 64 GB UHS-II) | |
| Acer Predator 17 G9-793-70PJ (Toshiba Exceria Pro SDXC 64 GB UHS-II) | |
| maximum AS SSD Seq Read Test (1GB) | |
| Asus ROG G703GX (Toshiba Exceria Pro SDXC 64 GB UHS-II) | |
| Eurocom Sky X7C i9-9900K (Toshiba Exceria Pro SDXC 64 GB UHS-II) | |
| Acer Predator 17 G9-793-70PJ (Toshiba Exceria Pro SDXC 64 GB UHS-II) | |
| MSI GT75 8RG-090 Titan (Toshiba Exceria Pro SDXC 64 GB UHS-II) | |
Communication
Eurocom offers Intel 9260 and Killer 1535 WLAN options with transfer rates of up to 1.73 Gbps each. Performance can be faster than what we've recorded below since our server setup is limited by a 1 Gbps line.
| Networking | |
| iperf3 transmit AX12 | |
| Asus ROG G703GX | |
| MSI GT75 8RG-090 Titan | |
| Eurocom Sky X7C i9-9900K | |
| Alienware 17 R5 | |
| iperf3 receive AX12 | |
| MSI GT75 8RG-090 Titan | |
| Asus ROG G703GX | |
| Alienware 17 R5 | |
| Eurocom Sky X7C i9-9900K | |
Maintenance
Warranty
The standard one-year limited warranty applies. Options to extend the warranty for up to three years are available.
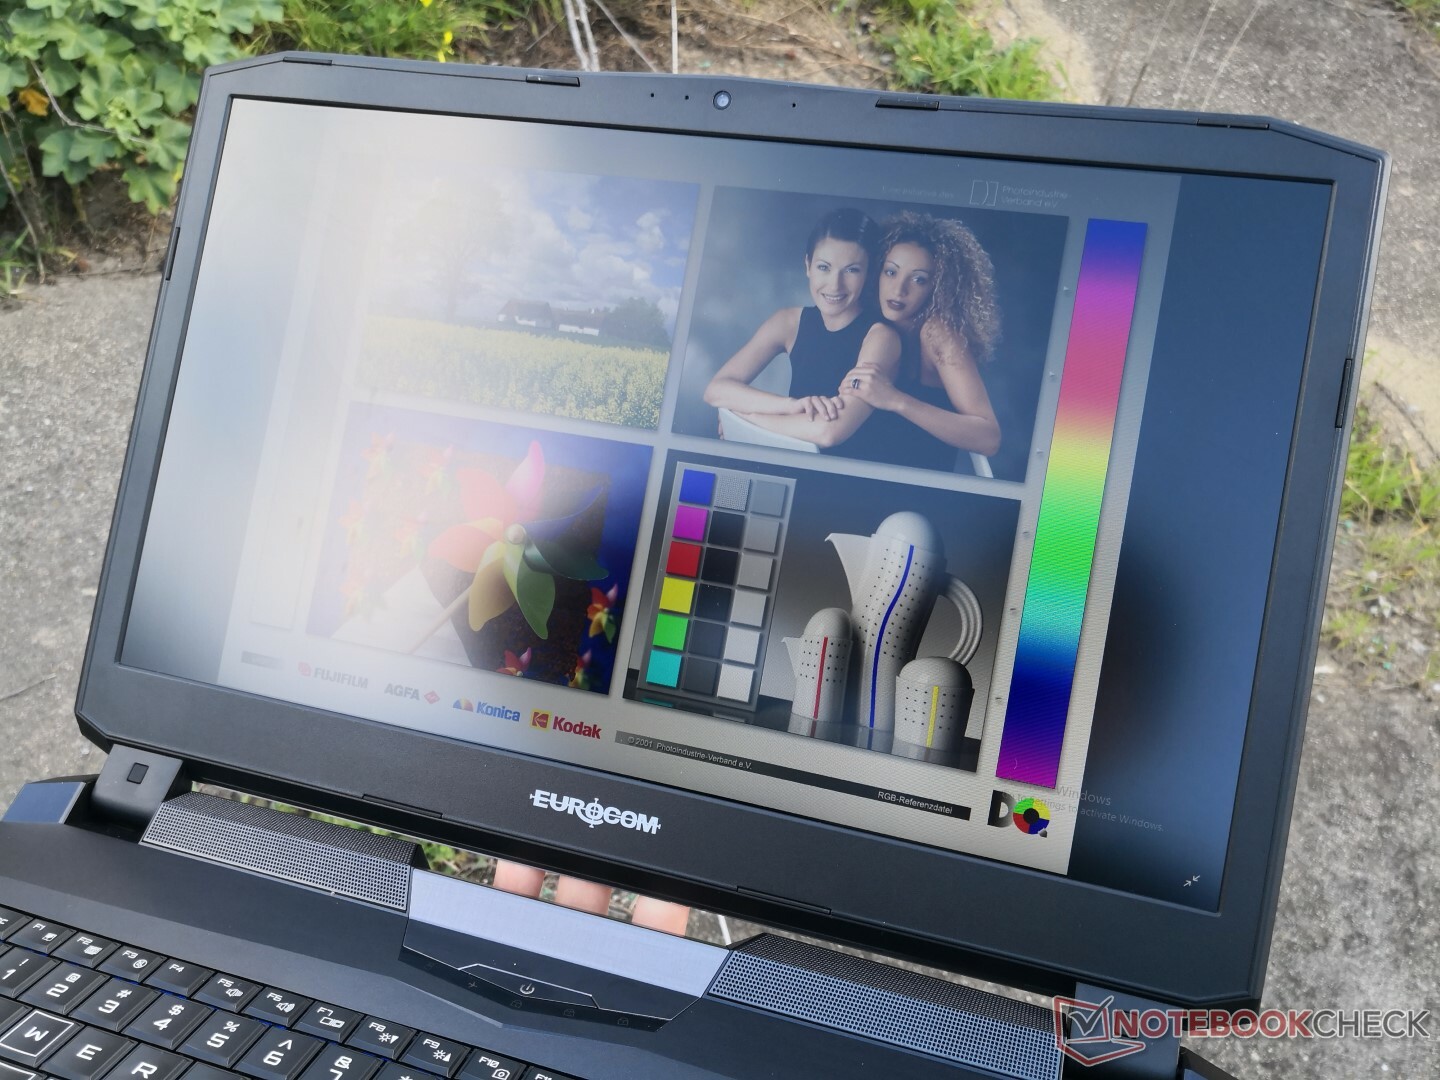
Display
Whereas our last Sky X7C had a 4K UHD 60 Hz panel, our unit today is equipped with an FHD 144 Hz panel. Other than the obvious native resolution and refresh rate differences, does the FHD panel bring anything else to the table?
The FHD option has significantly faster black-white and gray-gray response times for less ghosting and slightly more accurate colors out of the box. Otherwise, the 4K UHD SKU has the advantage when it comes to brightness and gamut. Contrast is actually quite similar between the two at only about 800:1 each. Note that other 17.3-inch gaming laptops like the Asus ROG G703GX or Lenovo Legion Y740-17ICH may carry similar AU Optronics panels as our Eurocom unit.
For gaming purposes, the pricier 4K UHD option is not objectively better. It's all down to user preference if resolution or response time and refresh rate take priority.
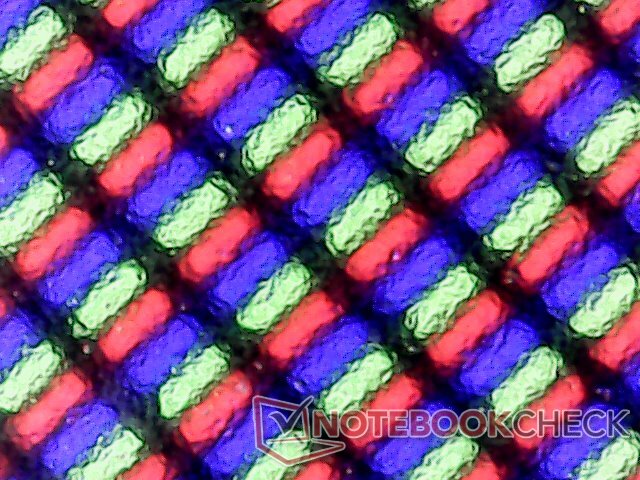
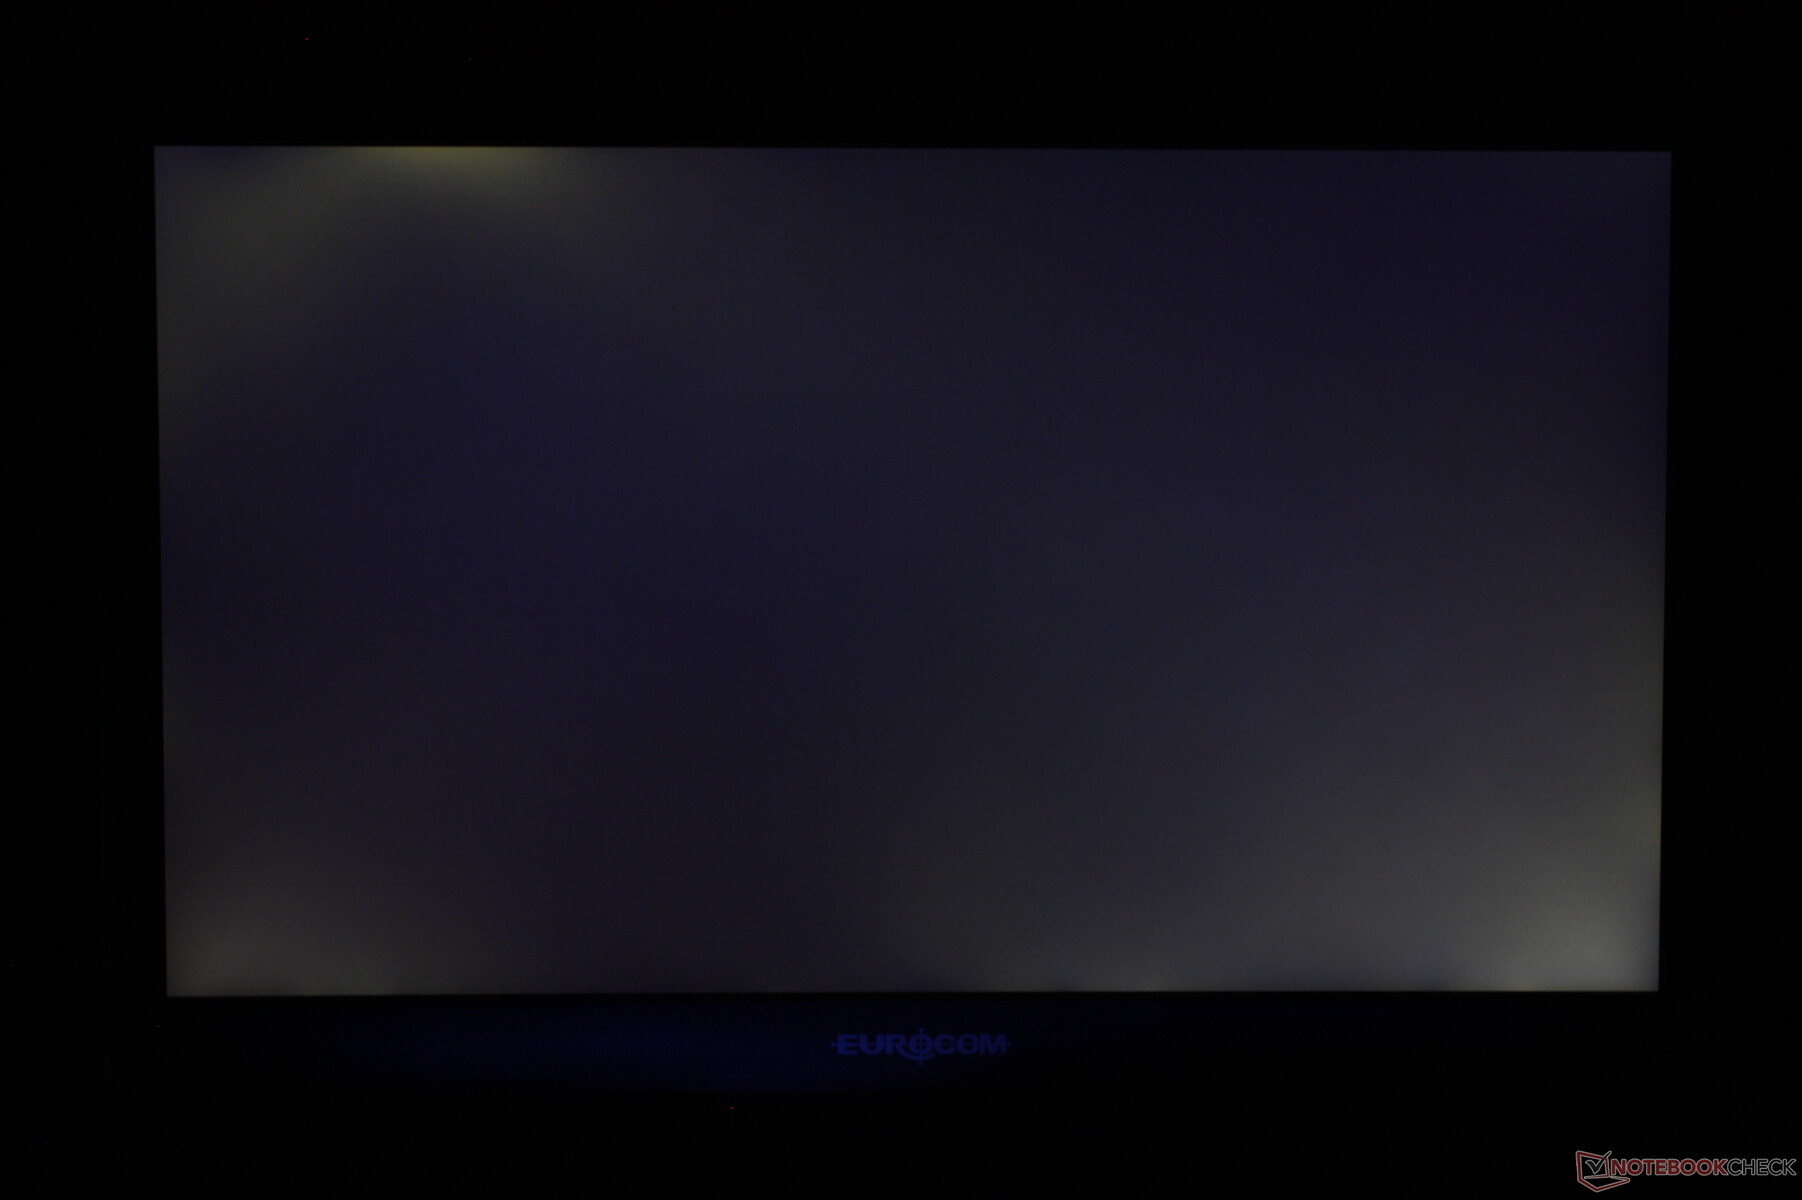
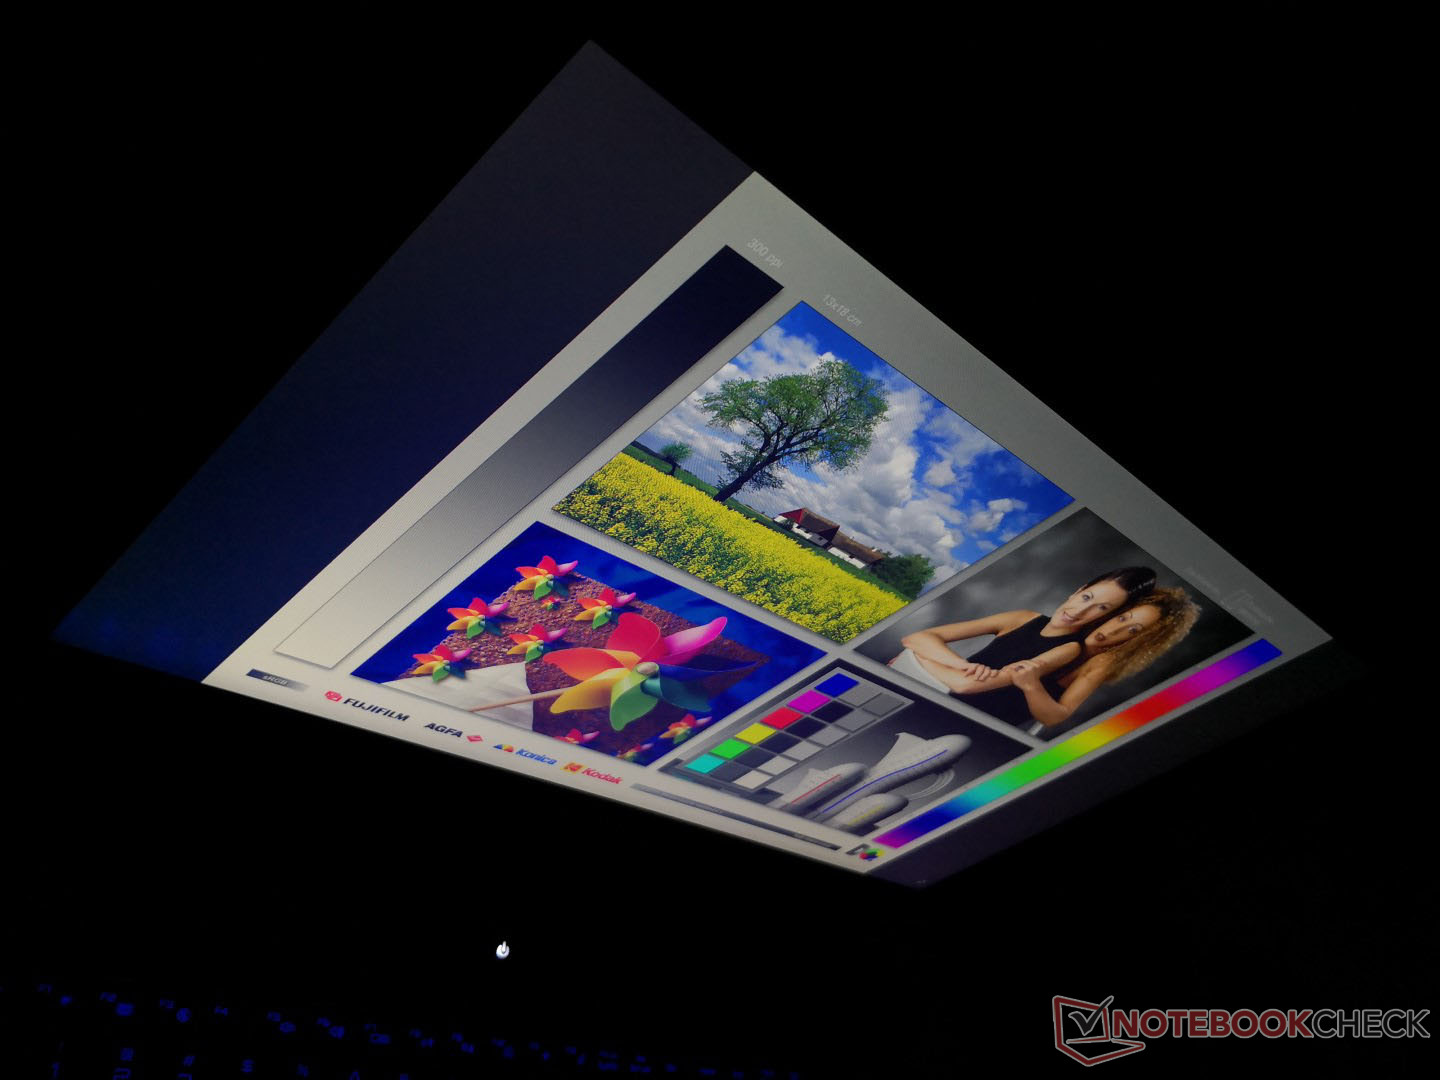
Our specific test unit suffers from moderate-heavy uneven backlight bleeding as shown by the image below. We would expect as much from a budget laptop, but this is disappointing to see on a Eurocom. There is a slight layer of graininess over the screen that's common amongst most matte panels.
| |||||||||||||||||||||||||
Brightness Distribution: 85 %
Center on Battery: 276.1 cd/m²
Contrast: 767:1 (Black: 0.36 cd/m²)
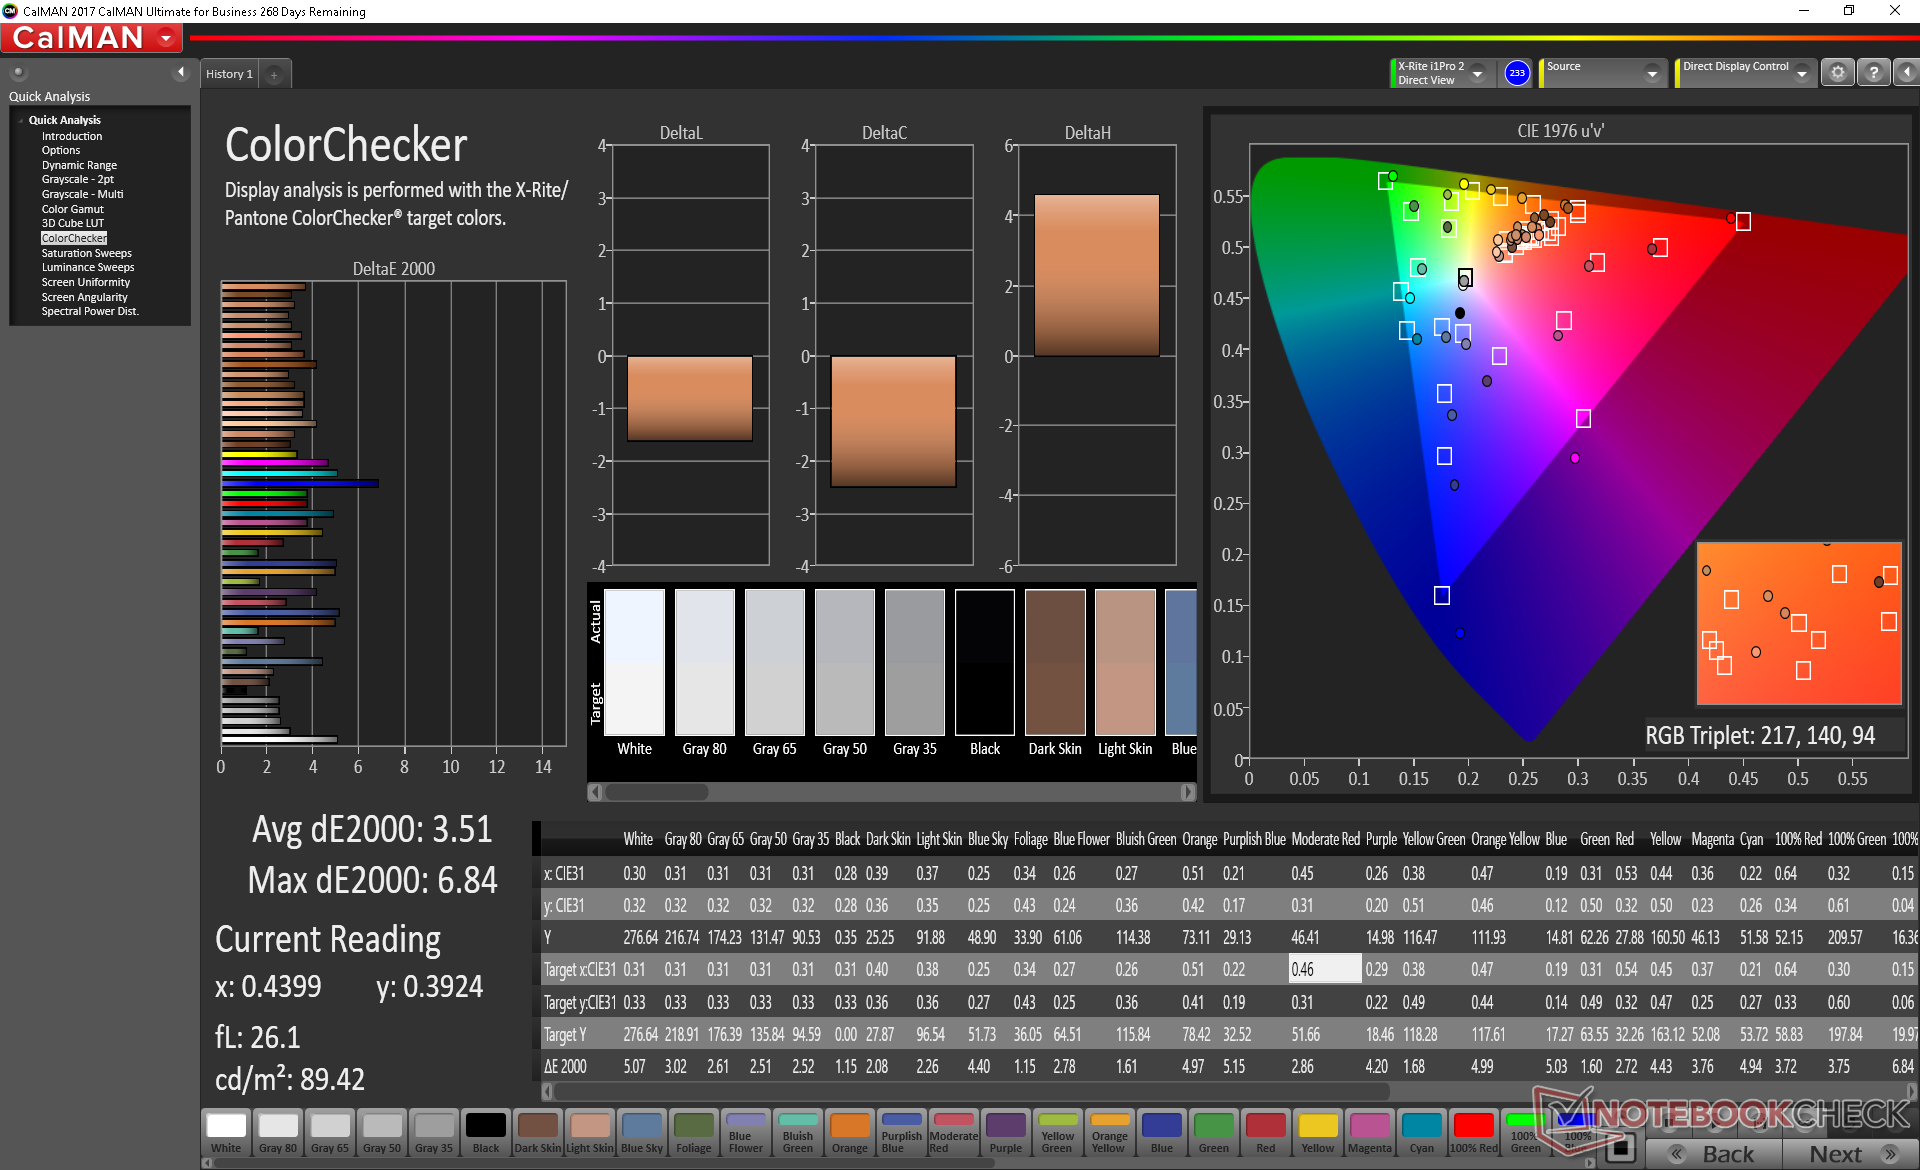
ΔE ColorChecker Calman: 3.51 | ∀{0.5-29.43 Ø4.71}
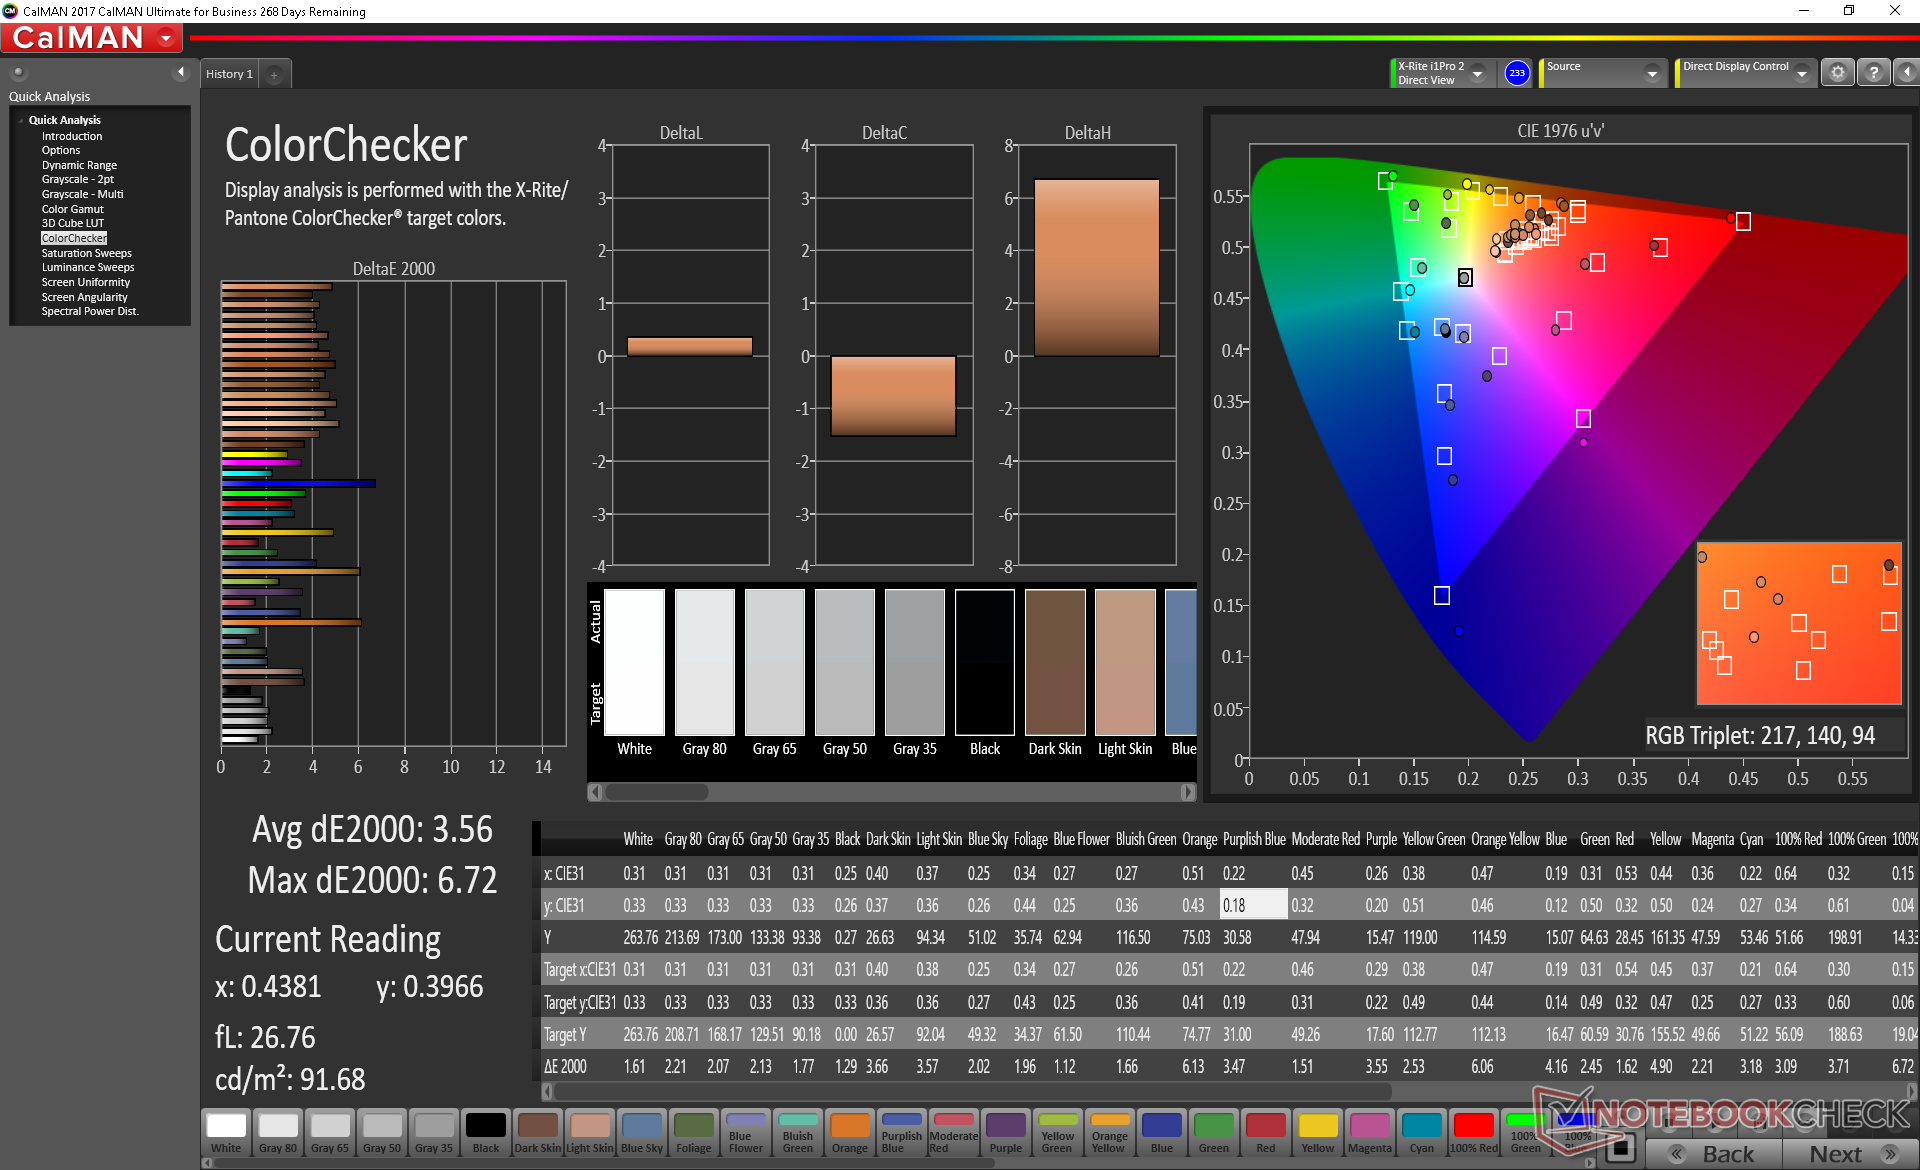
calibrated: 3.56
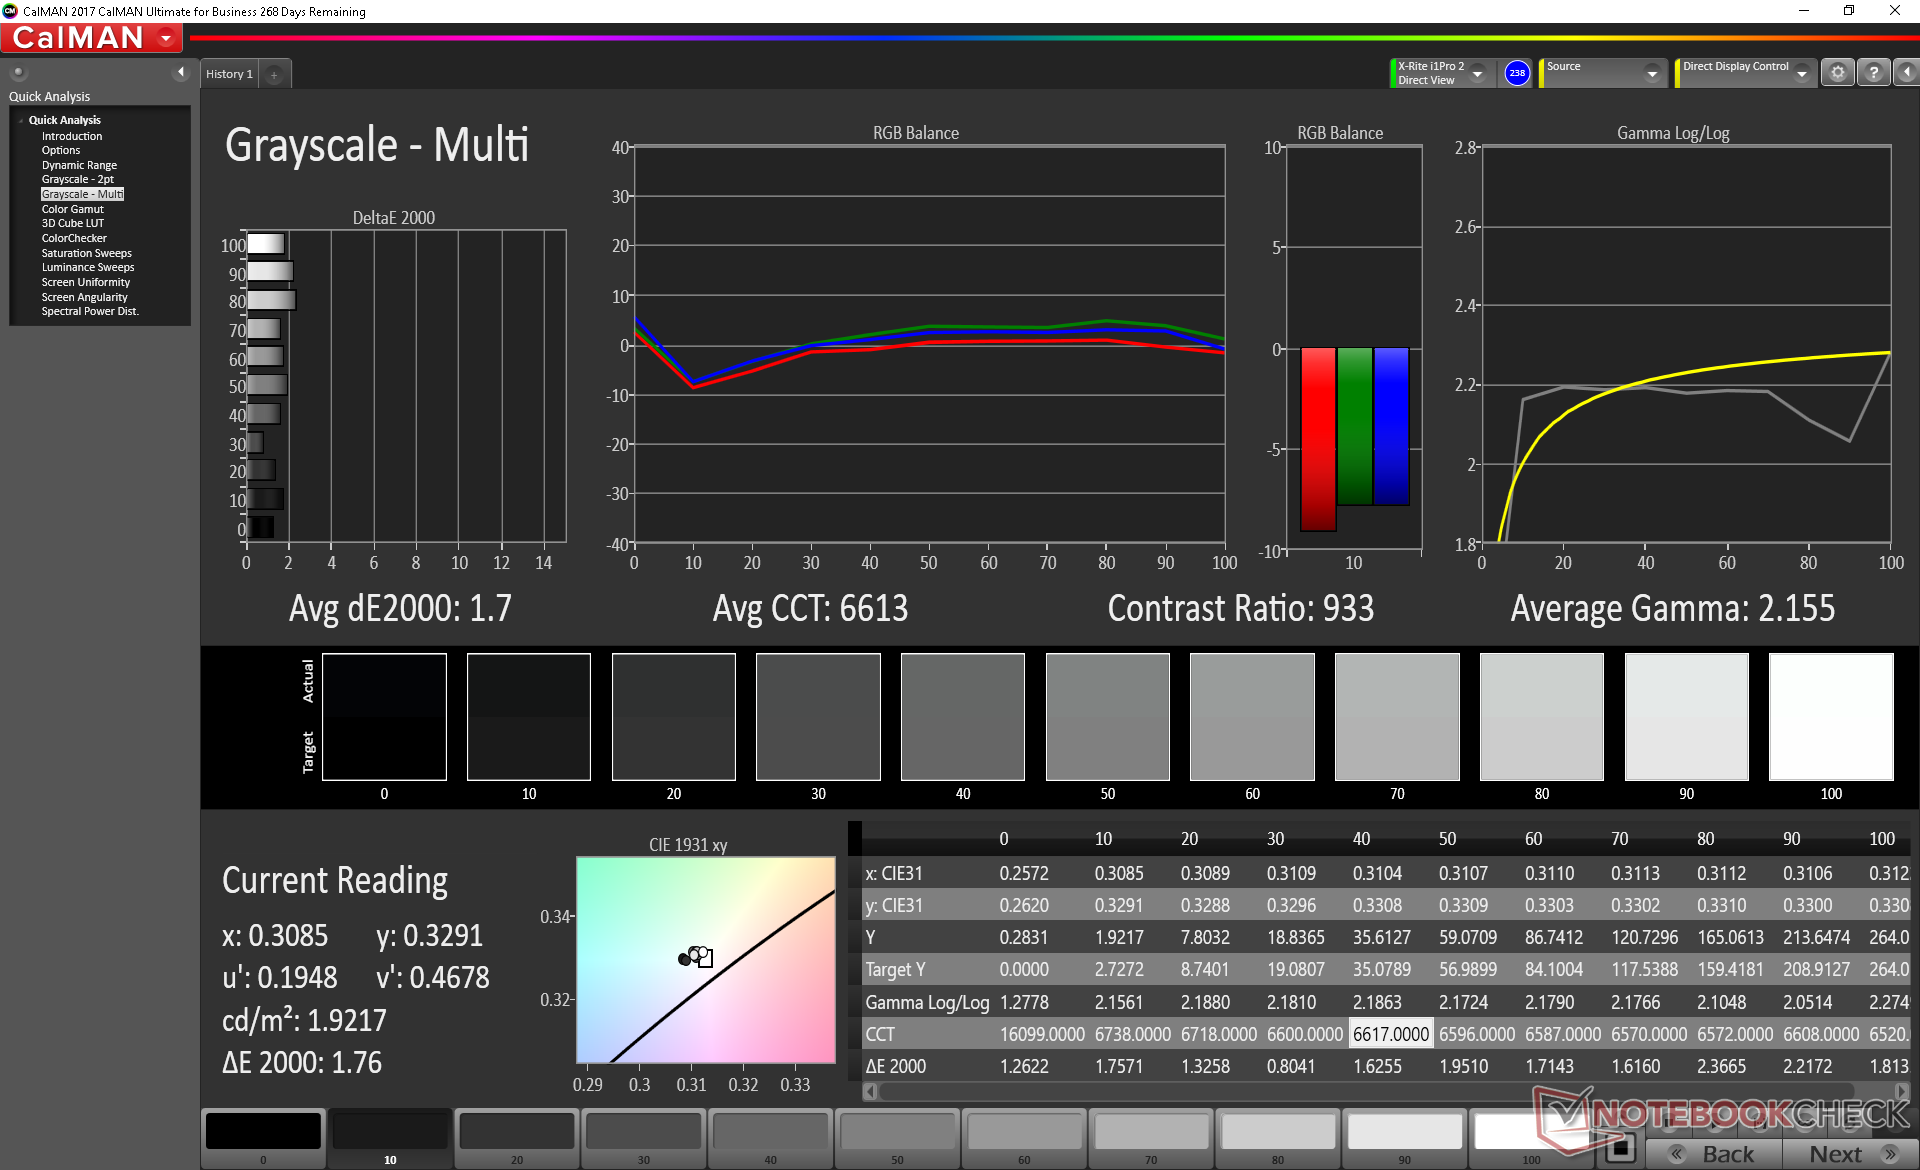
ΔE Greyscale Calman: 2.7 | ∀{0.09-98 Ø4.96}
88.8% sRGB (Argyll 1.6.3 3D)
57.8% AdobeRGB 1998 (Argyll 1.6.3 3D)
65.2% AdobeRGB 1998 (Argyll 3D)
89.1% sRGB (Argyll 3D)
64.7% Display P3 (Argyll 3D)
Gamma: 2.28
CCT: 6947 K
| Eurocom Sky X7C i9-9900K AU Optronics B173HAN03.1, IPS, 17.3", 1920x1080 | Eurocom Sky X7C AU Optronics B173ZAN01.0, IPS, 17.3", 3840x2160 | Alienware 17 R5 JYWWF_B173QTN (AUO1496), TN, 17.3", 2560x1440 | Asus ROG G703GX AU Optronics B173HAN03.2 (AUO329D), IPS, 17.3", 1920x1080 | MSI GT75 8RG-090 Titan CMN N173HHE-G32 (CMN1747), TN, 17.3", 1920x1080 | Lenovo Legion Y740-17ICH AU Optronics B173HAN03.2, IPS, 17.3", 1920x1080 | |
|---|---|---|---|---|---|---|
| Display | 32% | -3% | 2% | 28% | -0% | |
| Display P3 Coverage (%) | 64.7 | 86 33% | 63.4 -2% | 64.1 -1% | 90.9 40% | 64 -1% |
| sRGB Coverage (%) | 89.1 | 99.9 12% | 86.1 -3% | 93.3 5% | 100 12% | 90.4 1% |
| AdobeRGB 1998 Coverage (%) | 65.2 | 98.9 52% | 62.9 -4% | 65.6 1% | 86.2 32% | 64.8 -1% |
| Response Times | -131% | 14% | 36% | 52% | -3% | |
| Response Time Grey 50% / Grey 80% * (ms) | 18 ? | 38.4 ? -113% | 20.8 ? -16% | 7.2 ? 60% | 8 ? 56% | 15.6 ? 13% |
| Response Time Black / White * (ms) | 10.8 ? | 26.8 ? -148% | 6 ? 44% | 9.6 ? 11% | 5.6 ? 48% | 12.8 ? -19% |
| PWM Frequency (Hz) | 26000 ? | |||||
| Screen | -8% | -13% | -2% | 24% | -15% | |
| Brightness middle (cd/m²) | 276.1 | 333 21% | 398 44% | 296 7% | 240 -13% | 299.1 8% |
| Brightness (cd/m²) | 260 | 330 27% | 367 41% | 279 7% | 248 -5% | 273 5% |
| Brightness Distribution (%) | 85 | 88 4% | 86 1% | 85 0% | 83 -2% | 81 -5% |
| Black Level * (cd/m²) | 0.36 | 0.4 -11% | 0.51 -42% | 0.25 31% | 0.22 39% | 0.27 25% |
| Contrast (:1) | 767 | 833 9% | 780 2% | 1184 54% | 1091 42% | 1108 44% |
| Colorchecker dE 2000 * | 3.51 | 5.87 -67% | 5.45 -55% | 4.77 -36% | 2.14 39% | 5.07 -44% |
| Colorchecker dE 2000 max. * | 6.84 | 9.74 -42% | 10.36 -51% | 9.08 -33% | 5.04 26% | 10.55 -54% |
| Colorchecker dE 2000 calibrated * | 3.56 | 4.59 -29% | 2.56 28% | 1.46 59% | 1.54 57% | 3.31 7% |
| Greyscale dE 2000 * | 2.7 | 4.5 -67% | 5.4 -100% | 5.83 -116% | 1.62 40% | 6.8 -152% |
| Gamma | 2.28 96% | 2.34 94% | 2.4 92% | 2.47 89% | 2.28 96% | 2.46 89% |
| CCT | 6947 94% | 6384 102% | 7453 87% | 8076 80% | 6846 95% | 7805 83% |
| Color Space (Percent of AdobeRGB 1998) (%) | 57.8 | 88 52% | 56 -3% | 60 4% | 77 33% | 58.5 1% |
| Color Space (Percent of sRGB) (%) | 88.8 | 100 13% | 86 -3% | 93 5% | 100 13% | 89.9 1% |
| Total Average (Program / Settings) | -36% /
-16% | -1% /
-7% | 12% /
4% | 35% /
29% | -6% /
-11% |
* ... smaller is better
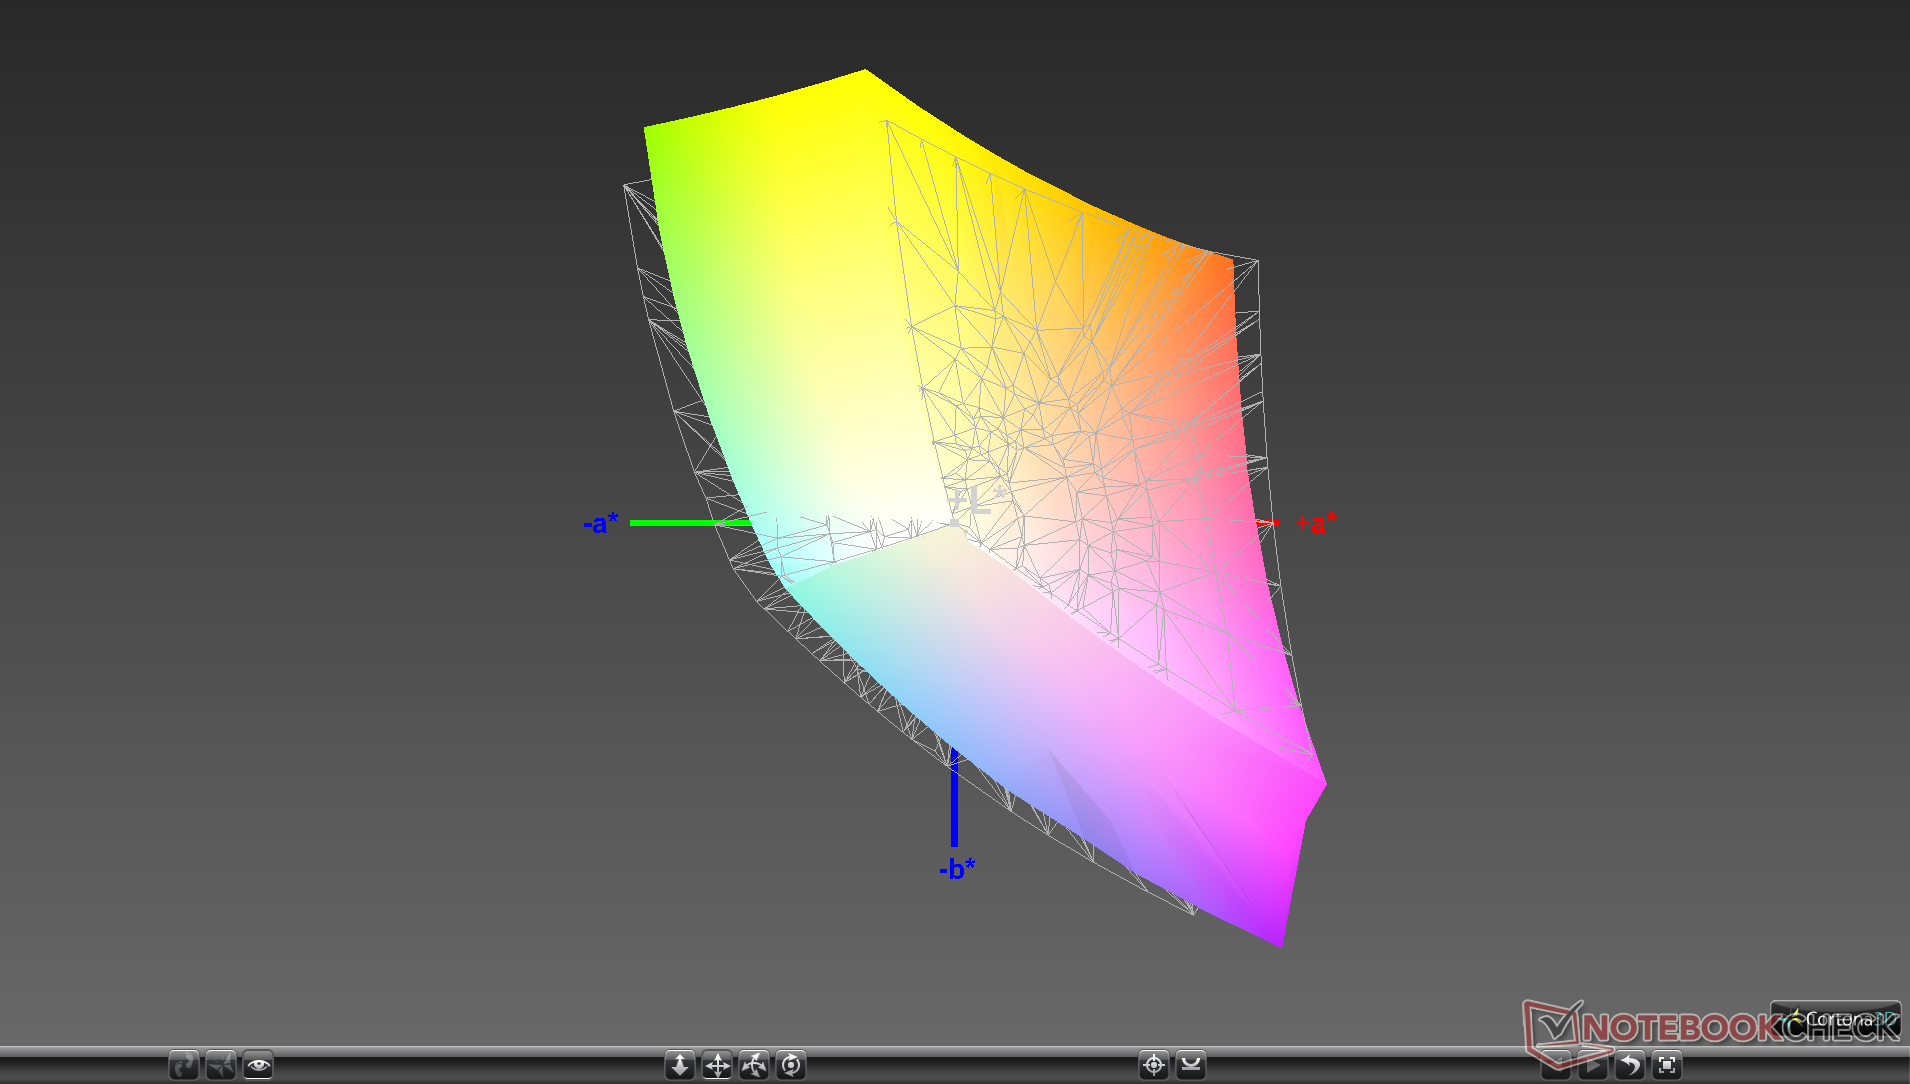
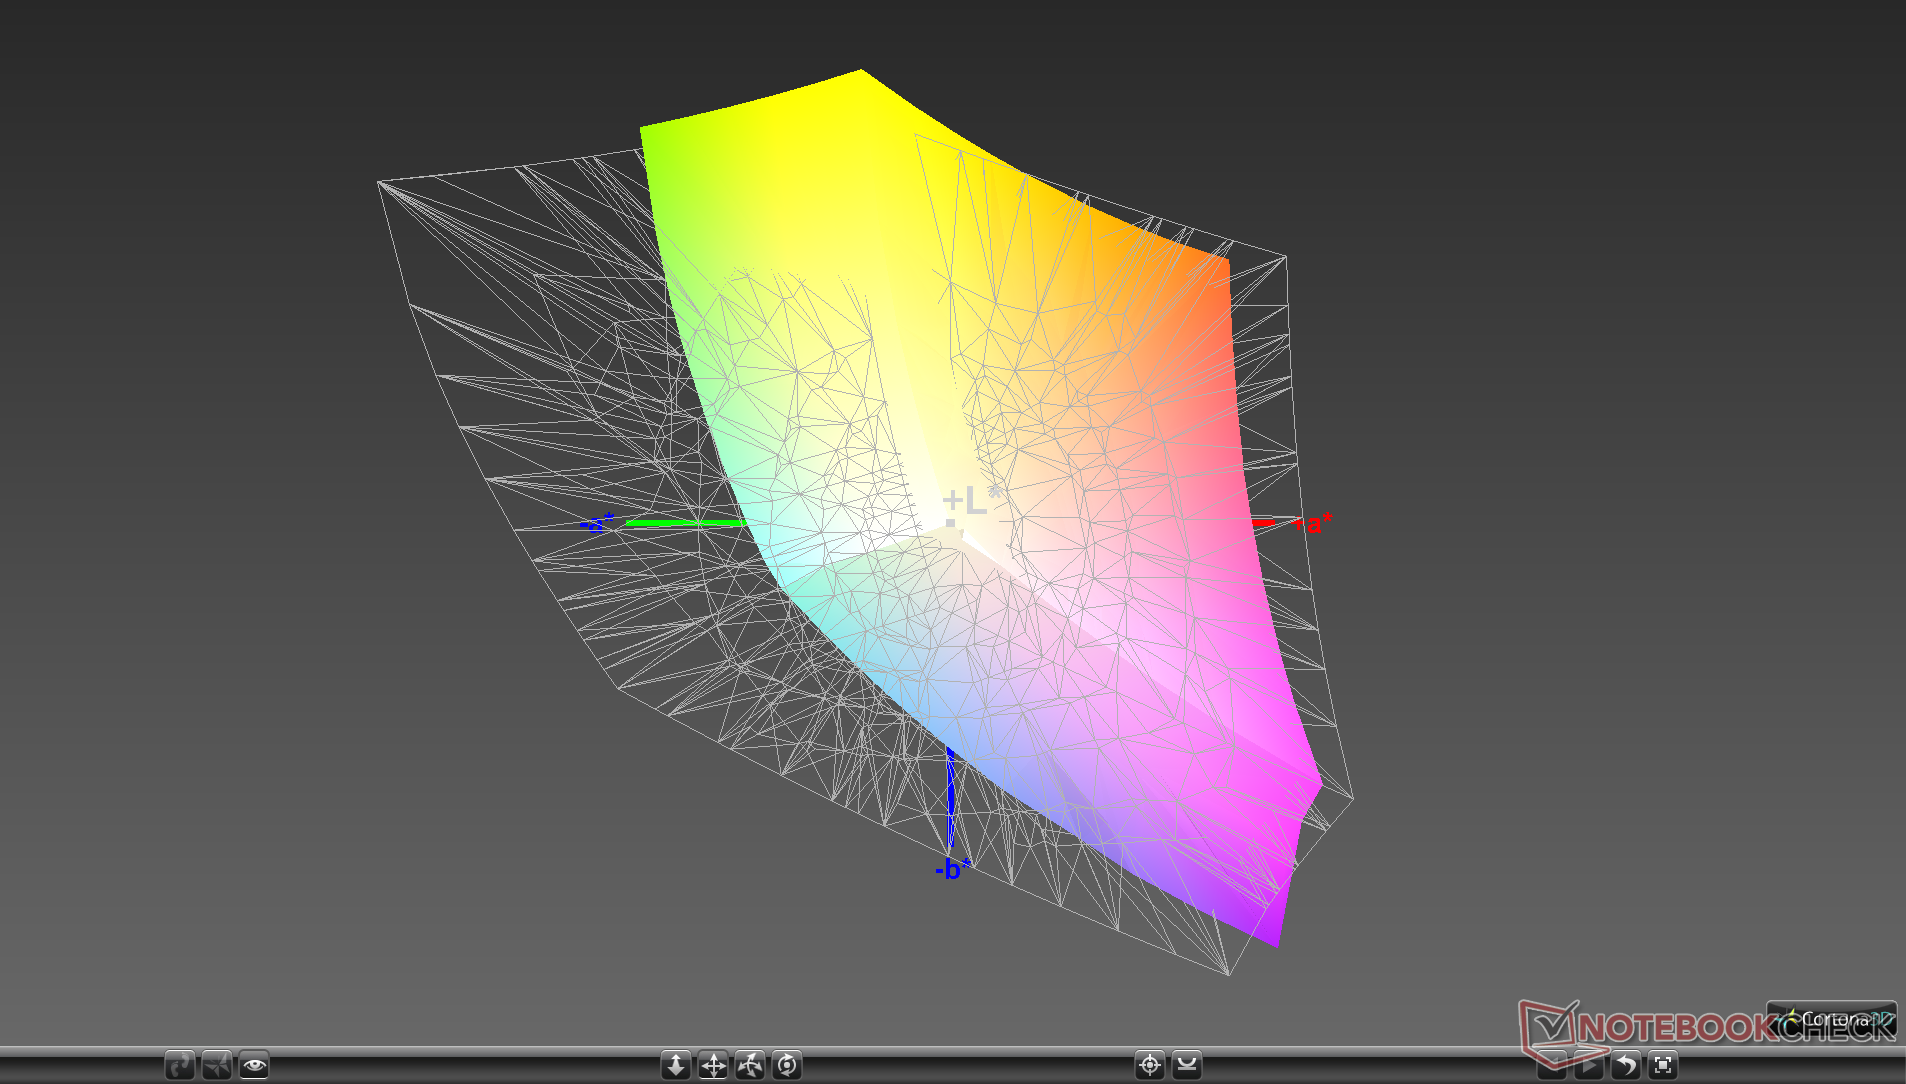
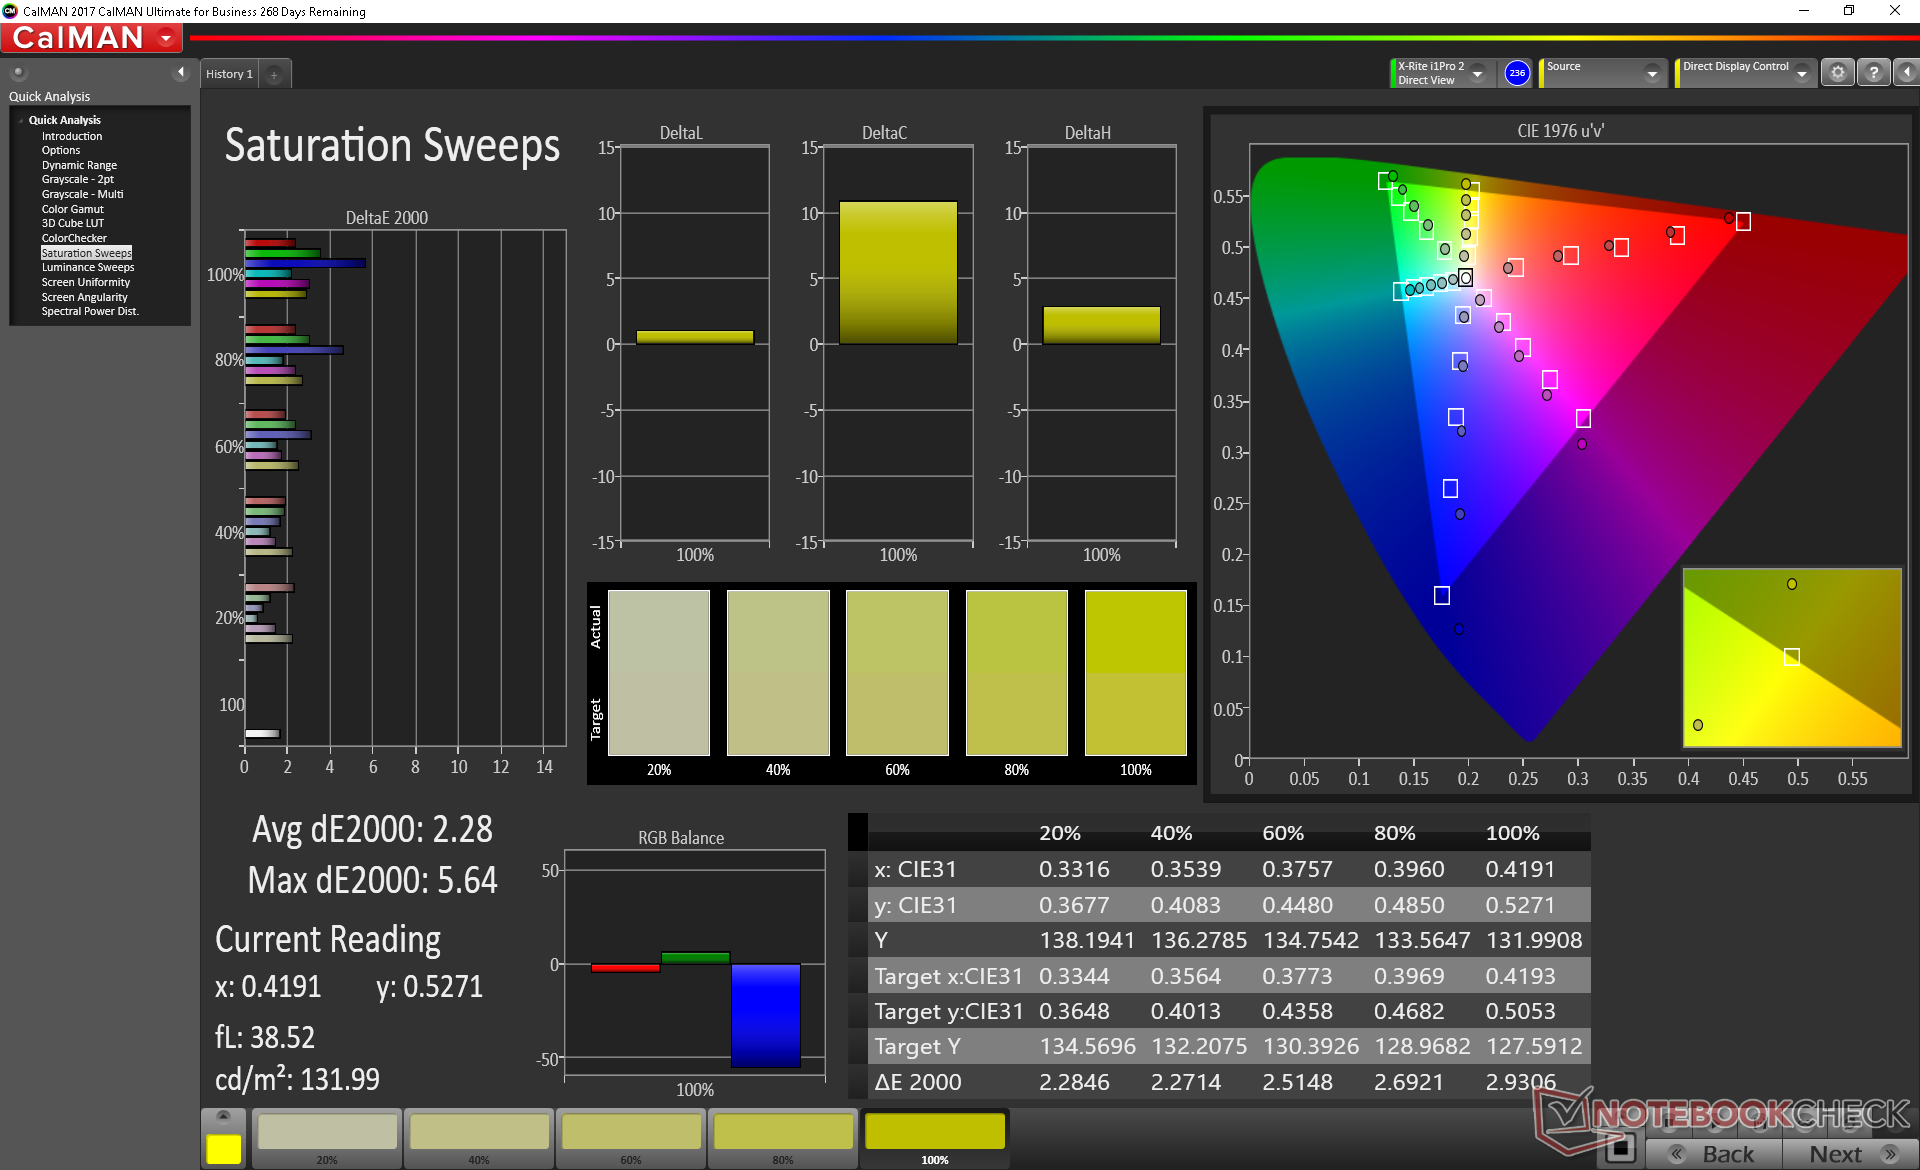
Color space covers approximately 89 percent of sRGB compared to 100 percent on the 4K UHD option. The slightly narrower gamut is the price to pay for the very fast refresh rate and response times.
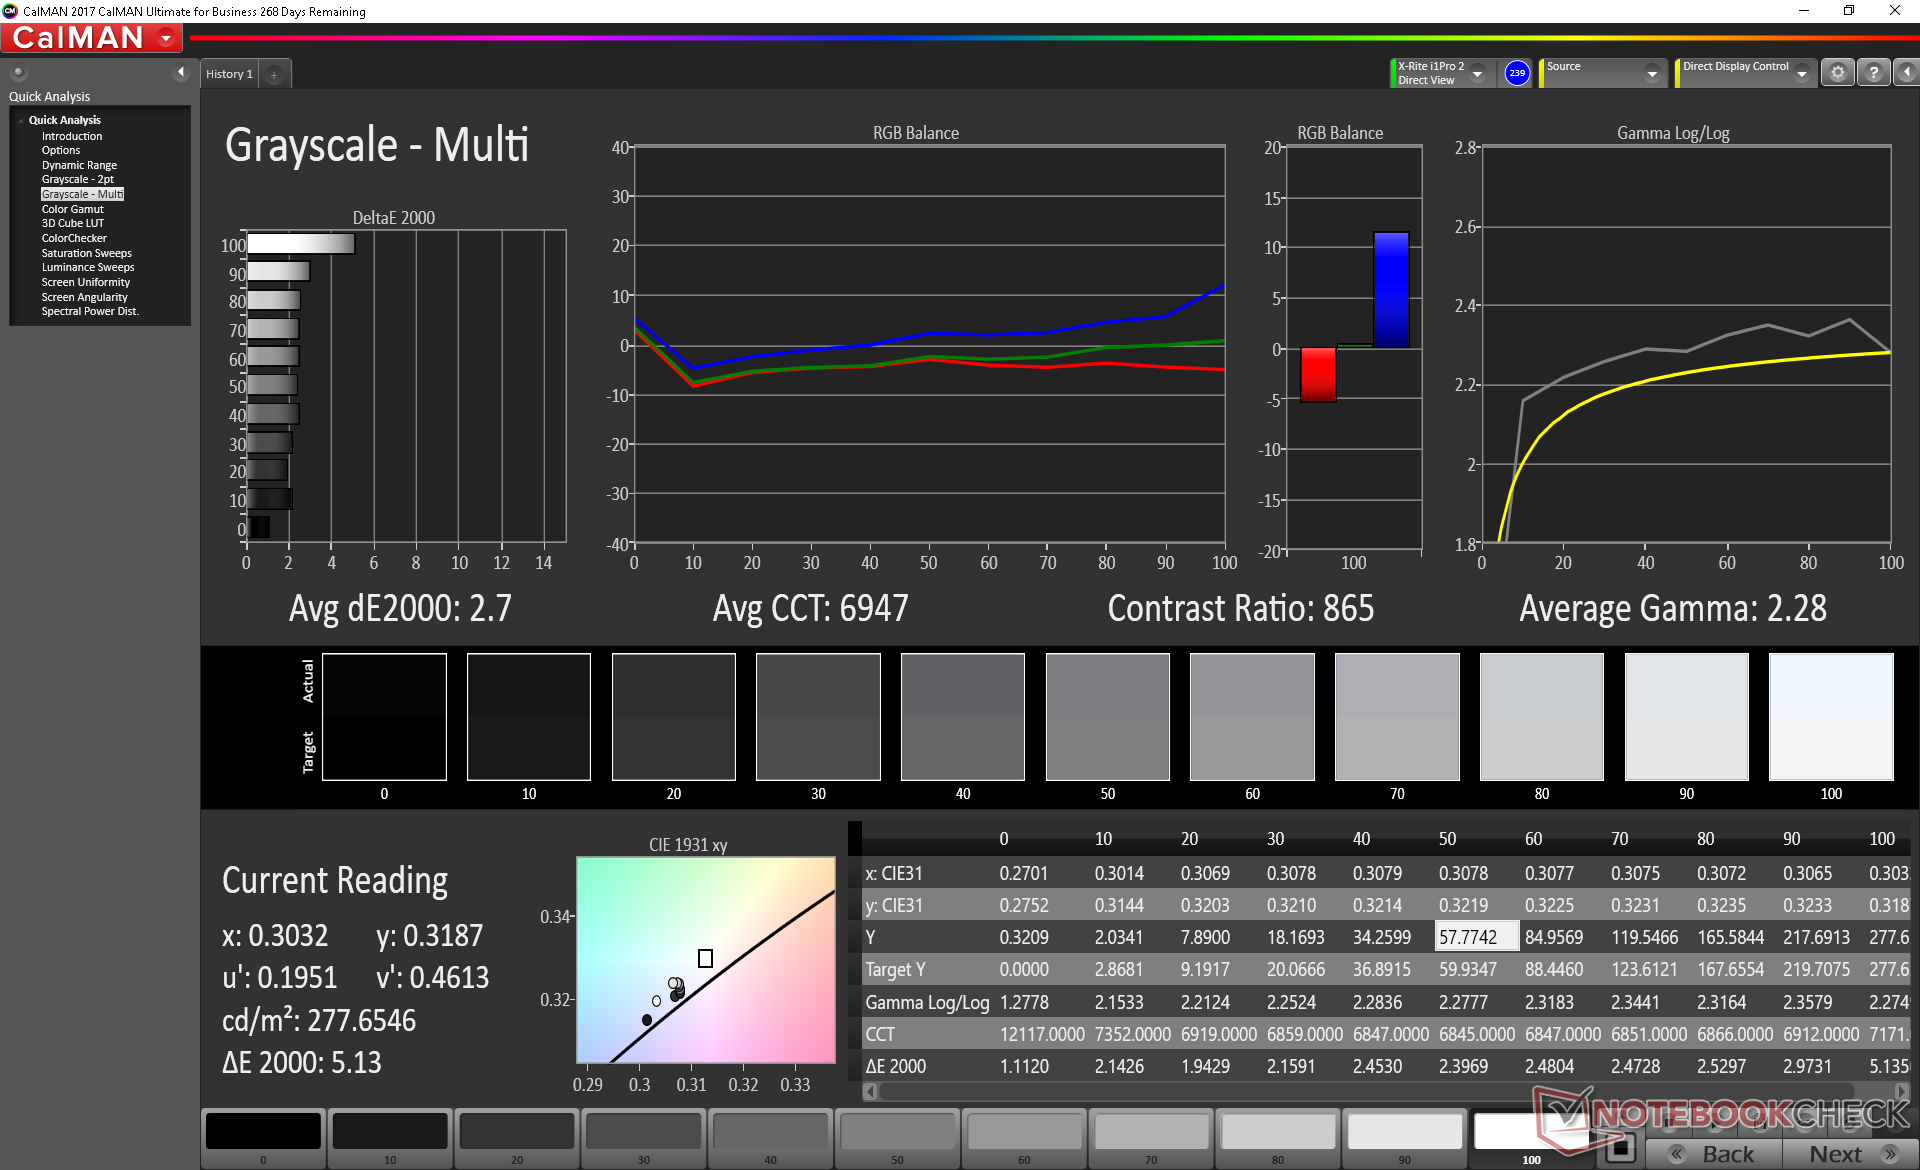
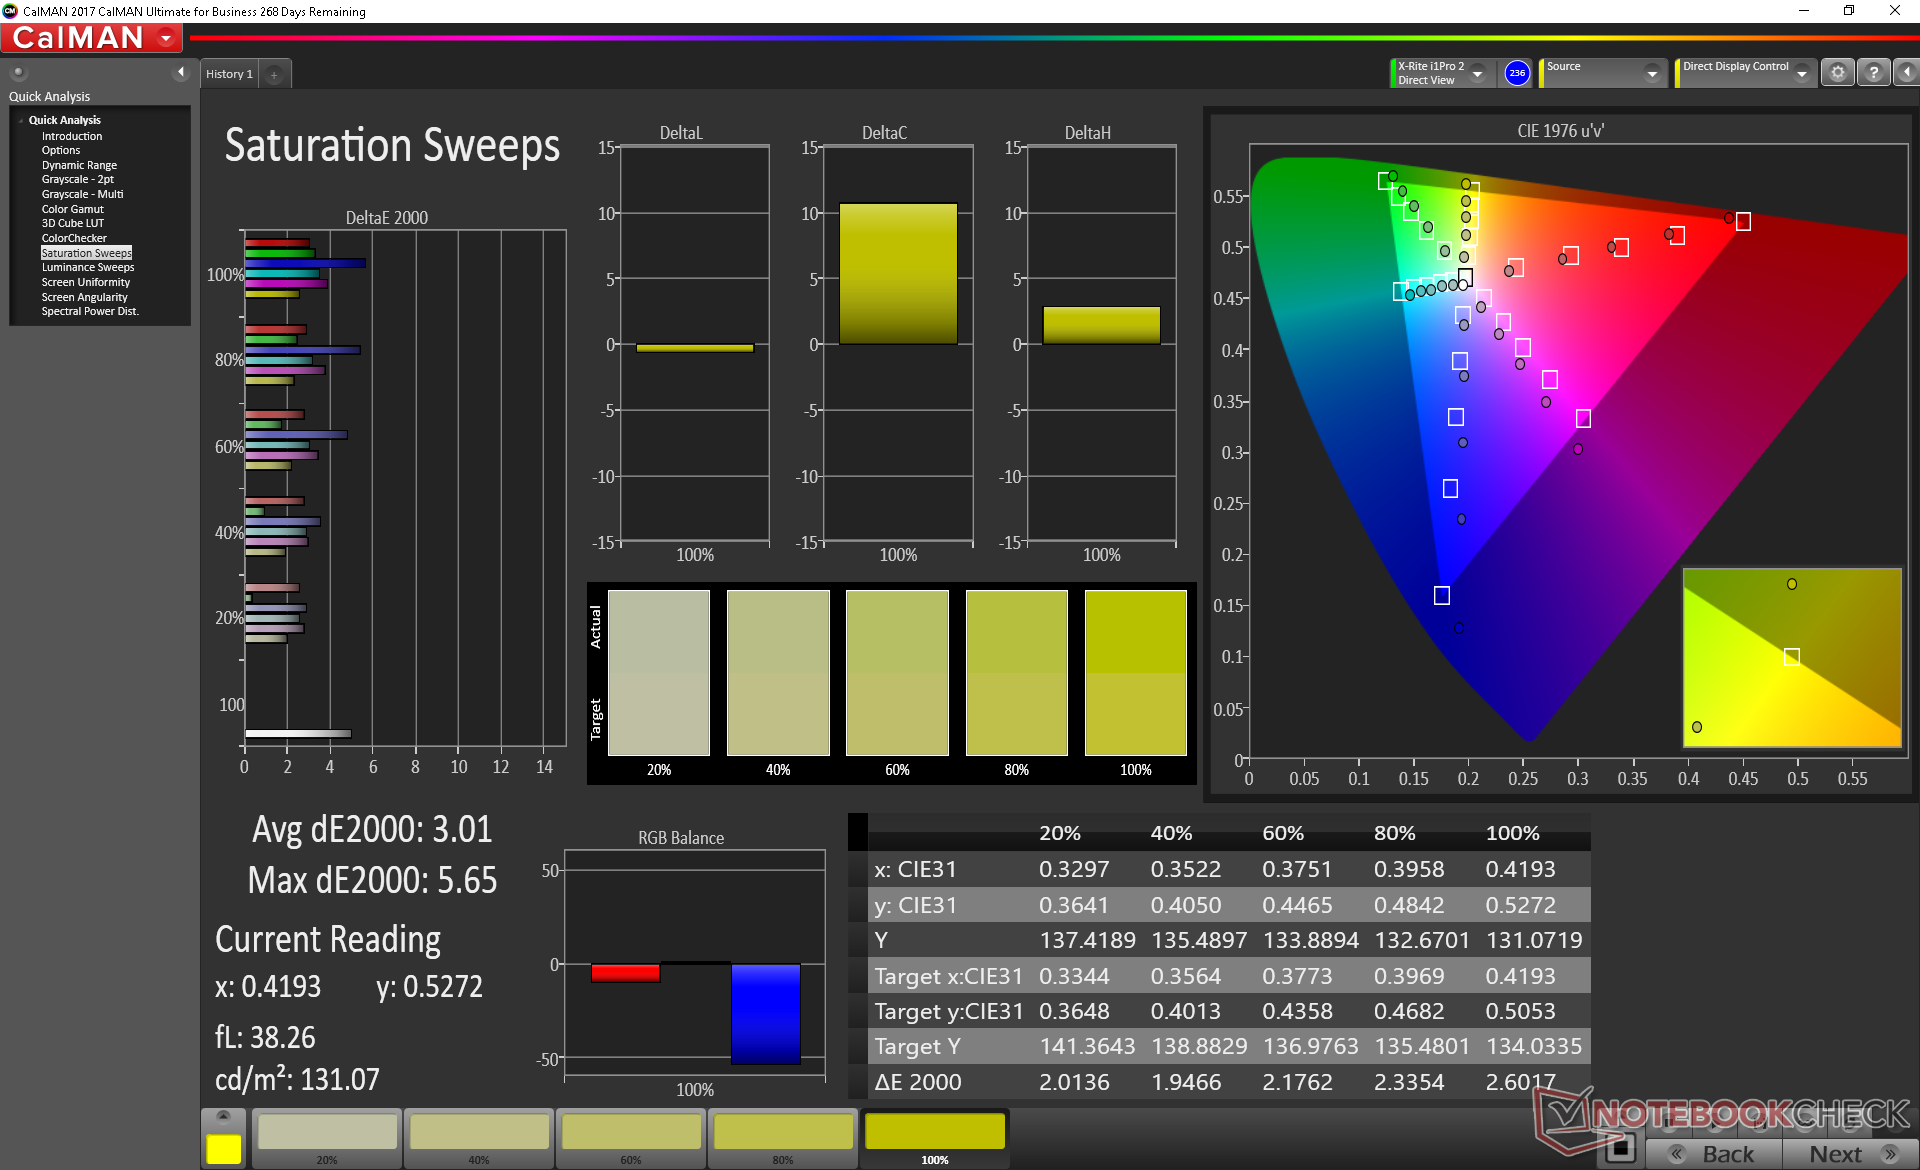
Although grayscale and colors are already good out of the box, we're able to measure some small improvements after performing our own calibration. Blue is represented slightly less accurately than other primary and secondary colors according to our CalMan results below. Nonetheless, average DeltaE color is just 3.51 compared to 5 or higher on other competing gaming laptops.
Eurocom has an option to calibrate the display for you before shipping.
Display Response Times
| ↔ Response Time Black to White | ||
|---|---|---|
| 10.8 ms ... rise ↗ and fall ↘ combined | ↗ 5.6 ms rise | 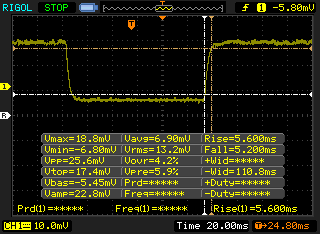 |
| ↘ 5.2 ms fall | ||
| The screen shows good response rates in our tests, but may be too slow for competitive gamers. In comparison, all tested devices range from 0.1 (minimum) to 240 (maximum) ms. » 29 % of all devices are better. This means that the measured response time is better than the average of all tested devices (19.8 ms). | ||
| ↔ Response Time 50% Grey to 80% Grey | ||
| 18 ms ... rise ↗ and fall ↘ combined | ↗ 10 ms rise | 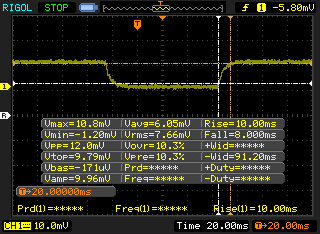 |
| ↘ 8 ms fall | ||
| The screen shows good response rates in our tests, but may be too slow for competitive gamers. In comparison, all tested devices range from 0.165 (minimum) to 636 (maximum) ms. » 32 % of all devices are better. This means that the measured response time is better than the average of all tested devices (31 ms). | ||
Screen Flickering / PWM (Pulse-Width Modulation)
| Screen flickering / PWM not detected | 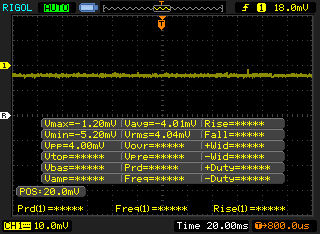 | ||
In comparison: 52 % of all tested devices do not use PWM to dim the display. If PWM was detected, an average of 7747 (minimum: 5 - maximum: 343500) Hz was measured. | |||
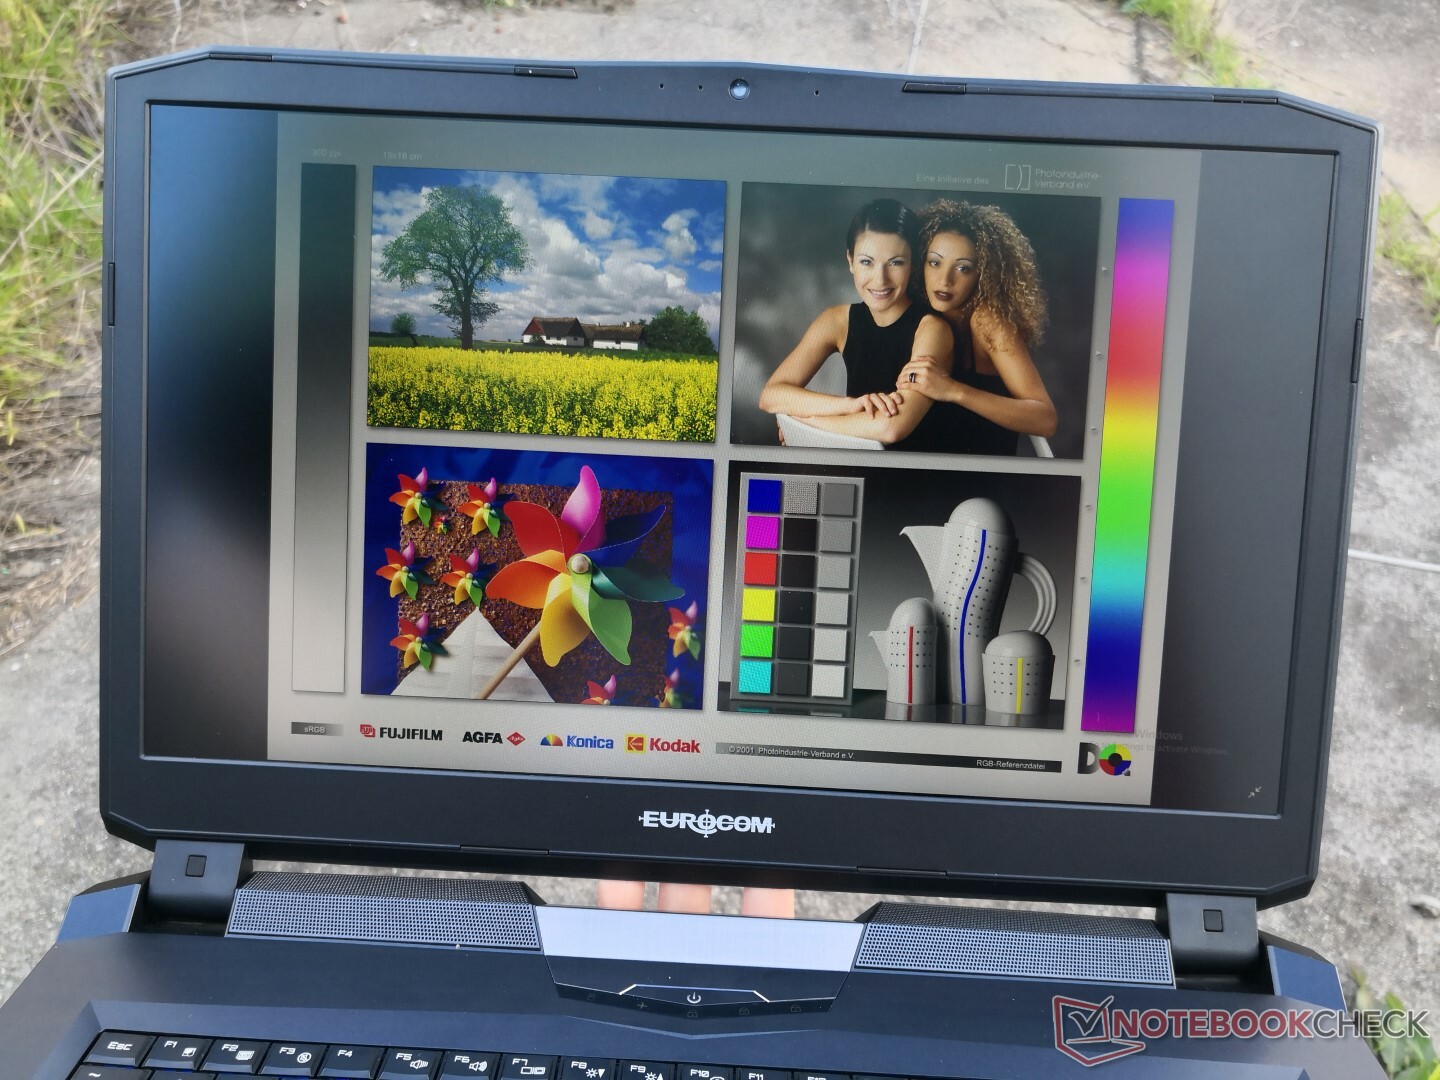
The Sky X7C was not designed to be used frequently outdoors and so outdoor visibility is unsurprisingly poor when under direct sunlight. We recommend working under shade if the system must be used outdoors. Since the average display brightness of most 17.3-inch gaming laptops is about 300 nits, the Sky X7C is no better or worse than many of its competitors.
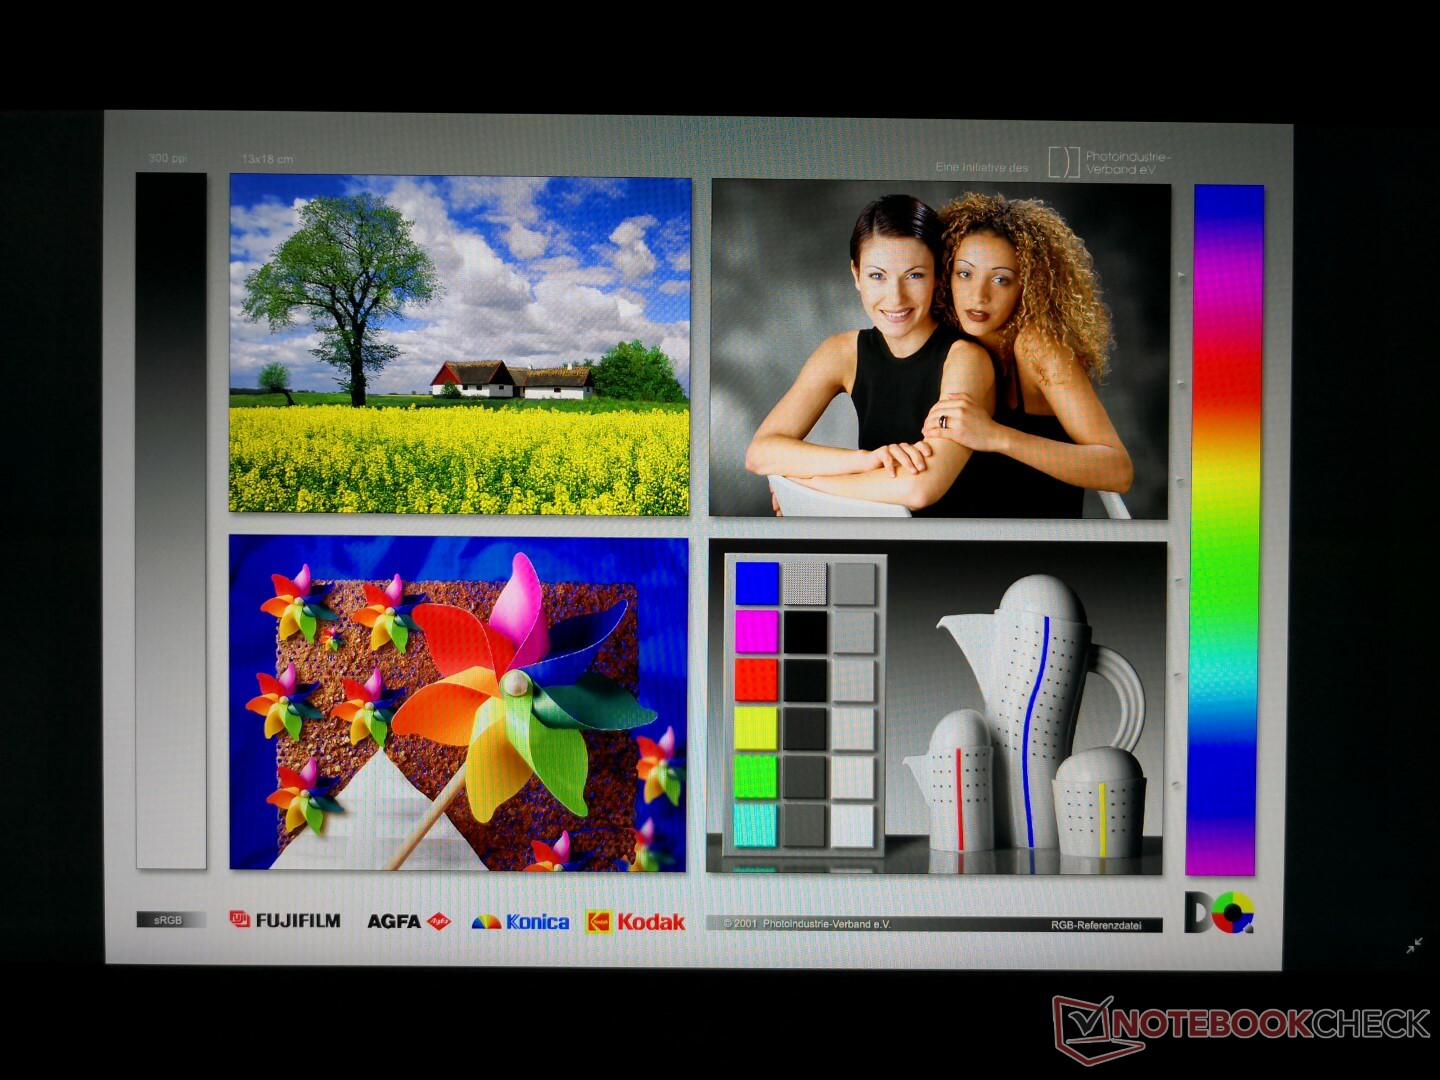
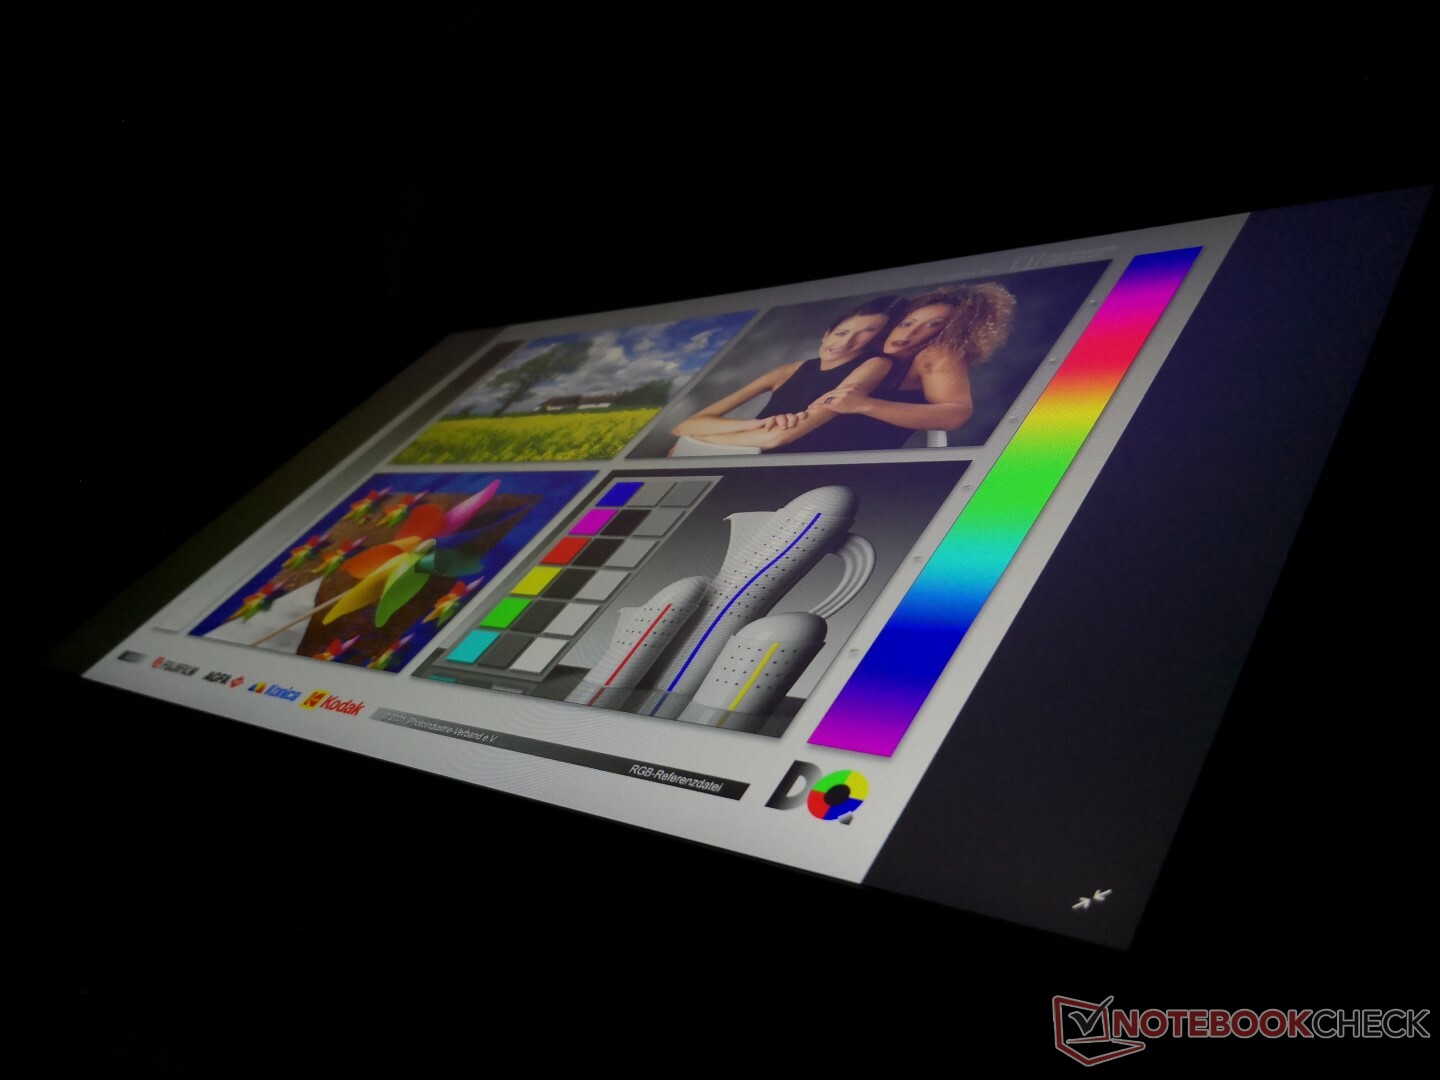
Viewing angles are very wide as expected from IPS panel. Brightness and contrast shift just slightly if viewing from unrealistically extreme angles.

Performance
Processor
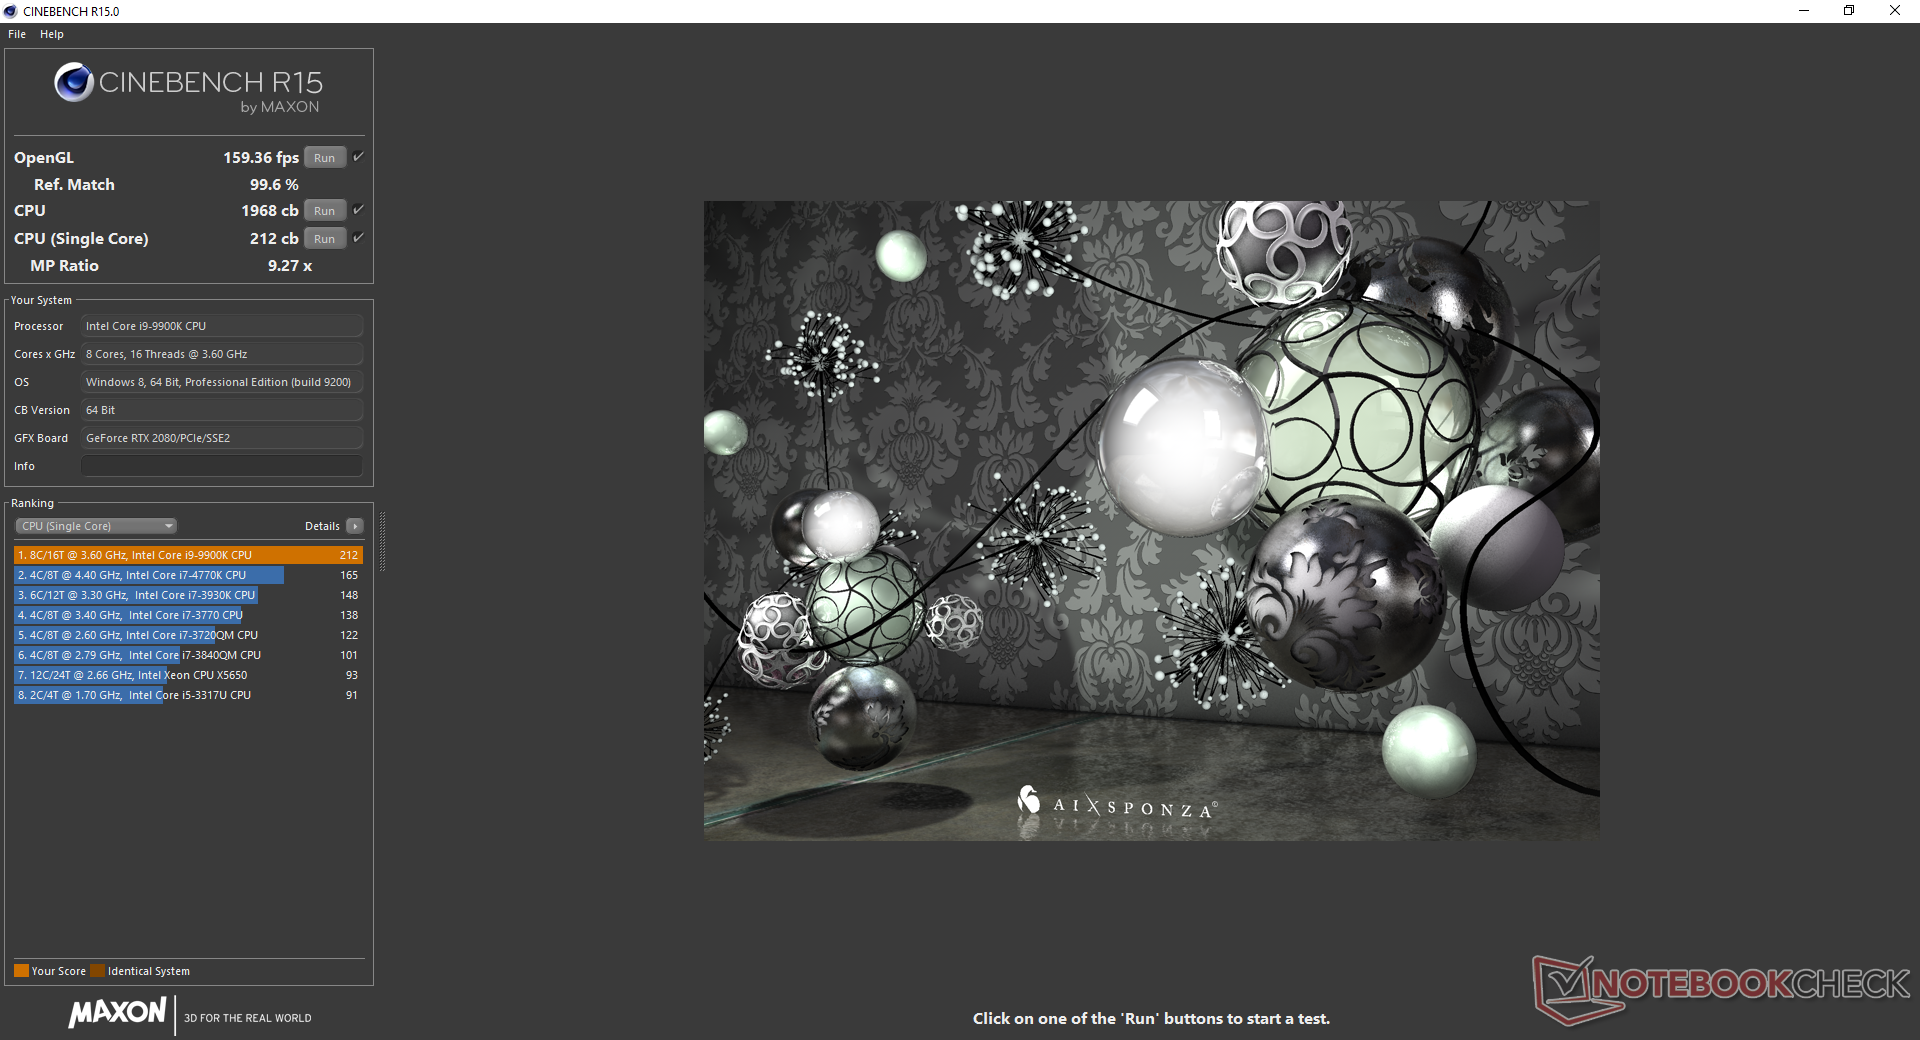
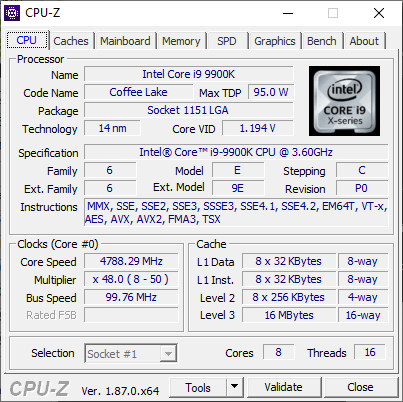
The Core i9-9900K on our Eurocom laptop is just 4 percent behind our reference Core i9-9900K installed on a proper desktop according to CineBench R15. Results are about 35 percent and 40 percent faster than the Core i7-9700K and Core i7-8086K, respectively. Most competing gaming laptops use the Core i7-8750H which can be 40 percent slower than our Core i9 in multi-threaded workloads.
Performance sustainability is very good as well. By running CineBench R15 Multi-Thread in a loop, we can observe an initial high score of 1949 points before falling to 1893 points by the third loop for a performance dip of just 3 to 5 percent over time. Some gaming laptops, such as the MSI GE75 Raider, can fall by as much as 12 percent or more during the same CineBench loop test.
See our review on the Core i9-9900K for more technical information and benchmark comparisons.
System Performance
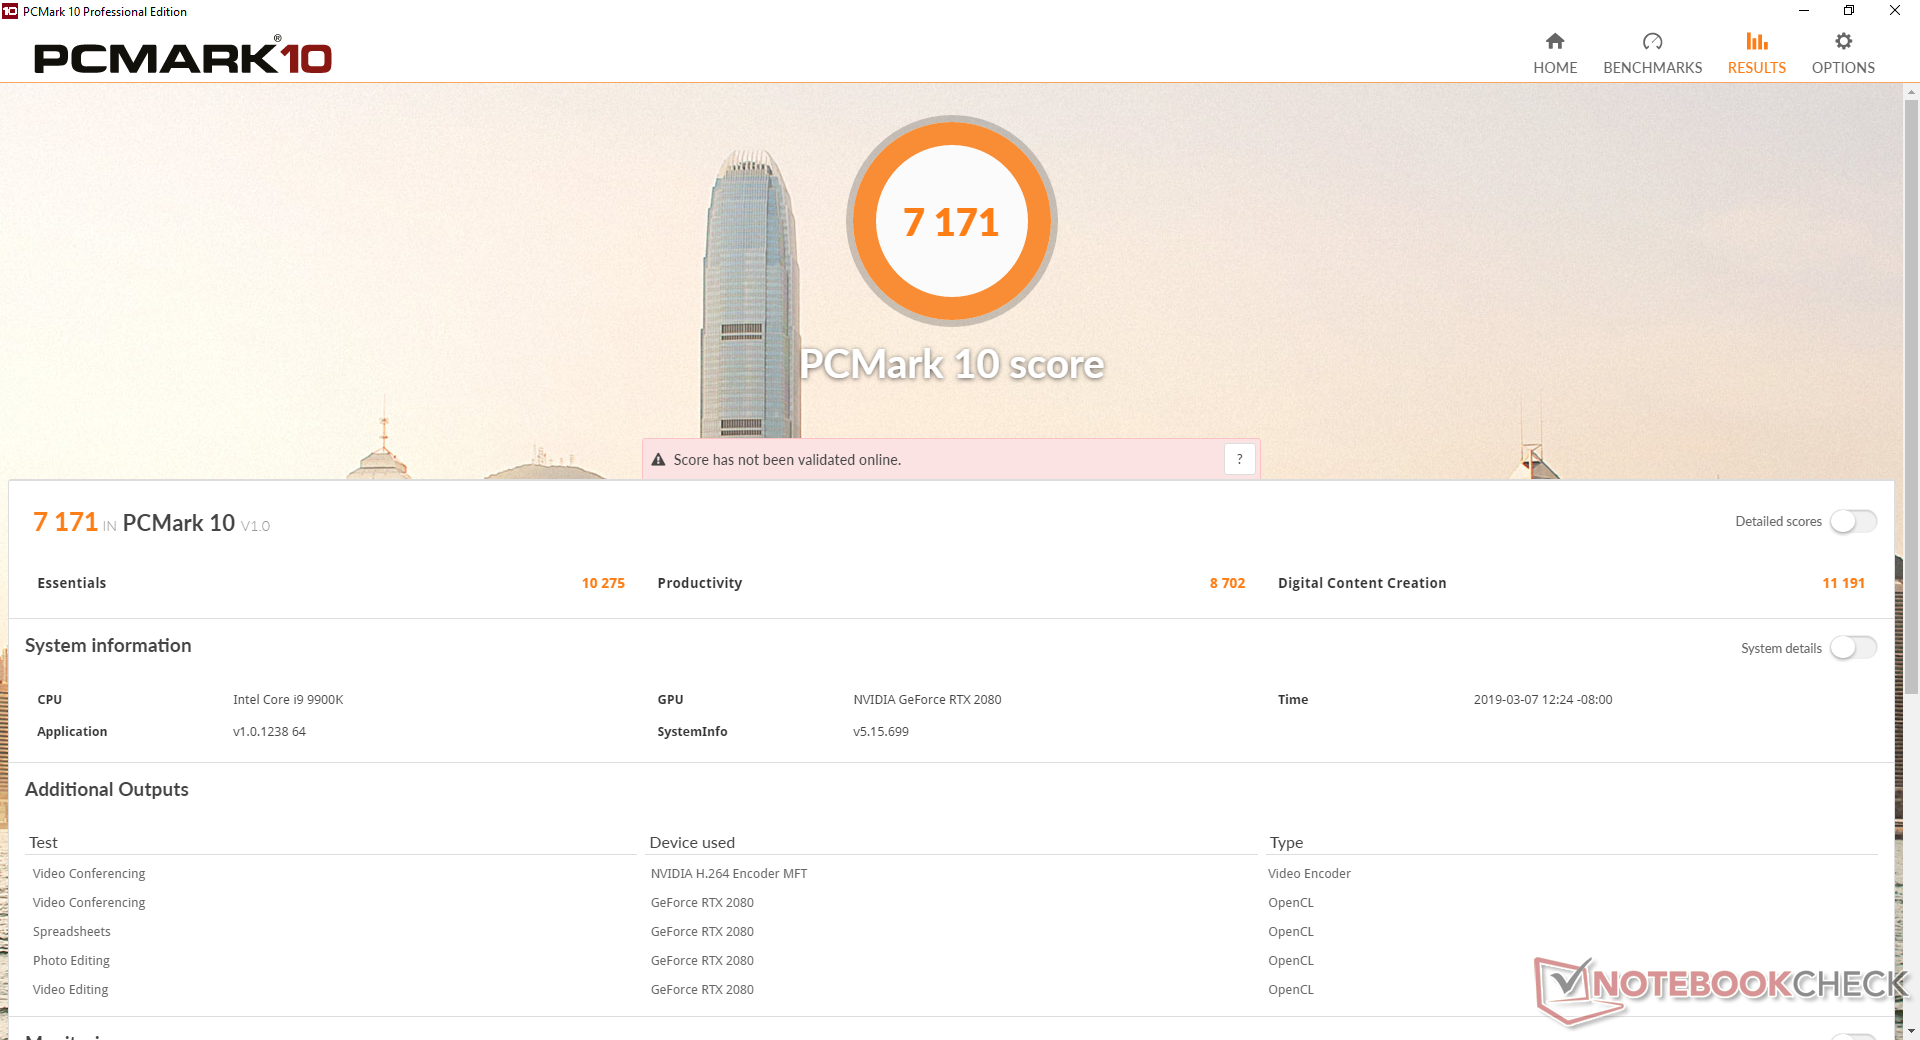
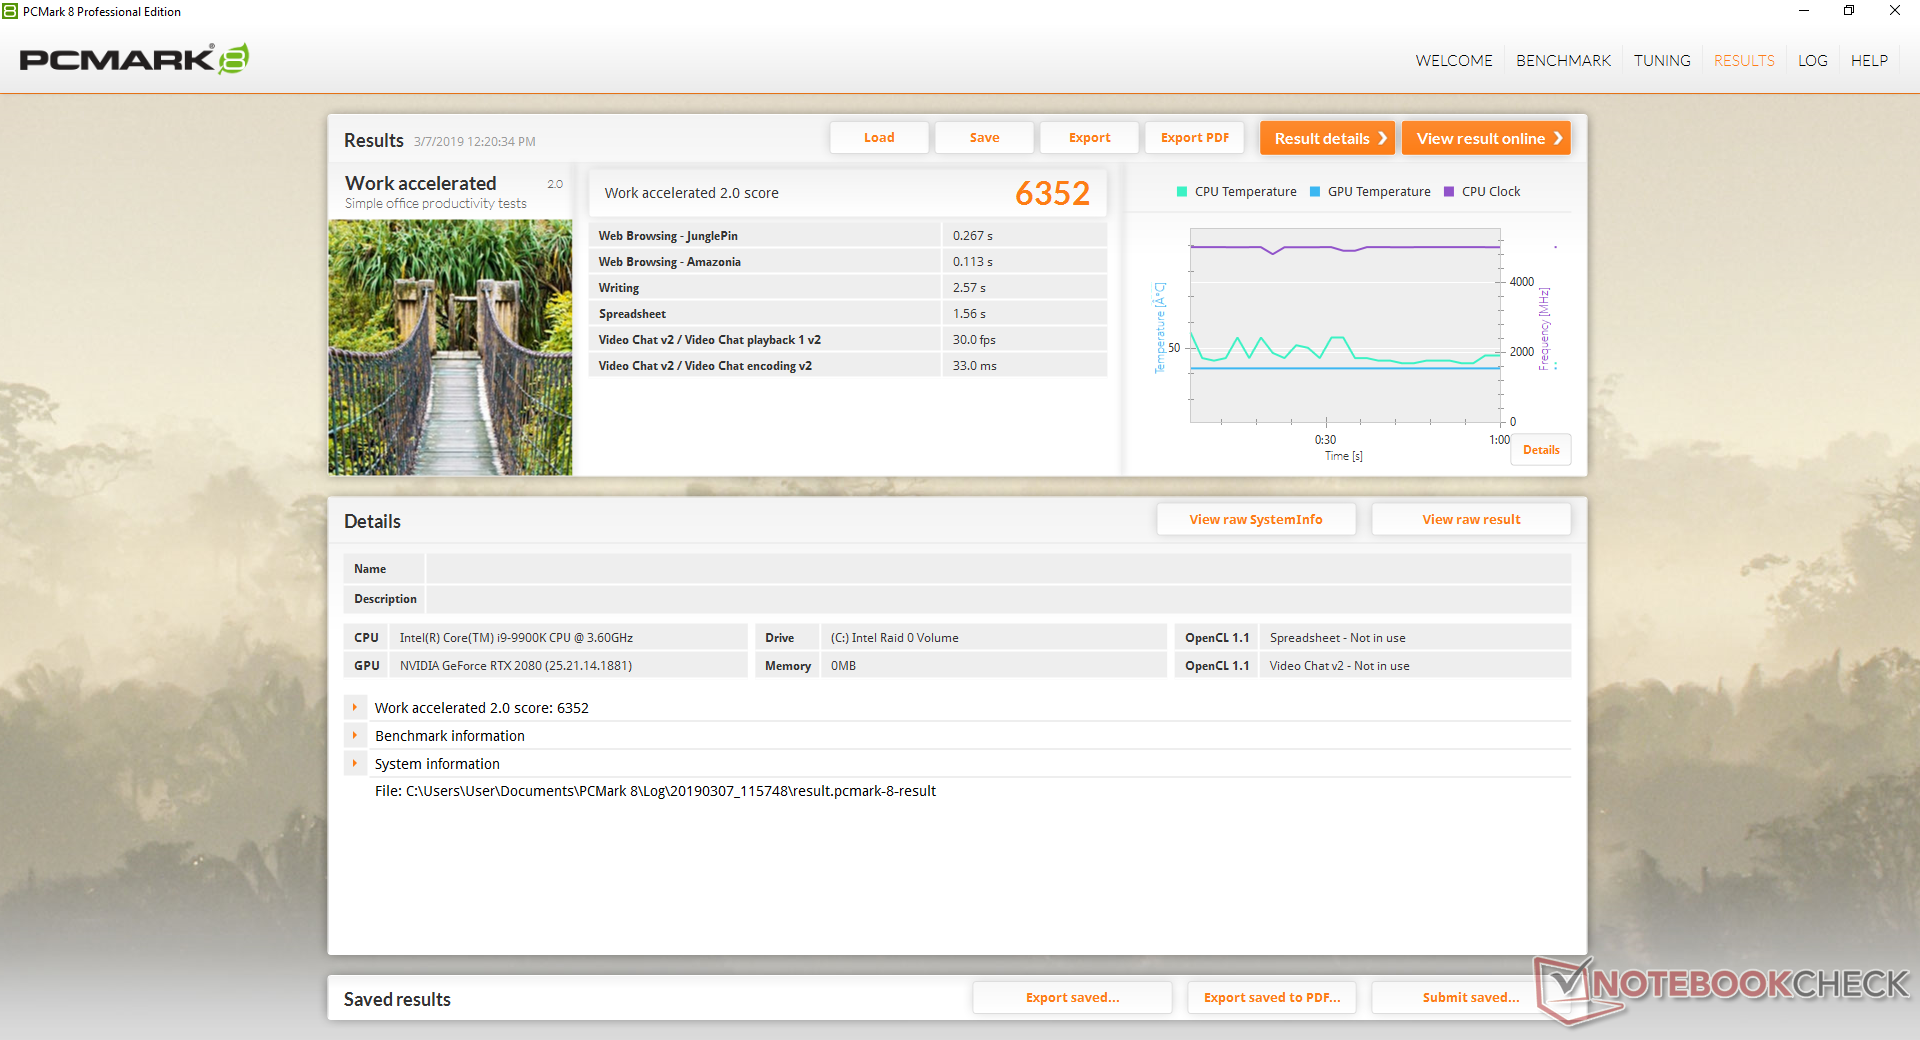
PCMark benchmark results are some of the highest in our database beating out even the Eurocom Sky X9C with GTX 1080 SLI graphics. While we didn't experience any software or hardware issues during our time with the unit, users may need to manually install the drivers for the card reader, Thunderbolt 3, and WLAN since the Windows 10 OS ships in a barebones state.
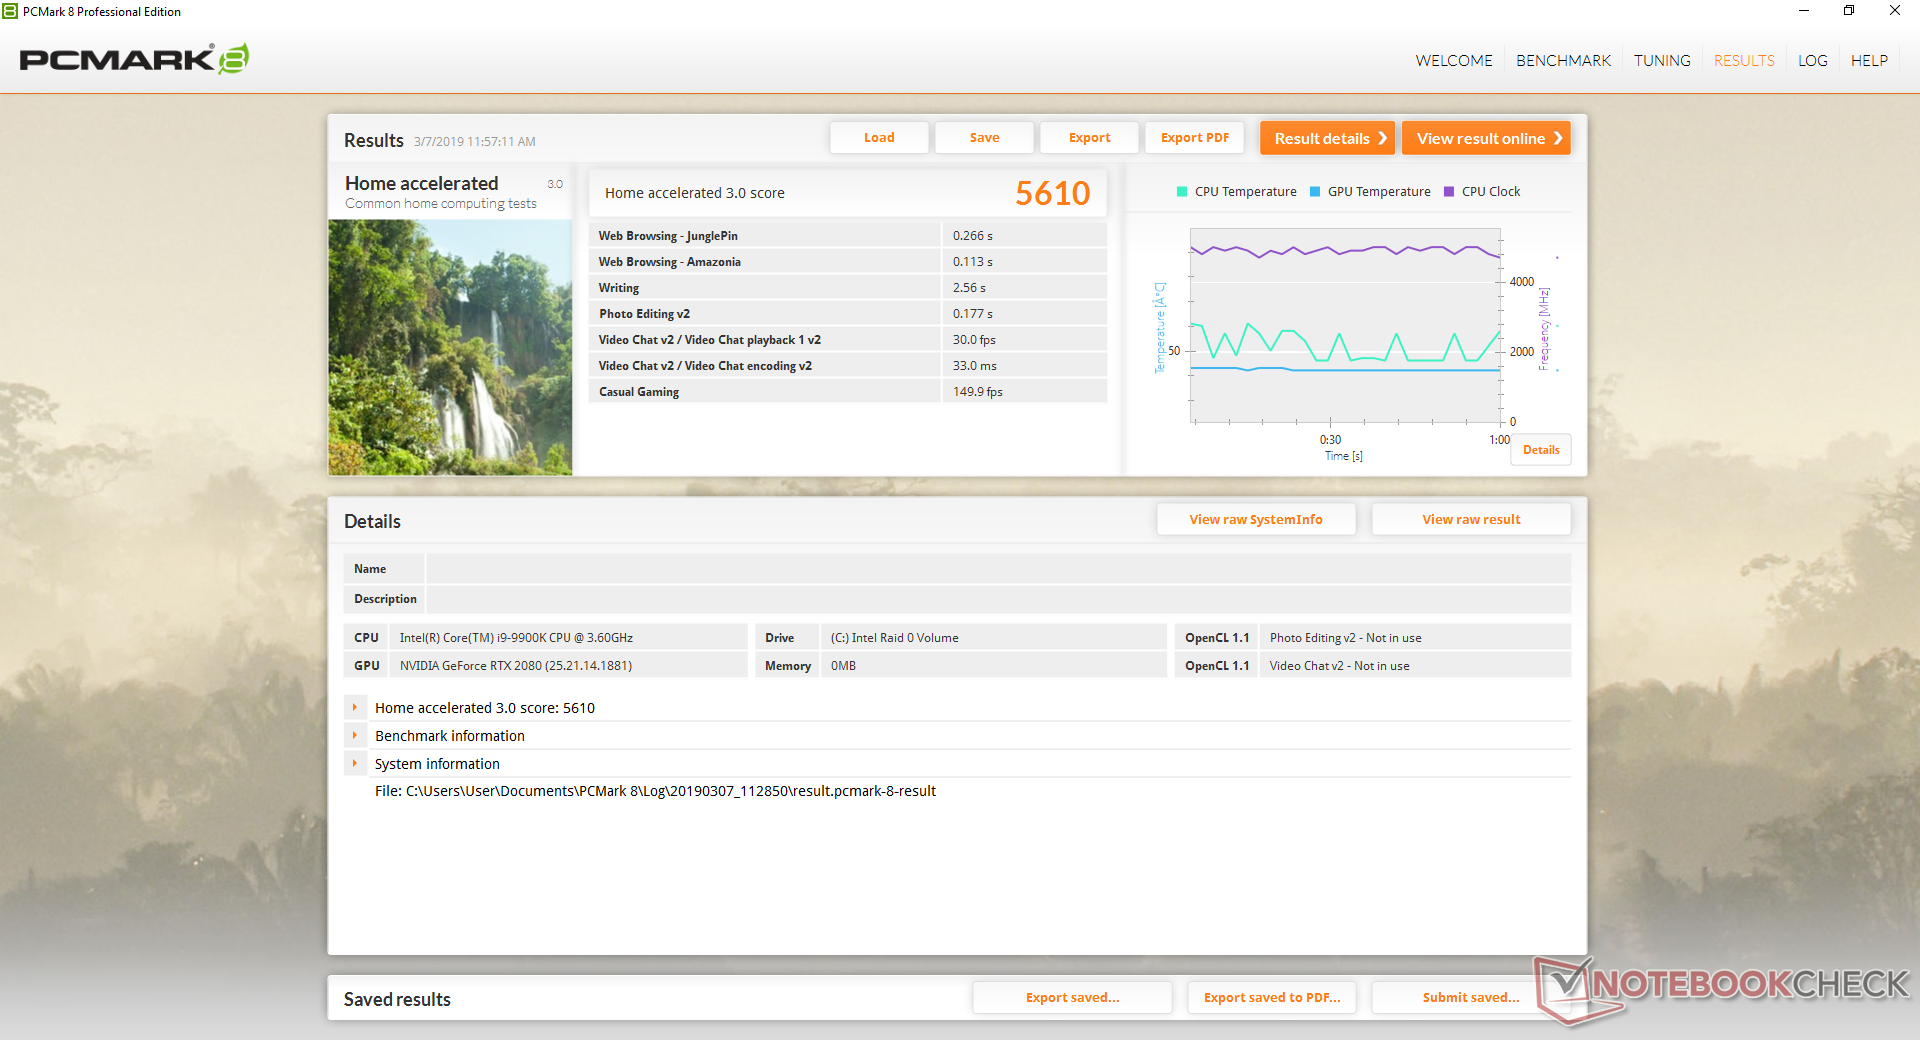
| PCMark 8 Home Score Accelerated v2 | 5610 points | |
| PCMark 8 Work Score Accelerated v2 | 6352 points | |
| PCMark 10 Score | 7171 points | |
Help | ||
Storage Devices
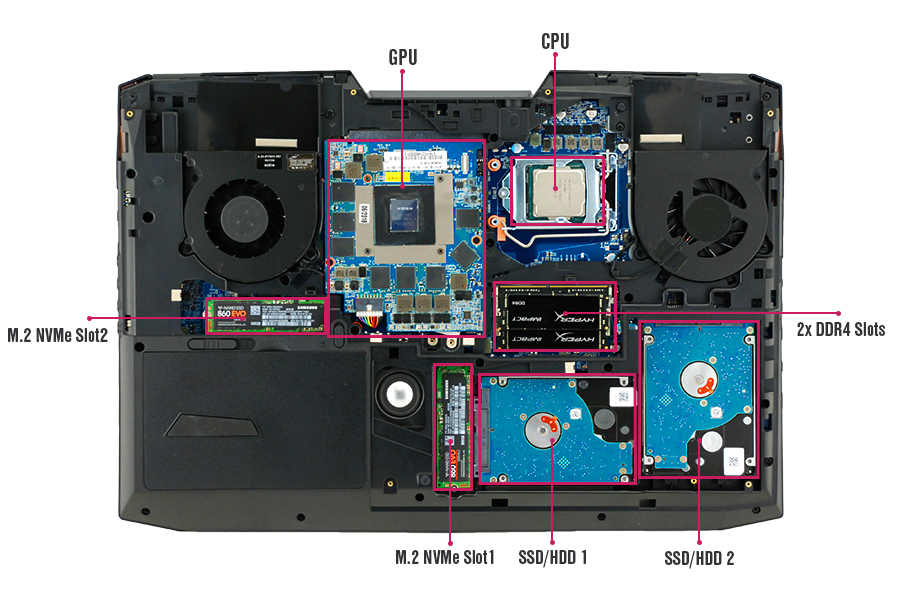
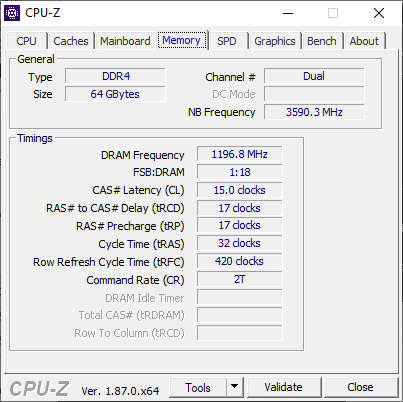
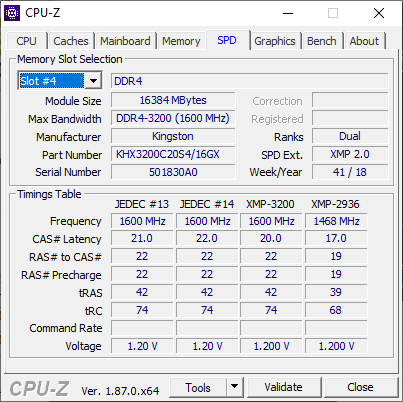
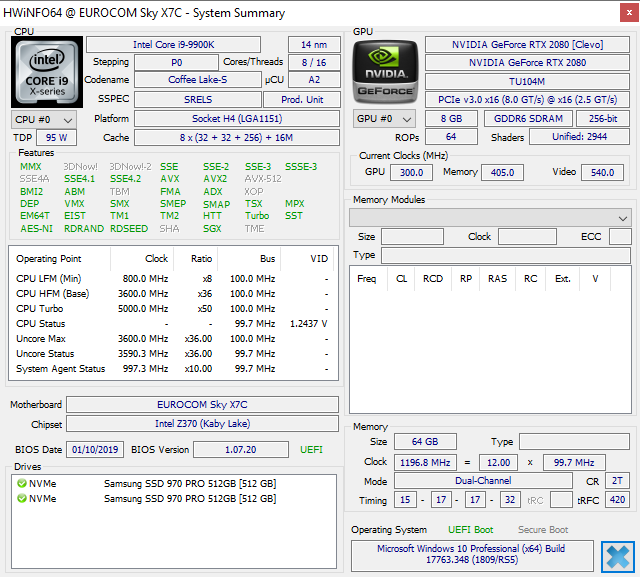
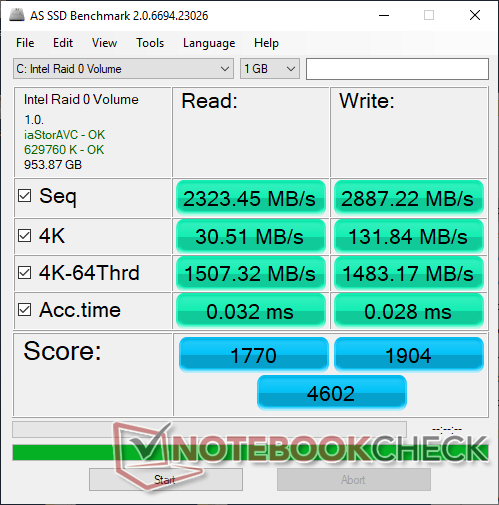
There are four internal storage bays available (2x M.2 2280 + 2x 2.5-inch SATA III). Much like on our last Sky X7C with GTX 1080 graphics, our latest SKU is also equipped with 2x 512 GB Samsung SSD 970 Pro NVMe SSDs for significantly faster transfer rates than single-drive solutions. The Samsung SSD PM981 in the Asus ROG G703, for example, has a sequential rate of "only" 1766 MB/s compared to 2887 MB/s on our RAID 0 soluition.
See our table of SSDs and HDDs for more benchmark comparisons.
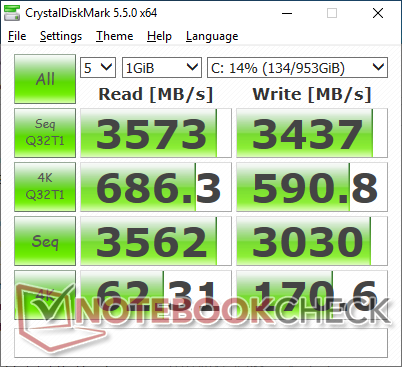
| Eurocom Sky X7C i9-9900K 2x Samsung SSD 970 Pro 512GB (RAID 0) | Alienware 17 R5 SK hynix PC401 HFS256GD9TNG | Asus ROG G703GX Samsung SSD PM981 MZVLB512HAJQ | MSI GT75 8RG-090 Titan 2x Samsung PM961 MZVLW256HEHP (RAID 0) | Acer Predator 17 G9-793-70PJ Toshiba NVMe THNSN5512GPU7 | Lenovo Legion Y740-17ICH Samsung SSD PM981 MZVLB256HAHQ | |
|---|---|---|---|---|---|---|
| AS SSD | -69% | -19% | -15% | -33% | -36% | |
| Seq Read (MB/s) | 2323 | 2203 -5% | 1632 -30% | 3058 32% | 2237 -4% | 1153 -50% |
| Seq Write (MB/s) | 2887 | 559 -81% | 1767 -39% | 2196 -24% | 1230 -57% | 1328 -54% |
| 4K Read (MB/s) | 30.51 | 38.74 27% | 50.4 65% | 38.37 26% | 37.51 23% | 35.05 15% |
| 4K Write (MB/s) | 131.8 | 92.7 -30% | 101.9 -23% | 97.7 -26% | 120.8 -8% | 96 -27% |
| 4K-64 Read (MB/s) | 1507 | 447.2 -70% | 1196 -21% | 1347 -11% | 851 -44% | 727 -52% |
| 4K-64 Write (MB/s) | 1483 | 279.1 -81% | 1631 10% | 1236 -17% | 646 -56% | 1212 -18% |
| Access Time Read * (ms) | 0.032 | 0.091 -184% | 0.061 -91% | 0.056 -75% | 0.052 -63% | 0.063 -97% |
| Access Time Write * (ms) | 0.028 | 0.065 -132% | 0.037 -32% | 0.038 -36% | 0.033 -18% | 0.04 -43% |
| Score Read (Points) | 1770 | 706 -60% | 1410 -20% | 1691 -4% | 1112 -37% | 878 -50% |
| Score Write (Points) | 1904 | 428 -78% | 1910 0% | 1553 -18% | 890 -53% | 1441 -24% |
| Score Total (Points) | 4602 | 1424 -69% | 4057 -12% | 4066 -12% | 2547 -45% | 2784 -40% |
| Copy ISO MB/s (MB/s) | 3044 | 2048 -33% | 1487 -51% | |||
| Copy Program MB/s (MB/s) | 574 | 428.5 -25% | 608 6% | |||
| Copy Game MB/s (MB/s) | 1489 | 1173 -21% | 1162 -22% |
* ... smaller is better

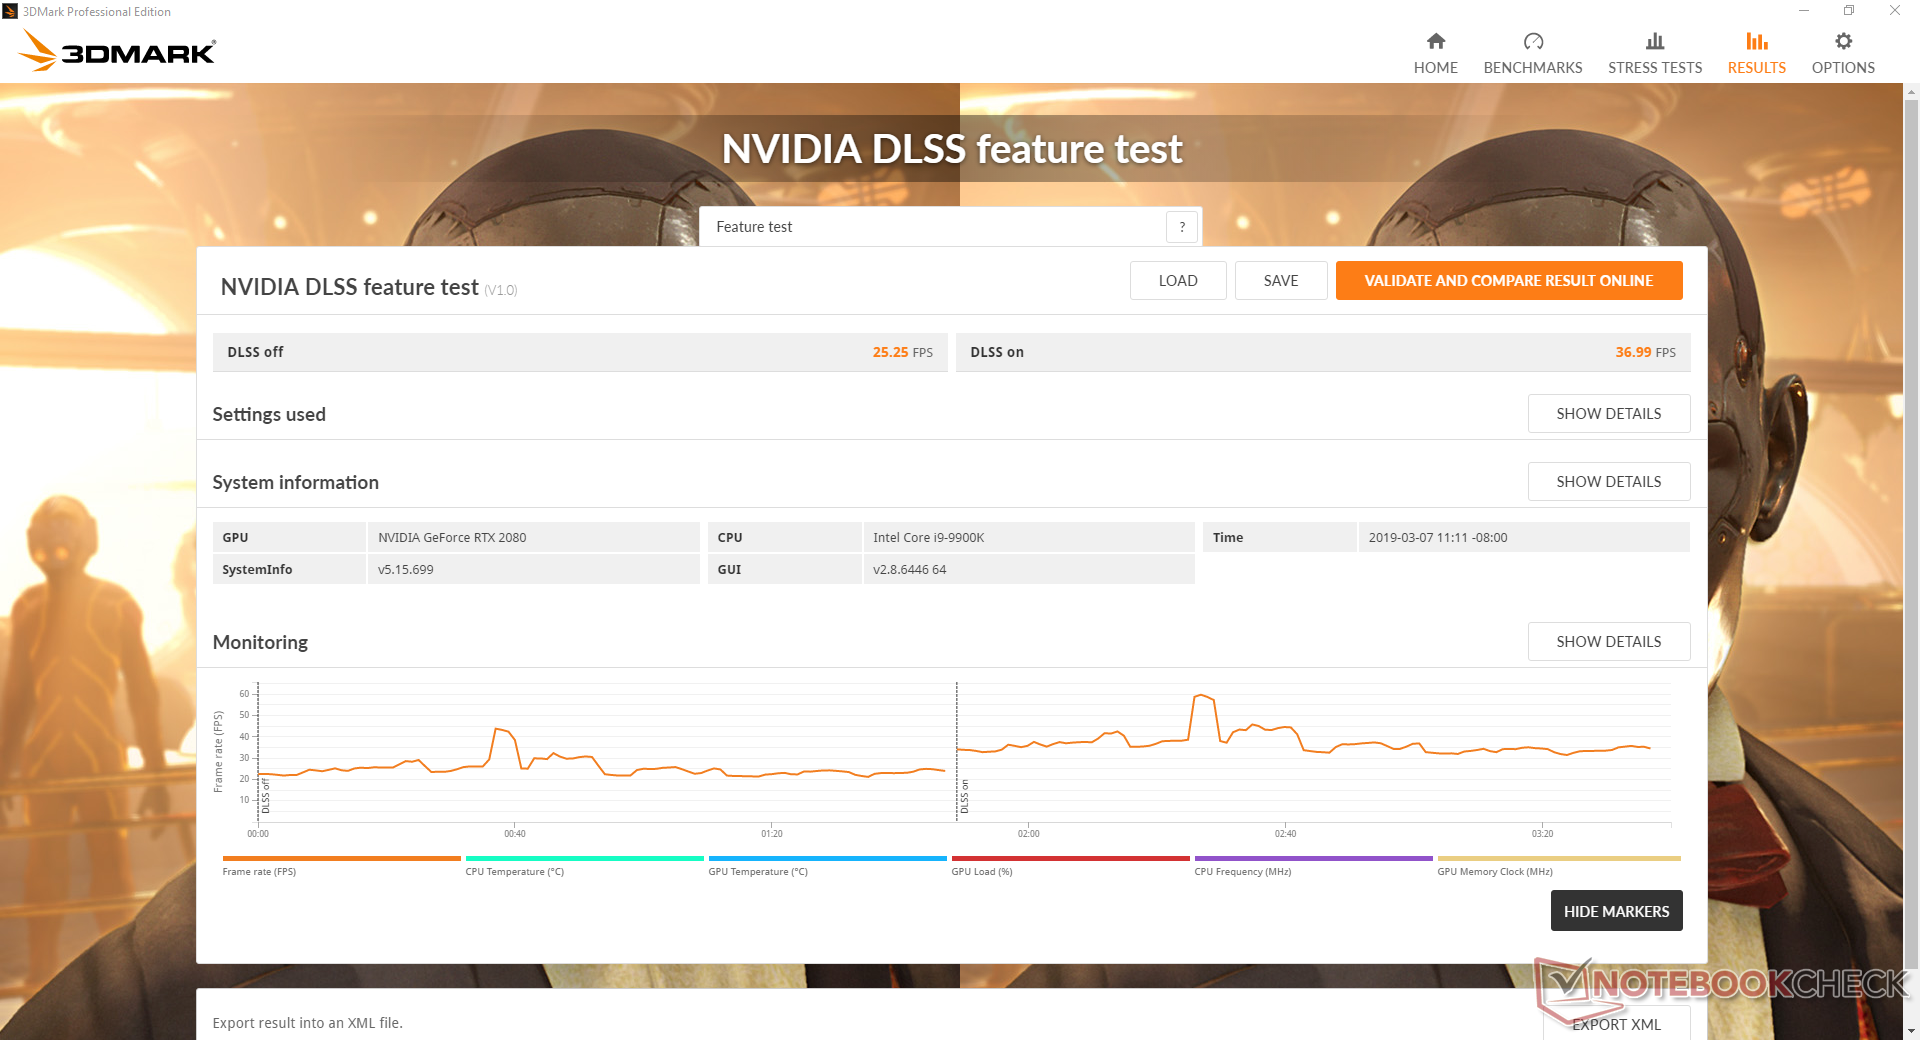
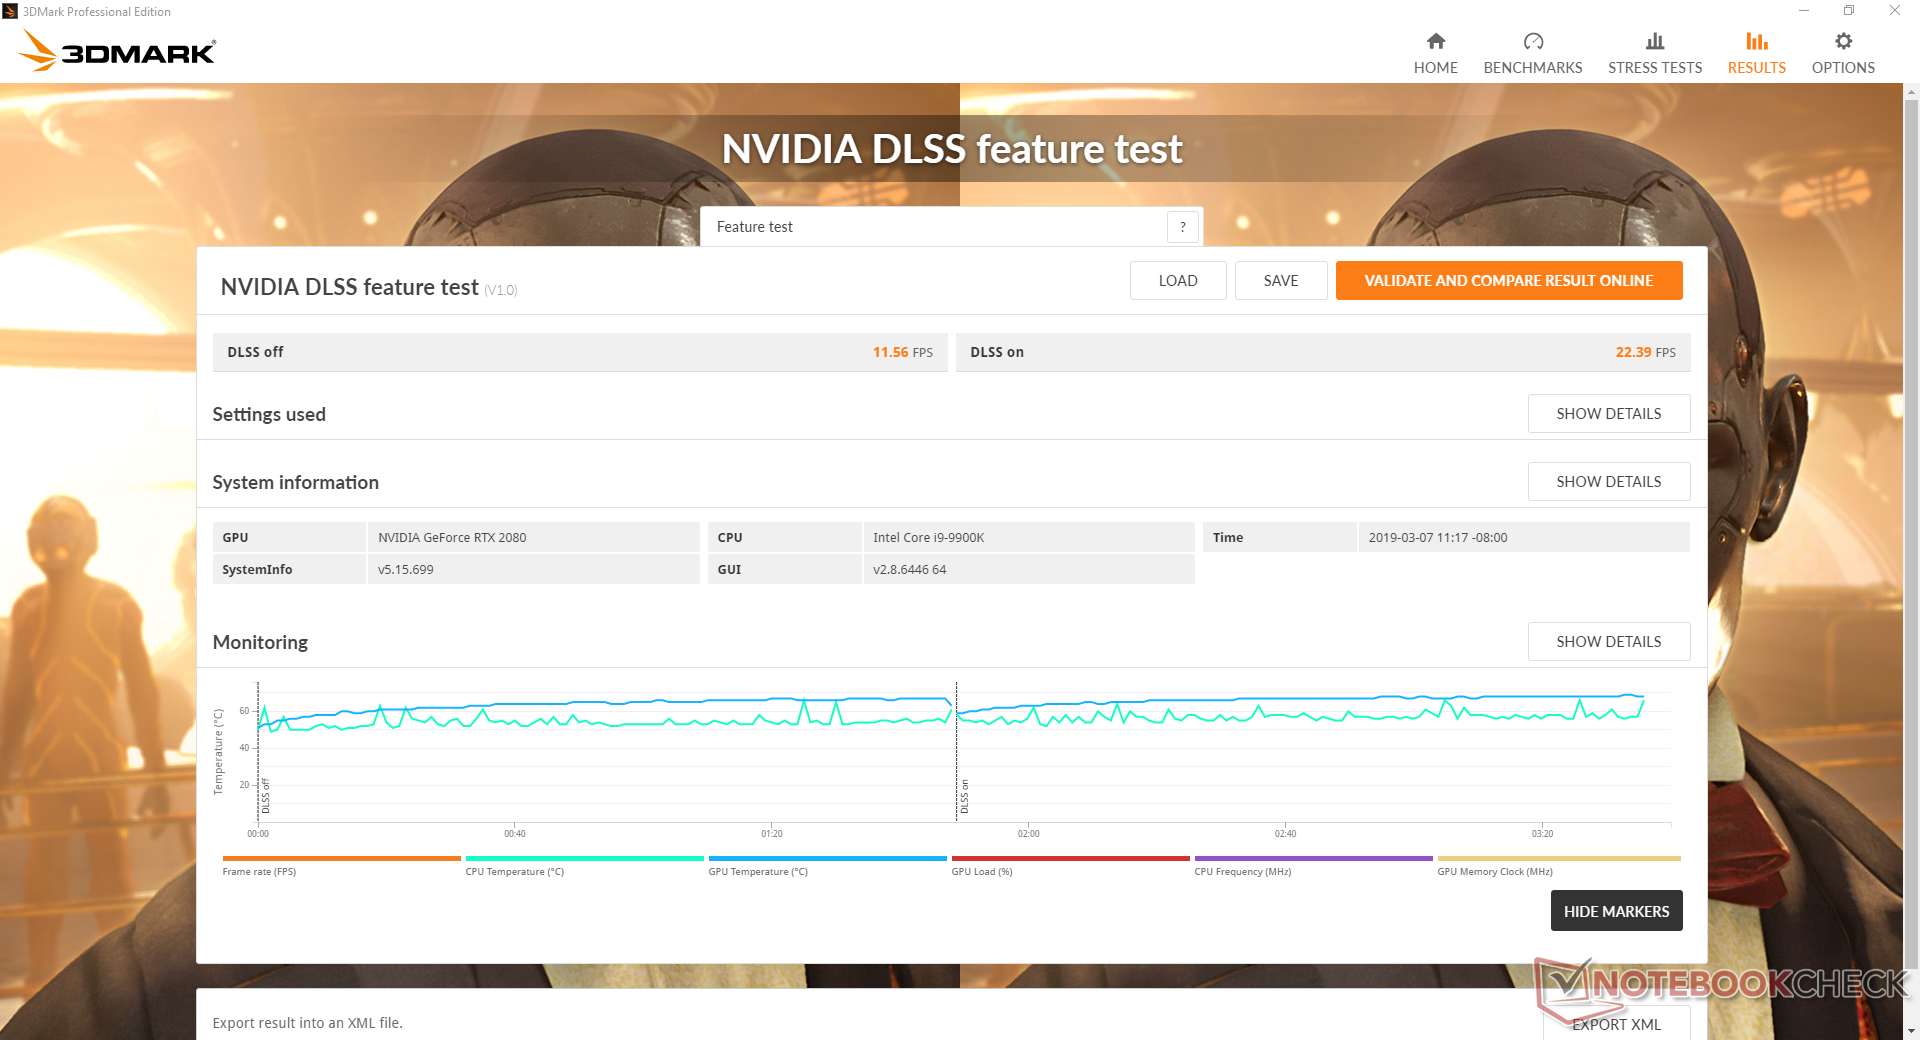
GPU Performance
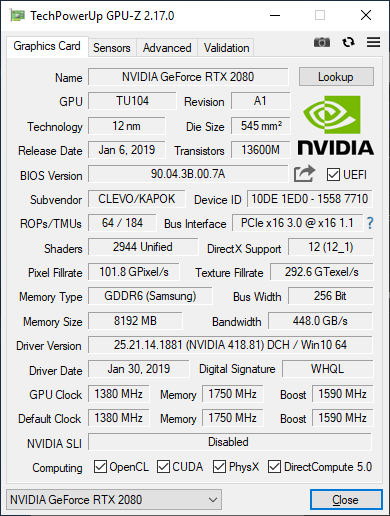
The RTX 2080 in the Sky X7C is 7 to 12 percent slower than our desktop RTX 2080 reference. Indeed, a quick look at its GPU-Z data shows reduced clock rates when compared to a desktop RTX 2080 (1590 MHz vs. 1860 MHz) even though CUDA count remains identical. Raw performance can still be 22 percent to 42 percent faster than the last generation mobile GTX 1080 depending on the resolution and DX11/DX12 setting.
The RTX 2080 Max-Q is only about 15 percent slower than our RTX 2080. The difference is surprisingly small considering how much heavier, larger, and demanding the Sky X7C chassis can be when compared to a Max-Q laptop.
Running Witcher 3 shows no recurring dips in frame rates to suggest no interrupting background activity when gaming.
See our overview on the Nvidia Turing series for more technical information and our dedicated page on the RTX 2080 for more benchmark comparisons.
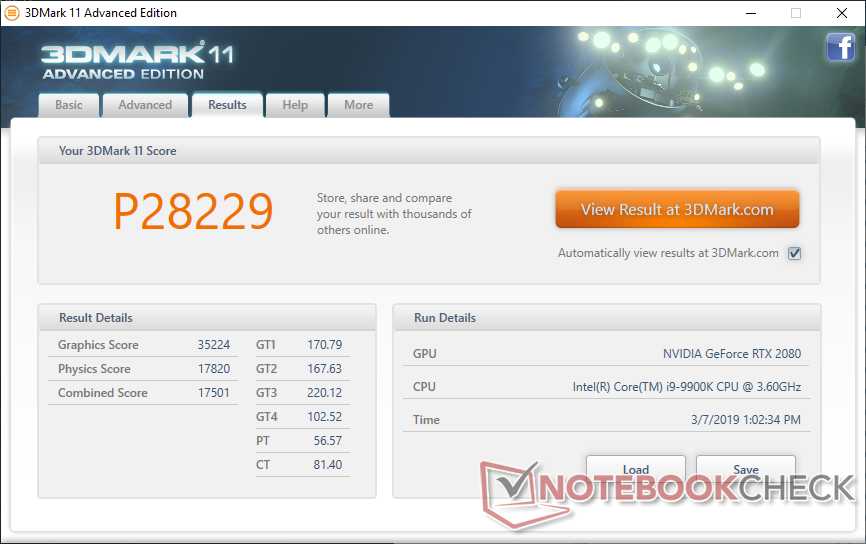
| 3DMark 11 Performance | 28229 points | |
| 3DMark Cloud Gate Standard Score | 58727 points | |
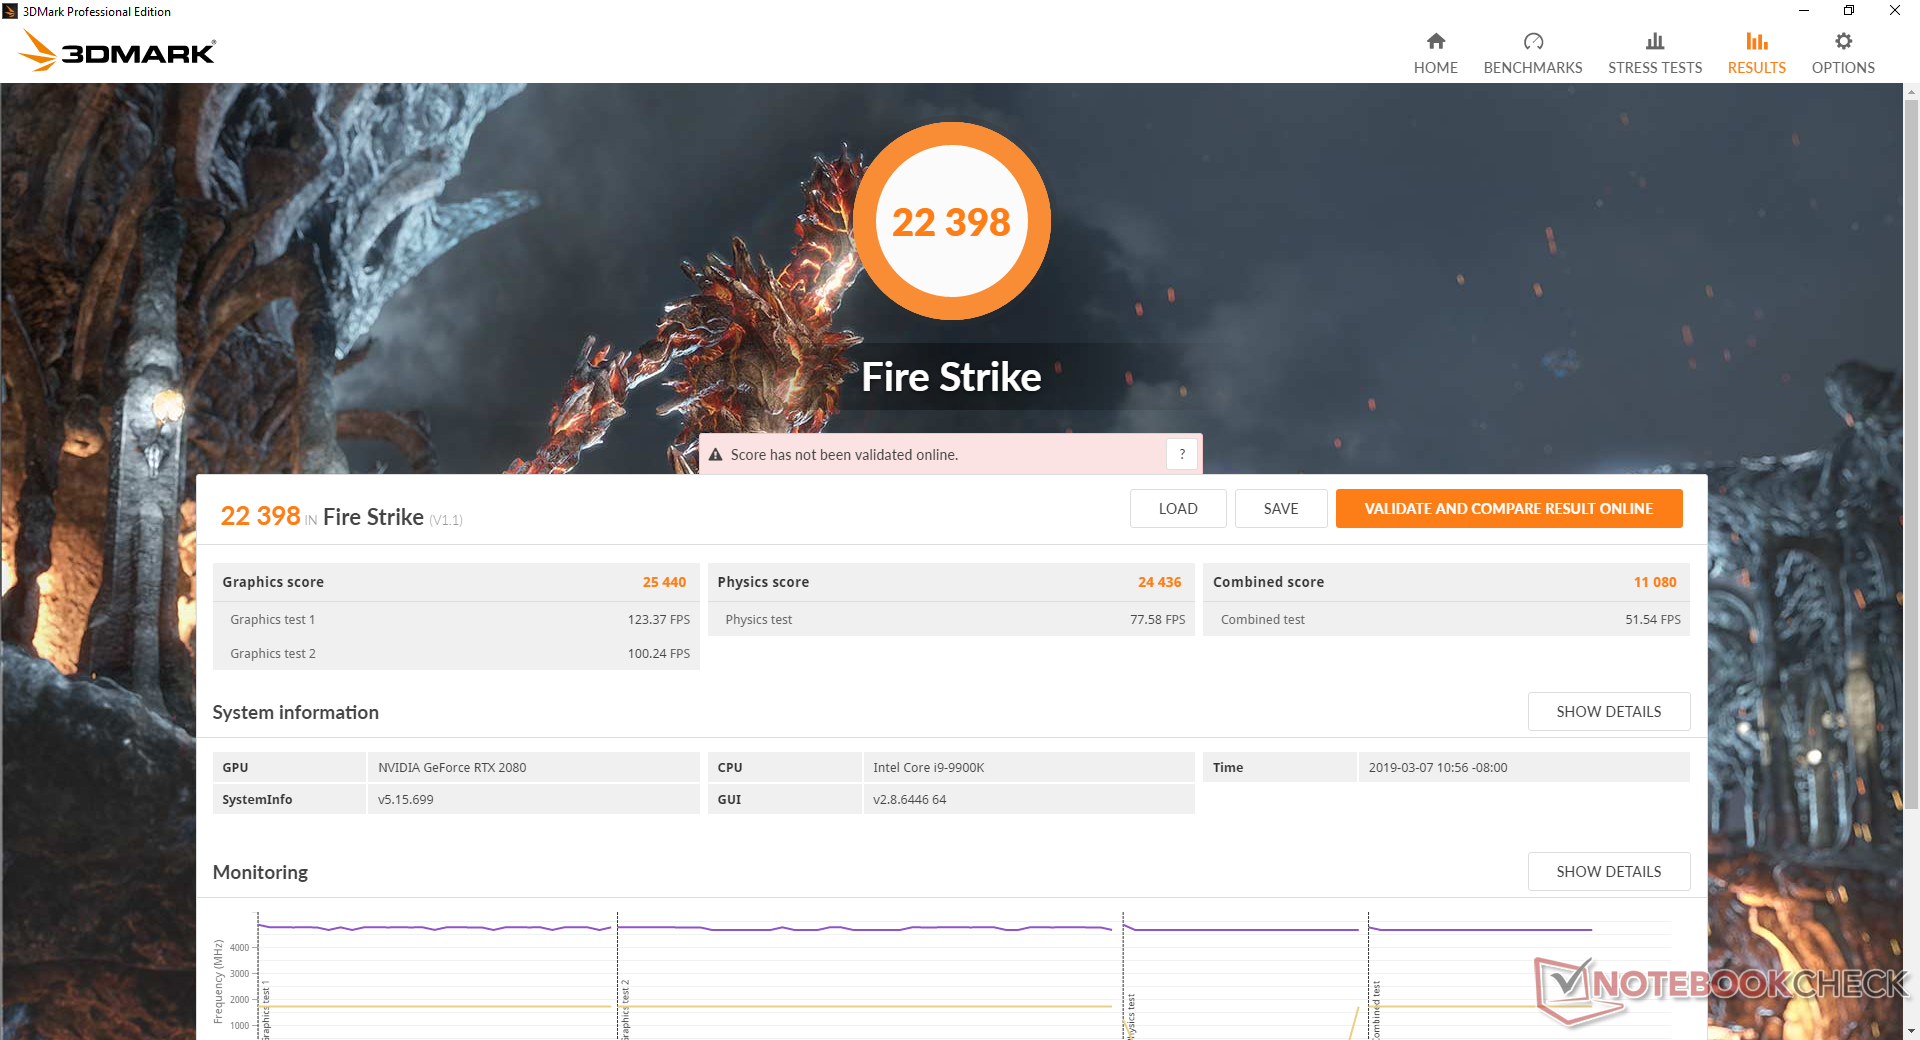
| 3DMark Fire Strike Score | 22398 points | |
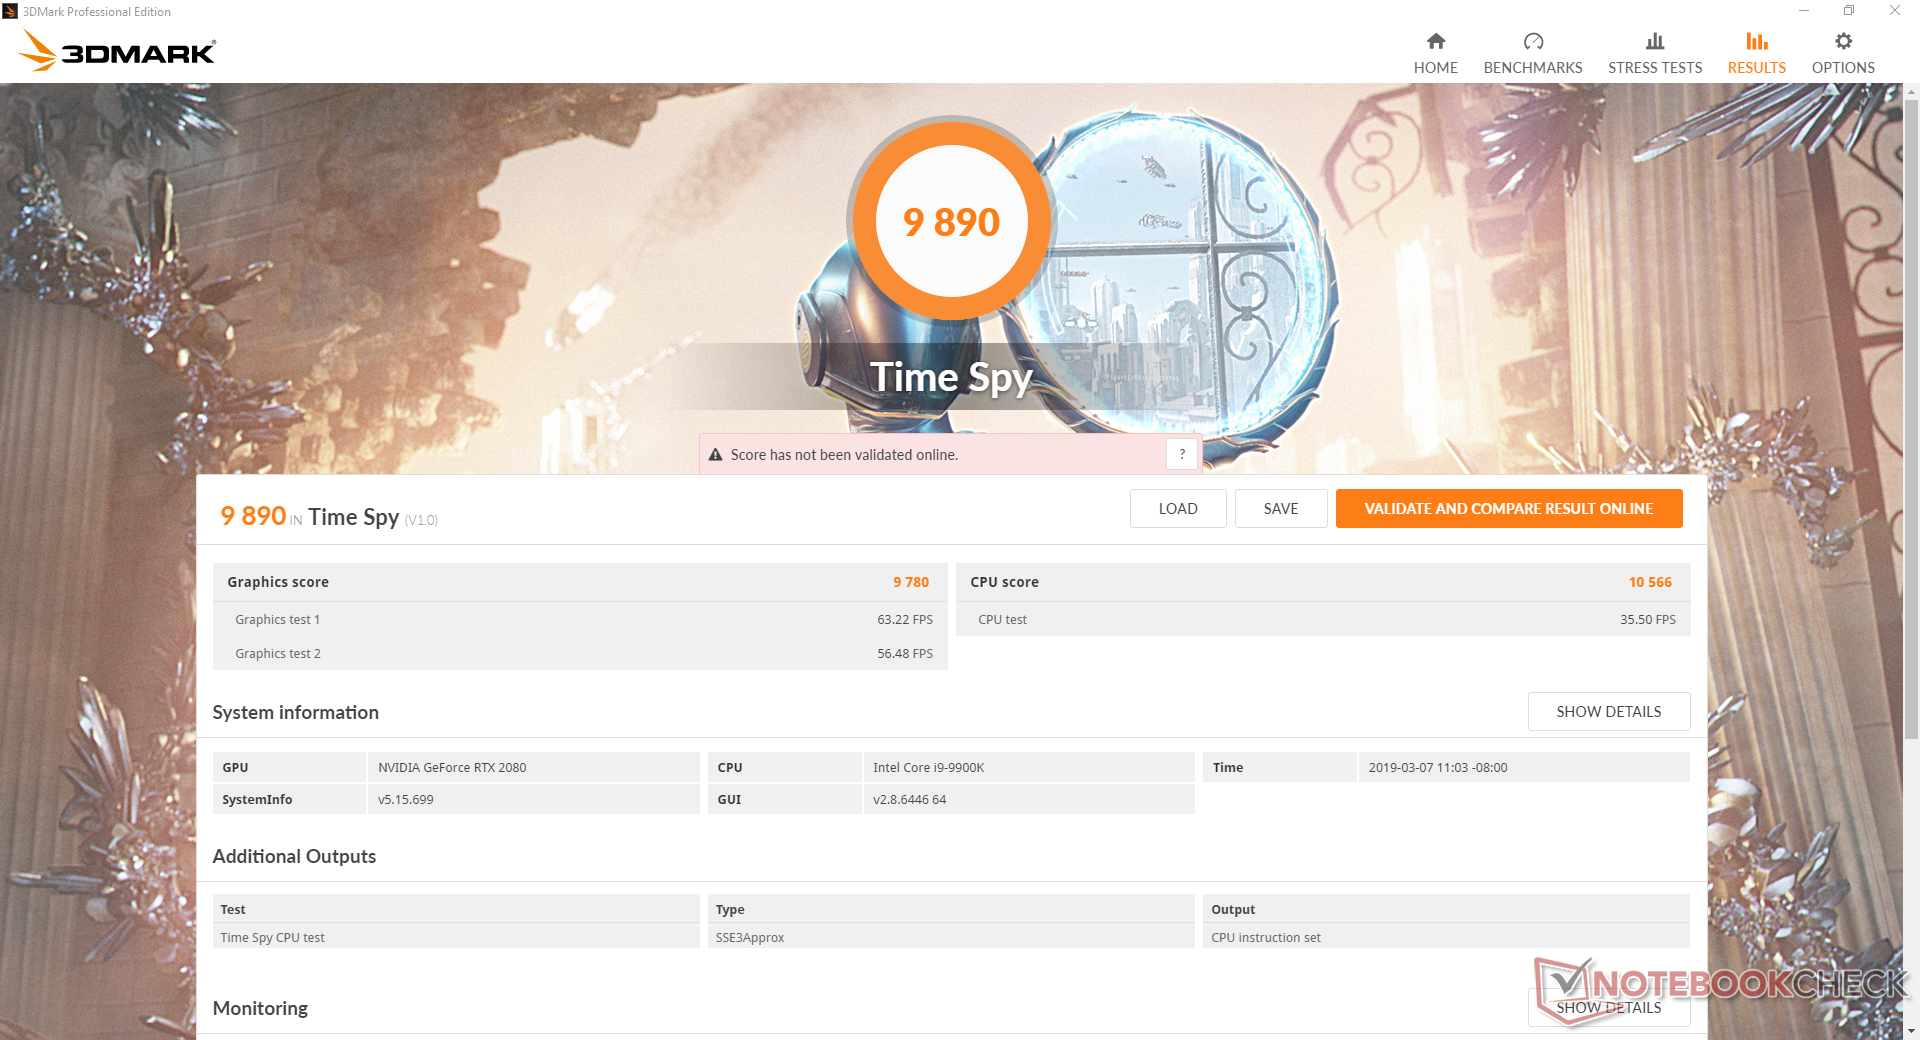
| 3DMark Time Spy Score | 9890 points | |
Help | ||
| low | med. | high | ultra | |
|---|---|---|---|---|
| BioShock Infinite (2013) | 452.2 | 368.6 | 344.1 | 201.1 |
| The Witcher 3 (2015) | 387.2 | 272.8 | 174.2 | 90.3 |
| Rise of the Tomb Raider (2016) | 318.2 | 225 | 175.7 | 140.5 |
Emissions
System Noise
Fan noise is more noticeable on the Sky X7C compared to many other gaming laptops because its AC adapter has its own set of active fans as well. Thus, not only will the laptop make noise, but so will the AC adapter. Light loads like browsing or video streaming will bump the fans to 34 dB(A) and so we recommend working in Power Saver or Silent mode when the GPU horsepower is not required.
When running Witcher 3, we are able to record a fan noise of 49 dB(A) to be similar to the Asus ROG G703GX or MSI GE75. Coil whine is not present on our test unit.
| Eurocom Sky X7C i9-9900K GeForce RTX 2080 Mobile, i9-9900K, 2x Samsung SSD 970 Pro 512GB (RAID 0) | Asus ROG G703GX GeForce RTX 2080 Mobile, i7-8750H, Samsung SSD PM981 MZVLB512HAJQ | MSI GT75 8RG-090 Titan GeForce GTX 1080 Mobile, i9-8950HK, 2x Samsung PM961 MZVLW256HEHP (RAID 0) | Lenovo Legion Y740-17ICH GeForce RTX 2080 Max-Q, i7-8750H, Samsung SSD PM981 MZVLB256HAHQ | MSI GE75 8SF GeForce RTX 2070 Mobile, i7-8750H, Kingston RBUSNS8154P3256GJ1 | Asus Zephyrus S GX701GX GeForce RTX 2080 Max-Q, i7-8750H, Samsung SSD PM981 MZVLB1T0HALR | |
|---|---|---|---|---|---|---|
| Noise | -11% | -13% | 4% | -7% | -5% | |
| off / environment * (dB) | 28.9 | 30 -4% | 30 -4% | 28.3 2% | 28.3 2% | 29 -0% |
| Idle Minimum * (dB) | 29.7 | 30 -1% | 32 -8% | 31.5 -6% | 33.5 -13% | 29 2% |
| Idle Average * (dB) | 29.7 | 35 -18% | 34 -14% | 31.6 -6% | 33.6 -13% | 32 -8% |
| Idle Maximum * (dB) | 30 | 41 -37% | 37 -23% | 31.6 -5% | 35 -17% | 33 -10% |
| Load Average * (dB) | 36.5 | 44 -21% | 43 -18% | 32.3 12% | 38 -4% | 47 -29% |
| Witcher 3 ultra * (dB) | 49 | 51 -4% | 57 -16% | 43 12% | 50 -2% | 49 -0% |
| Load Maximum * (dB) | 57 | 52 9% | 62 -9% | 45.5 20% | 56.9 -0% | 51 11% |
* ... smaller is better
Noise level
| Idle |
| 29.7 / 29.7 / 30 dB(A) |
| Load |
| 36.5 / 57 dB(A) |
 | ||
30 dB silent 40 dB(A) audible 50 dB(A) loud |
||
min: | ||
Temperature
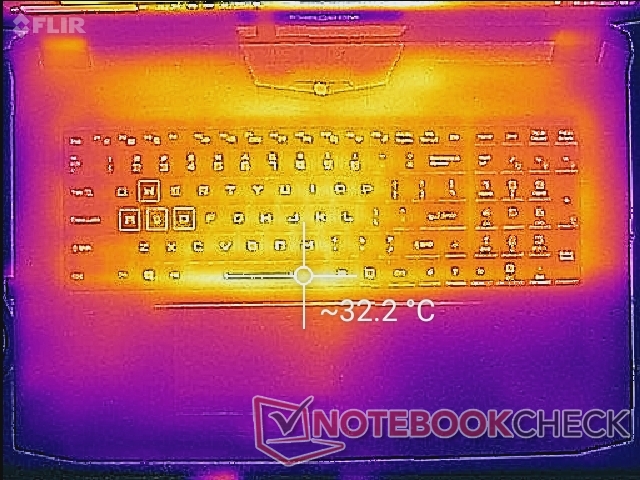
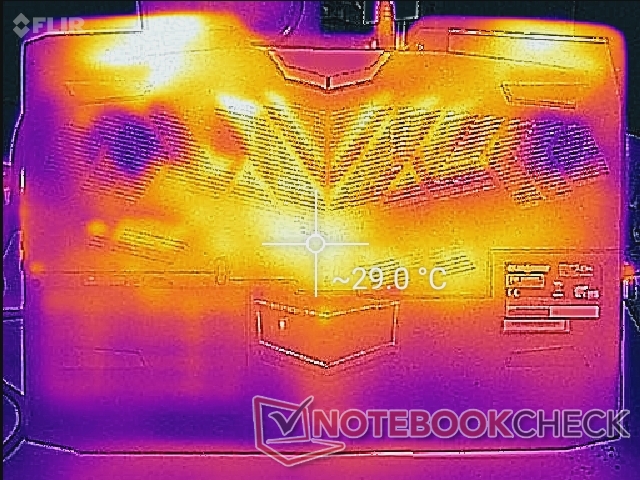
Surface temperatures when idling on desktop will be warm but never uncomfortably so. The keyboard center can be as warm as 32 C whereas the palm rests can be 10 C cooler. This temperature difference is larger than on most other laptops since the Sky X7C is equipped with more demanding desktop-class processors.
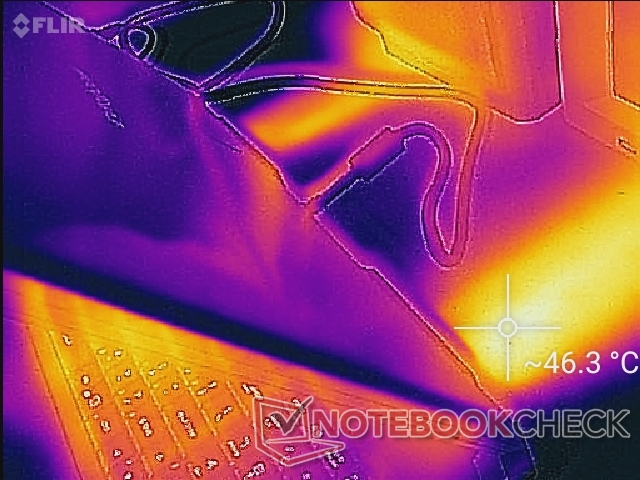
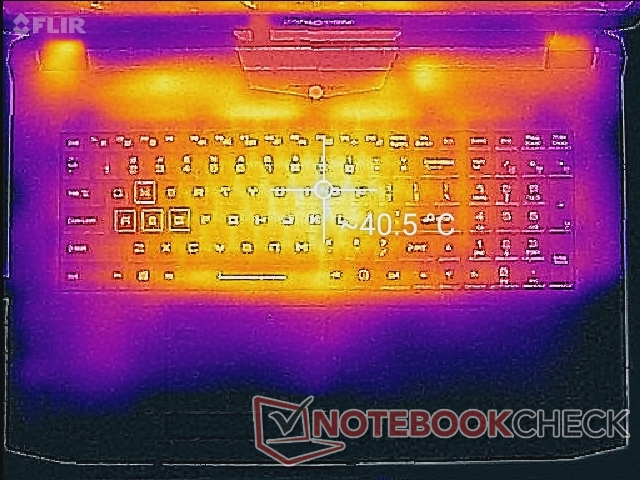
When running Witcher 3, the center of the keyboard can be as warm as 41 C compared to 38 C on the MSI GT75 and GE75 when subjected to similar loads. Thankfully, commonly touched areas like the WASD keys, Arrow keys, and palm rests remain relatively cool for comfortable hands and fingers when gaming.
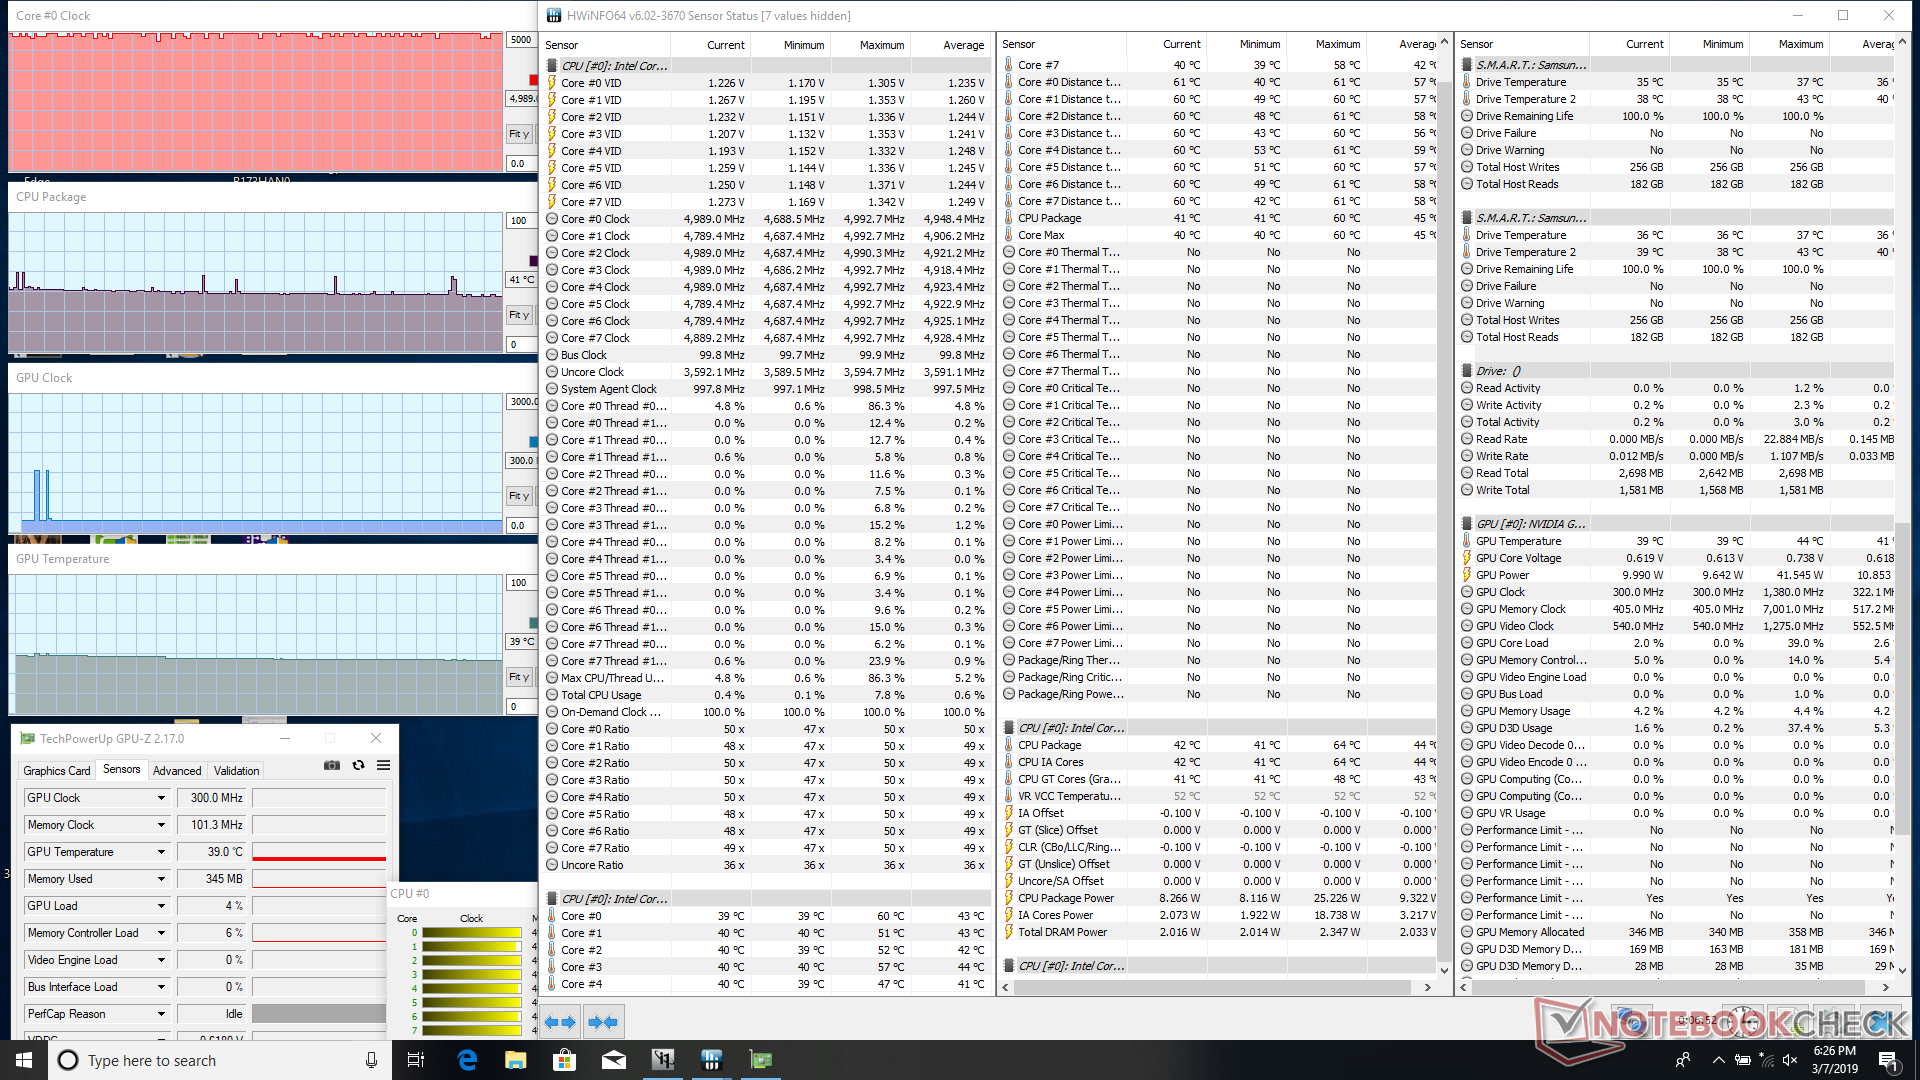
Stress Test
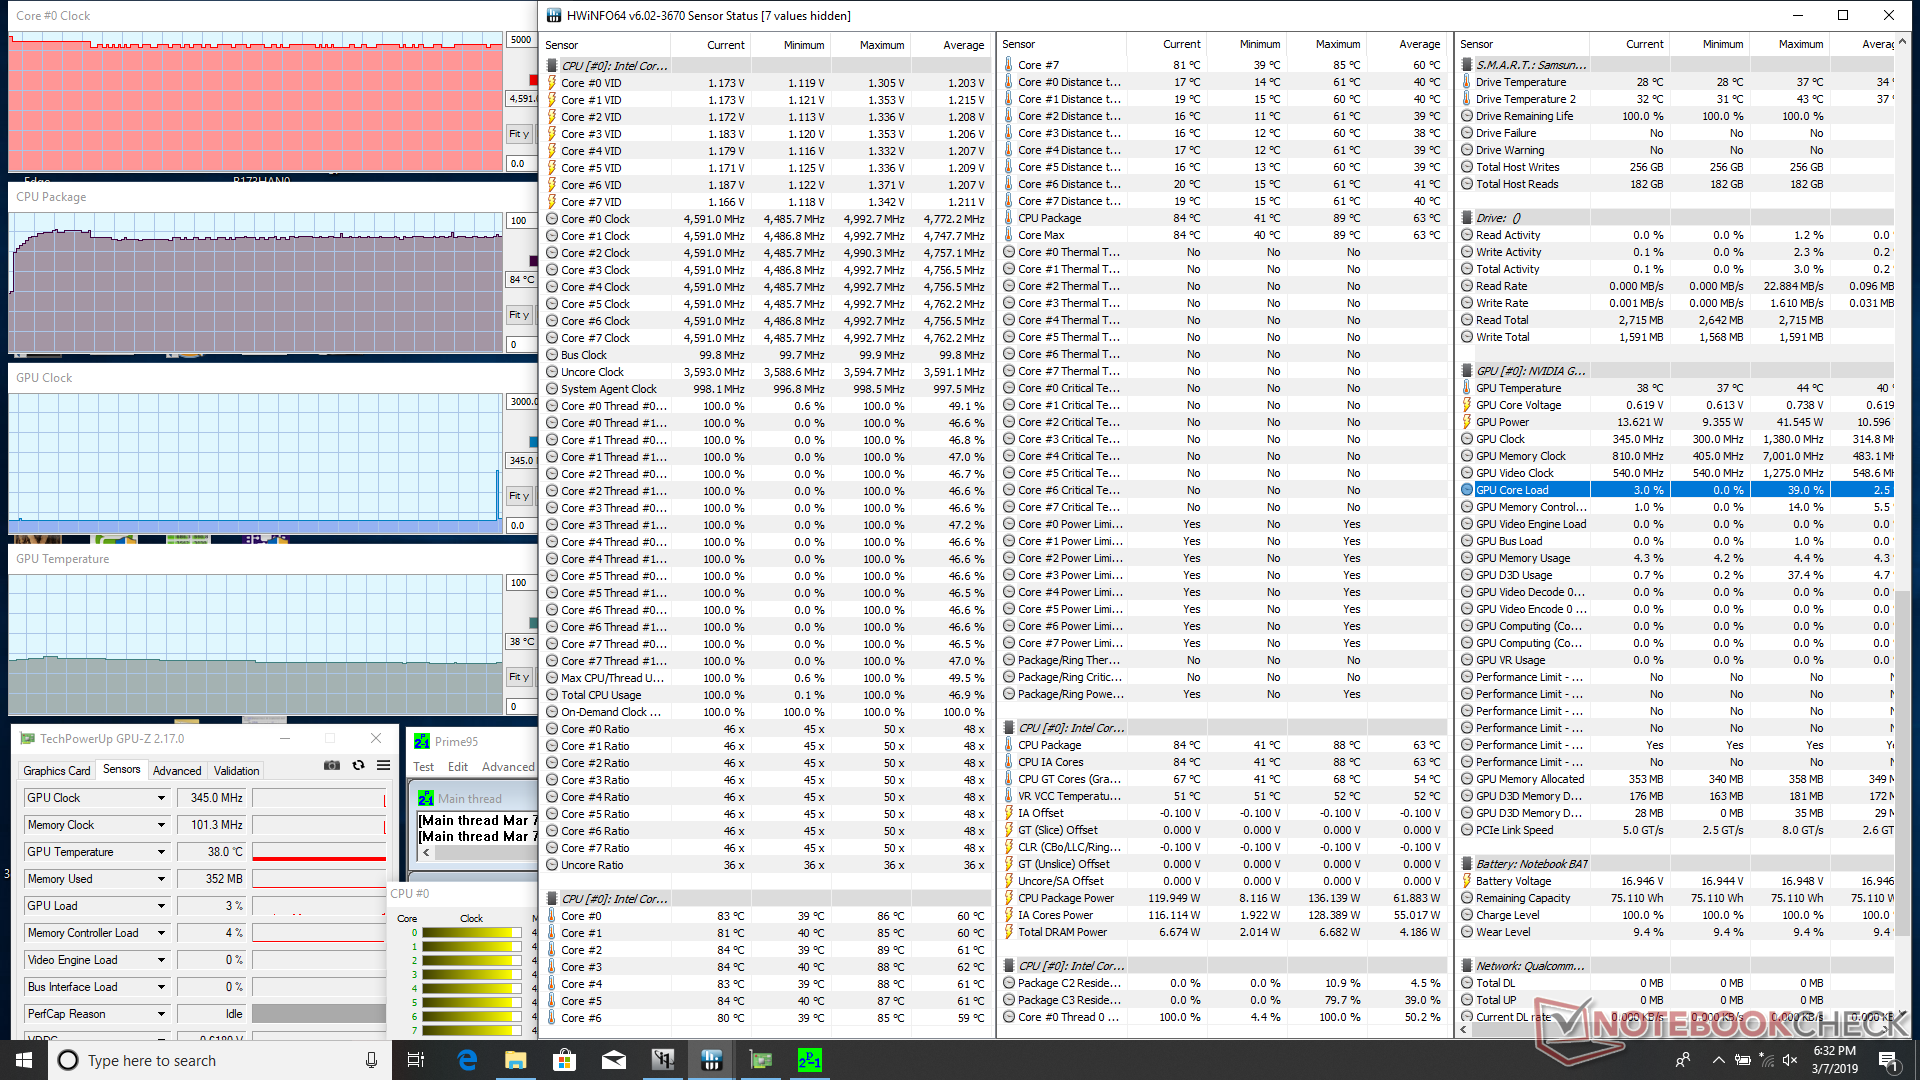
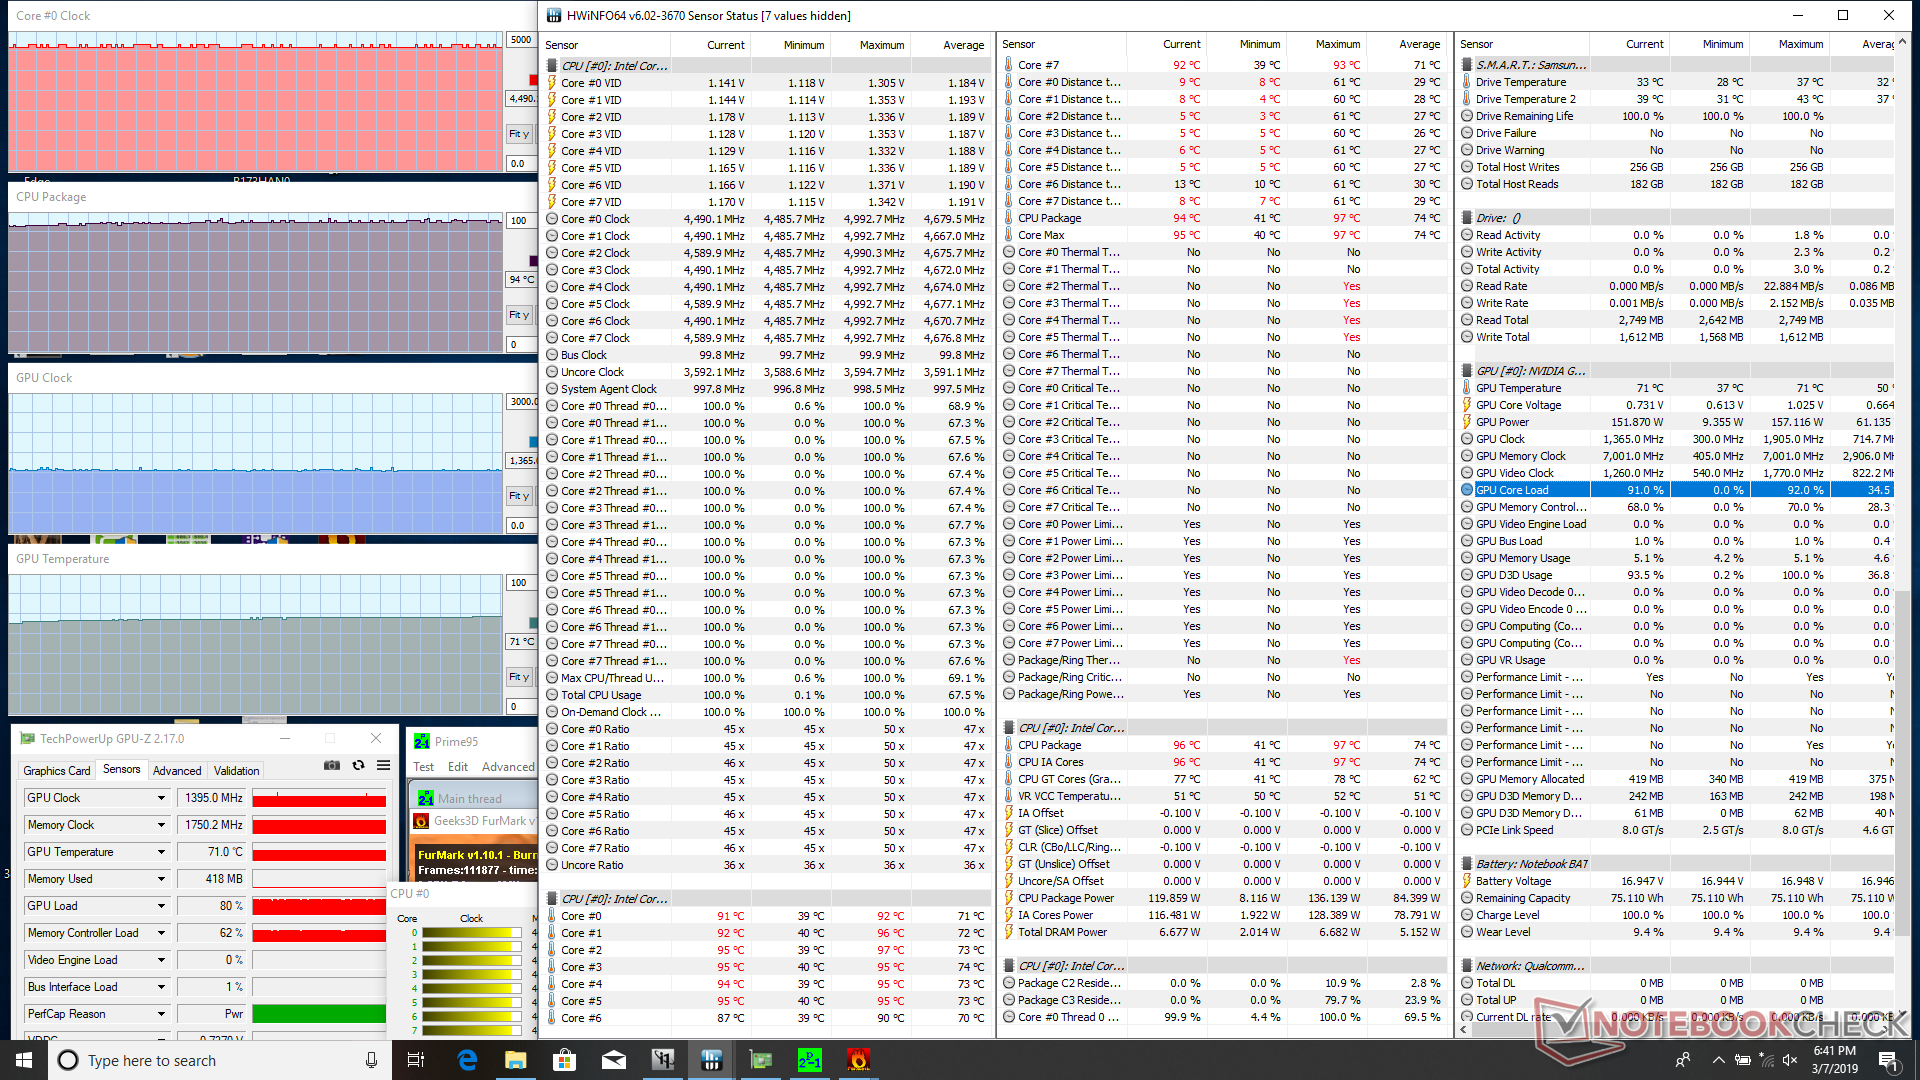
We stress the laptop with synthetic loads to identify for any potential throttling or stability issues. When running Prime95, the CPU will run as high as 4.7 GHz for the first few seconds until reaching a core temperature of 88 C. Thereafter, clock rate drops to a steady 4.5 to 4.6 GHz in order to maintain a cooler core temperature of 83 C. Its behavior here supports our CineBench R15 loop test observations above. Since the base clock rate of the i9-9900K is 3.5 GHz, the 1.0 to 1.1 GHz sustainable Turbo Boost on the Eurocom is respectable. Impressively, CPU clock rate does not fall when running both Prime95 and FurMark simultaneously, though core temperature will become very warm at 94 C.
Running Witcher 3 is more representative of real-world gaming loads. The CPU and GPU stabilize at 74 C and 71 C, respectively, compared to 83 C and 74 C on the Asus Zephyrus S GX701GX with RTX 2080 Max-Q graphics. The 70 C to 80 C range is common when gaming on high-power gaming laptops and it's good to see that the Sky X7C doesn't run much warmer than its peers.
Running on battery power will limit performance even when set to the High Performance profile. A 3DMark Fire Strike run on batteries returns Physics and Graphics scores of 13273 and 12738 points, respectively, compared to 24436 and 25440 points when on mains,
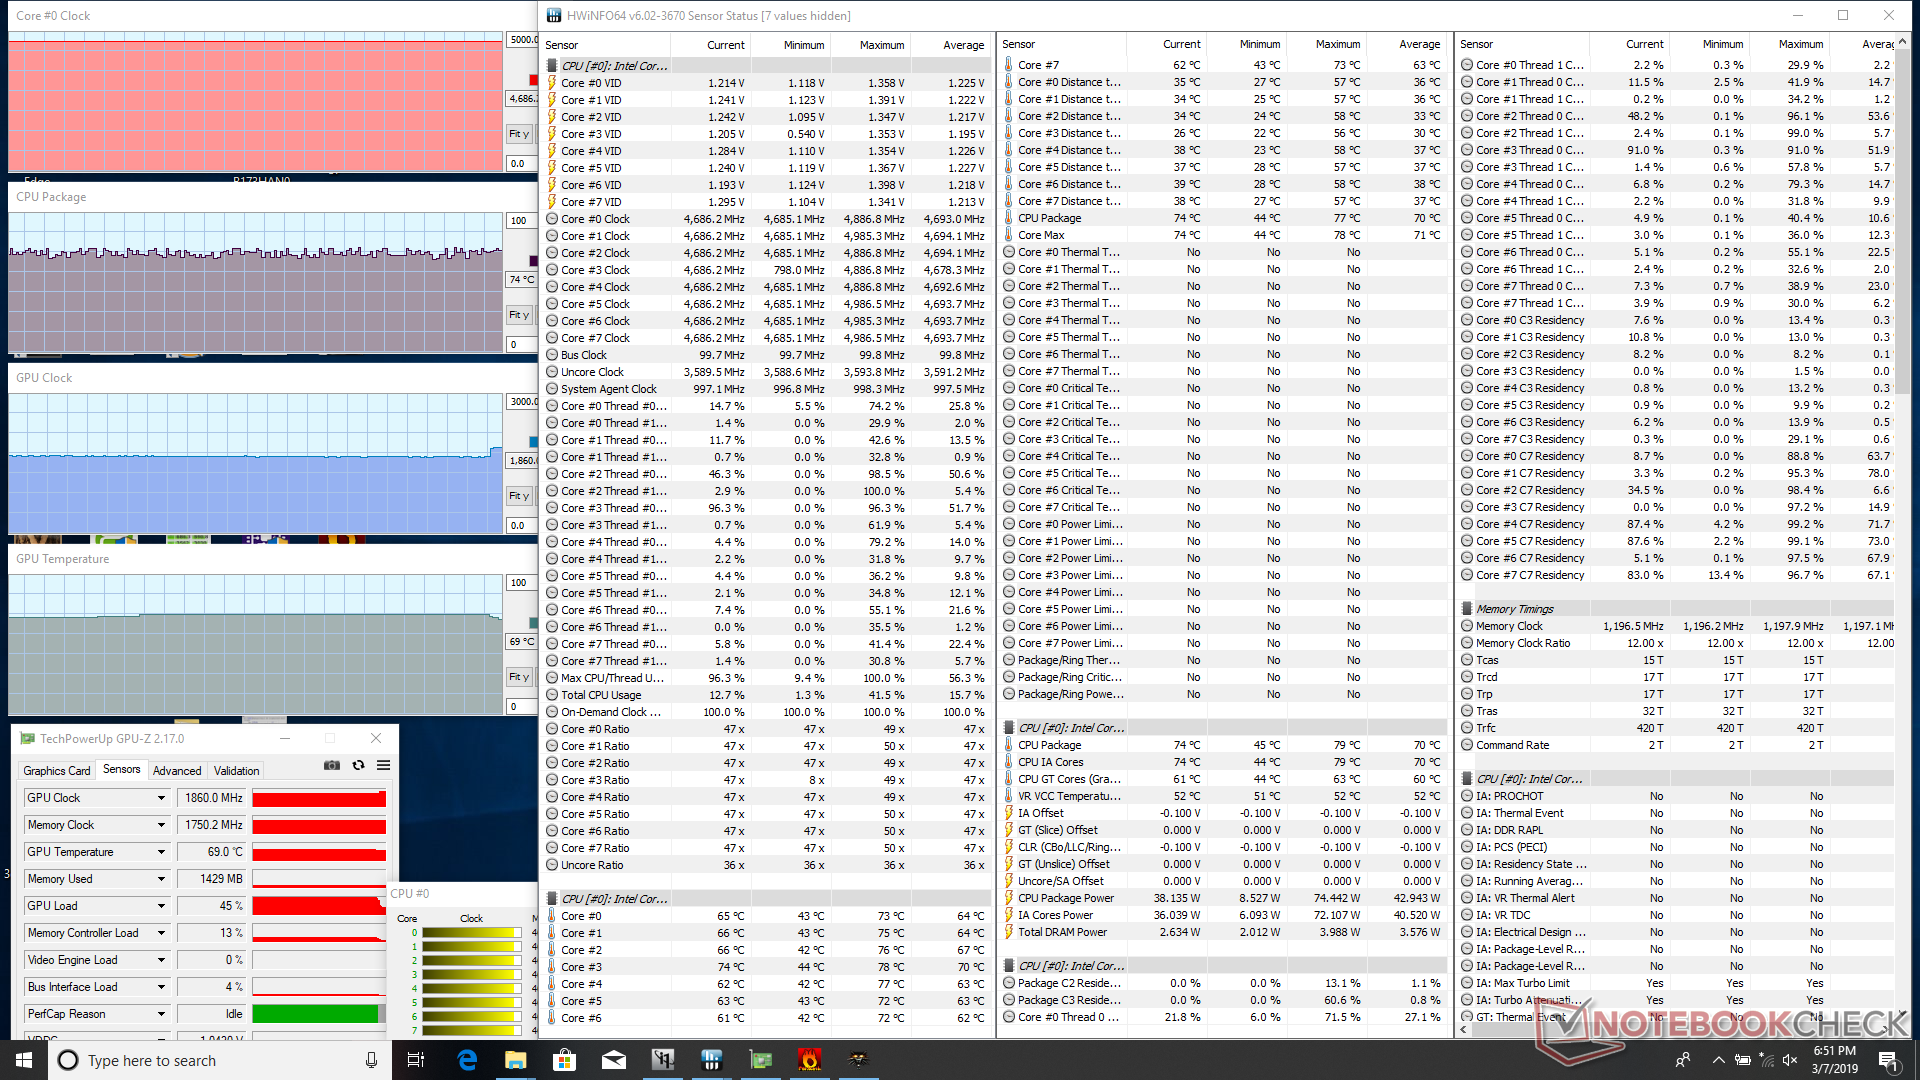
| CPU Clock (GHz) | GPU Clock (MHz) | Average CPU Temperature (°C) | Average GPU Temperature (°C) | |
| System Idle | -- | -- | 41 | 39 |
| Prime95 Stress | 4.6 | -- | 84 | -- |
| Prime95 + FurMark Stress | 4.5 | 1395 | 94 | 71 |
| Witcher 3 Stress | 4.7 | 1860 | 74 | 71 |
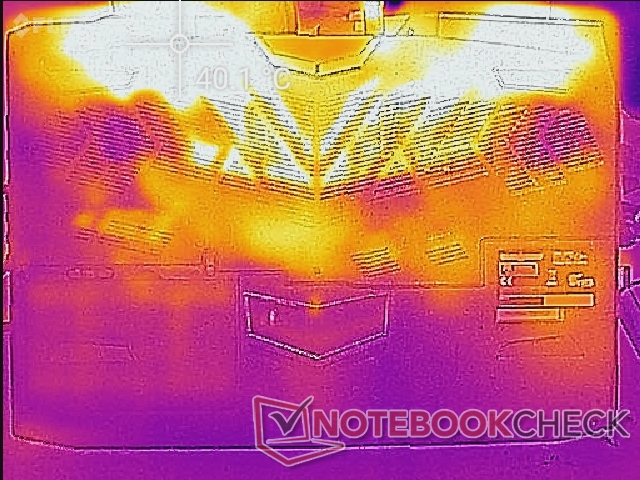
(+) The maximum temperature on the upper side is 39 °C / 102 F, compared to the average of 40.4 °C / 105 F, ranging from 21.2 to 68.8 °C for the class Gaming.
(+) The bottom heats up to a maximum of 33.8 °C / 93 F, compared to the average of 43.2 °C / 110 F
(+) In idle usage, the average temperature for the upper side is 27.7 °C / 82 F, compared to the device average of 33.9 °C / 93 F.
(+) Playing The Witcher 3, the average temperature for the upper side is 31.5 °C / 89 F, compared to the device average of 33.9 °C / 93 F.
(+) The palmrests and touchpad are cooler than skin temperature with a maximum of 25.4 °C / 77.7 F and are therefore cool to the touch.
(+) The average temperature of the palmrest area of similar devices was 28.8 °C / 83.8 F (+3.4 °C / 6.1 F).
Speakers

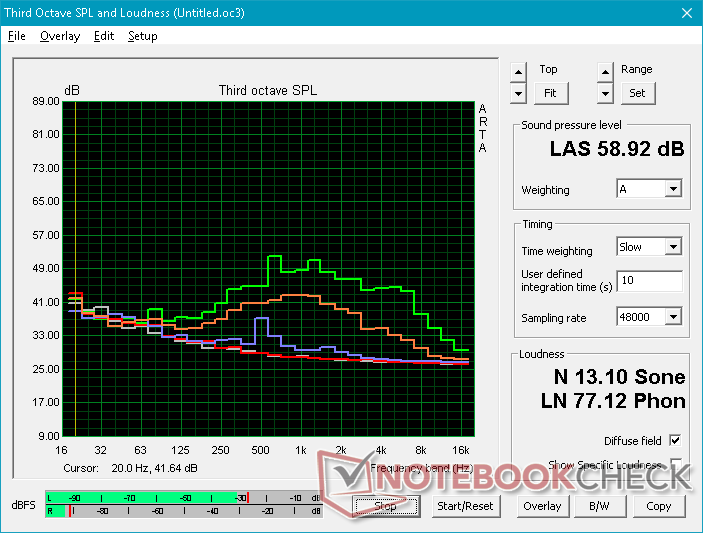
Eurocom Sky X7C i9-9900K audio analysis
(±) | speaker loudness is average but good (75.9 dB)
Bass 100 - 315 Hz
(±) | reduced bass - on average 11.4% lower than median
(-) | bass is not linear (15.1% delta to prev. frequency)
Mids 400 - 2000 Hz
(±) | higher mids - on average 7.9% higher than median
(+) | mids are linear (6.5% delta to prev. frequency)
Highs 2 - 16 kHz
(±) | reduced highs - on average 5.8% lower than median
(±) | linearity of highs is average (9.9% delta to prev. frequency)
Overall 100 - 16.000 Hz
(-) | overall sound is not linear (30.6% difference to median)
Compared to same class
» 96% of all tested devices in this class were better, 2% similar, 2% worse
» The best had a delta of 6%, average was 18%, worst was 132%
Compared to all devices tested
» 89% of all tested devices were better, 3% similar, 8% worse
» The best had a delta of 4%, average was 23%, worst was 134%
Apple MacBook 12 (Early 2016) 1.1 GHz audio analysis
(+) | speakers can play relatively loud (83.6 dB)
Bass 100 - 315 Hz
(±) | reduced bass - on average 11.3% lower than median
(±) | linearity of bass is average (14.2% delta to prev. frequency)
Mids 400 - 2000 Hz
(+) | balanced mids - only 2.4% away from median
(+) | mids are linear (5.5% delta to prev. frequency)
Highs 2 - 16 kHz
(+) | balanced highs - only 2% away from median
(+) | highs are linear (4.5% delta to prev. frequency)
Overall 100 - 16.000 Hz
(+) | overall sound is linear (10.2% difference to median)
Compared to same class
» 7% of all tested devices in this class were better, 2% similar, 90% worse
» The best had a delta of 5%, average was 18%, worst was 53%
Compared to all devices tested
» 5% of all tested devices were better, 1% similar, 94% worse
» The best had a delta of 4%, average was 23%, worst was 134%
Energy Management
Power Consumption
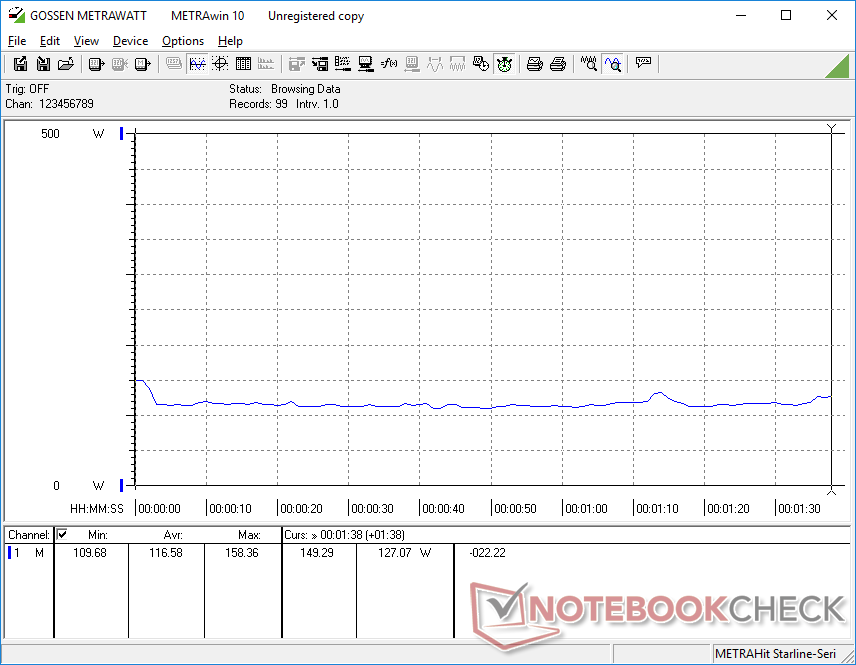
The system demands a lot of power. Simply idling on desktop will draw 46 W to be even more demanding than most ULV Ultrabooks when subjected to high processing loads. More traditional gaming laptops with mobile components, like the MSI GE75, are much more energy efficient at just 16 W to 25 W.
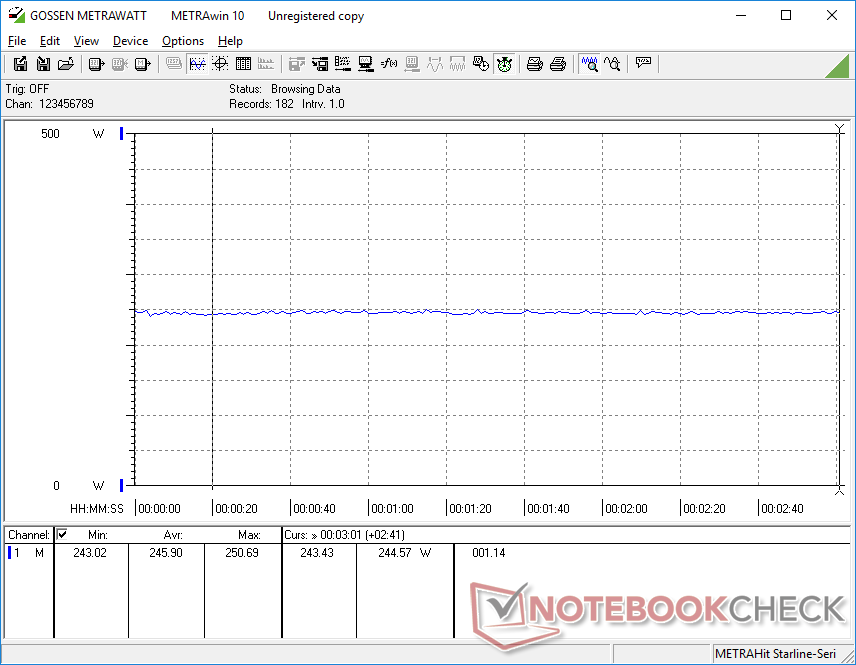
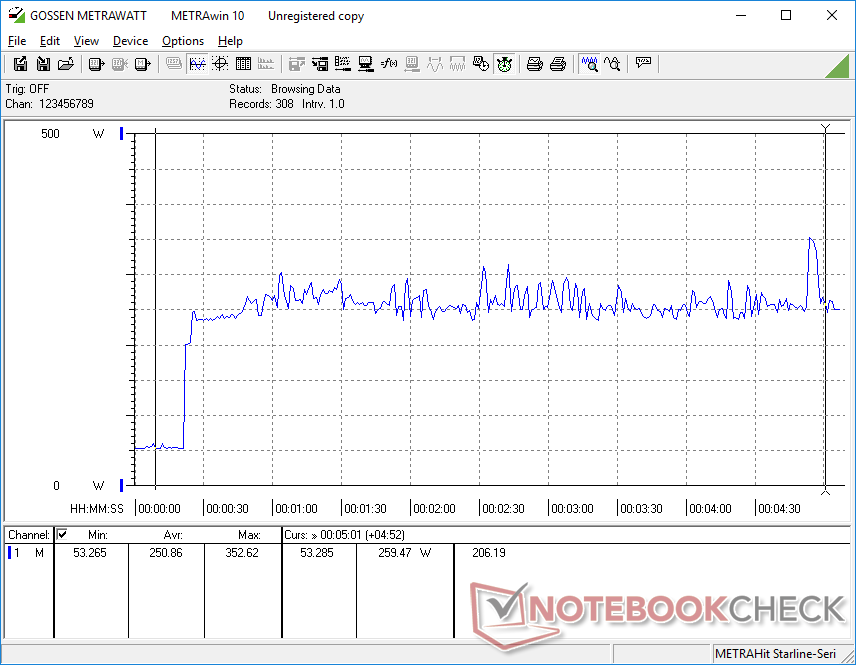
Power consumption is steady at 246 W when running Witcher 3. This is especially noteworthy because the Asus Zephyrus S GX701GX with the Core i7-8750H and RTX 2080 Max-Q consumes just 167 W under the same conditions. In other words, the Sky X7C consumes 47 percent more power for only about 15 percent faster GPU performance and 60 percent faster CPU performance.
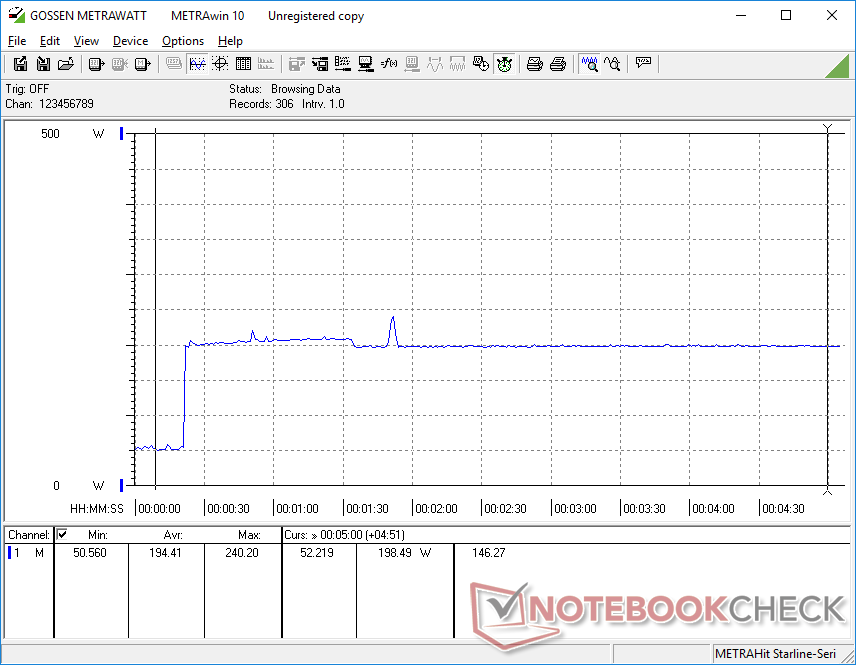
We're able to record a maximum draw of 353 W when running both Prime95 and FurMark simultaneously. Eurocom utilizes a special 780 W AC adapter requiring its own set of internal fans. While bulky with thick cables, it's at least less cumbersome than the 2x AC adapters required to run the Dell Alienware Area-51m or Asus ROG GZ700.
| Off / Standby | |
| Idle | |
| Load |
|
Key:
min: | |
| Eurocom Sky X7C i9-9900K i9-9900K, GeForce RTX 2080 Mobile, 2x Samsung SSD 970 Pro 512GB (RAID 0), IPS, 1920x1080, 17.3" | Asus ROG G703GX i7-8750H, GeForce RTX 2080 Mobile, Samsung SSD PM981 MZVLB512HAJQ, IPS, 1920x1080, 17.3" | MSI GT75 8RG-090 Titan i9-8950HK, GeForce GTX 1080 Mobile, 2x Samsung PM961 MZVLW256HEHP (RAID 0), TN, 1920x1080, 17.3" | Acer Predator 17 G9-793-70PJ i7-7700HQ, GeForce GTX 1070 Mobile, Toshiba NVMe THNSN5512GPU7, IPS, 3840x2160, 17.3" | MSI GE75 8SF i7-8750H, GeForce RTX 2070 Mobile, Kingston RBUSNS8154P3256GJ1, IPS, 1920x1080, 17.3" | Asus Zephyrus S GX701GX i7-8750H, GeForce RTX 2080 Max-Q, Samsung SSD PM981 MZVLB1T0HALR, IPS, 1920x1080, 17.3" | |
|---|---|---|---|---|---|---|
| Power Consumption | 23% | 3% | 27% | 38% | 37% | |
| Idle Minimum * (Watt) | 41.3 | 5 88% | 31 25% | 23 44% | 16.4 60% | 19 54% |
| Idle Average * (Watt) | 41.8 | 24 43% | 35 16% | 33 21% | 21.9 48% | 22 47% |
| Idle Maximum * (Watt) | 46.1 | 42 9% | 45 2% | 40 13% | 25.4 45% | 30 35% |
| Load Average * (Watt) | 116.6 | 112 4% | 130 -11% | 94 19% | 90.7 22% | 104 11% |
| Witcher 3 ultra * (Watt) | 245.9 | 284 -15% | 268 -9% | 177 28% | 203.3 17% | 167 32% |
| Load Maximum * (Watt) | 352.6 | 320 9% | 374 -6% | 228 35% | 222.9 37% | 203 42% |
* ... smaller is better
Battery Life
Unsurprisingly, battery life is not very long. We recorded a runtime of only 2 hours or roughly 20 minutes shorter than our last Sky X7C with GTX 1080 graphics. Since our test unit comes with G-Sync, there is no Optimus to boost battery life.
Charging from empty to full capacity takes about 2 hours.
| Eurocom Sky X7C i9-9900K i9-9900K, GeForce RTX 2080 Mobile, 82 Wh | Alienware 17 R5 i7-8750H, GeForce GTX 1070 Mobile, 99 Wh | Asus ROG G703GX i7-8750H, GeForce RTX 2080 Mobile, 96 Wh | MSI GT75 8RG-090 Titan i9-8950HK, GeForce GTX 1080 Mobile, 75 Wh | Lenovo Legion Y740-17ICH i7-8750H, GeForce RTX 2080 Max-Q, 76 Wh | Eurocom Sky X7C i7-8086K, GeForce GTX 1080 Mobile, 82 Wh | |
|---|---|---|---|---|---|---|
| Battery runtime | 80% | 100% | 60% | 20% | ||
| WiFi v1.3 (h) | 2 | 3.6 80% | 4 100% | 3.2 60% | 2.4 20% | |
| Reader / Idle (h) | 4.5 | 5 | 3.8 | |||
| Load (h) | 1.1 | 1.3 | 1.1 |
Pros
Cons
Verdict
The performance gap between a GeForce RTX 2080 and GeForce RTX 2080 Max-Q appears to be slimmer this generation when compared to the last. Opting for the Eurocom Sky X7C RTX 2080 will bring just a 15 to 20 percent boost in GPU performance over a much slimmer, lighter, cheaper, longer-lasting, and more power-efficient RTX 2080 Max-Q alternative.
The biggest reasons to own a Sky X7C are not for its graphics performance or display, but for its CPU performance and upgradeability. The Core i9-9900K is faster than the Core i7-8750H by 60 percent to be a better justification for the significant increase in chassis size, fan noise, and power consumption. If you rely on CPU-intensive tasks instead of the usual GPU-bound games, then the Sky X7C should do the trick.
Users who know they will take full advantage of the desktop Core i9 CPU will get the most out of the Eurocom Sky X7C. Otherwise, the minimal boost in graphics performance over a soldered RTX 2080 or RTX 2080 Max-Q is too small to justify the very large chassis, high power consumption, and bulky AC adapter.
Eurocom Sky X7C i9-9900K
- 03/11/2019 v6 (old)
Allen Ngo
Price comparison
