Eurocom Nightsky Ti15 (Clevo PB51RF) Laptop Review
The Nightsky series is Eurocom's latest family of narrow bezels laptops for enthusiast gamers. It currently consists of the 15.6-inch Nightsky RX15 and 17.3-inch Nightsky RX17 which we had checked out earlier last month. Both models share a similar design language and so we recommend checking out our Nightsky RX17 review page to learn more about the chassis, keyboard, and other physical features.
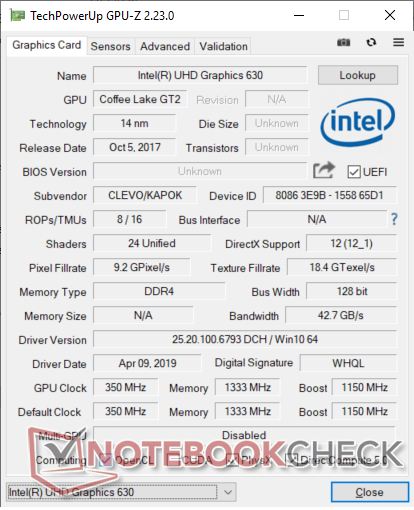
The Nightsky Ti15/RX15 can be configured with either a Core i7-9750H or unlocked Core i9-9980HK CPU, GeForce GTX 1660 Ti or GeForce RTX 2070 GPU, and a 144/240 Hz 1080p IPS or 60 Hz 4K UHD OLED display. Our test unit today is the lower Ti15 configuration with GeForce 1660 Ti graphics, i7-9750H CPU, and 144 Hz panel retailing for about 2200 USD or less depending on the storage selection. The Nightsky Ti 15 is otherwise visually identical to the Nightsky RX15.
Direct competitors to the Eurocom Nightsky TI15/RX15 include other 15.6-inch mid-range to higher-end gaming laptops like the Asus Zephyrus M GM501, Asus ROG Strix Scar G531, MSI GE63, Razer Blade 15, Aorus 15, or the Dell Alienware m15 series.
More Eurocom reviews:
Case
Chassis quality is so much better than the super-thin Eurocom Q6 or Q8. Surfaces do not creak or bend as easily and they actually feel thicker and more robust. In other words, it doesn't feel like Clevo made as many sacrifices just to create a thinner or lighter design. The lid in particular does not feel any weaker or stronger than the lids of the larger Eurocom Sky X4C or Tornado F5 for a strong first impression. Overall quality is superior to the MSI GP65 and on par with the Asus ROG Strix III G531.
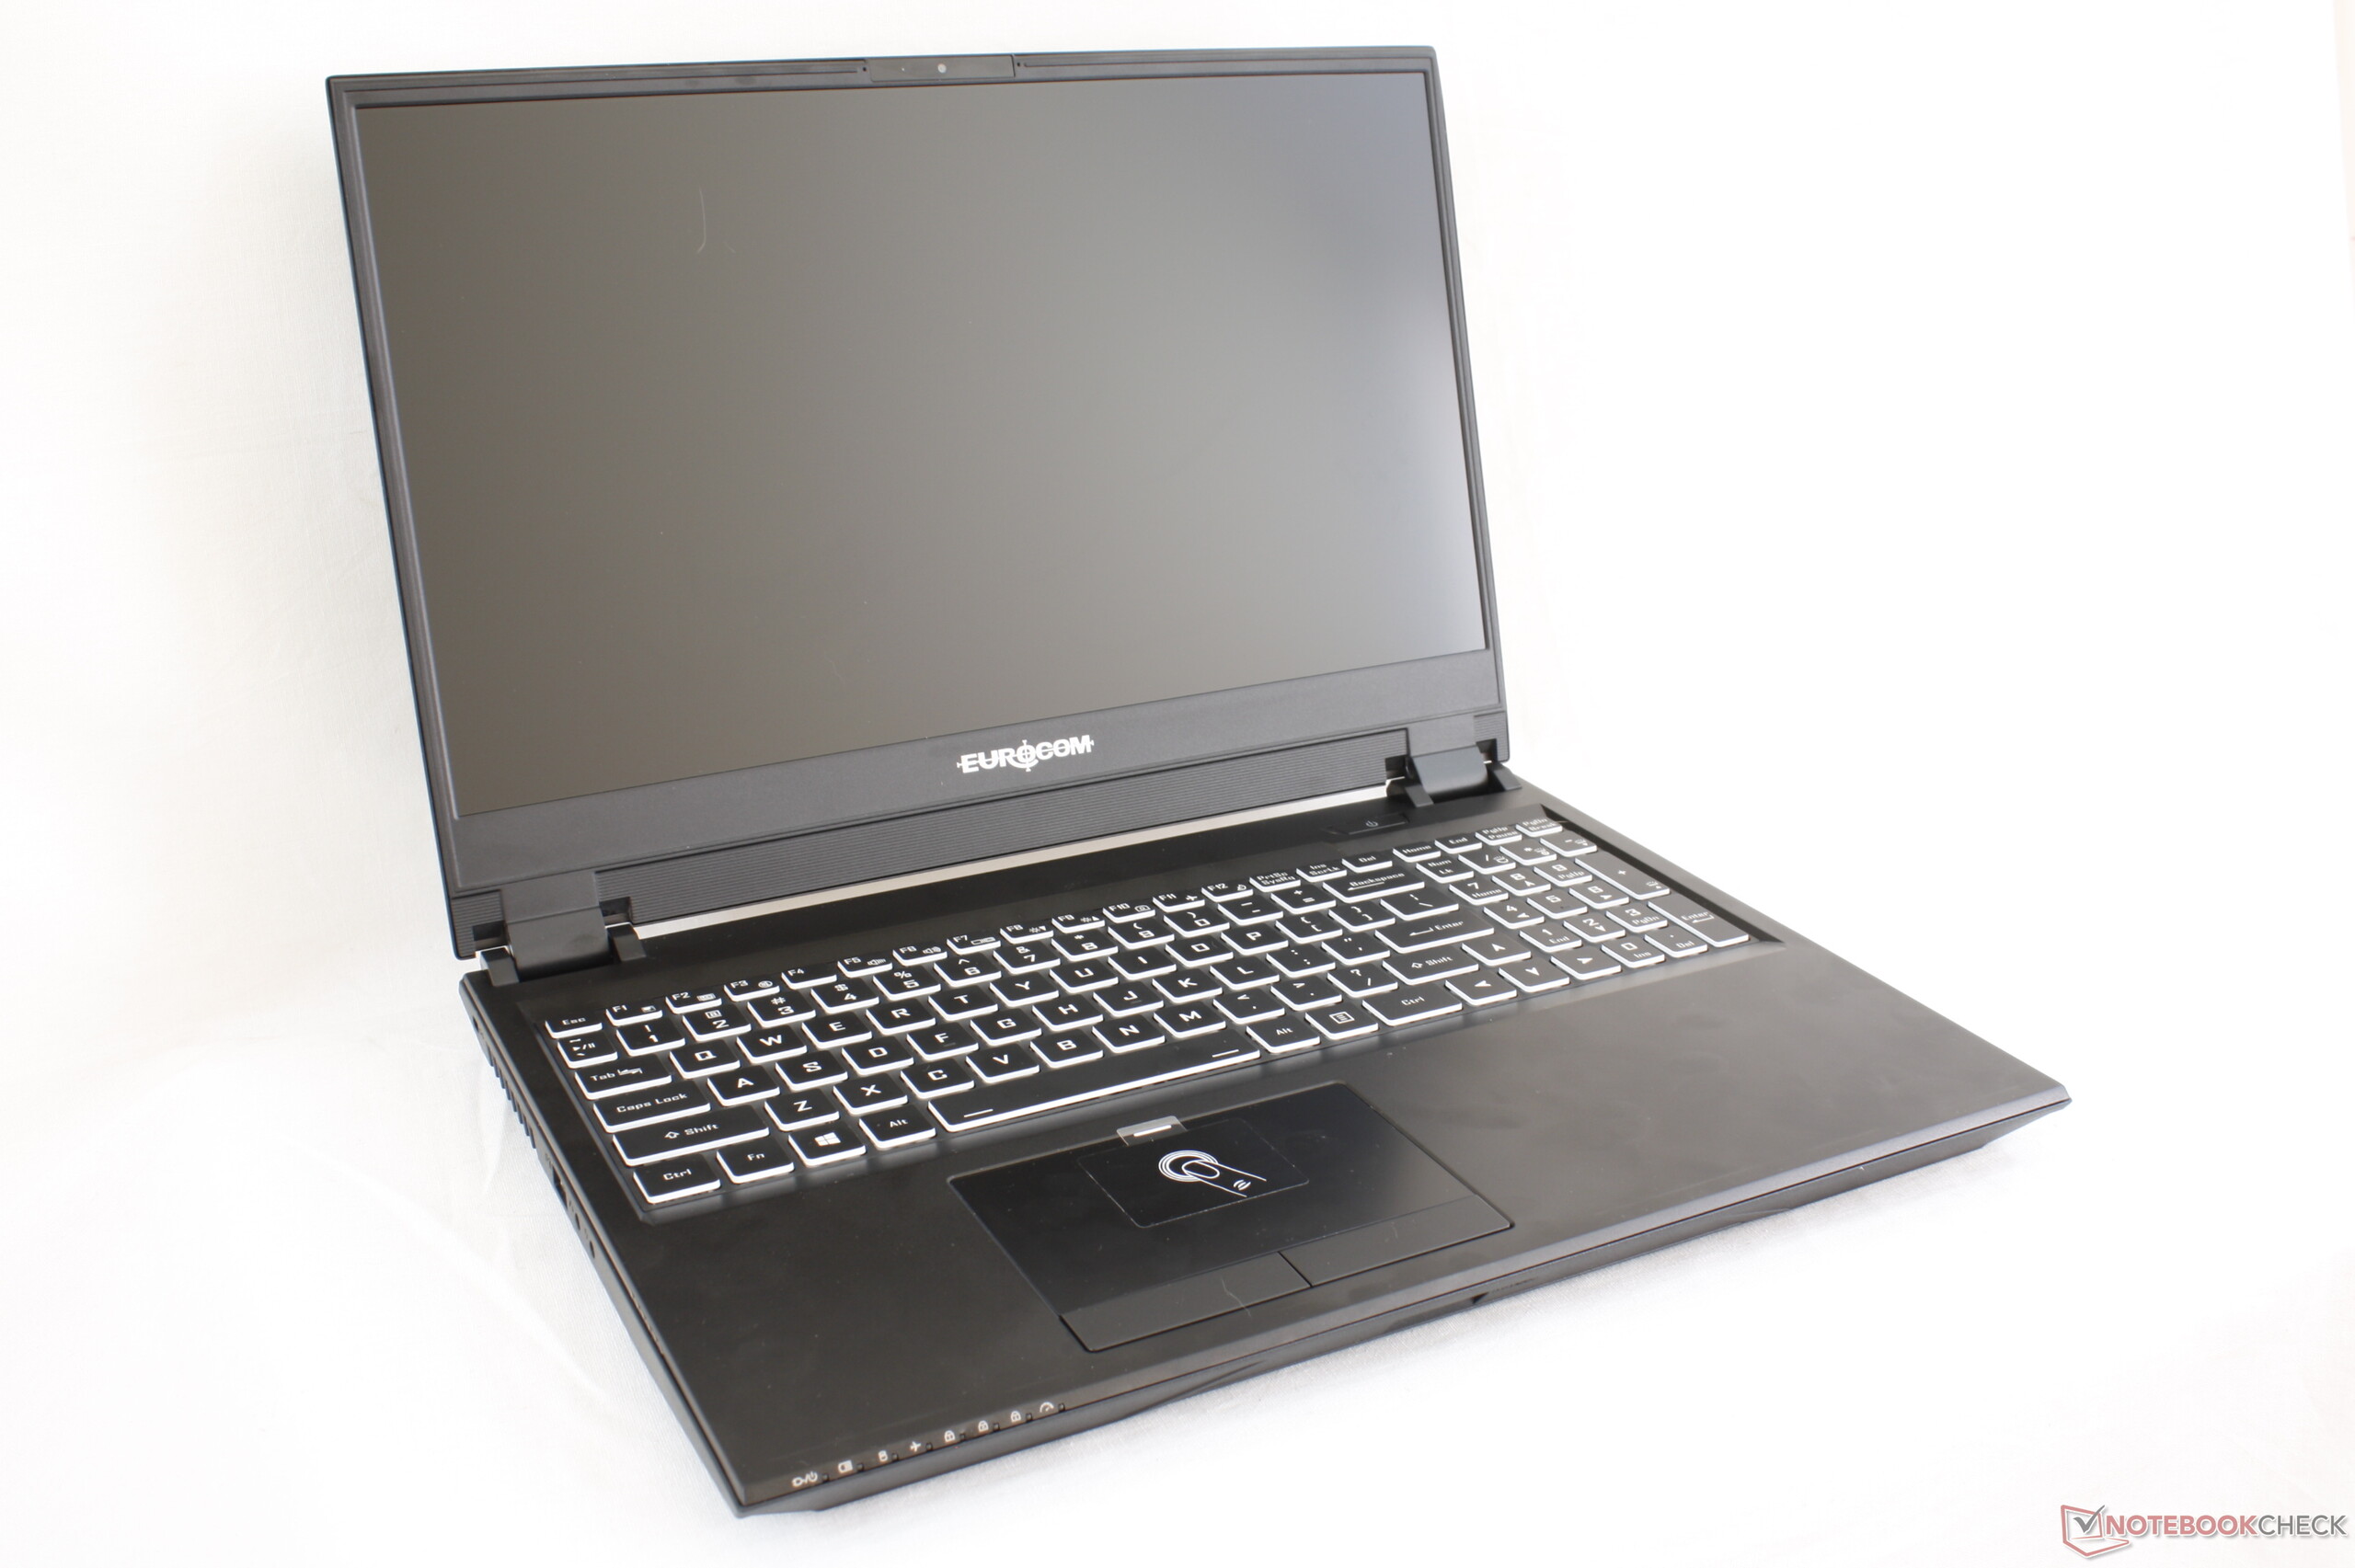
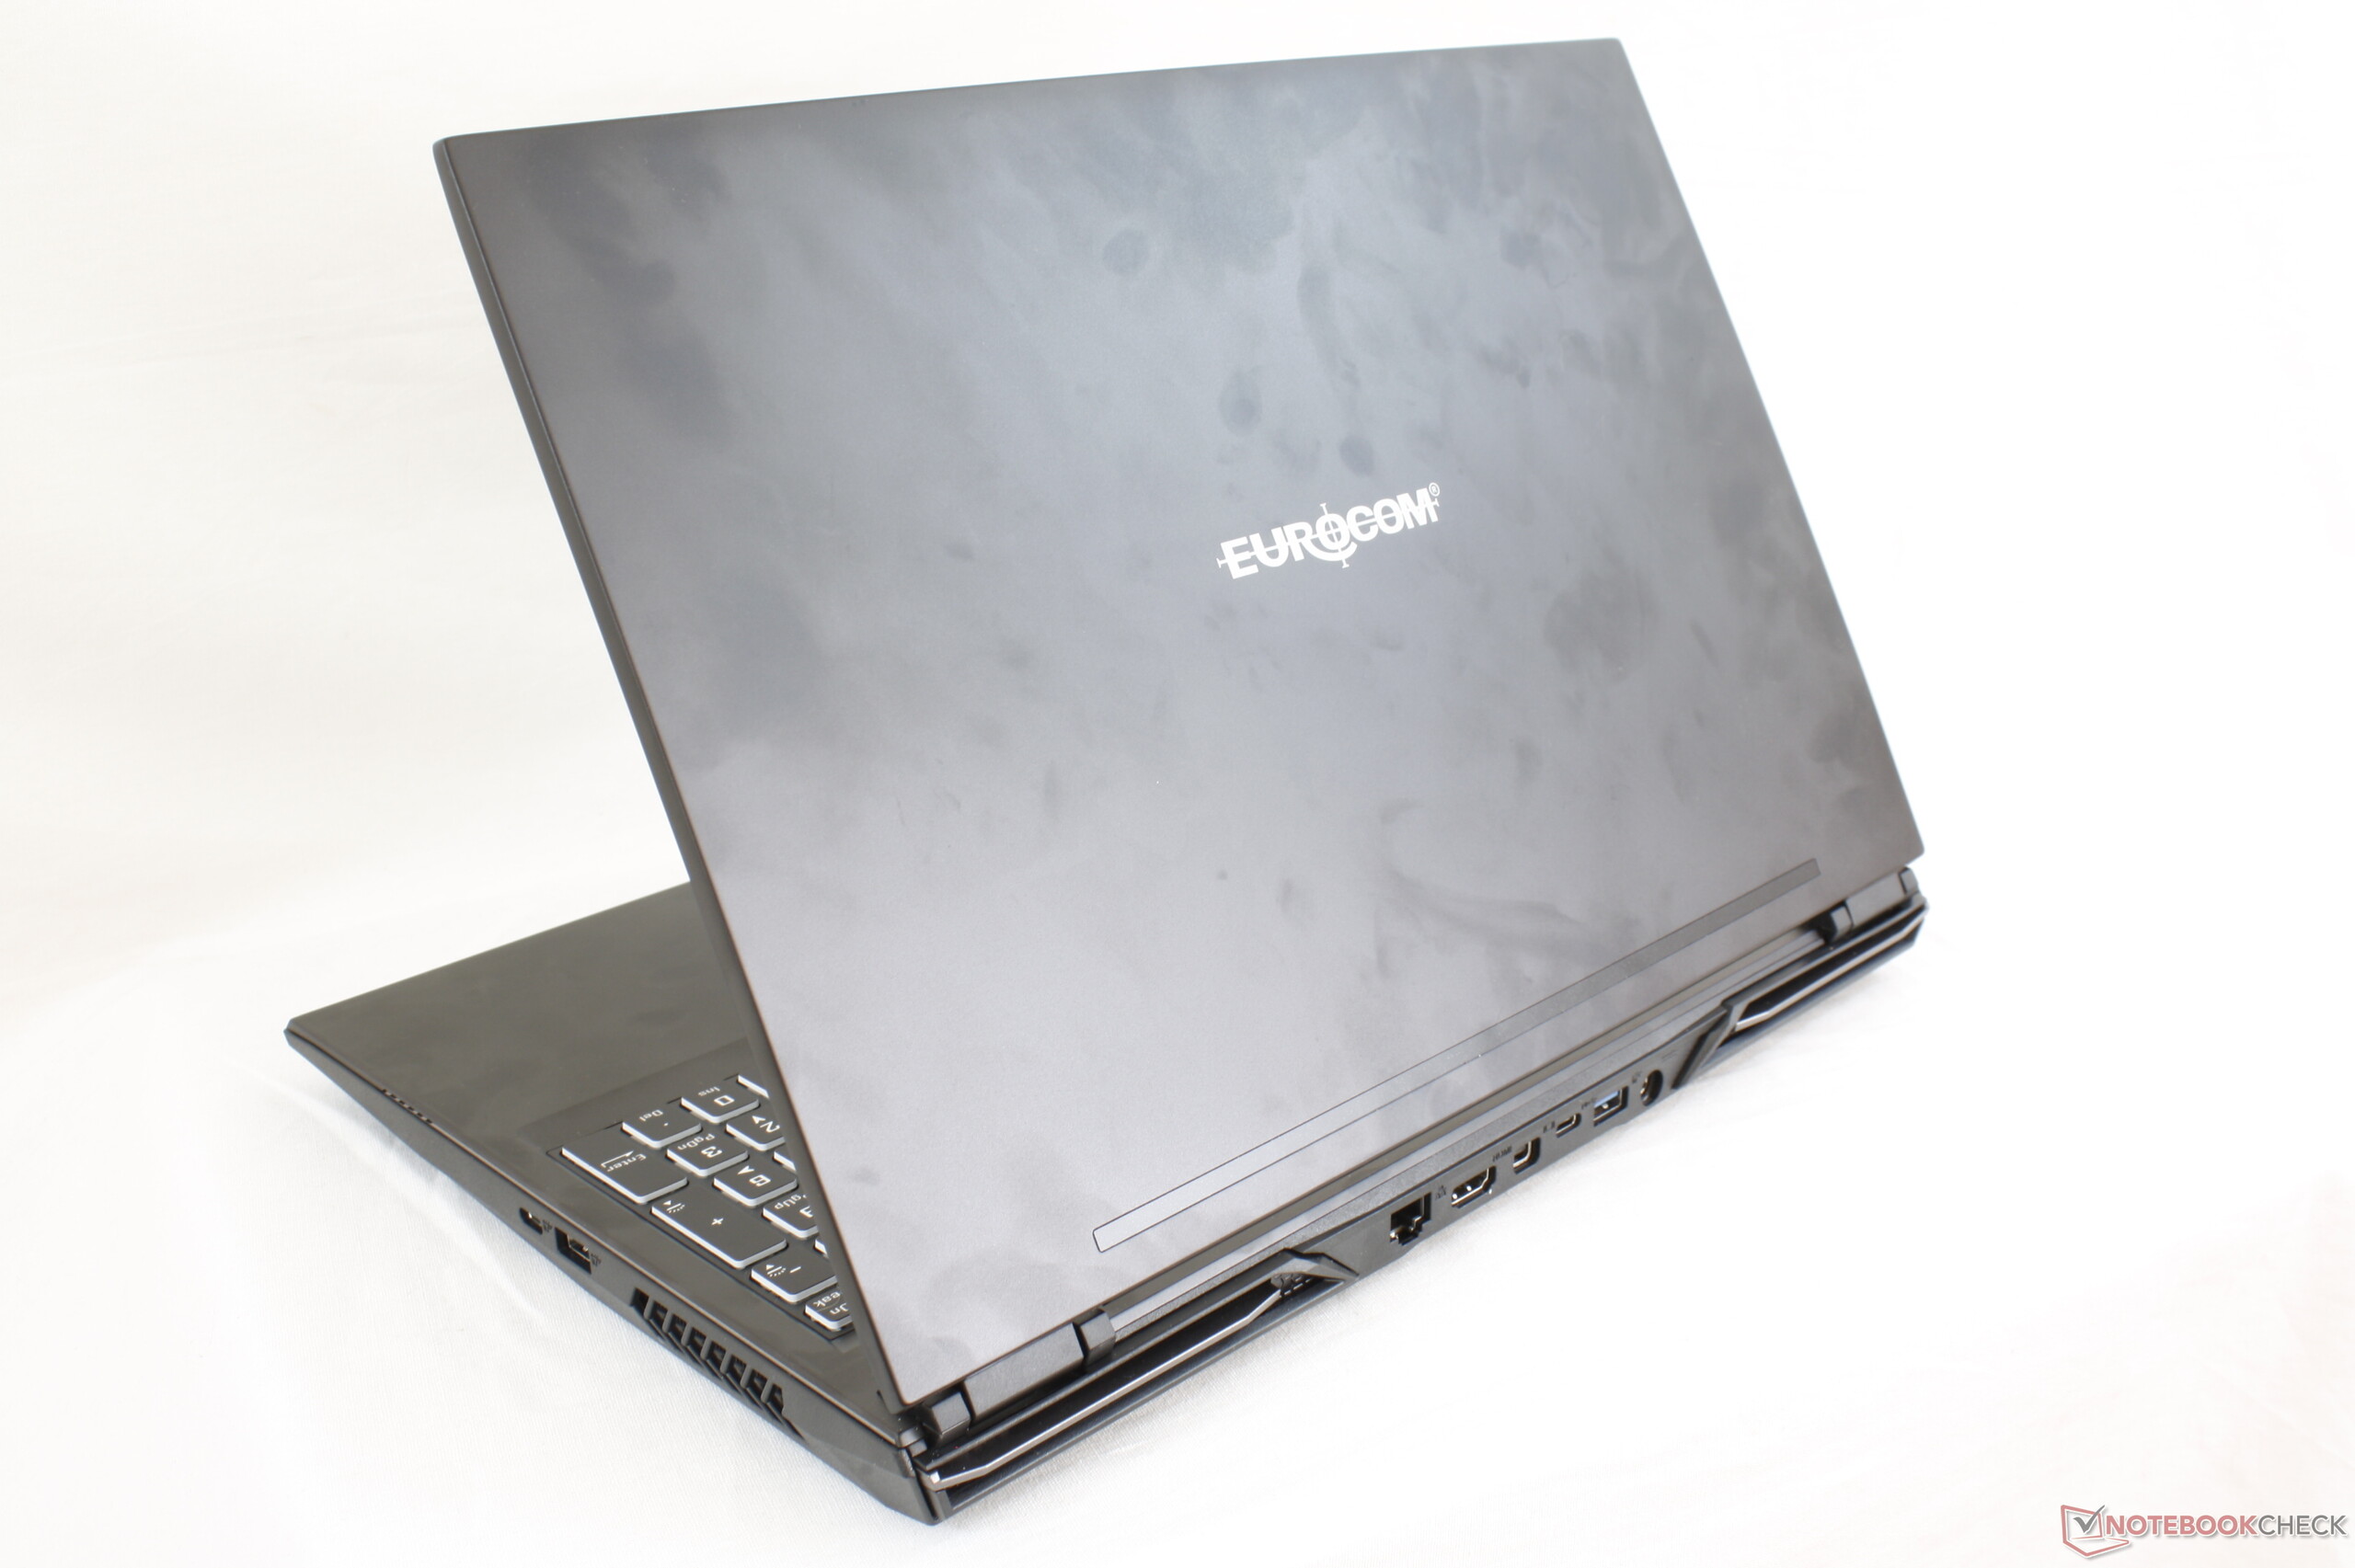
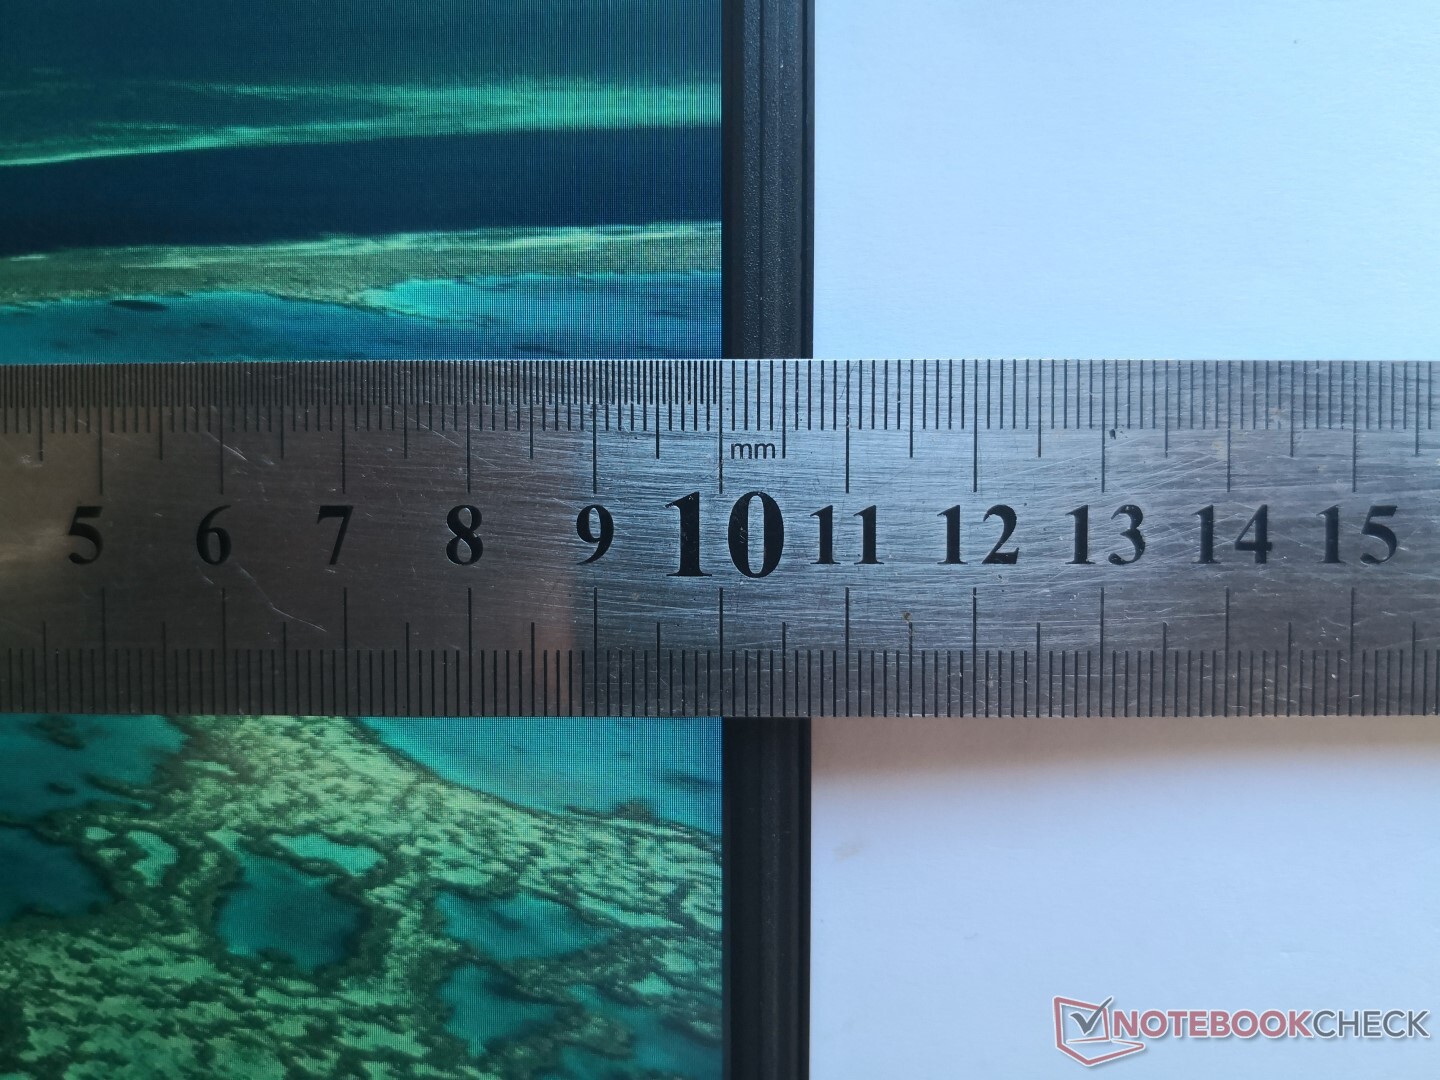
In terms of size and weight, the Eurocom is very nearly the same as the HP Pavilion Gaming 15 but much thicker (29.9 mm vs. 23.4 mm) and slightly heavier (2.5 kg vs. 2.4 kg). The narrow bezels make this one of the smallest and most compact 15-inch gaming laptops from Clevo thus far.
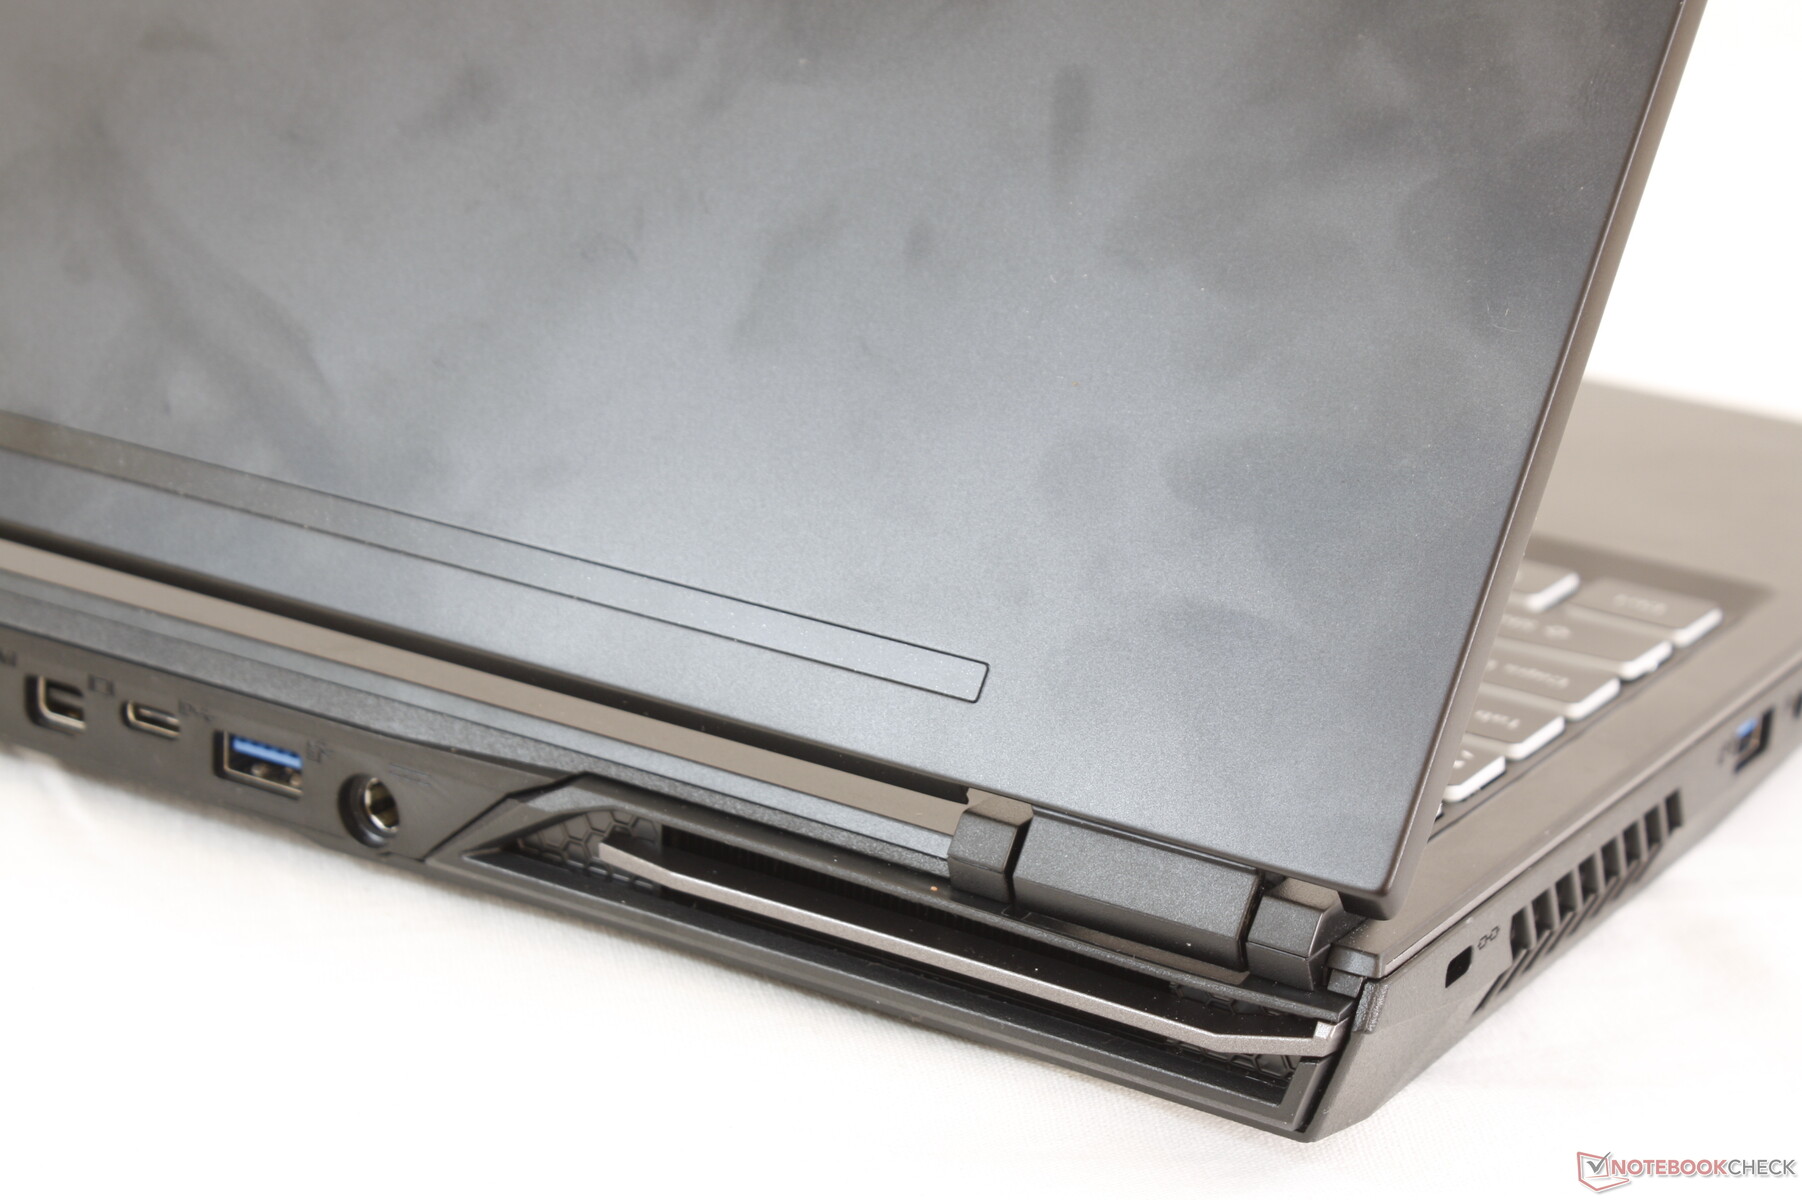
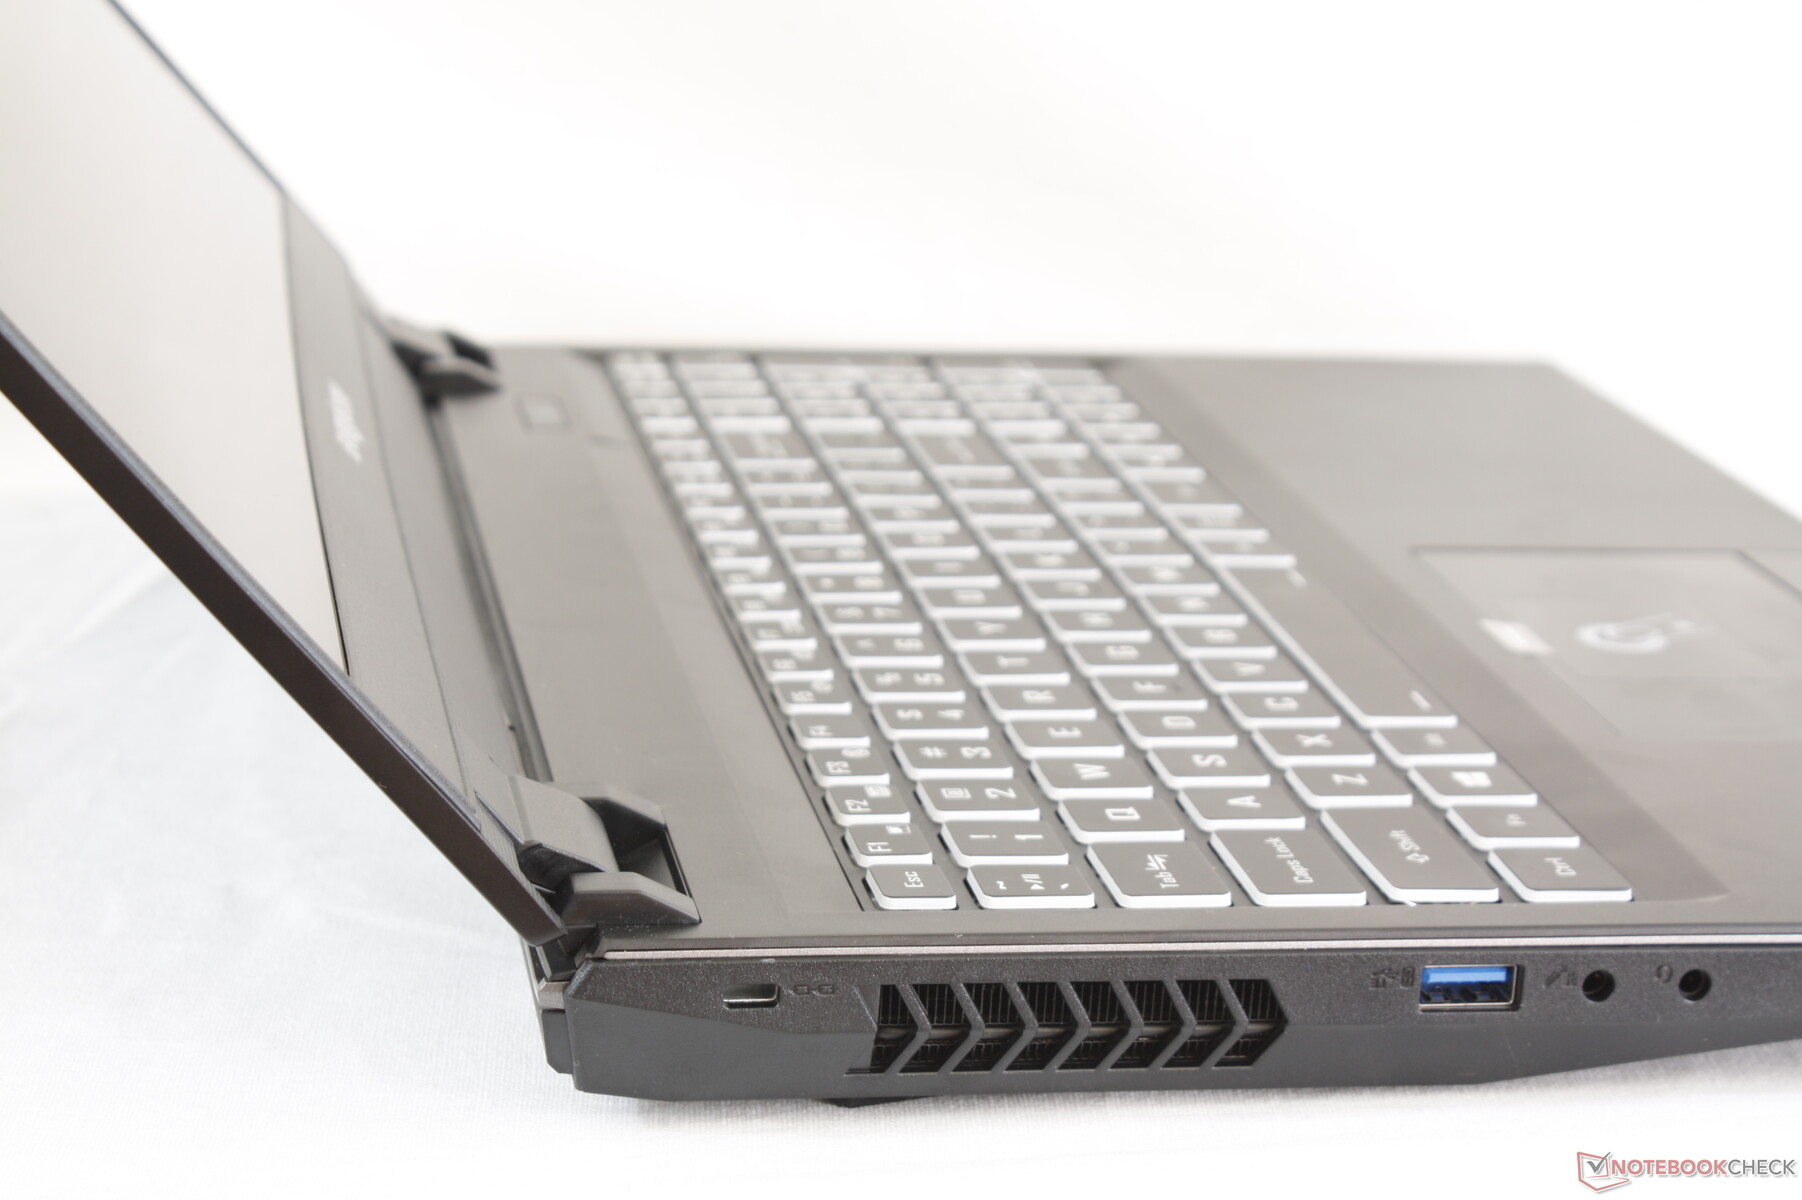
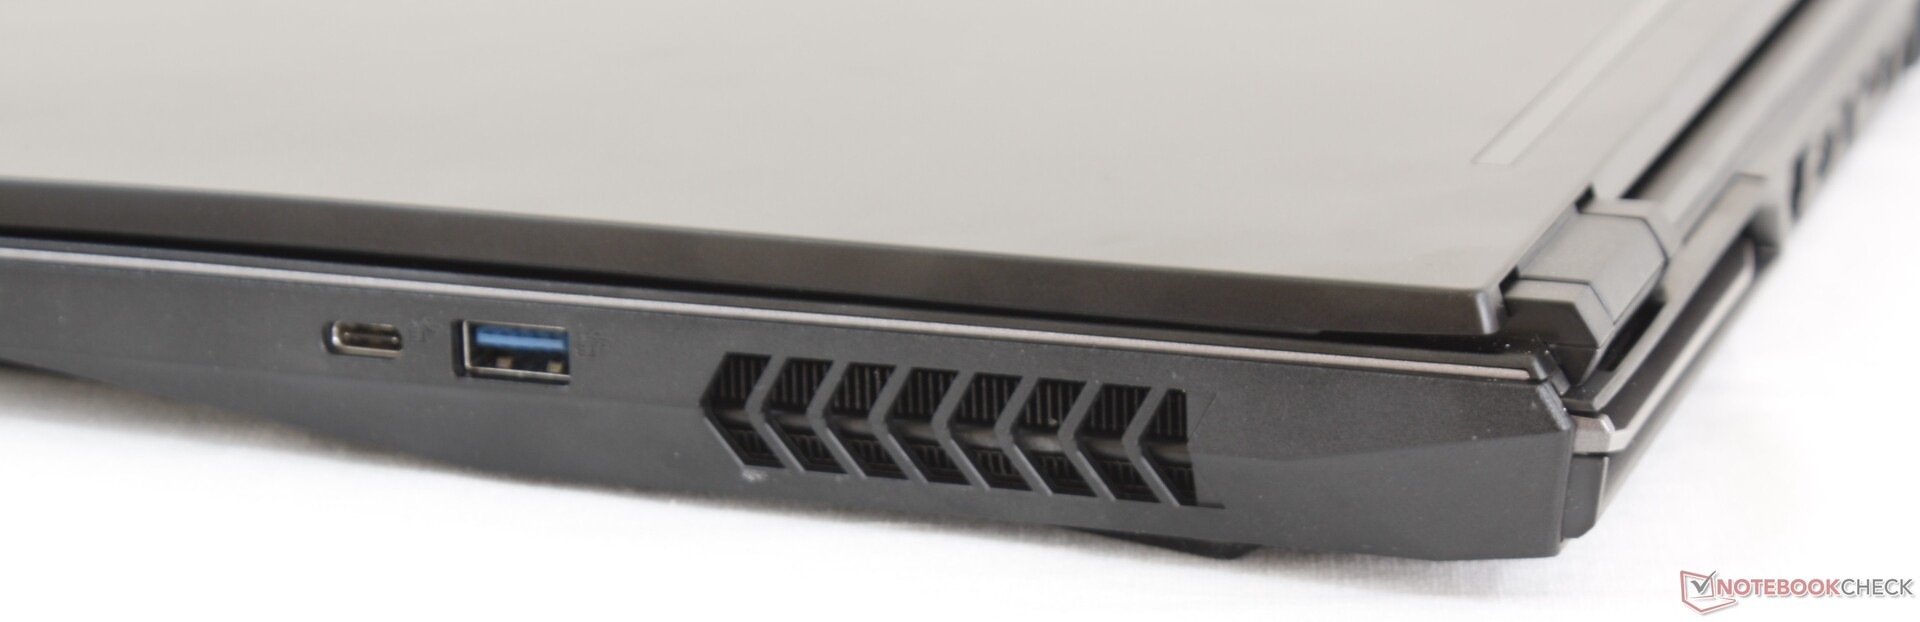
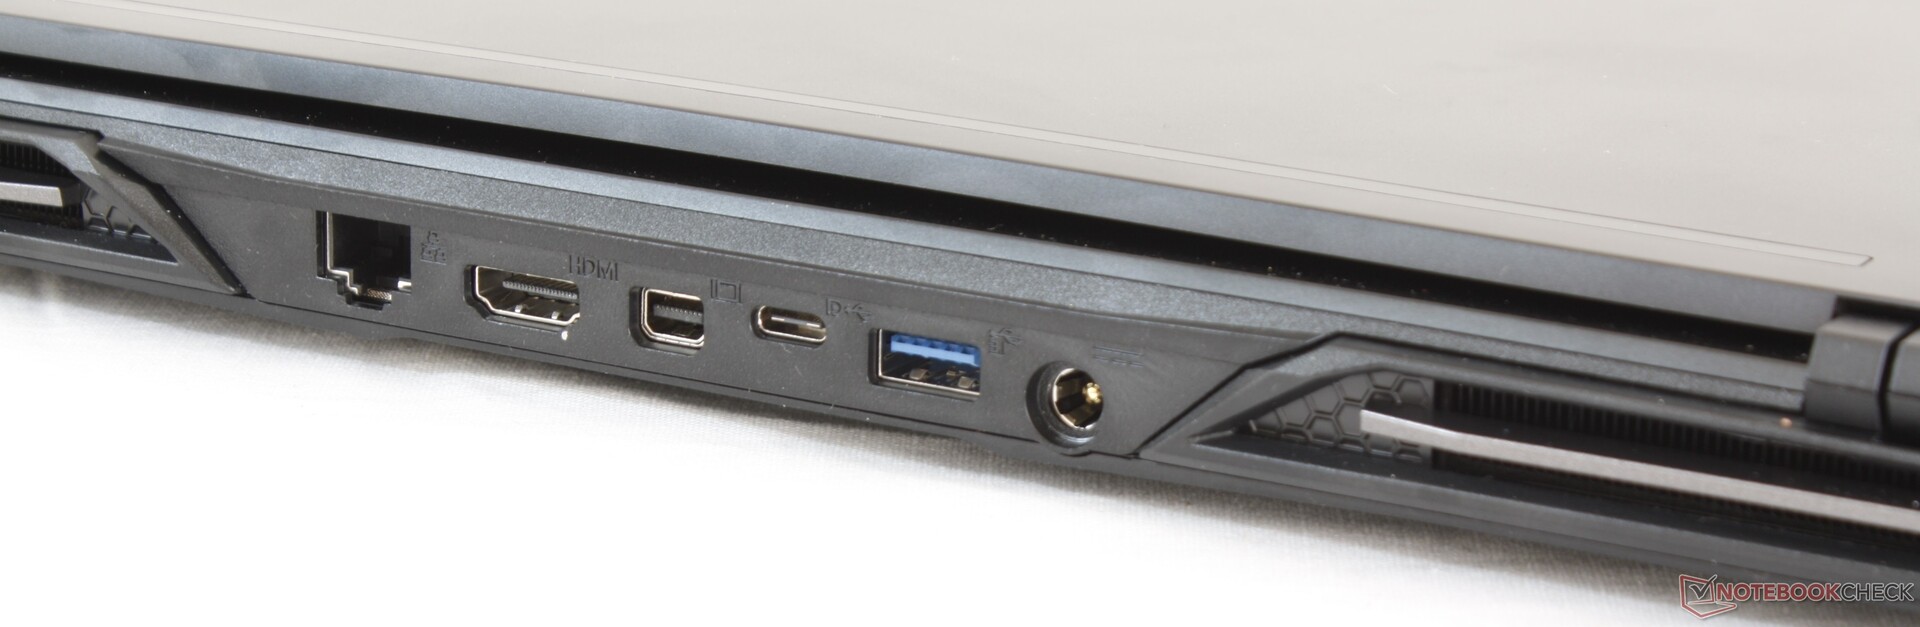
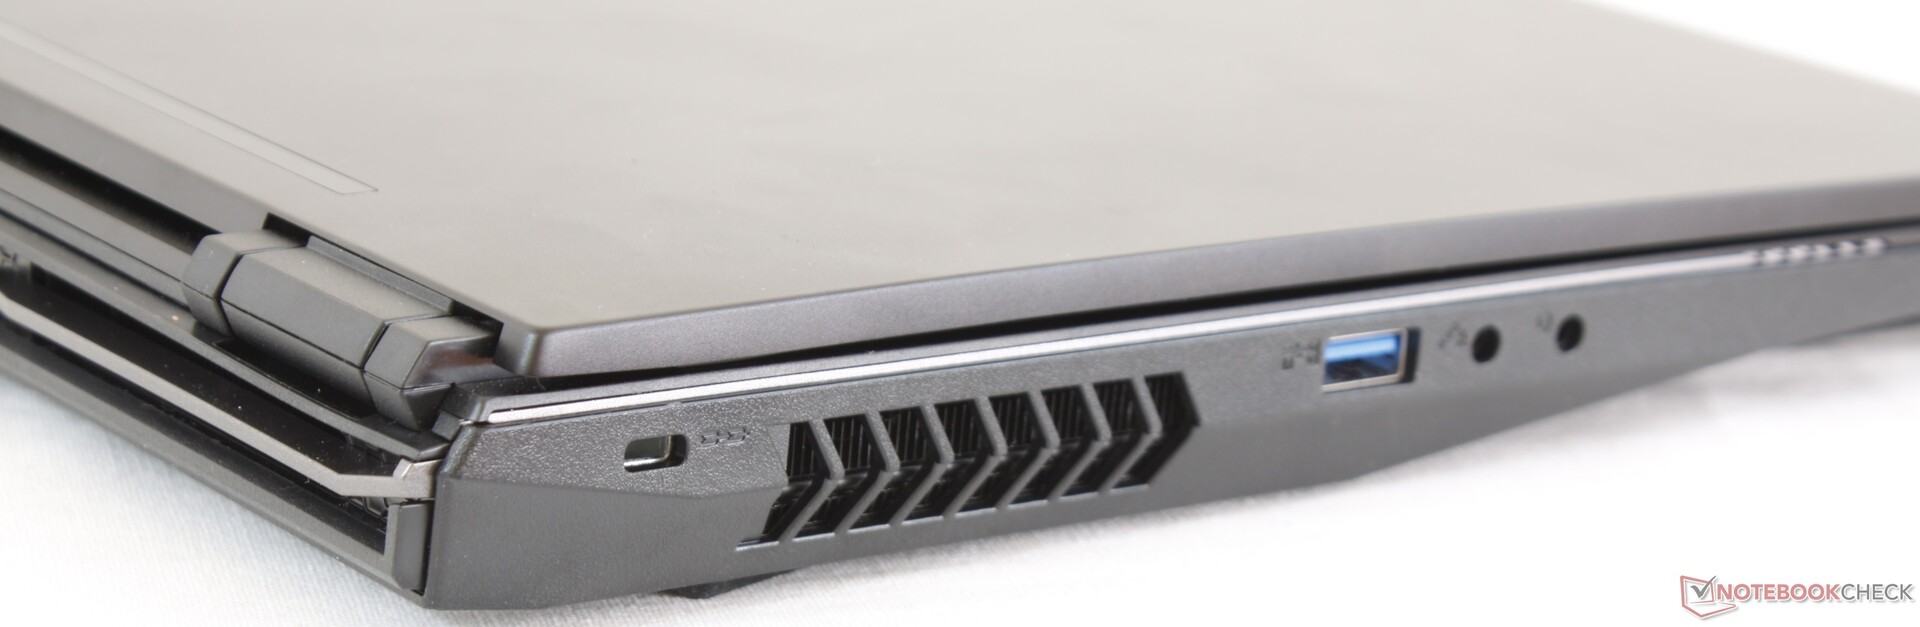
Connectivity
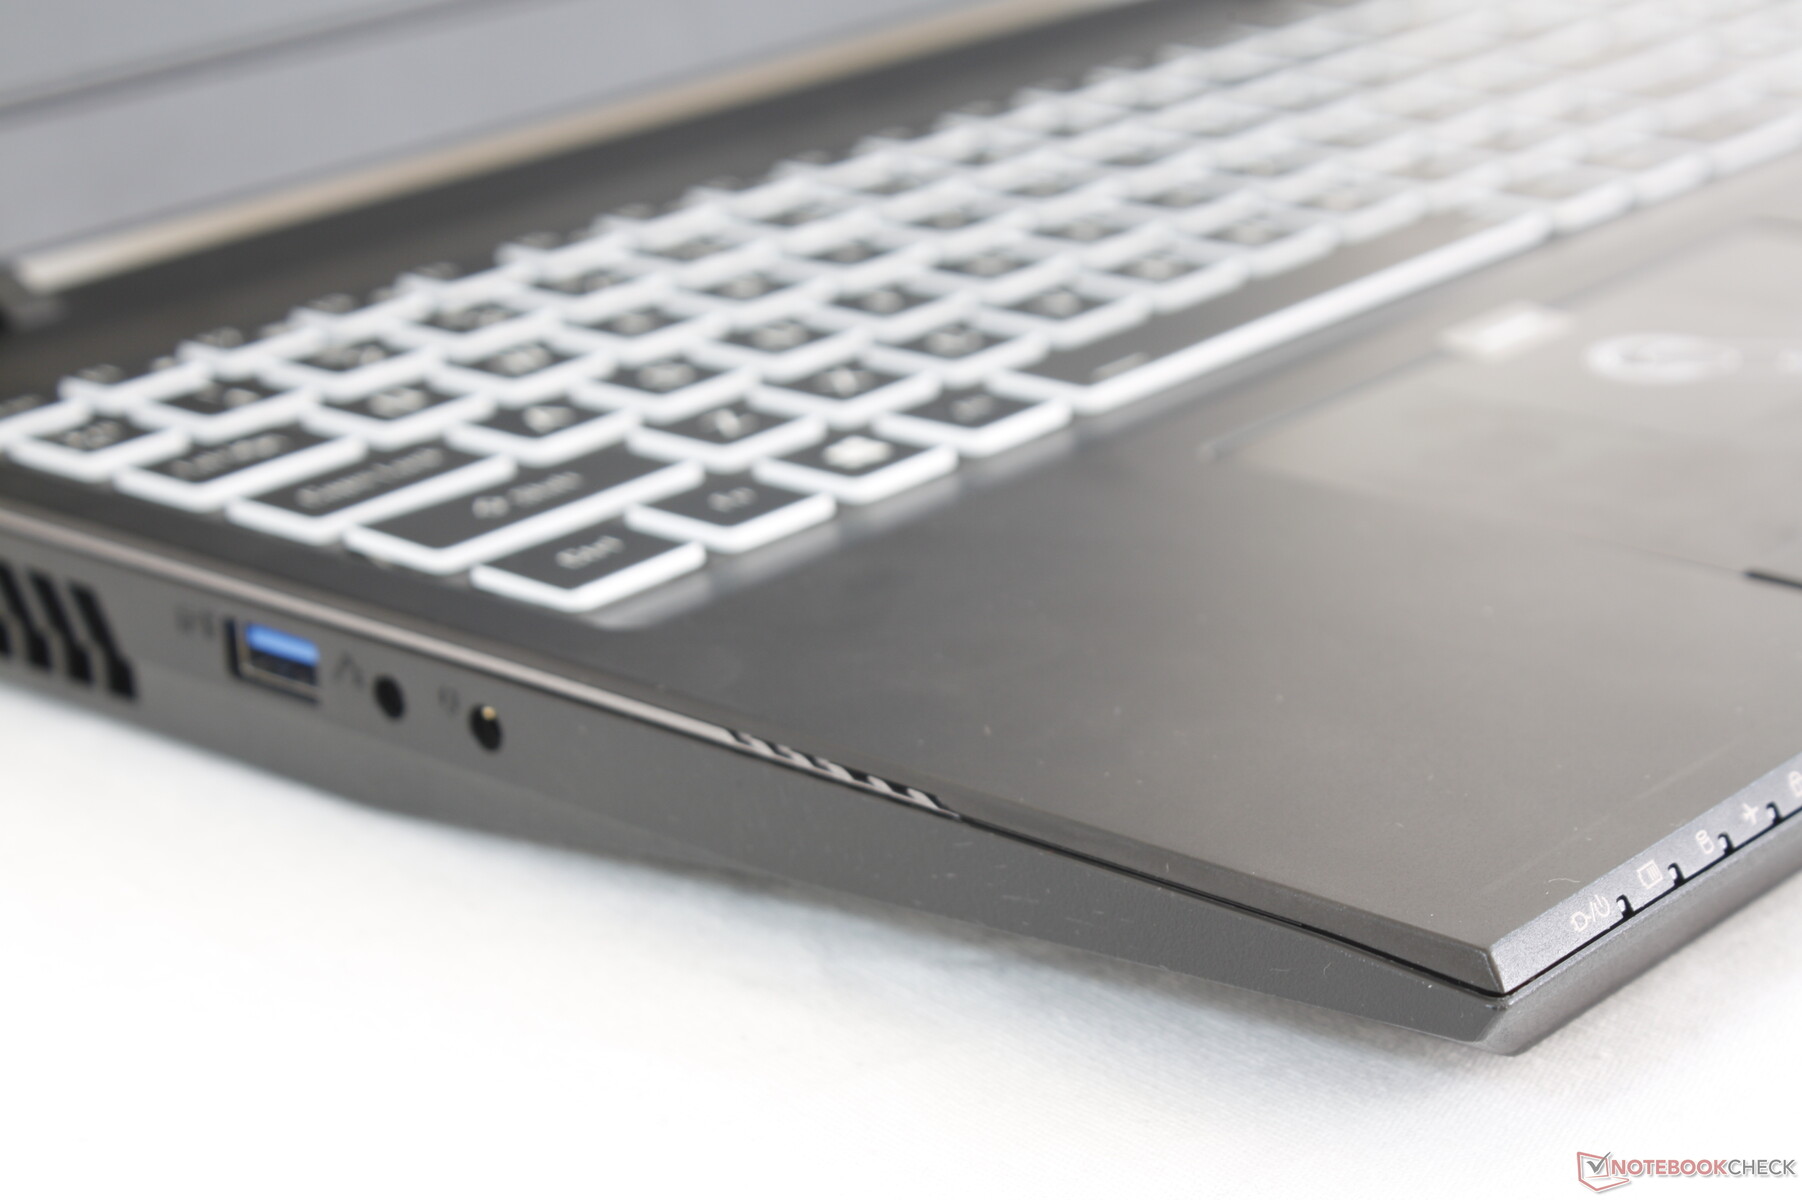
Port options and positioning are the same as on the larger 17.3-inch Nightsky RX17 including the unusual SD card reader along the front edge. The system has more ports than most other gaming laptops.
SD Card Reader
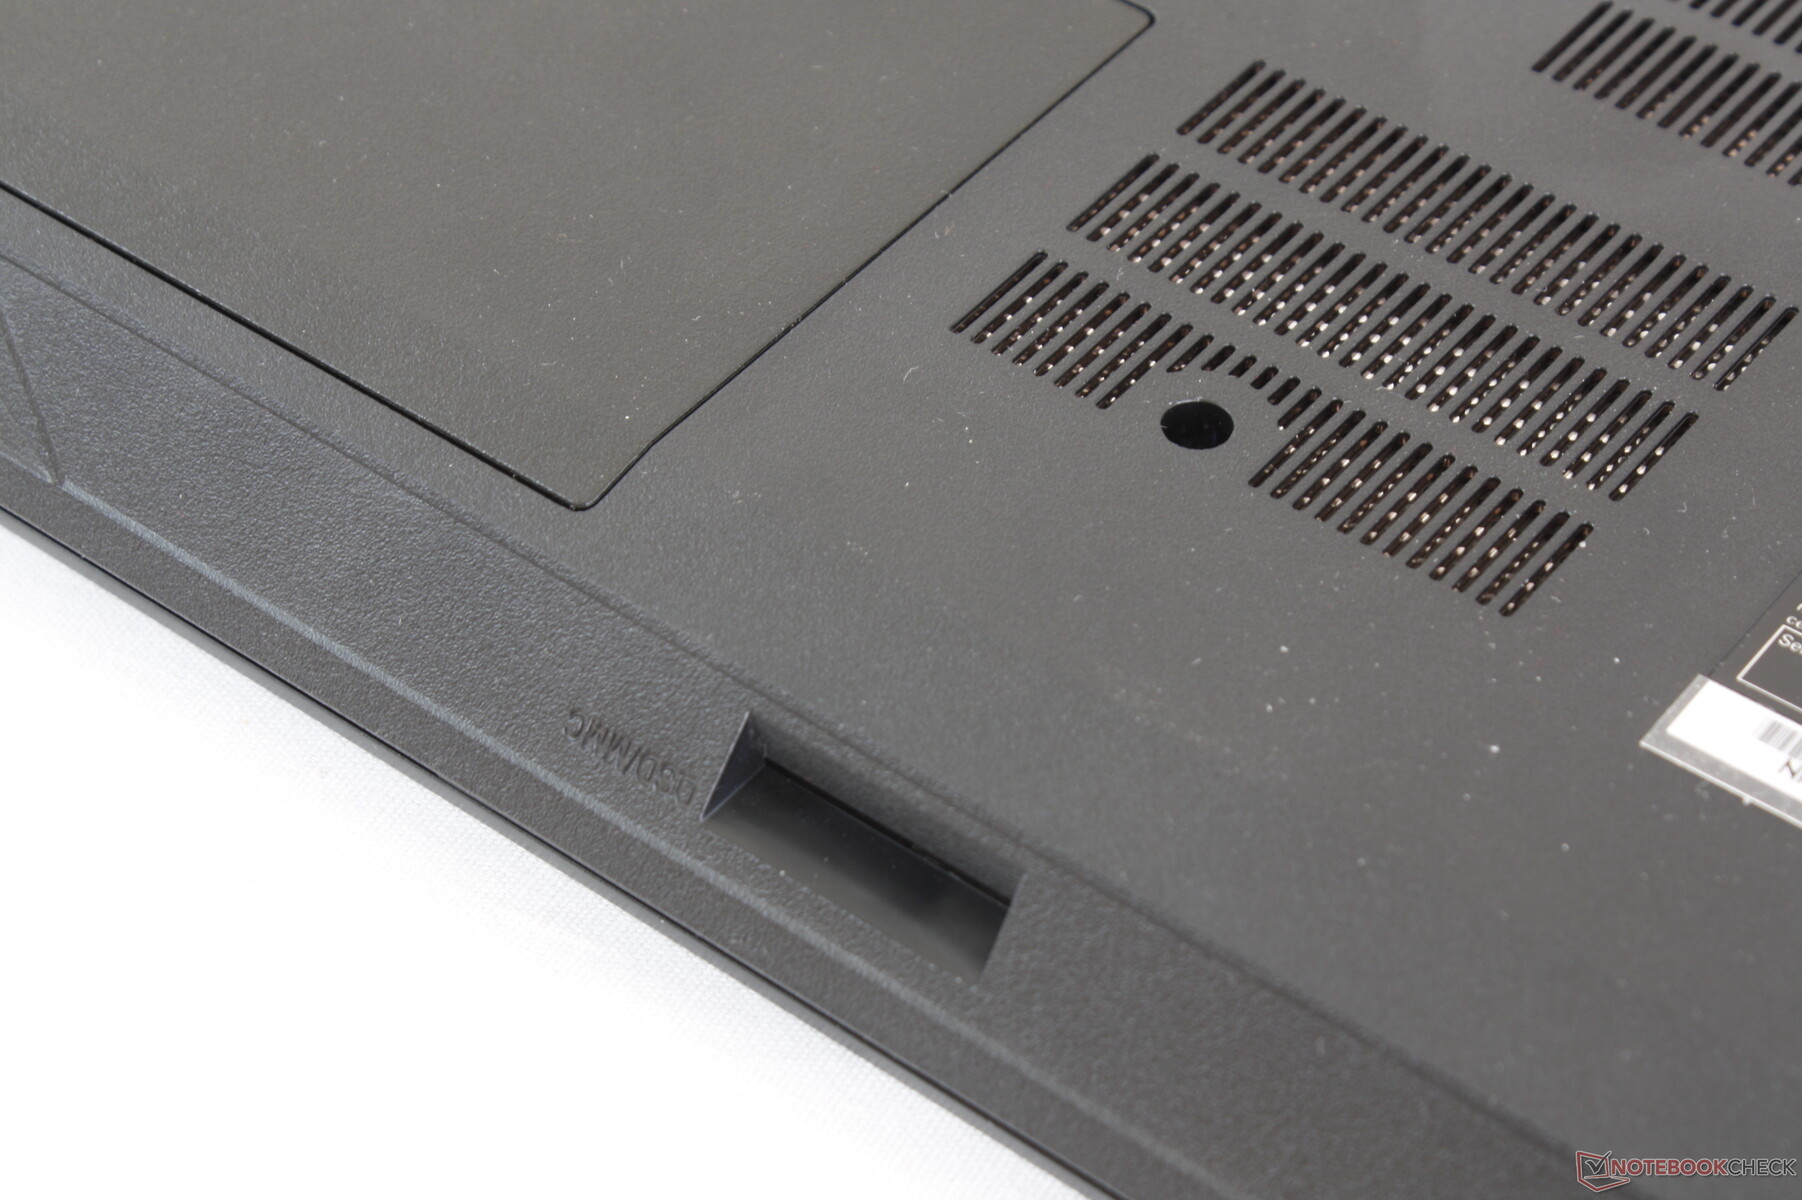
Eurocom laptops typically have very fast SD card readers and the Nightsky series is no exception. Moving 1 GB worth of pictures from our UHS-II test card to desktop takes only about 6 seconds compared to almost 15 seconds on the HP Omen 15.
A fully inserted SD card sites almost flush against the edge of the chassis for safe transporting.
| SD Card Reader | |
| average JPG Copy Test (av. of 3 runs) | |
| Razer Blade Pro 17 RTX 2060 (Toshiba Exceria Pro SDXC 64 GB UHS-II) | |
| Eurocom Nightsky Ti15 (Toshiba Exceria Pro SDXC 64 GB UHS-II) | |
| HP Omen 15-dc1020ng (Toshiba Exceria Pro SDXC 64 GB UHS-II) | |
| HP Gaming Pavilion 15-dk0009ng (Toshiba Exceria Pro SDXC 64 GB UHS-II) | |
| Dell G5 15 5590 (Toshiba Exceria Pro SDXC 64 GB UHS-II) | |
| maximum AS SSD Seq Read Test (1GB) | |
| Eurocom Nightsky Ti15 (Toshiba Exceria Pro SDXC 64 GB UHS-II) | |
| Razer Blade Pro 17 RTX 2060 (Toshiba Exceria Pro SDXC 64 GB UHS-II) | |
| HP Omen 15-dc1020ng (Toshiba Exceria Pro SDXC 64 GB UHS-II) | |
| HP Gaming Pavilion 15-dk0009ng (Toshiba Exceria Pro SDXC 64 GB UHS-II) | |
| Dell G5 15 5590 (Toshiba Exceria Pro SDXC 64 GB UHS-II) | |
Communication
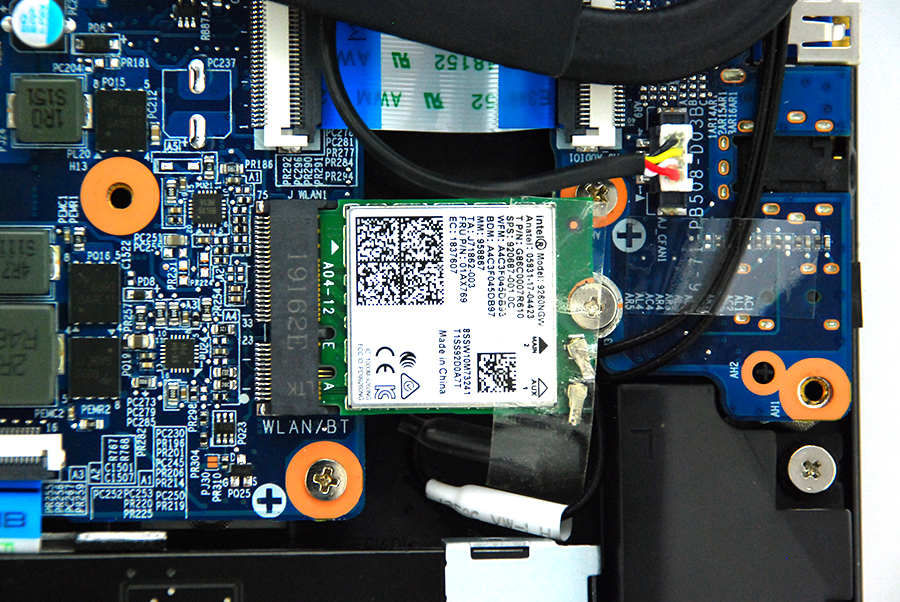
The Eurocom is Wi-Fi 6 ready with its Killer AX1650x module. Performance can be faster than what we've recorded below since our server setup is limited by a 1 Gbps line.
| Networking | |
| iperf3 transmit AX12 | |
| Aorus 15-SA | |
| HP Omen 15-dc1020ng | |
| Eurocom Nightsky Ti15 | |
| Dell G5 15 5590 | |
| iperf3 receive AX12 | |
| Eurocom Nightsky Ti15 | |
| Aorus 15-SA | |
| Dell G5 15 5590 | |
| HP Omen 15-dc1020ng | |
Maintenance
Much like on the Nightsky RX17, the Ti15/RX15 is one of the more difficult Clevo systems to service. You'll potentially have to remove the keyboard just to pop open the bottom panel and upgrade something as simple as RAM or storage.
Warranty
The standard one-year limited warranty applies with options to extend up to three years.
Input Devices
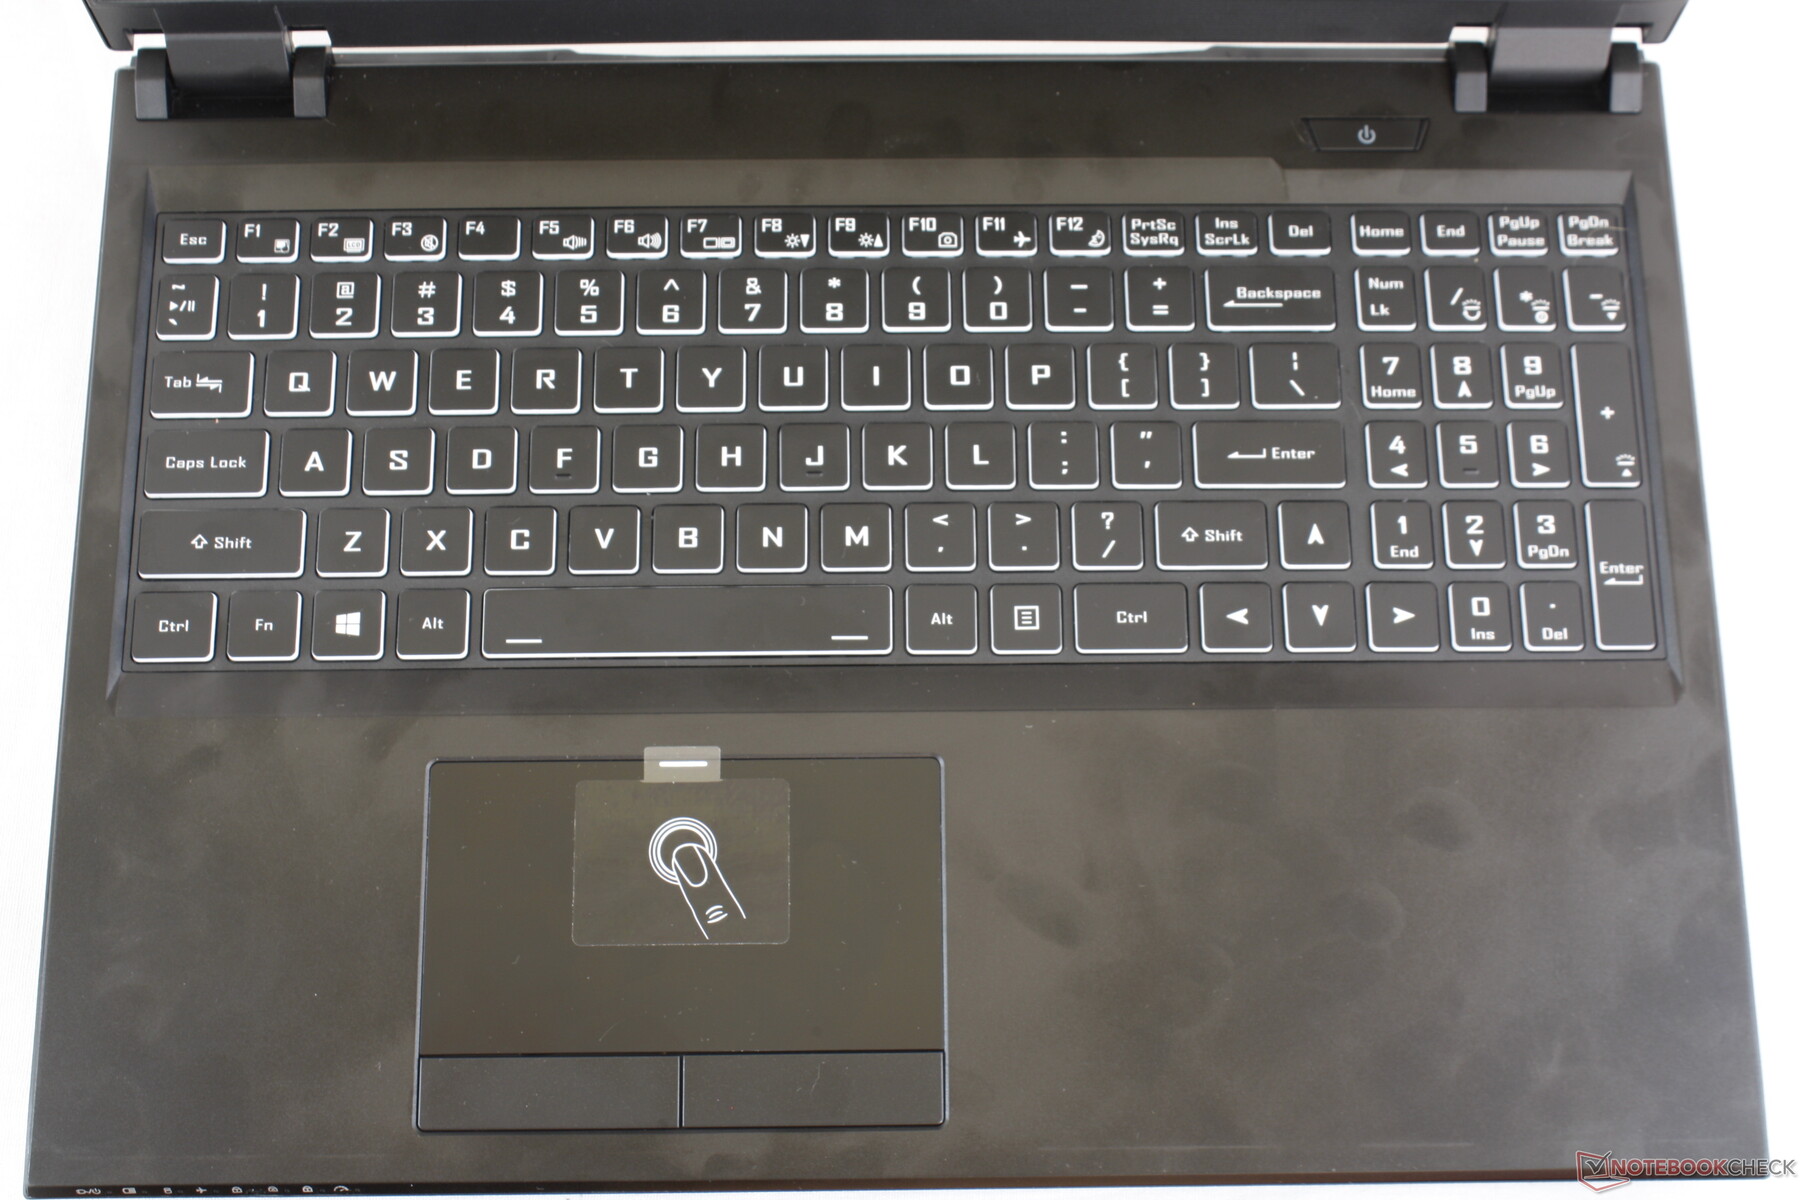
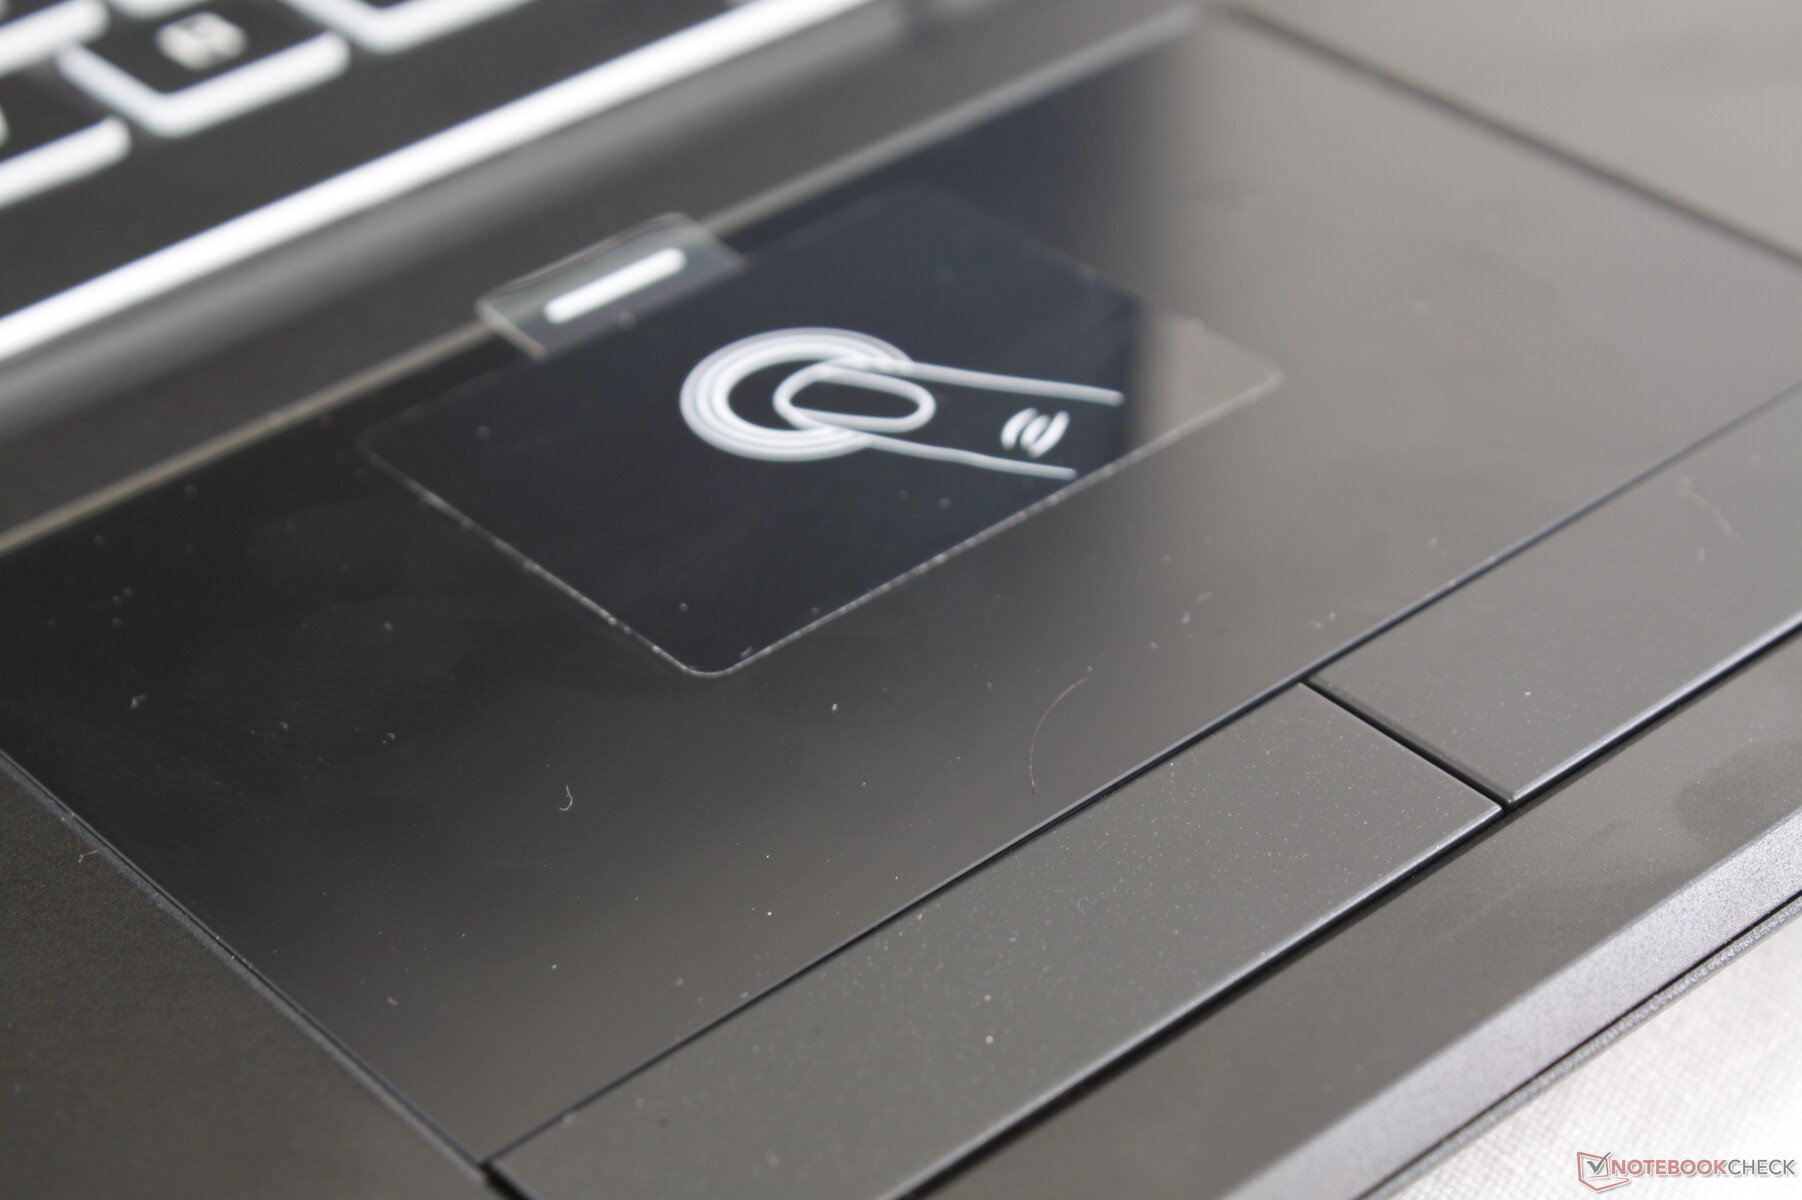
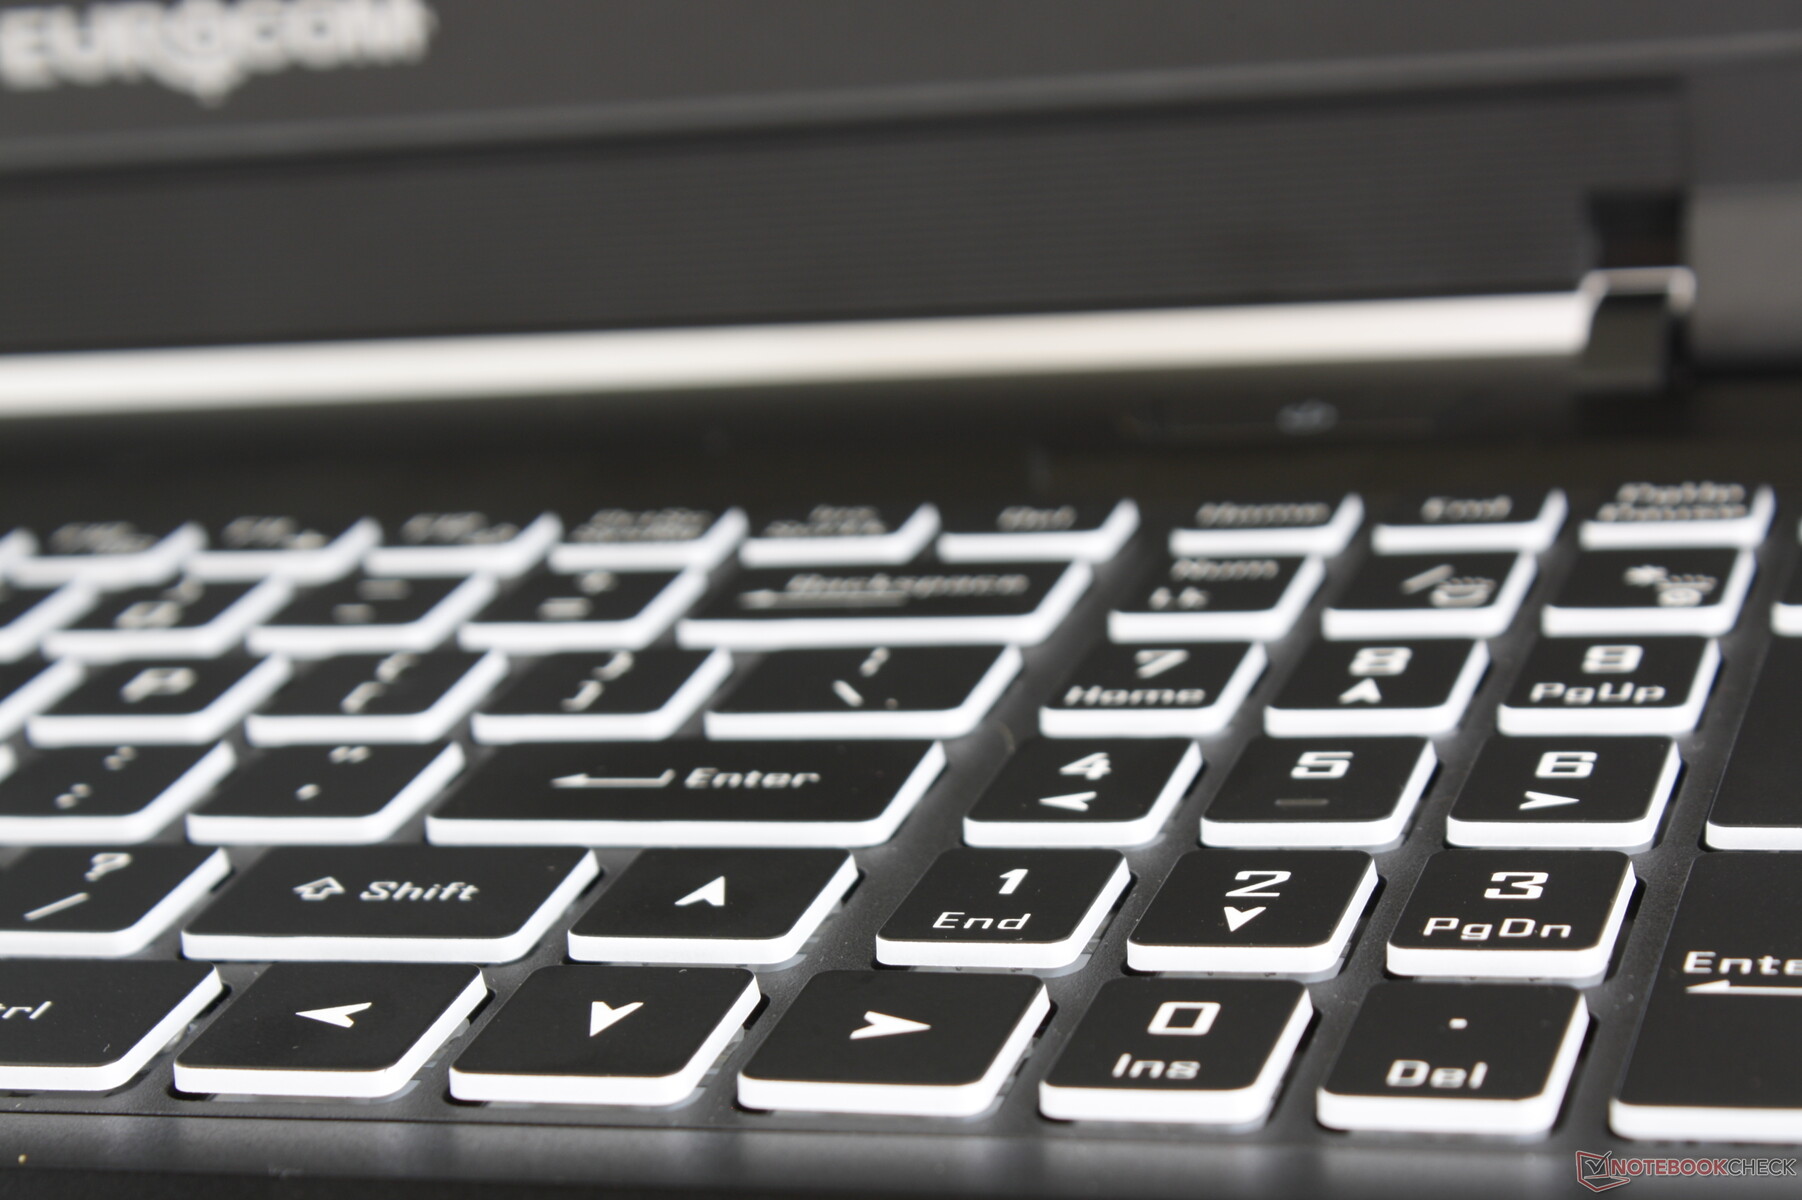
Keyboard and Touchpad
The Nightsky RX15 shares the same keyboard and touchpad as on the RX17 despite their screen size differences. Even the dimensions of the touchpad between the two models are identical. Thus, all our comments from the Nightsky RX17 apply here on the RX15.

Display
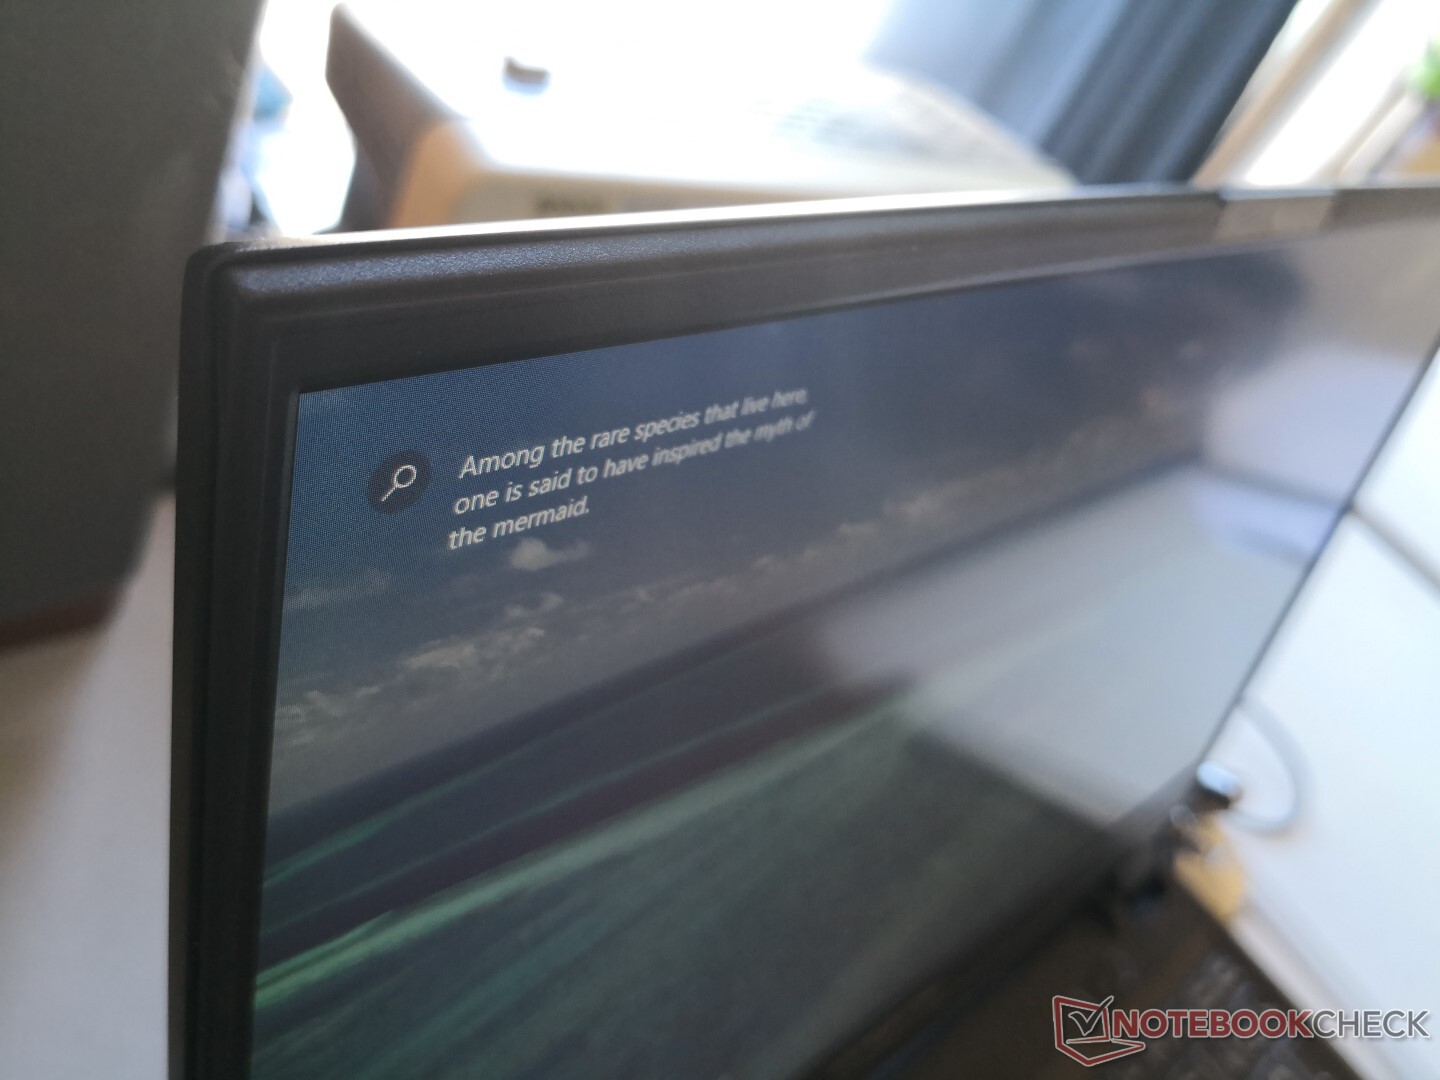
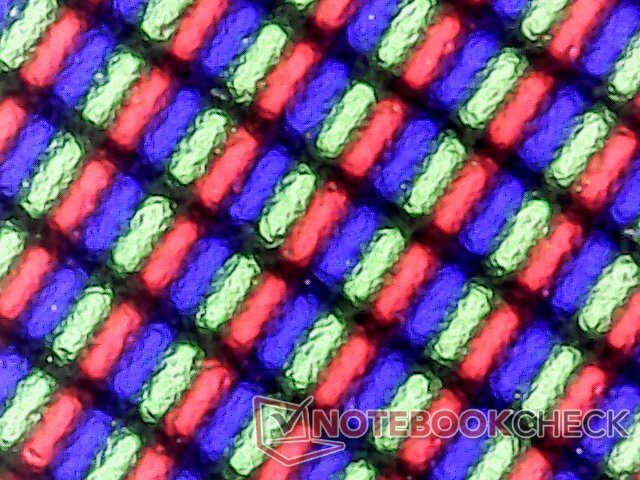
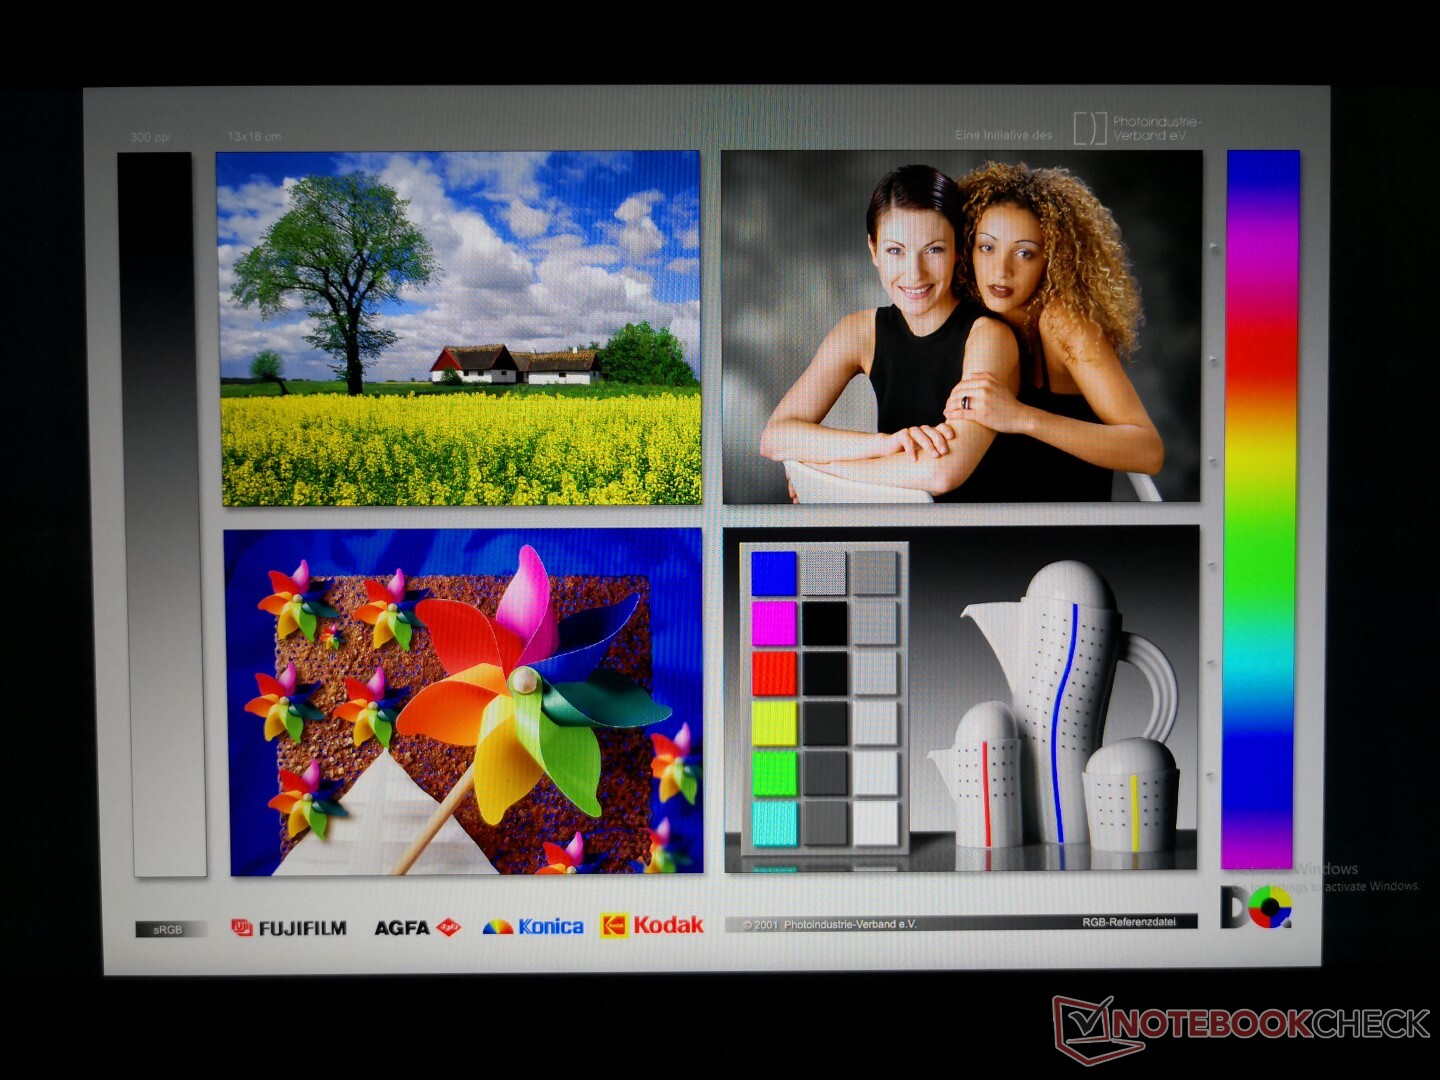
The AU Optronics B156HAN 144 Hz IPS panel here can also be found on other gaming laptops like the Dell G5 15 5590, Alienware m15, or Asus Zephyrus S GX531GX for a similar viewing experience between them. Contrast ratio is high at nearly 1000:1, response times are fast at about 4 ms to 7 ms for reduced ghosting, and brightness is brighter than on both the HP Omen 15 and the aforementioned Dell. The panel is slightly grainy but that is to be expected from a matte overlay.
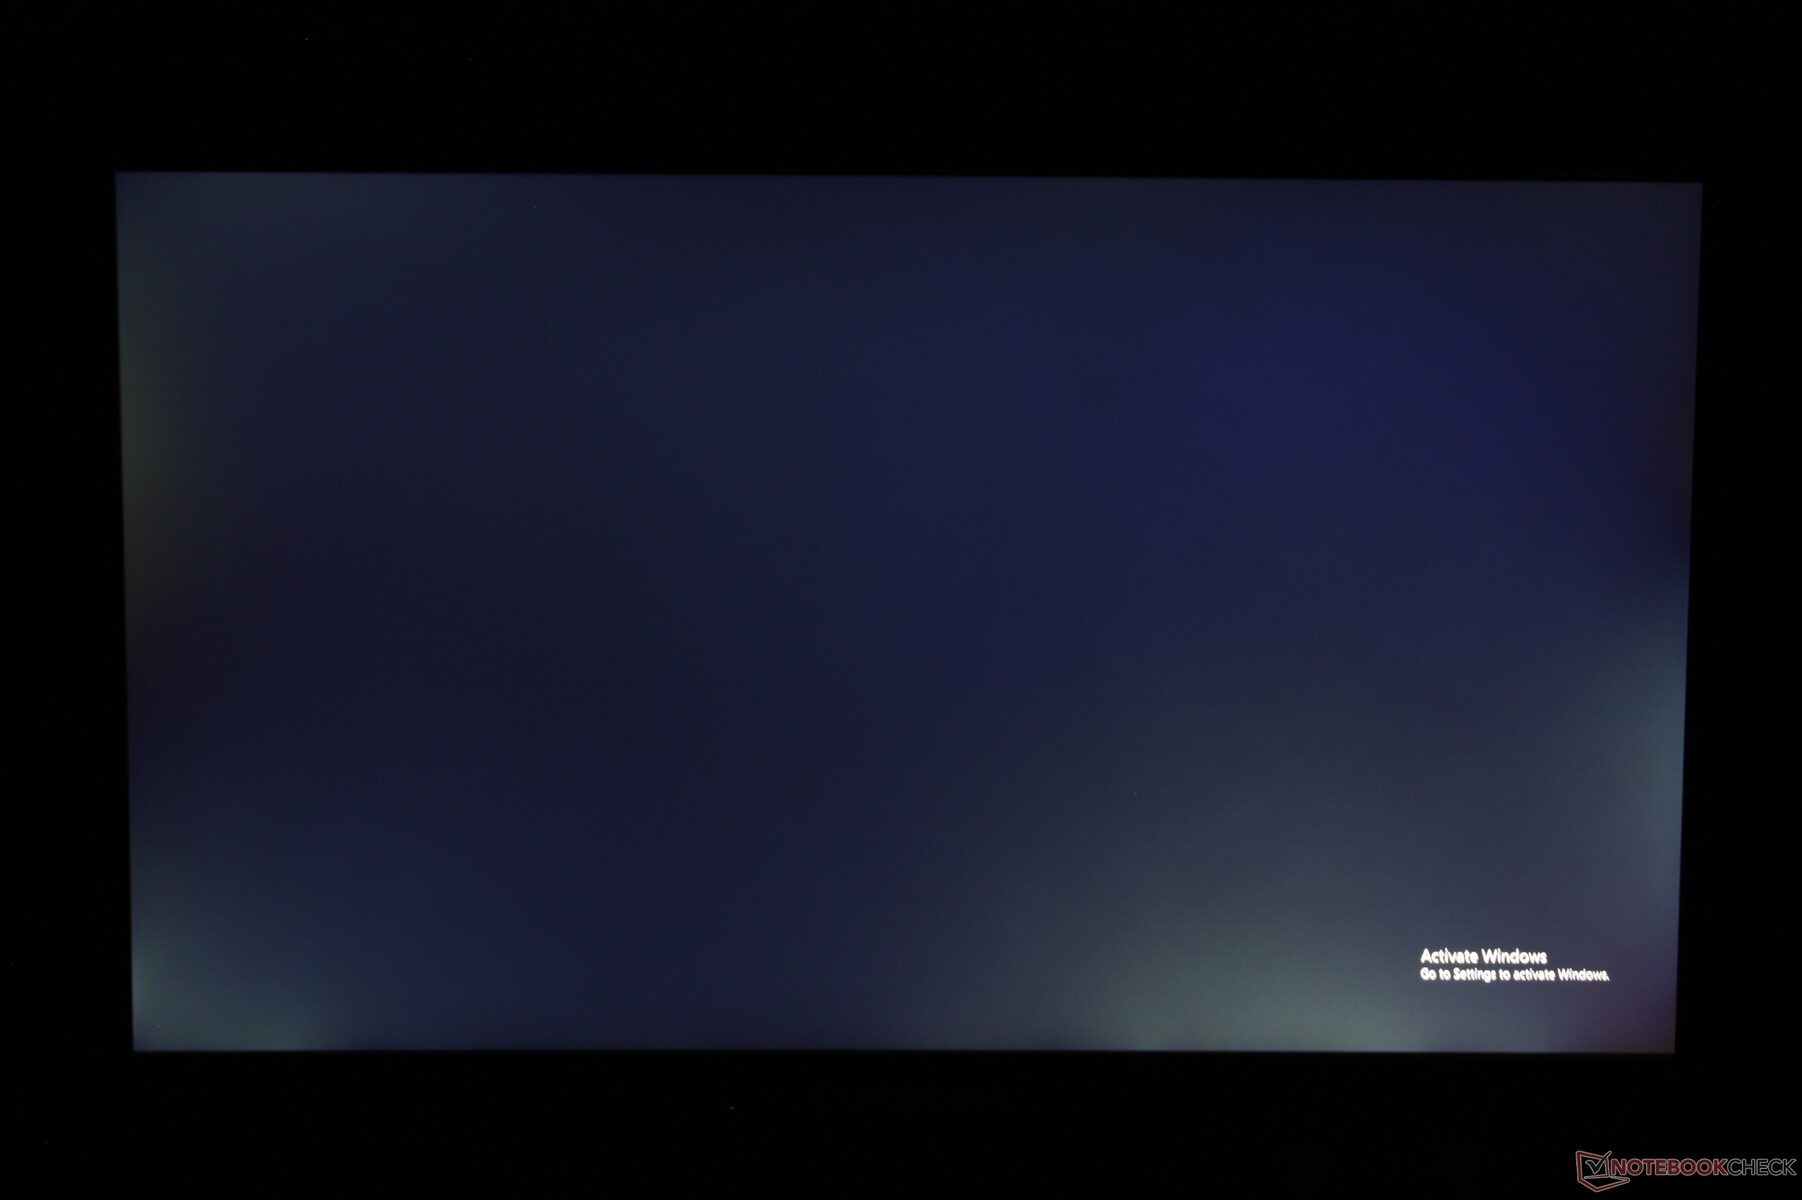
Perhaps the worst aspect of the display is its moderate uneven backlight bleeding as shown by our picture below. A small level of bleeding is always expected from most IPS panels, but it's disappointing to see it here on at such noticeable levels especially on an enthusiast gaming laptop.
| |||||||||||||||||||||||||
Brightness Distribution: 83 %
Center on Battery: 331 cd/m²
Contrast: 946:1 (Black: 0.35 cd/m²)
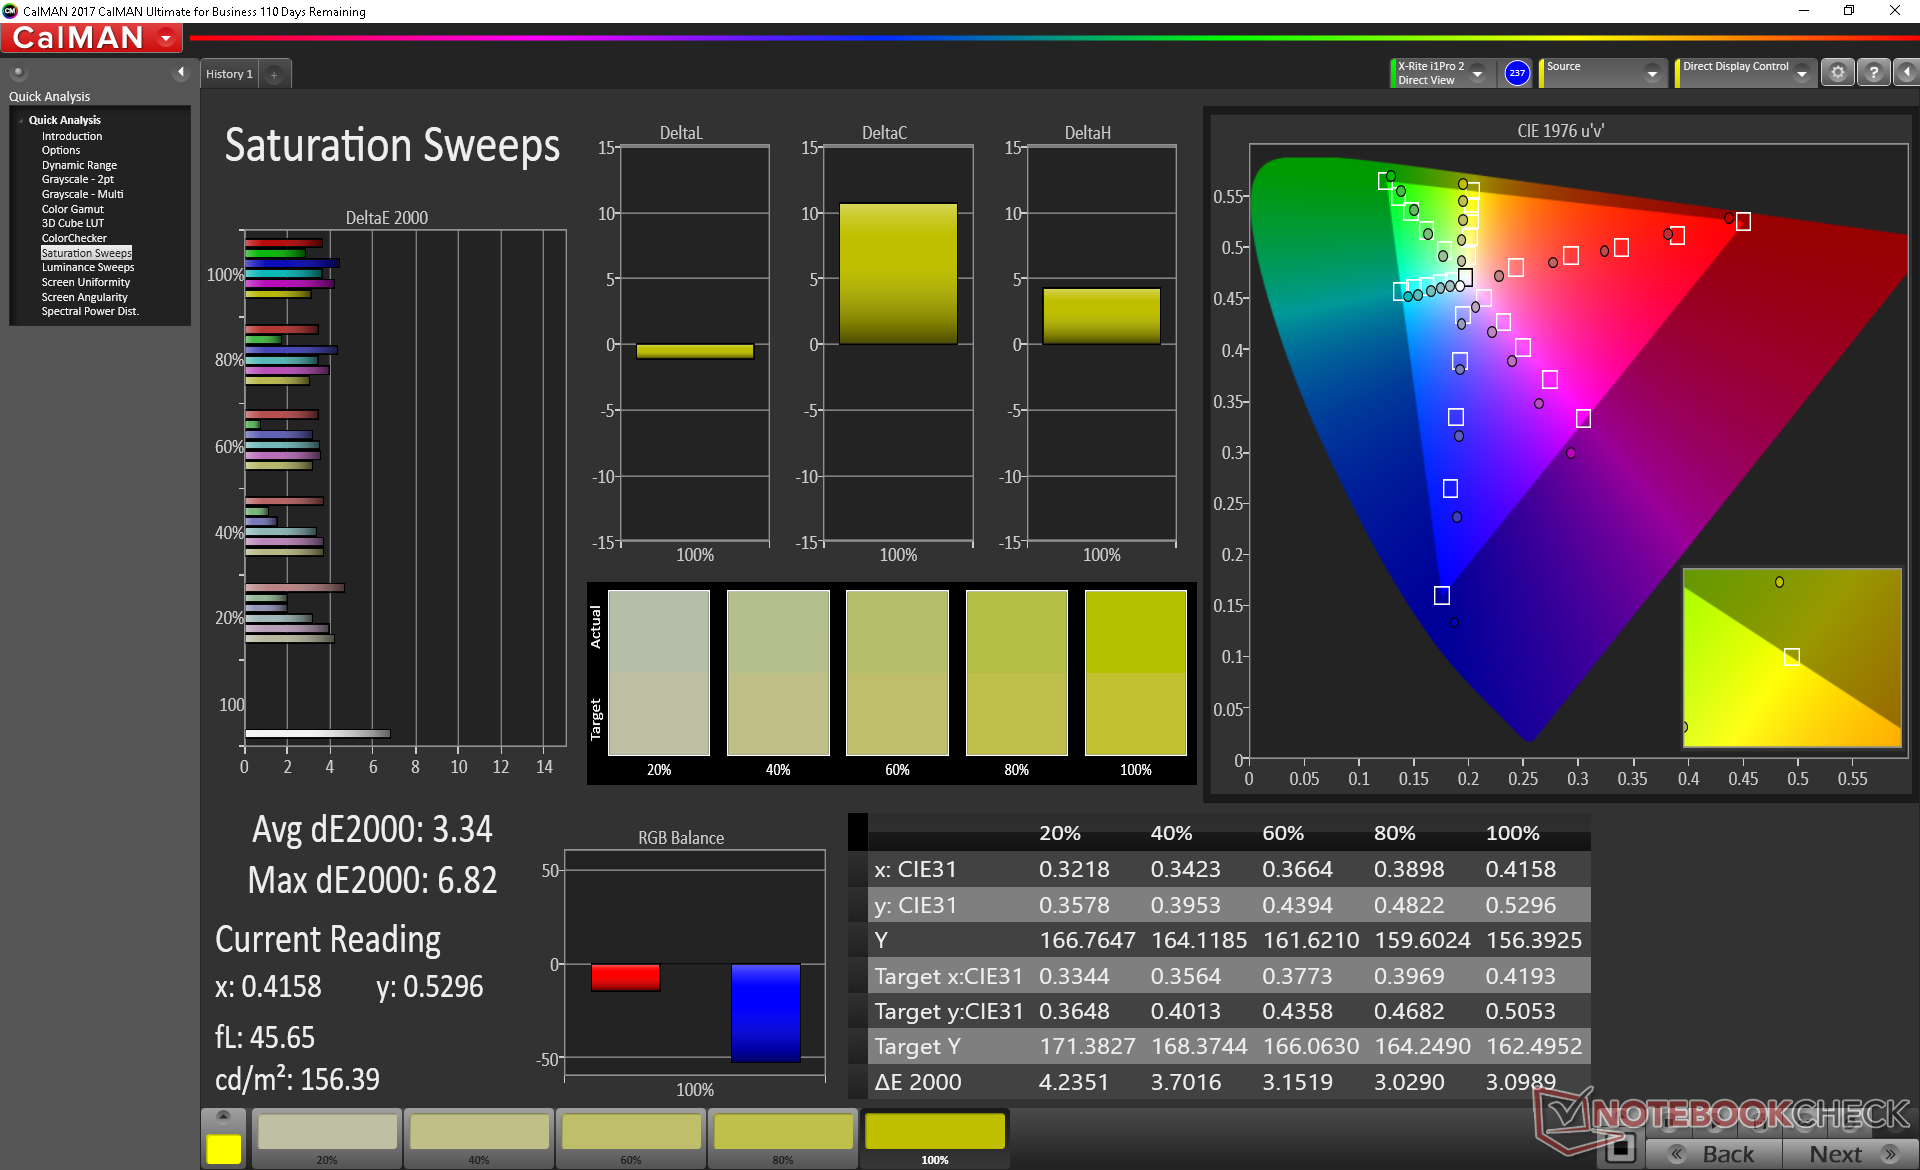
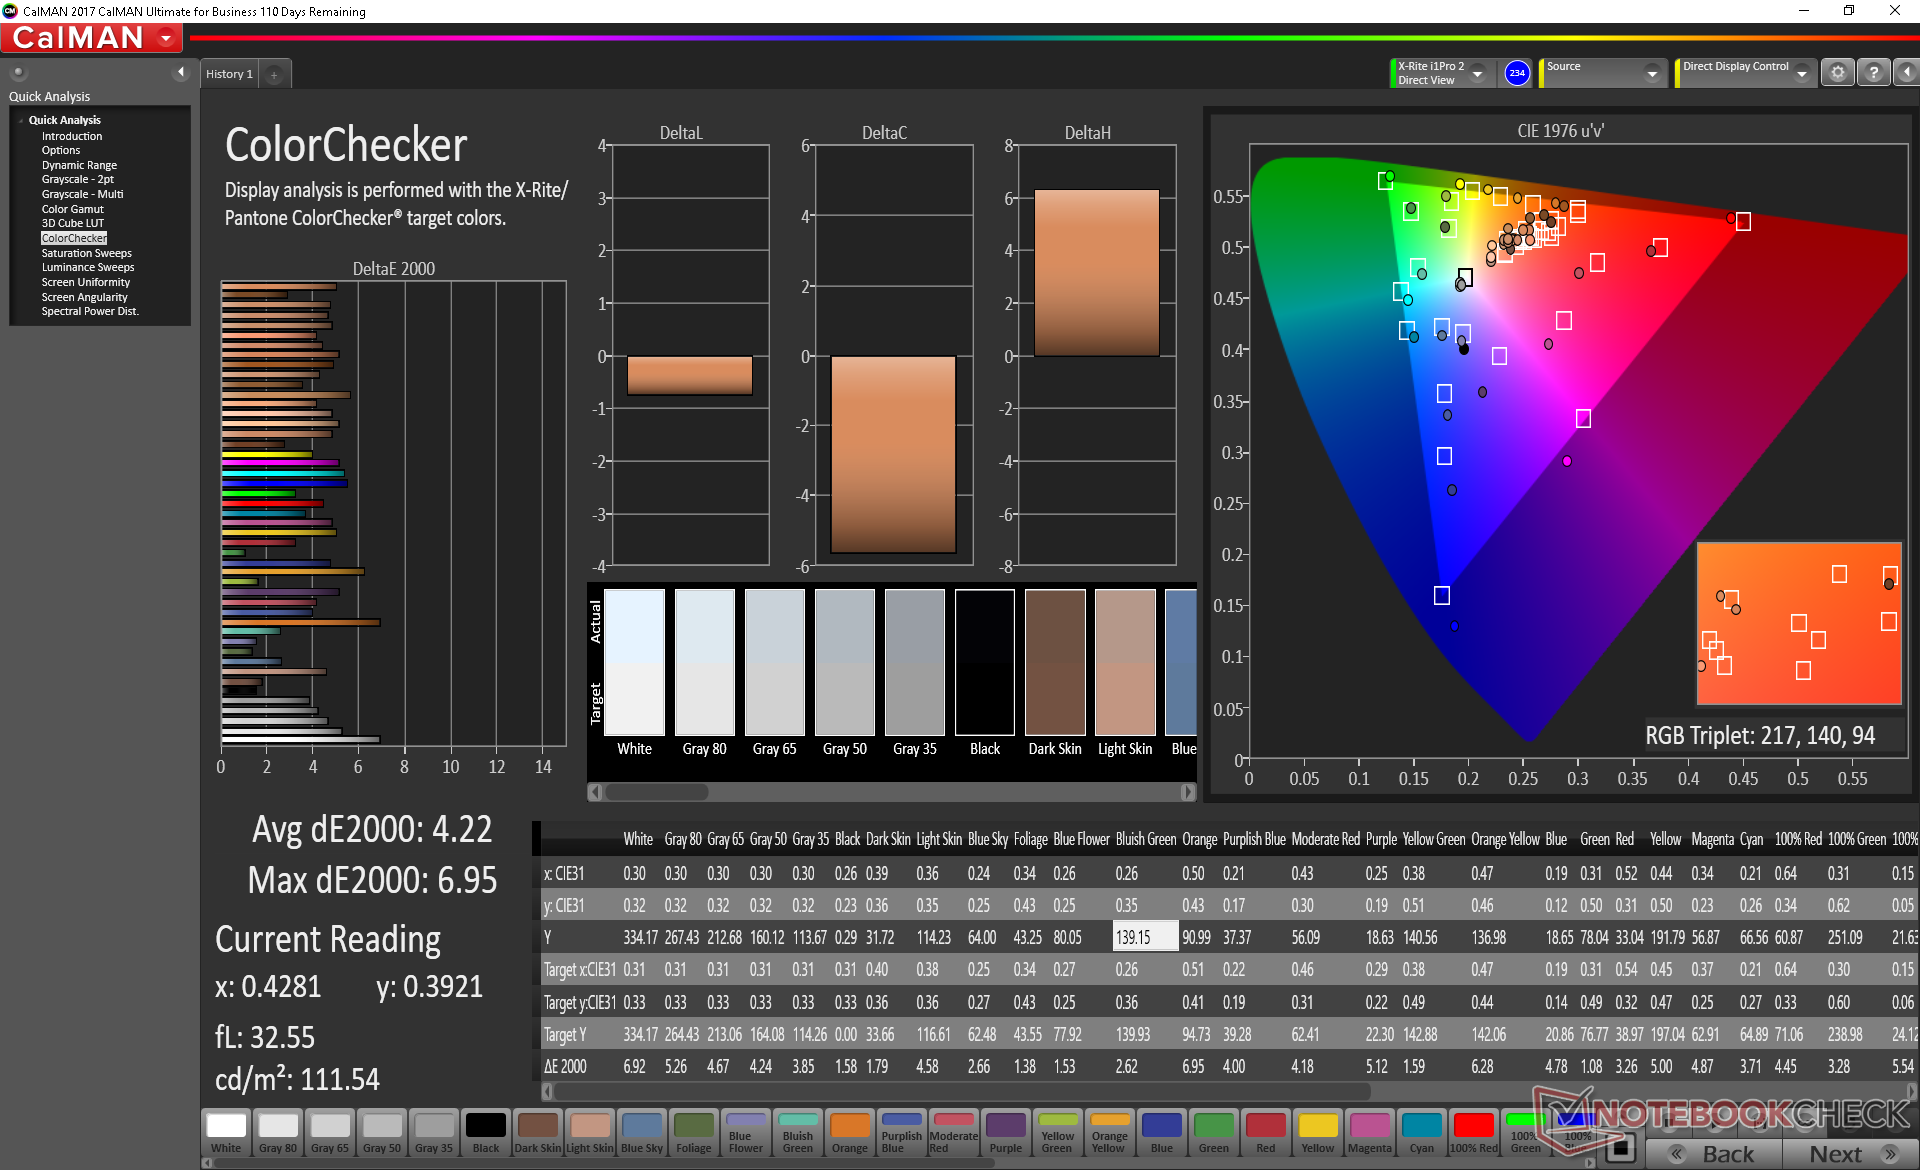
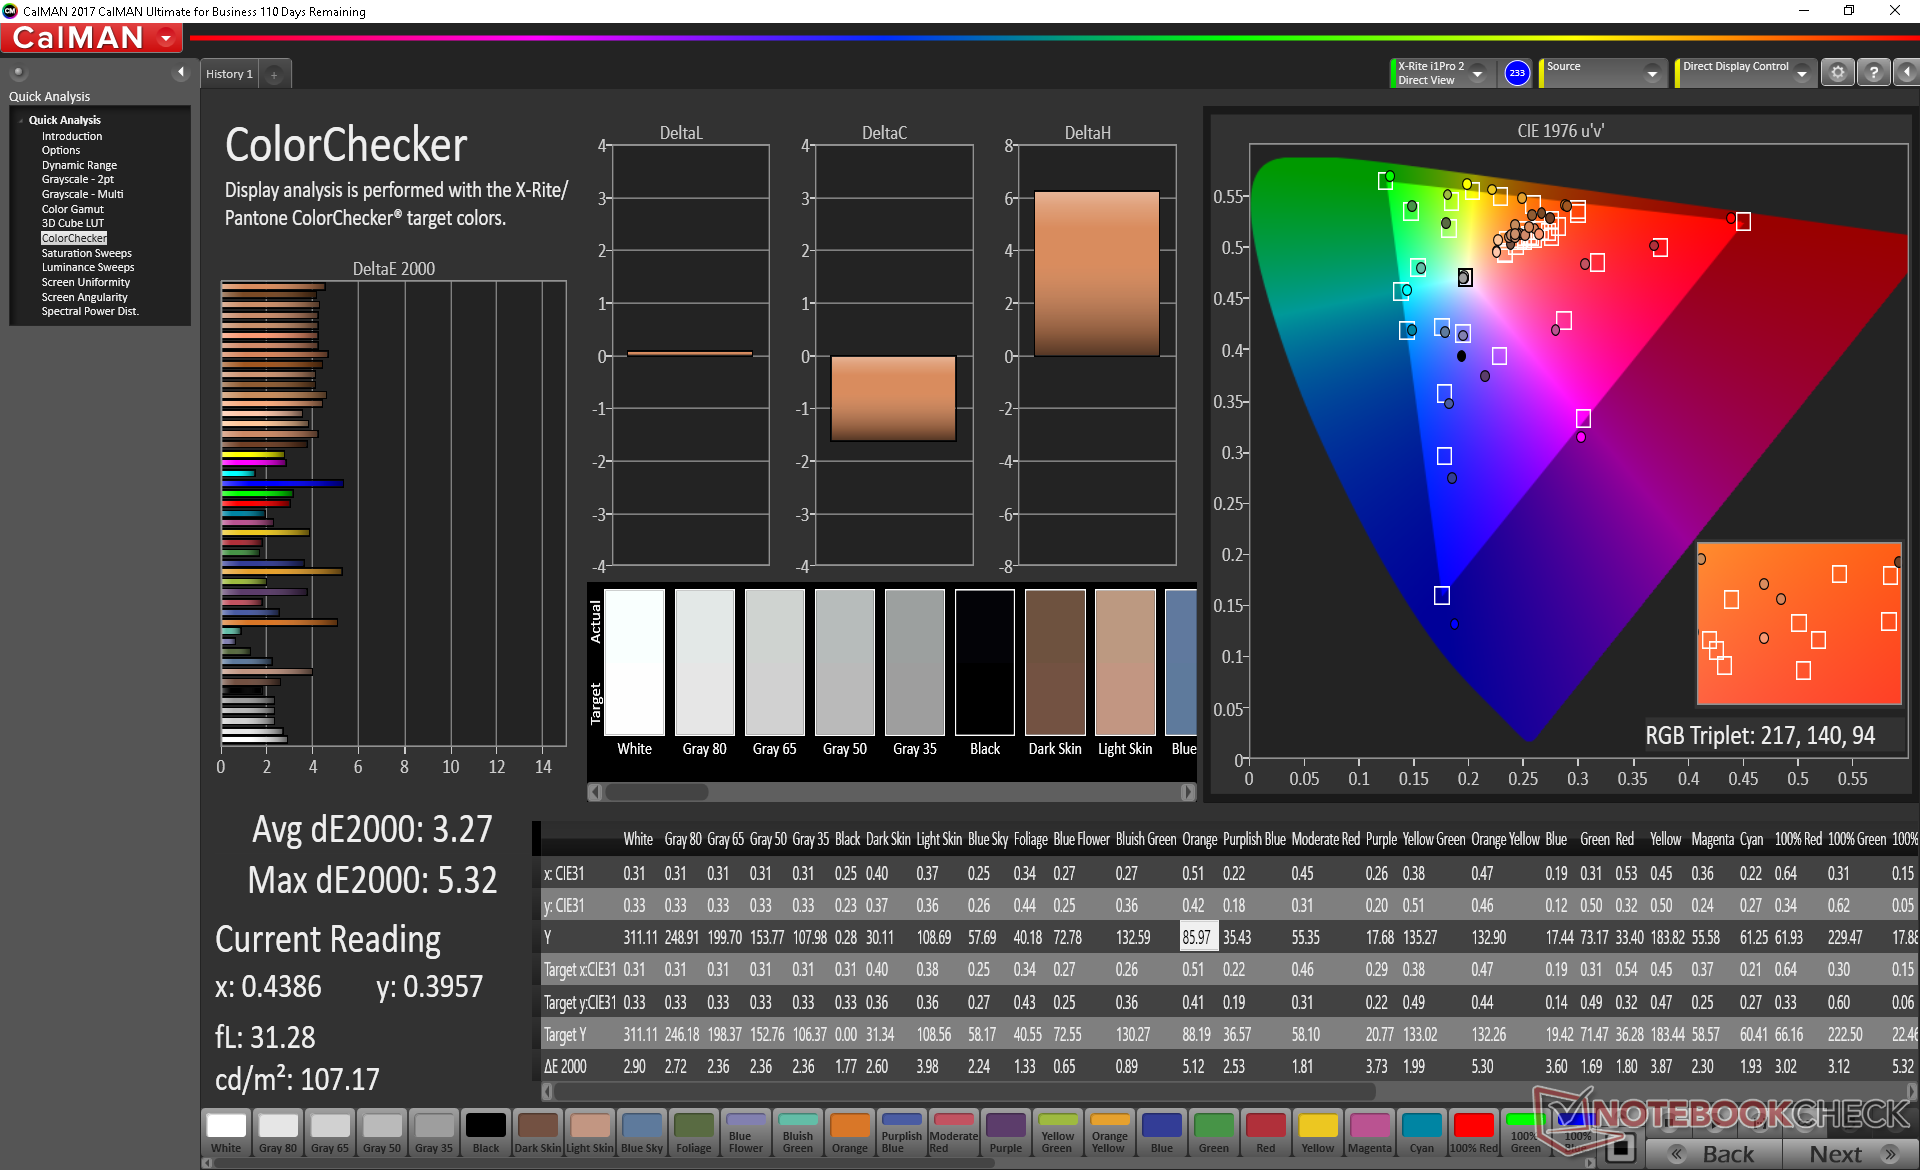
ΔE ColorChecker Calman: 4.22 | ∀{0.5-29.43 Ø4.71}
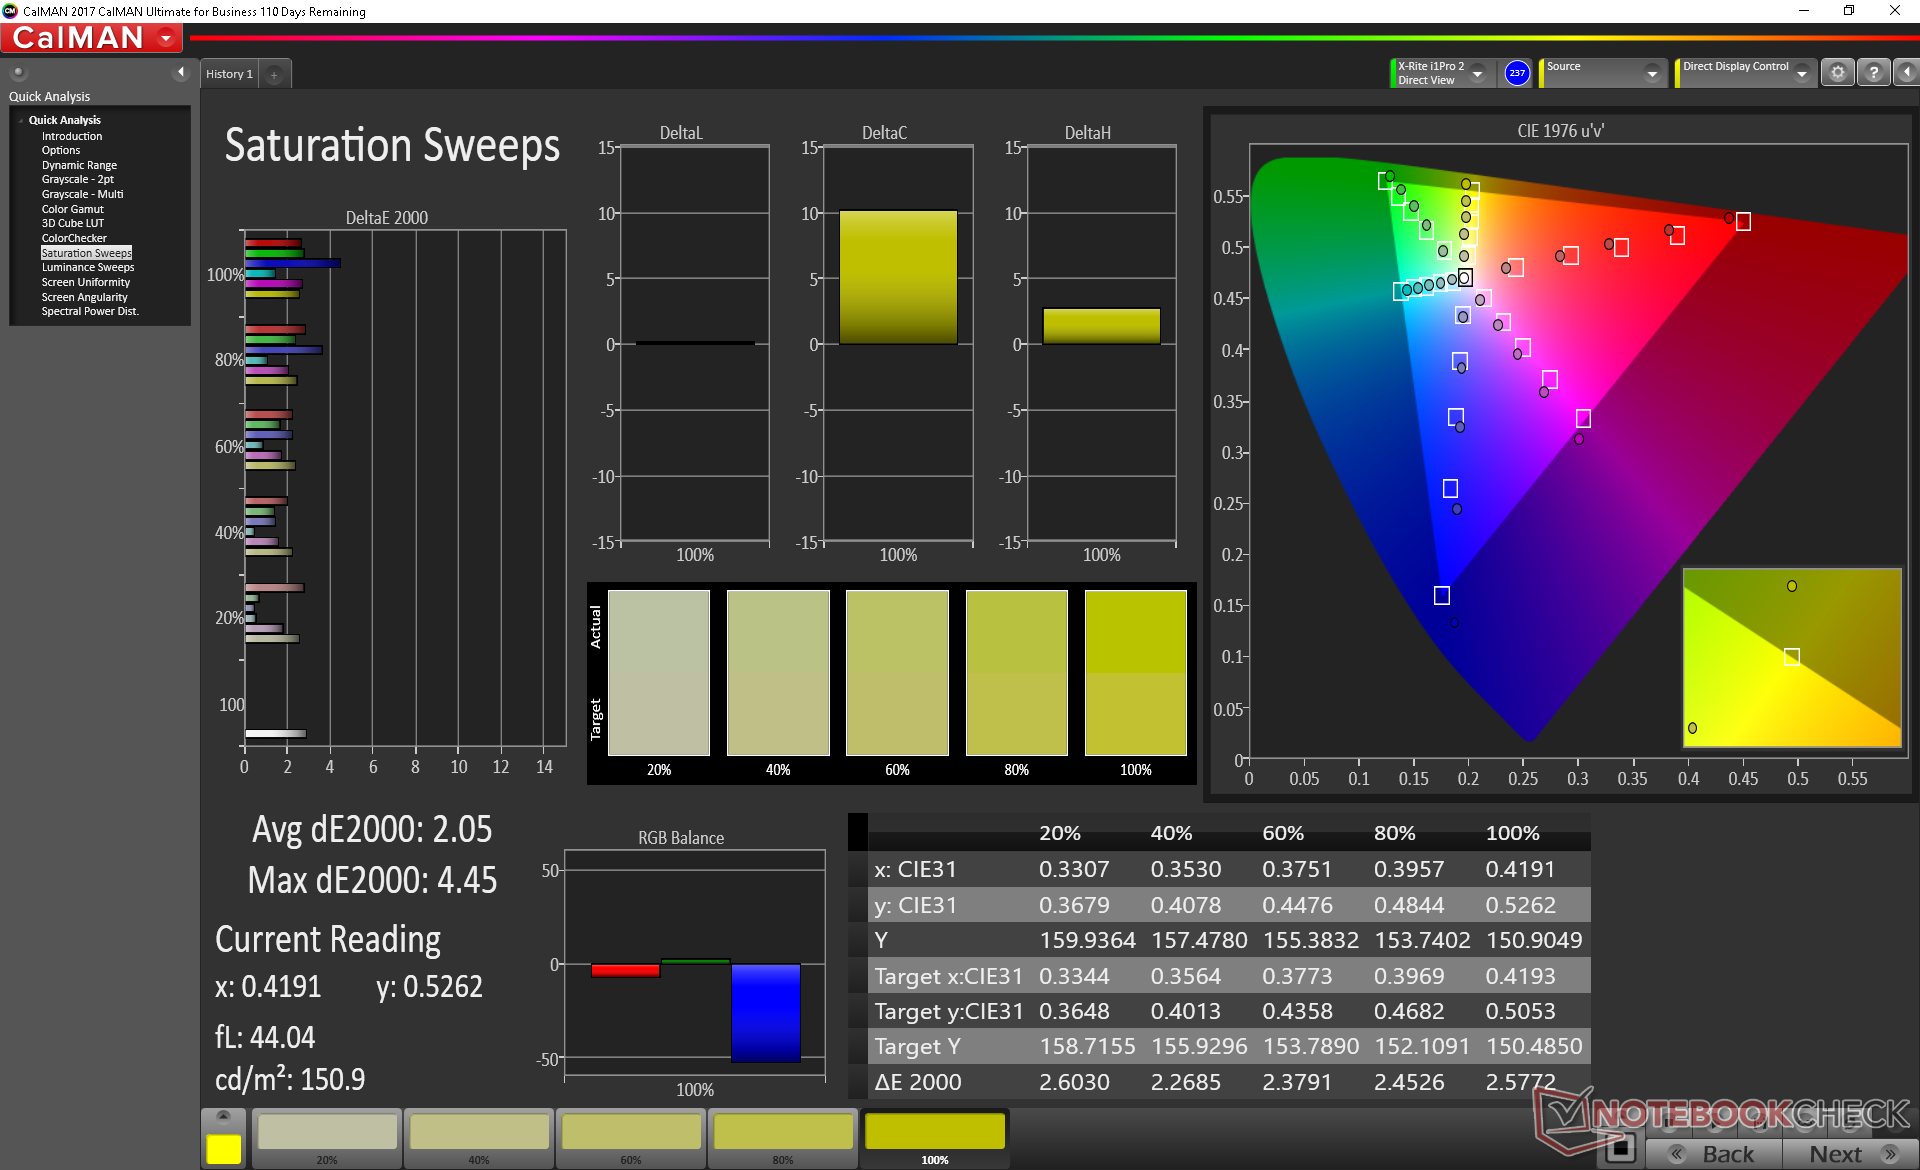
calibrated: 3.27
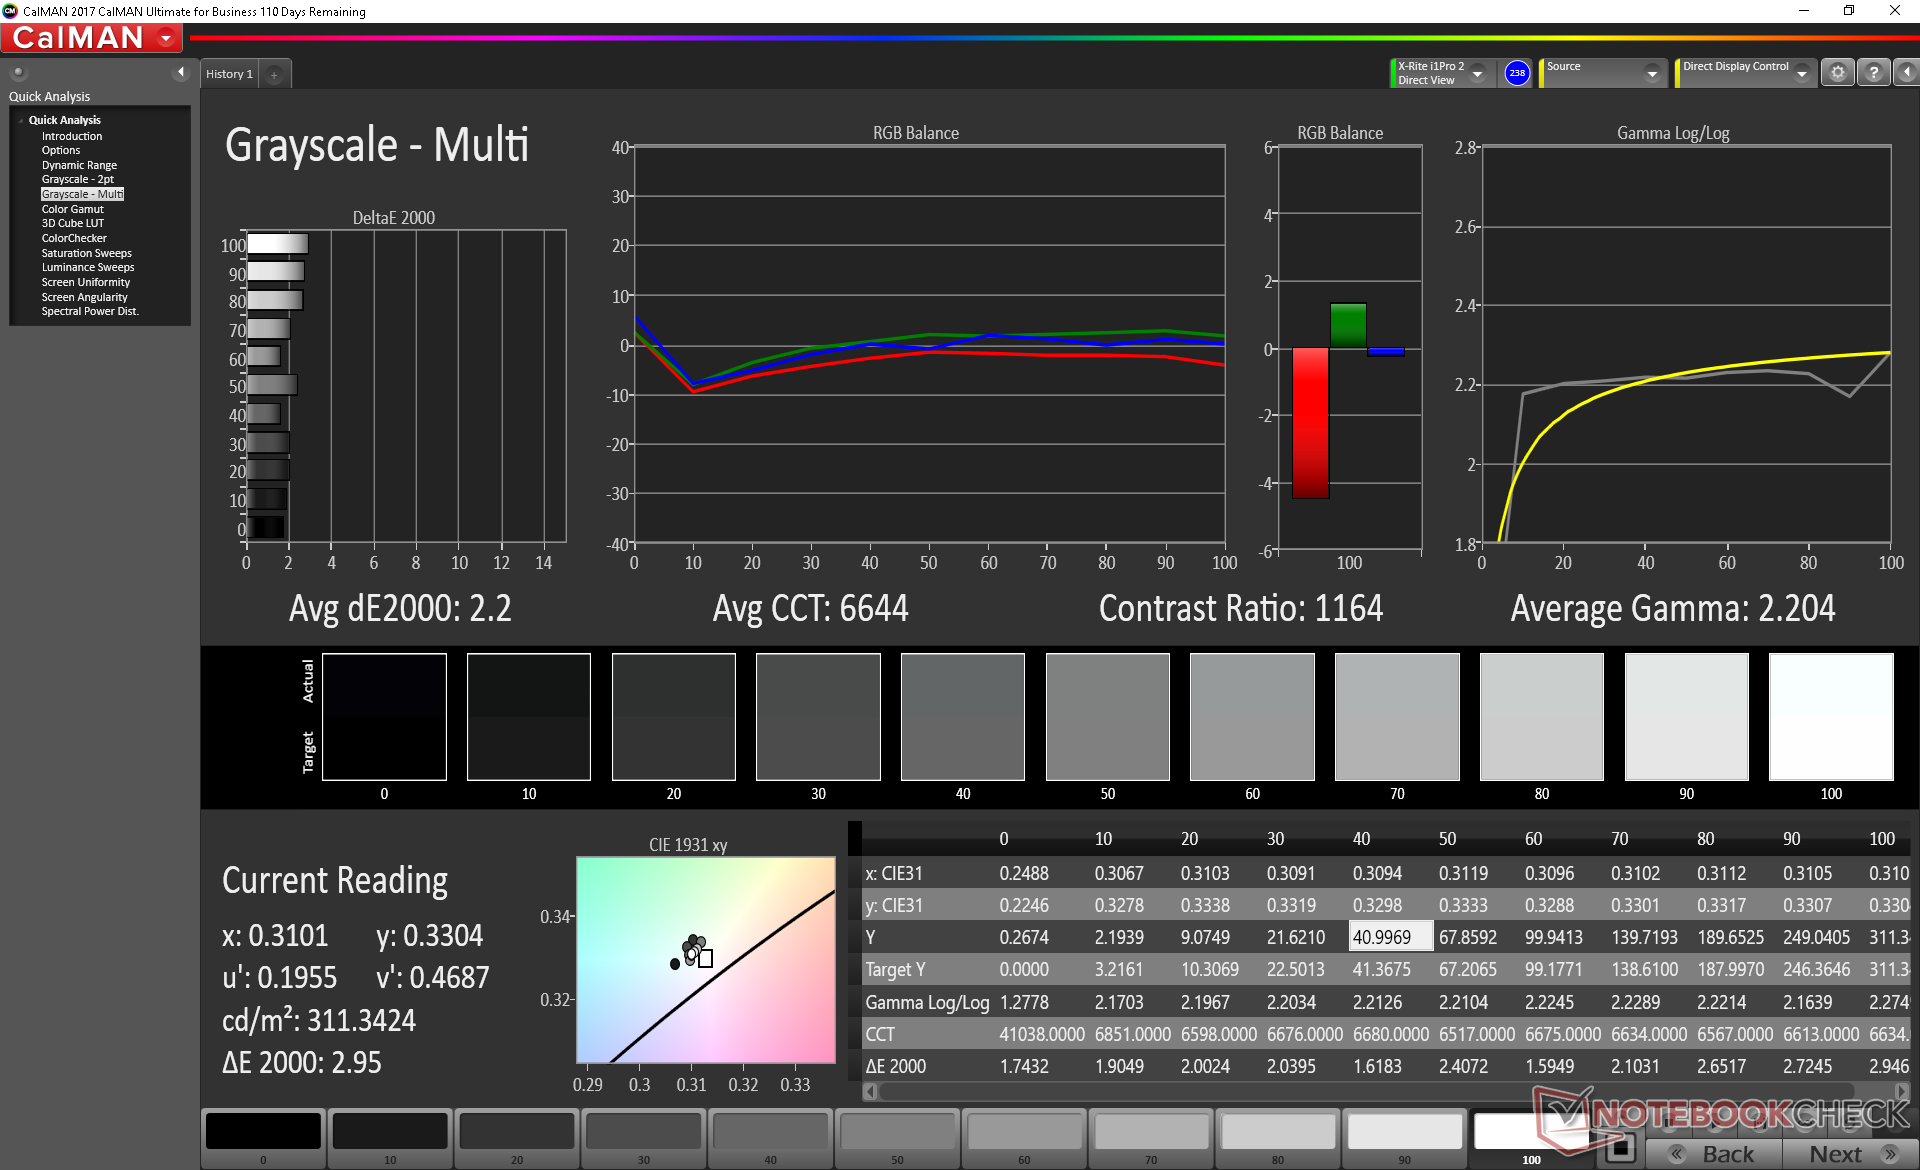
ΔE Greyscale Calman: 3.9 | ∀{0.09-98 Ø4.96}
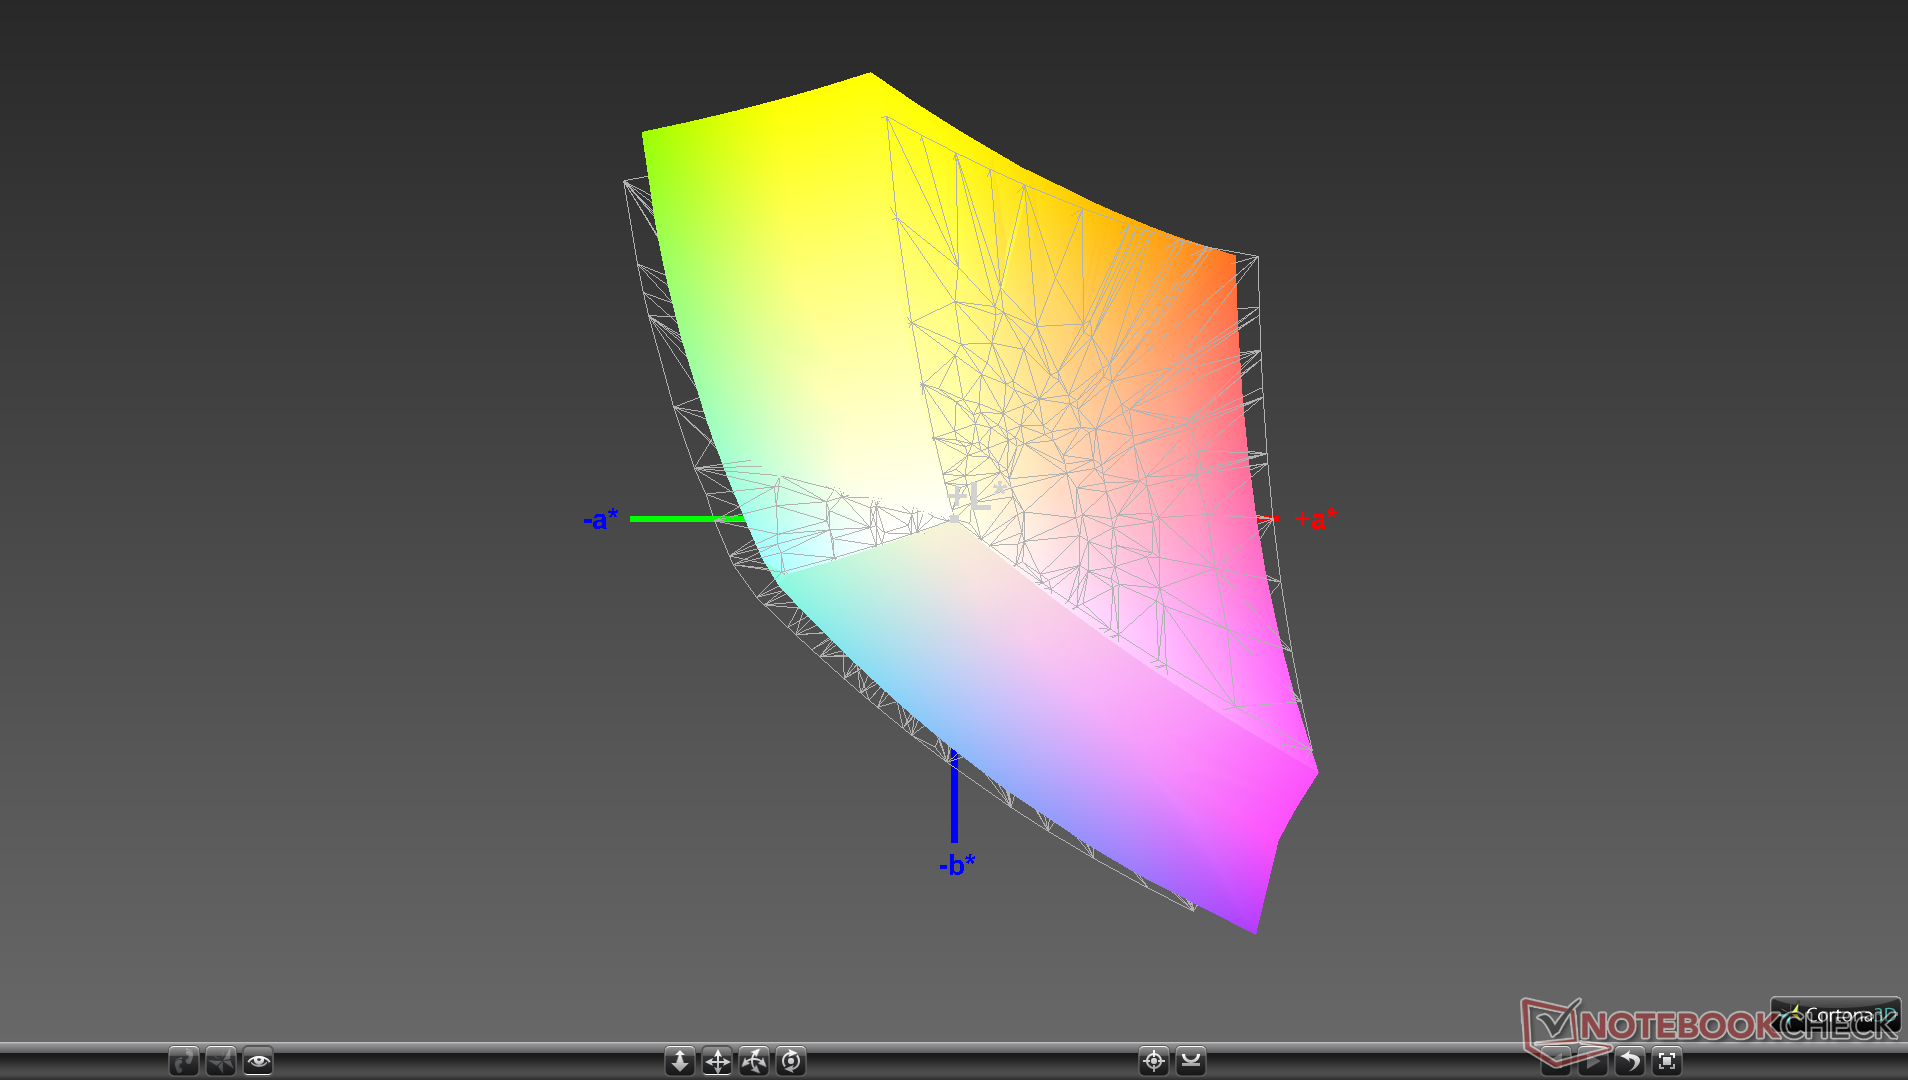
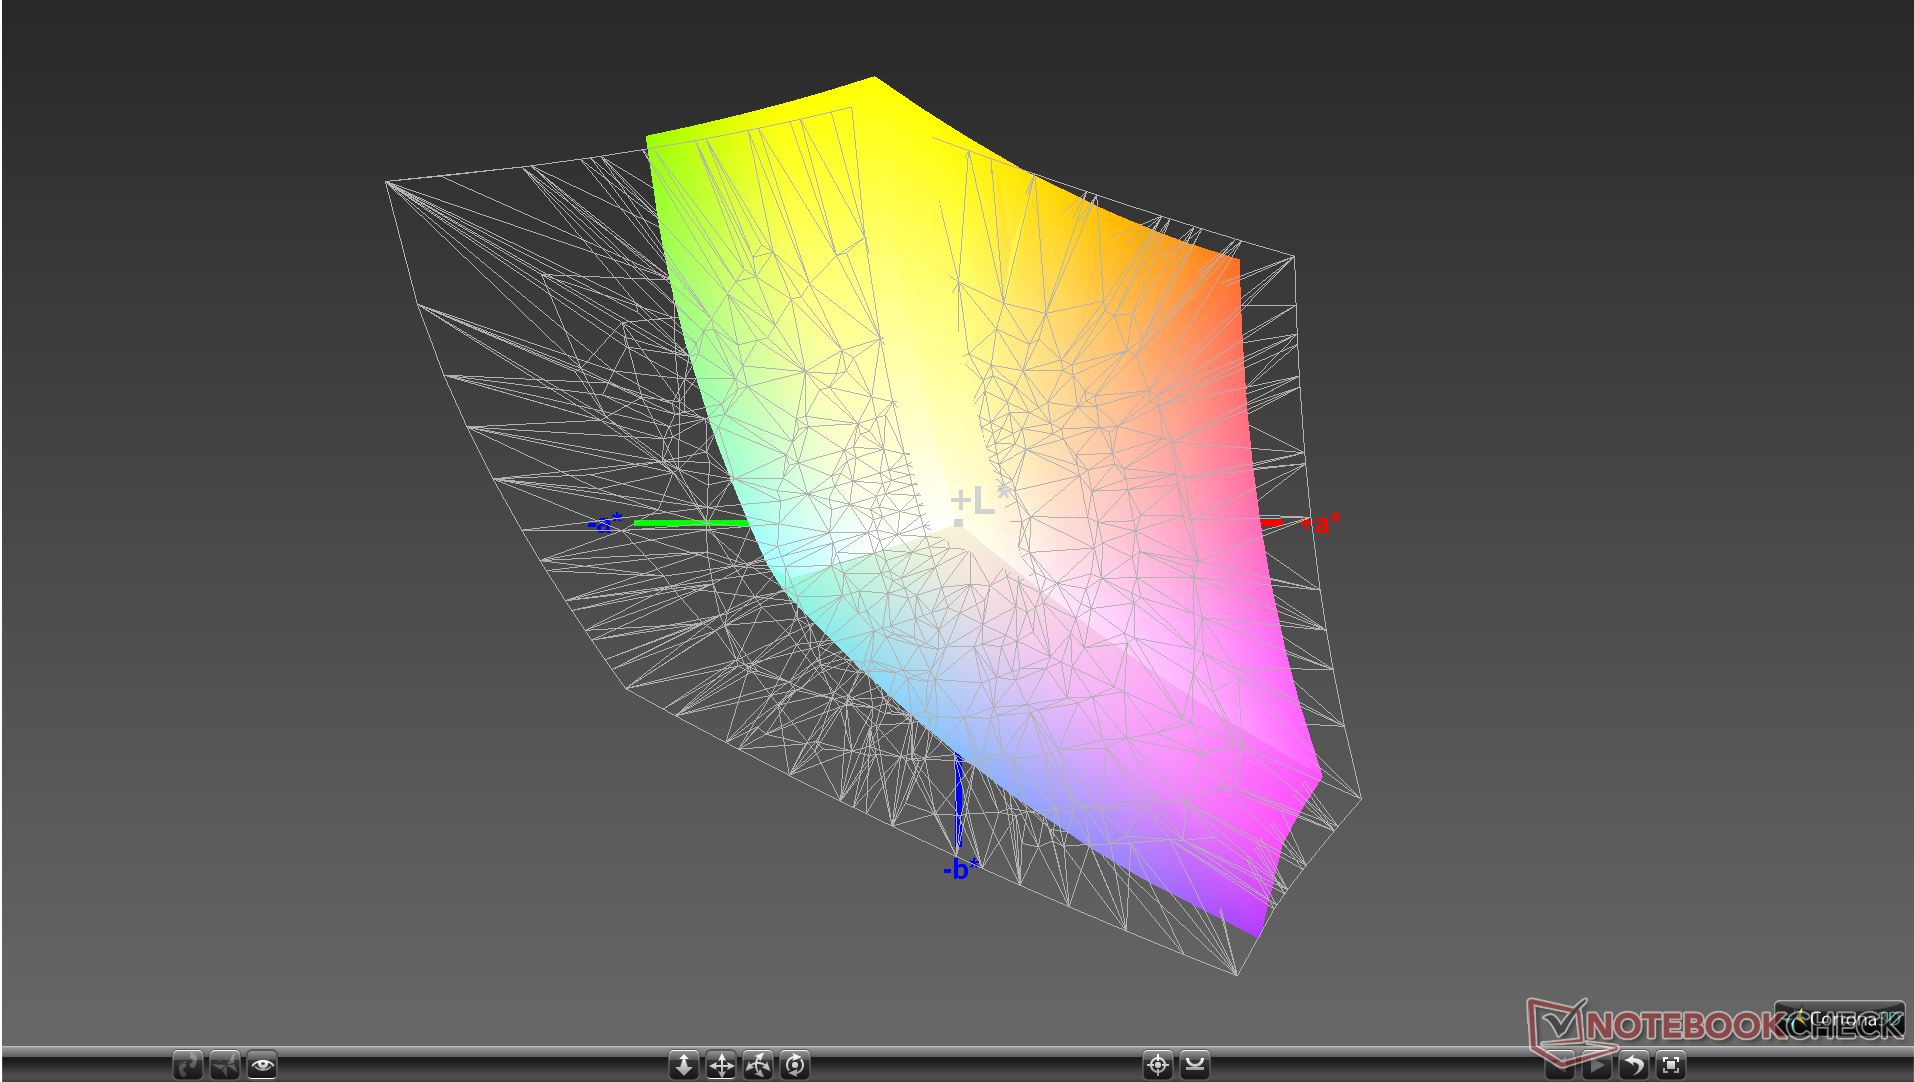
90.5% sRGB (Argyll 1.6.3 3D)
59% AdobeRGB 1998 (Argyll 1.6.3 3D)
66.3% AdobeRGB 1998 (Argyll 3D)
90.9% sRGB (Argyll 3D)
65.2% Display P3 (Argyll 3D)
Gamma: 2.26
CCT: 7392 K
| Eurocom Nightsky Ti15 AU Optronics B156HAN, IPS, 15.6", 1920x1080 | Aorus 15-SA LG Philips LP156WFG-SPB2 (LGD05E8), IPS, 15.6", 1920x1080 | Dell G5 15 5590 AU Optronics B156HAN, IPS, 15.6", 1920x1080 | HP Omen 15-dc1020ng LGD05CE, IPS, 15.6", 1920x1080 | HP Gaming Pavilion 15-dk0009ng LG Philips LGD05FE, IPS, 15.6", 1920x1080 | MSI GE63 Raider RGB 8RF-008 CMN N156HHE-GA1 (CMN15F4), TN, 15.6", 1920x1080 | |
|---|---|---|---|---|---|---|
| Display | 0% | -38% | -39% | 1% | 26% | |
| Display P3 Coverage (%) | 65.2 | 64.3 -1% | 39.26 -40% | 38.37 -41% | 64.2 -2% | 90 38% |
| sRGB Coverage (%) | 90.9 | 93.6 3% | 59.1 -35% | 57.6 -37% | 95.1 5% | 100 10% |
| AdobeRGB 1998 Coverage (%) | 66.3 | 65.6 -1% | 40.56 -39% | 39.69 -40% | 65.8 -1% | 86 30% |
| Response Times | -21% | -213% | -193% | -11% | -67% | |
| Response Time Grey 50% / Grey 80% * (ms) | 14.4 ? | 15.6 ? -8% | 45 ? -213% | 40 ? -178% | 16.4 ? -14% | 24.4 ? -69% |
| Response Time Black / White * (ms) | 9.6 ? | 12.8 ? -33% | 30 ? -213% | 29.6 ? -208% | 10.4 ? -8% | 15.8 ? -65% |
| PWM Frequency (Hz) | 25510 ? | |||||
| Screen | 8% | -40% | -27% | 22% | 0% | |
| Brightness middle (cd/m²) | 331 | 266 -20% | 234 -29% | 251 -24% | 345 4% | 292 -12% |
| Brightness (cd/m²) | 327 | 254 -22% | 219 -33% | 232 -29% | 324 -1% | 258 -21% |
| Brightness Distribution (%) | 83 | 90 8% | 82 -1% | 76 -8% | 86 4% | 81 -2% |
| Black Level * (cd/m²) | 0.35 | 0.28 20% | 0.17 51% | 0.17 51% | 0.42 -20% | 0.23 34% |
| Contrast (:1) | 946 | 950 0% | 1376 45% | 1476 56% | 821 -13% | 1270 34% |
| Colorchecker dE 2000 * | 4.22 | 3.11 26% | 8.6 -104% | 6.2 -47% | 1.3 69% | 5.82 -38% |
| Colorchecker dE 2000 max. * | 6.95 | 5.84 16% | 17.49 -152% | 18.6 -168% | 2.8 60% | 9.05 -30% |
| Colorchecker dE 2000 calibrated * | 3.27 | 1.37 58% | 4.06 -24% | 4.8 -47% | 1.1 66% | 2.82 14% |
| Greyscale dE 2000 * | 3.9 | 3.94 -1% | 8.55 -119% | 4.2 -8% | 1.2 69% | 4.61 -18% |
| Gamma | 2.26 97% | 2.53 87% | 3.02 73% | 2.32 95% | 2.31 95% | 2.65 83% |
| CCT | 7392 88% | 6210 105% | 7802 83% | 7454 87% | 6476 100% | 6950 94% |
| Color Space (Percent of AdobeRGB 1998) (%) | 59 | 60 2% | 37 -37% | 36.5 -38% | 60.5 3% | 76 29% |
| Color Space (Percent of sRGB) (%) | 90.5 | 93 3% | 59 -35% | 57.4 -37% | 94.9 5% | 100 10% |
| Total Average (Program / Settings) | -4% /
3% | -97% /
-61% | -86% /
-50% | 4% /
14% | -14% /
-4% |
* ... smaller is better
Color space is not unlike most Ultrabooks at >90 percent sRGB and about 60 percent of AdobeRGB. It may not be HDR compatible, but it's good enough for gaming purposes.
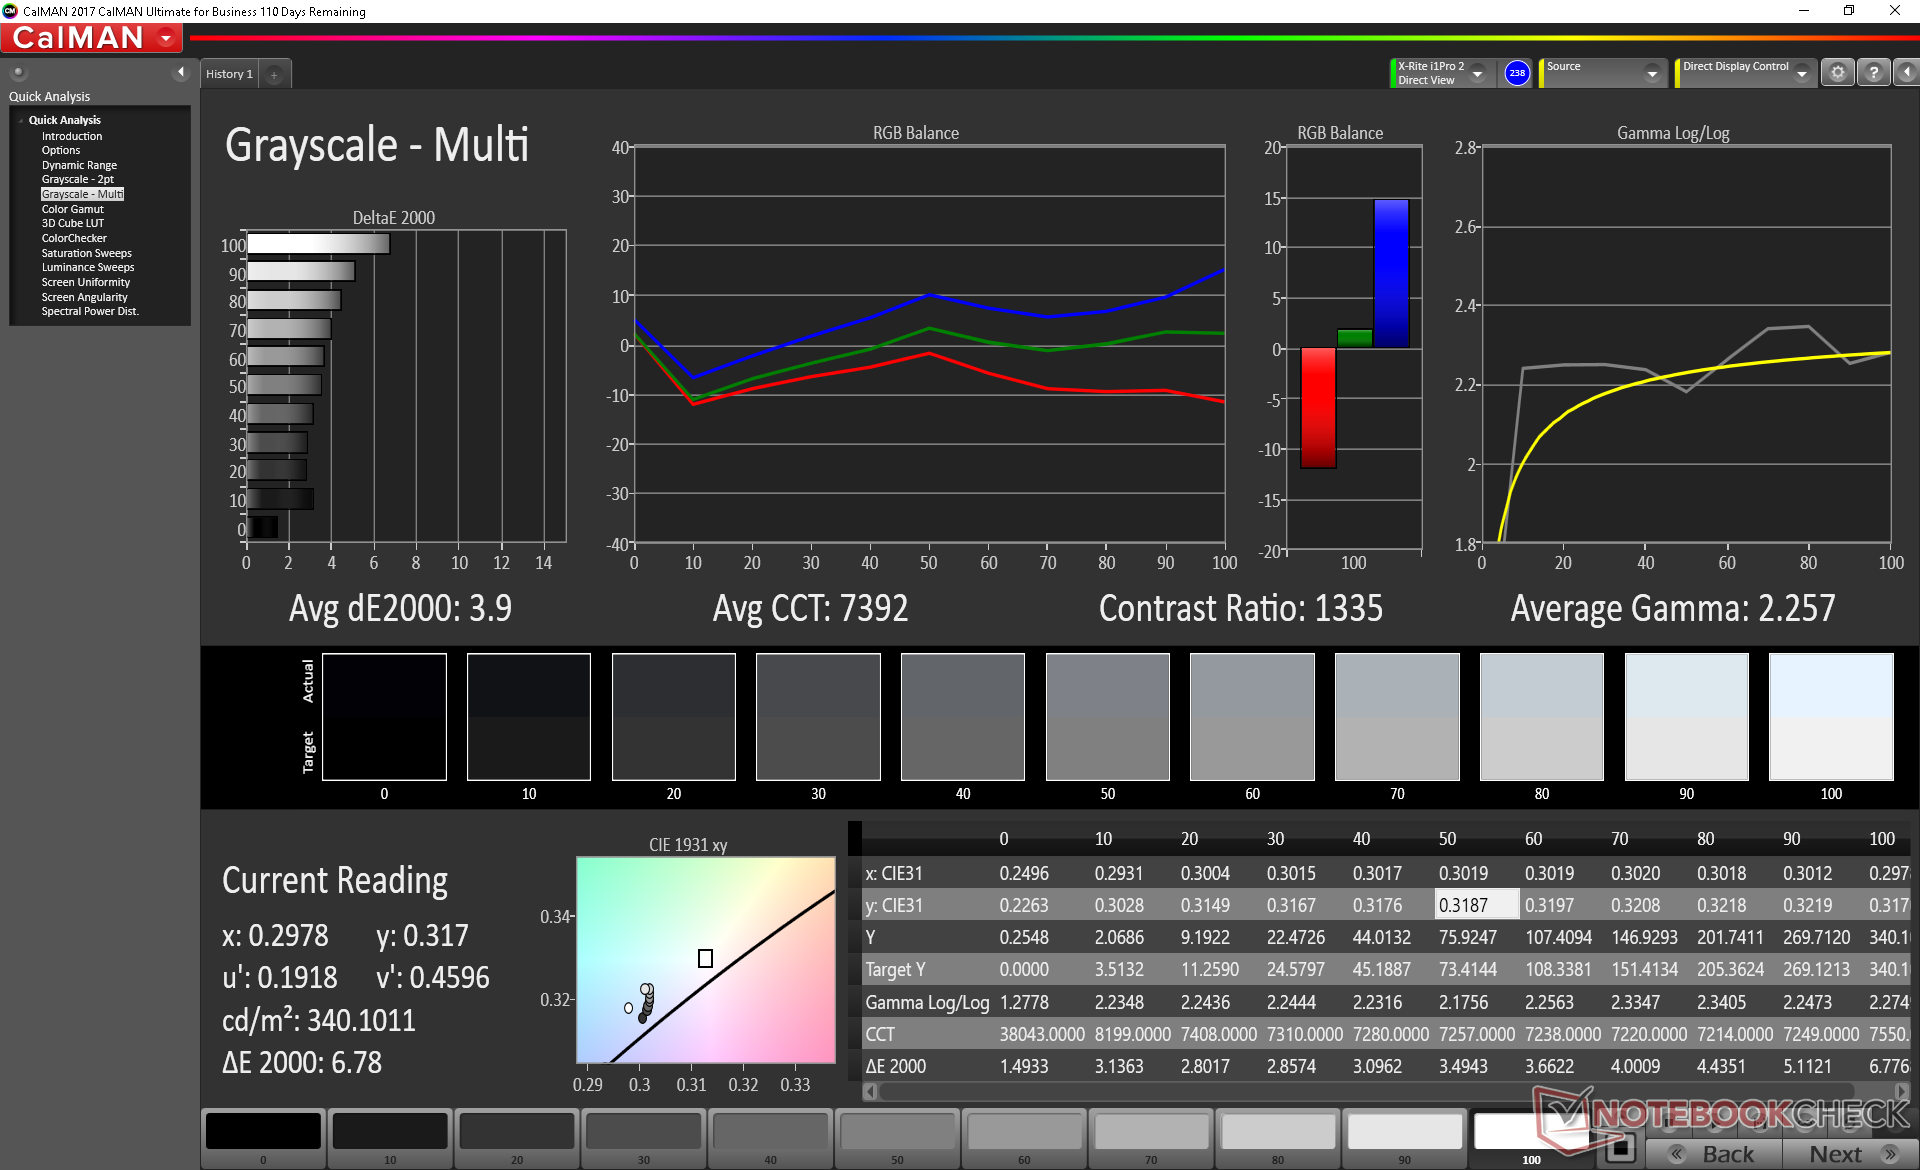
Further measurements with an X-Rite colorimeter reveal generally good grayscale and colors out of the box. Our calibration attempt improves the display even further with final average grayscale and color deltaE values of 2.2 and 3.27, respectively.
Display Response Times
| ↔ Response Time Black to White | ||
|---|---|---|
| 9.6 ms ... rise ↗ and fall ↘ combined | ↗ 5.2 ms rise | 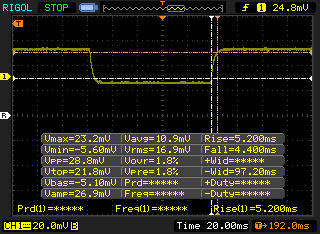 |
| ↘ 4.4 ms fall | ||
| The screen shows fast response rates in our tests and should be suited for gaming. In comparison, all tested devices range from 0.1 (minimum) to 240 (maximum) ms. » 26 % of all devices are better. This means that the measured response time is better than the average of all tested devices (19.8 ms). | ||
| ↔ Response Time 50% Grey to 80% Grey | ||
| 14.4 ms ... rise ↗ and fall ↘ combined | ↗ 7.2 ms rise | 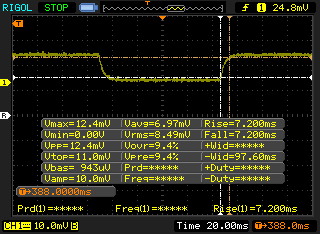 |
| ↘ 7.2 ms fall | ||
| The screen shows good response rates in our tests, but may be too slow for competitive gamers. In comparison, all tested devices range from 0.165 (minimum) to 636 (maximum) ms. » 28 % of all devices are better. This means that the measured response time is better than the average of all tested devices (31 ms). | ||
Screen Flickering / PWM (Pulse-Width Modulation)
| Screen flickering / PWM not detected | 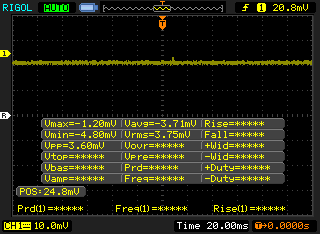 | ||
In comparison: 52 % of all tested devices do not use PWM to dim the display. If PWM was detected, an average of 7747 (minimum: 5 - maximum: 343500) Hz was measured. | |||
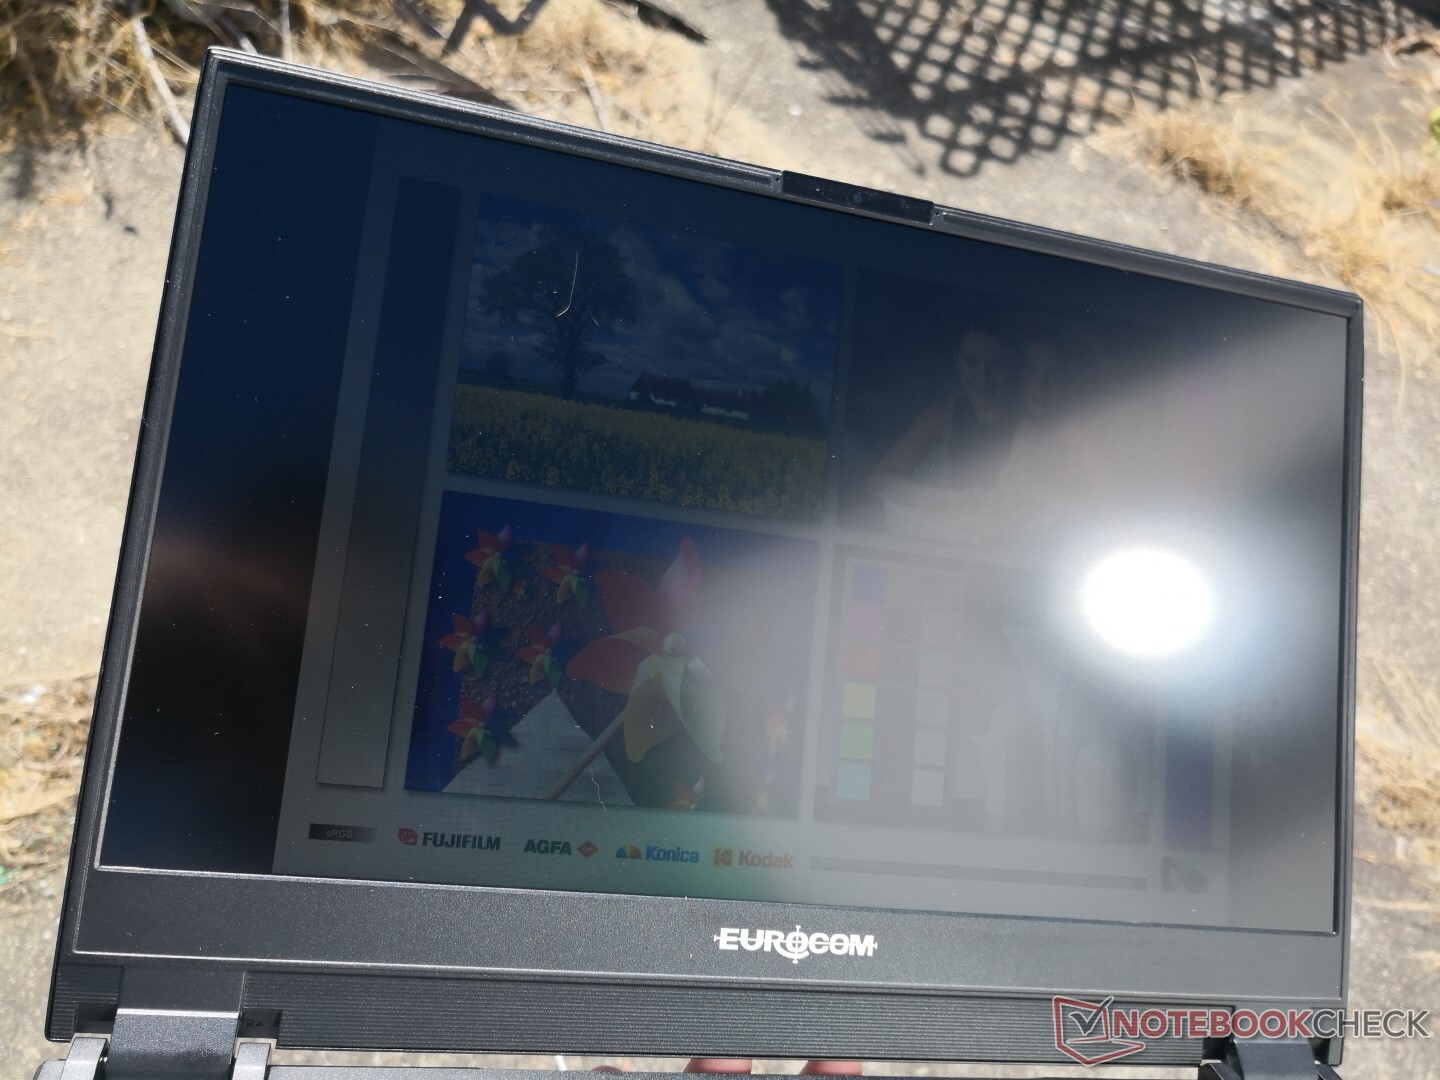
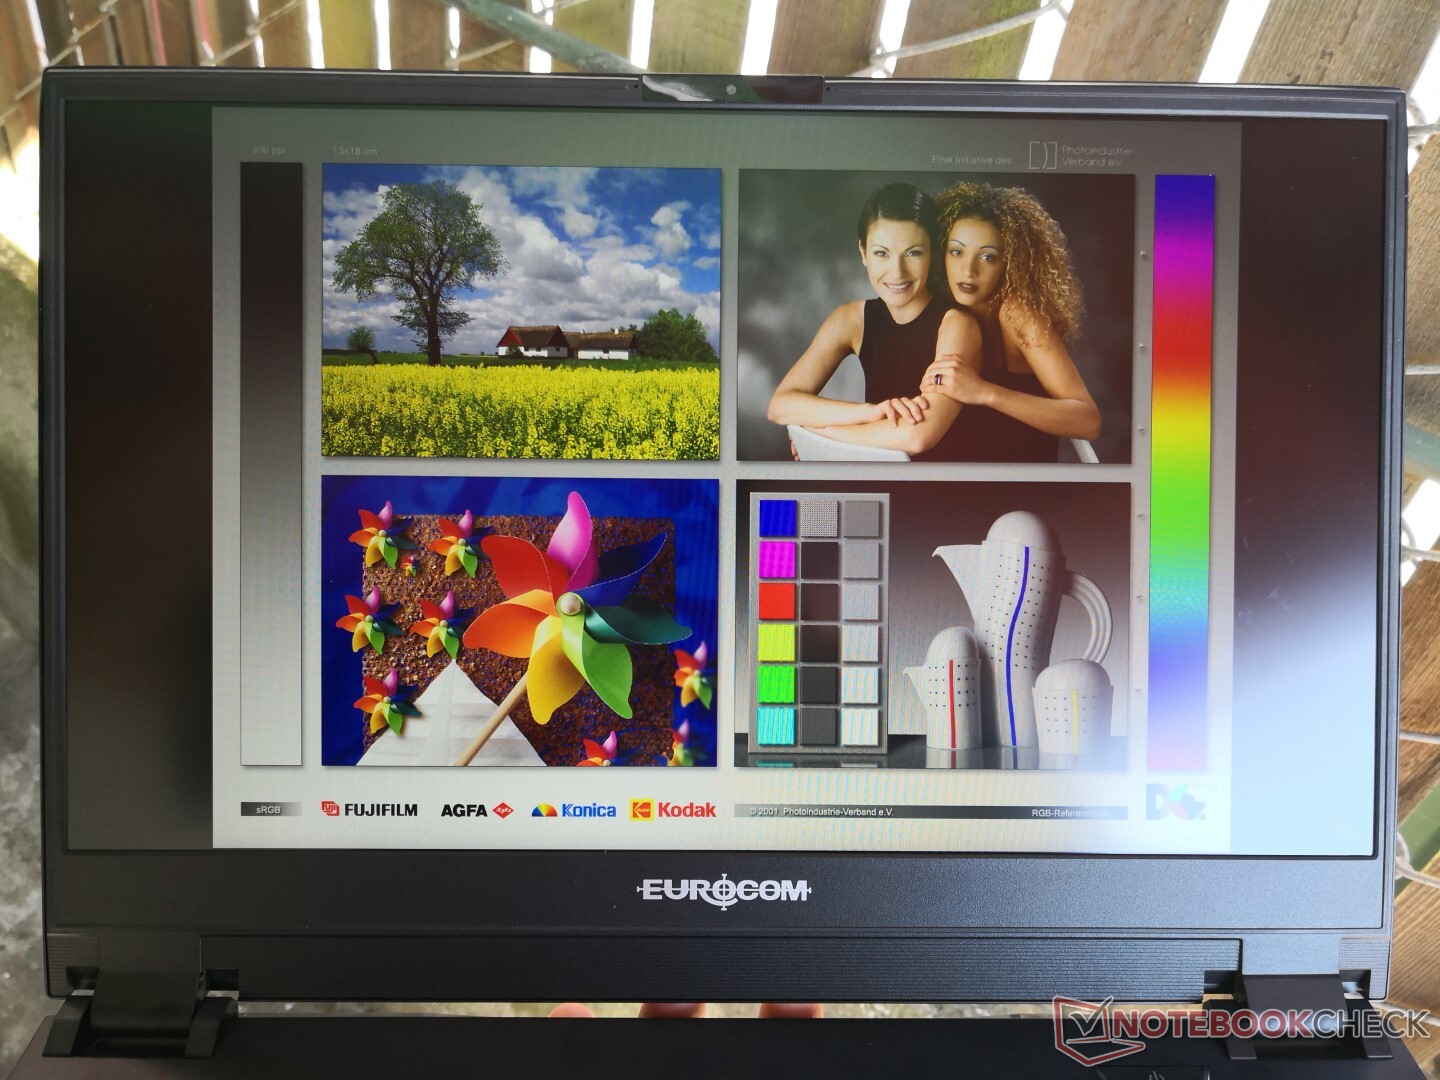
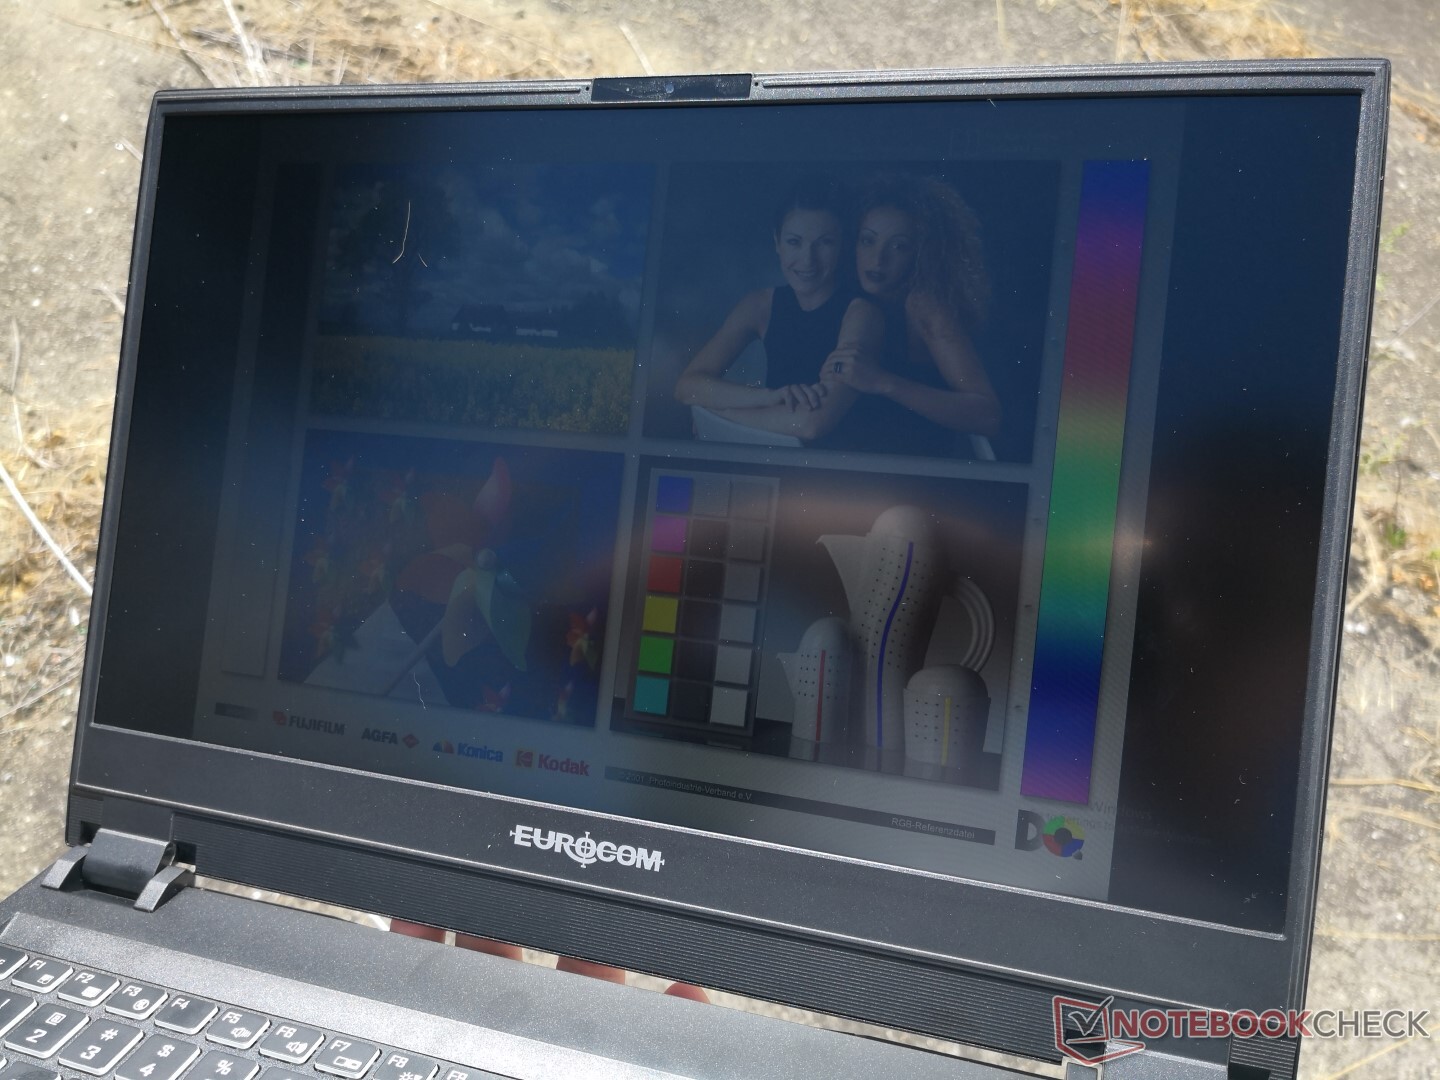
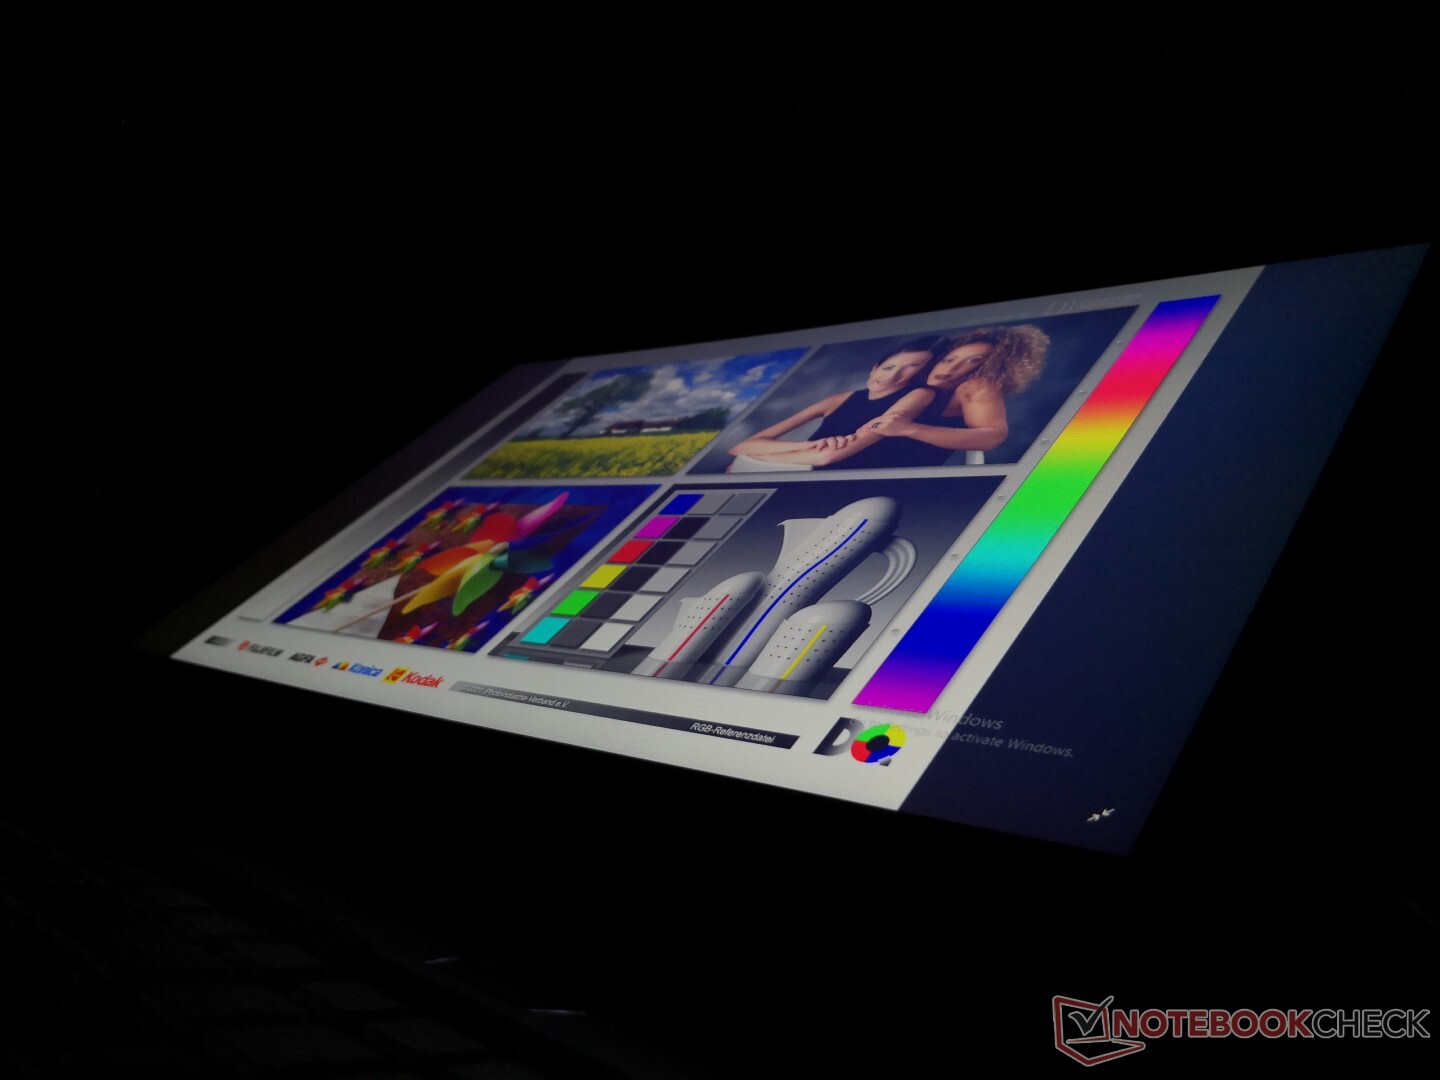
Outdoor visibility is pretty good when under shade, but otherwise poor when under sunlight or on a bright cloudy day. This system was not designed to be used outdoors frequently despite the matte panel, narrow bezels, and wide viewing angles.
Performance
The Eurocom Nightsky 15 series is unusual because it has only Core i7 and Core i9 options with GeForce GTX 1660 Ti or RTX 2070 graphics and nothing else. This makes the system one of the only gaming laptops you can configure with an enthusiast Core i9-9980HK CPU and a budget-midrange GTX 1660 Ti.
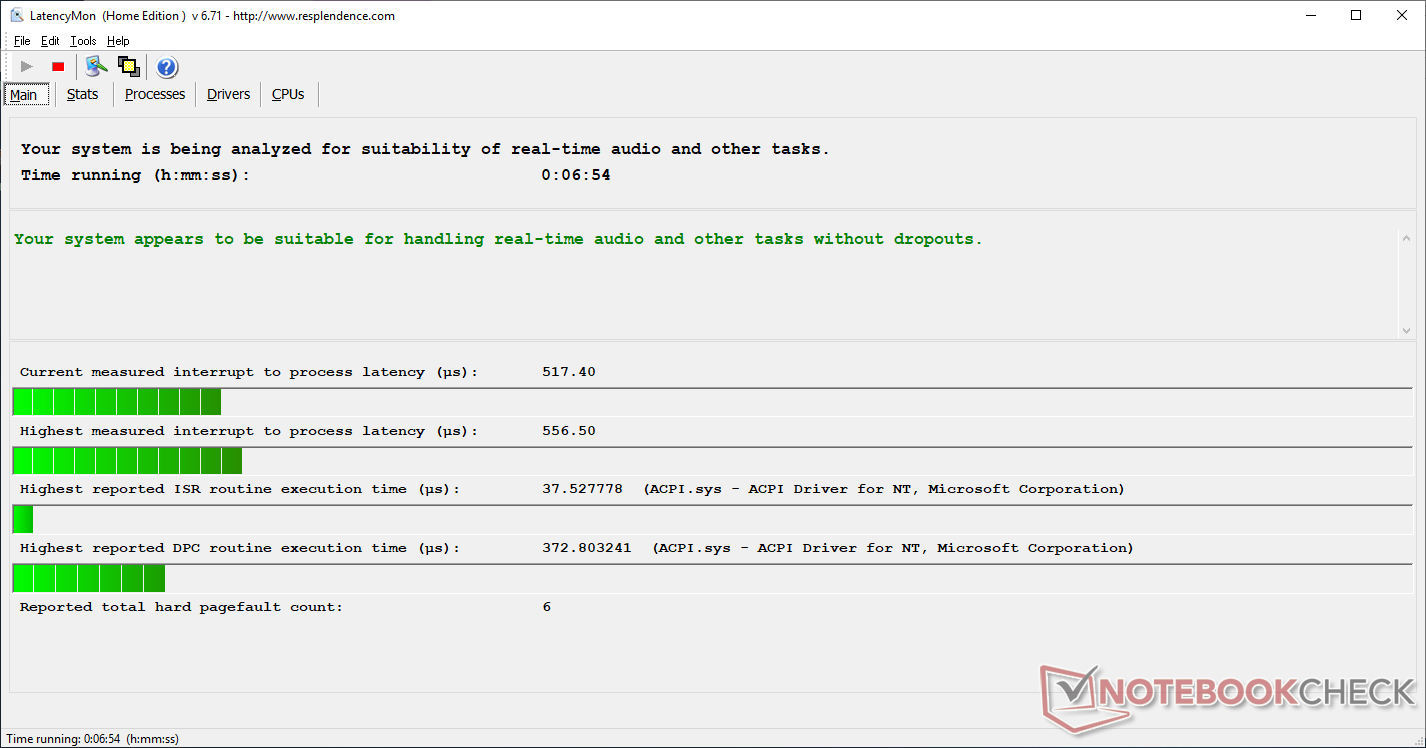
LatencyMon shows no DPC latency issues. Eurocom and Clevo systems are generally very light when it comes to pre-loaded applications and so background activities are kept to a minimum.
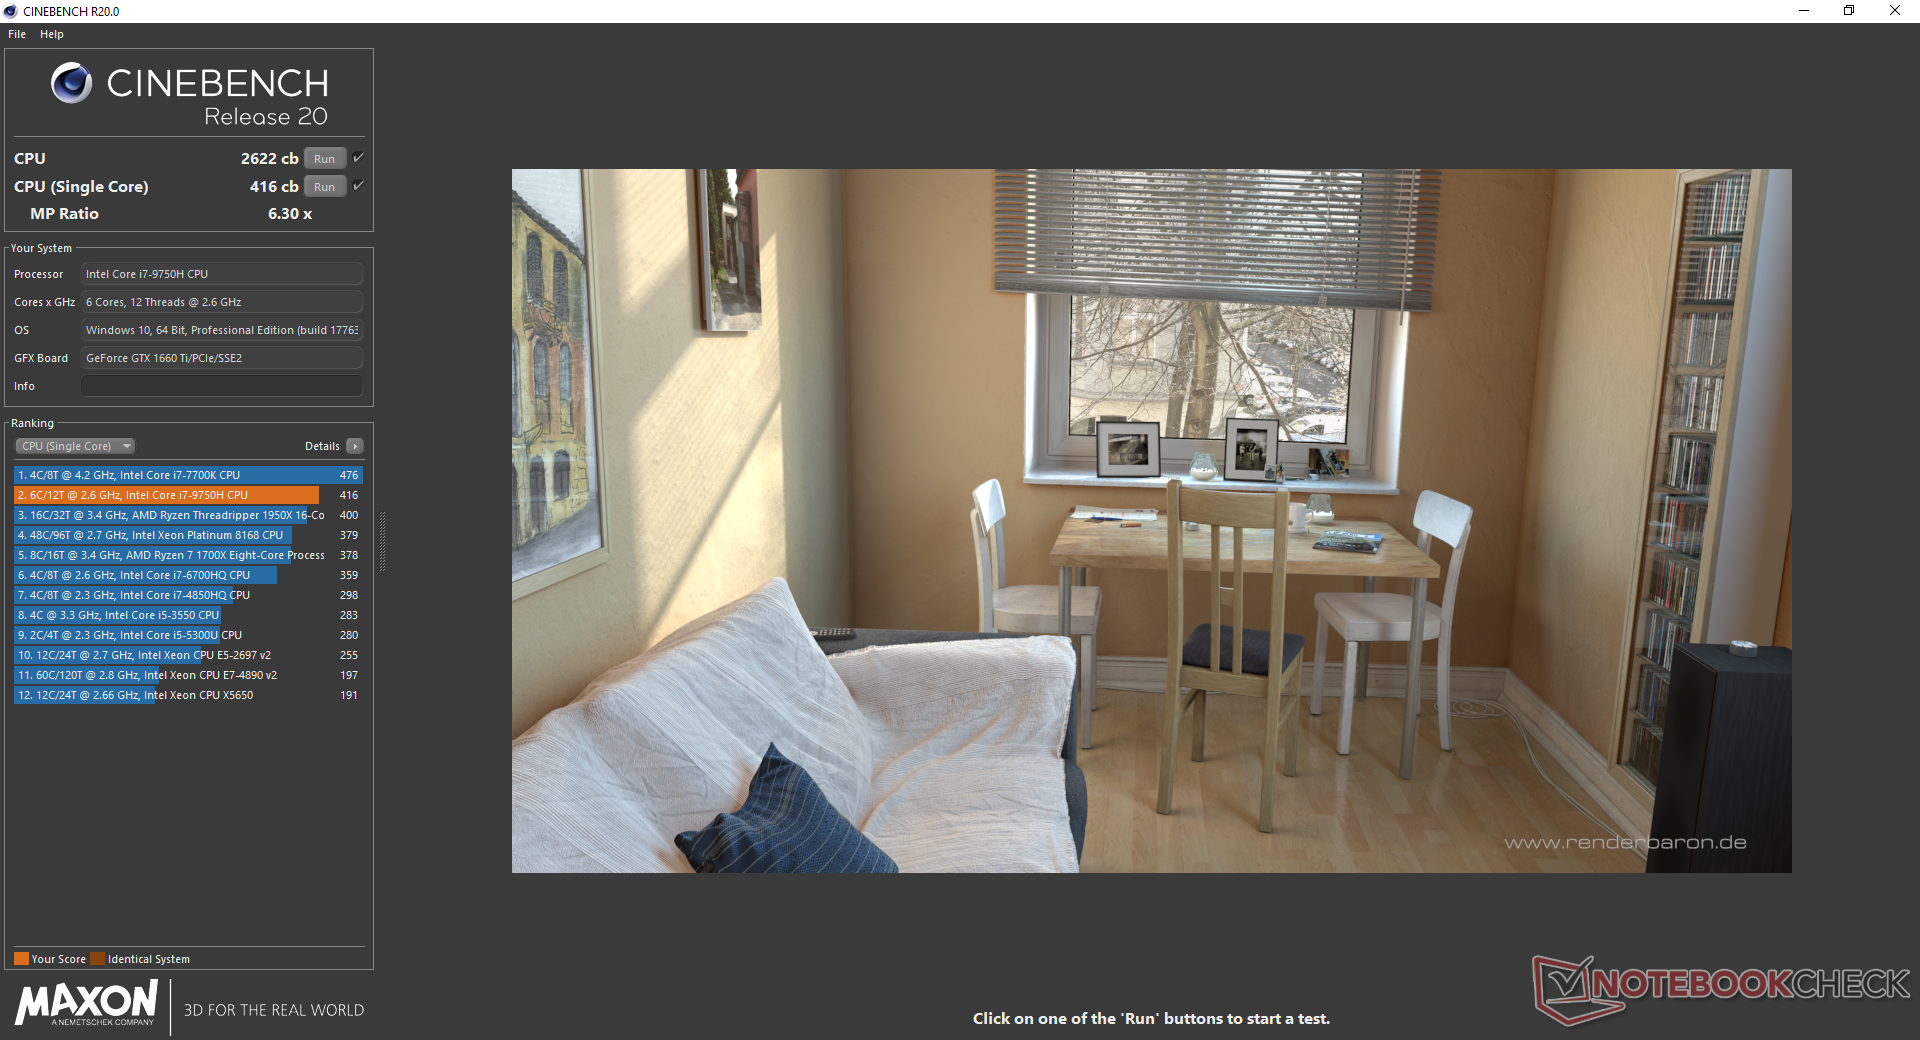
Processor
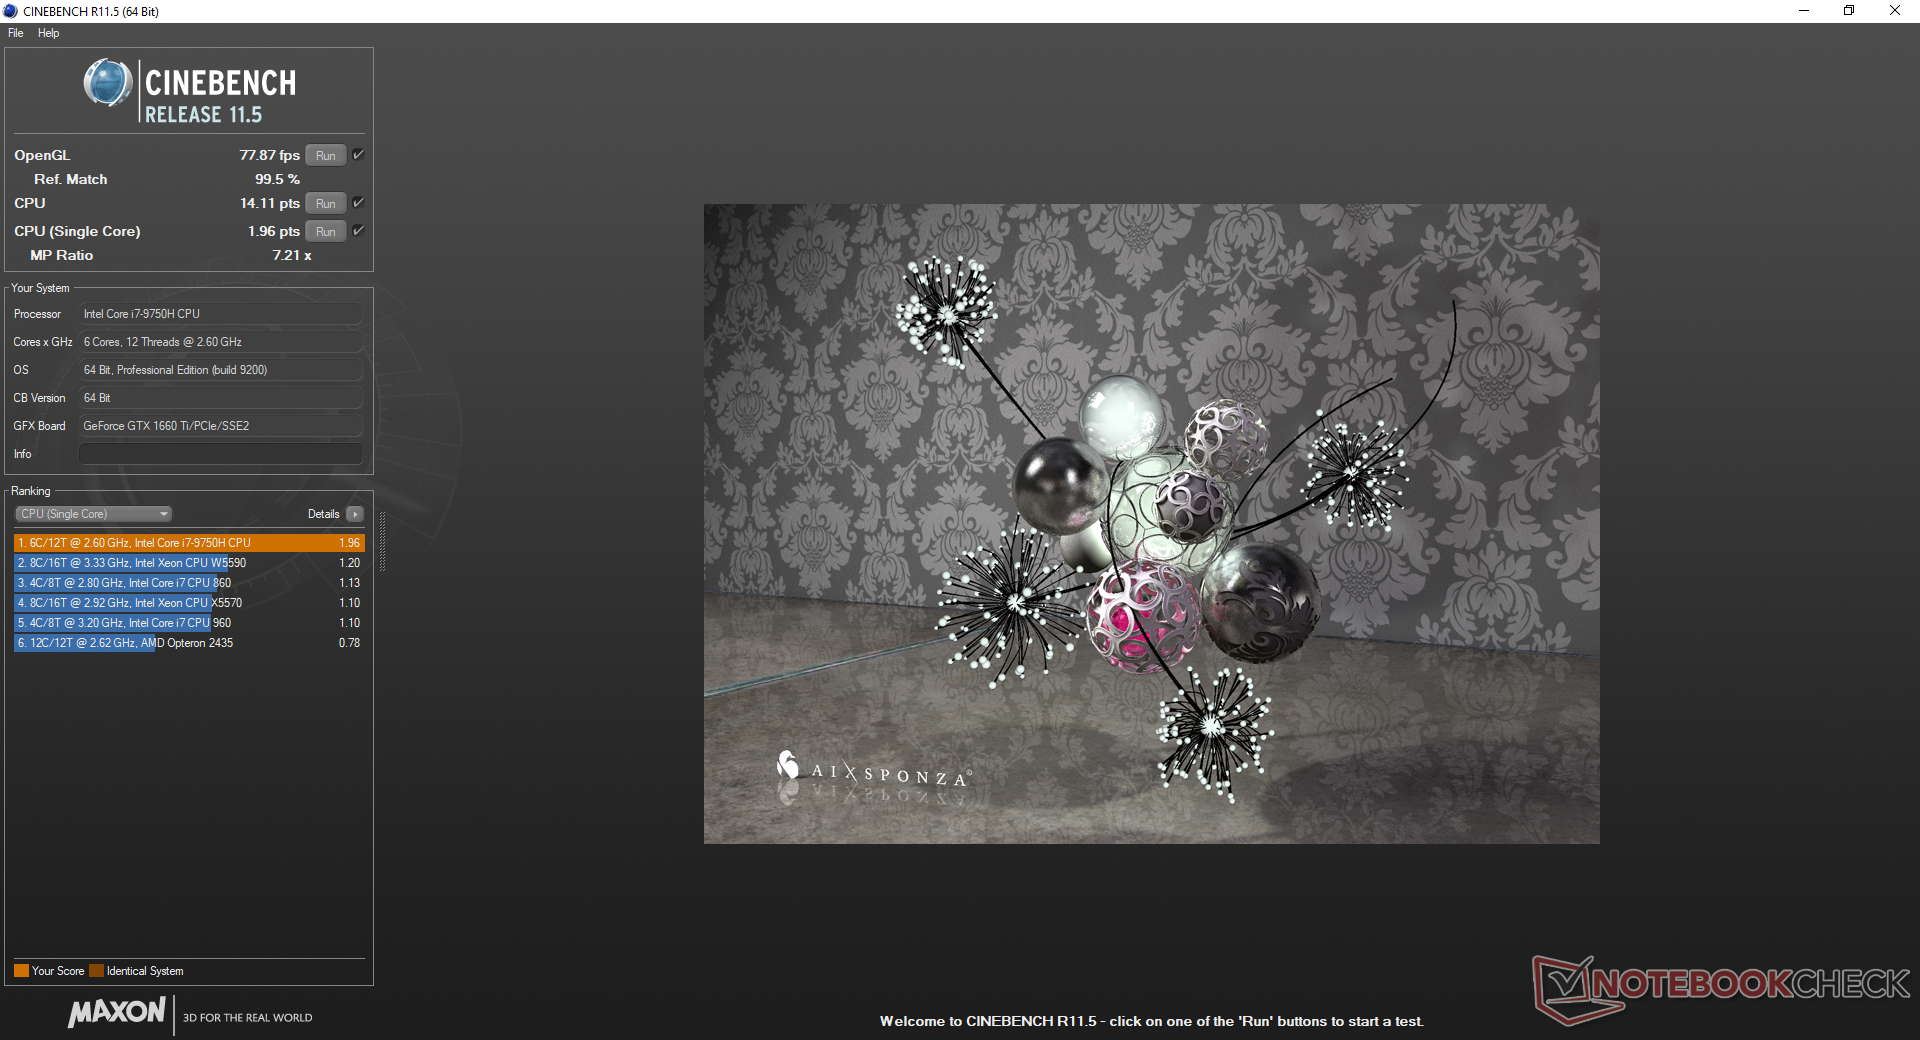
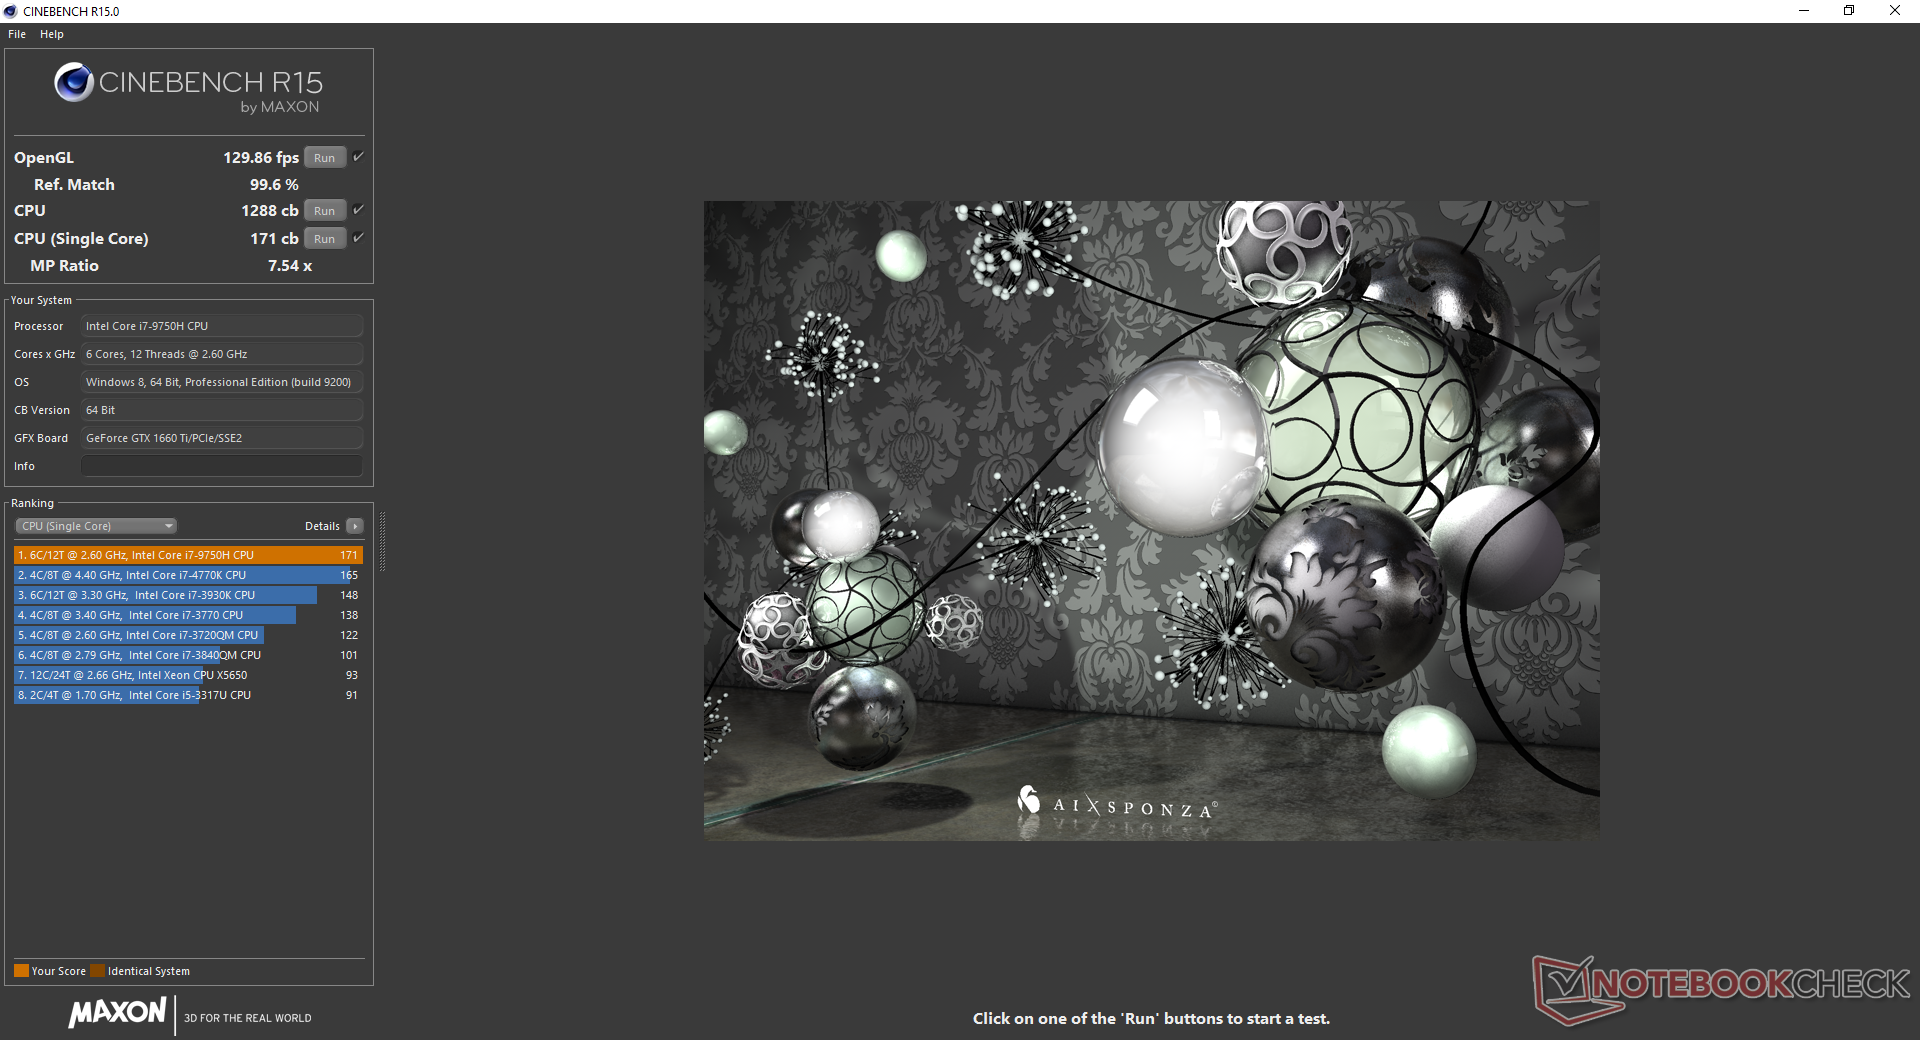
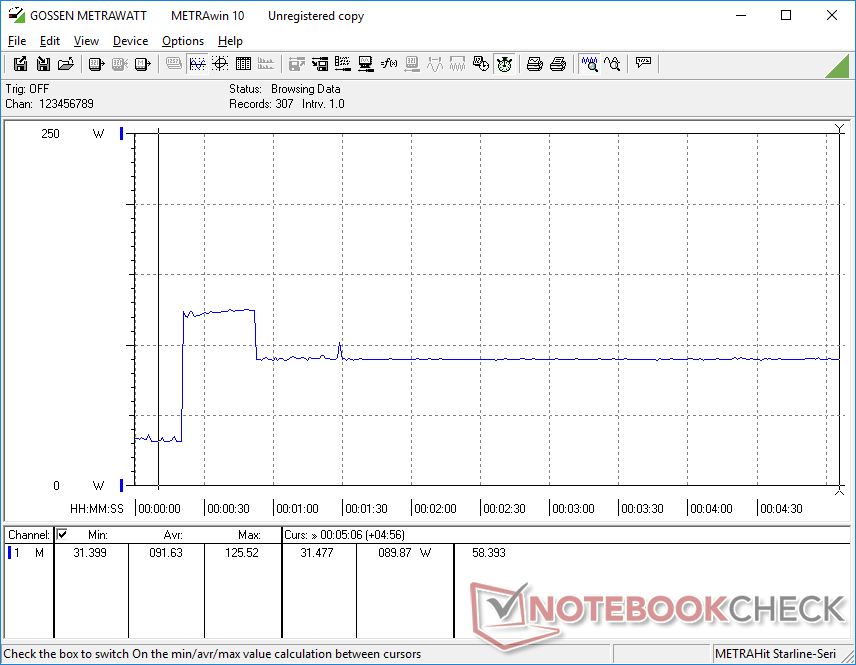
CPU performance is almost 10 percent faster than the average Core i7-9750H in our database according to CineBench R15. However, this healthy lead doesn't last very long as maximum Turbo Boost is only temporary. When running CineBench R15 Multi-Thread in a loop, performance drops by about 15 percent from the high initial score as shown by our graph below. Raw performance is still significantly faster than the quad-core Core i7-9300H and older Core i7-7700HQ by about 60 to 70 percent.
See our dedicated page on the Core i7-9750H for more technical information and benchmark comparisons.
| Cinebench R15 | |
| CPU Single 64Bit | |
| Schenker | |
| Eurocom Sky X4C | |
| Alienware m17 P37E | |
| MSI GE75 9SG | |
| Average Intel Core i7-9750H (170 - 194, n=82) | |
| MSI GF63 8RC-040XPL | |
| HP Omen 15-dc1303ng | |
| Eurocom Nightsky Ti15 | |
| Asus FX503VM-EH73 | |
| Asus ROG Zephyrus G15 GA502DU | |
| CPU Multi 64Bit | |
| Schenker | |
| Schenker | |
| MSI GE75 9SG | |
| Eurocom Sky X4C | |
| Eurocom Nightsky Ti15 | |
| Alienware m17 P37E | |
| Average Intel Core i7-9750H (952 - 1306, n=85) | |
| HP Omen 15-dc1303ng | |
| MSI GF63 8RC-040XPL | |
| Asus ROG Zephyrus G15 GA502DU | |
| Asus FX503VM-EH73 | |
| Cinebench R10 | |
| Rendering Multiple CPUs 32Bit | |
| MSI GE75 9SG | |
| Eurocom Sky X4C | |
| Average Intel Core i7-9750H (28251 - 36304, n=13) | |
| Asus FX503VM-EH73 | |
| Asus ROG Zephyrus G15 GA502DU | |
| Rendering Single 32Bit | |
| Eurocom Sky X4C | |
| MSI GE75 9SG | |
| Average Intel Core i7-9750H (6659 - 7214, n=13) | |
| Asus FX503VM-EH73 | |
| Asus ROG Zephyrus G15 GA502DU | |
| wPrime 2.10 - 1024m | |
| MSI GF63 8RC-040XPL | |
| Asus FX503VM-EH73 | |
| Asus ROG Zephyrus G15 GA502DU | |
| Average Intel Core i7-9750H (n=1) | |
| Eurocom Sky X4C | |
| MSI GE75 9SG | |
* ... smaller is better
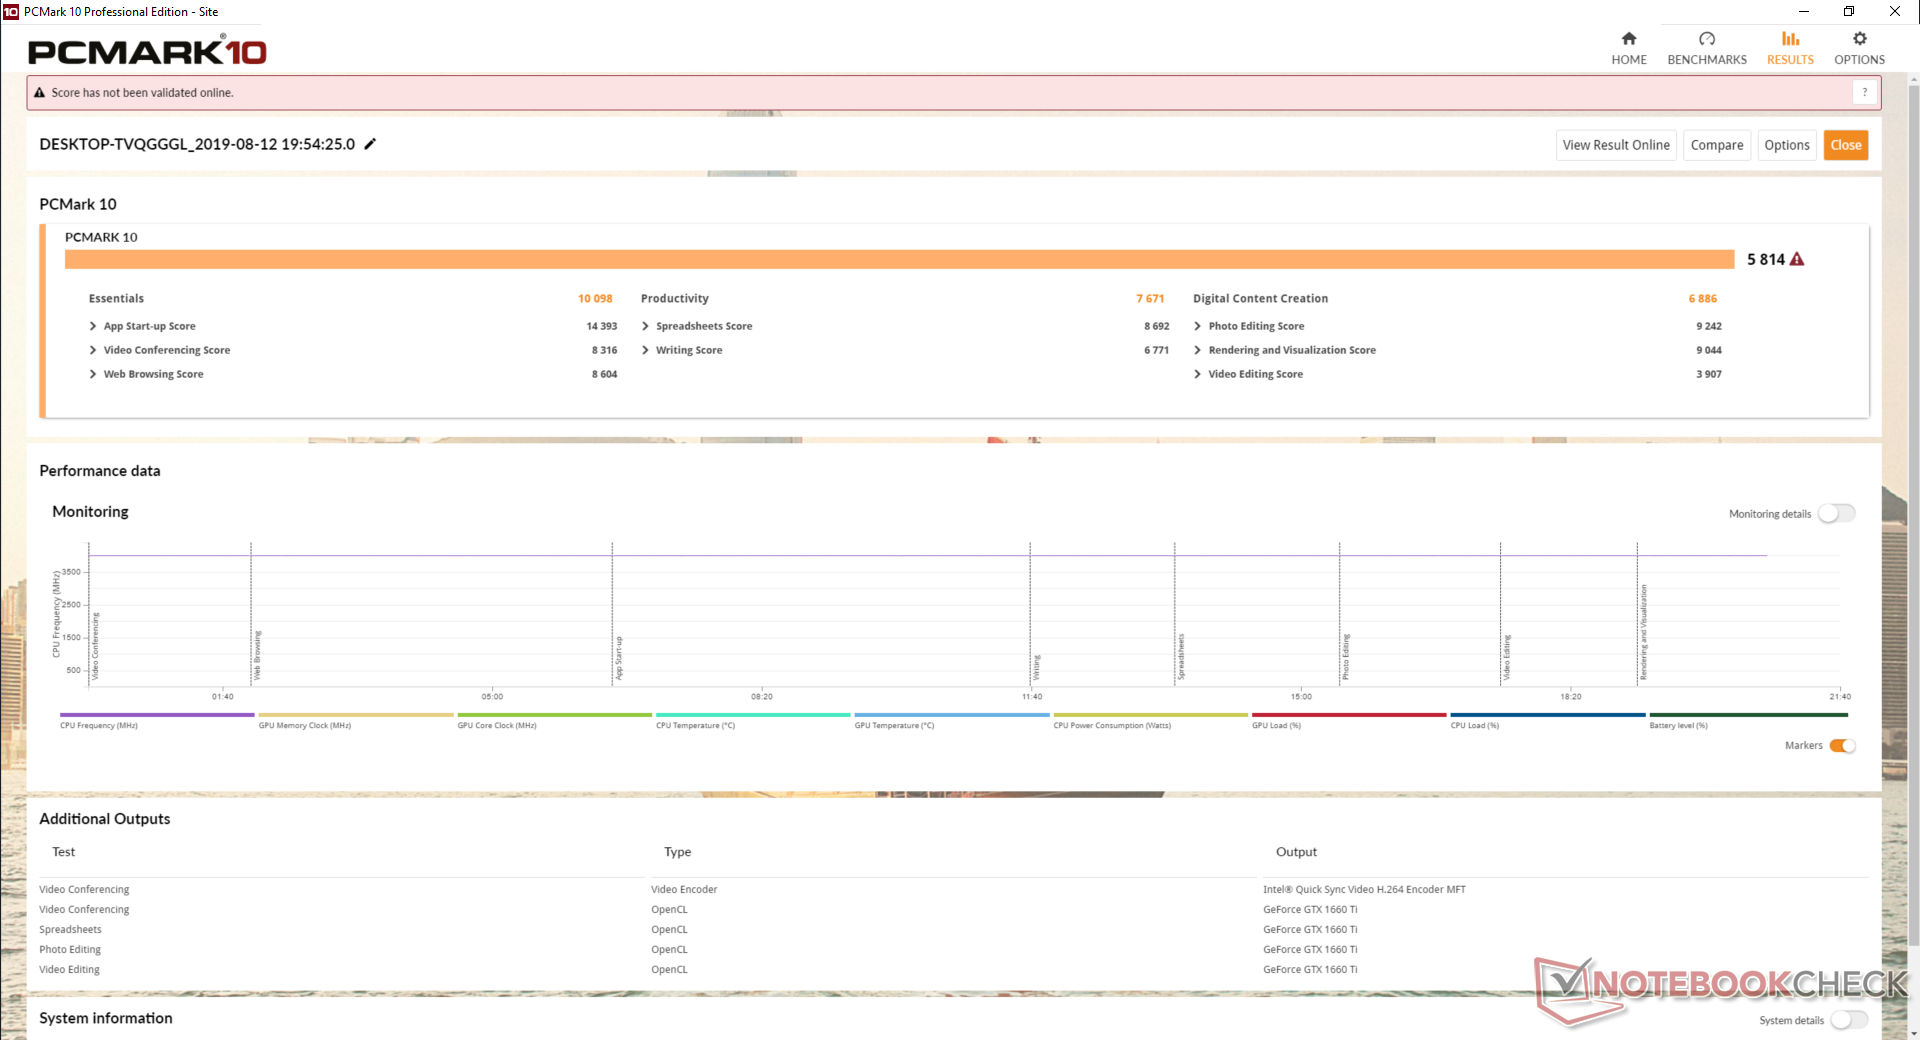
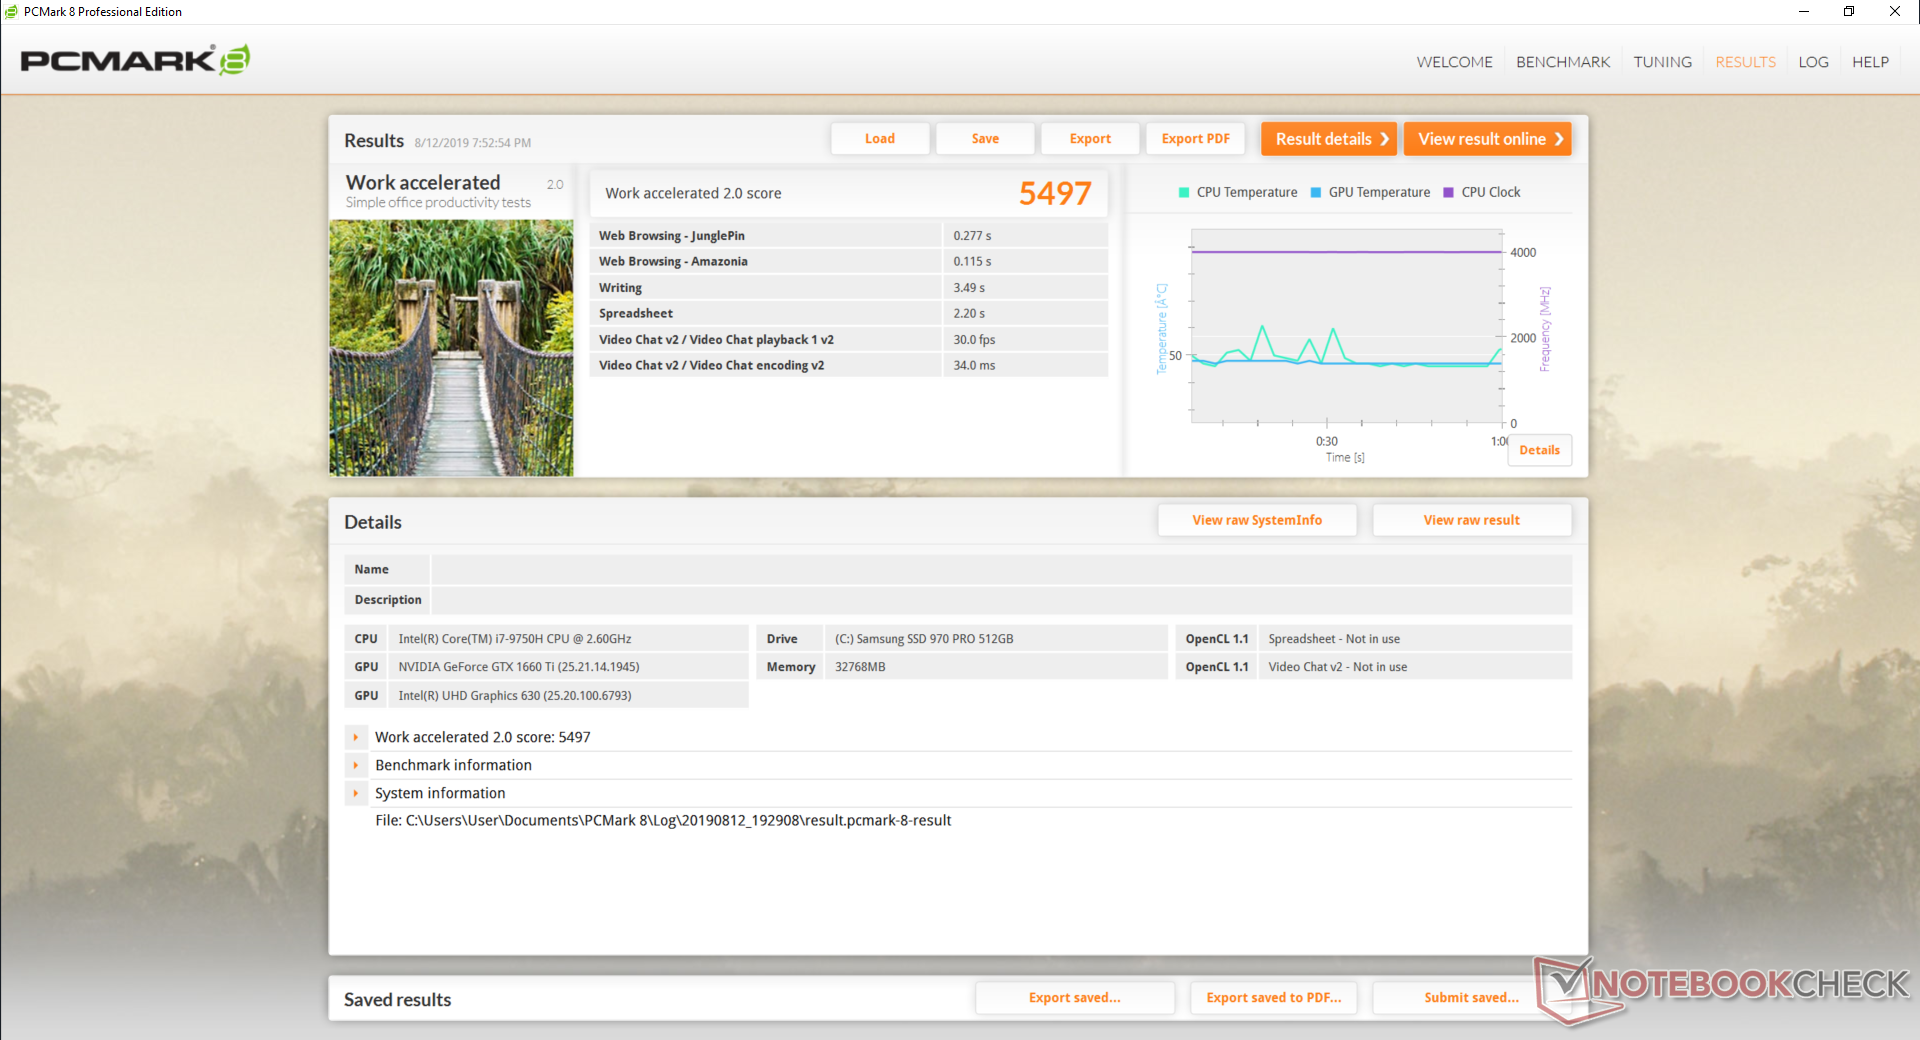
System Performance
PCMark benchmarks are where we expect them to be in relation to other gaming laptops with a similar class GPU. The much larger and more powerful Eurocom Sky X7C with its desktop i9-9900K and GeForce RTX 2080 is still the champ in these particular tests.
We experienced no software or hardware issues during our time with the test unit.
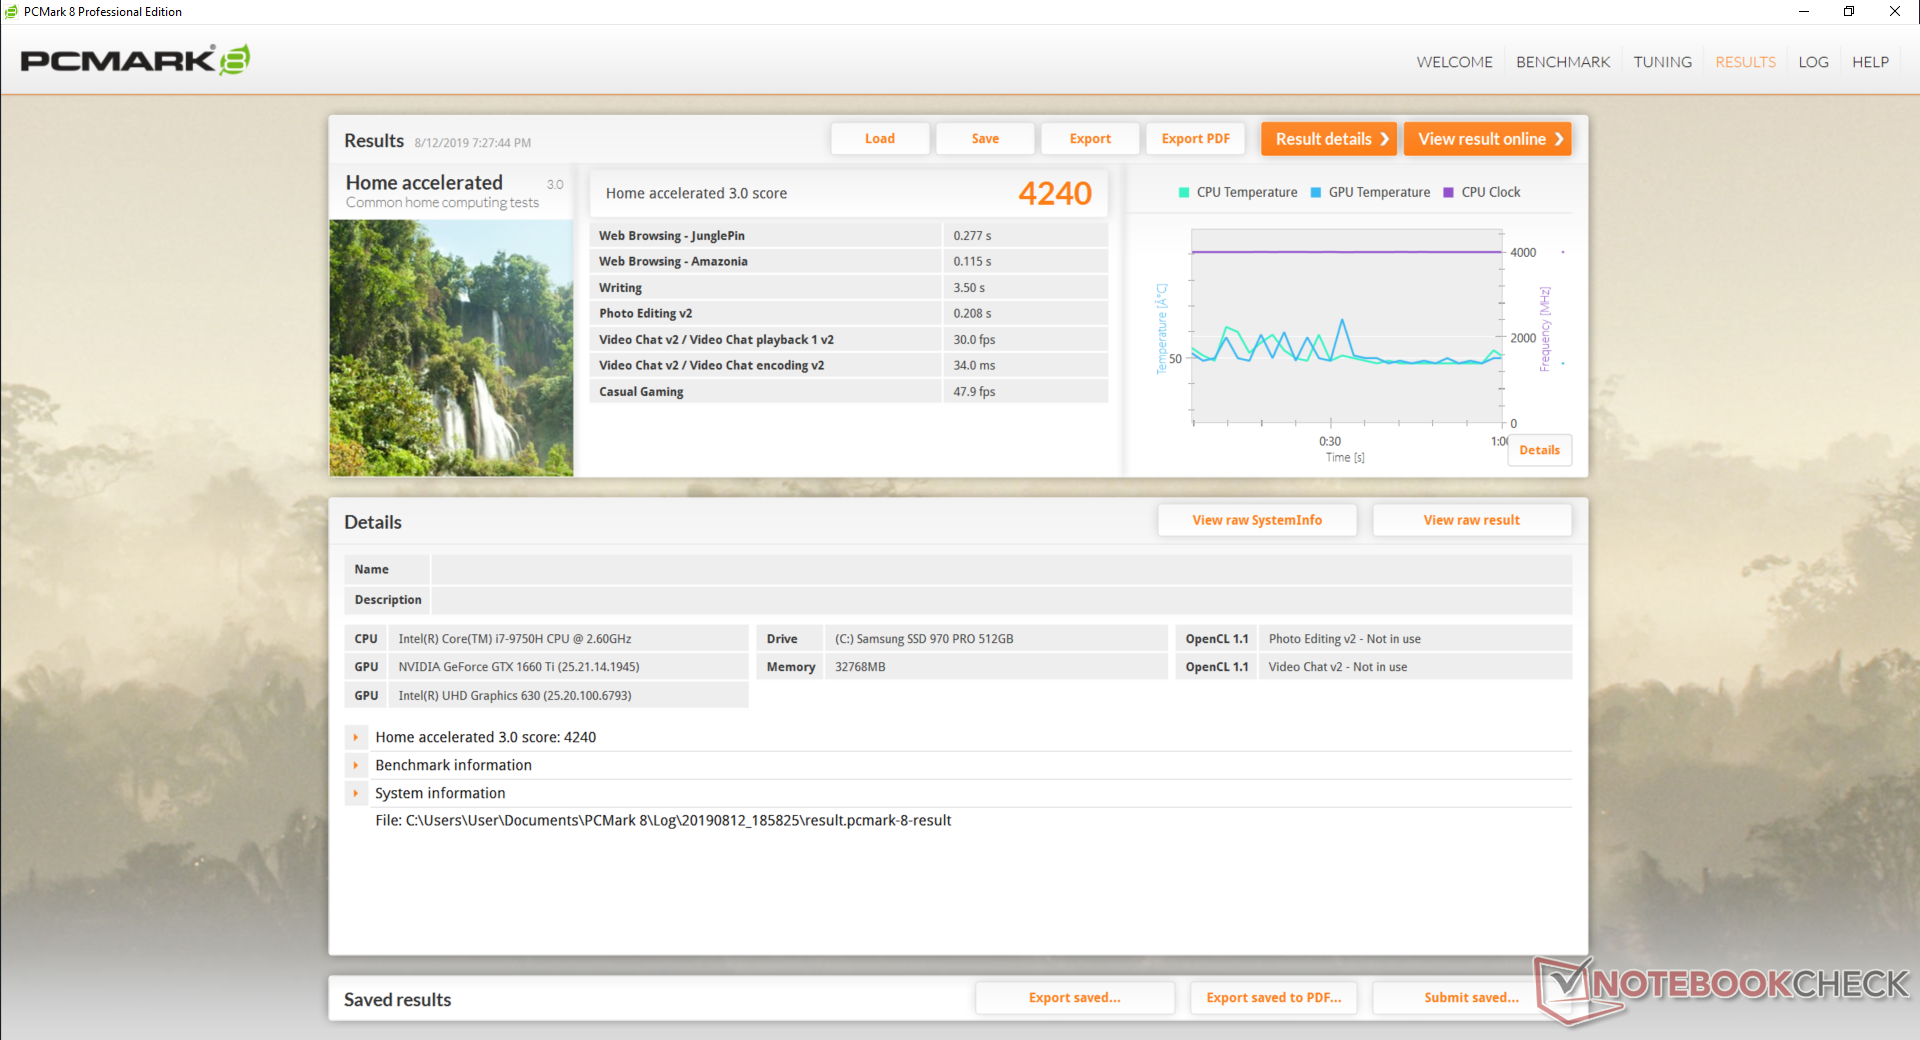
| PCMark 8 Home Score Accelerated v2 | 4240 points | |
| PCMark 8 Work Score Accelerated v2 | 5497 points | |
| PCMark 10 Score | 5814 points | |
Help | ||
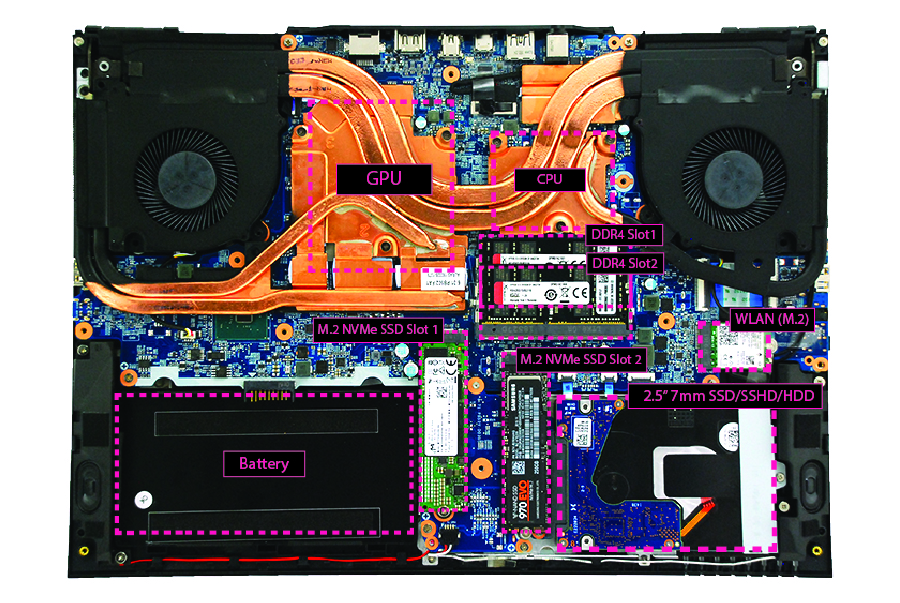
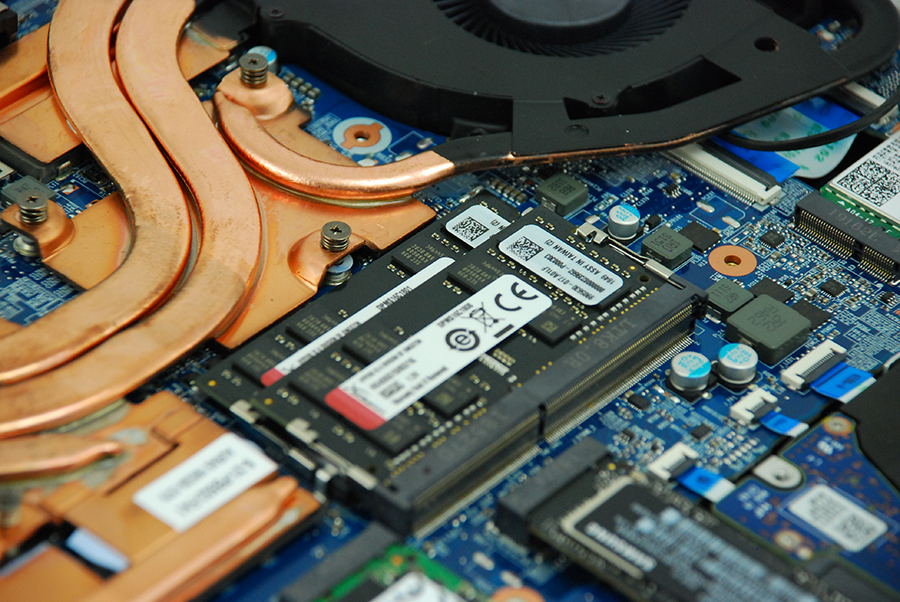
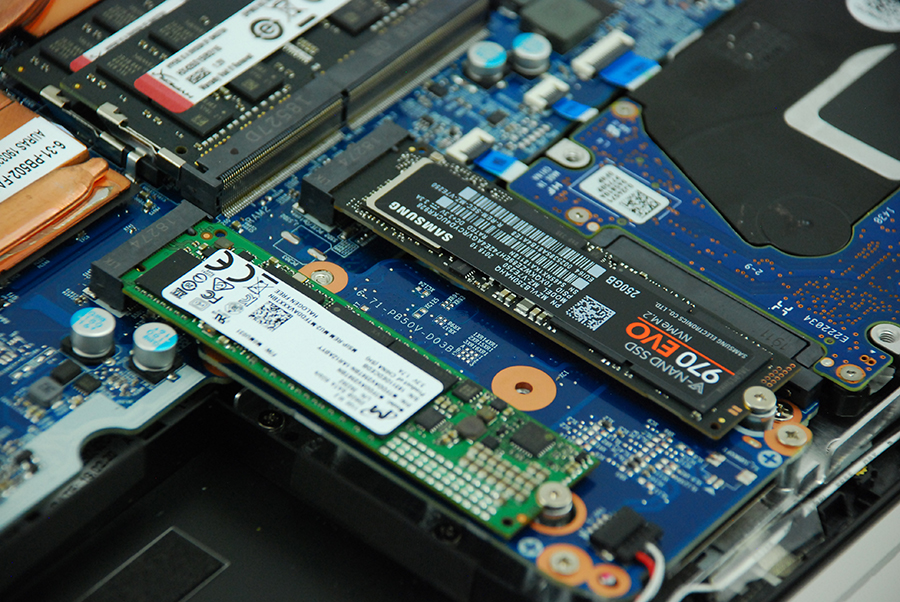
Storage Devices
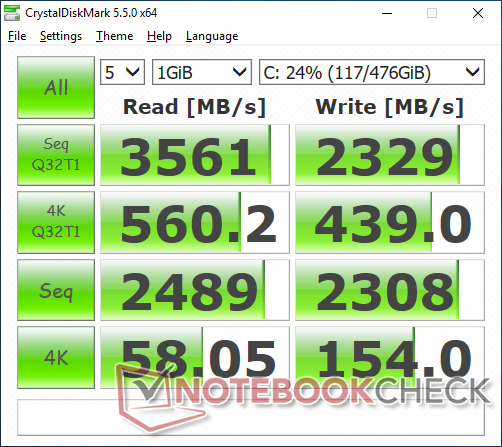
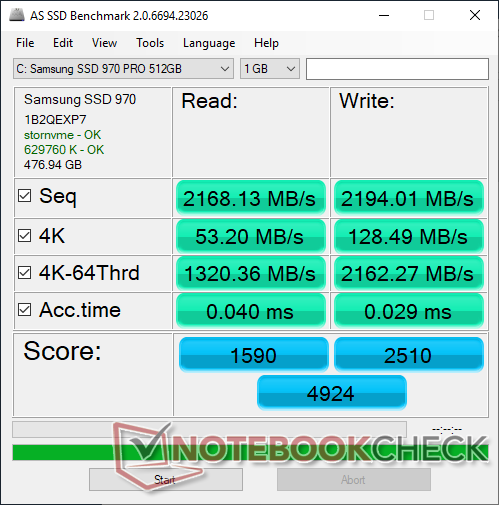
There are two M.2 PCIe slots with RAID compatibility and a single 2.5-inch SATA III bay available. Our unit comes equipped with a single 512 GB Samsung SSD 970 Pro with sequential read and write rates of over 2100 MB/s each according to AS SSD. Samsung produces some of the fastest NVMe drives for consumers and this is no different.
Since servicing can be a pain, however, we recommend configuring wisely before committing to a purchase.
| Eurocom Nightsky Ti15 Samsung SSD 970 Pro 512GB | Aorus 15-SA Intel SSD 760p SSDPEKKW512G8 | Dell G5 15 5590 KBG30ZMS128G | HP Omen 15-dc1020ng WDC PC SN720 SDAQNTW-512G | HP Gaming Pavilion 15-dk0009ng Samsung SSD PM981 MZVLB256HAHQ | |
|---|---|---|---|---|---|
| AS SSD | -25% | -469% | -16% | -52% | |
| Seq Read (MB/s) | 2168 | 2601 20% | 1036 -52% | 2955 36% | 2088 -4% |
| Seq Write (MB/s) | 2194 | 1507 -31% | 115.1 -95% | 2440 11% | 1347 -39% |
| 4K Read (MB/s) | 53.2 | 56.3 6% | 29.6 -44% | 40.56 -24% | 36.14 -32% |
| 4K Write (MB/s) | 128.5 | 110.3 -14% | 67.8 -47% | 118.6 -8% | 96.5 -25% |
| 4K-64 Read (MB/s) | 1320 | 877 -34% | 184.5 -86% | 1283 -3% | 565 -57% |
| 4K-64 Write (MB/s) | 2162 | 914 -58% | 95.2 -96% | 1538 -29% | 588 -73% |
| Access Time Read * (ms) | 0.04 | 0.05 -25% | 1.519 -3697% | 0.084 -110% | 0.093 -132% |
| Access Time Write * (ms) | 0.029 | 0.034 -17% | 0.255 -779% | 0.032 -10% | 0.038 -31% |
| Score Read (Points) | 1590 | 1193 -25% | 318 -80% | 1619 2% | 810 -49% |
| Score Write (Points) | 2510 | 1175 -53% | 174 -93% | 1901 -24% | 819 -67% |
| Score Total (Points) | 4924 | 2938 -40% | 620 -87% | 4323 -12% | 2014 -59% |
| Copy ISO MB/s (MB/s) | 2104 | 159.2 | 1418 | 1043 | |
| Copy Program MB/s (MB/s) | 387.7 | 94.4 | 392.5 | 371.7 | |
| Copy Game MB/s (MB/s) | 1021 | 106.3 | 907 | 399.9 |
* ... smaller is better

GPU Performance
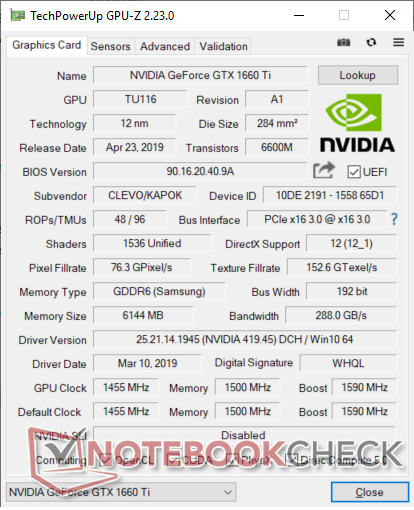
The mobile GeForce GTX 1660 Ti is about 30 to 60 percent faster than the older mobile GTX 1060. Nvidia has optimized its Turing cards for DX12 and so you'll see the biggest gains when playing newer games. Raw GPU performance is only about 5 percent slower than our desktop GeForce 1660 Ti reference.
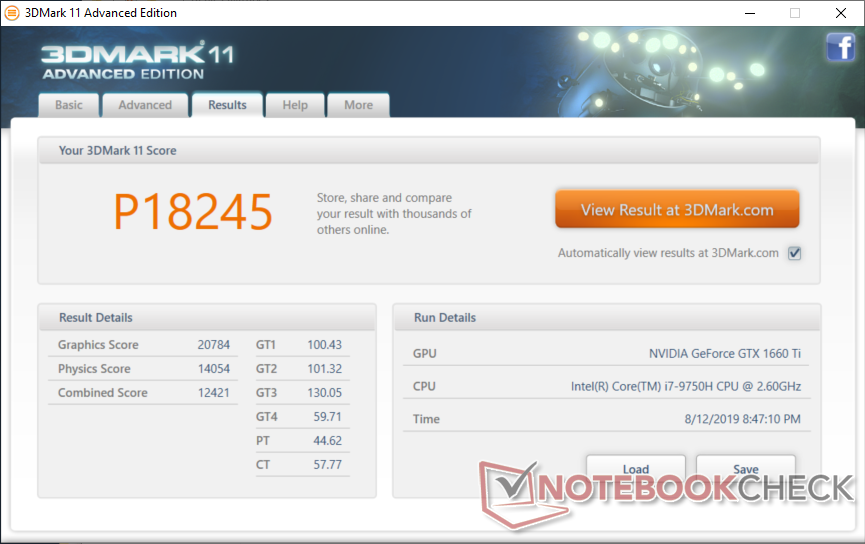
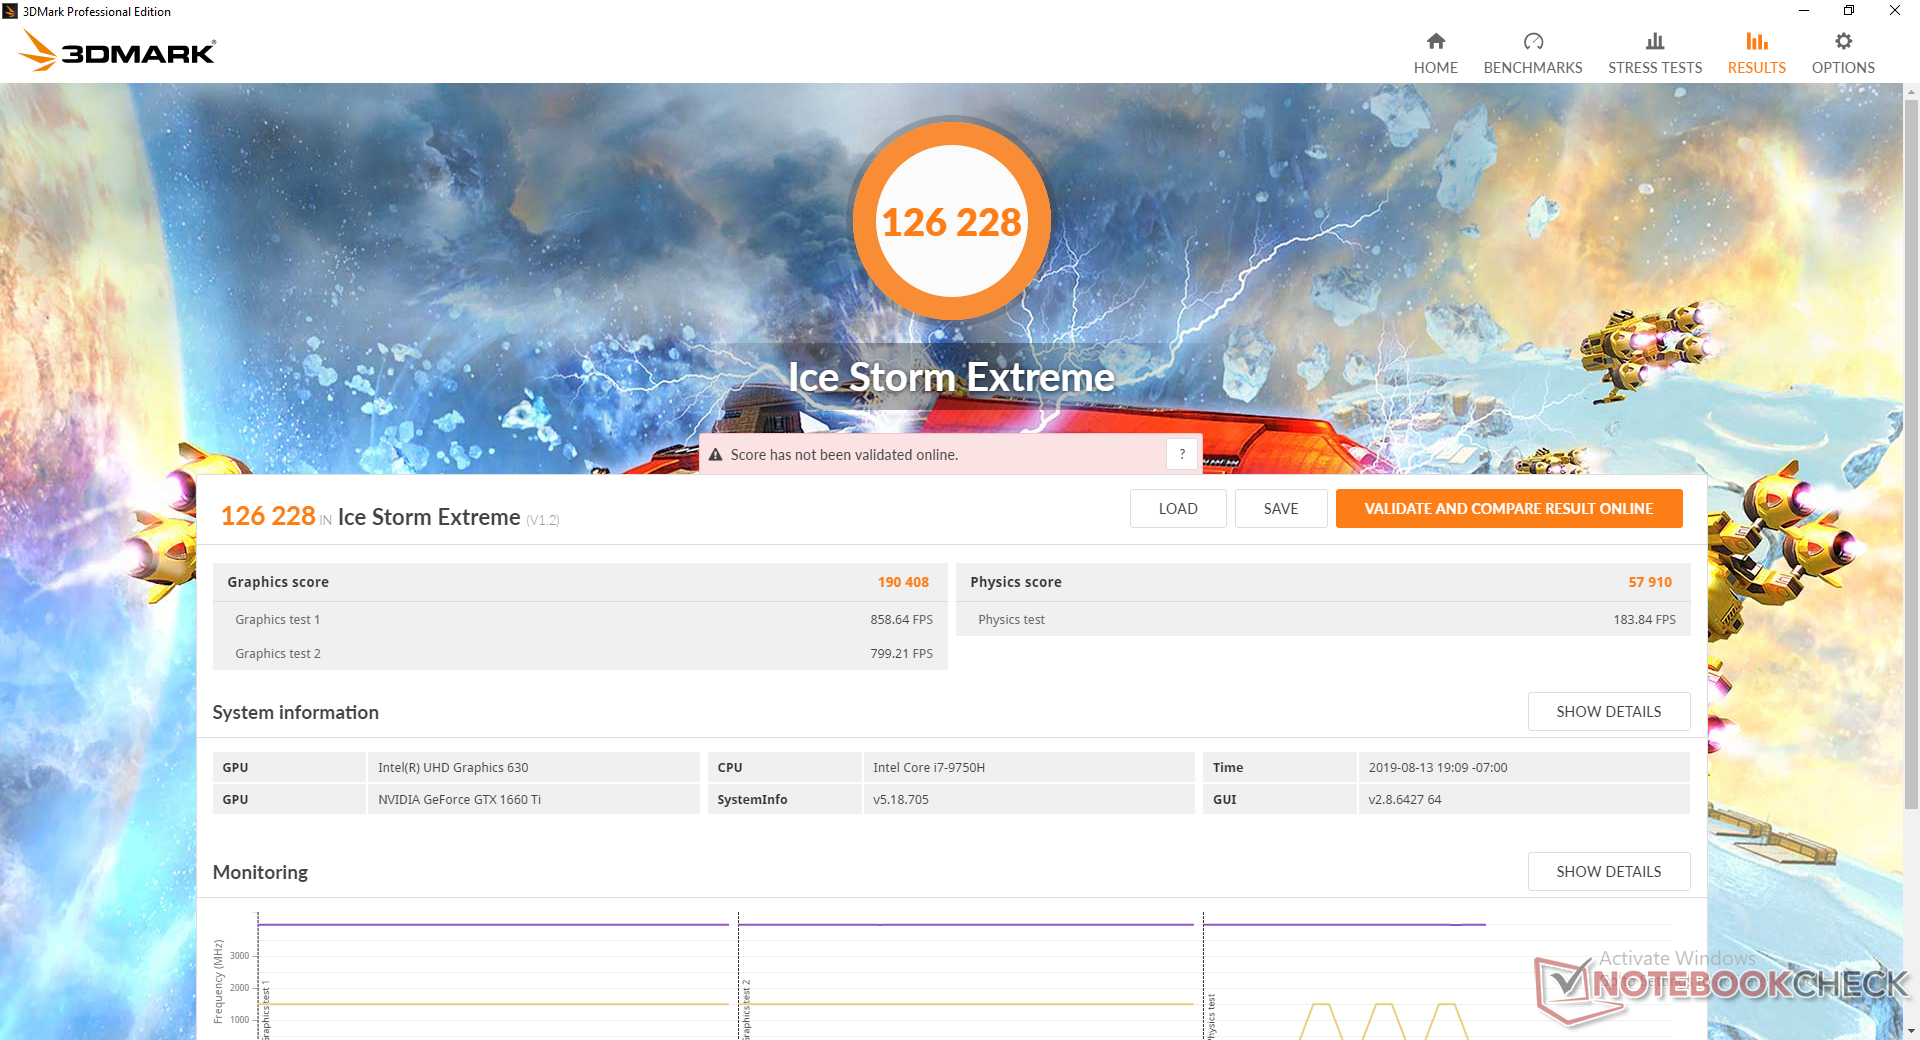
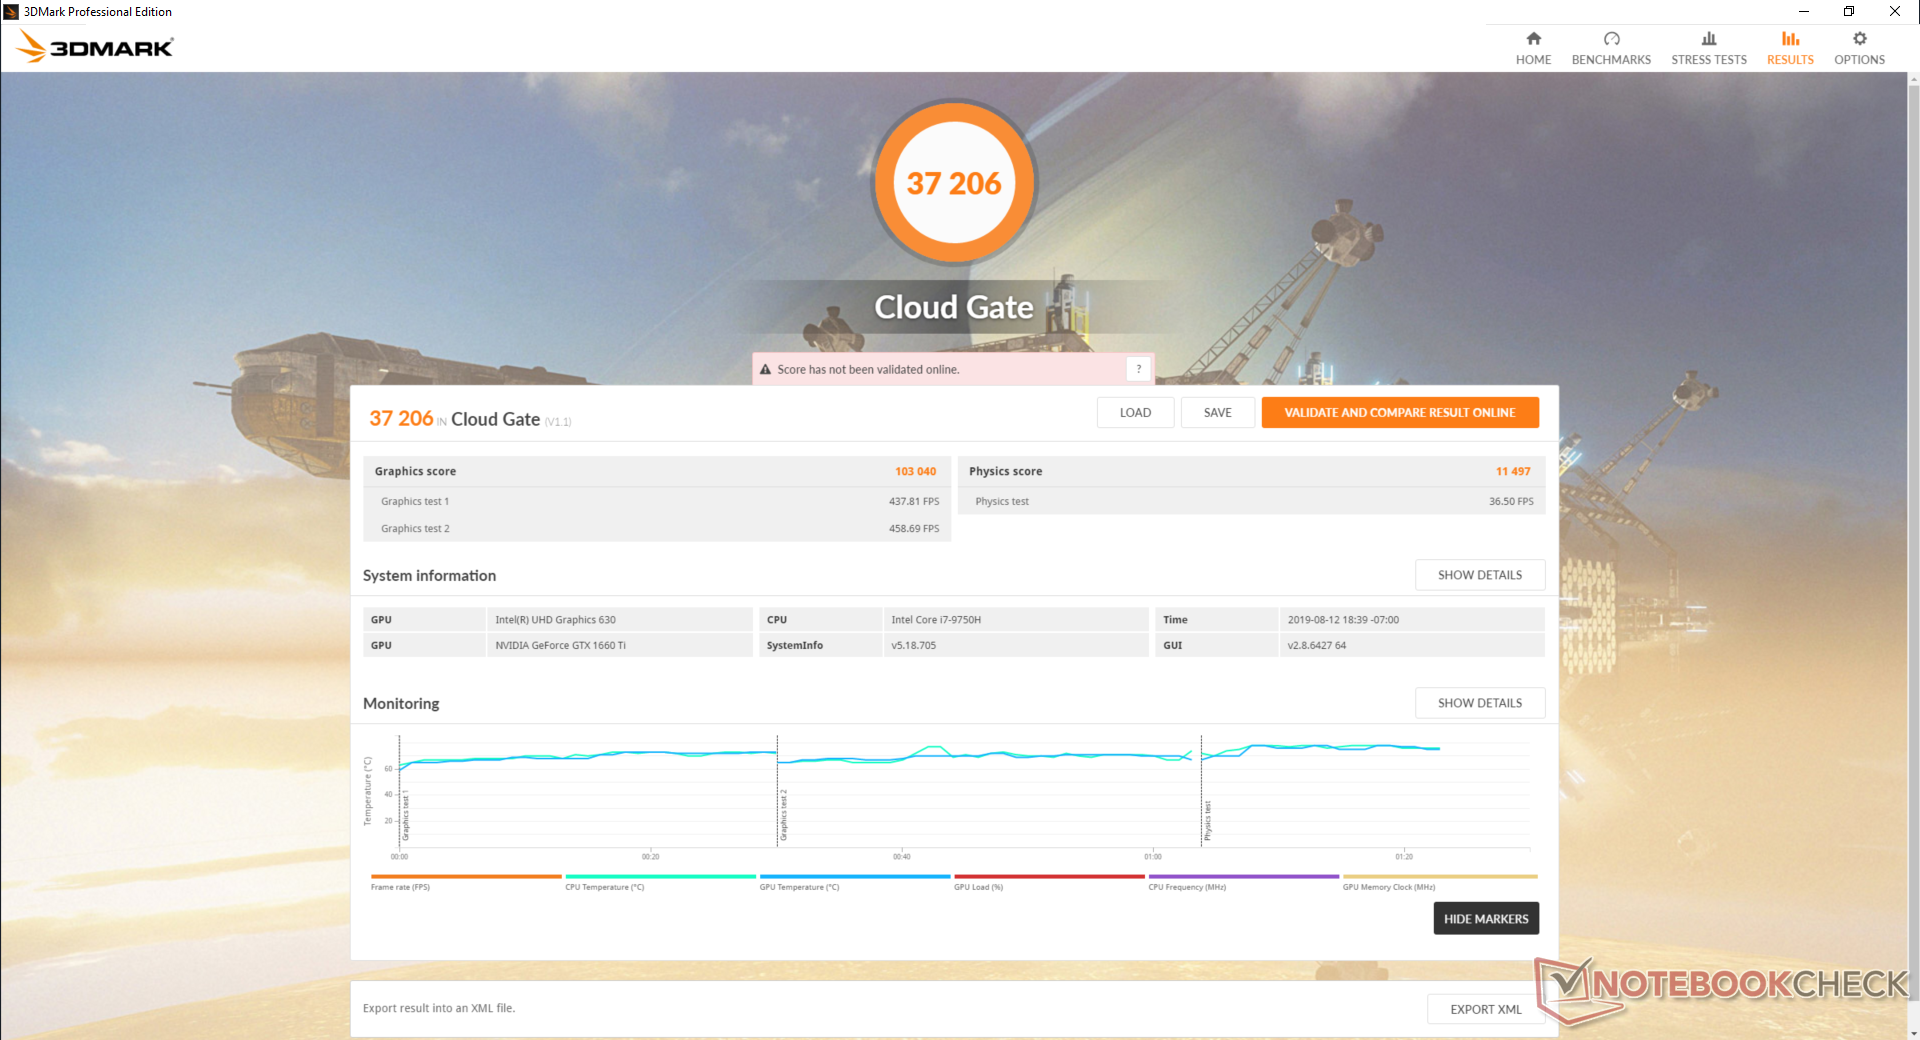
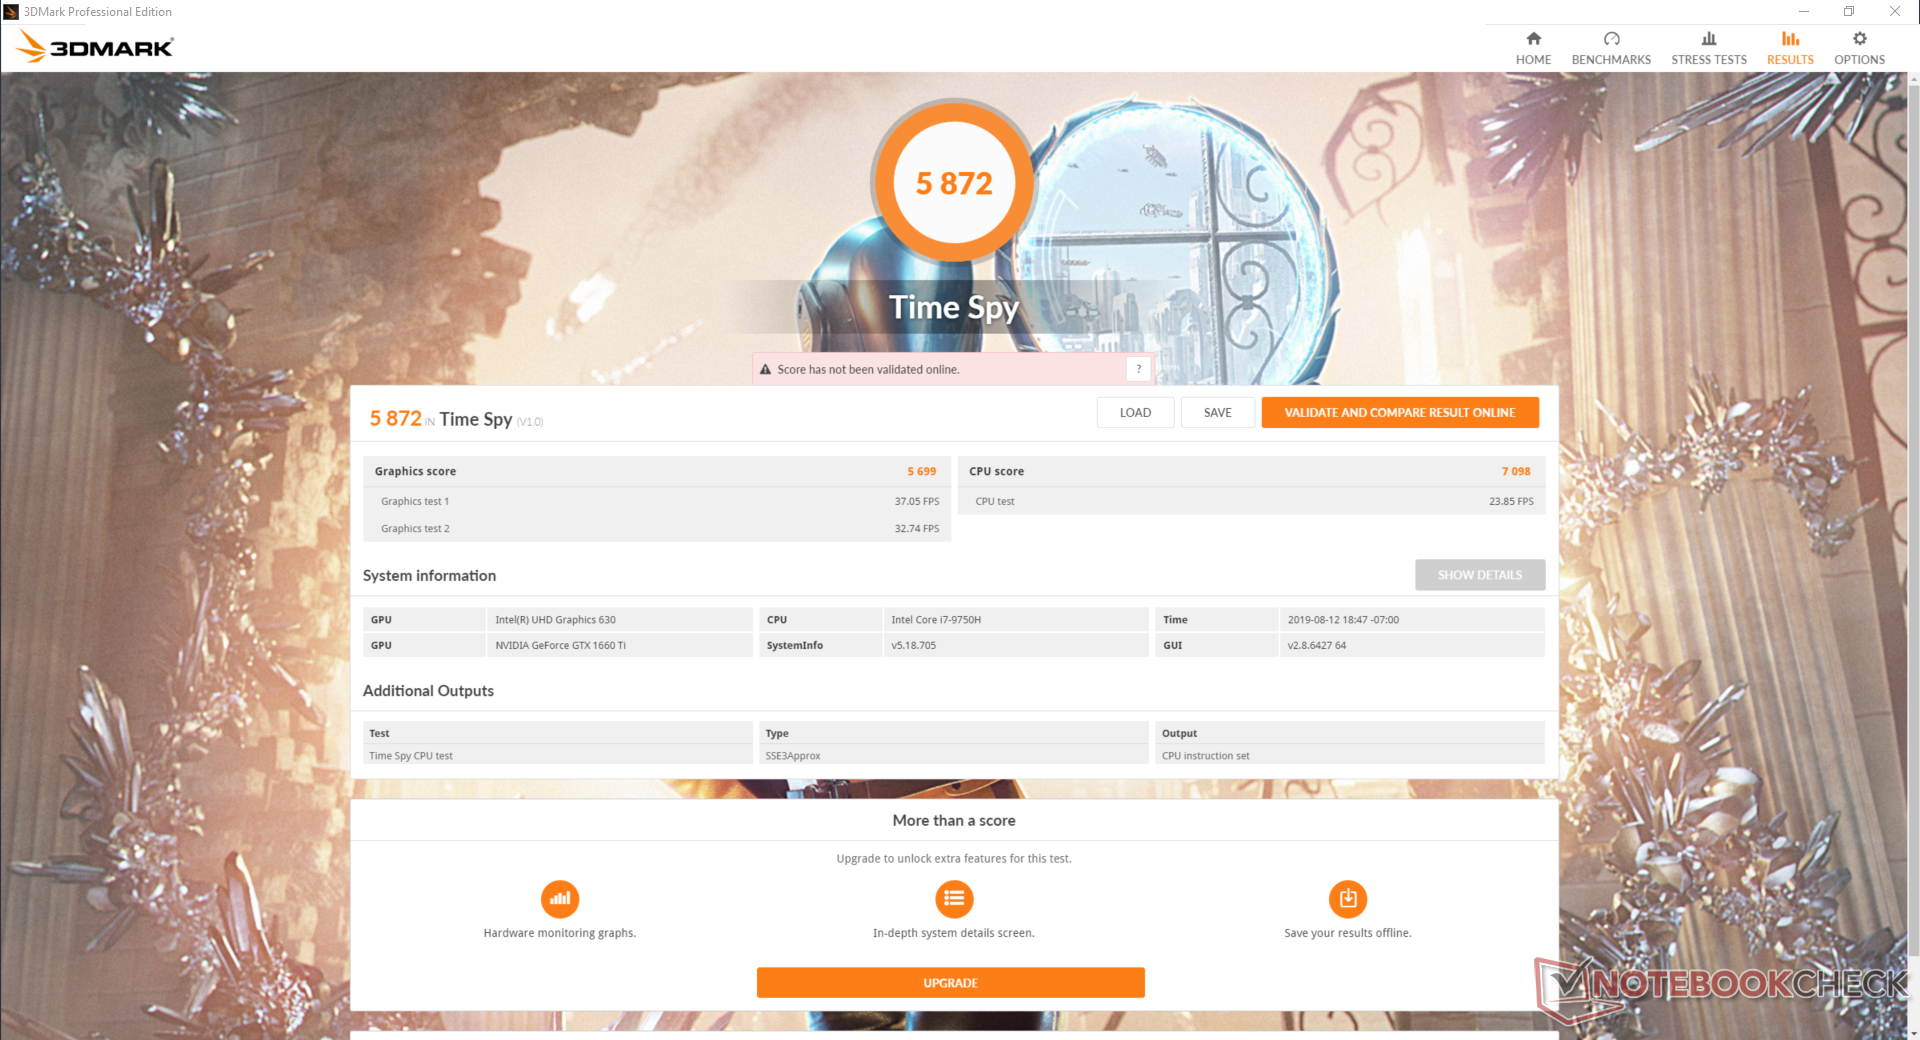
| 3DMark 11 Performance | 18245 points | |
| 3DMark Cloud Gate Standard Score | 37206 points | |
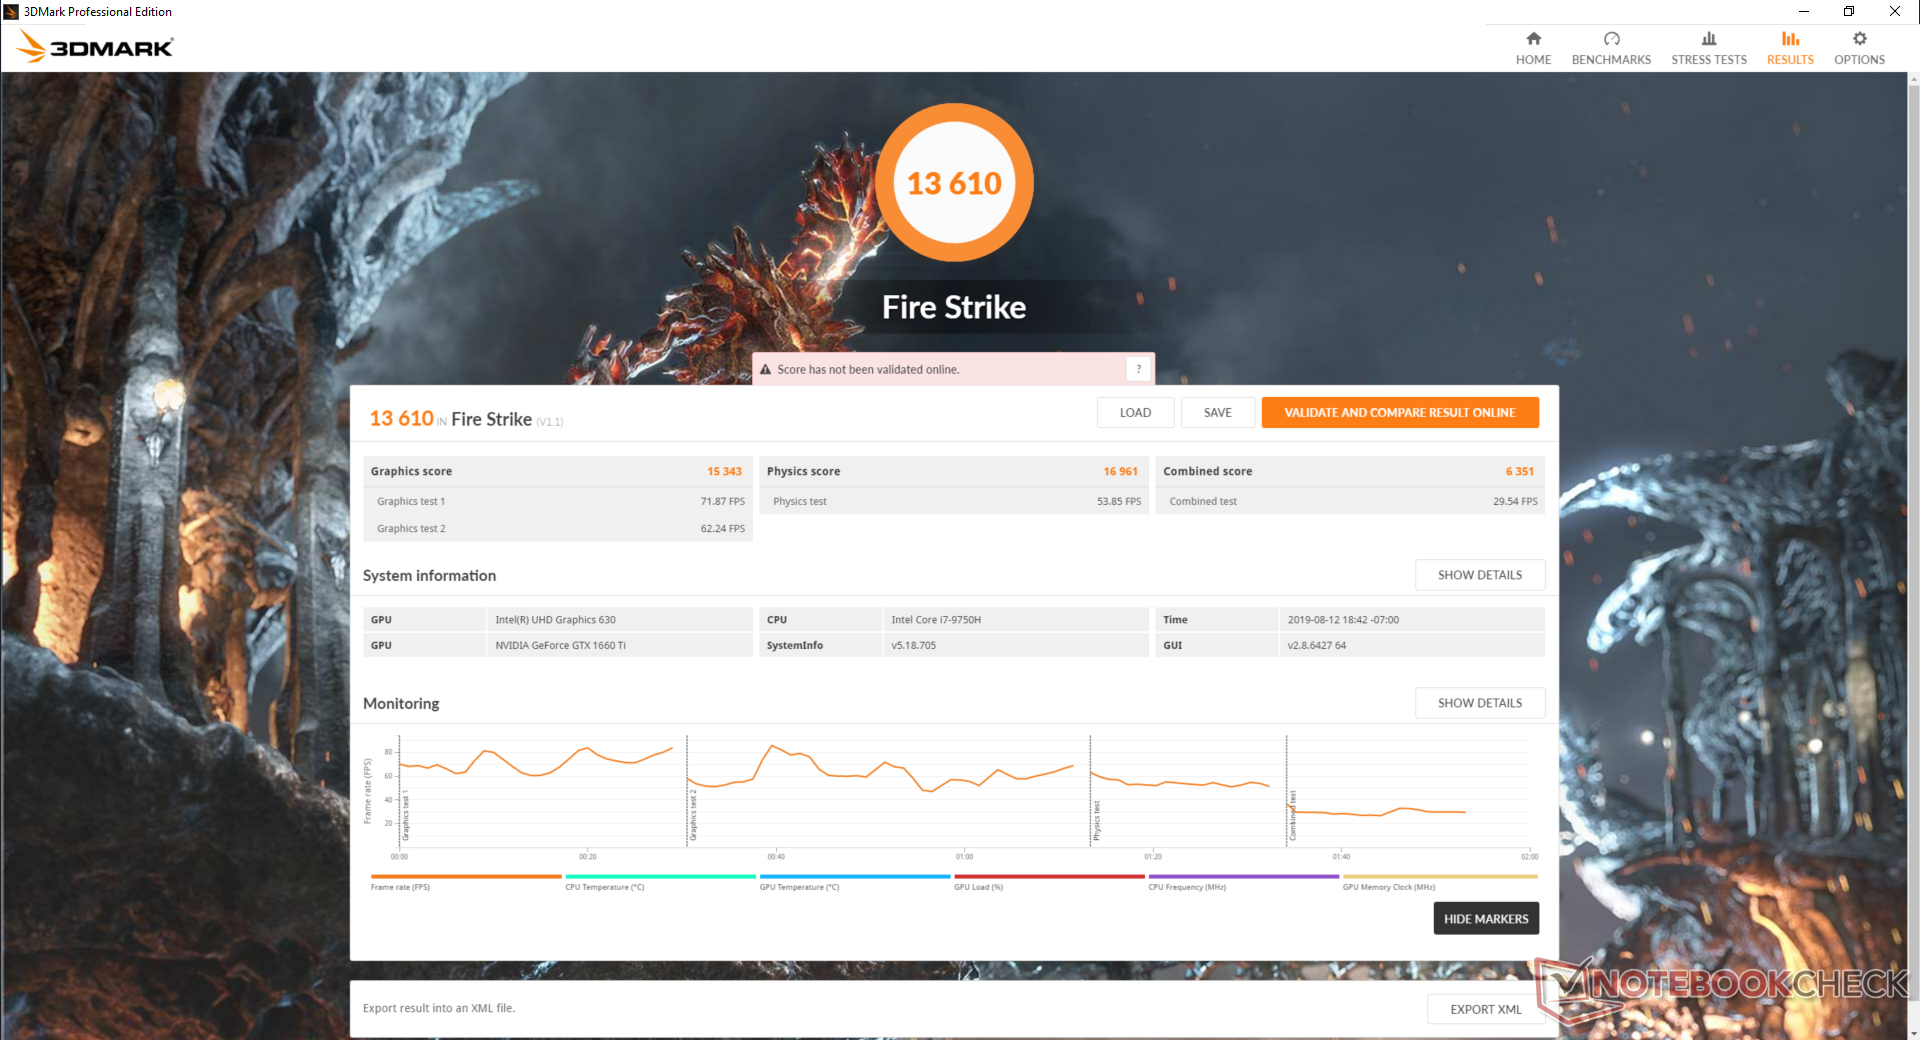
| 3DMark Fire Strike Score | 13610 points | |
| 3DMark Time Spy Score | 5872 points | |
Help | ||
Gaming Performance
The system is powerful enough to play the latest games at native 1080p and 60 FPS with most settings on medium to maximum. Note that performance is very similar to the more expensive mobile RTX 2060 sans the ray-tracing and DLSS support.
See our dedicated page on the mobile GeForce GTX 1660 Ti for more technical information and benchmark comparisons.
| low | med. | high | ultra | |
|---|---|---|---|---|
| BioShock Infinite (2013) | 345.5 | 288.4 | 274.5 | 144.2 |
| The Witcher 3 (2015) | 297.8 | 200 | 120.4 | 60.5 |
| Shadow of the Tomb Raider (2018) | 151 | 93 | 82 | 73 |
Emissions
System Noise
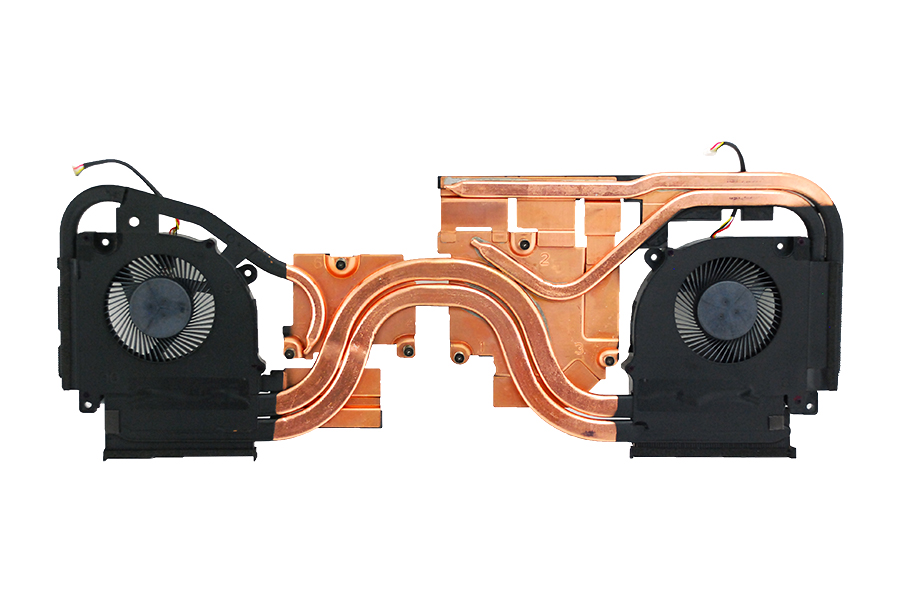
The cooling solution consists of twin fans and five copper heat pipes between them. The fans are pretty good at staying quiet for as long as possible before needing to really ramp up. When set to Quiet mode, fan noise maxes out at 34.8 dB(A) but it's oftentimes much lower and almost inaudible if simply web browsing or streaming.
When gaming, however, fan noise will be as loud as most other mid-size gaming laptops like the Aorus 15 or MSI GE63 at almost 54 dB(A). Some alternatives, like the Razer Blade 15, are noticeably quieter at about 45 dB(A) when under the same gaming conditions. We find headphones to be a necessity when fan noise reaches 50 dB(A) and above.
We can notice no coil whine or electronic noise on our test unit.
| Eurocom Nightsky Ti15 GeForce GTX 1660 Ti Mobile, i7-9750H, Samsung SSD 970 Pro 512GB | Aorus 15-SA GeForce GTX 1660 Ti Mobile, i7-9750H, Intel SSD 760p SSDPEKKW512G8 | Dell G5 15 5590 GeForce RTX 2060 Mobile, i7-8750H, KBG30ZMS128G | HP Omen 15-dc1020ng GeForce GTX 1650 Mobile, i5-9300H, WDC PC SN720 SDAQNTW-512G | HP Gaming Pavilion 15-dk0009ng GeForce GTX 1660 Ti Max-Q, i7-9750H, Samsung SSD PM981 MZVLB256HAHQ | MSI GE63 Raider RGB 8RF-008 GeForce GTX 1070 Mobile, i7-8750H, Samsung SSD PM871a MZNLN256HMHQ | |
|---|---|---|---|---|---|---|
| Noise | -13% | -3% | 10% | 12% | -7% | |
| off / environment * (dB) | 28.4 | 29 -2% | 30.4 -7% | 28.8 -1% | 28.2 1% | 30 -6% |
| Idle Minimum * (dB) | 28.6 | 32 -12% | 30.4 -6% | 28.8 -1% | 29.3 -2% | 30 -5% |
| Idle Average * (dB) | 28.6 | 35 -22% | 30.4 -6% | 29.5 -3% | 29.3 -2% | 35 -22% |
| Idle Maximum * (dB) | 28.6 | 41 -43% | 33.4 -17% | 31.1 -9% | 29.3 -2% | 36 -26% |
| Load Average * (dB) | 47.8 | 54 -13% | 42 12% | 35.2 26% | 32.3 32% | 42 12% |
| Witcher 3 ultra * (dB) | 53.7 | 52 3% | 35.2 34% | 34 37% | 54 -1% | |
| Load Maximum * (dB) | 53.7 | 56 -4% | 48.7 9% | 41 24% | 41.2 23% | 56 -4% |
* ... smaller is better
Noise level
| Idle |
| 28.6 / 28.6 / 28.6 dB(A) |
| Load |
| 47.8 / 53.7 dB(A) |
 | ||
30 dB silent 40 dB(A) audible 50 dB(A) loud |
||
min: | ||
Temperature
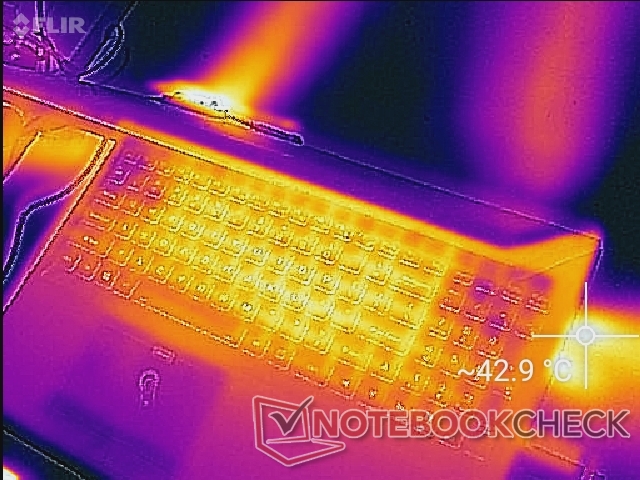
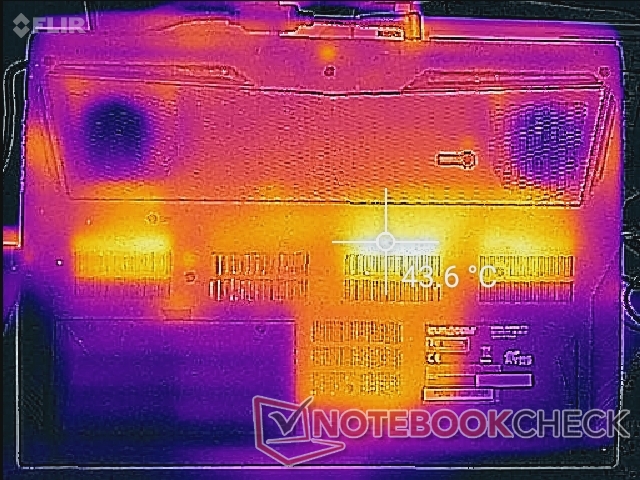
Surface temperatures are warmest towards the center of the keyboard where it can around 38 C to 42 C when gaming. Fortunately, the palm rests, NumPad, and WASD keys remain cool no matter the load for comfortable gaming. Hot spots are actually a bit warmer than expected during low loads since the fans are running much quieter and more slowly.
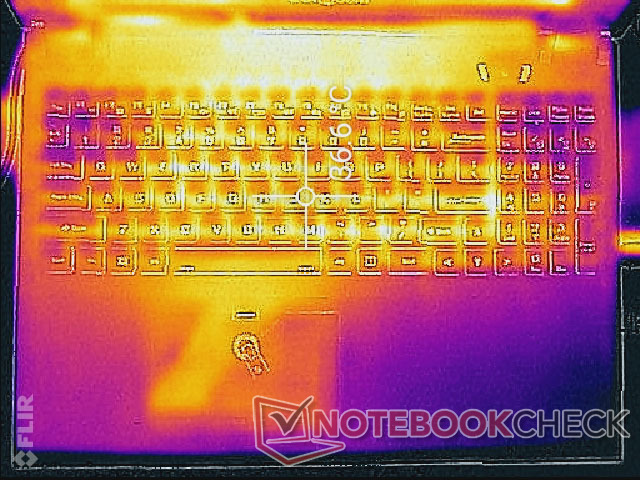
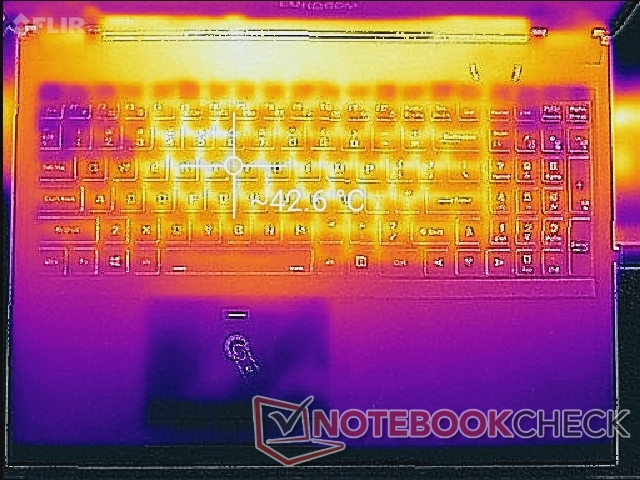
(±) The maximum temperature on the upper side is 42.6 °C / 109 F, compared to the average of 40.4 °C / 105 F, ranging from 21.2 to 68.8 °C for the class Gaming.
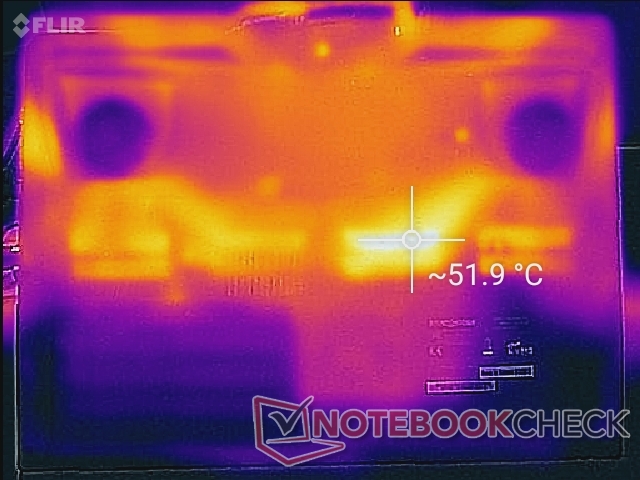
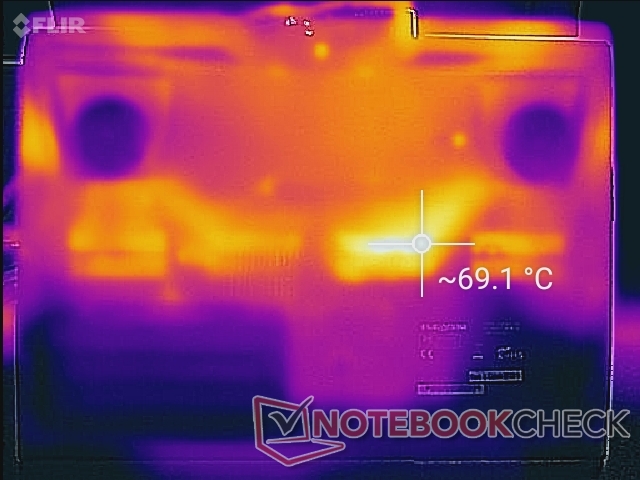
(-) The bottom heats up to a maximum of 69 °C / 156 F, compared to the average of 43.2 °C / 110 F
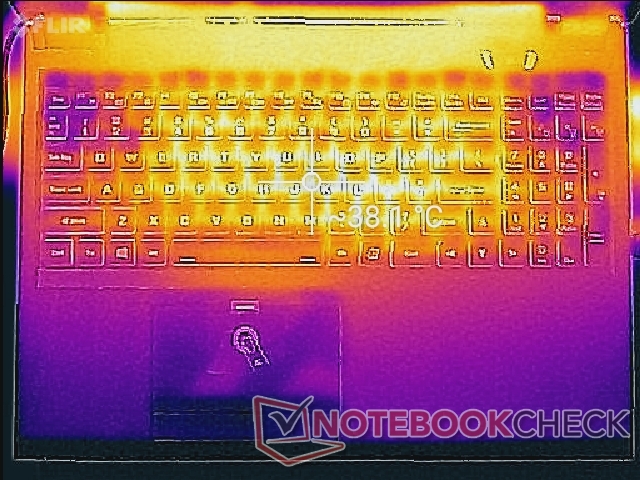
(±) In idle usage, the average temperature for the upper side is 35.5 °C / 96 F, compared to the device average of 33.9 °C / 93 F.
(±) Playing The Witcher 3, the average temperature for the upper side is 33.1 °C / 92 F, compared to the device average of 33.9 °C / 93 F.
(±) The palmrests and touchpad can get very hot to the touch with a maximum of 36 °C / 96.8 F.
(-) The average temperature of the palmrest area of similar devices was 28.8 °C / 83.8 F (-7.2 °C / -13 F).
Stress Test
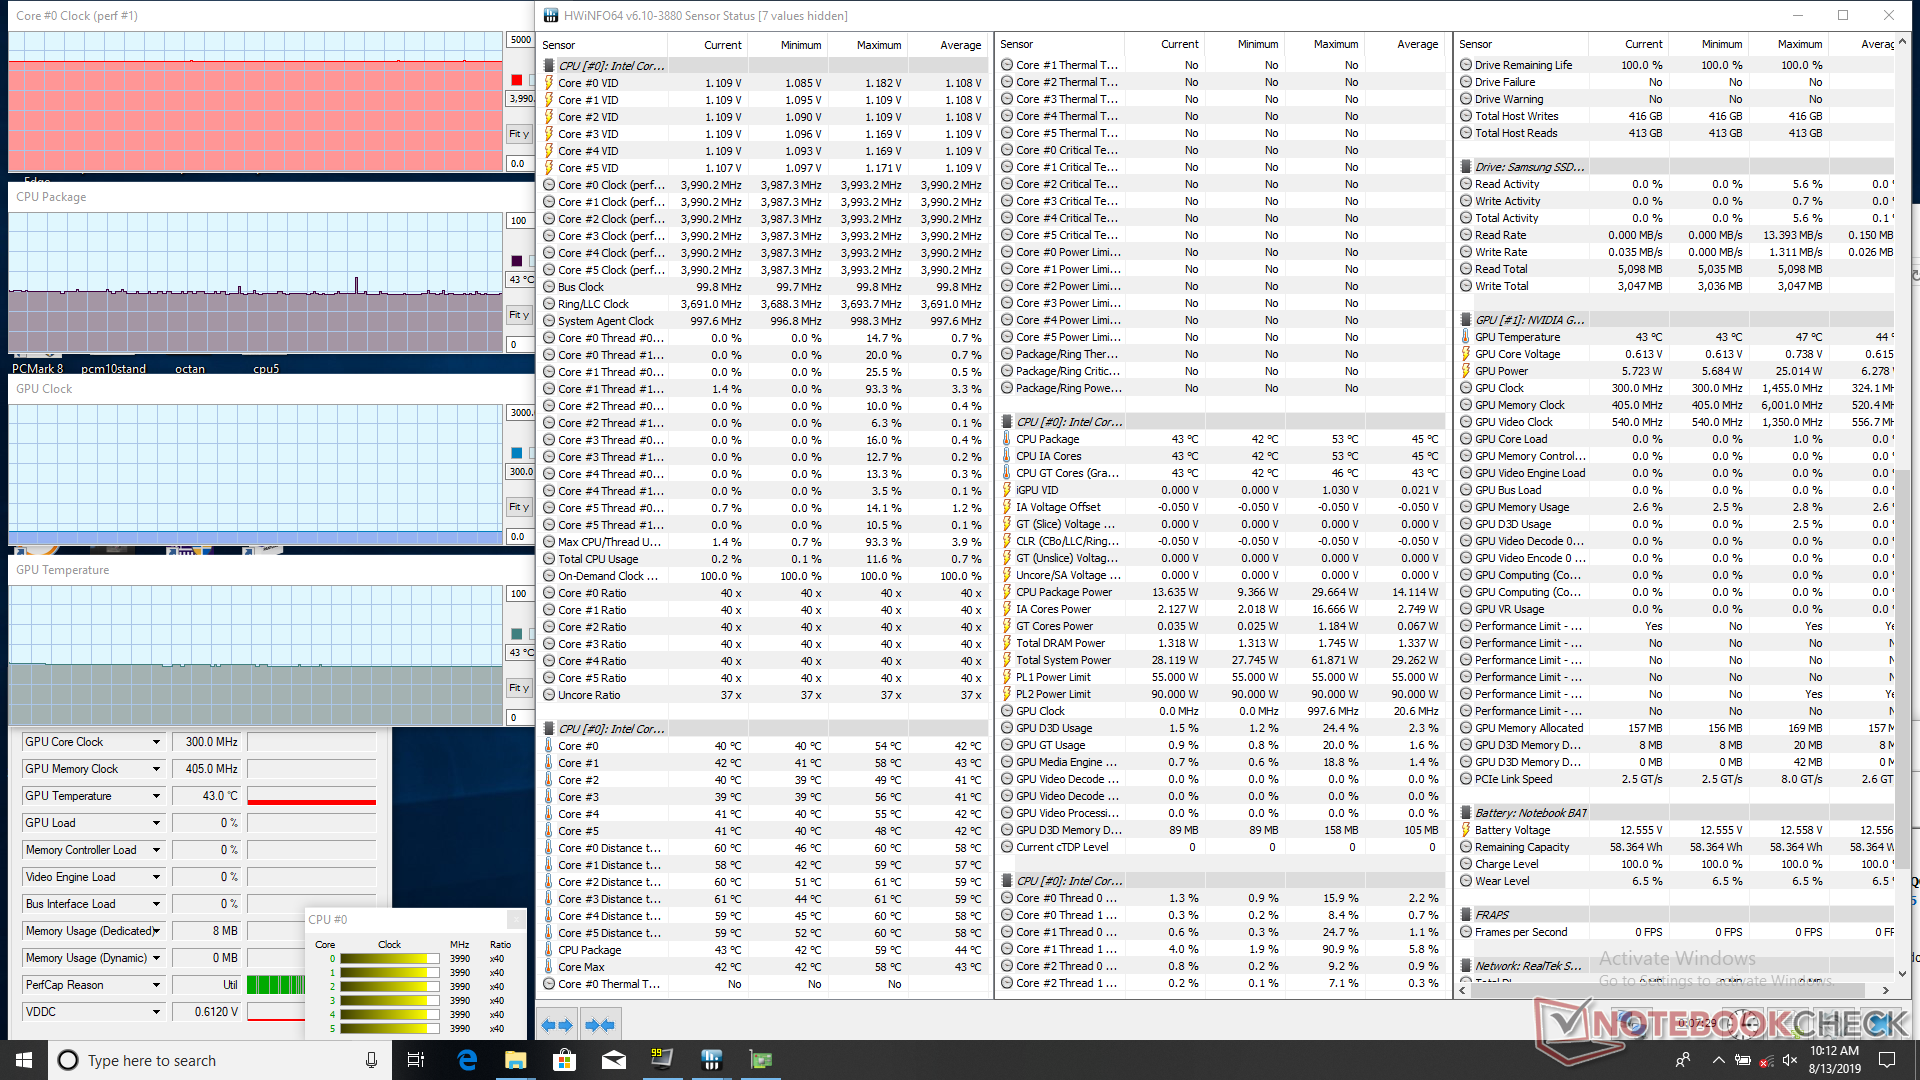
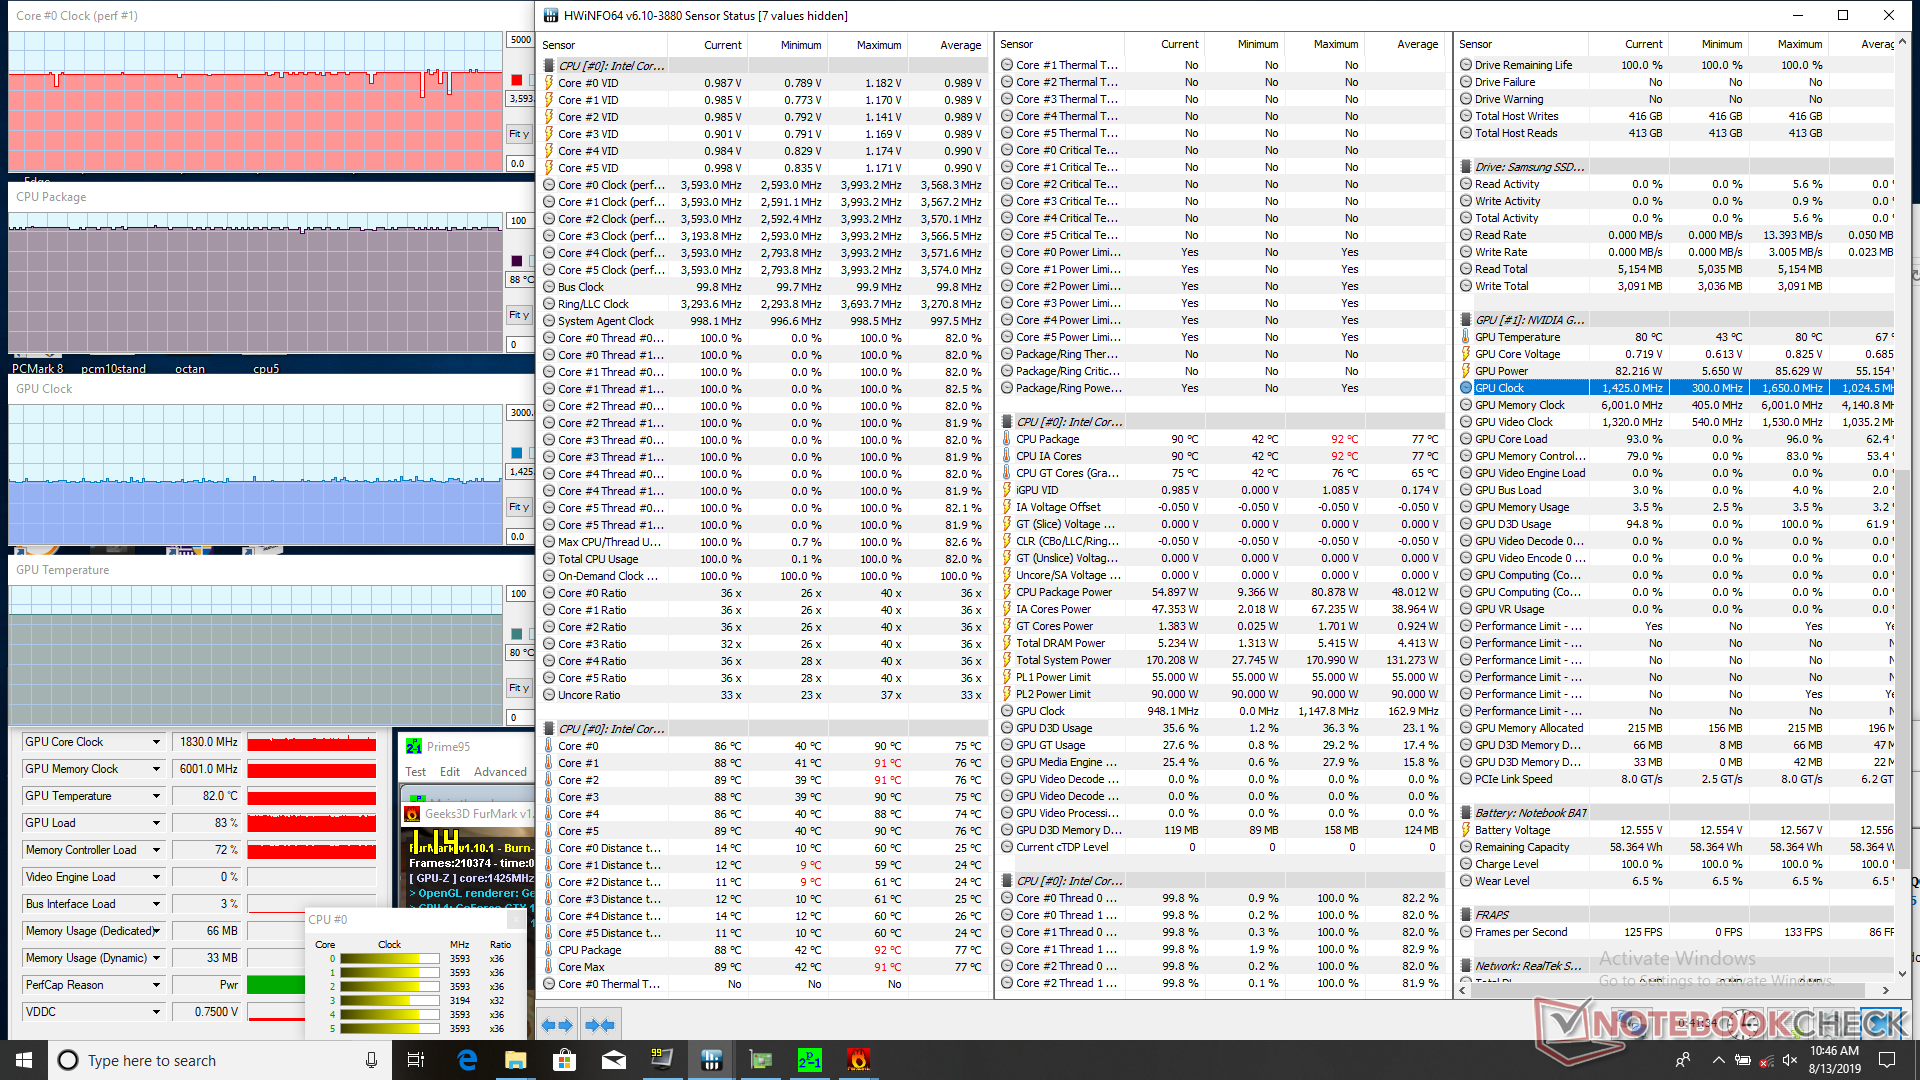
We stress the system with synthetic loads to identify for any potential throttling or stability issues. When running Prime95, the CPU will spike to 4 GHz for the about 20 seconds until it hits 80 C. Thereafter, clock rates drop to the 3.2 to 3.3 GHz range in order to maintain a cooler core temperature of 66 C. This behavior backs up both our CineBench loop test results above and power consumption observations below. When at 100 percent CPU and GPU utilization, CPU and GPU temperatures stabilize at 88 C and 80 C, respectively.
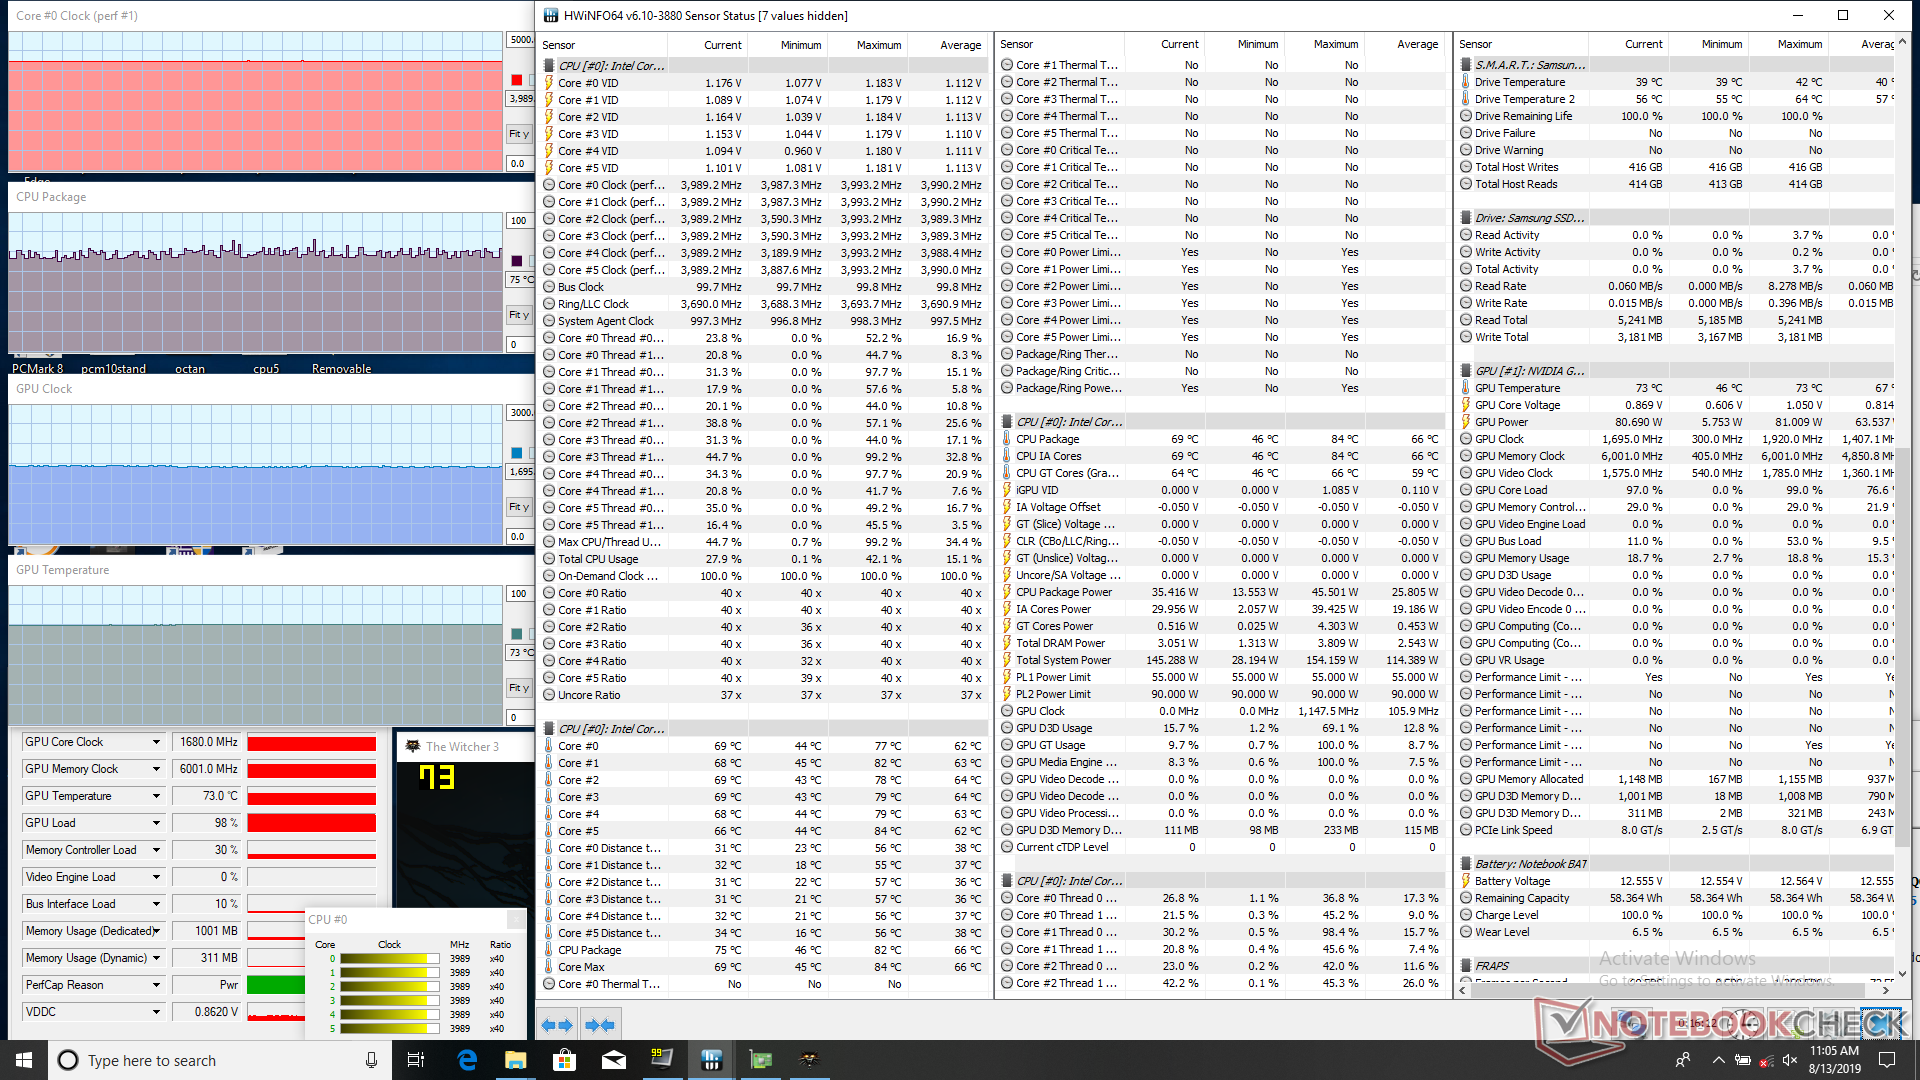
Running Witcher 3 is more representative of real-world loads. Here, CPU and GPU temperatures each stabilize at 75 C and 73 C. We can observe no performance throttling no matter the load.
Running on batteries will impact overall performance. A Fire Strike run on batteries returns Physics and Graphics scores of 11264 and 1177 points, respectively, compared to 16961 and 15343 points when on mains.
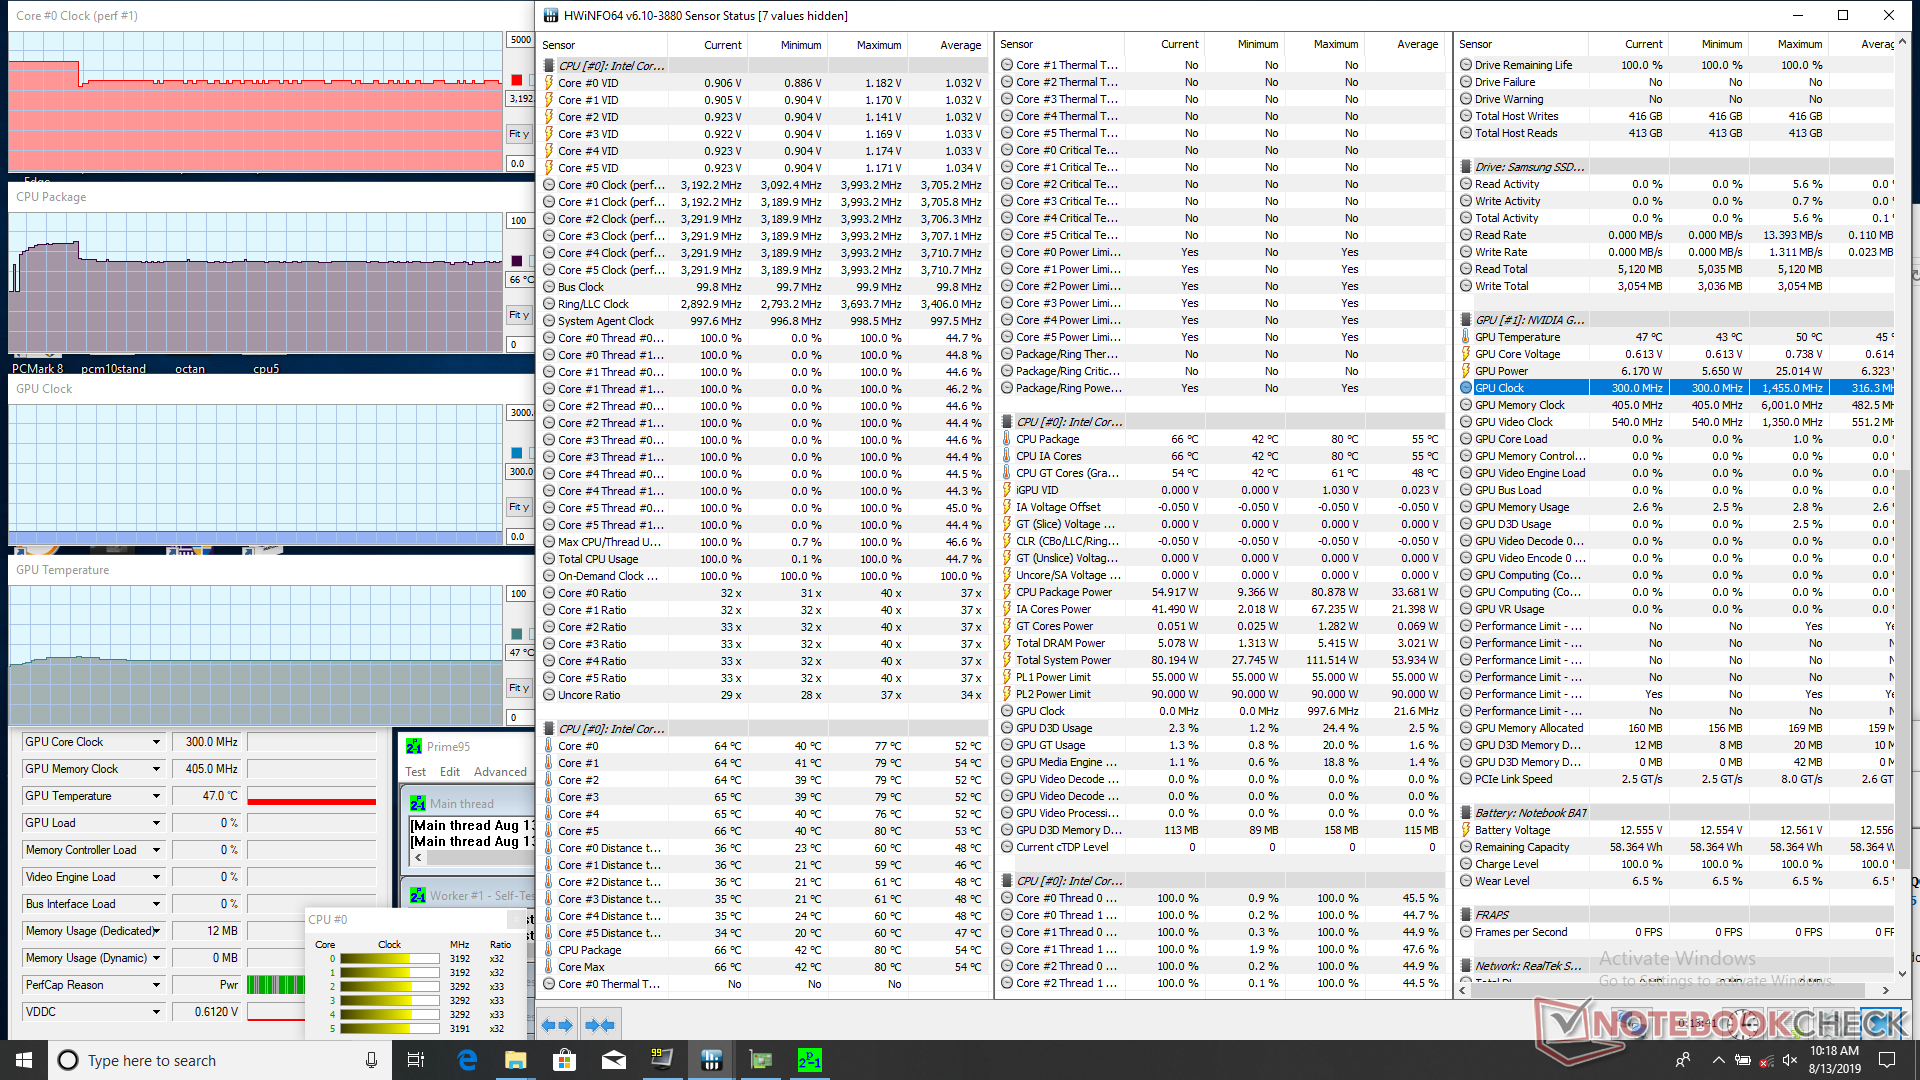
| CPU Clock (GHz) | GPU Clock (MHz) | Average CPU Temperature (°C) | Average GPU Temperature (°C) | |
| System Idle | -- | -- | 43 | 43 |
| Prime95 Stress | 3.2 - 3.3 | -- | 66 | 47 |
| Prime95 + FurMark Stress | 3.6 | 1830 | 88 | 80 |
| Witcher 3 Stress | 4.0 | 1680 | ~75 | 73 |
Speakers
The 2 W stereo speakers of the Nightsky RX15 are lacking the dedicated 4 W subwoofer of its bigger 17.3-inch Nightsky RX17 counterpart. Bass is thus noticeably poorer, but the chassis appears to vibrate much less because of it. Maximum volume is otherwise nearly identical to the Nightsky RX17.

Eurocom Nightsky Ti15 audio analysis
(+) | speakers can play relatively loud (86.2 dB)
Bass 100 - 315 Hz
(-) | nearly no bass - on average 16% lower than median
(+) | bass is linear (6.3% delta to prev. frequency)
Mids 400 - 2000 Hz
(+) | balanced mids - only 4% away from median
(+) | mids are linear (5.4% delta to prev. frequency)
Highs 2 - 16 kHz
(+) | balanced highs - only 3.4% away from median
(±) | linearity of highs is average (9.2% delta to prev. frequency)
Overall 100 - 16.000 Hz
(±) | linearity of overall sound is average (17.4% difference to median)
Compared to same class
» 48% of all tested devices in this class were better, 12% similar, 40% worse
» The best had a delta of 6%, average was 18%, worst was 132%
Compared to all devices tested
» 33% of all tested devices were better, 8% similar, 58% worse
» The best had a delta of 4%, average was 23%, worst was 134%
Apple MacBook 12 (Early 2016) 1.1 GHz audio analysis
(+) | speakers can play relatively loud (83.6 dB)
Bass 100 - 315 Hz
(±) | reduced bass - on average 11.3% lower than median
(±) | linearity of bass is average (14.2% delta to prev. frequency)
Mids 400 - 2000 Hz
(+) | balanced mids - only 2.4% away from median
(+) | mids are linear (5.5% delta to prev. frequency)
Highs 2 - 16 kHz
(+) | balanced highs - only 2% away from median
(+) | highs are linear (4.5% delta to prev. frequency)
Overall 100 - 16.000 Hz
(+) | overall sound is linear (10.2% difference to median)
Compared to same class
» 7% of all tested devices in this class were better, 2% similar, 90% worse
» The best had a delta of 5%, average was 18%, worst was 53%
Compared to all devices tested
» 5% of all tested devices were better, 1% similar, 94% worse
» The best had a delta of 4%, average was 23%, worst was 134%
Energy Management
Power Consumption
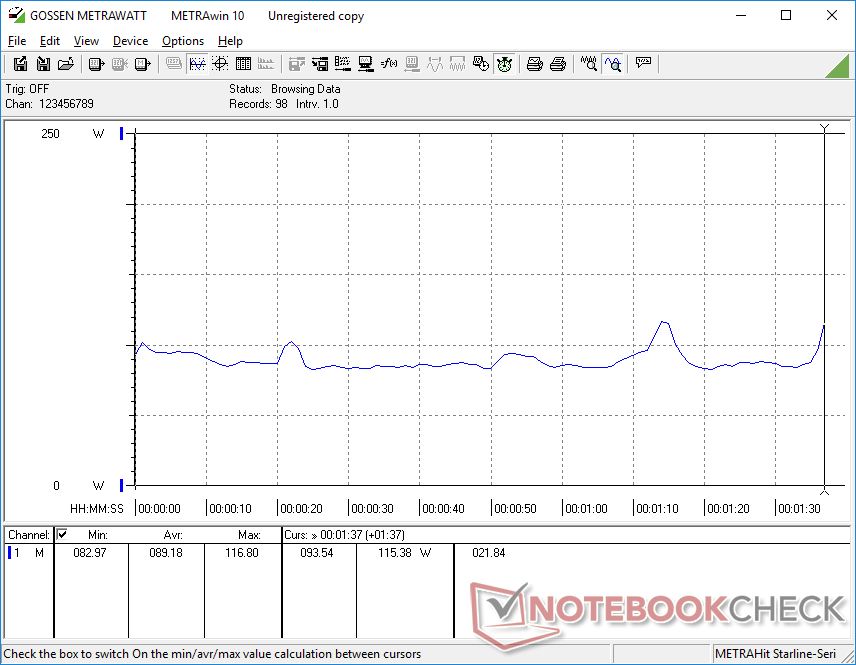
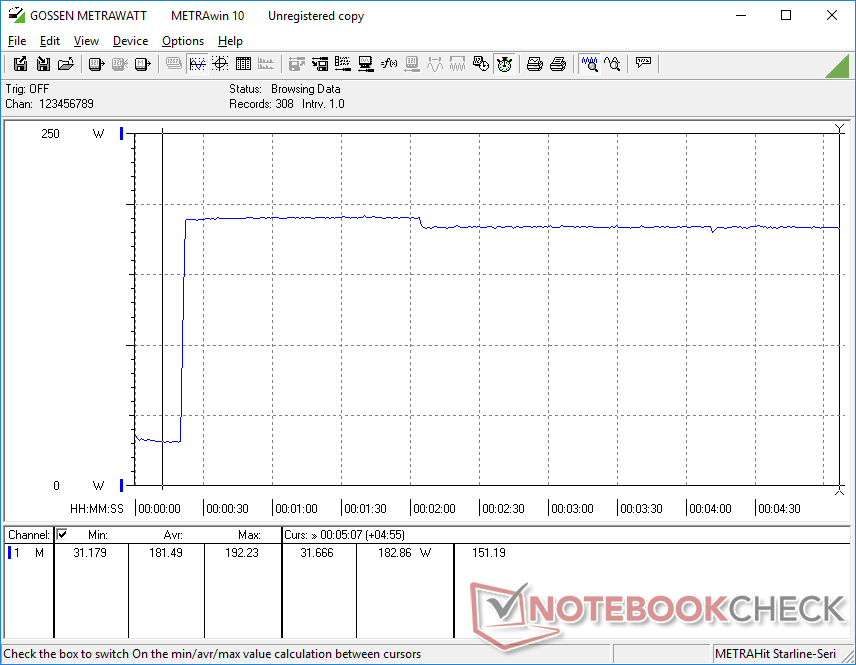
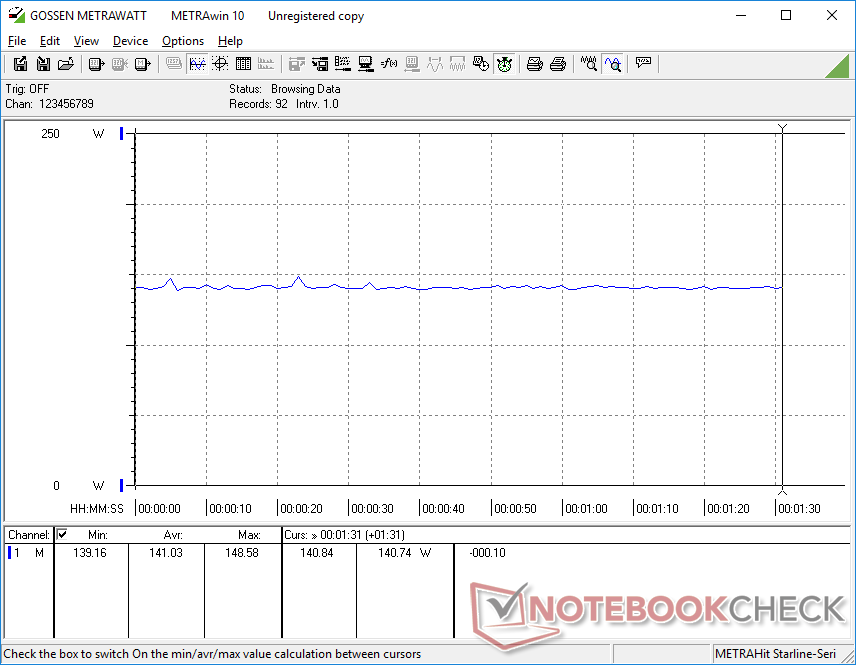
Idling on desktop demands anywhere between 16 W and 31 W which is higher than most other 15.6-inch gaming laptops like the older MSI GE63. This may be responsible for the unimpressive battery life in our next section. When gaming, consumption averages 141 W not unlike the Aorus 15-SA with the same CPU and GPU.
At most, we're able to record 192.3 W from the small-medium (~14.3 x 7.3 x 2.3 cm) 180 W AC adapter.
| Off / Standby | |
| Idle | |
| Load |
|
Key:
min: | |
| Eurocom Nightsky Ti15 i7-9750H, GeForce GTX 1660 Ti Mobile, Samsung SSD 970 Pro 512GB, IPS, 1920x1080, 15.6" | Aorus 15-SA i7-9750H, GeForce GTX 1660 Ti Mobile, Intel SSD 760p SSDPEKKW512G8, IPS, 1920x1080, 15.6" | Dell G5 15 5590 i7-8750H, GeForce RTX 2060 Mobile, KBG30ZMS128G, IPS, 1920x1080, 15.6" | HP Omen 15-dc1020ng i5-9300H, GeForce GTX 1650 Mobile, WDC PC SN720 SDAQNTW-512G, IPS, 1920x1080, 15.6" | MSI GE63 Raider RGB 8RF-008 i7-8750H, GeForce GTX 1070 Mobile, Samsung SSD PM871a MZNLN256HMHQ, TN, 1920x1080, 15.6" | MSI GL73 8RD-418US i7-8750H, GeForce GTX 1050 Ti Mobile, Kingston RBUSNS8154P3128GJ, TN LED, 1920x1080, 17.3" | |
|---|---|---|---|---|---|---|
| Power Consumption | 4% | 38% | 47% | 14% | 20% | |
| Idle Minimum * (Watt) | 16.8 | 20 -19% | 3.5 79% | 4.04 76% | 9 46% | 11.8 30% |
| Idle Average * (Watt) | 29 | 23 21% | 6.9 76% | 7.2 75% | 14 52% | 18.7 36% |
| Idle Maximum * (Watt) | 30.8 | 29 6% | 8.5 72% | 11.4 63% | 19 38% | 19.8 36% |
| Load Average * (Watt) | 89.2 | 87 2% | 127 -42% | 80.8 9% | 91 -2% | 100.8 -13% |
| Witcher 3 ultra * (Watt) | 141.1 | 136 4% | 93.6 34% | 182 -29% | 124.4 12% | |
| Load Maximum * (Watt) | 192.3 | 173 10% | 179 7% | 144.5 25% | 238 -24% | 151.6 21% |
* ... smaller is better
Battery Life
Expect a real-world WLAN runtime of only 3.5 hours when set to the Balanced power profile to be average for a gaming laptop. The Dell G5 15 5590 with the faster RTX 2060 GPU can last for over two times longer despite having a similar battery capacity.
Recharging from empty to full capacity takes about 2 hours.
| Eurocom Nightsky Ti15 i7-9750H, GeForce GTX 1660 Ti Mobile, 62 Wh | Aorus 15-SA i7-9750H, GeForce GTX 1660 Ti Mobile, 62 Wh | Dell G5 15 5590 i7-8750H, GeForce RTX 2060 Mobile, 60 Wh | HP Omen 15-dc1020ng i5-9300H, GeForce GTX 1650 Mobile, 52.5 Wh | HP Gaming Pavilion 15-dk0009ng i7-9750H, GeForce GTX 1660 Ti Max-Q, 52.5 Wh | MSI GE63 Raider RGB 8RF-008 i7-8750H, GeForce GTX 1070 Mobile, 51 Wh | |
|---|---|---|---|---|---|---|
| Battery runtime | -22% | 114% | 78% | 33% | 11% | |
| WiFi v1.3 (h) | 3.6 | 2.8 -22% | 7.7 114% | 6.4 78% | 4.8 33% | 4 11% |
| Reader / Idle (h) | 3.5 | 14.8 | 15.9 | 8.7 | 5.7 | |
| Load (h) | 2 | 2.8 | 1.2 | 1.3 | 0.8 | |
| Witcher 3 ultra (h) | 1 | 1 |
Pros
Cons
Verdict
There's no doubting the performance of the Eurocom Nightsky Ti15. Unfortunately, it falls short in a few other key areas. For one, this chassis is one of the least user-friendly Clevo systems to service especially when compared to older and larger Clevo models that were much easy to disassemble. If you plan on upgrading your storage and RAM frequently, then this will not be the system for you. It's a shame because the Nighysky Ti15 has more storage expansion options than most other narrow bezel 15.6-inch gaming laptops.
Secondly, the Eurocom could have been quieter when gaming. Both the Razer Blade 15 and HP Gaming Pavilion 15 are able to run quieter while sporting the same CPU and similar GPU options. Perhaps having Max-Q options would have boosted battery life while lowering fan noise.
The Eurocom Nightsky Ti15 is a high-performance mid-size solution that sits between the MSI GS65 and MSI GT63 in size while performing closer to an enthusiast Eurocom Sky X4C desktop replacement. Some corners had to be cut along the way including battery life and serviceability.
Eurocom Nightsky Ti15
- 08/17/2019 v6 (old)
Allen Ngo
Price comparison
