Asus ROG Strix Hero III G731GW Review - a colorful laptop with compromises

Asus' ROG line is a storied brand in the world of gaming laptops. The device family sits at the forefront of the gaming industry and incorporates many of the newest technologies. This is fairly evident with the latest line of Strix and Hero gaming laptops. In addition to new CPU and GPU options, the laptops have been decked out with RGB strips along the bottom edges. While the new lighting options add quite a bit of flair to what is normally a comparatively tame brand, they introduce new points of failure, as we will point out in this review.
We recently looked at the ROG Strix G GL731GU and conclude that a few design annoyances hindered the overall experience. The ROG Strix Hero III G731GW under review today (courtesy of CUKUSA) is essentially an upgraded GL731GU and exaggerates both the pros and cons of the cheaper device. Starting at US $2000, the G731GW is armed with some of the most powerful hardware on the market today. The Intel Core i7-9750H and the Nvidia GeForce RTX 2070 chew through games, and the 144 Hz panel makes that gameplay silky smooth. However, these components can be found on several other machines. How does the Asus ROG Hero III G731GW fare in a highly competitive industry?
Consumers have several options at this end of the gaming laptop market. In this review, we will compare the Asus ROG Hero III G731GW to the Acer Predator Triton 500, Dell's Alienware m17, the Eurocom Nightsky RX17, Gigabyte's Aorus 15-W9, and the MSI GE75 Raider 8SF.
Case
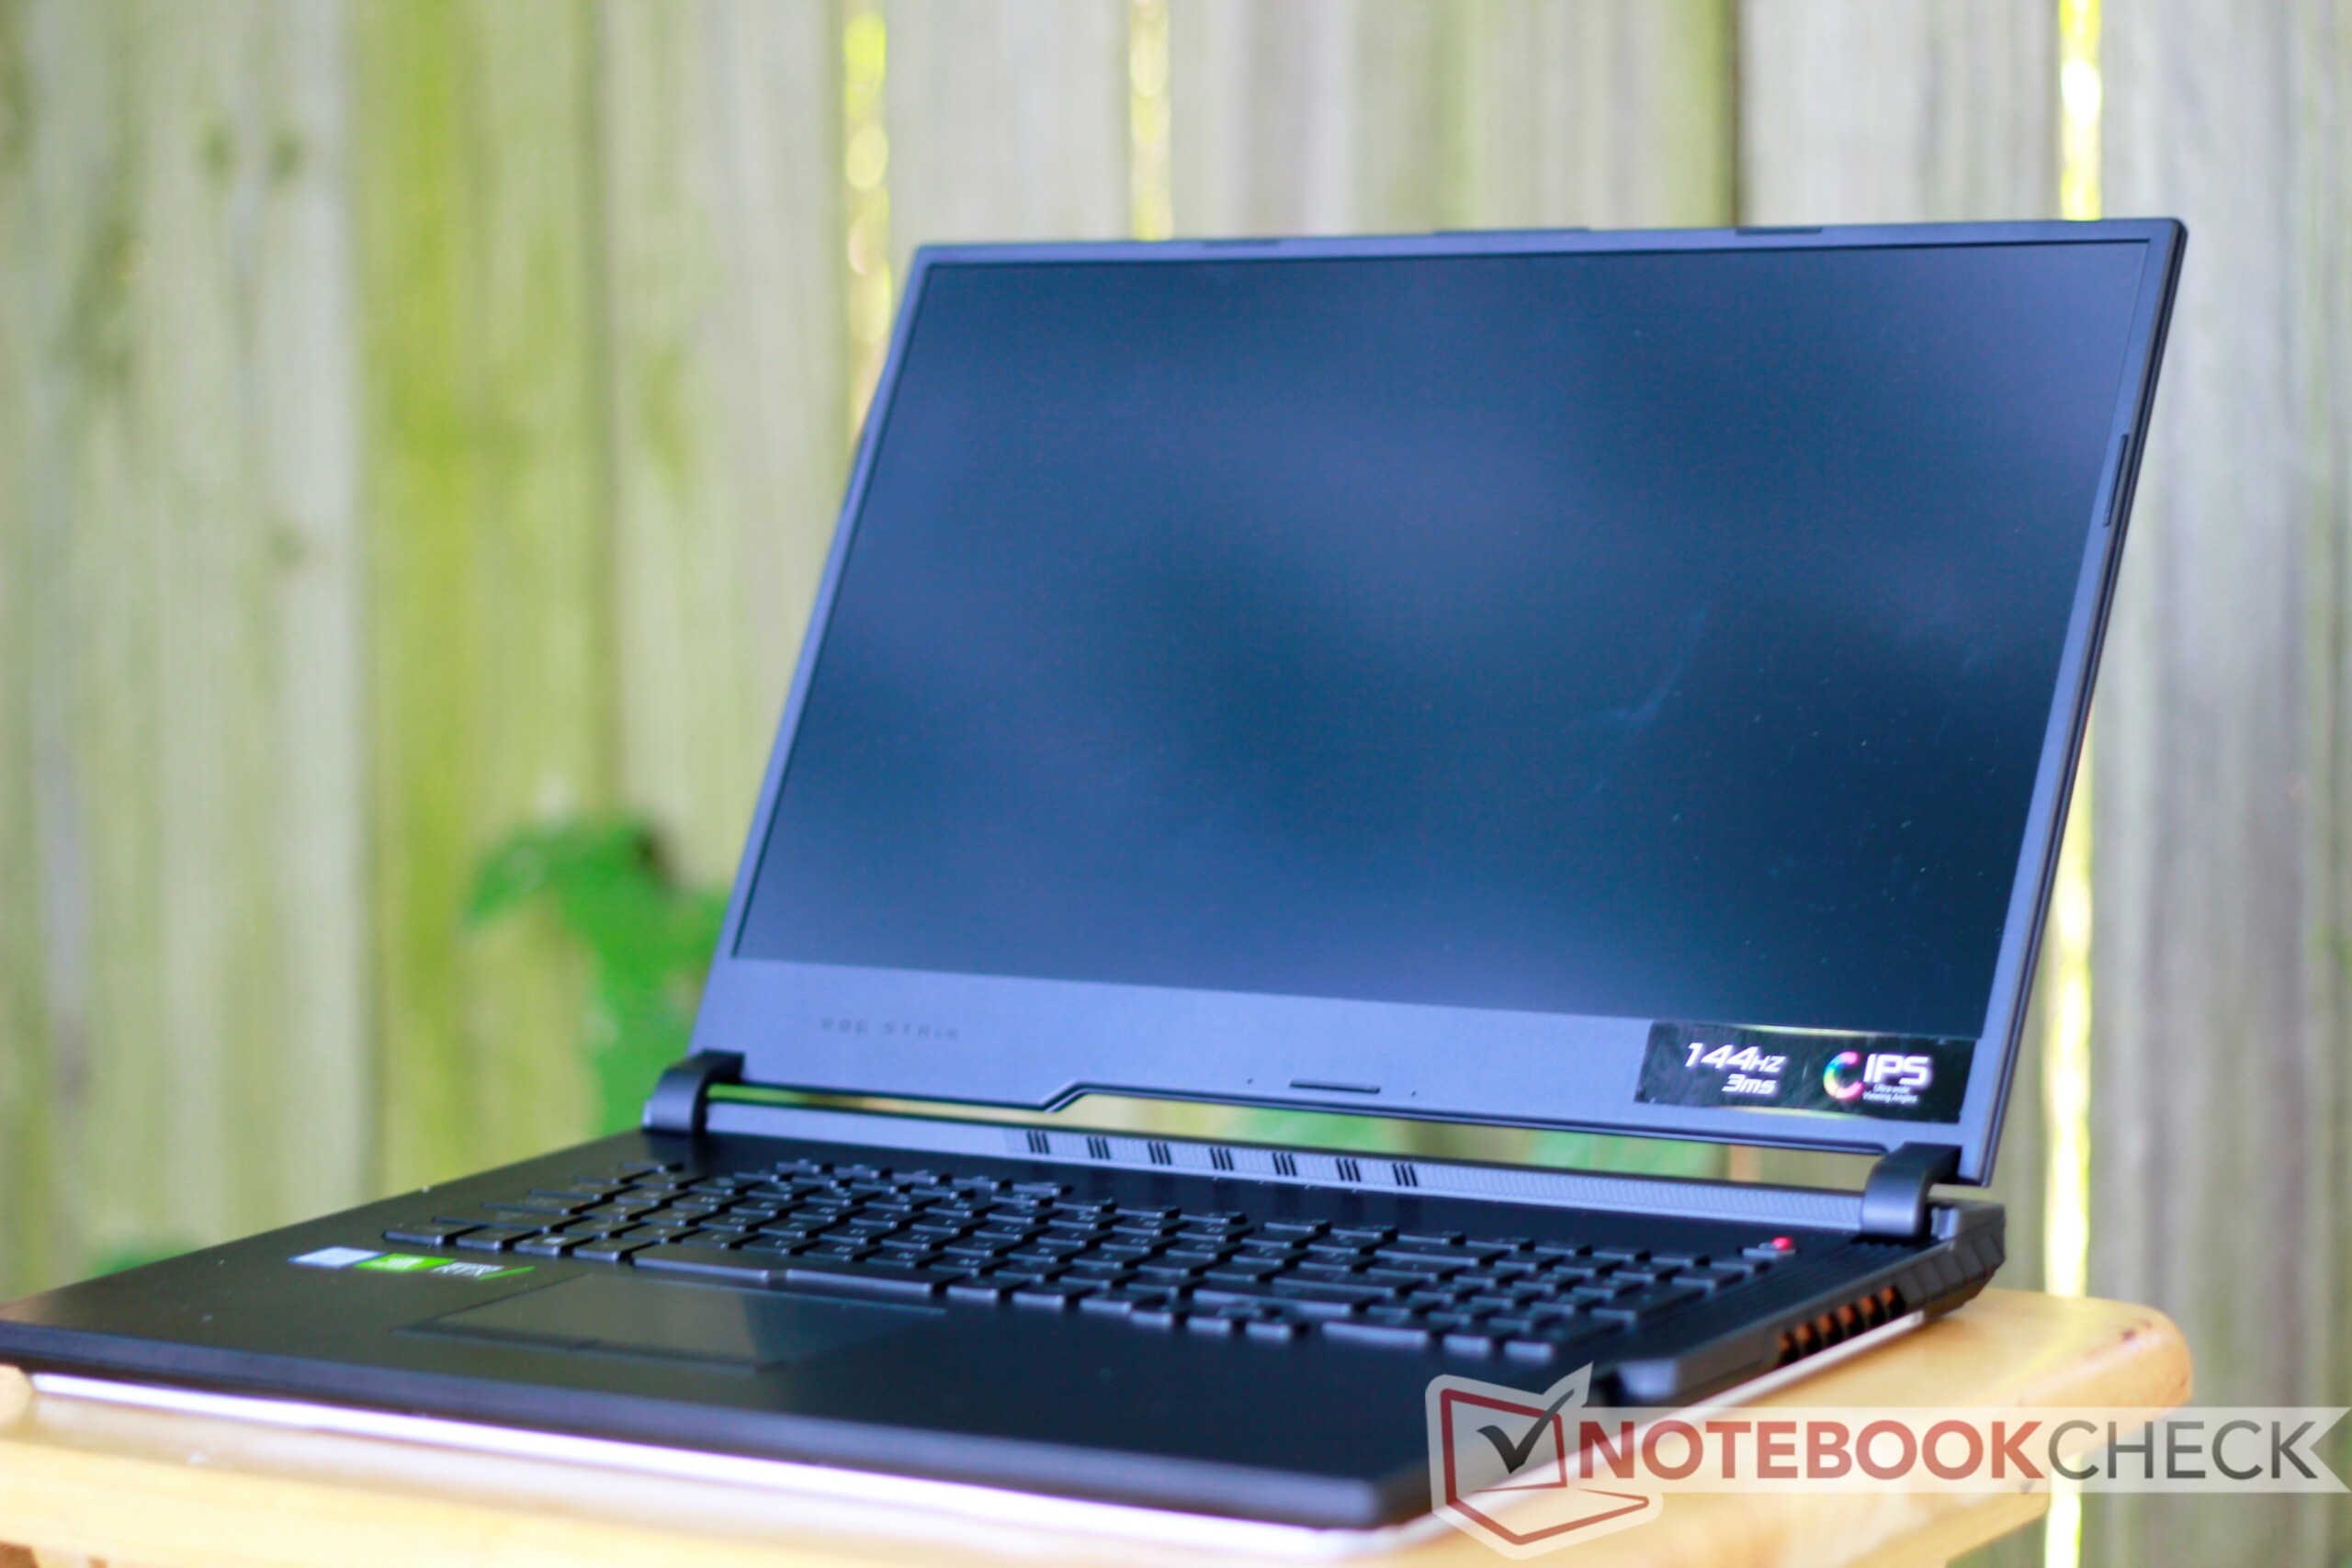
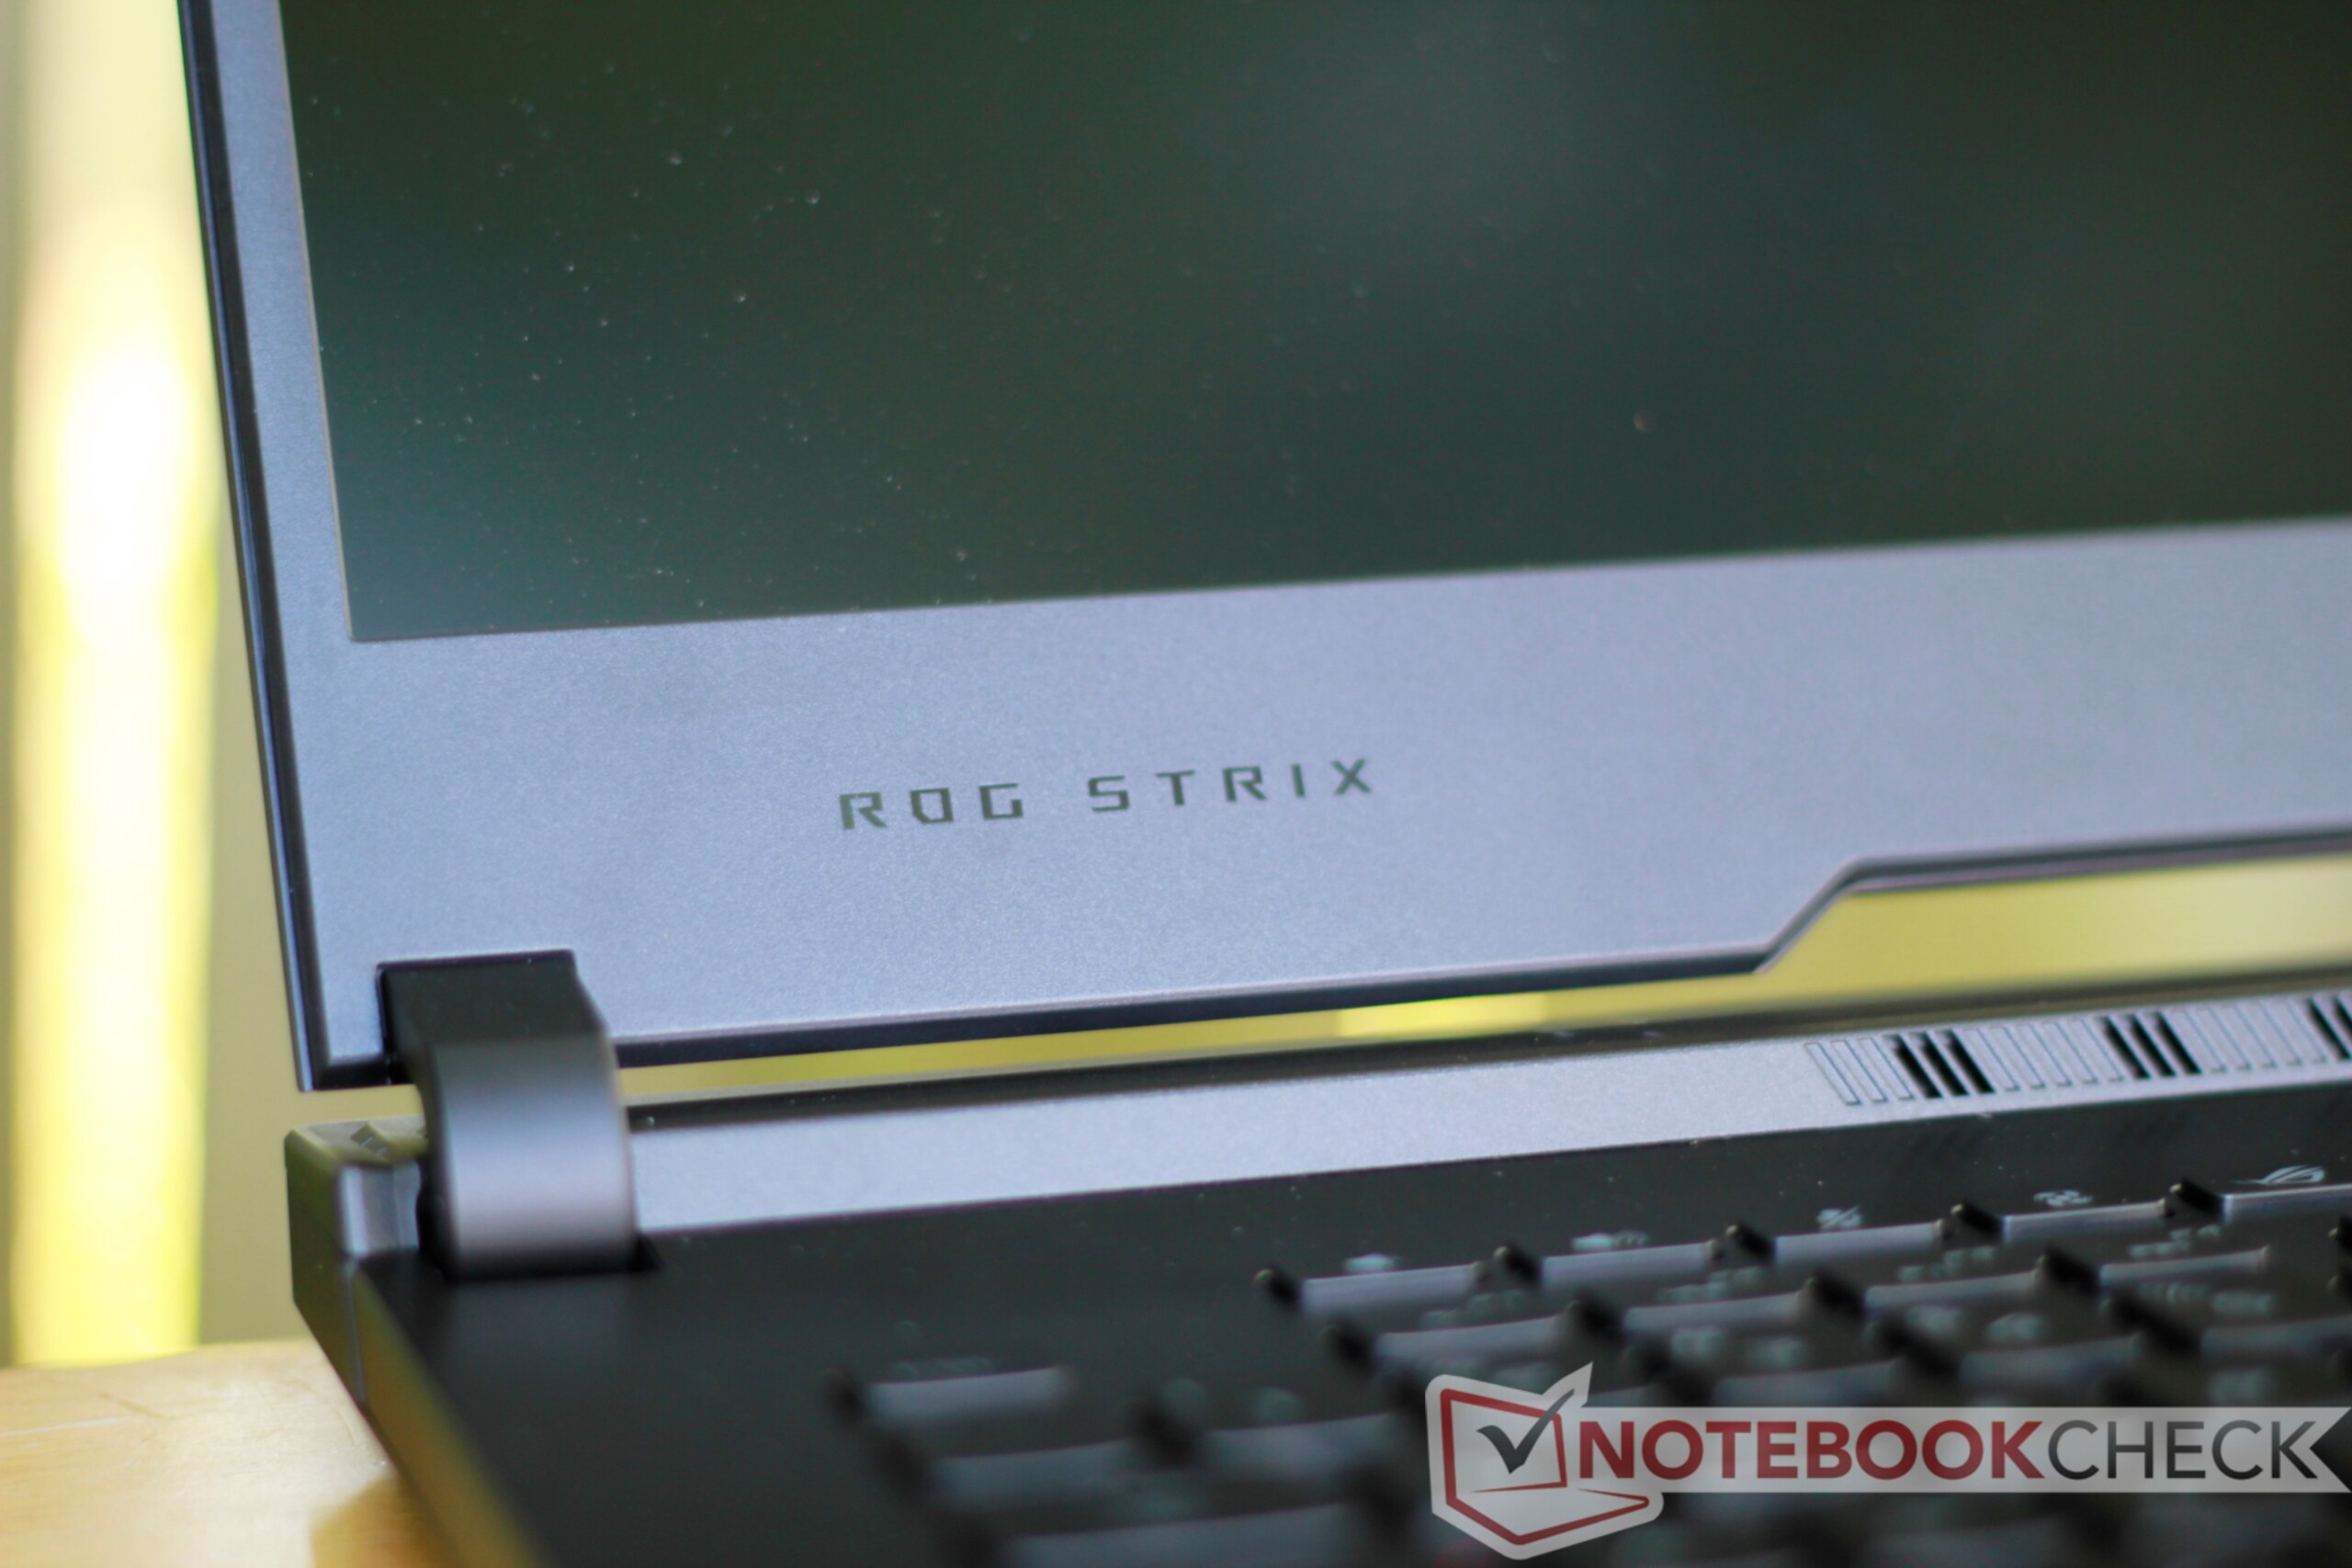
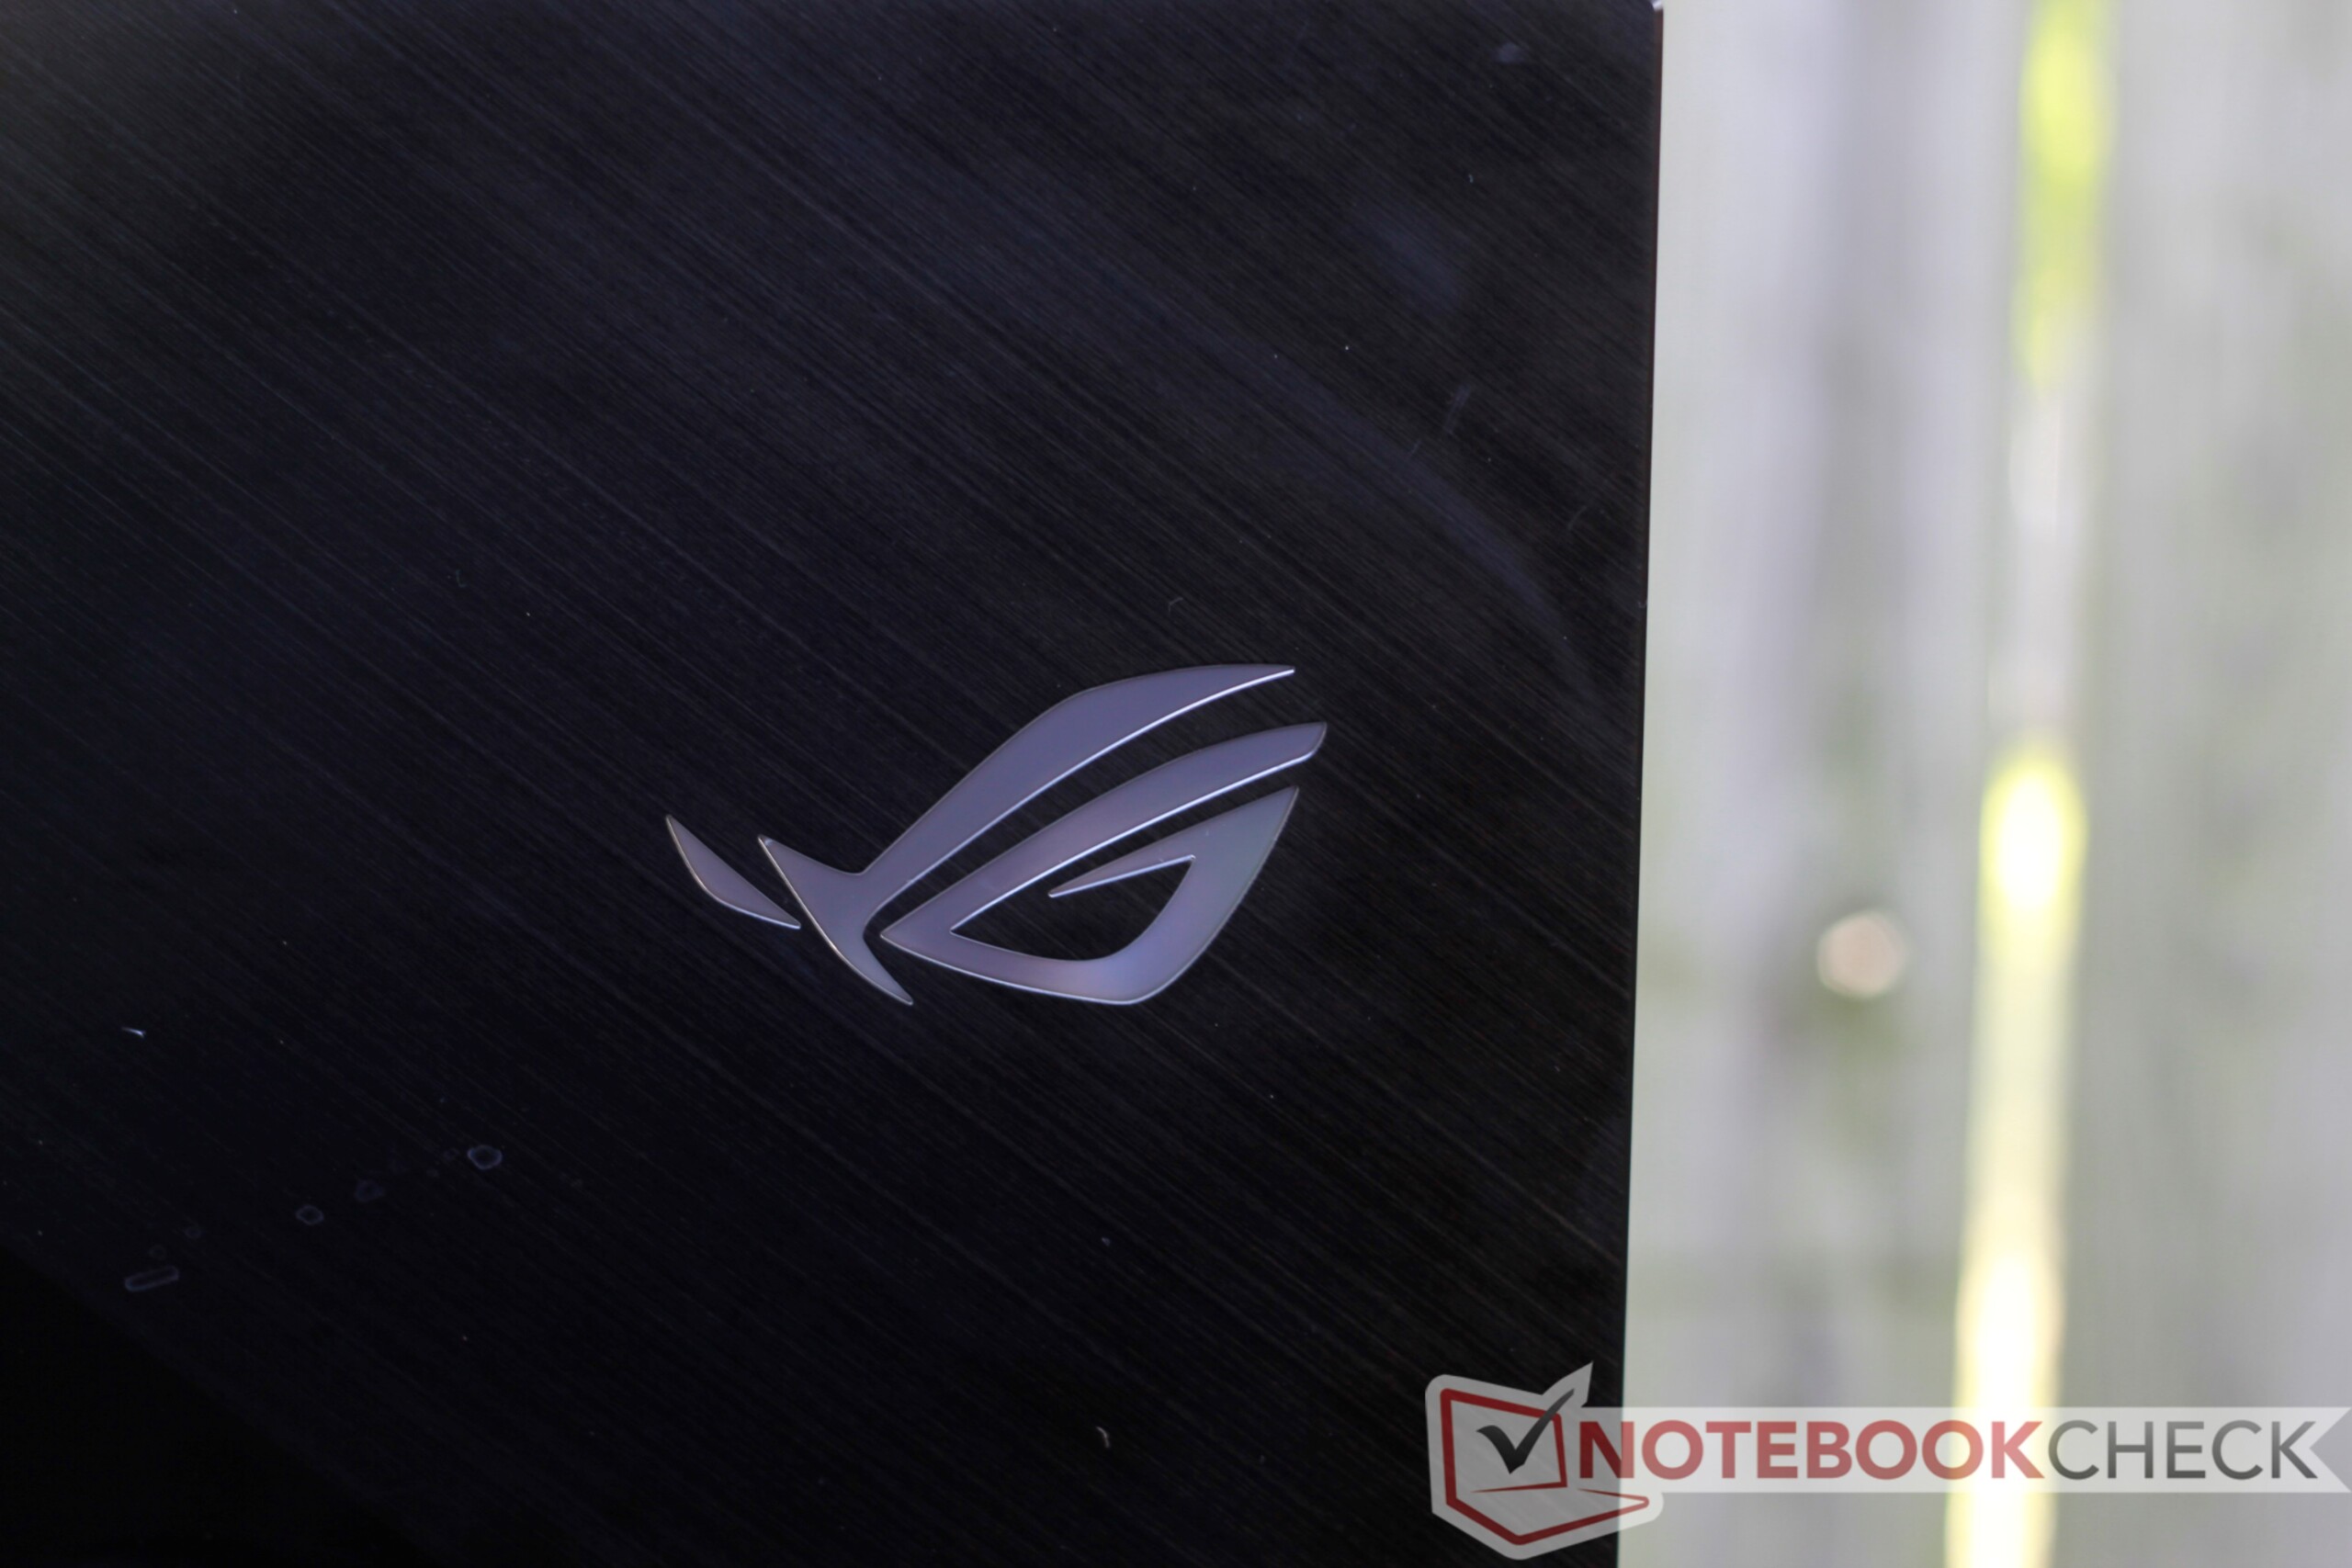
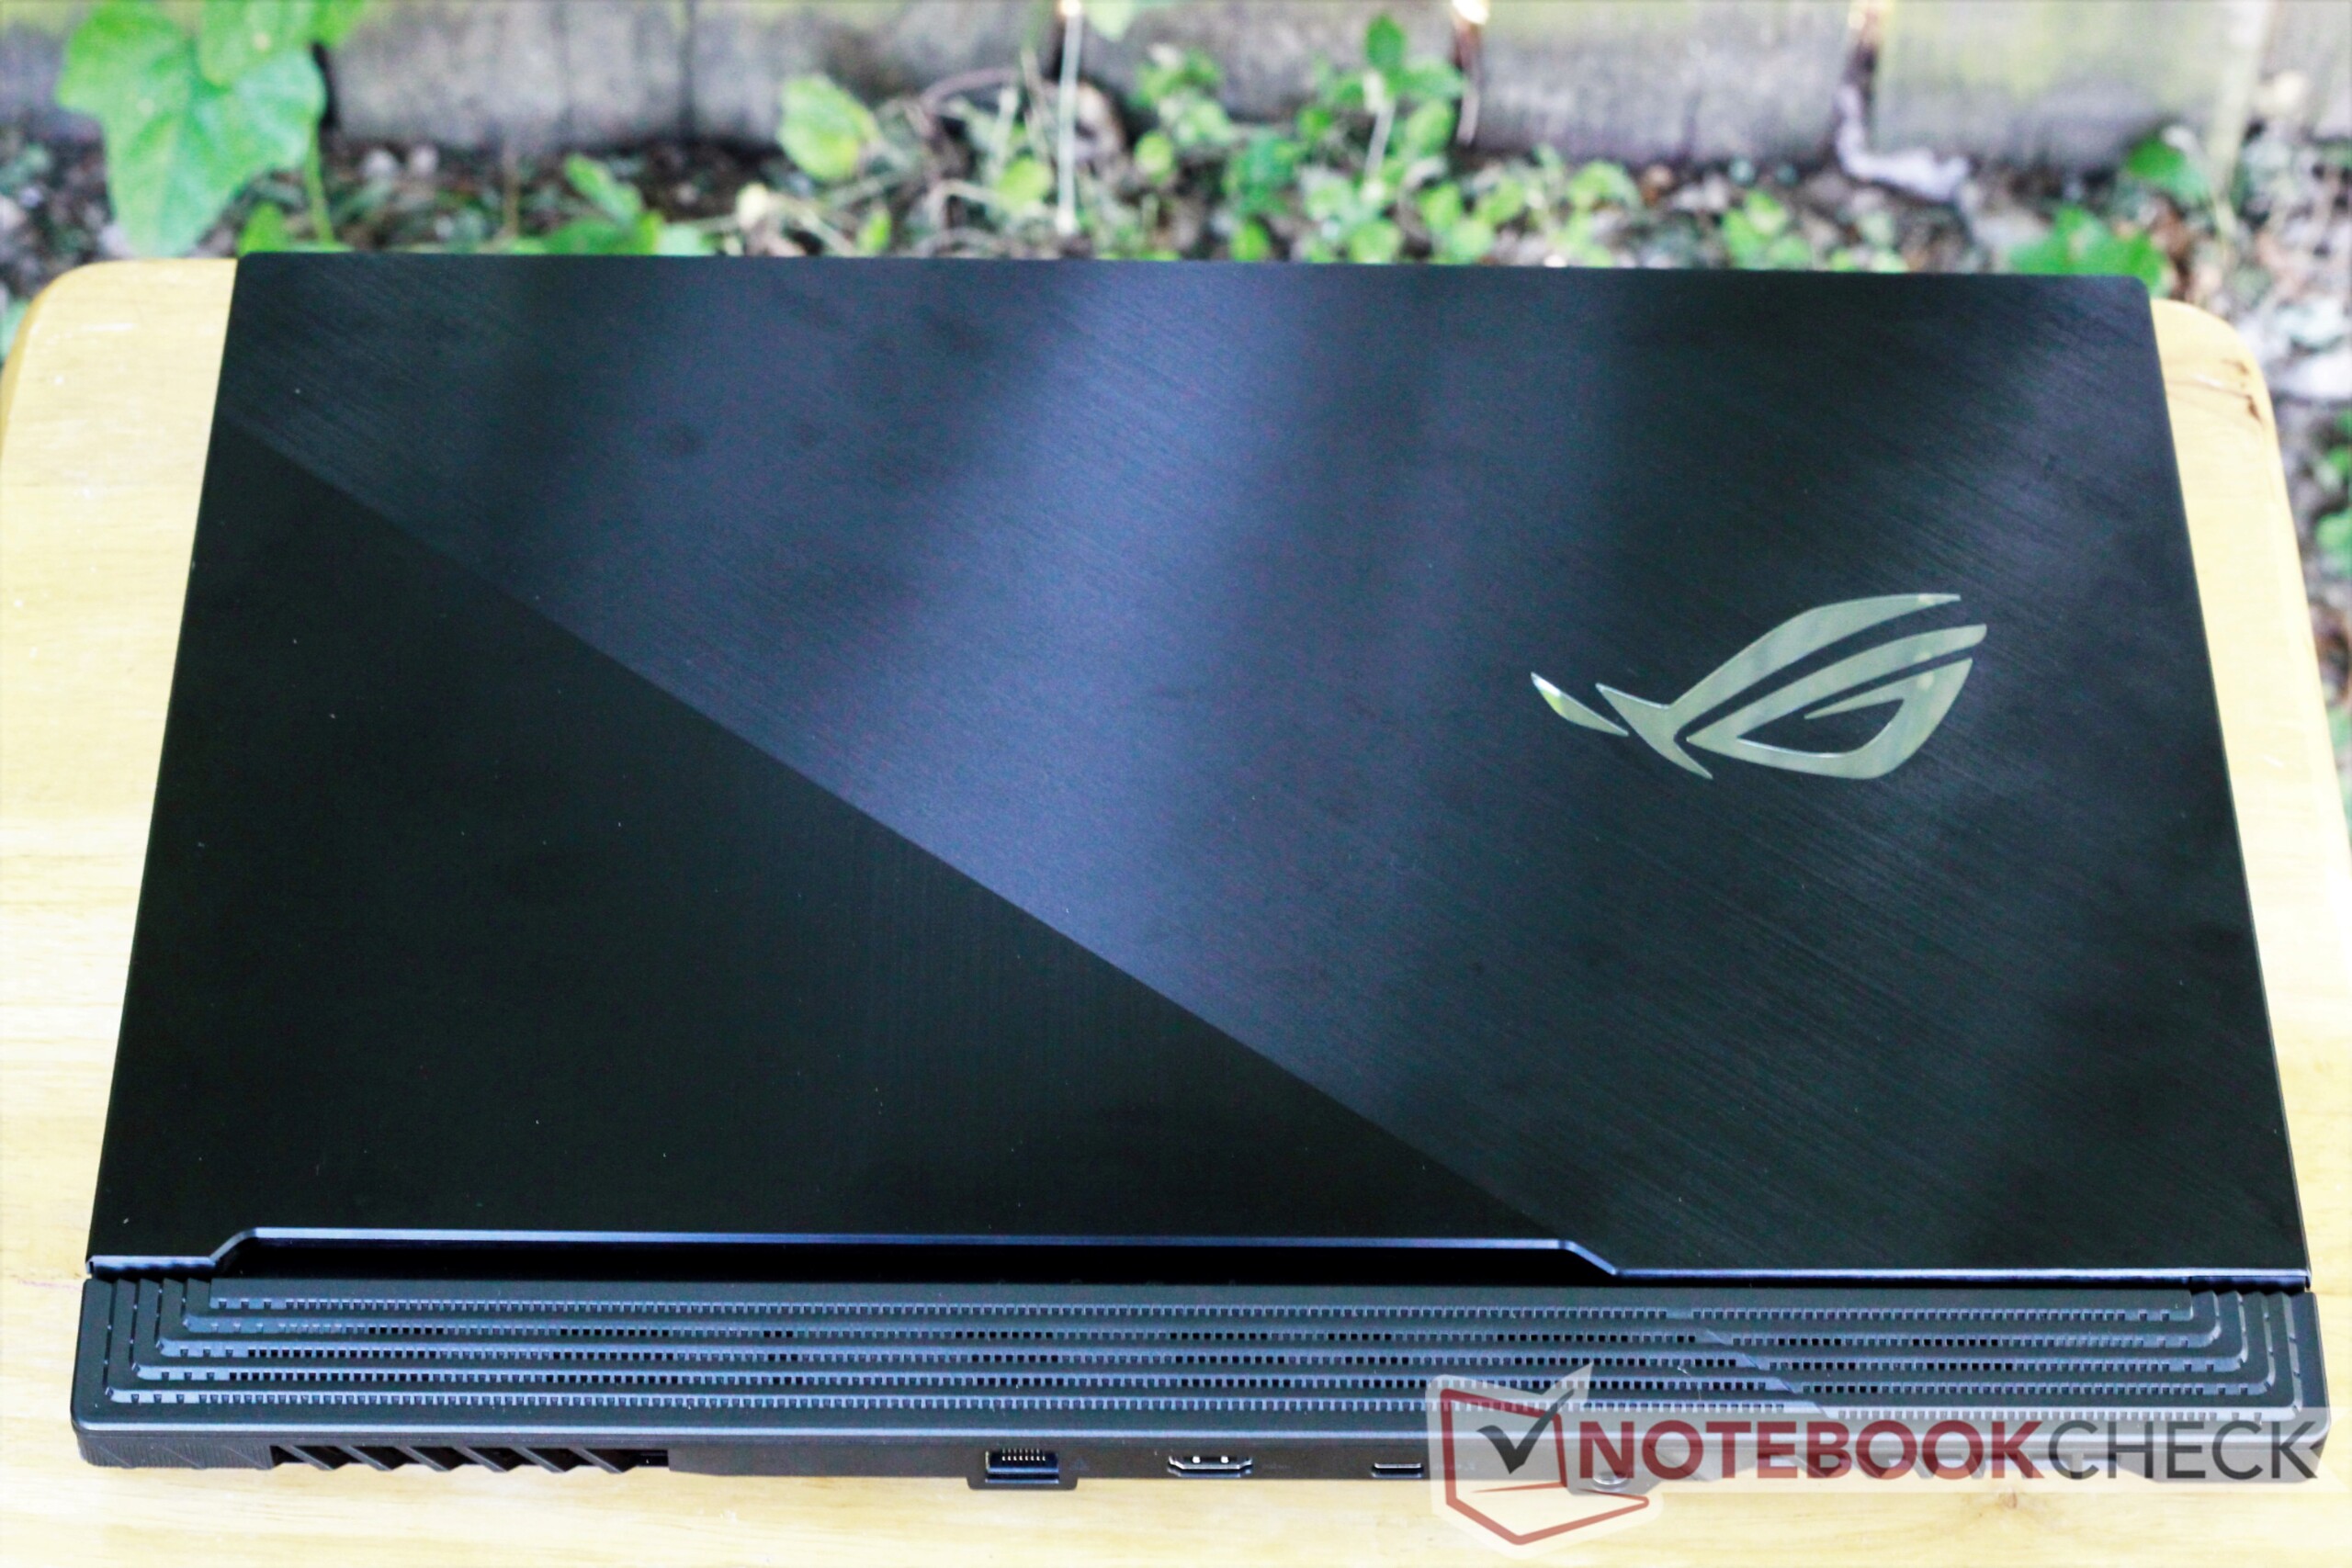
The case is as well-built as the high retail price suggests. Brushed aluminum adorns the lid and the keyboard deck. The bottom panel is made from plastic with etched accents typical for Asus' ROG laptops. The display bezel is also plastic. While the black aluminum looks nice out of the box, it is a fingerprint magnet. Smudges appear readily at the slightest touch, and effort is needed to wipe them away. The chassis does not creak when pressed or squeezed.
There is minimal flex along the keyboard deck under direct pressure. While typing, the deck remains firm. The bottom panel is similarly rigid and does not warp. The thin lid can be twisted a slight bit. Depressing the back of the display does not distort the LCD panel. The hinges are robust and well-tuned. One-handed opening is a snap, and the hinges hold the screen firmly in place under normal use. There is no wobble when typing. The hinges open to a maximum of 120°.
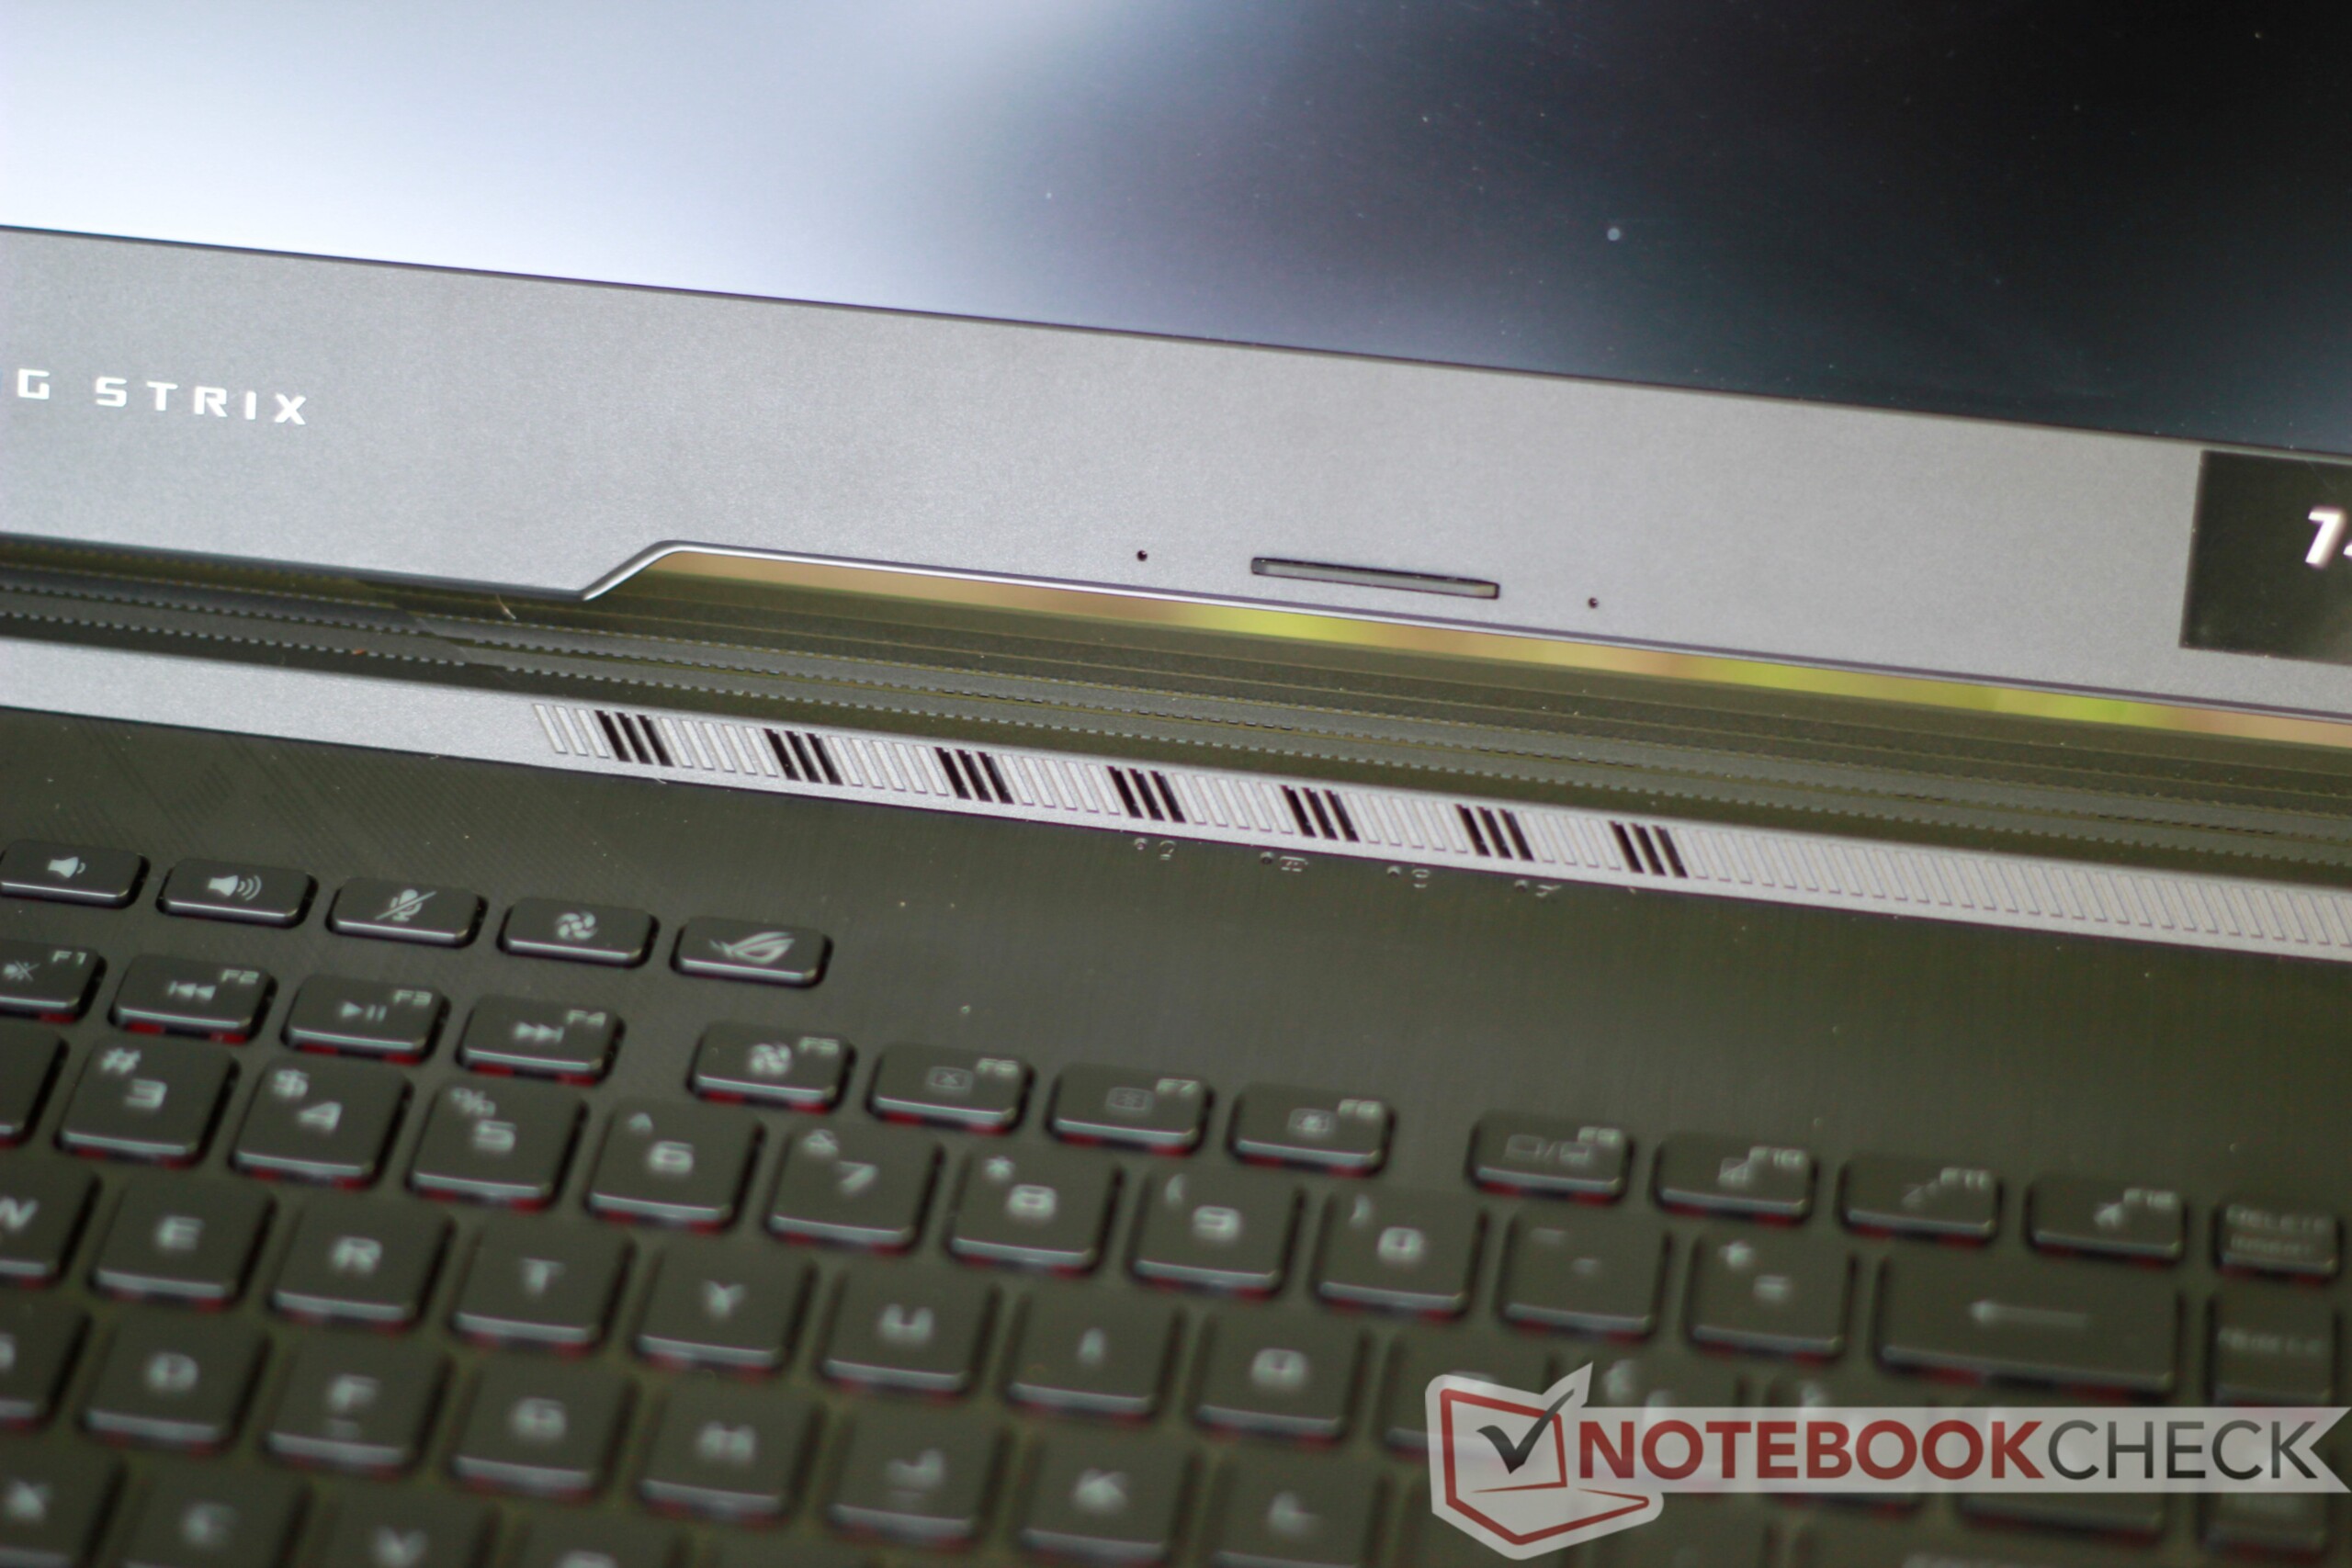
Eagle-eyed readers may have noticed the absence of a webcam. Asus has been omitting the webcam on more and more laptops in response to their own market research. The manufacturer has found that users prefer narrower bezels around the displays of machines. Rather than mount the webcam on the bottom bezel like the XPS 15 or Legion Y740, Asus would rather remove the camera entirely. Lastly, according to Asus' research, most gamers use an external camera, rendering the webcams on gaming laptops unused relics.
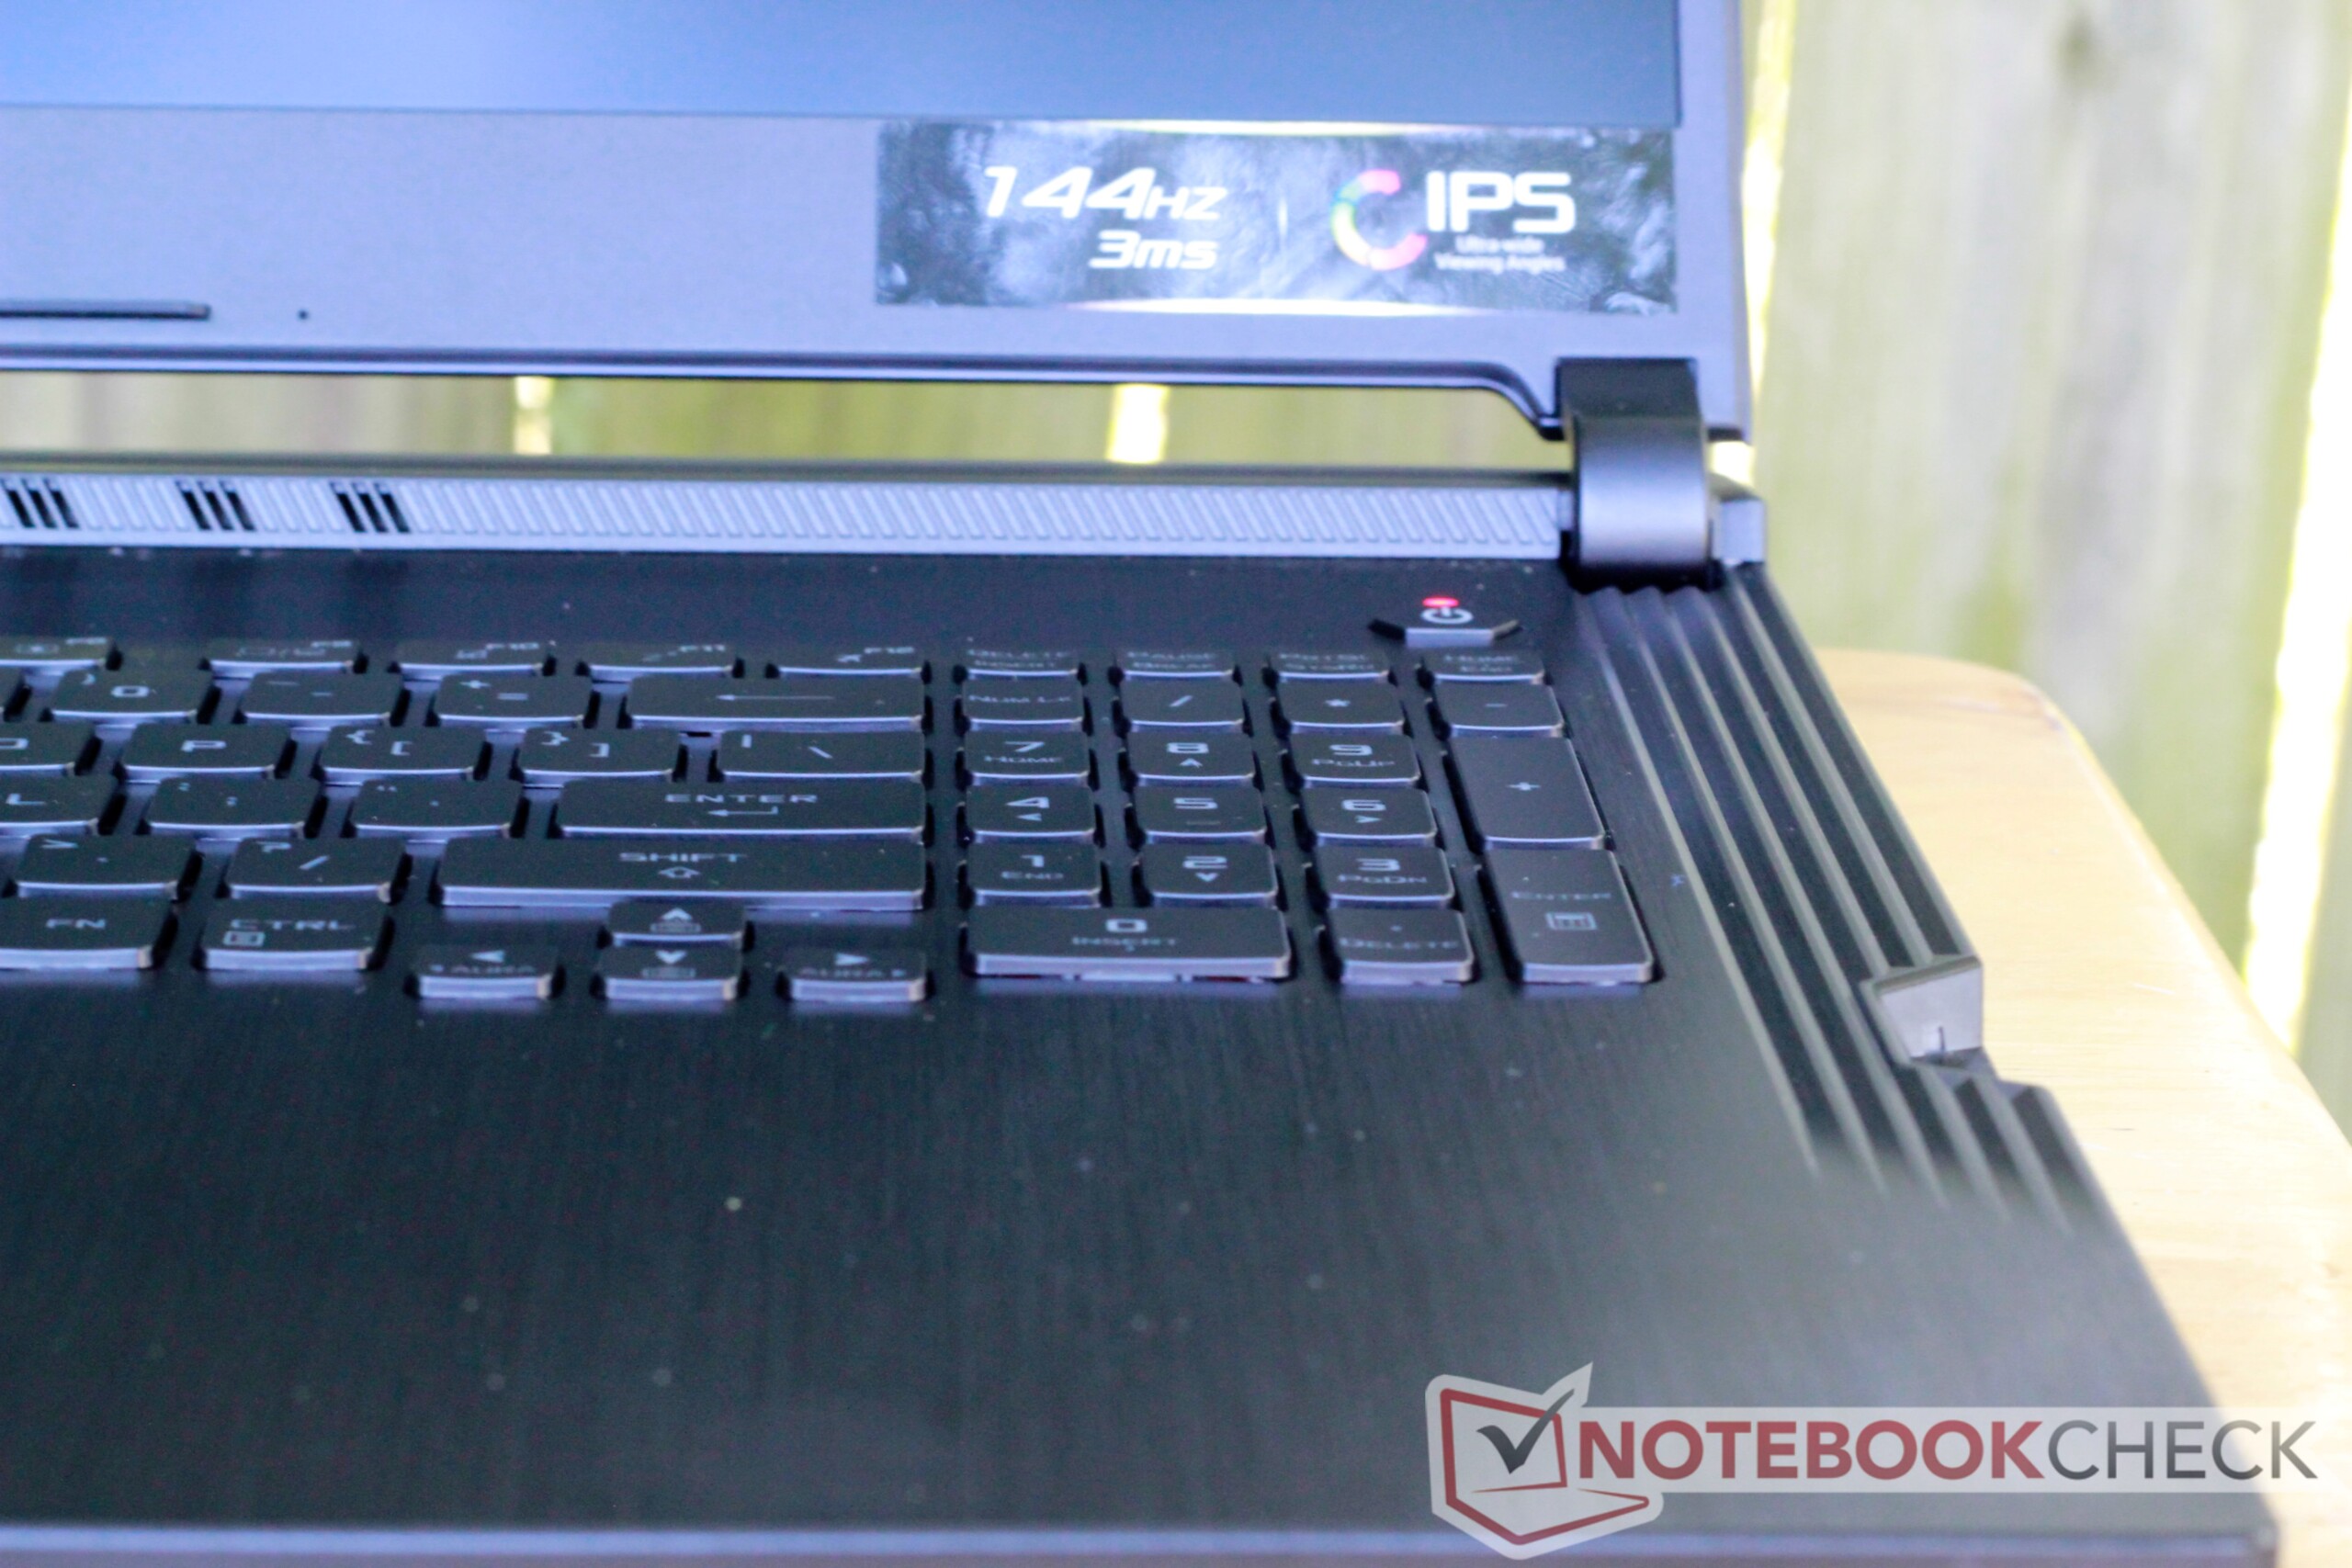
There are RGB lights on almost every surface that are controlled via Asus' Aura lighting software. The keyboard backlight is per-key rather than zoned, allowing for some unique lighting effects. There are also plastic strips along the bottom of the right, front, and left of the device. These strips are also capable of displaying separate colors, allowing for rippling color shifts. The effect is quite striking but can be ostentatious. Like the cheaper GL731GU, the brightness levels of all RGB lights are controlled simultaneously. This means the bottom RGB lights cannot be disabled without also disabling the keyboard backlight.
We should note that an update (dated 2019/07/12) installed during our review period seems to have disabled the bottom RGB lights. The keyboard and logo backlights can still be customized, but after installing the most recent Aura Lighting Component update, the bottom RGB strip is nothing more than hollow plastic.
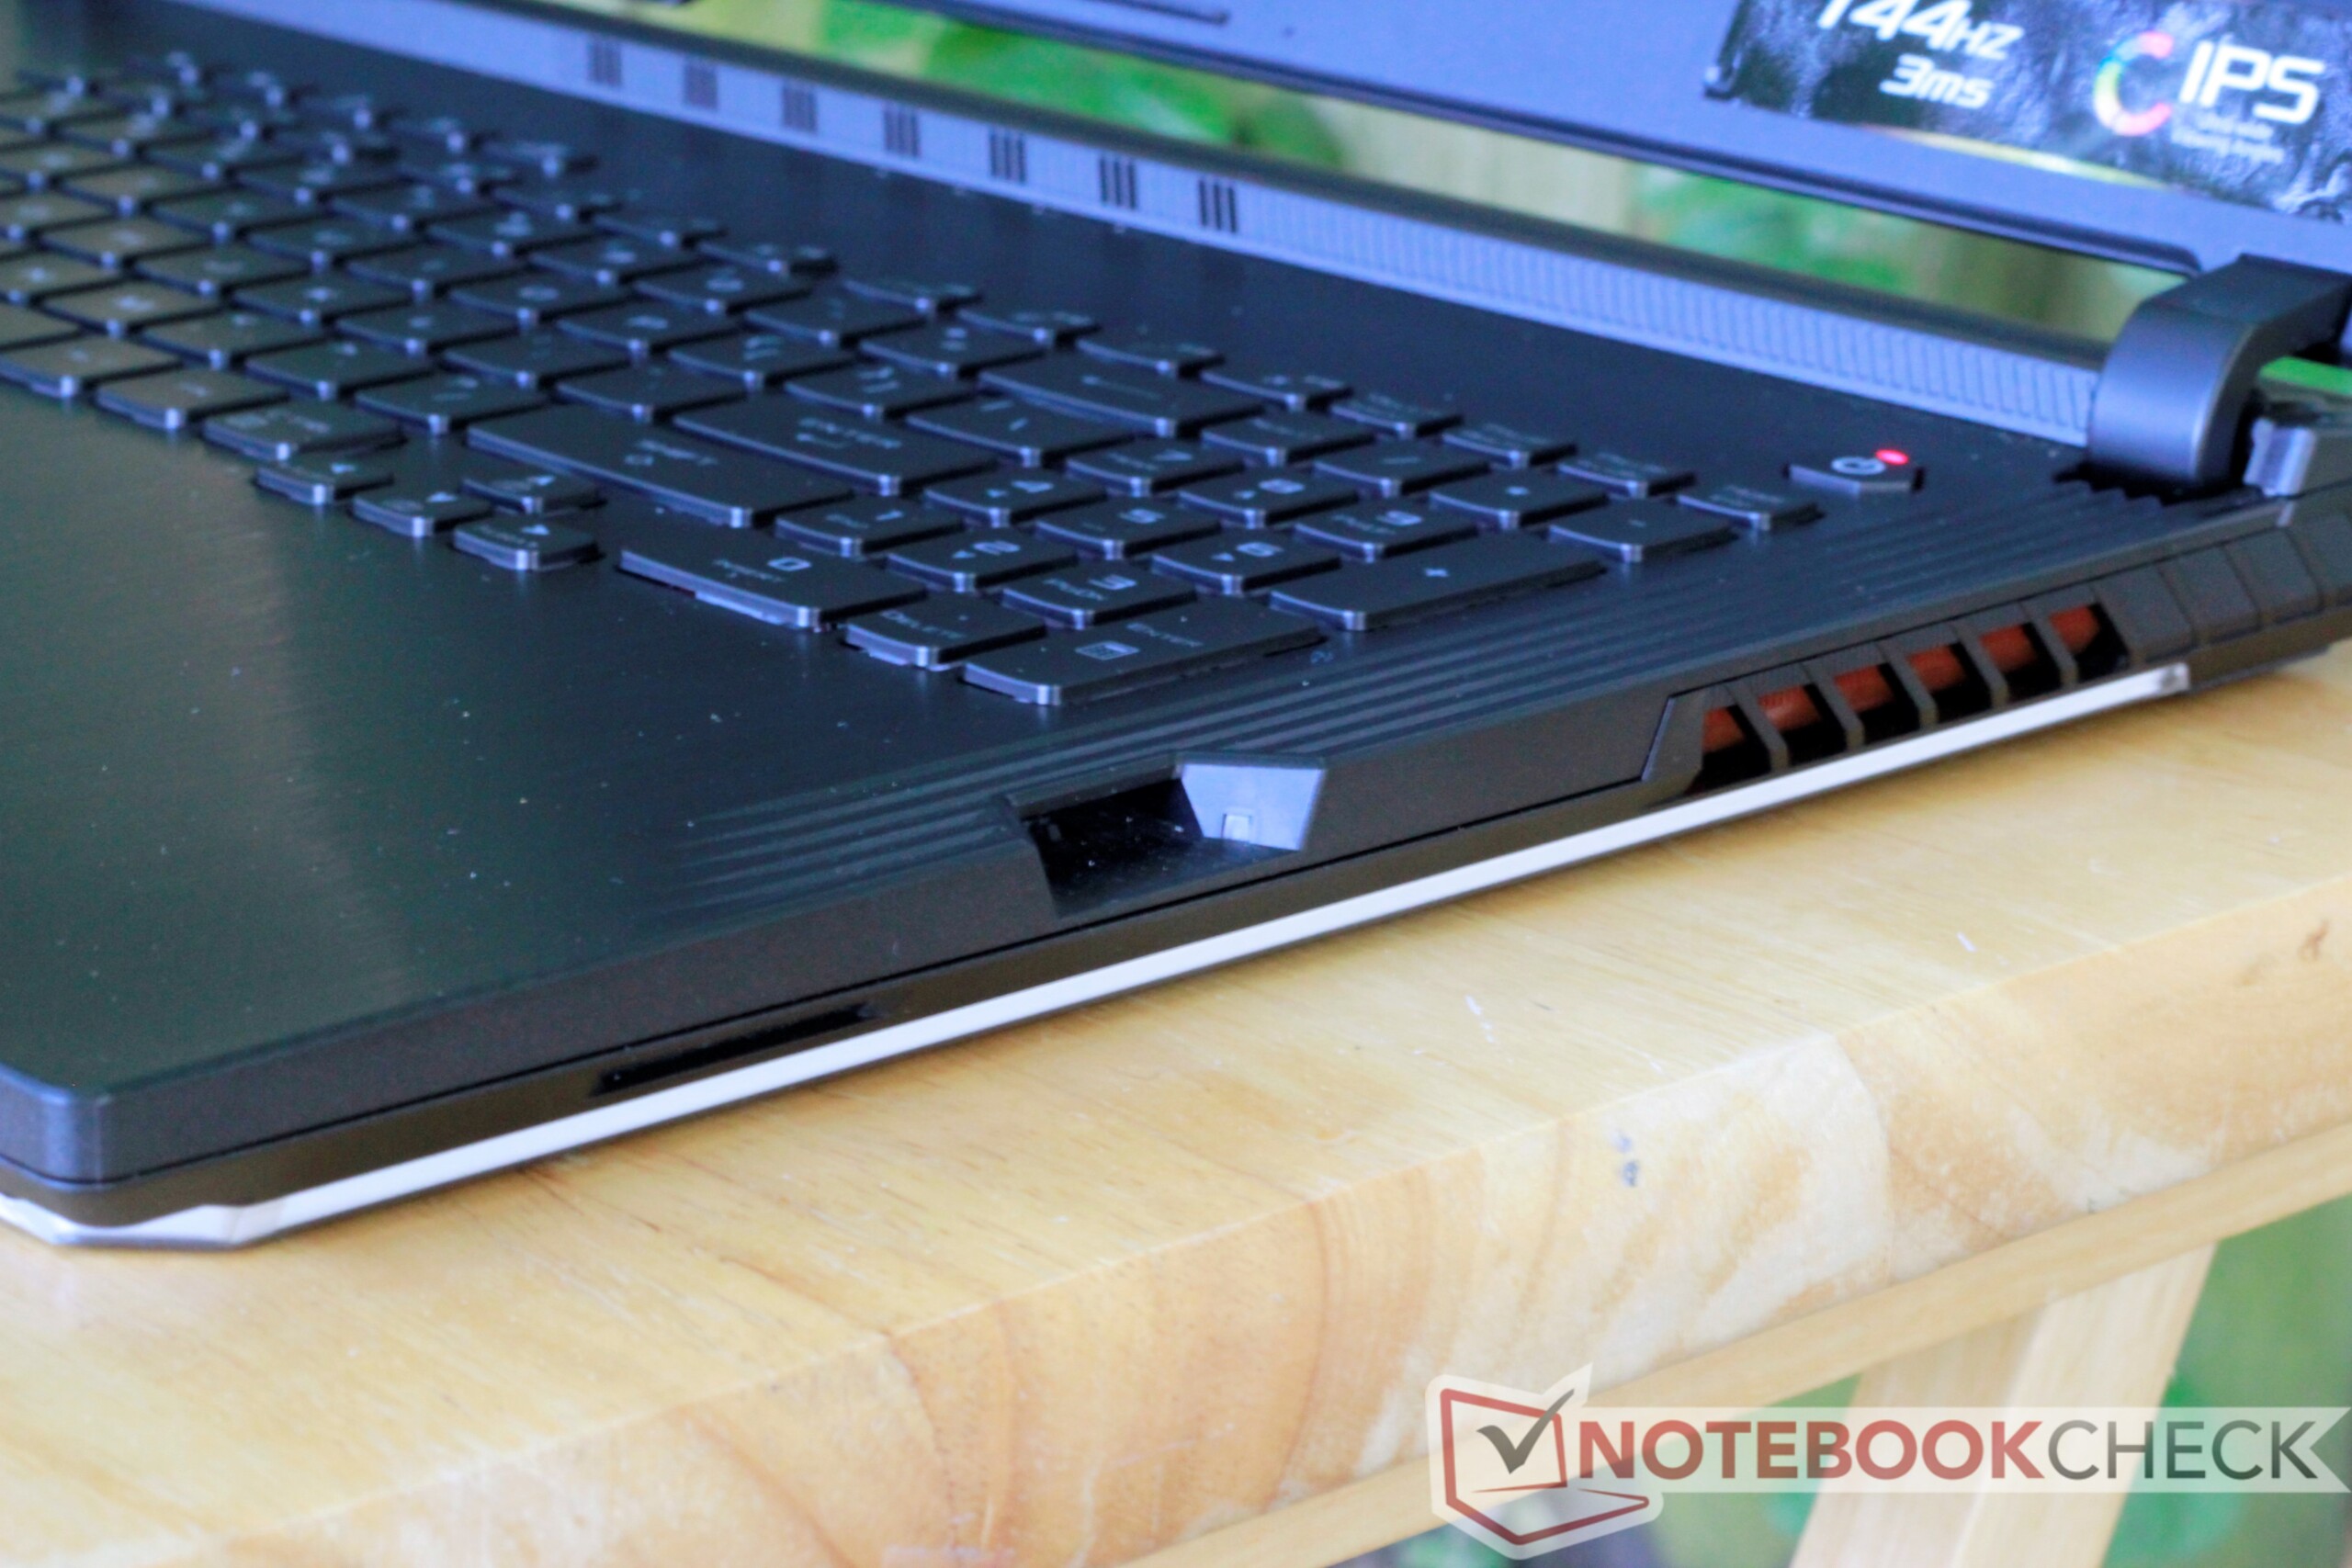
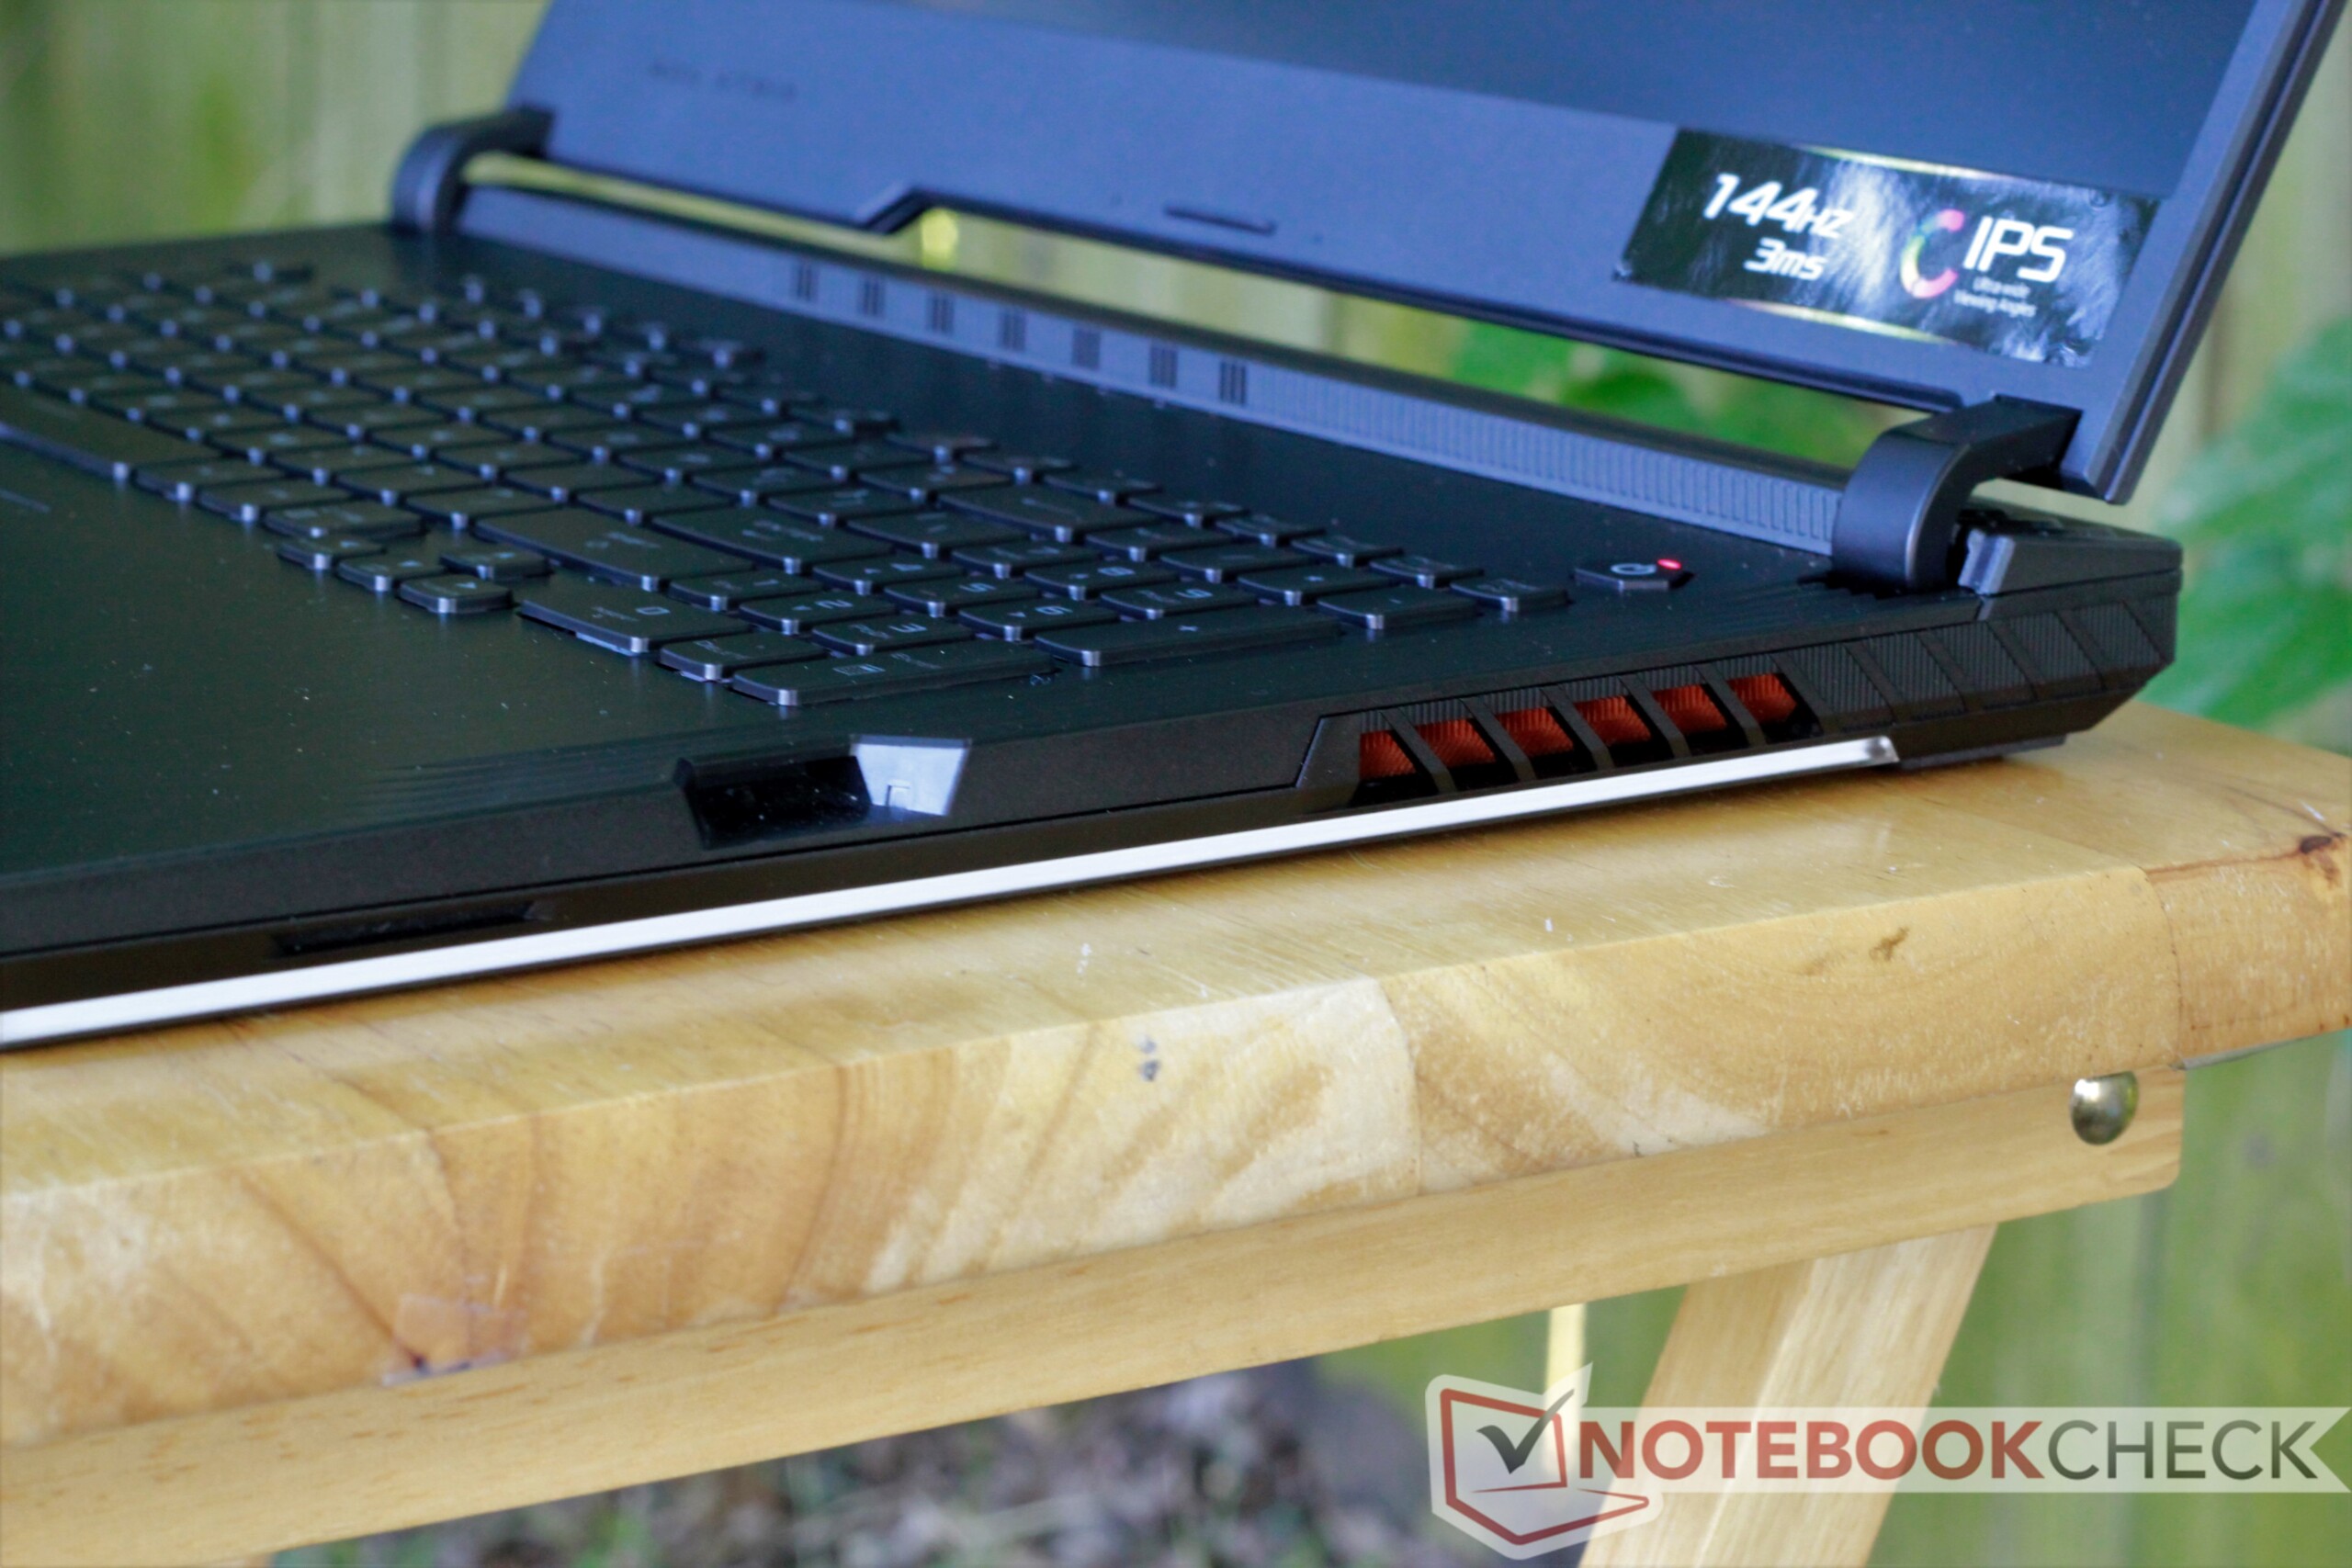
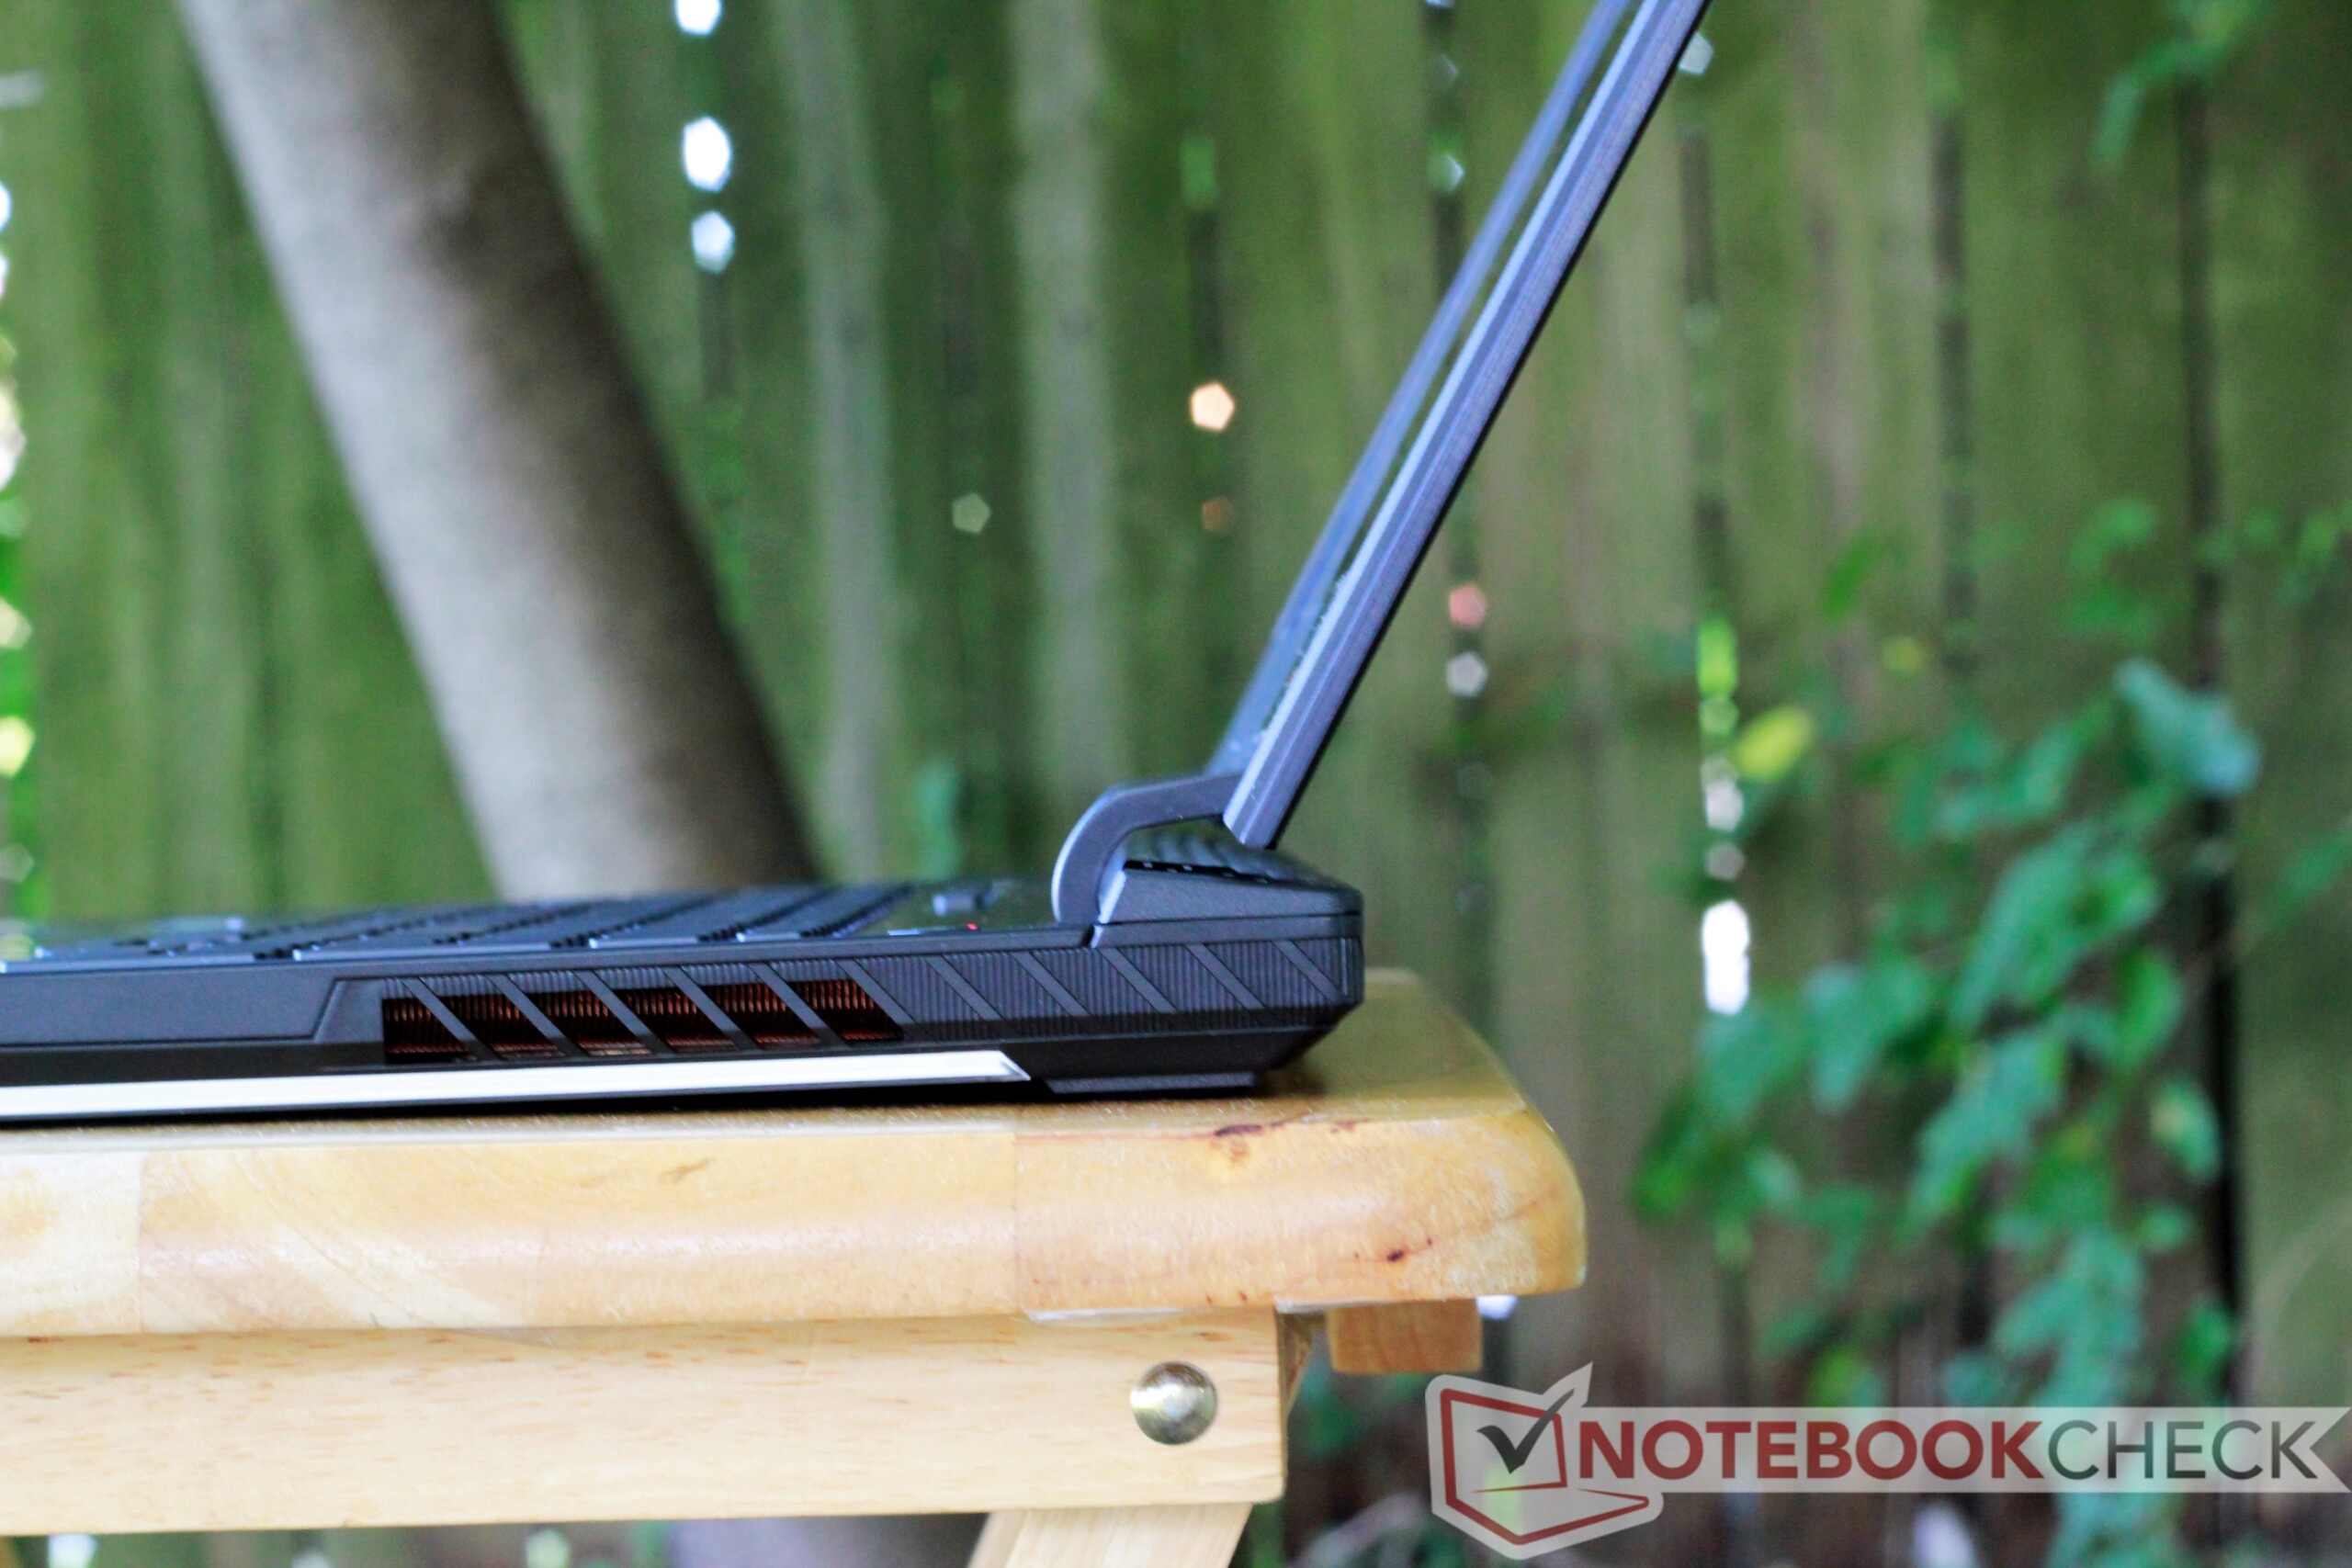
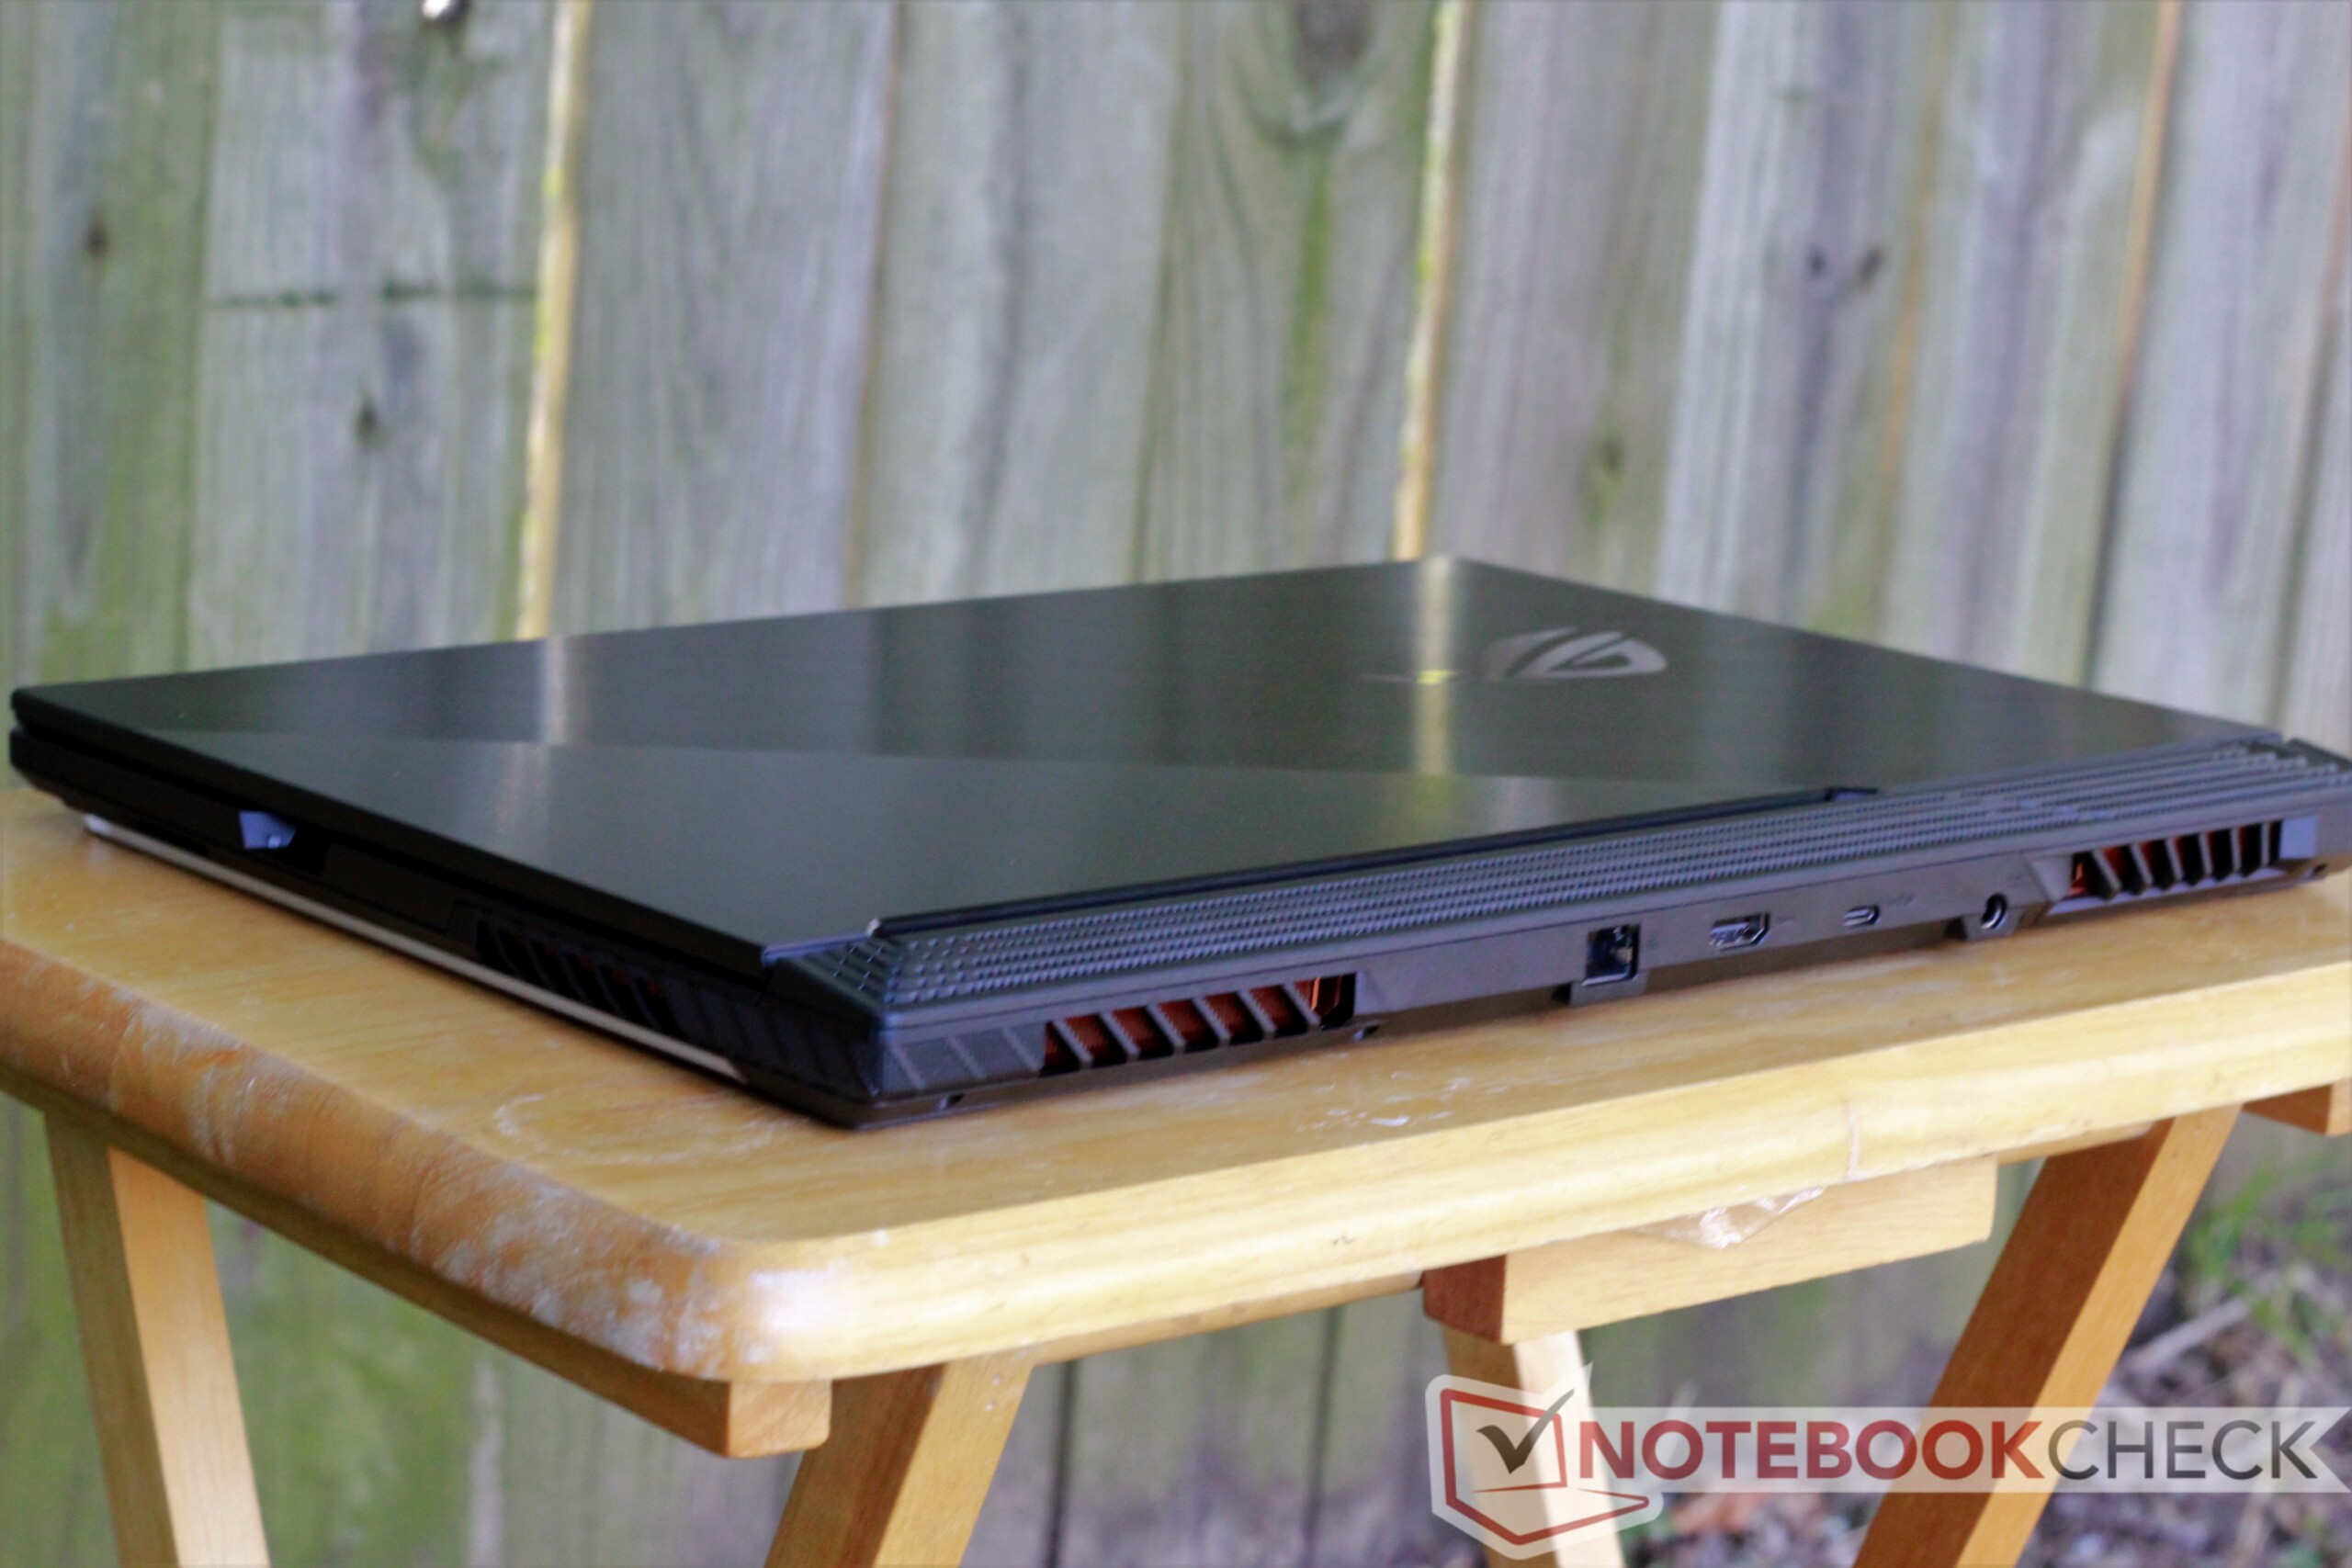
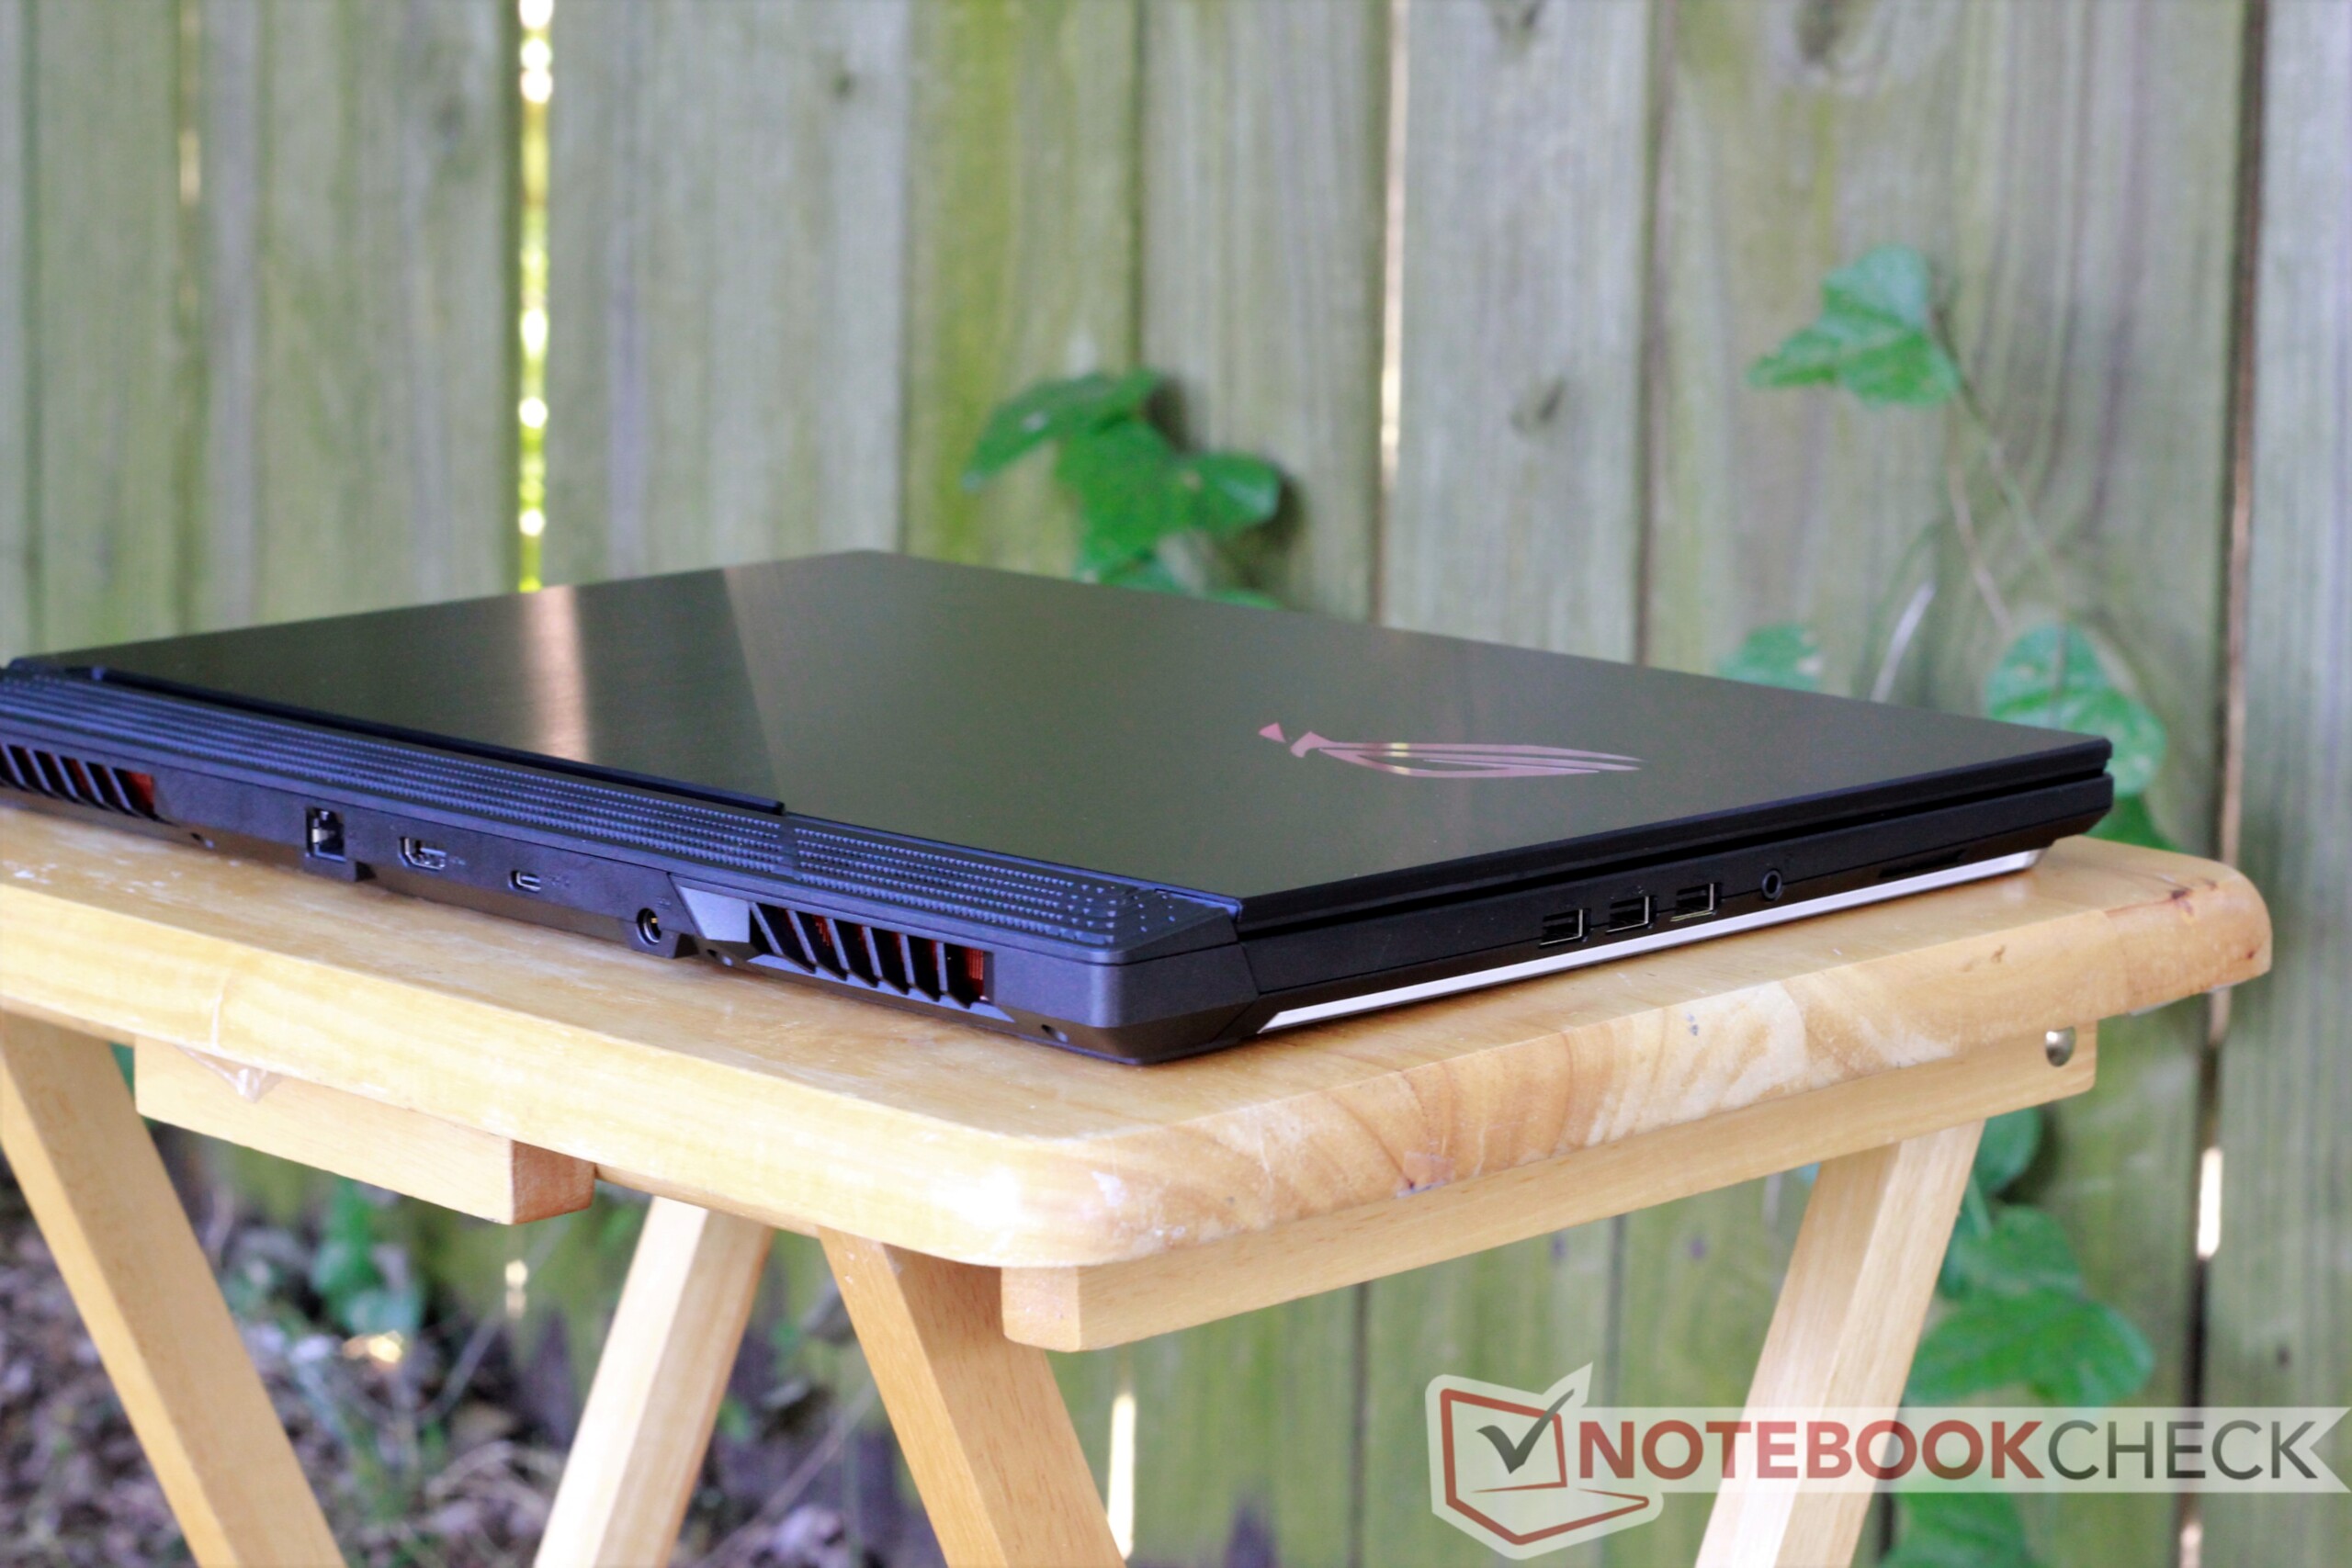
The G731GW's footprint is a tad larger than other 17.3-inch gaming laptops. The G731GW cuts a bit off its length and width thanks to the thin bezels (5.3 mm) around the right, left, and top of the display, but the machine is still large. The case takes up a bit more space than the MSI GE75 and Eurocom Nightsky RX17, but only by a hair. This is mainly because of the G731GW's rear ventilation, which juts out a fair bit behind the hinge. The hinges of the Eurocom and MSI GE75 sit flush with the rear of the device. The G731GW's rear vents also make fitting the machine into a regular school-sized backpack problematic.
The G731GW is also about 0.3 kg (0.5 lbs) heavier than the MSI GE75 and Alienware m17. The Eurocom Nightsky RX17 is similar in weight to the G731GW (2.9 kg). Unsurprisingly, 15-inch gaming laptops are significantly smaller and lighter than the G731GW.
Connectivity
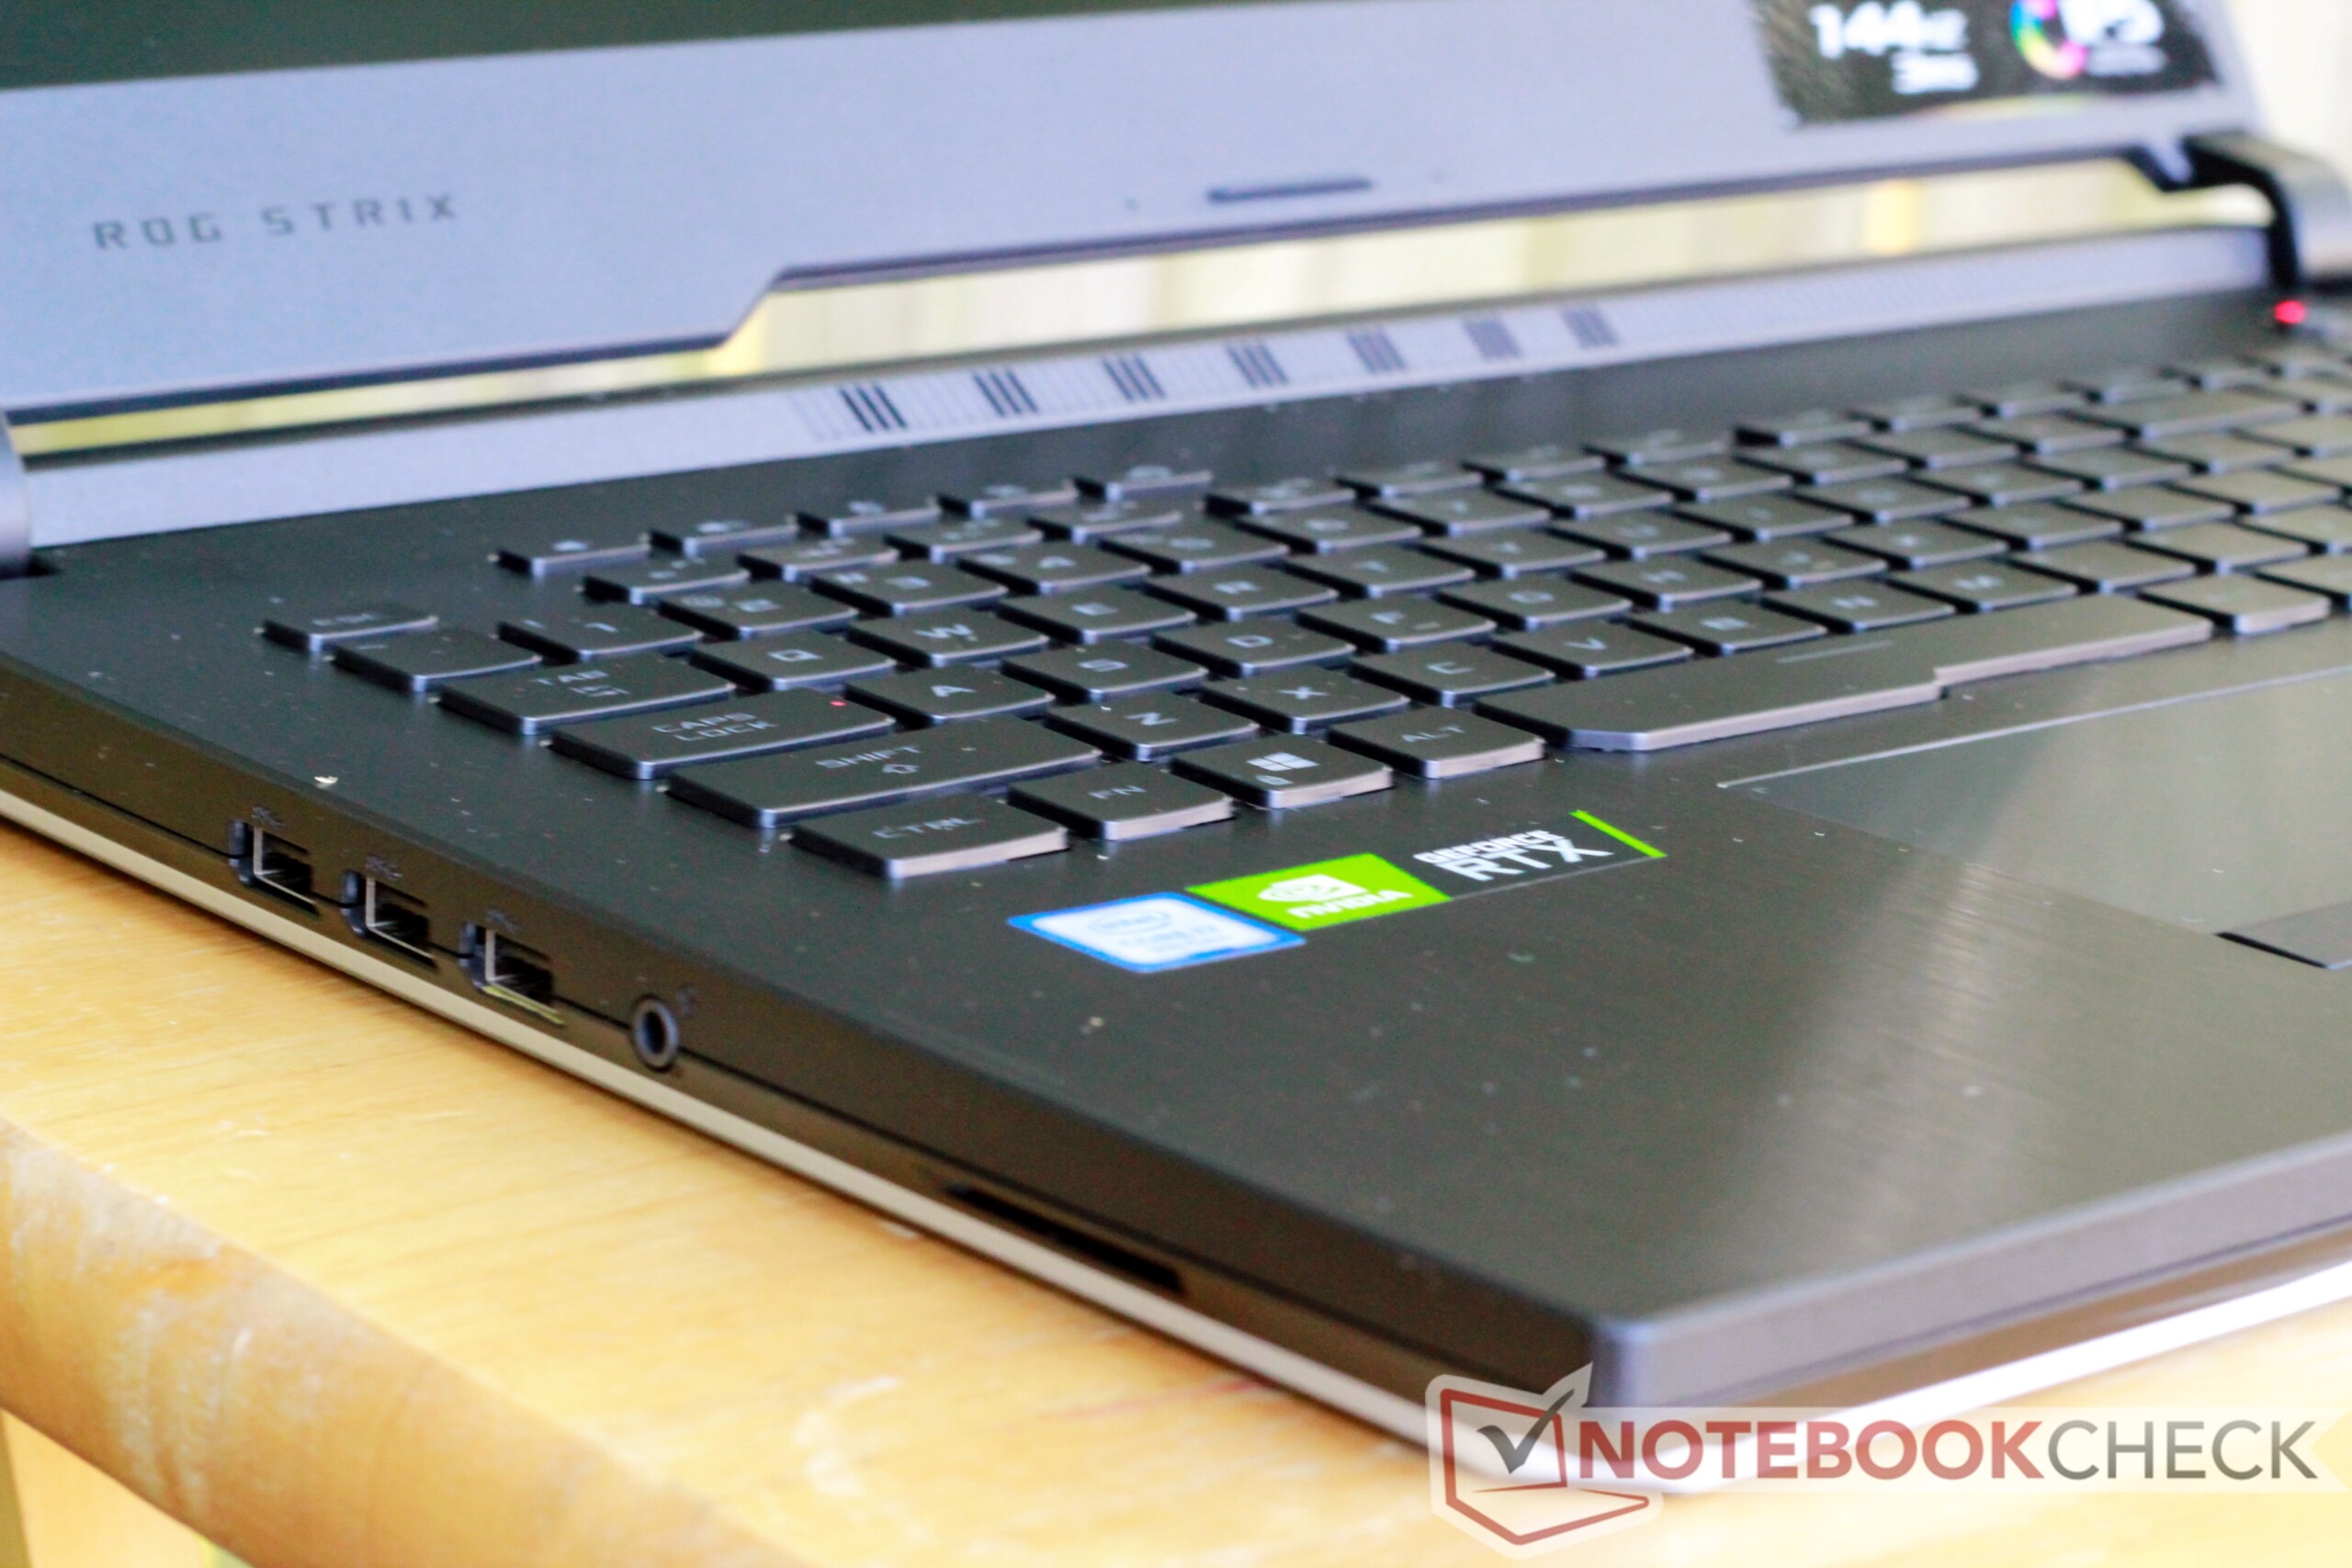
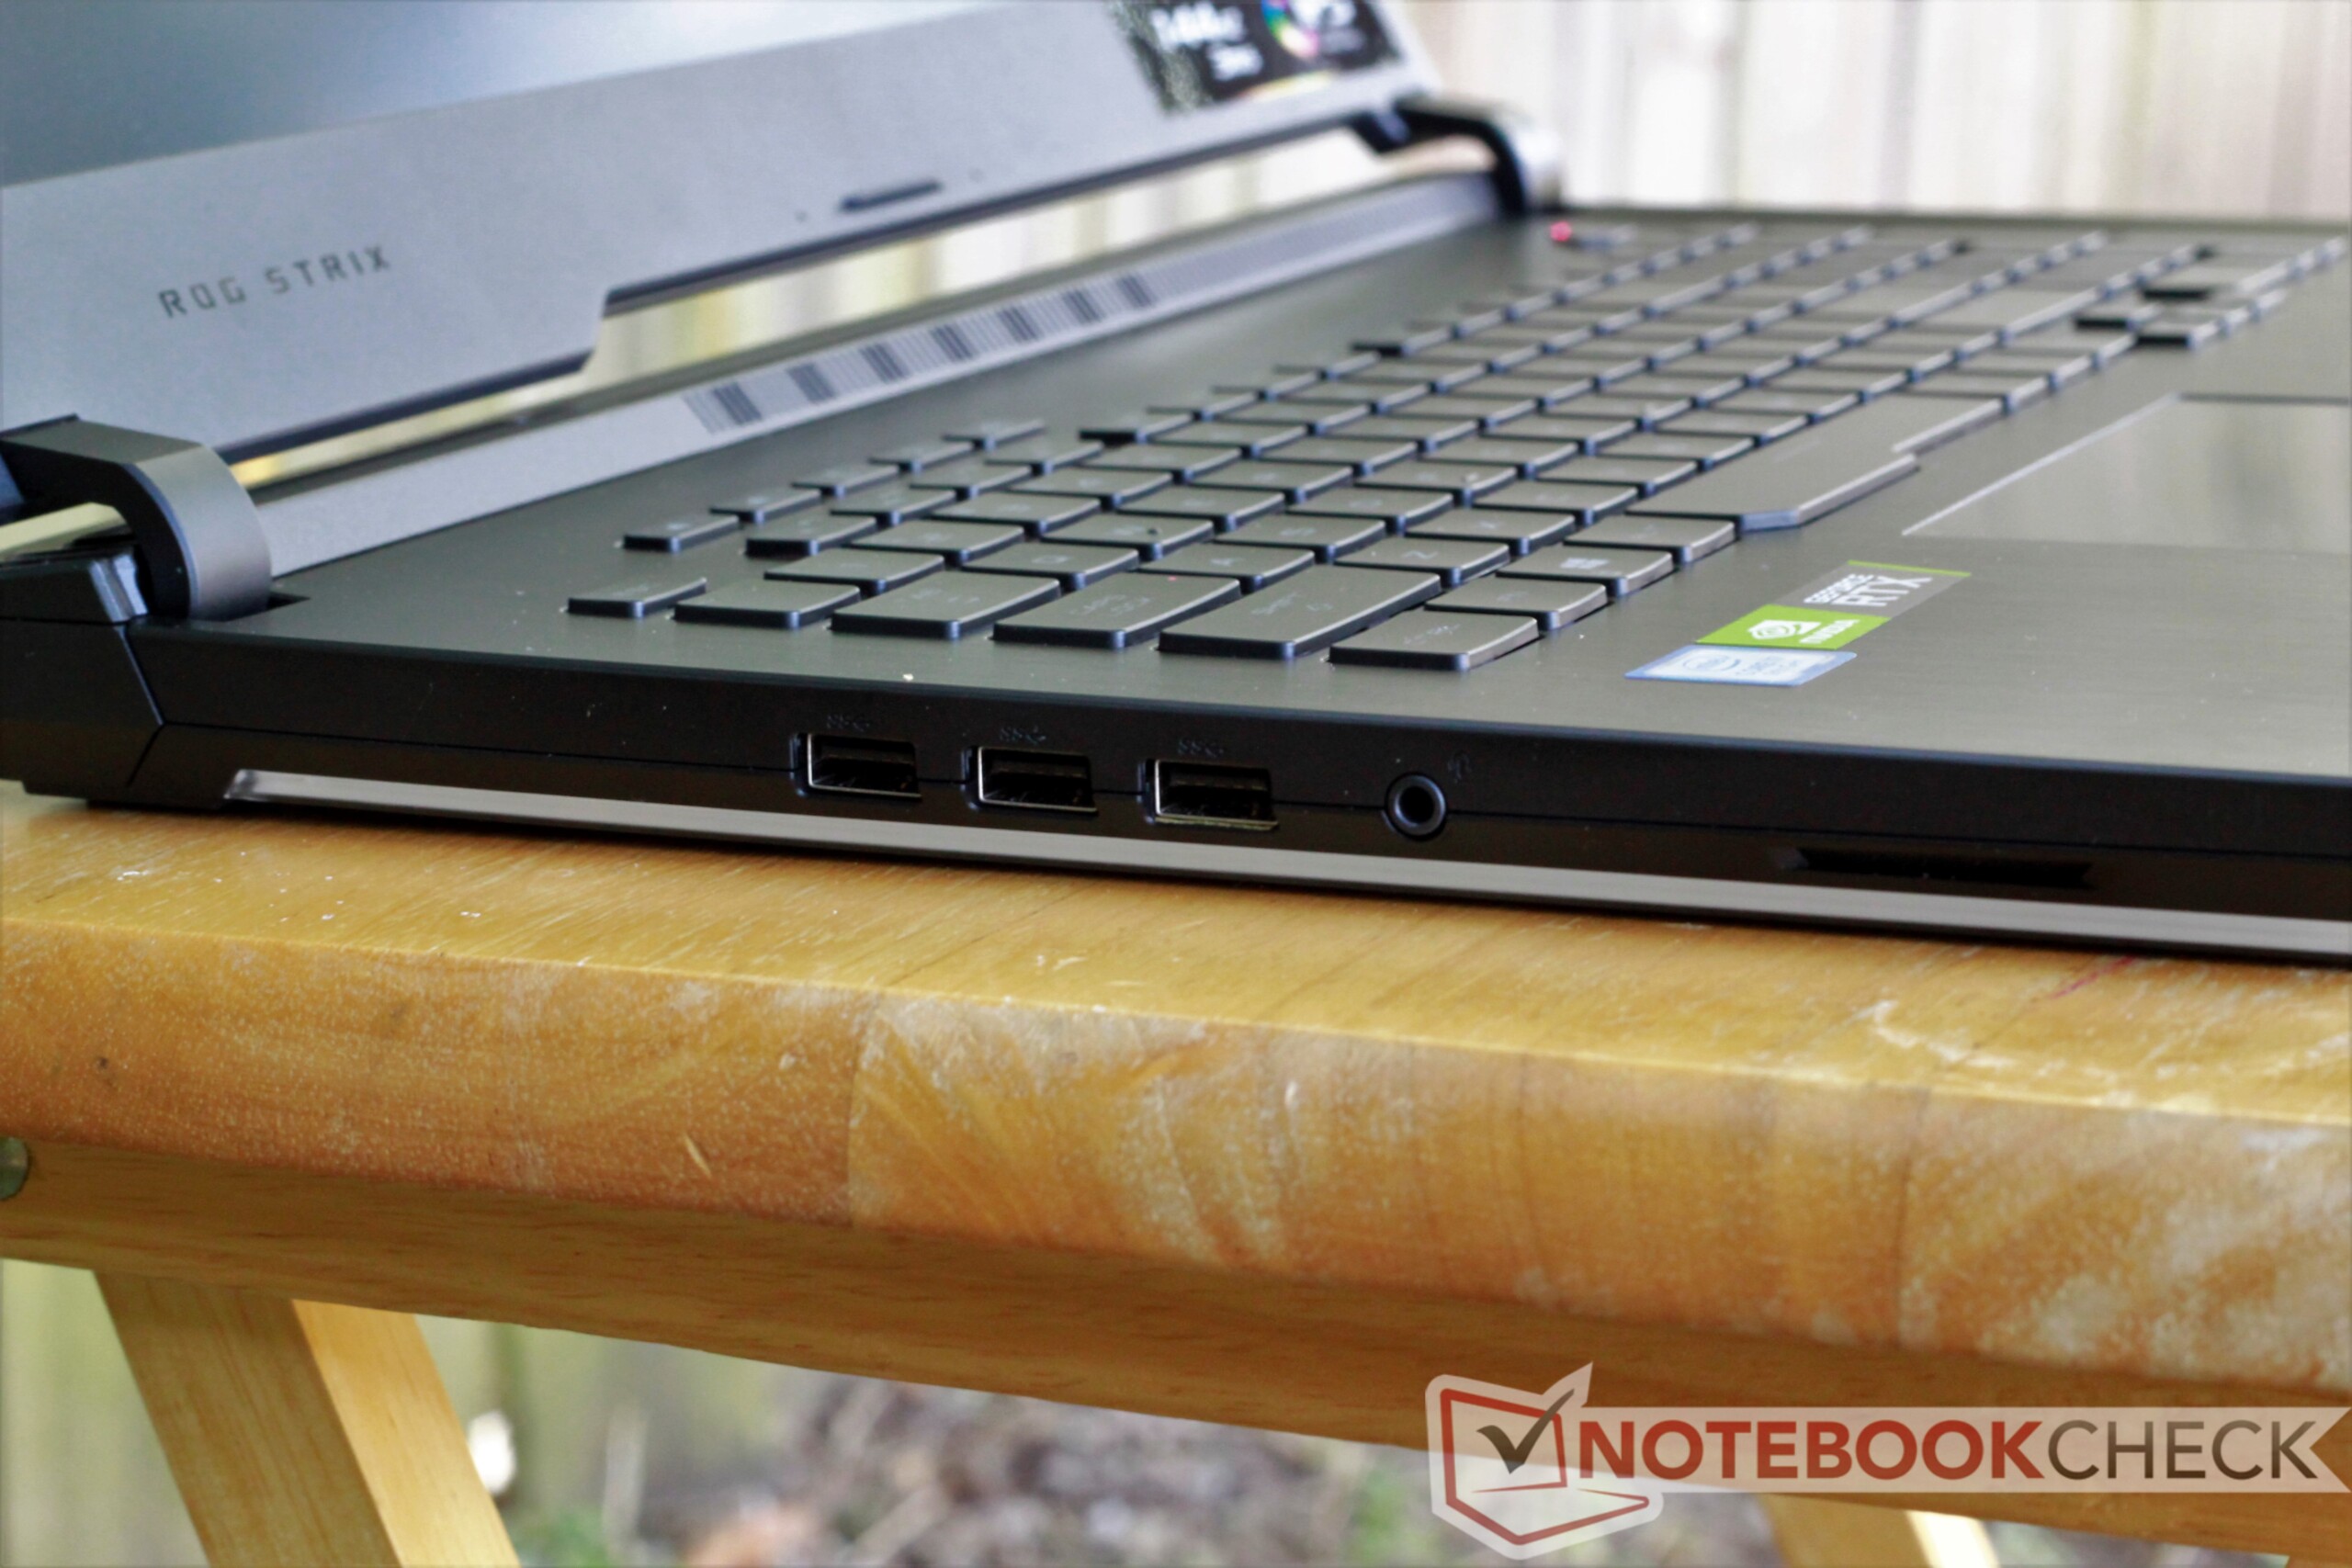
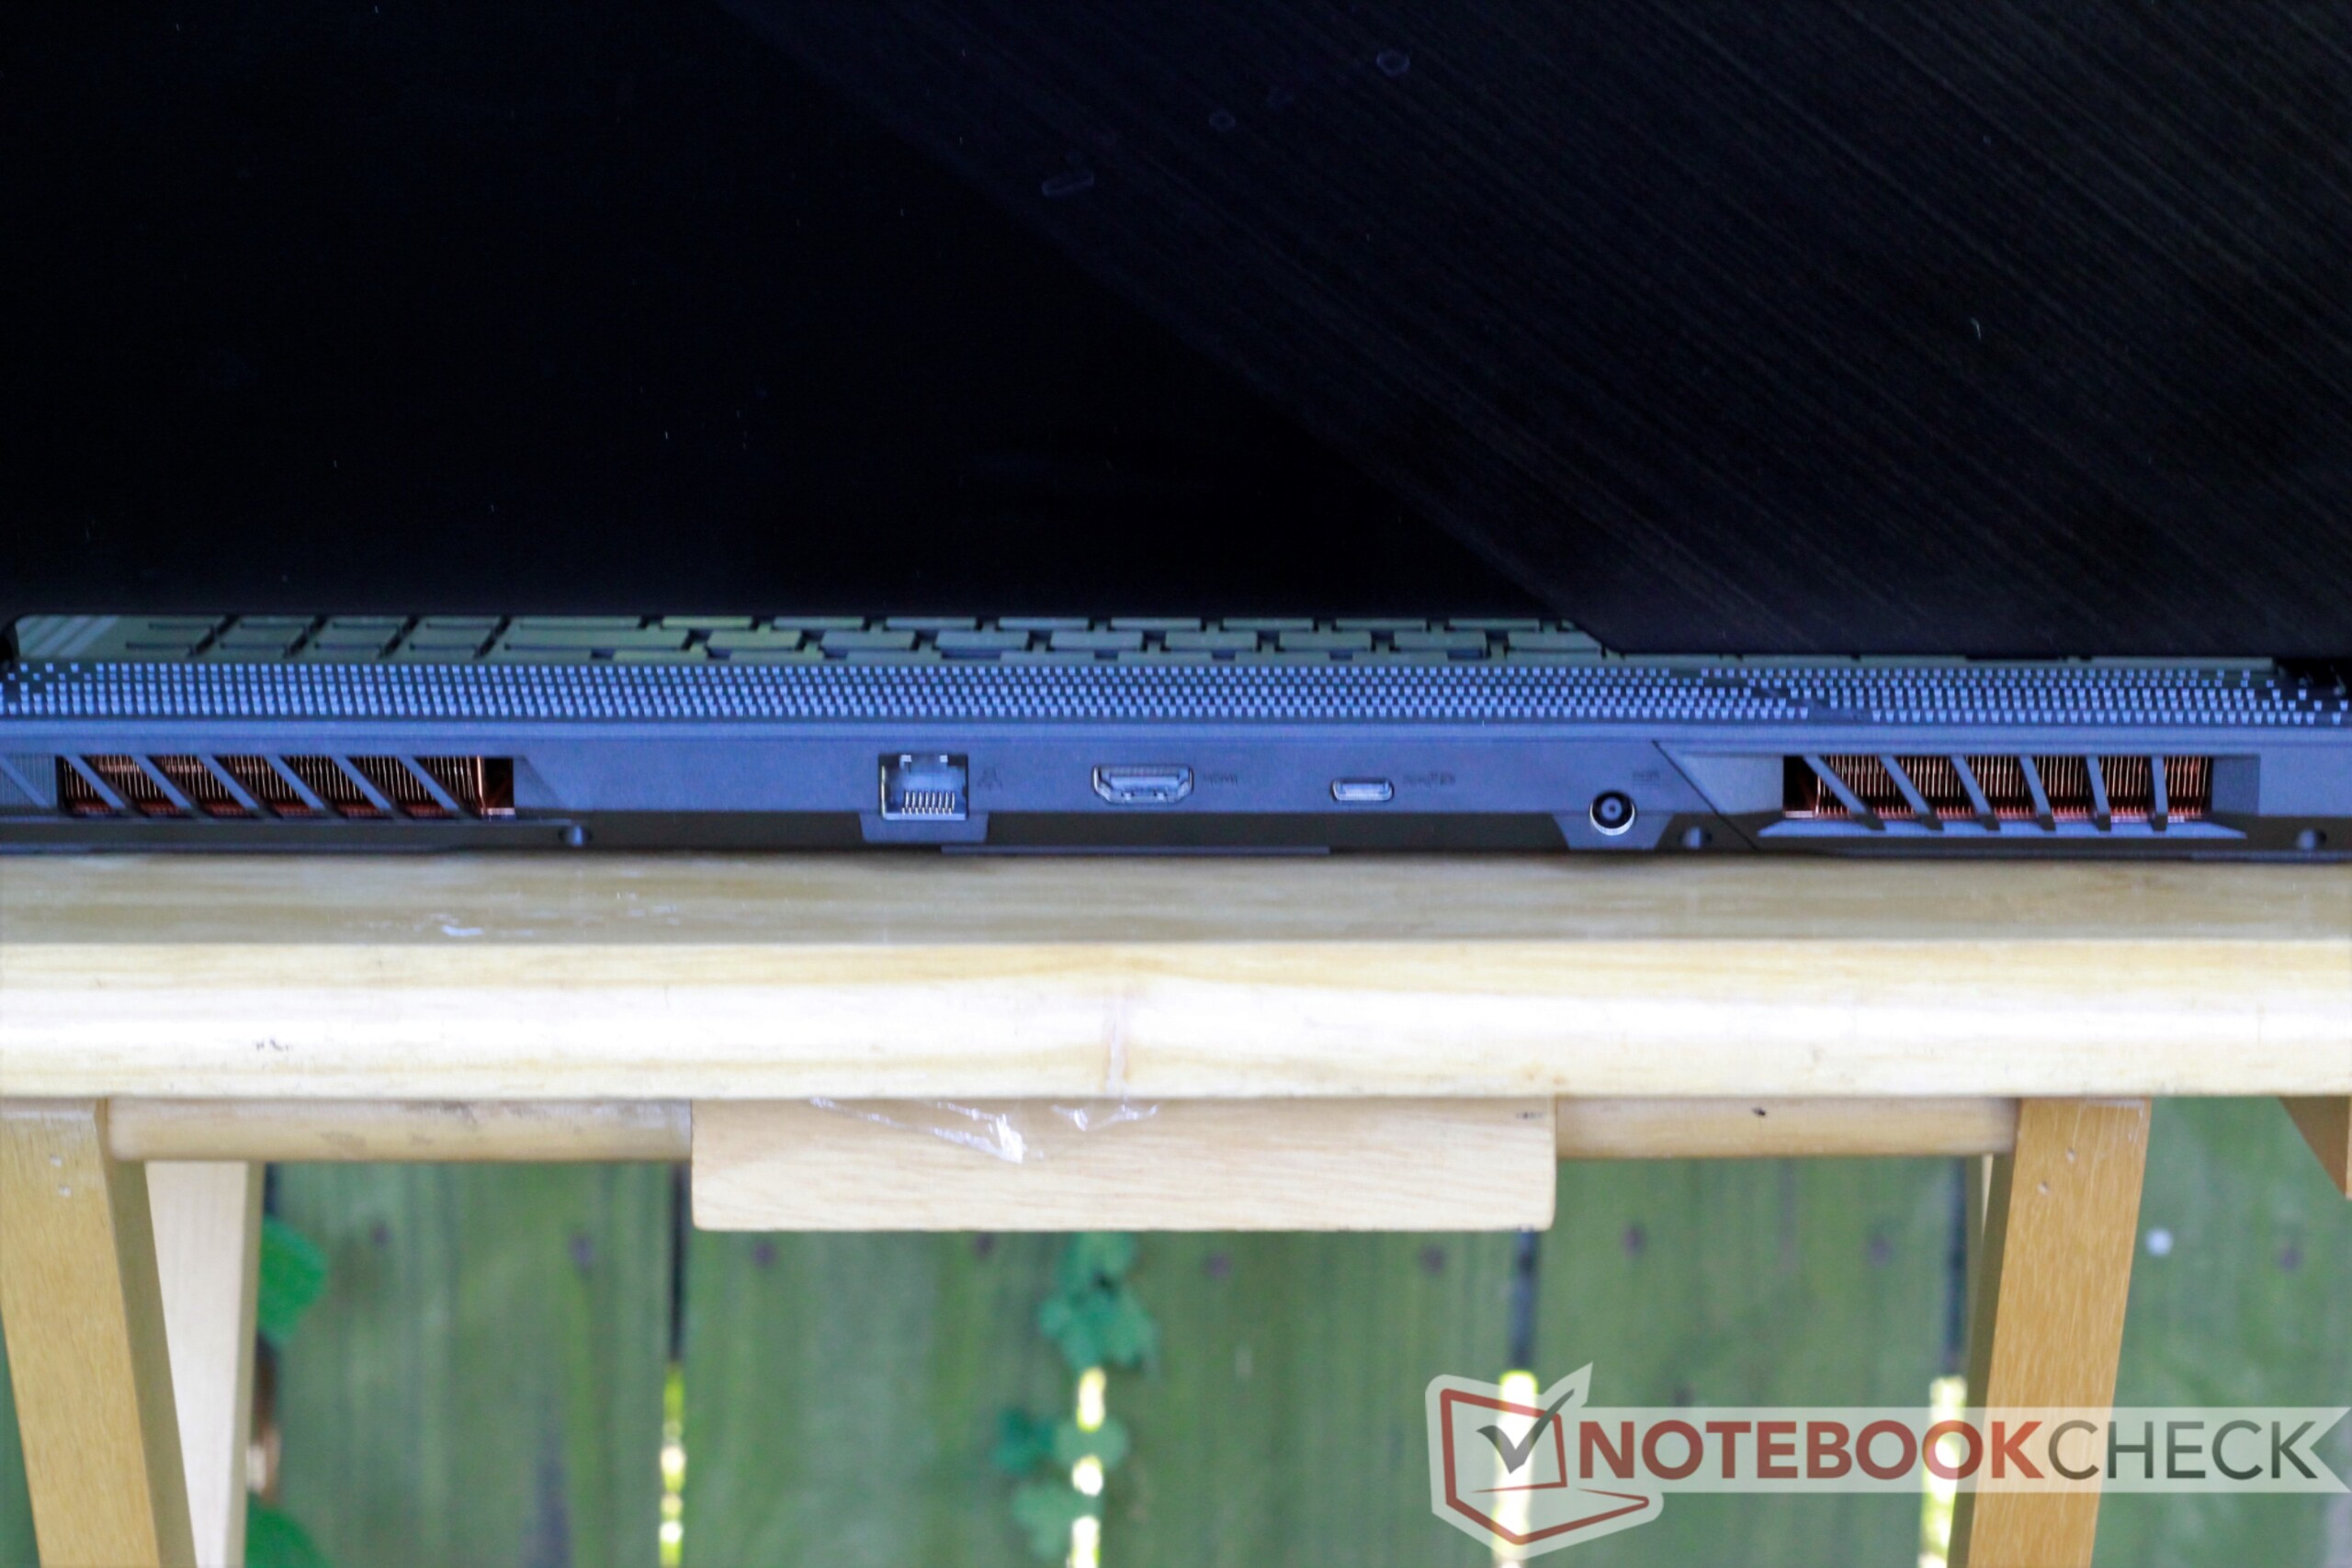
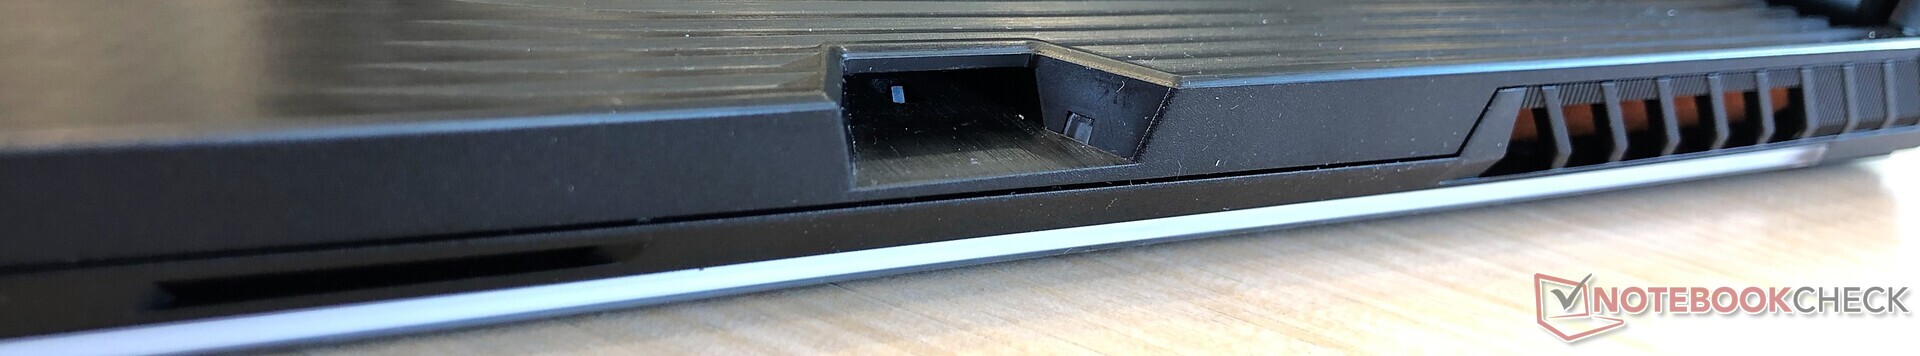
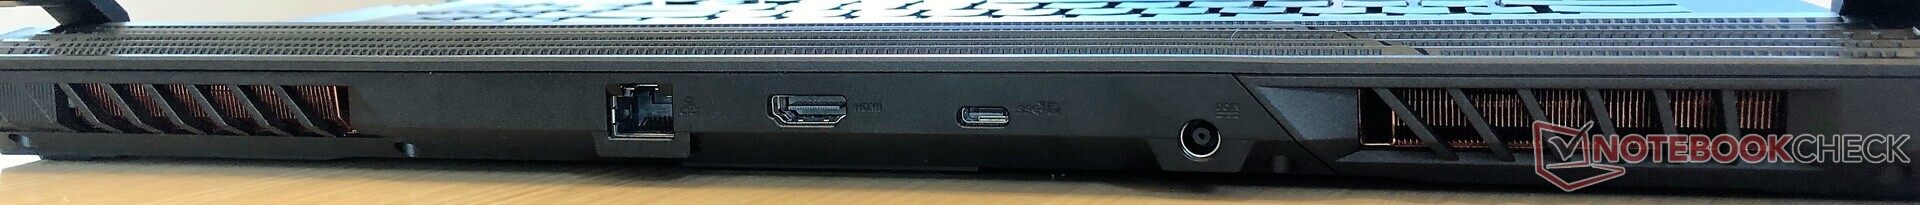
As with most gaming laptops, port selection is good. However, we are critical of the layout. The G731GW's three USB 3.1 (Gen 1) Type-A ports are all situated on the left side of the case. This is an odd choice considering a significant portion of gamers prefer to use external mice when gaming. Users that wish to hook up a mouse will need to route the cable around the machine, which can be annoying. Rubbing salt in this wound is the scant right edge of the chassis, occupied only by a single vent and Asus' proprietary Keystone port. There is plenty of room for an additional USB port. We would also like to see an additional dedicated port for connecting another display, although the USB 3.1 (Gen 2) Type-C port does support DisplayPort. The lack of an SD Card slot is another confusing omission.
The Keystone port is an interesting addition. The Asus Keystone is a tiny modified USB drive that gamers can use to save and transfer system profiles between machines. The Keystone also decrypts a "shadow drive," which is an encrypted portion of the machine's hard drive. This could be useful for protecting hidden files as only the users' Keystone can unlock that portion of the hard drive.

Communication
The WiFi card supports 2 x 2 802.11b/g/n/ac WiFi on both 2.4 and 5 GHz bands. Speeds are more than adequate for consumer routers. Receive speeds are a bit below average compared to other gaming laptops but should be satisfactory for most users. Those that need faster transfer rates can use the Gigabit Ethernet jack located on the rear of the machine. We measure consistent connections up to about 40 m from our consumer-grade AC router through 2 internal walls and 1 external brick wall on the 2.4 GHz band and about 25 m on the 5 GHz band.
Maintenance
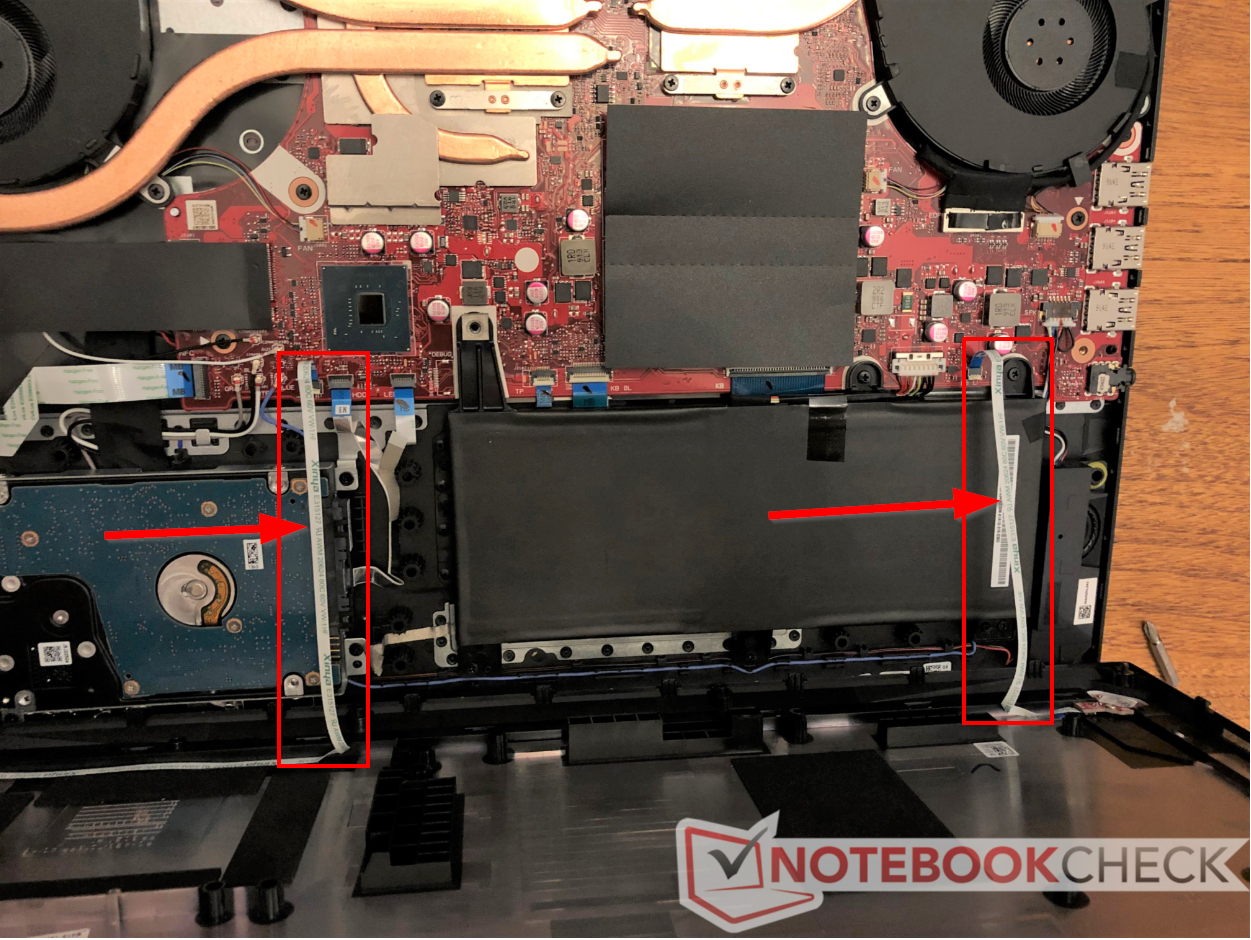
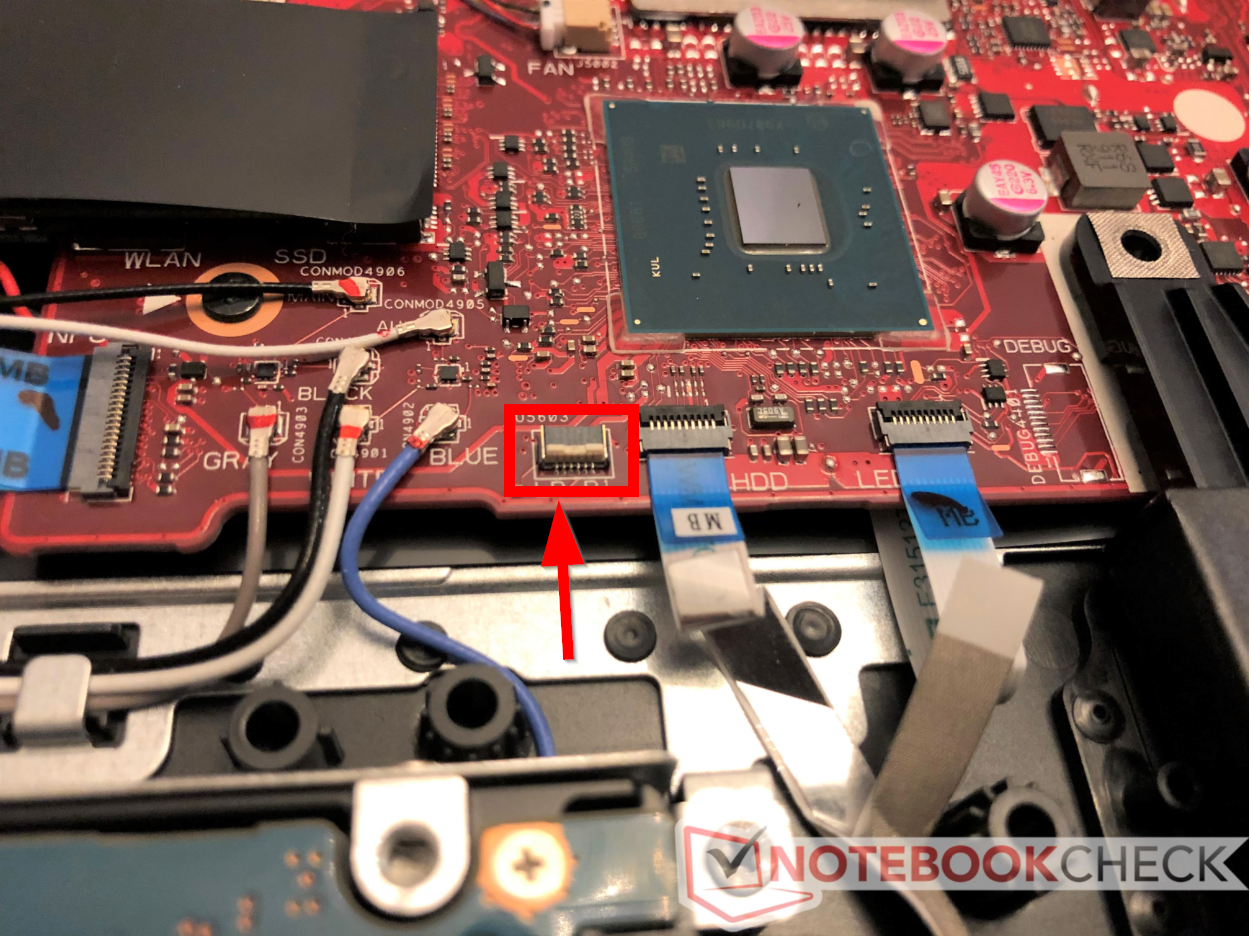
Like the GL731GU we recently reviewed, maintenance is possible but has two major annoyances. The plastic bottom panel is held on with 11 Phillips Head screws and plastic clips that are easy to disengage. There are two different lengths of screws, so care should be taken to keep them organized. Once the bottom panel is free, there are two final obstacles. Ribbon cables that control the lighting for the bottom RGB strips are adhered to the inside of the bottom panel and must be removed from their ZIF connectors. Once these are taken out, the internals are accessible.
Users have access to the RAM, both storage drives (one M.2 NVMe, one 2.5-inch SATA III, the fans, and the battery. The wireless card is located on the other side of the motherboard, making that swap a bit more difficult. Reassembly requires that the RGB ribbon cables be reinserted into their connectors, which can be difficult.
We will also note that there is indeed extra room along the right edge of the case for an additional USB port or two.
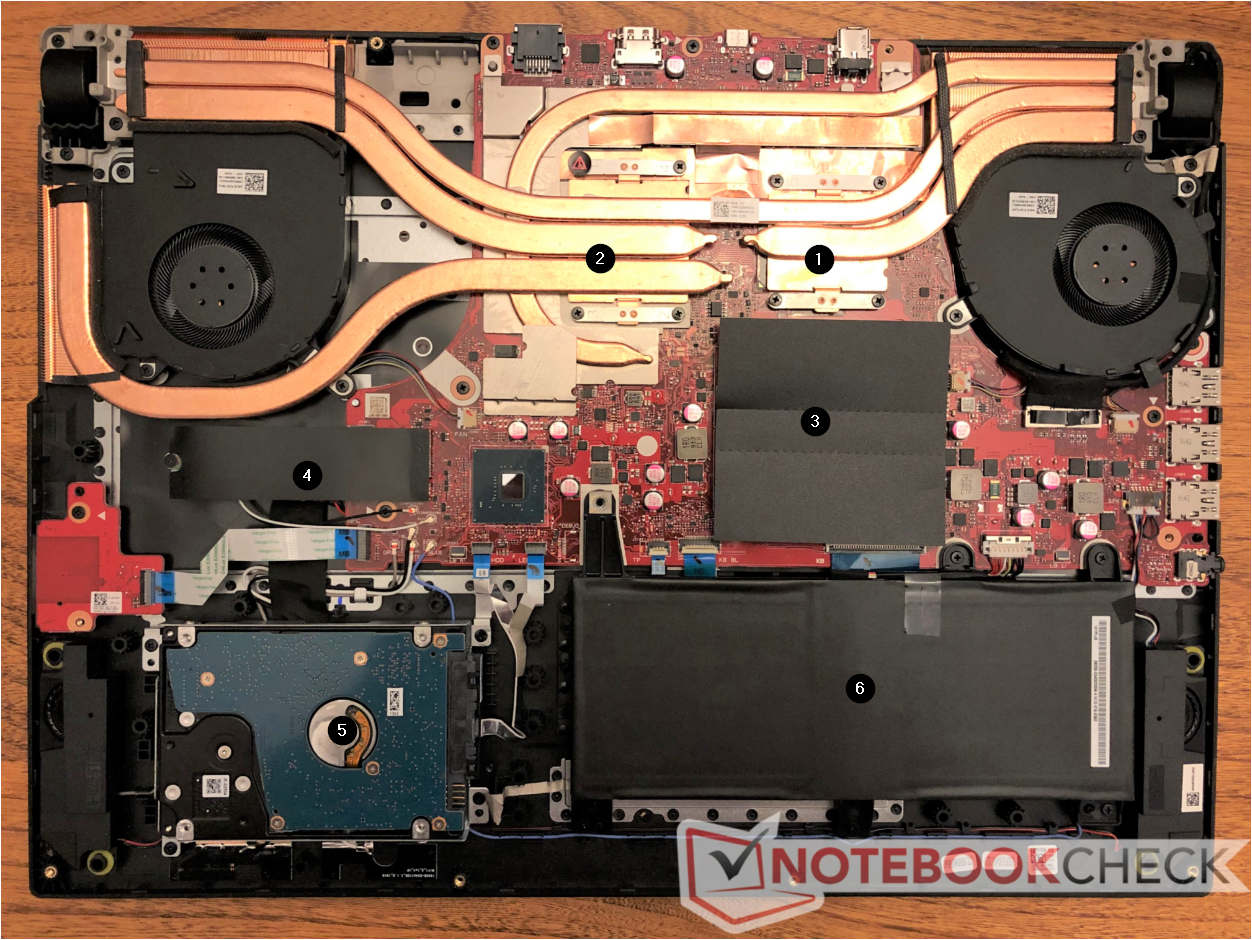
- Intel Core i7-9750H
- Nvidia GeForce RTX 2070
- DDR4 RAM (two DIMMS)
- M.2 NVMe drive
- 2.5-inch SATA III drive
- Battery
Warranty & Accessories
Asus offers a standard 12-month warranty. There were no accessories included in the box.
Input Devices
Keyboard
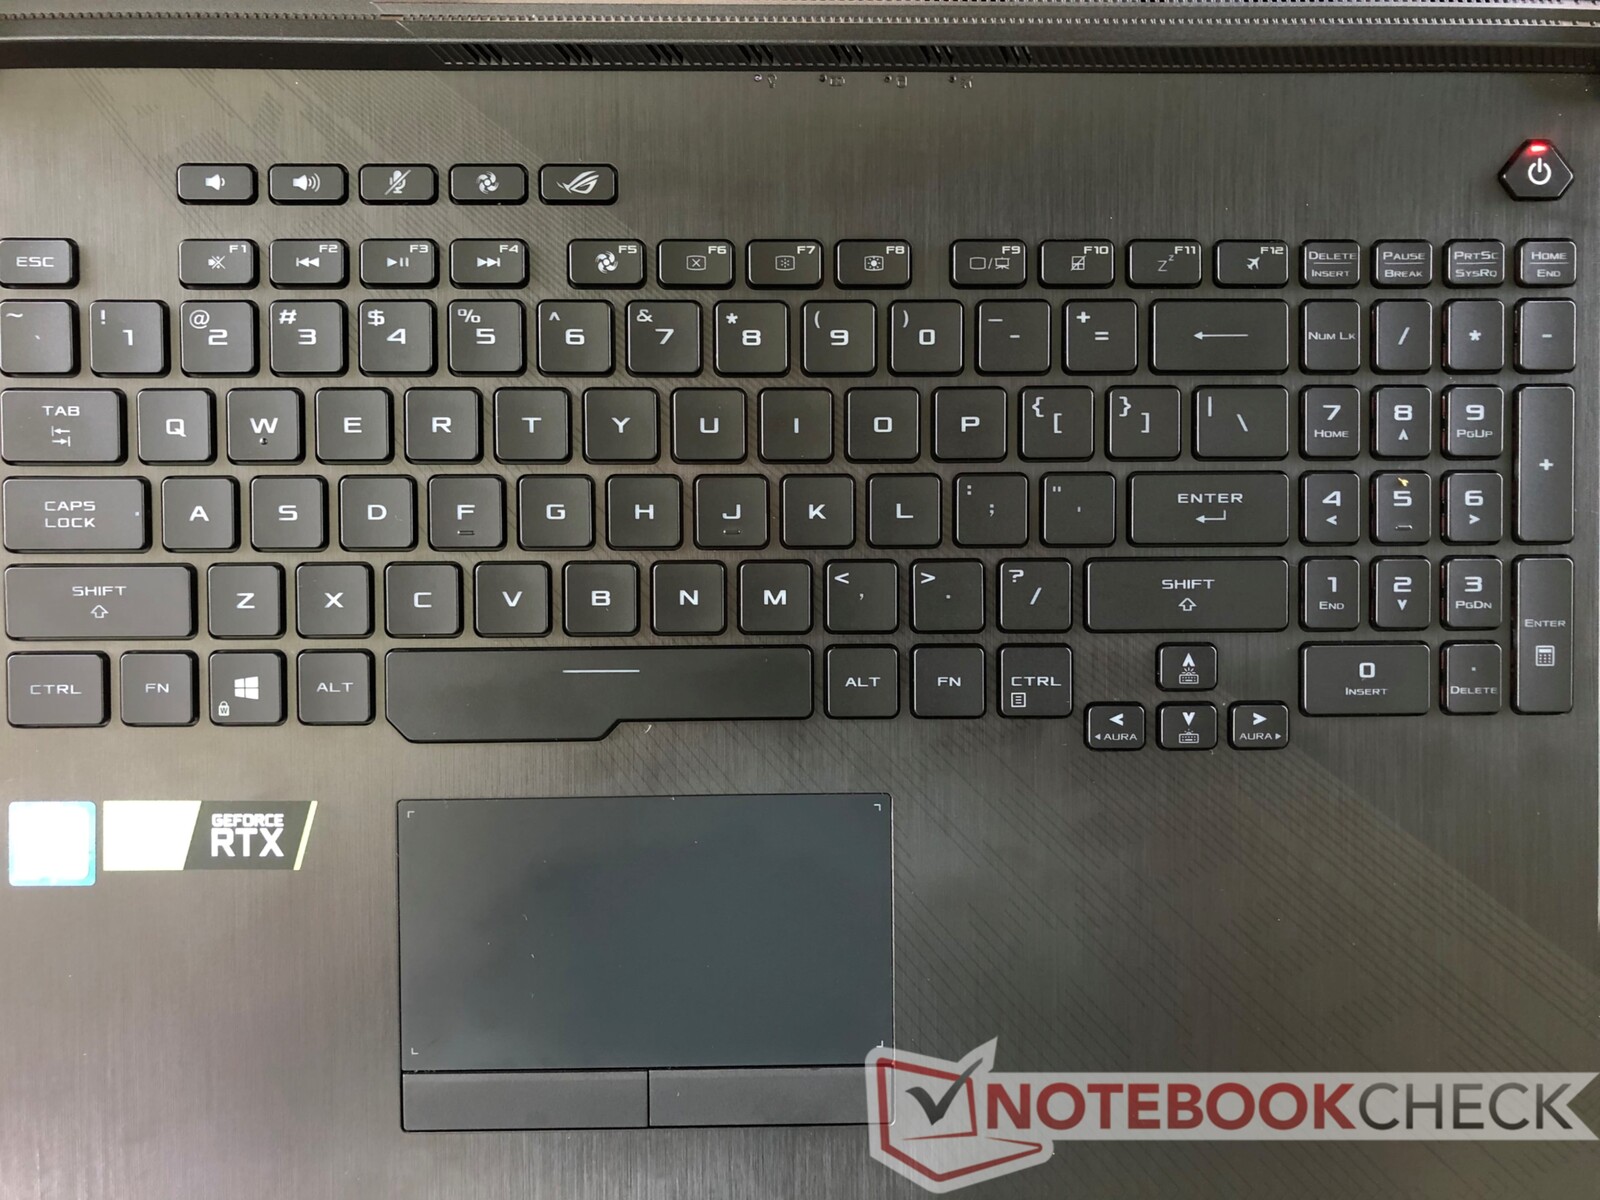
The keyboard is typical for an ROG laptop, which is good news. Higher-end Asus laptops commonly have good keyboards (mostly because of their generous travel) and the G731GW is no exception. Feedback is crisp and feels more responsive than the pillowy SteelSeries keyboards found in MSI's gaming laptops. In our opinion, the G731GW's keyboard offers excellent response and feedback and is well-suited to gaming and typing sessions. Key clatter is fairly quiet and shouldn't be distracting.
One of the big draws of the keyboard is its per-key RGB lighting. Each key can be individually lit to one of over 16 million colors. Asus offers a few clever preset modes in their Aura software package. The Aura Creator also allows users to fine-tune the RGB lighting all around the machine, but we find the software a bit cumbersome. The RGB software solutions in the Razer Blade series are more user-friendly.
Similar to the GL731GU, we find complaint with the cramped number pad and arrow keys. The number keys on the right side are noticeably smaller than the main keyboard, which is frustrating considering the amount of space available on the upper deck of the chassis. As such, data entry or gameplay using the numpad is awkward and not pleasant.
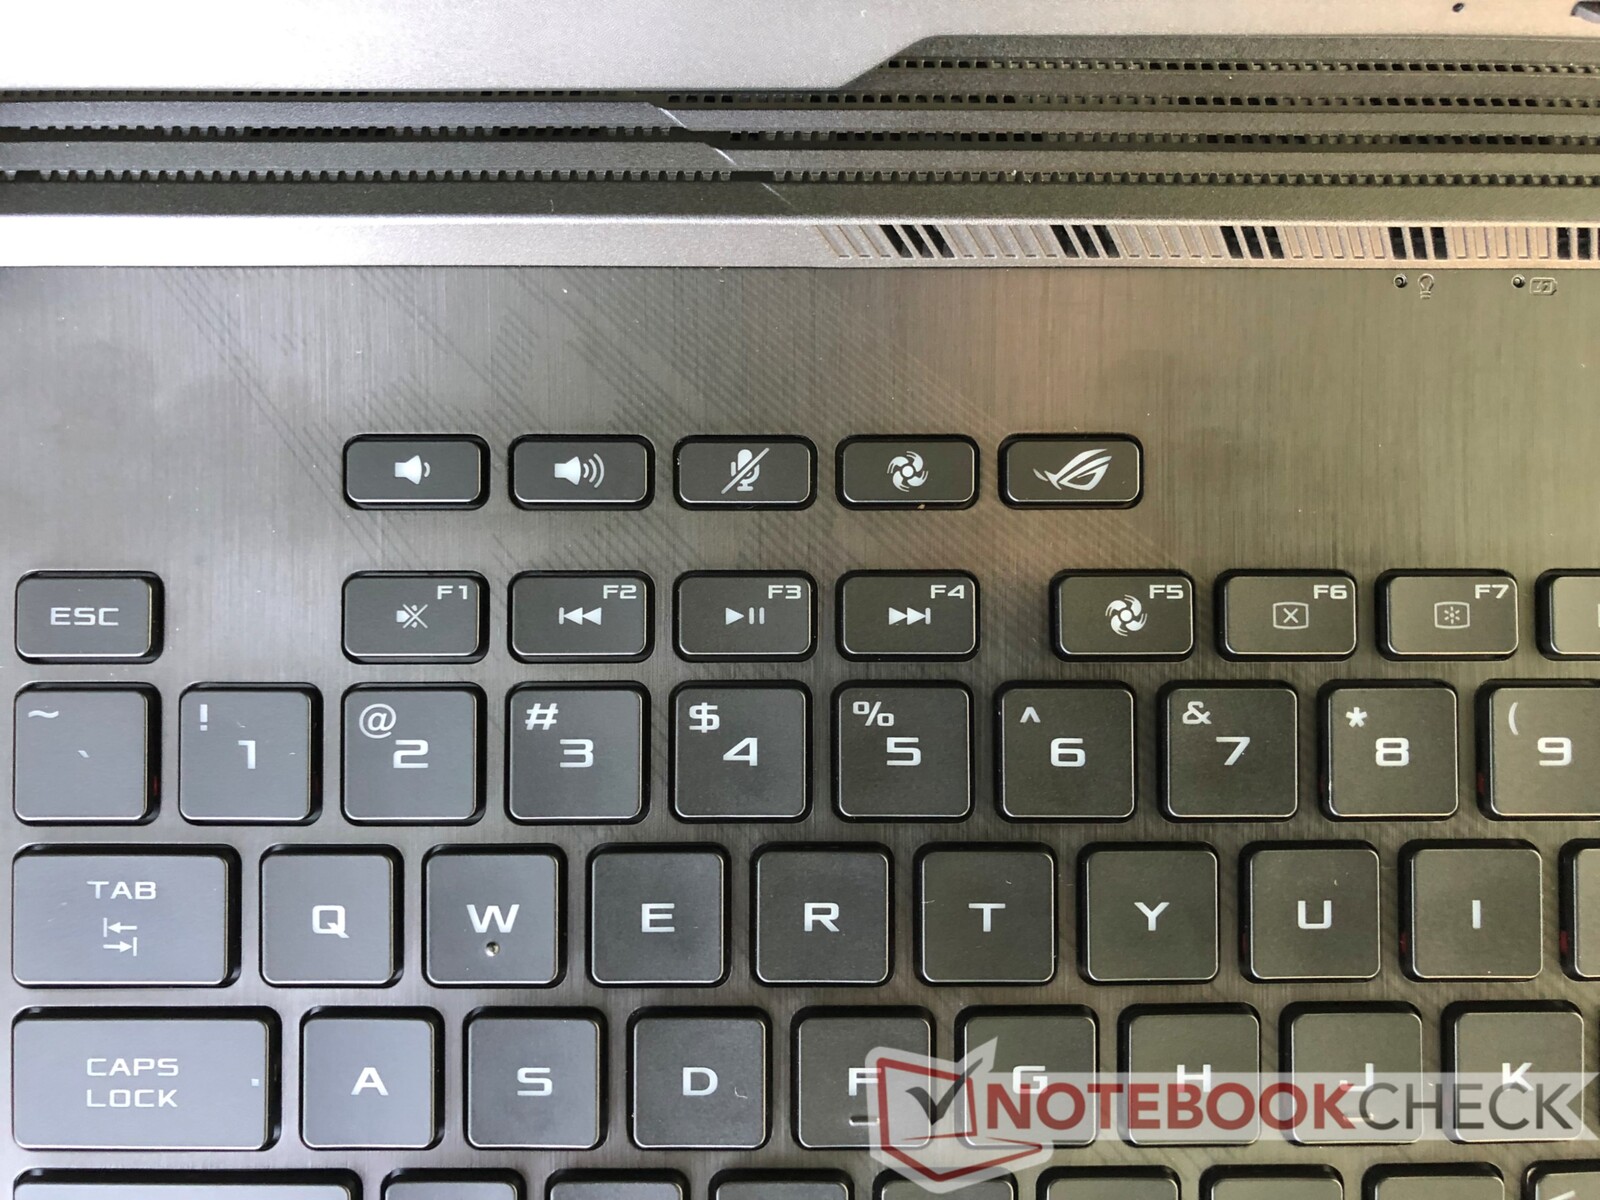
We do appreciate the dedicated keys for volume, mic muting, and fan profile switching located along the top. There is a redundant fan control key in the function row, but other basic function keys are readily accessible. We would like to see the inclusion of macro keys in future revisions; there is room along the top and sides of the keyboard.
Touchpad
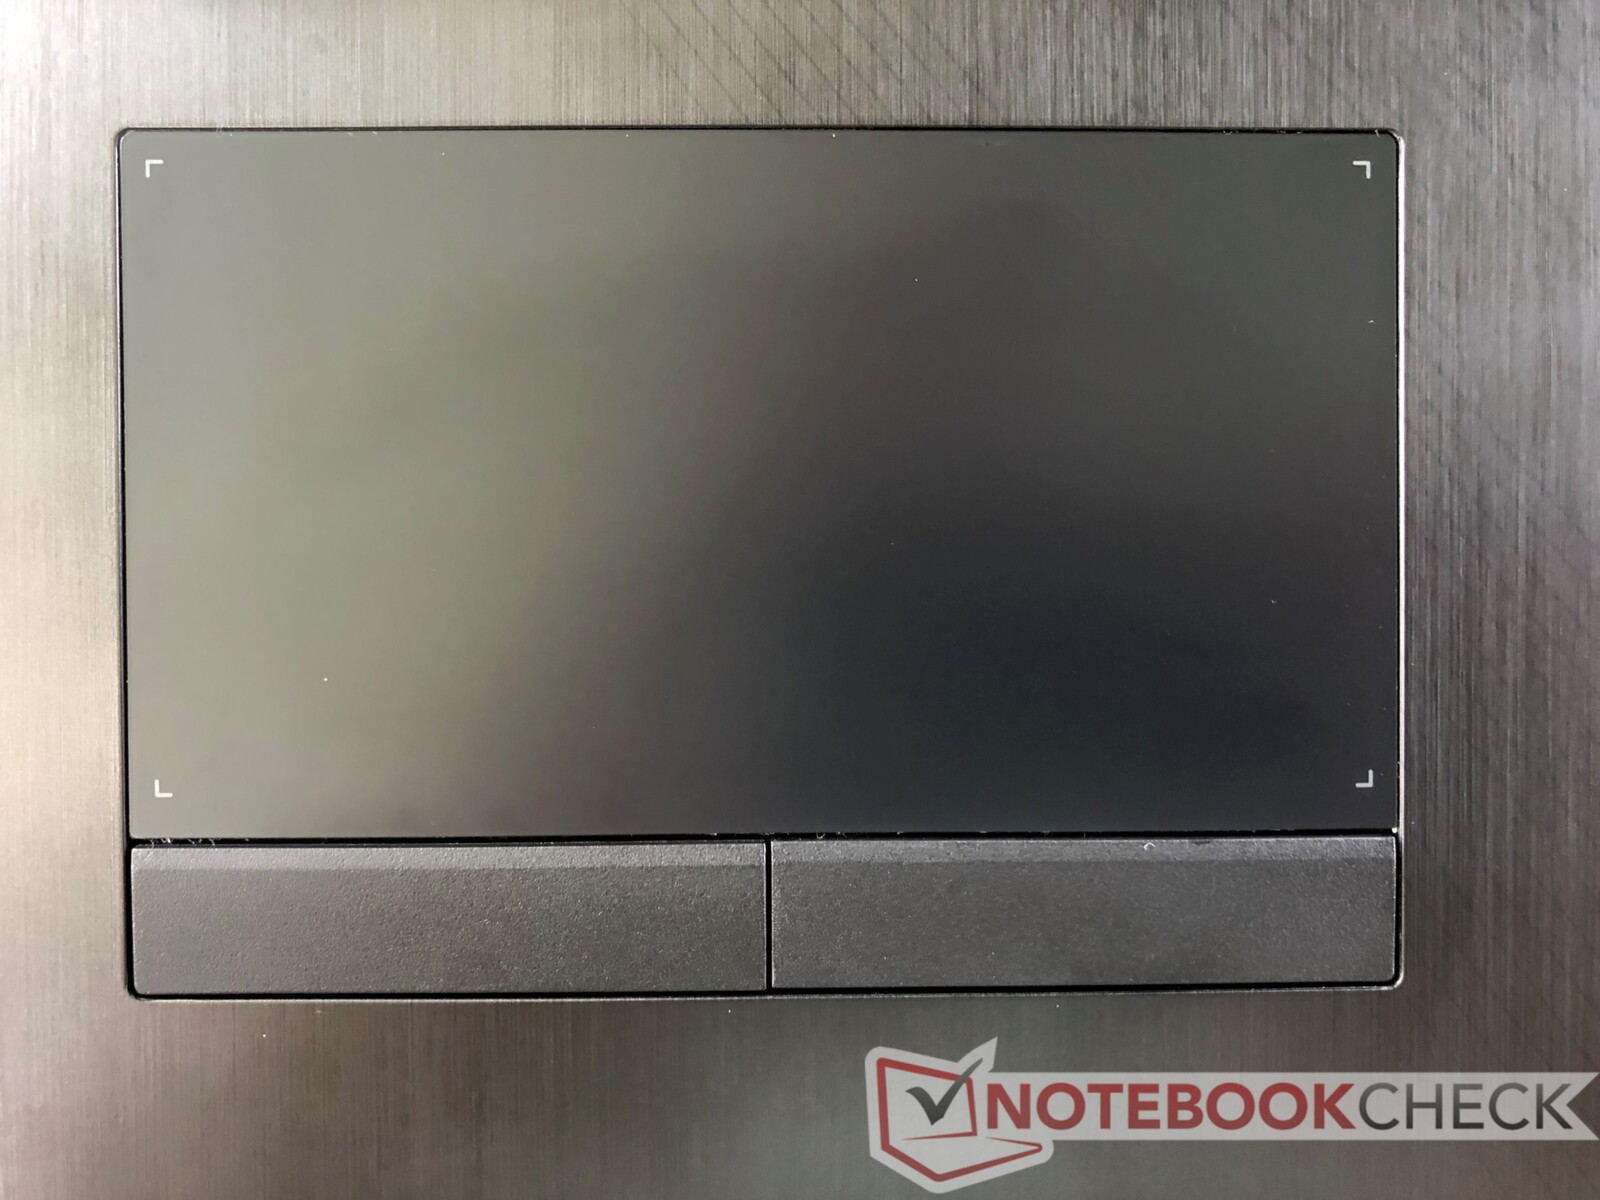
The touchpad is excellent. It offers an average amount of space (10.7 x 6 cm), but gliding is smooth and tracking is highly responsive. We notice a slight bit of cursor acceleration when tracking at fast speeds across the pad, which is something for trackpad gamers to be aware of. The dedicated buttons below the trackpad have generous travel with springy feedback. Clicks are virtually silent, which is a nice touch. Overall, the touchpad is well-suited to UI navigation and feels great to use.
Our primary complaint is that the touchpad is easily marred by skin oil and smudges, similar to the touchpad of the GL731GU. As an added stab, it is difficult to wipe away fingerprints.
Display
One of the main selling points of the G731GW is its 144 Hz display. The panel is lightning fast and has quicker response times than even other gaming laptops with 144 Hz panels. Navigating UIs is as smooth as butter, and 100+ fps gameplay melts across the screen. The Razer Blade Pro 17 has slightly faster response times, but the difference is not readily noticed.
There are a few shortcomings. The panel averages ~300 nits. However, the backlight distribution is a bit low (80%) for this price point. Users are unlikely to notice the 40 nit difference between the left and right sides, but it is worth noting. Like the GL731GU, there is a bit of grain due to the matte finish, but this is only noticeable in bright scenes. The contrast ratio is good (~1000:1). There is no detectable PWM.
| |||||||||||||||||||||||||
Brightness Distribution: 80 %
Center on Battery: 297.4 cd/m²
Contrast: 959:1 (Black: 0.31 cd/m²)
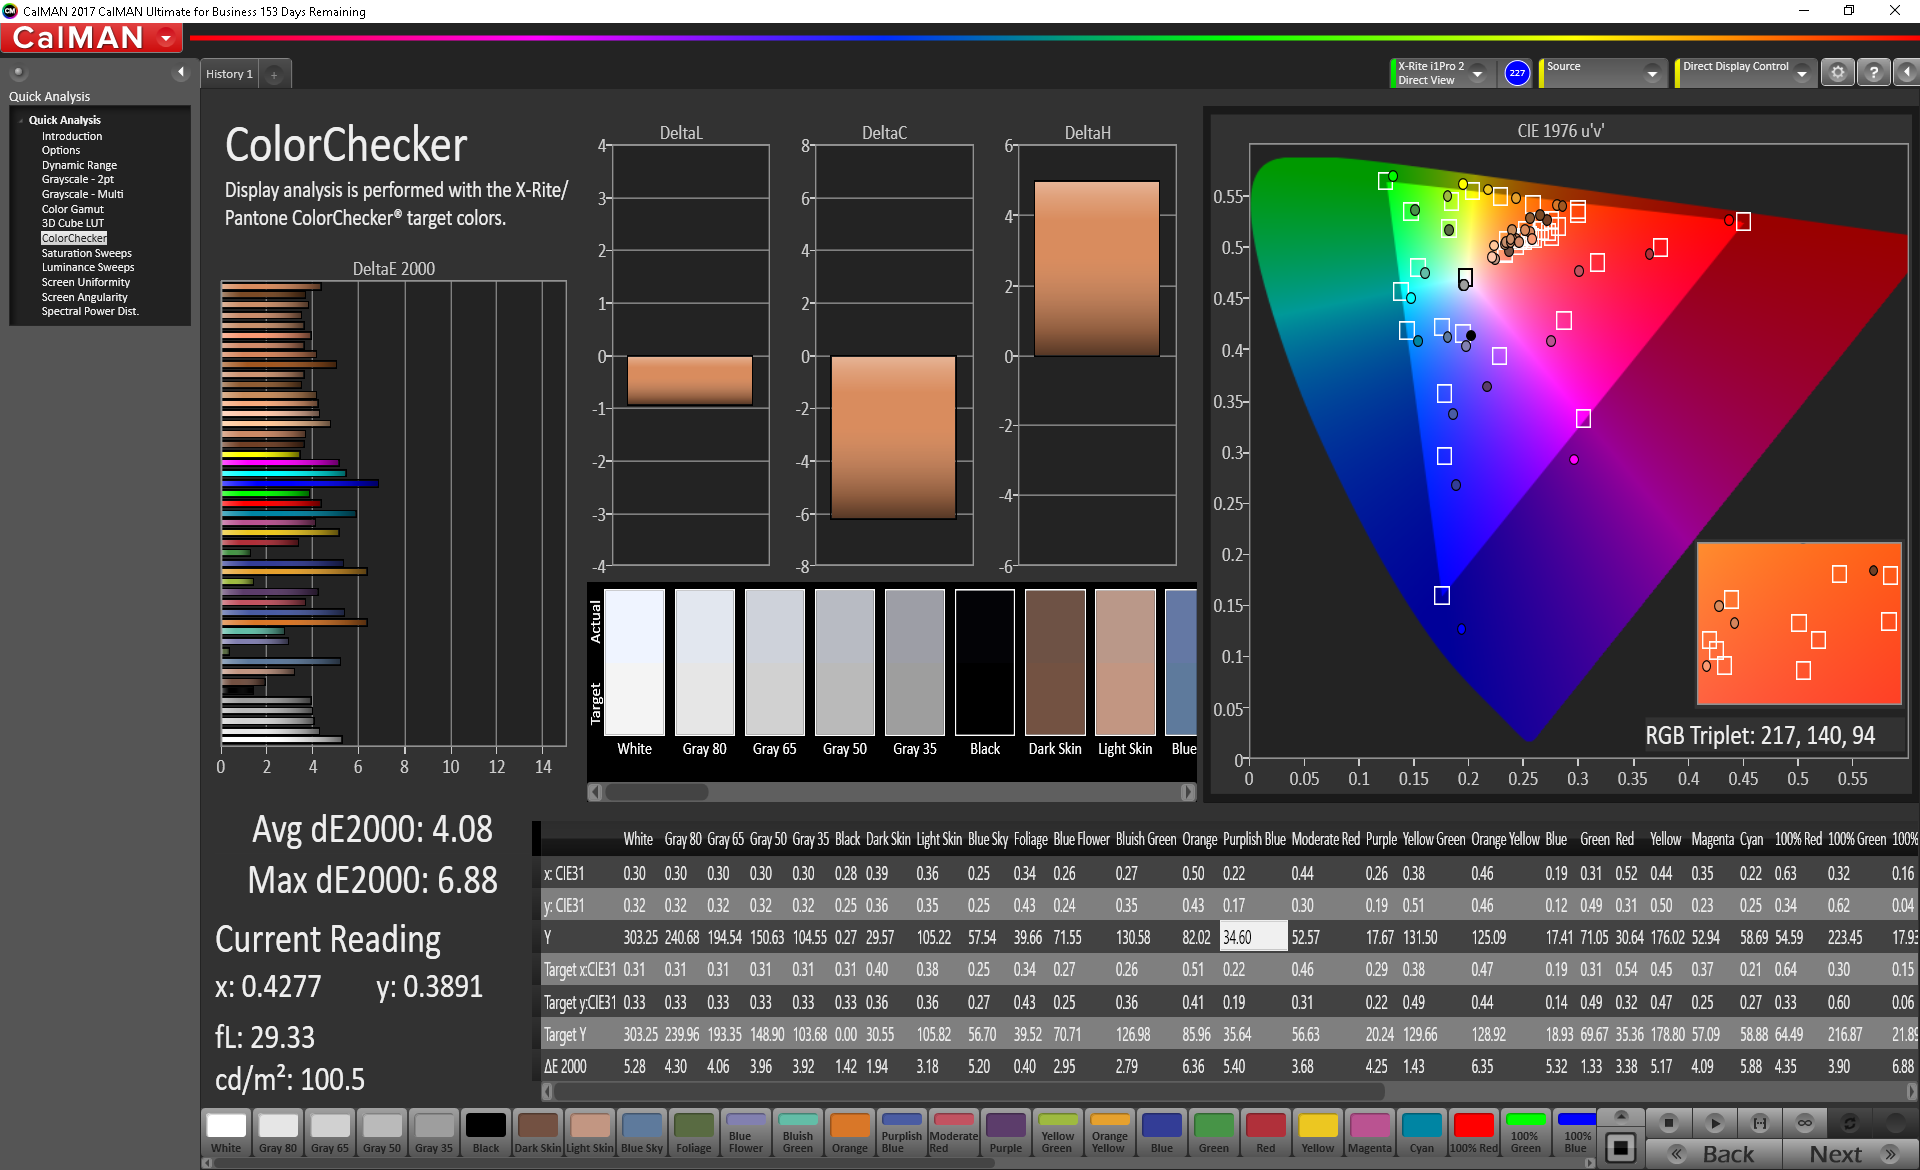
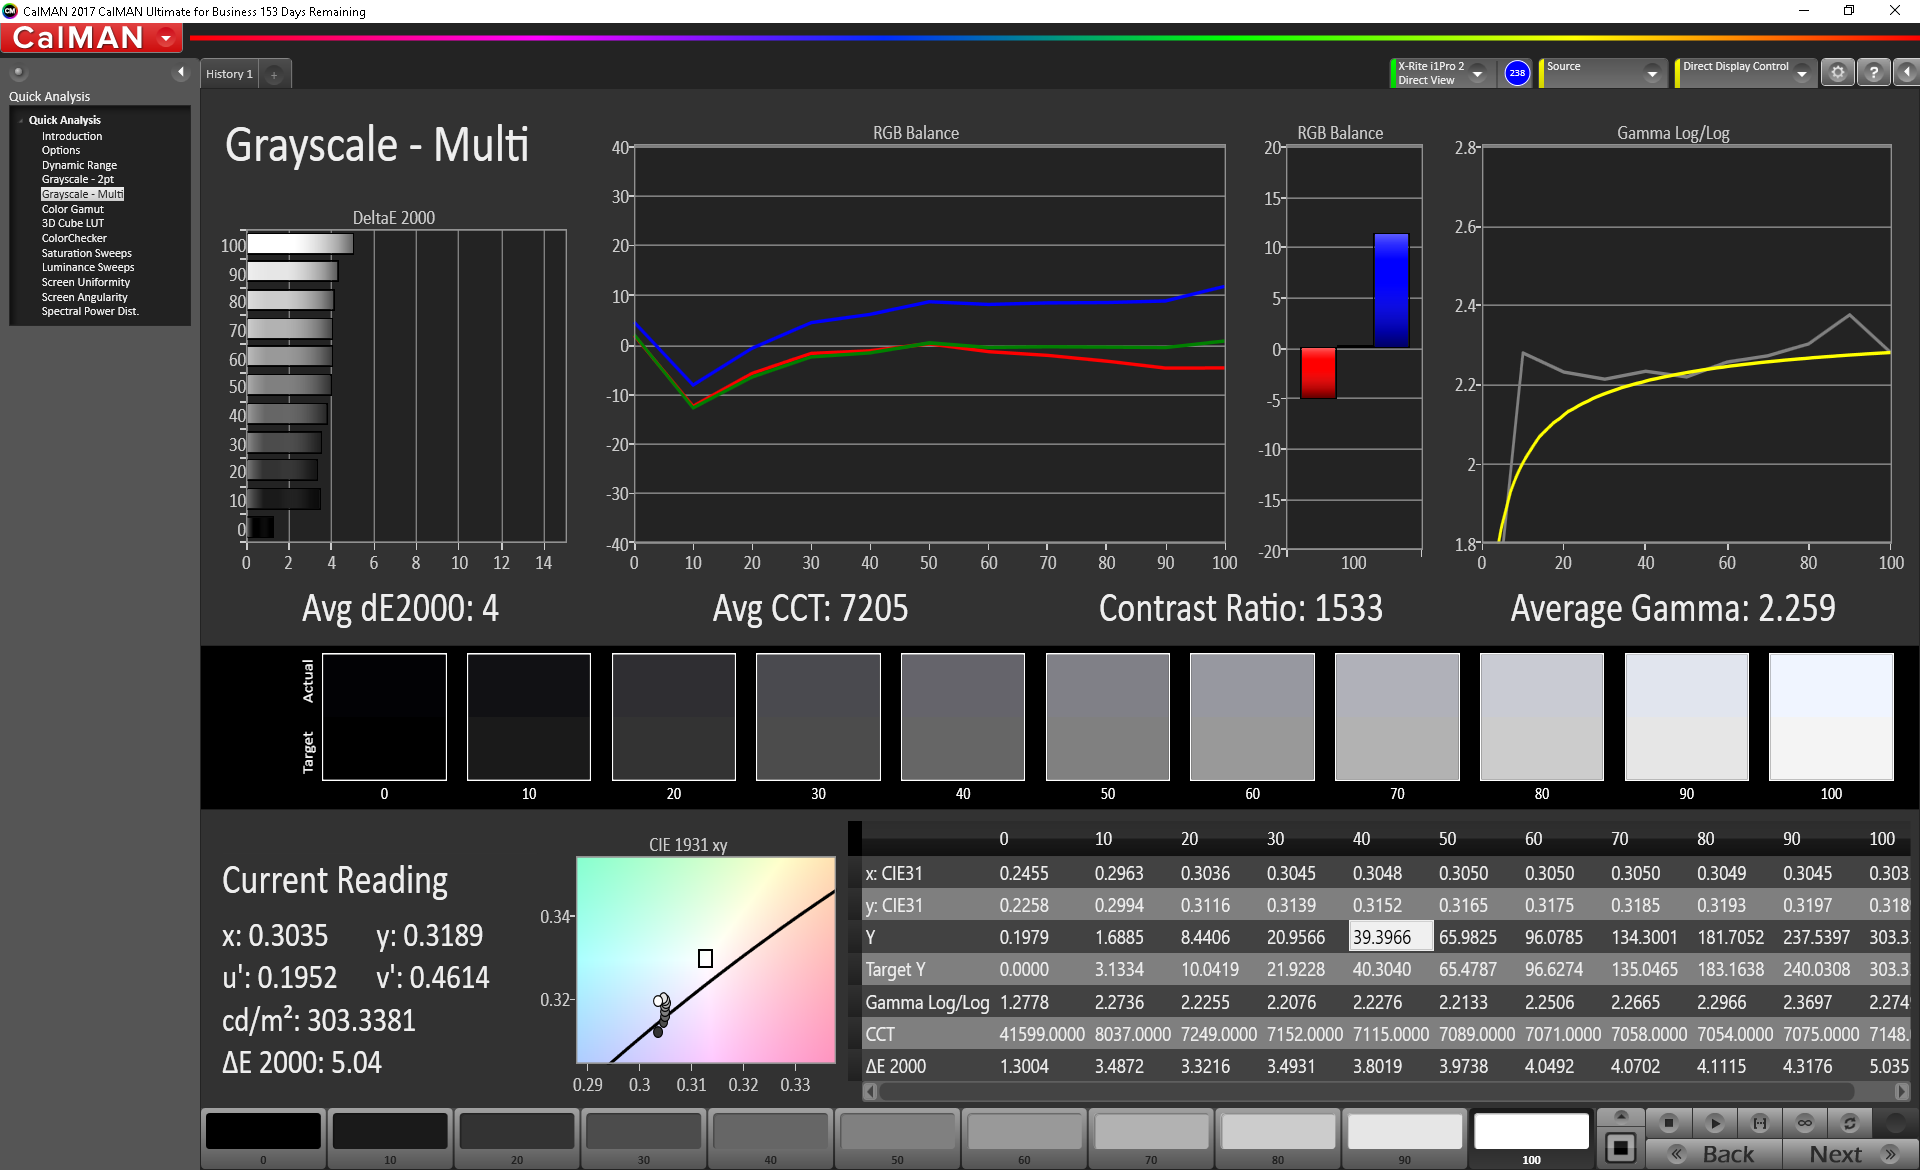
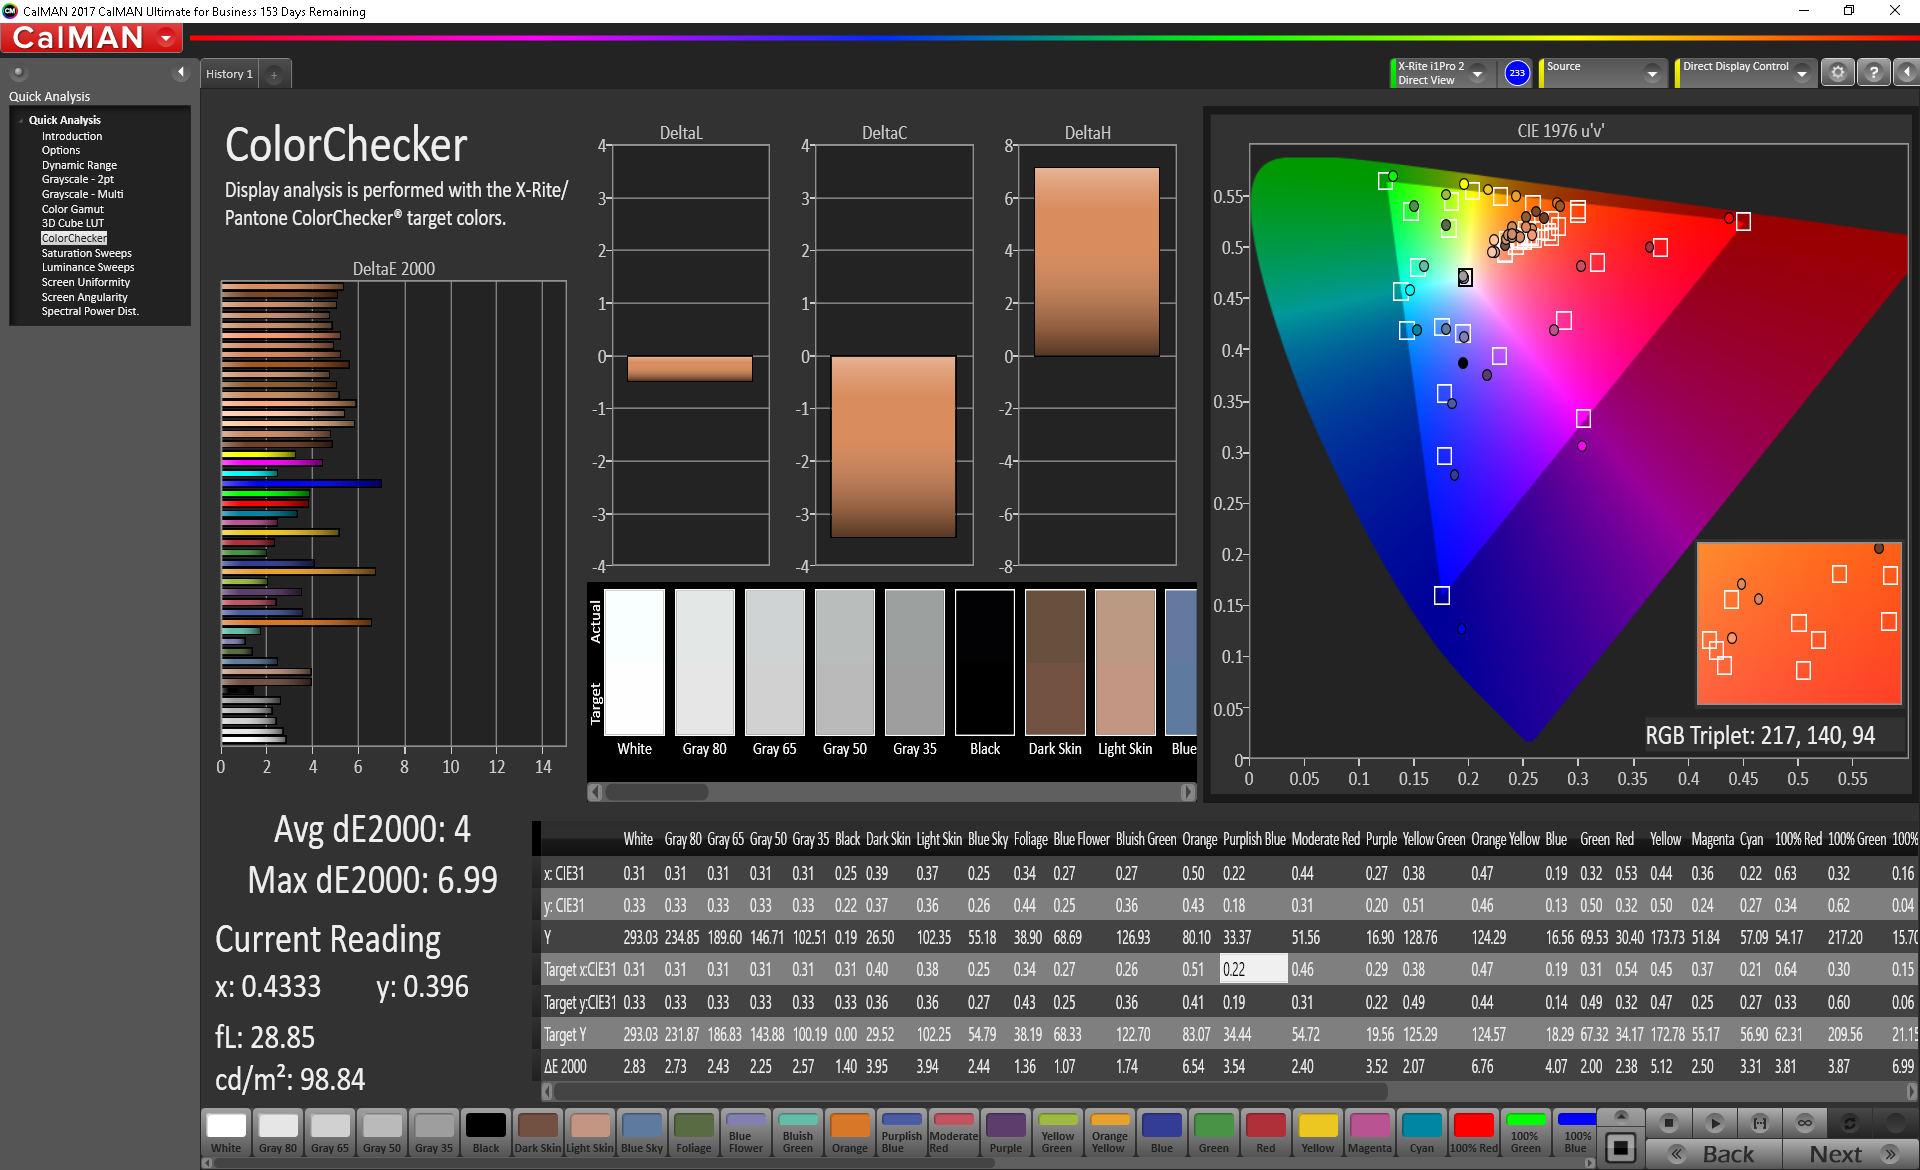
ΔE ColorChecker Calman: 4.08 | ∀{0.5-29.43 Ø4.73}
calibrated: 4
ΔE Greyscale Calman: 4 | ∀{0.09-98 Ø4.97}
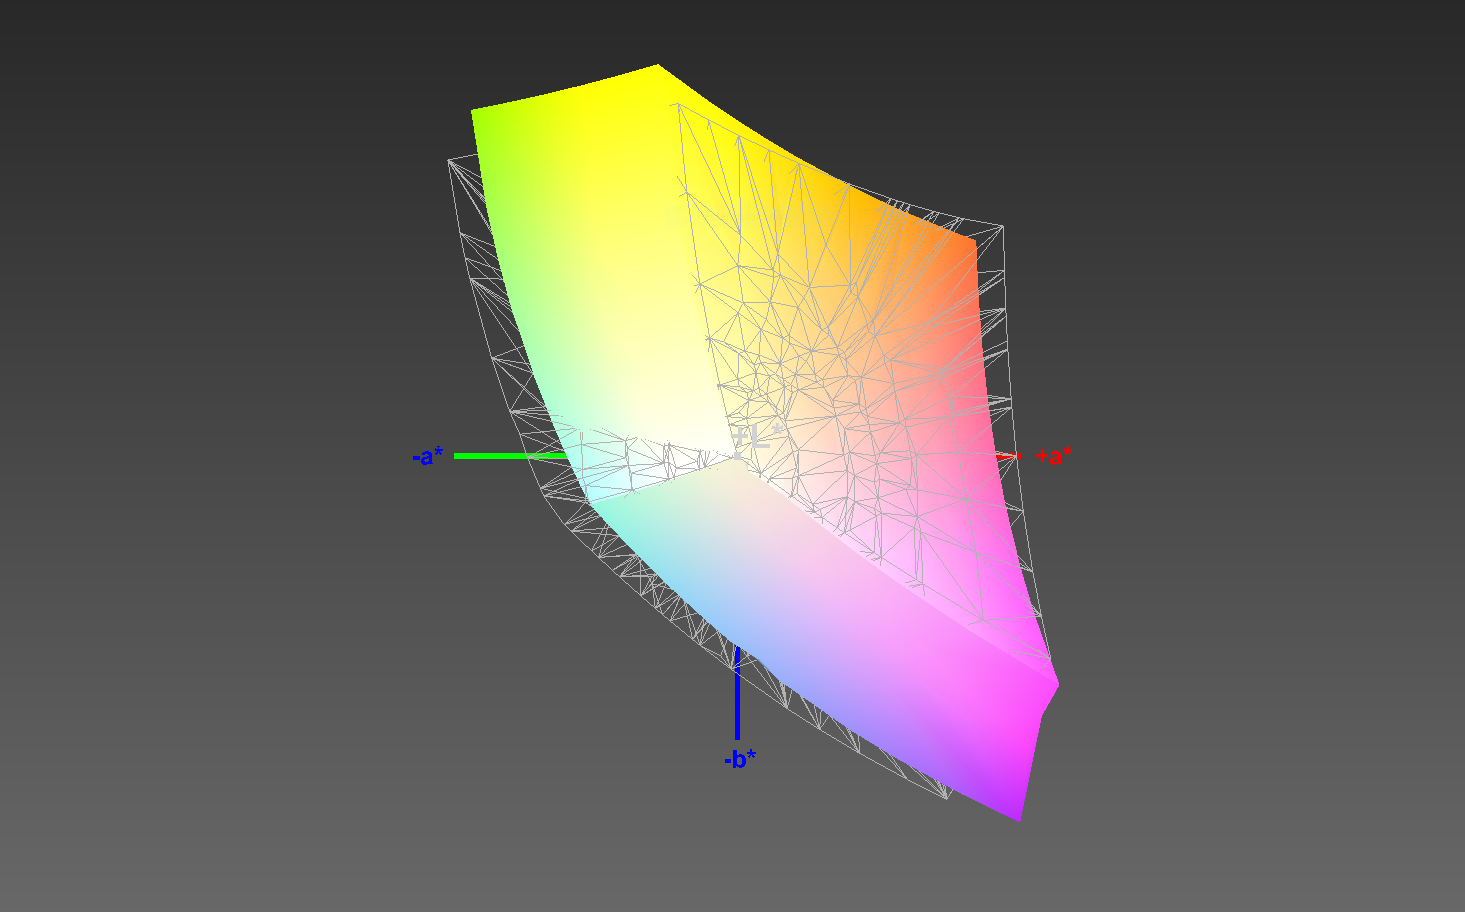
86% sRGB (Argyll 1.6.3 3D)
56% AdobeRGB 1998 (Argyll 1.6.3 3D)
62.9% AdobeRGB 1998 (Argyll 3D)
86.3% sRGB (Argyll 3D)
61.9% Display P3 (Argyll 3D)
Gamma: 2.259
CCT: 7205 K
| Asus ASUS ROG Strix SCAR III G731GW-XB74 AU Optronics AUO409D, IPS, 17.3", 1920x1080 | Acer Predator Triton 500 AU Optronics B156HAN08.2 (AUO82ED), IPS, 15.6", 1920x1080 | Alienware m17 P37E AU Optronics B173ZAN01.0, IPS, 17.3", 3840x2160 | HP Omen 15-dc1303ng LG Philips LGD05C0, IPS, 15.6", 1920x1080 | Aorus 15 X9 LG Philips LP156WFG-SPB2, IPS, 15.6", 1920x1080 | MSI GE75 8SF Chi Mei N173HCE-G33, IPS, 17.3", 1920x1080 | Eurocom Nightsky RX17 BOE NV173FHM-N44, IPS, 17.3", 1920x1080 | |
|---|---|---|---|---|---|---|---|
| Display | 5% | 38% | 5% | 7% | 5% | 7% | |
| Display P3 Coverage (%) | 61.9 | 64.2 4% | 86.4 40% | 63.8 3% | 64.9 5% | 63.1 2% | 66.1 7% |
| sRGB Coverage (%) | 86.3 | 92.6 7% | 99.9 16% | 93.4 8% | 95.6 11% | 94.4 9% | 93.1 8% |
| AdobeRGB 1998 Coverage (%) | 62.9 | 65.7 4% | 99.1 58% | 65 3% | 66.3 5% | 65.2 4% | 67.2 7% |
| Response Times | -4% | -268% | -45% | -59% | -12% | -59% | |
| Response Time Grey 50% / Grey 80% * (ms) | 7.2 ? | 8 ? -11% | 35.6 ? -394% | 14 ? -94% | 15.2 ? -111% | 9.6 ? -33% | 16.4 ? -128% |
| Response Time Black / White * (ms) | 11.6 ? | 11.2 ? 3% | 28 ? -141% | 11 ? 5% | 12.4 ? -7% | 10.4 ? 10% | 10.4 ? 10% |
| PWM Frequency (Hz) | 25770 ? | 990 ? | |||||
| Screen | 2% | -4% | 11% | 15% | 33% | 9% | |
| Brightness middle (cd/m²) | 297.4 | 304 2% | 357.9 20% | 316 6% | 305.1 3% | 370.4 25% | 298.4 0% |
| Brightness (cd/m²) | 306 | 299 -2% | 347 13% | 295 -4% | 295 -4% | 348 14% | 287 -6% |
| Brightness Distribution (%) | 80 | 89 11% | 94 18% | 84 5% | 78 -2% | 89 11% | 90 13% |
| Black Level * (cd/m²) | 0.31 | 0.27 13% | 0.33 -6% | 0.42 -35% | 0.33 -6% | 0.29 6% | 0.3 3% |
| Contrast (:1) | 959 | 1126 17% | 1085 13% | 752 -22% | 925 -4% | 1277 33% | 995 4% |
| Colorchecker dE 2000 * | 4.08 | 4.66 -14% | 6.57 -61% | 2.7 34% | 2.58 37% | 1.26 69% | 3.58 12% |
| Colorchecker dE 2000 max. * | 6.88 | 9.65 -40% | 9.86 -43% | 5.65 18% | 4.32 37% | 3.02 56% | 6.29 9% |
| Colorchecker dE 2000 calibrated * | 4 | 1.72 57% | 6.74 -69% | 1.58 60% | 1.33 67% | 1.21 70% | 2.82 29% |
| Greyscale dE 2000 * | 4 | 5.53 -38% | 4.3 -8% | 2.35 41% | 3.4 15% | 1.4 65% | 3.1 22% |
| Gamma | 2.259 97% | 2.5 88% | 2.6 85% | 2.41 91% | 2.28 96% | 2.2 100% | 2.24 98% |
| CCT | 7205 90% | 8028 81% | 6403 102% | 6904 94% | 6374 102% | 6747 96% | 7064 92% |
| Color Space (Percent of AdobeRGB 1998) (%) | 56 | 60 7% | 88.4 58% | 60 7% | 60.7 8% | 59.7 7% | 60.2 8% |
| Color Space (Percent of sRGB) (%) | 86 | 93 8% | 100 16% | 93 8% | 95.2 11% | 94.4 10% | 92.7 8% |
| Total Average (Program / Settings) | 1% /
2% | -78% /
-29% | -10% /
3% | -12% /
4% | 9% /
22% | -14% /
0% |
* ... smaller is better
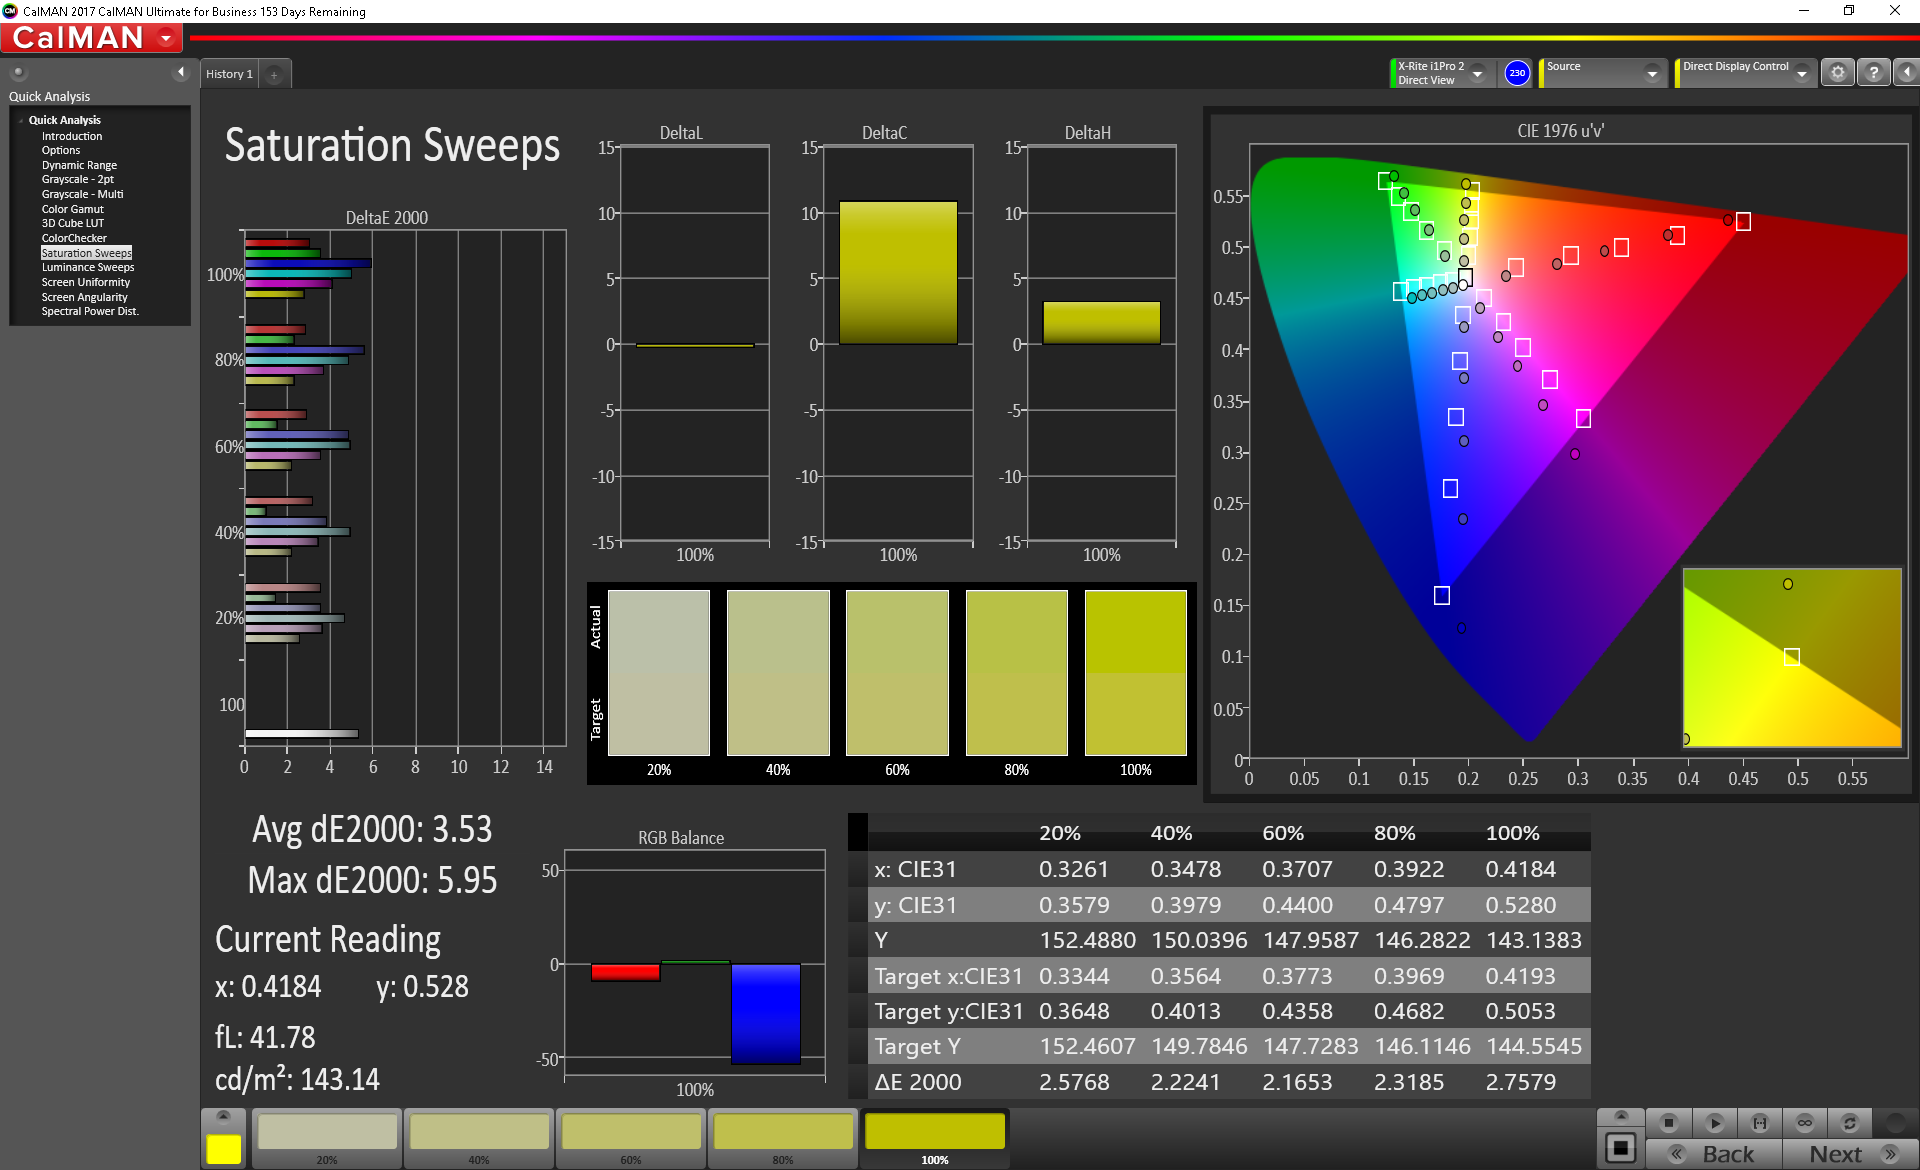
Color reproduction is above average for a gaming laptop. The DeltaE2000 for colors average 4.08, which is a bit too high for professional use (DeltaE2000 of 3 or lower) but is more than acceptable for gaming. However, several other gaming laptops at this end of the market offer far more color-accurate displays, especially the MSI GE75 Raider 8SF. Still, we must praise Asus for the tight color variance (maximum DeltaE2000 of 6.88) as well as the well-tuned Gamma. The color temperature is a bit on the cool side (CCT of 7205K), which gives a very slight blue tint to white backgrounds.
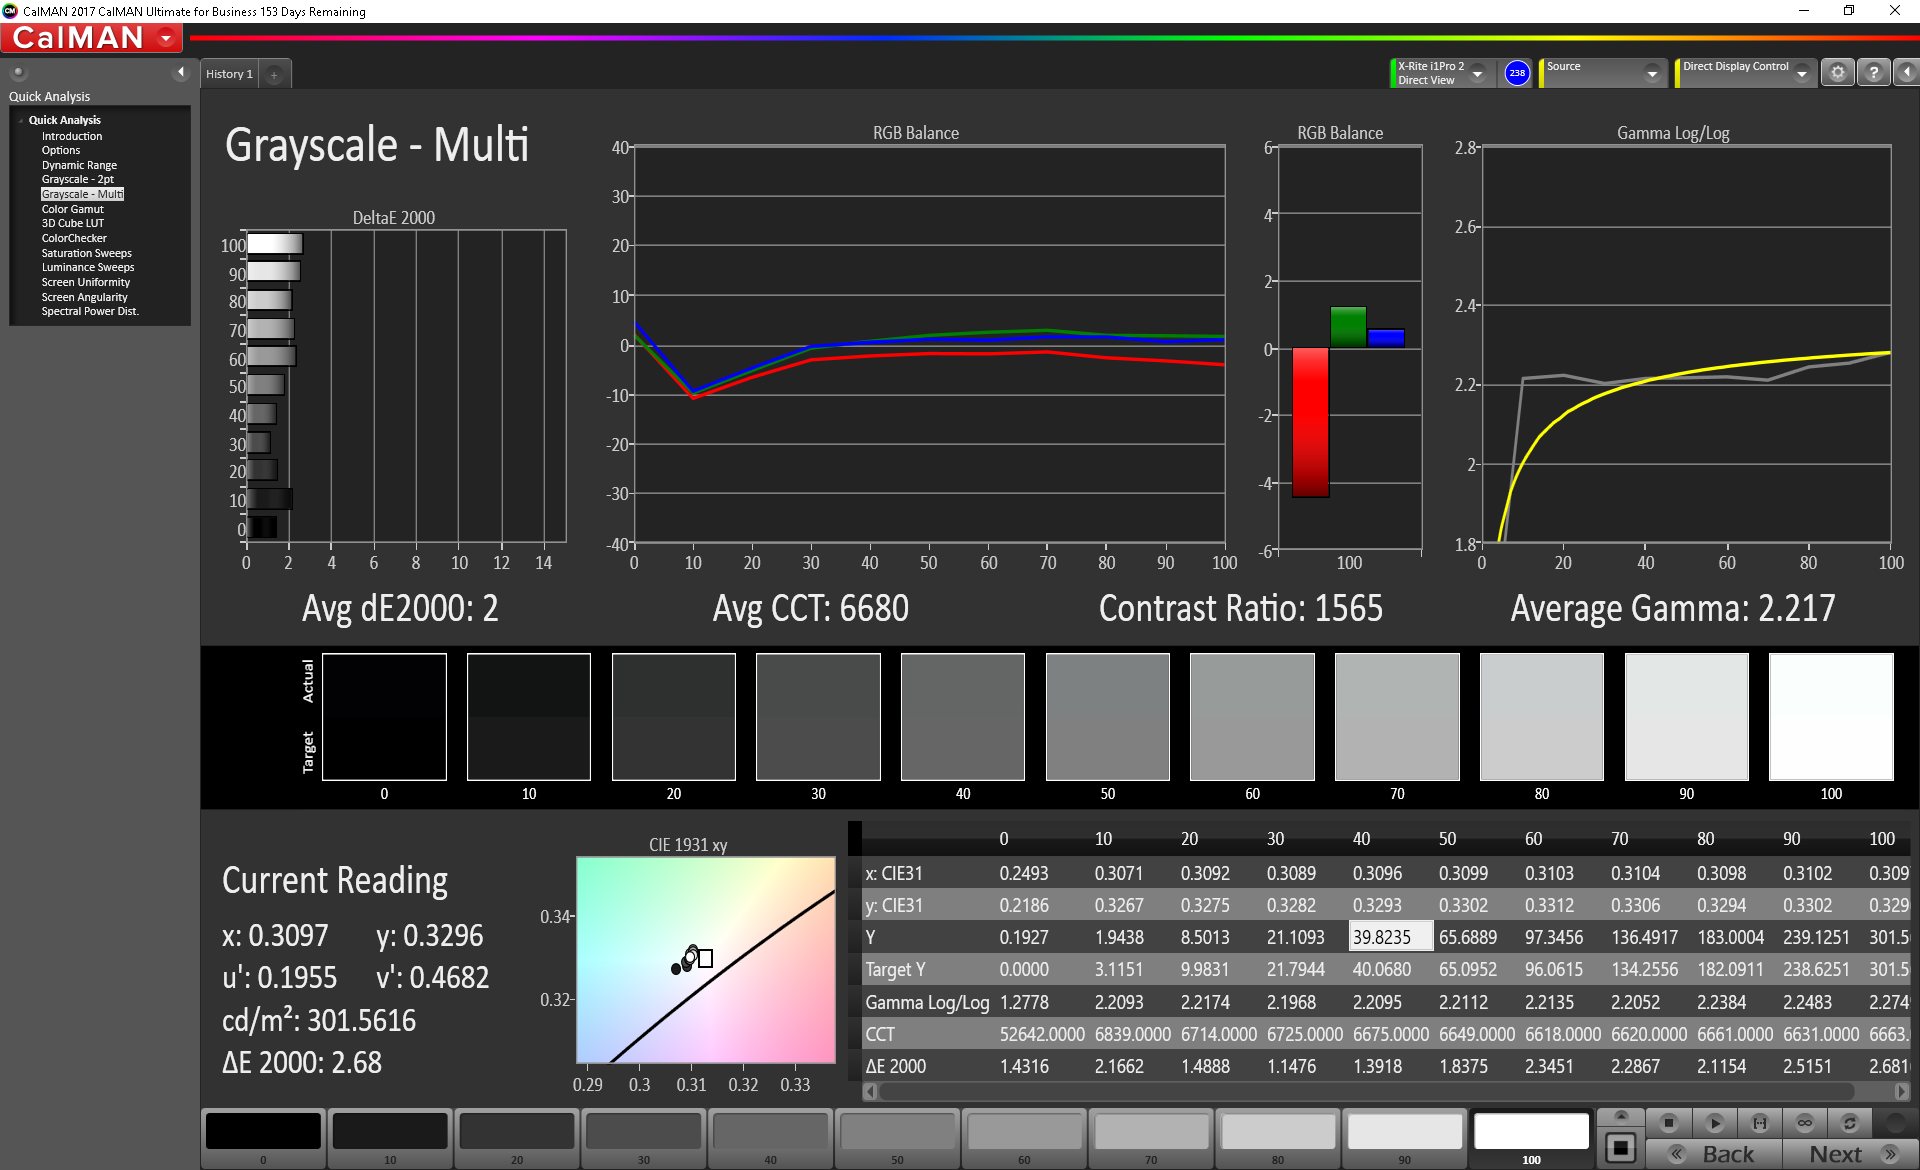
Calibration improves the DeltaE2000 for grays, the Gamma, and the color temperature but doesn't affect the delta for colors that much. Color space coverage also leaves room for improvement; The AU Optronics panel covers only 86% of the sRGB gamut. Most other high-end gaming laptops cover between 90-100% of the sRGB gamut and a decent portion of the AdobeRGB color space.


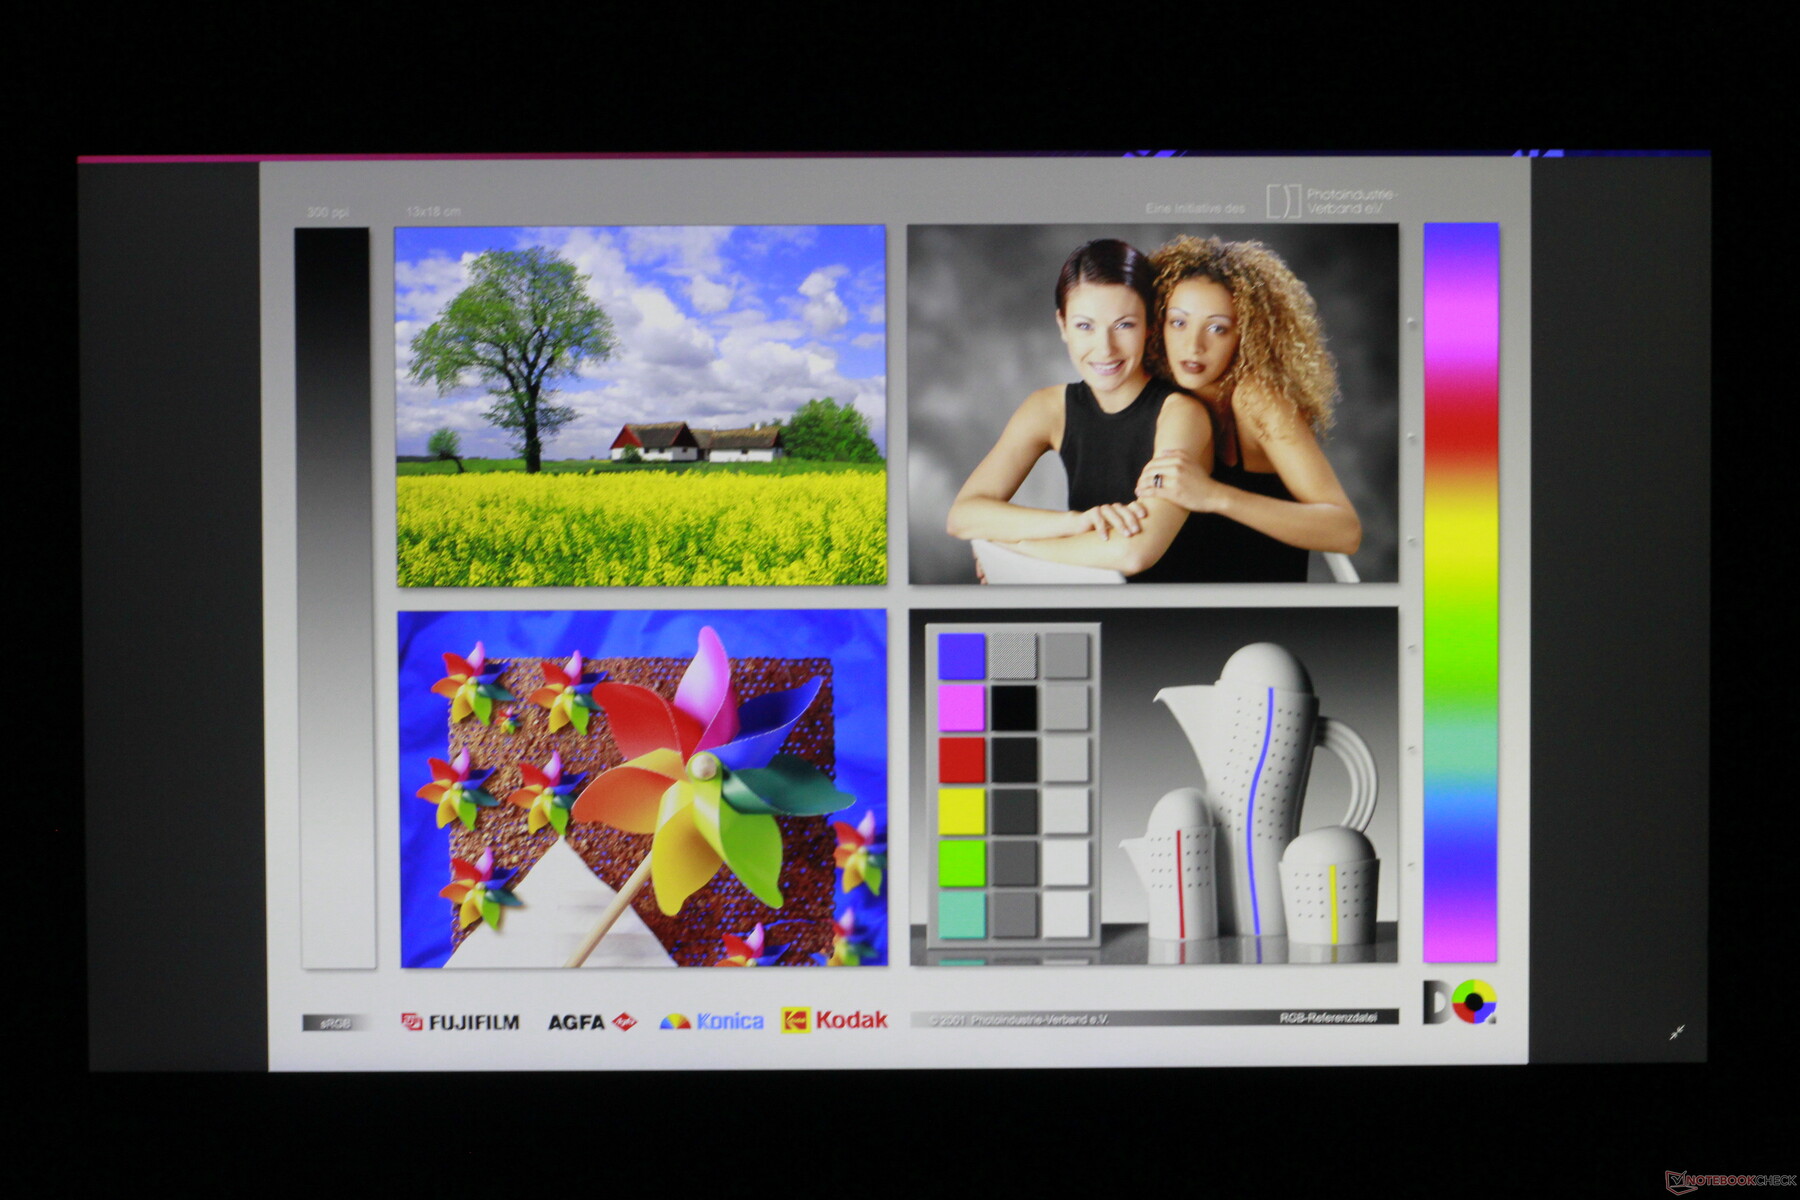
The average backlight suffers in bright conditions. While the matte finish kills reflections, the display cannot get bright enough to shine through sunlight or high-lumen light bulbs. The screen is easily visible under heavy shade or away from windows.
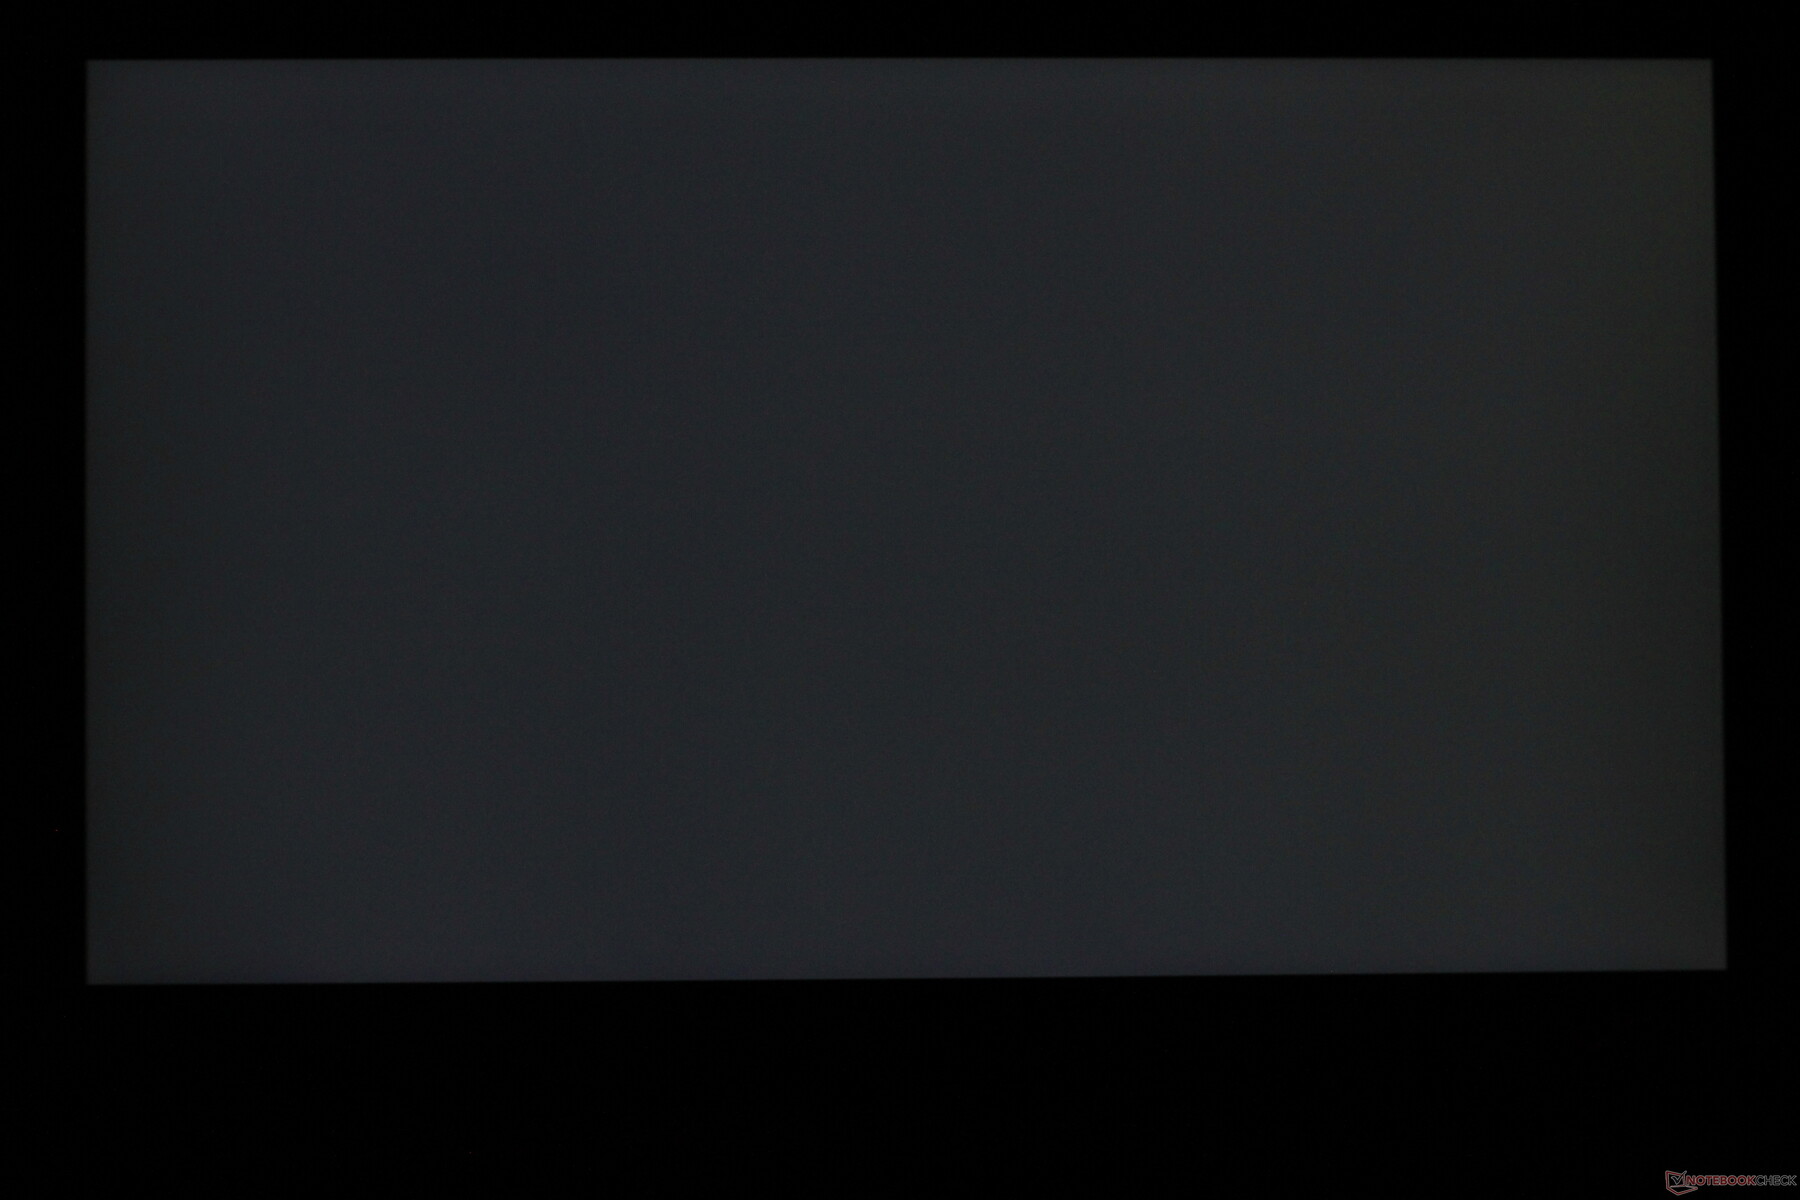
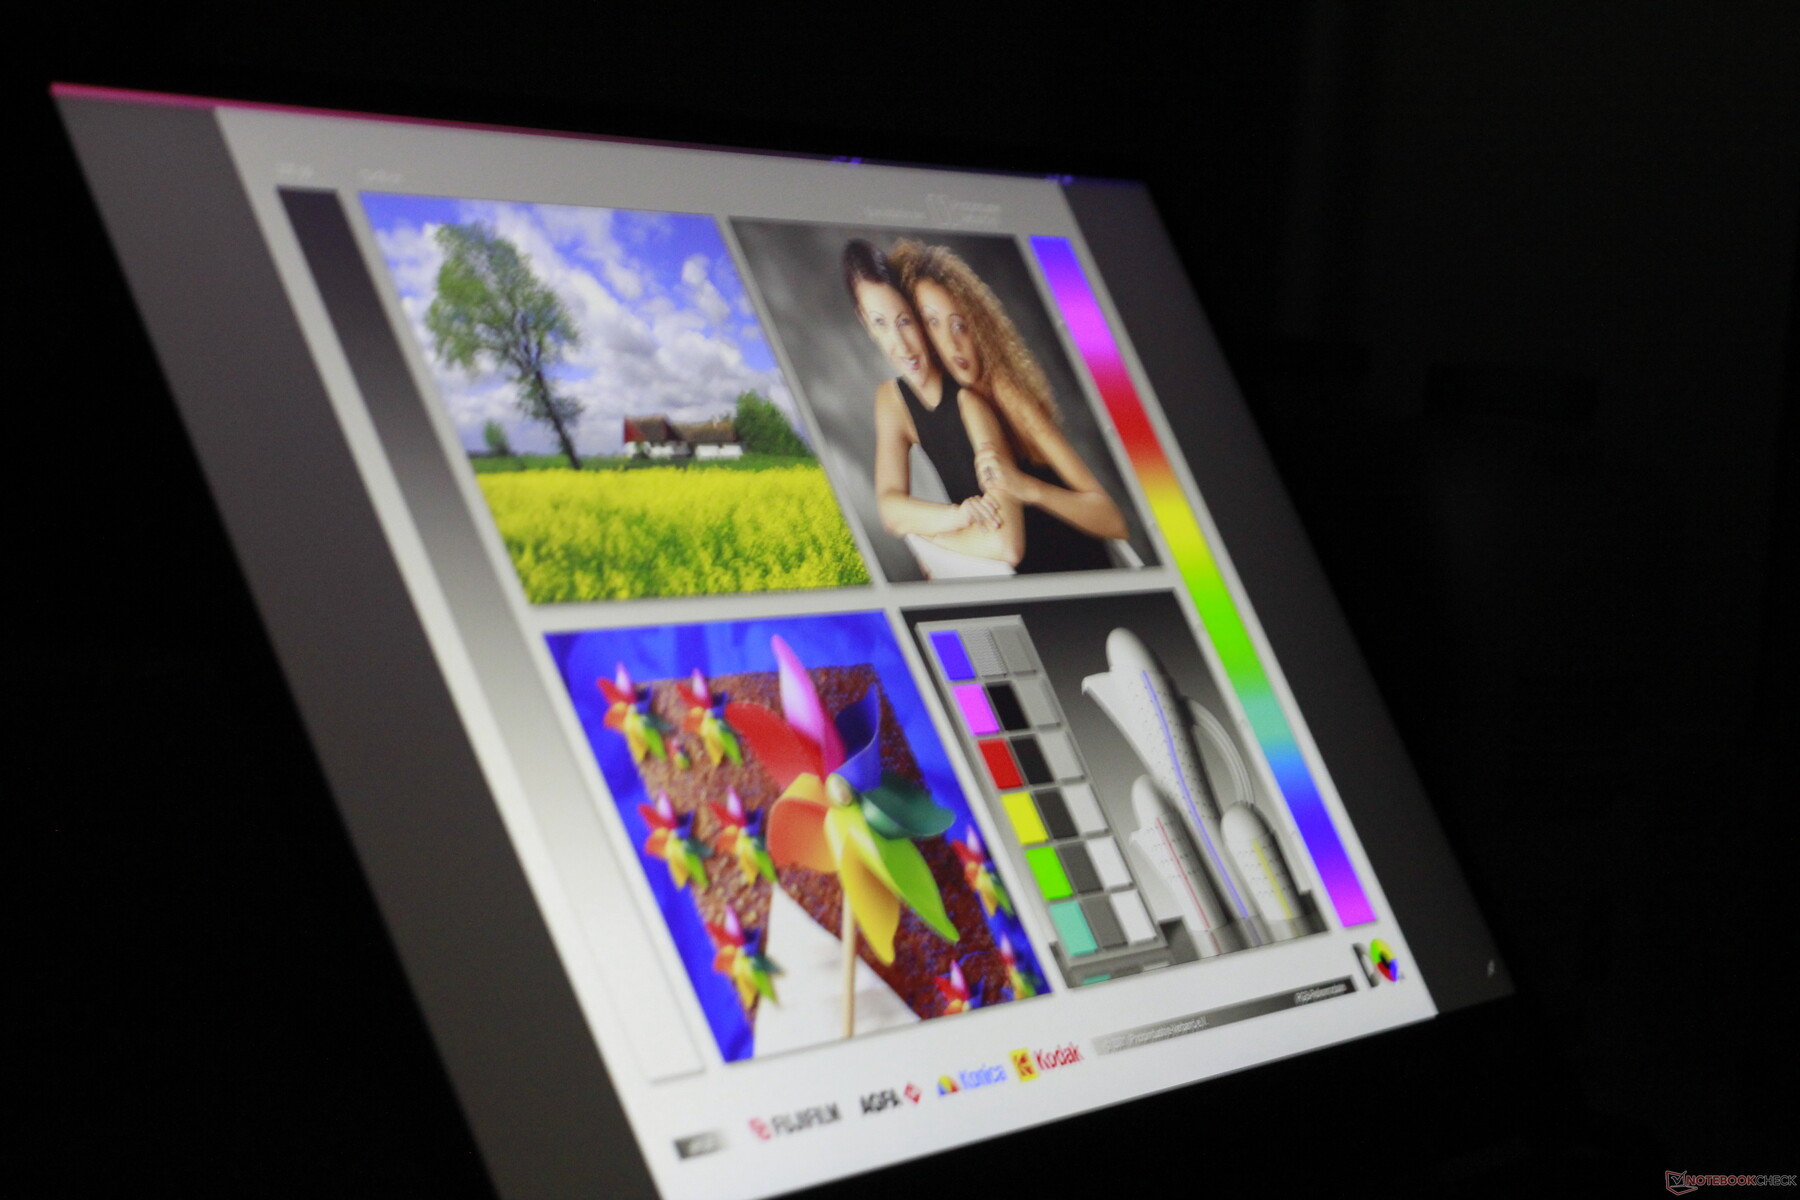
Viewing angles are excellent, as is expected of an IPS display. Also impressive is the complete lack of backlight bleed.


Display Response Times
| ↔ Response Time Black to White | ||
|---|---|---|
| 11.6 ms ... rise ↗ and fall ↘ combined | ↗ 6.4 ms rise | 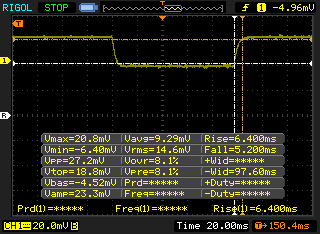 |
| ↘ 5.2 ms fall | ||
| The screen shows good response rates in our tests, but may be too slow for competitive gamers. In comparison, all tested devices range from 0.1 (minimum) to 240 (maximum) ms. » 31 % of all devices are better. This means that the measured response time is better than the average of all tested devices (19.9 ms). | ||
| ↔ Response Time 50% Grey to 80% Grey | ||
| 7.2 ms ... rise ↗ and fall ↘ combined | ↗ 3.6 ms rise | 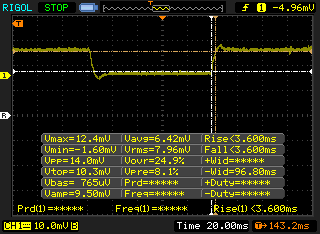 |
| ↘ 3.6 ms fall | ||
| The screen shows very fast response rates in our tests and should be very well suited for fast-paced gaming. In comparison, all tested devices range from 0.165 (minimum) to 636 (maximum) ms. » 20 % of all devices are better. This means that the measured response time is better than the average of all tested devices (31.1 ms). | ||
Screen Flickering / PWM (Pulse-Width Modulation)
| Screen flickering / PWM not detected | 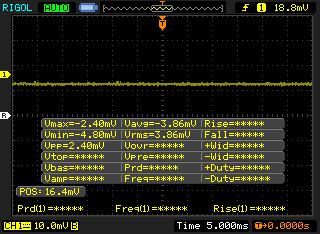 | ||
In comparison: 52 % of all tested devices do not use PWM to dim the display. If PWM was detected, an average of 7784 (minimum: 5 - maximum: 343500) Hz was measured. | |||
Performance
The Asus G731GW packs some of the latest and greatest tech from Intel and Nvidia; as a result, the machine is well-suited to gaming with maximum details at 1440p. The 144 Hz display makes gameplay at Full HD buttery smooth as framerates push into the high double digits and low hundreds. Overall, the G731GW plows through games but falls about 5% below other laptops using the Nvidia GeForce RTX 2070.
Processor
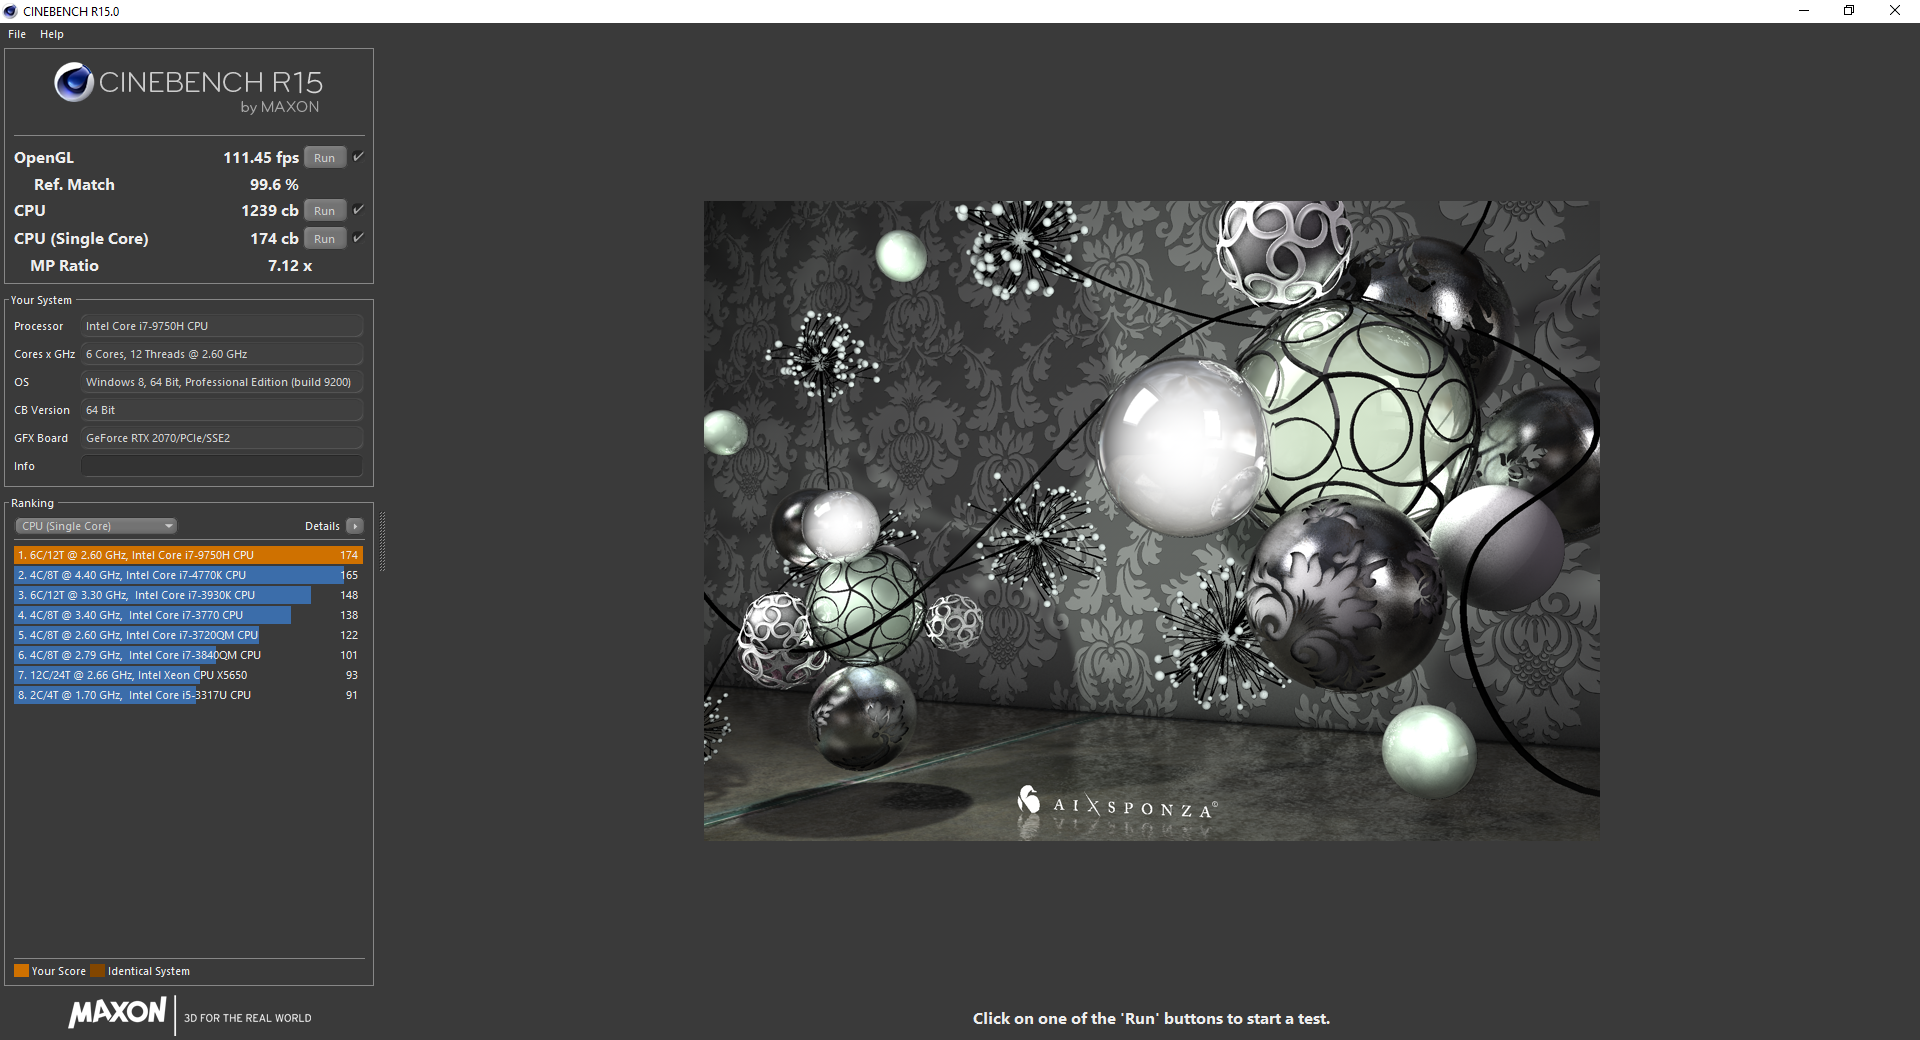
The 9th-Gen Core i7-9750H is one of Intel's fastest mobile processors. Built on the Coffee Lake architecture using a 14nm++ process (Intel's term for an improved 14nm process), the 9750H is a six-core monster with a 2.6 GHz base clock and a 4.5 GHz boost on a single core (4.0 GHz across all six cores). The 9750H is an iterative improvement over the Core i7-8750H, offering a slight bump in the boost clock (4.5 GHz vs 4.1 GHz) and a bit more L3 cache (12 MB vs 9 MB). Otherwise, the 9750H offers a reasonable performance increase over its older brother.
The Asus G731GW performs well in CPU benchmarks out of the gates, hitting 1239 in Cinebench R15's multicore test. However, it is a hair behind the Eurocom Nightsky RX17, another 9750H-equipped gaming laptop. Still, this is a fair bit better than the older Core i7-8750H and almost twice as fast as AMD's mobile CPU offerings.
Long-term performance is steady. In our 50-loop Cinbench R15 test, the G731GW sees a slight drop in performance after its first run, which is typical for this test. Scores then level out just underneath those of the Eurocom Nightsky RX17.
| Cinebench R10 | |
| Rendering Multiple CPUs 32Bit | |
| Average of class Gaming (42932 - 81339, n=8, last 2 years) | |
| Dell G5 15 5590 | |
| Average Intel Core i7-9750H (28251 - 36304, n=13) | |
| Asus TUF FX705DY-AU072 | |
| Rendering Single 32Bit | |
| Average of class Gaming (7457 - 11779, n=8, last 2 years) | |
| Asus TUF FX705DY-AU072 | |
| Average Intel Core i7-9750H (6659 - 7214, n=13) | |
| Dell G5 15 5590 | |
System Performance
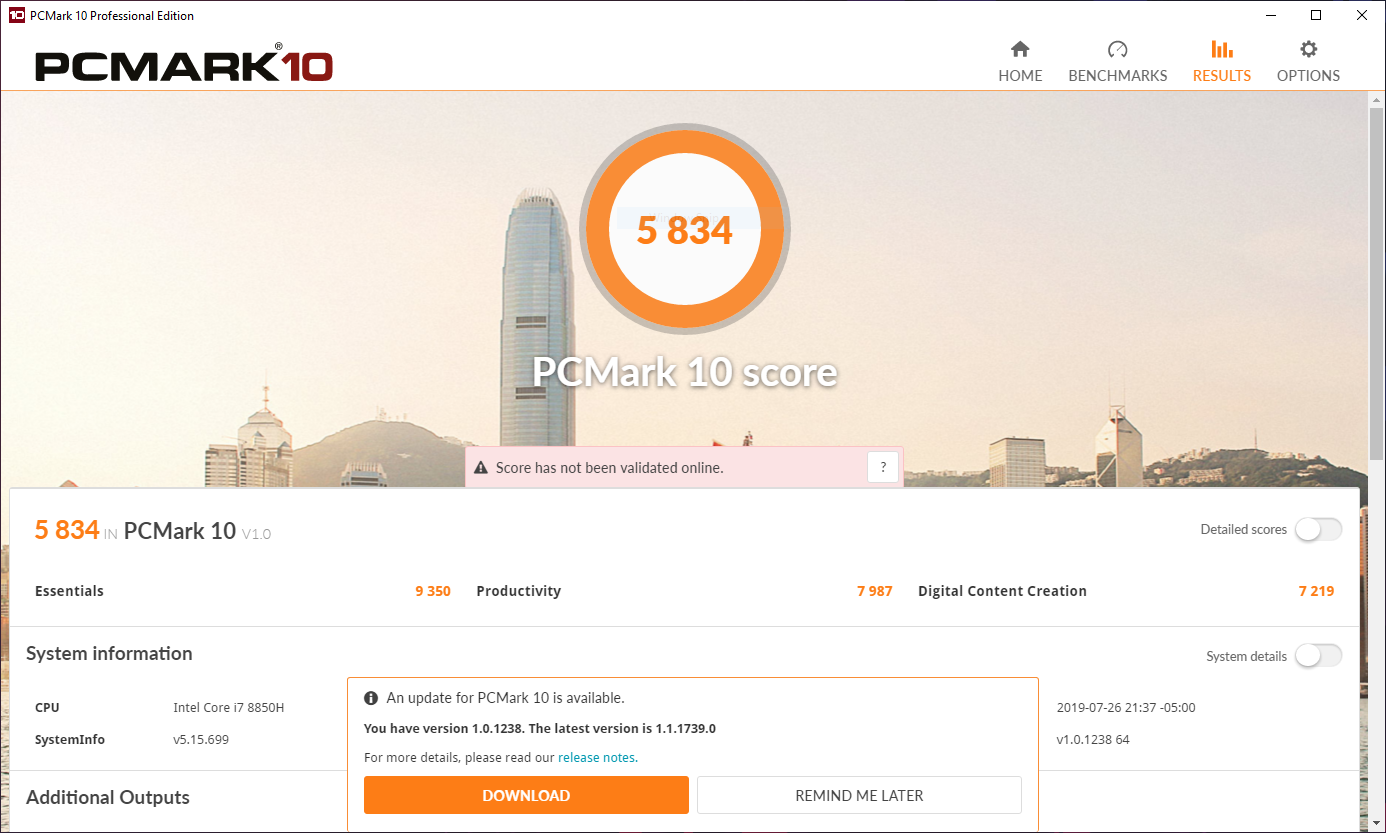
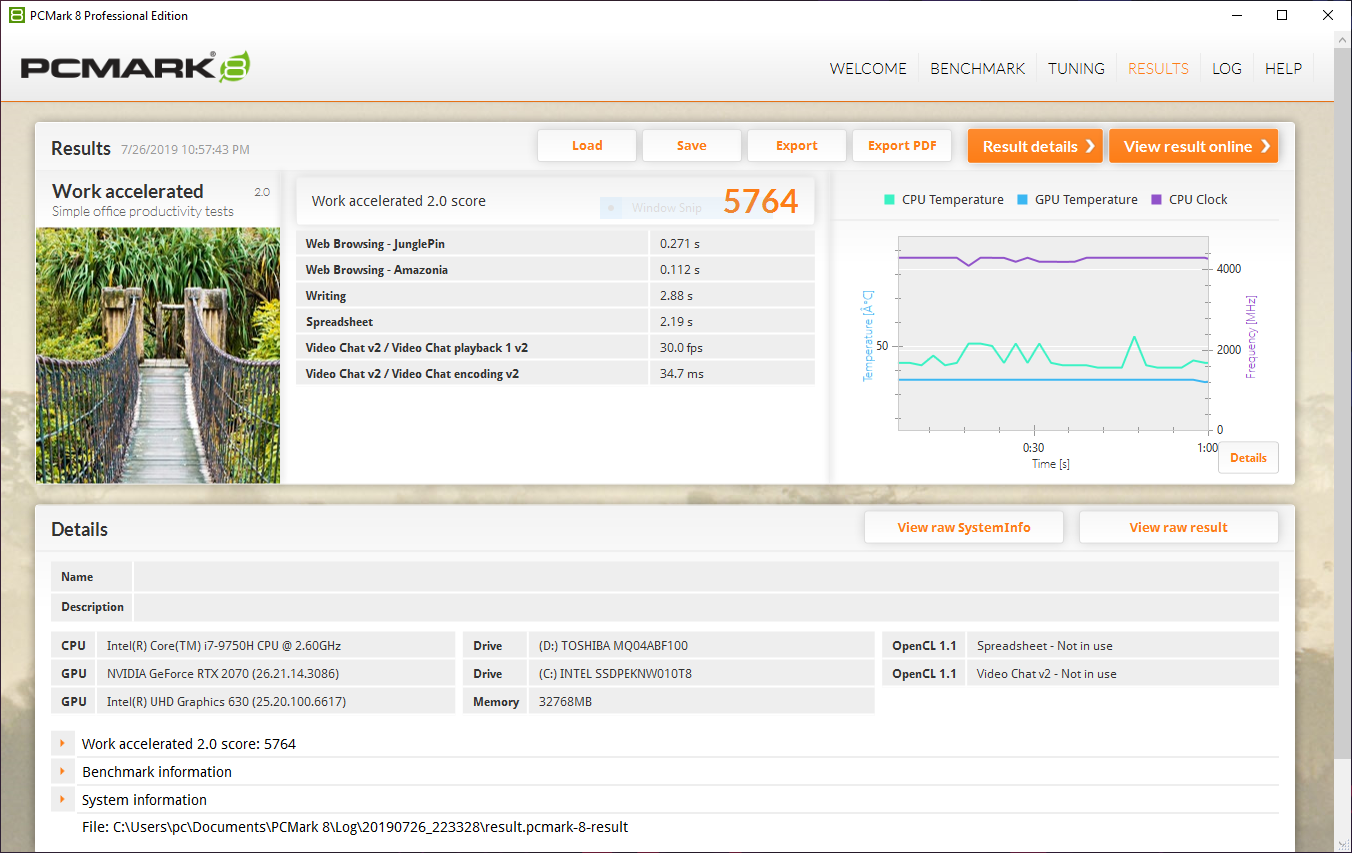
Overall system performance is speedy and in line with expectations. Compared to the similarly-specced Eurocom Nightsky RX17, the G731GW falls about 5-8% behind in PCMark 10. This performance should be adequate for most use cases, including content creation and heavy office work.
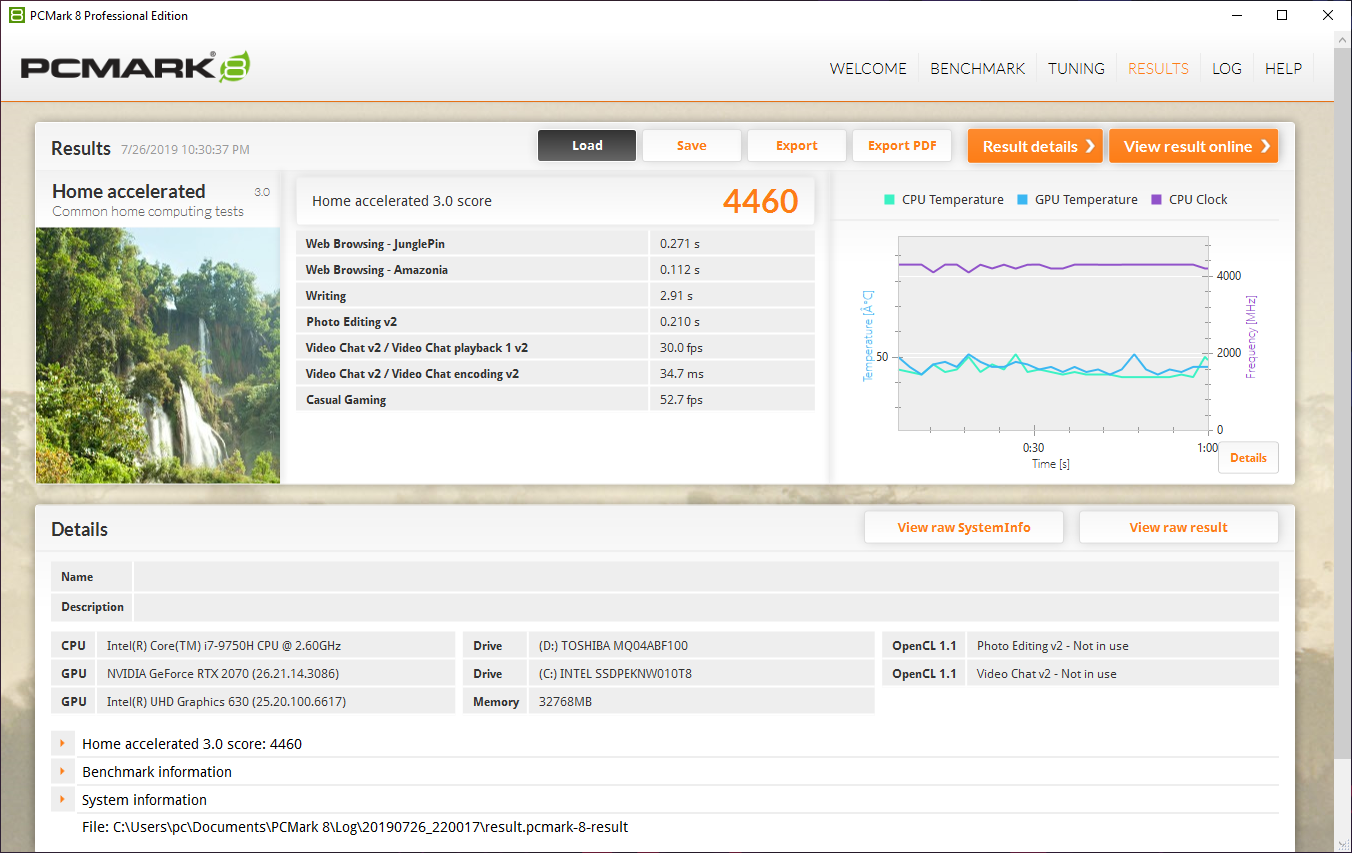
| PCMark 8 Home Score Accelerated v2 | 4460 points | |
| PCMark 8 Work Score Accelerated v2 | 5764 points | |
| PCMark 10 Score | 5834 points | |
Help | ||
Storage Devices
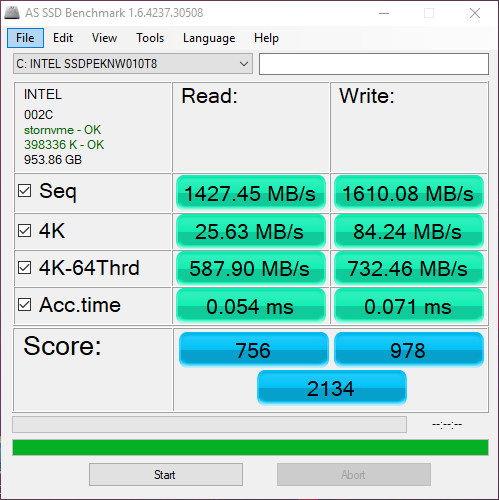
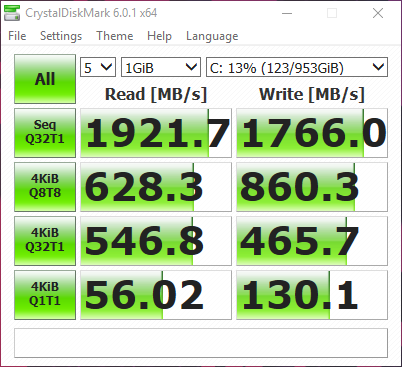
The Intel SSD 660p has reasonably fast read and write speed with quick access times. Samsung's PM981, which is used in other gaming laptops like the HP Omen 15, offers better read speeds and is overall snappy, but the Intel 660p should be good enough for most. Game load times are fairly quick. Users can easily upgrade the storage drive should they see fit.
The additional 2.5-inch bay in our unit is populated by a fairly slow 5400 RPM mechanical HDD. As a result, the drive should be reserved for media files and infrequently used files.
| Asus ASUS ROG Strix SCAR III G731GW-XB74 Intel SSD 660p 1TB SSDPEKNW010T8 | Acer Predator Triton 500 2x WDC PC SN720 SDAPNTW-256G-1014 (RAID 0) | Alienware m17 P37E SK Hynix PC401 512GB M.2 (HFS512GD9TNG) | HP Omen 15-dc1303ng Samsung SSD PM981 MZVLB256HAHQ | Aorus 15 X9 Intel SSD 760p SSDPEKKW512G8 | MSI GE75 8SF Kingston RBUSNS8154P3256GJ1 | Eurocom Nightsky RX17 2x Samsung SSD 970 Pro 512GB (RAID 0) | Average Intel SSD 660p 1TB SSDPEKNW010T8 | |
|---|---|---|---|---|---|---|---|---|
| AS SSD | 67% | 1% | 48% | 23% | -27% | 67% | 9% | |
| Seq Read (MB/s) | 1427 | 2913 104% | 1835 29% | 2485 74% | 1912 34% | 949 -33% | 2297 61% | 1456 ? 2% |
| Seq Write (MB/s) | 1610 | 2492 55% | 1121 -30% | 1575 -2% | 1553 -4% | 823 -49% | 2860 78% | 1404 ? -13% |
| 4K Read (MB/s) | 25.63 | 38.7 51% | 23.98 -6% | 53.4 108% | 56.5 120% | 25.36 -1% | 52.2 104% | 48.7 ? 90% |
| 4K Write (MB/s) | 84.2 | 107.2 27% | 100 19% | 113.5 35% | 119.6 42% | 67.1 -20% | 125.8 49% | 131.6 ? 56% |
| 4K-64 Read (MB/s) | 588 | 1228 109% | 687 17% | 725 23% | 869 48% | 748 27% | 1412 140% | 586 ? 0% |
| 4K-64 Write (MB/s) | 732 | 1079 47% | 776 6% | 1371 87% | 584 -20% | 650 -11% | 1228 68% | 788 ? 8% |
| Access Time Read * (ms) | 0.054 | 0.047 13% | 0.059 -9% | 0.049 9% | 0.173 -220% | 0.04 26% | 0.07236 ? -34% | |
| Access Time Write * (ms) | 0.071 | 0.035 51% | 0.053 25% | 0.032 55% | 0.031 56% | 0.059 17% | 0.09 -27% | 0.07731 ? -9% |
| Score Read (Points) | 756 | 1558 106% | 895 18% | 1027 36% | 1116 48% | 869 15% | 1694 124% | 780 ? 3% |
| Score Write (Points) | 978 | 1435 47% | 988 1% | 1642 68% | 859 -12% | 799 -18% | 1640 68% | 1060 ? 8% |
| Score Total (Points) | 2134 | 3770 77% | 2306 8% | 3163 48% | 2544 19% | 2109 -1% | 4235 98% | 2252 ? 6% |
| Copy ISO MB/s (MB/s) | 1489 | 773 -48% | 1329 -11% | 1121 -25% | 2514 69% | 1469 ? -1% | ||
| Copy Program MB/s (MB/s) | 514 | 493 -4% | 404.3 -21% | 532 4% | 592 15% | 484 ? -6% | ||
| Copy Game MB/s (MB/s) | 893 | 647 -28% | 1071 20% | 380.5 -57% | 1494 67% | 997 ? 12% | ||
| CrystalDiskMark 5.2 / 6 | 3% | -6% | -6% | 16% | -39% | 38% | -4% | |
| Write 4K (MB/s) | 130.1 | 93.6 -28% | 120.2 -8% | 50.2 -61% | 147.2 13% | 73.3 -44% | 133 2% | 144.5 ? 11% |
| Read 4K (MB/s) | 56 | 38.82 -31% | 44.3 -21% | 35.32 -37% | 63.7 14% | 33.35 -40% | 61.6 10% | 54.1 ? -3% |
| Write Seq (MB/s) | 2455 | 1278 | 991 | 1573 | 849 | 2935 | 1445 ? | |
| Read Seq (MB/s) | 2107 | 1389 | 1526 | 2602 | 964 | 3118 | 1446 ? | |
| Write 4K Q32T1 (MB/s) | 465.7 | 298.7 -36% | 436.2 -6% | 445.1 -4% | 531 14% | 236.2 -49% | 571 23% | 427 ? -8% |
| Read 4K Q32T1 (MB/s) | 547 | 338.7 -38% | 515 -6% | 526 -4% | 598 9% | 384.7 -30% | 654 20% | 456 ? -17% |
| Write Seq Q32T1 (MB/s) | 1766 | 2902 64% | 1157 -34% | 1647 -7% | 1592 -10% | 867 -51% | 3296 87% | 1650 ? -7% |
| Read Seq Q32T1 (MB/s) | 1922 | 3536 84% | 2671 39% | 3427 78% | 2981 55% | 1586 -17% | 3560 85% | 1728 ? -10% |
| Write 4K Q8T8 (MB/s) | 860 | 880 ? 2% | ||||||
| Read 4K Q8T8 (MB/s) | 628 | 629 ? 0% | ||||||
| Total Average (Program / Settings) | 35% /
43% | -3% /
-1% | 21% /
29% | 20% /
21% | -33% /
-30% | 53% /
58% | 3% /
4% |
* ... smaller is better

GPU Performance
The Nvidia GeForce RTX 2070 sits at the top of Nvidia's current consumer GPU lineup, bested only by the GeForce RTX 2080. Built on a 12nm FinFET process, the RTX line's big draw is its real-time ray tracing technology. Unfortunately, not many titles take full advantage of real-time ray tracing at the time of this publication. That said, the RTX 2070 packs plenty of other features, including support for HDMI 2.0b (which the G731GW has), H.265 encoding, and support for high-resolution rendering.
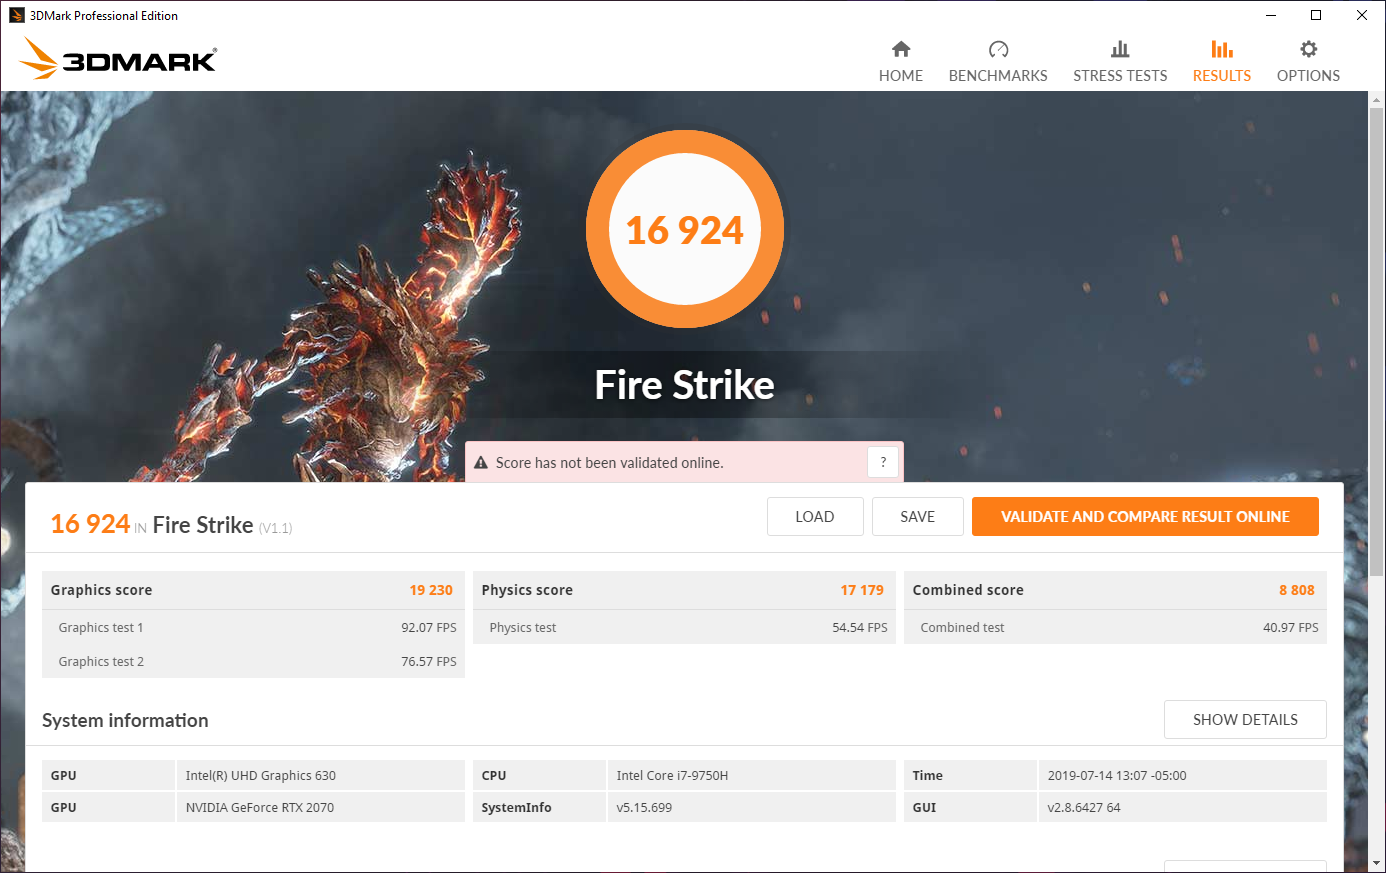
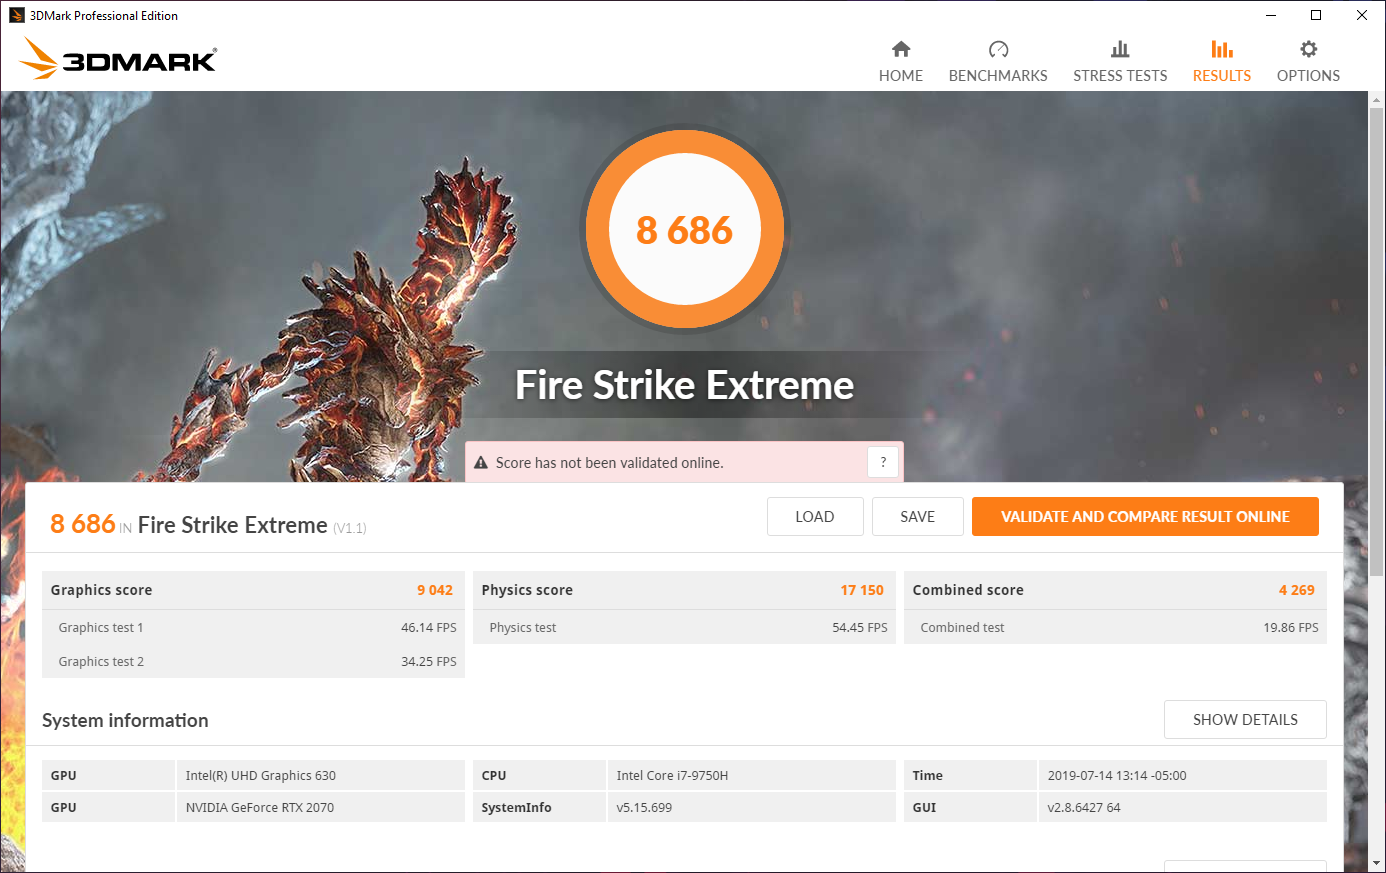
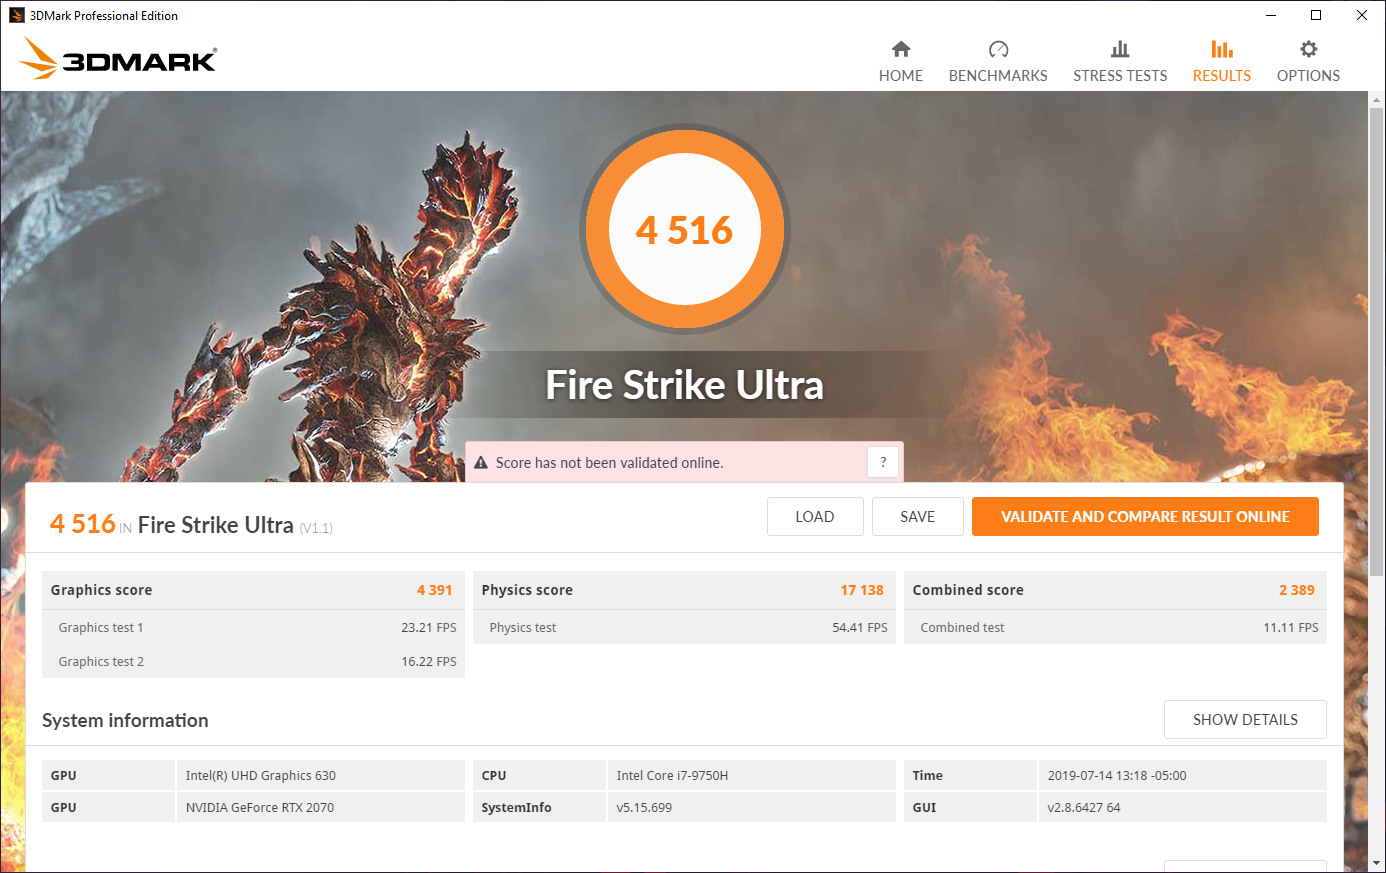
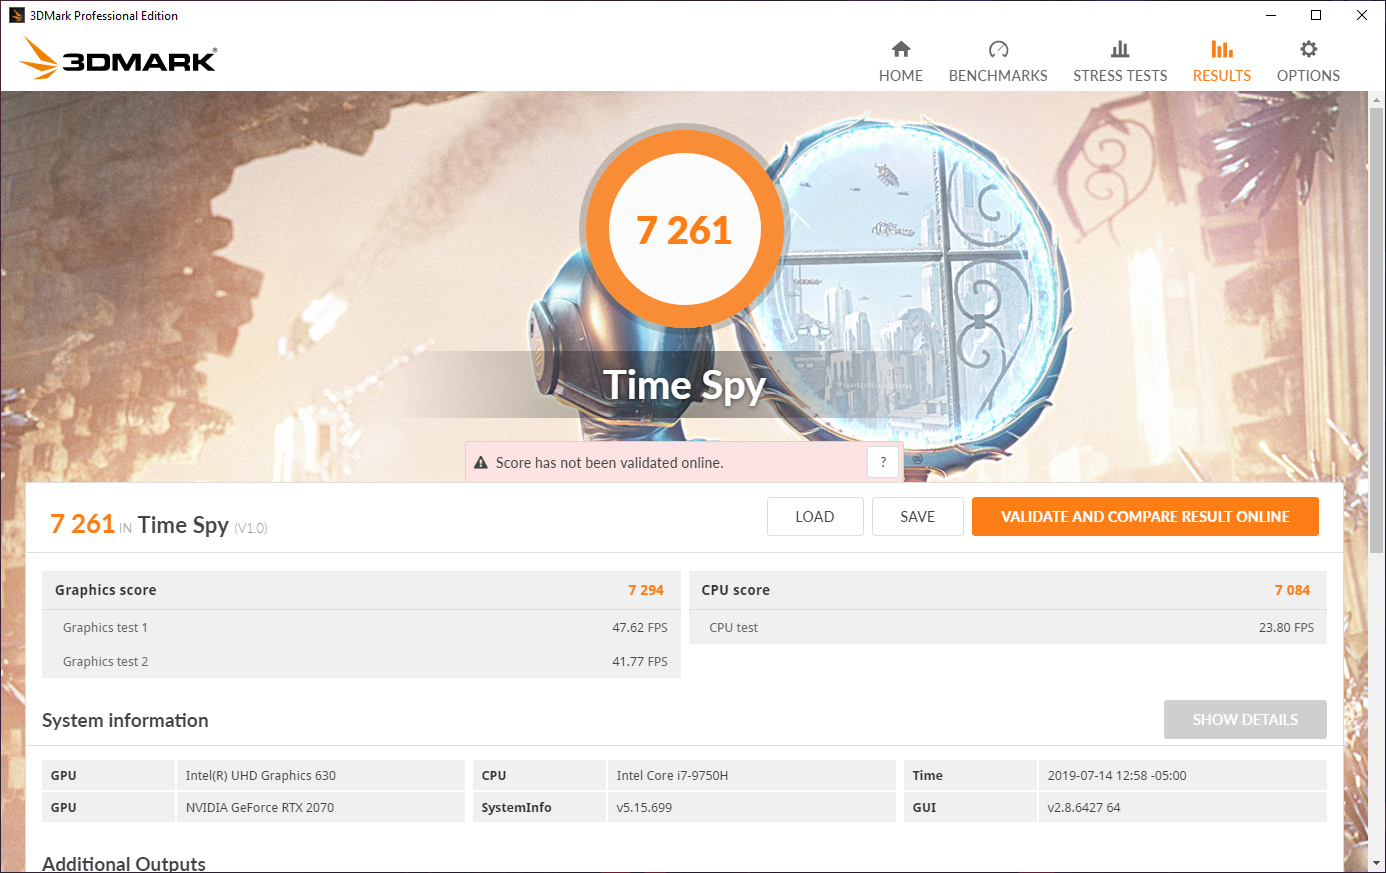
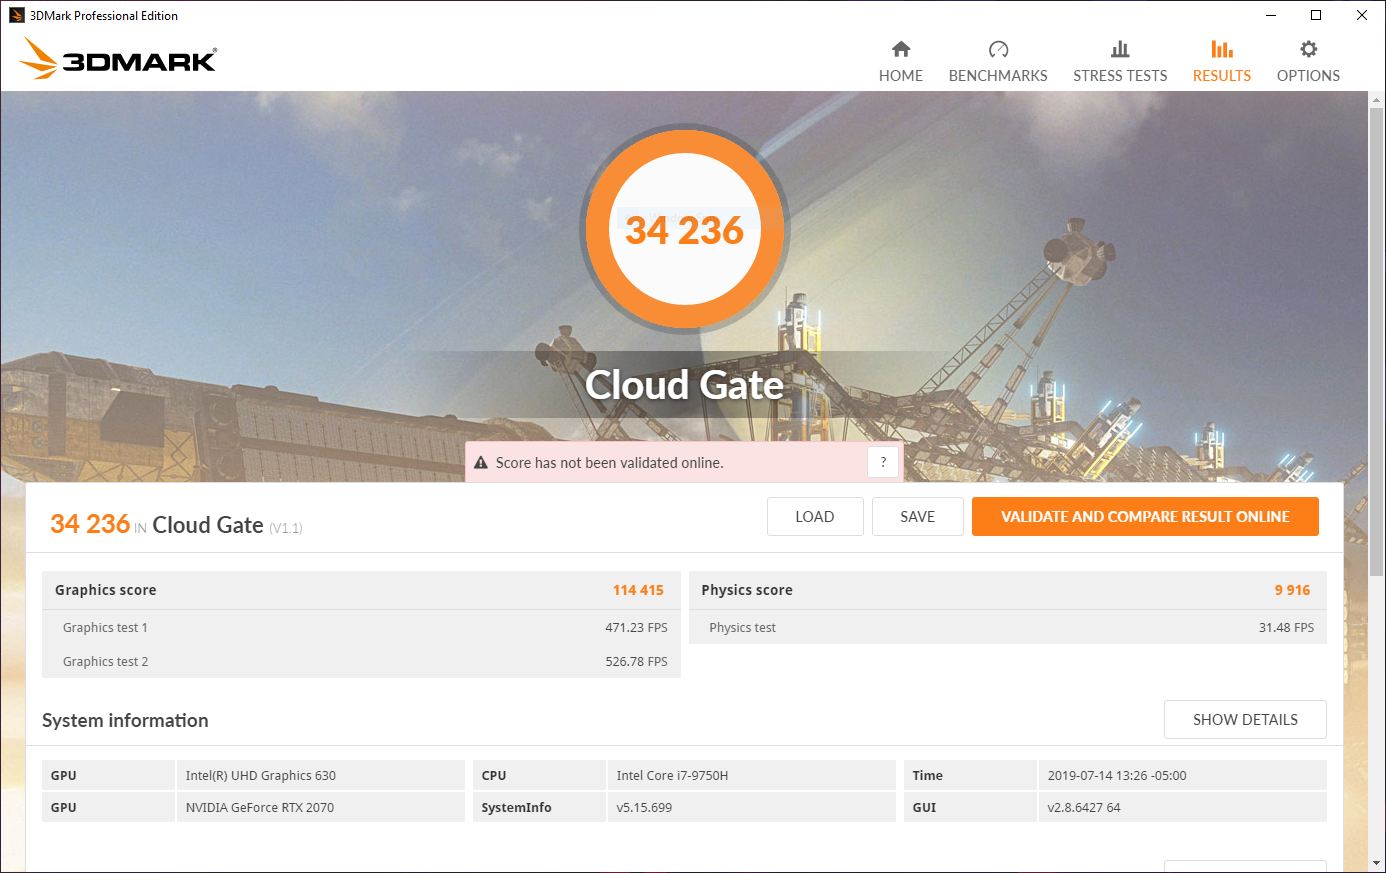
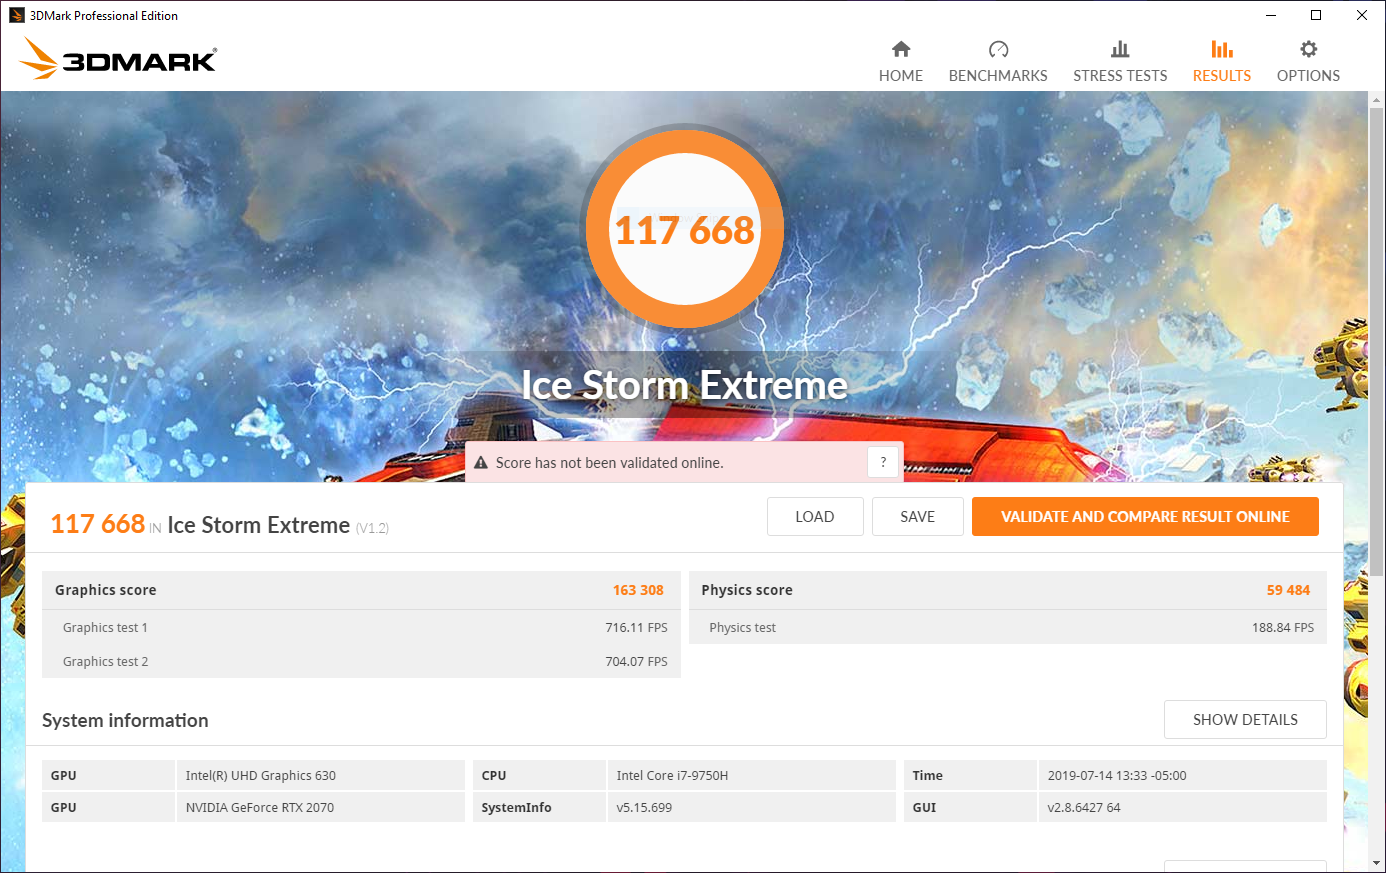
While the RTX 2070 is suitable for playing games at 4K/Medium-High settings, the card can also take advantage of the G731GW's 144 Hz 1080p panel. The GPU performs admirably in synthetic benchmarks like 3DMark's Fire Strike. In a similar vein to our CPU benchmarks, the G731GW doesn't quite match up to other gaming laptops in its class. The machine falls about 3% behind the average for the RTX 2070 in most benchmarks, but this is well within reason. Gaming performance should be on par with similarly-specced devices.
| 3DMark 11 | |
| 1280x720 Performance GPU | |
| Average of class Gaming (21841 - 80022, n=106, last 2 years) | |
| Razer Blade Pro 17 RTX 2080 Max-Q | |
| Average NVIDIA GeForce RTX 2070 Mobile (23335 - 27298, n=21) | |
| Asus ASUS ROG Strix SCAR III G731GW-XB74 | |
| MSI WS75 9TL-636 | |
| Medion Erazer X15805 | |
| MSI GE65 Raider 9SE | |
| Asus ROG Strix G GL731GU-RB74 | |
| Apple MacBook Pro 15 2018 (2.9 GHz, Vega 20) | |
| Asus TUF FX705DY-AU072 | |
| 1280x720 Performance Combined | |
| Average of class Gaming (10258 - 30851, n=106, last 2 years) | |
| MSI WS75 9TL-636 | |
| Asus ROG Strix G GL731GU-RB74 | |
| Medion Erazer X15805 | |
| Average NVIDIA GeForce RTX 2070 Mobile (8716 - 16364, n=21) | |
| Razer Blade Pro 17 RTX 2080 Max-Q | |
| MSI GE65 Raider 9SE | |
| Asus ASUS ROG Strix SCAR III G731GW-XB74 | |
| Apple MacBook Pro 15 2018 (2.9 GHz, Vega 20) | |
| Asus TUF FX705DY-AU072 | |
| 3DMark 11 Performance | 19495 points | |
| 3DMark Ice Storm Standard Score | 118130 points | |
| 3DMark Cloud Gate Standard Score | 34236 points | |
| 3DMark Fire Strike Score | 16924 points | |
| 3DMark Fire Strike Extreme Score | 8686 points | |
| 3DMark Time Spy Score | 7261 points | |
Help | ||
Gaming Performance
Despite the setbacks we observed in performance, the G731GW still easily chews through most modern games. Even demanding titles like Final Fantasy XV or Shadow of the Tomb Raider hit framerates in the upper double-digits at FHD/High settings. These high framerates also take advantage of the fast 144 Hz response rate. The G731GW is also well-suited for competitive gamers as lighter titles like Fortnite and CS:GO push well into the hundreds of frames a second.
| The Witcher 3 - 1920x1080 Ultra Graphics & Postprocessing (HBAO+) | |
| Average of class Gaming (95 - 240, n=8, last 2 years) | |
| Acer Predator Triton 500 | |
| Alienware m17 P37E | |
| Average NVIDIA GeForce RTX 2070 Mobile (64 - 82.1, n=21) | |
| Eurocom Nightsky RX17 | |
| Aorus 15 X9 | |
| MSI GE75 8SF | |
| Asus ASUS ROG Strix SCAR III G731GW-XB74 | |
Long gaming sessions yield little variance in framerate. Over an hour-long session of The Witcher 3, we observe very slight dips in performance as the day/night cycle shifts the scene. These small falls are commonly seen and in line with expectations.
| low | med. | high | ultra | |
|---|---|---|---|---|
| The Witcher 3 (2015) | 64 | |||
| Fortnite (2018) | 236 | 190 | 140 | 132 |
| Final Fantasy XV Benchmark (2018) | 158 | 100 | 77 | |
| Shadow of the Tomb Raider (2018) | 105 | 97 | 93 | 85 |
| F1 2019 (2019) | 198 | 168 | 139 | 95 |
Emissions
System Noise
The Asus G731GW offers multiple preset fan profiles and allows users to customize the fan curve through software. The preset profiles support a variety of use cases. When set to Silent, the fans are almost dead quiet and rarely turn on. When set to Turbo, the fans ramp up aggressively and rarely turn off. For lighter office work or browsing the web, the Silent and Balanced profiles keep fan noise around 30 dB(A), which just fades underneath ambient room noise. The Turbo profile is meant for heavy loads like gaming, and the fans get very loud, averaging about 51-55 dB(A). The fan sound profile is well-balanced and evenly tuned; thus, the fans are not whiny and emit a low-pitched whir, even when running at full blast. There is no noticeable coil whine.
| Asus ASUS ROG Strix SCAR III G731GW-XB74 GeForce RTX 2070 Mobile, i7-9750H, Intel SSD 660p 1TB SSDPEKNW010T8 | Acer Predator Triton 500 GeForce RTX 2080 Max-Q, i7-8750H, 2x WDC PC SN720 SDAPNTW-256G-1014 (RAID 0) | Alienware m17 P37E GeForce RTX 2080 Max-Q, i9-8950HK, SK Hynix PC401 512GB M.2 (HFS512GD9TNG) | HP Omen 15-dc1303ng GeForce RTX 2070 Max-Q, i7-8750H, Samsung SSD PM981 MZVLB256HAHQ | Aorus 15 X9 GeForce RTX 2070 Mobile, i7-8750H, Intel SSD 760p SSDPEKKW512G8 | MSI GE75 8SF GeForce RTX 2070 Mobile, i7-8750H, Kingston RBUSNS8154P3256GJ1 | Eurocom Nightsky RX17 GeForce RTX 2070 Mobile, i7-9750H, 2x Samsung SSD 970 Pro 512GB (RAID 0) | |
|---|---|---|---|---|---|---|---|
| Noise | 2% | 2% | -3% | -4% | -3% | 2% | |
| off / environment * (dB) | 28.2 | 29 -3% | 28.2 -0% | 30.5 -8% | 28.2 -0% | 28.3 -0% | 28 1% |
| Idle Minimum * (dB) | 28.2 | 30 -6% | 28.2 -0% | 32.8 -16% | 32.6 -16% | 33.5 -19% | 28 1% |
| Idle Average * (dB) | 28.5 | 32 -12% | 28.2 1% | 32.8 -15% | 32.7 -15% | 33.6 -18% | 28.4 -0% |
| Idle Maximum * (dB) | 30 | 34 -13% | 31 -3% | 32.8 -9% | 32.7 -9% | 35 -17% | 32.9 -10% |
| Load Average * (dB) | 51.5 | 44 15% | 50.8 1% | 42.5 17% | 38.9 24% | 38 26% | 45 13% |
| Witcher 3 ultra * (dB) | 55.3 | 46 17% | 50.8 8% | 51.8 6% | 50 10% | 53.2 4% | |
| Load Maximum * (dB) | 55.3 | 47 15% | 50.8 8% | 47.5 14% | 64.1 -16% | 56.9 -3% | 53.2 4% |
* ... smaller is better
Noise level
| Idle |
| 28.2 / 28.5 / 30 dB(A) |
| Load |
| 51.5 / 55.3 dB(A) |
 | ||
30 dB silent 40 dB(A) audible 50 dB(A) loud |
||
min: | ||
Temperature
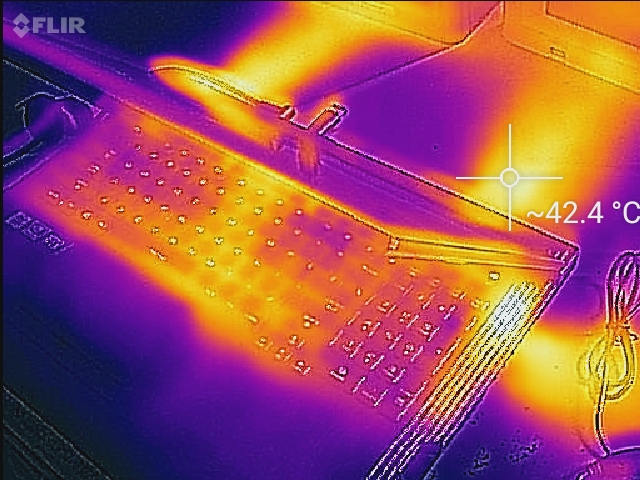
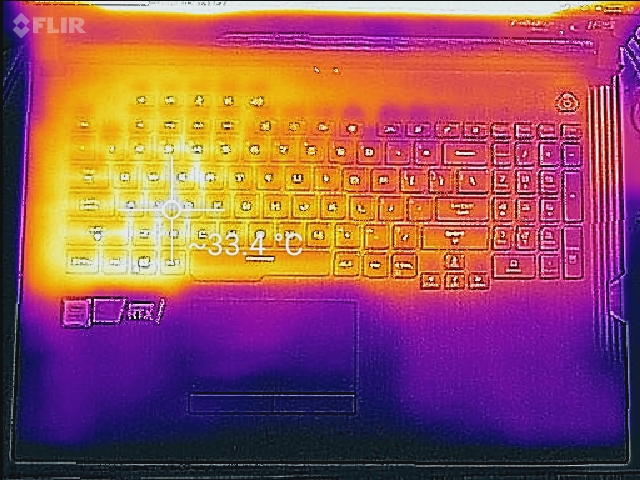
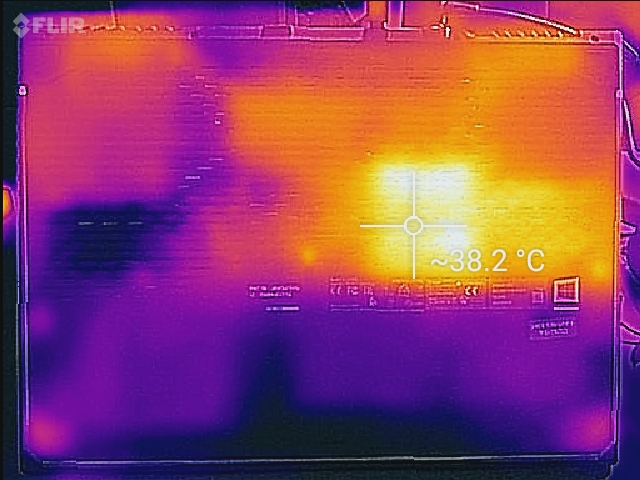
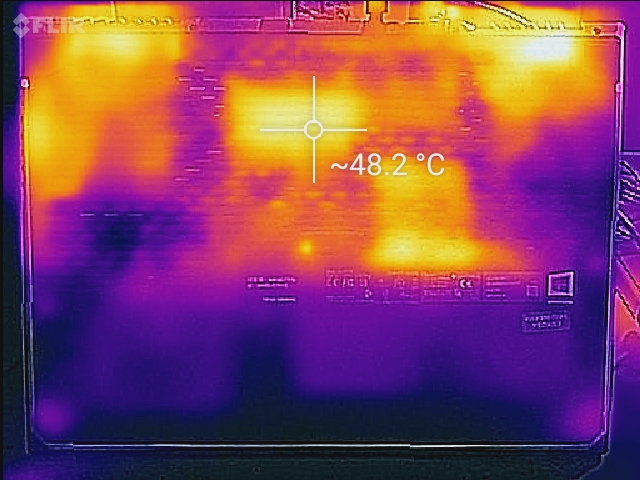
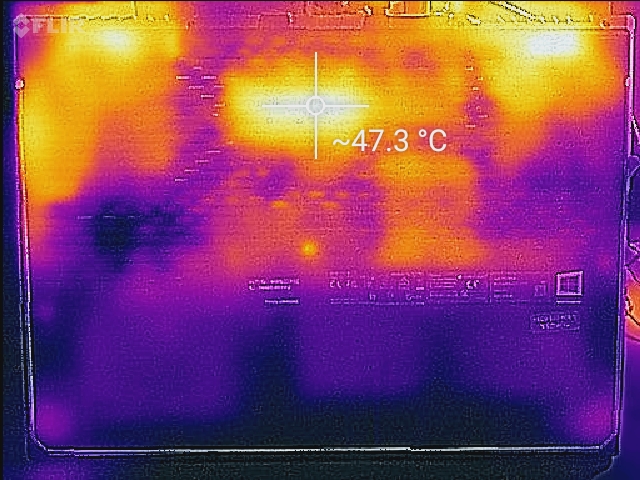
Due to the powerful components held within its chassis, the G731GW gets toasty under load. However, the cooling system does a good job at directing heat away from the parts of the machine where users' hands rest. The keyboard grows warm under load (particularly the middle), but the WASD keys never get uncomfortable. The bottom gets hot along the top edge, so we recommend using the machine on a flat surface with plenty of clear room for the rear and side ventilation.
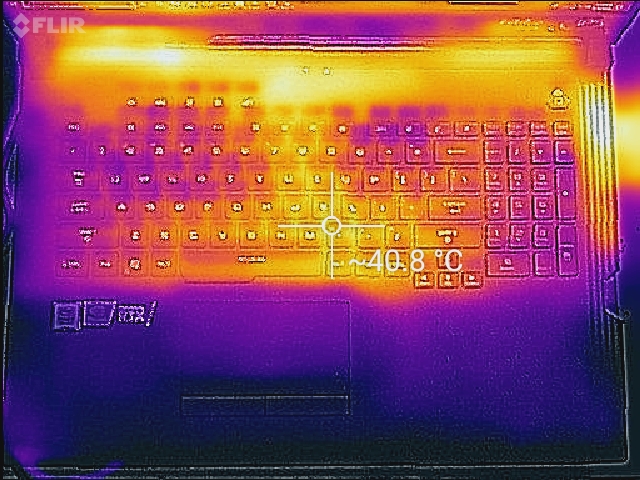
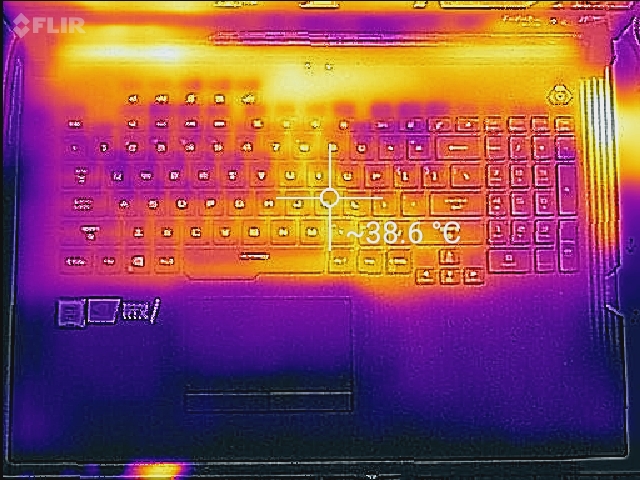
(-) The maximum temperature on the upper side is 45.2 °C / 113 F, compared to the average of 40.4 °C / 105 F, ranging from 21.2 to 68.8 °C for the class Gaming.
(-) The bottom heats up to a maximum of 52 °C / 126 F, compared to the average of 43.2 °C / 110 F
(+) In idle usage, the average temperature for the upper side is 29.1 °C / 84 F, compared to the device average of 33.9 °C / 93 F.
(±) Playing The Witcher 3, the average temperature for the upper side is 32.1 °C / 90 F, compared to the device average of 33.9 °C / 93 F.
(+) The palmrests and touchpad are cooler than skin temperature with a maximum of 26.8 °C / 80.2 F and are therefore cool to the touch.
(±) The average temperature of the palmrest area of similar devices was 28.8 °C / 83.8 F (+2 °C / 3.6 F).
Stress Test
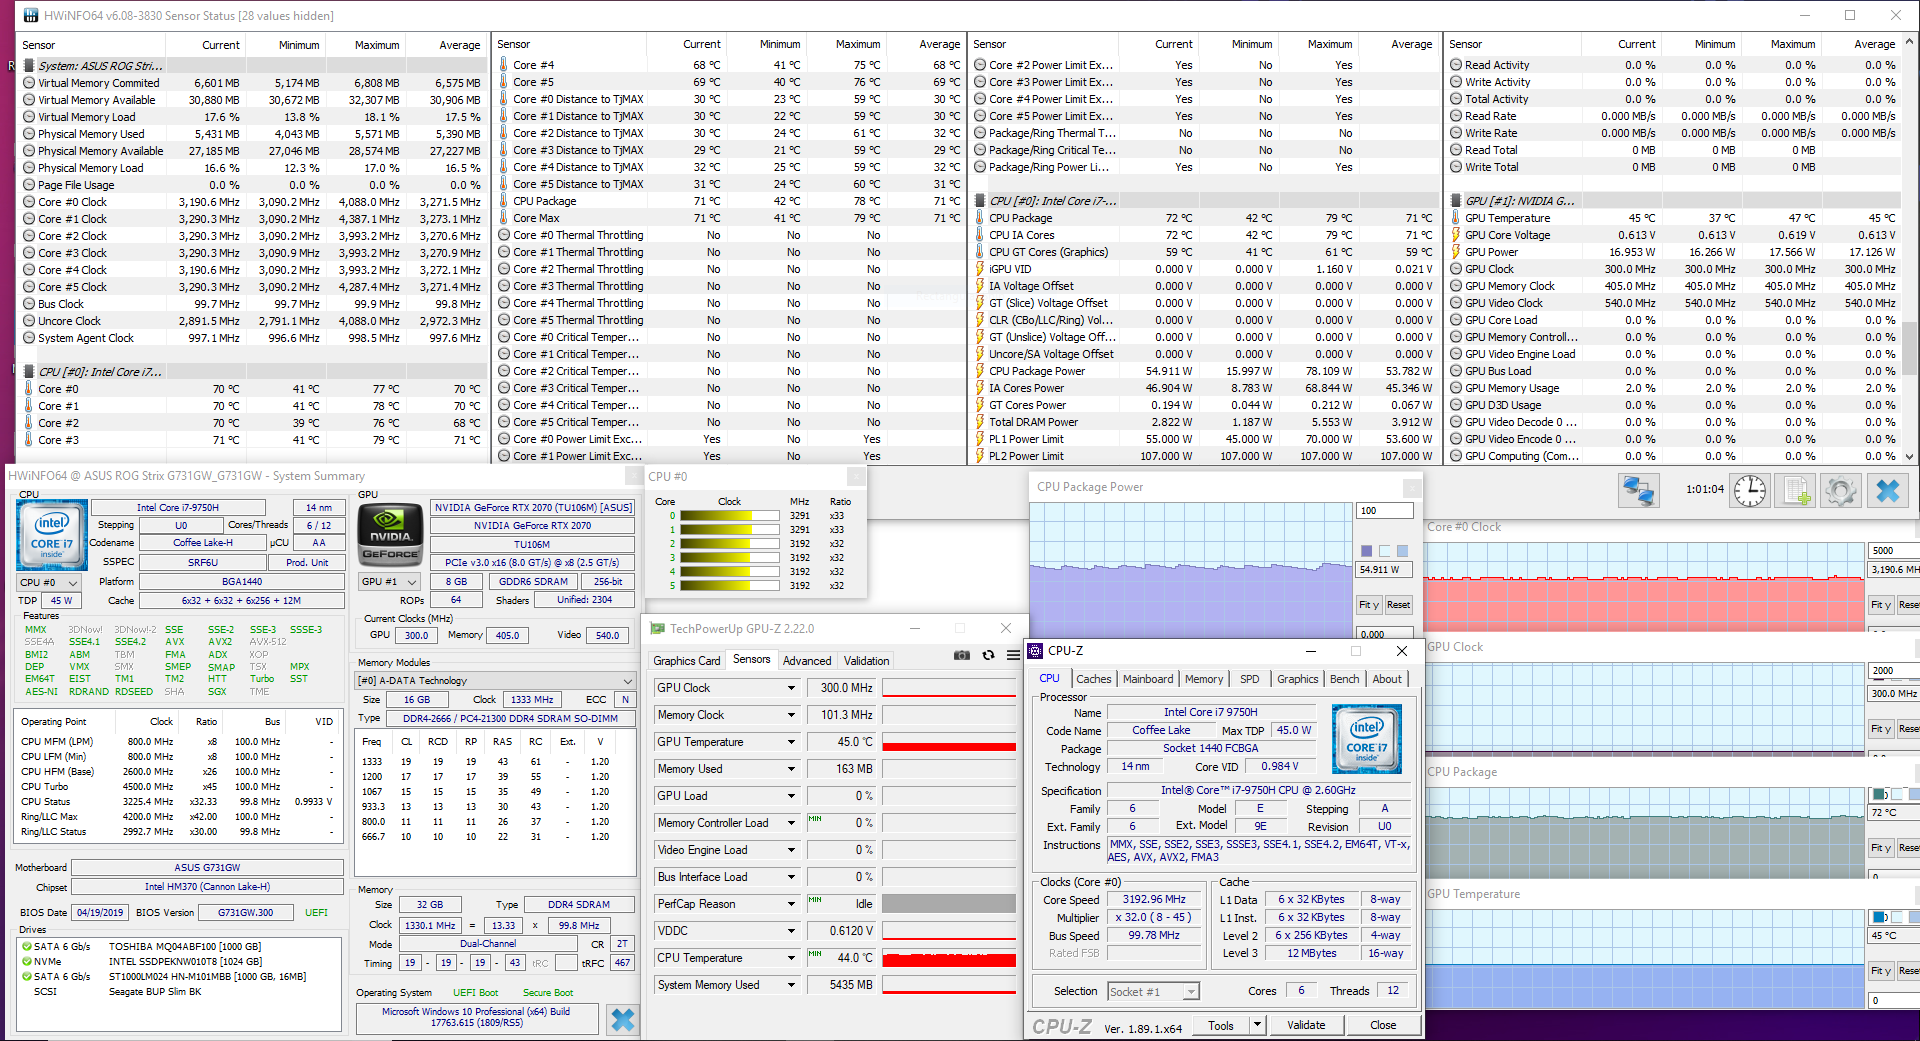
The G731GW handles stress well. During our dual stress test (which runs Prime95 and FurMark for an hour), CPU and GPU clocks bounce up and down with small intermittent spikes in performance. This is likely to keep temperatures in check; the CPU die averages 86° and the GPU sits at a relatively balmy 75°. There isn't much thermal headroom to push the hardware further, so Asus may have tuned the machine to throttle performance before thermal thresholds are approached. It's feasible that users could tease out more consistent performance by altering the default fan curves, but the machine does well regardless.
During long gaming sessions, the G731GW holds fairly steady. CPU and GPU temperatures stay within thermal tolerances, but the G731GW falls a bit behind its peers under load. Performance is below expectations even though the hardware is pushed fairly hard. (The sudden shift in the CPU and GPU clocks and temperatures at the end of the graphs is because we had to exiting the game in order to take a screenshot of these readings.)
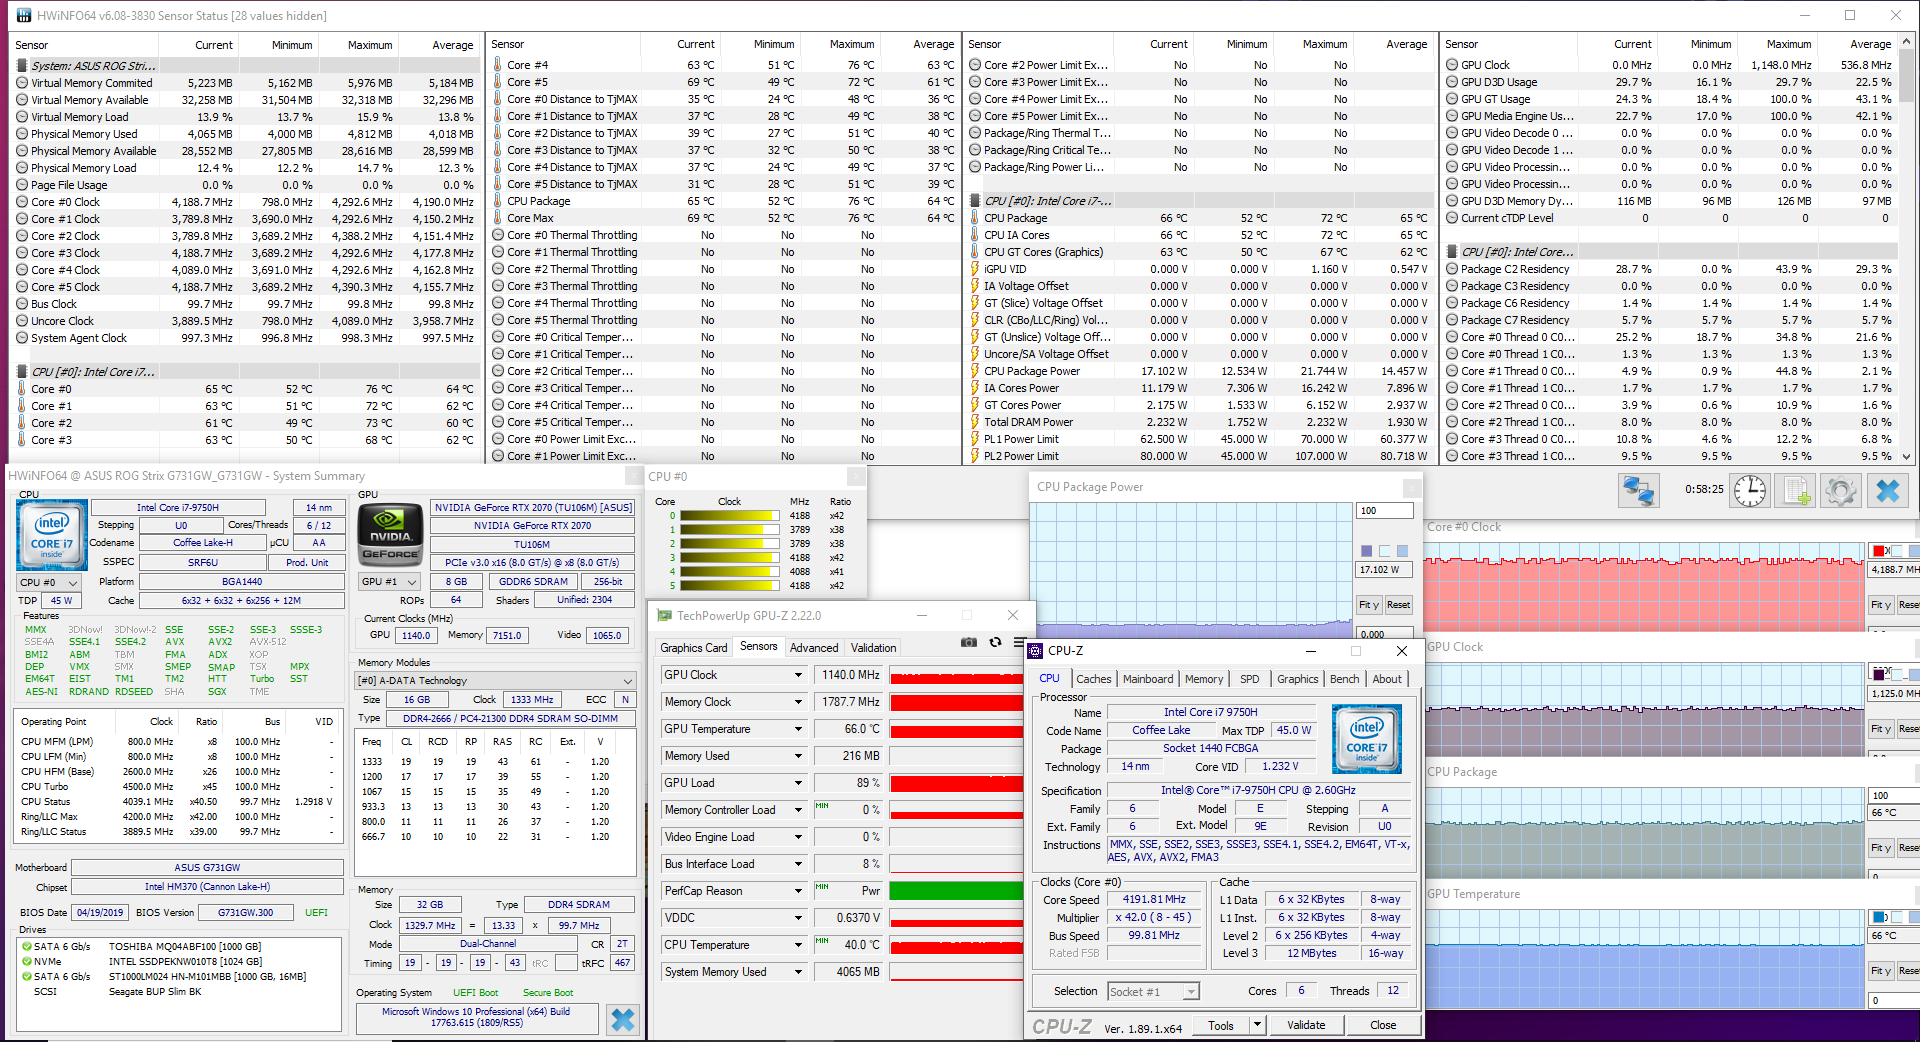
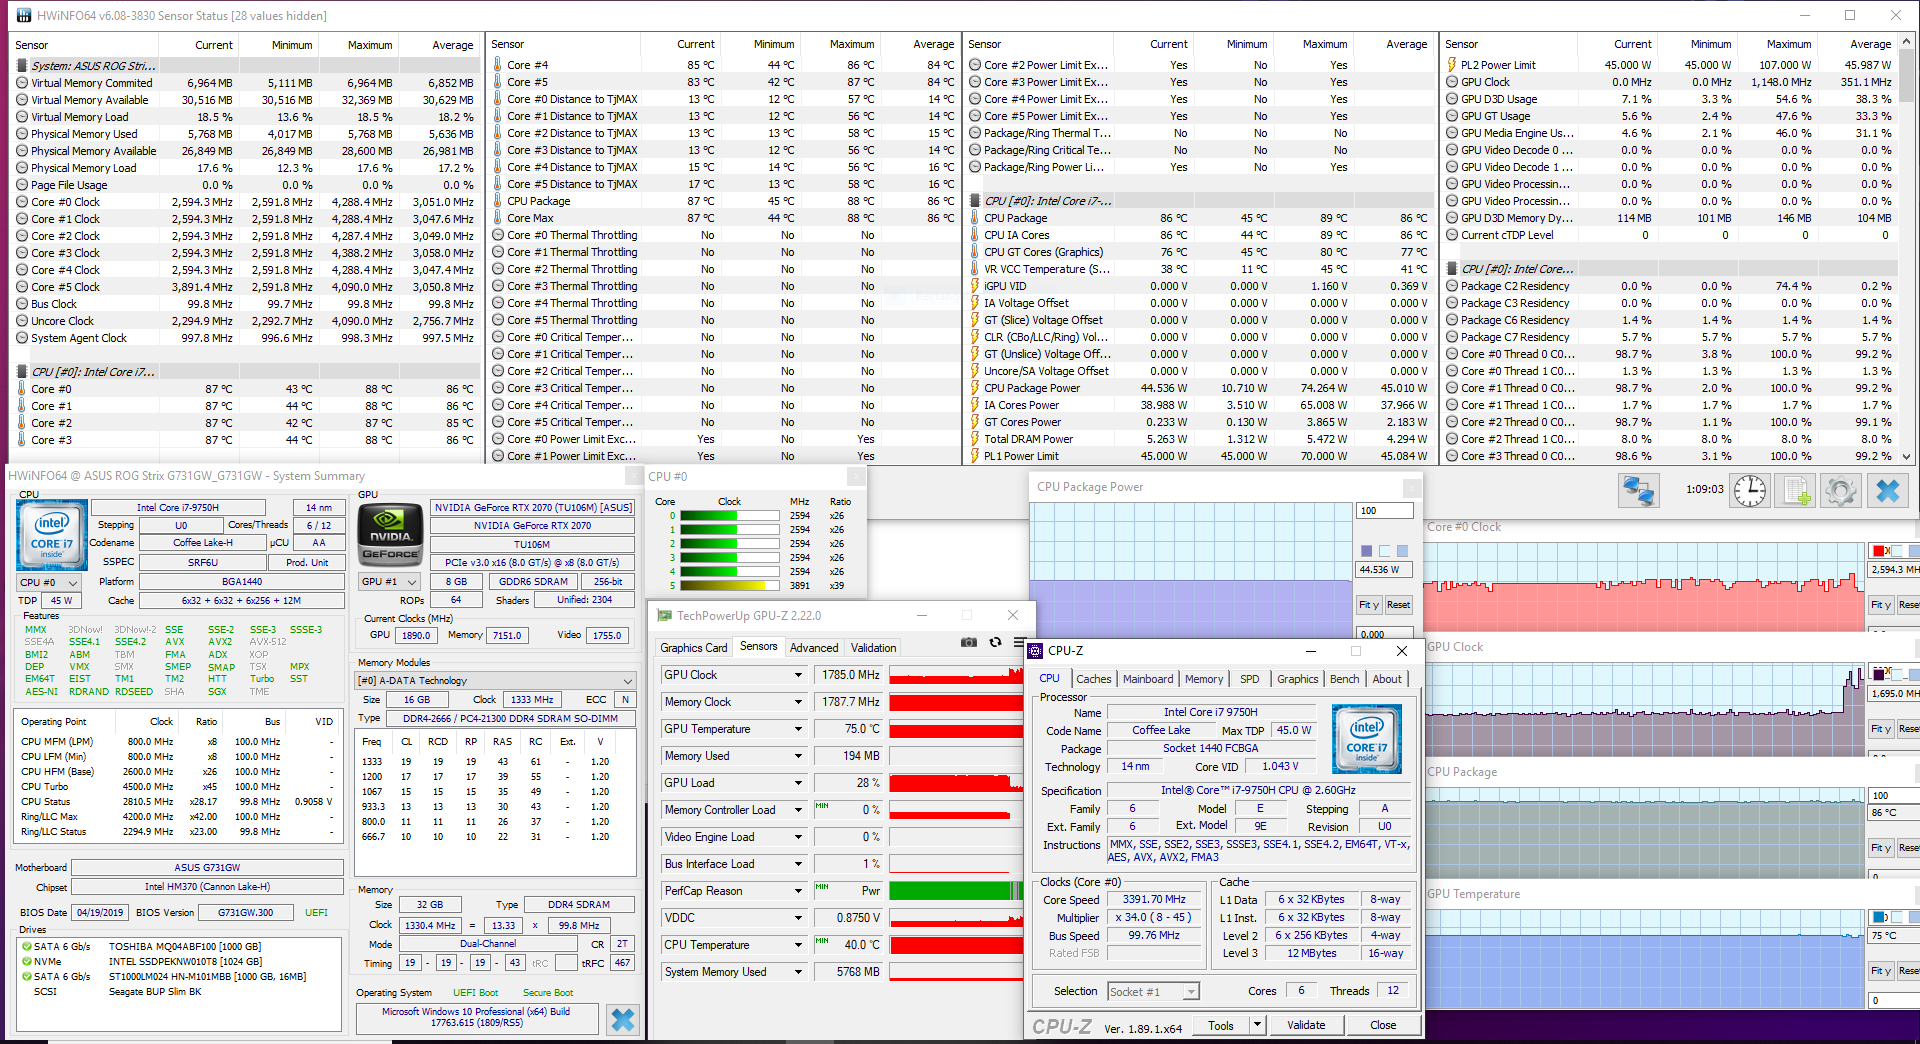
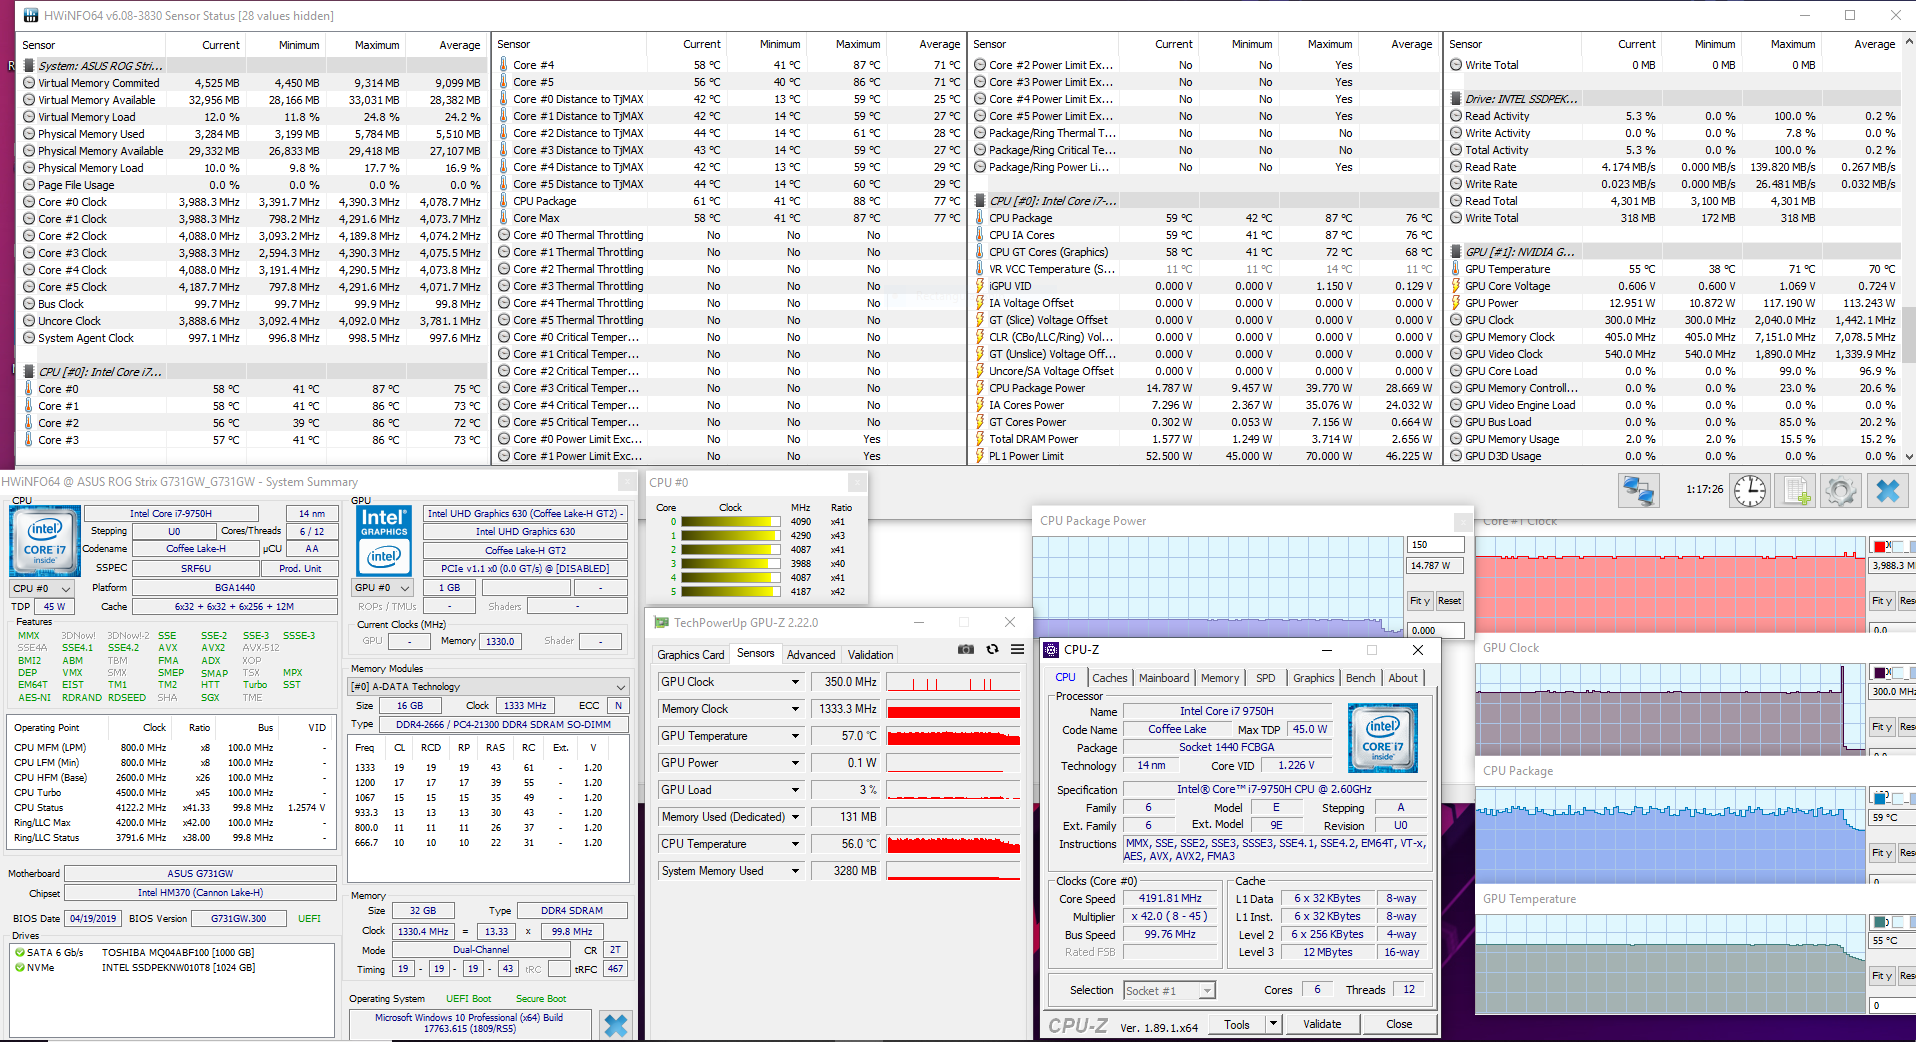
| CPU Clock (GHz) | GPU Clock (MHz) | Average CPU Temperature (°C) | Average GPU Temperature (°C) | |
| Prime95 Stress | 3.3 | - | 71 | - |
| FurMark Stress | 4.2 | 1125 | 64 | 66 |
| Prime95 + FurMark Stress | 3.0 | 1150 | 86 | 75 |
| Witcher 3 Stress | 4.1 | 1450 | 77 | 70 |
Speakers

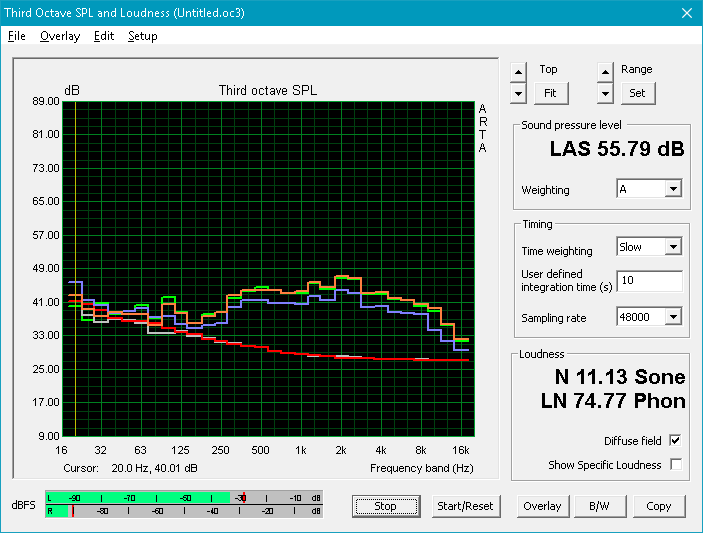
The speakers are excellent. Mids and highs are well-balanced, and southe nd remains clear at any volume level. The speakers get very loud (~85-90 dB) and media can be heard clearly across a room. Our one point of complaint lies with the lower registers. While bass is more present than in most other laptops, the inclusion of a subwoofer would go a long way in making the G731GW a brilliant media machine.
MSI GE75 8SF audio analysis
(+) | speakers can play relatively loud (89.3 dB)
Bass 100 - 315 Hz
(±) | reduced bass - on average 13.7% lower than median
(+) | bass is linear (6.8% delta to prev. frequency)
Mids 400 - 2000 Hz
(±) | reduced mids - on average 5.1% lower than median
(±) | linearity of mids is average (7.4% delta to prev. frequency)
Highs 2 - 16 kHz
(+) | balanced highs - only 3.3% away from median
(+) | highs are linear (6.4% delta to prev. frequency)
Overall 100 - 16.000 Hz
(±) | linearity of overall sound is average (16.2% difference to median)
Compared to same class
» 40% of all tested devices in this class were better, 7% similar, 54% worse
» The best had a delta of 6%, average was 18%, worst was 132%
Compared to all devices tested
» 26% of all tested devices were better, 6% similar, 68% worse
» The best had a delta of 4%, average was 24%, worst was 134%
Alienware m17 P37E audio analysis
(±) | speaker loudness is average but good (80.4 dB)
Bass 100 - 315 Hz
(±) | reduced bass - on average 11.4% lower than median
(±) | linearity of bass is average (12.4% delta to prev. frequency)
Mids 400 - 2000 Hz
(+) | balanced mids - only 3% away from median
(+) | mids are linear (6.1% delta to prev. frequency)
Highs 2 - 16 kHz
(+) | balanced highs - only 4.3% away from median
(+) | highs are linear (5.2% delta to prev. frequency)
Overall 100 - 16.000 Hz
(+) | overall sound is linear (13.8% difference to median)
Compared to same class
» 21% of all tested devices in this class were better, 7% similar, 72% worse
» The best had a delta of 6%, average was 18%, worst was 132%
Compared to all devices tested
» 15% of all tested devices were better, 4% similar, 81% worse
» The best had a delta of 4%, average was 24%, worst was 134%
Energy Management
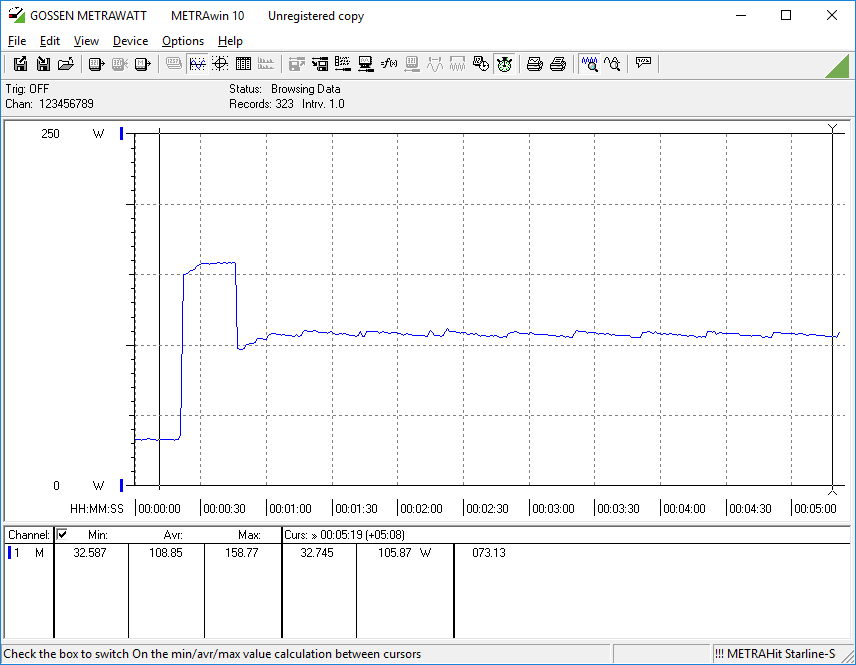
Power Consumption
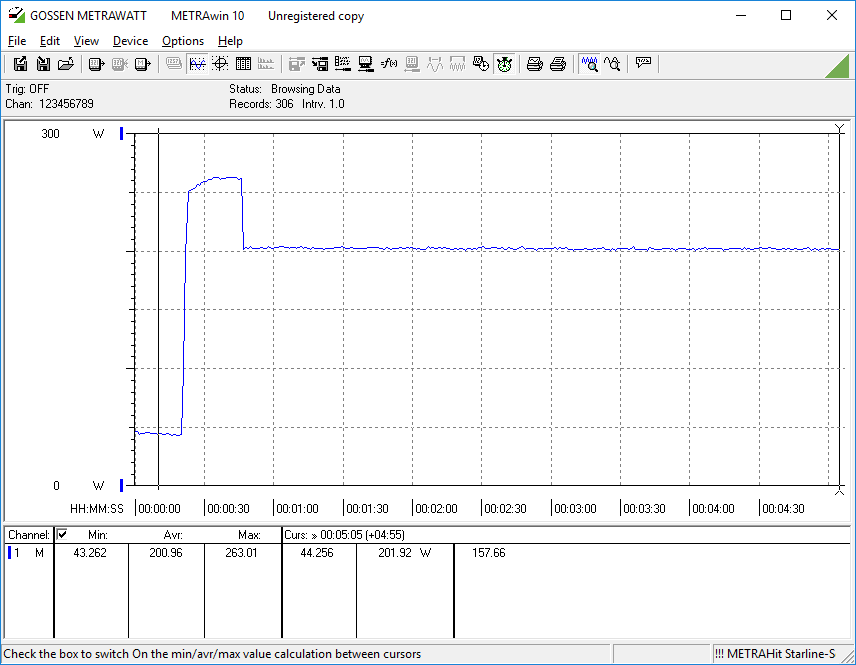
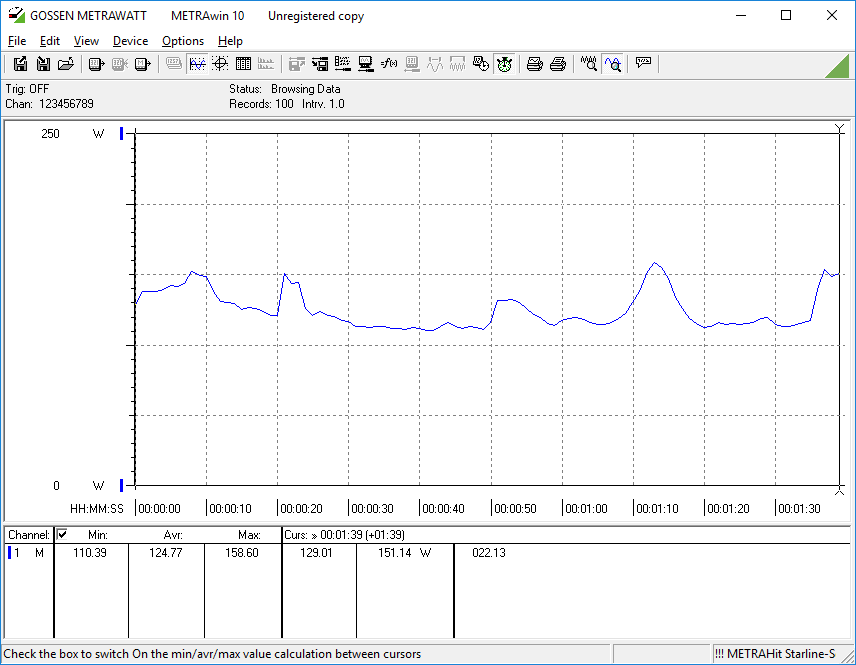
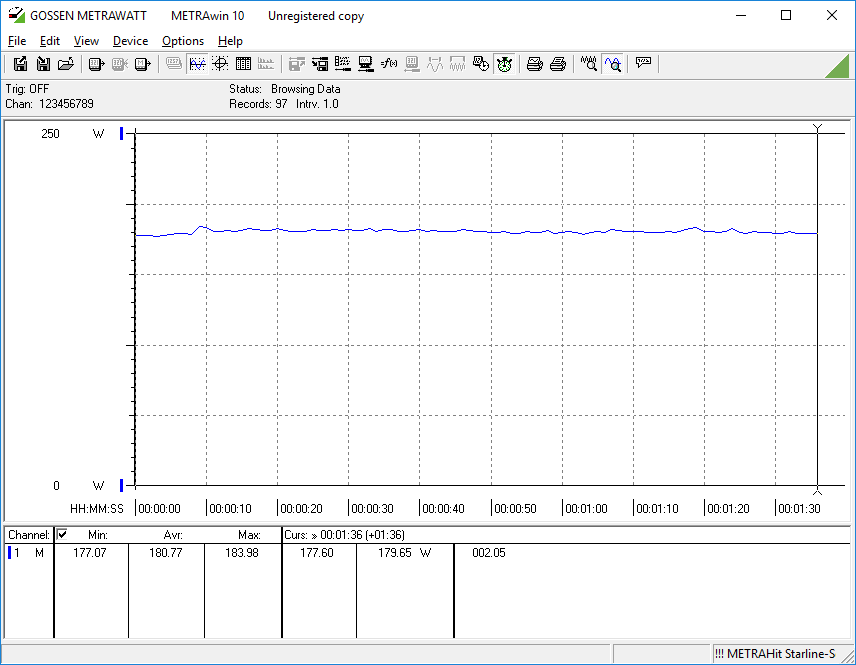
Power draw is in line with other high-end gaming laptops when the machine is doing light work. Under load, the G731GW pulls about 30-35 Watts more than competing gaming laptops, possibly to power all the RGB lighting and the 144 Hz display. We measure a brief spike of 263 Watts at the beginning of our stress tests, which is higher than the 230 Watt rating of the power adapter, but this quickly comes down. While gaming, the G731GW pulls about as much power as is to be expected from a premium 17-inch gaming laptop.
| Off / Standby | |
| Idle | |
| Load |
|
Key:
min: | |
| Asus ASUS ROG Strix SCAR III G731GW-XB74 i7-9750H, GeForce RTX 2070 Mobile, Intel SSD 660p 1TB SSDPEKNW010T8, IPS, 1920x1080, 17.3" | Acer Predator Triton 500 i7-8750H, GeForce RTX 2080 Max-Q, 2x WDC PC SN720 SDAPNTW-256G-1014 (RAID 0), IPS, 1920x1080, 15.6" | Alienware m17 P37E i9-8950HK, GeForce RTX 2080 Max-Q, SK Hynix PC401 512GB M.2 (HFS512GD9TNG), IPS, 3840x2160, 17.3" | HP Omen 15-dc1303ng i7-8750H, GeForce RTX 2070 Max-Q, Samsung SSD PM981 MZVLB256HAHQ, IPS, 1920x1080, 15.6" | Aorus 15 X9 i7-8750H, GeForce RTX 2070 Mobile, Intel SSD 760p SSDPEKKW512G8, IPS, 1920x1080, 15.6" | MSI GE75 8SF i7-8750H, GeForce RTX 2070 Mobile, Kingston RBUSNS8154P3256GJ1, IPS, 1920x1080, 17.3" | Eurocom Nightsky RX17 i7-9750H, GeForce RTX 2070 Mobile, 2x Samsung SSD 970 Pro 512GB (RAID 0), IPS, 1920x1080, 17.3" | |
|---|---|---|---|---|---|---|---|
| Power Consumption | 17% | -6% | 30% | -7% | 11% | 11% | |
| Idle Minimum * (Watt) | 18.2 | 16 12% | 21.2 -16% | 14.7 19% | 26 -43% | 16.4 10% | 18.6 -2% |
| Idle Average * (Watt) | 23 | 22 4% | 29.6 -29% | 18.6 19% | 30.8 -34% | 21.9 5% | 22.6 2% |
| Idle Maximum * (Watt) | 33.1 | 32 3% | 34 -3% | 22.6 32% | 34.9 -5% | 25.4 23% | 23 31% |
| Load Average * (Watt) | 124.8 | 89 29% | 130.9 -5% | 90 28% | 90.7 27% | 90.7 27% | 93.4 25% |
| Witcher 3 ultra * (Watt) | 180.8 | 147 19% | 177.5 2% | 175 3% | 203.3 -12% | 186.4 -3% | |
| Load Maximum * (Watt) | 263 | 173 34% | 219.7 16% | 120 54% | 241.2 8% | 222.9 15% | 233.6 11% |
* ... smaller is better
Battery Life
Gaming laptops aren't known for their battery life, and that remains the case with the G731GW. The laptop lasts just shy of 4 hours in our WiFi v1.3 battery test (screen at 250 nits, Balanced power profile, loading a new webpage every 30-40 seconds). Users should be able to get a bit of office work done while out and about. The large (16.5 x 7.6 x 3.2 cm) power adapter will need to be packed for gaming sessions; the G731GW lasts less than an hour and a half under load.
| Asus ASUS ROG Strix SCAR III G731GW-XB74 i7-9750H, GeForce RTX 2070 Mobile, 66 Wh | Acer Predator Triton 500 i7-8750H, GeForce RTX 2080 Max-Q, 82 Wh | Alienware m17 P37E i9-8950HK, GeForce RTX 2080 Max-Q, 90 Wh | HP Omen 15-dc1303ng i7-8750H, GeForce RTX 2070 Max-Q, 70 Wh | Aorus 15 X9 i7-8750H, GeForce RTX 2070 Mobile, 62 Wh | MSI GE75 8SF i7-8750H, GeForce RTX 2070 Mobile, 65 Wh | Eurocom Nightsky RX17 i7-9750H, GeForce RTX 2070 Mobile, 62 Wh | |
|---|---|---|---|---|---|---|---|
| Battery runtime | 5% | 33% | -3% | -48% | -10% | -21% | |
| Reader / Idle (h) | 4.2 | 5.6 33% | 9.1 117% | 5 19% | 1.8 -57% | 4.2 0% | |
| WiFi v1.3 (h) | 3.9 | 3.2 -18% | 4.9 26% | 3.3 -15% | 1.6 -59% | 3.5 -10% | 2 -49% |
| Load (h) | 1.4 | 1.4 0% | 0.8 -43% | 1.2 -14% | 1 -29% | 1.2 -14% |
Pros
Cons
Verdict

The old saying goes that beauty is only skin deep. Asus has added a lot of flair to the exterior of the G731GW but seems to have forgotten about some factors that make a gaming laptop great. In particular, the odd port placement and annoying maintenance process leave a bad taste after an otherwise delightful dish.
The G731GW gets a lot of things right. It's 144 Hz display is one of the best we have seen in gaming laptops, and its keyboard feels excellent and offers a quick response. Likewise, gaming performance is great; most games will glide across the high-refresh rate panel thanks to the powerful GeForce RTX 2070 and Core i7-9750H.
However, there are many small annoyances potential buyers should consider. The RGB logo and bottom RGB strip cannot be turned off without disabling the keyboard backlight. All USB ports are on the left side of the machine, which makes routing a mouse cable cumbersome. The RGB ribbon cables make opening the device for upgrades a lesson in caution. Lastly, overall performance is a hair behind competing laptops, particularly the Eurocom Nightsky RX17.
All said, the Asus G731GW flirts with greatness but is held back by a sum of minor flaws. However, considering the relatively low price tag compared to other high-end gaming laptop ($2000, ~$2325 as configured), these small annoyances may be worth the savings.
Asus ASUS ROG Strix SCAR III G731GW-XB74
- 09/20/2019 v7 (old)
Sam Medley
Price comparison
