ZenBook on Steroids: Asus ZenBook Pro Duo UX581 Laptop Review
At Computex 2018, everyone thought Asus was crazy for turning the traditional clickpad into a full-fledged 1080p touchscreen. Turns out, that was just step 1 for an even crazier master plan.
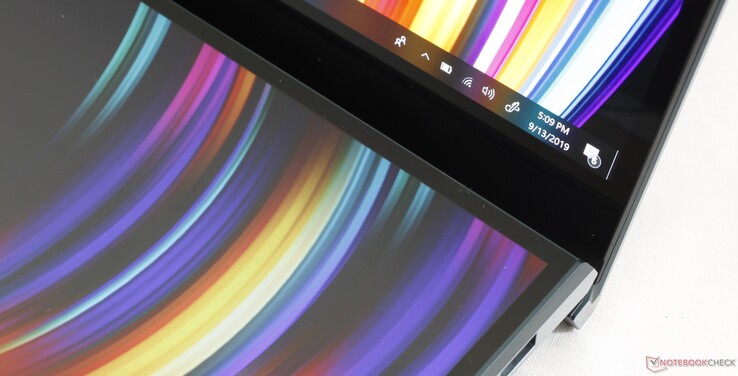
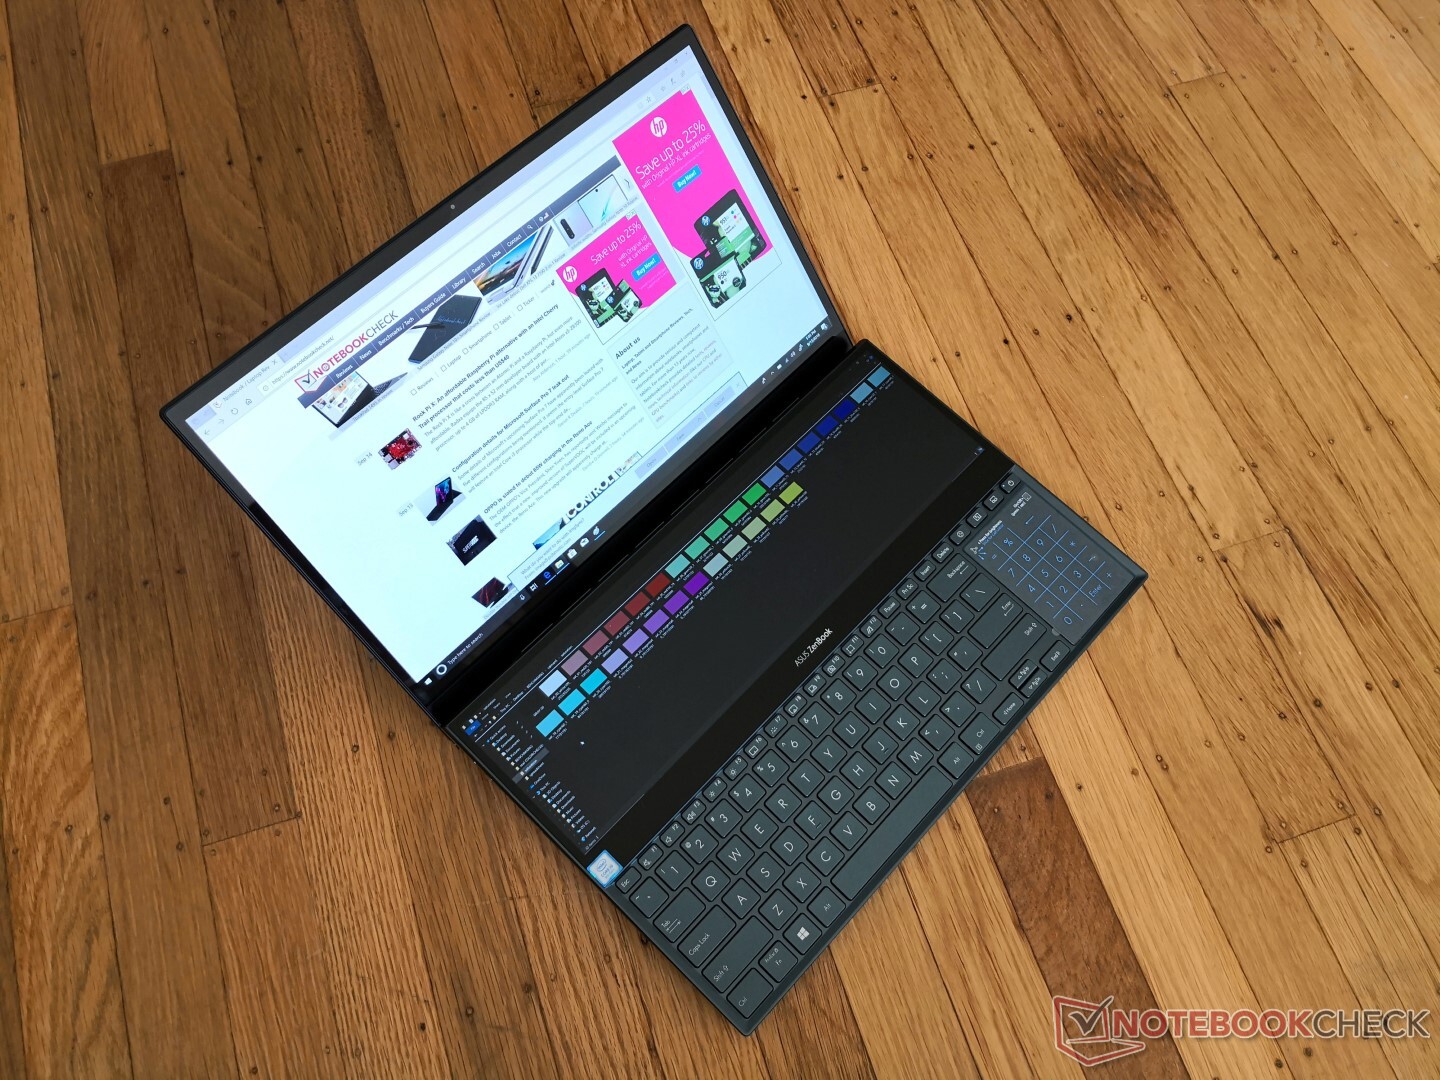
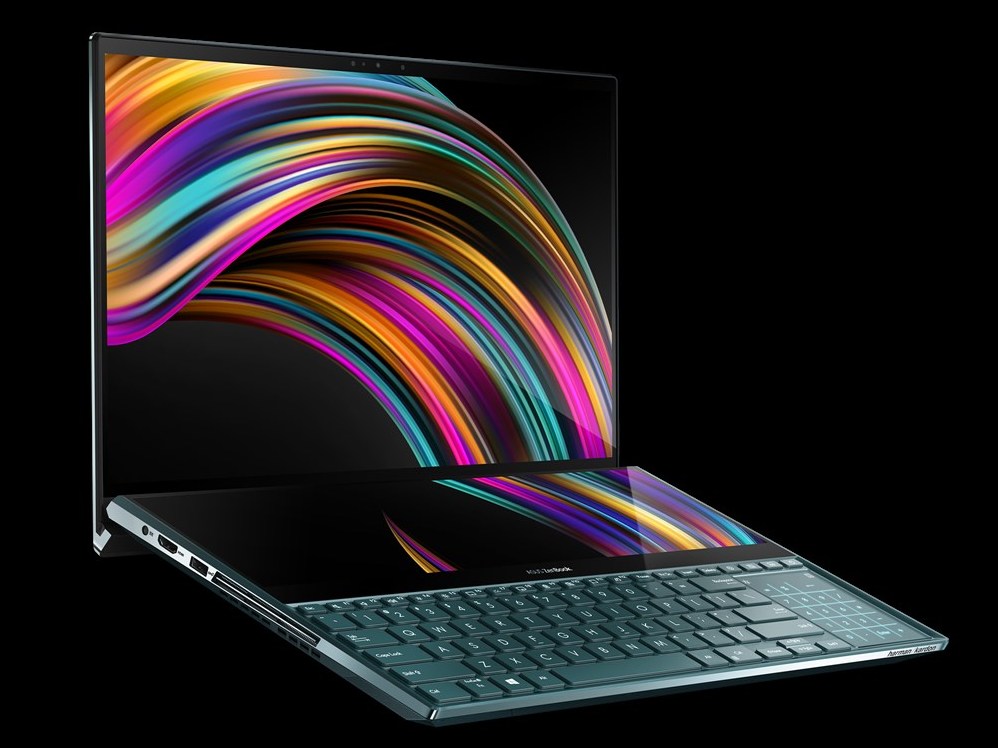
The ZenBook Pro Duo UX581 succeeds last year's ZenBook Pro 15 UX580 by integrating an even larger secondary touchscreen to accompany the main display. Unlike their predecessor, the two screens here are physically closer to one another, have the same screen width, and the same PPI for a truer 1:1 dual screen experience. The changes directly address many of our complaints about ScreenPad 1.0 on last year's UX580.
Aside from the obvious visual differences, internal specifications have also had a generational upgrade. The 8th gen Core i9 CPU and Nvidia Pascal GPU of the UX580 have been updated to the 9th gen Core i9 CPU and Nvidia RTX Turing GPU for the UX581-XB94T as described here. A less expensive UX581GV-XB74T SKU is also available with the Core i7 instead, but all configurations come with the same 4K screens and RTX 2060 GPU. Add up all these high-end components with the unique double 4K display design and you have a laptop retailing for $2500 to $3000 USD.
Competitors to the ZenBook Pro Duo 15 UX581 include other high-end 15.6-inch laptops like the MSI GT63, Razer Blade 15, or HP Omen X 2S 15. While Asus is marketing the system more for content creators and heavy multimedia users rather than gamers, comparisons to dedicated gaming laptops will be inevitable. No other laptop is available as of this writing with the same display features of the UX581 to make this Asus a one-of-a-kind laptop for now.
Purchase the Asus ZenBook Pro Duo 15 UX581GV on Amazon here.
More Asus reviews:
Case
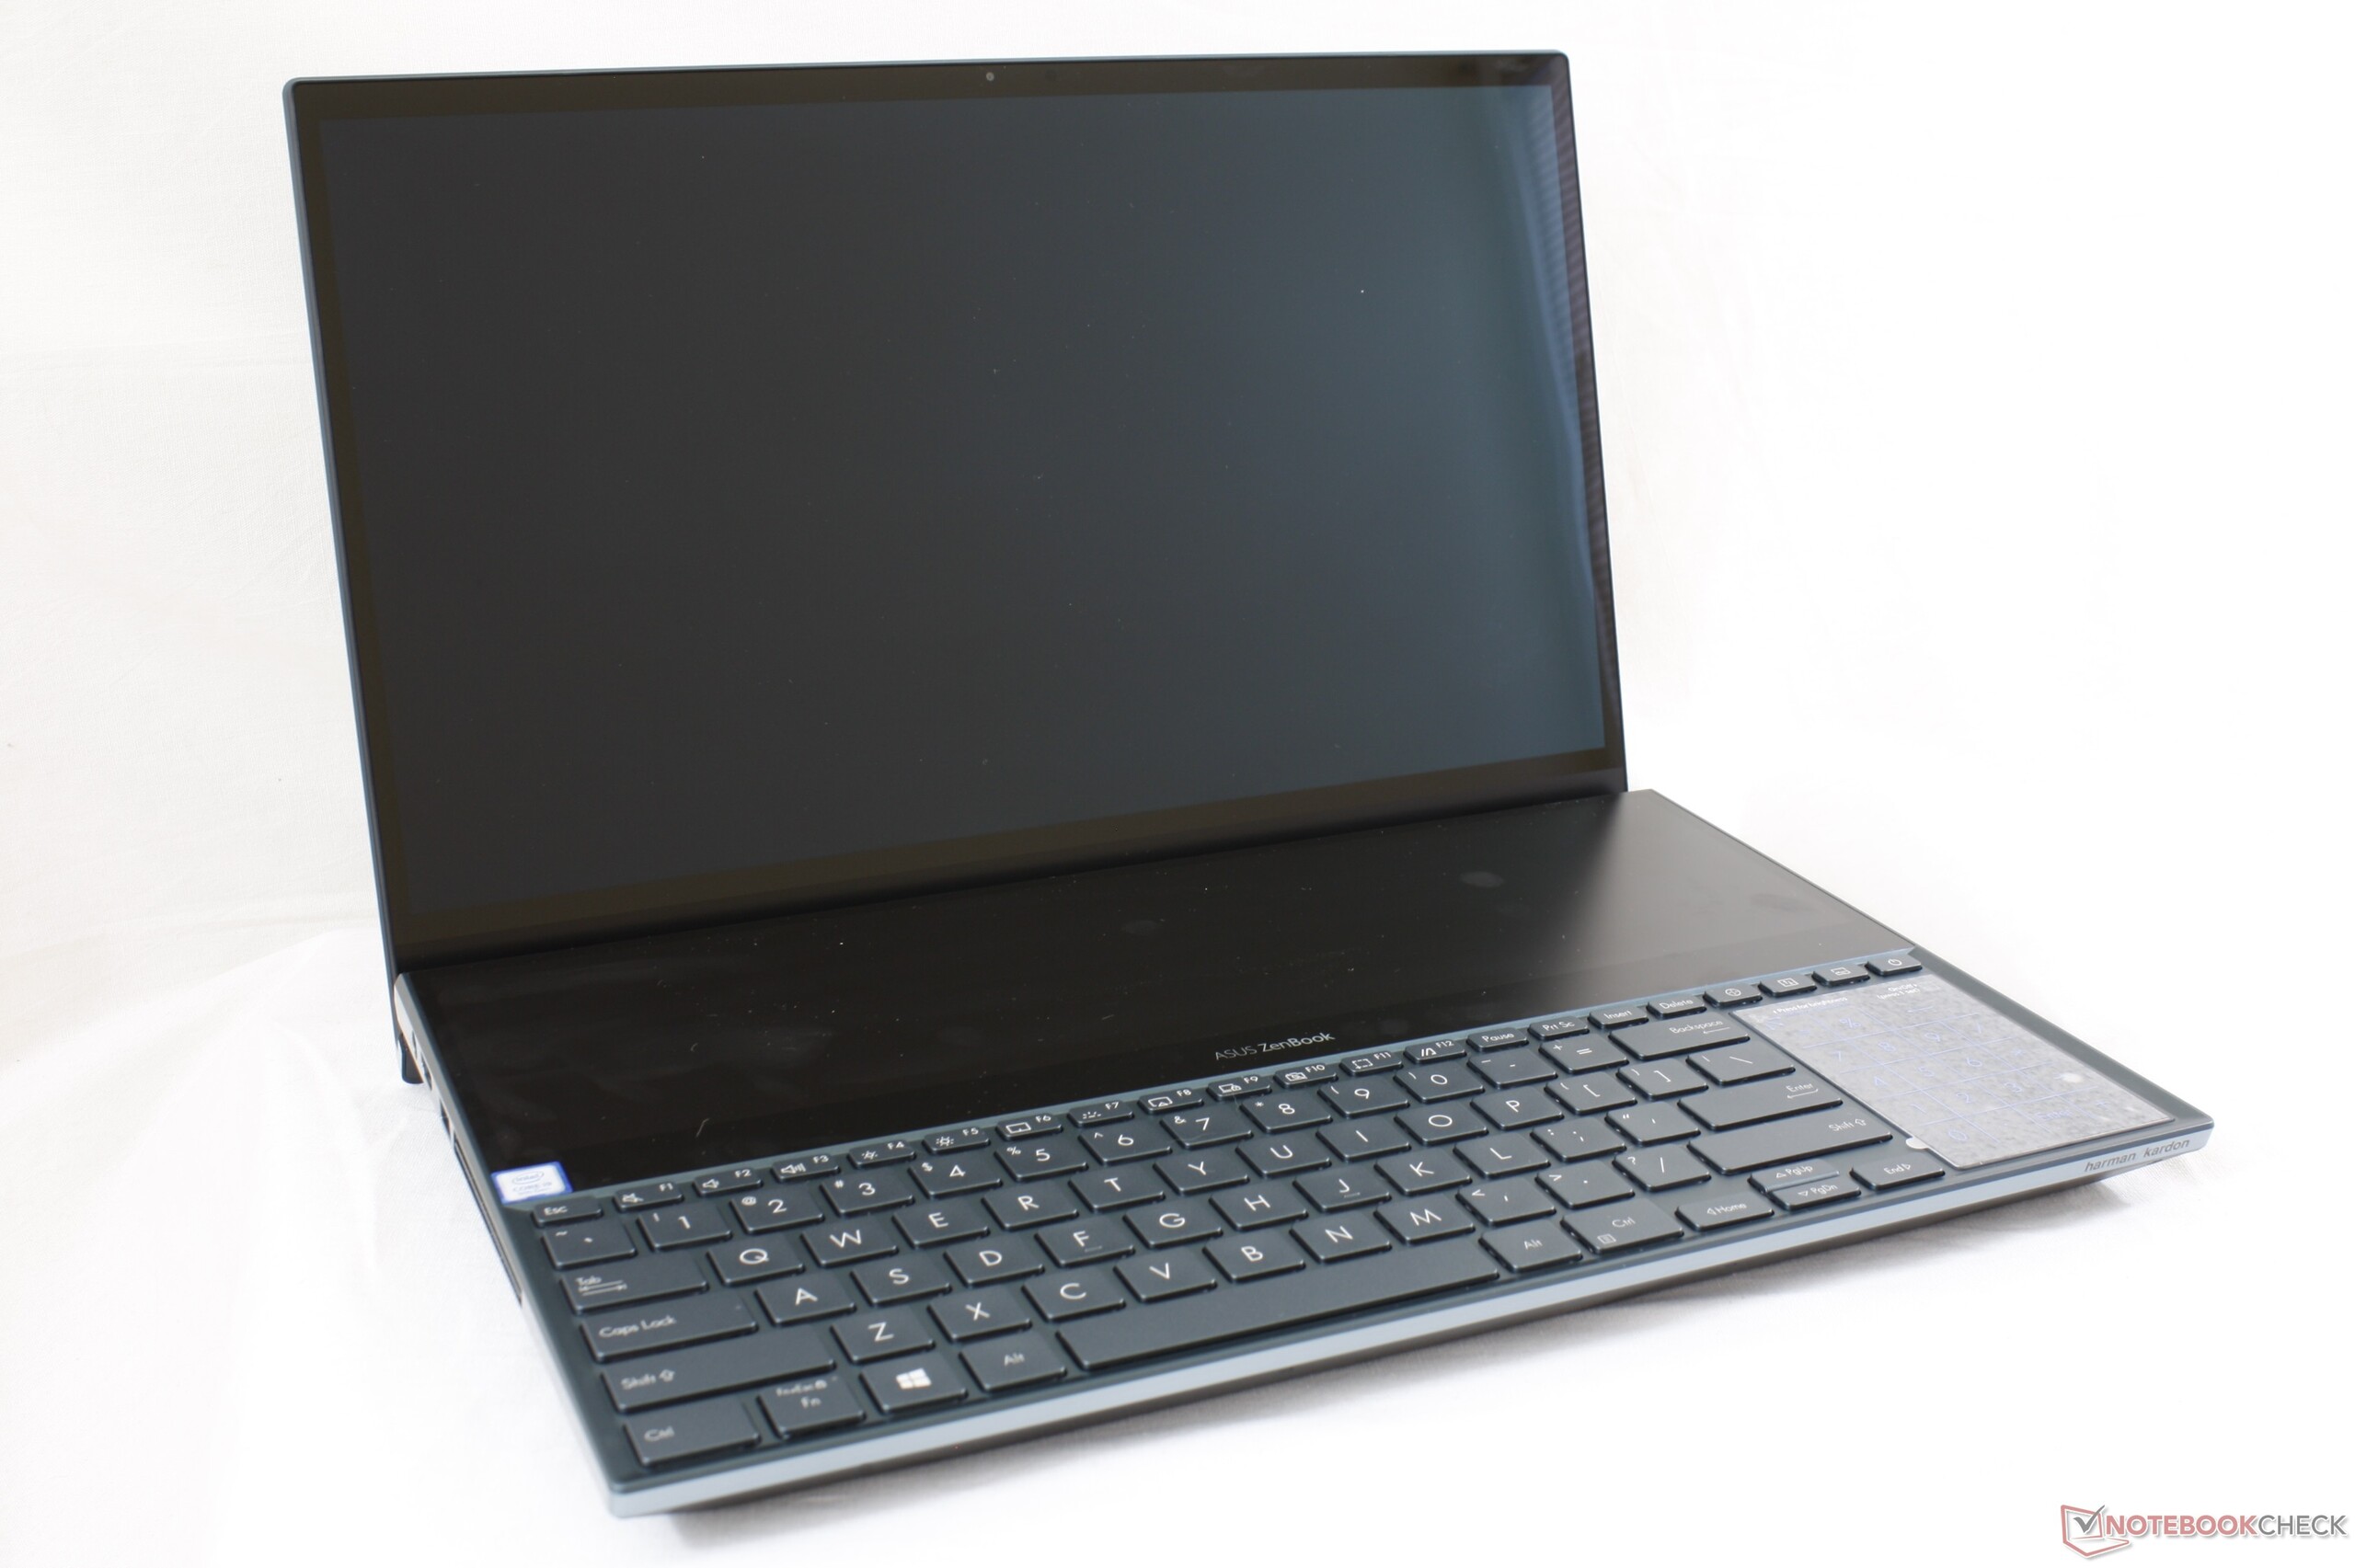
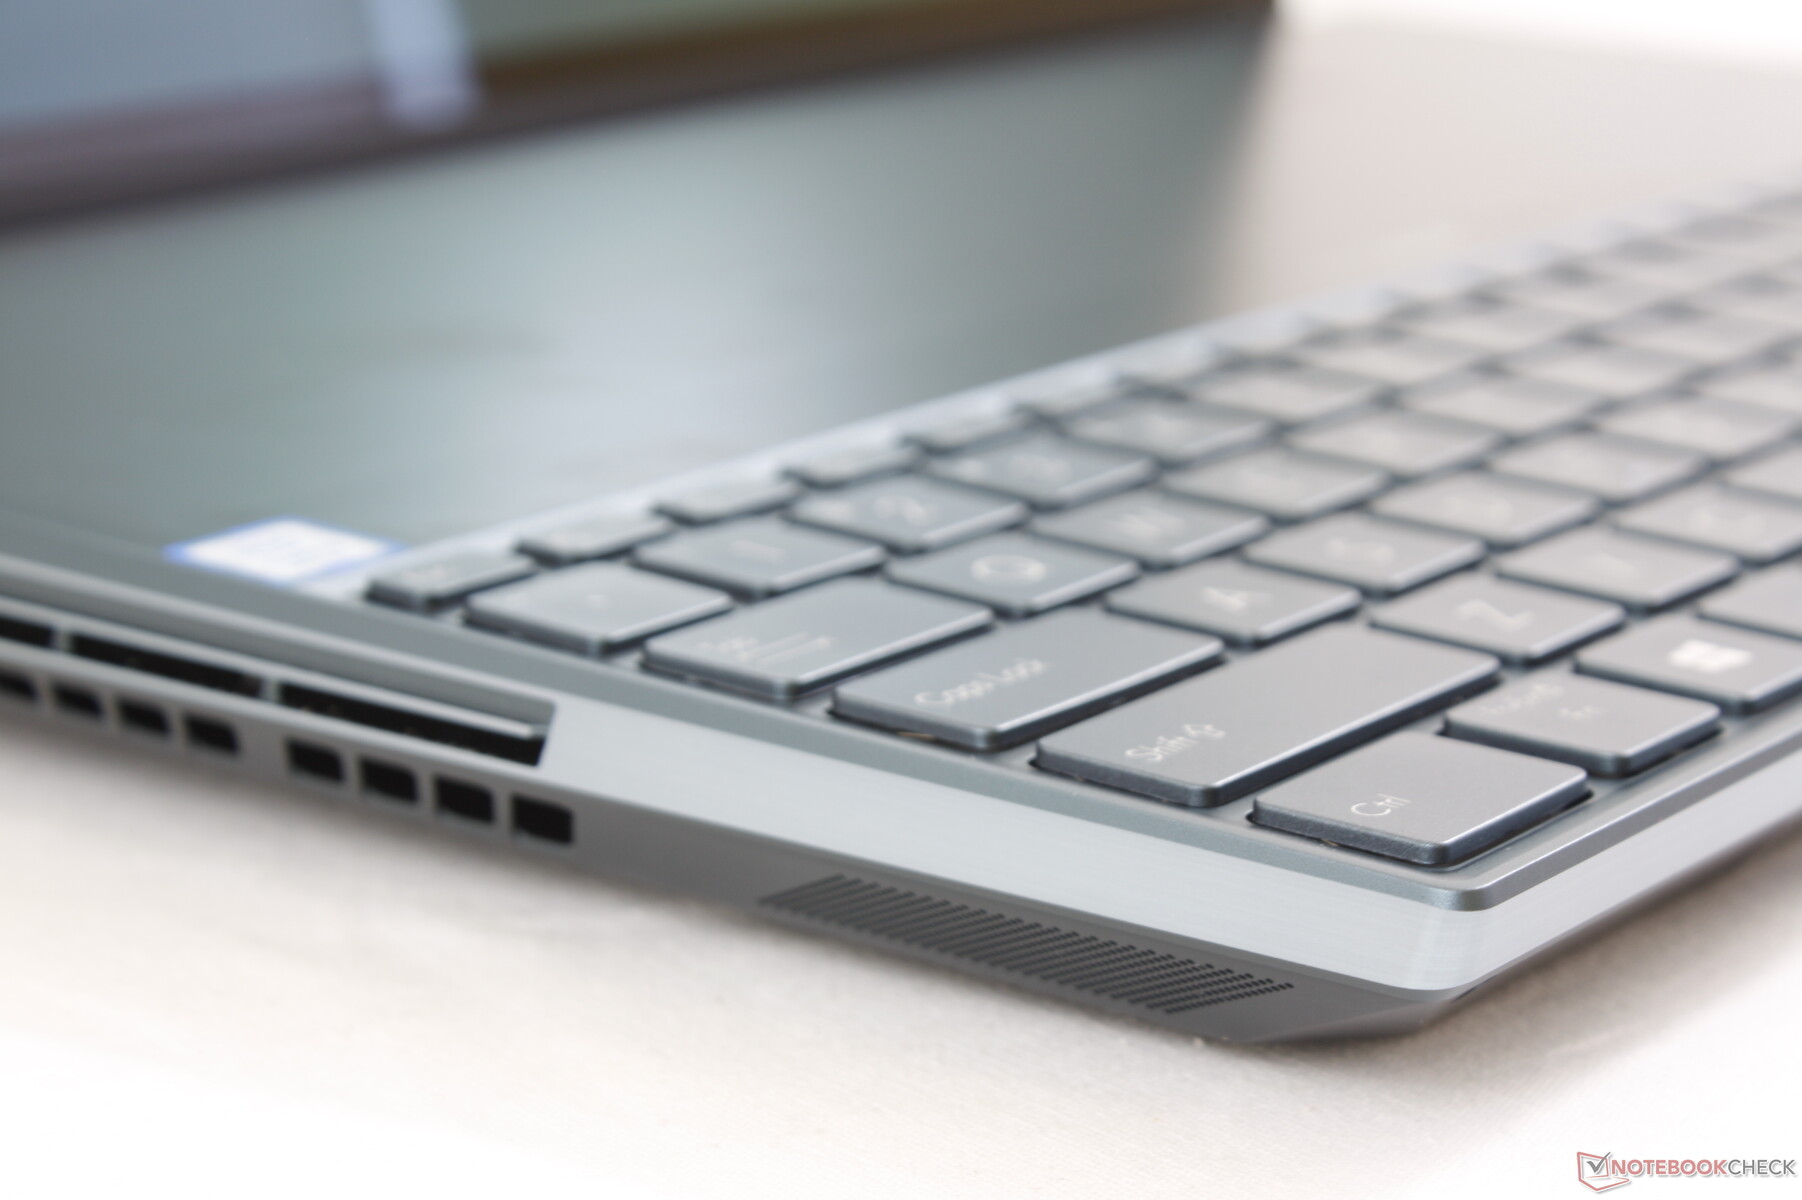
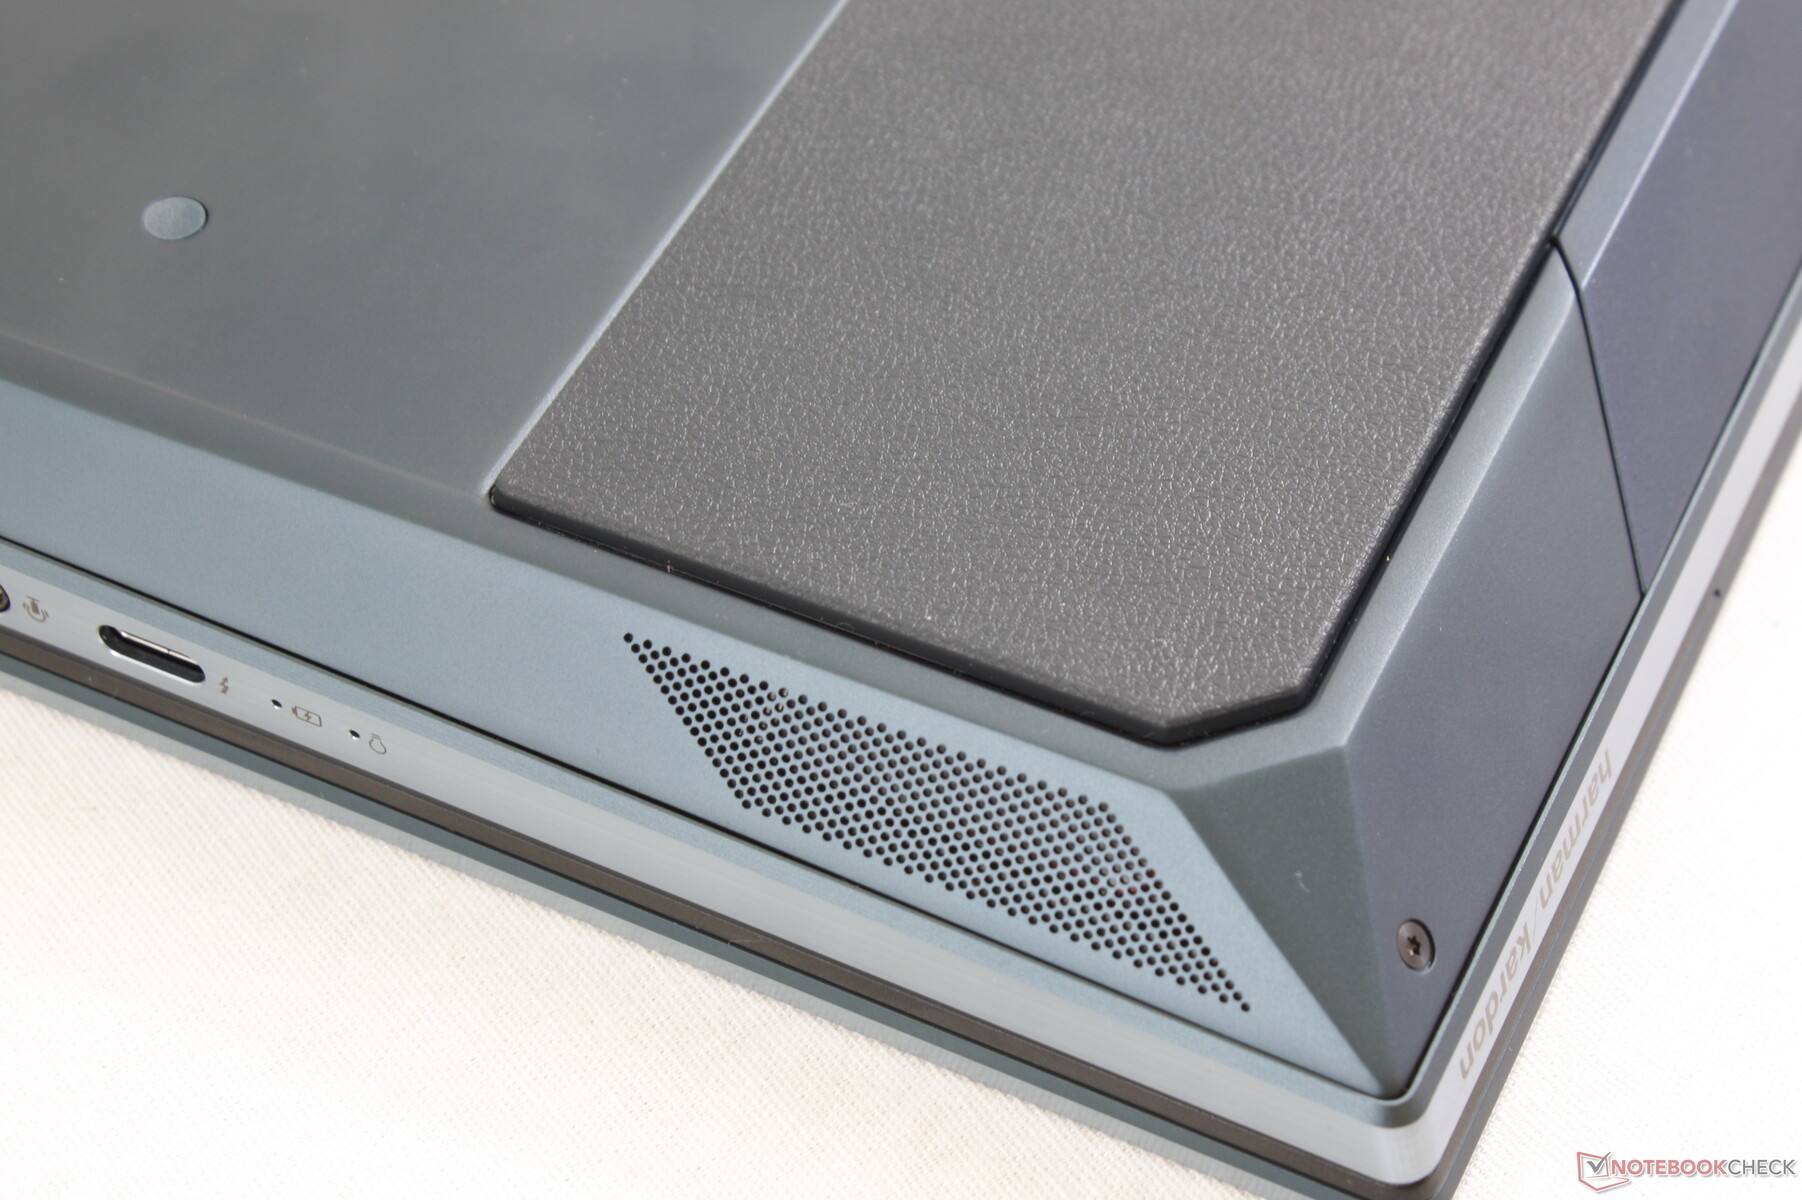
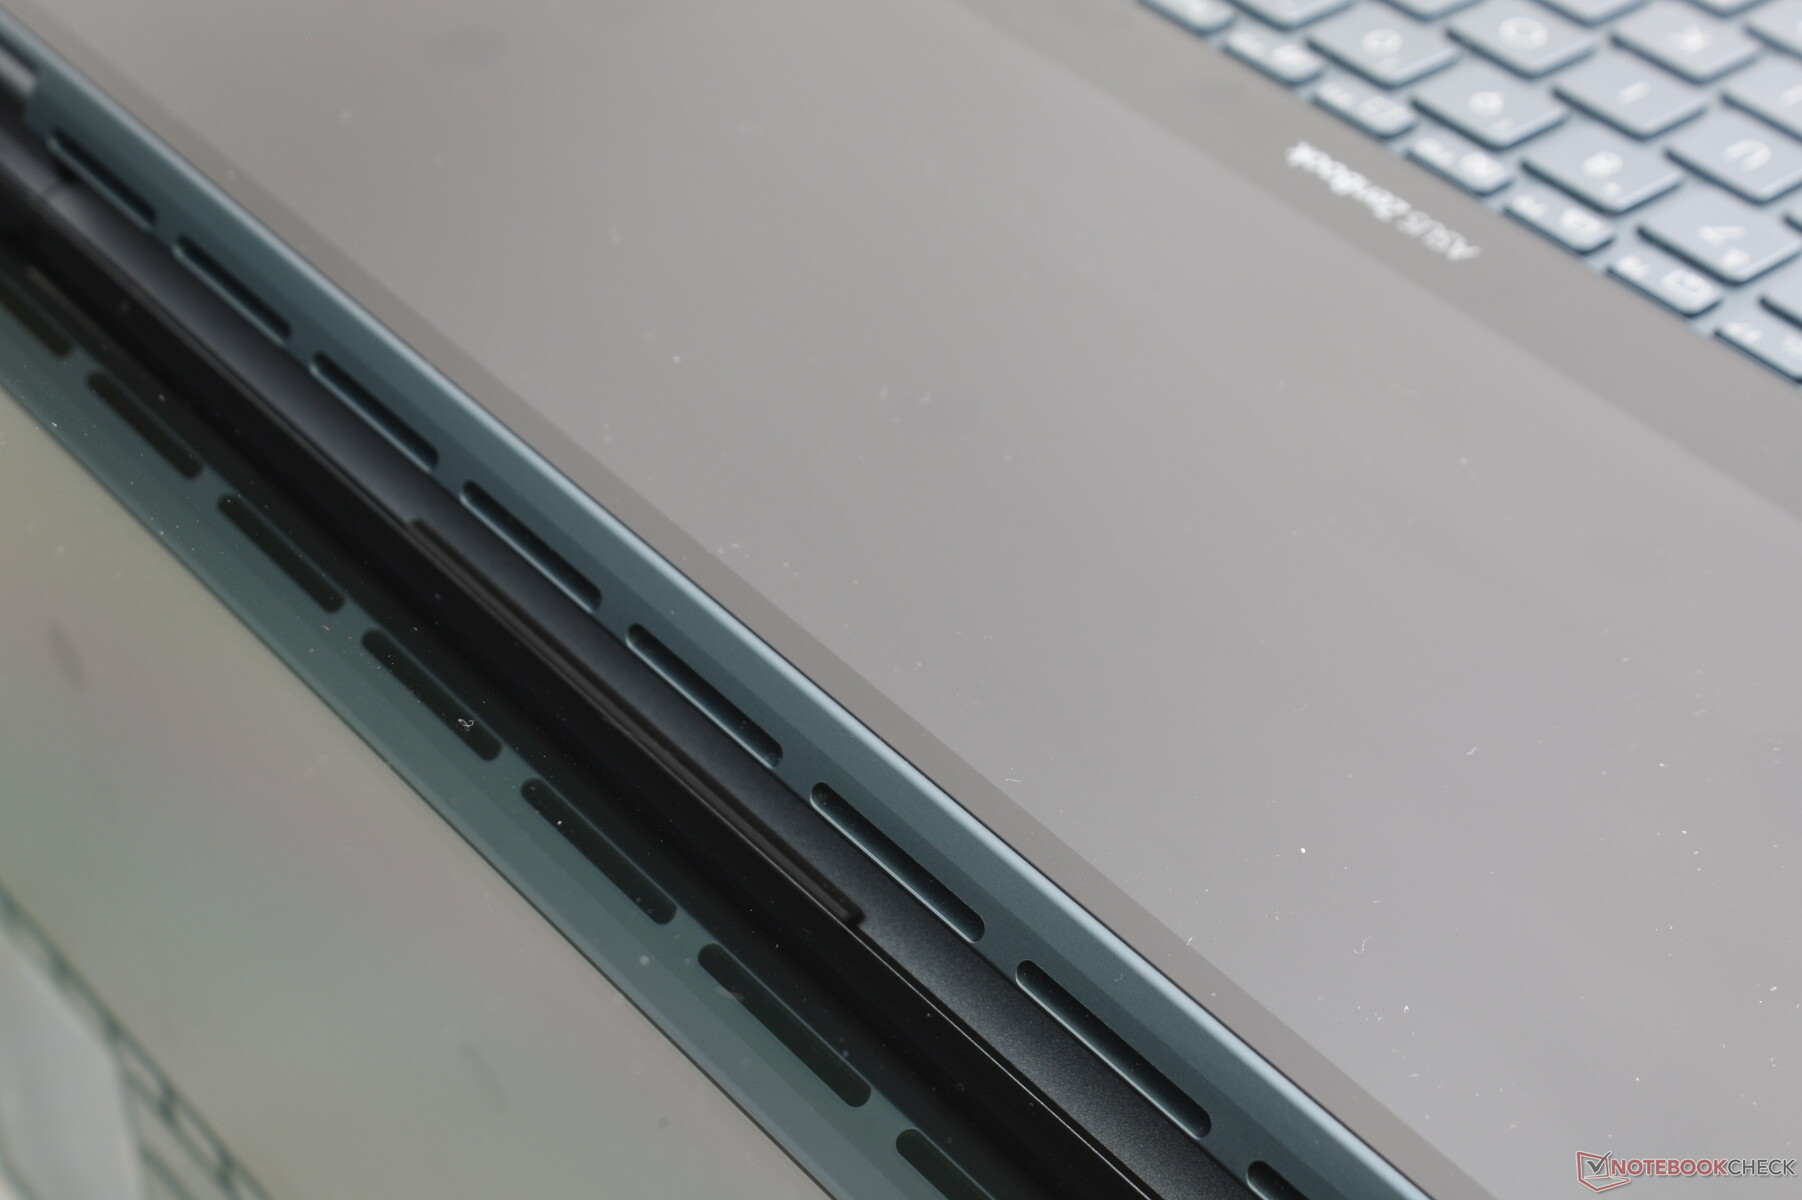
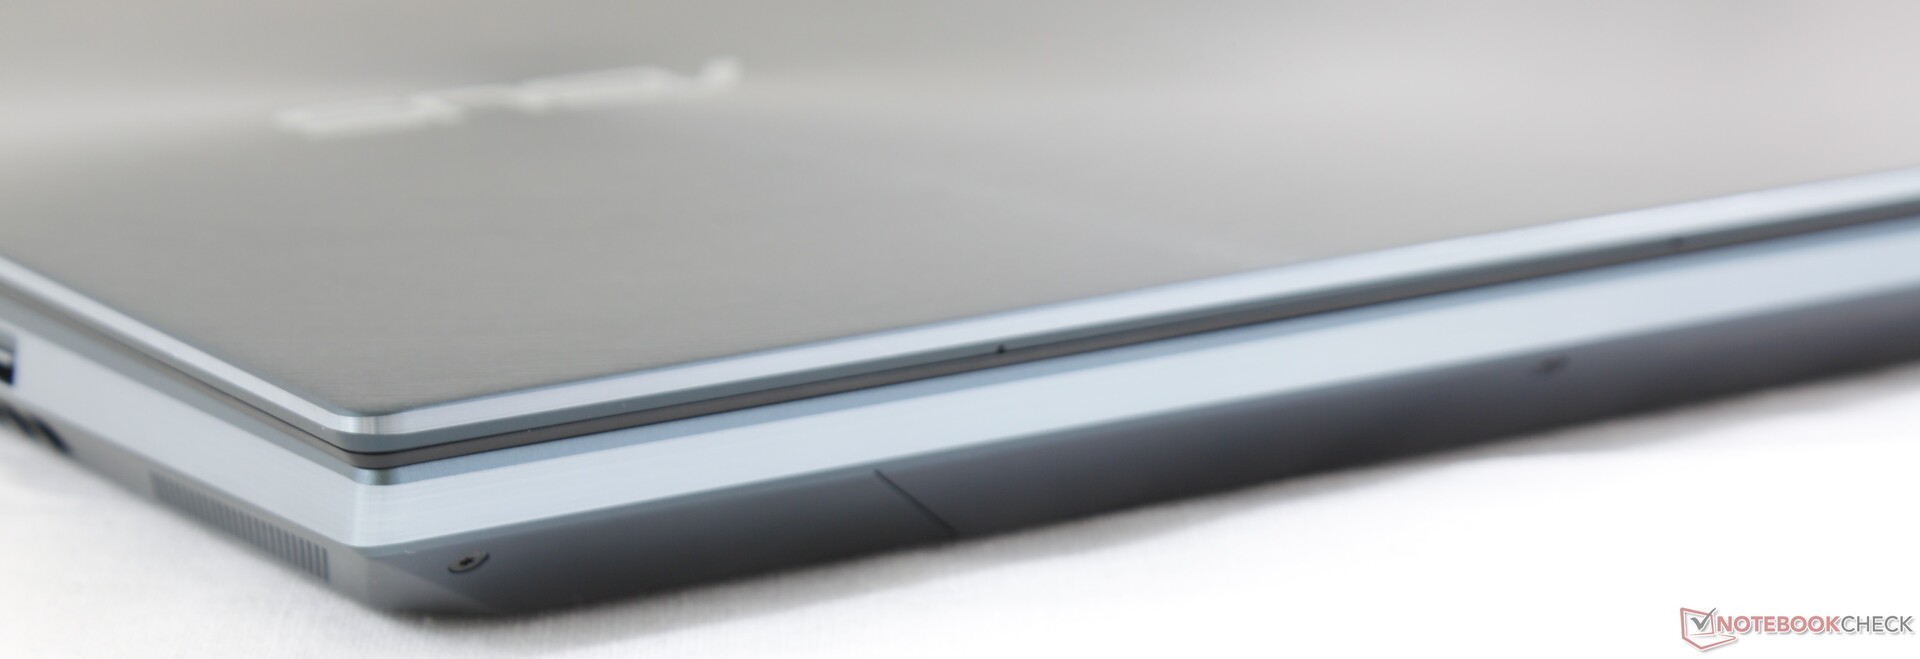
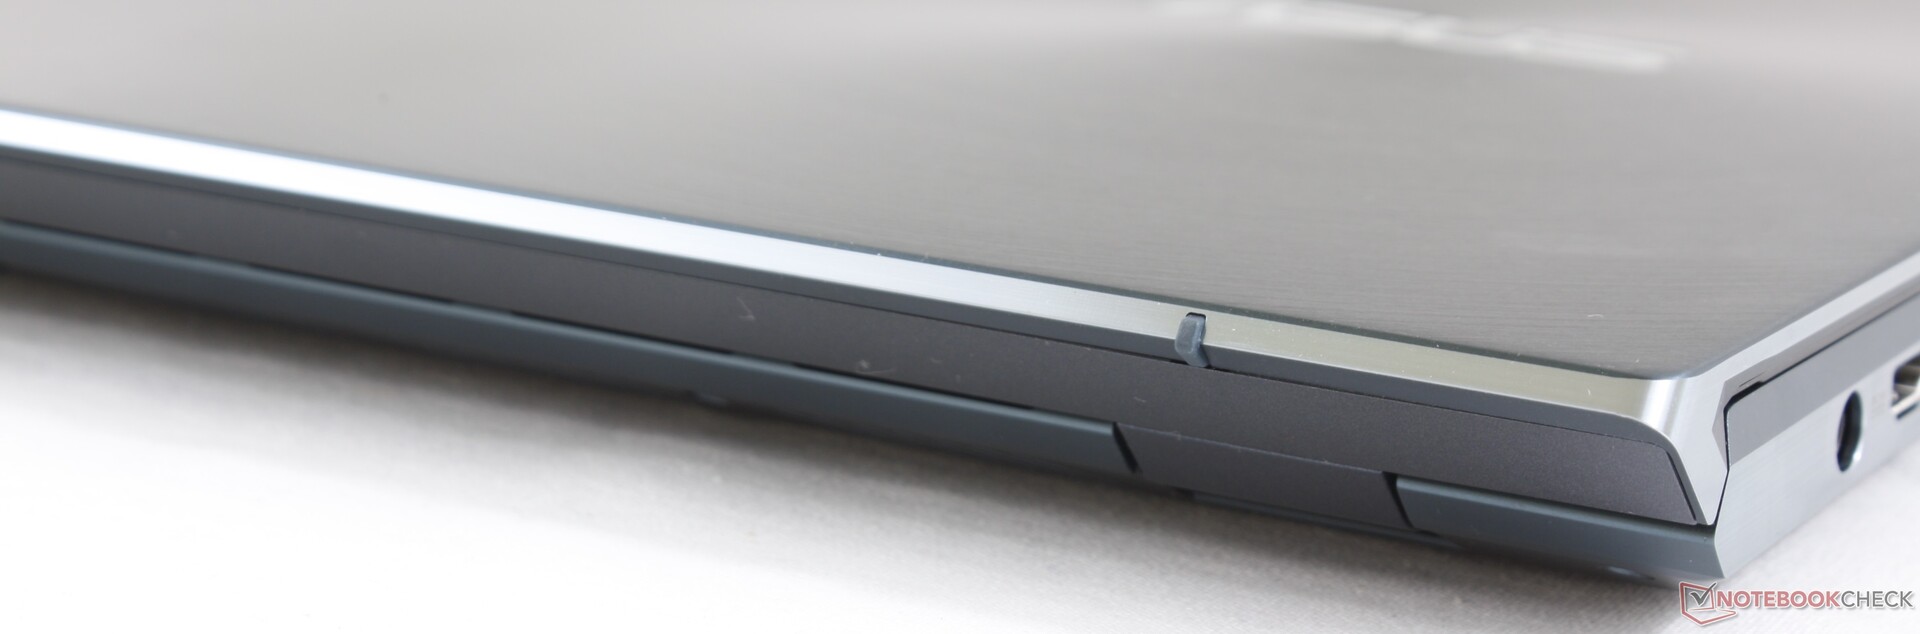
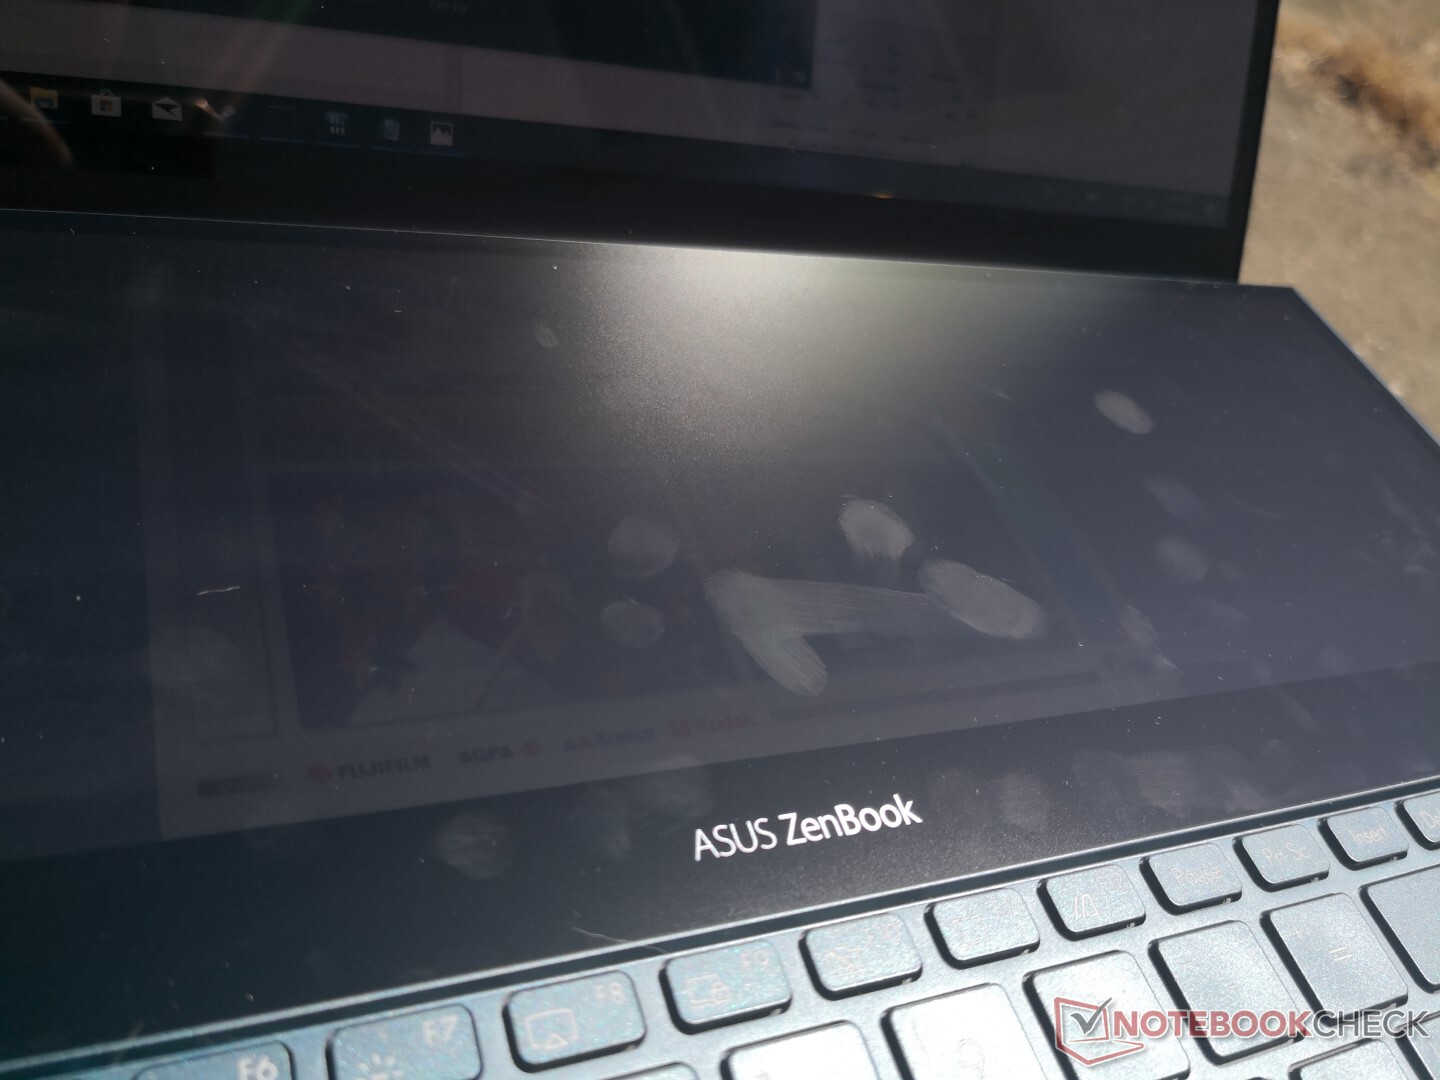
ZenBook laptops are typically all aluminum and the ZenBook Pro Duo is no different. The familiar Celestial Blue color, smooth surfaces, and spun-metal outer lid finish return for a familiar look and feel. Whereas all ZenBook laptops have been quite thin, however, the UX581 is noticeably thicker and heavier than what we've come to expect from the series.
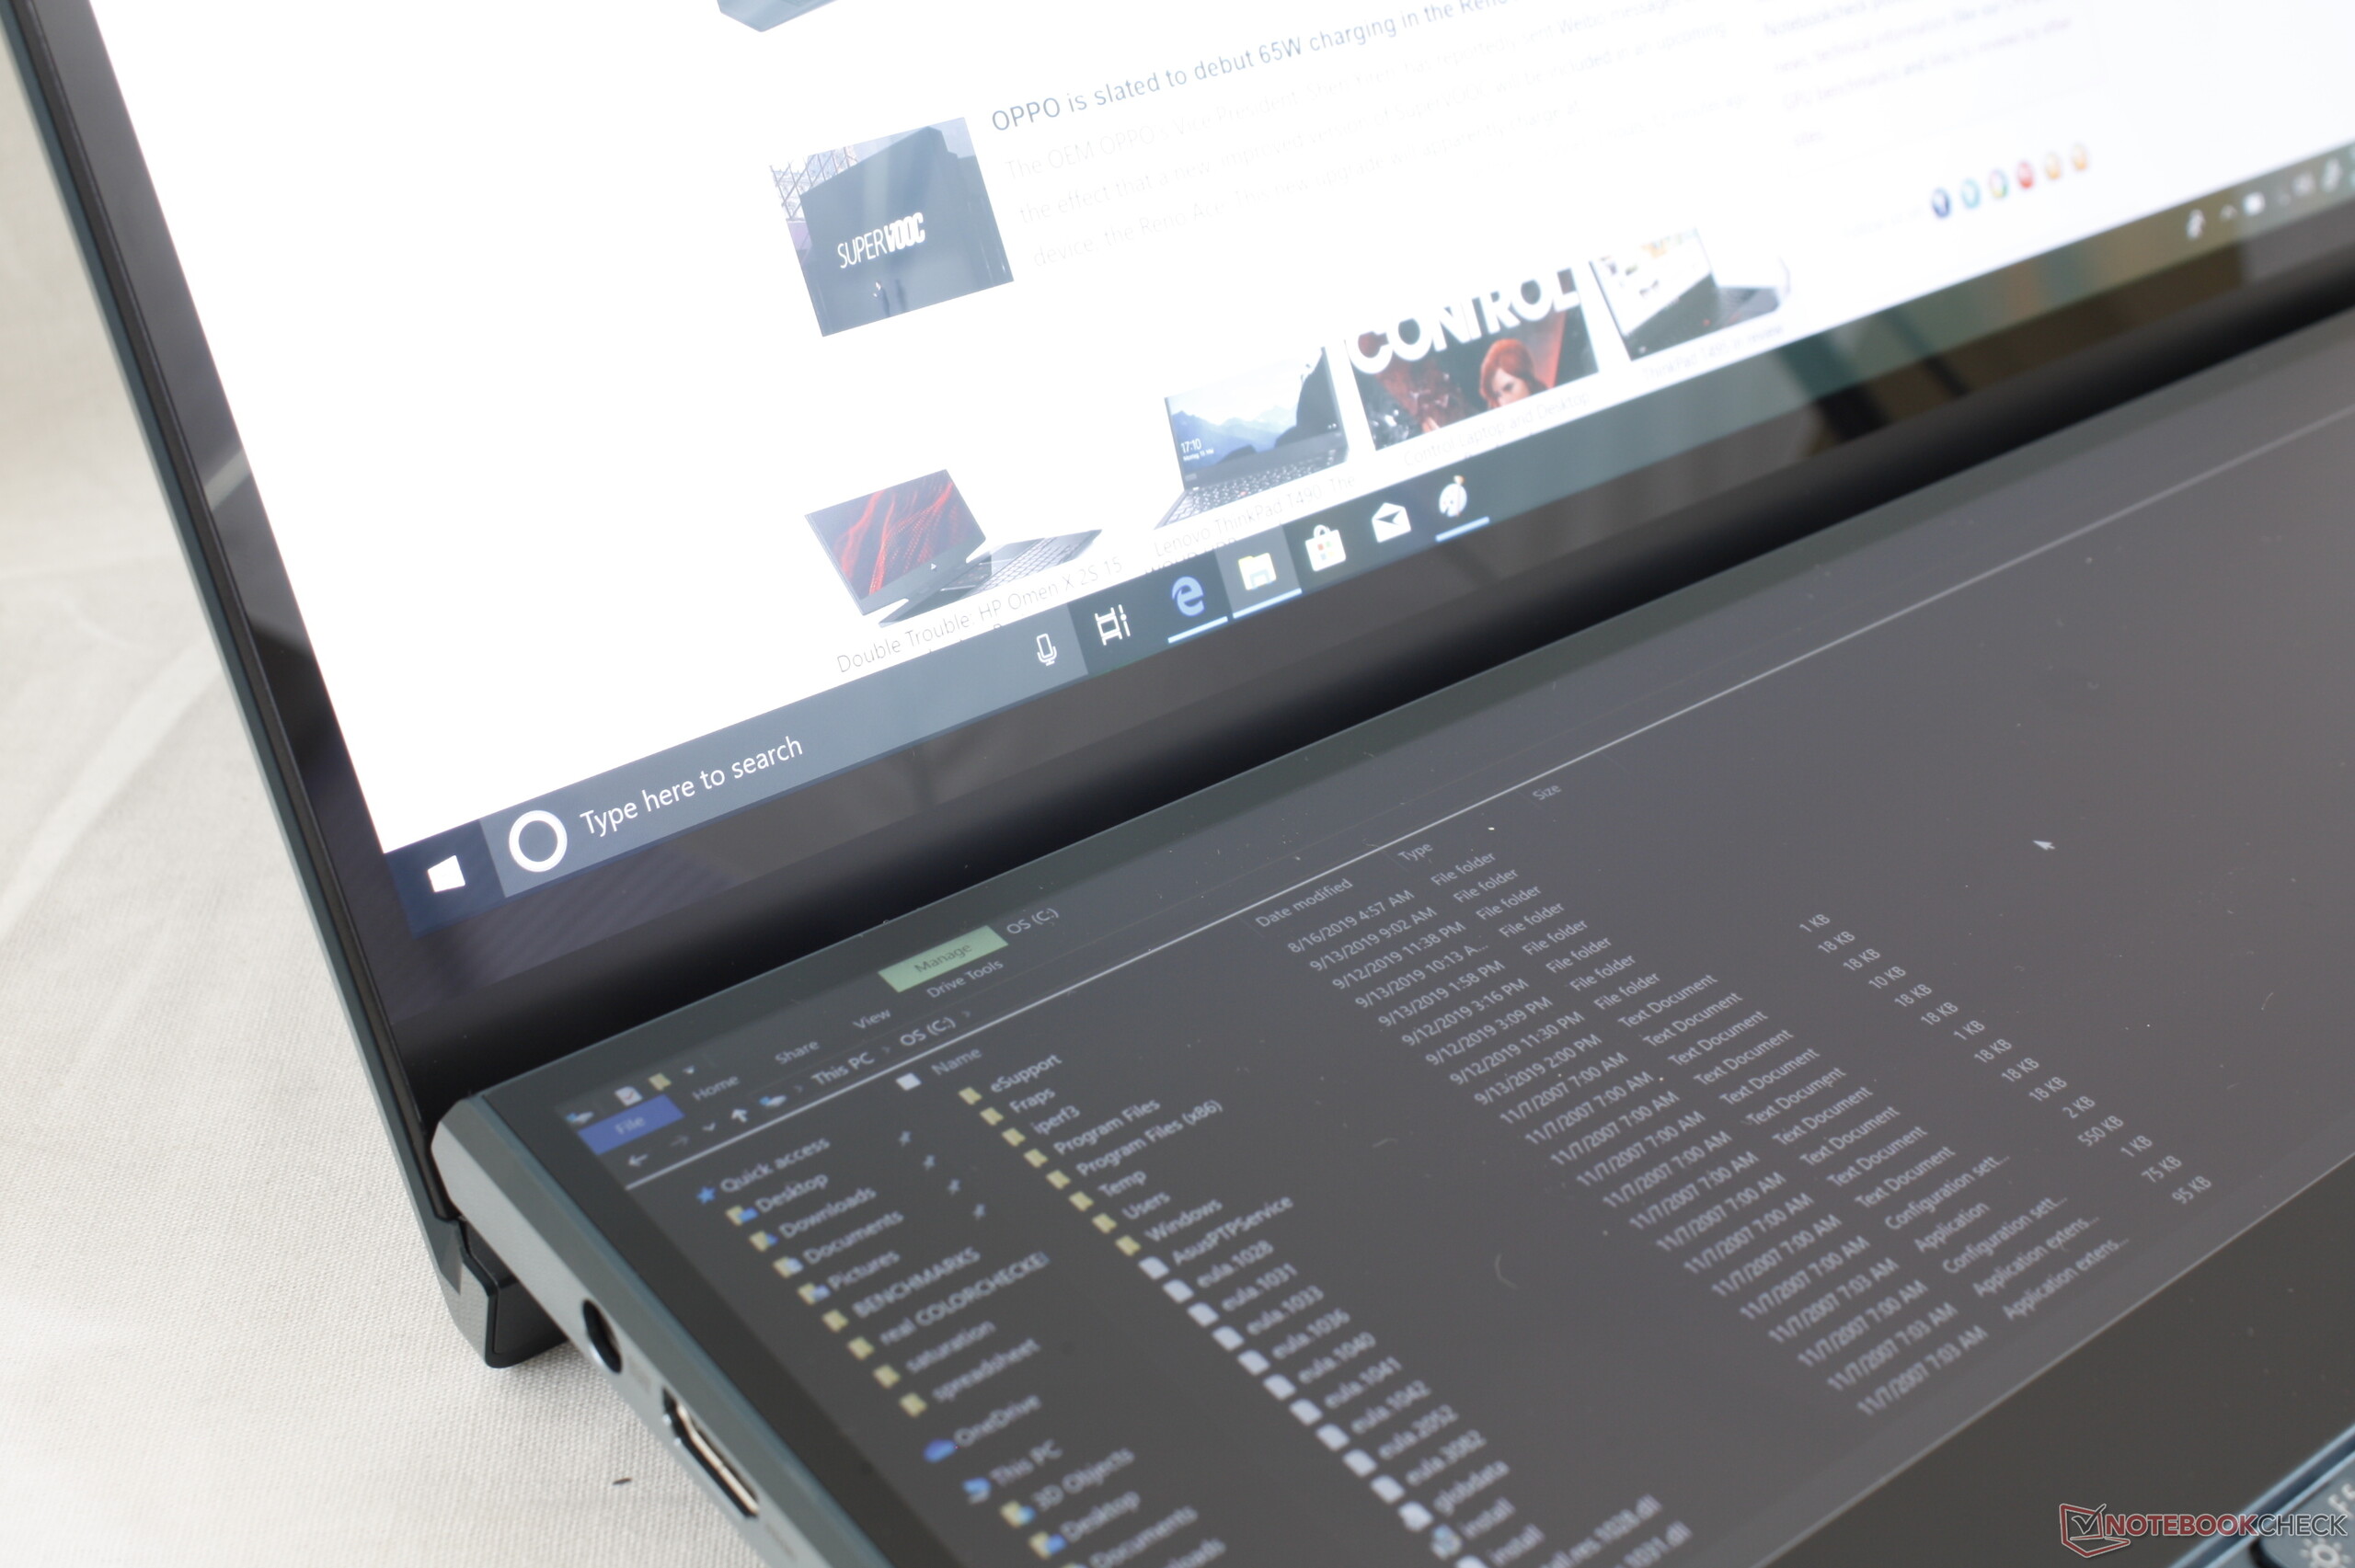
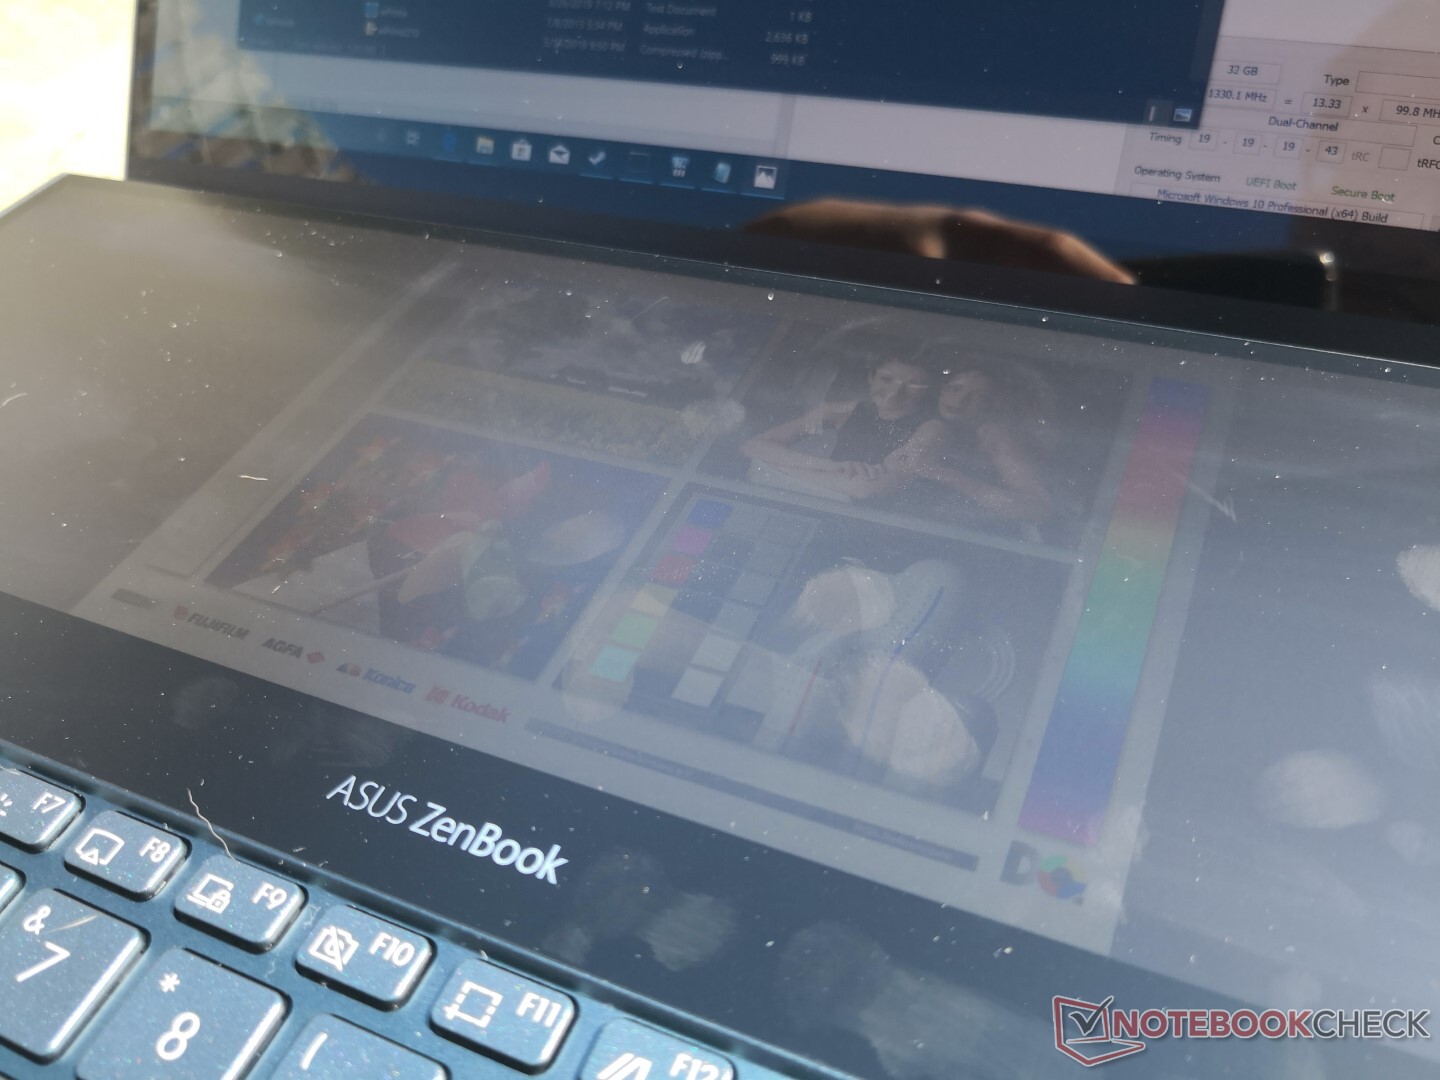
The chassis feels sturdy partly due to how hefty the unit is. The lid in particular is firmer than expected with almost no twisting and the base is even stronger with no creaking and only minor depressions when applying moderate pressure on the keyboard keys. The second screen is matte in contrast to the glossy second screen of the HP Omen X 2S 15 likely in an attempt to reduce glare, but fingerprints will accumulate everywhere on the screen nonetheless. For such a heavy ZenBook, this is also the most well-made in its family.
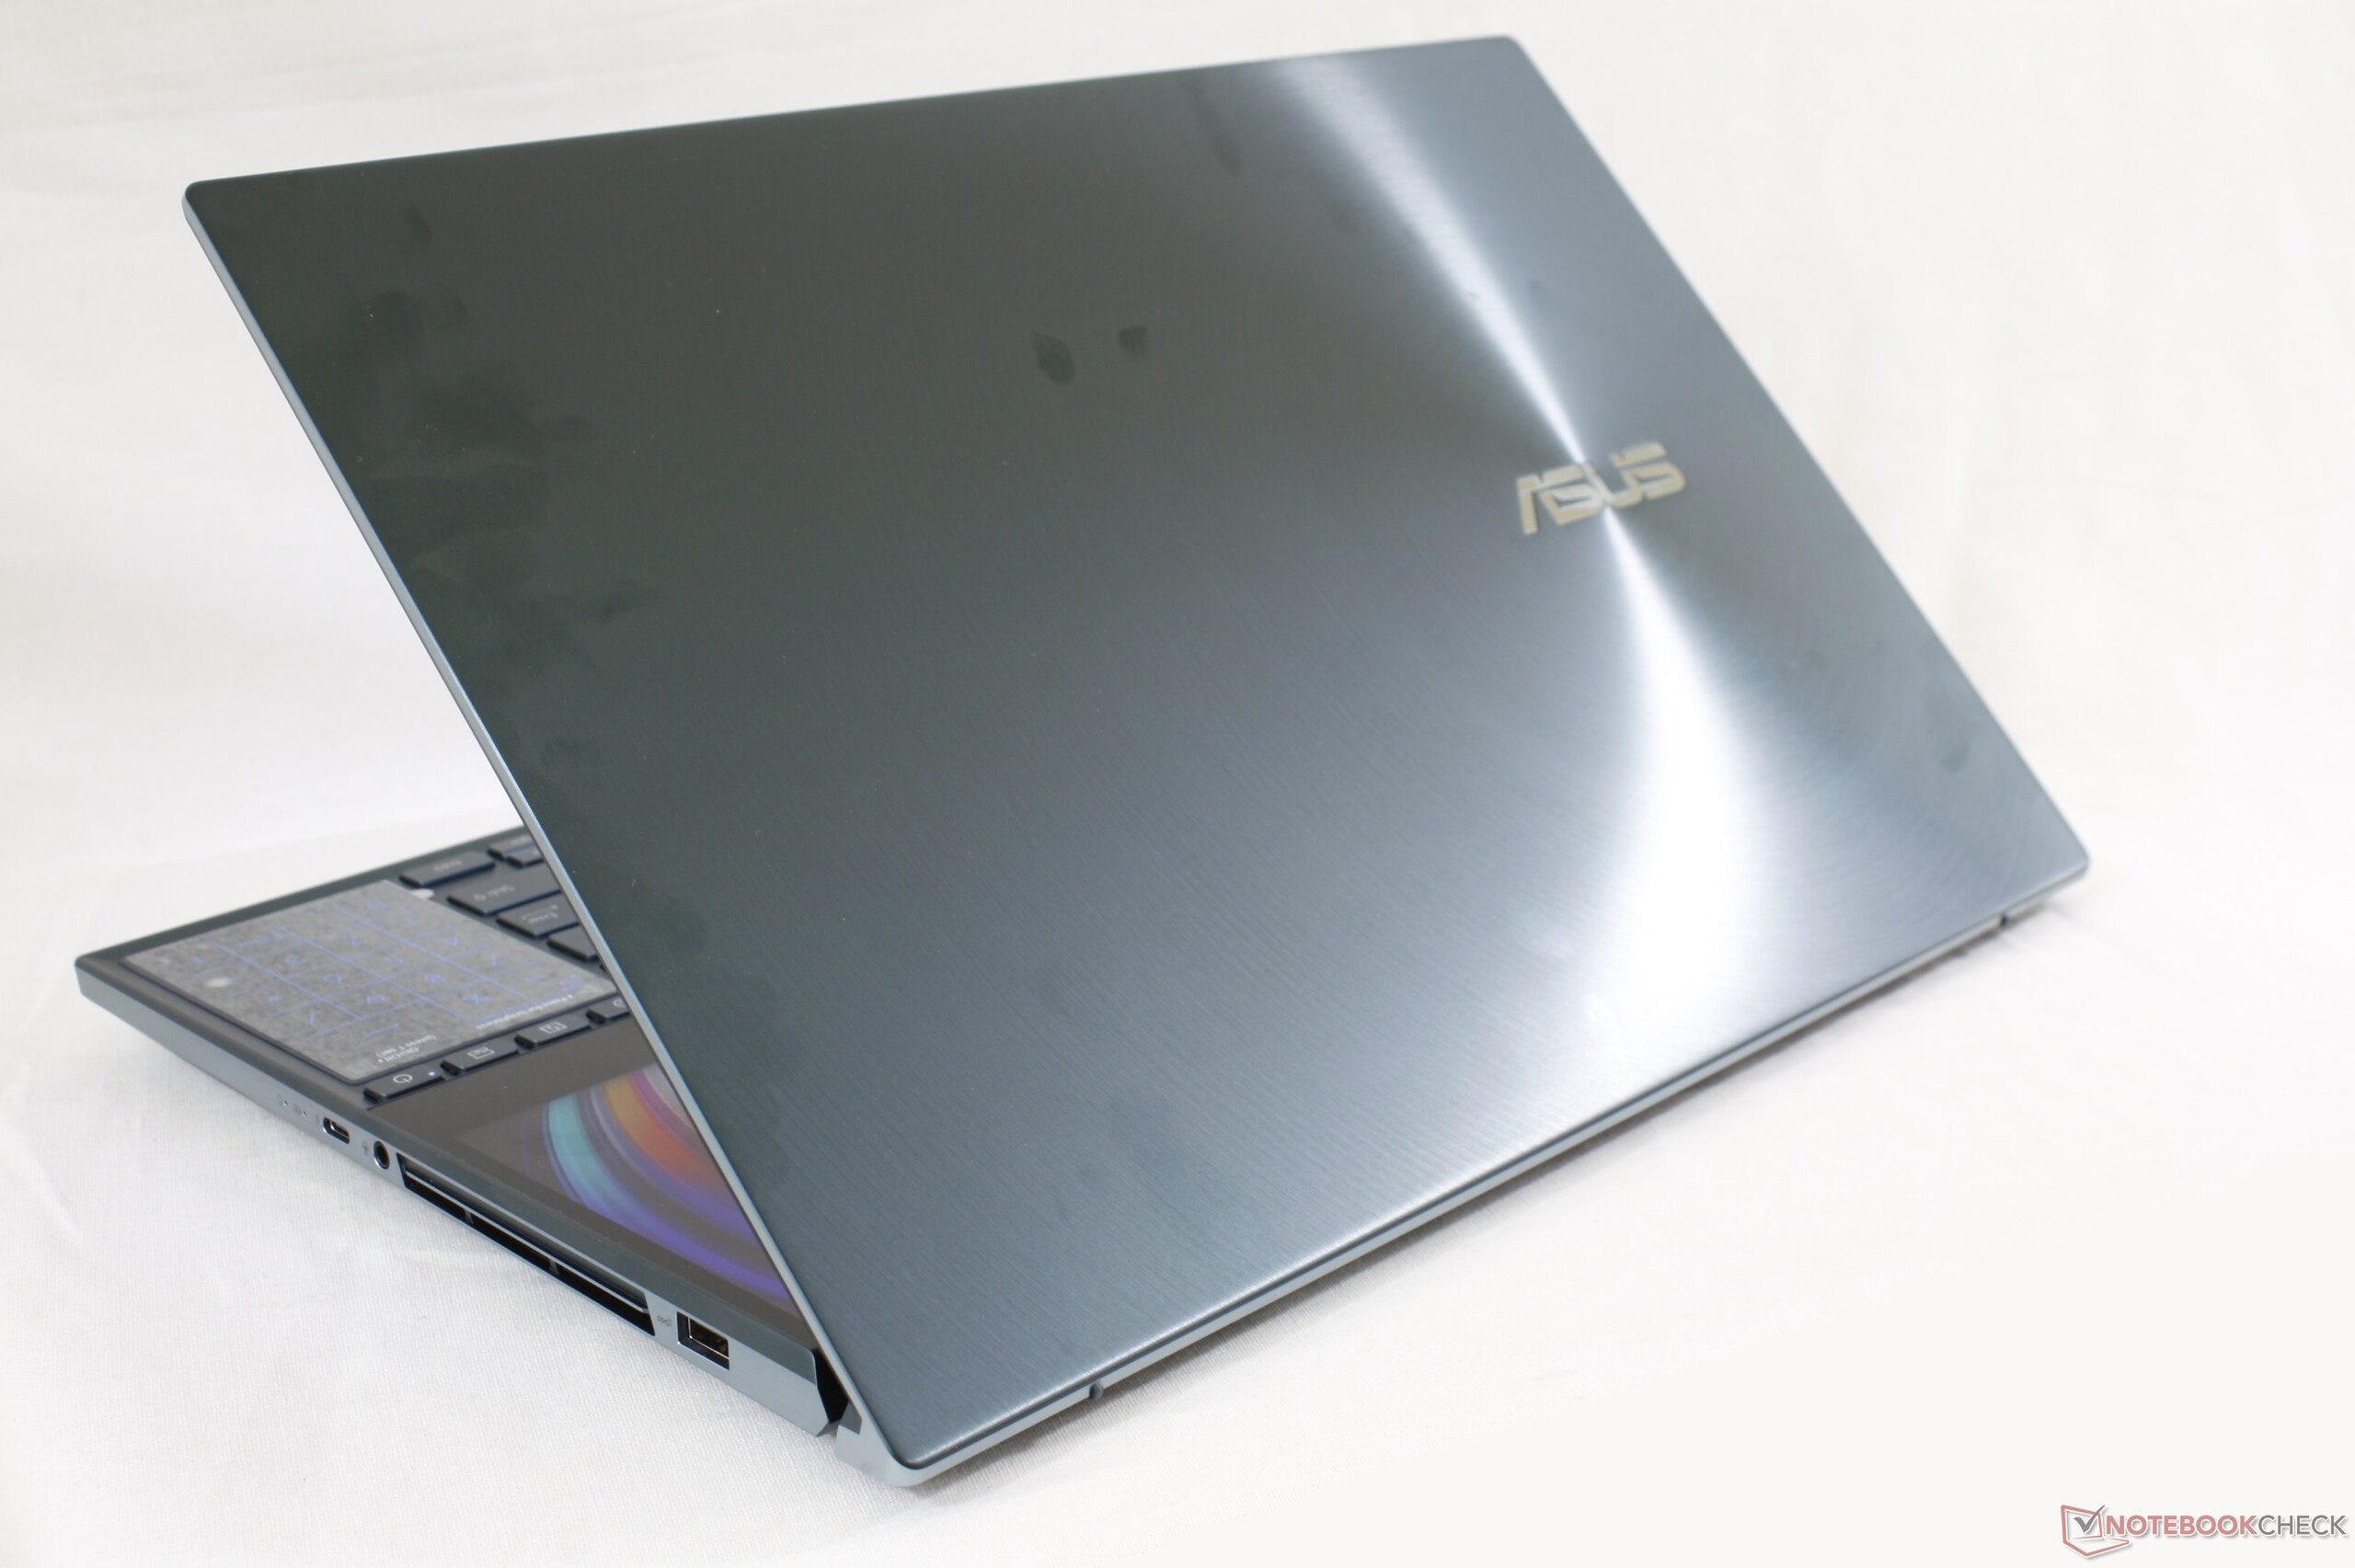
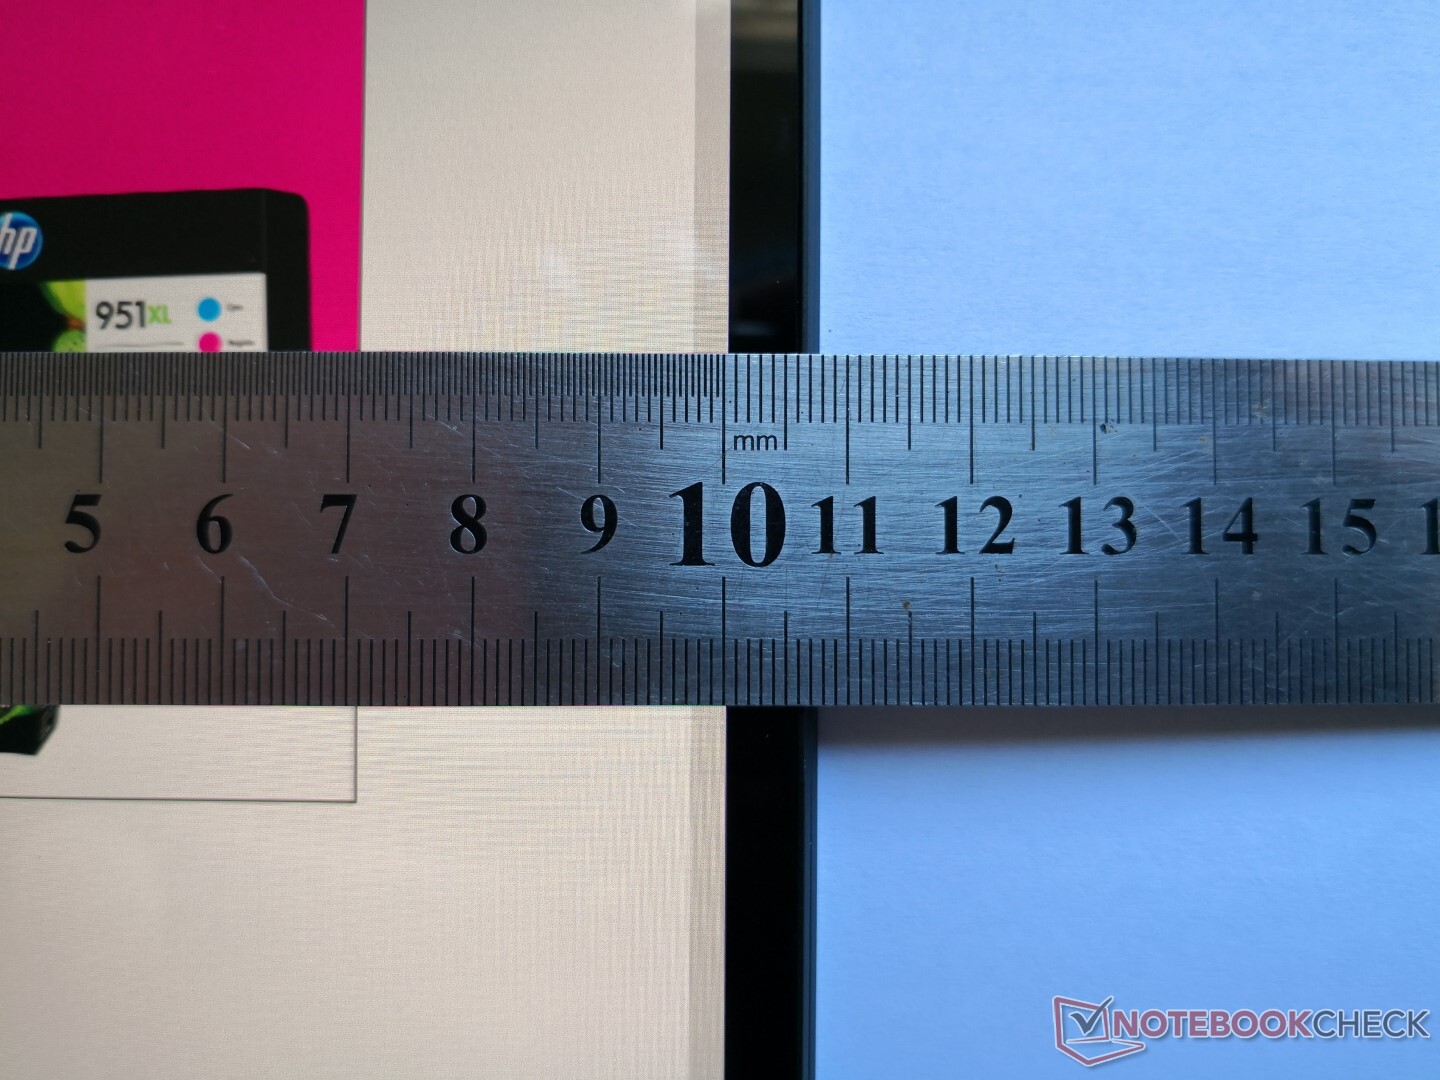
An easily noticeable drawback to the UX581 is its weight and thickness. The system is 500 g heavier than the latest XPS 15 7590 while being almost as thick as Asus' own Strix III G531 gaming laptop. It manages to be smaller than last year's UX580 in footprint but with a much thicker profile. If you'll be traveling frequently, you may want to consider the more portable ZenBook 15 UX534 which comes with its own version of the ScreenPad.
Connectivity
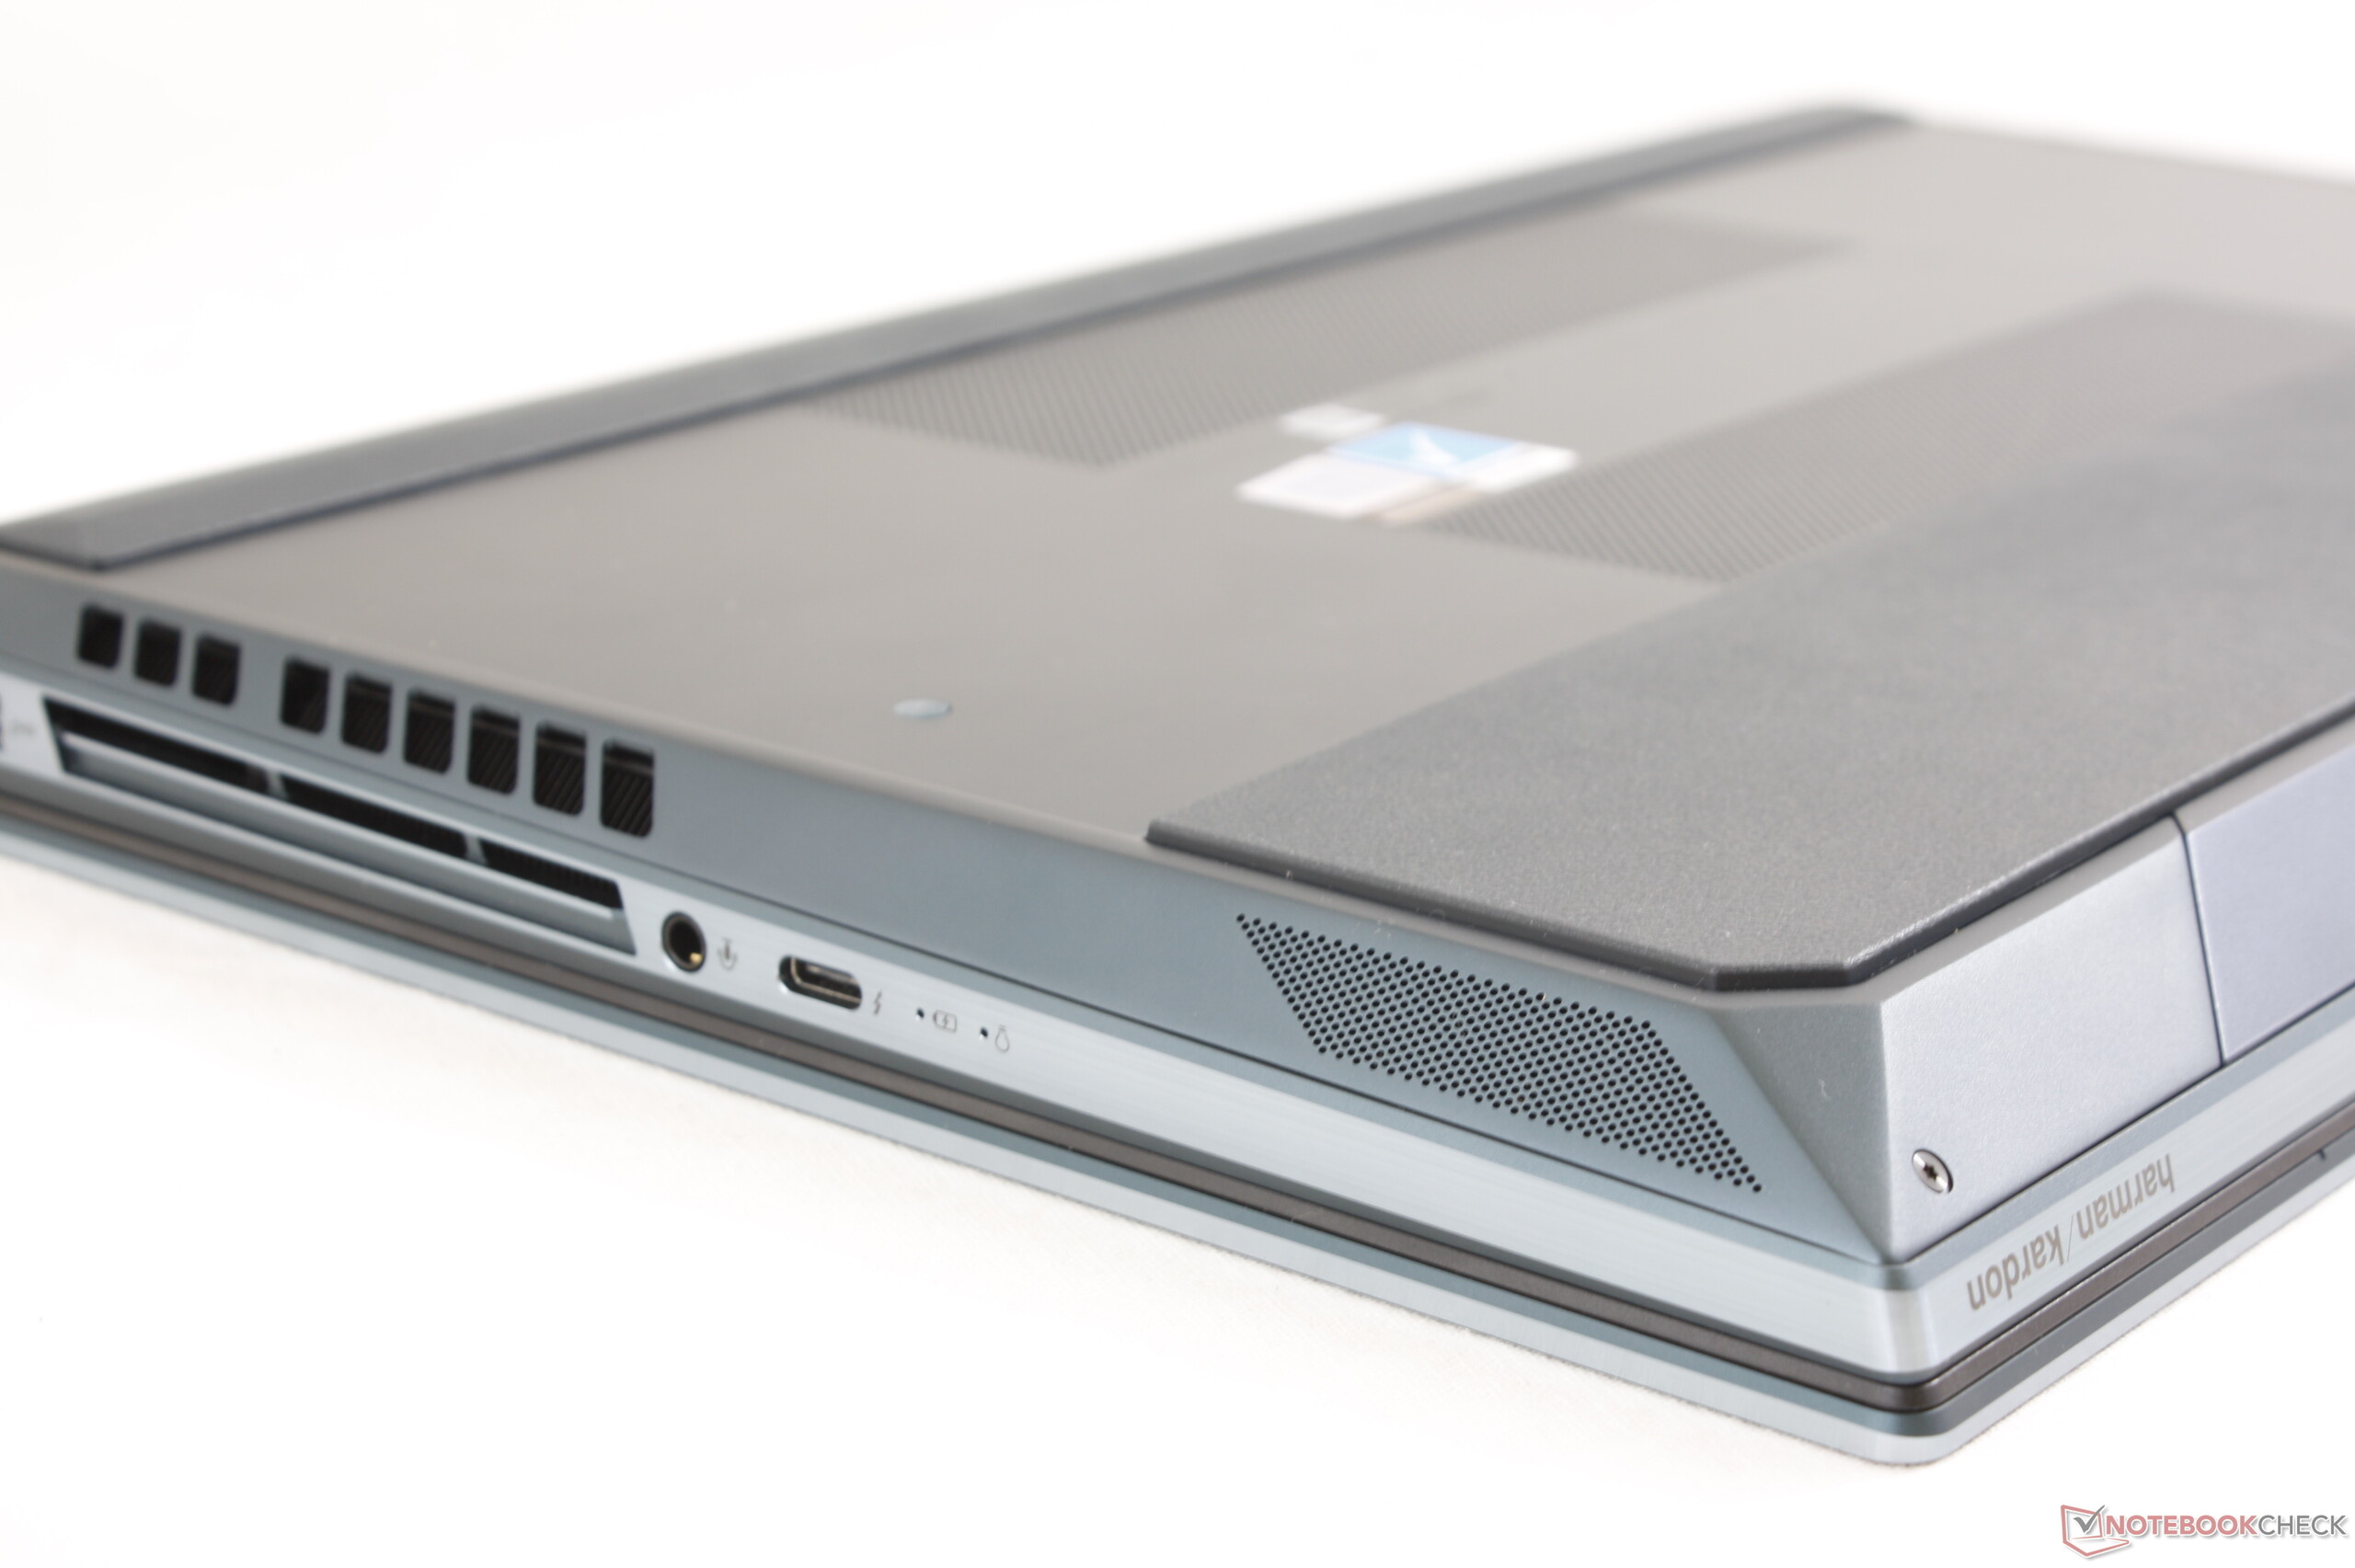
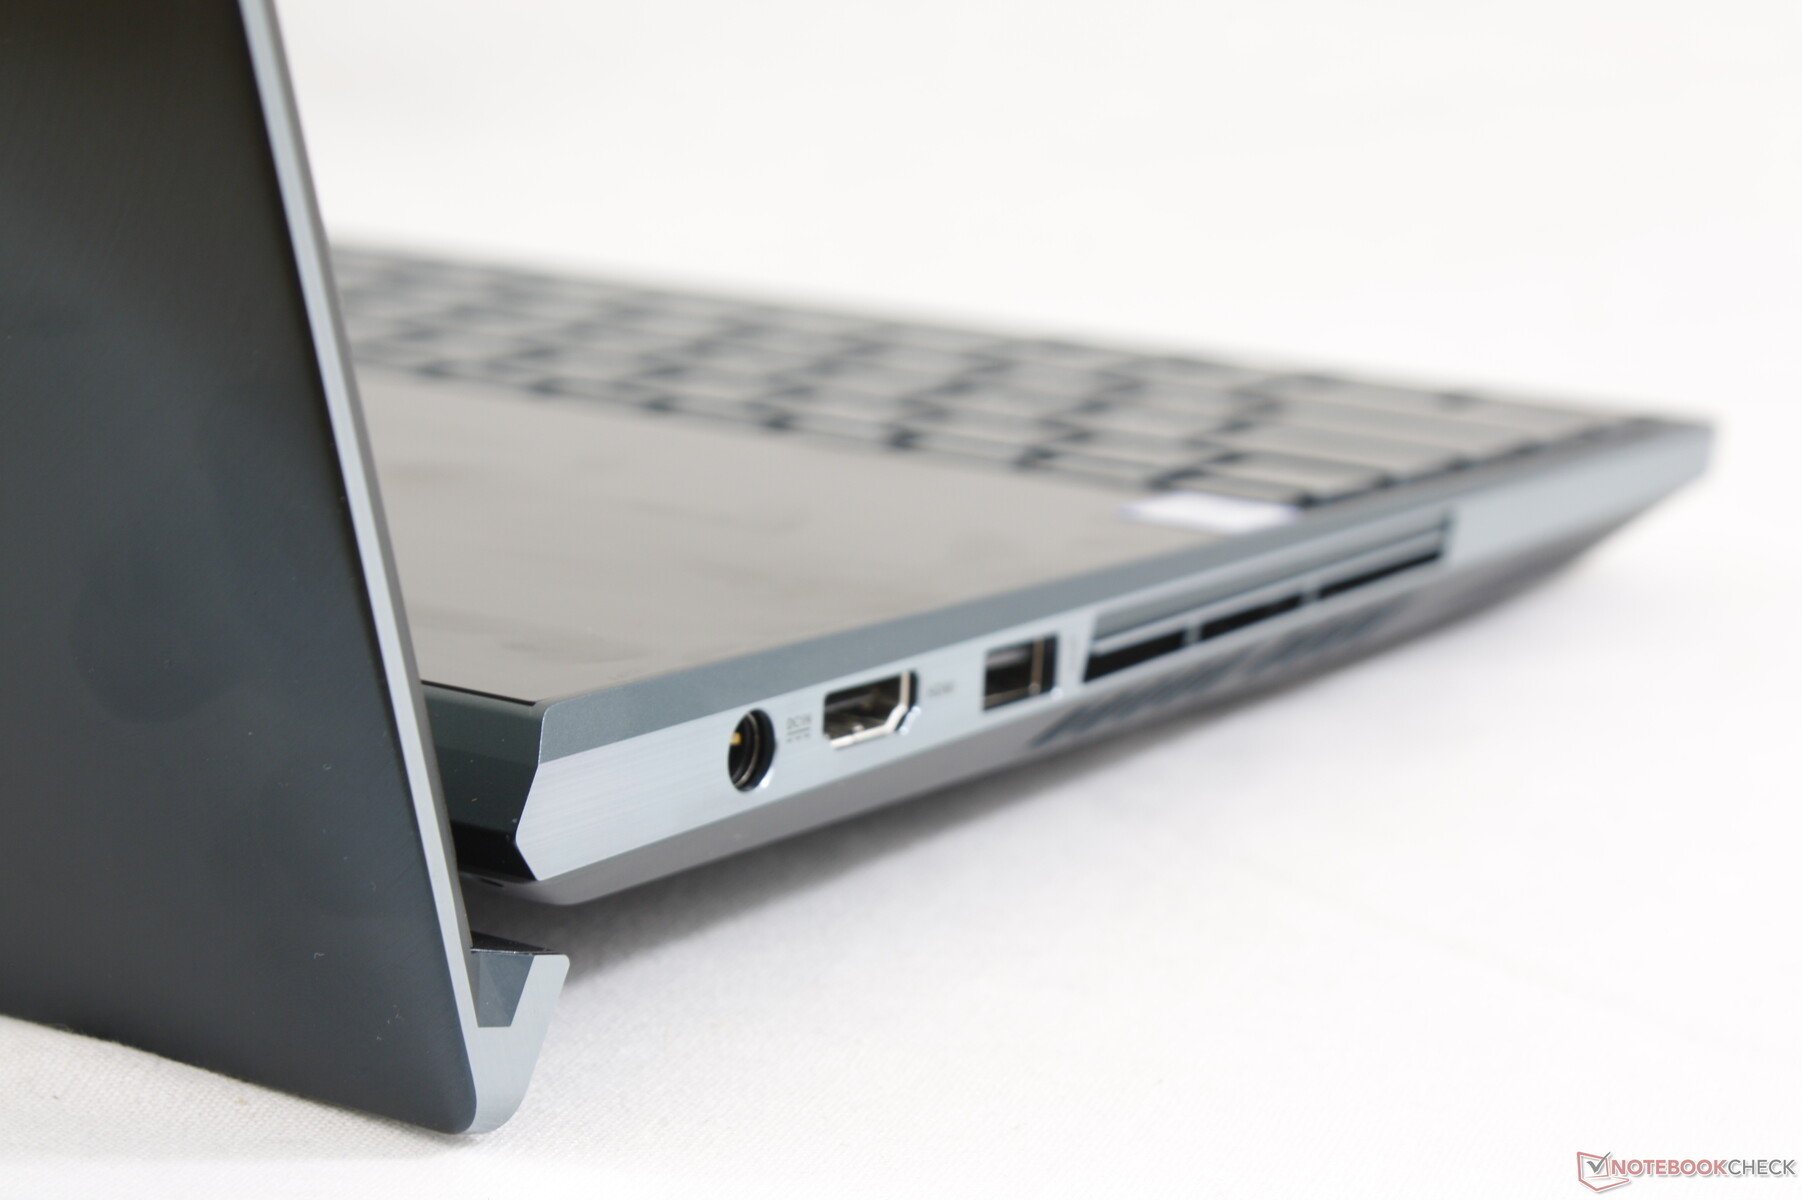
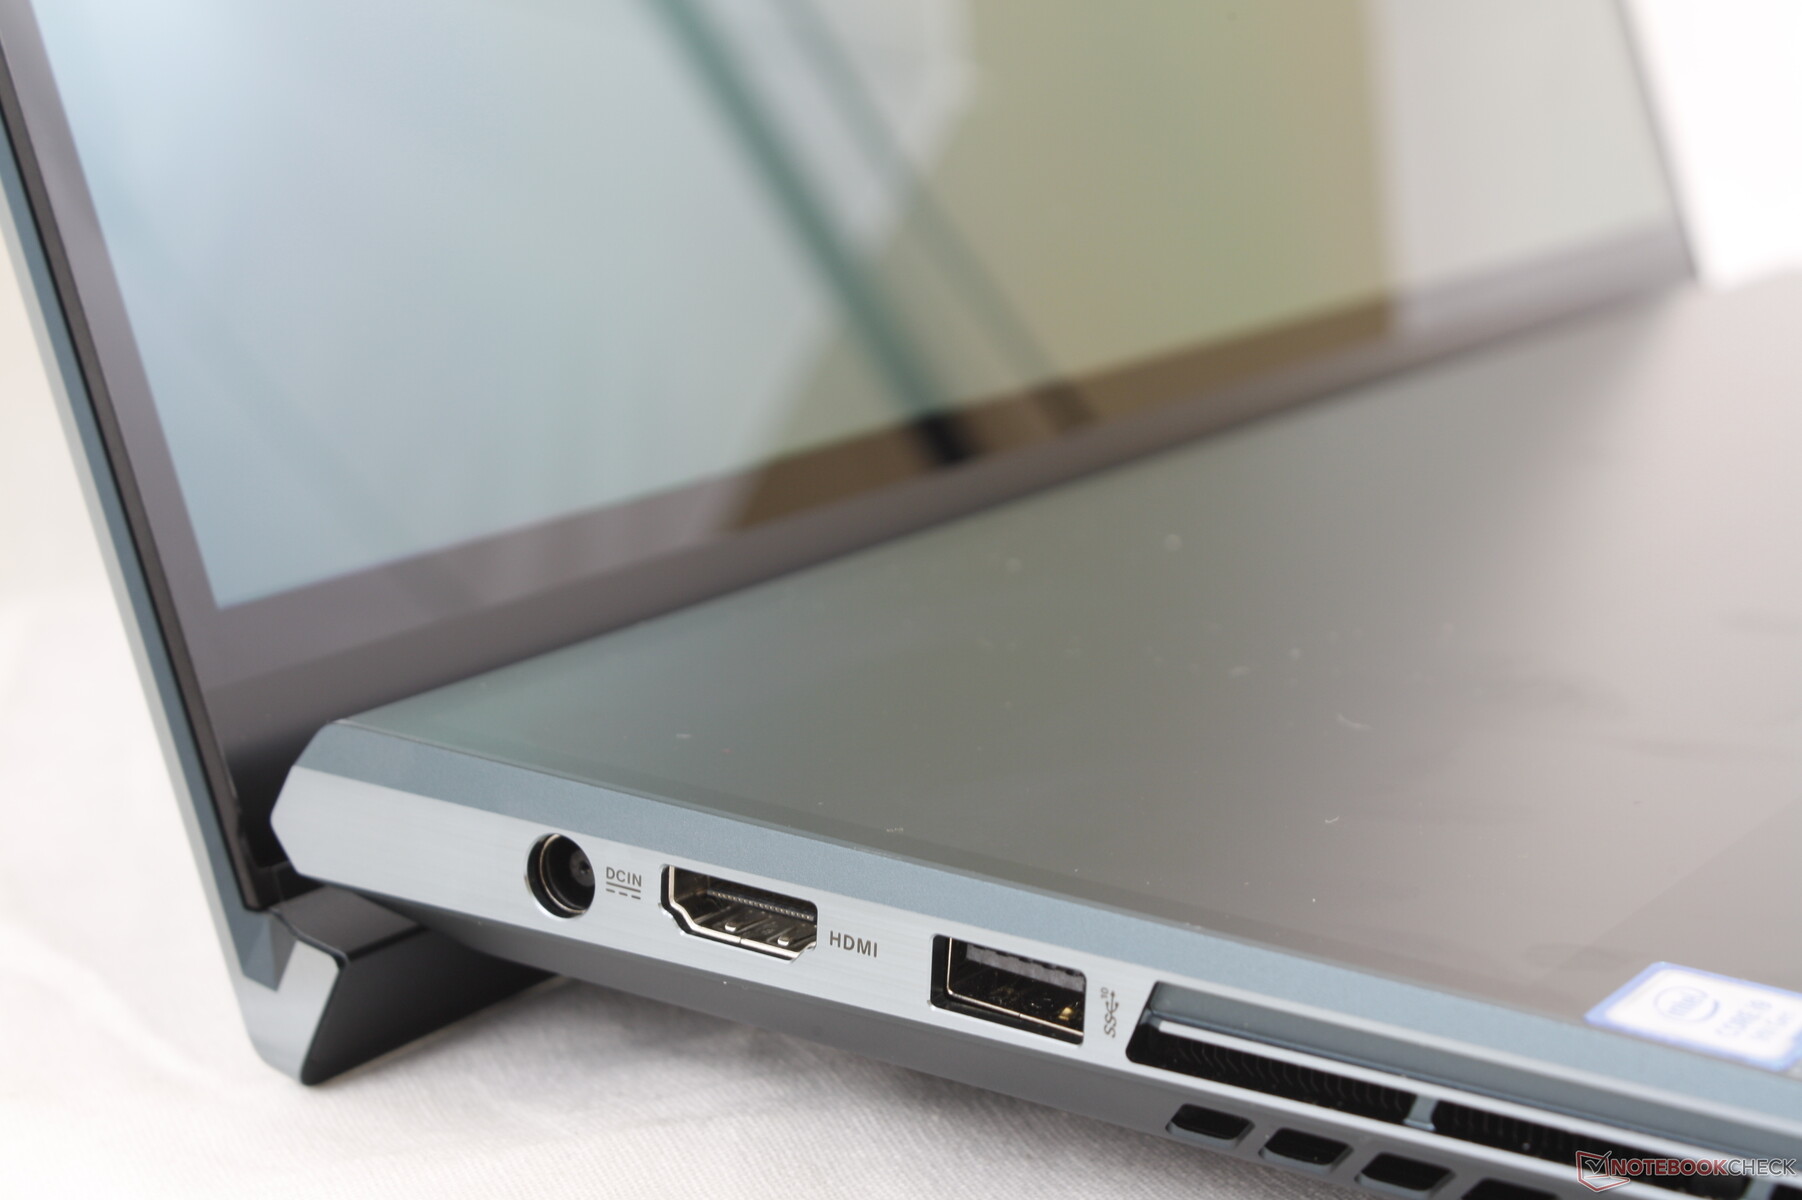
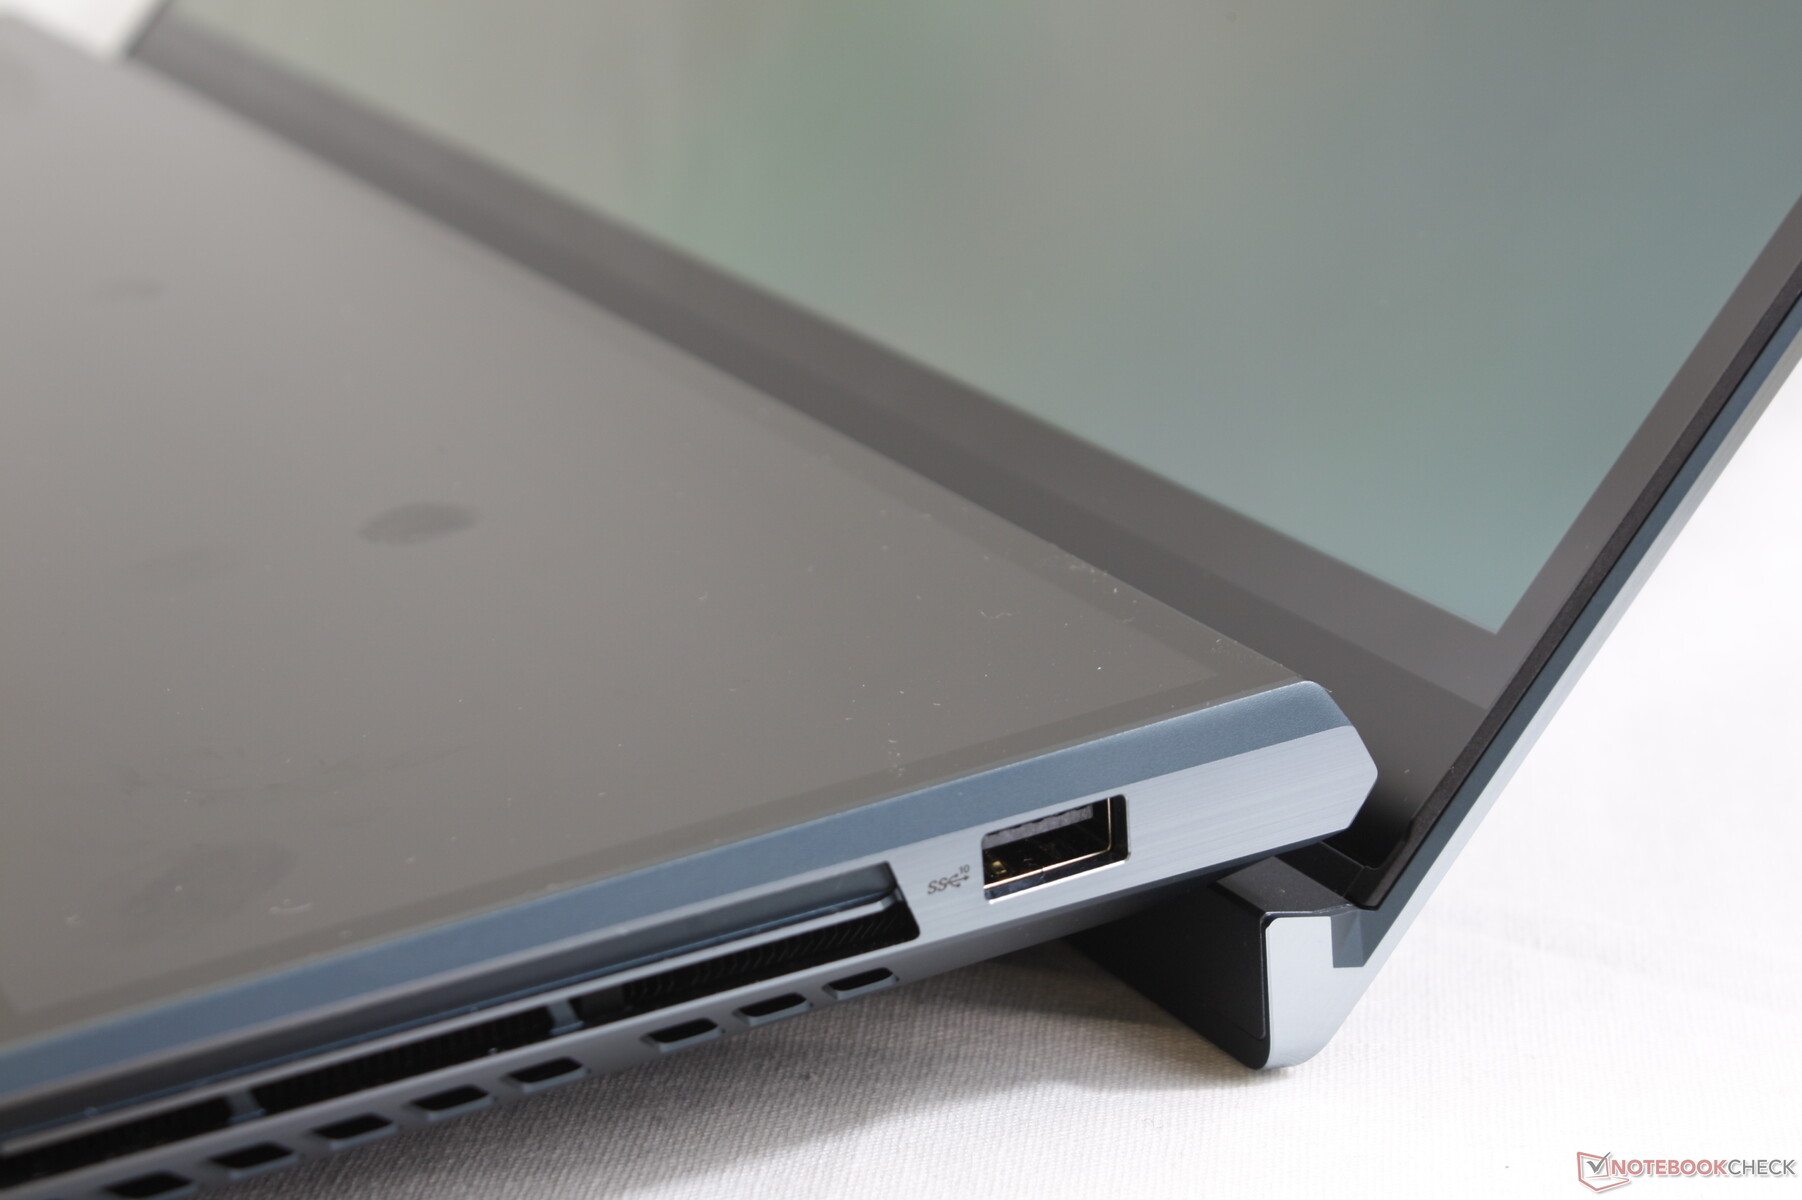
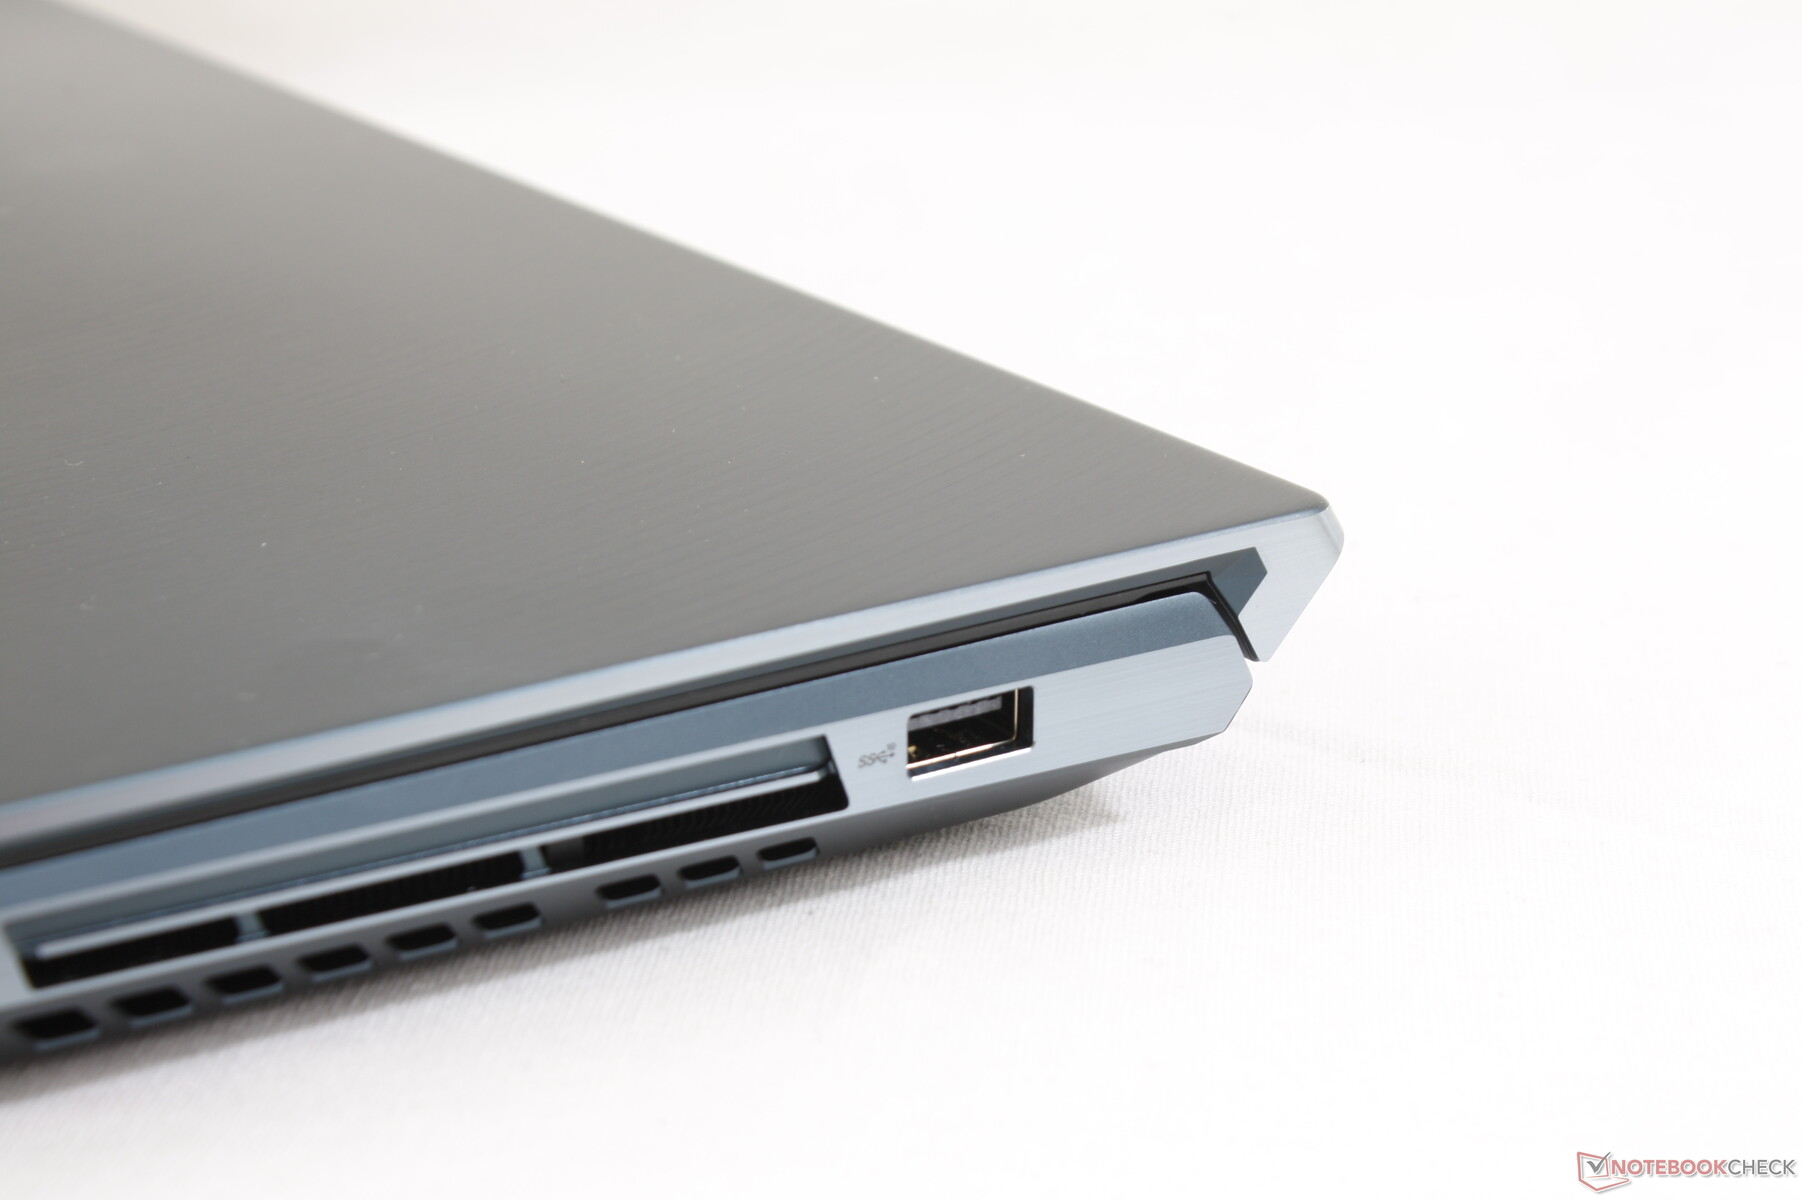
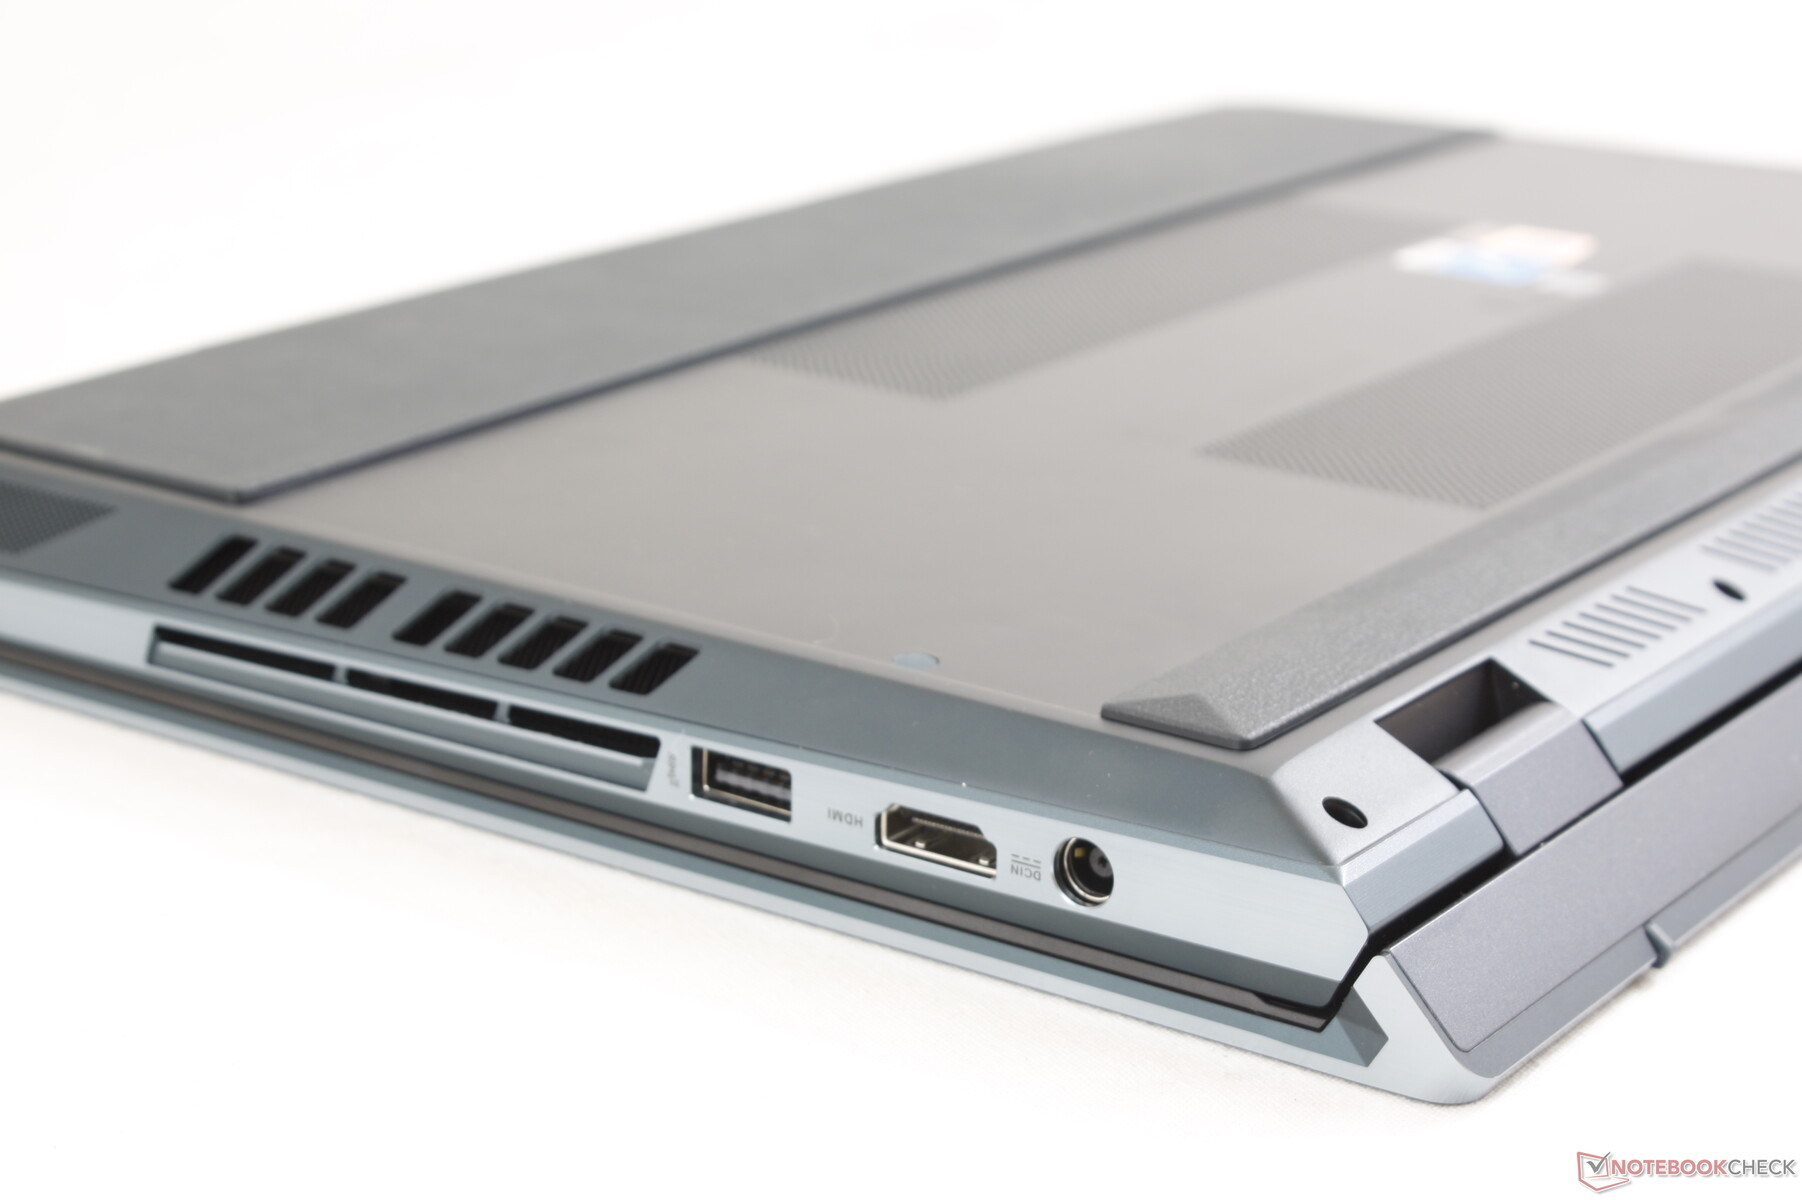
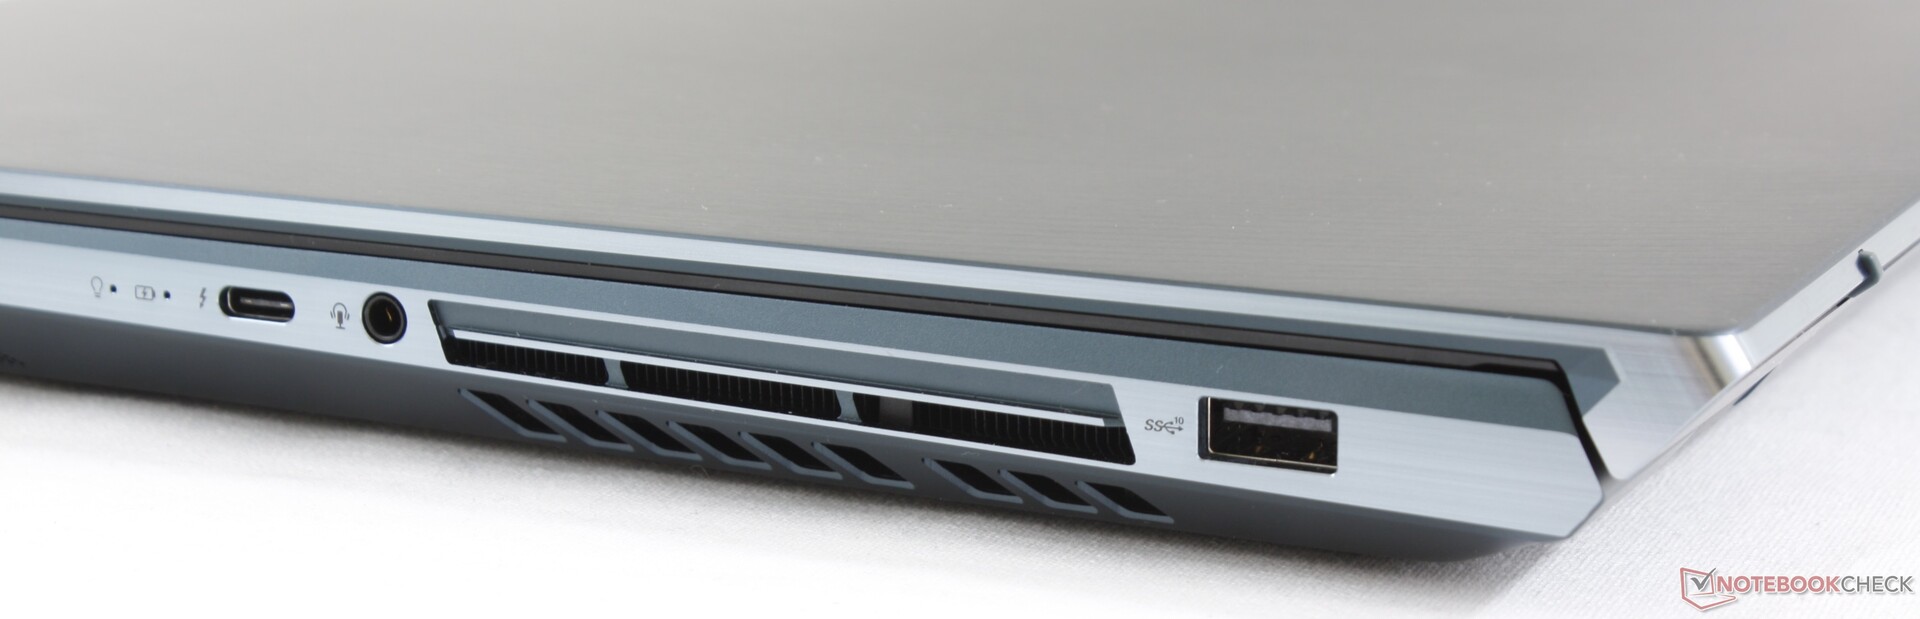
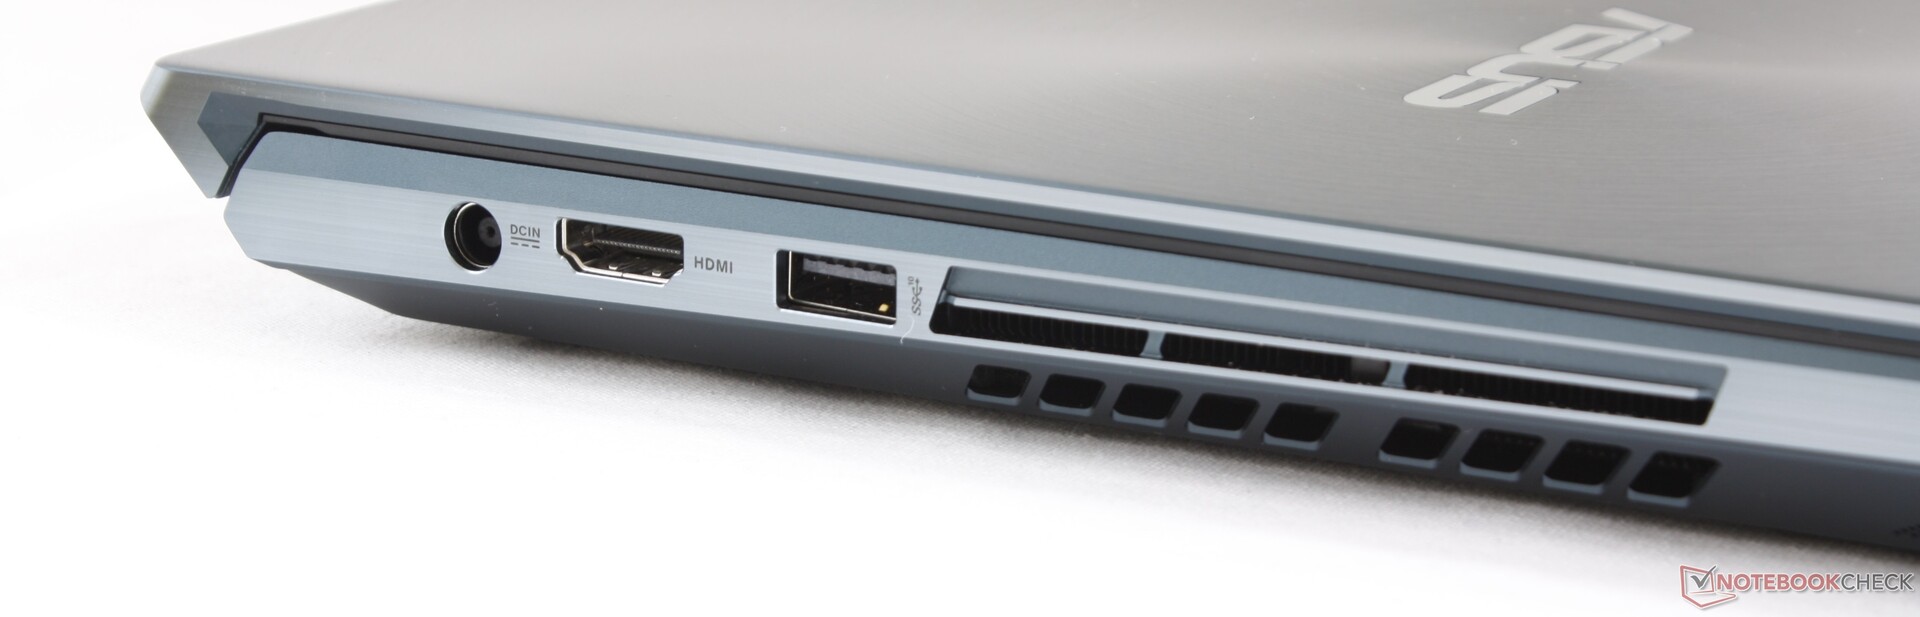
Port options are somewhat meager. Despite having a thicker and heavier chassis, the UX581 has fewer ports than last year's UX580. Asus has dropped both the MicroSD reader and one USB Type-C port for an additional USB Type-A port. Port positioning is otherwise good as they are evenly distributed and easy to reach along the sides.
Communication
WLAN is provided by an Intel AX200 module for Bluetooth 5 connectivity, transfer rates of up to 2.4 Gbps, and compatibility with Wi-Fi 6 networks. Unfortunately, the wireless on our test unit appears to be defective. Transfer rates between our UX581 and a local test server would result in transmit and receive speeds of only about 100 MB/s each. We would run this same test side-by-side with an MSI GL75 and the MSI would return more normal transfer rates of ~650 Mbps.
In addition, our unit would be unable to connect to any 802.11n networks and so we suspect that there could be an issue with the 2.4 GHz antennae. We recommend double-checking the wireless immediately after purchasing for any abnormalities.
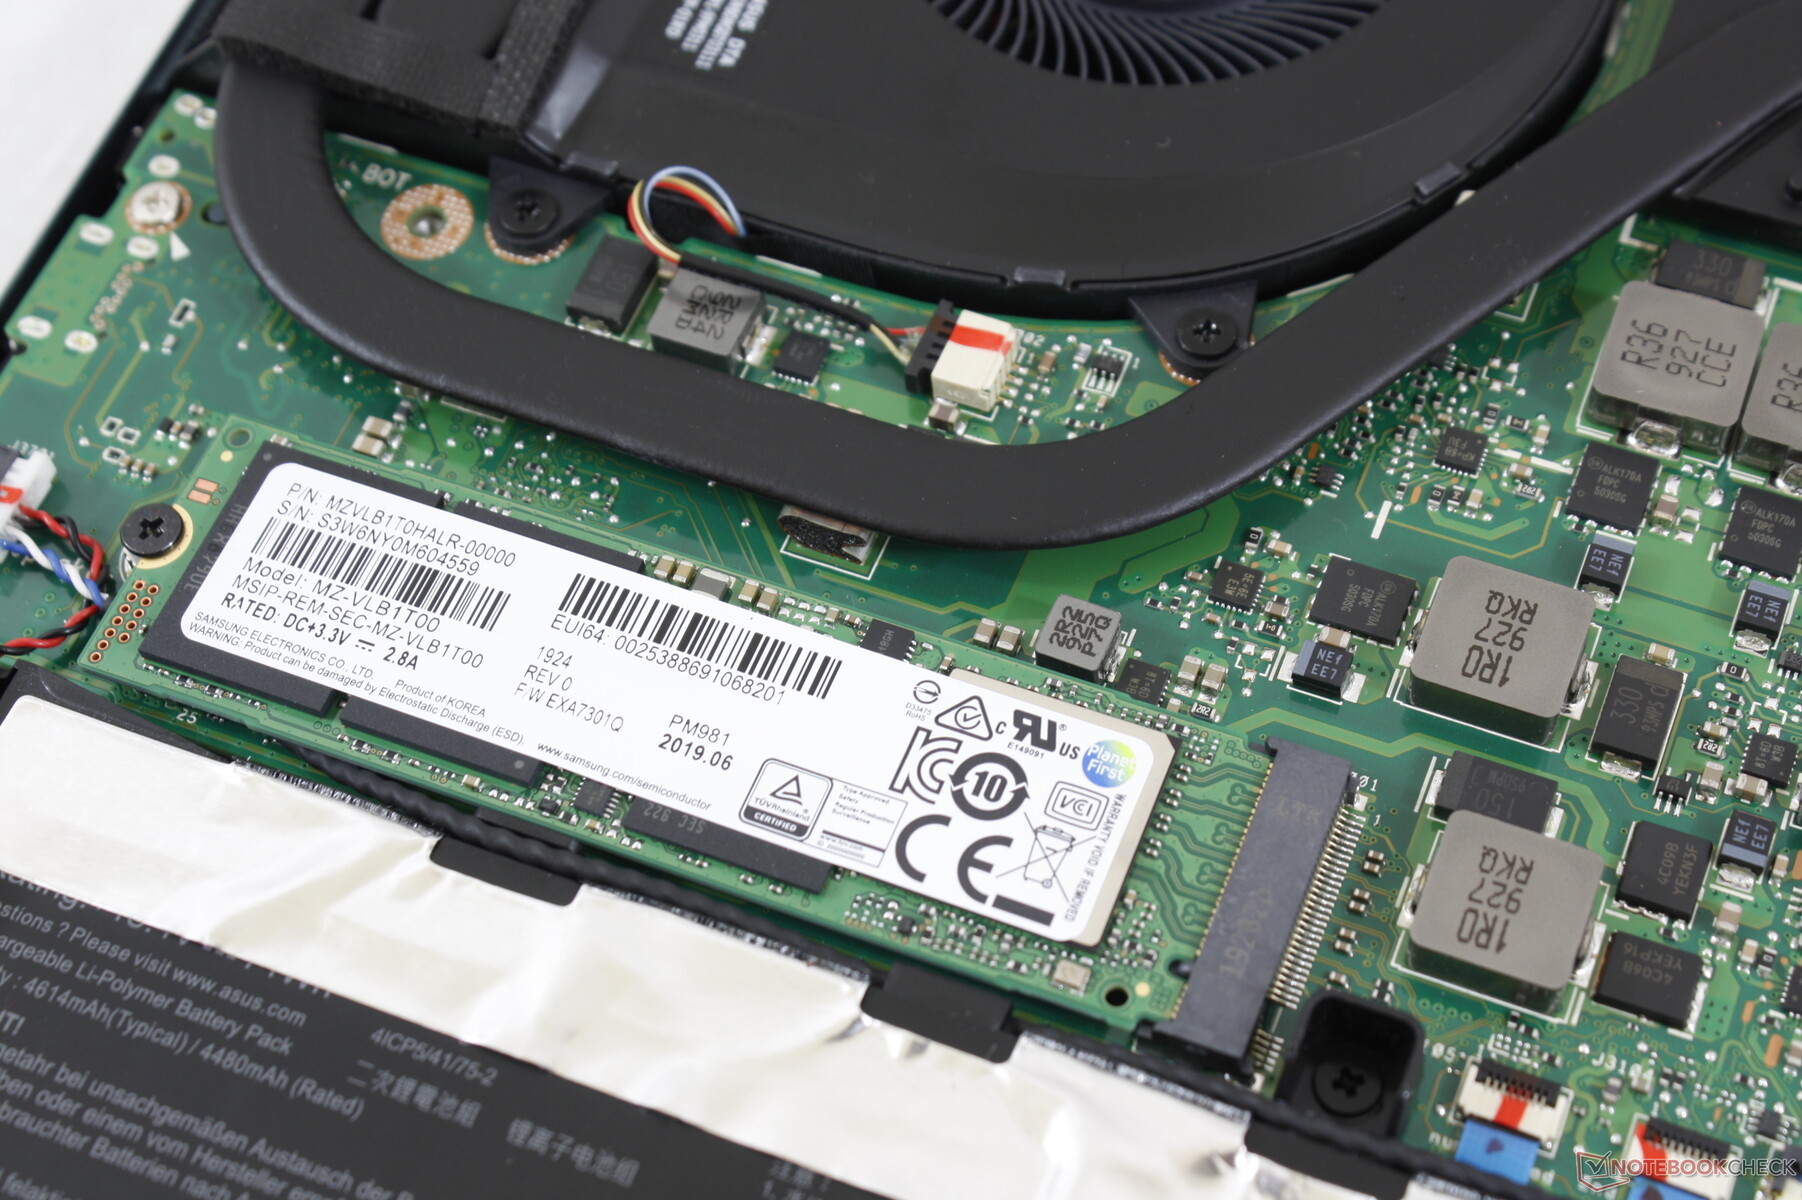
Maintenance
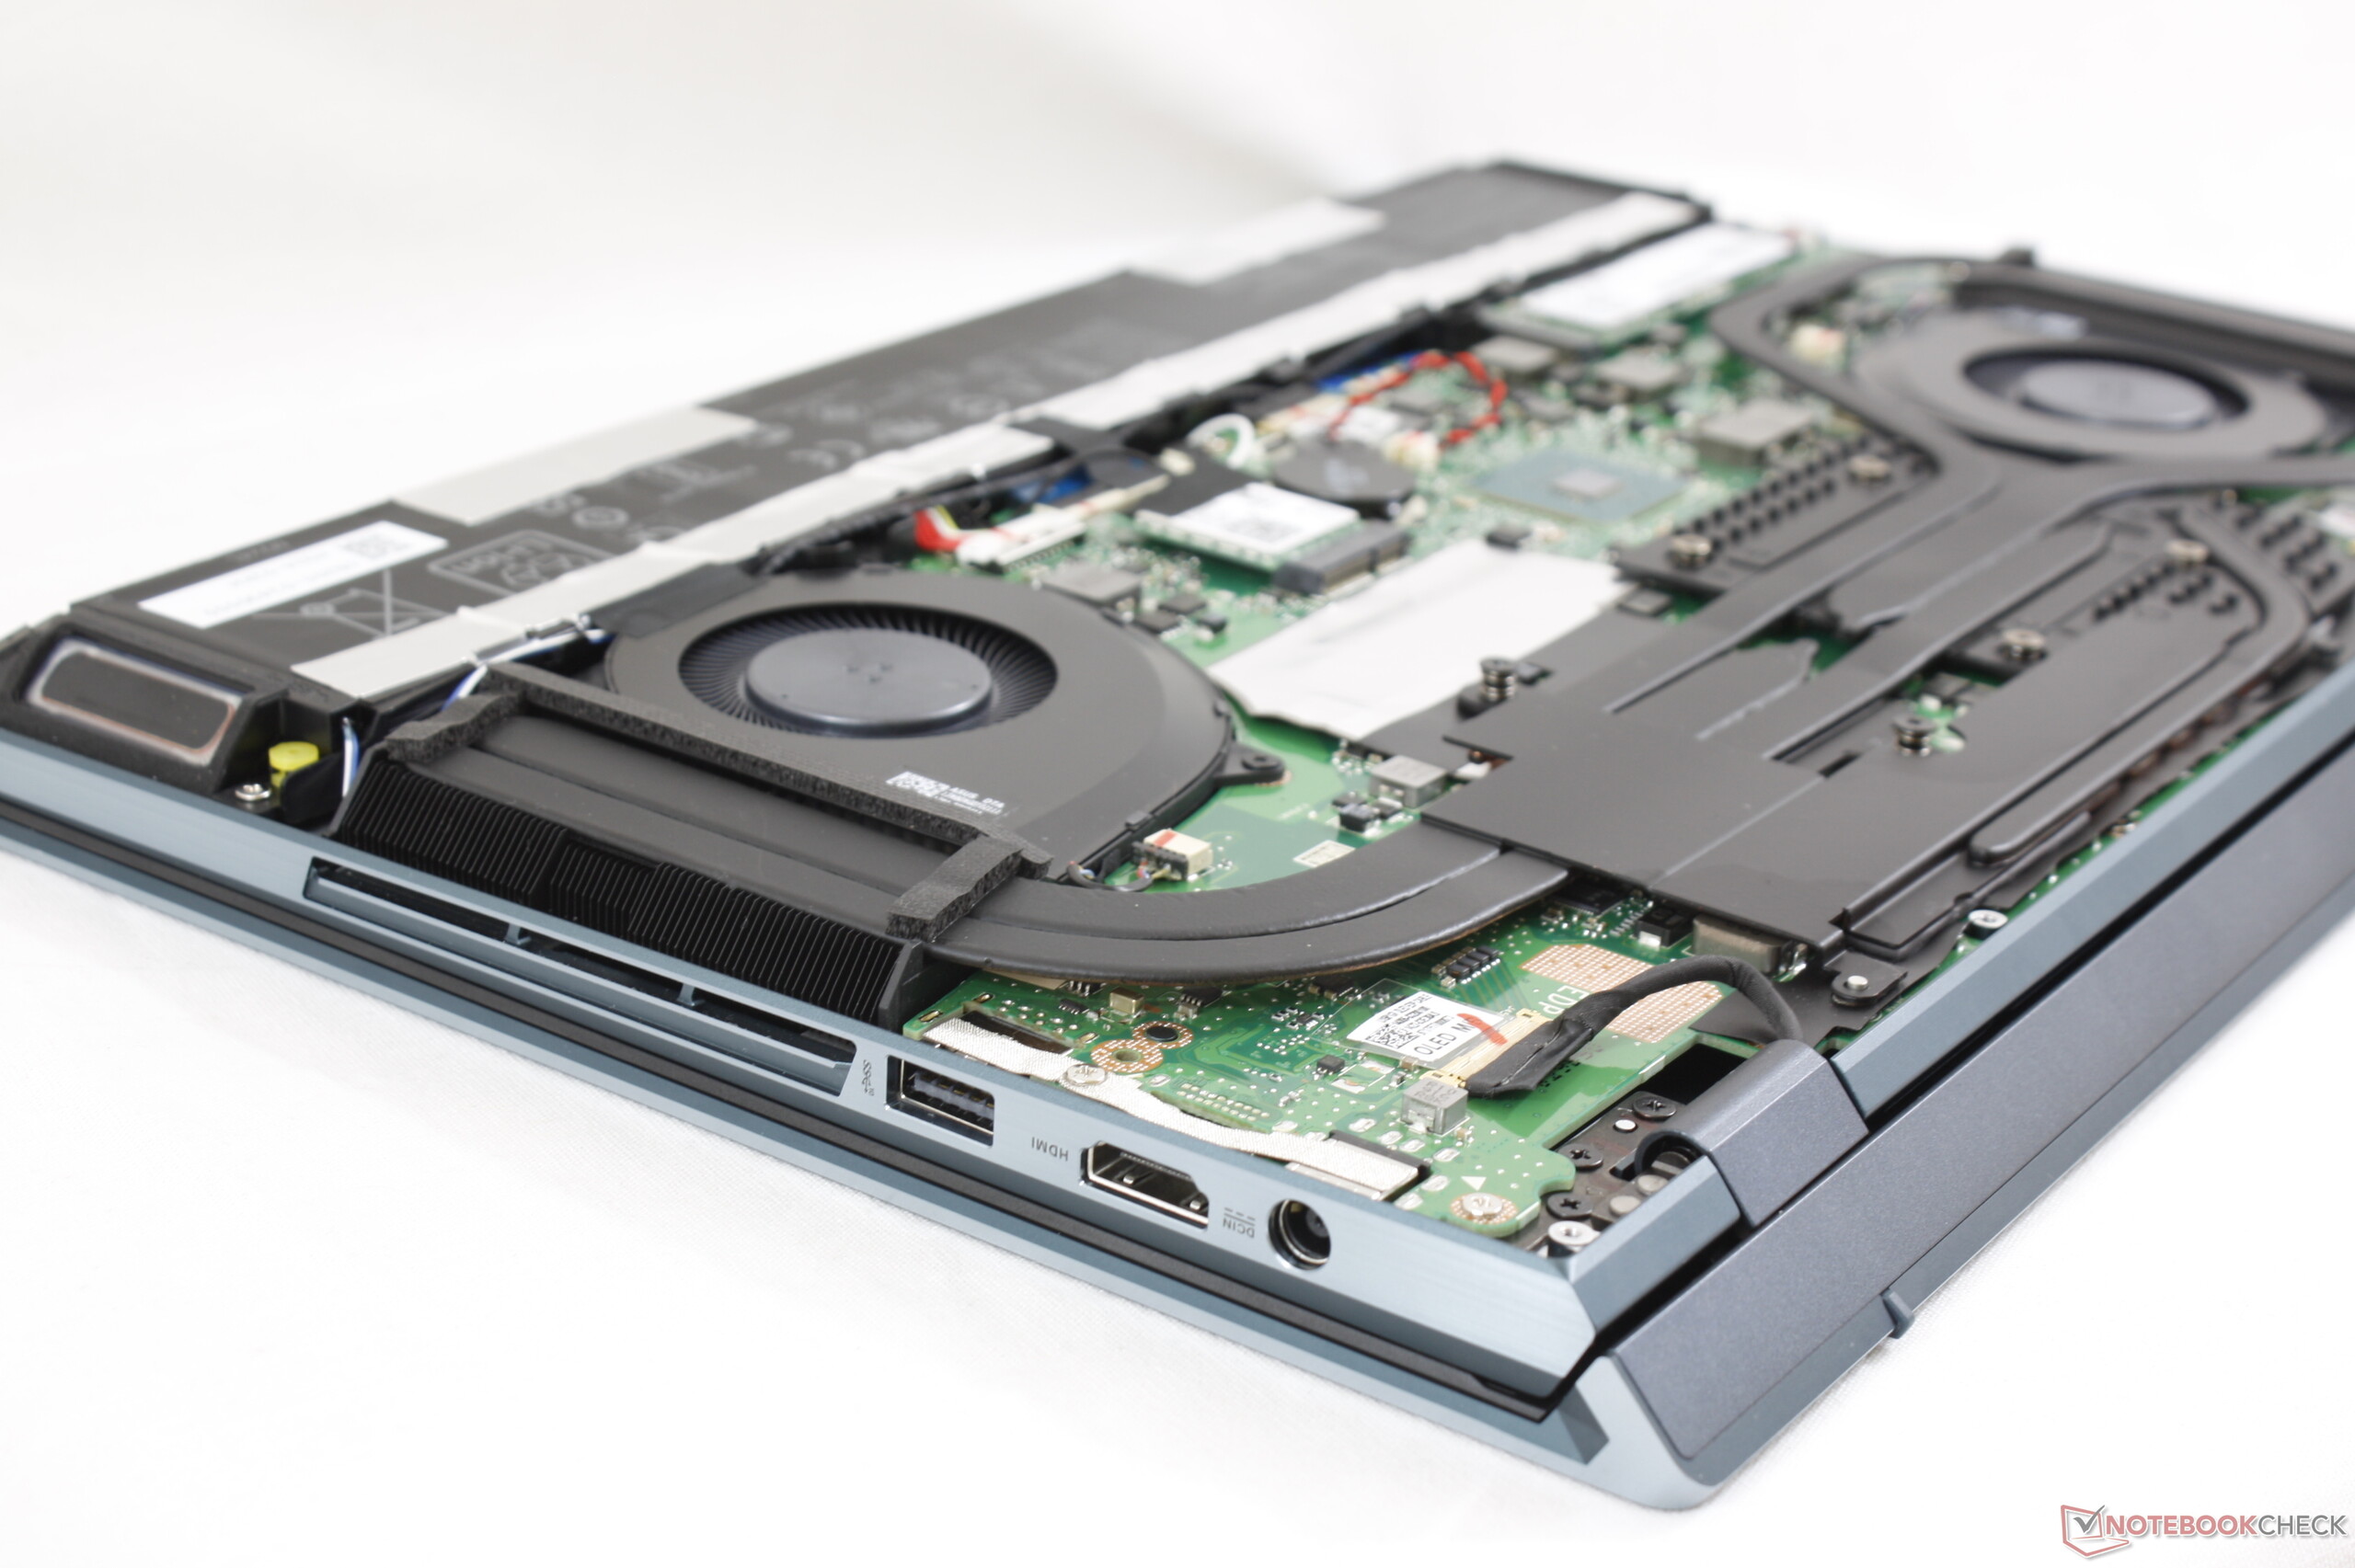
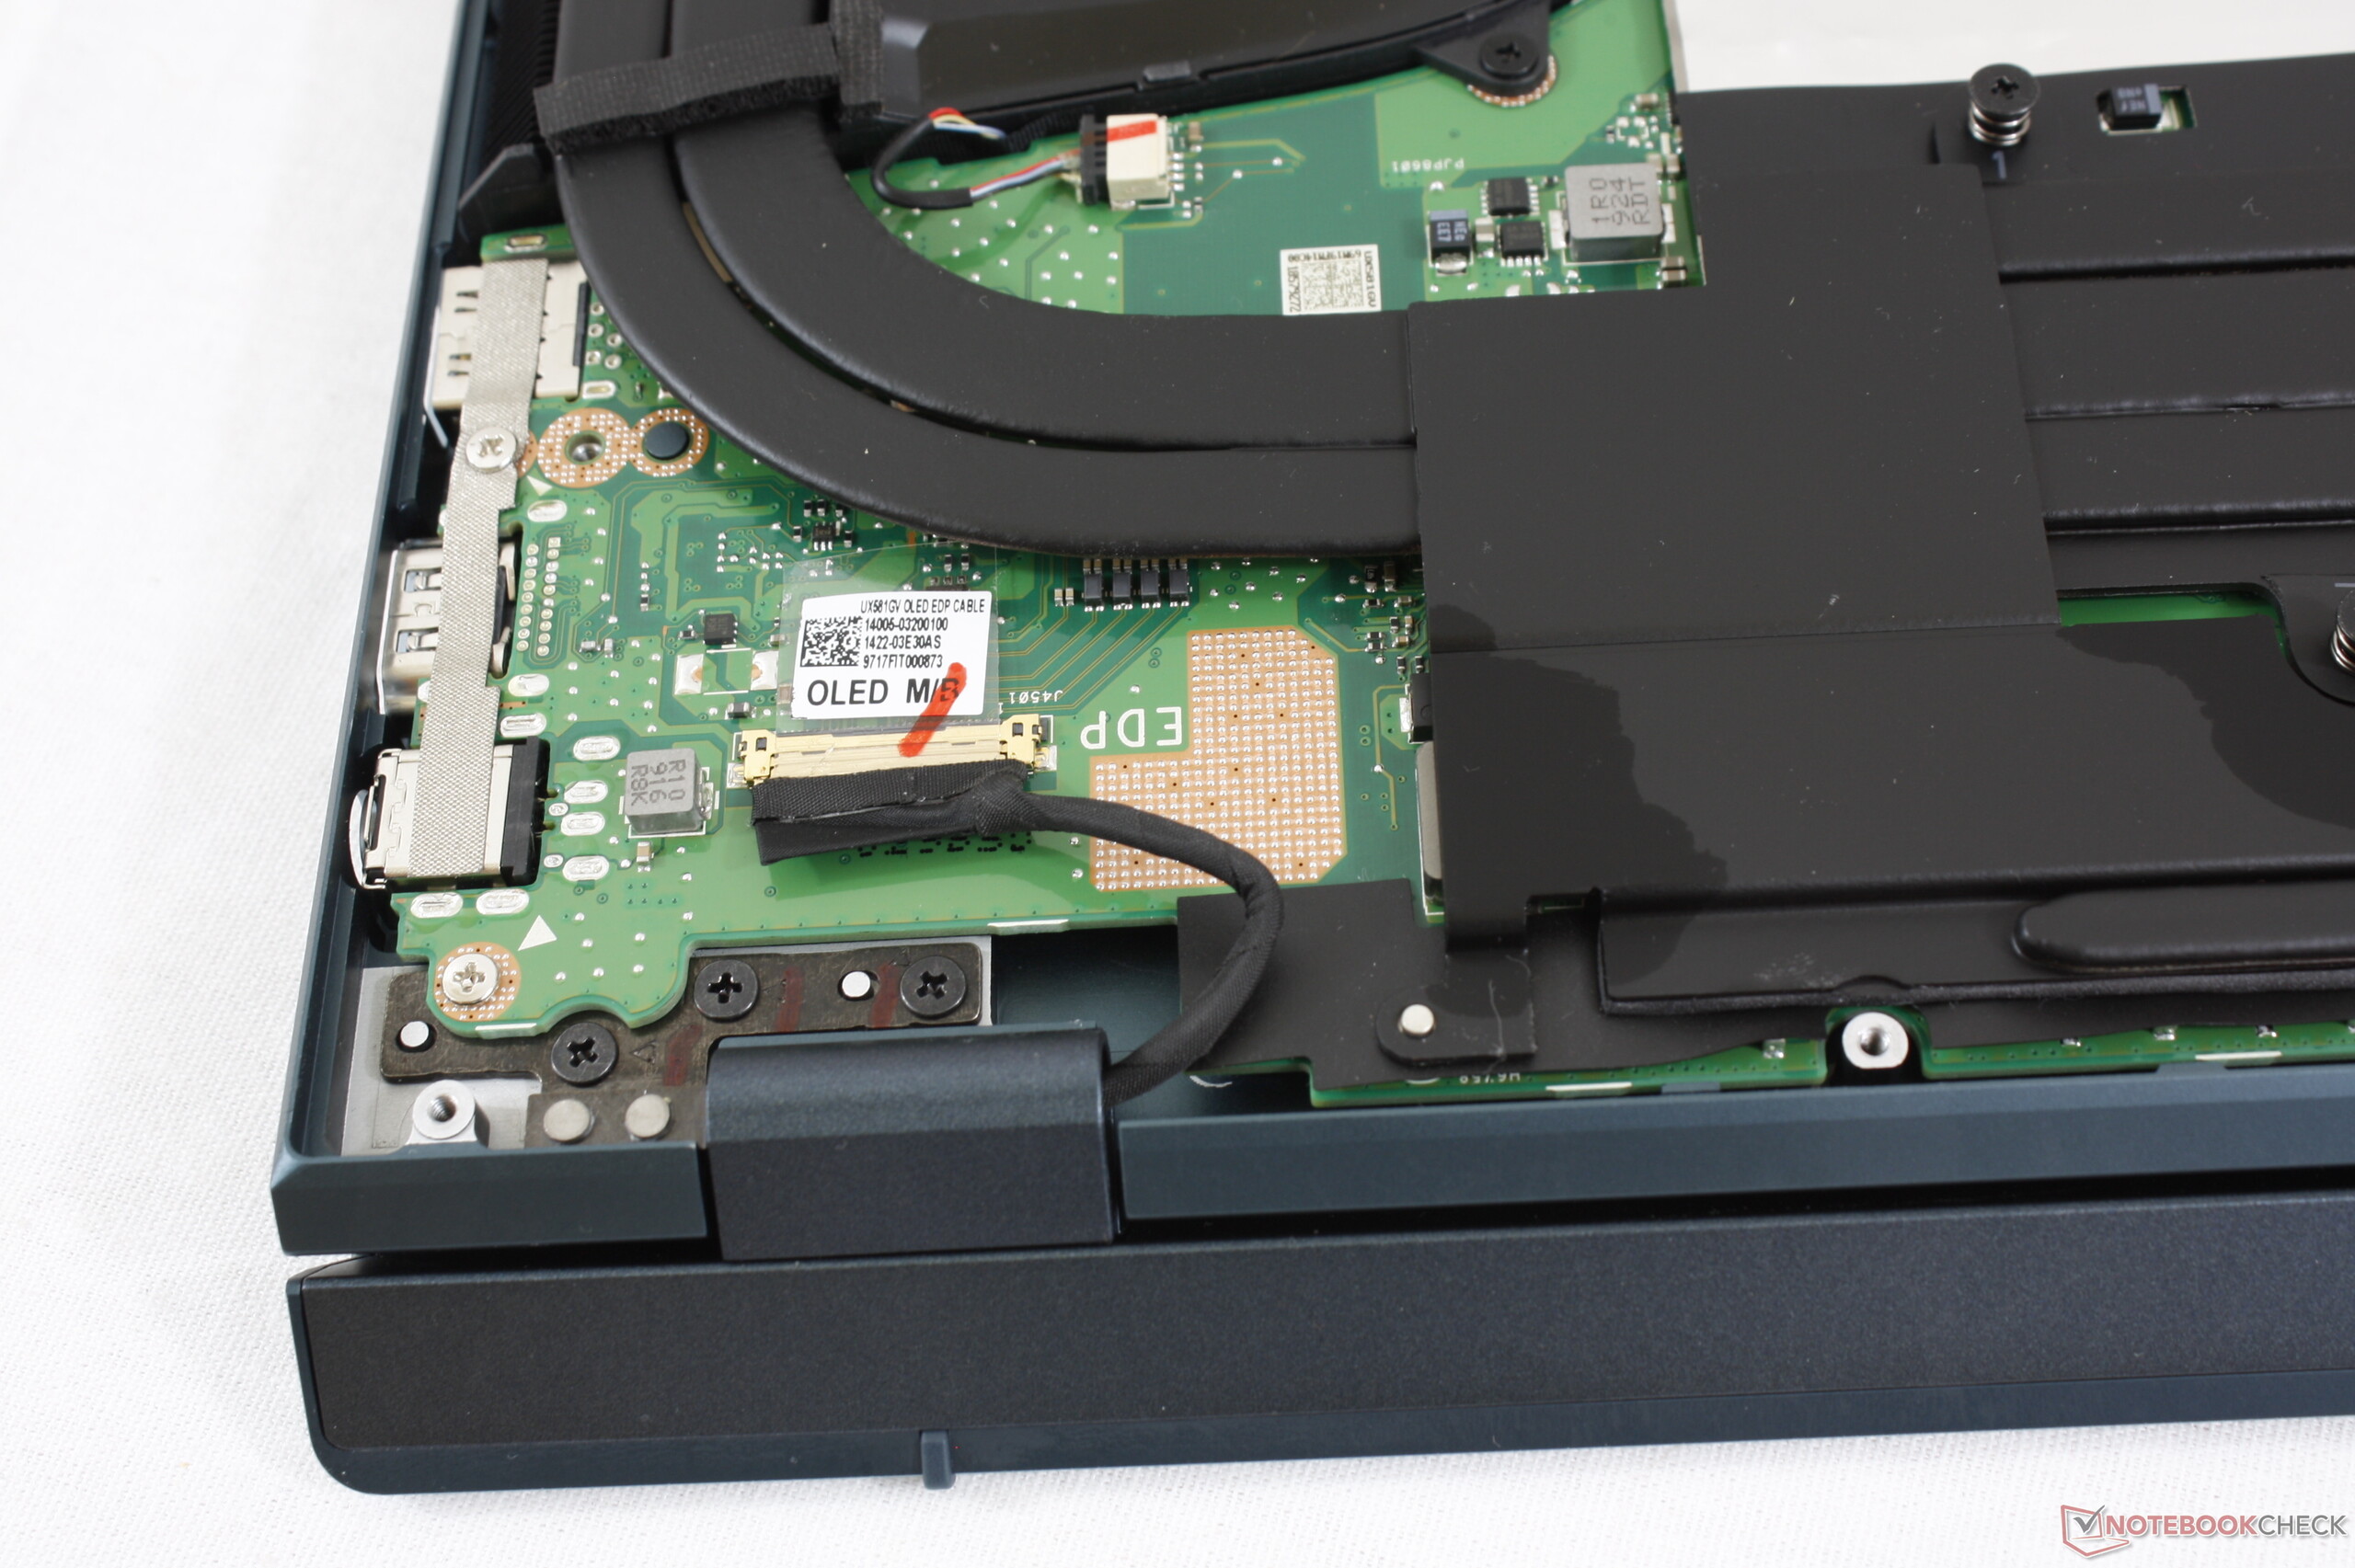
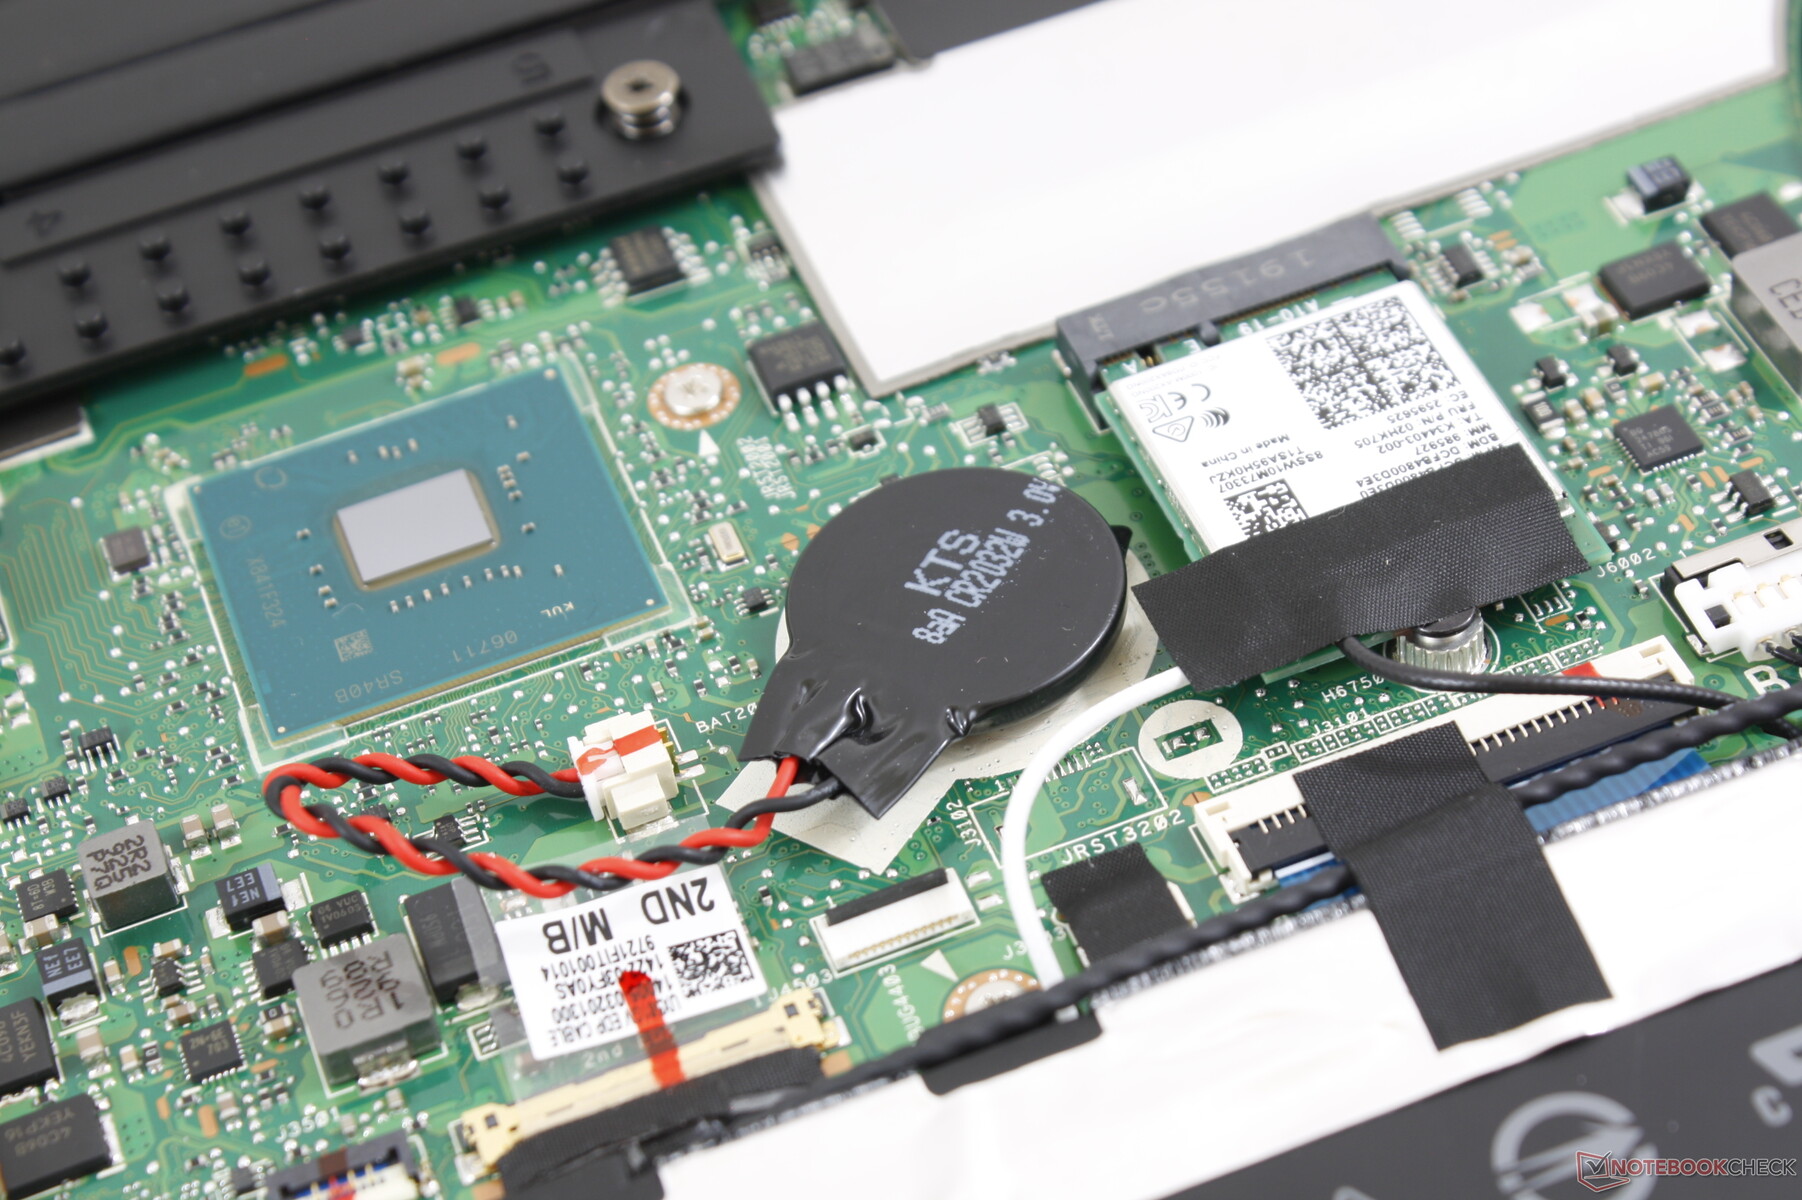
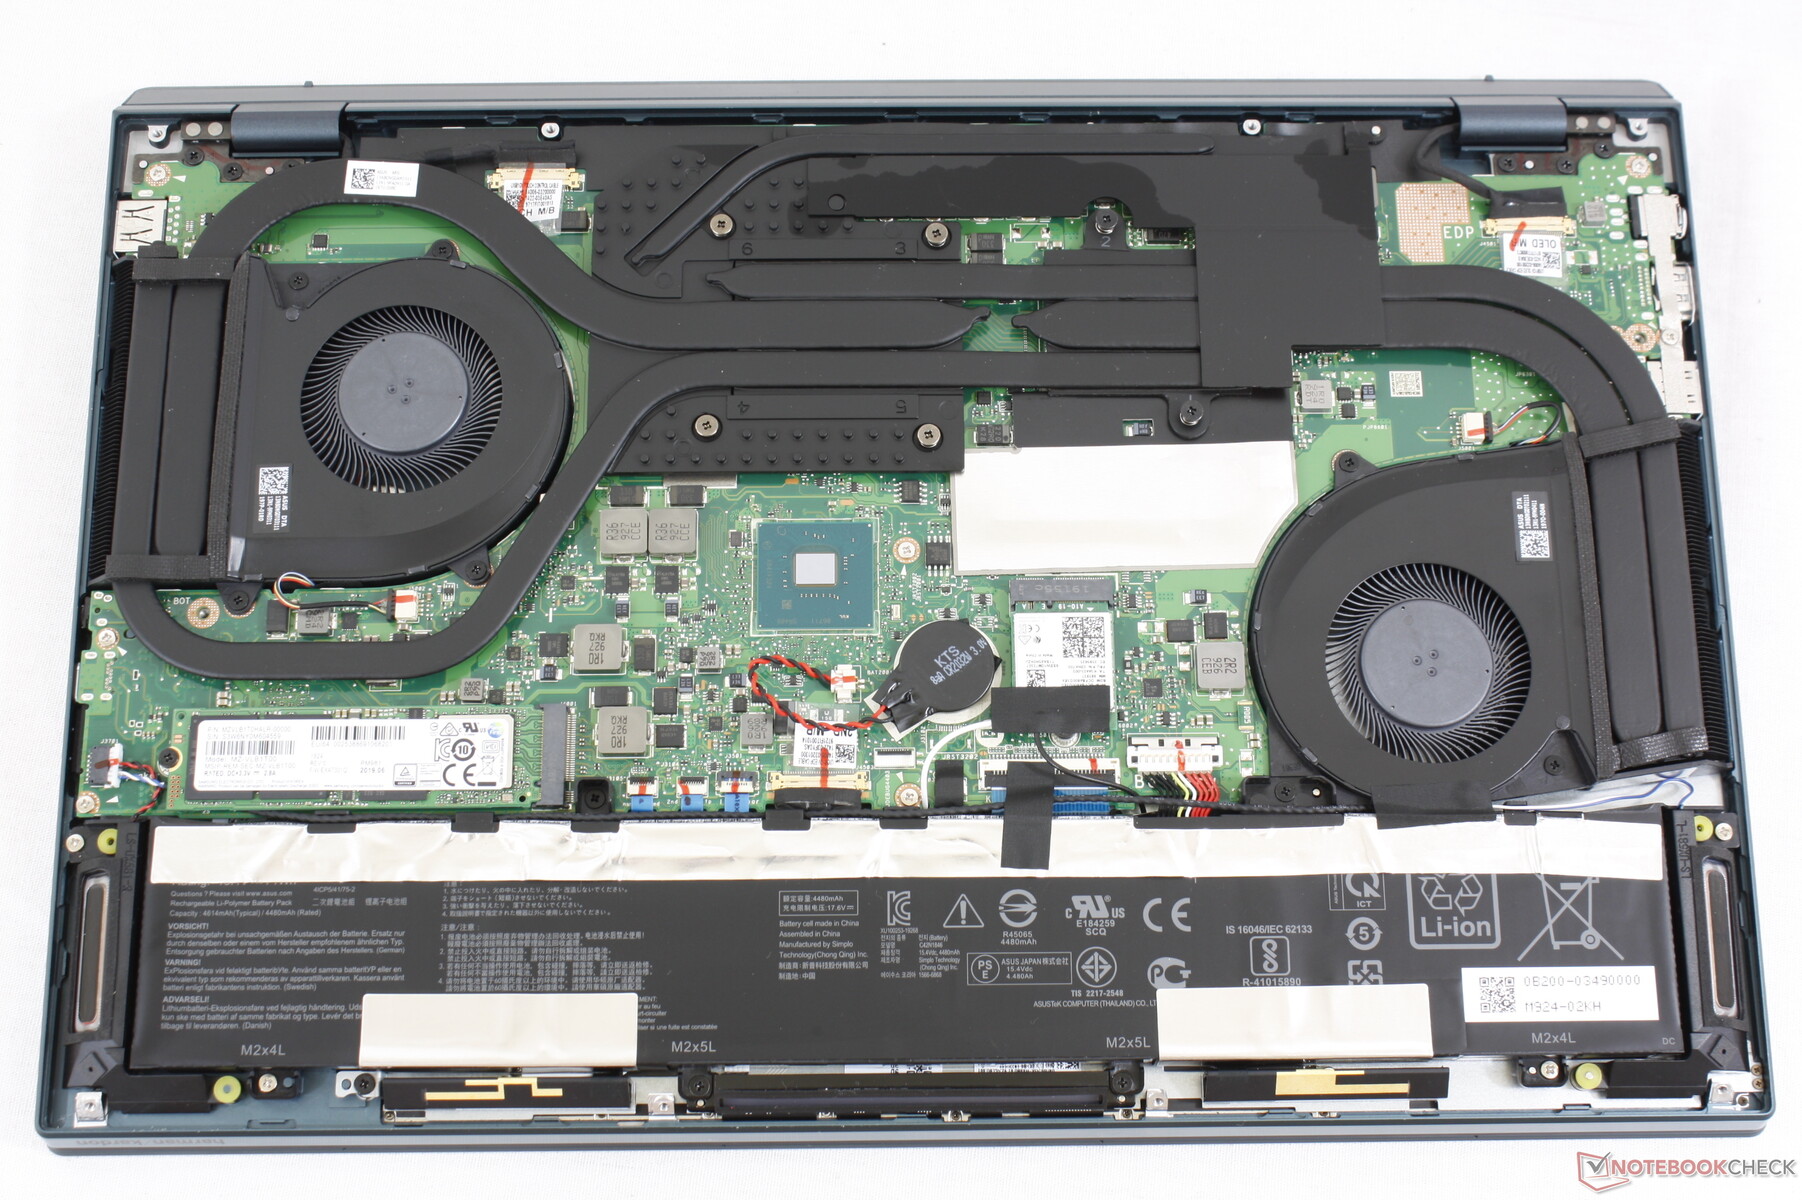
Serviceability is relatively easy provided that you have a small pair of tweezers and a T5 Torx wrench to remove the ten screws on the bottom. Two of the screws are protected by rubber plugs which must be carefully removed.
Once inside, users will be able to upgrade the WLAN and M.2 2280 SSD. RAM is soldered and the slim battery is smaller than expected.
Accessories and Warranty
Included extras are an active WACOM stylus and a plastic wrist rest that attaches to the front edge of the laptop. A velvet cleaning cloth would have been a great addition since both screens are susceptible to fingerprints.
The standard one-year limited warranty applies.
Input Devices
Keyboard
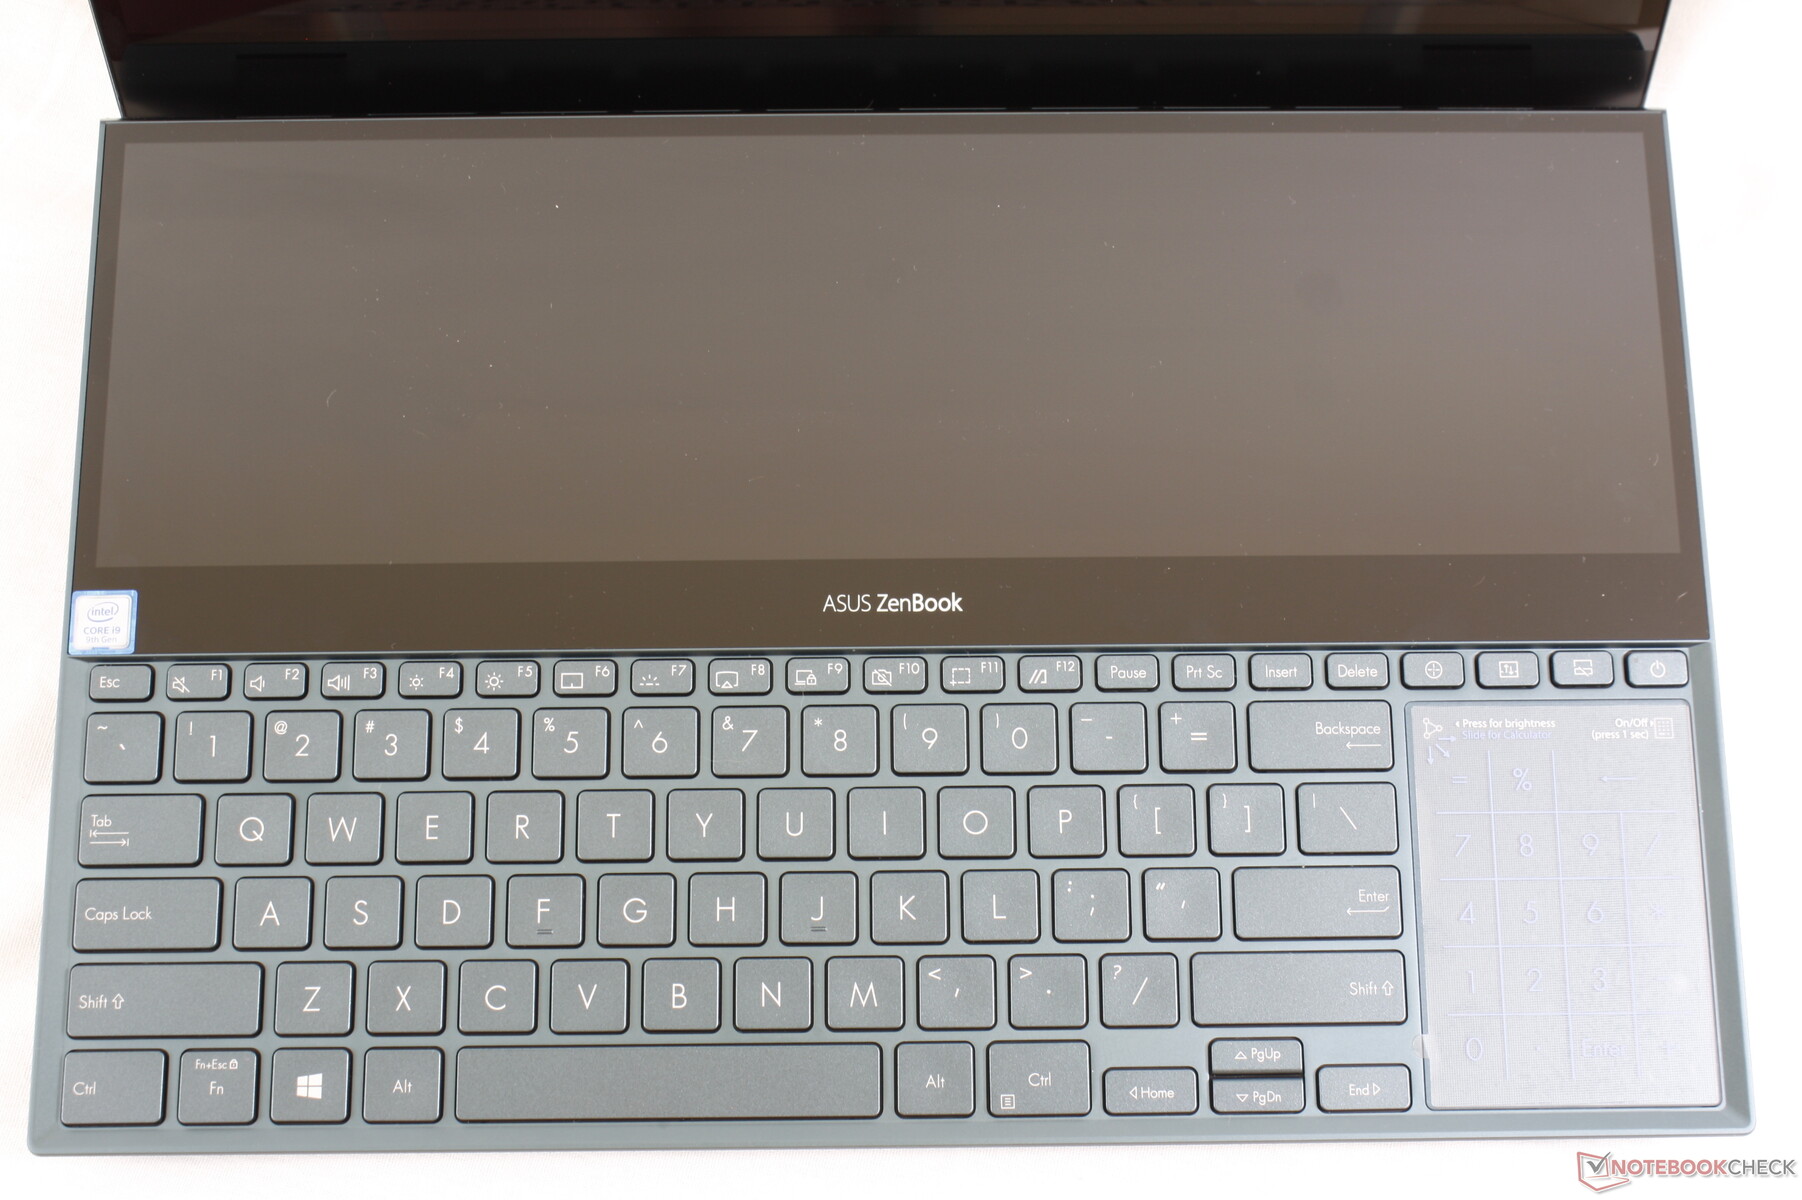
Asus has been getting better at creating front keyboards ever since the original Zephyrus GX501 days. The main QWERTY keys of the UX581 have both deeper travel and crisper feedback than on the GX501 to feel more like a typical Ultrabook keyboard that most users are already familiar with. There is one major flaw on the UX581, however, that makes typing more difficult. The front edge of the system is leveled slightly higher than the keyboard keys meaning that when you try to hit the Space key, you might hit the edge of the laptop instead. This issue does not exist on other laptops including the GX501 or HP Omen X 2S 15.
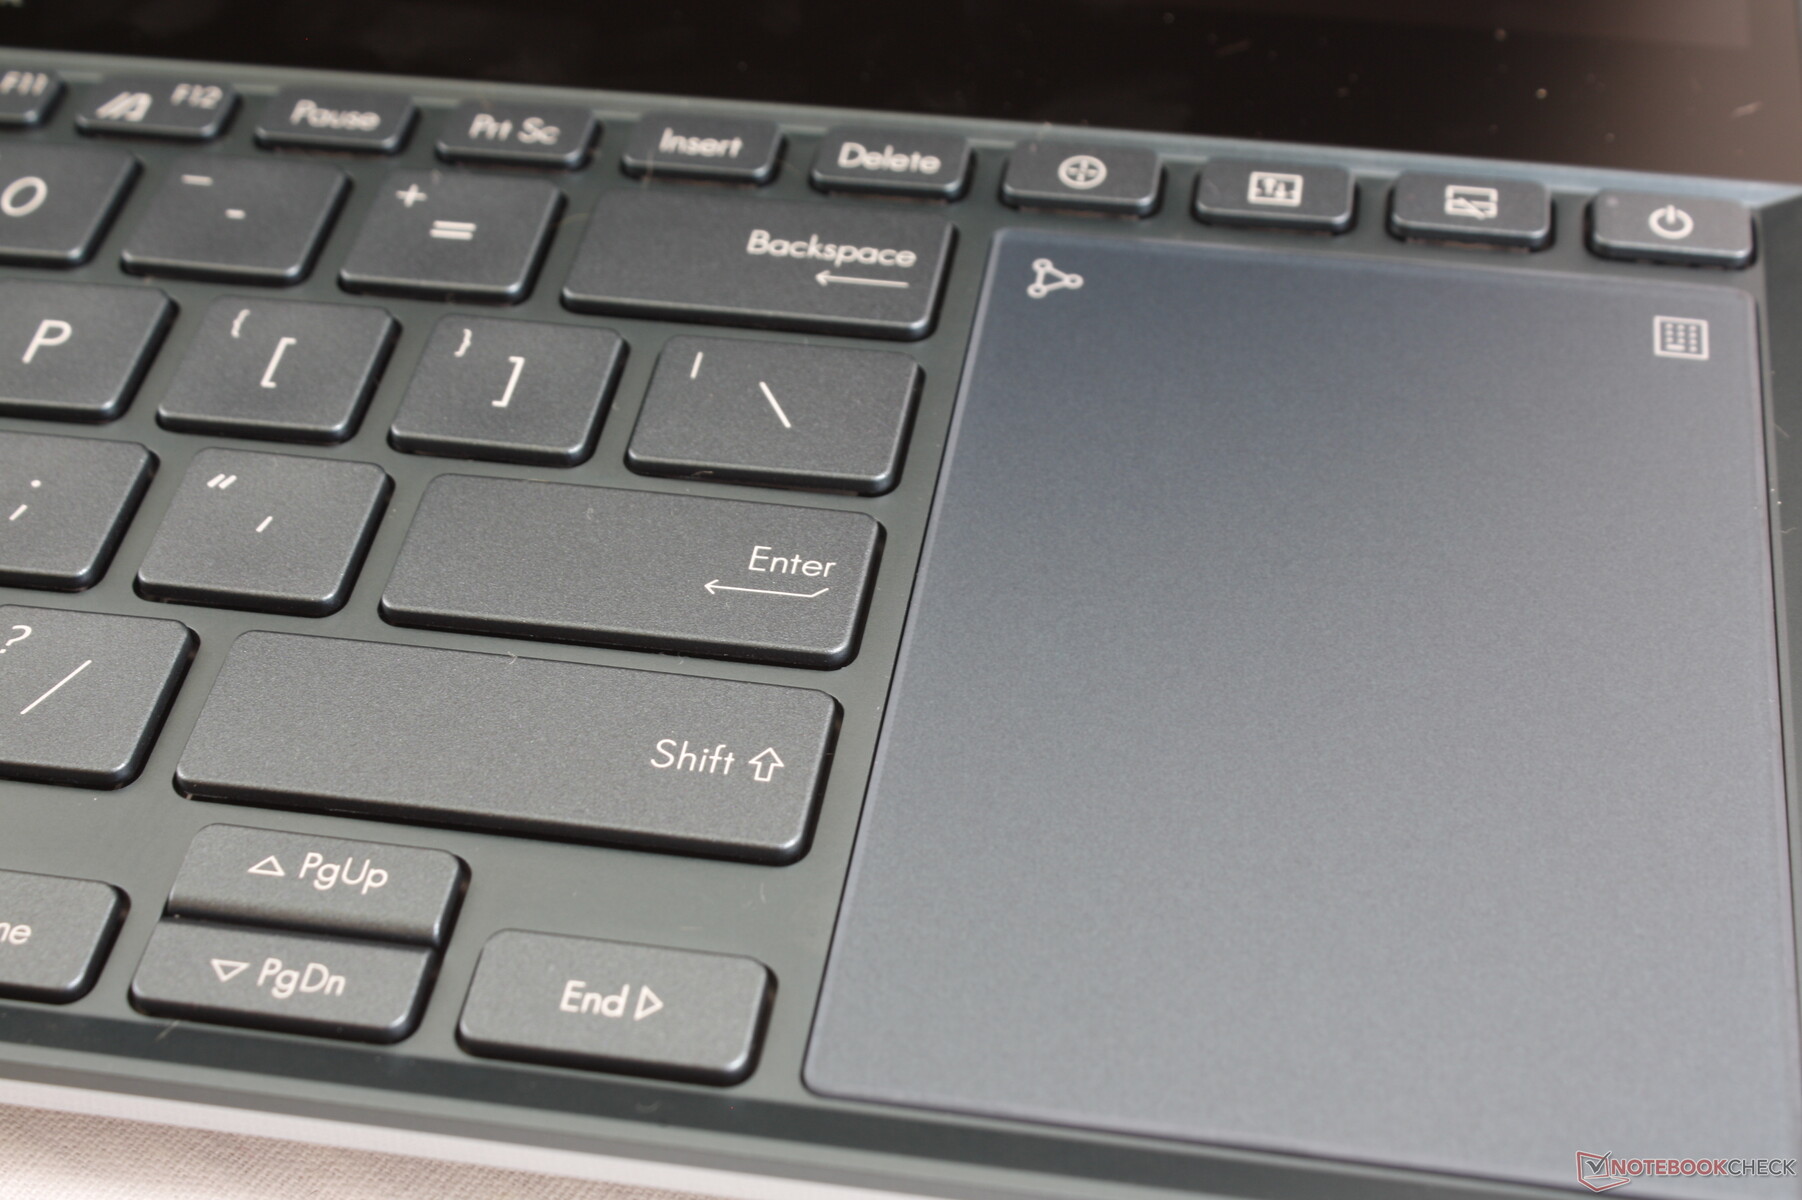
Some other disappointments include single-zone white backlighting instead of per-key RGB and the cramped Arrow keys. There are handy auxiliary keys above the clickpad for toggling Turbo Fan mode, moving the focused window to the other display, and turning on or off the second display, but they're positioned very close to the Power button which can result in some accidental Sleep moments.
Touchpad
It's inevitable that the clickpad will be small when so much of the laptop surface has been dedicated to the keyboard and secondary touchscreen. At just ~6.3 x 8.6 cm, the clickpad is smaller than the clickpad on the older ZenBook 15 UX530 (~10.4 x 7.3 cm). While it's reliable enough to get the job done with no cursor jumping or sticking issues, it's clear that you'll be wanting an external mouse whenever possible.
The integrated mouse keys are relatively quiet in clatter with shallow travel and moderate feedback. Multi-touch gestures are not as accurate as on a trackpad with dedicated mouse keys like on the GX501. Meanwhile, the virtual NumPad from the UX533 has returned in case if users need a quick NumPad. If you rely heavily on a NumPad for work, however, then a cheap USB solution with physical keys will still be the preferred way to go.

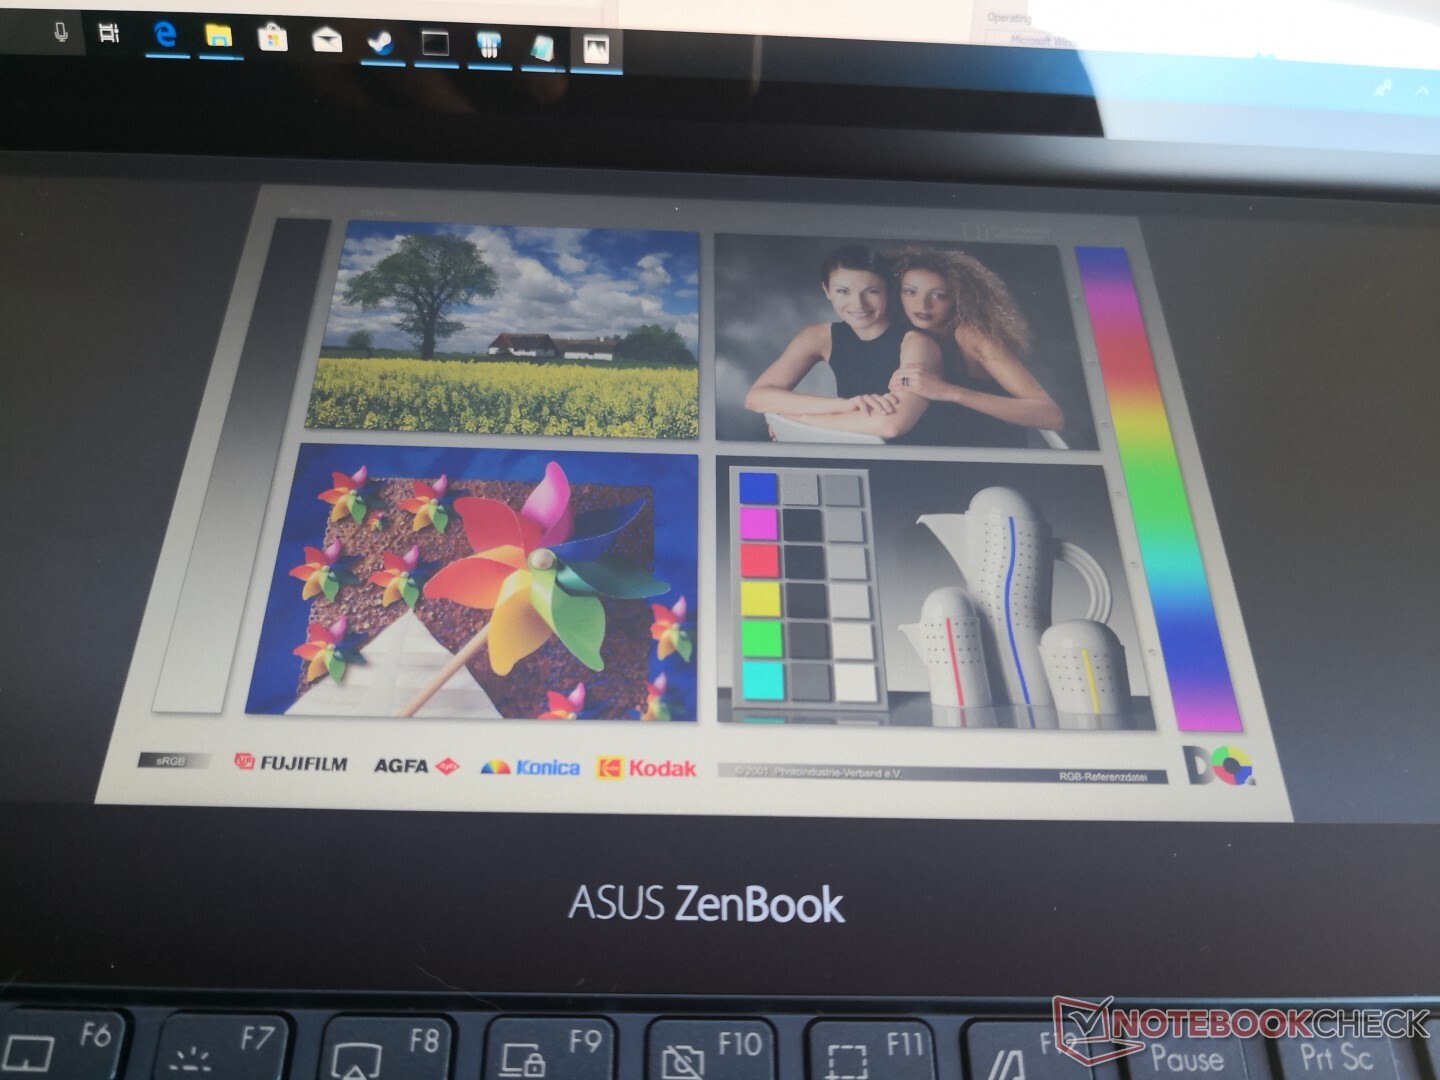
Display
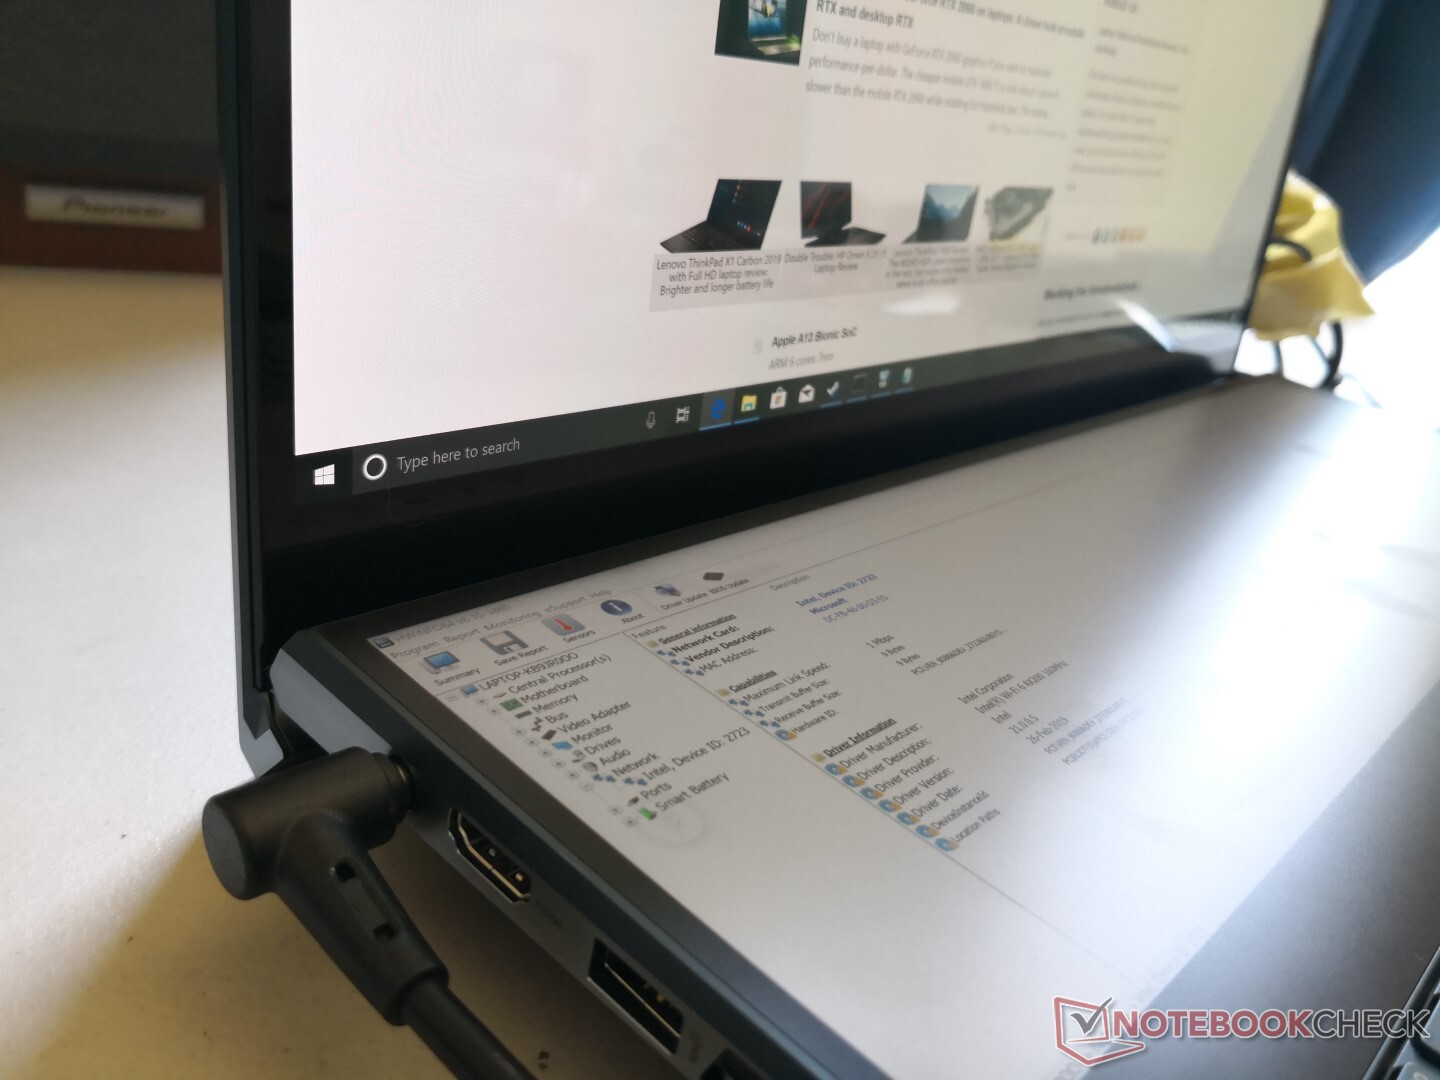
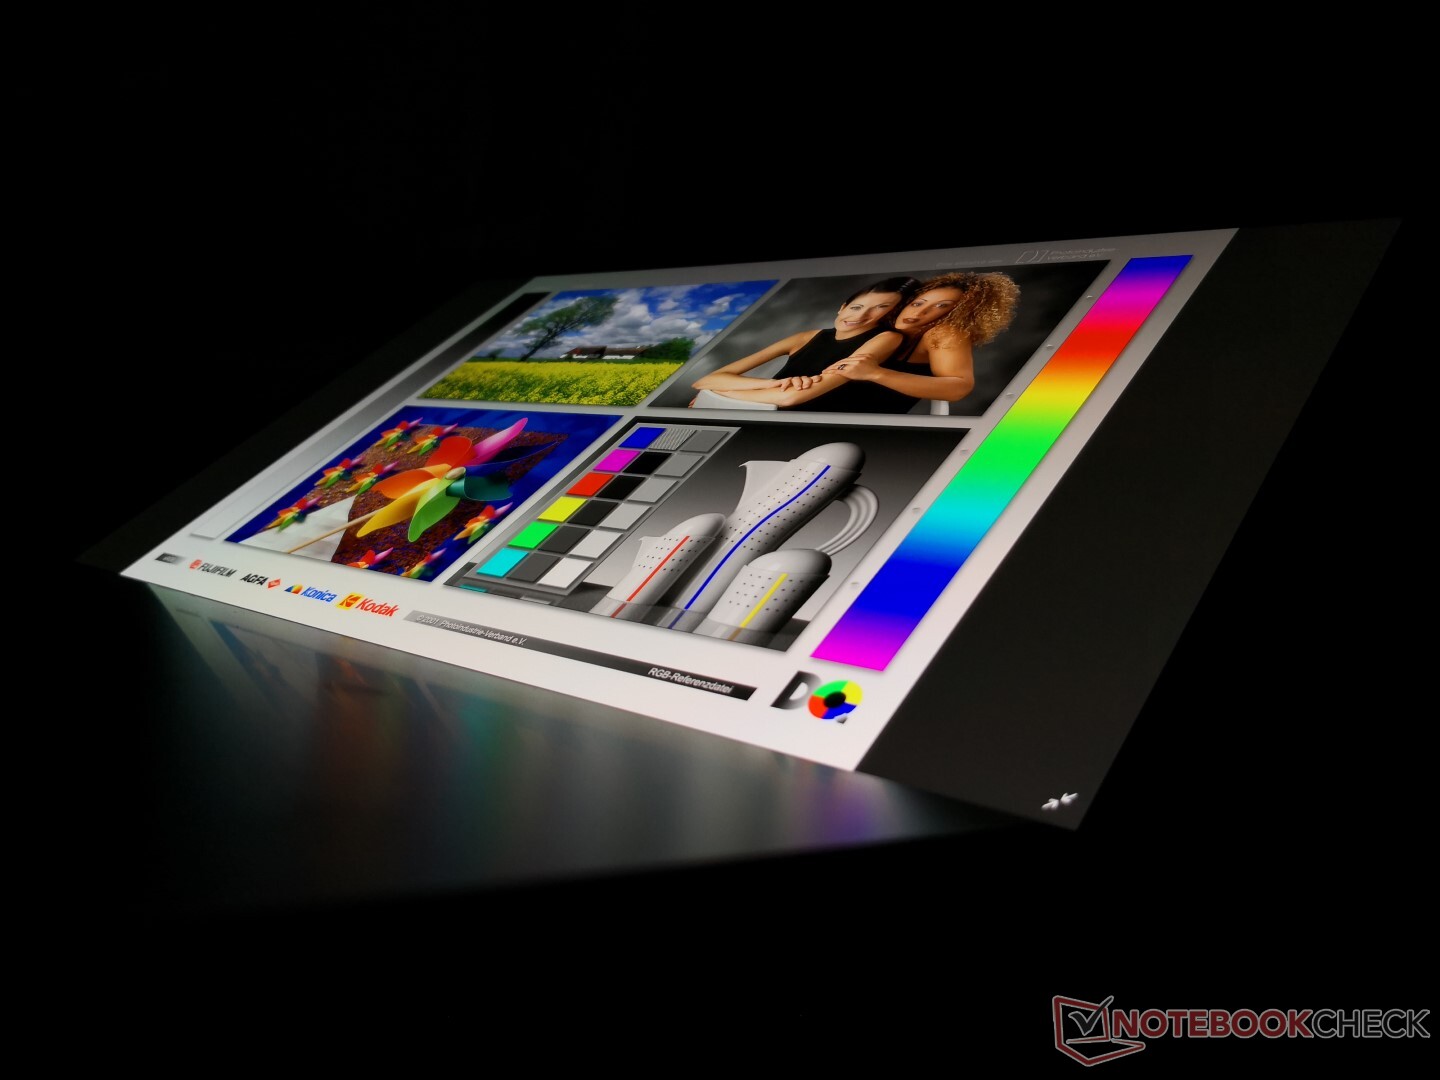
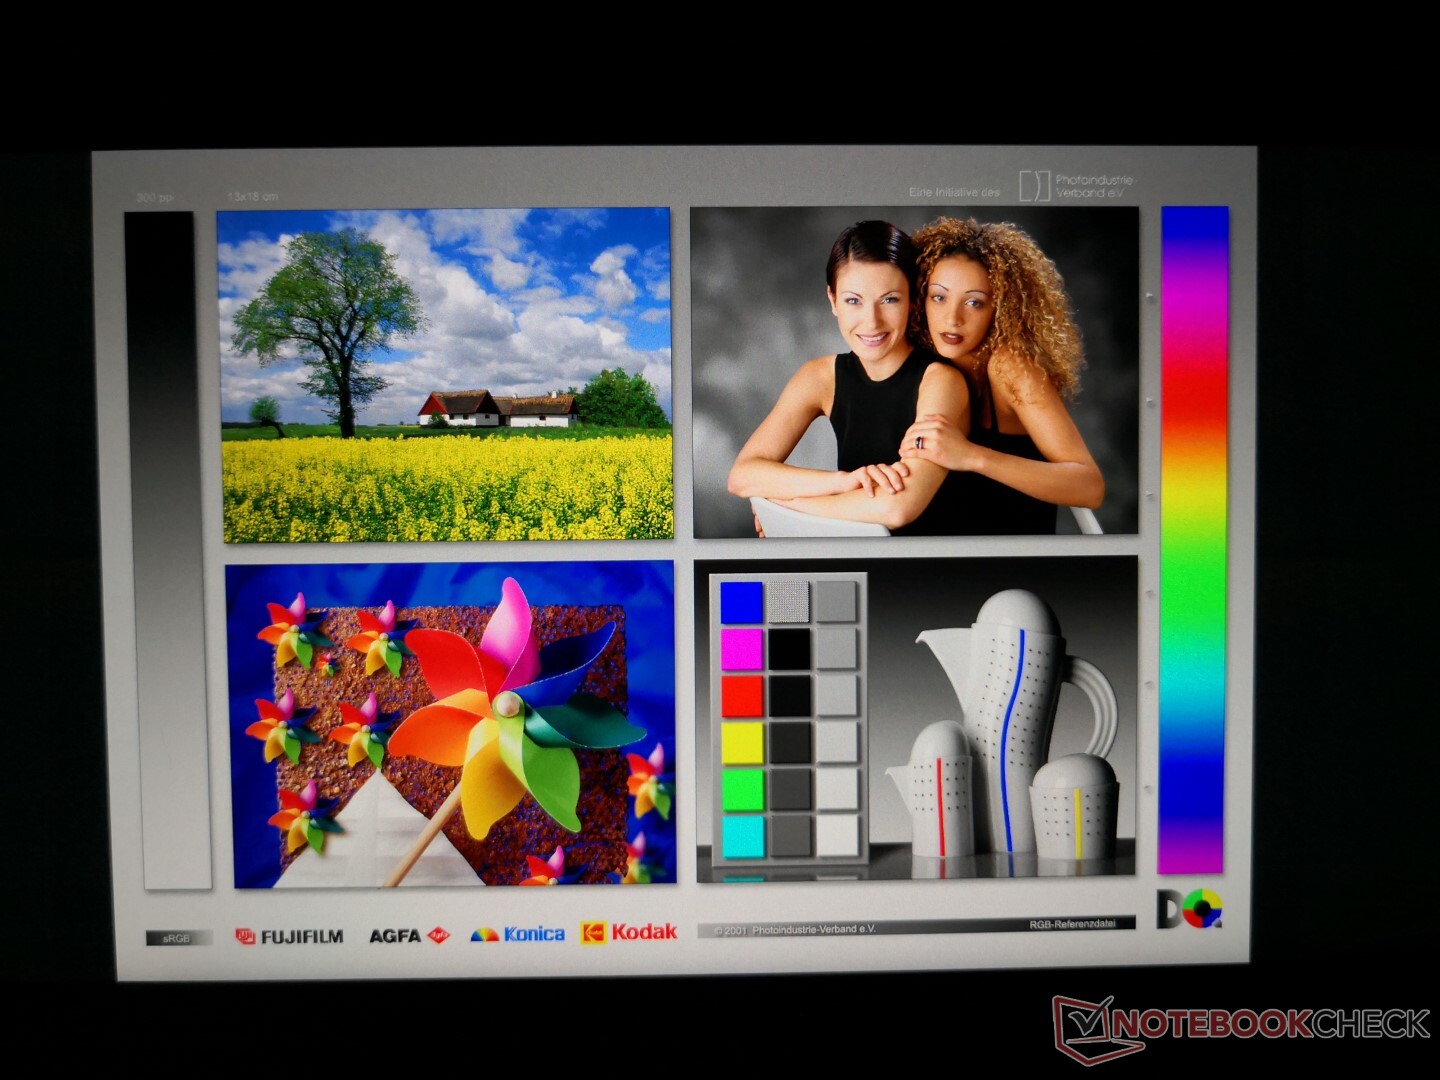
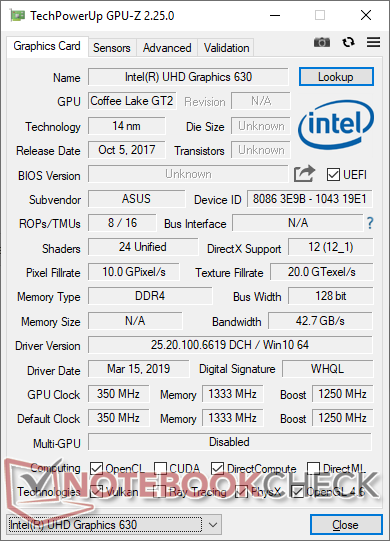
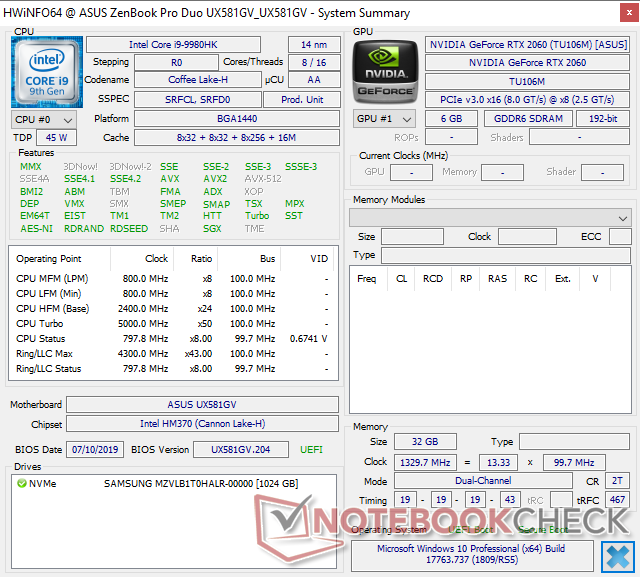
The glossy 4K UHD main display is an OLED panel sourced from Samsung. While HWiNFO is unable to identify the exact panel name, the SDCA029 controller is the same as the one found on the Dell XPS 15 OLED, Razer Blade 15 OLED, and Eurocom Nightsky RX15 OLED to suggest a very similar visual experience between these enthusiast laptops. All the usual benefits of OLED are here including the extremely fast response times for almost no ghosting, 100 percent DCI-P3 coverage, very deep black levels, no uneven backlight bleeding, and accurate colors out of the box. Even the unusually sudden change in PWM behavior from 0 to 52 percent and 53 percent to 100 percent is present.
A notable disadvantage of the OLED panel on the Asus is that it's slightly dimmer than on other 15.6-inch OLED laptops. We're able to record a maximum of 360 nits versus 421 nits, 473 nits, and 415 nits on the XPS 15, Blade 15, and Nightsky RX15, respectively. Nonetheless, the panel is still brighter than most IPS laptops while offering much wider colors as well.

| |||||||||||||||||||||||||
Brightness Distribution: 94 %
Center on Battery: 359.7 cd/m²
Contrast: ∞:1 (Black: 0 cd/m²)
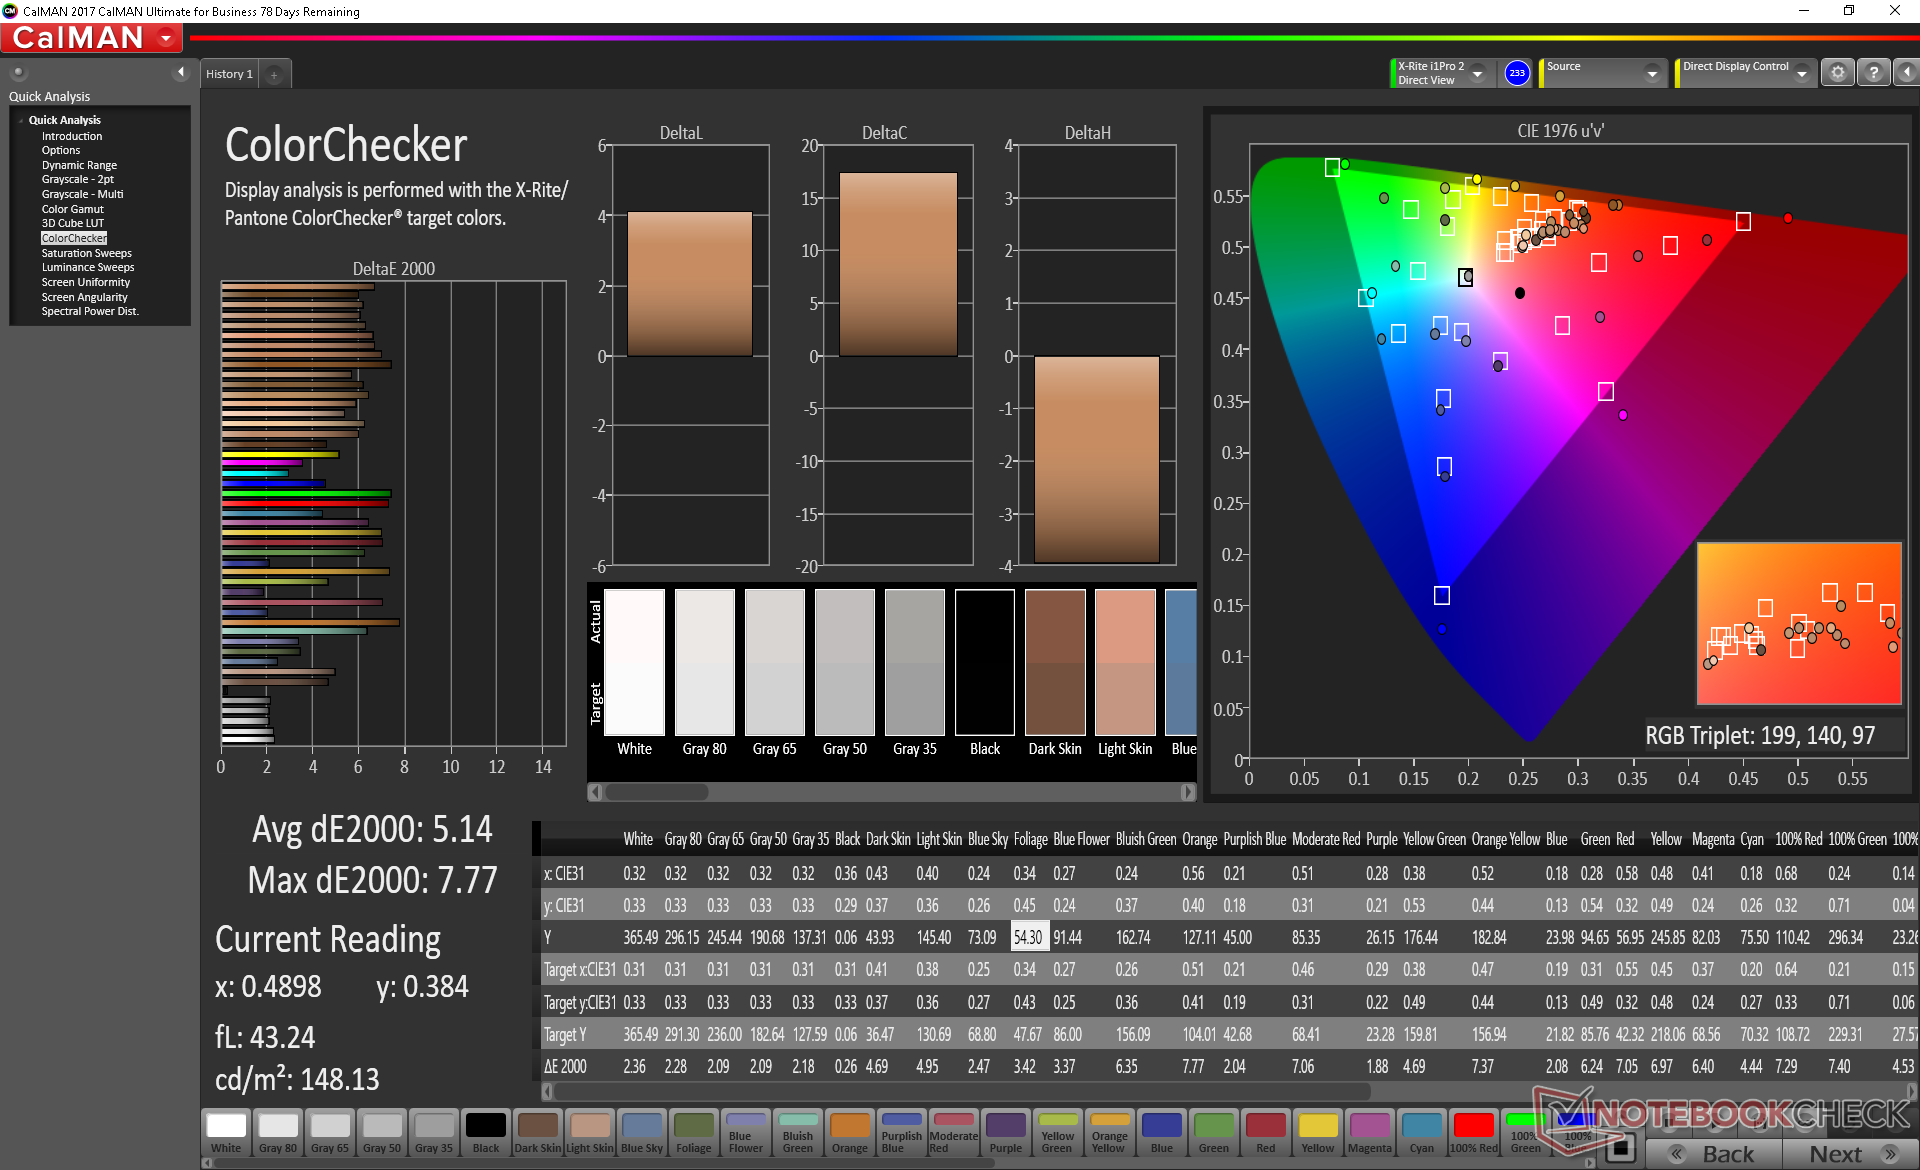
ΔE ColorChecker Calman: 5.14 | ∀{0.5-29.43 Ø4.73}
ΔE Greyscale Calman: 2.7 | ∀{0.09-98 Ø4.97}
81.3% sRGB (Argyll 1.6.3 3D)
61.8% AdobeRGB 1998 (Argyll 1.6.3 3D)
67.3% AdobeRGB 1998 (Argyll 3D)
81% sRGB (Argyll 3D)
63.5% Display P3 (Argyll 3D)
Gamma: 2
CCT: 6220 K
| Asus ZenBook Pro Duo UX581GV Samsung SDCA029, OLED, 15.6", 3840x2160 | Asus ZenBook Pro 15 UX580GE AU Optronics B156ZAN03.1, IPS, 15.6", 3840x2160 | Asus ZenBook 15 UX533FD BOE07D8, IPS, 15.6", 1920x1080 | Asus Strix Scar III G531GW Sharp LQ156M1JW09 (SHP14D3), IPS, 15.6", 1920x1080 | HP Omen X 2S 15-dg0075cl AU Optronics AUO82ED, IPS, 15.6", 1920x1080 | Dell XPS 15 7590 9980HK GTX 1650 Samsung 156WR04, SDCA029, OLED, 15.6", 3840x2160 | |
|---|---|---|---|---|---|---|
| Display | 35% | 4% | 8% | 6% | 33% | |
| Display P3 Coverage (%) | 63.5 | 85.9 35% | 67.2 6% | 66.2 4% | 66.2 4% | 88.1 39% |
| sRGB Coverage (%) | 81 | 100 23% | 88.4 9% | 96.5 19% | 92.3 14% | 99.6 23% |
| AdobeRGB 1998 Coverage (%) | 67.3 | 99.1 47% | 64.6 -4% | 67.5 0% | 67.2 0% | 91.8 36% |
| Response Times | -1339% | -1634% | -507% | -453% | 2% | |
| Response Time Grey 50% / Grey 80% * (ms) | 2.2 ? | 44 ? -1900% | 45 ? -1945% | 17.2 ? -682% | 15.2 ? -591% | 2.3 ? -5% |
| Response Time Black / White * (ms) | 2.6 ? | 22.8 ? -777% | 37 ? -1323% | 11.2 ? -331% | 10.8 ? -315% | 2.4 ? 8% |
| PWM Frequency (Hz) | 240.4 ? | 24040 ? | 59.5 ? | |||
| Screen | 9% | -18% | 11% | -15% | 1% | |
| Brightness middle (cd/m²) | 359.7 | 357.6 -1% | 311 -14% | 266 -26% | 324.8 -10% | 421.2 17% |
| Brightness (cd/m²) | 366 | 350 -4% | 303 -17% | 252 -31% | 316 -14% | 417 14% |
| Brightness Distribution (%) | 94 | 85 -10% | 81 -14% | 88 -6% | 84 -11% | 94 0% |
| Black Level * (cd/m²) | 0.35 | 0.24 | 0.27 | 0.26 | ||
| Colorchecker dE 2000 * | 5.14 | 4.12 20% | 5.1 1% | 1.81 65% | 4.96 4% | 6.06 -18% |
| Colorchecker dE 2000 max. * | 7.77 | 9.91 -28% | 8.91 -15% | 3.23 58% | 8.95 -15% | 11.89 -53% |
| Greyscale dE 2000 * | 2.7 | 1.8 33% | 4.93 -83% | 2.44 10% | 5 -85% | 2.8 -4% |
| Gamma | 2 110% | 2.17 101% | 2.44 90% | 2.42 91% | 2.21 100% | 2.15 102% |
| CCT | 6220 105% | 6613 98% | 7641 85% | 7005 93% | 7742 84% | 6235 104% |
| Color Space (Percent of AdobeRGB 1998) (%) | 61.8 | 87.5 42% | 58 -6% | 62 0% | 59.8 -3% | 81 31% |
| Color Space (Percent of sRGB) (%) | 81.3 | 100 23% | 88 8% | 97 19% | 91.8 13% | 99.6 23% |
| Contrast (:1) | 1022 | 1296 | 985 | 1249 | ||
| Colorchecker dE 2000 calibrated * | 4.23 | 2.48 | 1.03 | 3.23 | ||
| Total Average (Program / Settings) | -432% /
-192% | -549% /
-261% | -163% /
-69% | -154% /
-78% | 12% /
9% |
* ... smaller is better
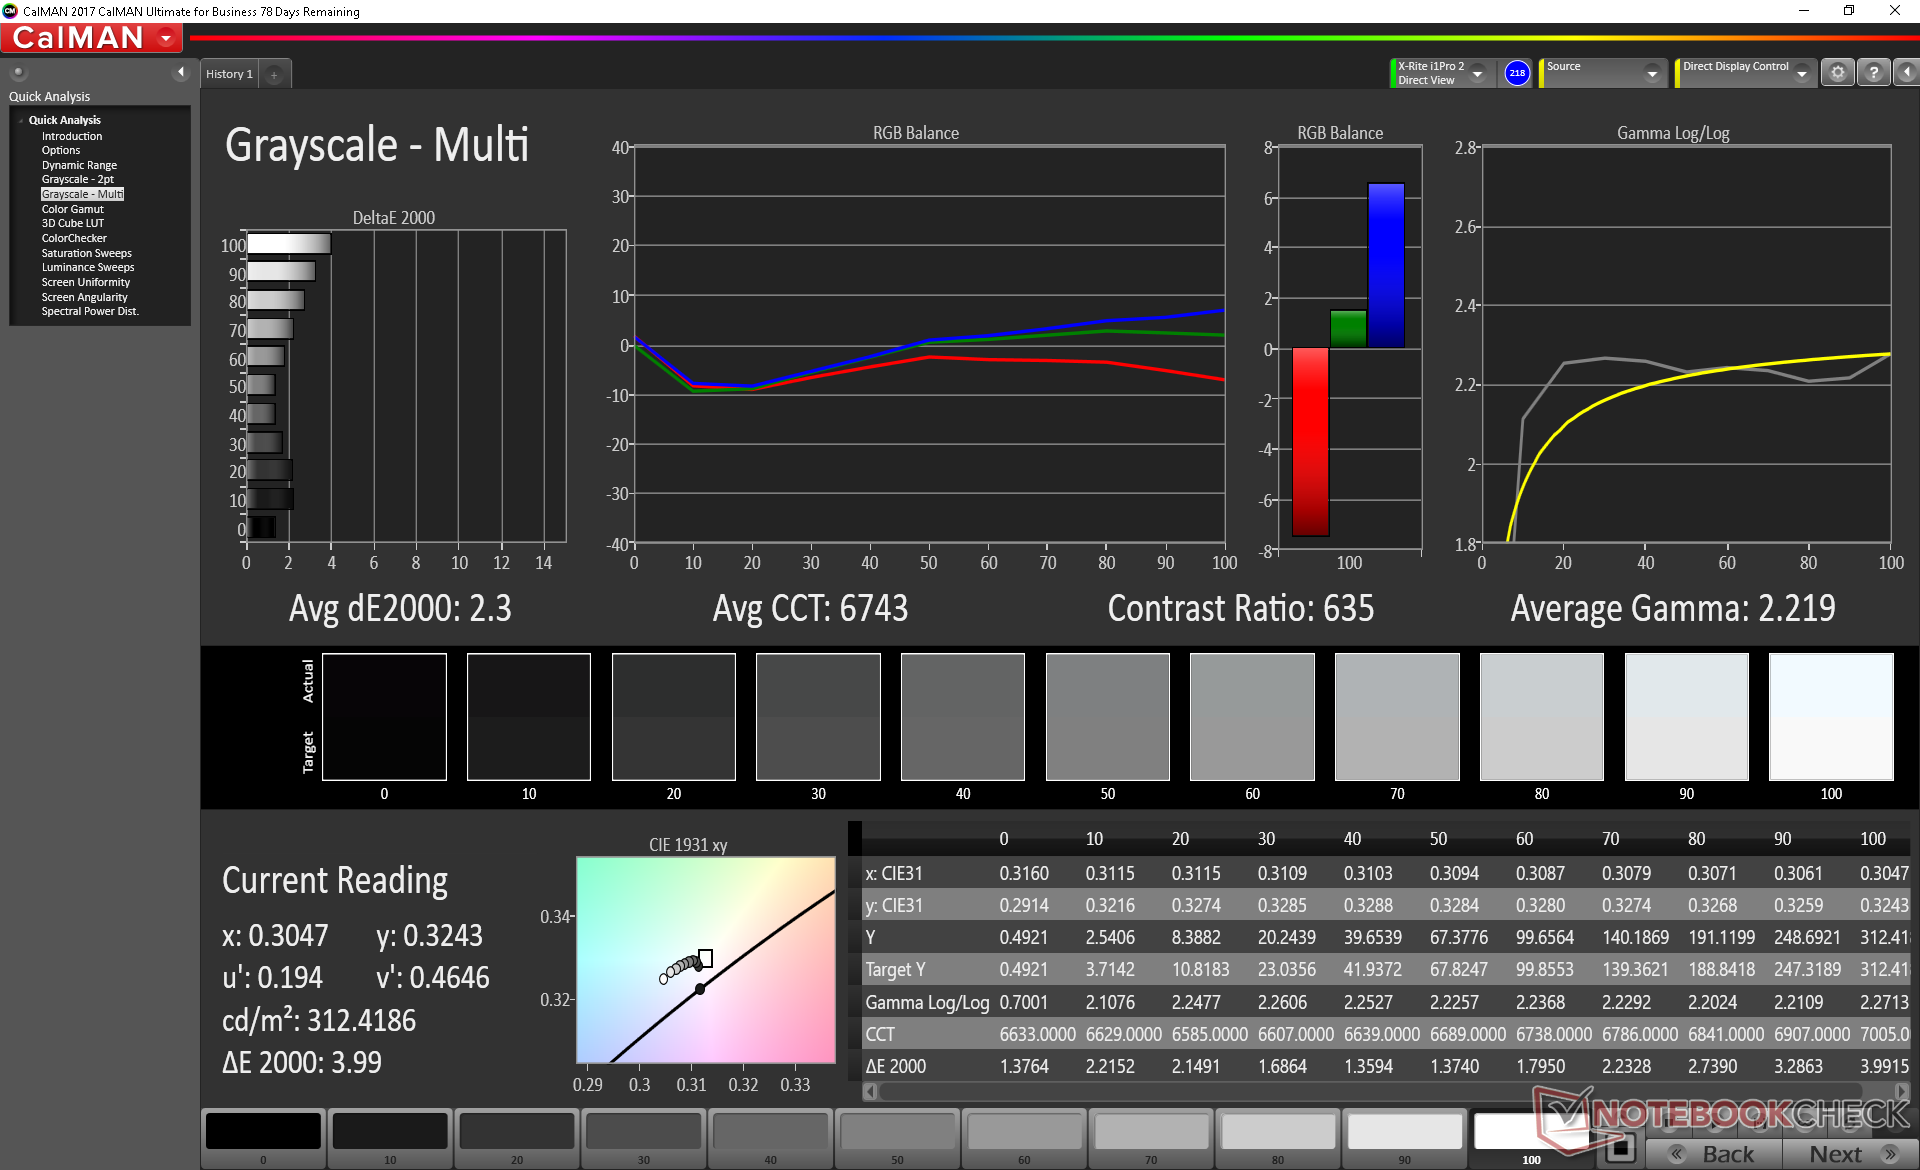
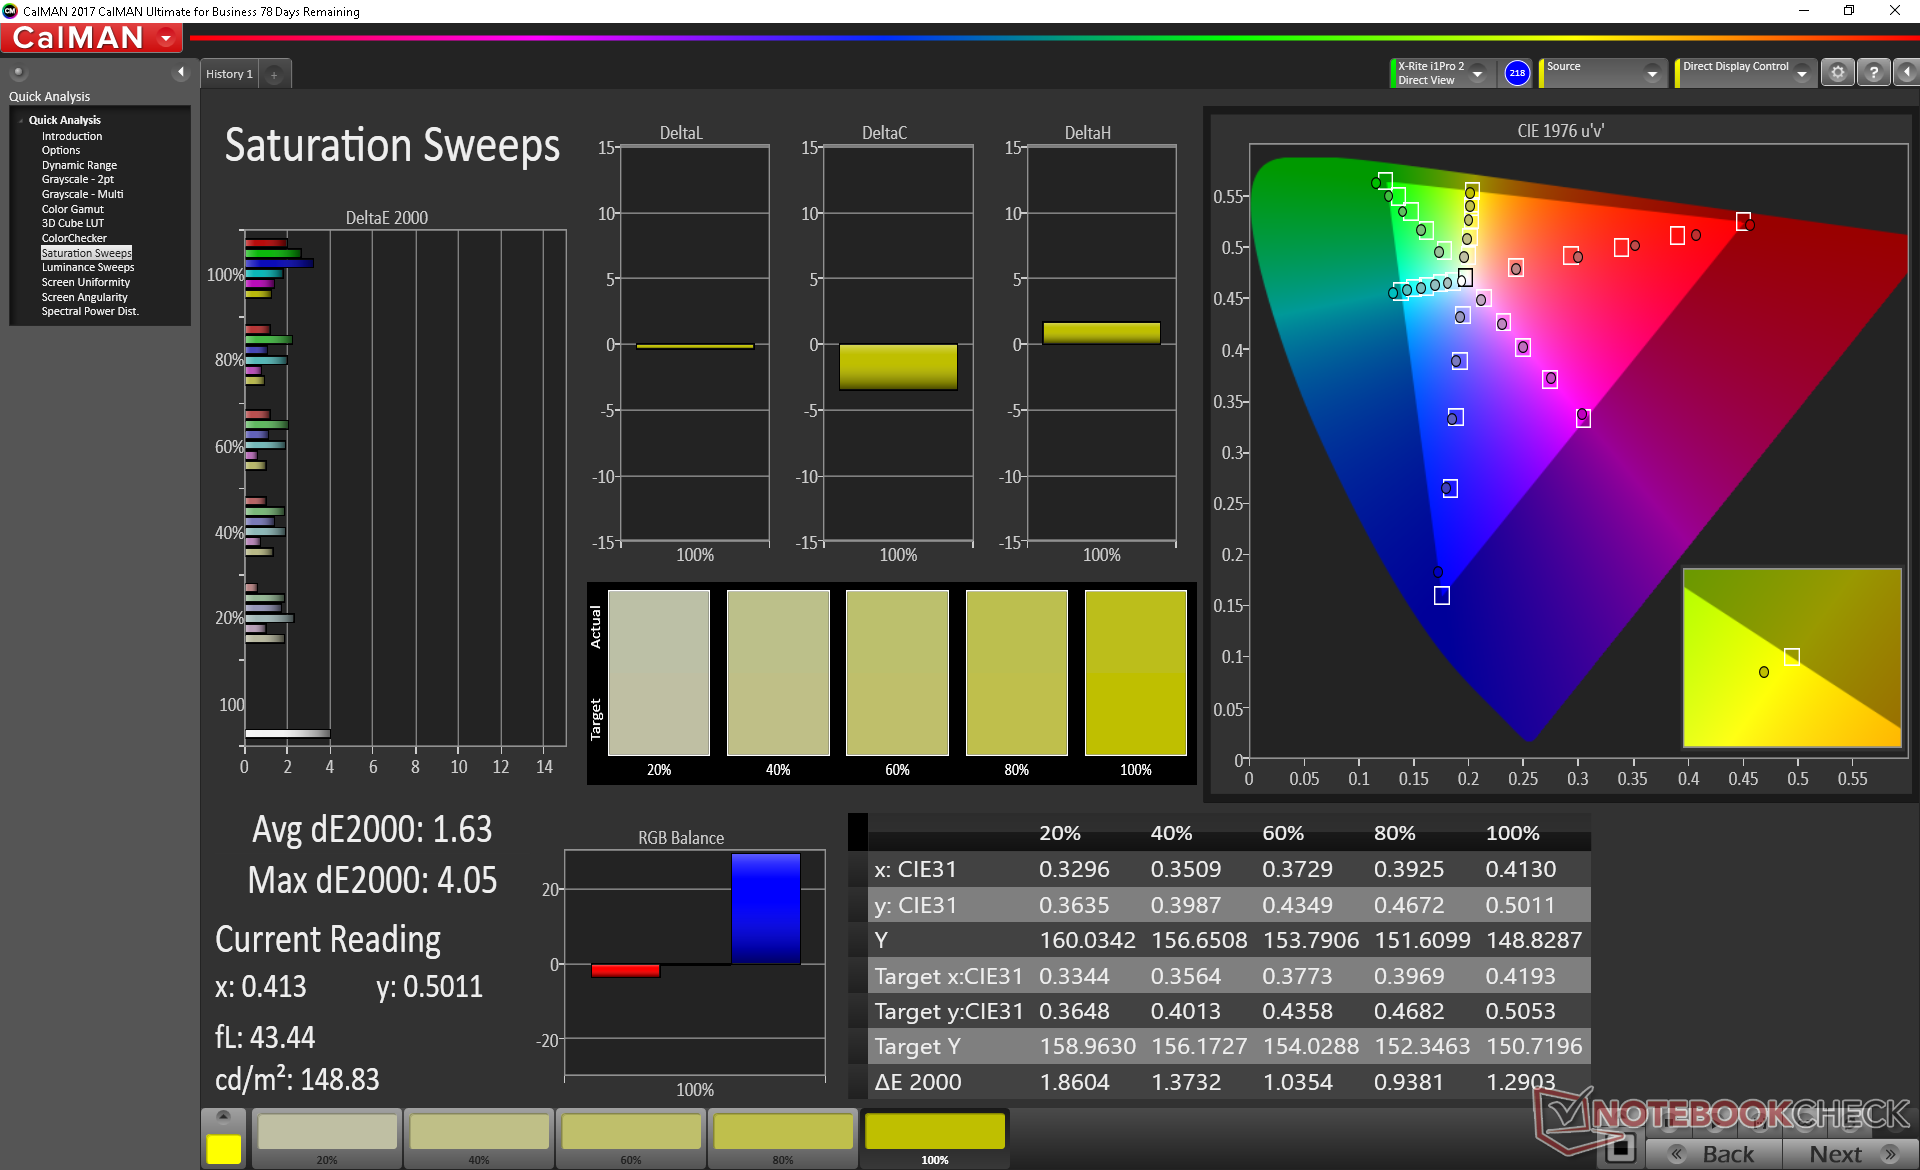
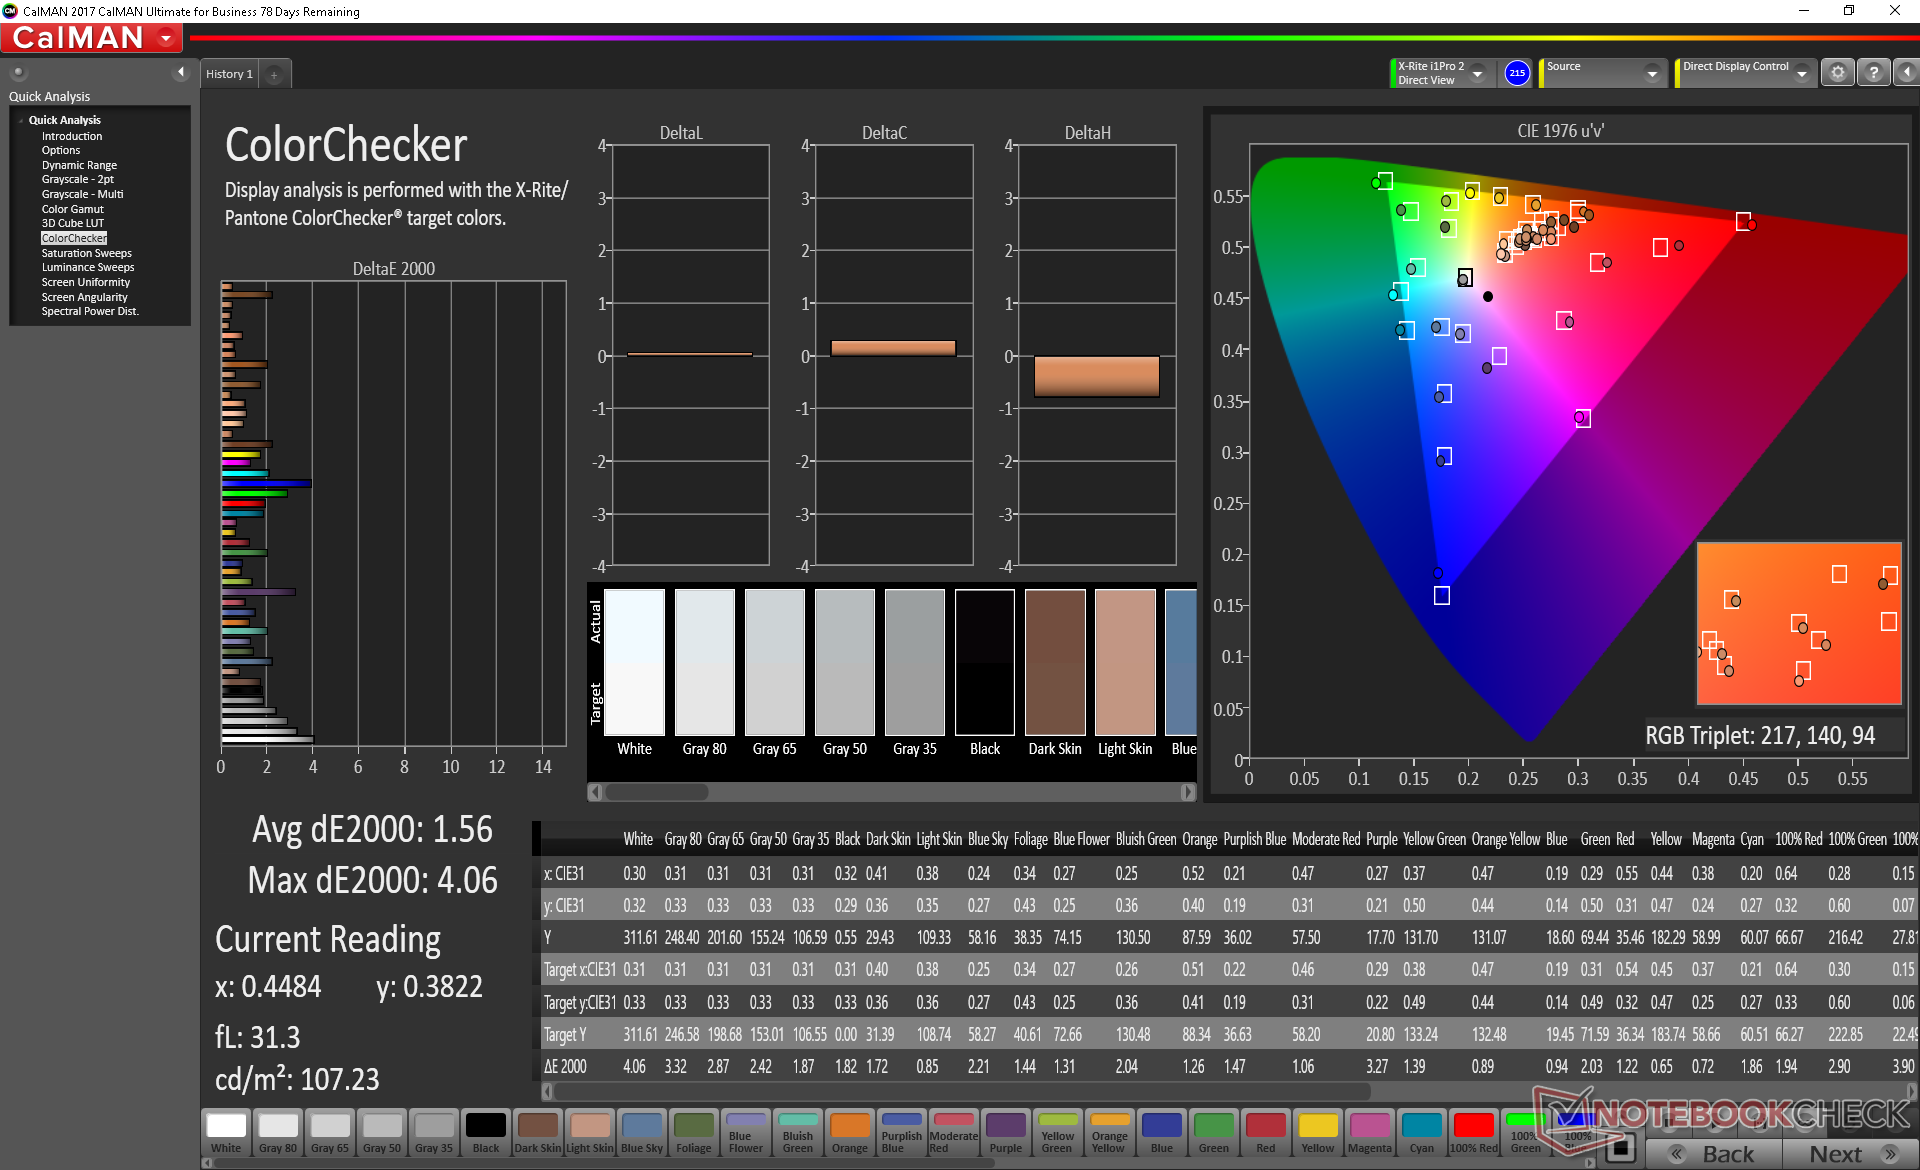
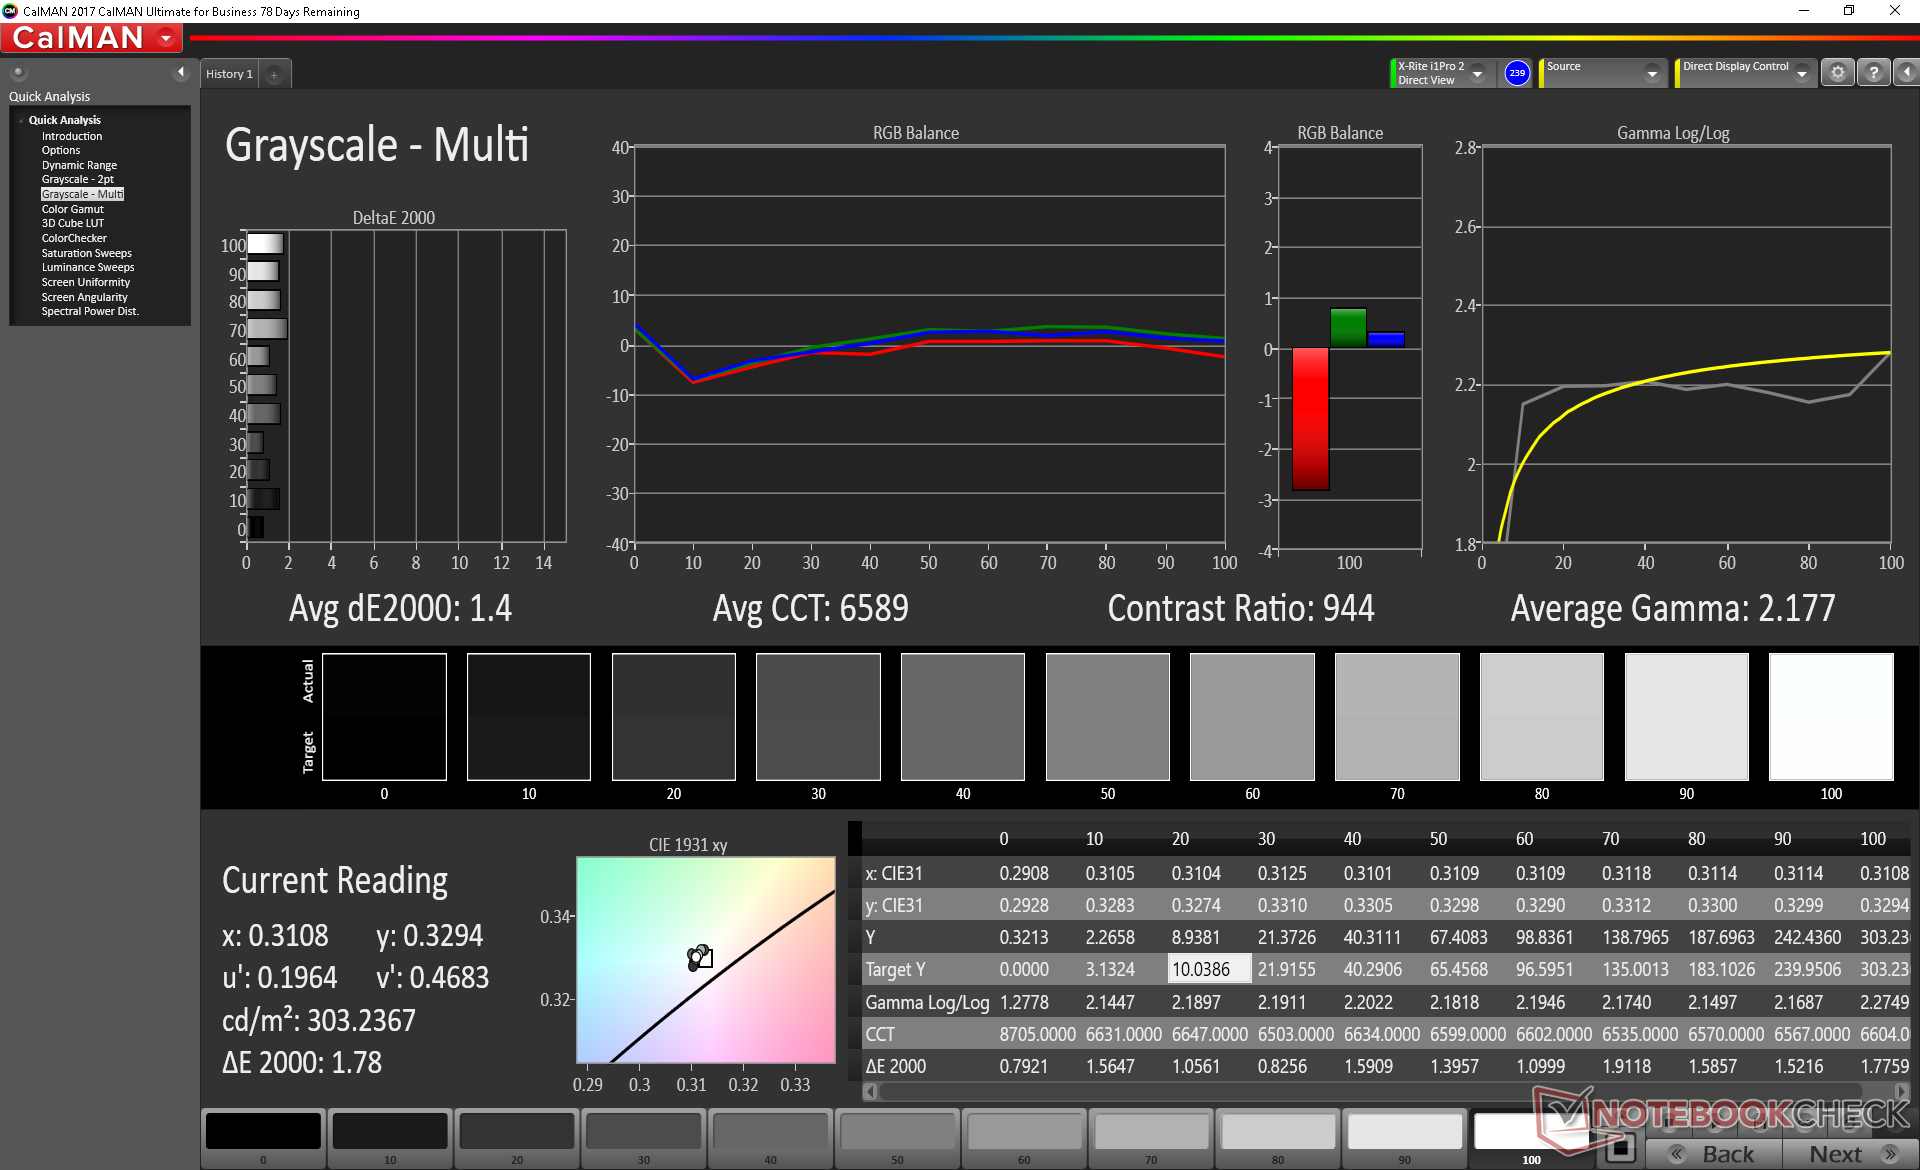
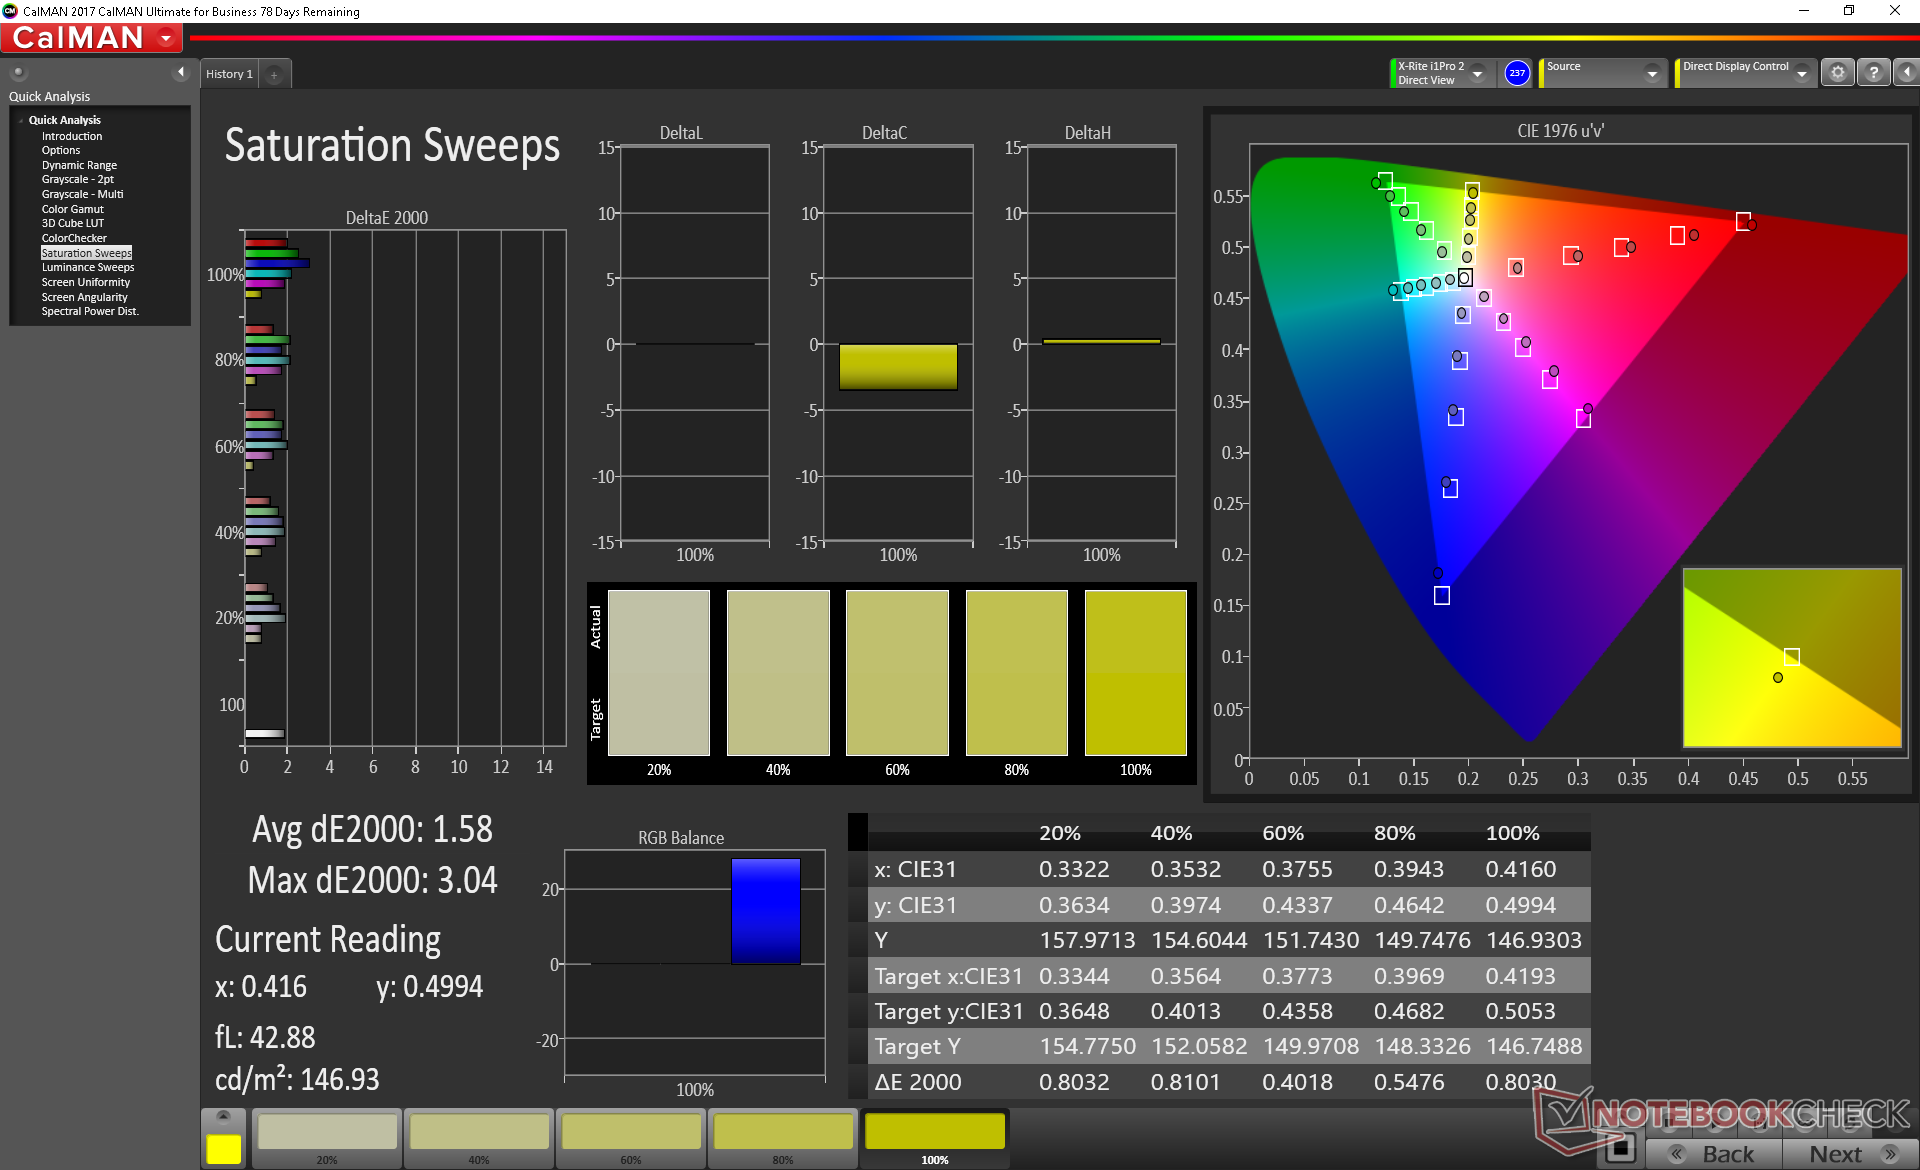
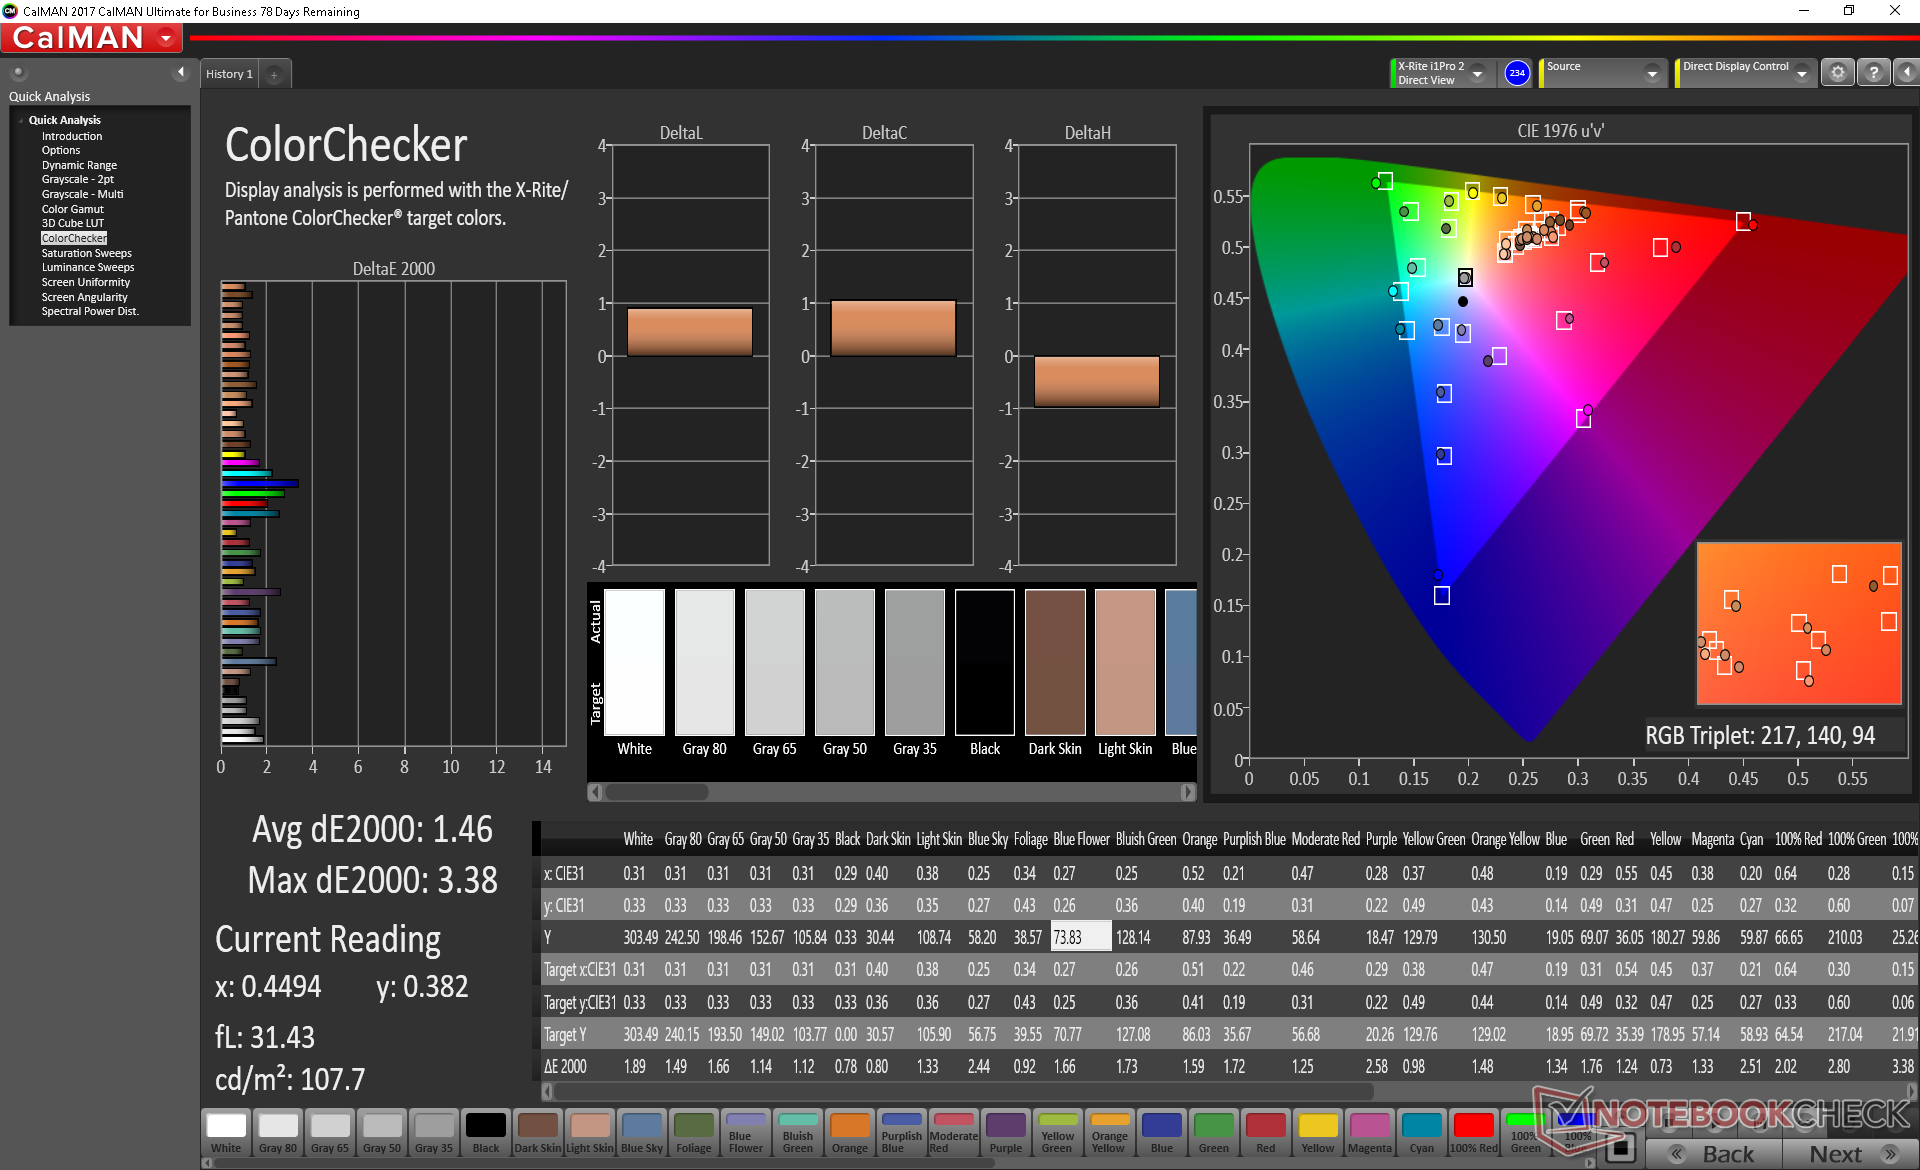
Despite Asus' claim of 100 percent DCI-P3, our independent measurements show just 81 percent sRGB coverage compared to 100 percent on last year's UX580 or on the Dell XPS 15 7590 OLED. We suspect that Asus' pre-installed color profile was designed to match the colors of the second display for improved color consistency between them. If dragging one window from the main screen to the second screen, for example, parity in colors and grayscale will be especially important for content creators.
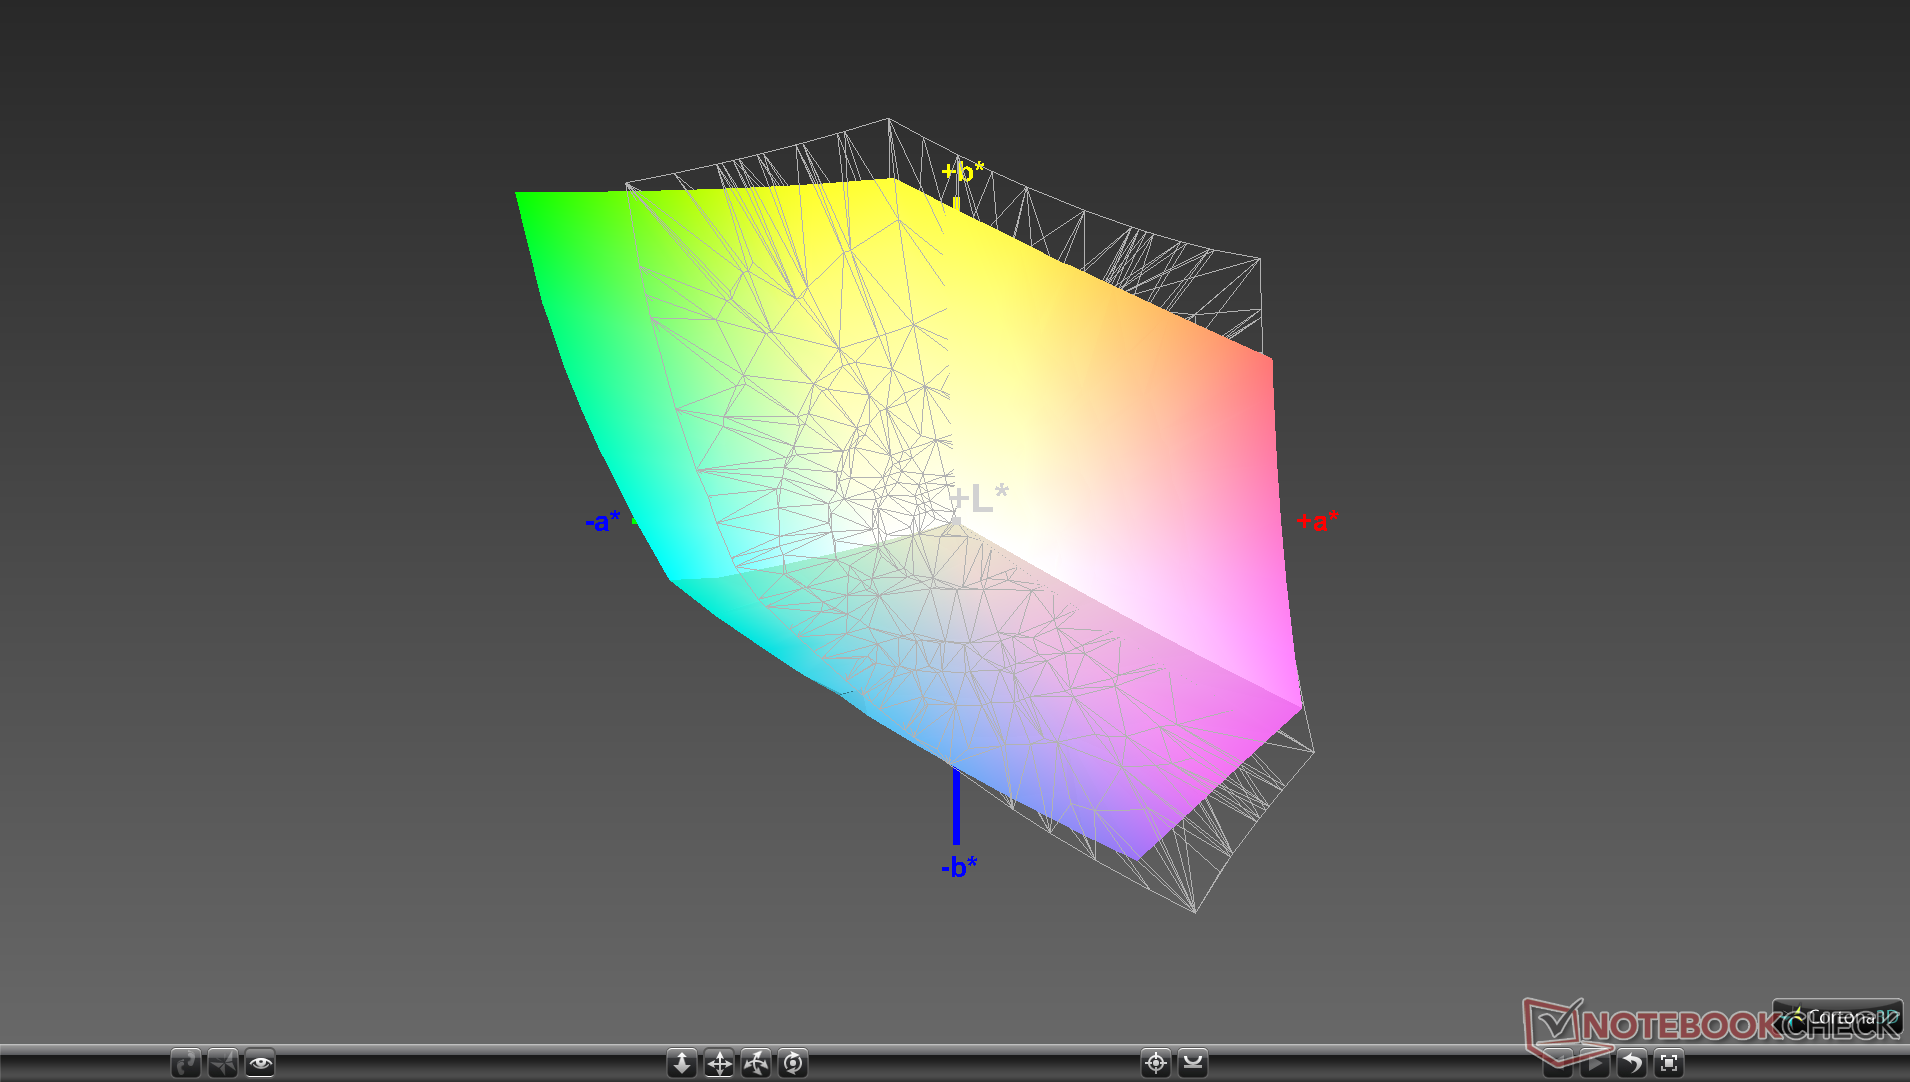

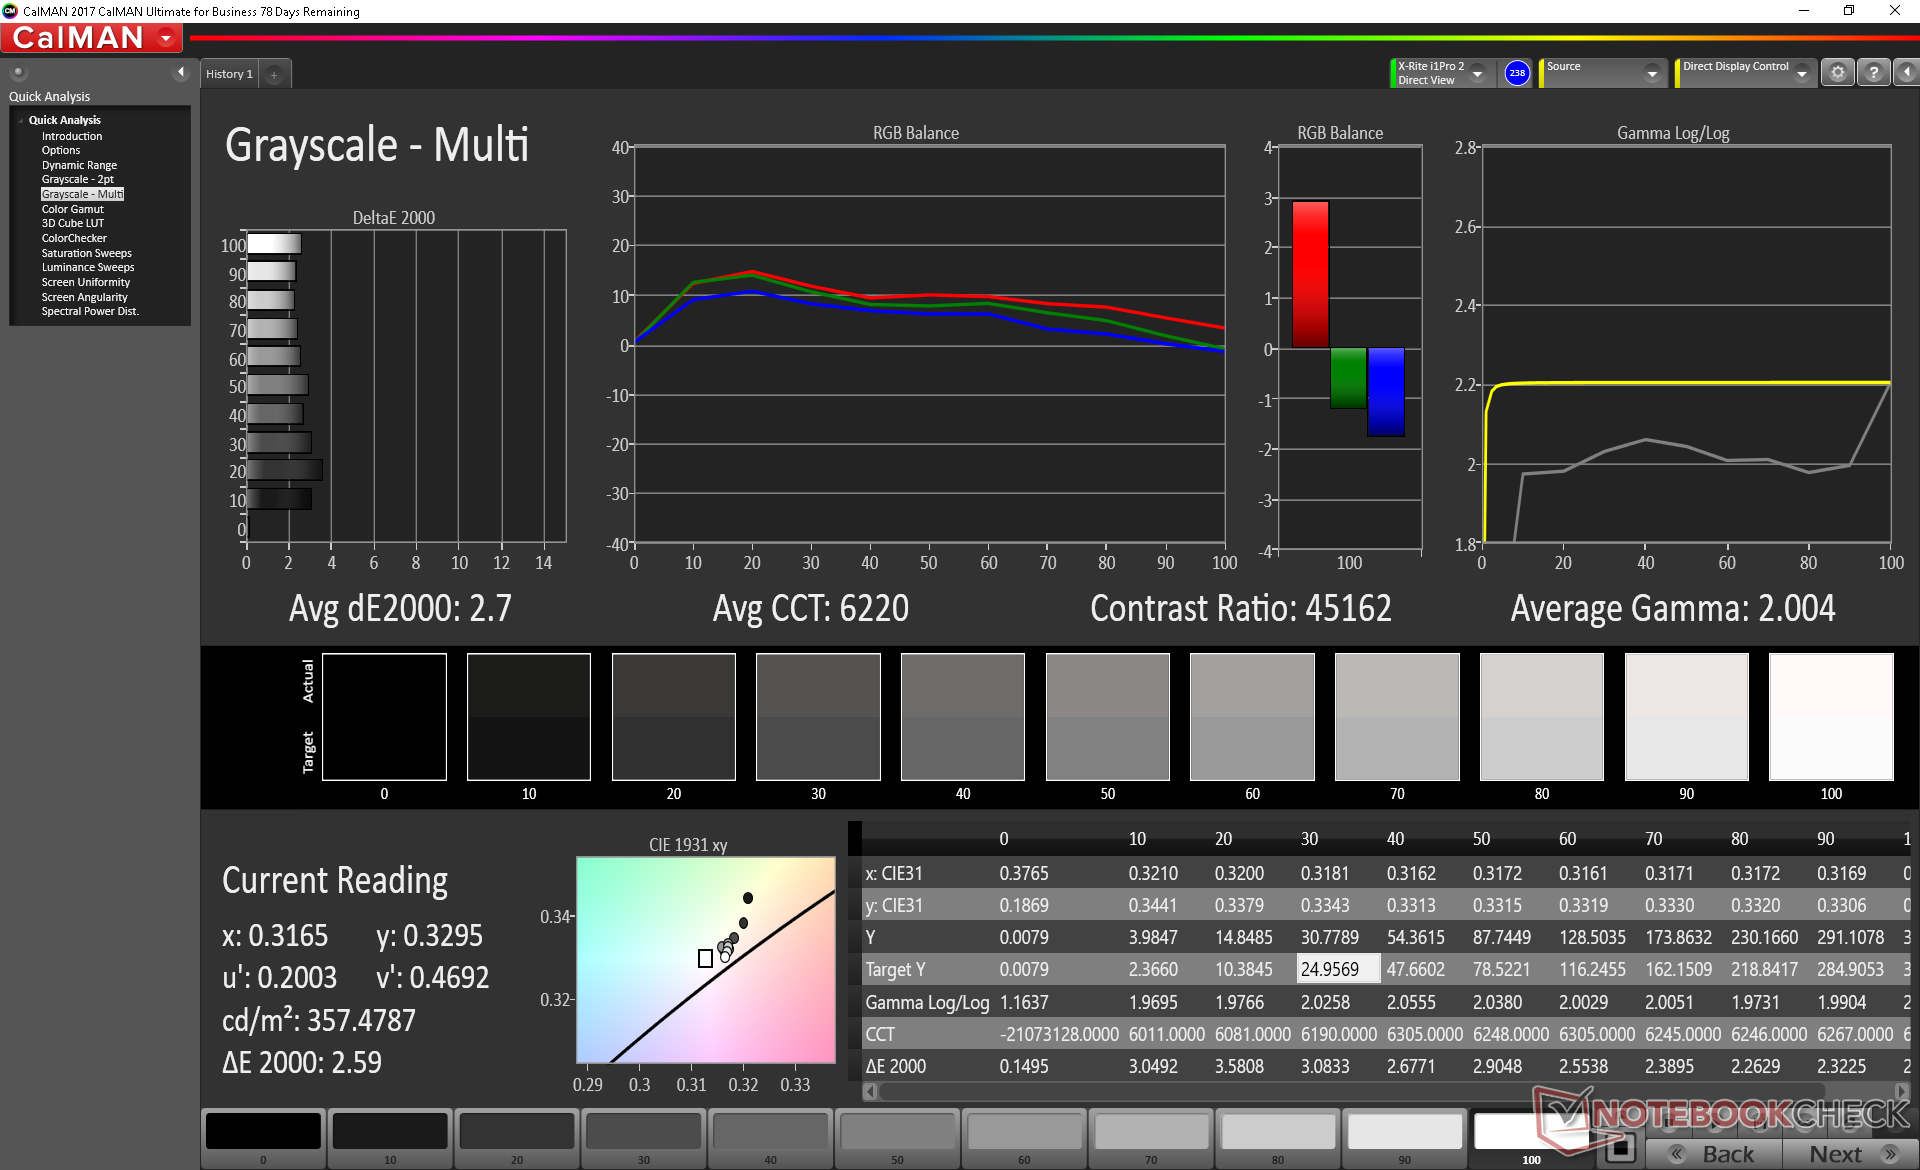
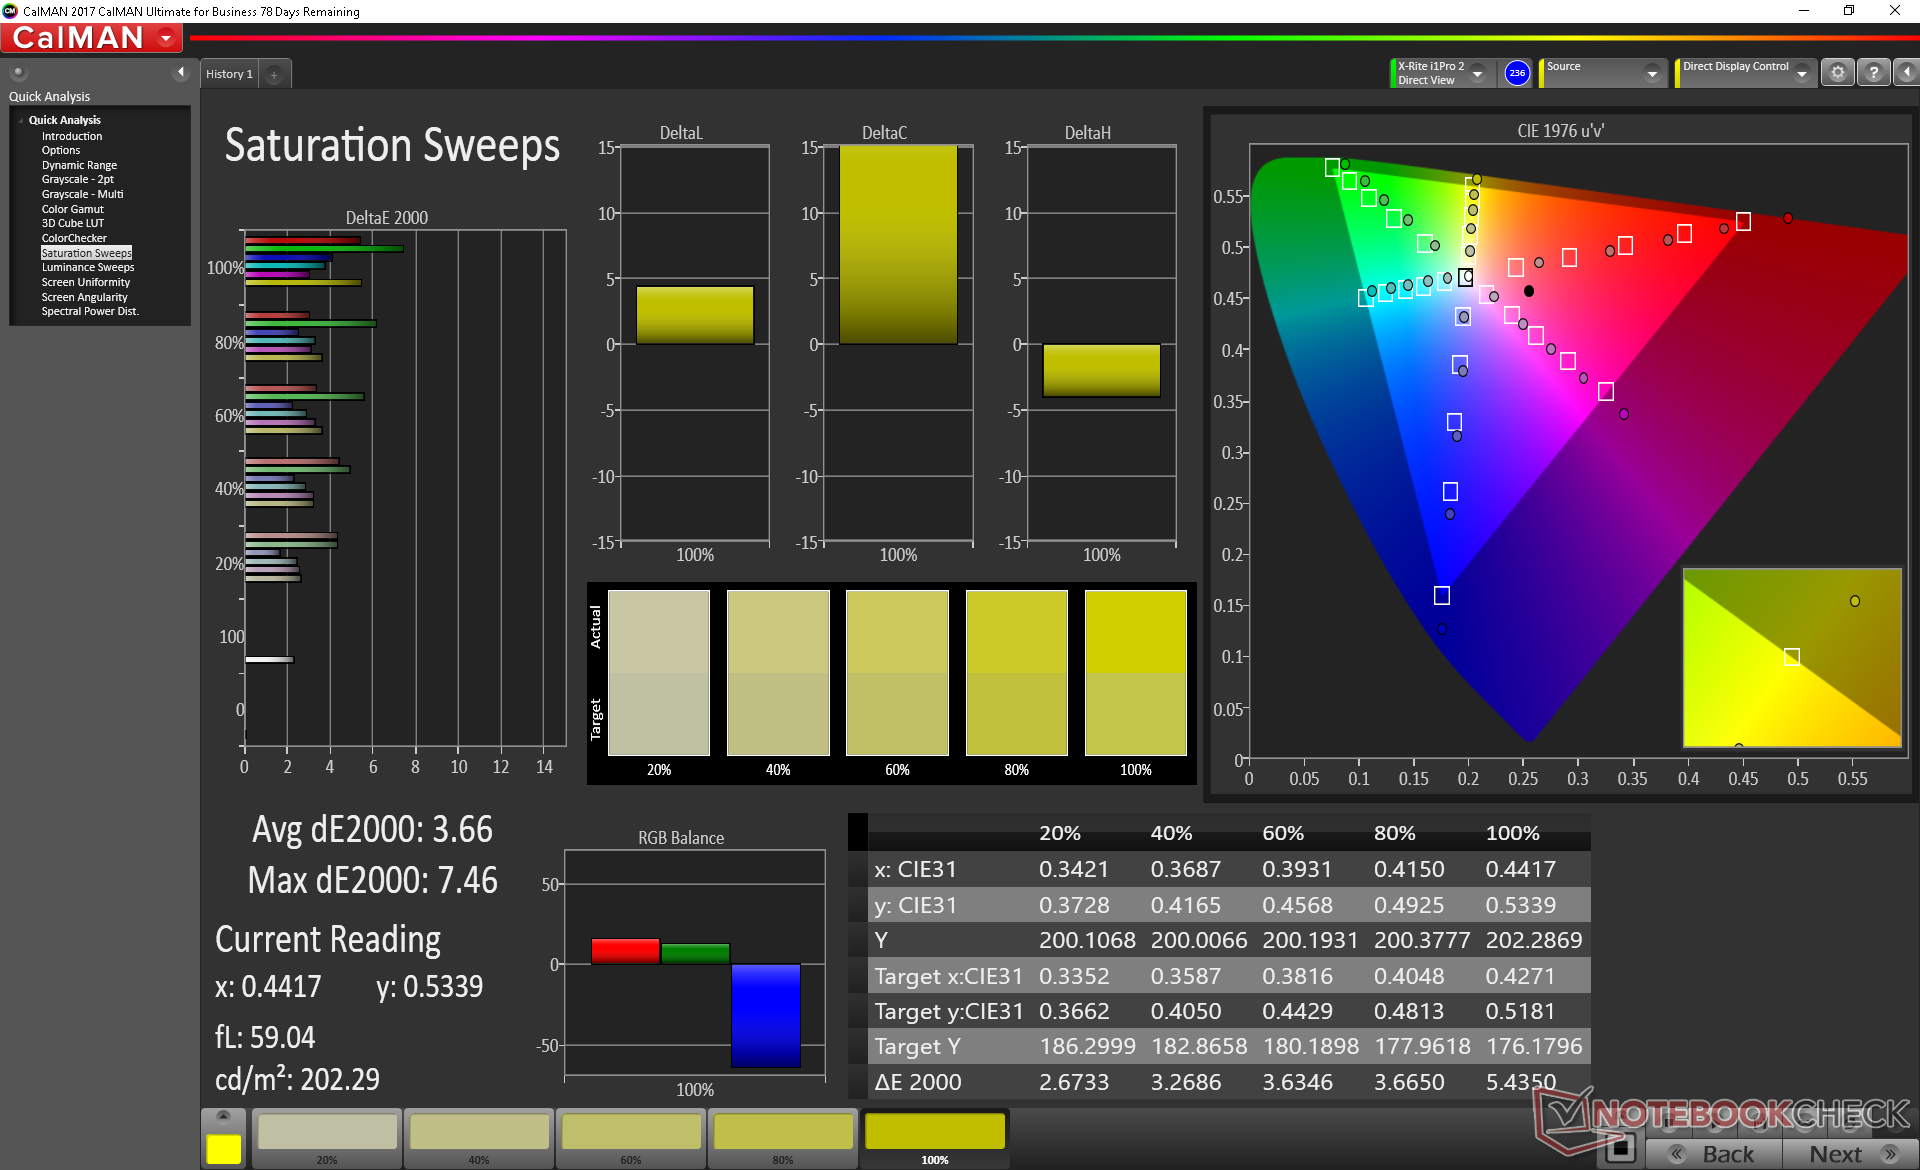
Further measurements with an X-Rite colorimeter show accurate grayscale and colors with average deltaE values of only 2.7 and 3.66, respectively, when compared to the AdobeRGB standard.
Display Response Times
| ↔ Response Time Black to White | ||
|---|---|---|
| 2.6 ms ... rise ↗ and fall ↘ combined | ↗ 1 ms rise | 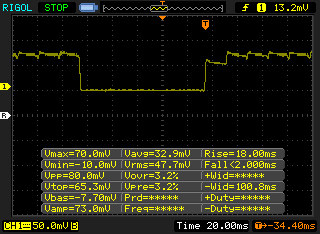 |
| ↘ 1.6 ms fall | ||
| The screen shows very fast response rates in our tests and should be very well suited for fast-paced gaming. In comparison, all tested devices range from 0.1 (minimum) to 240 (maximum) ms. » 13 % of all devices are better. This means that the measured response time is better than the average of all tested devices (19.9 ms). | ||
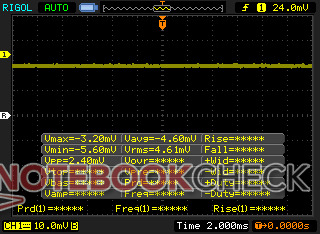
| ↔ Response Time 50% Grey to 80% Grey | ||
| 2.2 ms ... rise ↗ and fall ↘ combined | ↗ 1 ms rise | 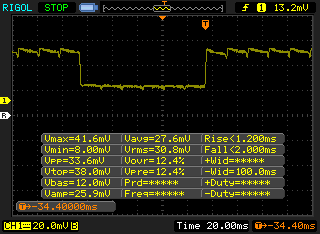 |
| ↘ 1.2 ms fall | ||
| The screen shows very fast response rates in our tests and should be very well suited for fast-paced gaming. In comparison, all tested devices range from 0.165 (minimum) to 636 (maximum) ms. » 11 % of all devices are better. This means that the measured response time is better than the average of all tested devices (31.1 ms). | ||
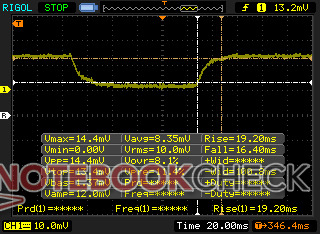
Screen Flickering / PWM (Pulse-Width Modulation)
| Screen flickering / PWM detected | 240.4 Hz | ≤ 52 % brightness setting | 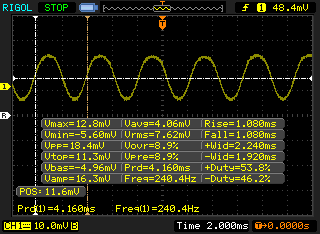 |
The display backlight flickers at 240.4 Hz (worst case, e.g., utilizing PWM) Flickering detected at a brightness setting of 52 % and below. There should be no flickering or PWM above this brightness setting. The frequency of 240.4 Hz is relatively low, so sensitive users will likely notice flickering and experience eyestrain at the stated brightness setting and below. In comparison: 52 % of all tested devices do not use PWM to dim the display. If PWM was detected, an average of 7801 (minimum: 5 - maximum: 343500) Hz was measured. | |||
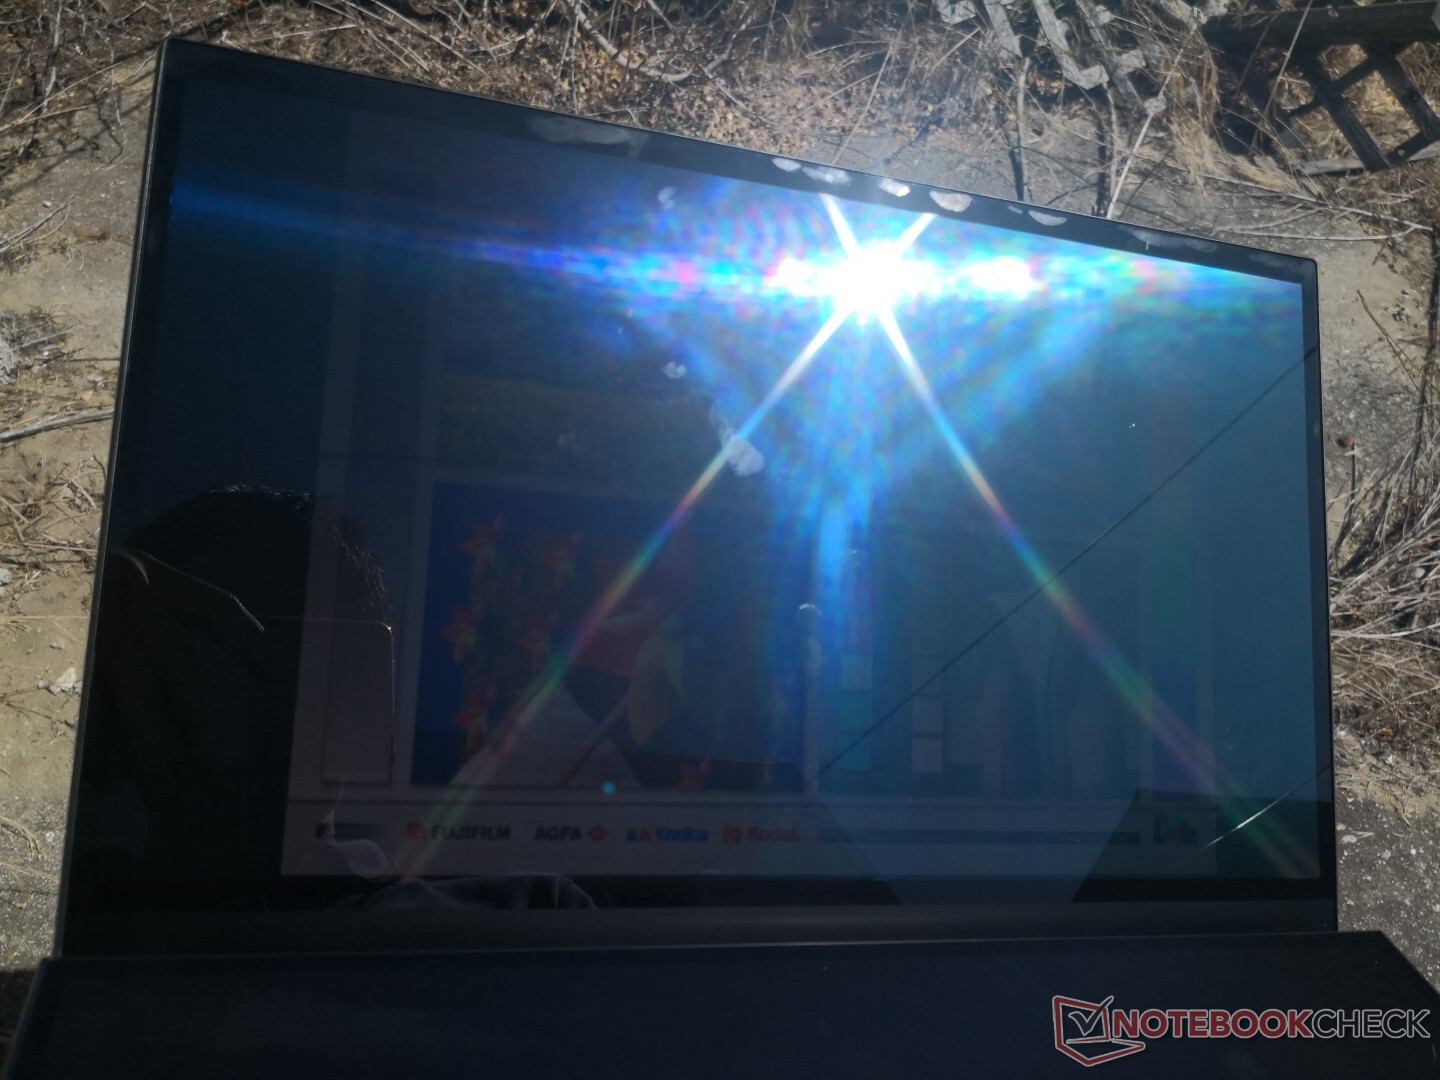
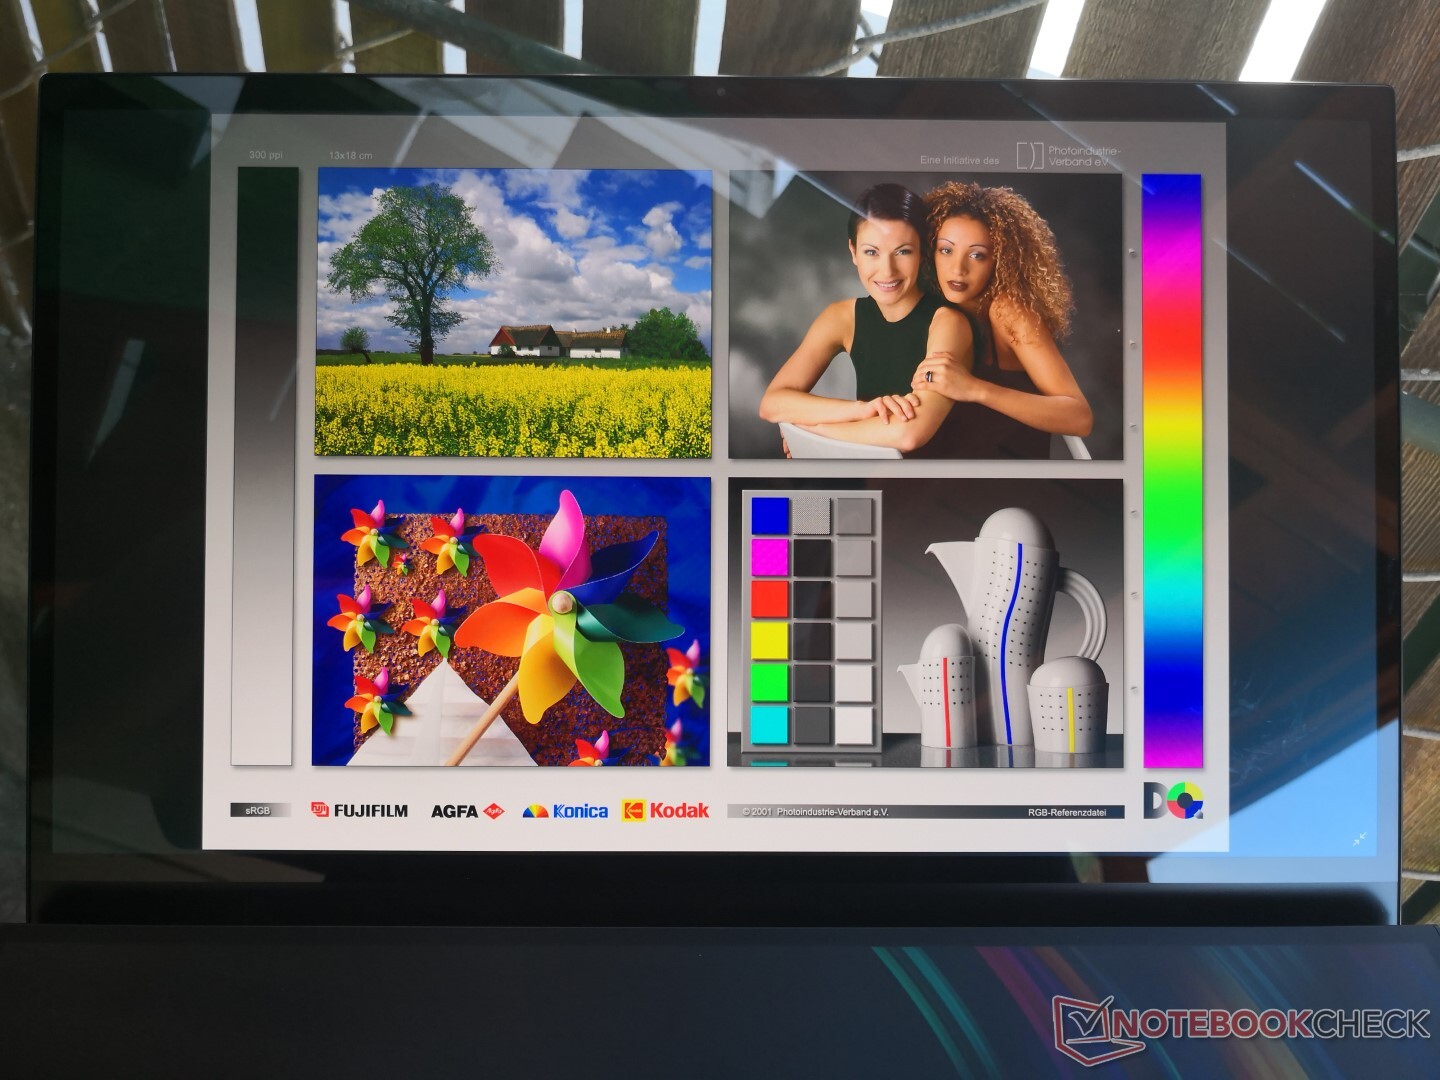
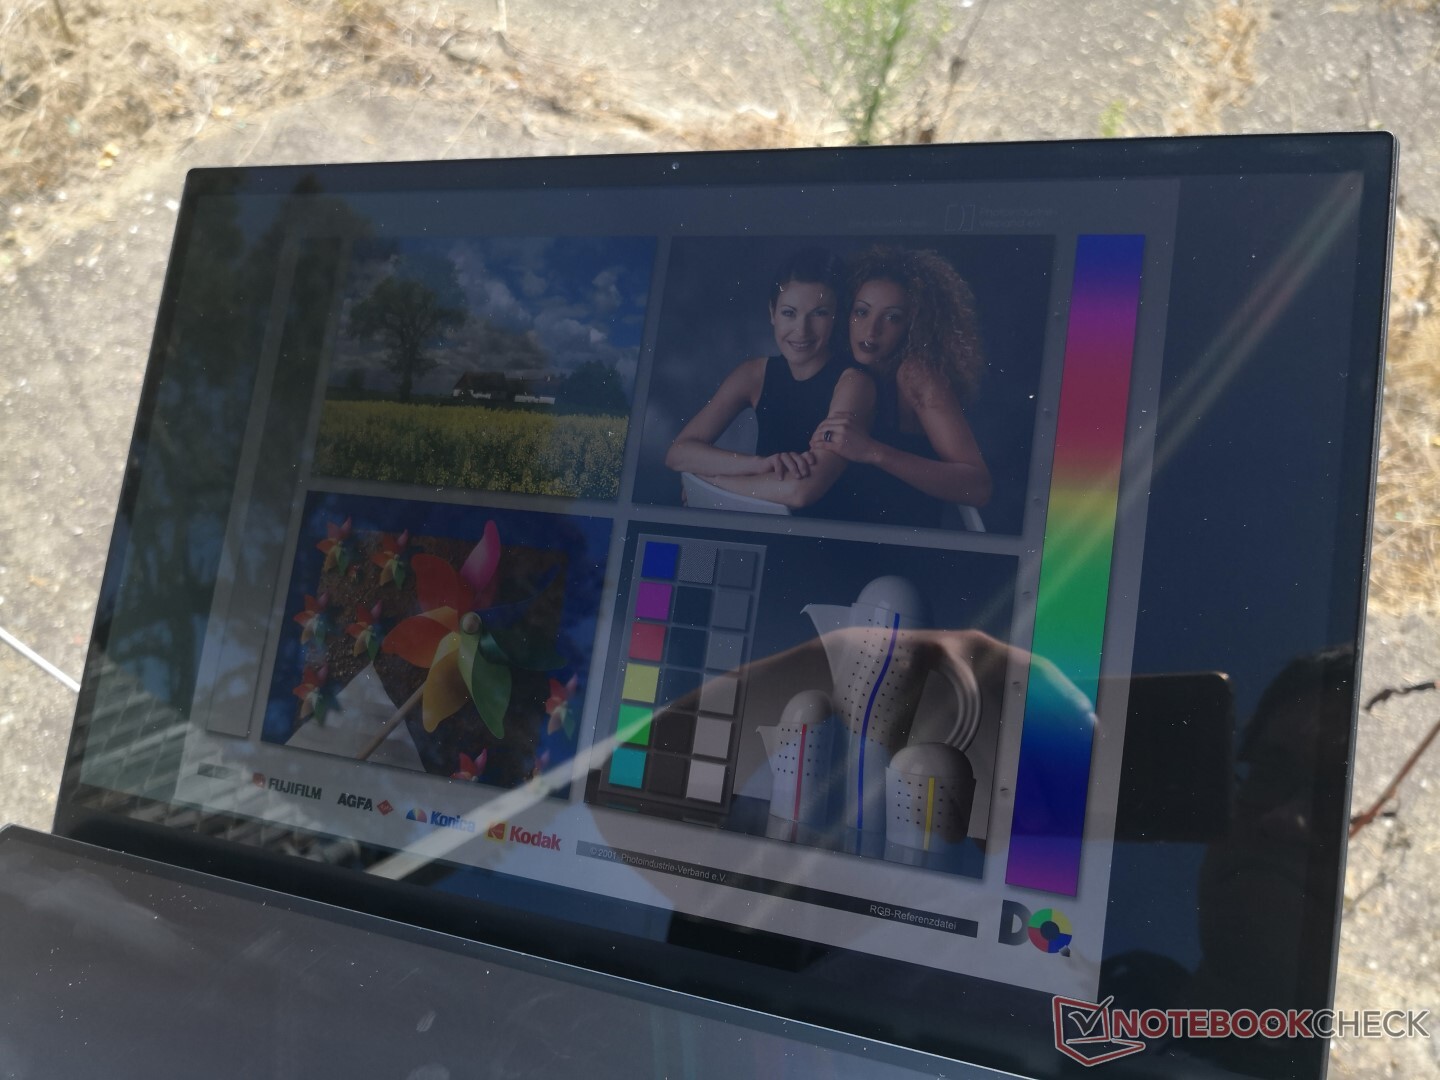
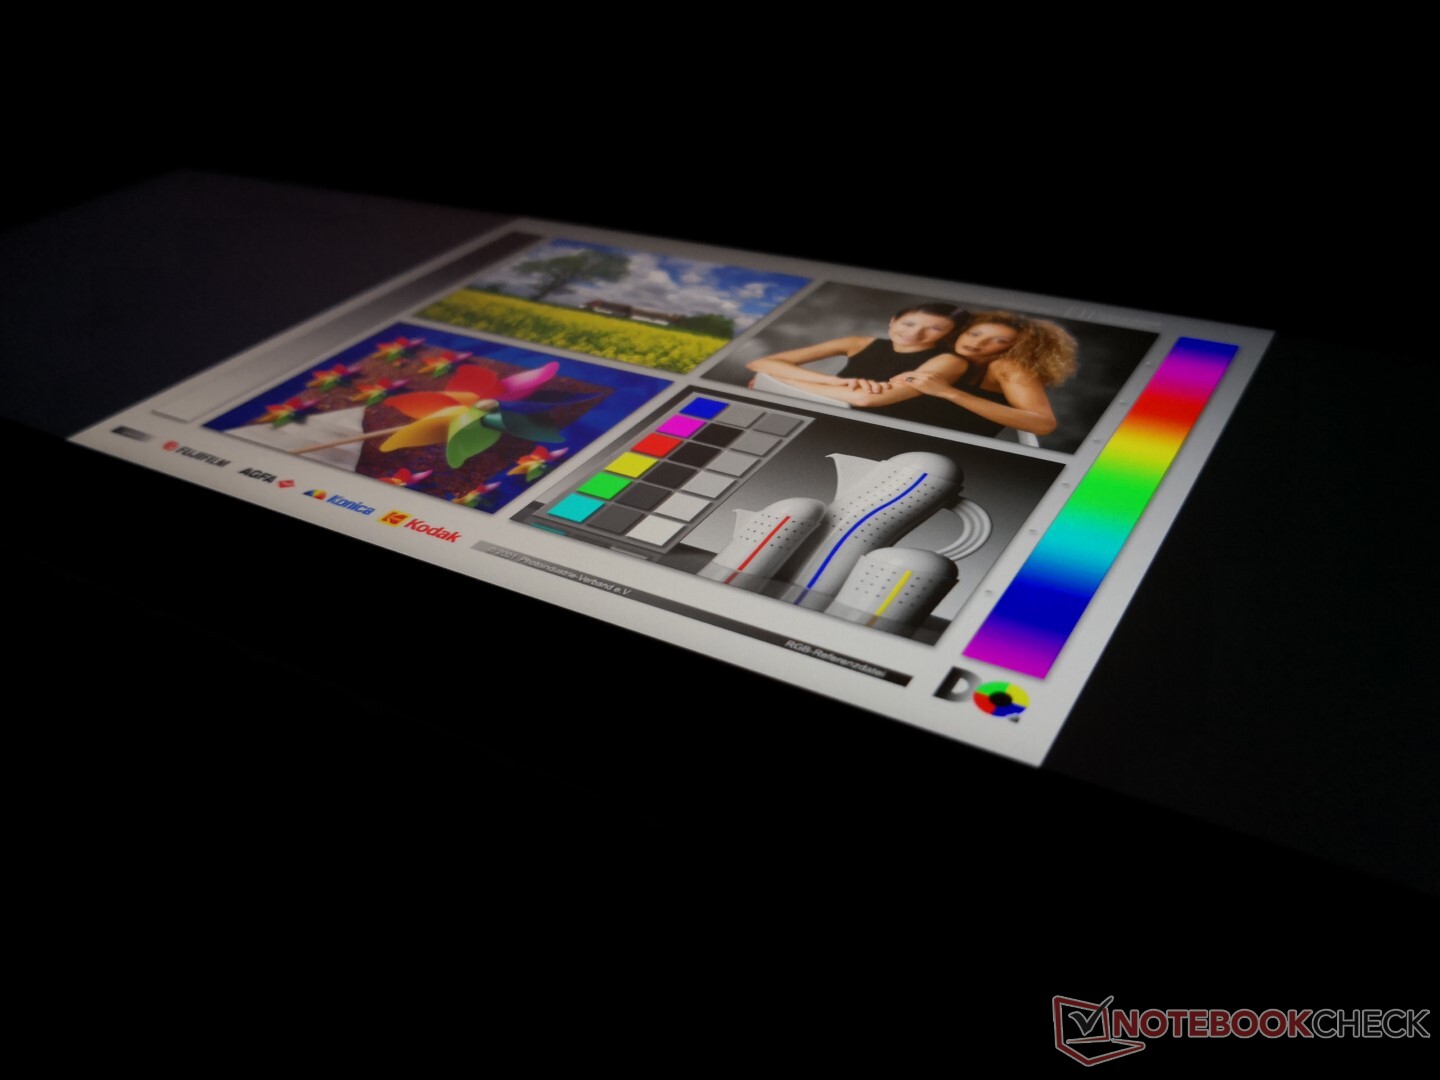
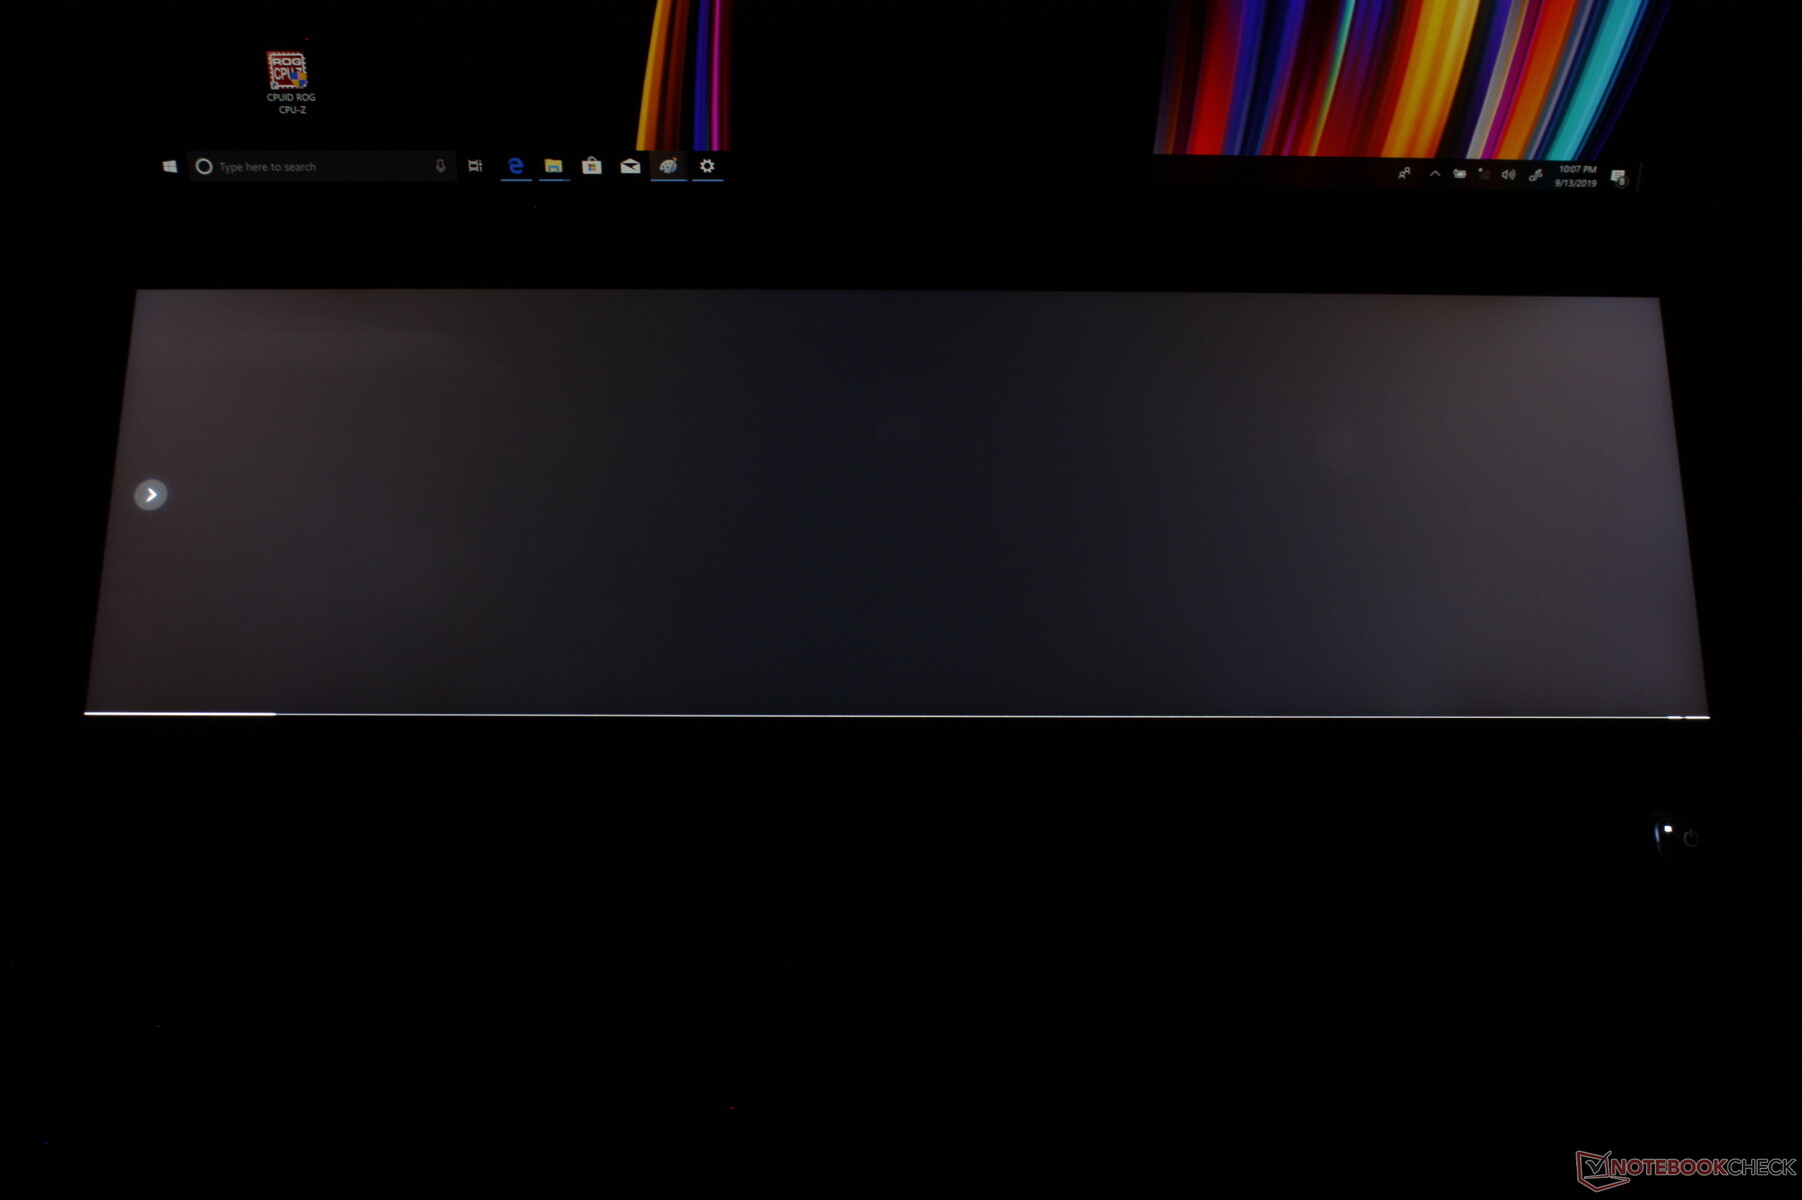
OLED displays are usually easier to see outdoors than IPS displays since they tend to be brighter and with deeper contrast ratios. For the UX581, the main display is usable when under shade while direct sunlight will still overwhelm any onscreen content. The maximum brightness setting is always recommended to minimize the heavy glare.
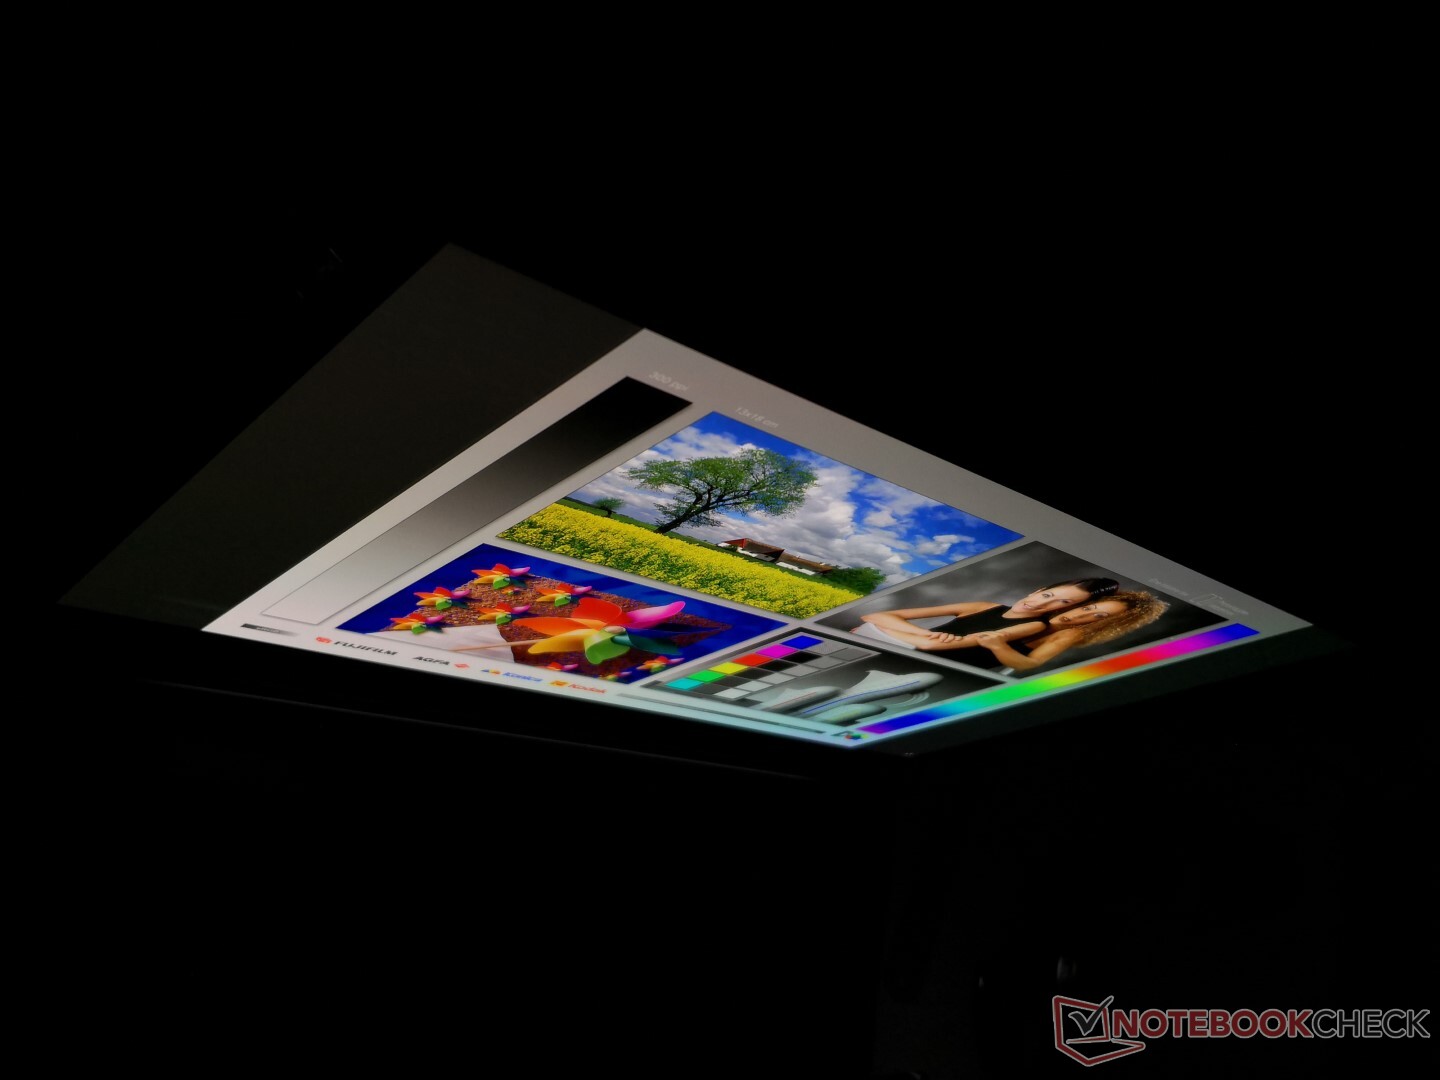
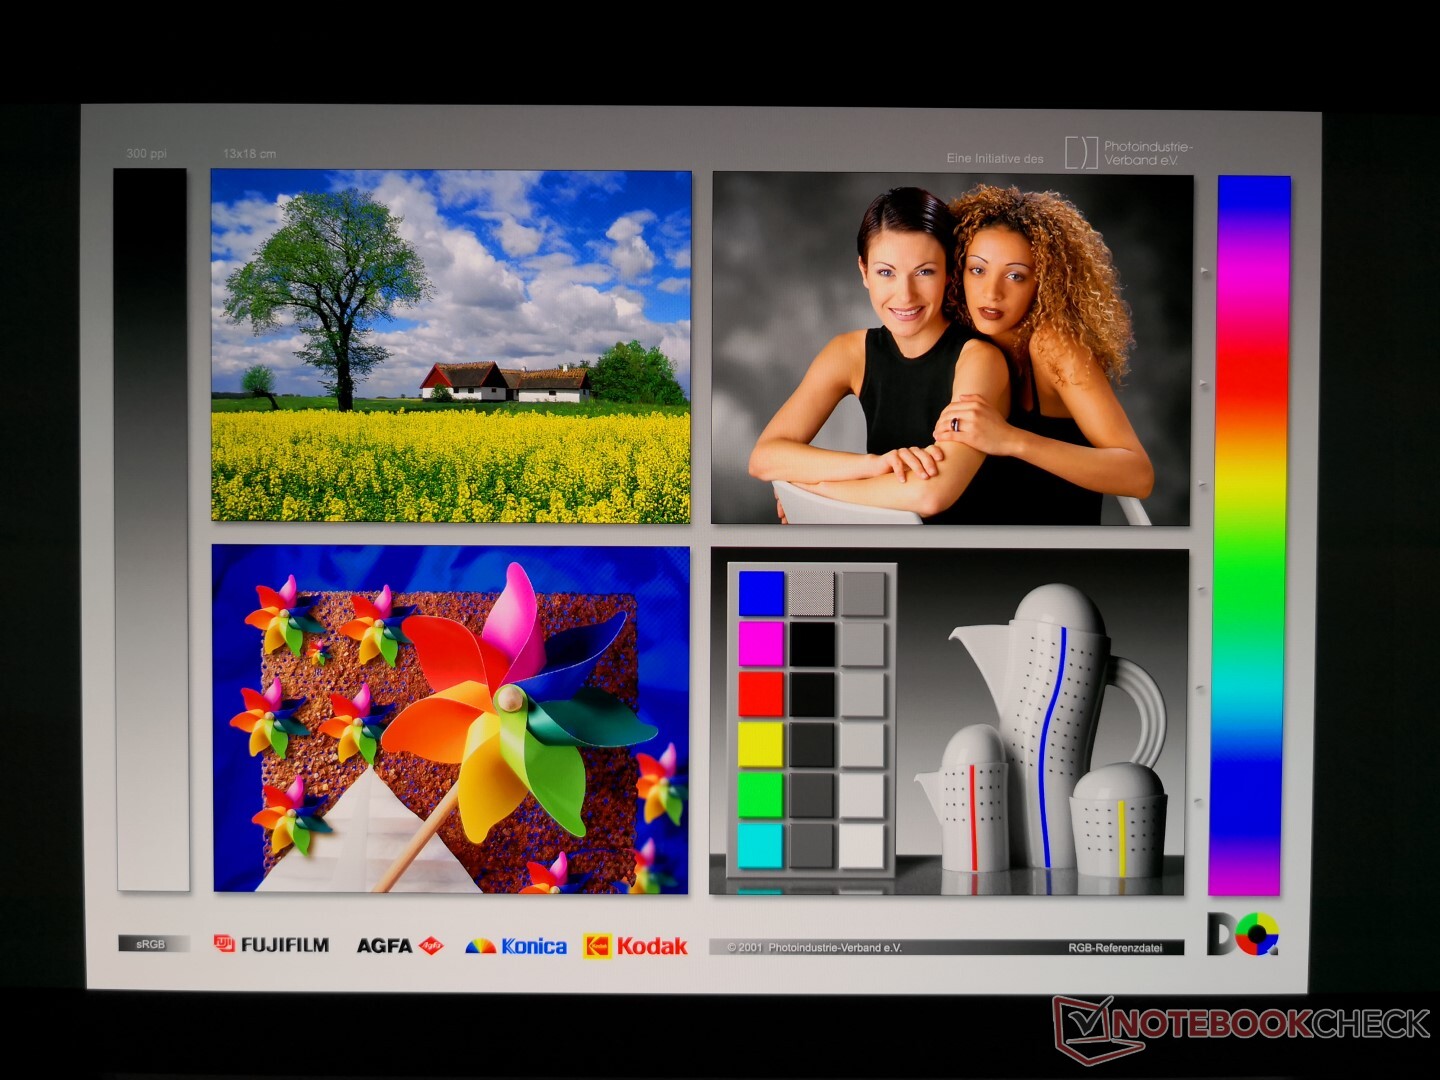
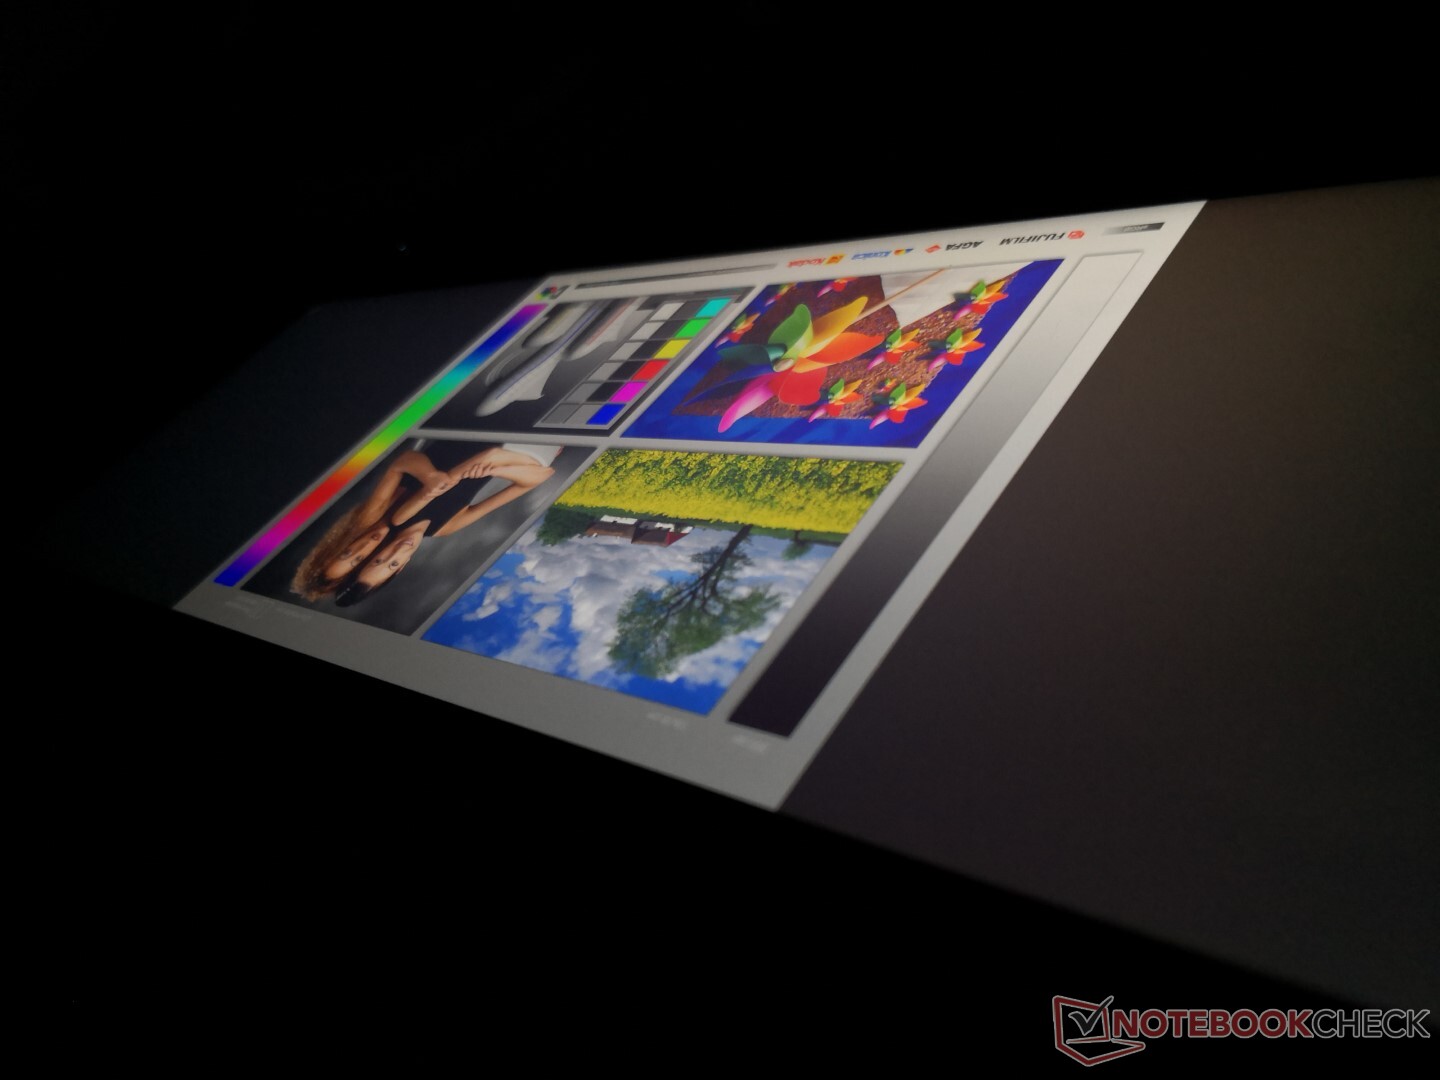
Viewing angles are excellent and better than IPS as apparent contrast remains steady from wide angles. Rainbow color bands will occur from extremely wide angles which is typical of OLED panels.
ScreenPad Plus
The 3840 x 1110 resolution matte secondary screen is very different from the glossy primary screen despite having the same PPI and width. Since it is an IPS panel, characteristics like response times, colors, brightness, and contrast ratio will be inferior to the main OLED panel. These drawbacks become easily noticeable when moving pictures or videos between the two screens. Content creators hoping for a perfect 1:1 dual screen setup may be disappointed while gamers and multimedia users would be less impacted.
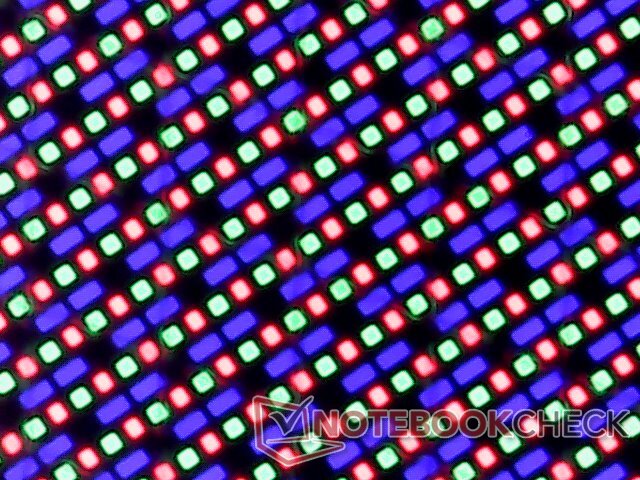
Perhaps the worst aspect of the ScreenPad Plus is its thick matte overlay in contrast to the crisp glossy screen of the main display as shown by our microscope image below. Picture quality is grainier as a result not unlike the ScreenPad on the recent VivoBook S15. We suspect that Asus had experimented with a glossy version of the ScreenPad Plus only to find that glare would have been too distracting much like on the second screen of the HP Omen X 2S 15. It's an unfortunate trade-off that the manufacturer probably had to make.
Thankfully, the drawbacks don't detract from the inherent utility or convenience of having a second display. Moving windows, watching videos, or multi-tasking between applications feels natural with only a small learning curve. Windows recognizes the screen the same way as it would any external monitor.
| Maximum Brightness | Contrast Ratio | Minimum Brightness | PWM | Black-White Response Time | Gray-Gray Response Time | sRGB Coverage | AdobeRGB Coverage |
|---|---|---|---|---|---|---|---|
| 311.2 | 536:1 | 11.9 | None | 13.2 ms | 19.2 ms | 94.5 percent | 63.3 percent |

Performance
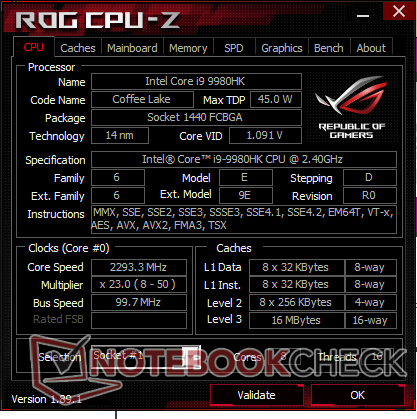
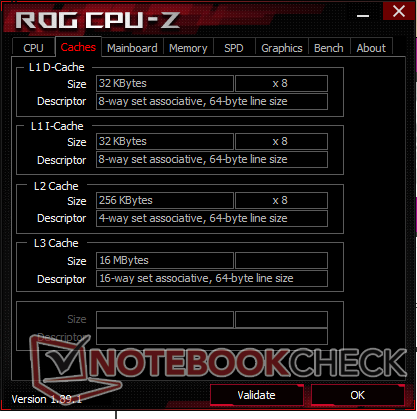
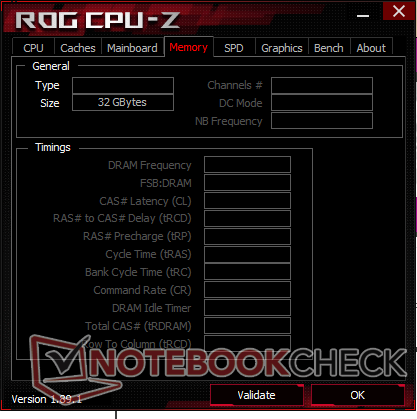
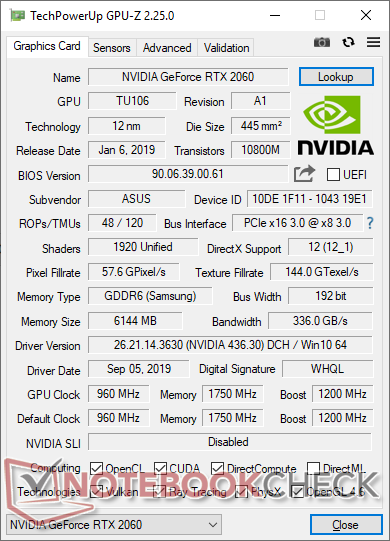
Asus is clearly aiming for enthusiasts with the ZenBook Pro Duo UX581. Users can choose between the hexa-core Core i7-9750H or unlocked octa-core Core i9-9980HK with 16 GB to 32 GB of soldered DDR4-2666 RAM. The primary 4K UHD OLED touchscreen, secondary ScreenPad Plus touchscreen, and GeForce RTX 2060 GPU are all fixed across every SKU. Optimus also comes standard meaning G-Sync will not be an option.
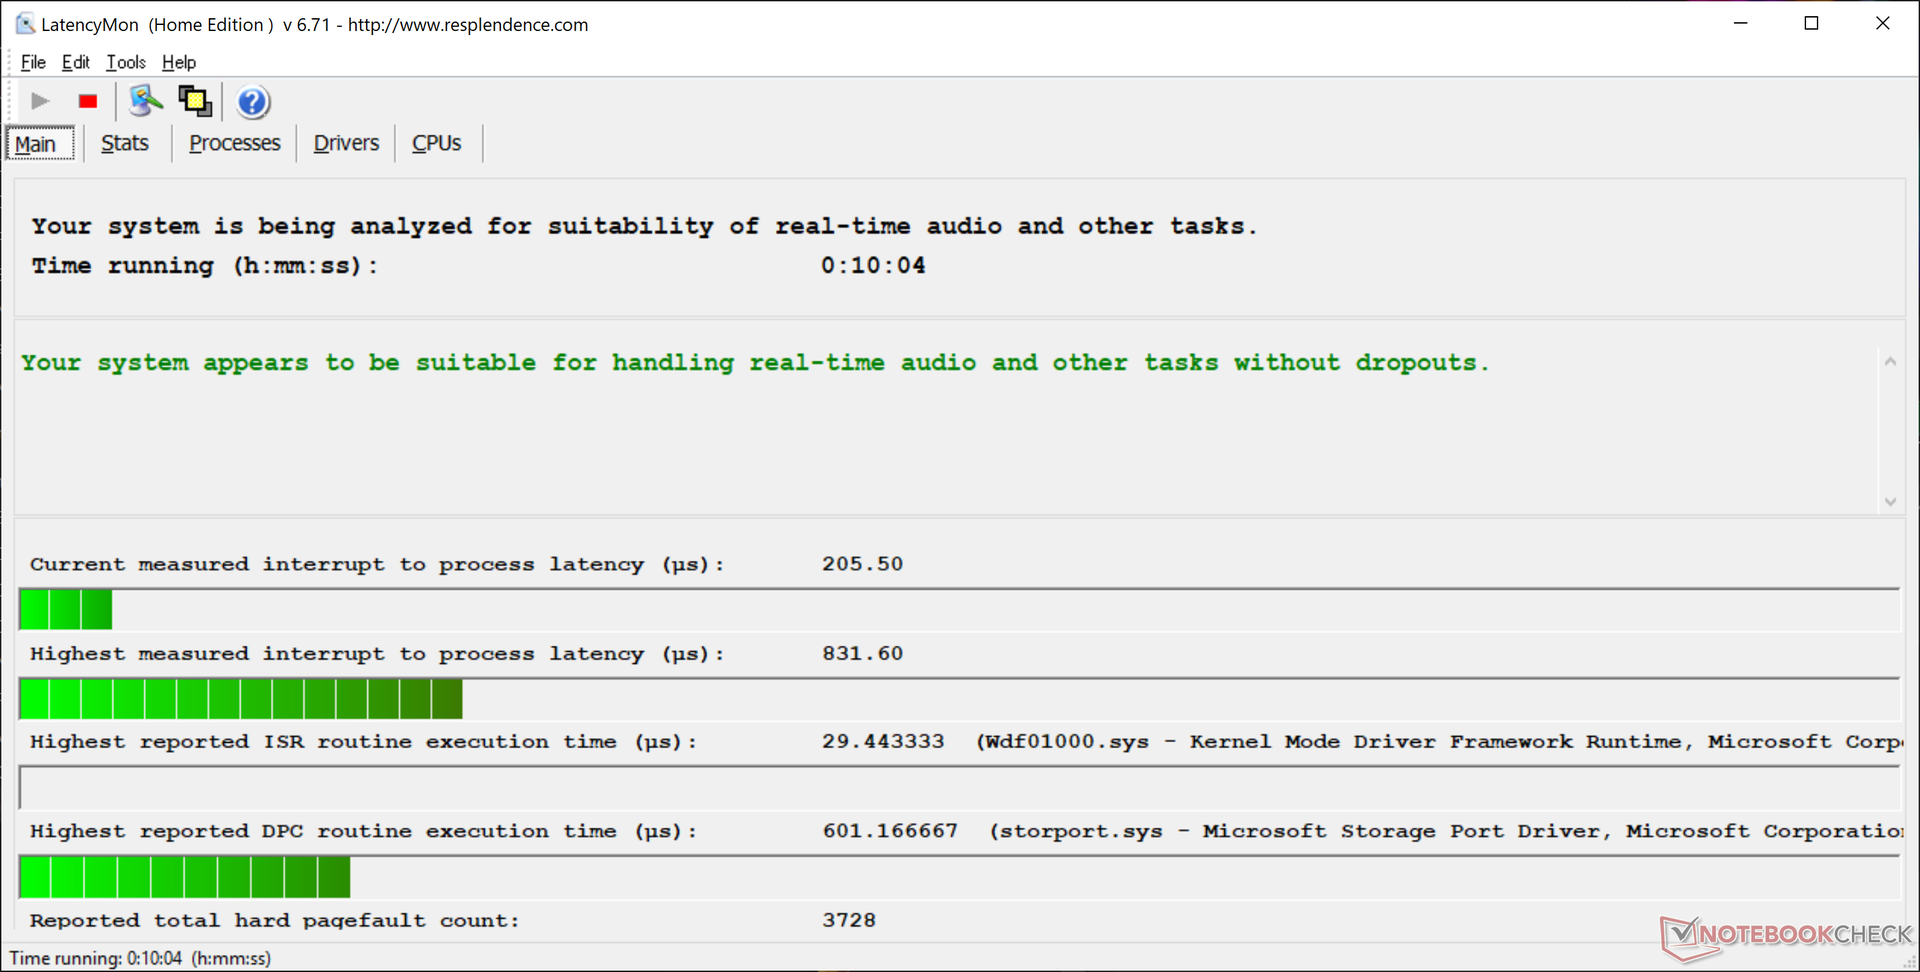
LatencyMon shows DPC latency issues only when WLAN is enabled.
Processor
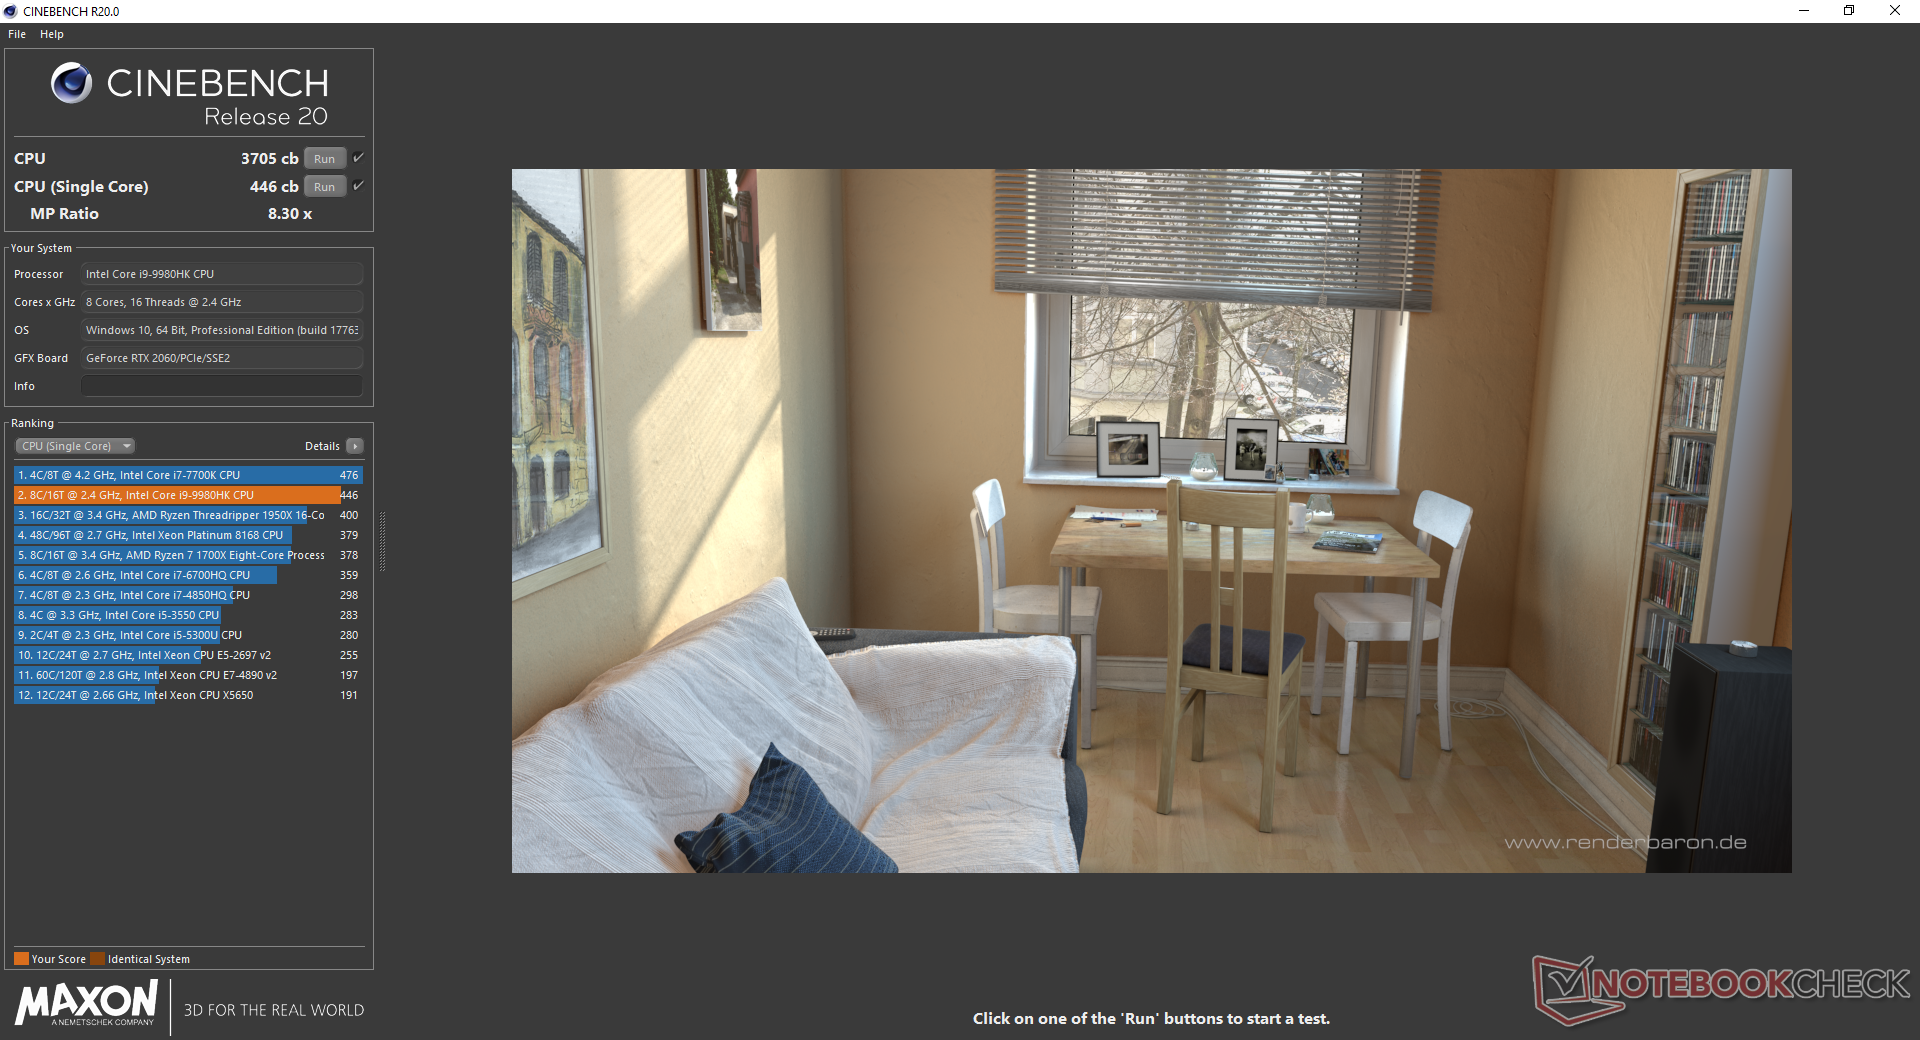
Core i9 CPUs for laptops have been a mixed bag. If the cooling solution can't sustain the very high Turbo Boost clock rates that the Core i9 series is known for, then overall performance won't be all that much better than a regular Core i7. The unlocked Core i9-9980HK in our Asus does a decent job at maintaining consistent performance over long periods of stress as shown by our CineBench R15 Multi-Thread loop graph below. Results are faster than on both the Dell XPS 15 7590 and Eurocom Nightsky RX15 each equipped with the same i9-9980HK CPU.
In general, users can expect 17 percent and 25 percent faster multi-thread performance than the average Core i9-9880H and last generation Core i9-8950HK, respectively, before accounting for any potential throttling. Upgrading from the Core i7-8750H or Core i7-9750H will bring a performance boost of about 35 percent.
See our dedicated page on the Core i9-9980HK here for more technical information and benchmark comparisons.

System Performance
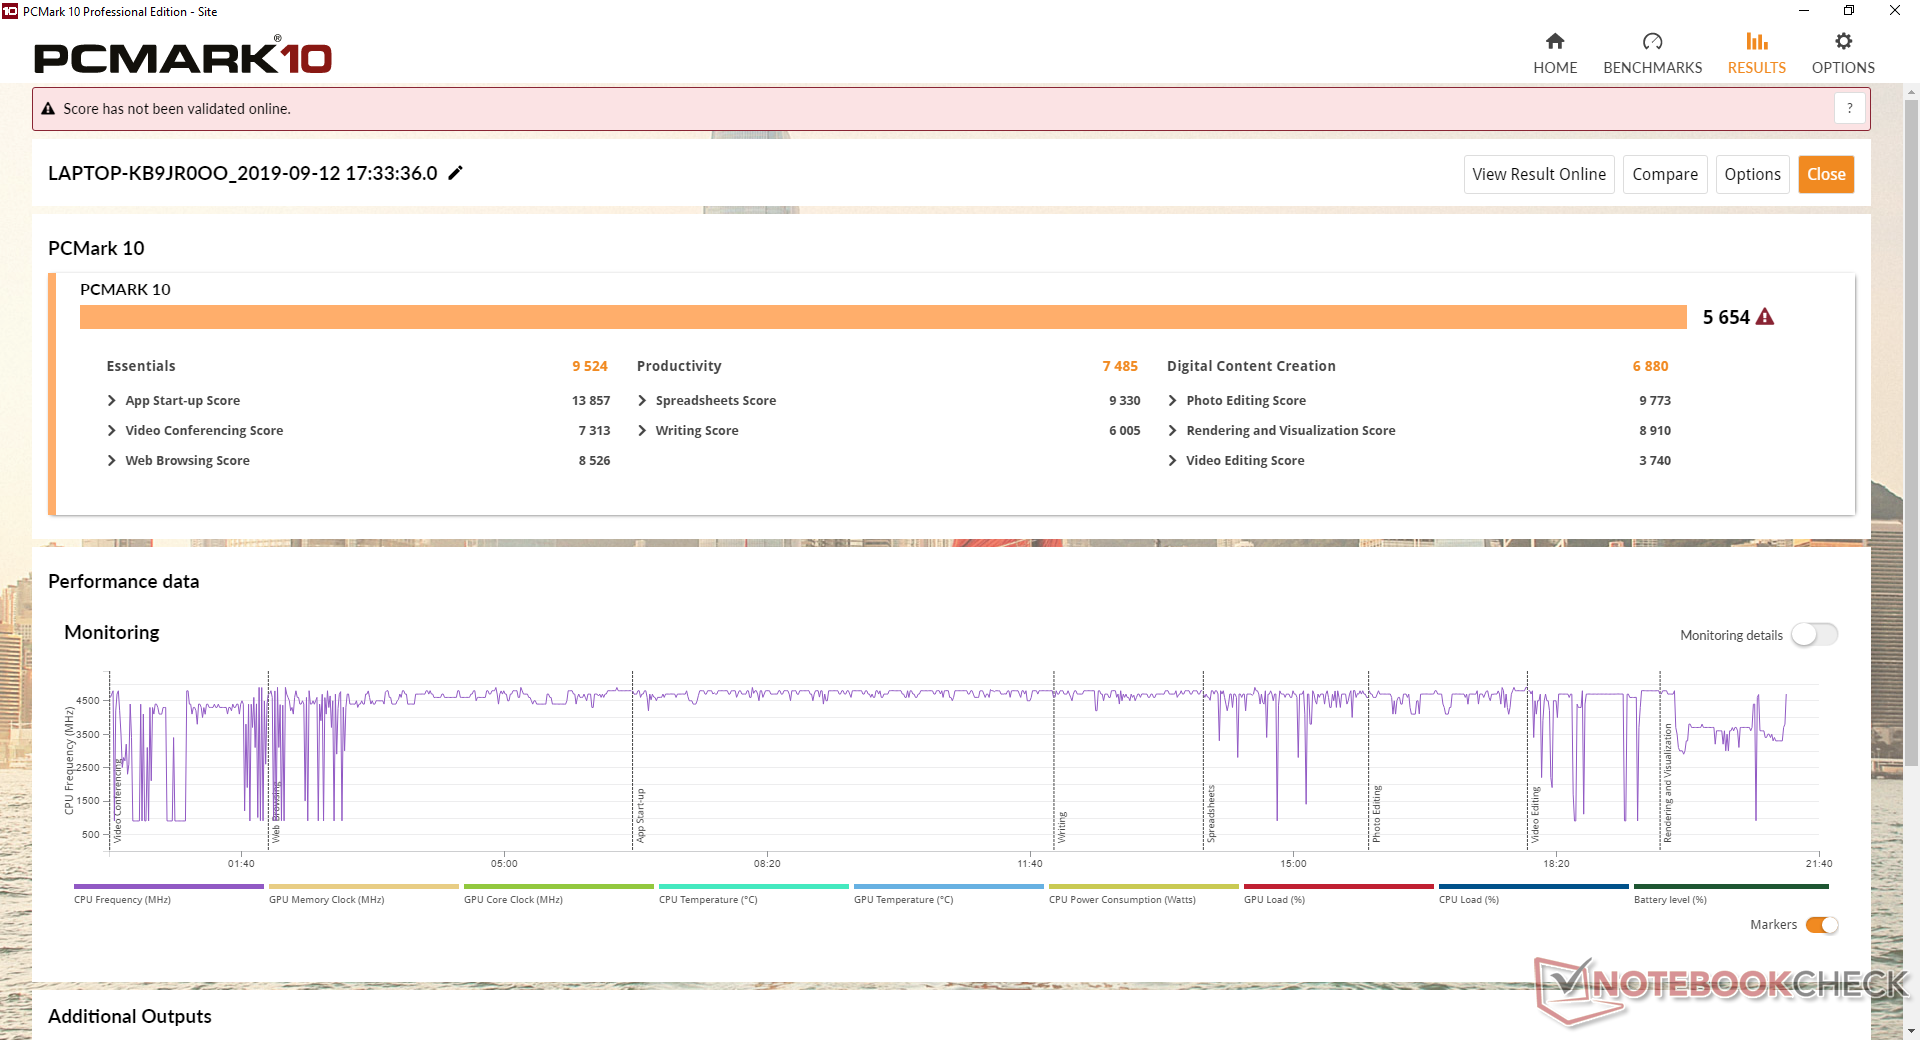
PCMark benchmarks rank our UX581 just a few percentage points higher than last year's UX580 meaning that you won't be noticing any huge gains in day-to-day workloads like browsing or multi-tasking. The exception is in GPU-heavy loads like editing or design as exemplified by the higher Digital Content Creation score since the performance jump from GTX 1050 Ti to the RTX 2060 is significant.
We experienced no software or hardware issues on our test unit other than the wireless issue mentioned above.
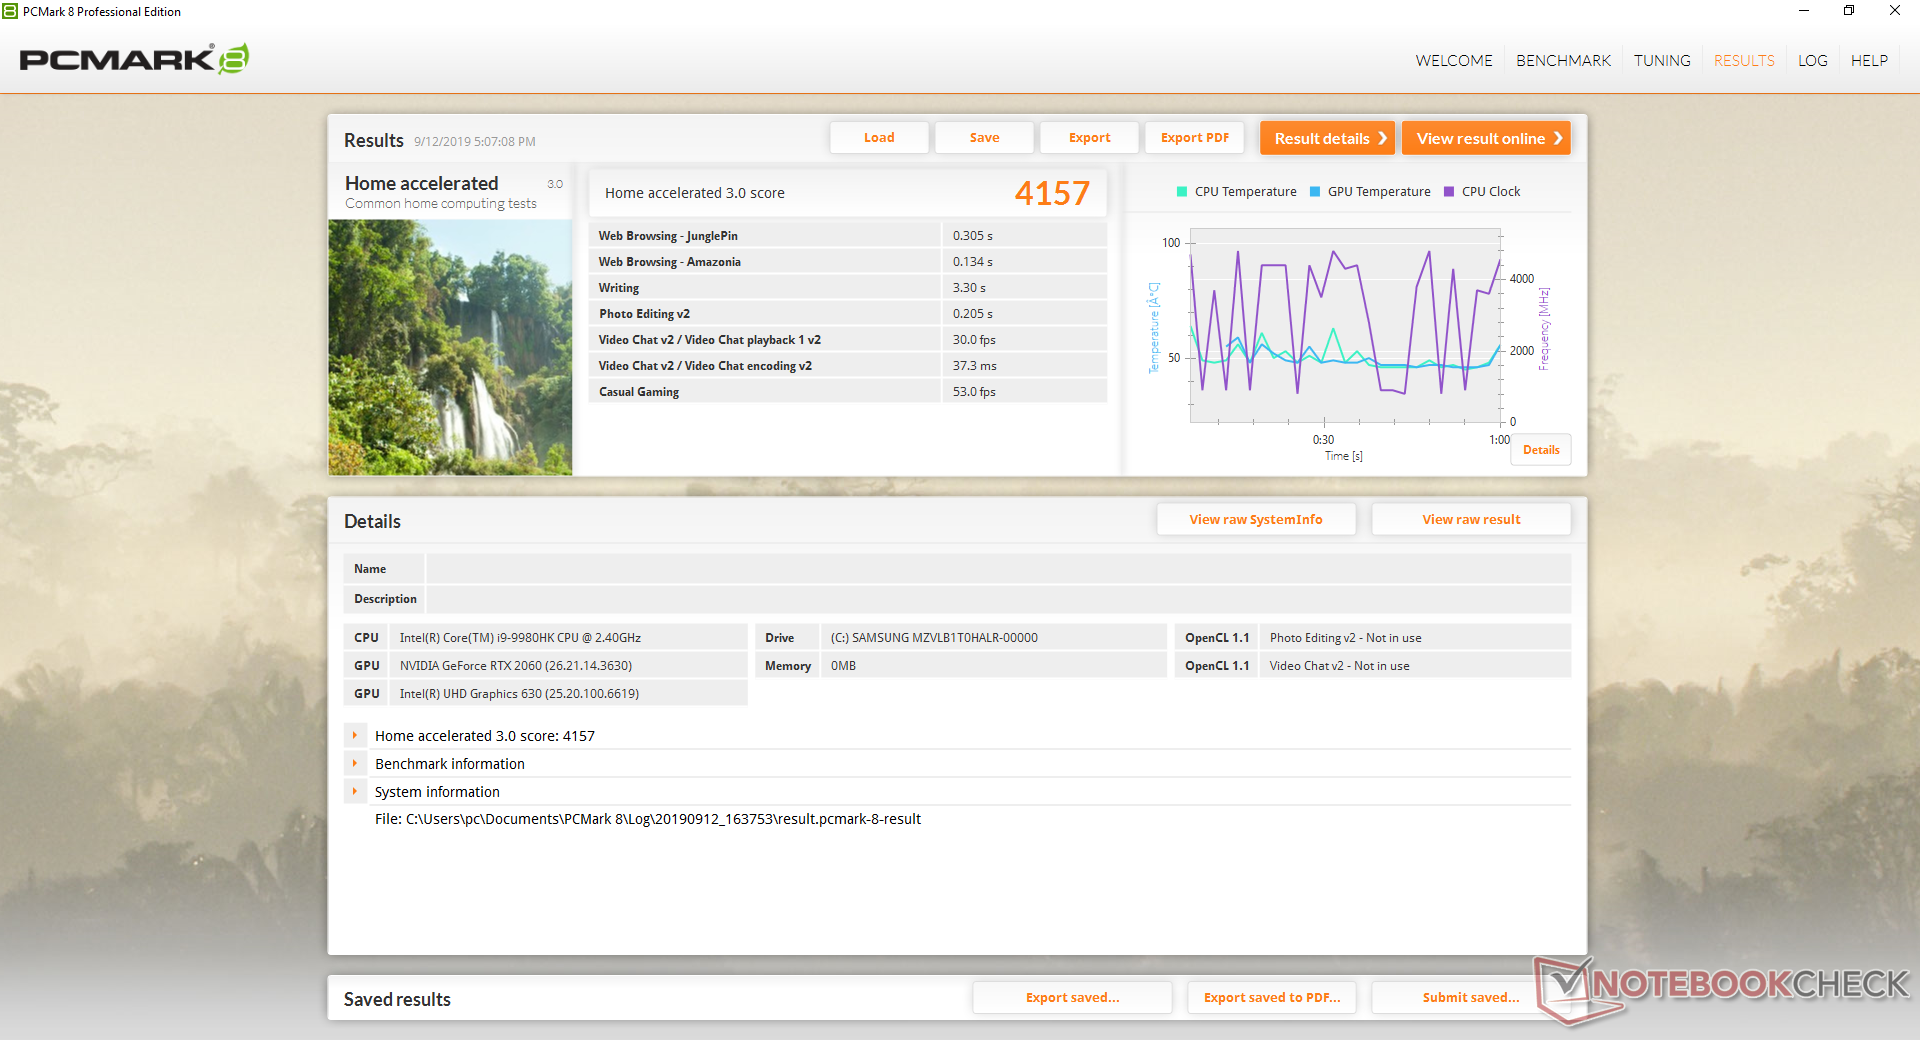
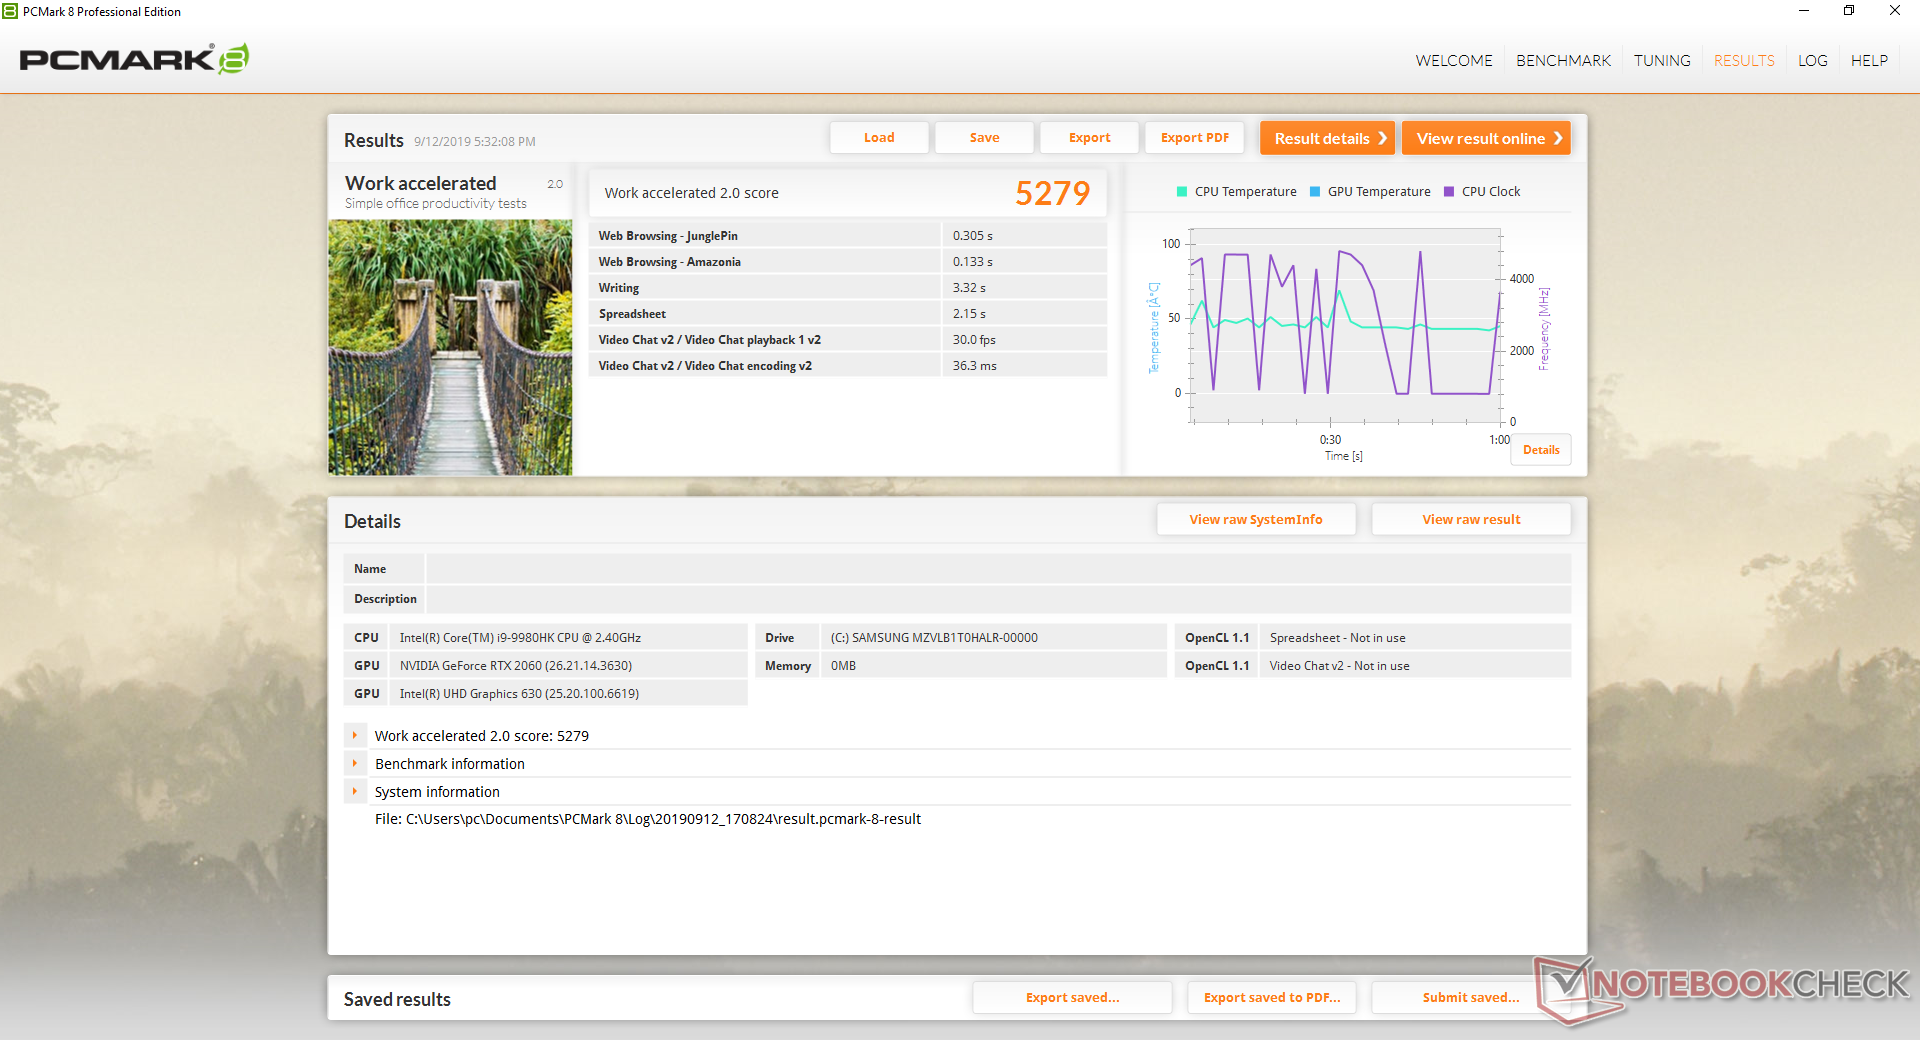
| PCMark 8 Home Score Accelerated v2 | 4157 points | |
| PCMark 8 Work Score Accelerated v2 | 5279 points | |
| PCMark 10 Score | 5654 points | |
Help | ||
Storage Devices
Internal storage is limited to just a single M.2 2280 PCIe x4 slot whereas other 15.6-inch laptops like the XPS 15 7590 or Asus ROG GL531 have secondary options. When considering that the UX581 is supposed to be a multimedia laptop for creators, you're likely going to want to append external storage drives or invest in a very high capacity internal M.2 drive.
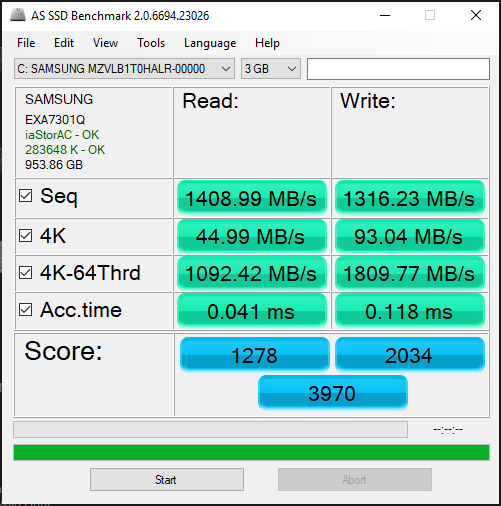
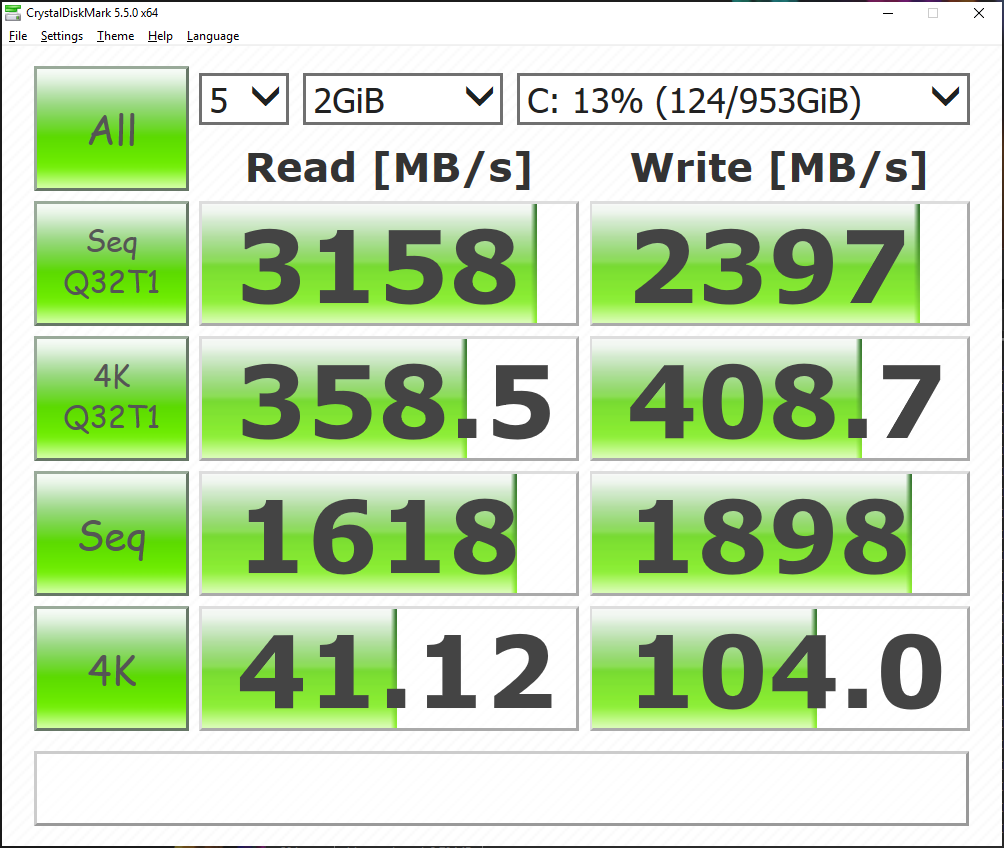
Our specific test unit comes equipped with a 1 TB Samsung SSD PM981 for sequential read and write speeds of about 1400 MB/s each according to AS SSD. The PM961 on last year's UX580 shows faster speeds in both AS SSD and CrystalDiskMark.
See our table of SSDs and HDDs for more benchmark comparisons.
| Asus ZenBook Pro Duo UX581GV Samsung SSD PM981 MZVLB1T0HALR | Asus ZenBook Pro 15 UX580GE Samsung SSD PM961 1TB M.2 PCIe 3.0 x4 NVMe (MZVLW1T0) | Asus ZenBook 15 UX533FD WDC PC SN520 SDAPNUW-512G | Dell XPS 15 7590 9980HK GTX 1650 Toshiba XG6 KXG60ZNV1T02 | Asus Strix Scar III G531GW Intel SSD 660p 1TB SSDPEKNW010T8 | HP Omen X 2S 15-dg0075cl WDC PC SN720 SDAPNTW-1T00 | |
|---|---|---|---|---|---|---|
| AS SSD | -0% | -23% | 7% | -37% | 16% | |
| Seq Read (MB/s) | 1409 | 2099 49% | 579 -59% | 1723 22% | 1574 12% | 2105 49% |
| Seq Write (MB/s) | 1316 | 1729 31% | 411.8 -69% | 1386 5% | 1591 21% | 2493 89% |
| 4K Read (MB/s) | 44.99 | 37.78 -16% | 41.81 -7% | 43.25 -4% | 26.79 -40% | 25.01 -44% |
| 4K Write (MB/s) | 93 | 100.9 8% | 131.6 42% | 98.3 6% | 105.1 13% | 108.7 17% |
| 4K-64 Read (MB/s) | 1092 | 1431 31% | 975 -11% | 1078 -1% | 583 -47% | 1604 47% |
| 4K-64 Write (MB/s) | 1810 | 1273 -30% | 1047 -42% | 1456 -20% | 603 -67% | 1593 -12% |
| Access Time Read * (ms) | 0.041 | 0.04 2% | 0.08 -95% | 0.05 -22% | 0.128 -212% | 0.046 -12% |
| Access Time Write * (ms) | 0.118 | 0.036 69% | 0.027 77% | 0.039 67% | 0.043 64% | 0.102 14% |
| Score Read (Points) | 1278 | 1679 31% | 1075 -16% | 1294 1% | 768 -40% | 1840 44% |
| Score Write (Points) | 2034 | 1547 -24% | 1220 -40% | 1693 -17% | 867 -57% | 1951 -4% |
| Score Total (Points) | 3970 | 4065 2% | 2845 -28% | 3638 -8% | 2033 -49% | 4743 19% |
| Copy ISO MB/s (MB/s) | 2112 | 1045 -51% | 3182 51% | 2250 7% | ||
| Copy Program MB/s (MB/s) | 874 | 430.9 -51% | 984 13% | 896 3% | ||
| Copy Game MB/s (MB/s) | 1677 | 728 -57% | 1824 9% | 1854 11% |
* ... smaller is better

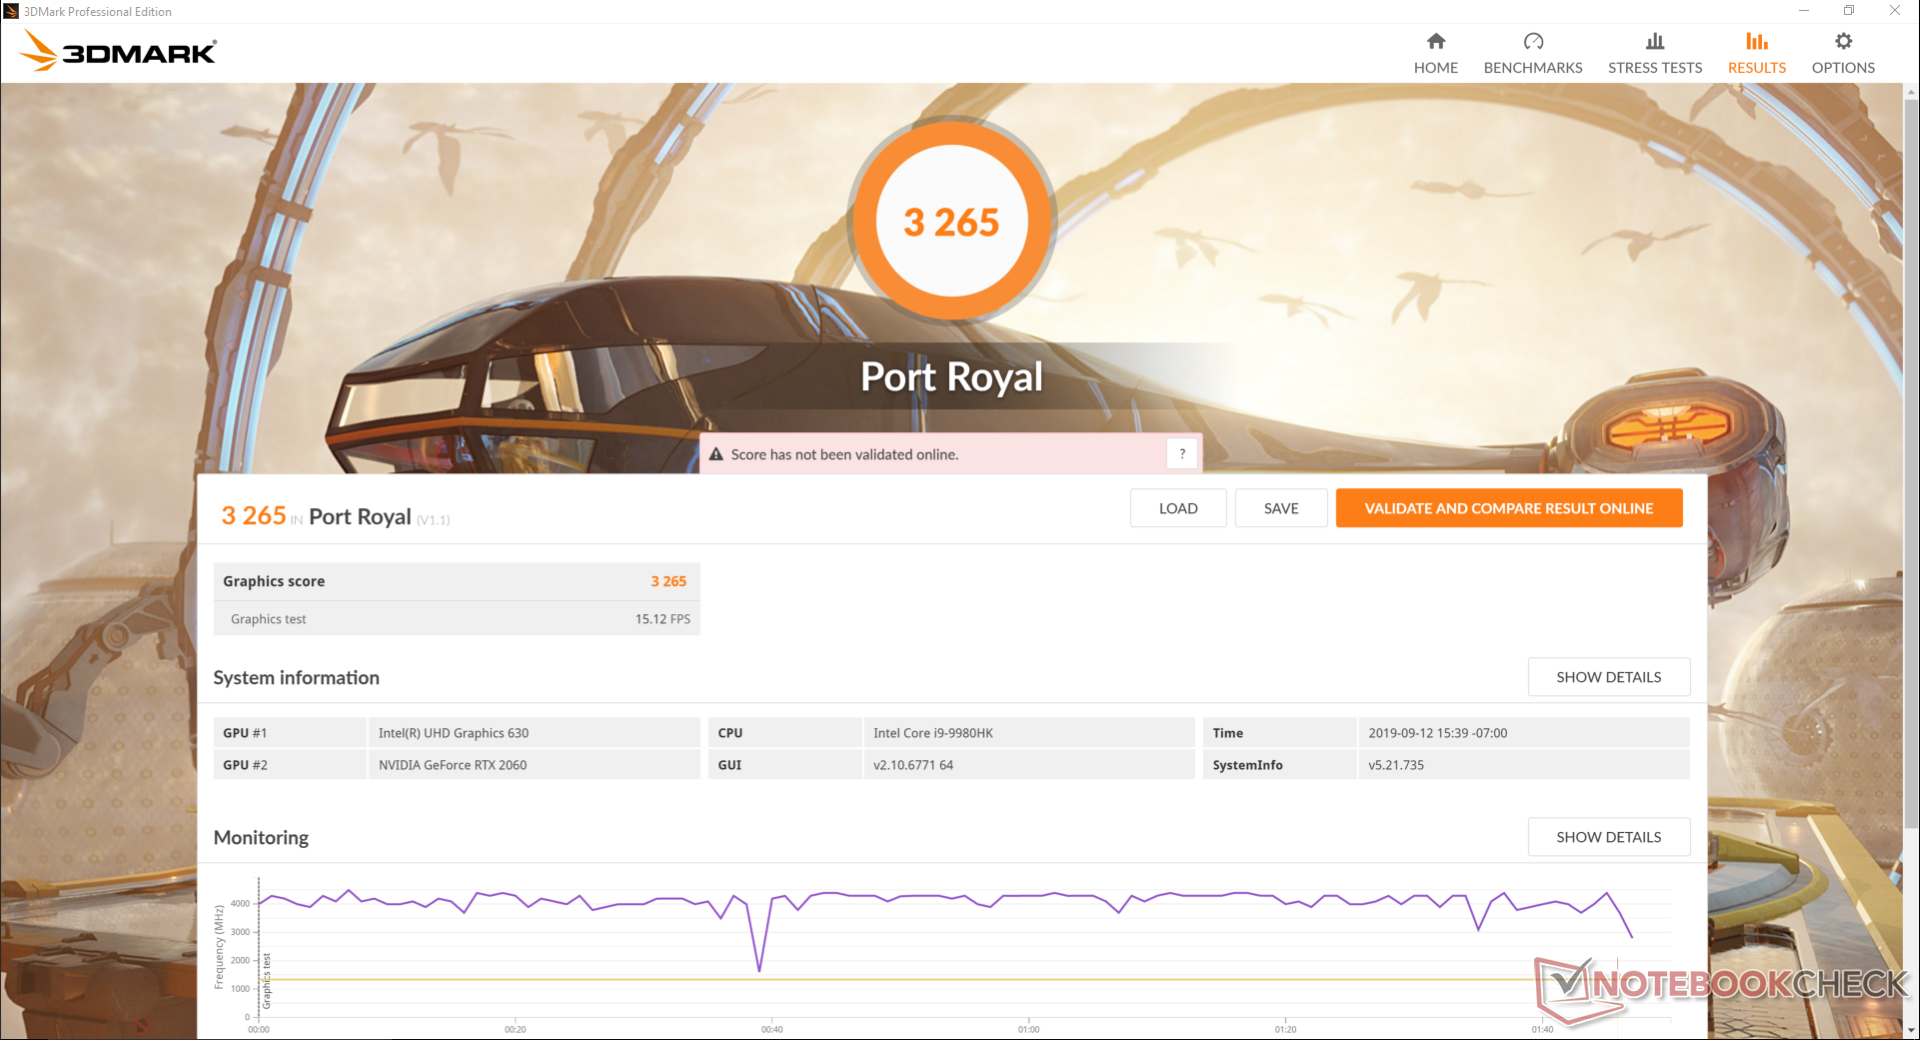
GPU Performance
3DMark benchmarks rank the Asus GeForce RTX 2060 within just a few percentage points of the average RTX 2060 in our database taken from 10 other gaming laptops. This means users can expect 25 percent slower performance than a desktop RTX 2060 and about 30 to 60 percent faster performance than the last generation GTX 1060. If you don't value DLSS or ray-tracing, then the mobile RTX 2060 is essentially on par with the mobile GTX 1660 Ti even though the latter can be hundreds of dollars cheaper.
Running Fire Strike on the default Auto Fan mode vs. Turbo Fan mode returns almost no differences in final scores. Nonetheless, Turbo Fan mode will benefit users who intend to stress the CPU to 100 percent utilization as our Stress Test section will show.
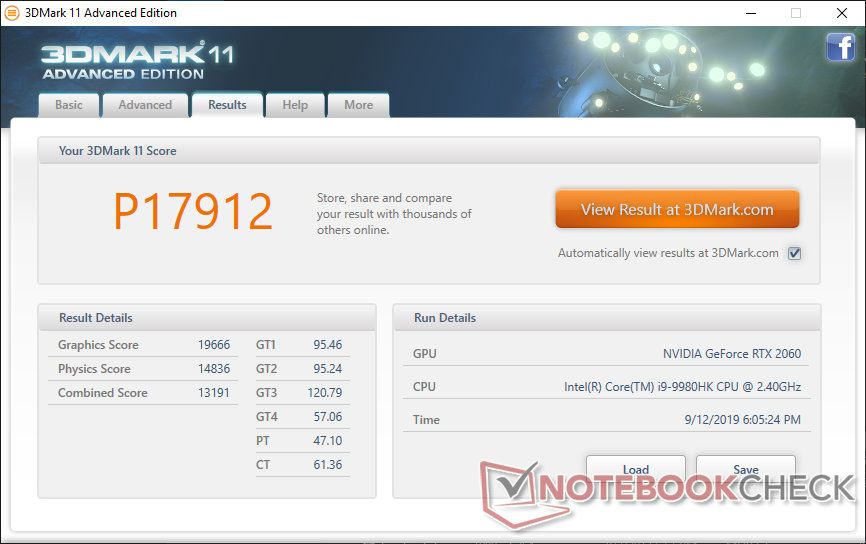
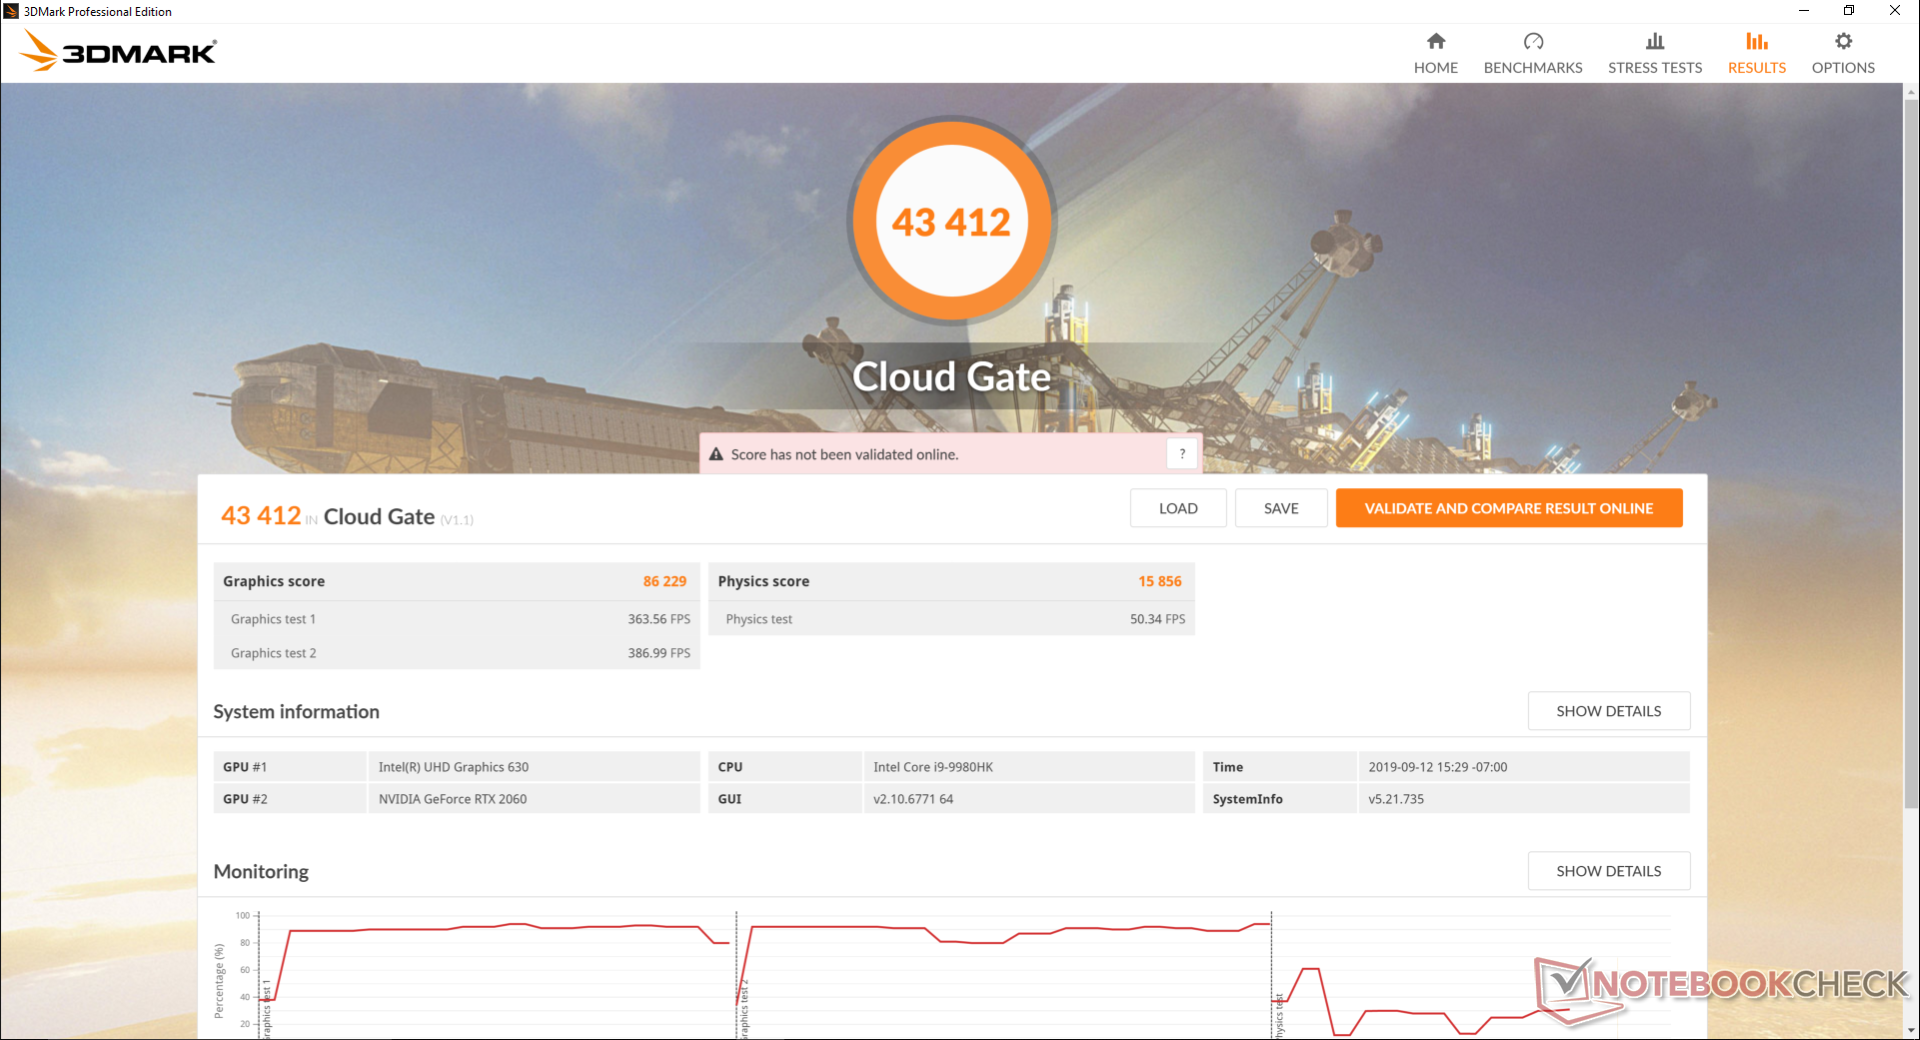

| 3DMark 11 Performance | 17912 points | |
| 3DMark Cloud Gate Standard Score | 43412 points | |
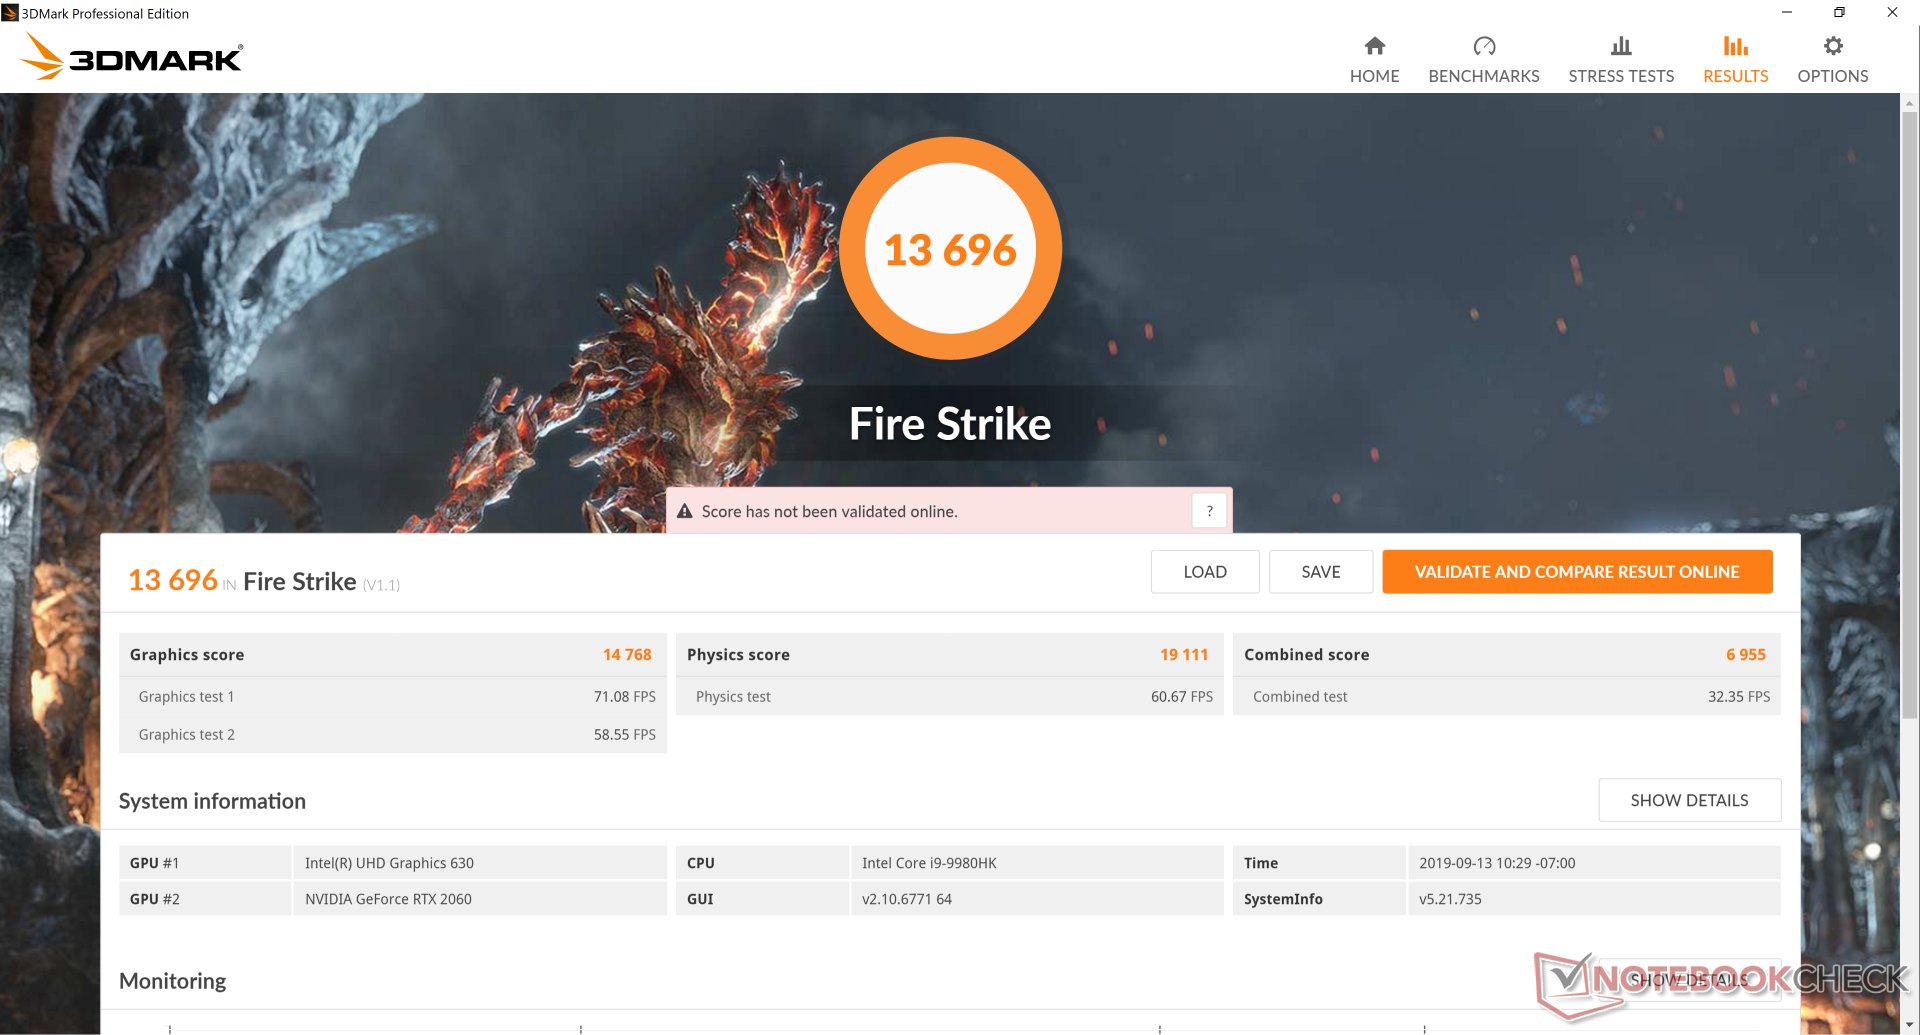
| 3DMark Fire Strike Score | 13696 points | |
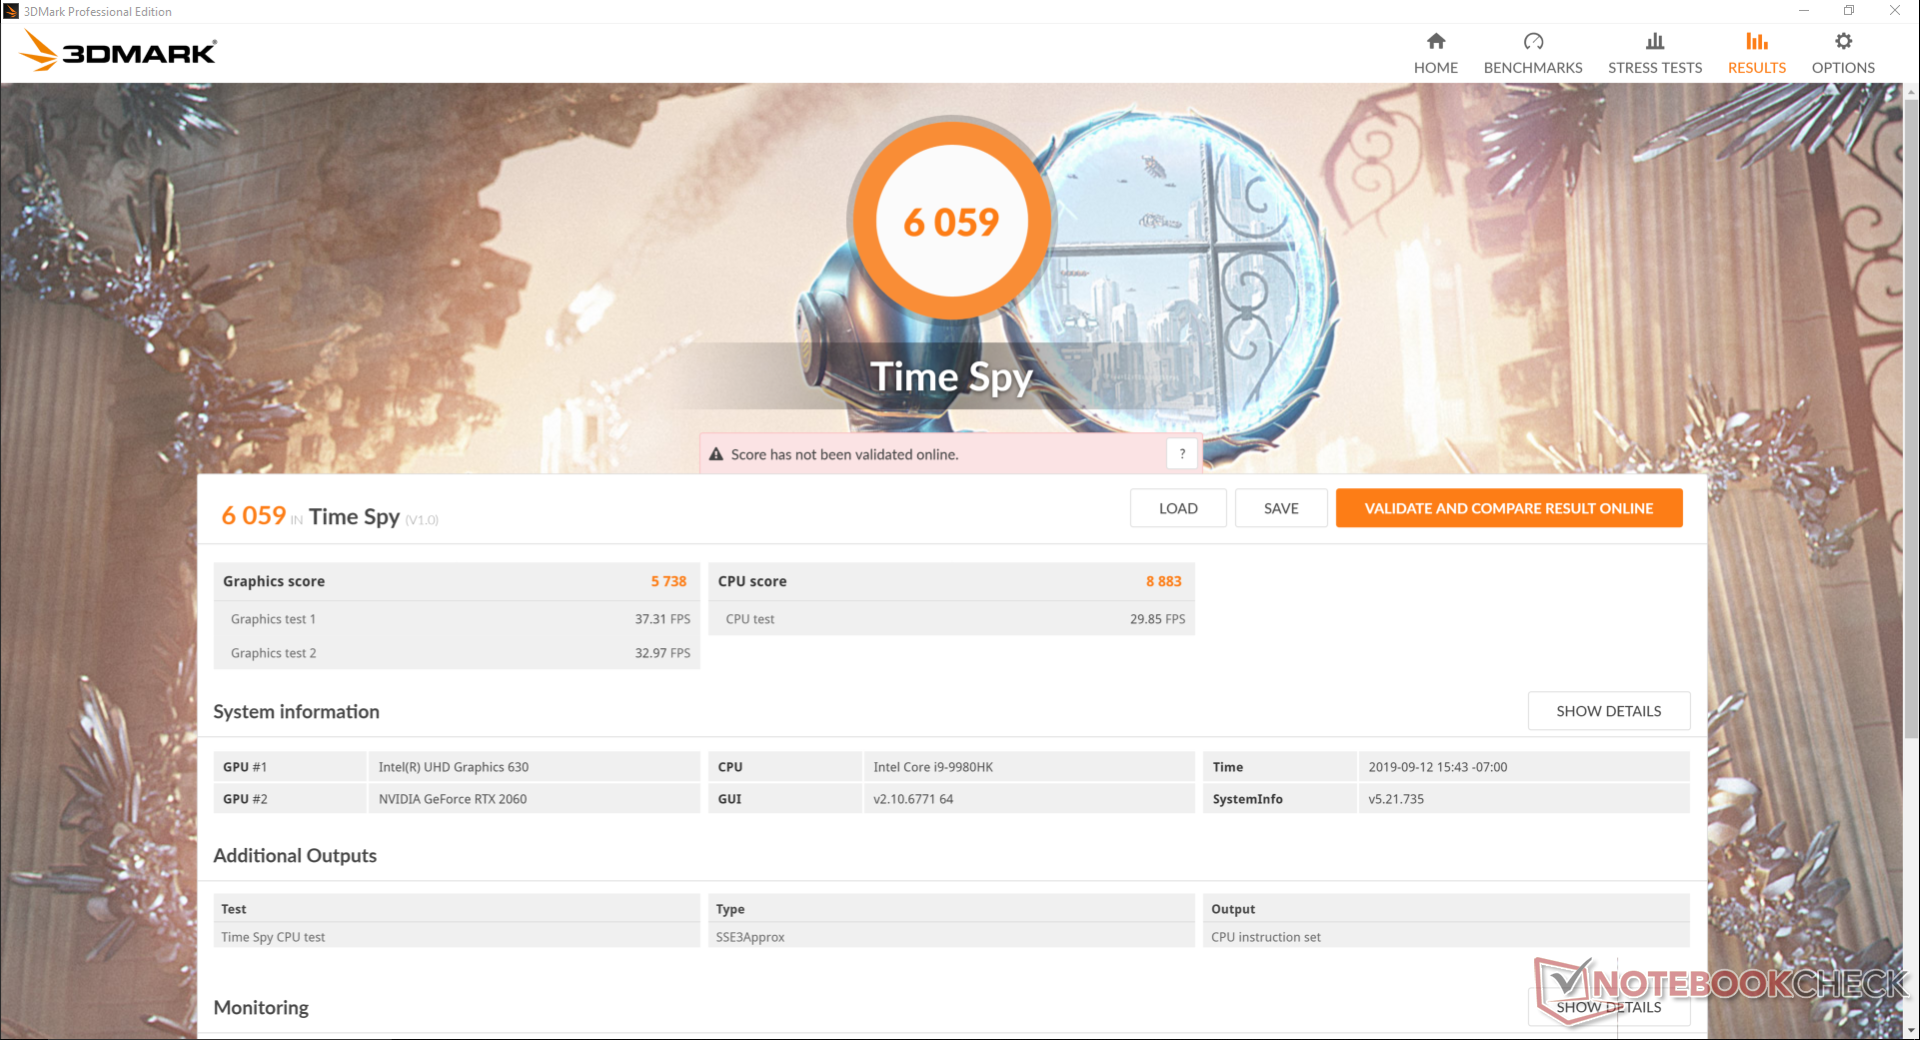
| 3DMark Time Spy Score | 6059 points | |
Help | ||
Gaming Performance
Of all the RTX GPUs available, the performance gap between mobile and desktop is widest on the RTX 2060. Users can get nearly the same 1080p performance from the cheaper GTX 1660 Ti assuming no ray-tracing or DLSS features.
Idling on Witcher 3 shows steady performance over time. We did, however, observe that the game would automatically minimize on its own should it idle for ~30 minutes which occurred twice during our hour-long test.
See our dedicated page on the GeForce RTX 2060 for more technical information and benchmark comparisons.
| low | med. | high | ultra | 4K | |
|---|---|---|---|---|---|
| The Witcher 3 (2015) | 267 | 185.4 | 112.8 | 57.2 | 41.3 |
| Rocket League (2017) | 249 | 241.9 | 180.6 | 96.2 | |
| Shadow of the Tomb Raider (2018) | 114 | 87 | 80 | 71 | 24 |
Emissions
System Noise
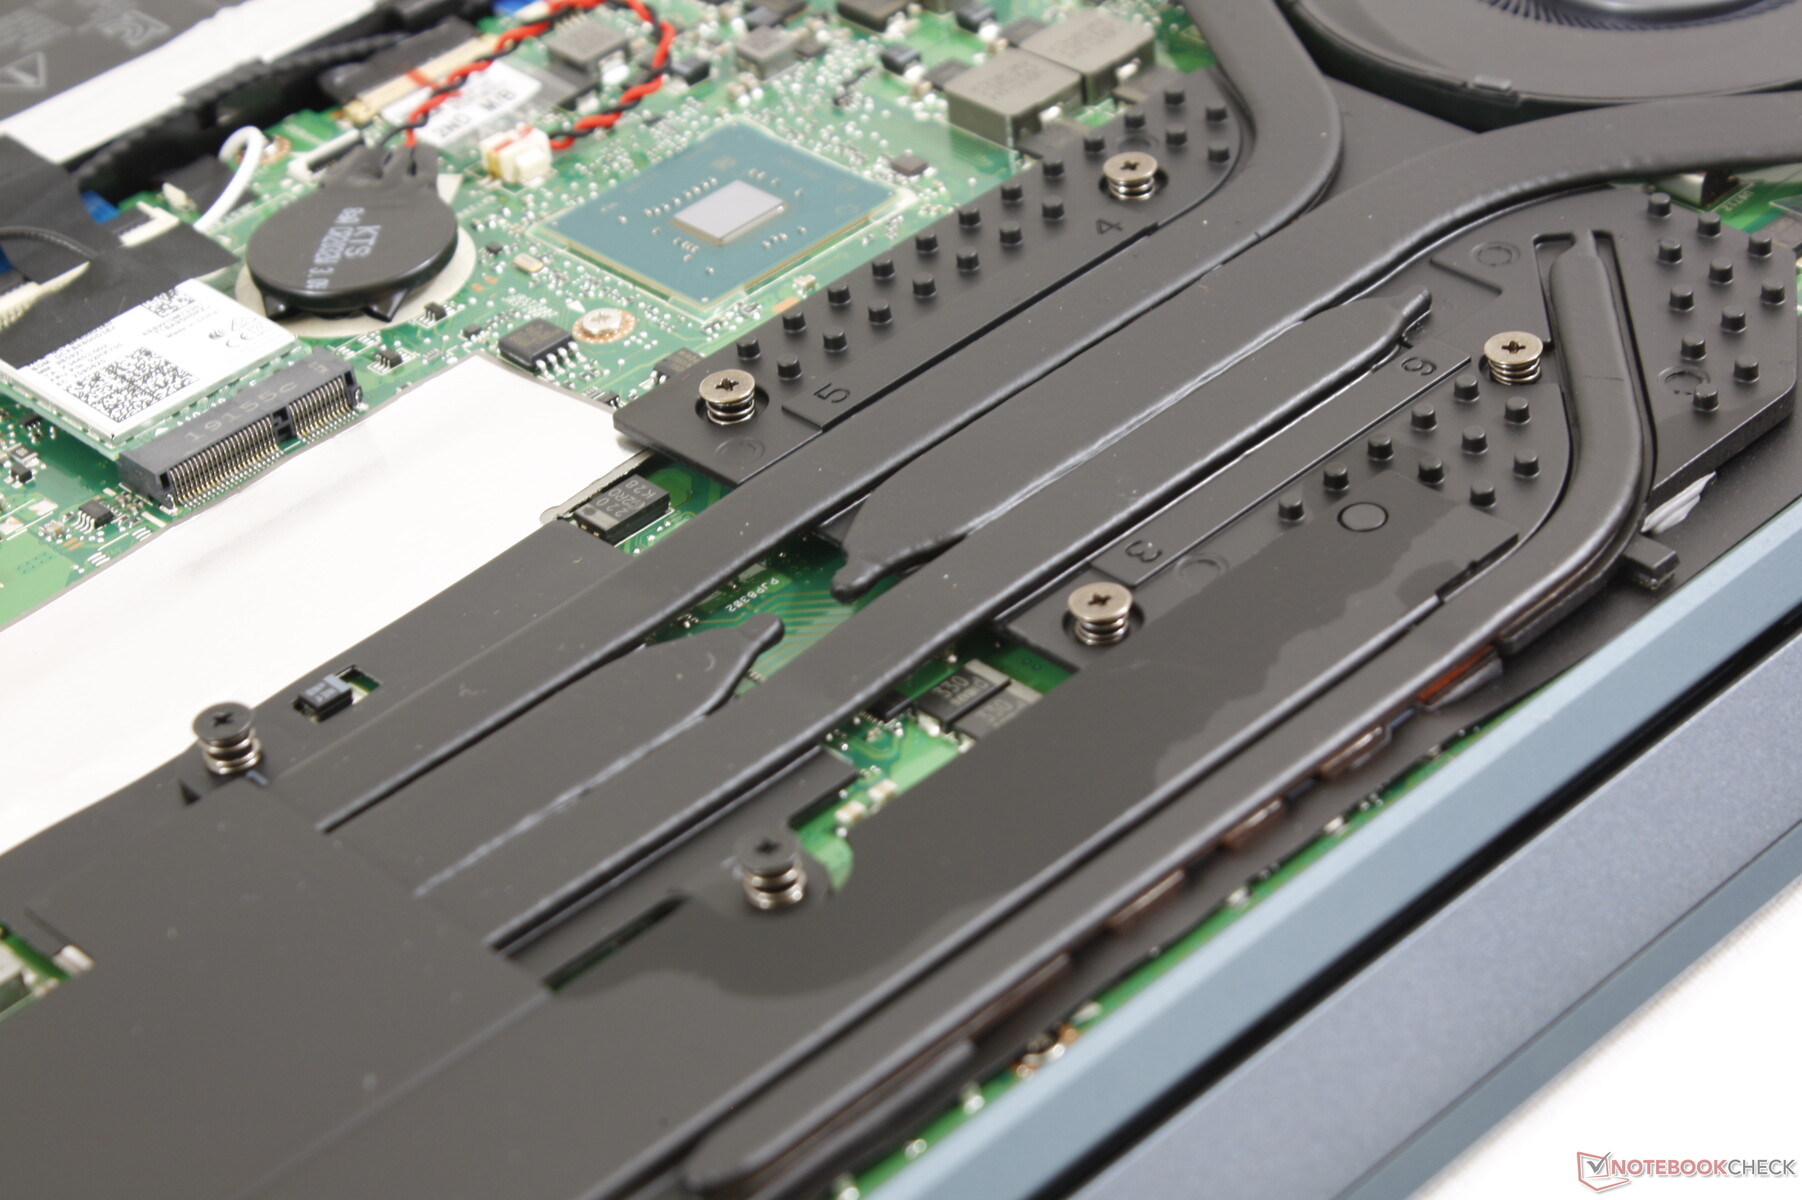
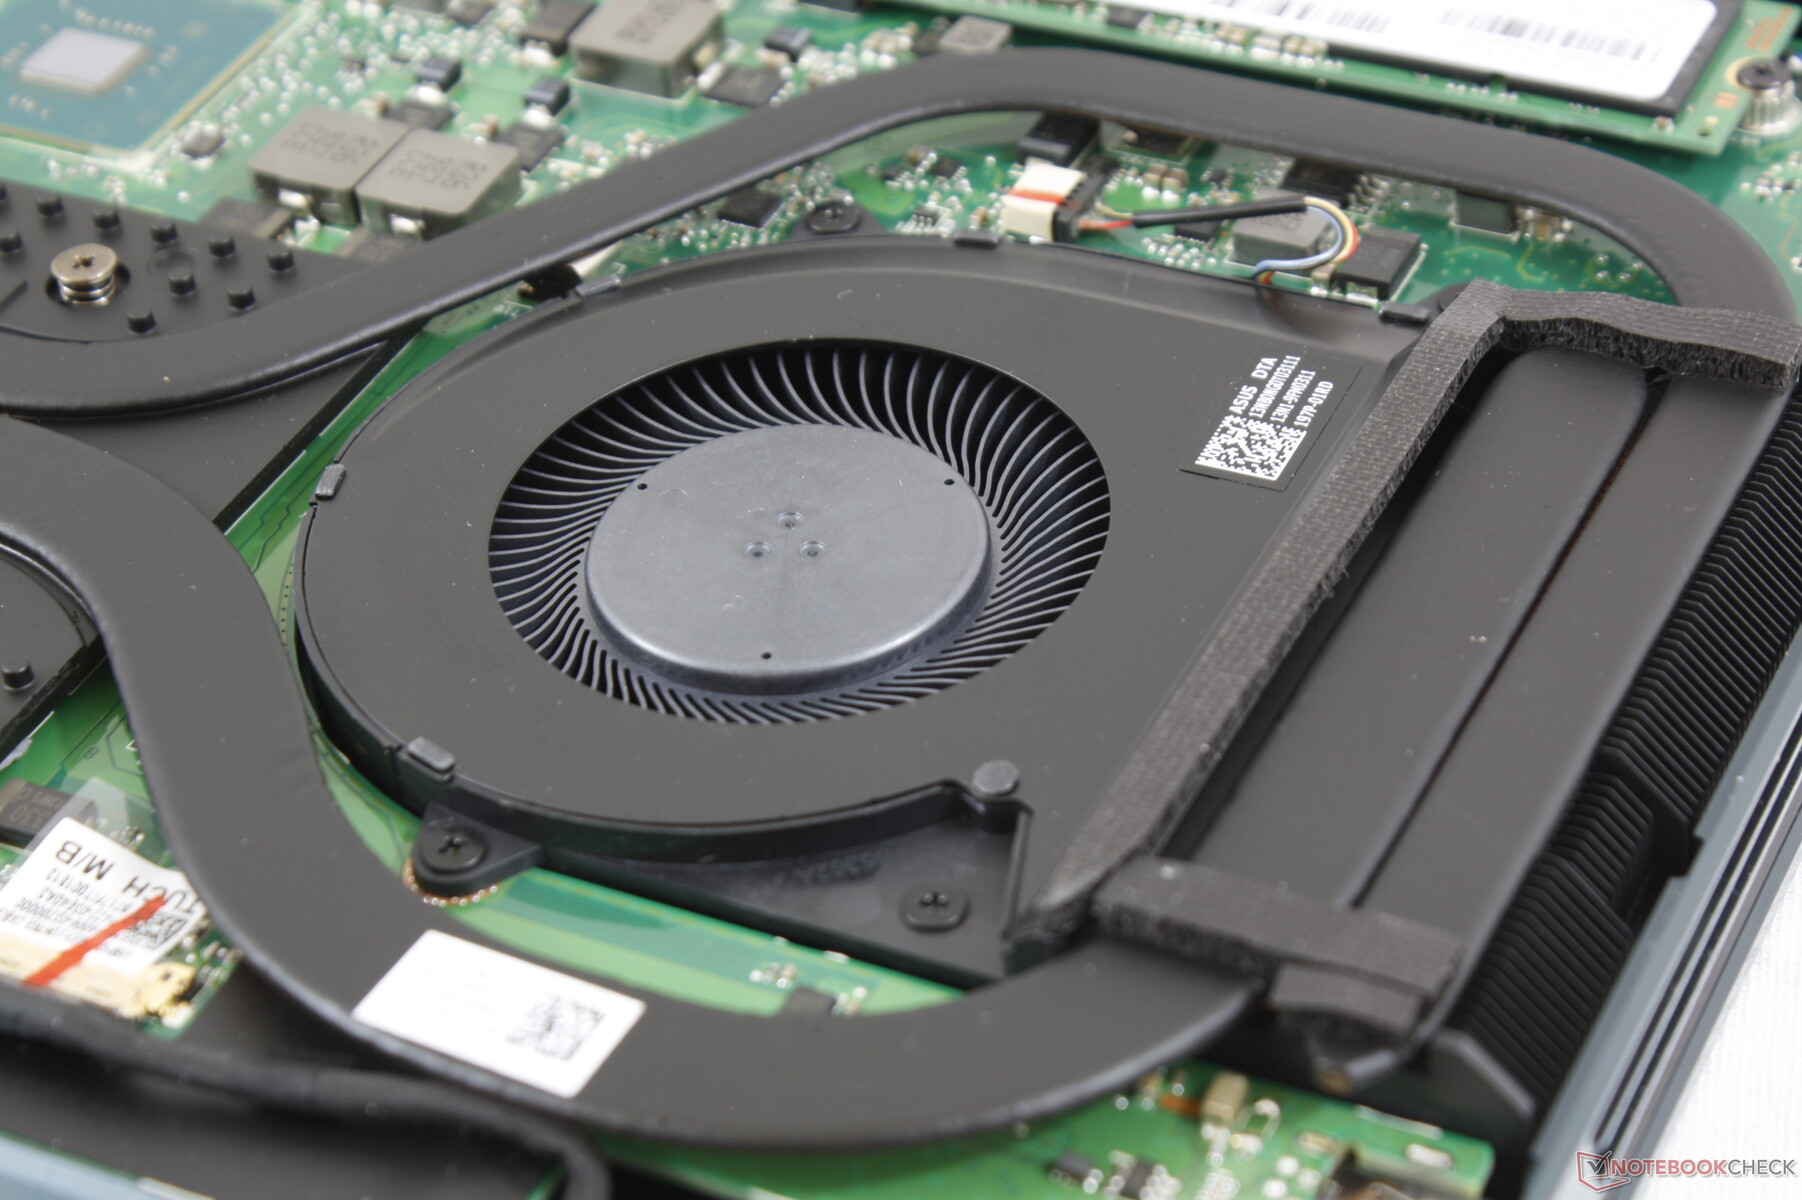
The cooling solution consists of two fans and five heat pipes between them. Fan noise is ever present meaning that the system is never truly silent when it is powered on. Fortunately, the fans are lethargic during low to low-medium loads topping out at just 31.9 dB(A) if simply web surfing or video streaming.
For higher loads like editing where bursts of high CPU clock rates are common, fan noise would rise to 35.4 dB(A). Running Witcher 3 on the default Auto Fan mode bumps fan noise to a steady 39.2 dB(A) which is quieter than most gaming laptops.
Toggling Turbo Fan mode when gaming will induce a maximum fan noise of 50 dB(A) to be louder than last year's UX580 or Dell's XPS 15 7590. Turbo Fan mode improves CPU performance more than the GPU, however, so it is not necessary in most cases when gaming.
We're able to notice slight coil whine on our unit when placing an ear near the keyboard keys. It's not loud enough to be an annoyance since the fans are more overwhelming.
| Asus ZenBook Pro Duo UX581GV GeForce RTX 2060 Mobile, i9-9980HK, Samsung SSD PM981 MZVLB1T0HALR | Asus ZenBook Pro 15 UX580GE GeForce GTX 1050 Ti Mobile, i9-8950HK, Samsung SSD PM961 1TB M.2 PCIe 3.0 x4 NVMe (MZVLW1T0) | Asus ZenBook 15 UX533FD GeForce GTX 1050 Max-Q, i7-8565U, WDC PC SN520 SDAPNUW-512G | Dell XPS 15 7590 9980HK GTX 1650 GeForce GTX 1650 Mobile, i9-9980HK, Toshiba XG6 KXG60ZNV1T02 | Asus Strix Scar III G531GW GeForce RTX 2070 Mobile, i9-9880H, Intel SSD 660p 1TB SSDPEKNW010T8 | HP Omen X 2S 15-dg0075cl GeForce RTX 2070 Max-Q, i7-9750H, WDC PC SN720 SDAPNTW-1T00 | |
|---|---|---|---|---|---|---|
| Noise | -3% | -4% | -4% | -22% | -9% | |
| off / environment * (dB) | 28.4 | 28 1% | 30.5 -7% | 28.2 1% | 29 -2% | 29 -2% |
| Idle Minimum * (dB) | 29 | 28.6 1% | 30.5 -5% | 28.2 3% | 30 -3% | 30.5 -5% |
| Idle Average * (dB) | 29 | 29.9 -3% | 30.5 -5% | 28.2 3% | 37 -28% | 31.5 -9% |
| Idle Maximum * (dB) | 29 | 30.5 -5% | 30.5 -5% | 30.4 -5% | 39 -34% | 31.5 -9% |
| Load Average * (dB) | 35.4 | 42.5 -20% | 40.8 -15% | 43.8 -24% | 54 -53% | 40.6 -15% |
| Witcher 3 ultra * (dB) | 42 | 44.8 -7% | 47.2 -12% | 54 -29% | 49.5 -18% | |
| Load Maximum * (dB) | 50 | 44.8 10% | 41.8 16% | 47.2 6% | 54 -8% | 53.4 -7% |
* ... smaller is better
Noise level
| Idle |
| 29 / 29 / 29 dB(A) |
| Load |
| 35.4 / 50 dB(A) |
 | ||
30 dB silent 40 dB(A) audible 50 dB(A) loud |
||
min: | ||
Temperature
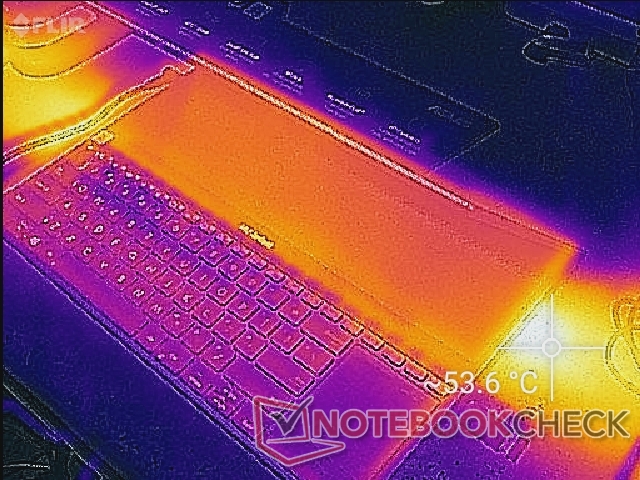
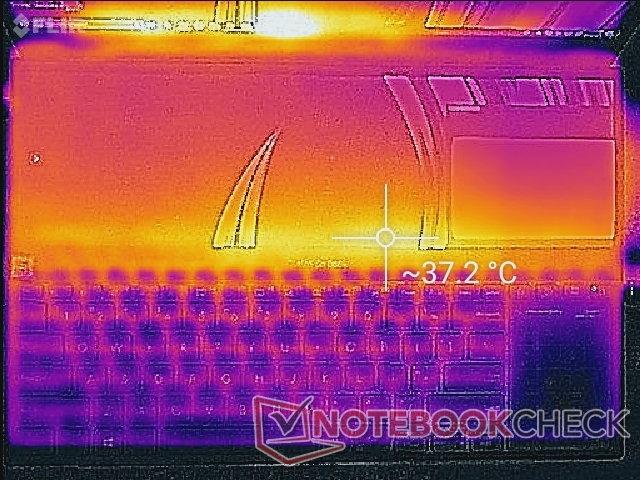
Surface temperature gradient is different than on most other laptops due to the unusual cooling design of the UX581. When idling on desktop, the warmest spot is nearest the center of the laptop where the keyboard borders the secondary screen as shown by our temperature maps below. Average surface temperatures are a few degrees warmer than on most other Ultrabooks likely due to the higher horsepower of the UX581.
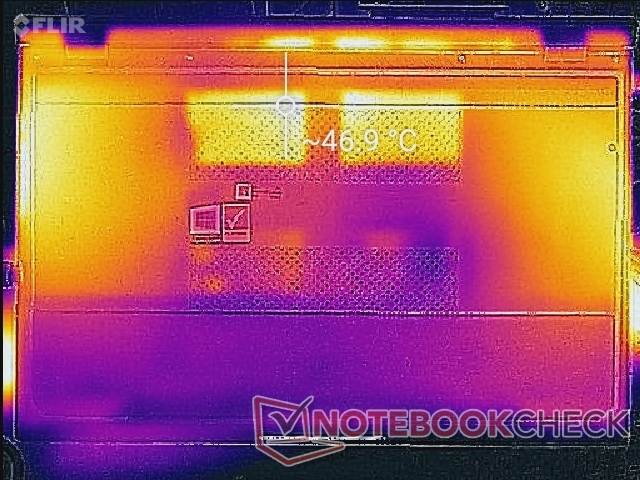
When gaming, quadrants closes to the outer edges of the laptop can reach 40 C to 45 C while the very center will be relatively cooler. This is opposite of most other gaming laptops where the chassis center will be warmer than the outer edges. Much like on the HP Omen 2S 15, Zephyrus S GX531, or Samsung Odyssey Z, the keyboard keys remain cool in the low 30 C range no matter the onscreen load since the entire keyboard is pushed forward.


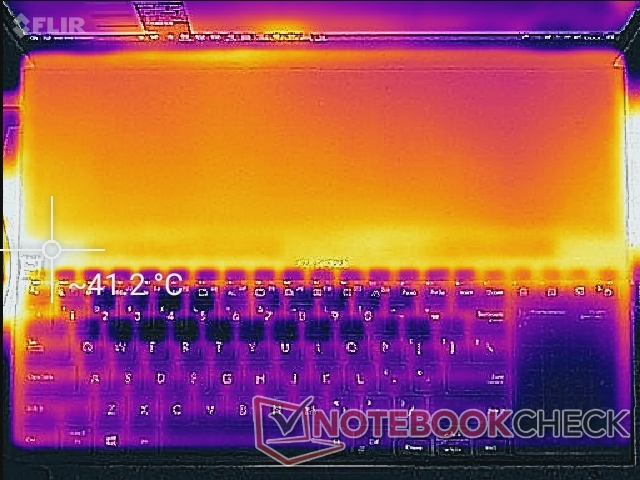

(±) The maximum temperature on the upper side is 40.4 °C / 105 F, compared to the average of 40.4 °C / 105 F, ranging from 21.2 to 68.8 °C for the class Gaming.
(-) The bottom heats up to a maximum of 47.8 °C / 118 F, compared to the average of 43.2 °C / 110 F
(±) In idle usage, the average temperature for the upper side is 34.5 °C / 94 F, compared to the device average of 33.9 °C / 93 F.
(±) Playing The Witcher 3, the average temperature for the upper side is 37.3 °C / 99 F, compared to the device average of 33.9 °C / 93 F.
(+) The palmrests and touchpad are reaching skin temperature as a maximum (34.6 °C / 94.3 F) and are therefore not hot.
(-) The average temperature of the palmrest area of similar devices was 28.8 °C / 83.8 F (-5.8 °C / -10.5 F).
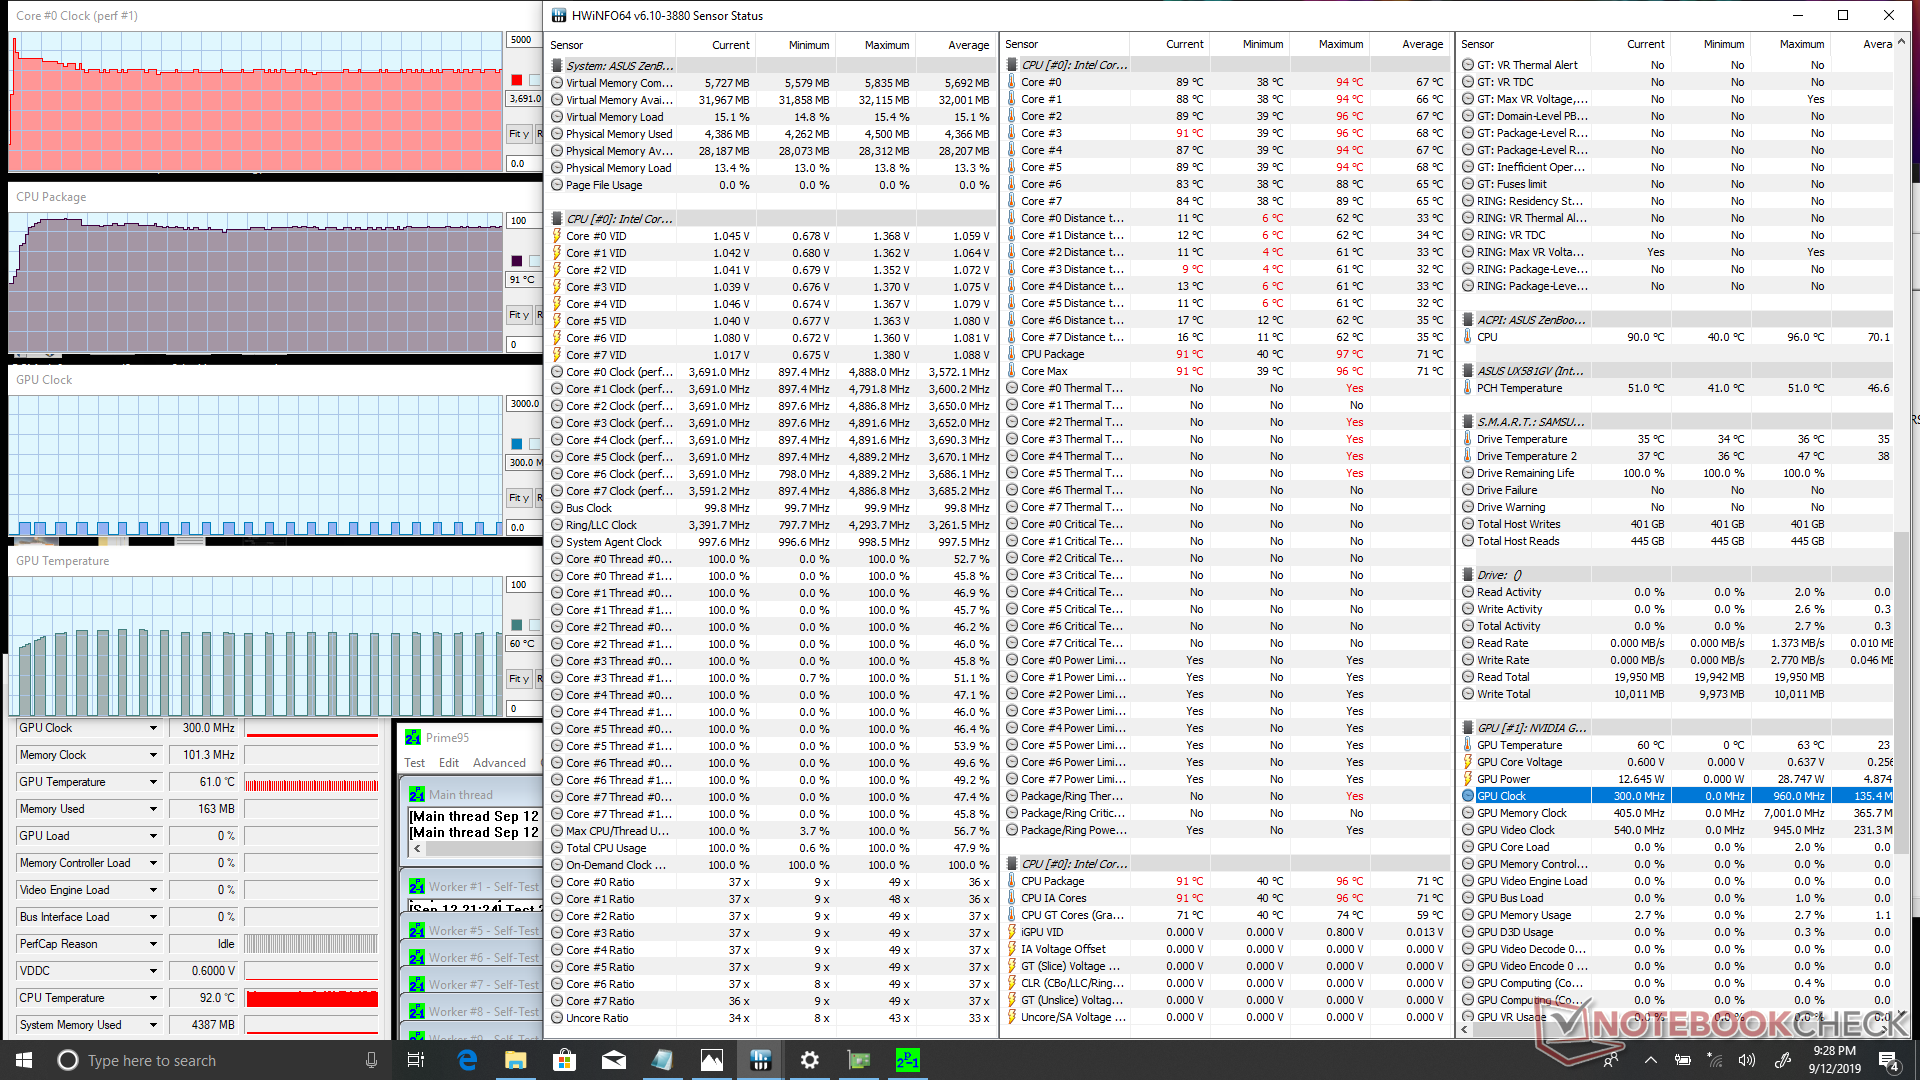
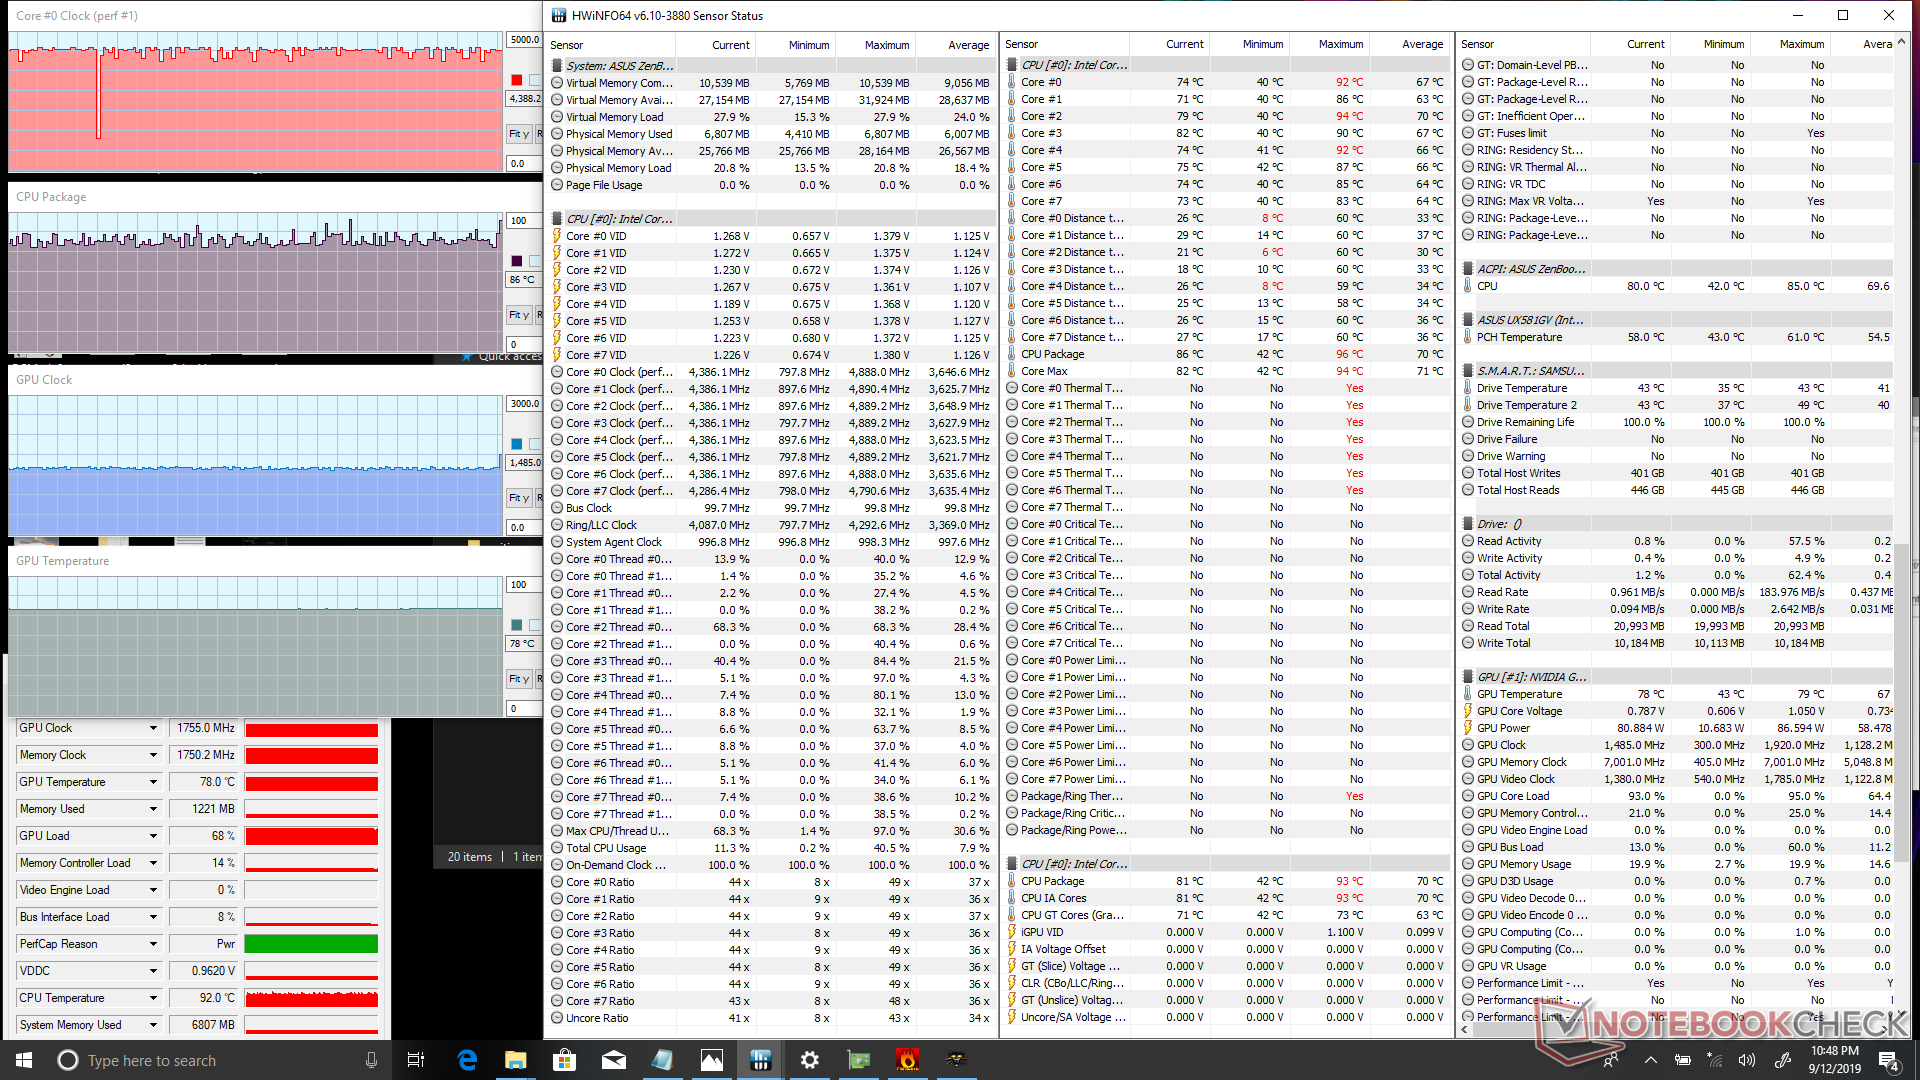
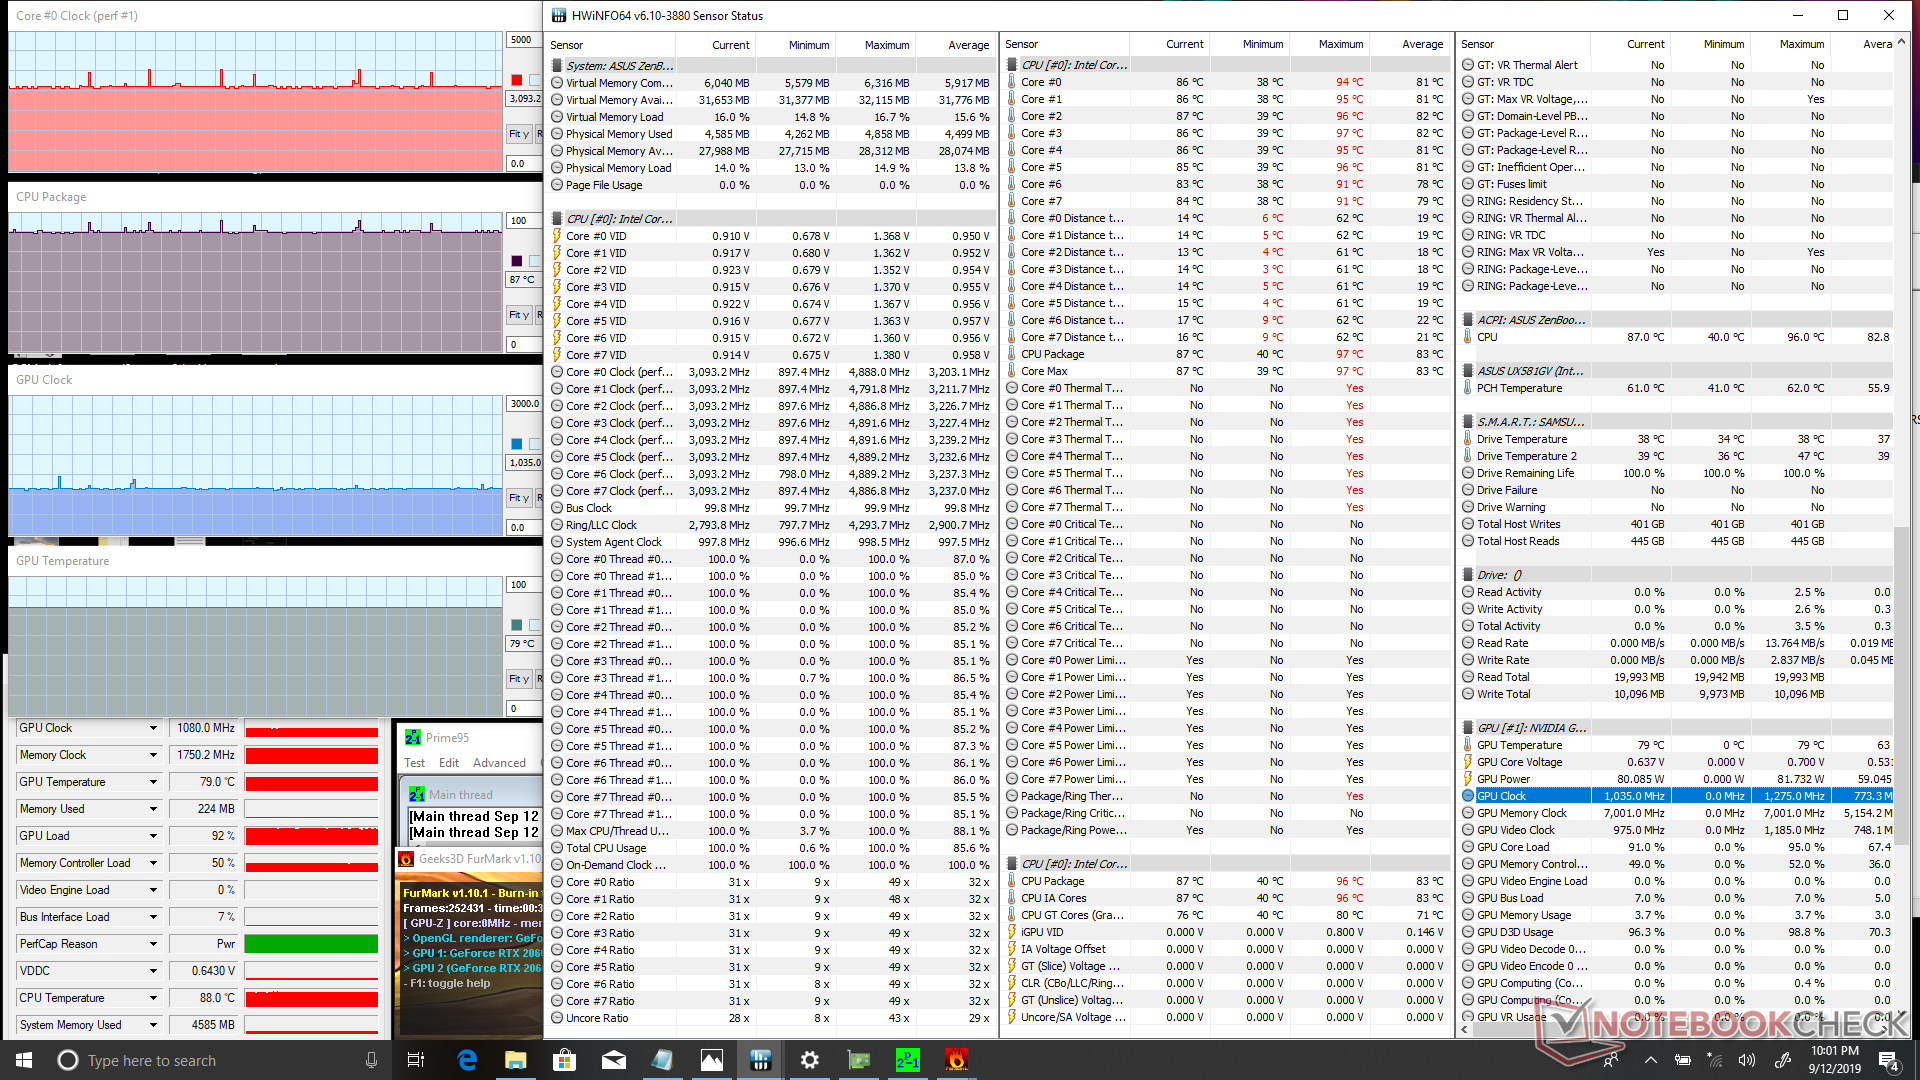
Stress Test
We stress the system with synthetic loads to identify for any potential throttling issues. When running Prime95 on the Default Auto Fan mode, clock rate and core temperature would stabilize at 2.9 GHz and 76 C, respectively. Enabling Turbo Fan mode will bump these values to a steady ~3.6 GHz and 91 C to be both faster and warmer. If you plan on doing a lot of encoding or other CPU-intensive tasks frequently, then we recommend toggling Turbo Fan mode to get the most out of the CPU. Running Witcher 3 or both Prime95 and FurMark simultaneously will cause the CPU and GPU to stabilize at 87 C and 79 C, respectively, to be slightly warmer than on the Razer Blade 15 and last year's ZenBook Pro 15 UX580.
Running on battery will limit performance. A Fire Strike run on battery power returns Physics and Graphics scores of 16680 and 4190 points, respectively, compared to 19111 and 14768 points when on mains.
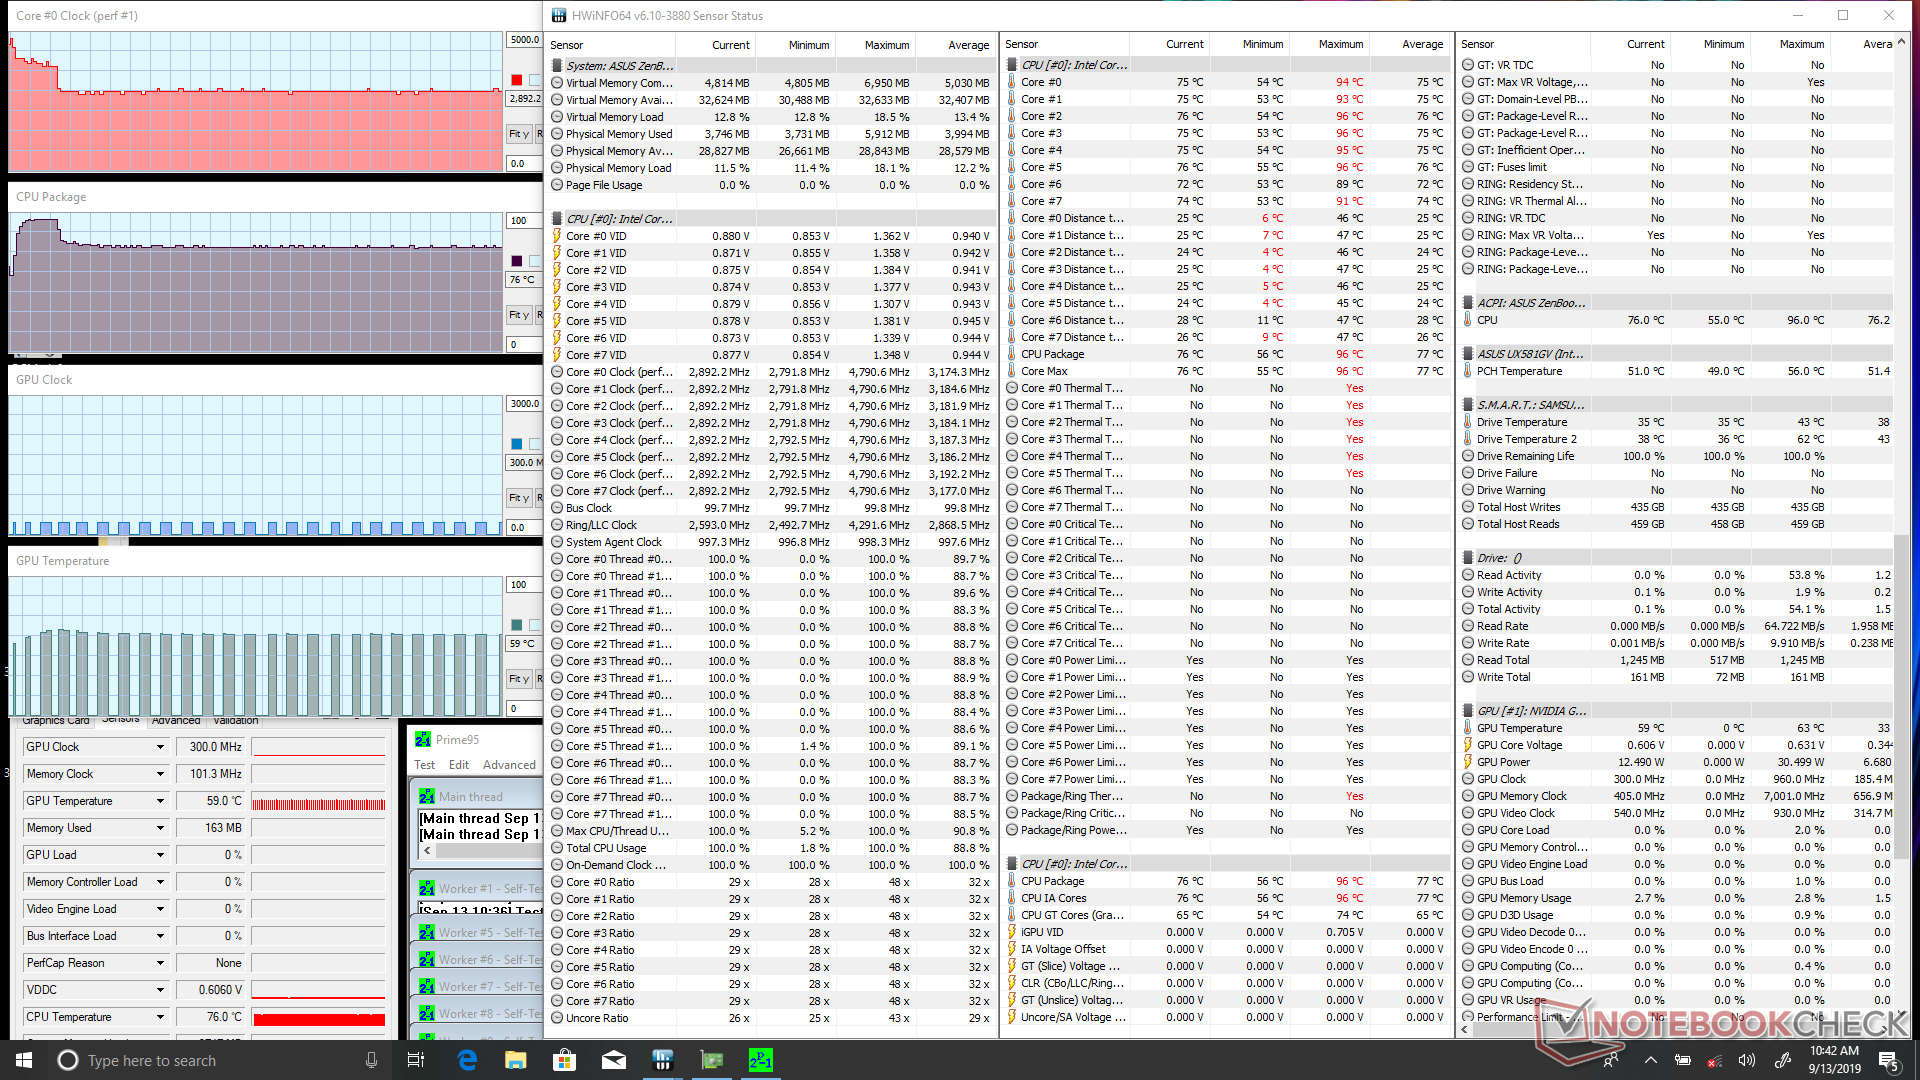
| CPU Clock (GHz) | GPU Clock (MHz) | Average CPU Temperature (°C) | Average GPU Temperature (°C) | |
| System Idle | -- | -- | 52 | 49 |
| Prime95 Stress (Default Auto Fan mode) | 2.9 | -- | 76 | -- |
| Prime95 Stress (Turbo Fan mode) | 3.6 - 3.7 | -- | 91 | -- |
| Prime95 + FurMark Stress | 3.1 | 1080 | 87 | 79 |
| Witcher 3 Stress | ~4.3 | 1450 | ~86 | 78 |
Speakers
The stereo speakers produce a relatively balanced audio experience as exemplified by their broad pink noise graph below. Maximum volume is not as loud as on gaming laptops like the MSI GT series meaning you'll still want external speakers if you intend to use the UX581 as an HTPC. High volume settings will cause the front corners of the chassis and clickpad to vibrate since the speakers are located directly underneath. It's a slight annoyance that thankfully doesn't result in any rattling.


Asus ZenBook Pro Duo UX581GV audio analysis
(±) | speaker loudness is average but good (74.4 dB)
Bass 100 - 315 Hz
(±) | reduced bass - on average 10.4% lower than median
(±) | linearity of bass is average (12.2% delta to prev. frequency)
Mids 400 - 2000 Hz
(+) | balanced mids - only 2.1% away from median
(+) | mids are linear (4.3% delta to prev. frequency)
Highs 2 - 16 kHz
(+) | balanced highs - only 4.5% away from median
(±) | linearity of highs is average (10.5% delta to prev. frequency)
Overall 100 - 16.000 Hz
(±) | linearity of overall sound is average (19.8% difference to median)
Compared to same class
» 69% of all tested devices in this class were better, 6% similar, 24% worse
» The best had a delta of 6%, average was 18%, worst was 132%
Compared to all devices tested
» 50% of all tested devices were better, 7% similar, 43% worse
» The best had a delta of 4%, average was 24%, worst was 134%
Apple MacBook 12 (Early 2016) 1.1 GHz audio analysis
(+) | speakers can play relatively loud (83.6 dB)
Bass 100 - 315 Hz
(±) | reduced bass - on average 11.3% lower than median
(±) | linearity of bass is average (14.2% delta to prev. frequency)
Mids 400 - 2000 Hz
(+) | balanced mids - only 2.4% away from median
(+) | mids are linear (5.5% delta to prev. frequency)
Highs 2 - 16 kHz
(+) | balanced highs - only 2% away from median
(+) | highs are linear (4.5% delta to prev. frequency)
Overall 100 - 16.000 Hz
(+) | overall sound is linear (10.2% difference to median)
Compared to same class
» 7% of all tested devices in this class were better, 2% similar, 91% worse
» The best had a delta of 5%, average was 18%, worst was 53%
Compared to all devices tested
» 5% of all tested devices were better, 1% similar, 94% worse
» The best had a delta of 4%, average was 24%, worst was 134%
Energy Management
Power Consumption
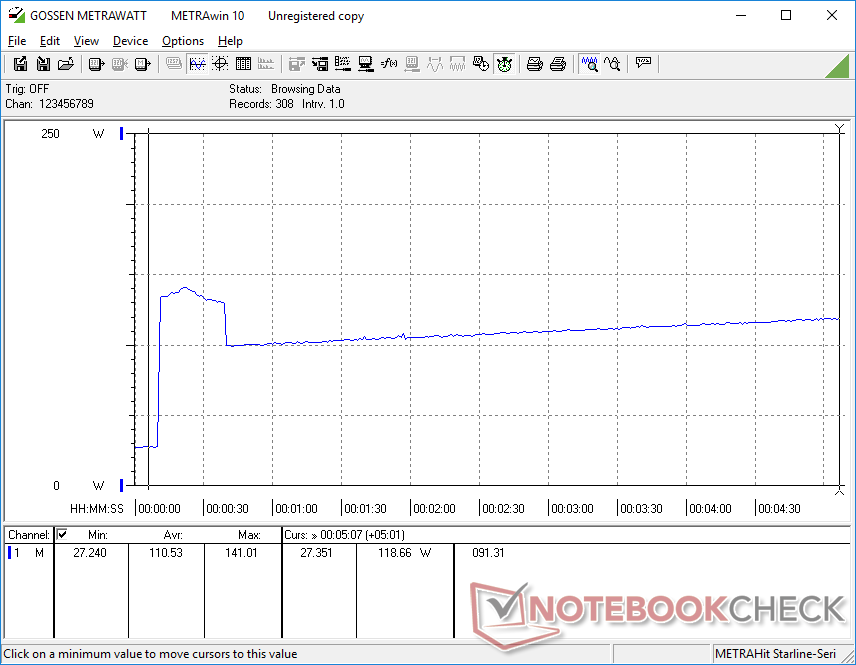
The UX581 is relatively power efficient when considering that it has to power two displays. Consumption ranges from 19 W to 35 W when idling on desktop compared to only 3 W to 11 W on Asus' smaller ZenBook 15 UX533. Since the main display is OLED, displaying all white colors can consume significantly more power than black or darker colors as detailed here. For our Asus, the difference can be as high as 14 W.
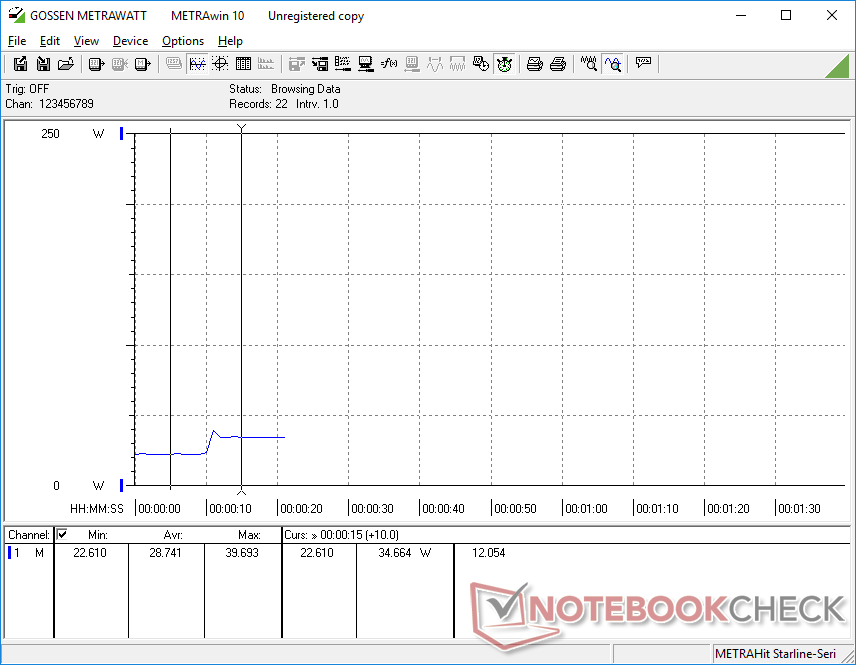
The difference in power consumption between turning off the ScreenPad and turning on the ScreenPad at maximum brightness is only 4 W.
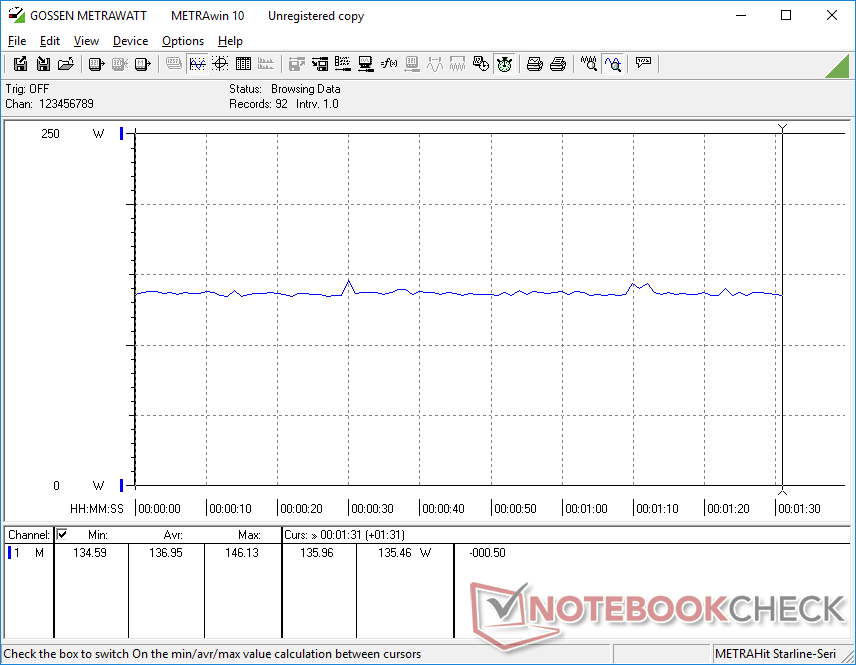
When running Witcher 3 to represent real-world gaming conditions, consumption averages 137 W compared to 128 W on the Lenovo Legion Y540 with the same RTX 2060 GPU. The slightly higher power consumption is not surprising given the more demanding displays of the Asus. Consumption is 33 percent higher than on the UX580 for a 100 to 170 percent boost in graphics performance to indicate higher performance per Watt between generations.
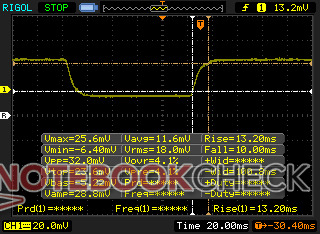
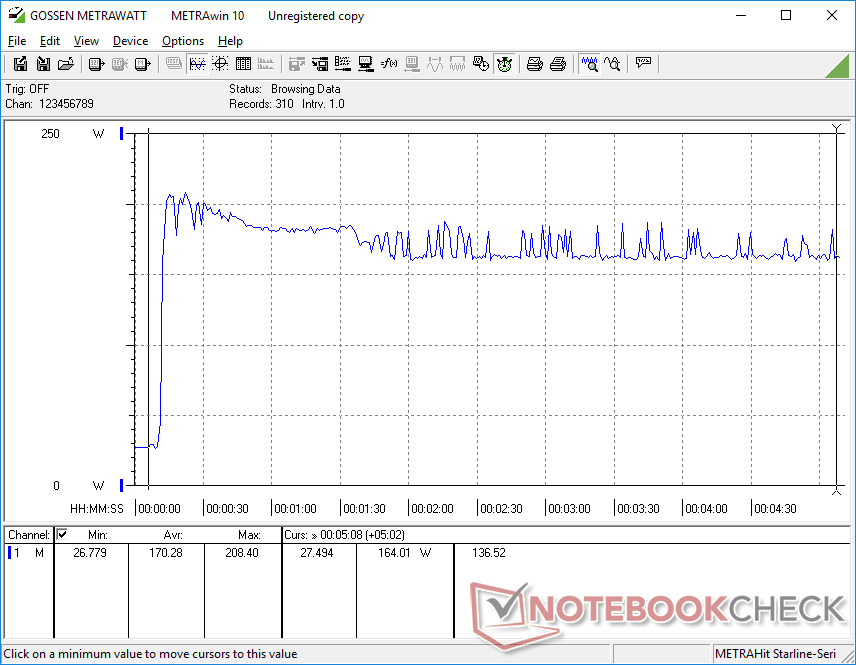
We're able to measure a maximum draw of 208 W from the medium-sized (~16.4 x 7.5 x 3.2 cm) 230 W AC adapter. This high of a consumption is unsustainable for more than half a minute as shown by our graphs below due to reaching thermal limits. It's possible to both recharge the system and run high loads like gaming simultaneously.
| Off / Standby | |
| Idle | |
| Load |
|
Key:
min: | |
| Asus ZenBook Pro Duo UX581GV i9-9980HK, GeForce RTX 2060 Mobile, Samsung SSD PM981 MZVLB1T0HALR, OLED, 3840x2160, 15.6" | Asus ZenBook Pro 15 UX580GE i9-8950HK, GeForce GTX 1050 Ti Mobile, Samsung SSD PM961 1TB M.2 PCIe 3.0 x4 NVMe (MZVLW1T0), IPS, 3840x2160, 15.6" | Asus ZenBook 15 UX533FD i7-8565U, GeForce GTX 1050 Max-Q, WDC PC SN520 SDAPNUW-512G, IPS, 1920x1080, 15.6" | Dell XPS 15 7590 9980HK GTX 1650 i9-9980HK, GeForce GTX 1650 Mobile, Toshiba XG6 KXG60ZNV1T02, OLED, 3840x2160, 15.6" | Asus Strix Scar III G531GW i9-9880H, GeForce RTX 2070 Mobile, Intel SSD 660p 1TB SSDPEKNW010T8, IPS, 1920x1080, 15.6" | HP Omen X 2S 15-dg0075cl i7-9750H, GeForce RTX 2070 Max-Q, WDC PC SN720 SDAPNTW-1T00, IPS, 1920x1080, 15.6" | |
|---|---|---|---|---|---|---|
| Power Consumption | 27% | 61% | 37% | -32% | -75% | |
| Idle Minimum * (Watt) | 19.3 | 11.7 39% | 2.7 86% | 6.2 68% | 29 -50% | 46 -138% |
| Idle Average * (Watt) | 24.2 | 18.5 24% | 8 67% | 9.6 60% | 32 -32% | 59 -144% |
| Idle Maximum * (Watt) | 24.5 | 22.8 7% | 10.6 57% | 21.2 13% | 37 -51% | 65.5 -167% |
| Load Average * (Watt) | 122.3 | 97.5 20% | 74 39% | 104.3 15% | 157 -28% | 99.8 18% |
| Witcher 3 ultra * (Watt) | 137 | 102.9 25% | 91.7 33% | 173 -26% | 154.1 -12% | |
| Load Maximum * (Watt) | 208.4 | 111.1 47% | 89 57% | 135.3 35% | 217 -4% | 222.7 -7% |
* ... smaller is better
Battery Life
It's unrealistic to expect a laptop with two 4K displays to last as long as a laptop with a single 4K display when all else is equal. The UX581 ships with the same 71 Wh capacity battery as last year's UX580 and runtimes are unsurprisingly shorter on the newer and faster model. We're able to record just over 4 hours of real-world WLAN use when both screens are active before automatic shutdown. The lighter Asus ZenBook 15 UX533 manages to outlast the UX580 by over two times when subjected to similar WLAN conditions.
Recharging from empty to full capacity takes a little over 1.5 hours. The system cannot be recharged with a USB Type-C adapter.
| Asus ZenBook Pro Duo UX581GV i9-9980HK, GeForce RTX 2060 Mobile, 71 Wh | Asus ZenBook Pro 15 UX580GE i9-8950HK, GeForce GTX 1050 Ti Mobile, 71 Wh | Asus ZenBook 15 UX533FD i7-8565U, GeForce GTX 1050 Max-Q, 73 Wh | Dell XPS 15 7590 9980HK GTX 1650 i9-9980HK, GeForce GTX 1650 Mobile, 97 Wh | Asus Strix Scar III G531GW i9-9880H, GeForce RTX 2070 Mobile, 66 Wh | HP Omen X 2S 15-dg0075cl i7-9750H, GeForce RTX 2070 Max-Q, 72 Wh | |
|---|---|---|---|---|---|---|
| Battery runtime | 18% | 107% | 81% | -28% | -42% | |
| Reader / Idle (h) | 13.1 | 14 7% | 26.5 102% | 15.2 16% | 5.5 -58% | 3.7 -72% |
| WiFi v1.3 (h) | 4.1 | 6.3 54% | 8.7 112% | 7.8 90% | 3 -27% | 2.2 -46% |
| Load (h) | 1.4 | 1.3 -7% | 2.9 107% | 3.3 136% | 1.4 0% | 1.3 -7% |
Pros
Cons
Verdict

We love the unique concept of the ZenBook Pro Duo UX581 and what it represents. Having a second screen of the same width and same PPI as the main screen makes it more ergonomic to use than the disproportionate second screens of the 2015 Razer Blade Pro, Asus ZenBook 15 UX534, or HP Omen X 2S 15. The downside is that Asus had to make some major sacrifices in order to integrate this large of a second display. Most notably, the UX581 is thicker, heavier, and significantly pricier than your typical flagship Ultrabook or multimedia laptop which makes this system more of a desktop replacement than something truly portable.
An oddity that picky professionals might loathe is the disparity in display quality between the two screens. A glossy OLED with super-fast response times is inherently going to look very different from a matte IPS with slower response times. We suspect that the supply for 3840 x 1110 resolution OLED panels is limited and so Asus had no choice but to use IPS for the ScreenPad Plus.
Other drawbacks include the shorter battery life, single storage slot, and lack of both an SD reader and tactile NumPad that content creators or professionals are more likely to exploit. Ideally, future ZenBook Pro Duo iterations would be able to integrate the second screen onto a chassis the size and weight of a sleek Razer Blade 15, XPS 15, or Spectre x360 15 Ultrabook instead of a medium-sized gaming laptop. Until then, you won't be able to find a better dual-screen experience outside of the UX581.
The Asus ZenBook Pro Duo UX581 is the most mature dual-screen laptop yet. It irons out some of the kinks of the original ScreenPad for a more natural desktop experience. Nonetheless, dual-screen laptops are still in their infancy and the ZenBook Pro Duo series could certainly benefit from a lighter and thinner design in the future.
Asus ZenBook Pro Duo UX581GV
- 08/31/2022 v7 (old)
Allen Ngo
Price comparison
