Asus ZenBook 15 UX534F Laptop Review: Look Like an Ultrabook, Play Like a Gamer
The Asus ZenBook 15 UX534 is nearly the same as the ZenBook 15 UX533 in chassis design, ports, and even CPU options. The main differences are the GPU update (GTX 1050 Max-Q to GTX 1650 Max-Q) and the ScreenPad 2.0 integration in contrast to the standard clickpad on last year's model. ScreenPad 2.0 is a touchscreen from Asus that replaces the traditional clickpad to offer a dual screen experience on laptops. Models currently shipping with a ScreenPad include the Asus VivoBook S15, ZenBook Pro Duo, and ZenBook Pro 15 UX580. The smaller 14-inch ZenBook 14 UX434 and 13.3-inch ZenBook 13 UX334 are also available with many of the same features as the ZenBook 15 UX534.
We recommend checking out our existing review on the ZenBook 15 UX533 since the UX534 is nearly identical. For this review, we will be looking for any performance differences between the two models and how the ScreenPad impacts battery life.
The ZenBook 15 UX534 can be found on Xotic PC for $1400 or $200 more than the ZenBook 15 UX533 with no ScreenPad 2.0.
More Asus reviews:
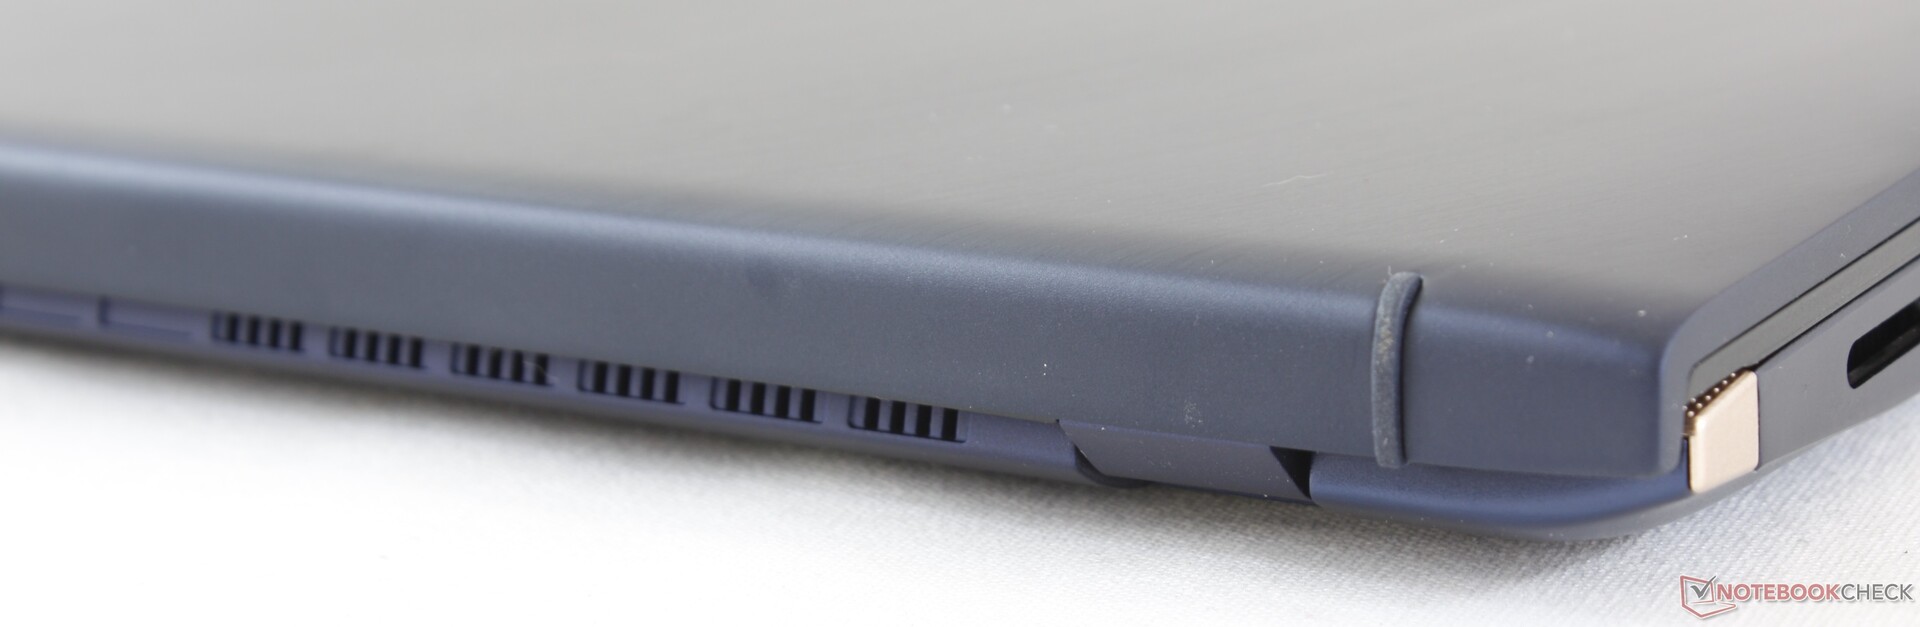
Case - Classic ZenBook Look and Feel
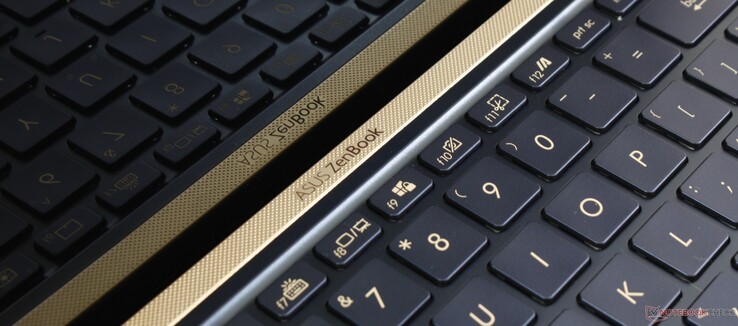
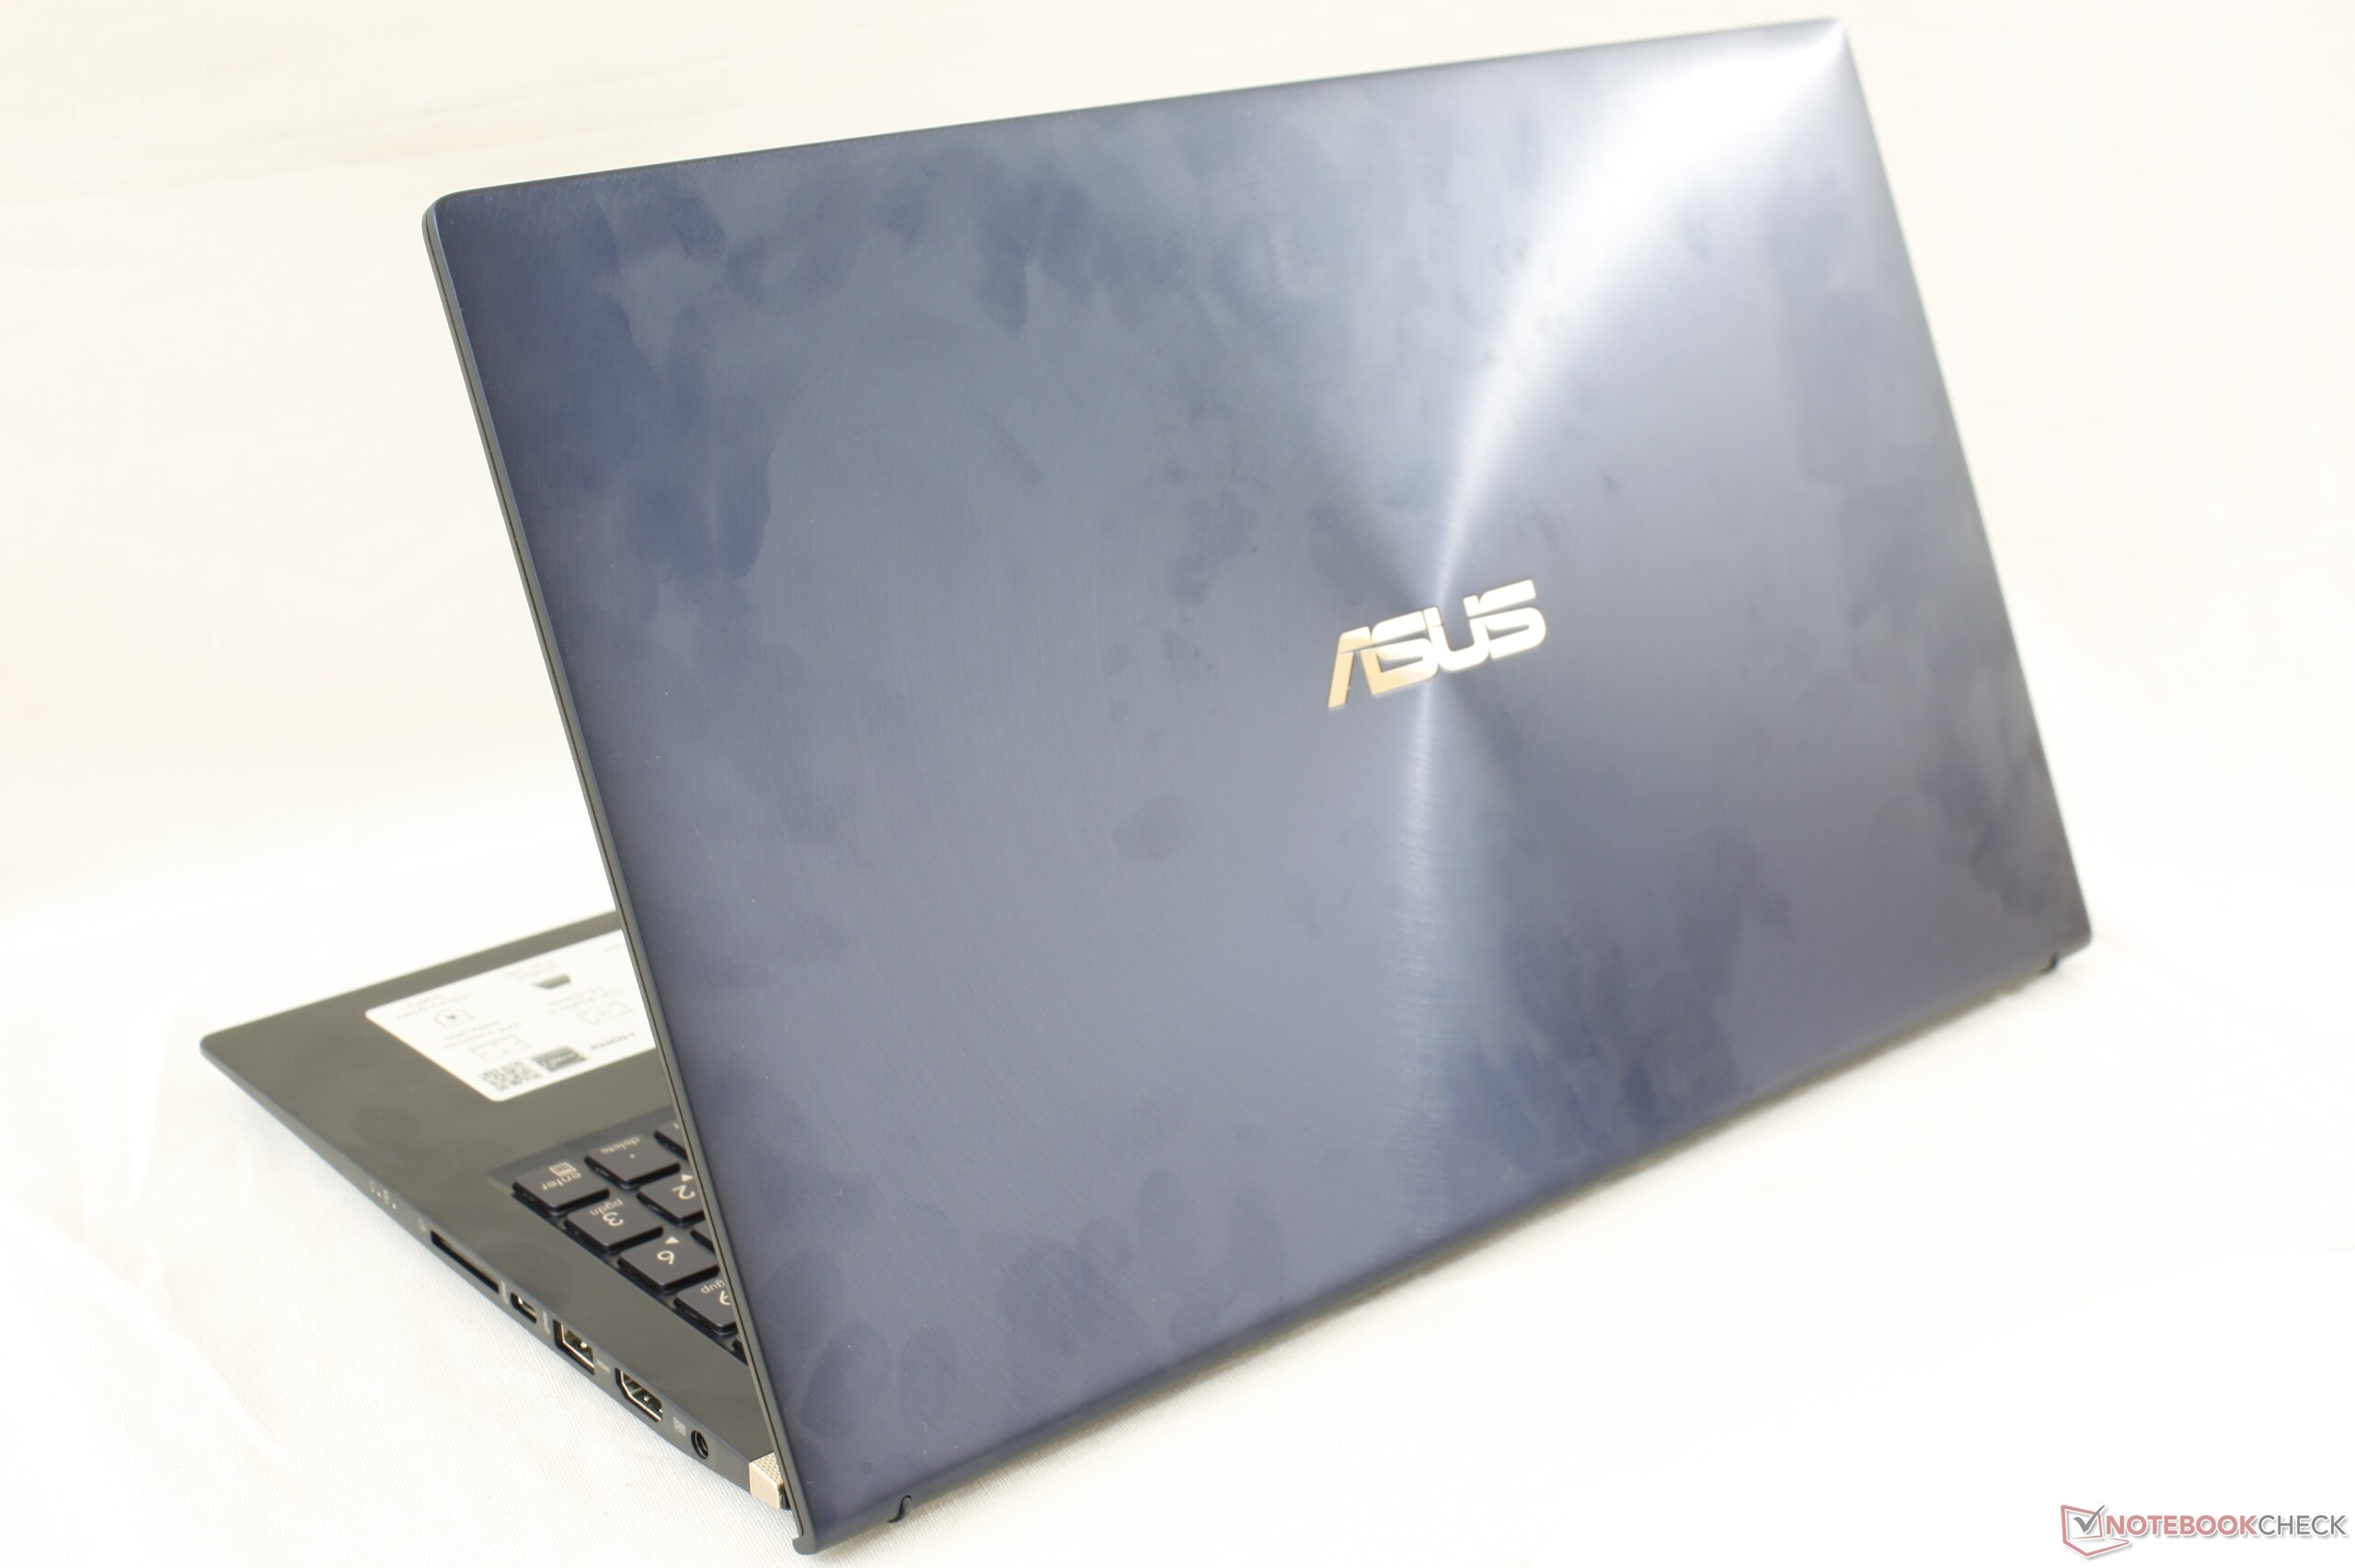
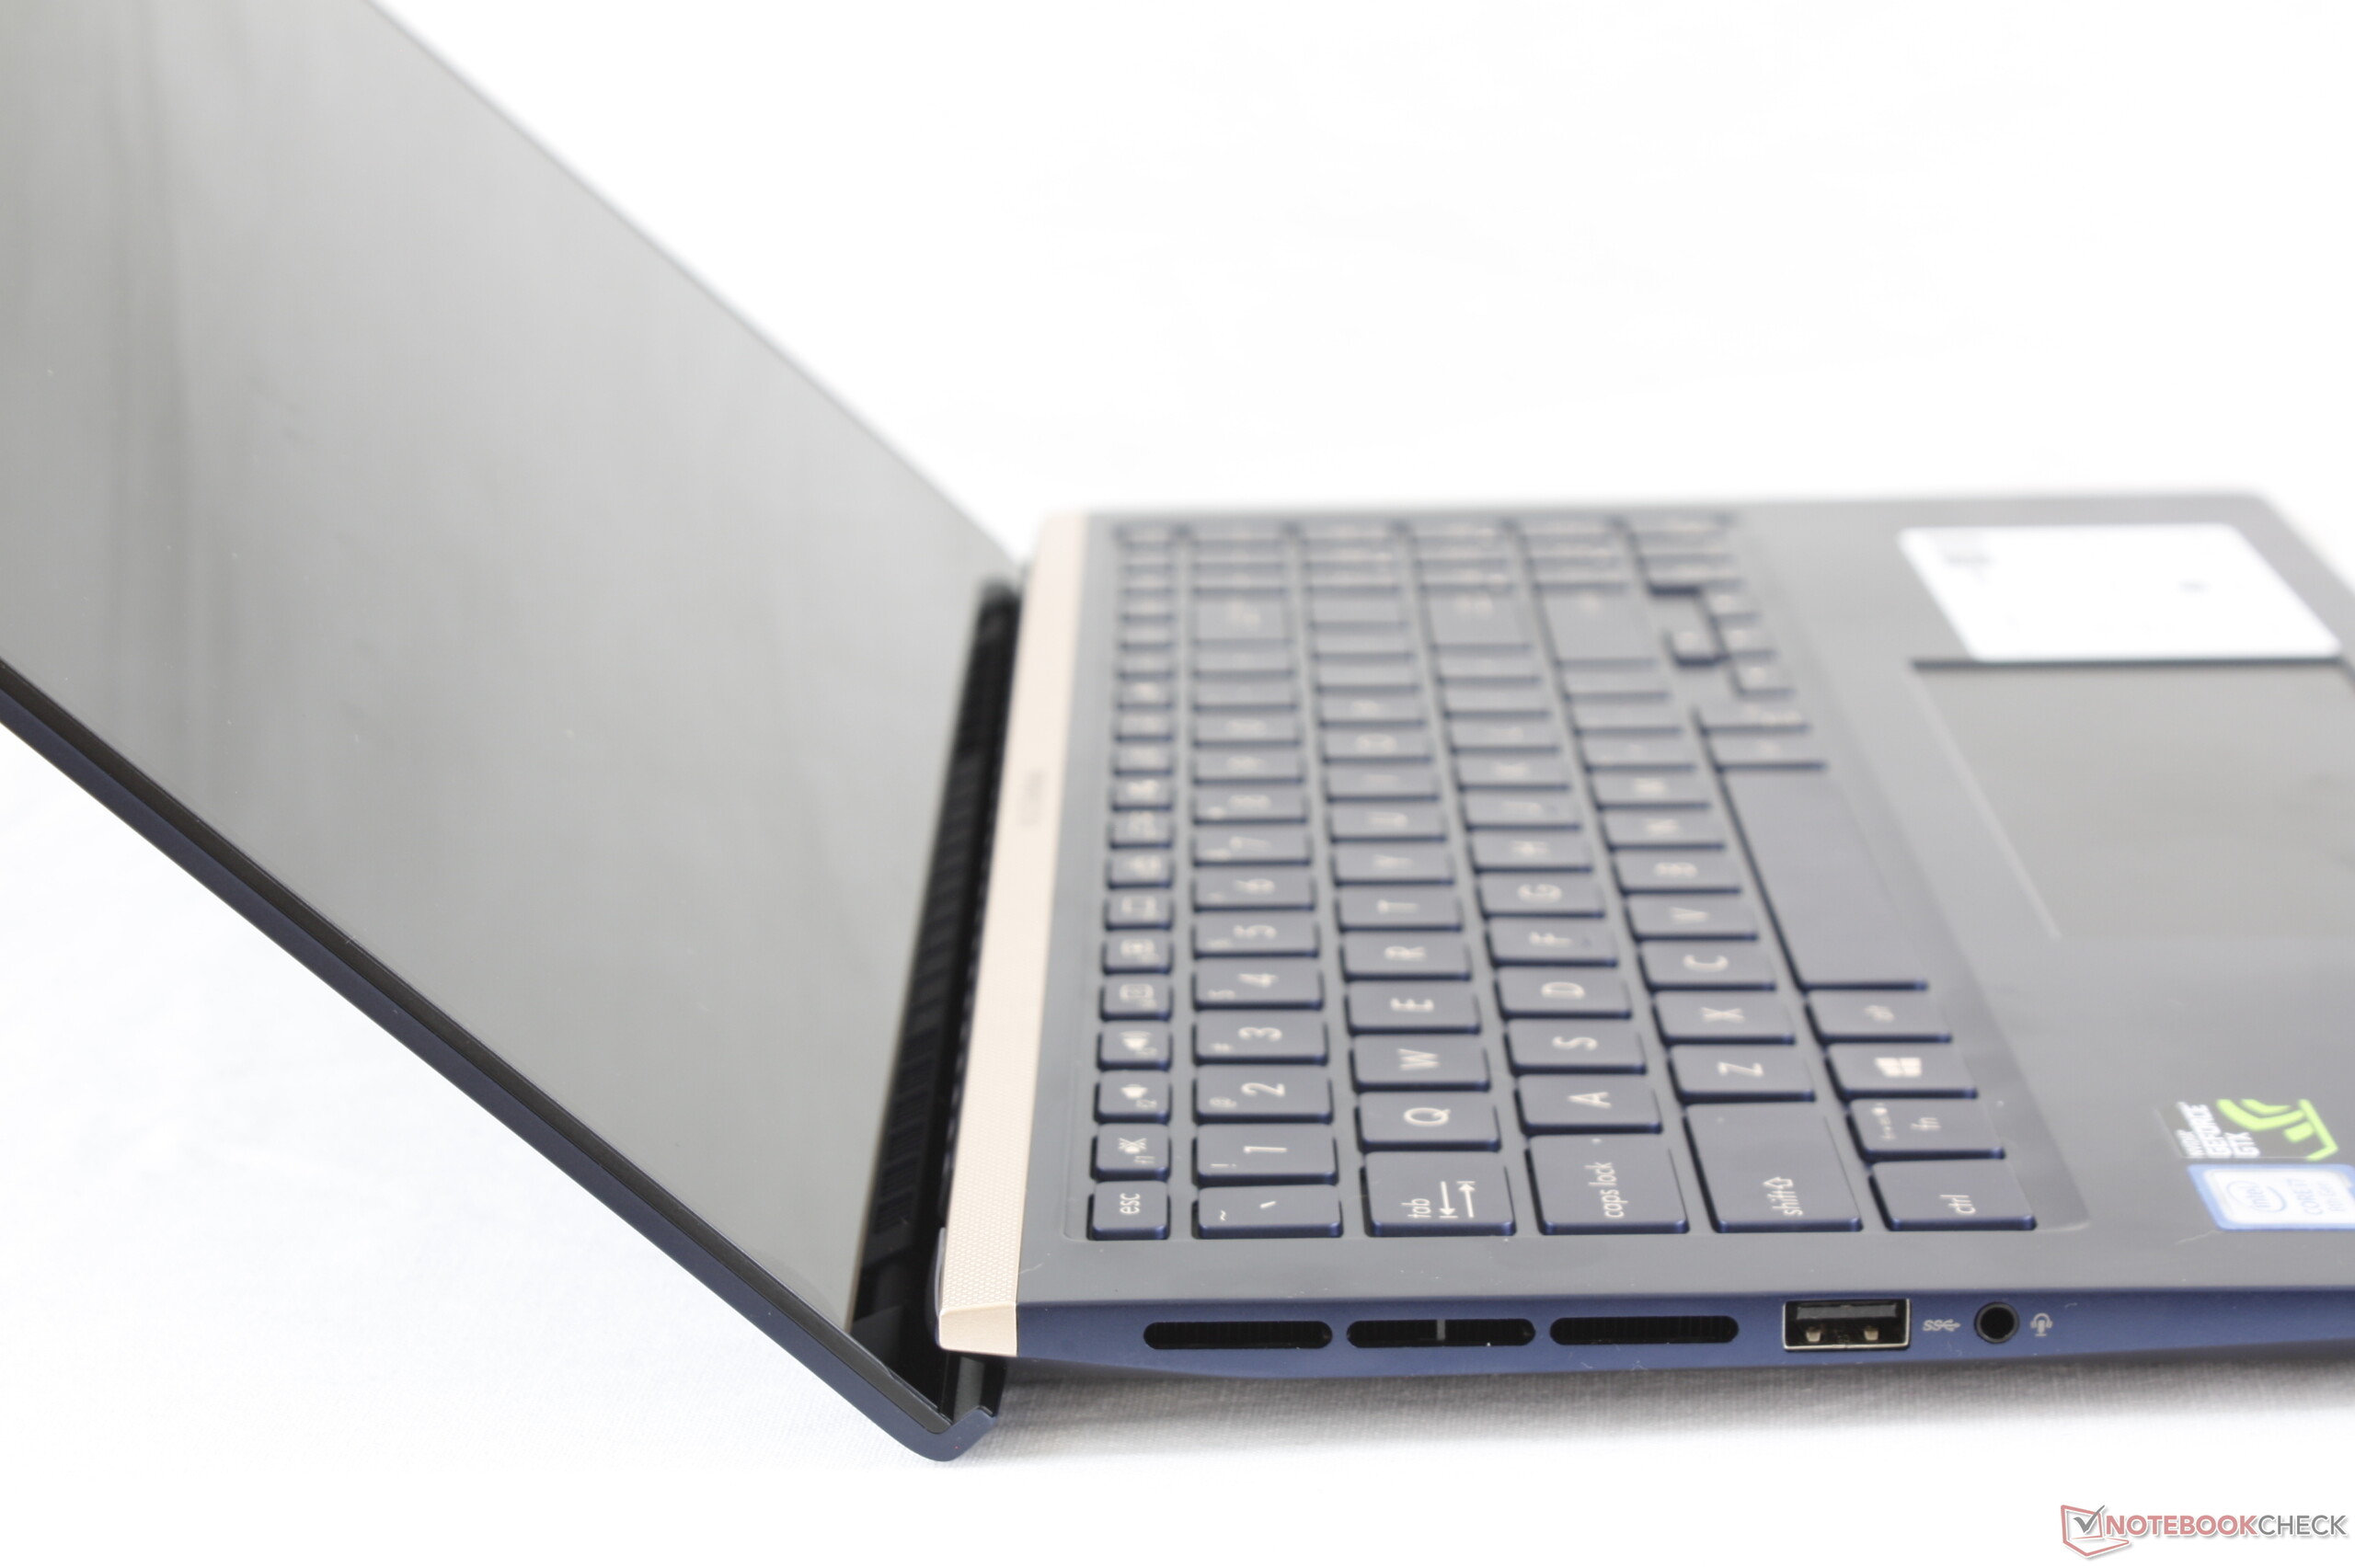
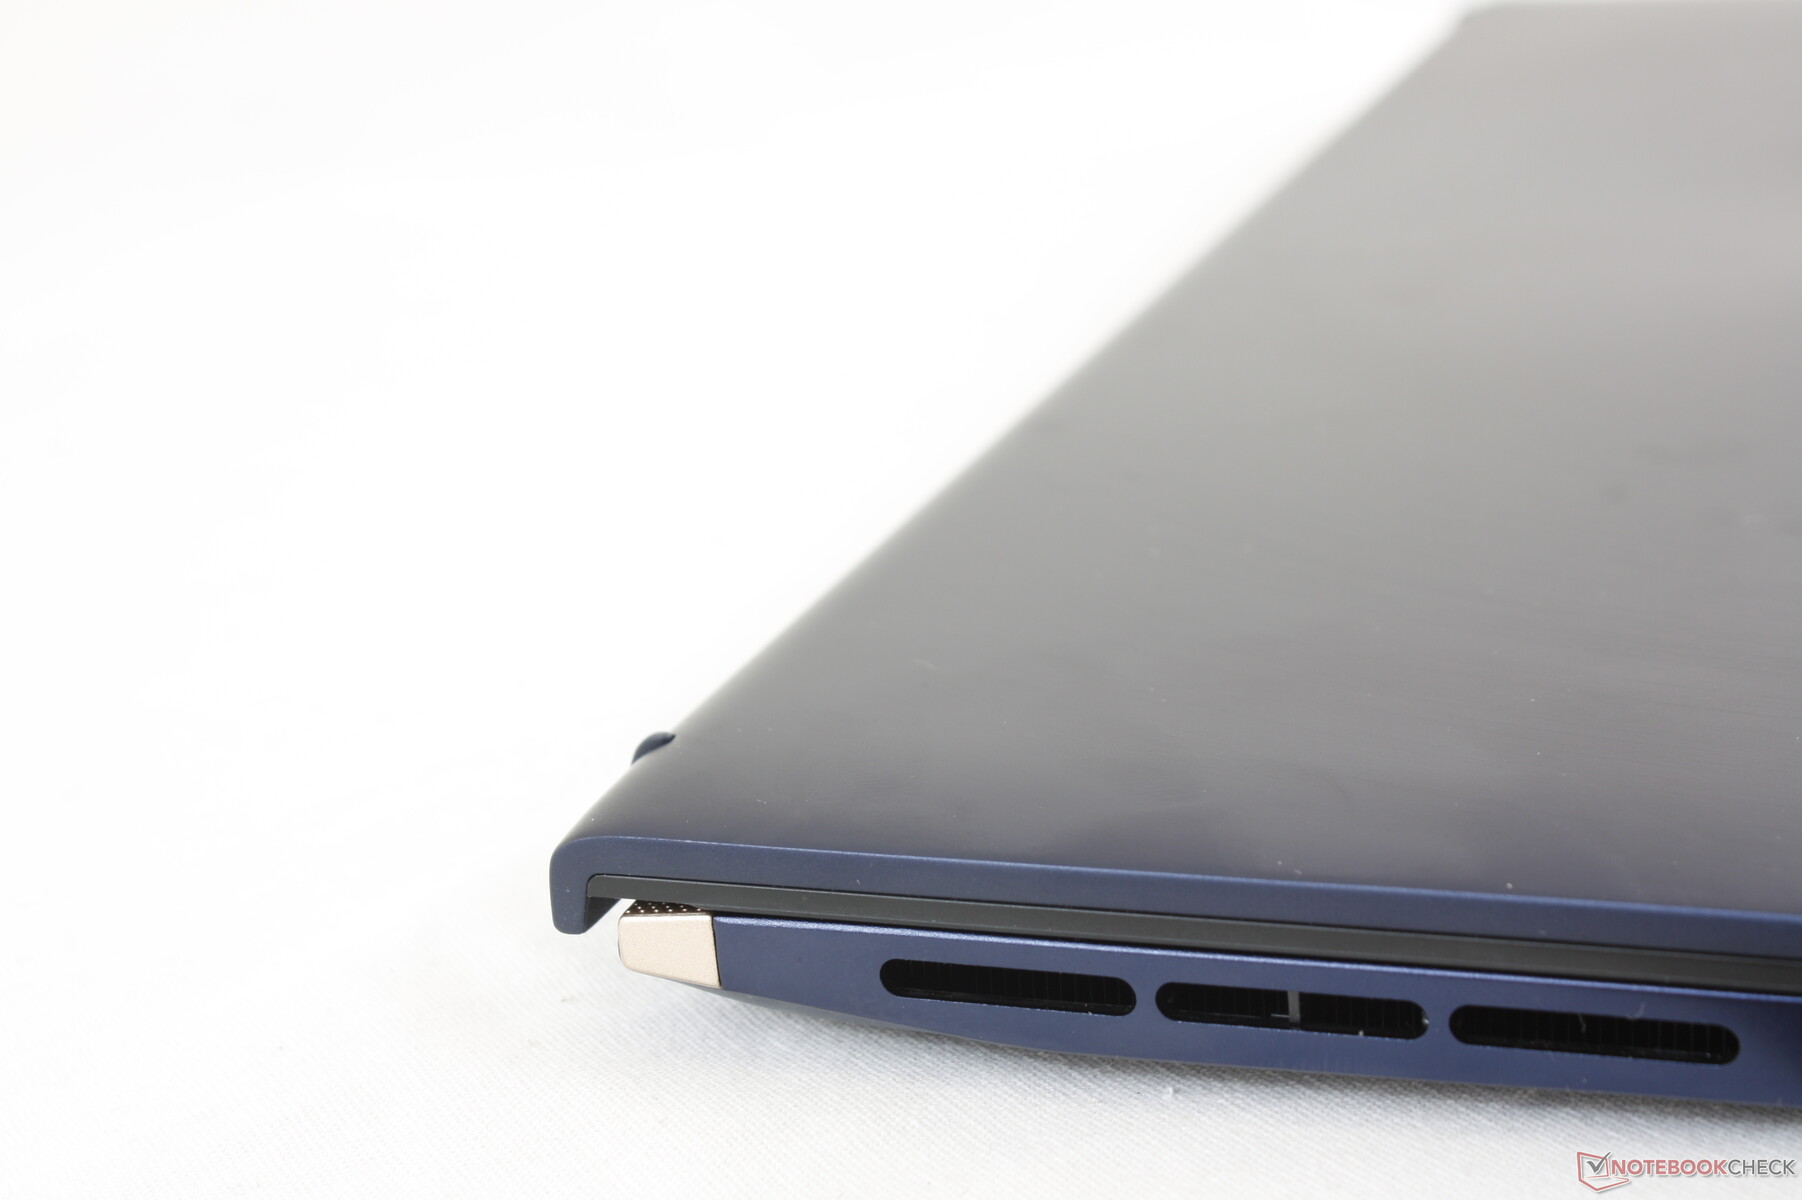
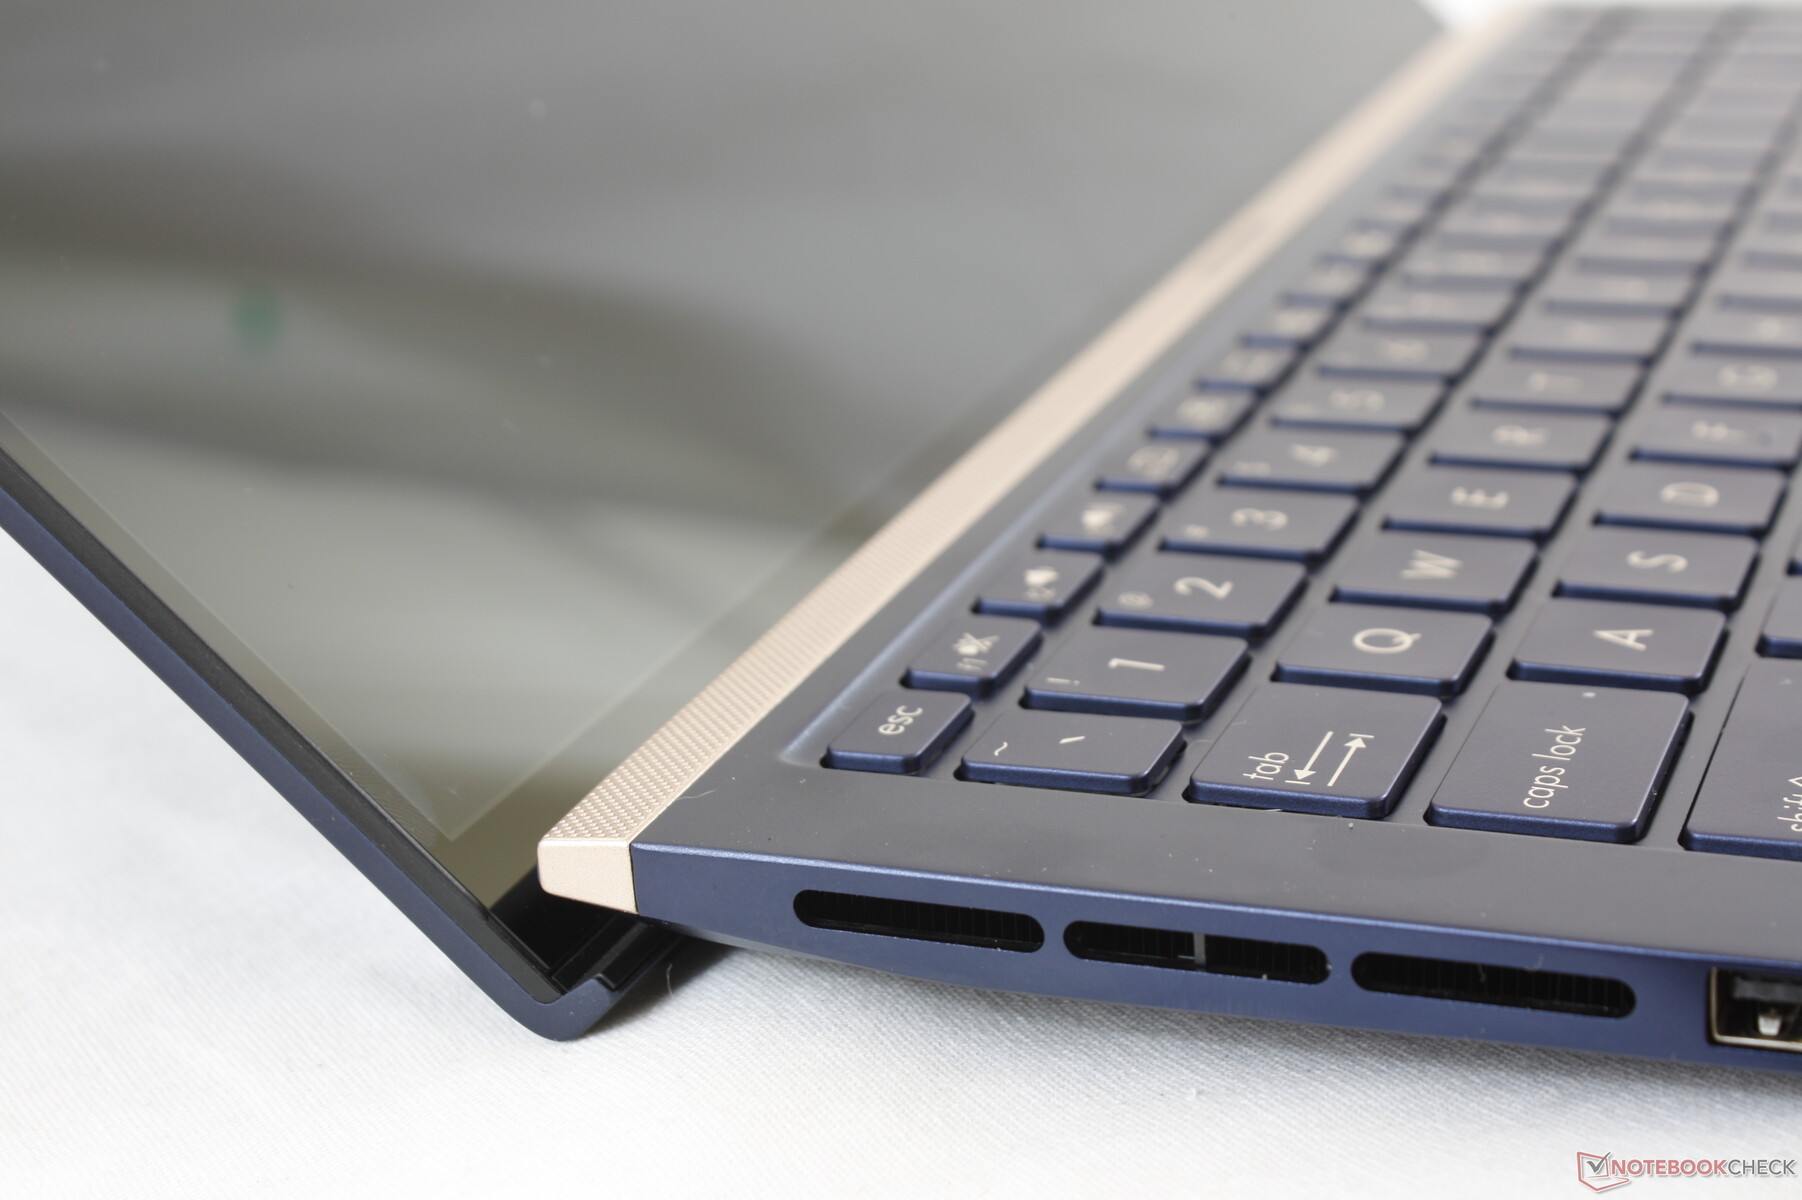
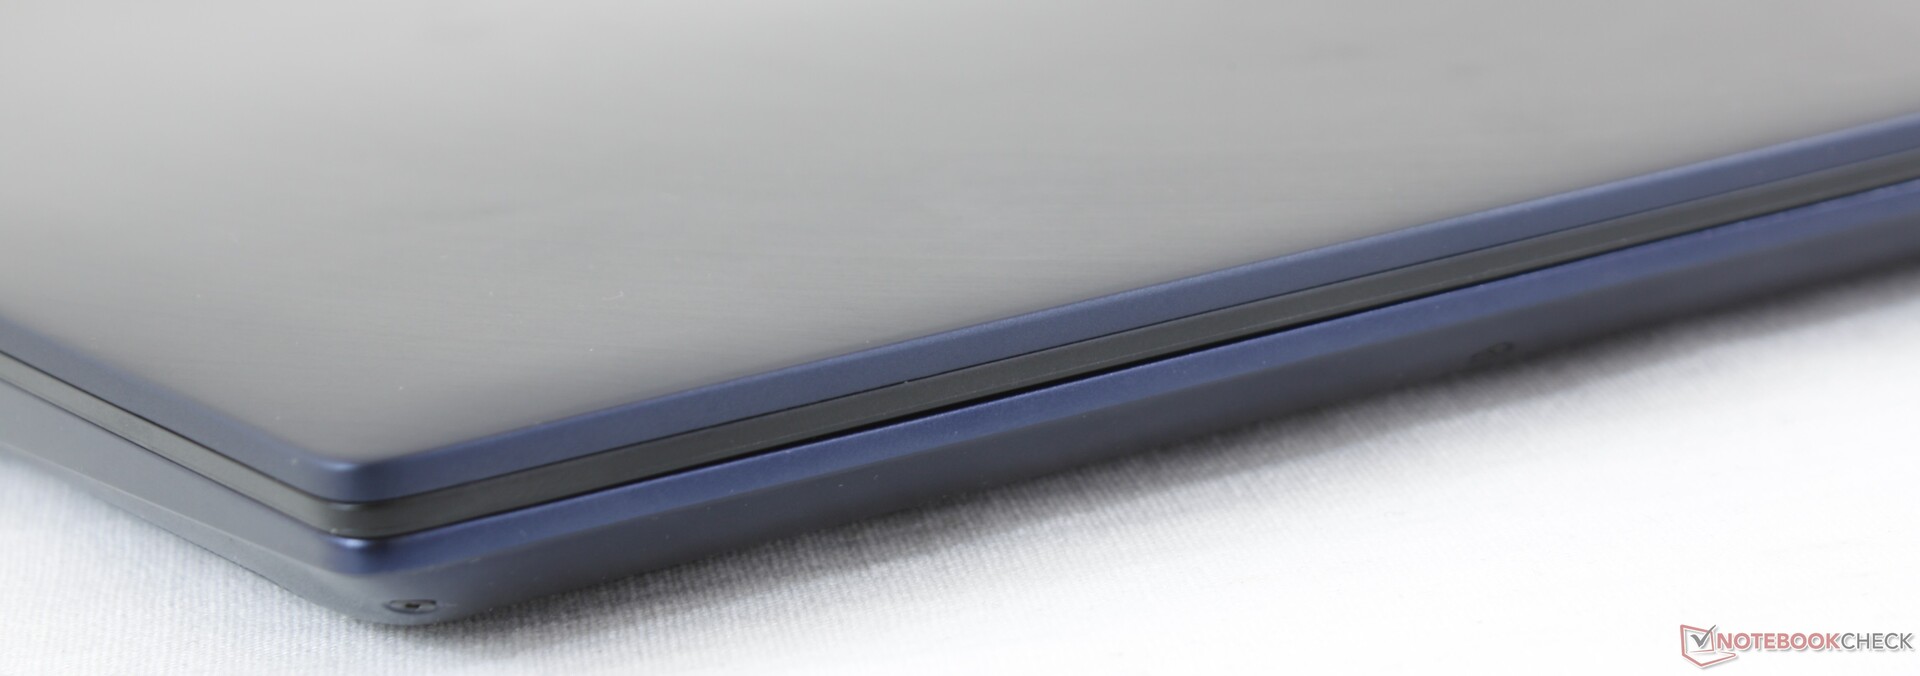
All our chassis comments on the ZenBook 15 UX533 apply here on the ZenBook 15 UX534 since they are nearly identical. Keep in mind that the UX534 is actually slightly thicker (18.9 mm vs 18 mm) and heavier (1.7 kg vs. 1.6 kg) than the UX533 likely due to the integration of the ScreenPad, but everything else from the iconic spun-metal finish of the outer lid, metal chassis design, gold trims, and overall rigidity are the same between them.
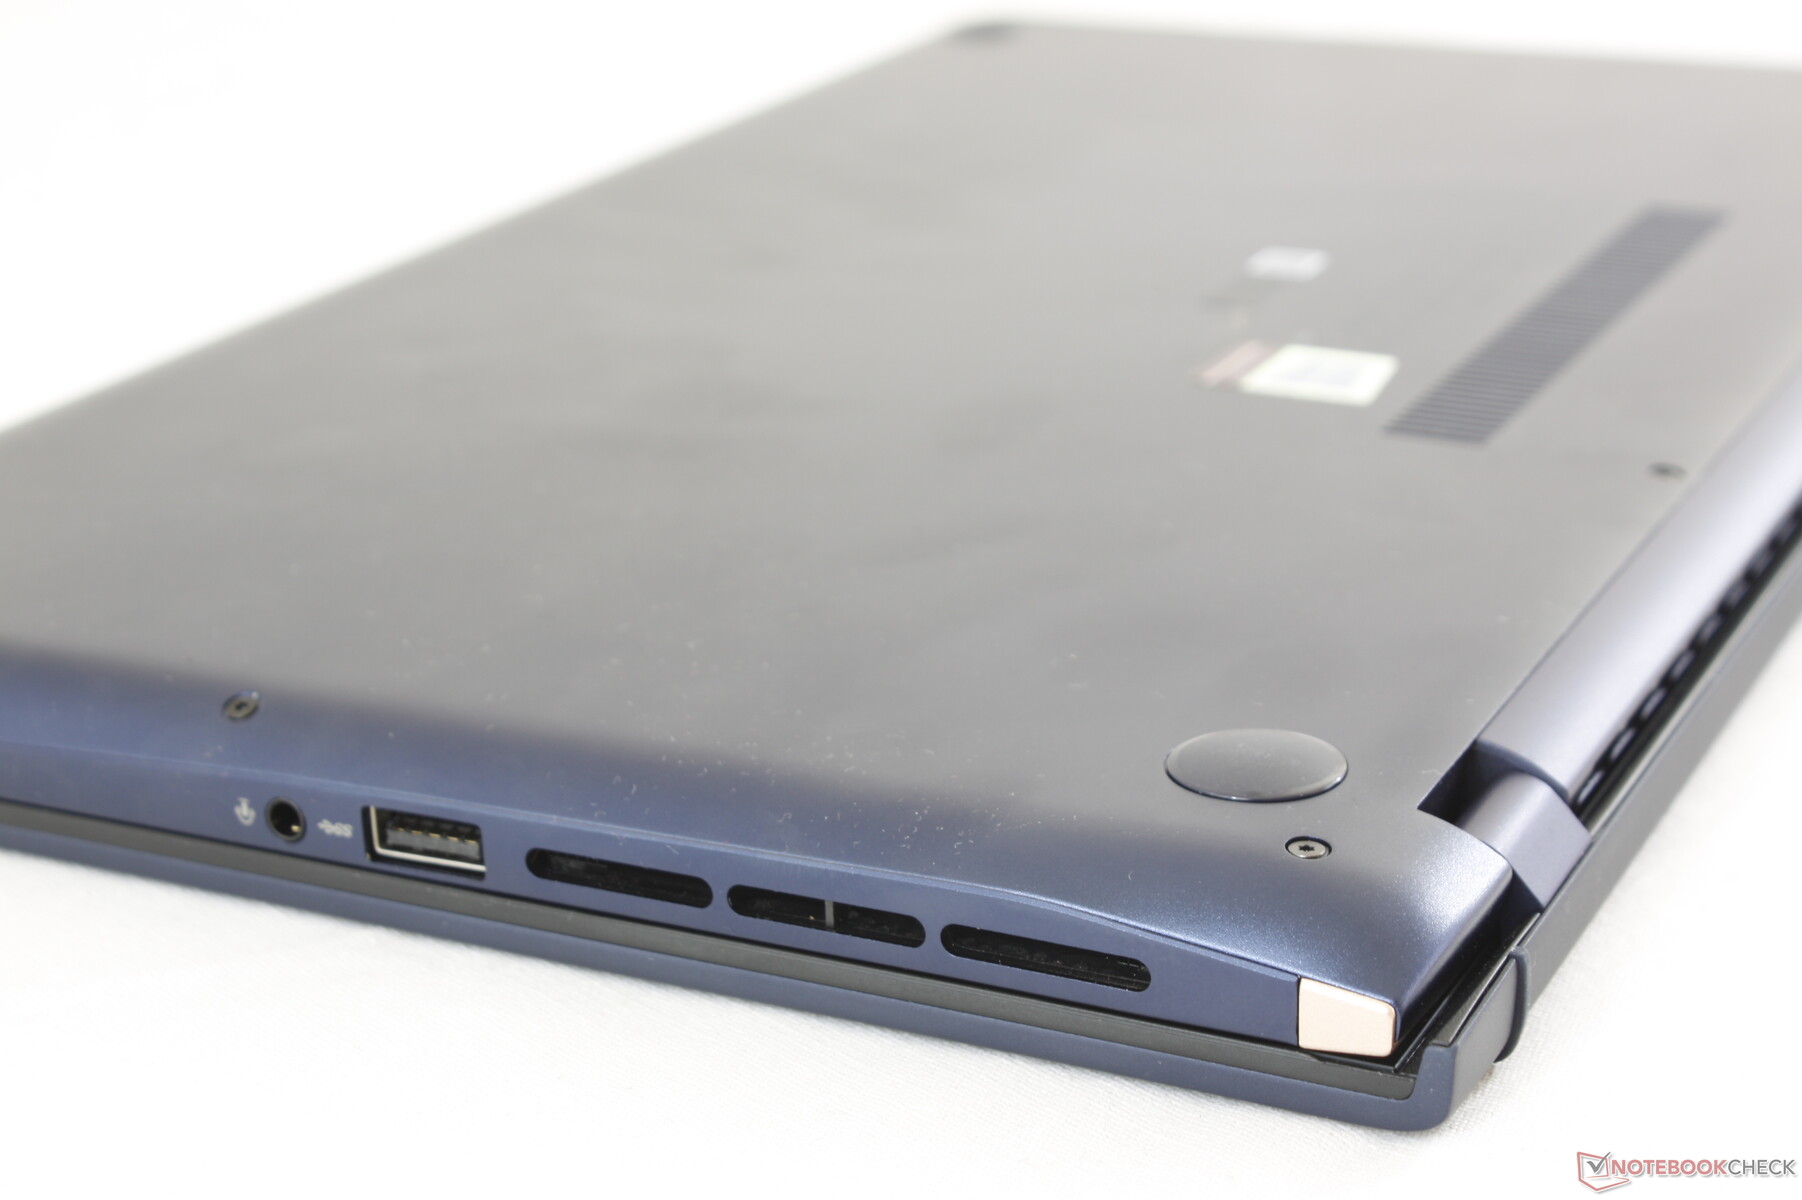
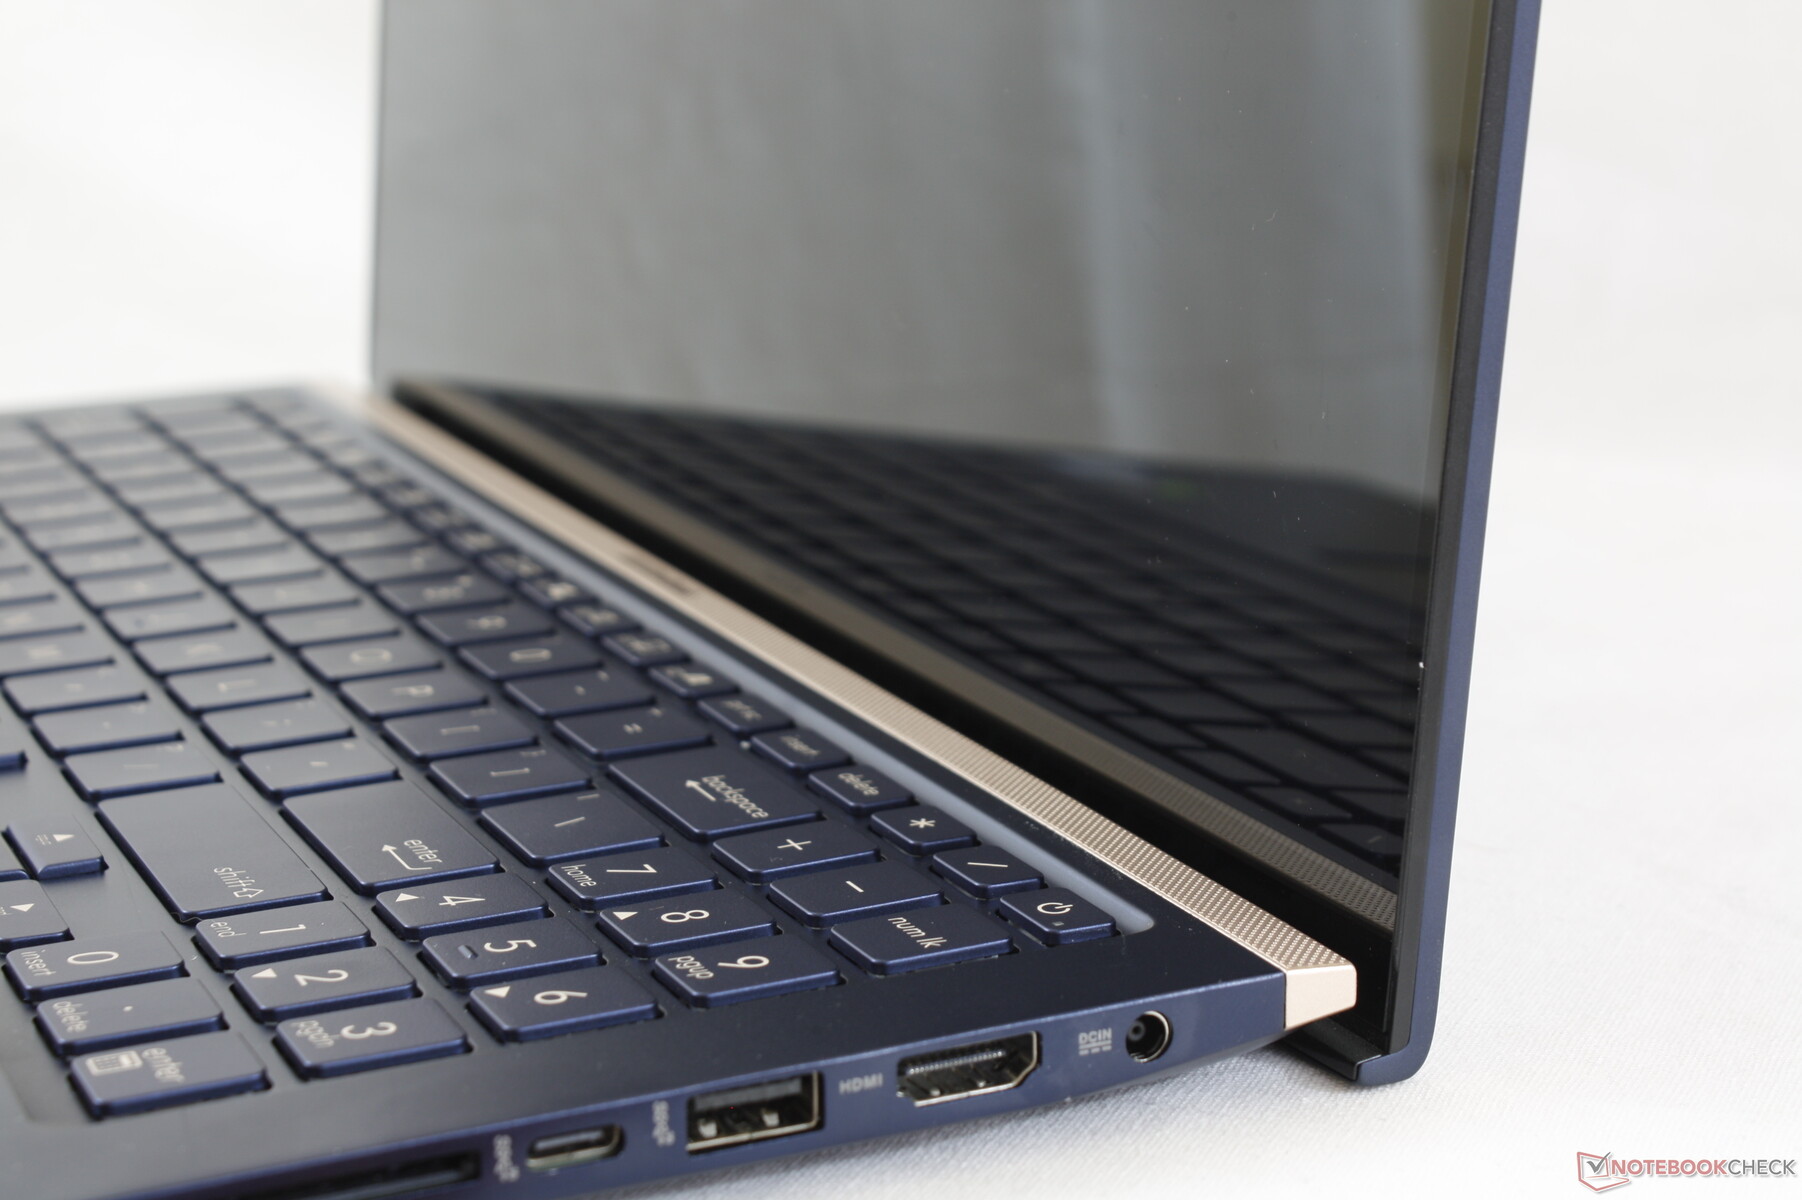
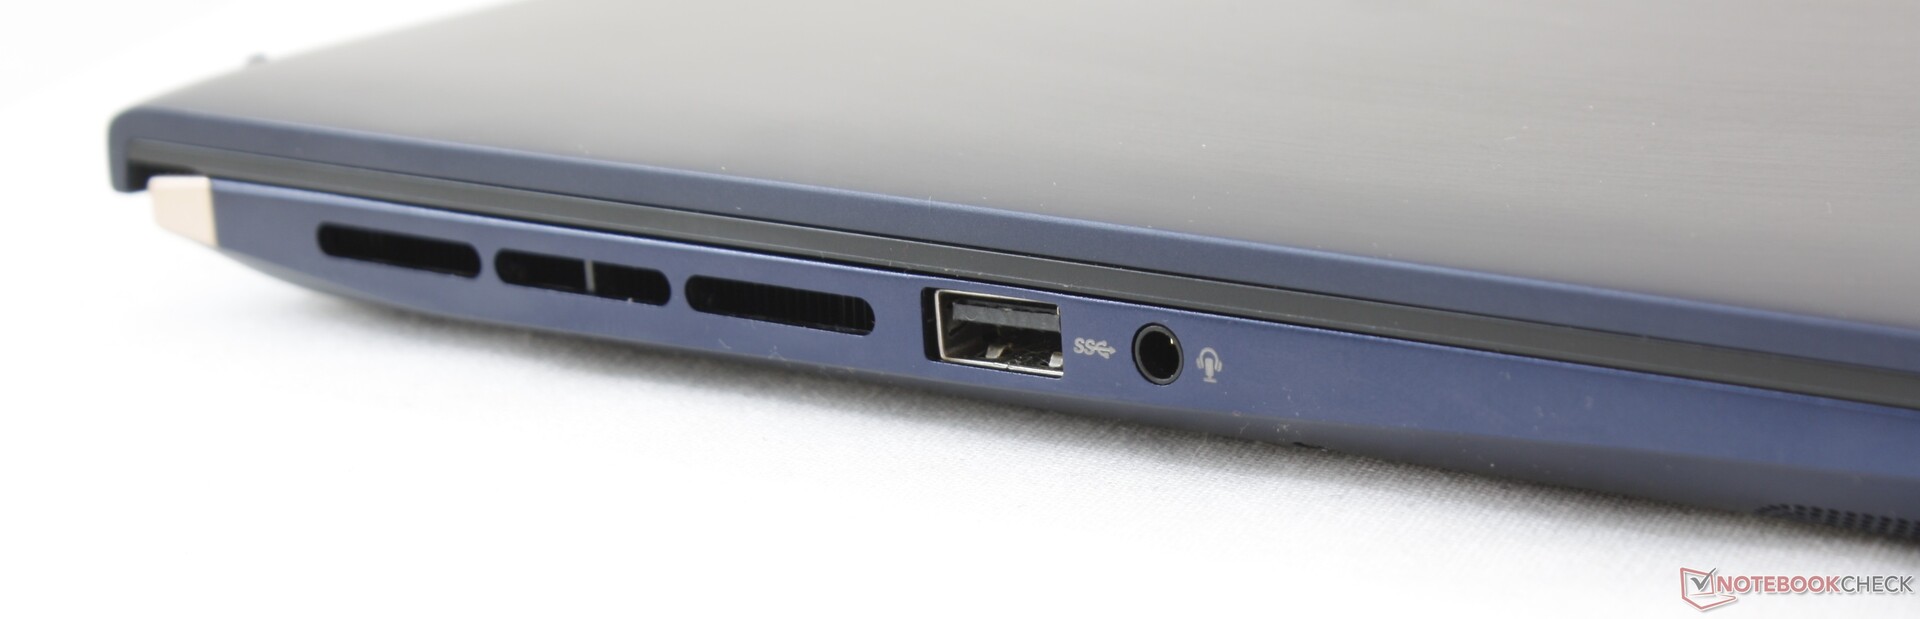
Connectivity - Nope, Still no Thunderbolt 3
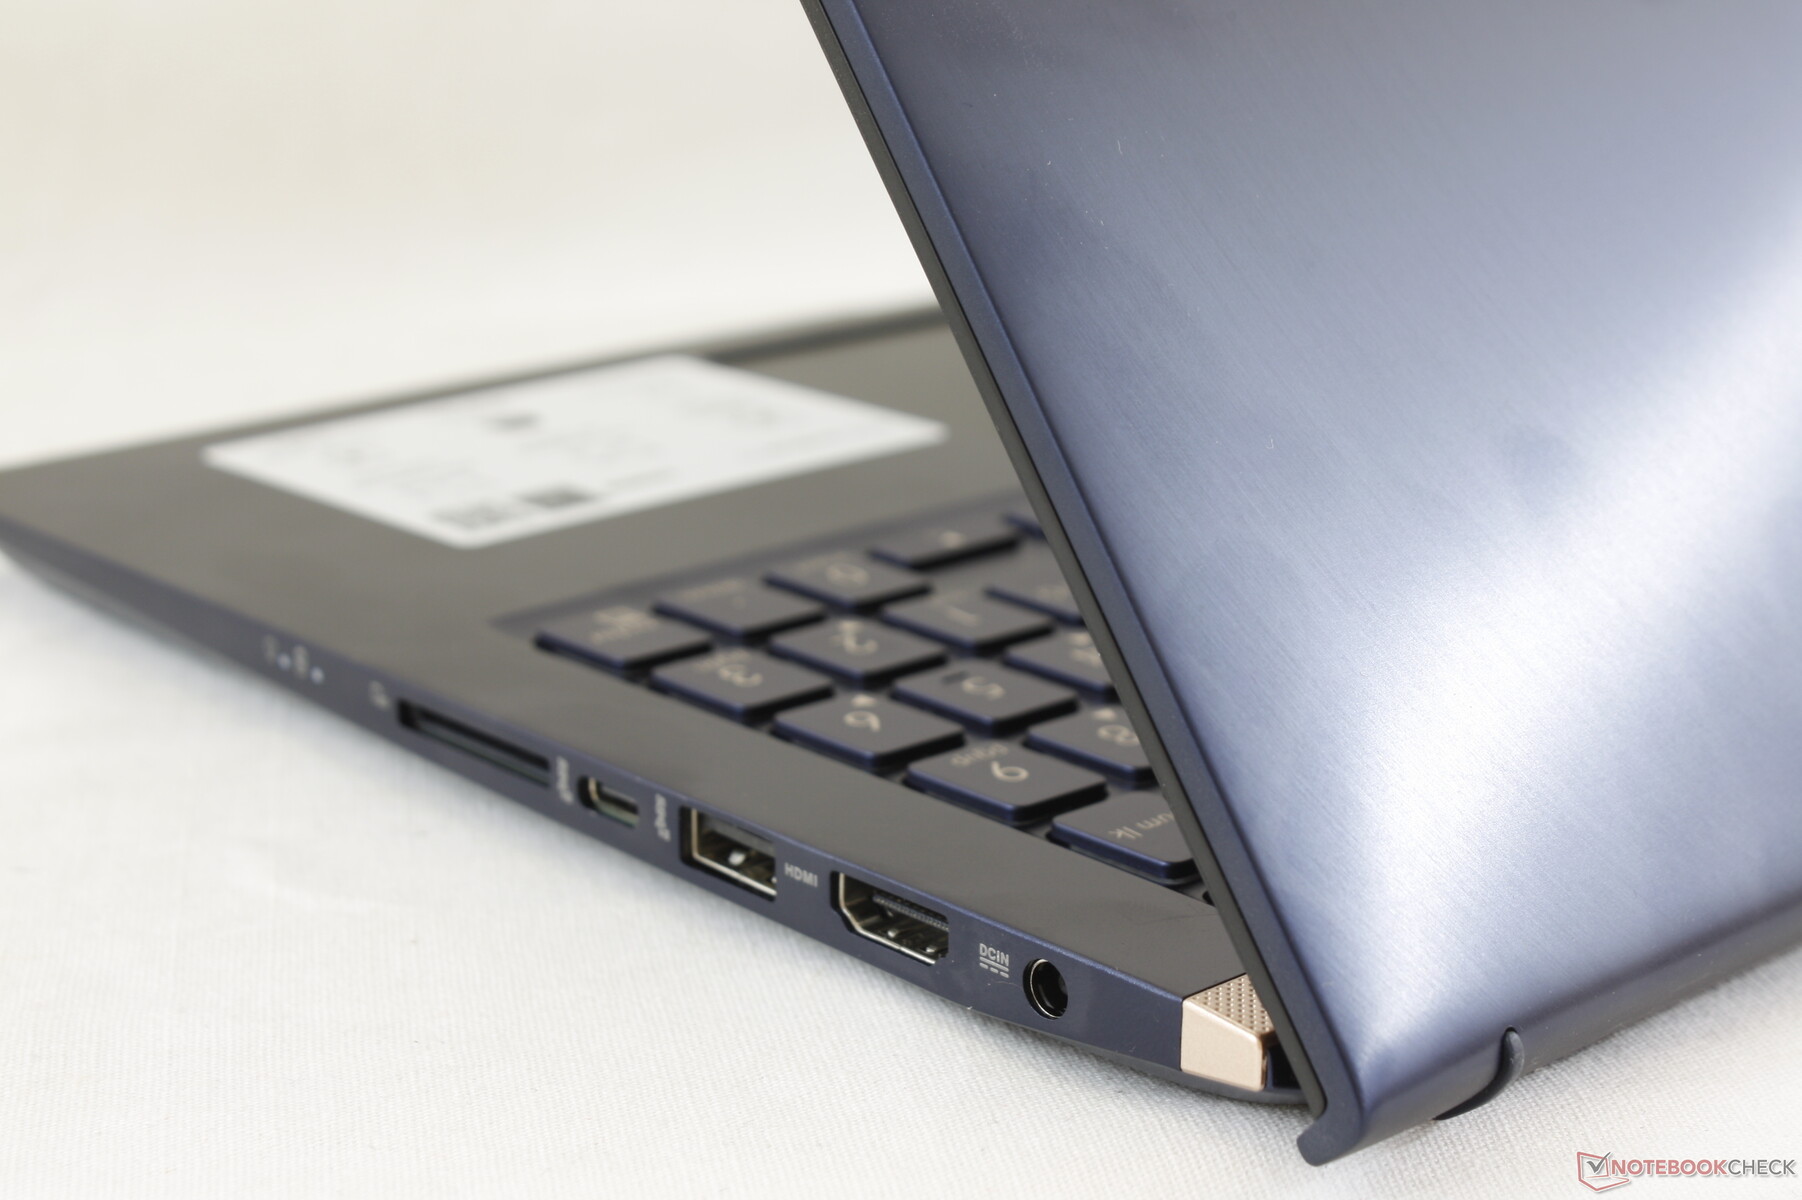
Port options remain identical to the ZenBook 15 UX533 and even the Dell XPS 15 7590. In Asus' case, however, its card reader is slower than the one on the Dell and its USB Type-C port does not support Thunderbolt 3 in contrast to the Dell or HP Spectre x360 15.
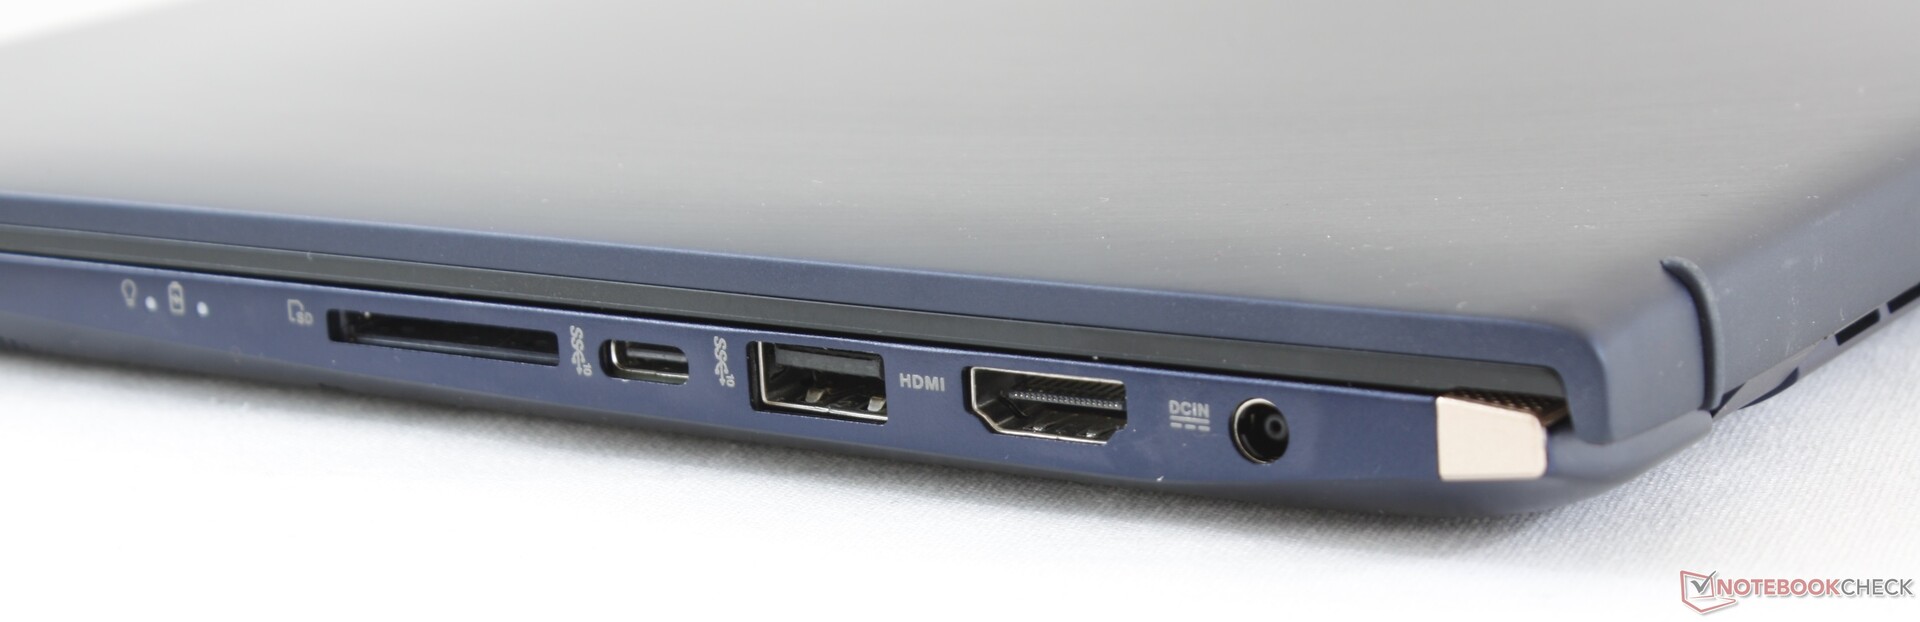
SD Card Reader
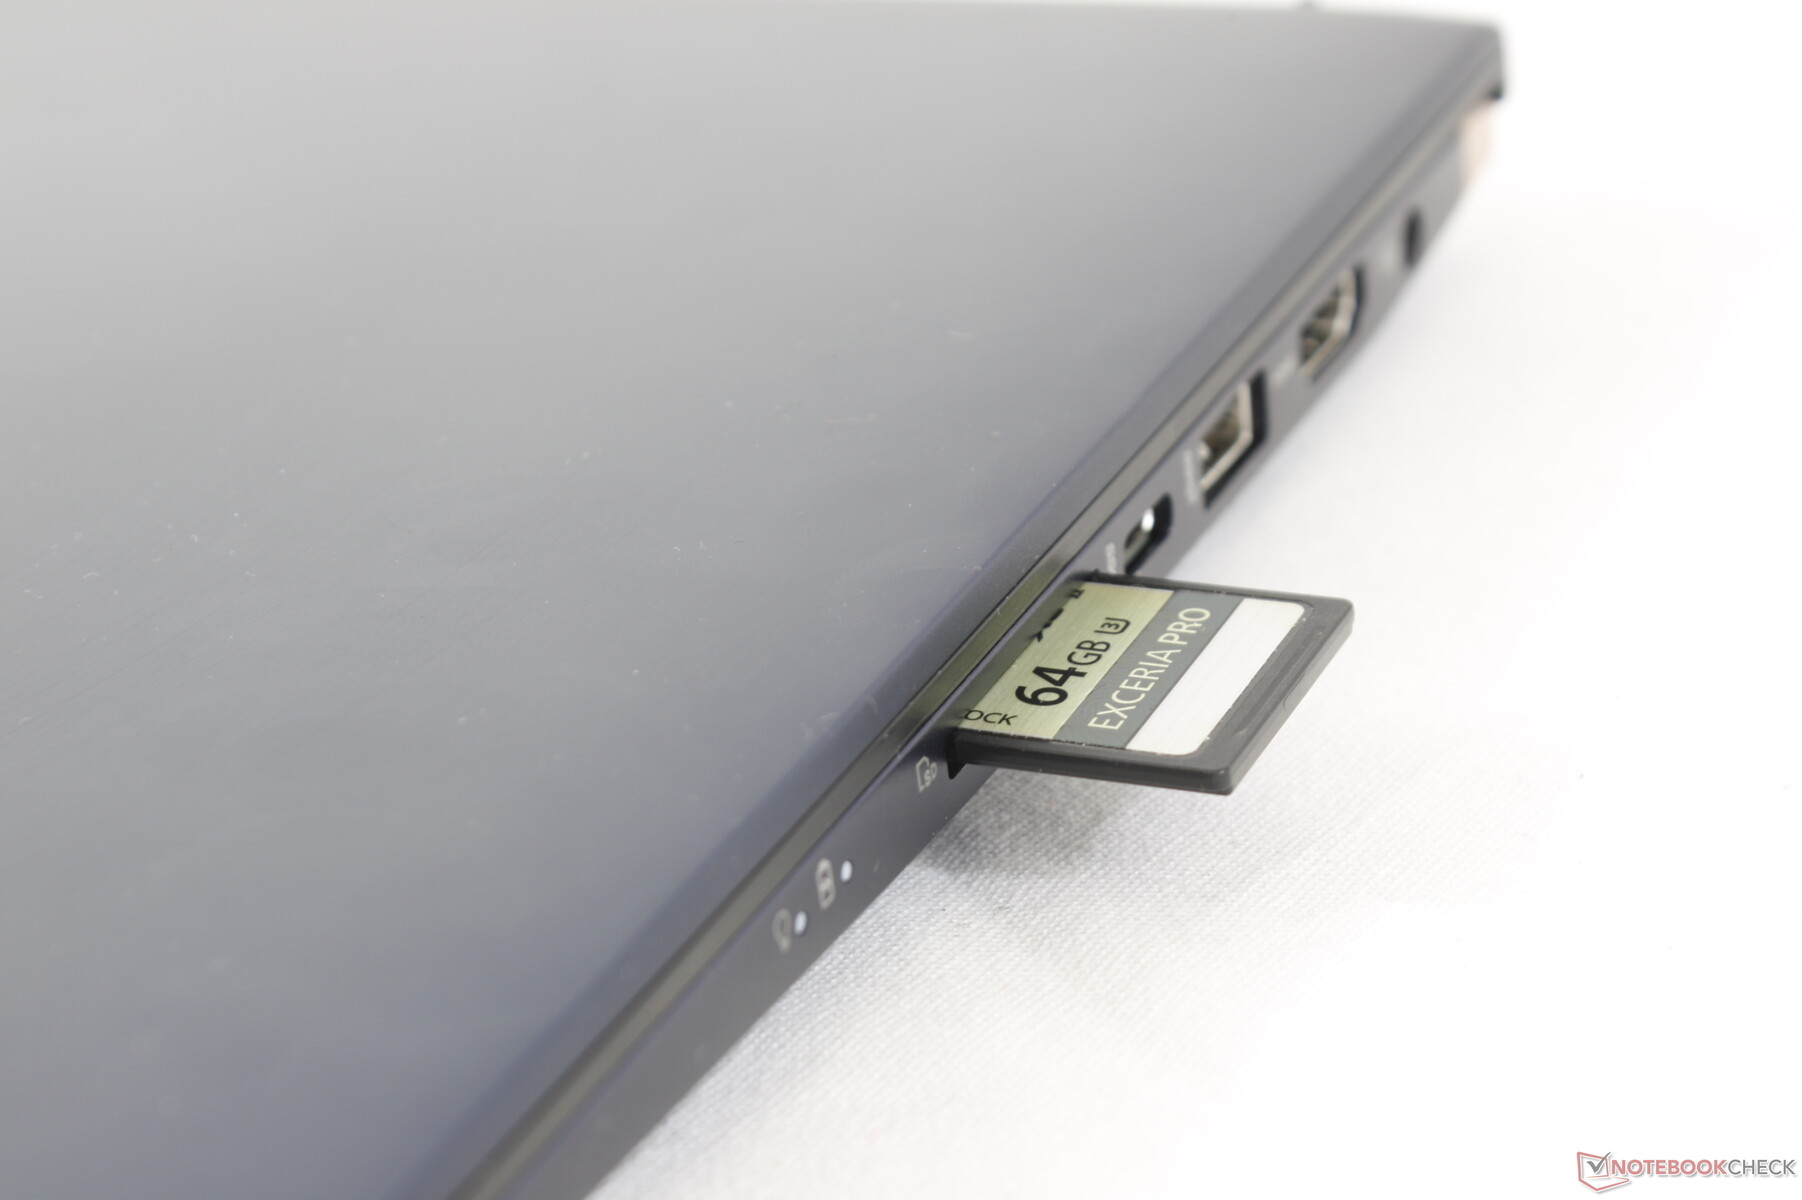
We appreciate the full-size SD card reader as this is a multimedia machine after all. Keep in mind that a fully inserted SD card will still protrude by over half its length to be unsafe when transporting. We would have preferred a full insertion instead.
| SD Card Reader | |
| average JPG Copy Test (av. of 3 runs) | |
| Dell XPS 15 7590 9980HK GTX 1650 (Toshiba Exceria Pro SDXC 64 GB UHS-II) | |
| HP Spectre x360 15-df0126ng (Toshiba Exceria Pro M501 microSDXC 64GB) | |
| Asus ZenBook 15 UX534FT-DB77 (Toshiba Exceria Pro SDXC 64 GB UHS-II) | |
| maximum AS SSD Seq Read Test (1GB) | |
| HP Spectre x360 15-df0126ng (Toshiba Exceria Pro M501 microSDXC 64GB) | |
| Dell XPS 15 7590 9980HK GTX 1650 (Toshiba Exceria Pro SDXC 64 GB UHS-II) | |
| Asus ZenBook 15 UX534FT-DB77 (Toshiba Exceria Pro SDXC 64 GB UHS-II) | |
Communication
The Intel 9560 comes standard for Wi-Fi 5 and Bluetooth 5 connectivity. The module is soldered and so Wi-Fi 6 options will be unlikely at least until the next iteration of the ZenBook 15 series.
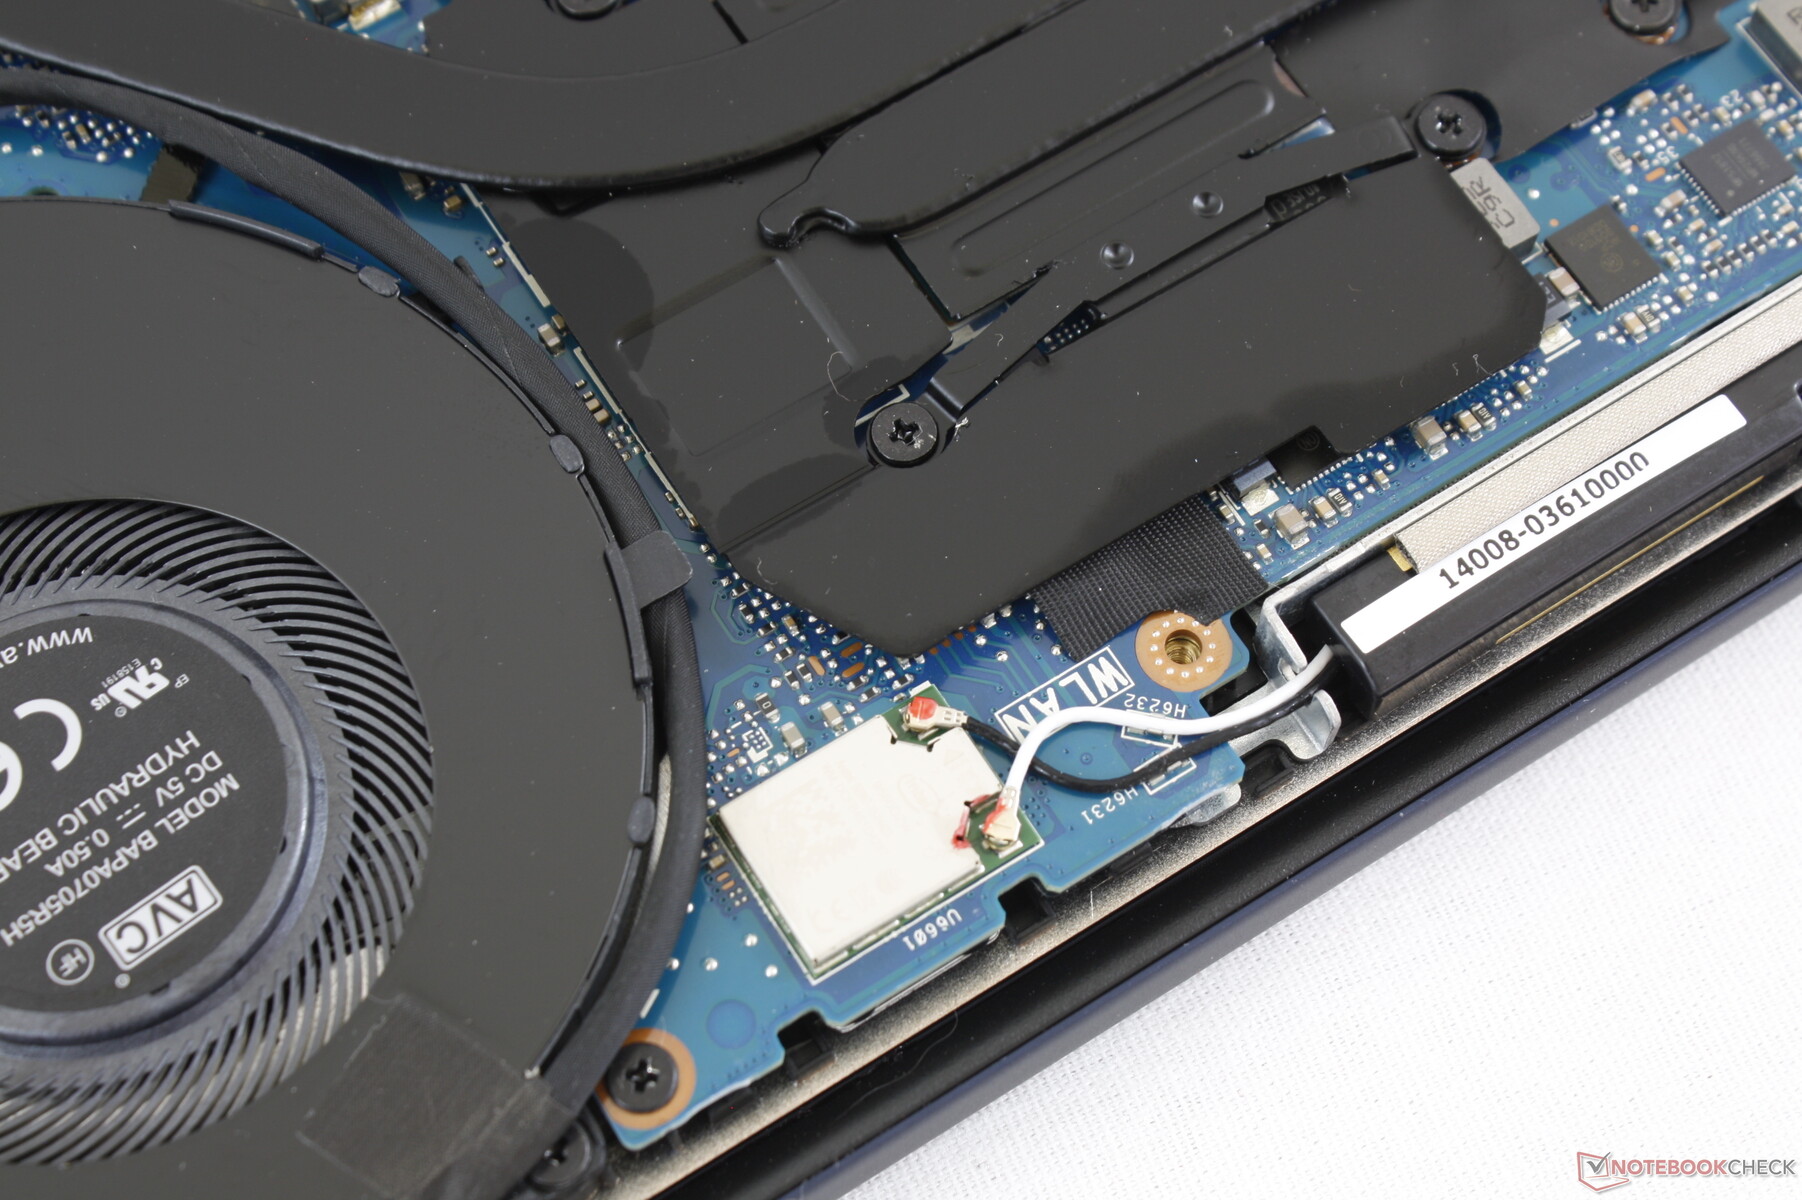
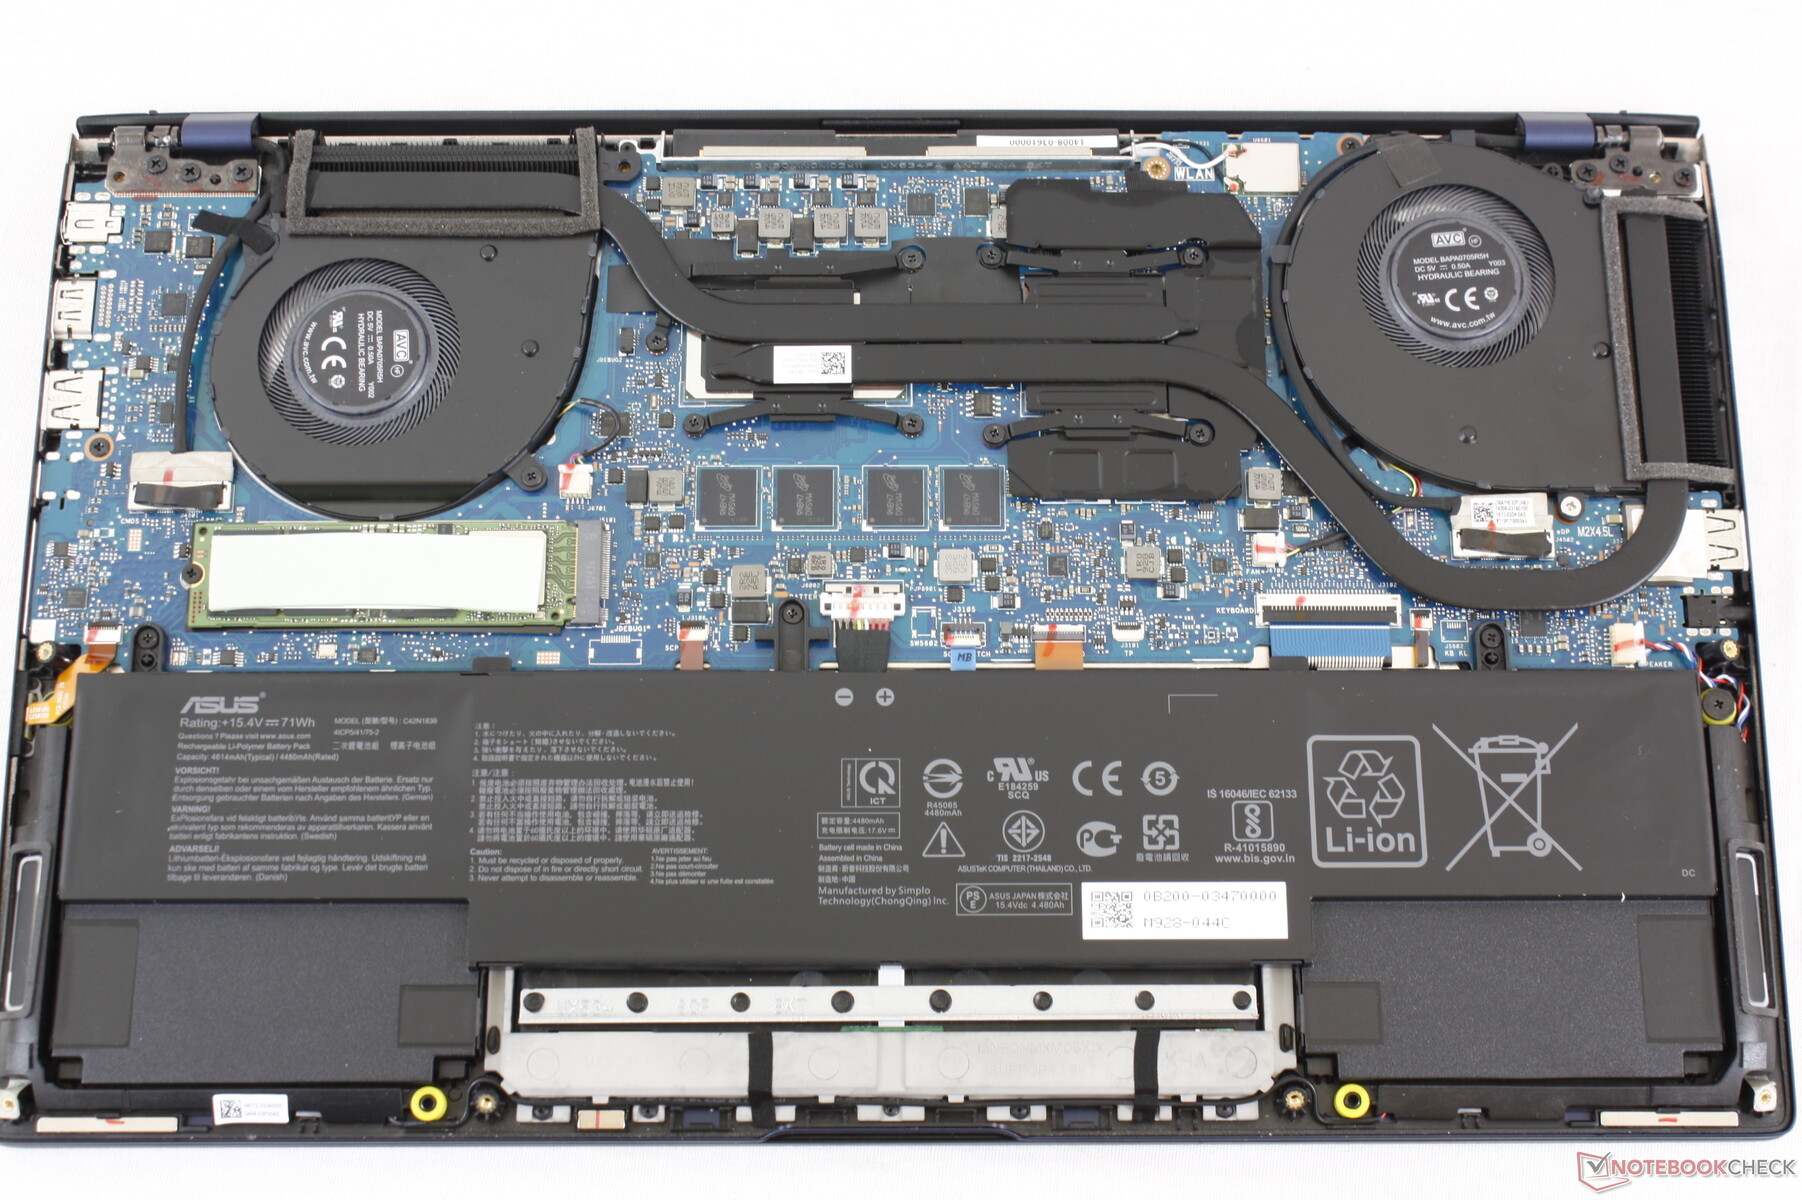
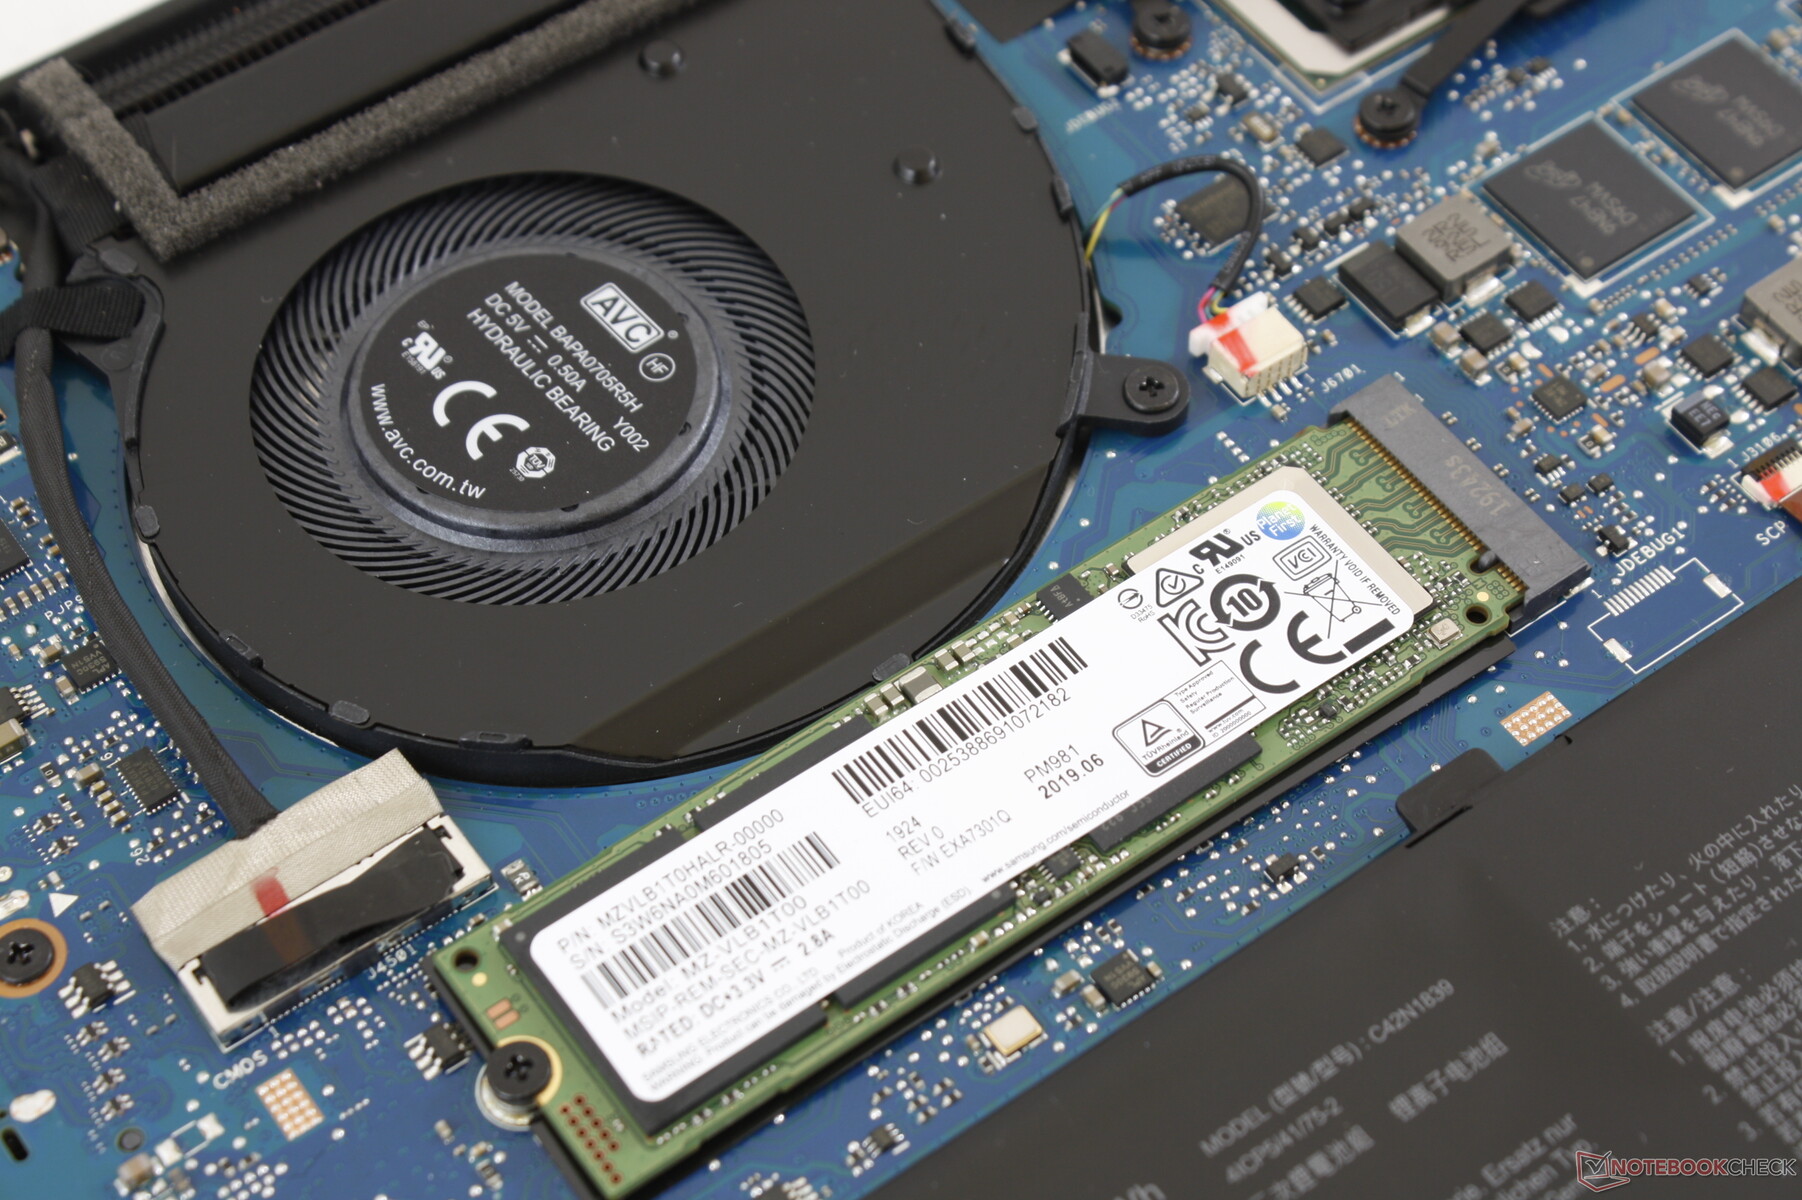
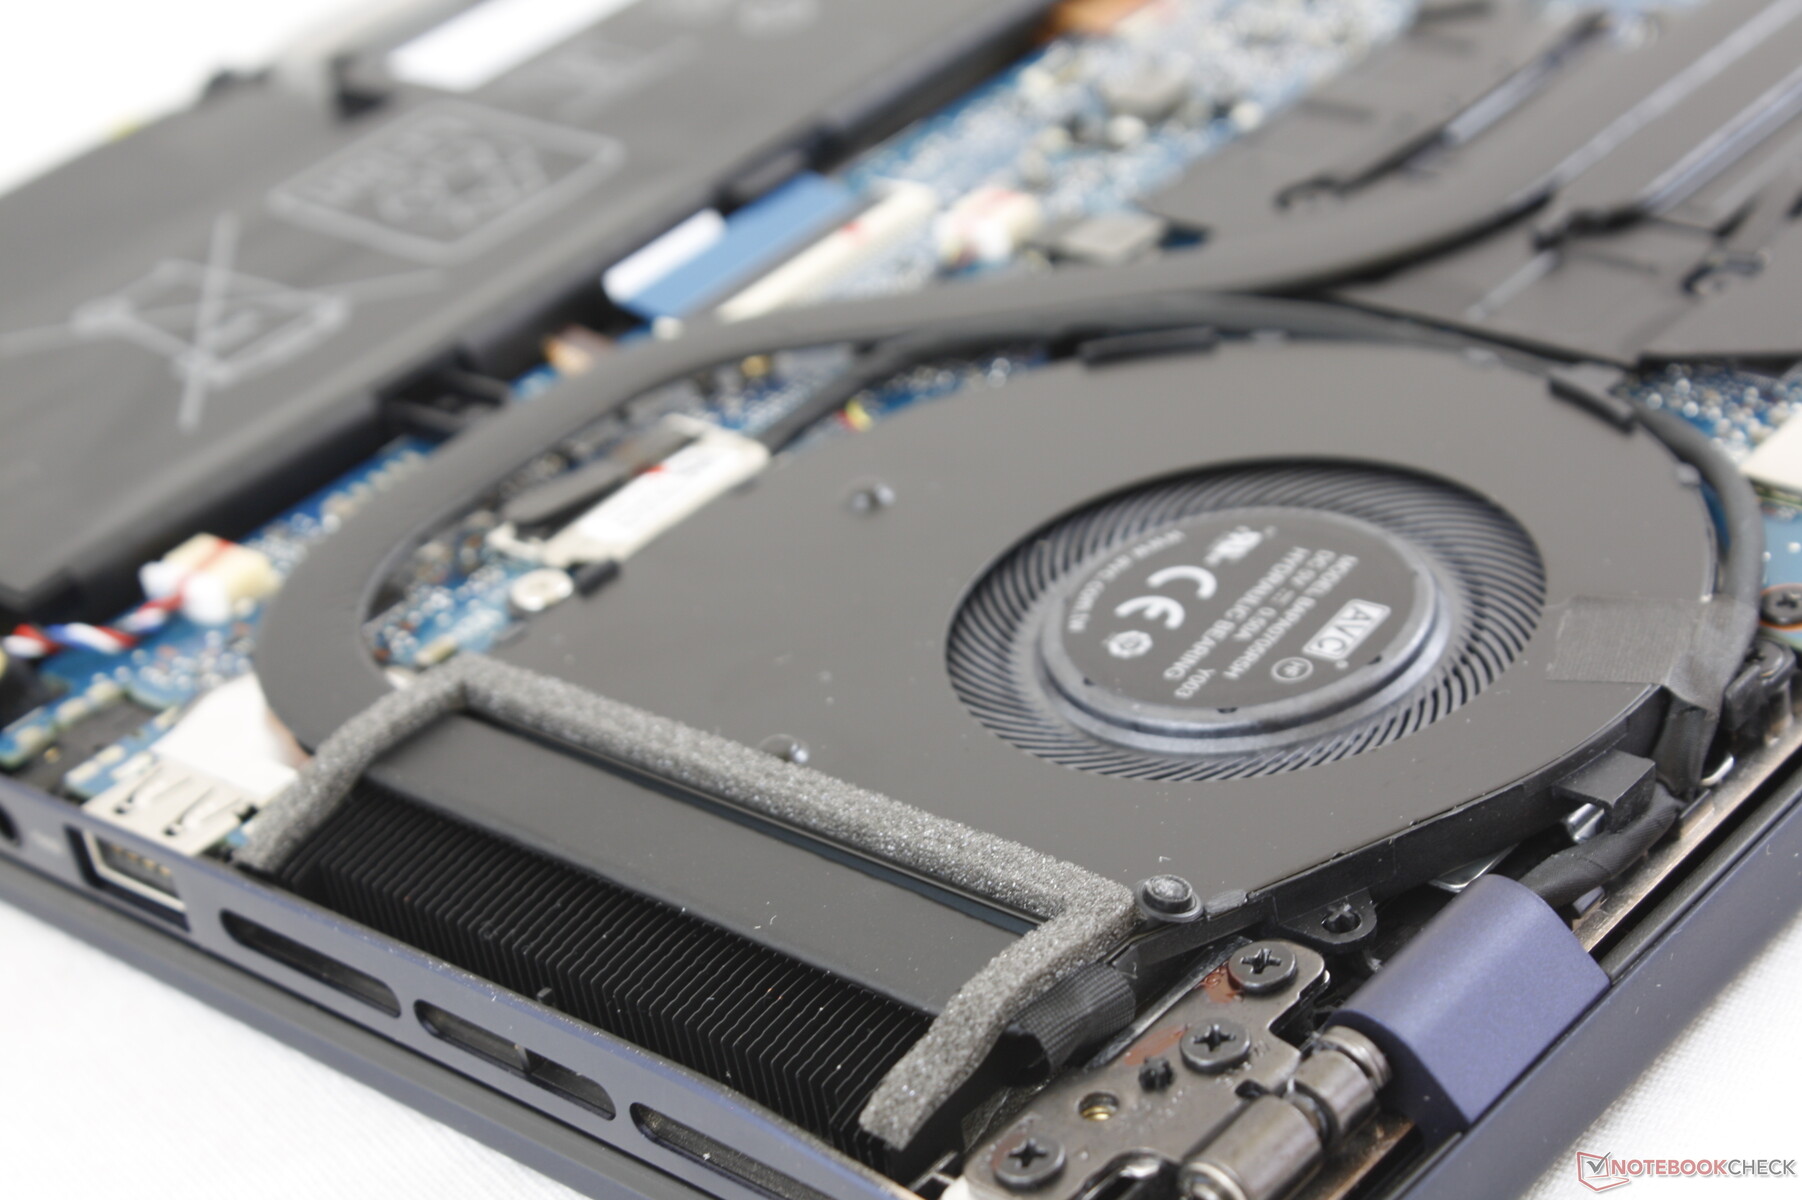
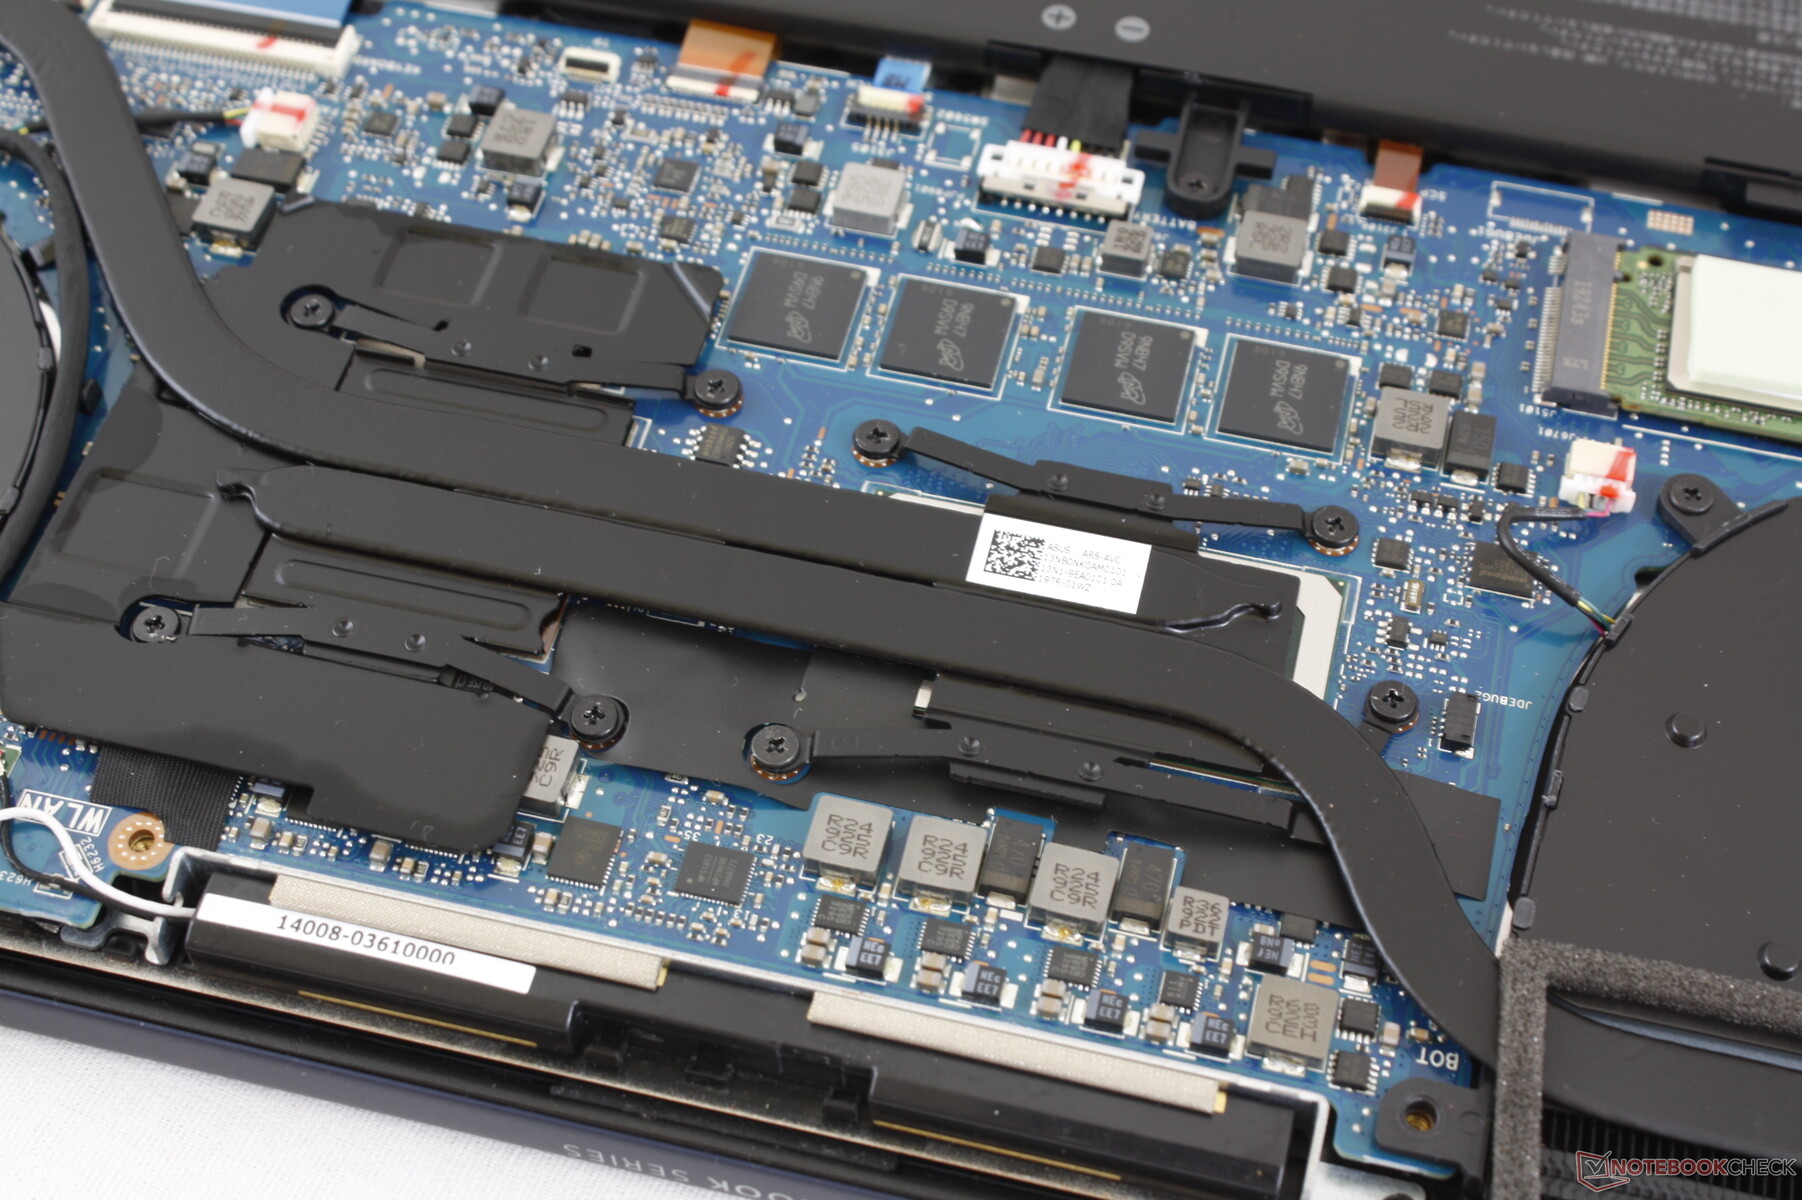
Maintenance
The bottom panel requires a T5 Torx wrench and it is sharp around the edges to deter tinkerers. Once inside, there is not much to upgrade aside from the single M.2 2280 slot and battery. RAM is soldered since the system utilizes LPDDR3.
Accessories and Warranty
Asus throws in a USB Type-A to RJ-45 adapter and a faux leather carrying case in each box. The standard one-year limited warranty applies.
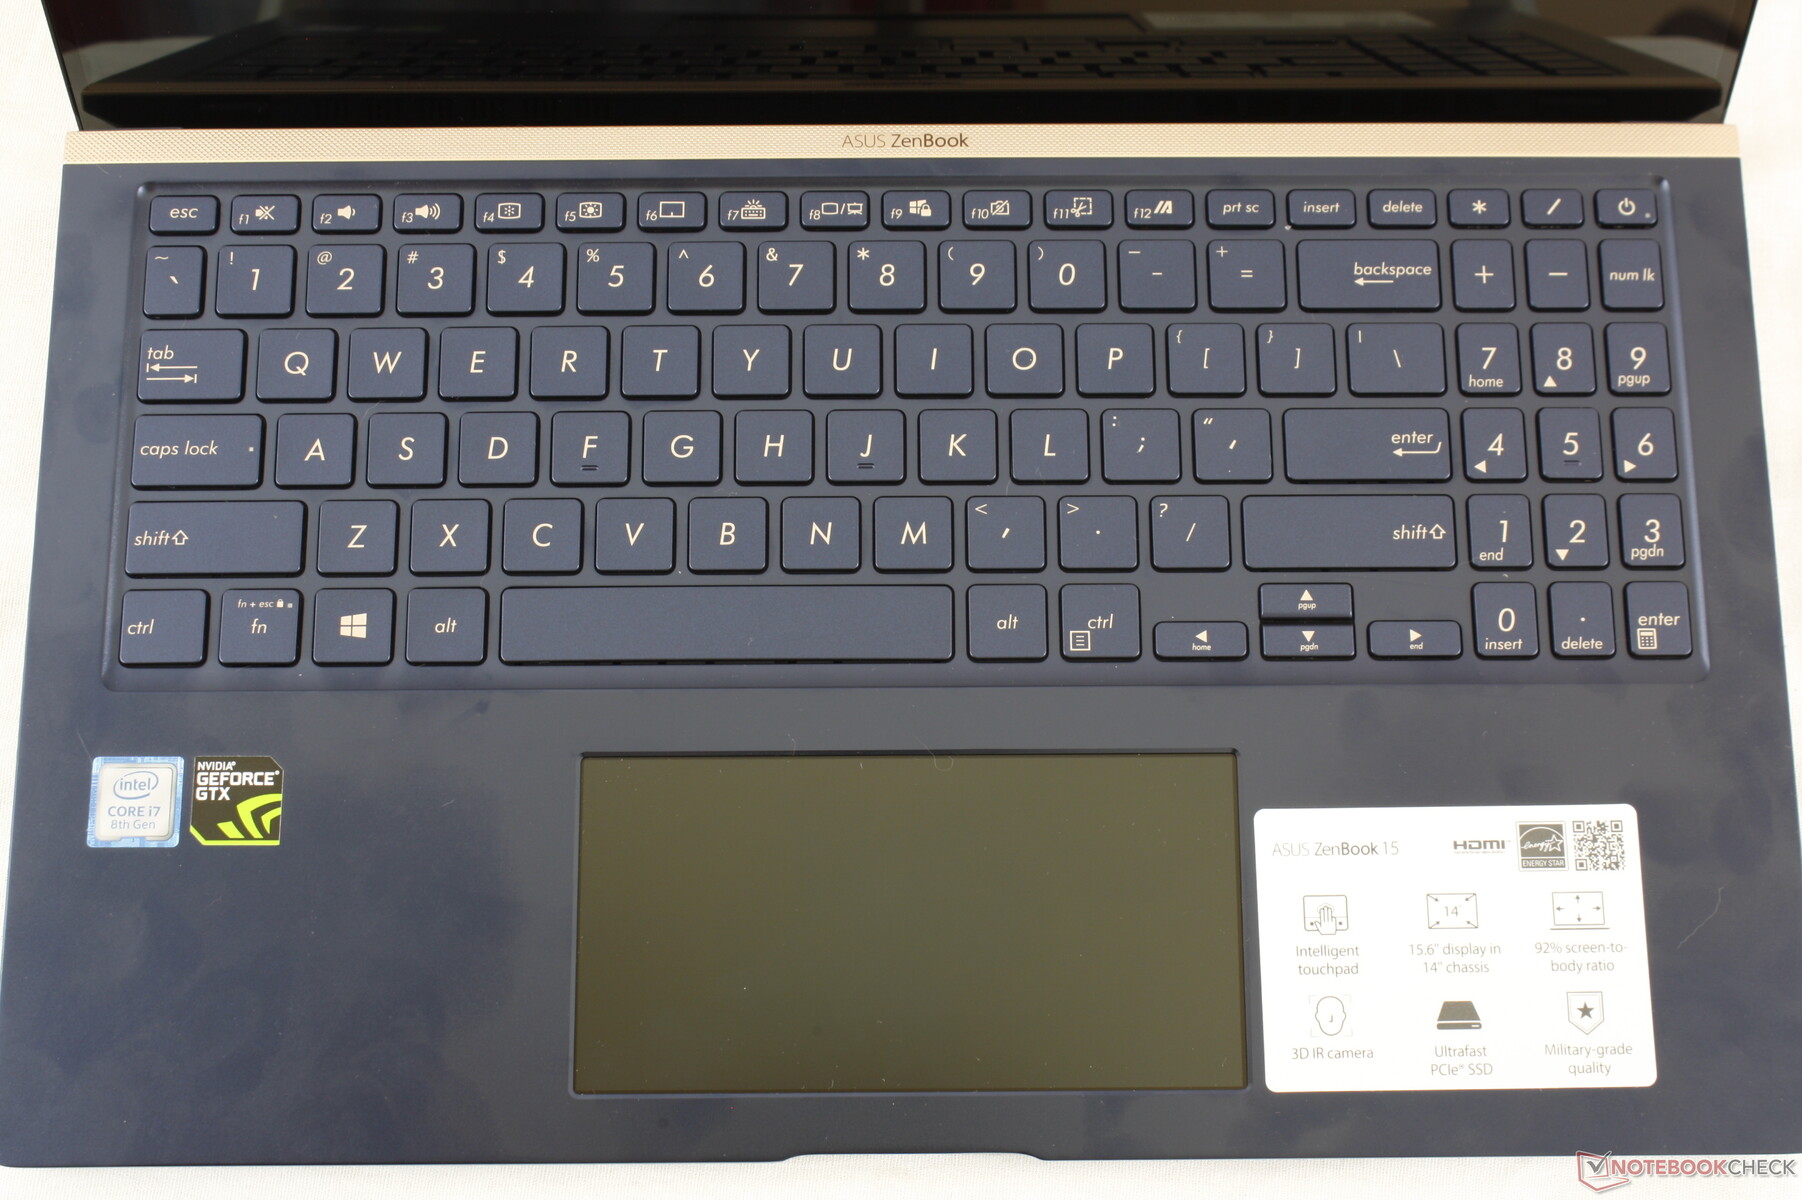
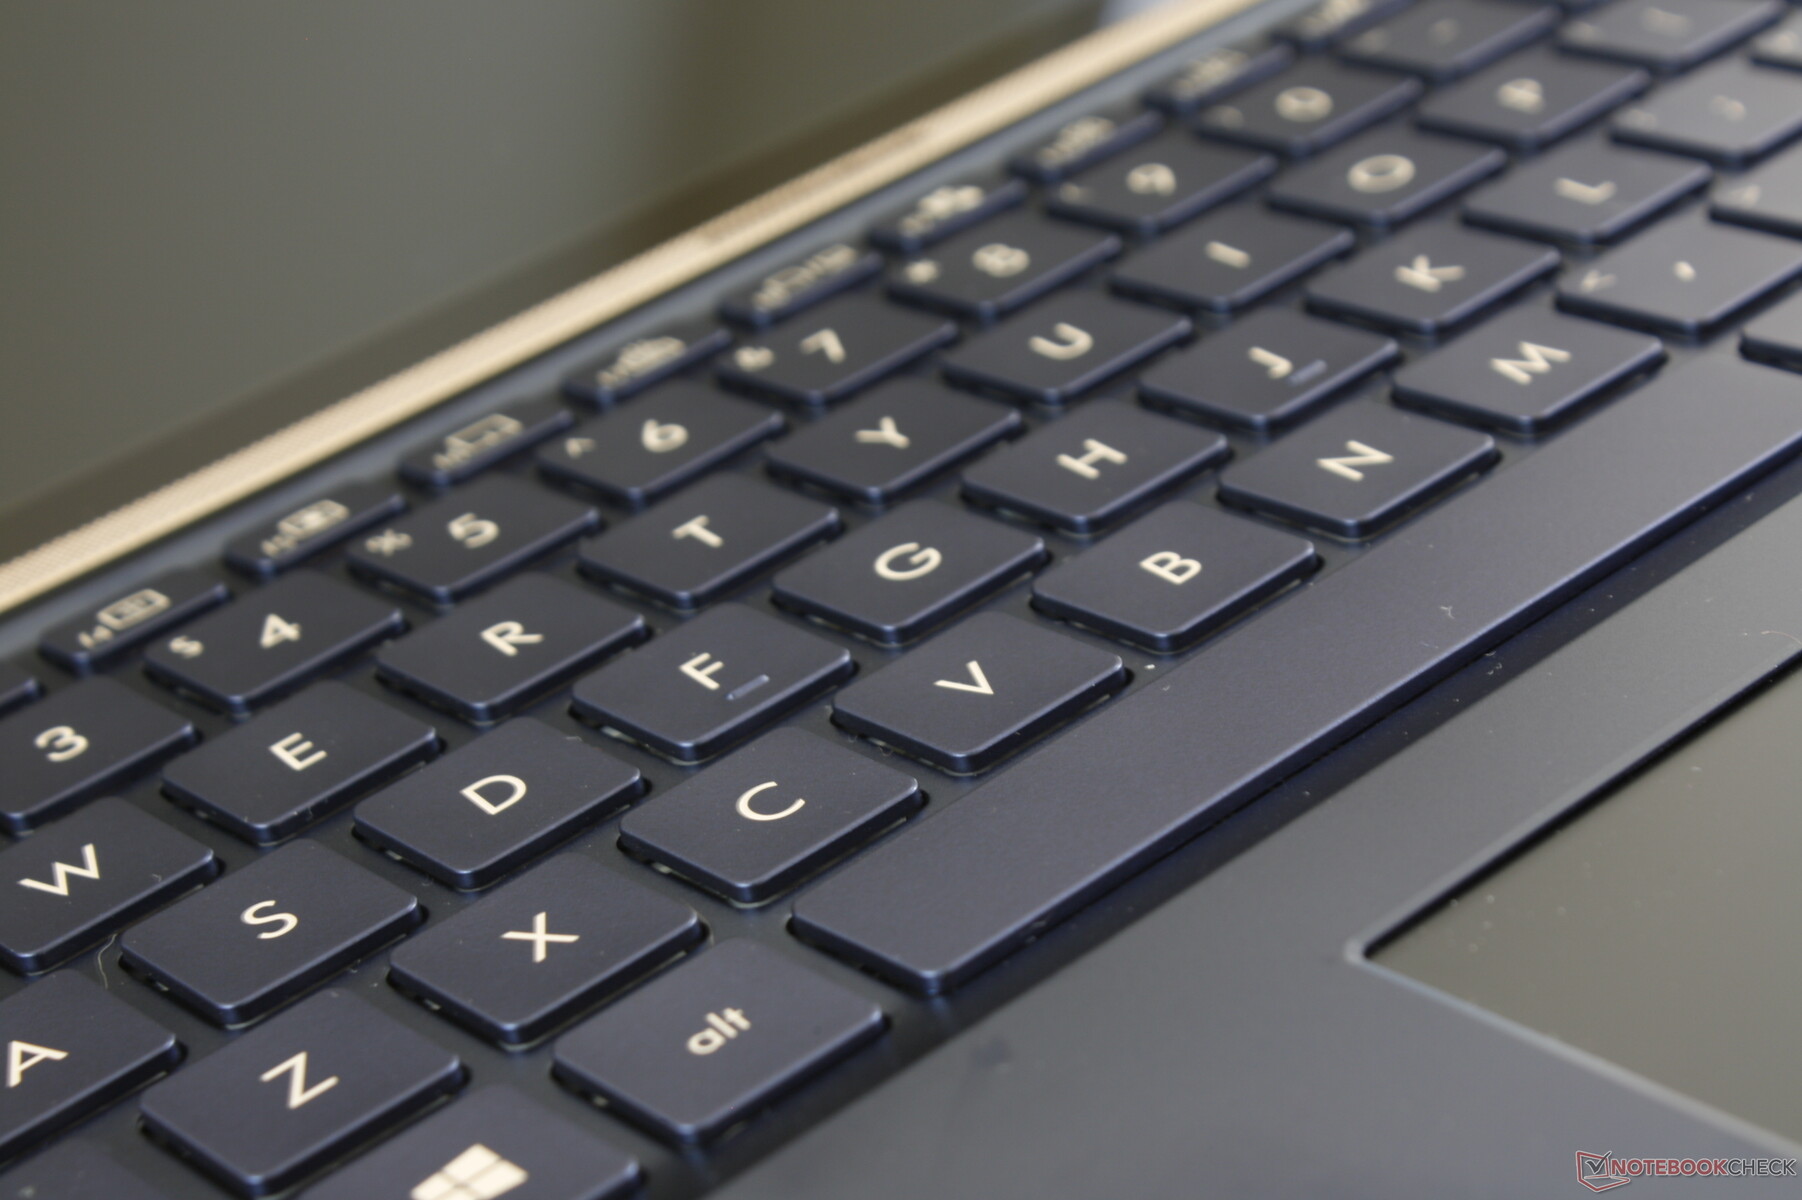
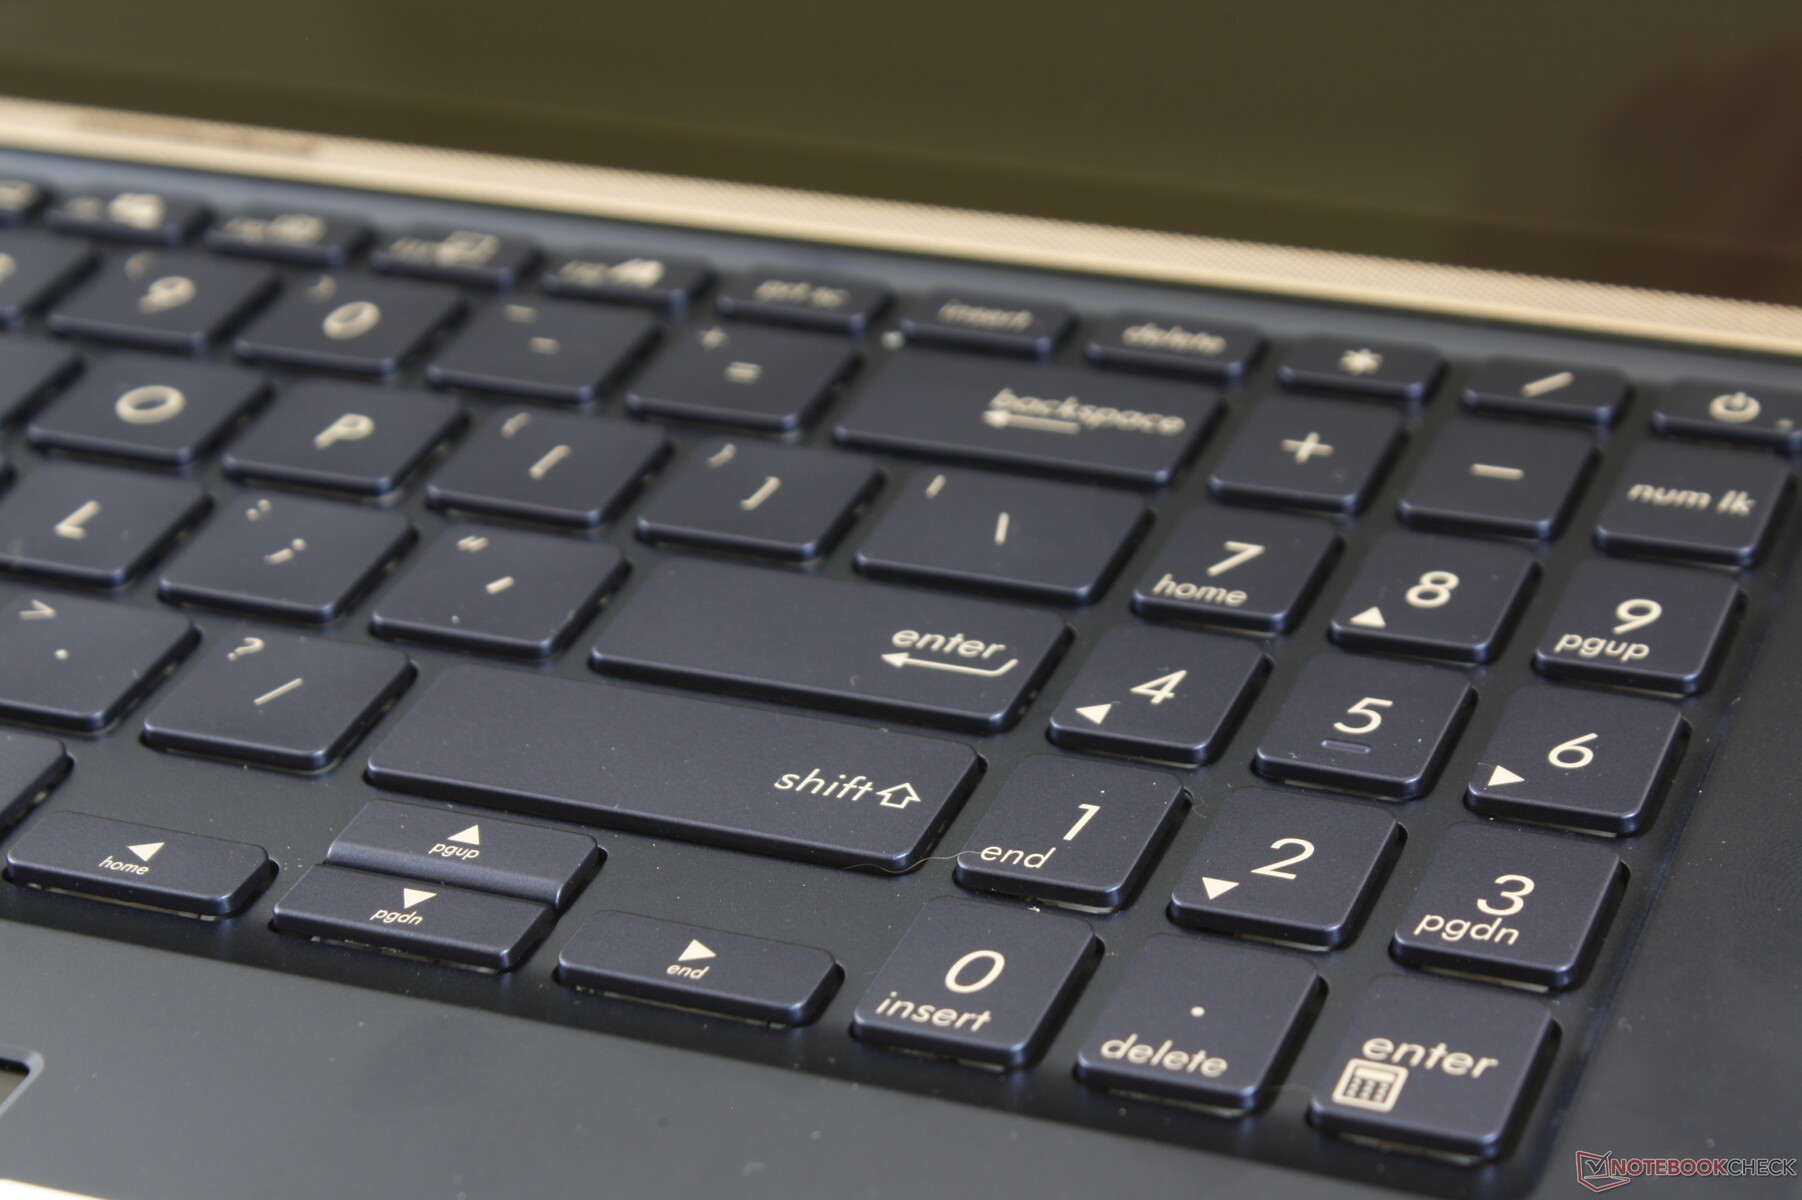
Input Devices
Keyboard
The keyboard remains identical to the ZenBook 15 UX534.
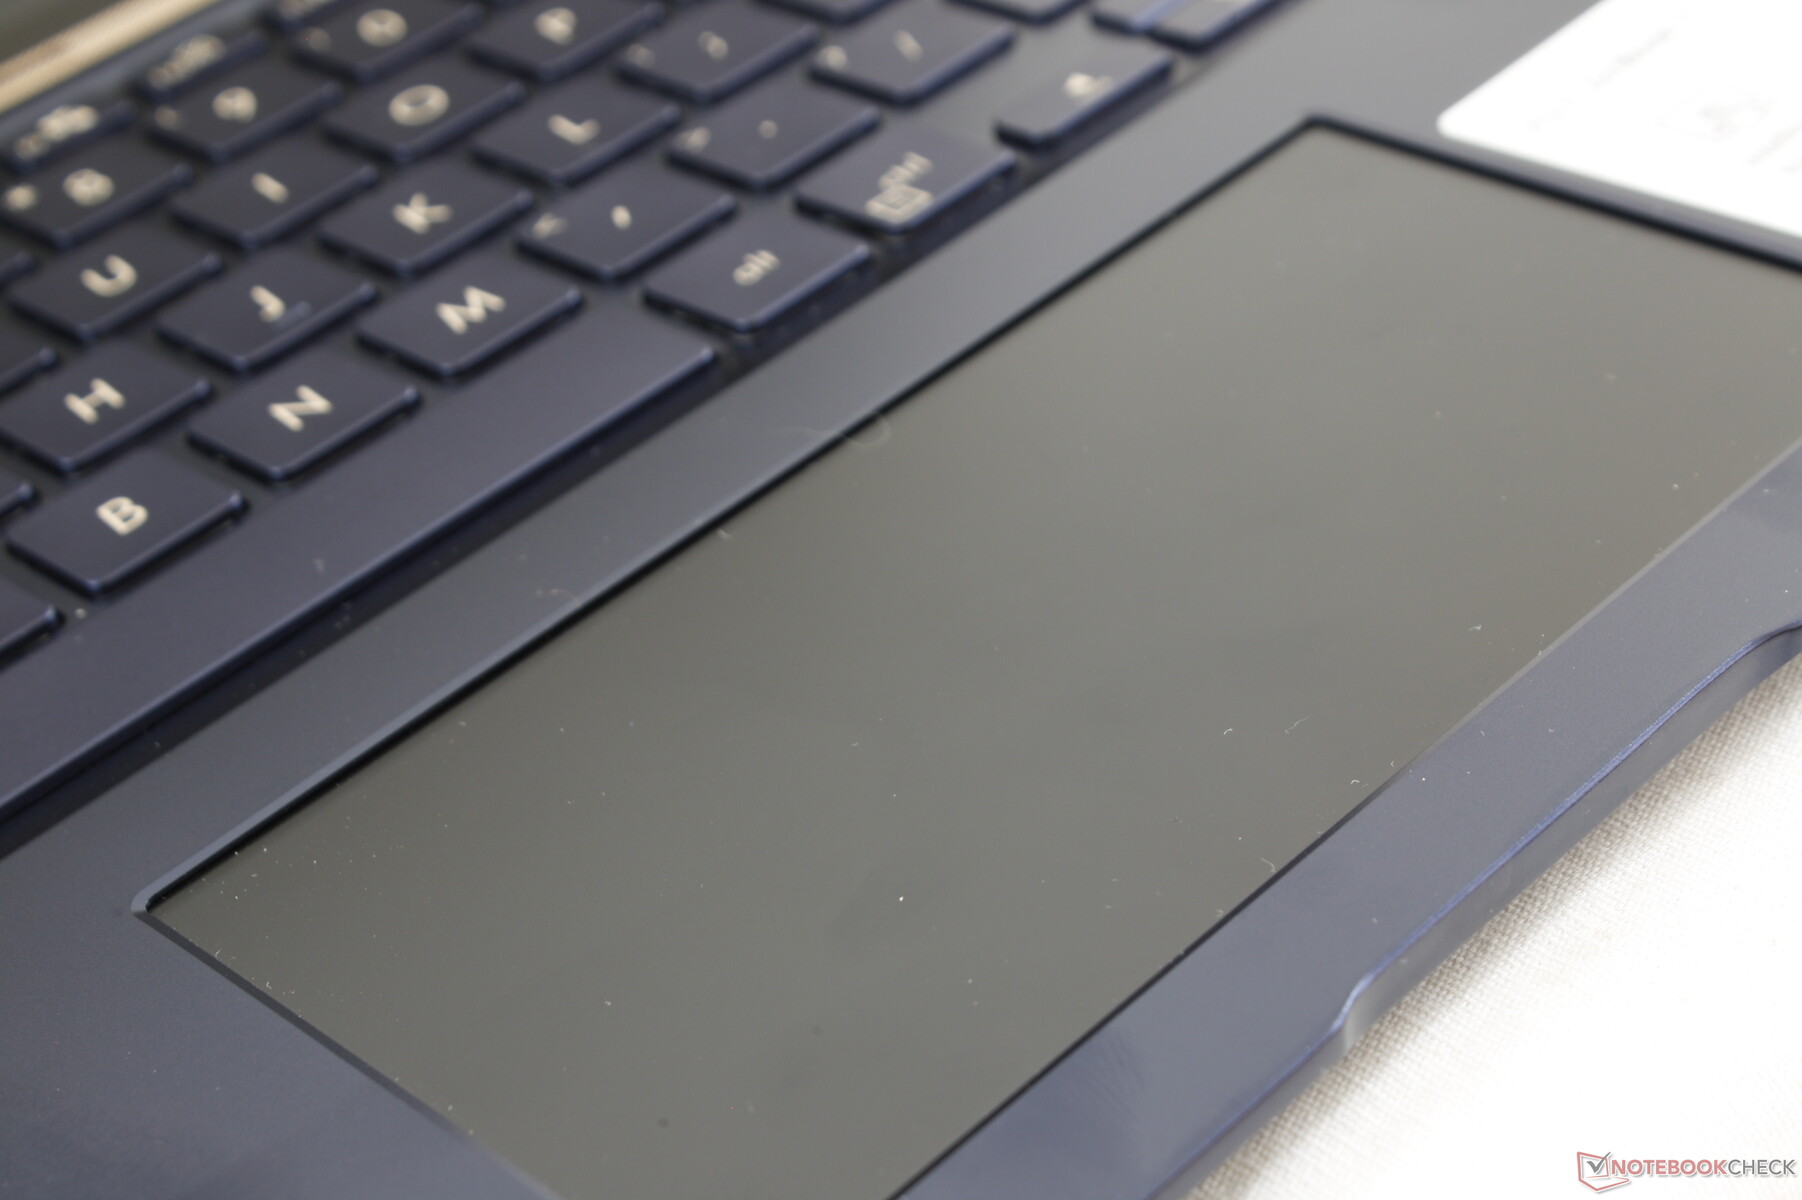
Touchpad
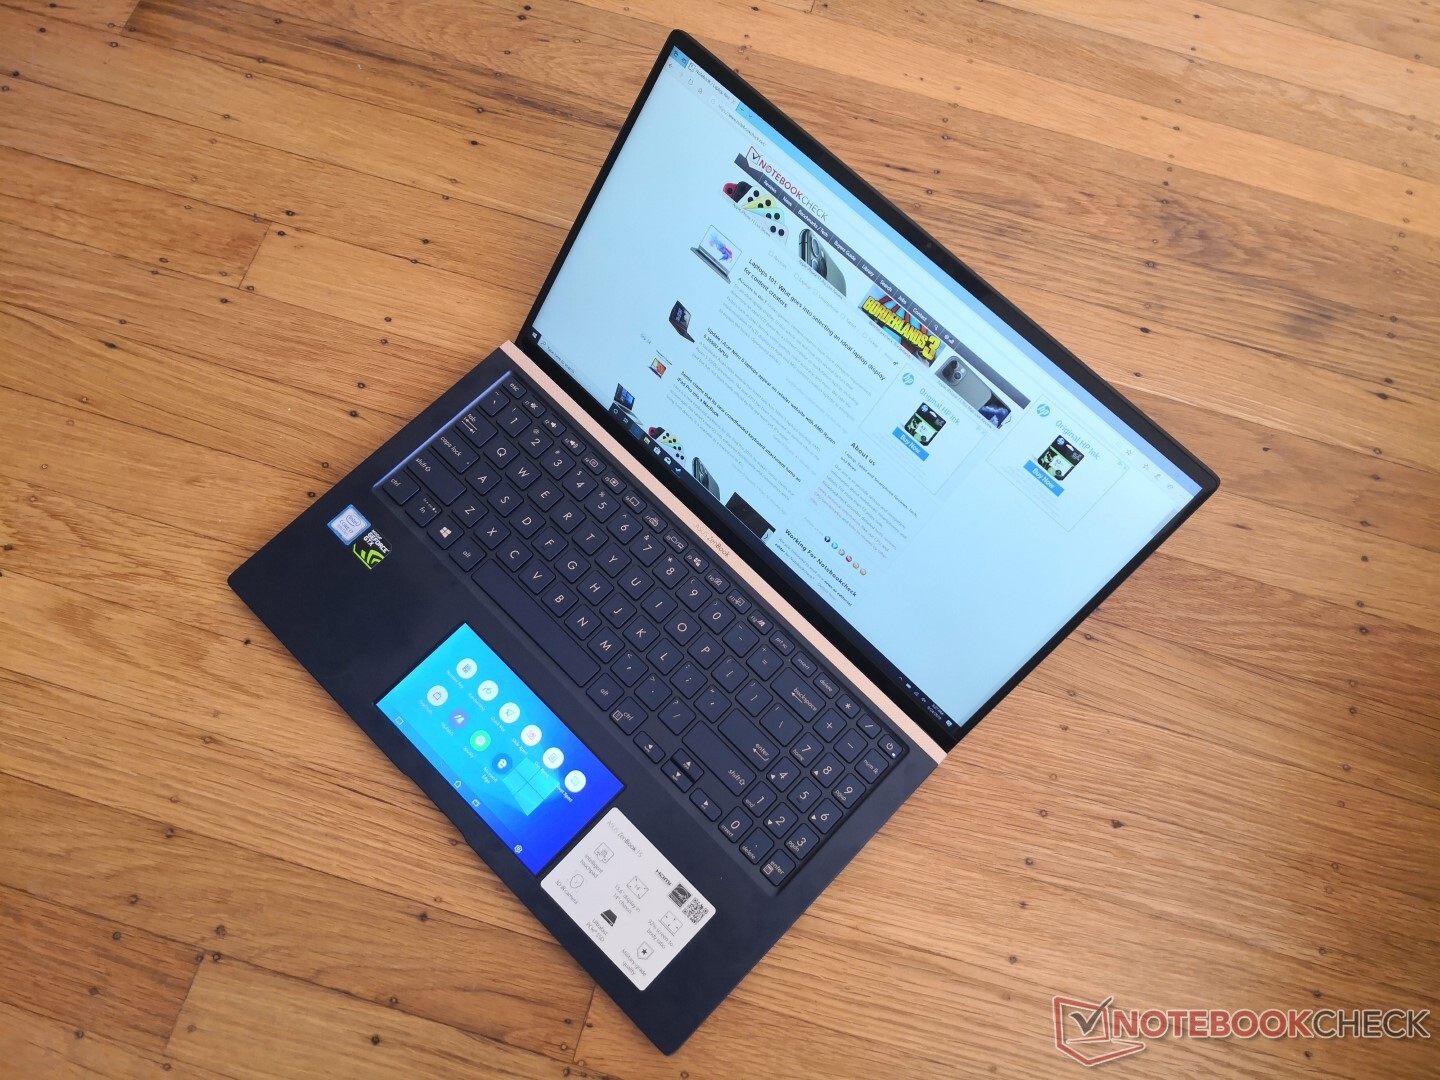
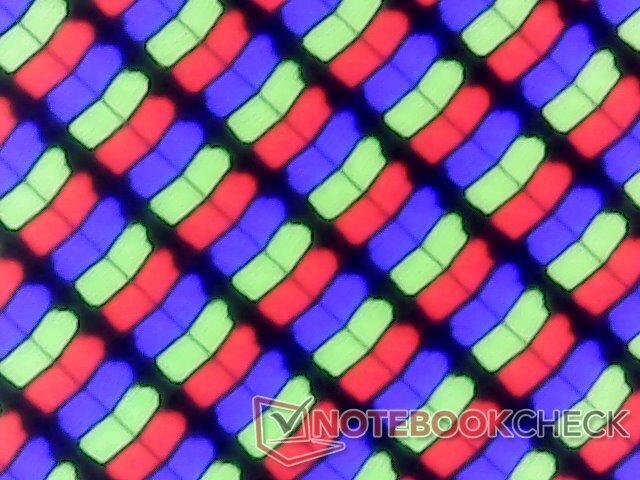
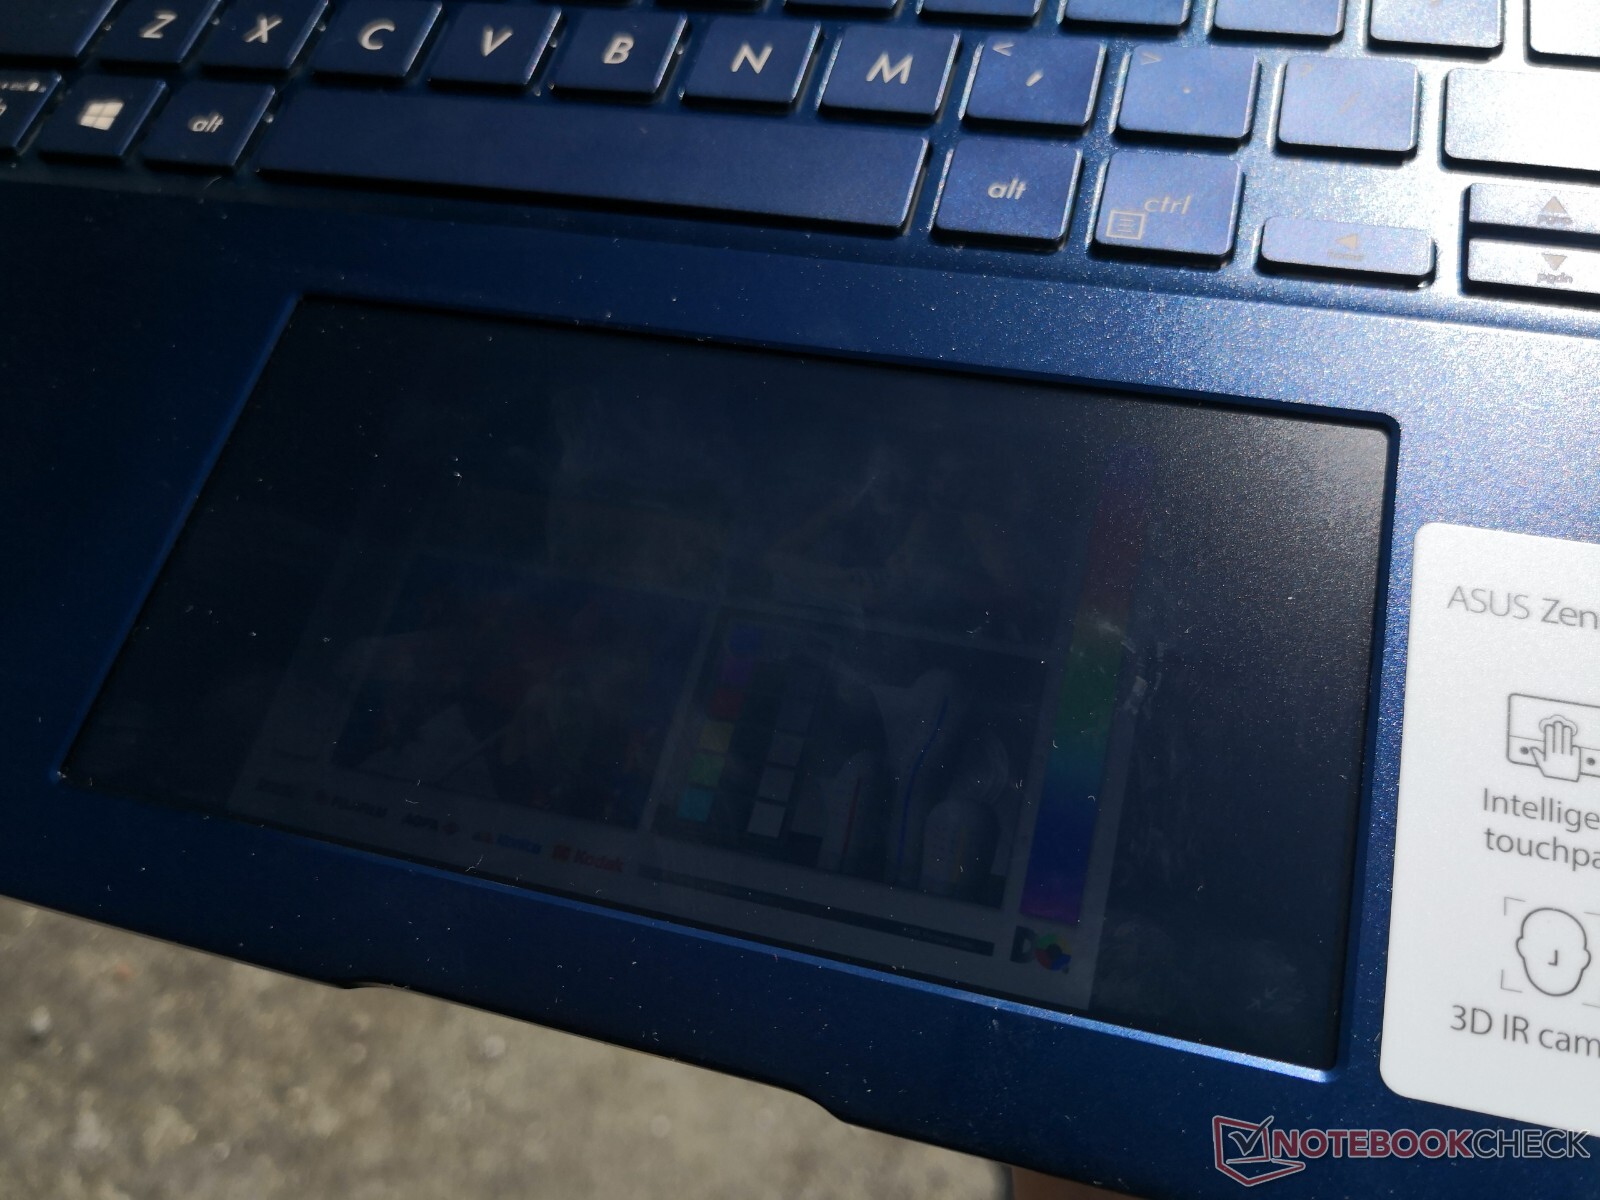
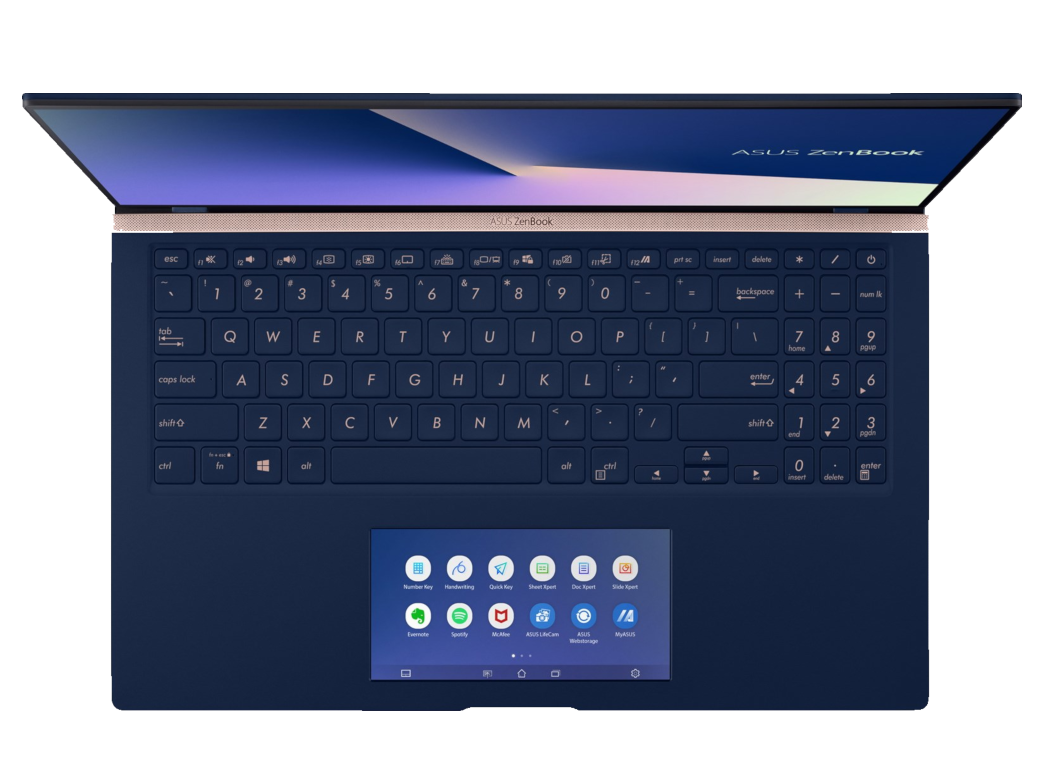
The ScreenPad surface area is larger (13 x 6.7 cm) than the clickpad on the UX533. The matte surface feels just a regular clickpad for smooth and reliable cursor control, but this has its drawbacks in terms of pixel clarity that we will show in the next section. There is almost no sticking when gliding at slow speeds which can make accurate clicking or drag and dropping more difficult.
Applying pressure on the ScreenPad surface will activate the integrated mouse keys. Feedback is on the soft side even though the auditory click is somewhat loud. An external mouse is going to be a lot more comfortable in this regard.
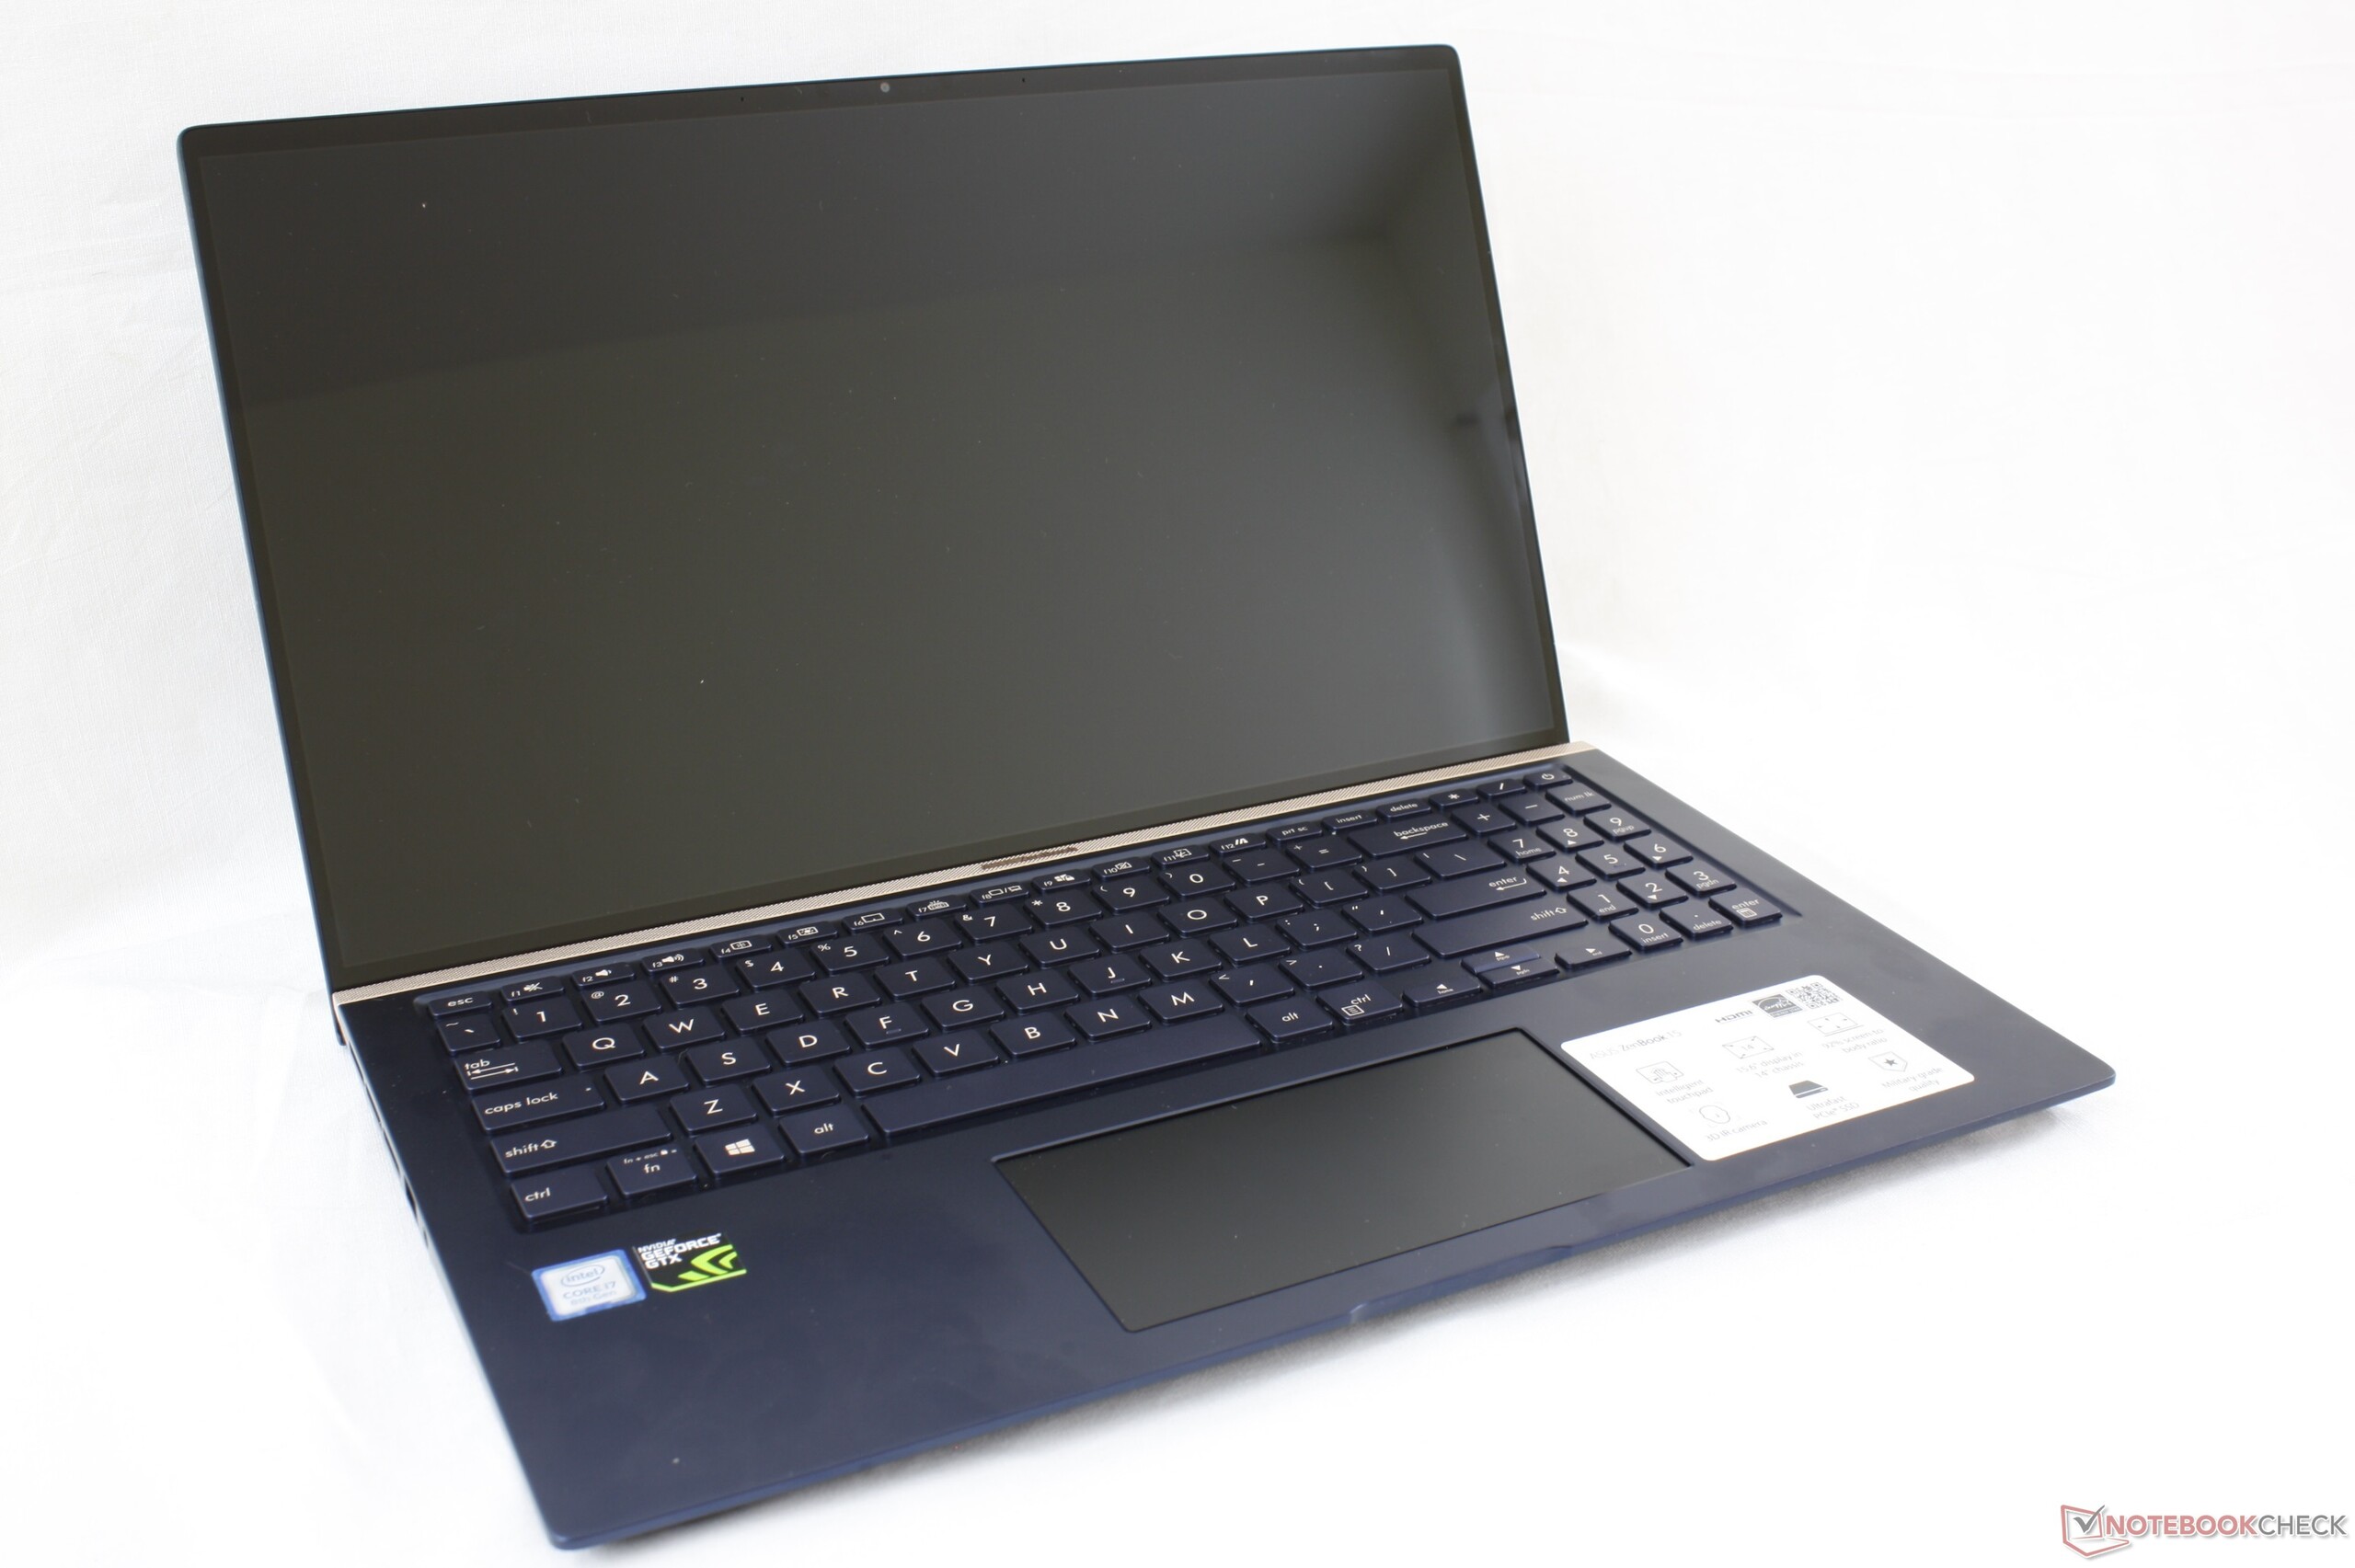
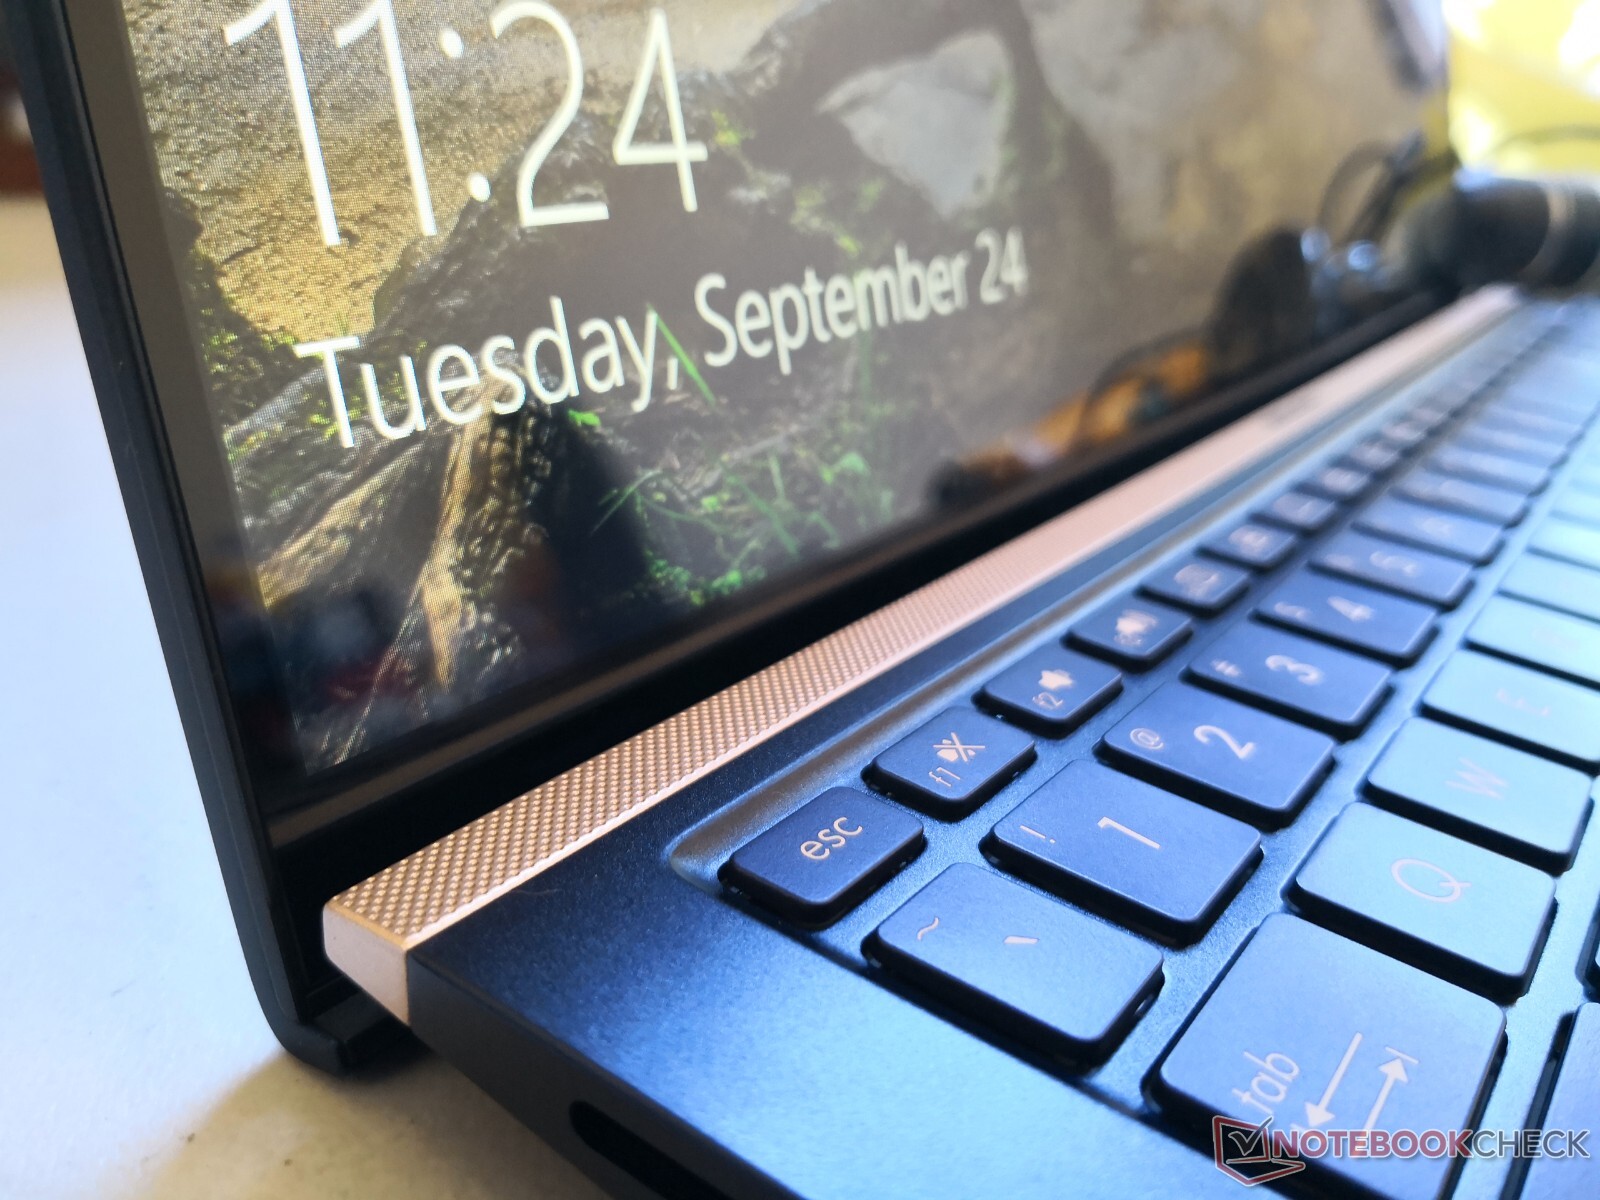
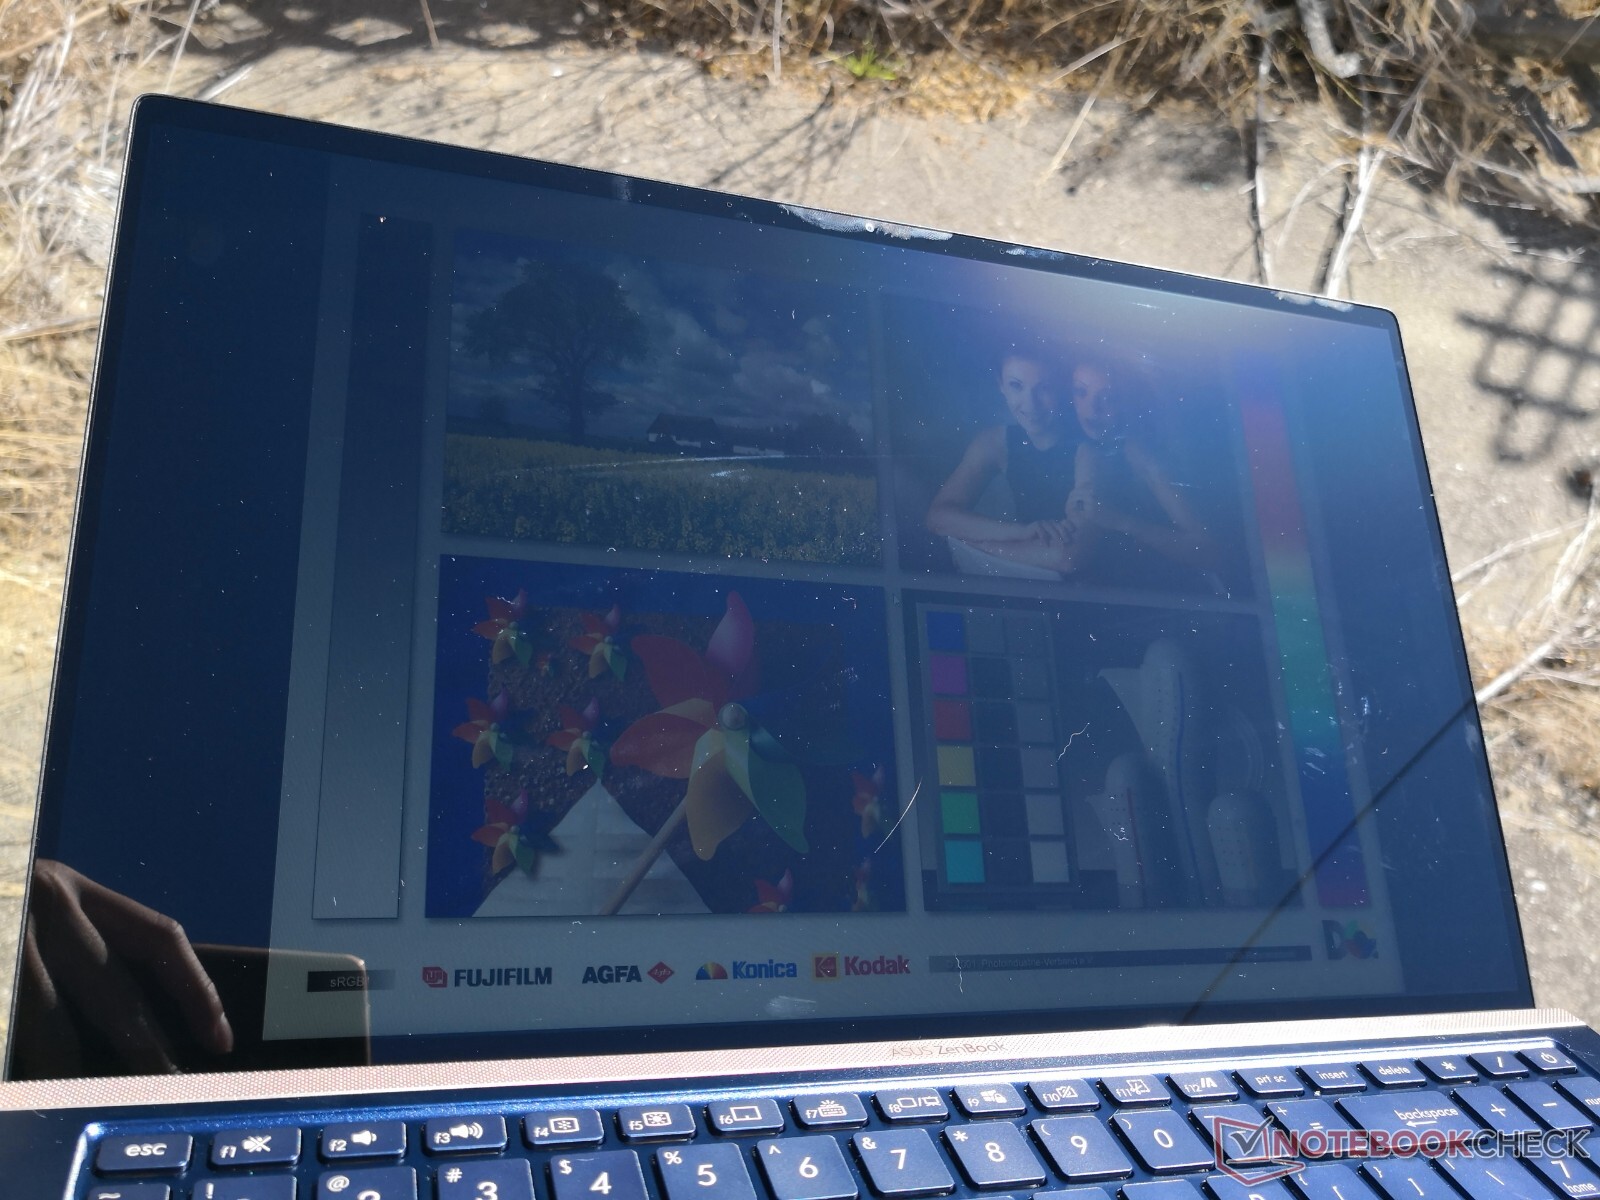
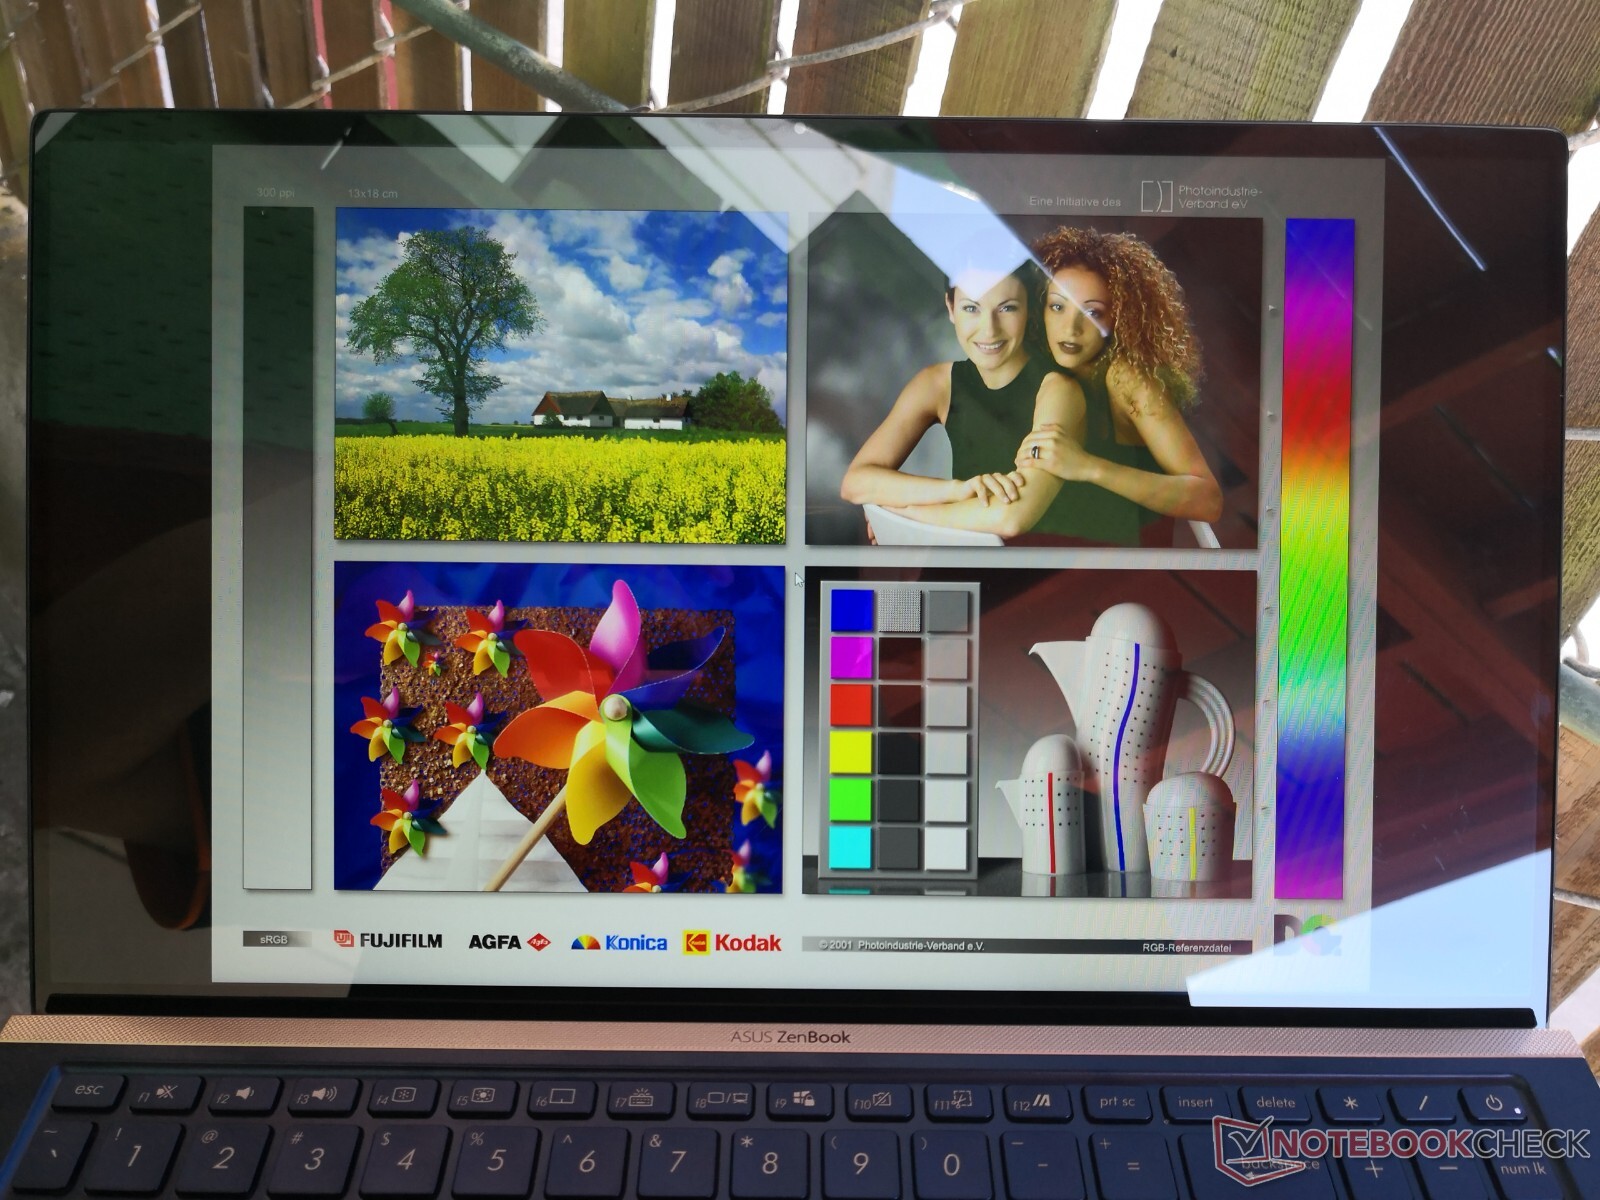
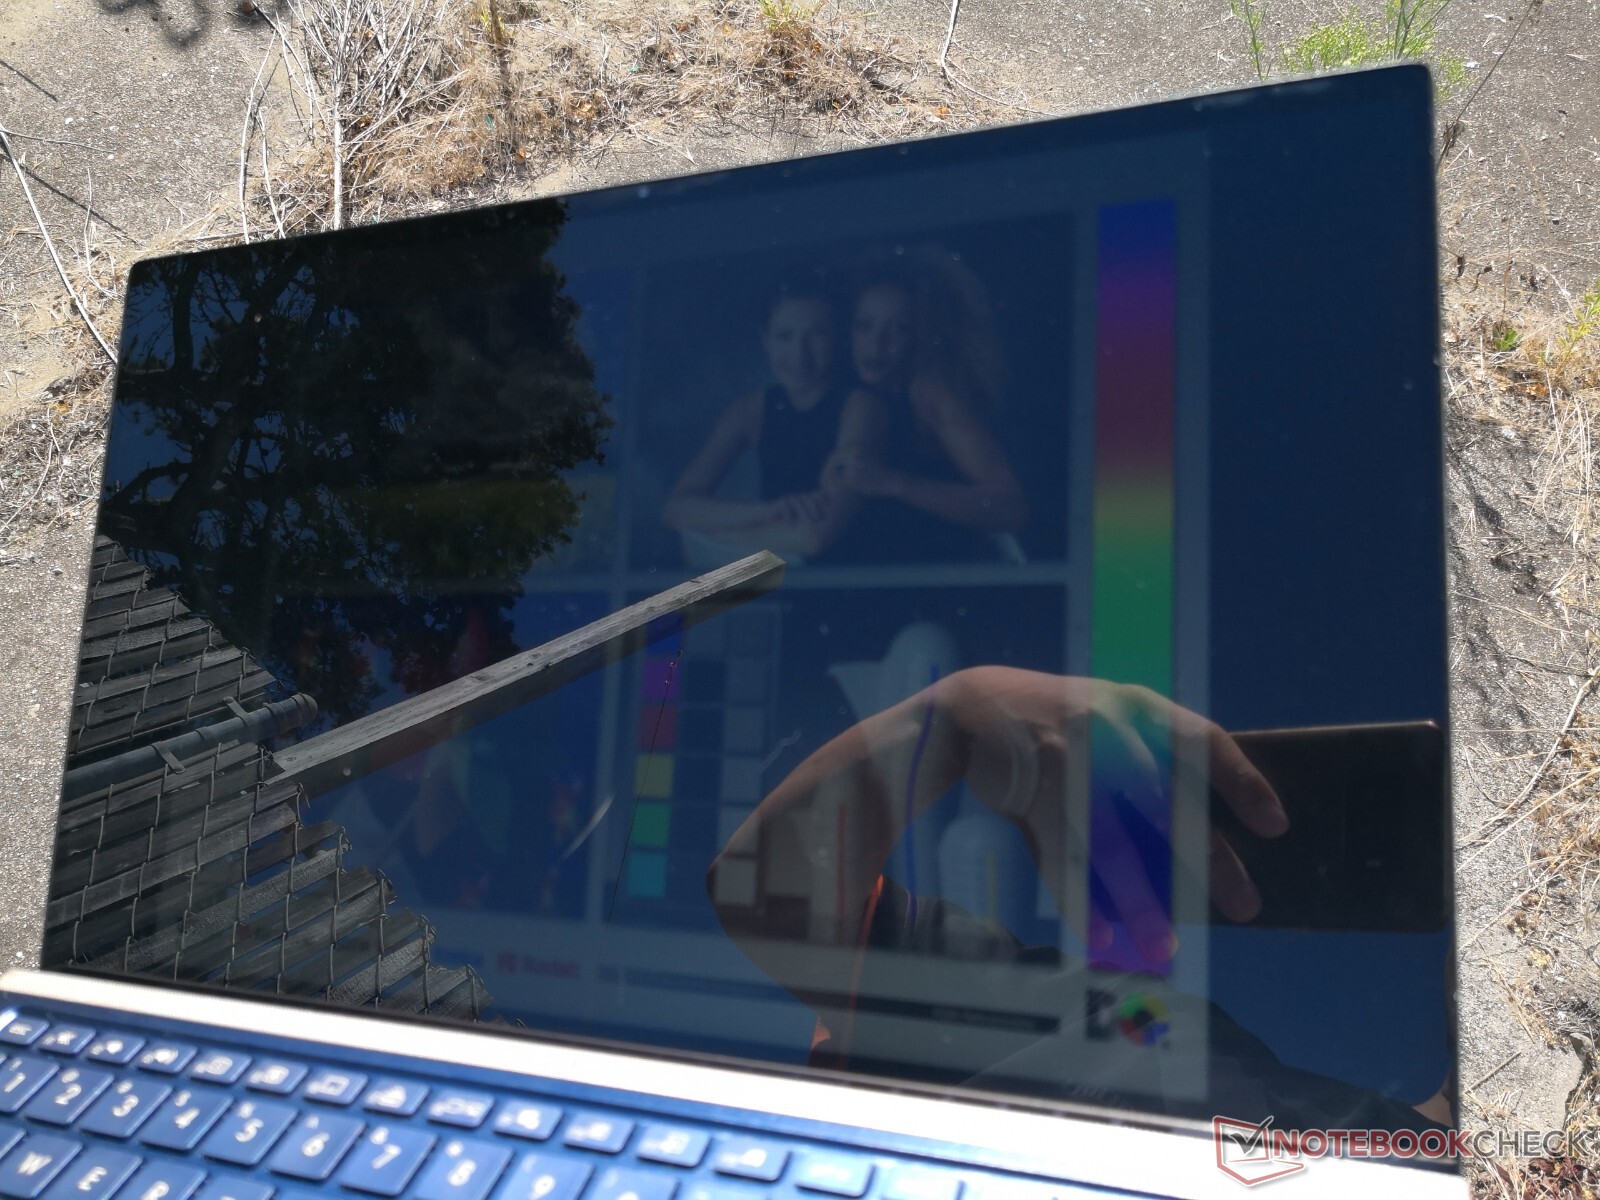
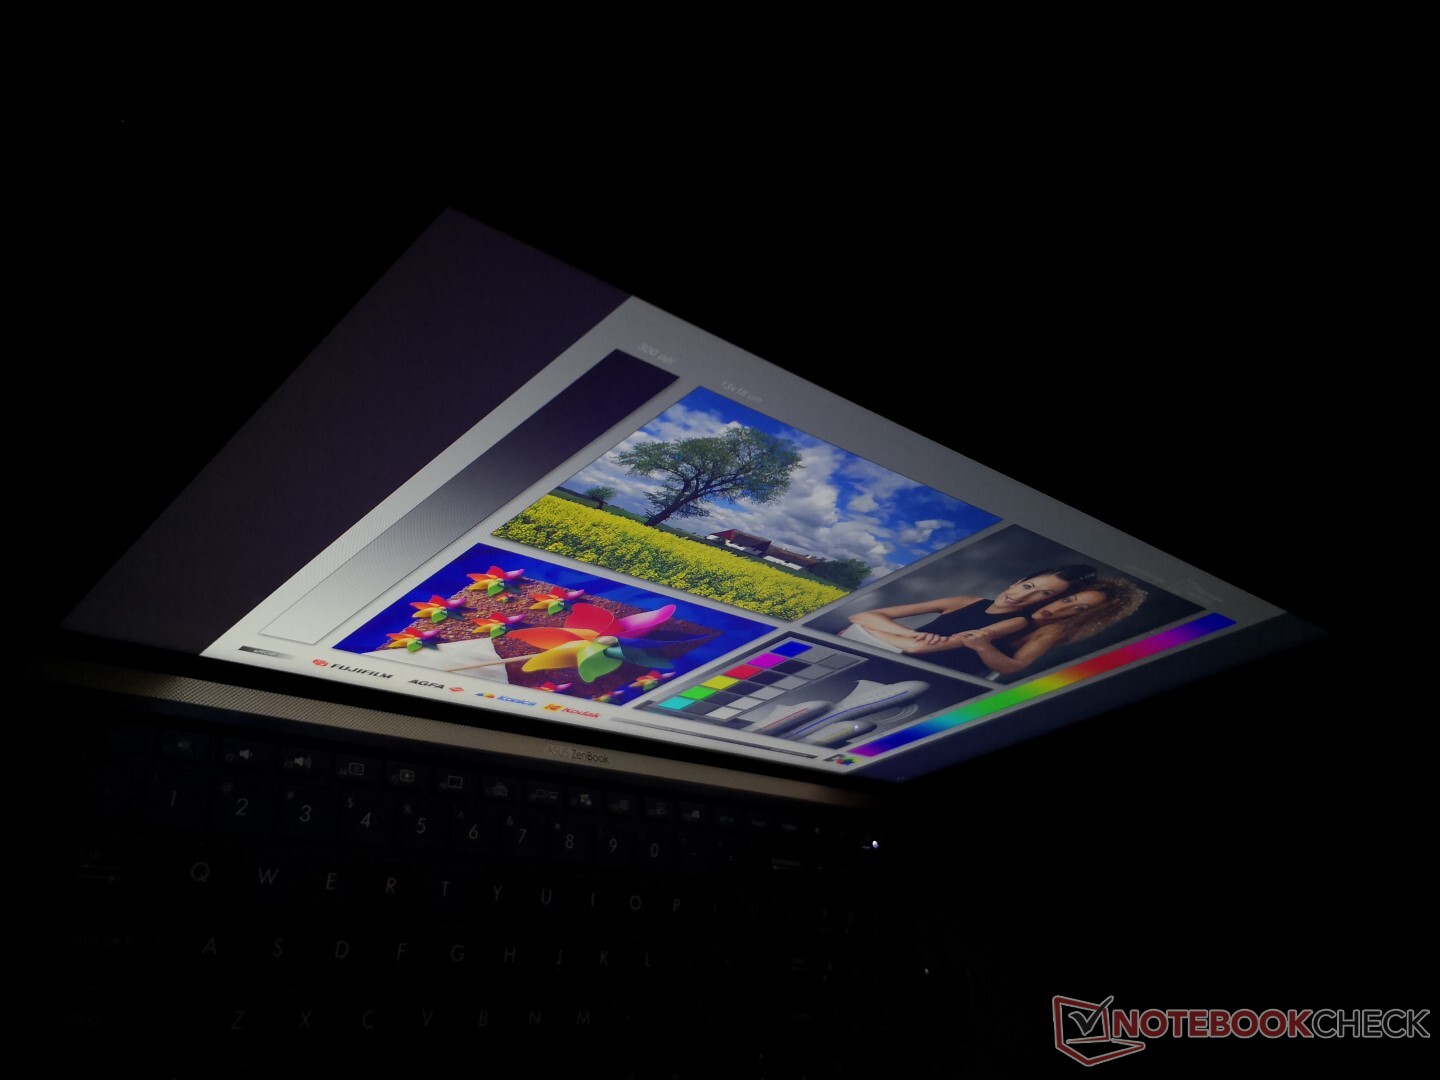
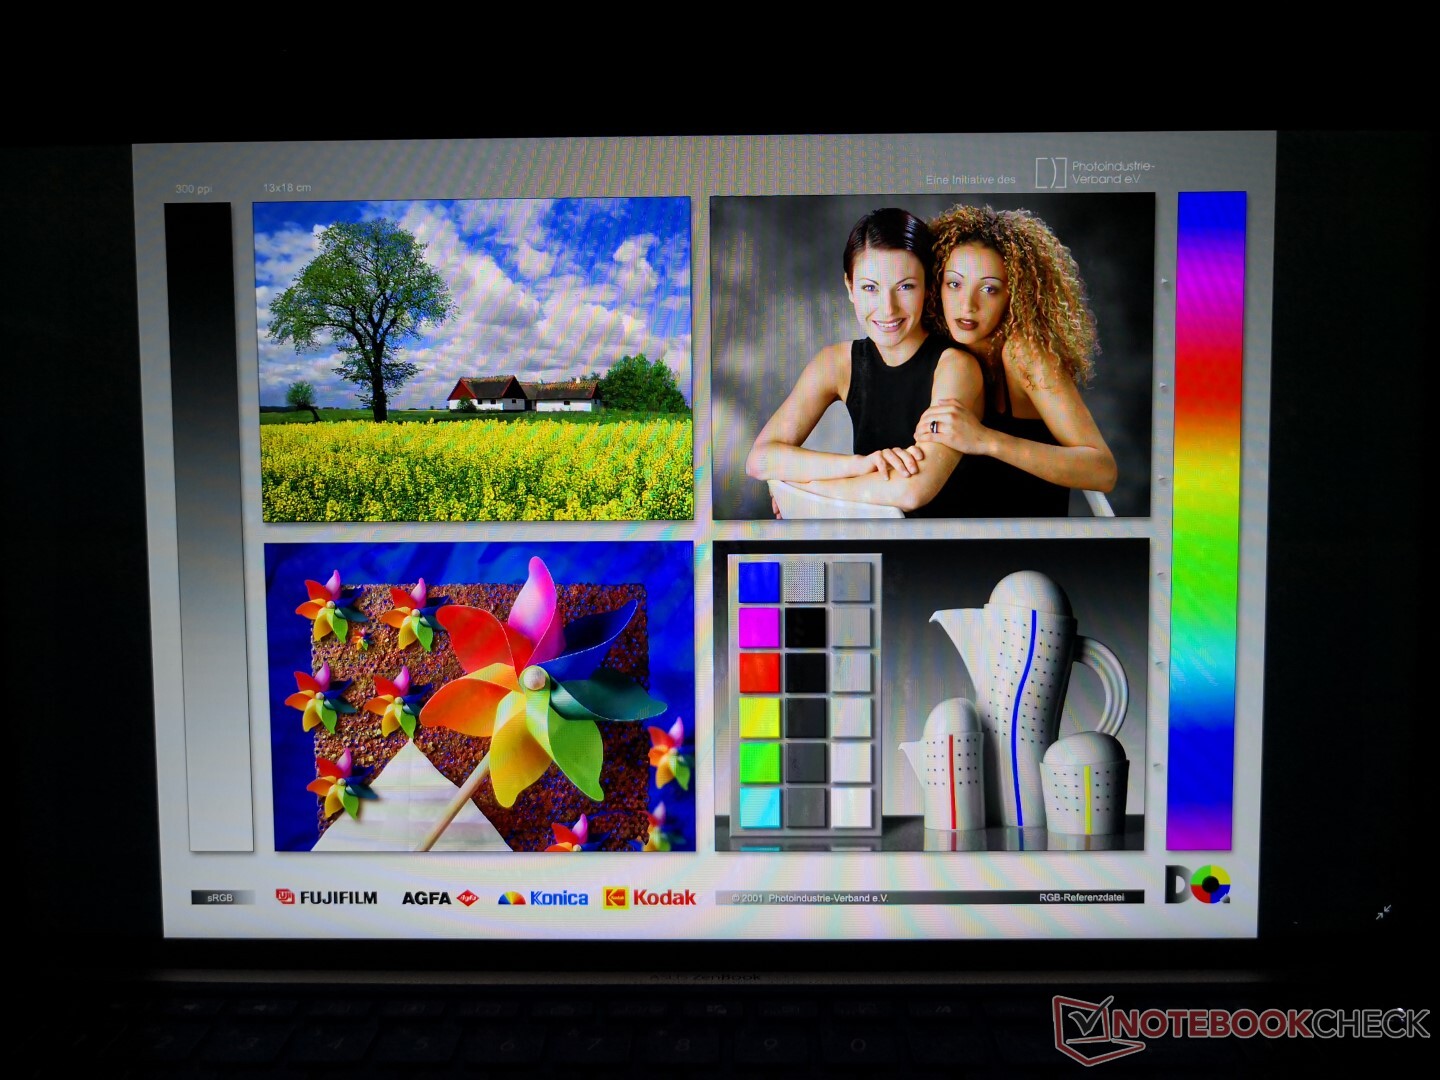
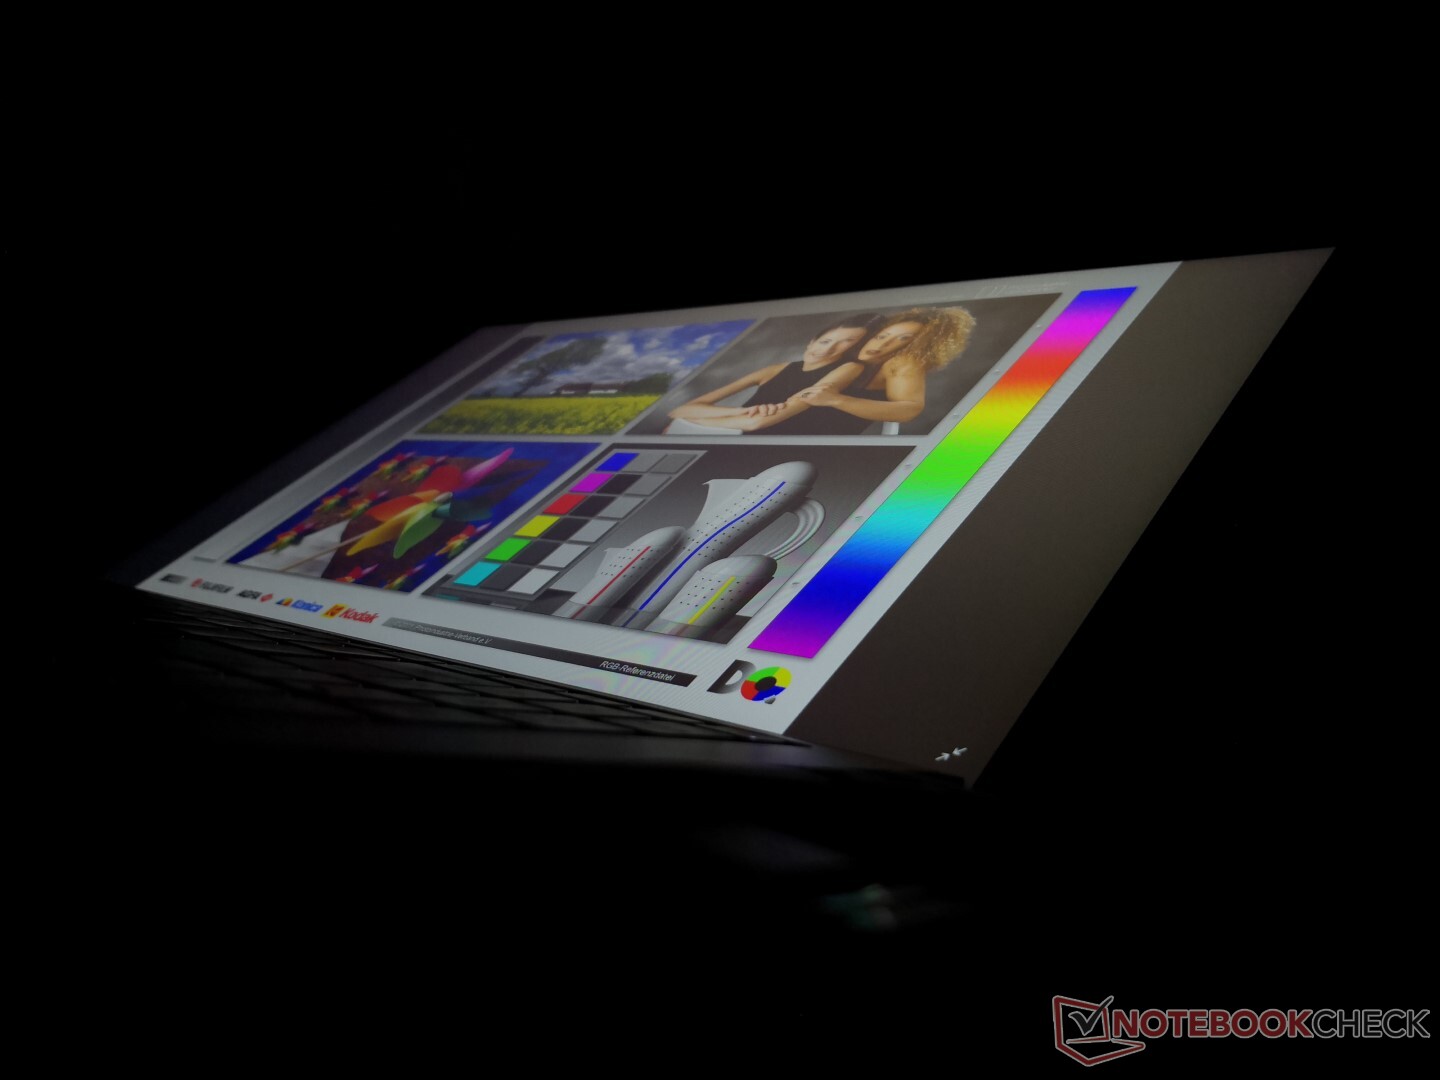
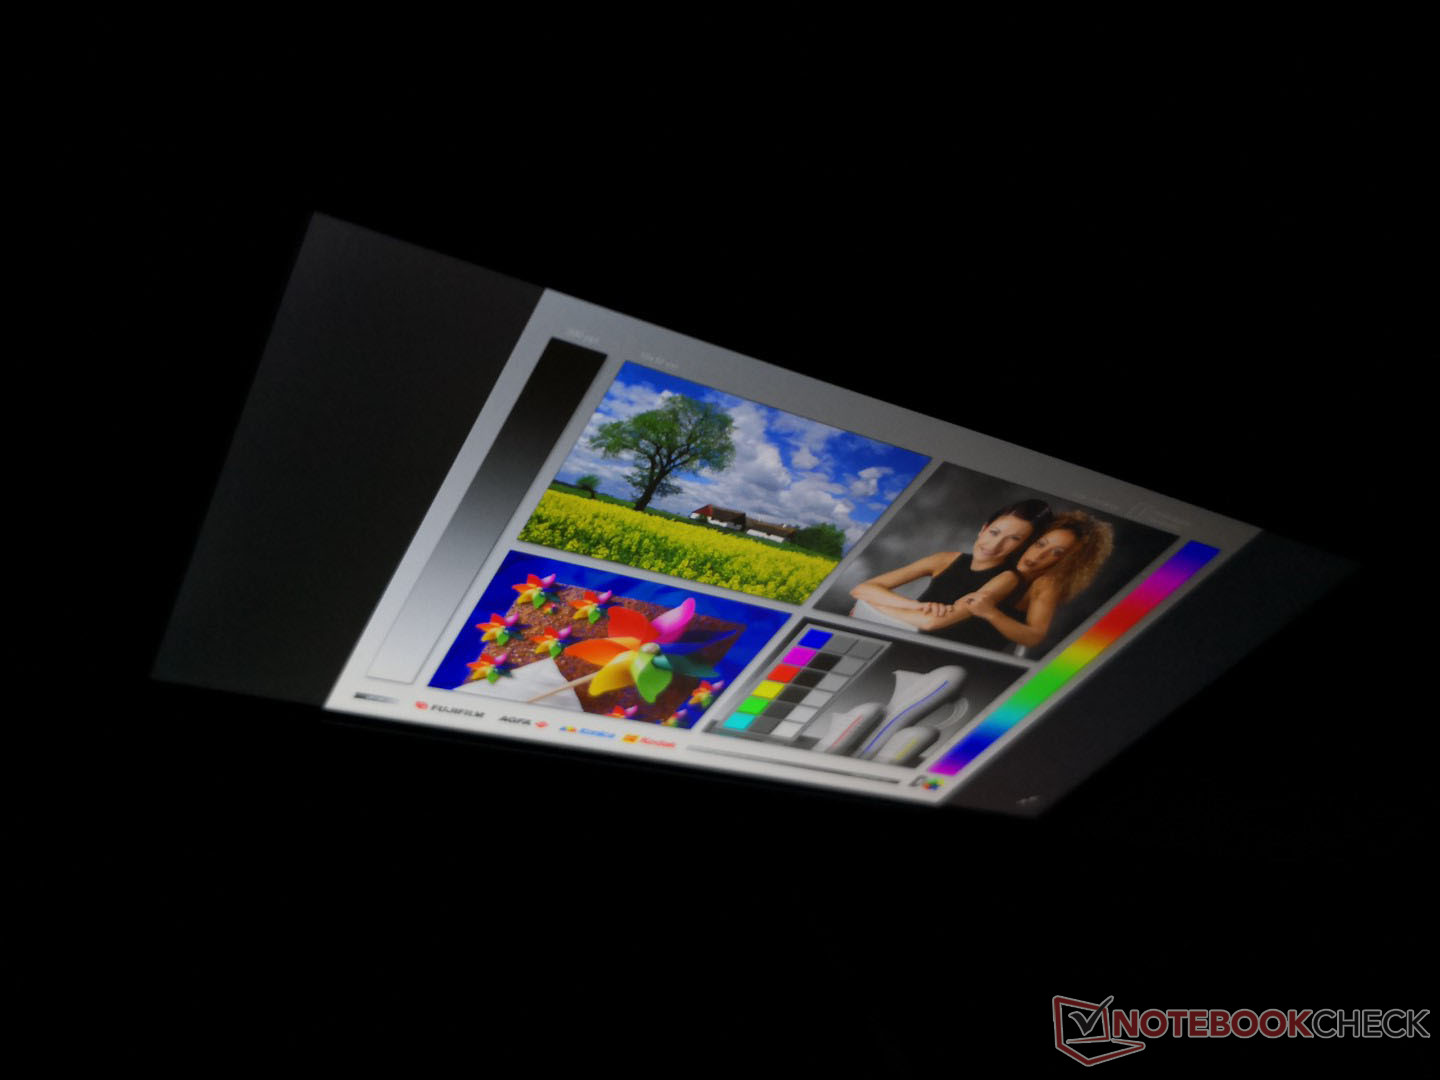
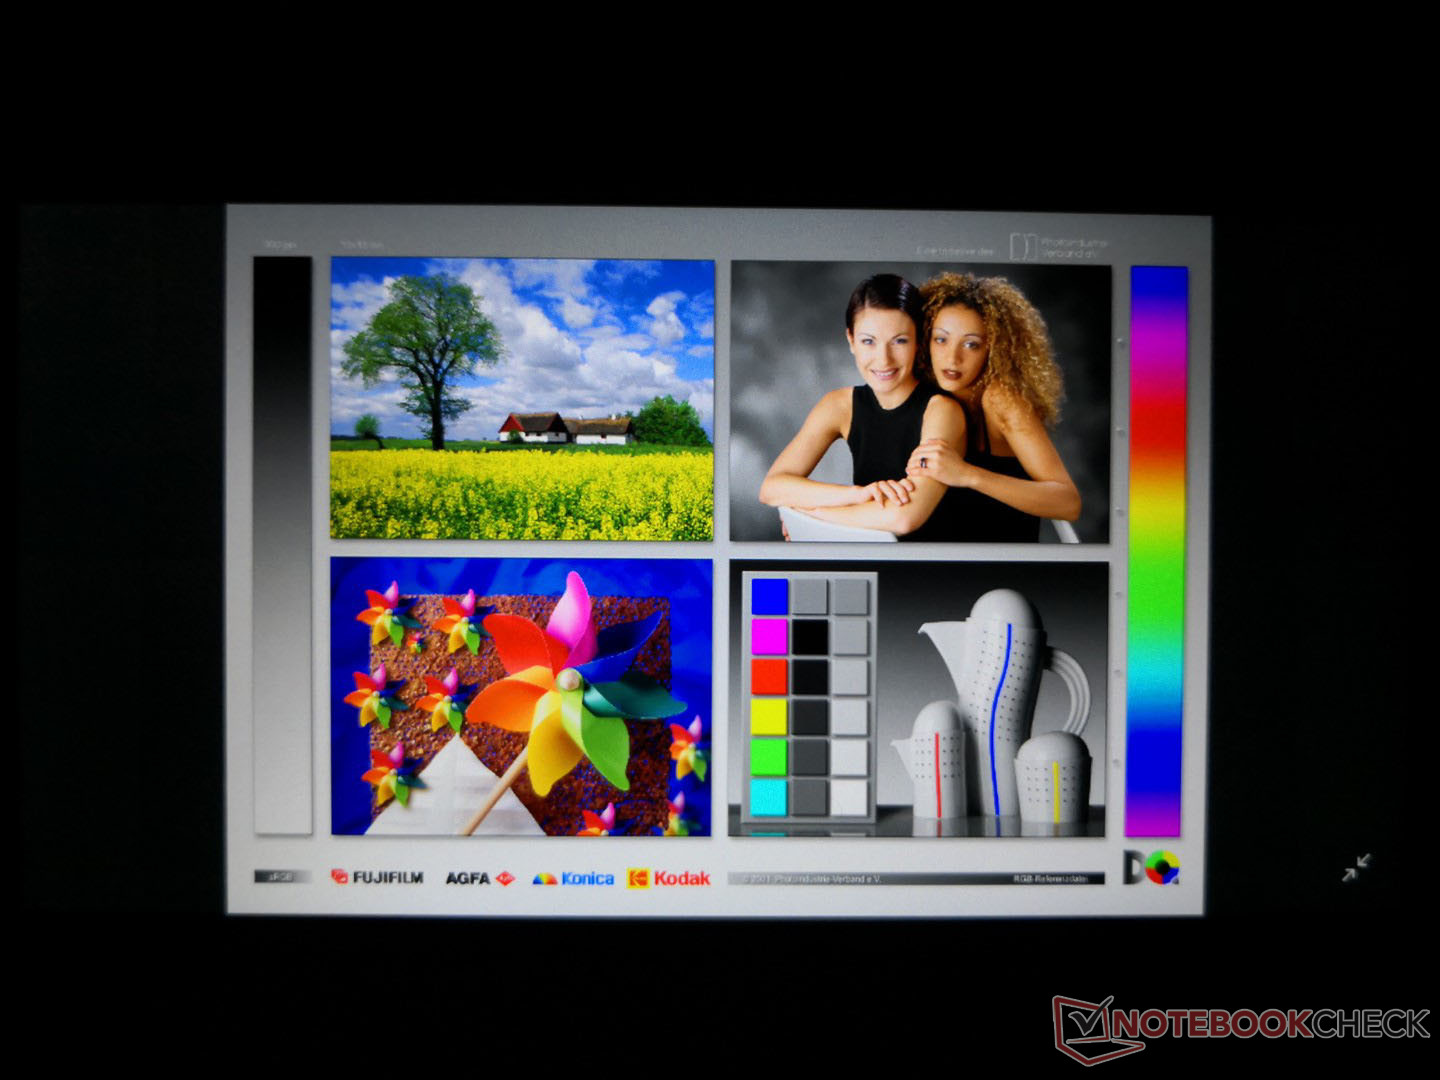
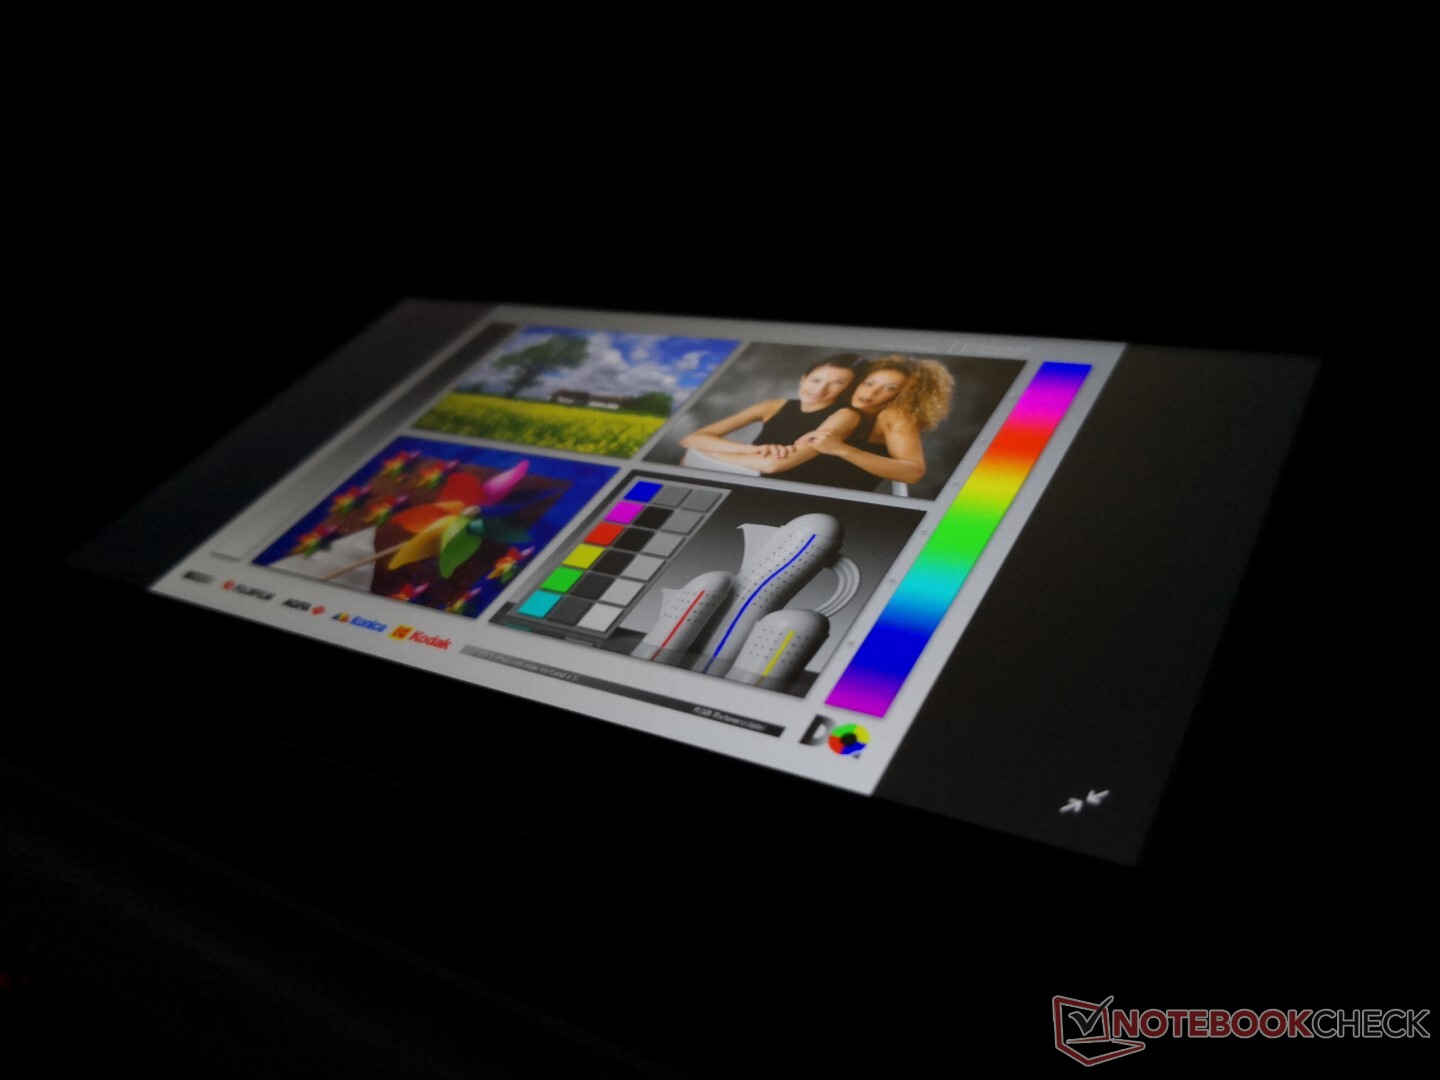
Display - Narrow Bezels on all Four Sides
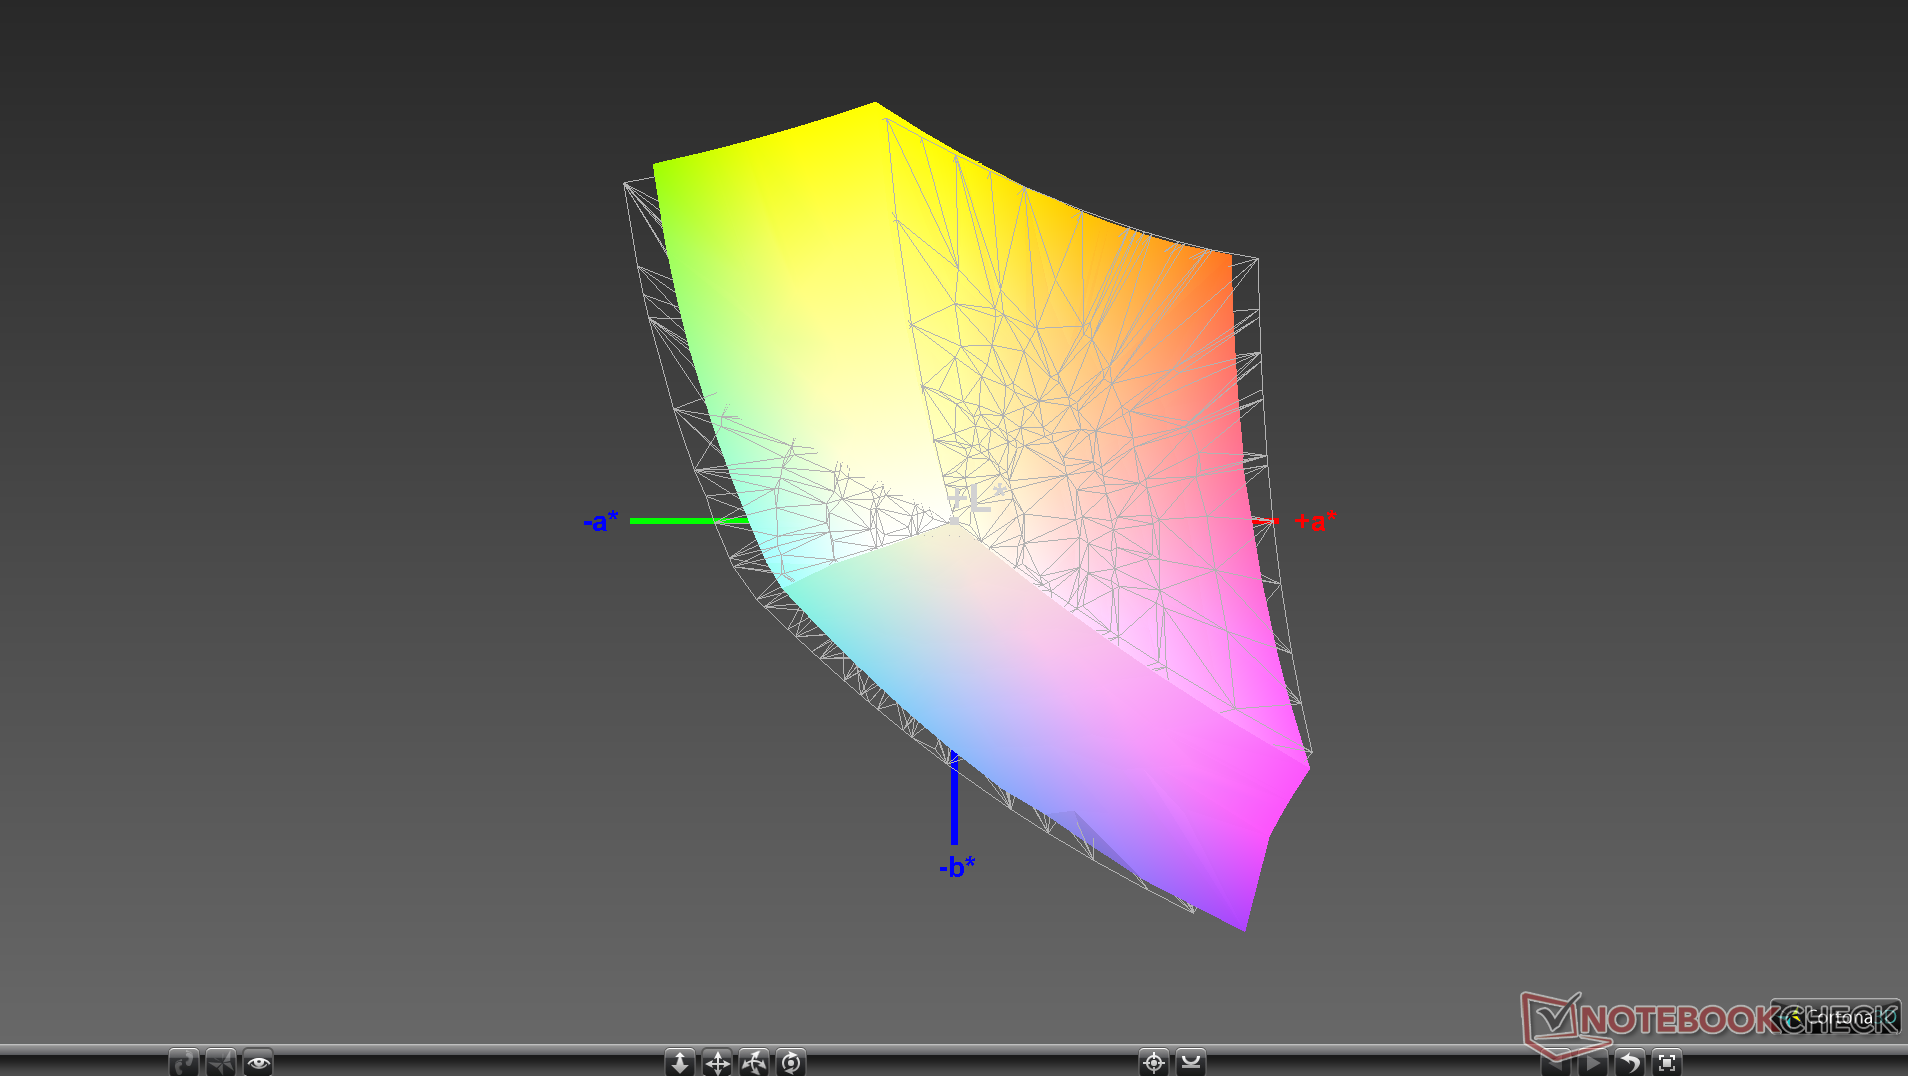
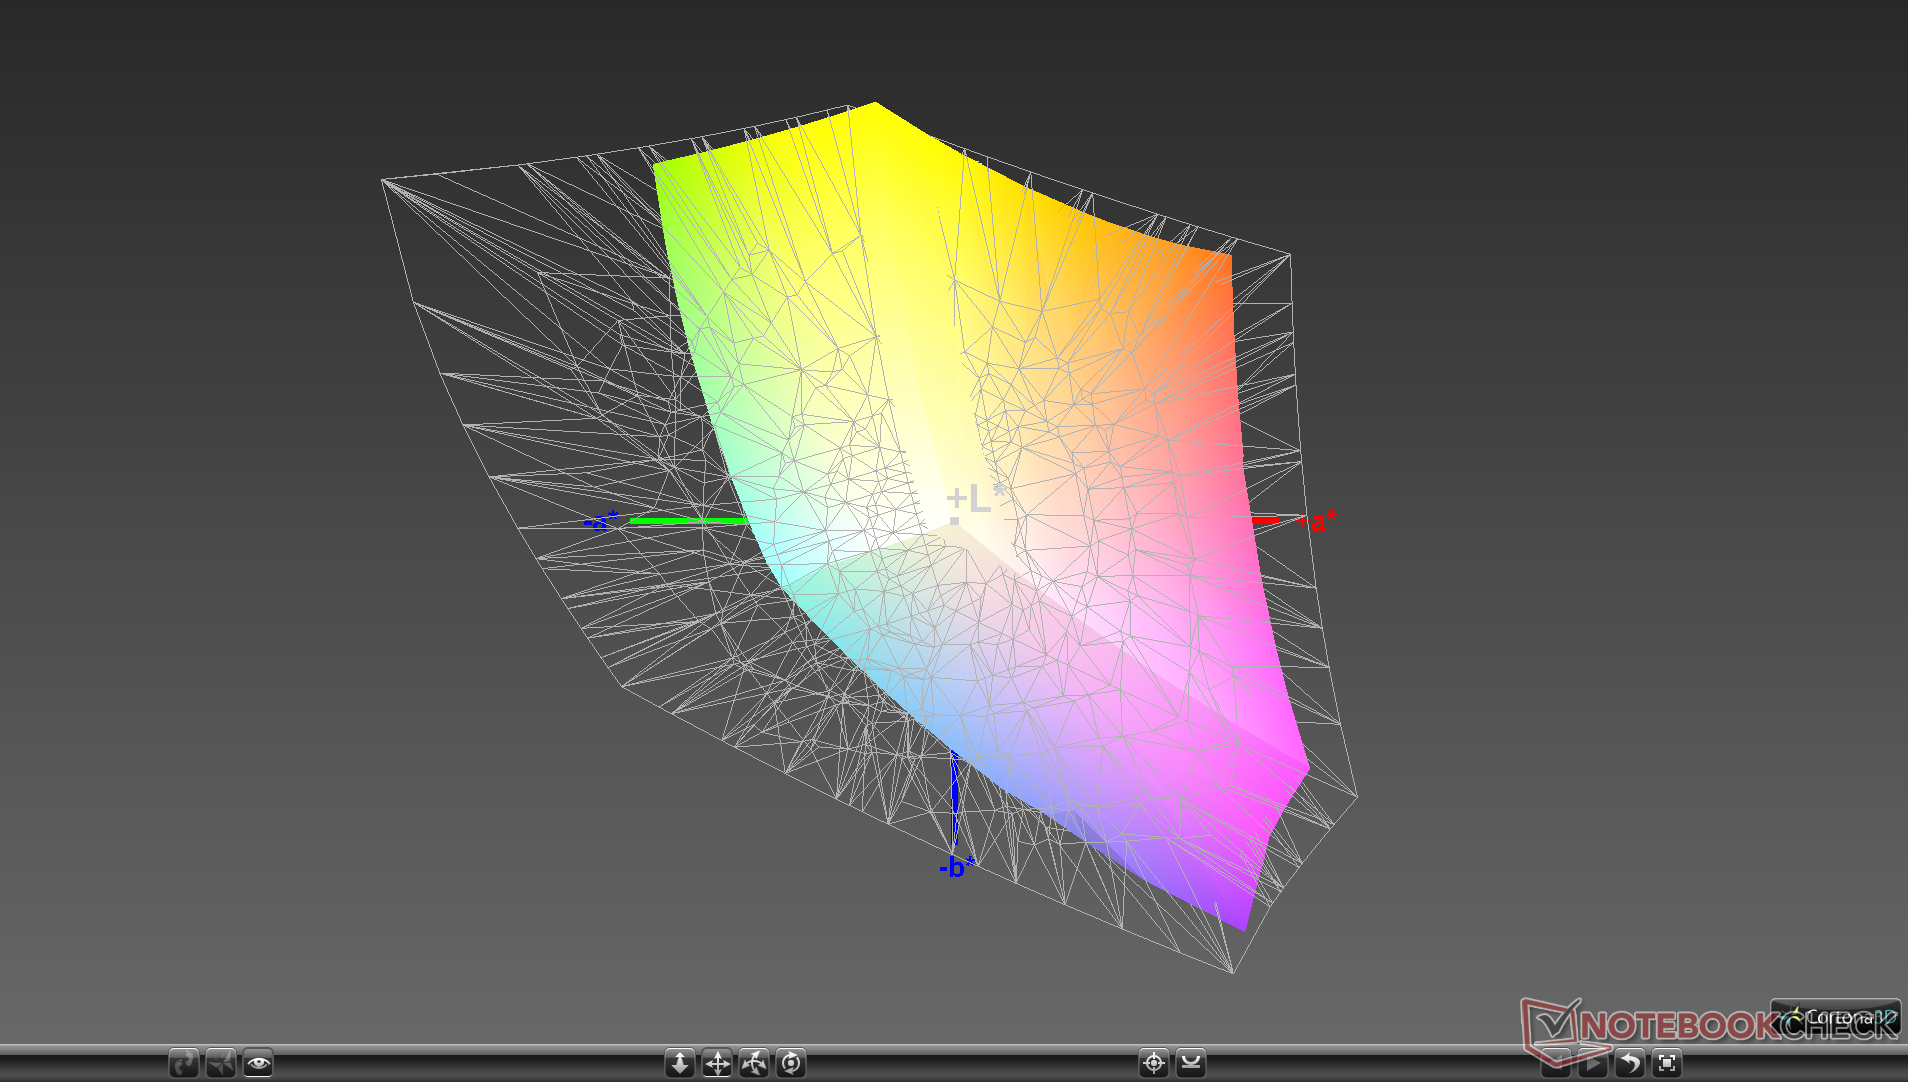
The ZenBook 15 UX534 utilizes the same BOE NV156FHM-N63 IPS panel and BOE07D8 controller as on the ZenBook 15 UX533. Thus, both models share similar response times, brightness levels, contrast ratios, and color spaces. Images appear sharp on the glossy screen even if response times are not as smooth as the 120 Hz or 144 Hz panels on Asus' ROG laptops. Users who want even deeper colors should consider the ZenBook Pro 15 or ZenBook Pro Duo which promise full AdobeRGB coverage.
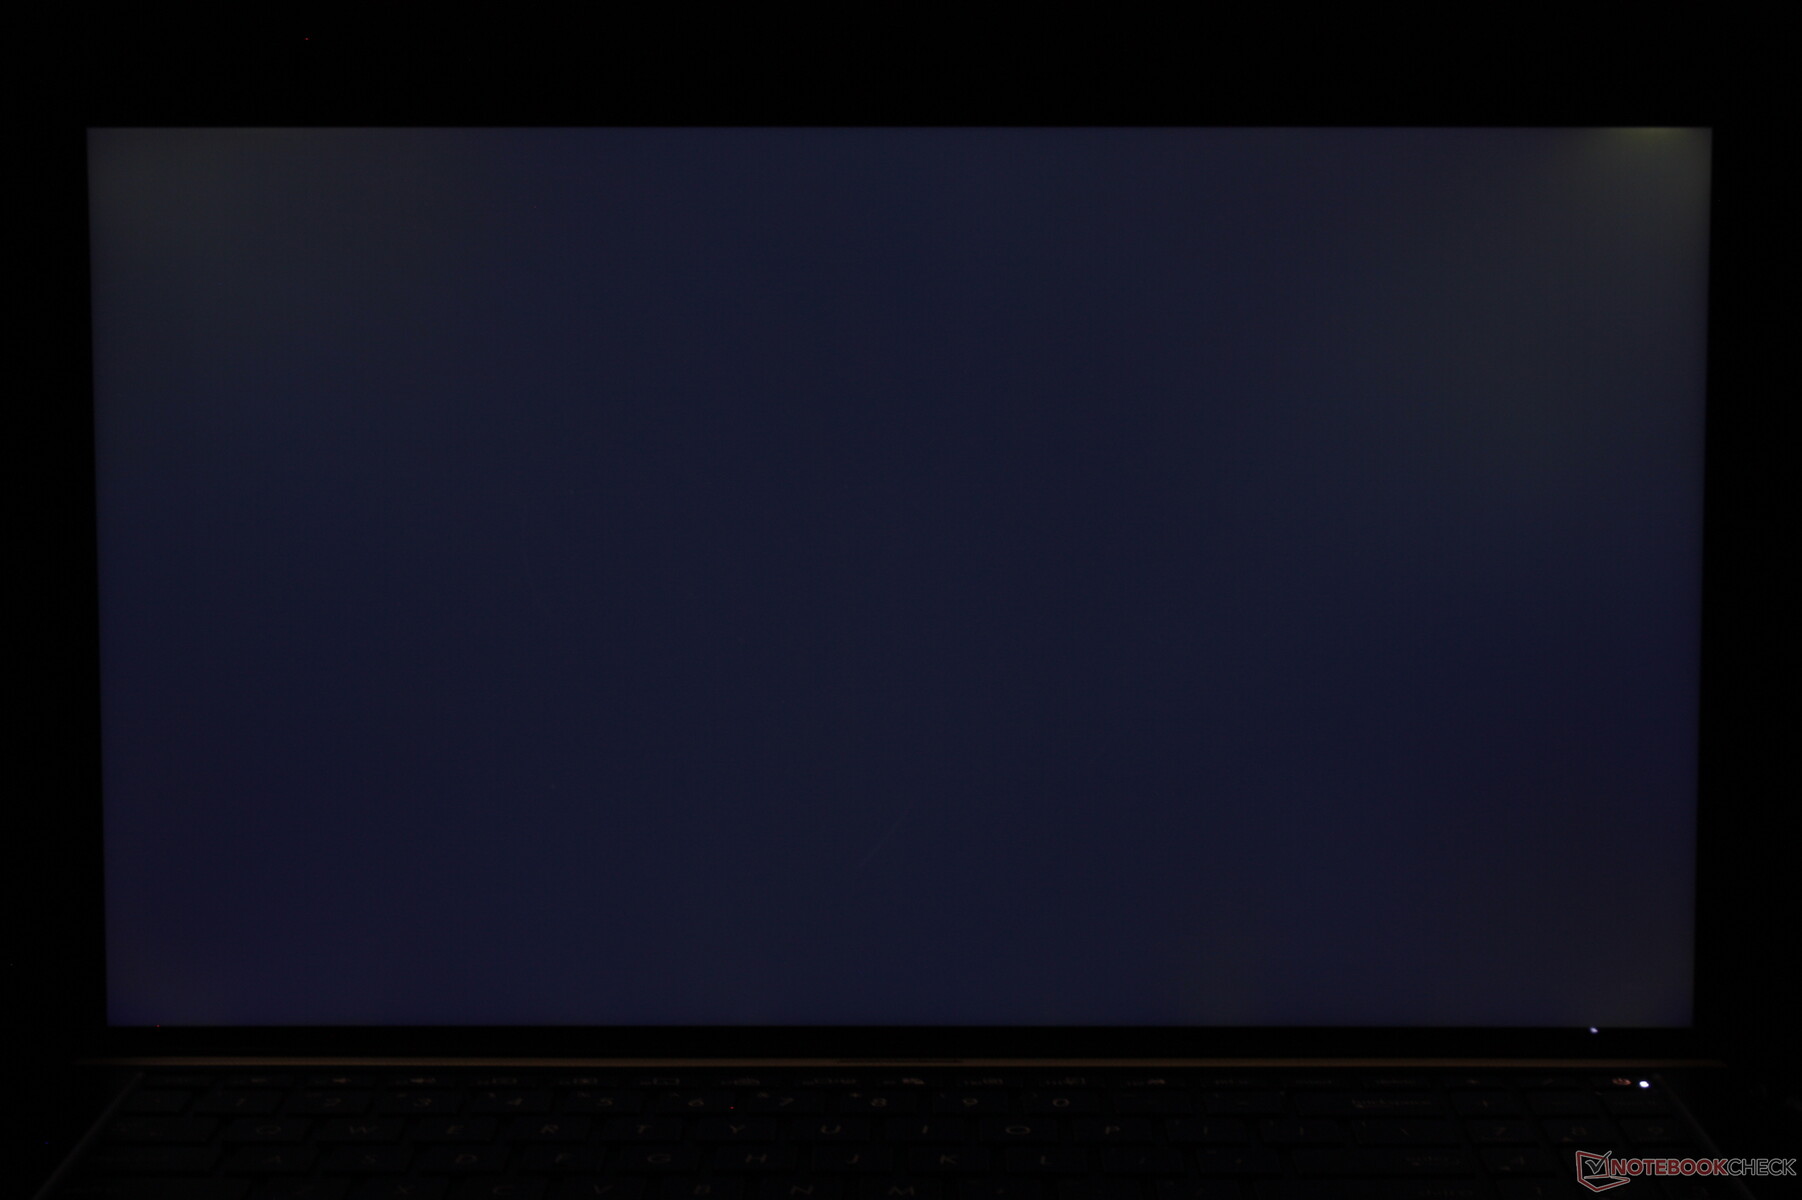
Our test unit suffers from light-moderate uneven backlight bleeding along the top corners of the screen as shown by the image below. It's noticeable during video playback with black borders, but it's thankfully not severe enough to be distracting.

| |||||||||||||||||||||||||
Brightness Distribution: 85 %
Center on Battery: 312.6 cd/m²
Contrast: 1008:1 (Black: 0.31 cd/m²)
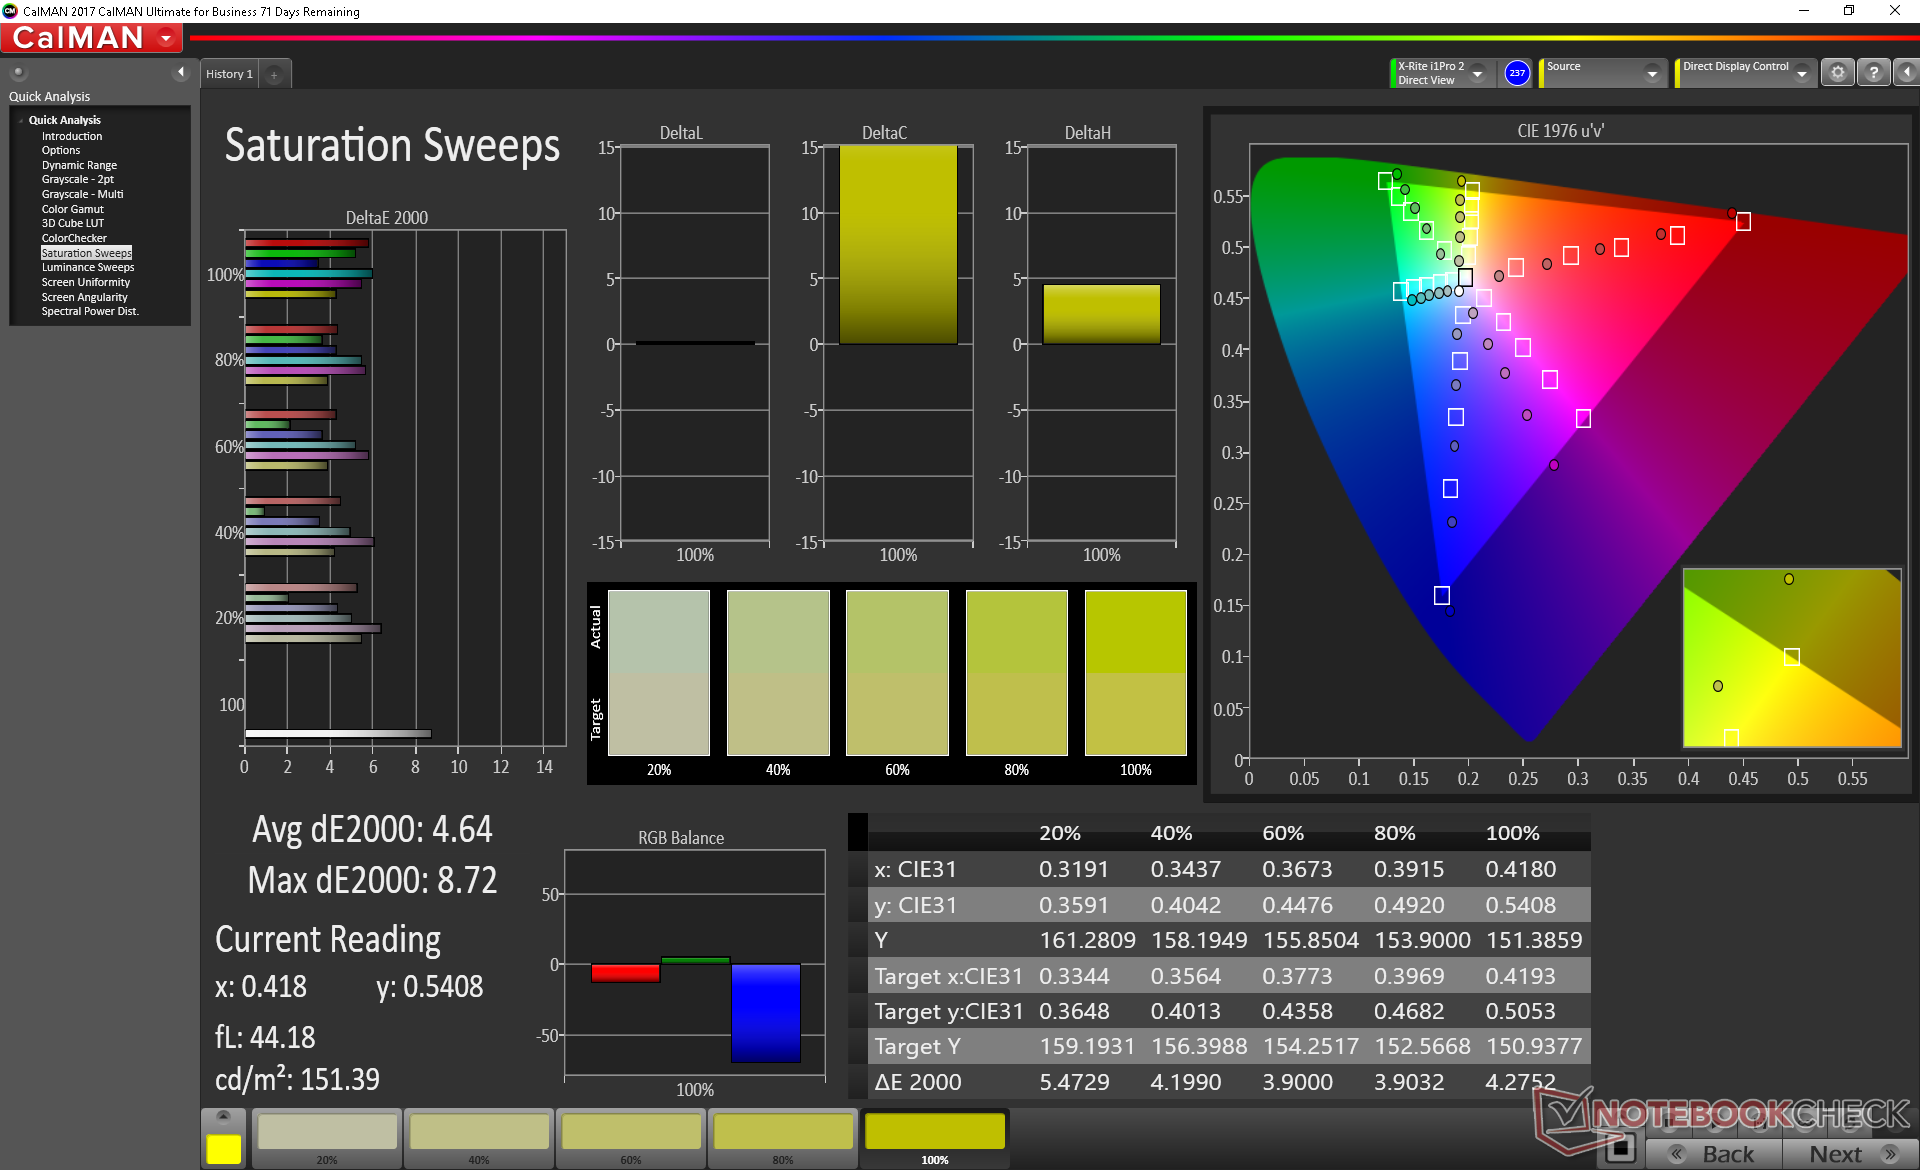
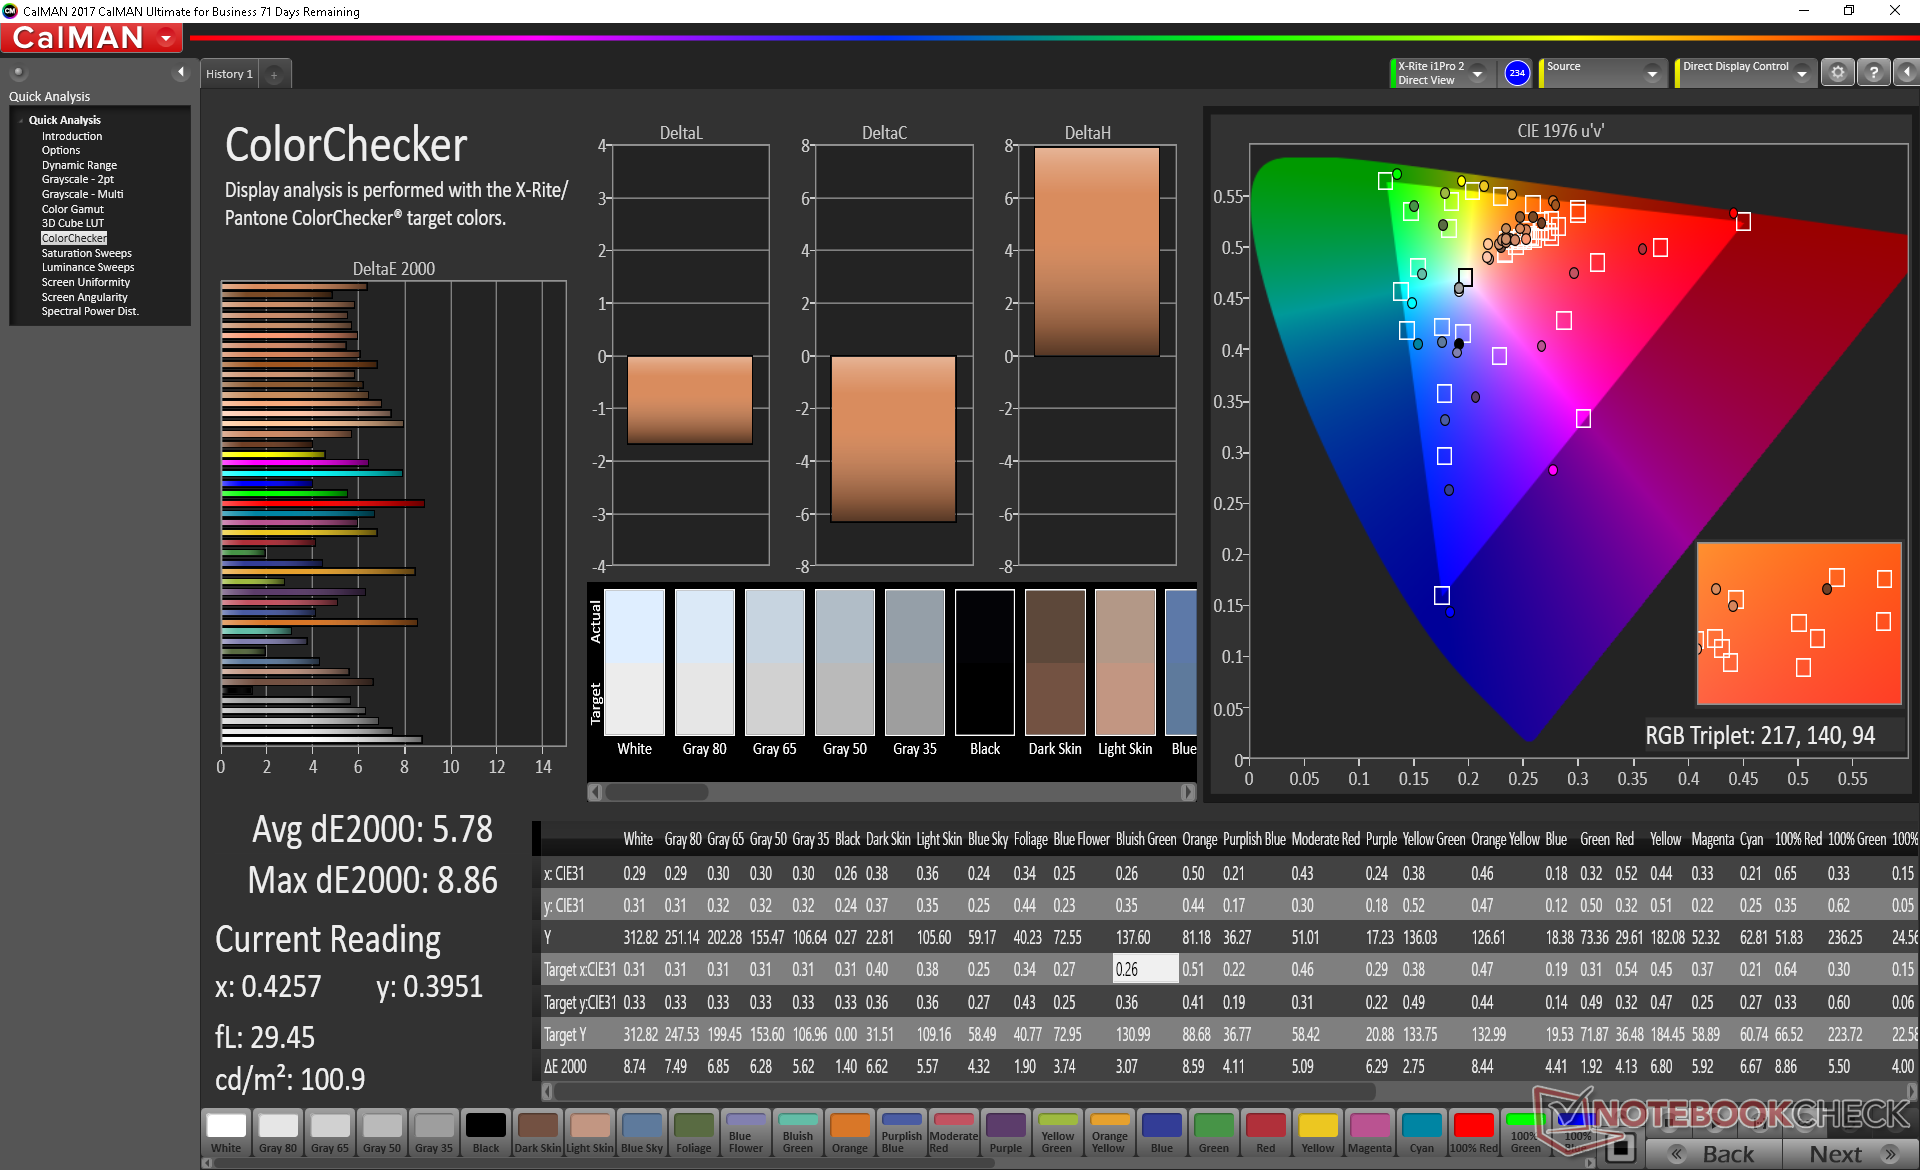
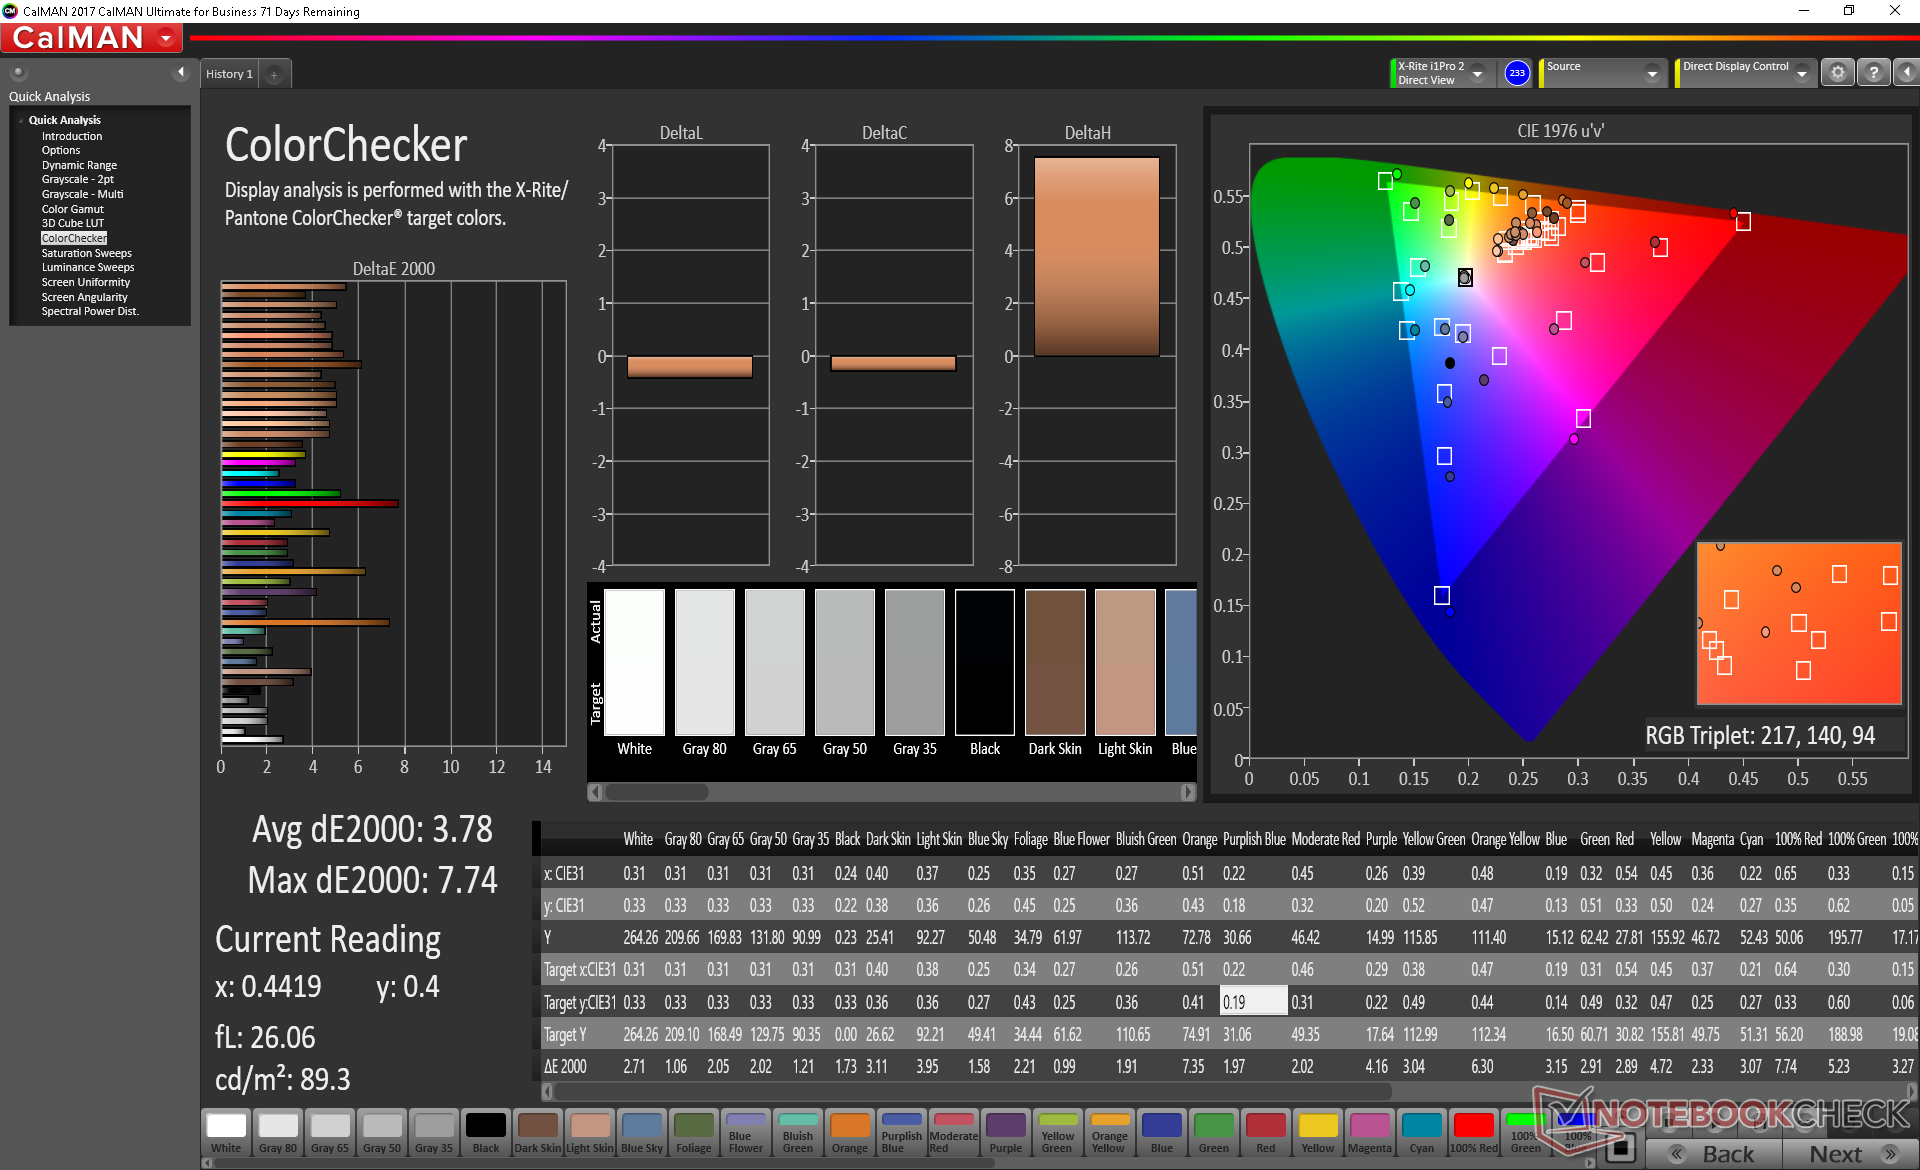
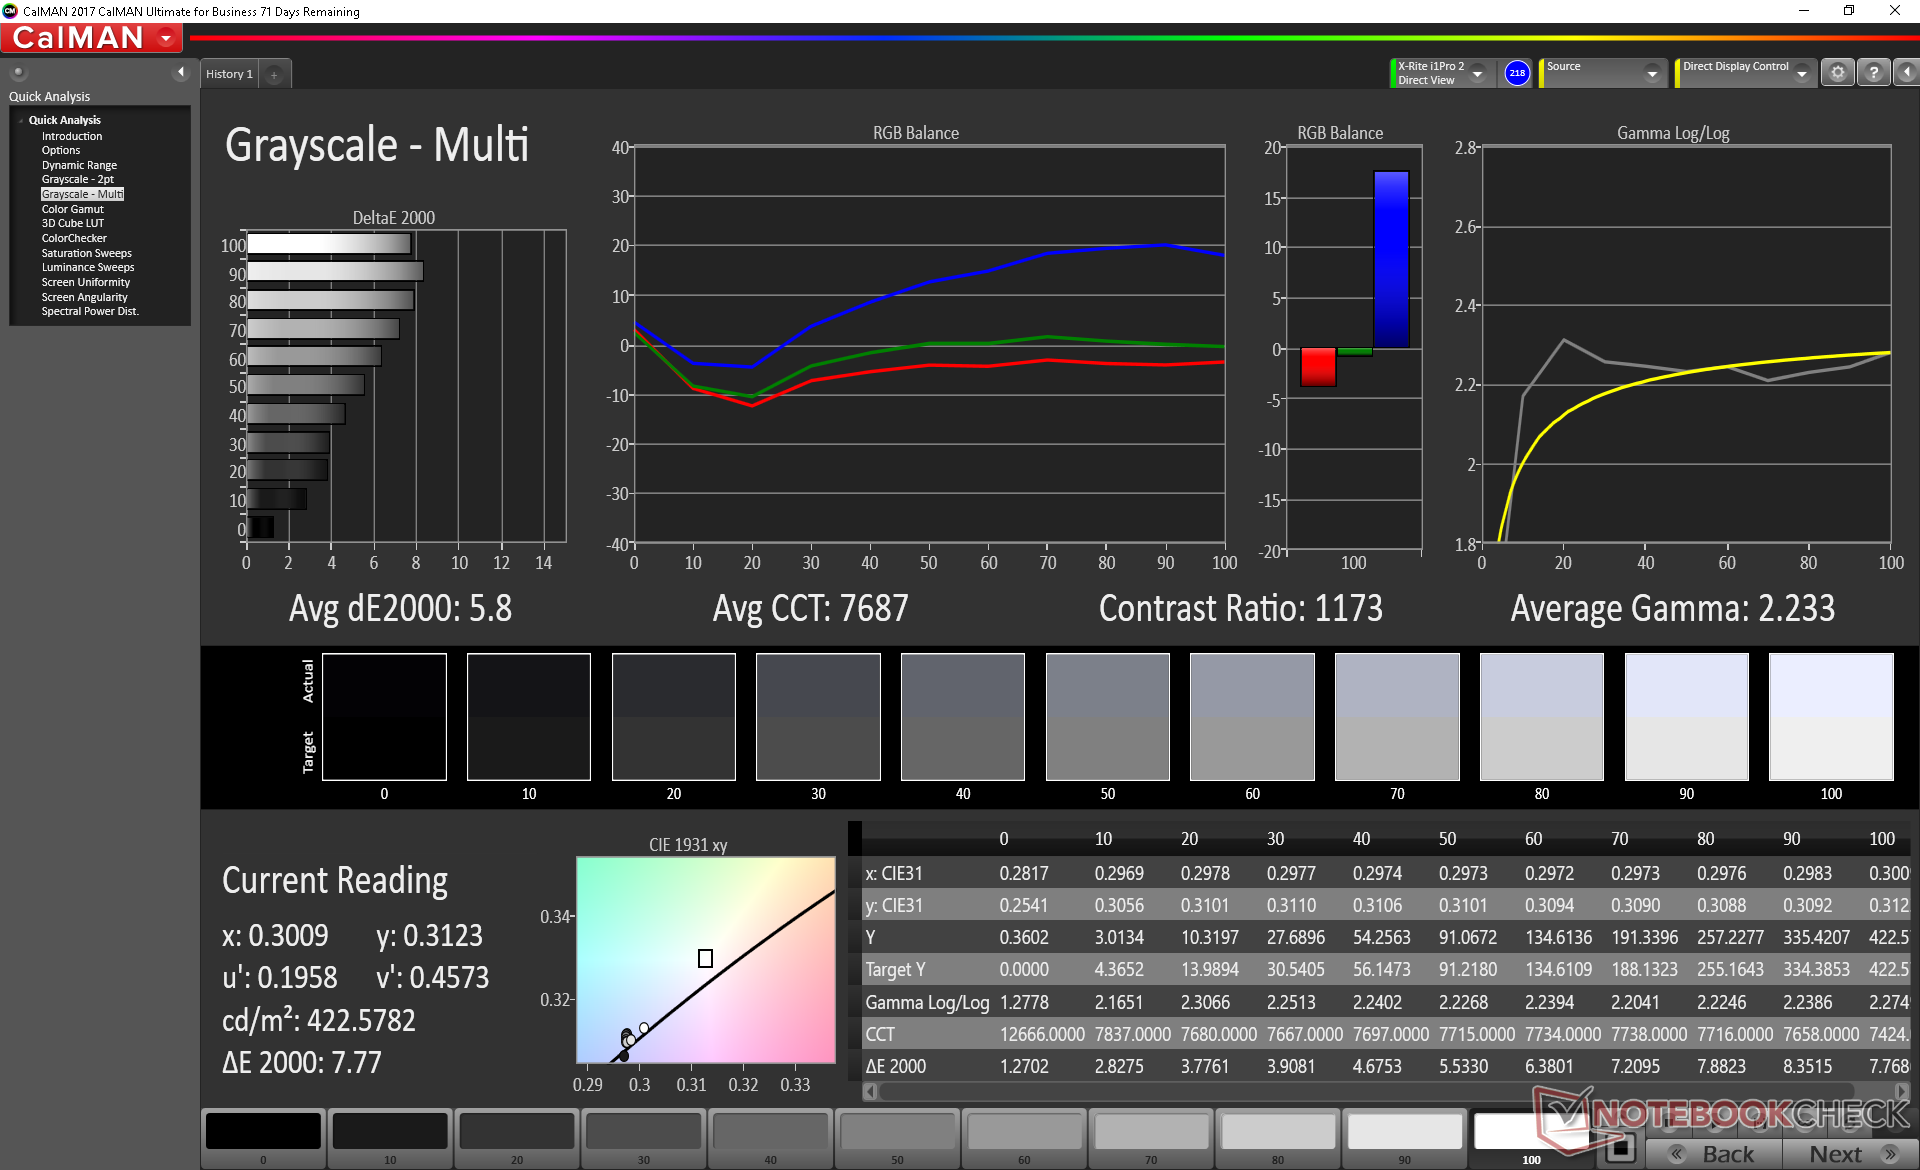
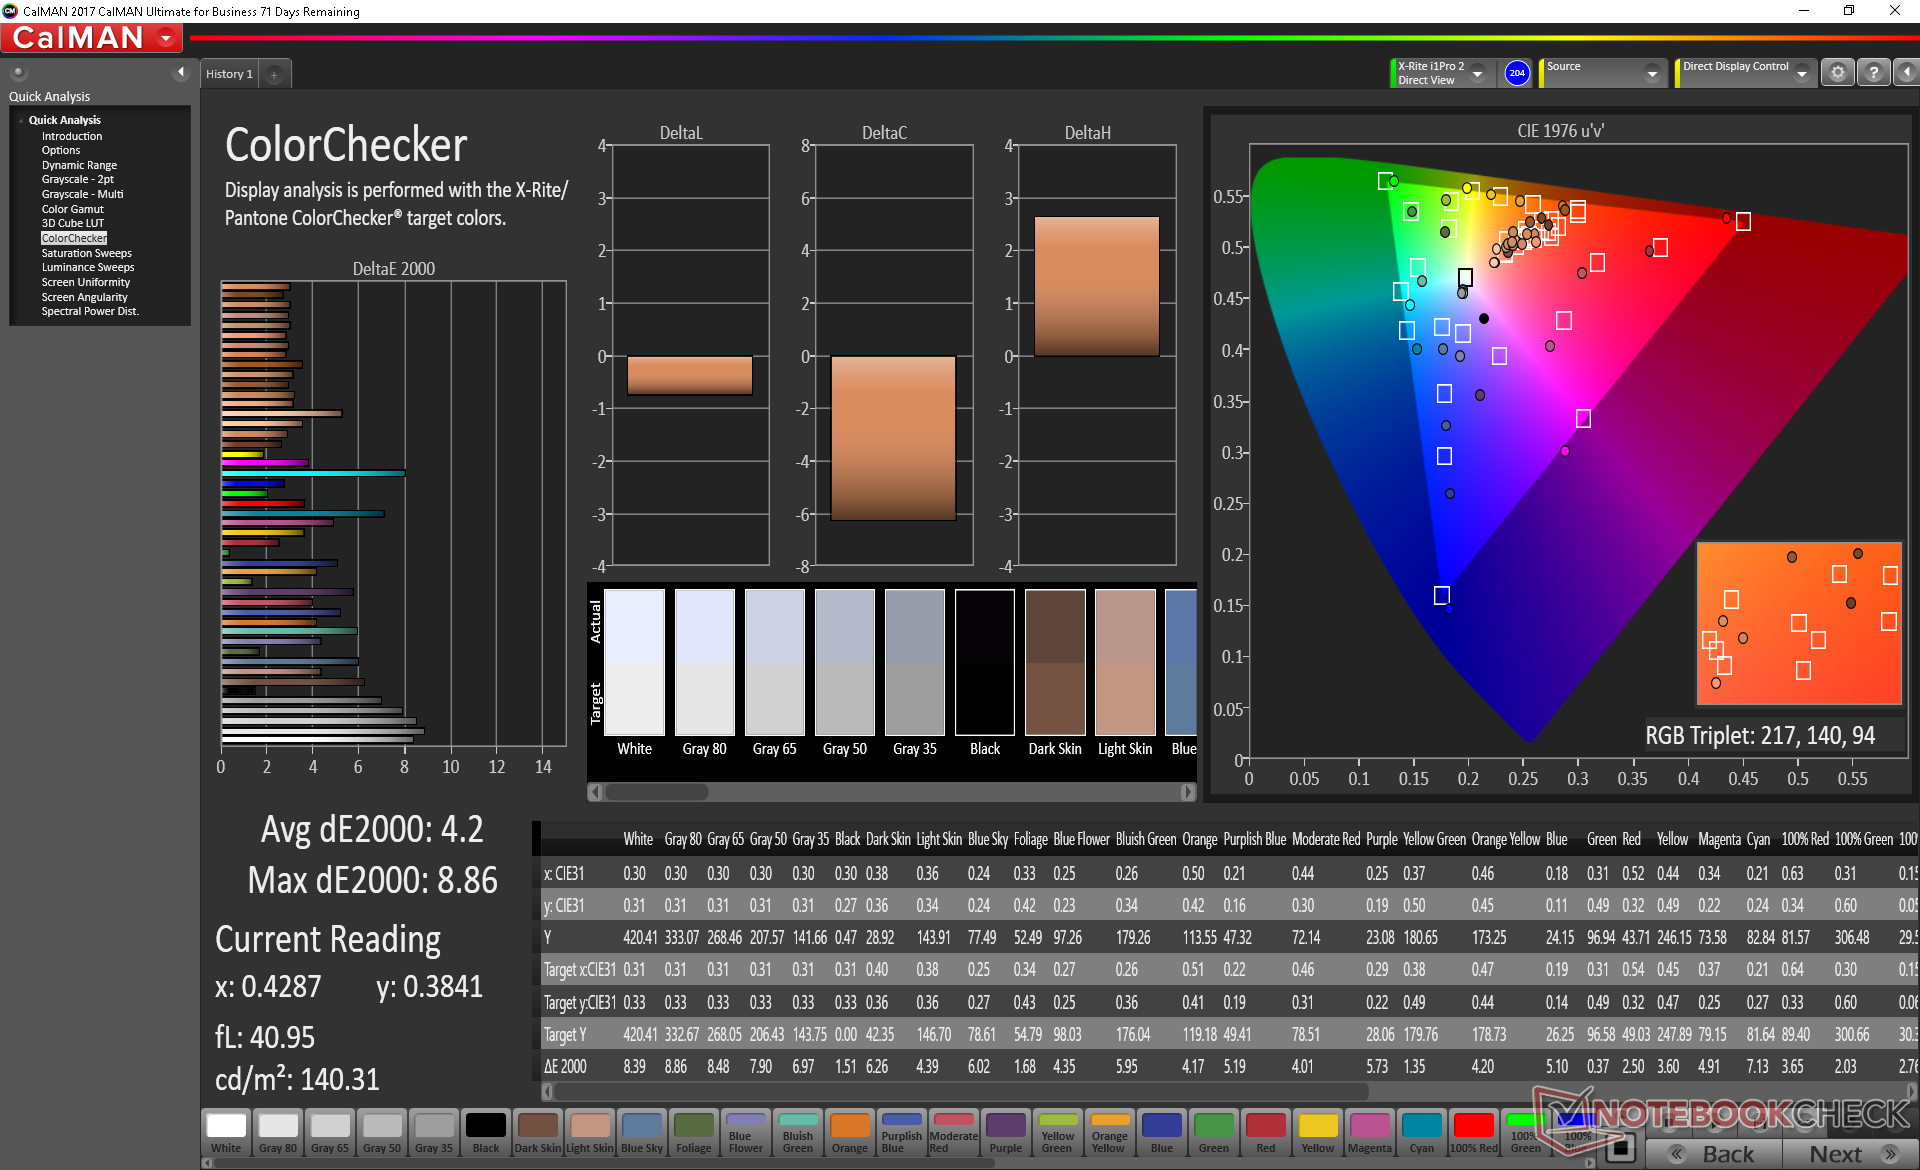
ΔE ColorChecker Calman: 5.78 | ∀{0.5-29.43 Ø4.72}
calibrated: 3.78
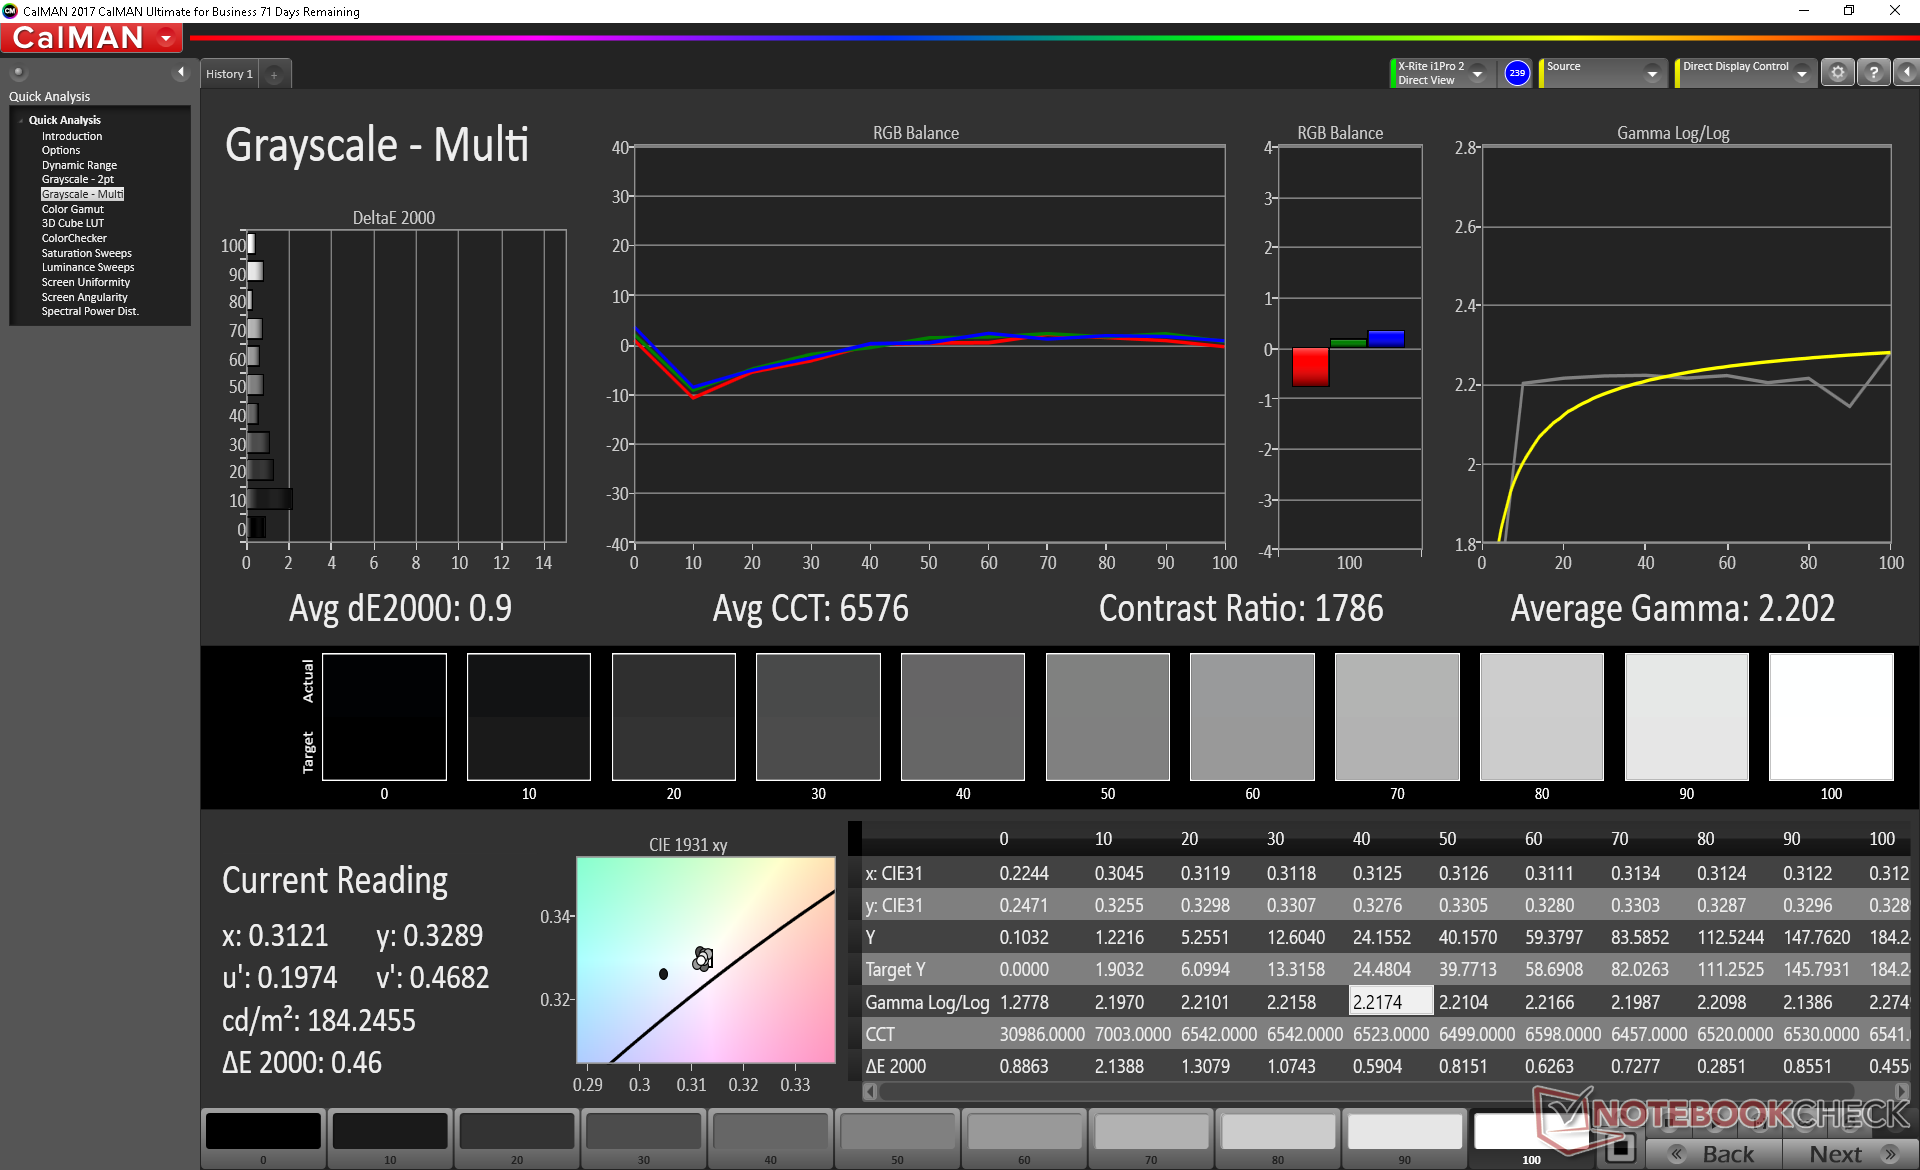
ΔE Greyscale Calman: 5.4 | ∀{0.09-98 Ø4.97}
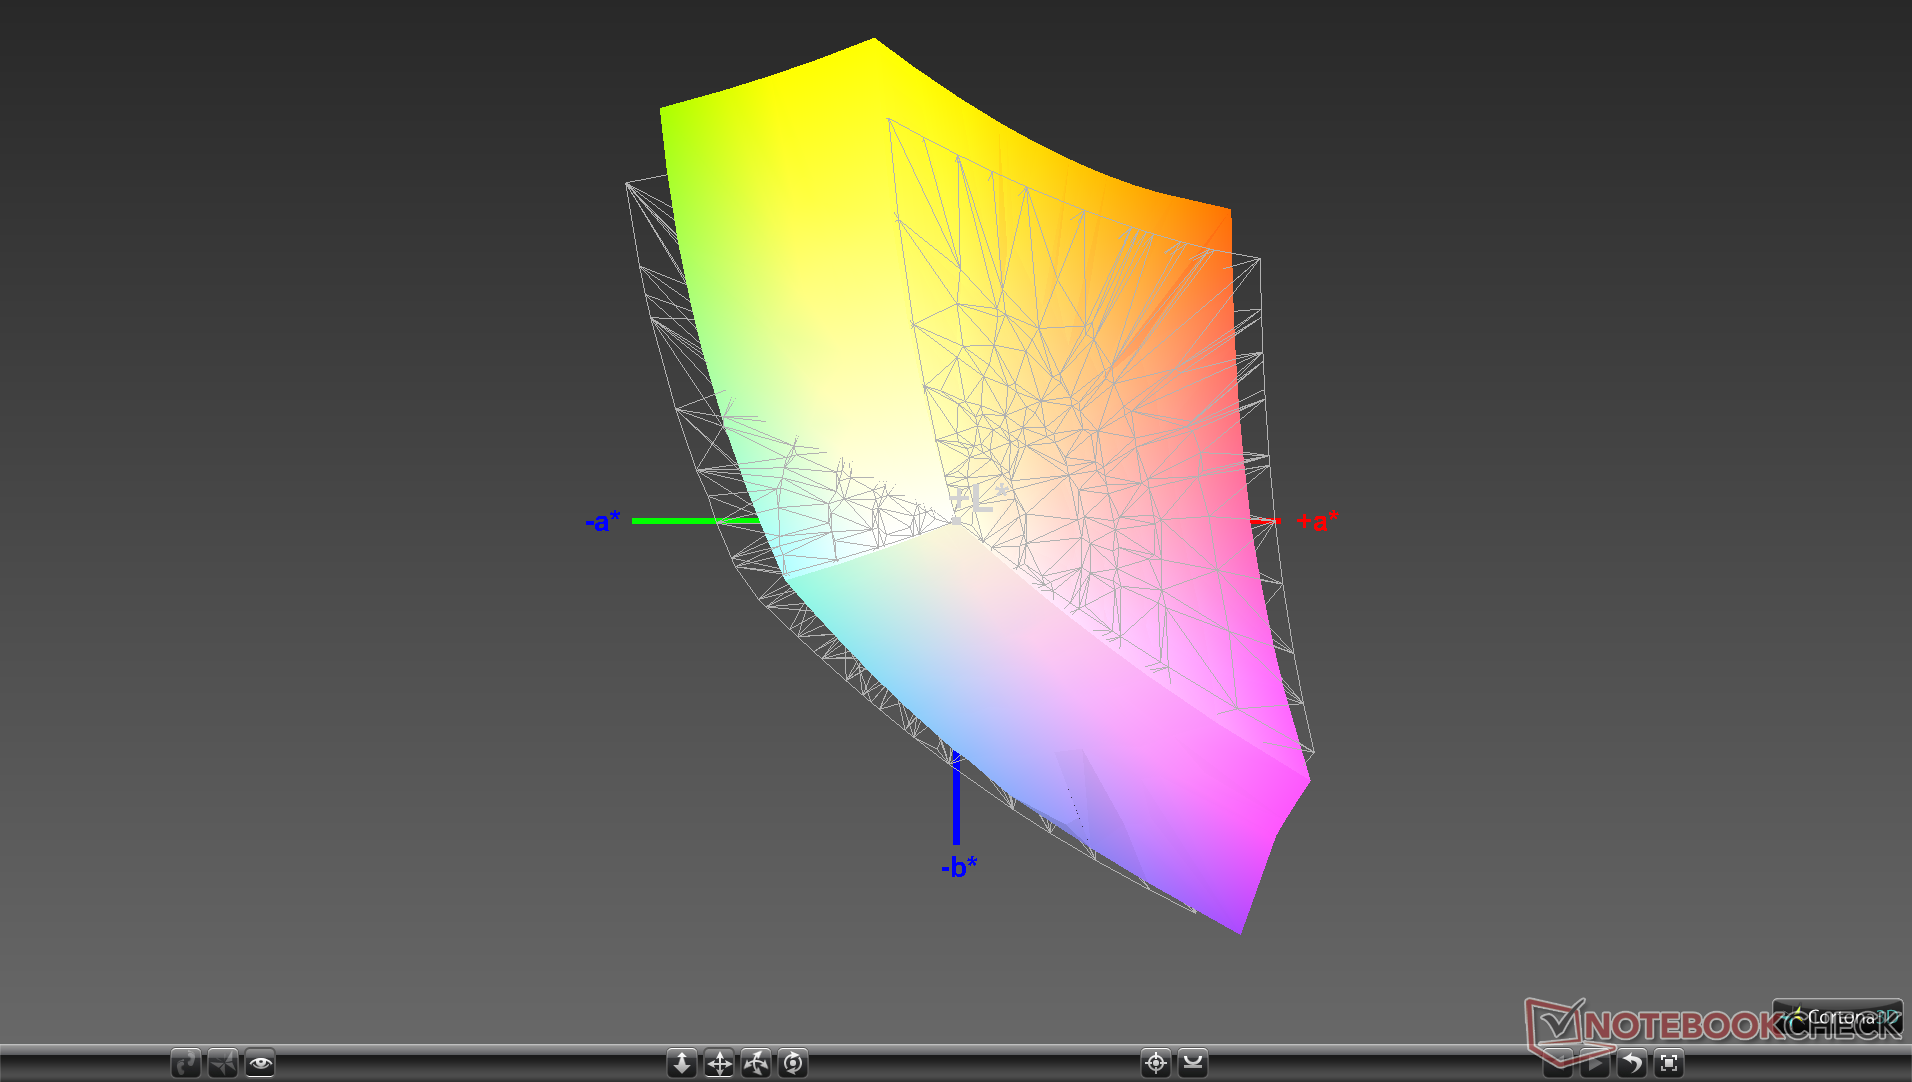
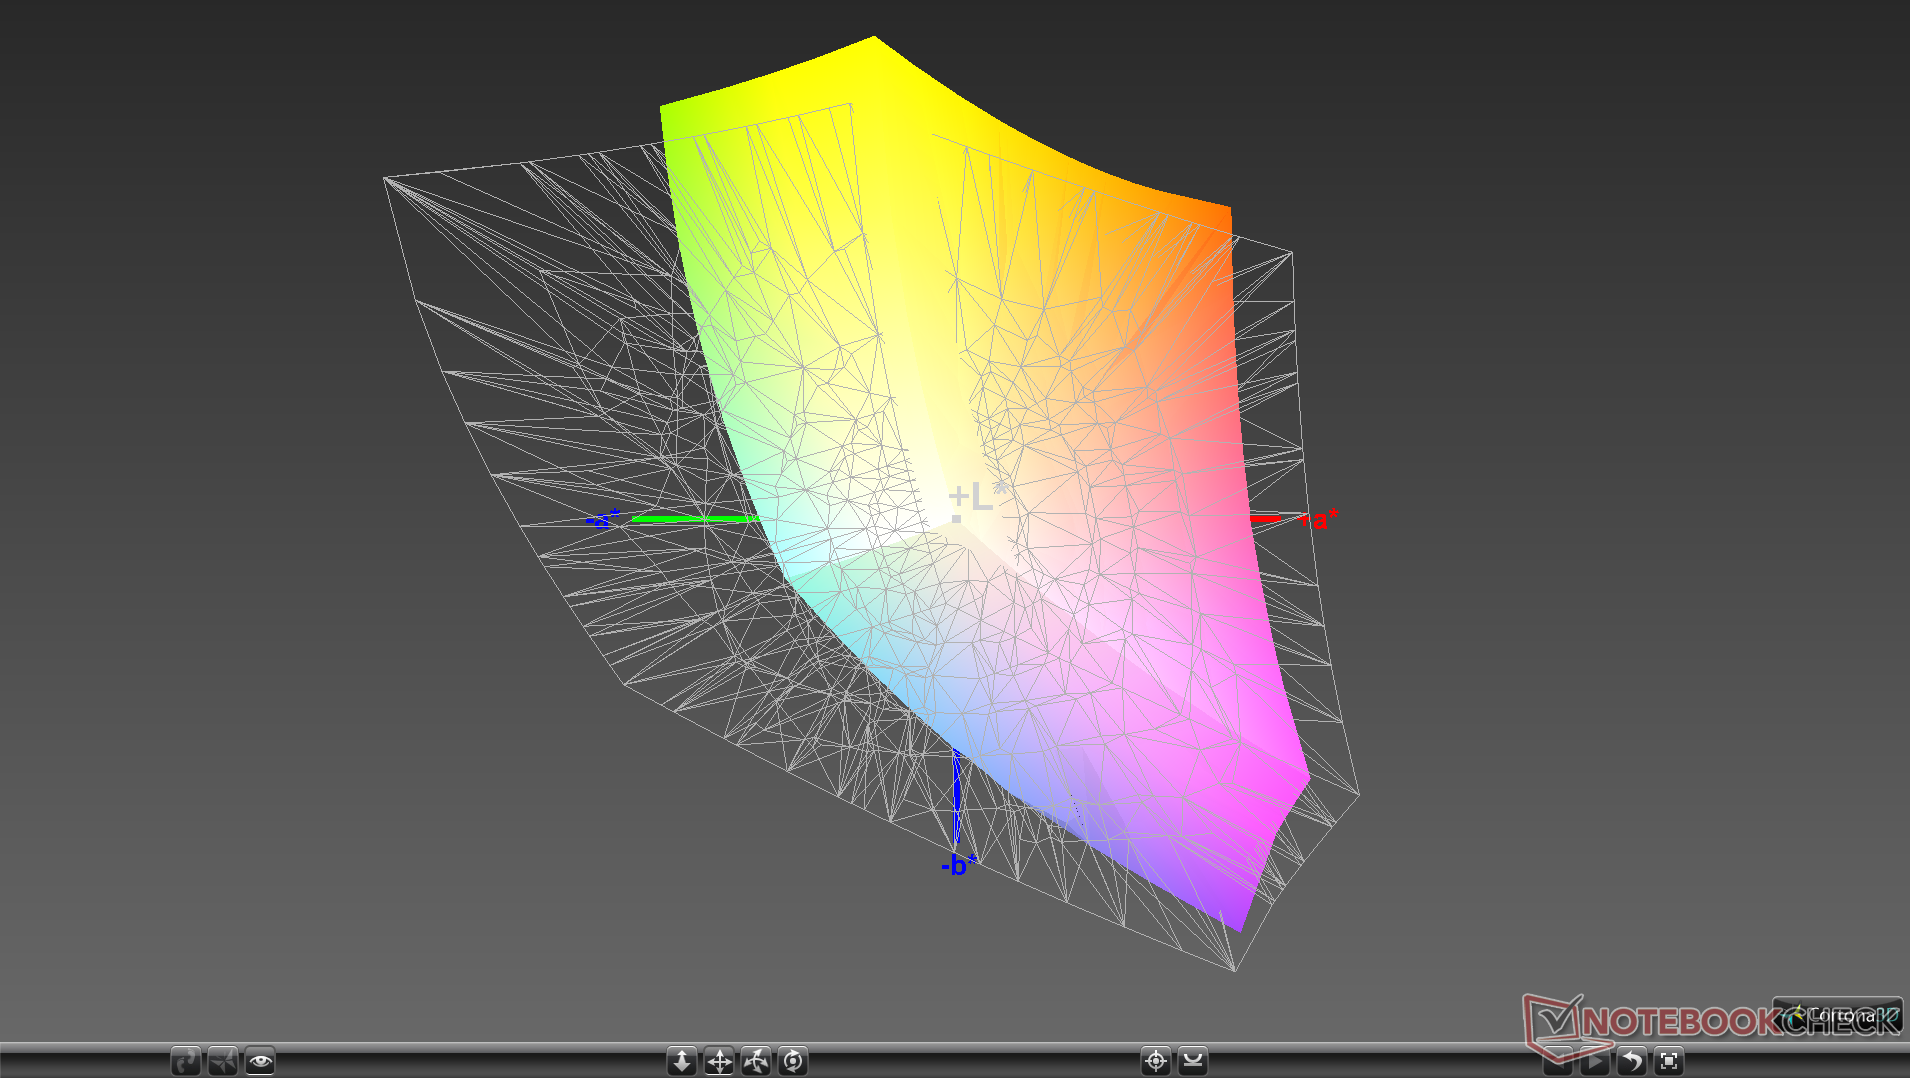
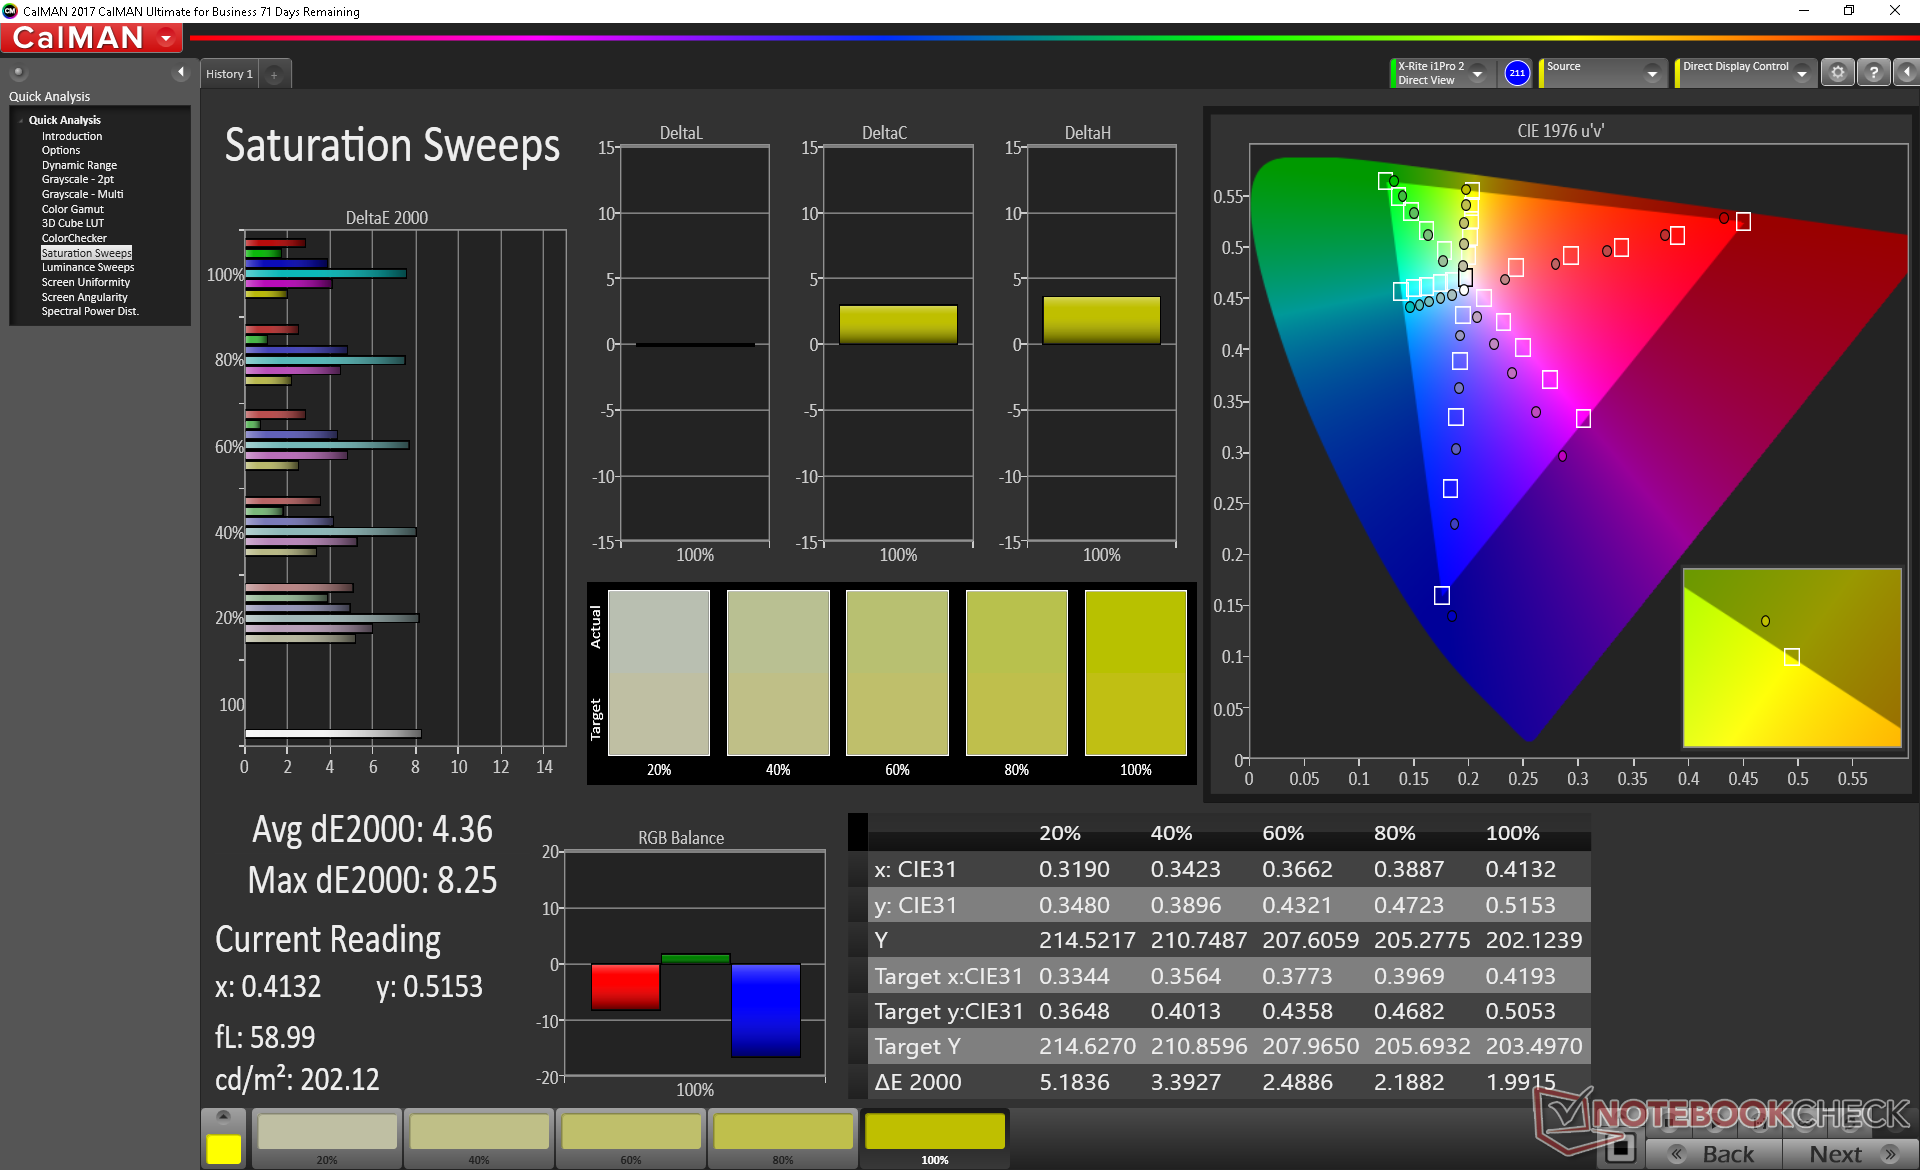
87.4% sRGB (Argyll 1.6.3 3D)
57.1% AdobeRGB 1998 (Argyll 1.6.3 3D)
64.1% AdobeRGB 1998 (Argyll 3D)
87.7% sRGB (Argyll 3D)
66.6% Display P3 (Argyll 3D)
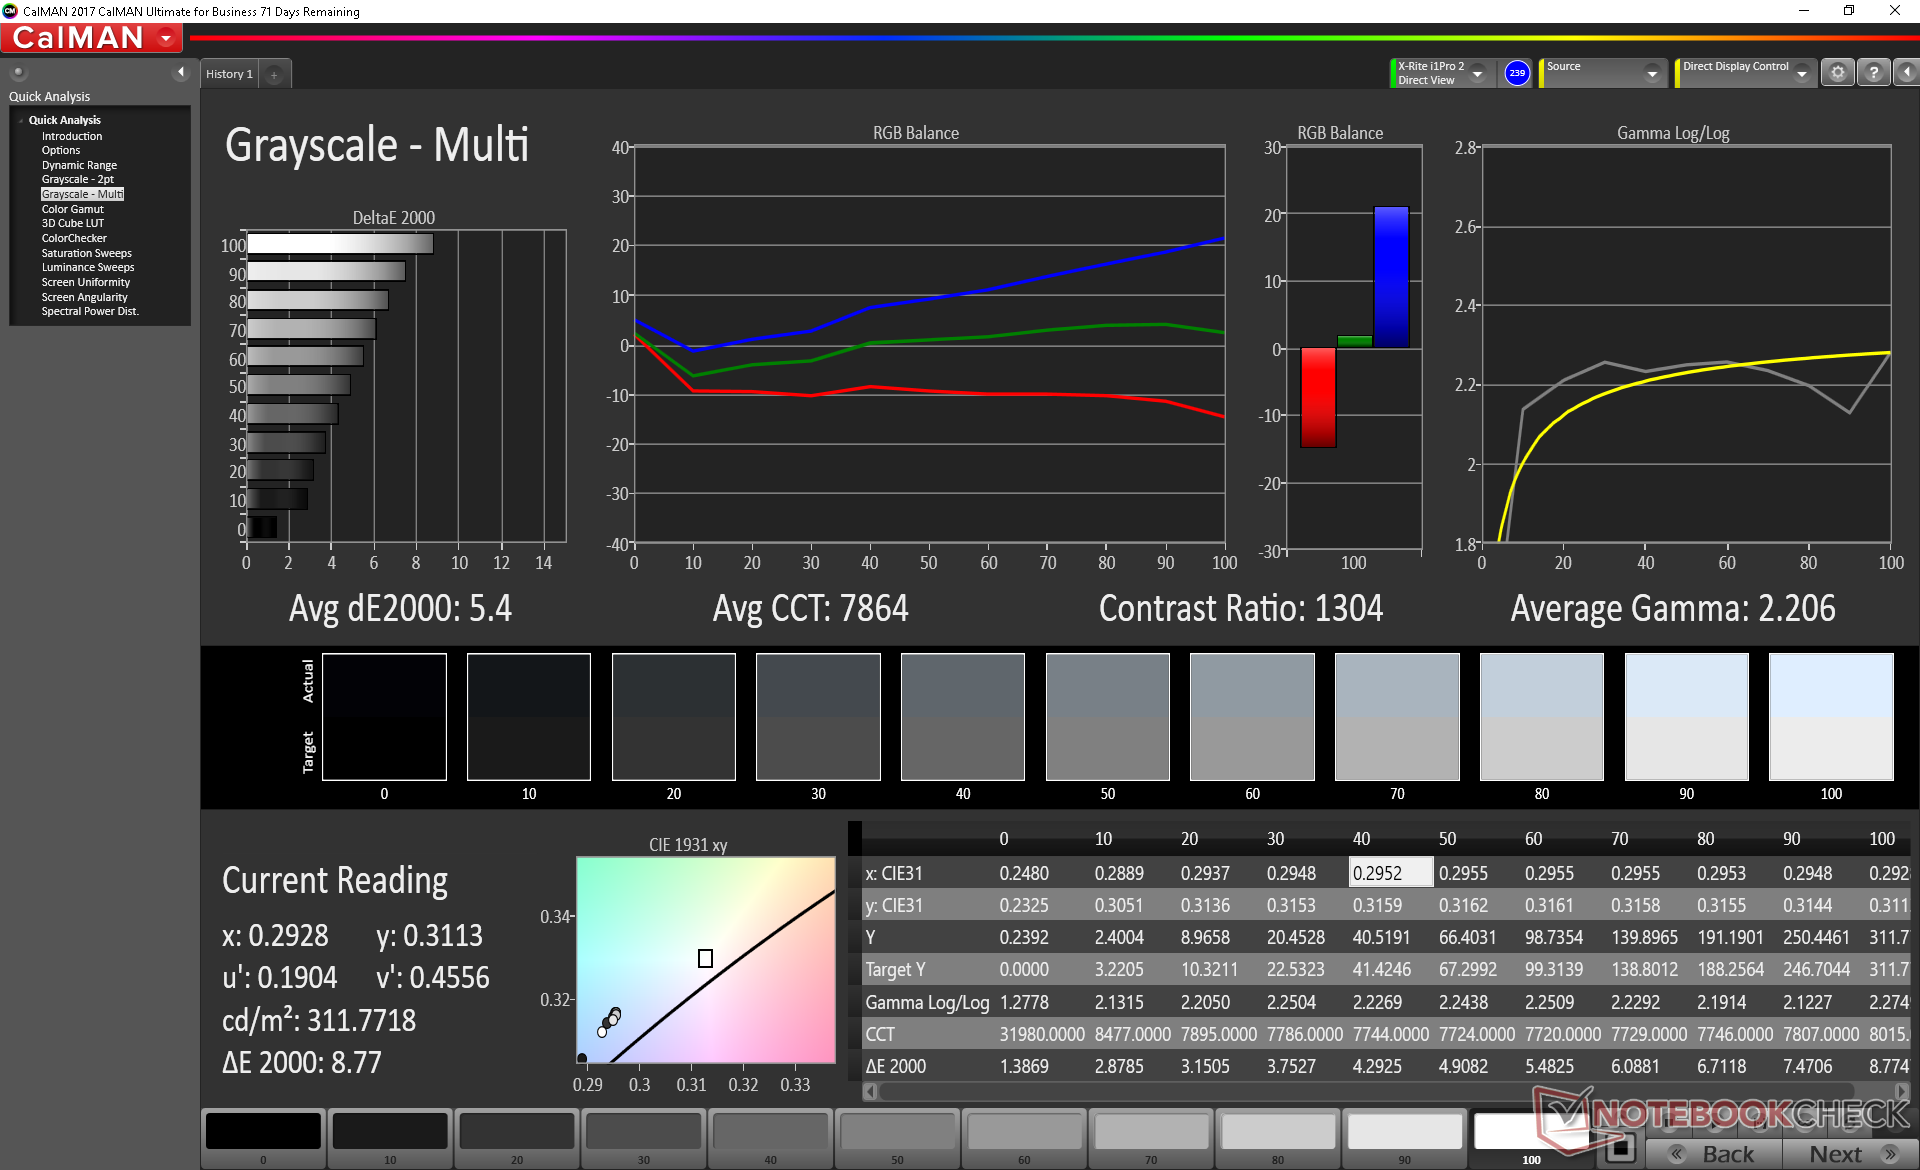
Gamma: 2.21
CCT: 7864 K
| Asus ZenBook 15 UX534FT-DB77 BOE NV156FHM-N63, IPS, 15.6", 1920x1080 | Dell XPS 15 7590 9980HK GTX 1650 Samsung 156WR04, SDCA029, OLED, 15.6", 3840x2160 | HP Spectre x360 15-df0126ng AU Optronics AUO30EB, IPS, 15.6", 3840x2160 | Lenovo Yoga 730-15IKB BOE HF NV156QUM-N51, IPS, 15.6", 3840x2160 | Razer Blade 15 GTX 1660 Ti BOE NV156FHM-N4K, IPS, 15.6", 1920x1080 | Apple MacBook Pro 15 2018 (2.6 GHz, 560X) APPA040, IPS, 15.4", 2880x1800 | |
|---|---|---|---|---|---|---|
| Display | 30% | 5% | 3% | 2% | 32% | |
| Display P3 Coverage (%) | 66.6 | 88.1 32% | 68.1 2% | 68.7 3% | 65.3 -2% | 98.7 48% |
| sRGB Coverage (%) | 87.7 | 99.6 14% | 94.2 7% | 90 3% | 91.8 5% | 99.9 14% |
| AdobeRGB 1998 Coverage (%) | 64.1 | 91.8 43% | 68.4 7% | 65.8 3% | 66.5 4% | 86.6 35% |
| Response Times | 94% | -16% | 21% | 69% | 1% | |
| Response Time Grey 50% / Grey 80% * (ms) | 41.2 ? | 2.3 ? 94% | 57 ? -38% | 34 ? 17% | 13.6 ? 67% | 43.2 ? -5% |
| Response Time Black / White * (ms) | 33.2 ? | 2.4 ? 93% | 31 ? 7% | 25 ? 25% | 10 ? 70% | 31.2 ? 6% |
| PWM Frequency (Hz) | 59.5 ? | 961 ? | 200 ? | 117000 ? | ||
| Screen | 19% | 11% | 5% | 12% | 47% | |
| Brightness middle (cd/m²) | 312.6 | 421.2 35% | 330 6% | 309 -1% | 312.7 0% | 520 66% |
| Brightness (cd/m²) | 290 | 417 44% | 310 7% | 299 3% | 305 5% | 492 70% |
| Brightness Distribution (%) | 85 | 94 11% | 87 2% | 84 -1% | 90 6% | 88 4% |
| Black Level * (cd/m²) | 0.31 | 0.37 -19% | 0.29 6% | 0.27 13% | 0.39 -26% | |
| Contrast (:1) | 1008 | 892 -12% | 1066 6% | 1158 15% | 1333 32% | |
| Colorchecker dE 2000 * | 5.78 | 6.06 -5% | 4.03 30% | 3.9 33% | 4.57 21% | 1.2 79% |
| Colorchecker dE 2000 max. * | 8.86 | 11.89 -34% | 6.74 24% | 7.5 15% | 6.81 23% | 2.3 74% |
| Colorchecker dE 2000 calibrated * | 3.78 | 1.96 48% | 2.91 23% | |||
| Greyscale dE 2000 * | 5.4 | 2.8 48% | 4.49 17% | 4.58 15% | 4.3 20% | 1.3 76% |
| Gamma | 2.21 100% | 2.15 102% | 2.57 86% | 2.43 91% | 2.29 96% | 2.18 101% |
| CCT | 7864 83% | 6235 104% | 6744 96% | 7344 89% | 7098 92% | 6738 96% |
| Color Space (Percent of AdobeRGB 1998) (%) | 57.1 | 81 42% | 61 7% | 39 -32% | 59.4 4% | |
| Color Space (Percent of sRGB) (%) | 87.4 | 99.6 14% | 94 8% | 90 3% | 91.3 4% | |
| Total Average (Program / Settings) | 48% /
33% | 0% /
6% | 10% /
7% | 28% /
17% | 27% /
36% |
* ... smaller is better
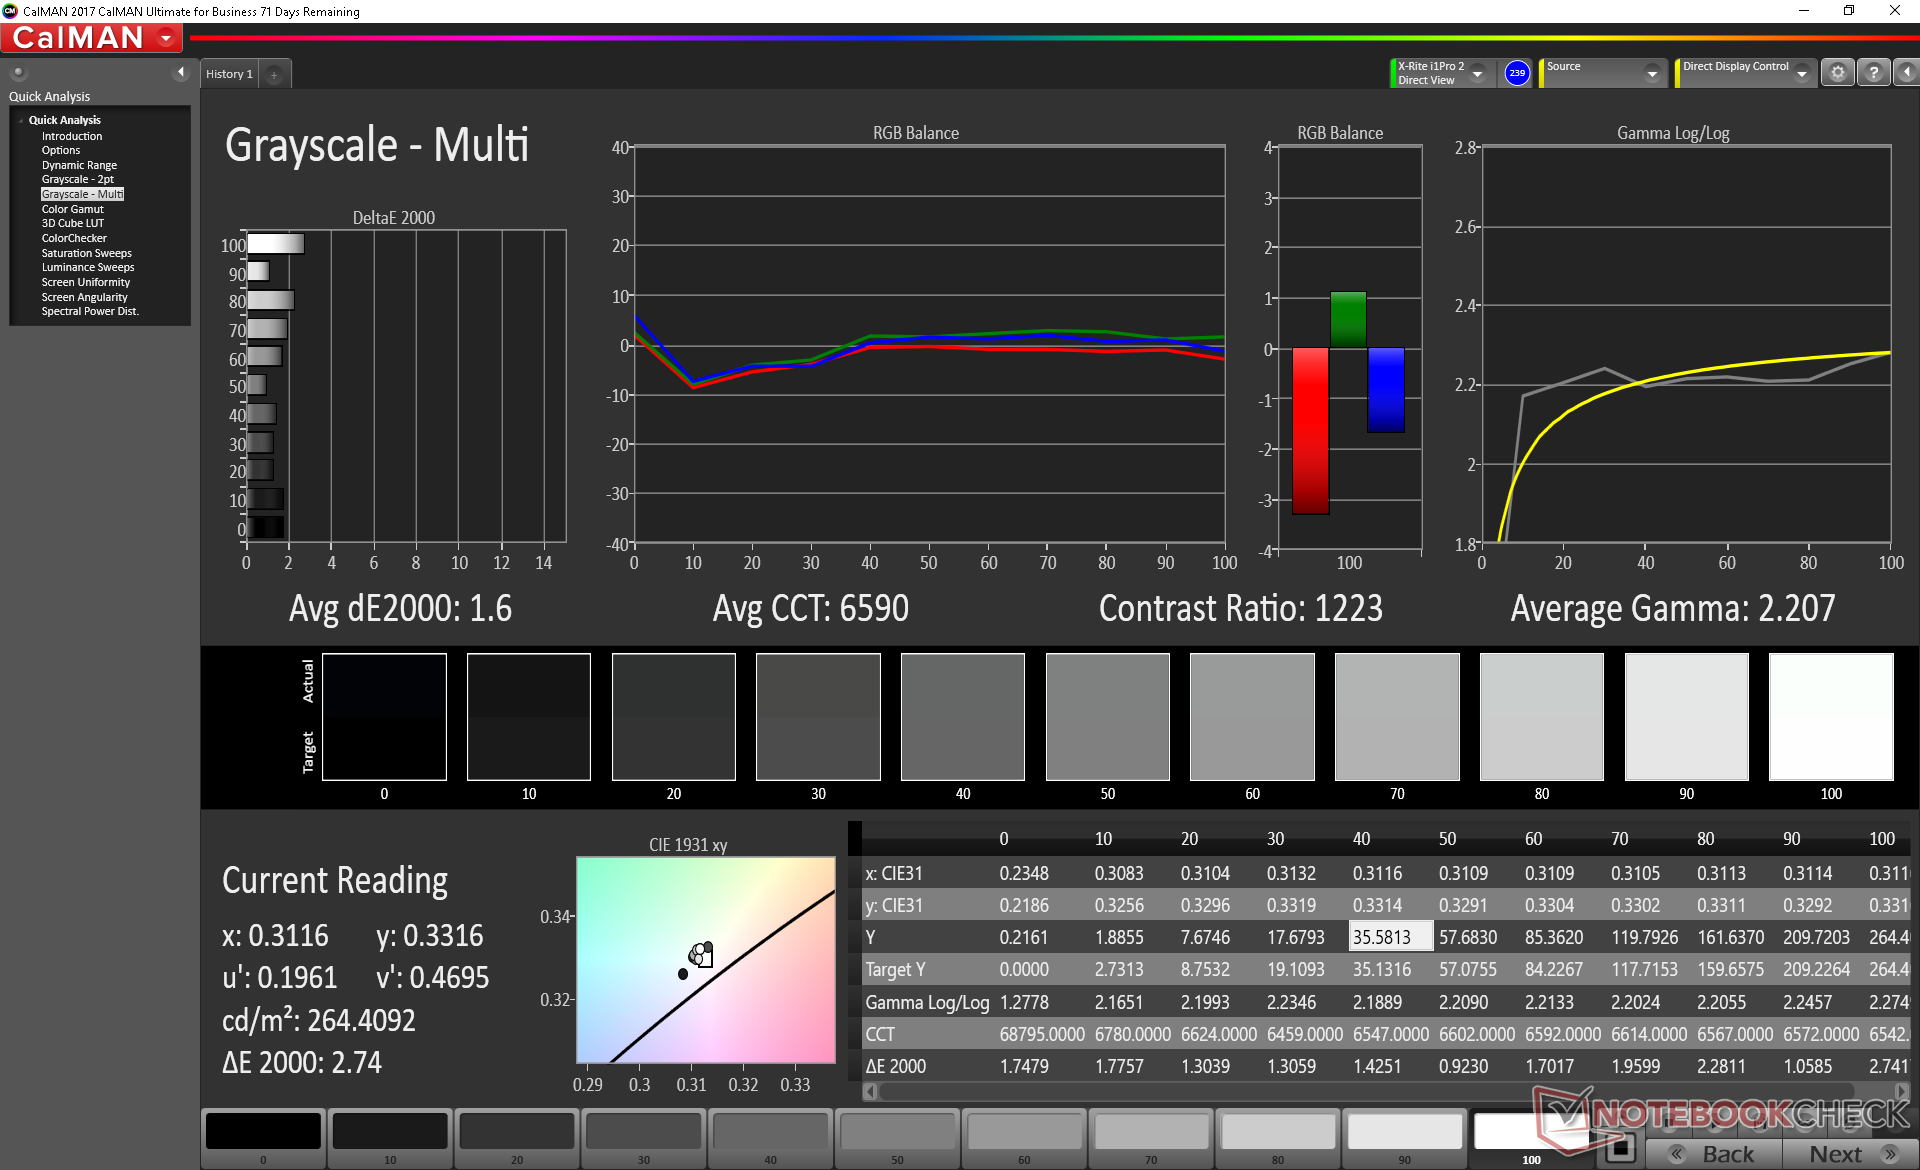
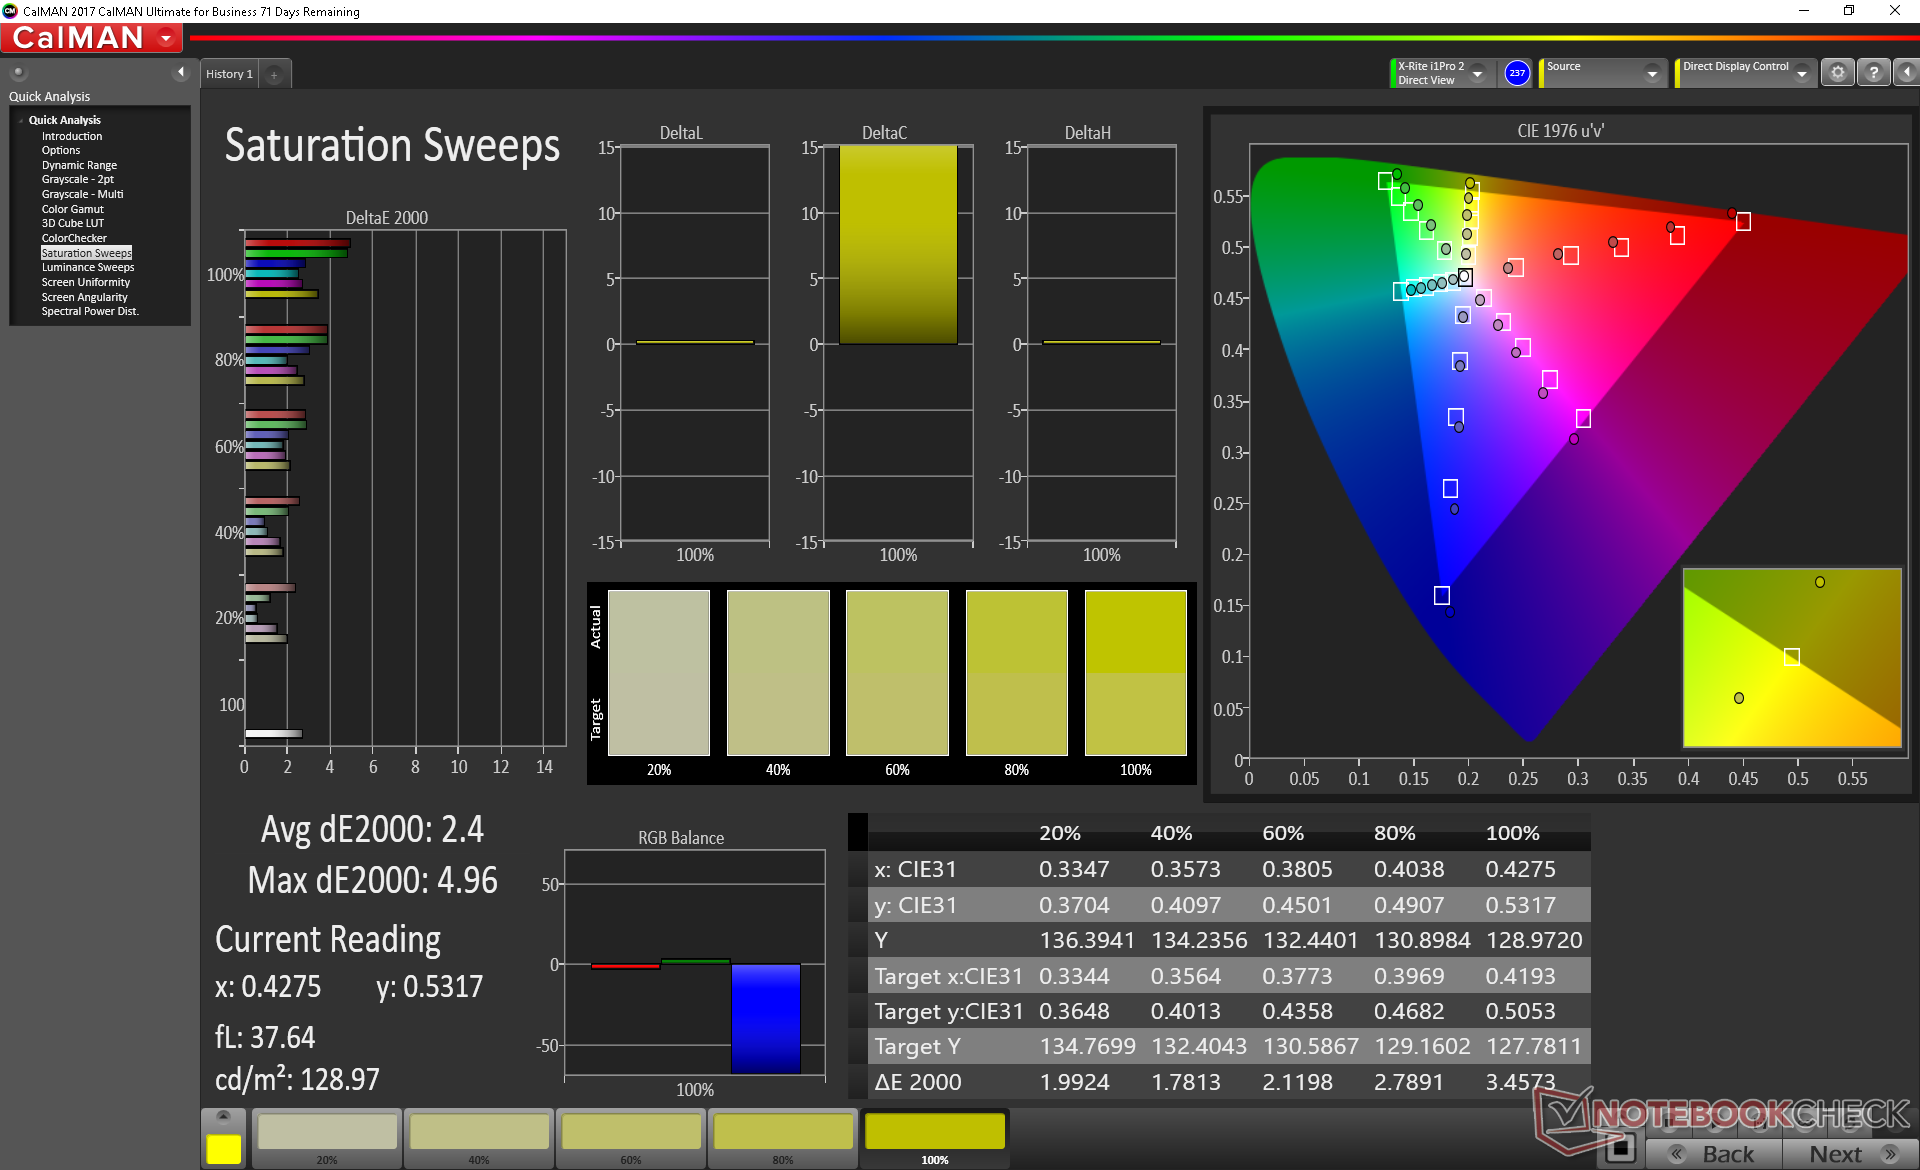
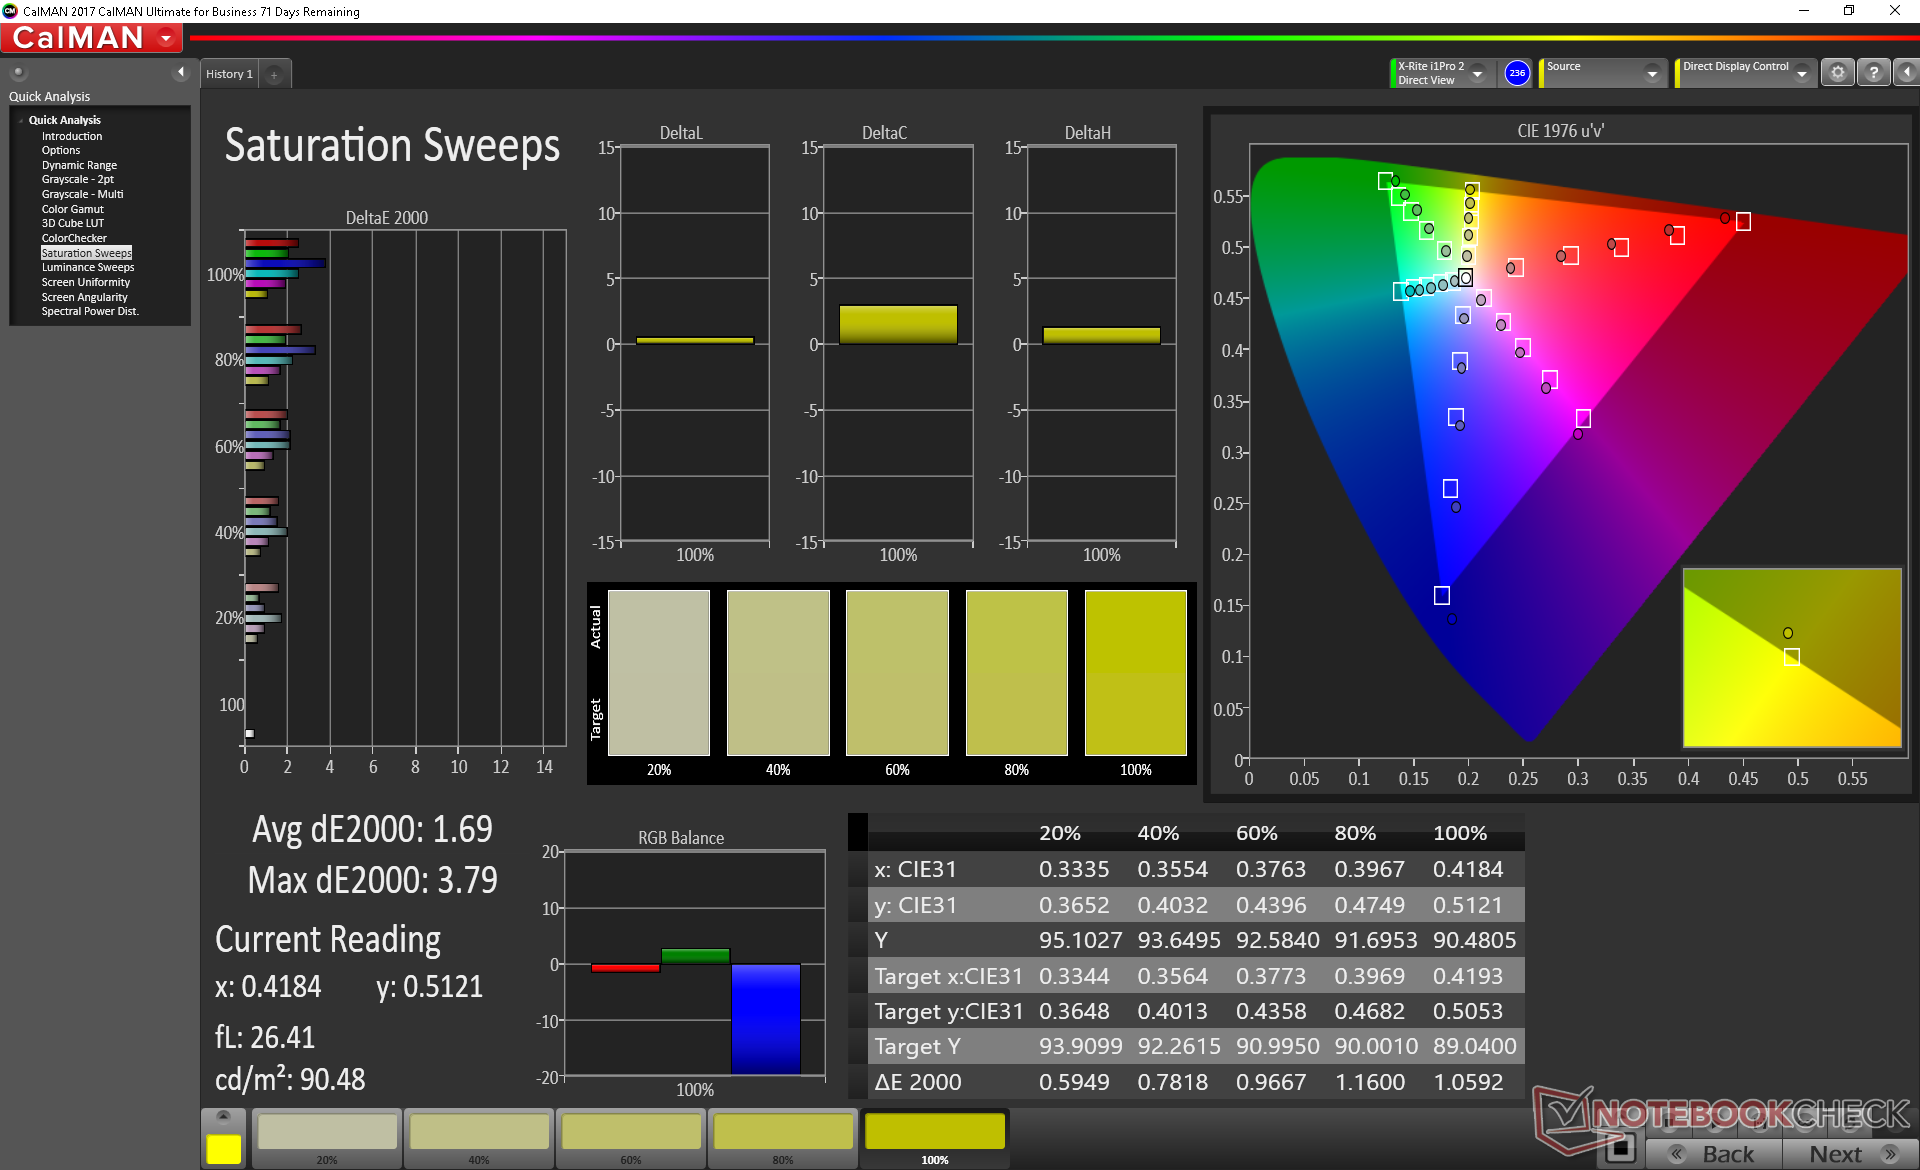
Further measurements with an X-Rite colorimeter reveal an overly cool color temperature out of the box. Our calibration attempt improves both grayscale (DeltaE 5.4 to 1.6) and colors noticeably for a more accurate picture as shown by our Calman results below. We recommend applying our calibrated ICM profile above if you don't have the tools to calibrate the display yourself.
Display Response Times
| ↔ Response Time Black to White | ||
|---|---|---|
| 33.2 ms ... rise ↗ and fall ↘ combined | ↗ 19.6 ms rise | 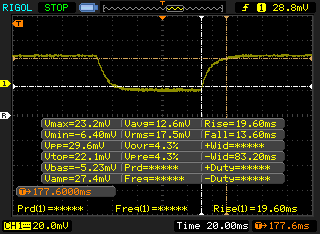 |
| ↘ 13.6 ms fall | ||
| The screen shows slow response rates in our tests and will be unsatisfactory for gamers. In comparison, all tested devices range from 0.1 (minimum) to 240 (maximum) ms. » 90 % of all devices are better. This means that the measured response time is worse than the average of all tested devices (19.8 ms). | ||
| ↔ Response Time 50% Grey to 80% Grey | ||
| 41.2 ms ... rise ↗ and fall ↘ combined | ↗ 22 ms rise | 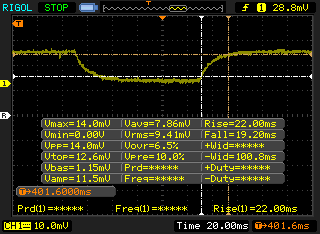 |
| ↘ 19.2 ms fall | ||
| The screen shows slow response rates in our tests and will be unsatisfactory for gamers. In comparison, all tested devices range from 0.165 (minimum) to 636 (maximum) ms. » 66 % of all devices are better. This means that the measured response time is worse than the average of all tested devices (31 ms). | ||
Screen Flickering / PWM (Pulse-Width Modulation)
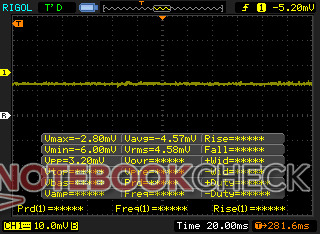
| Screen flickering / PWM not detected | 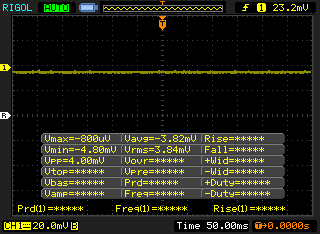 | ||
In comparison: 52 % of all tested devices do not use PWM to dim the display. If PWM was detected, an average of 7753 (minimum: 5 - maximum: 343500) Hz was measured. | |||
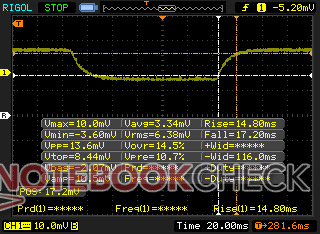
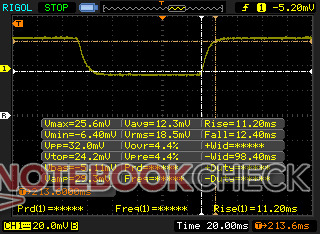
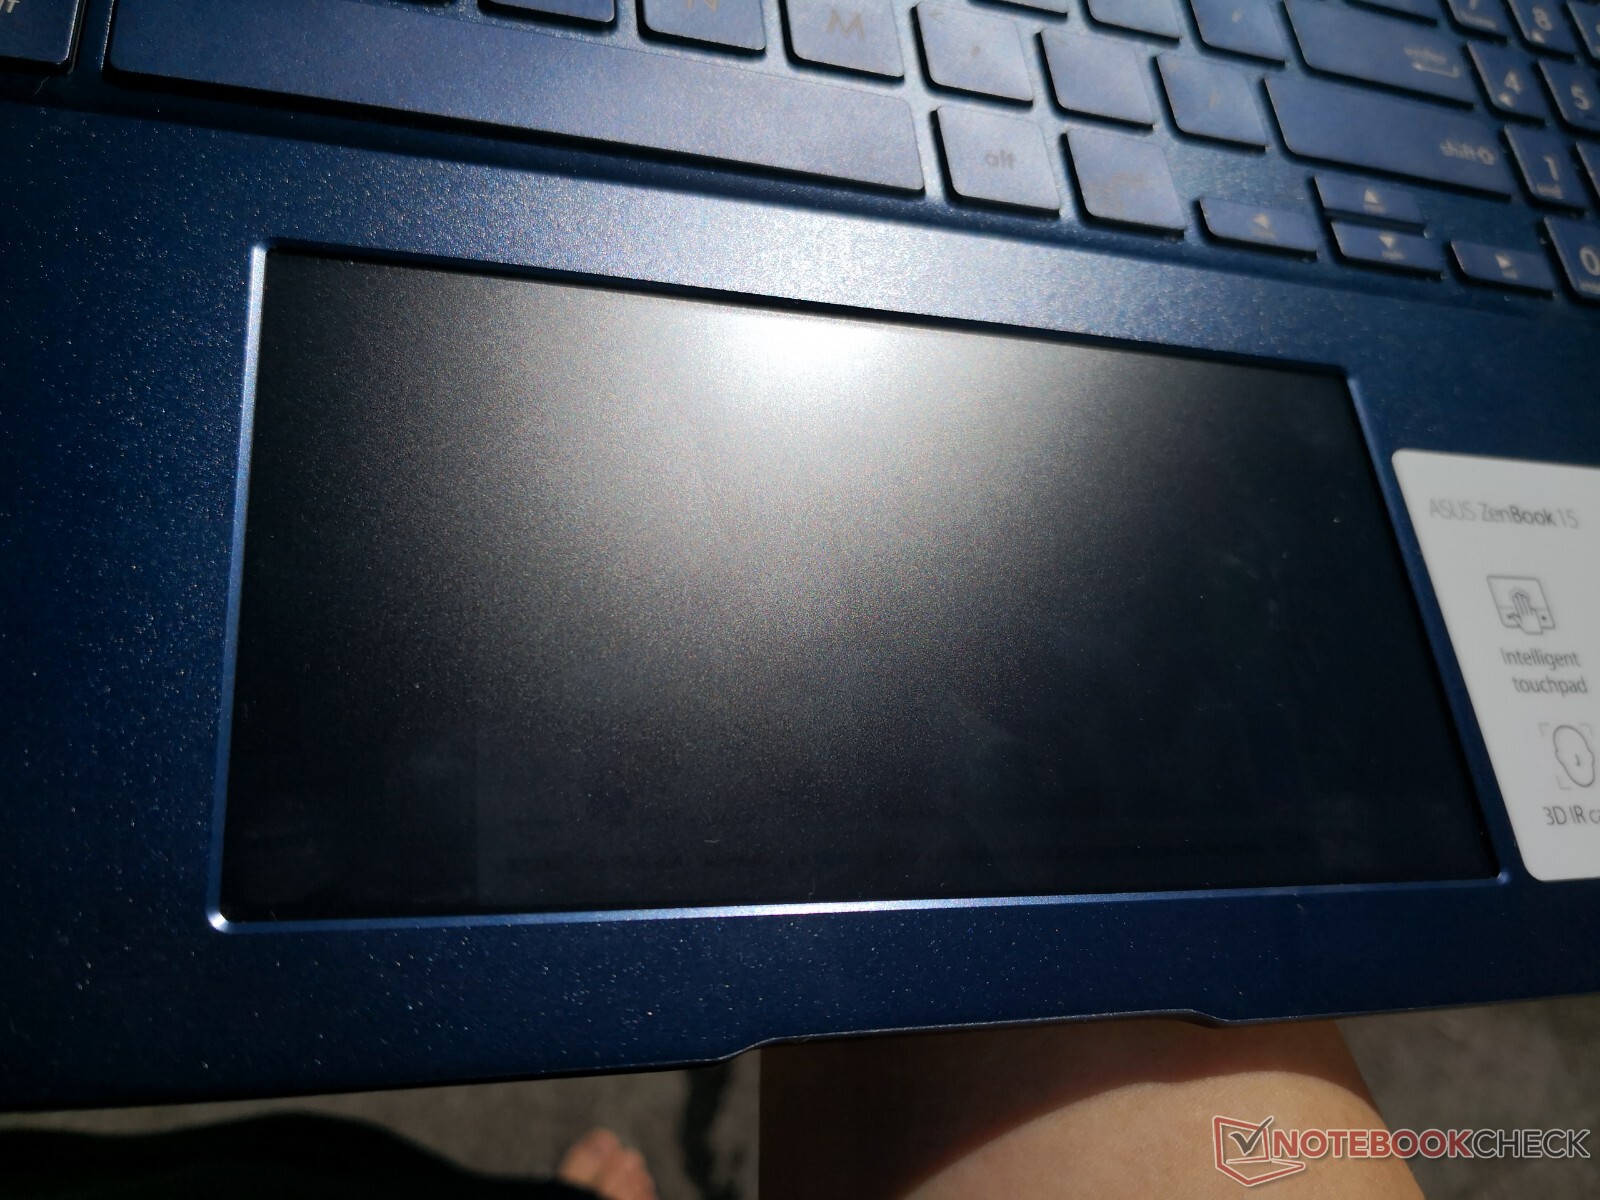
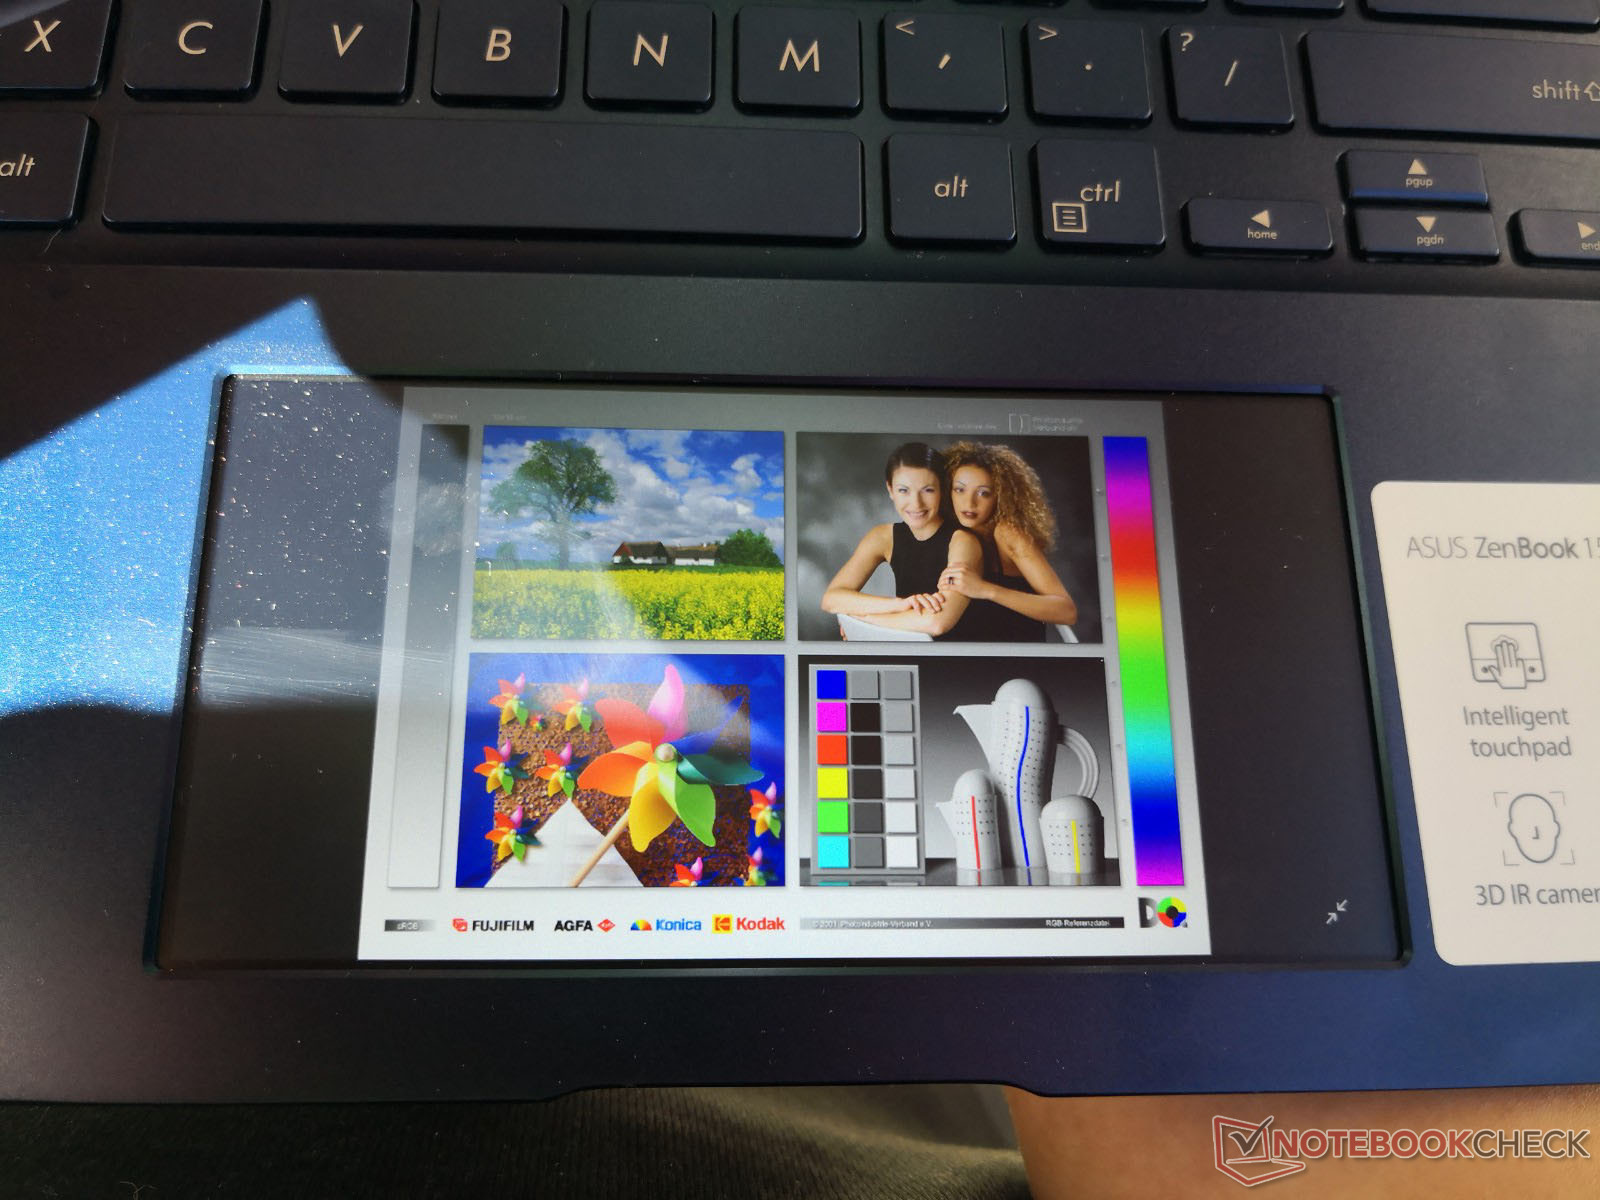
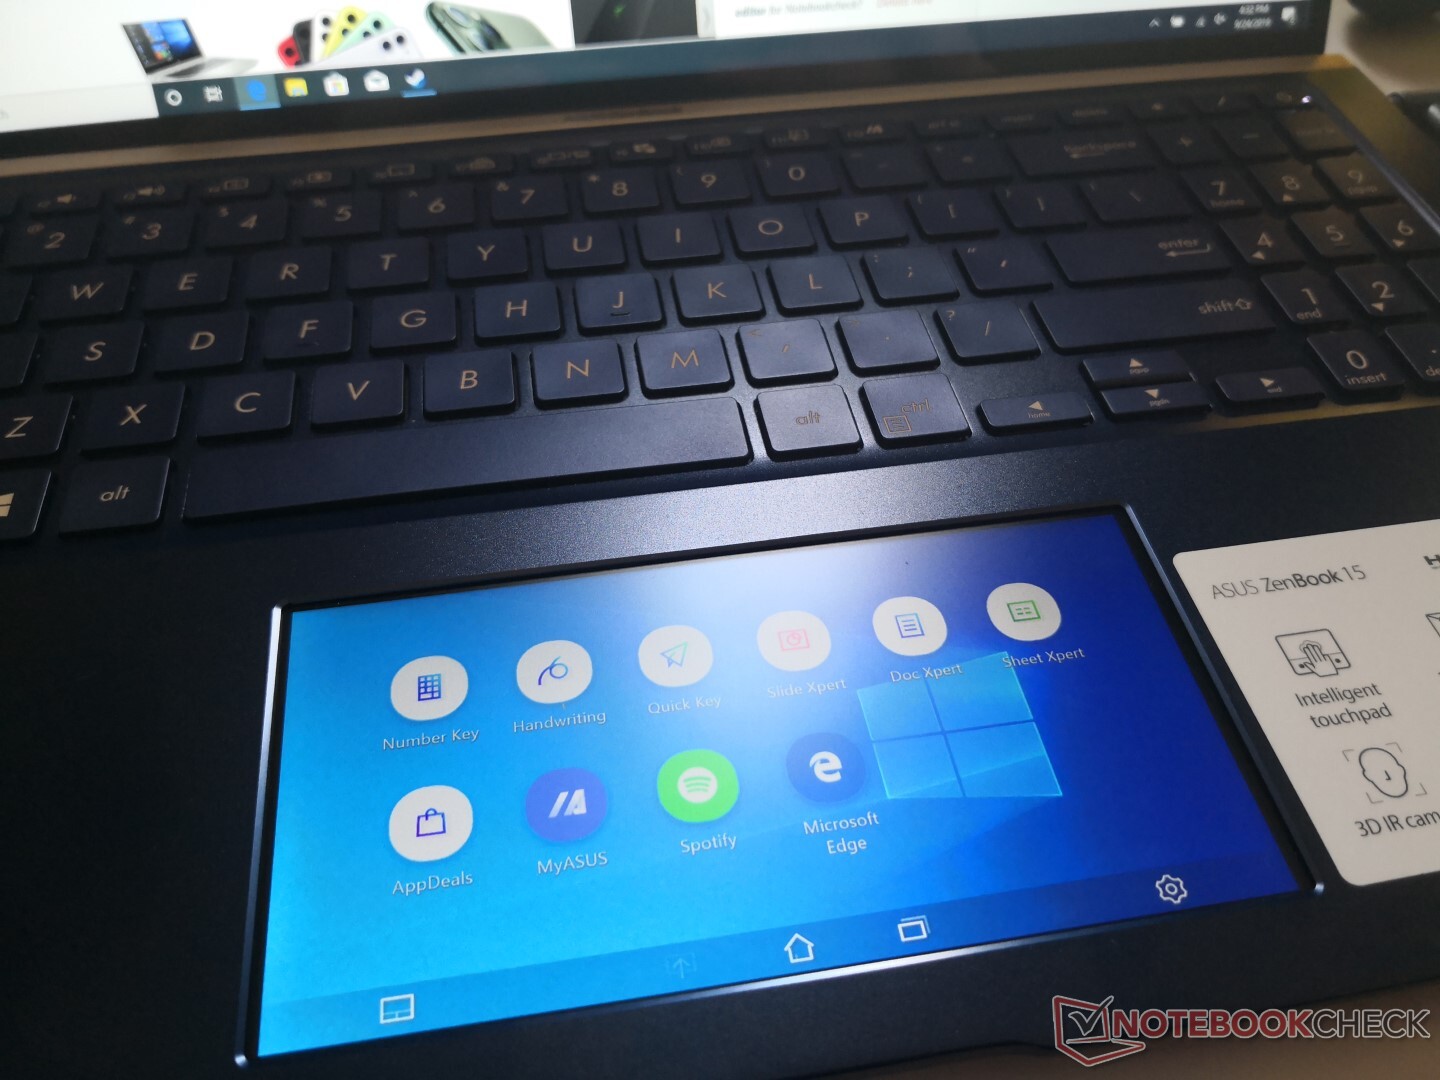
ScreenPad 2.0 - Smoother and Less Grainy than ScreenPad 1.0
The 5.65-inch IPS ScreenPad on this ZenBook appears to be very similar to the ScreenPad as found on the VivoBook S15 S532F. Properties like brightness, contrast ratio, response times, and even gamut are close in value. The biggest drawback to the ScreenPad continues to be its grainy picture and the far physical distance between it and the main screen. Shifting your eyes between the main screen and ScreenPad can be tiring when compared to the Apple Touch Bar or the HP Omen 2S X 15. Nonetheless, the extra screen real estate is invaluable for multi-tasking as any dual monitor desktop PC user would tell you.
One annoying aspect of the ScreenPad is that its brightness setting will reset to 50 percent every time the display is disabled or turned off. Automatically saving the previous brightness setting would avoid this issue.
See our page on the ScreenPad to read more about our thoughts on the technology.
| Maximum Brightness | Contrast Ratio | Minimum Brightness | PWM | Black-White Response Time | Gray-Gray Response Time | sRGB Coverage | AdobeRGB Coverage |
| 419.8 | 874:1 | 13.54 | No | 11.2 ms | 14.8 ms | 89.5 percent | 57.6 percent |


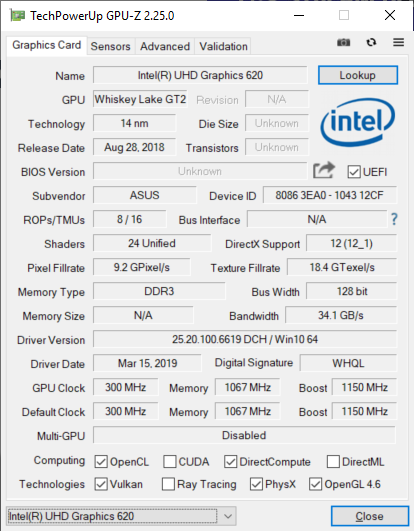
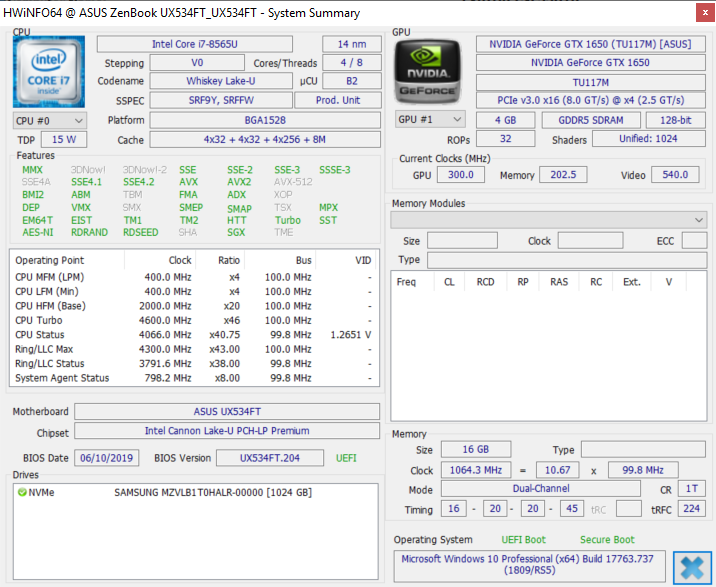
Performance - The Perfect Pairing of Processors
Whereas most other laptops pair Intel Core H-series CPUs with GeForce Max-Q GPUs, the ZenBook 15 uses an Intel Core U-series CPU instead. The smaller ZenBook 14 UX434 and ZenBook 13 UX334 do not have the same GTX 1650 Max-Q options as the UX534 as they are limited to the less demanding GeForce MX250.
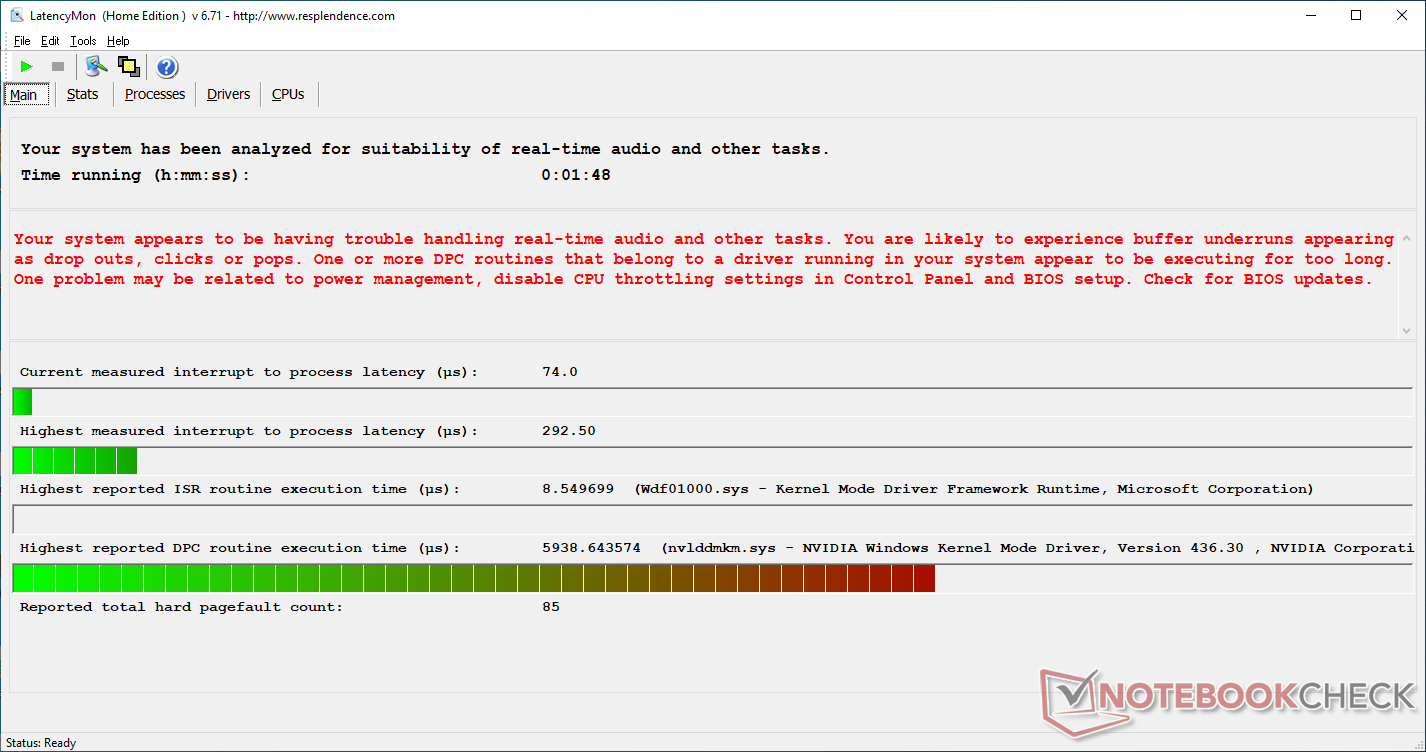
LatencyMon shows DPC latency issues even if wireless is disabled.
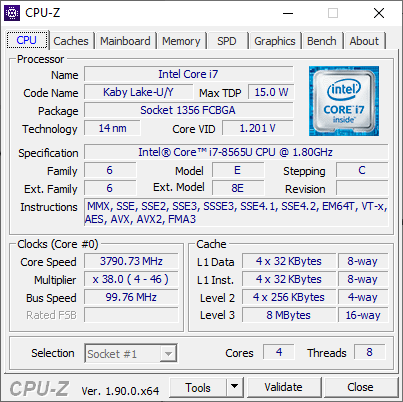
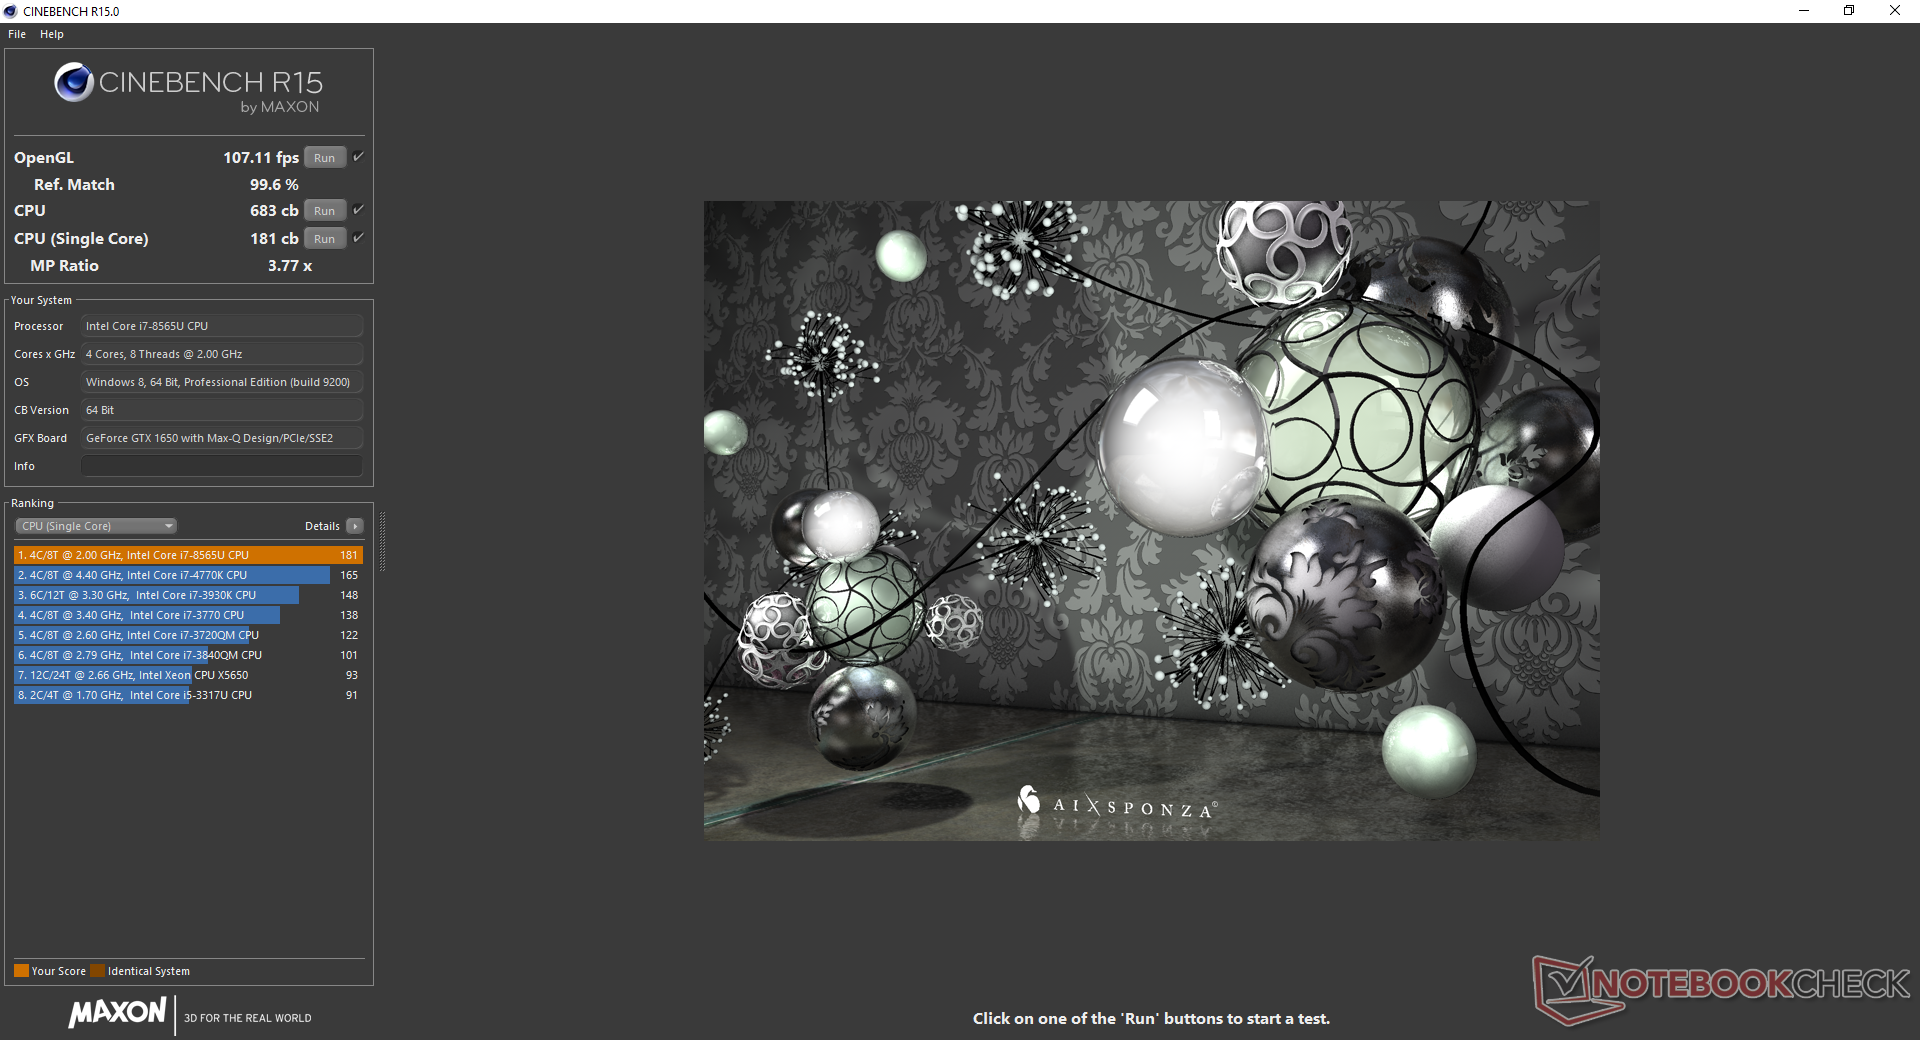
Processor - Slightly Slower than the ZenBook 15 UX533
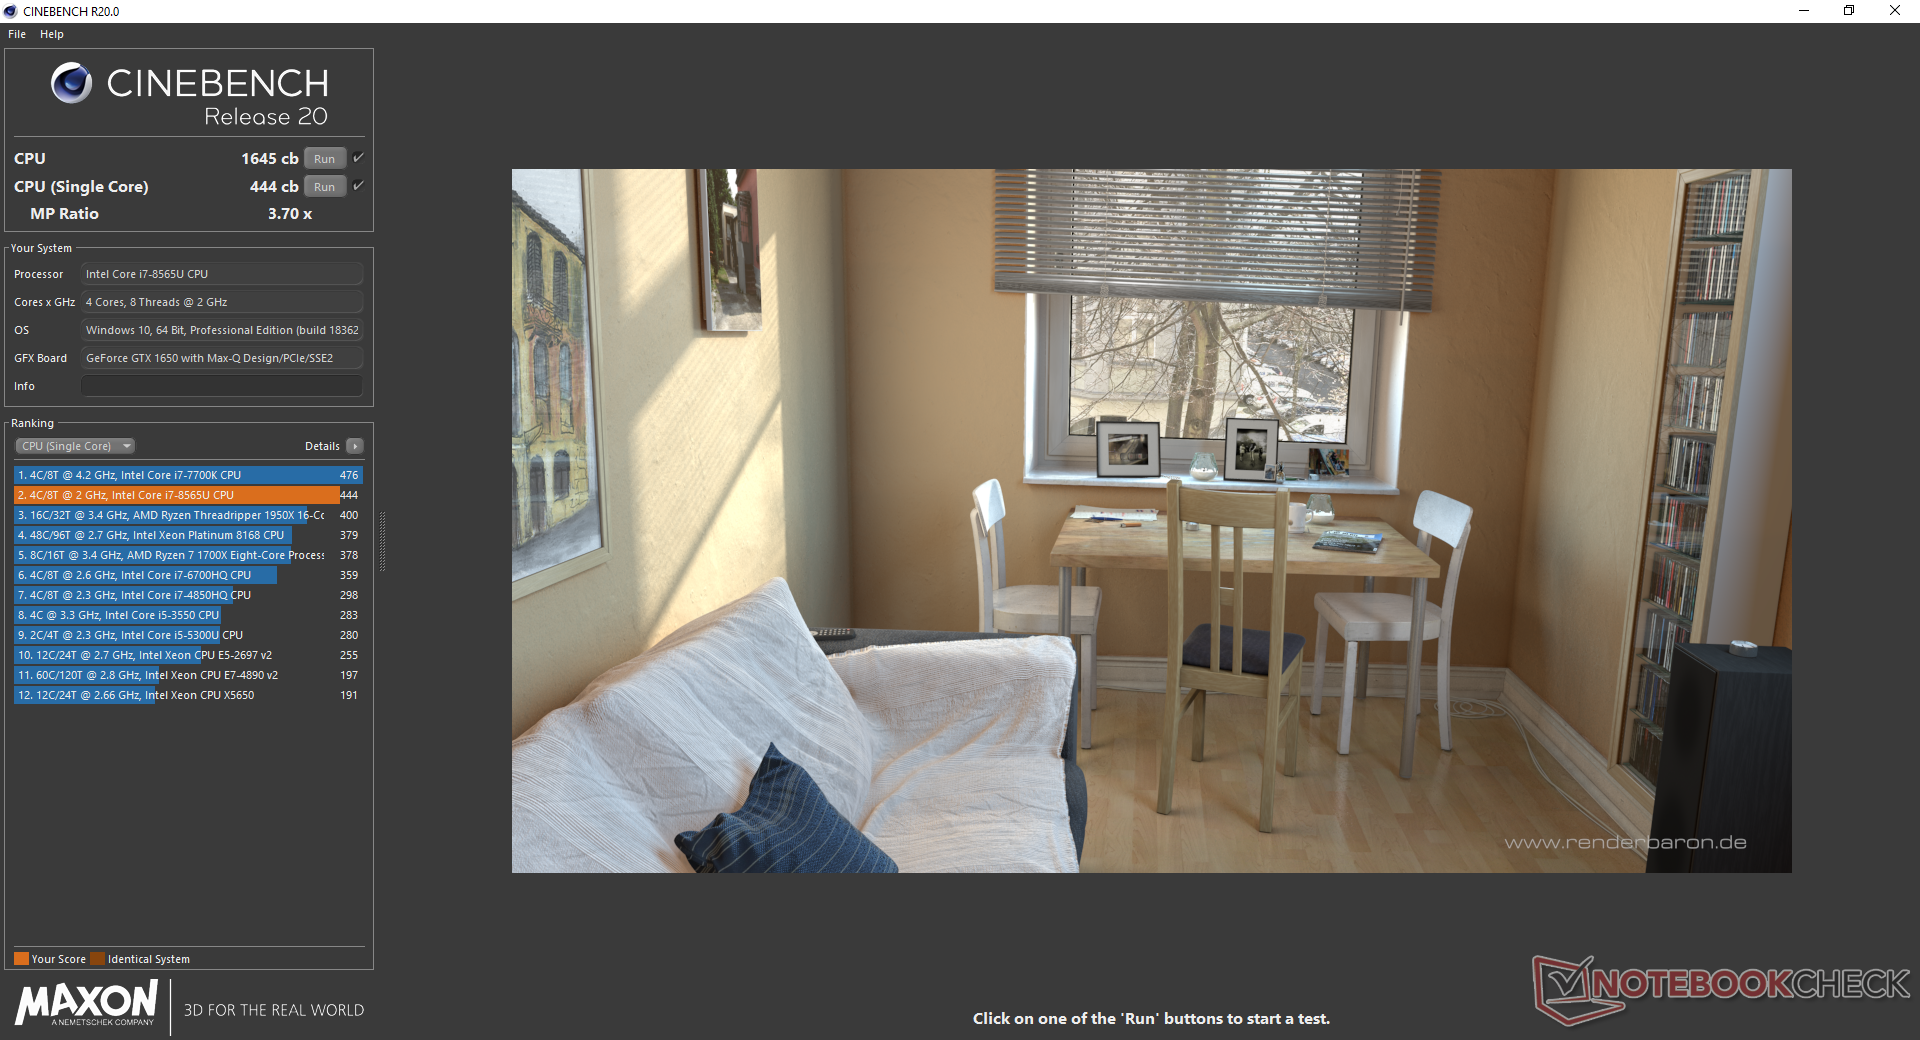
CPU performance is ever-so-slightly slower than the same Core i7-8565U processor on the ZenBook 15 UX533 after accounting for throttling. When running CineBench R15 Multi-Thread in a loop, the CPU in the UX534 is consistently slower by up to 5 percent. It's not enough to make a tangible difference during day-to-day loads, but it shows how finicky Turbo Boost clock rates can be even within the same laptop family.
See our dedicated page on the Core i7-8565U for more technical information and benchmarks.
System Performance
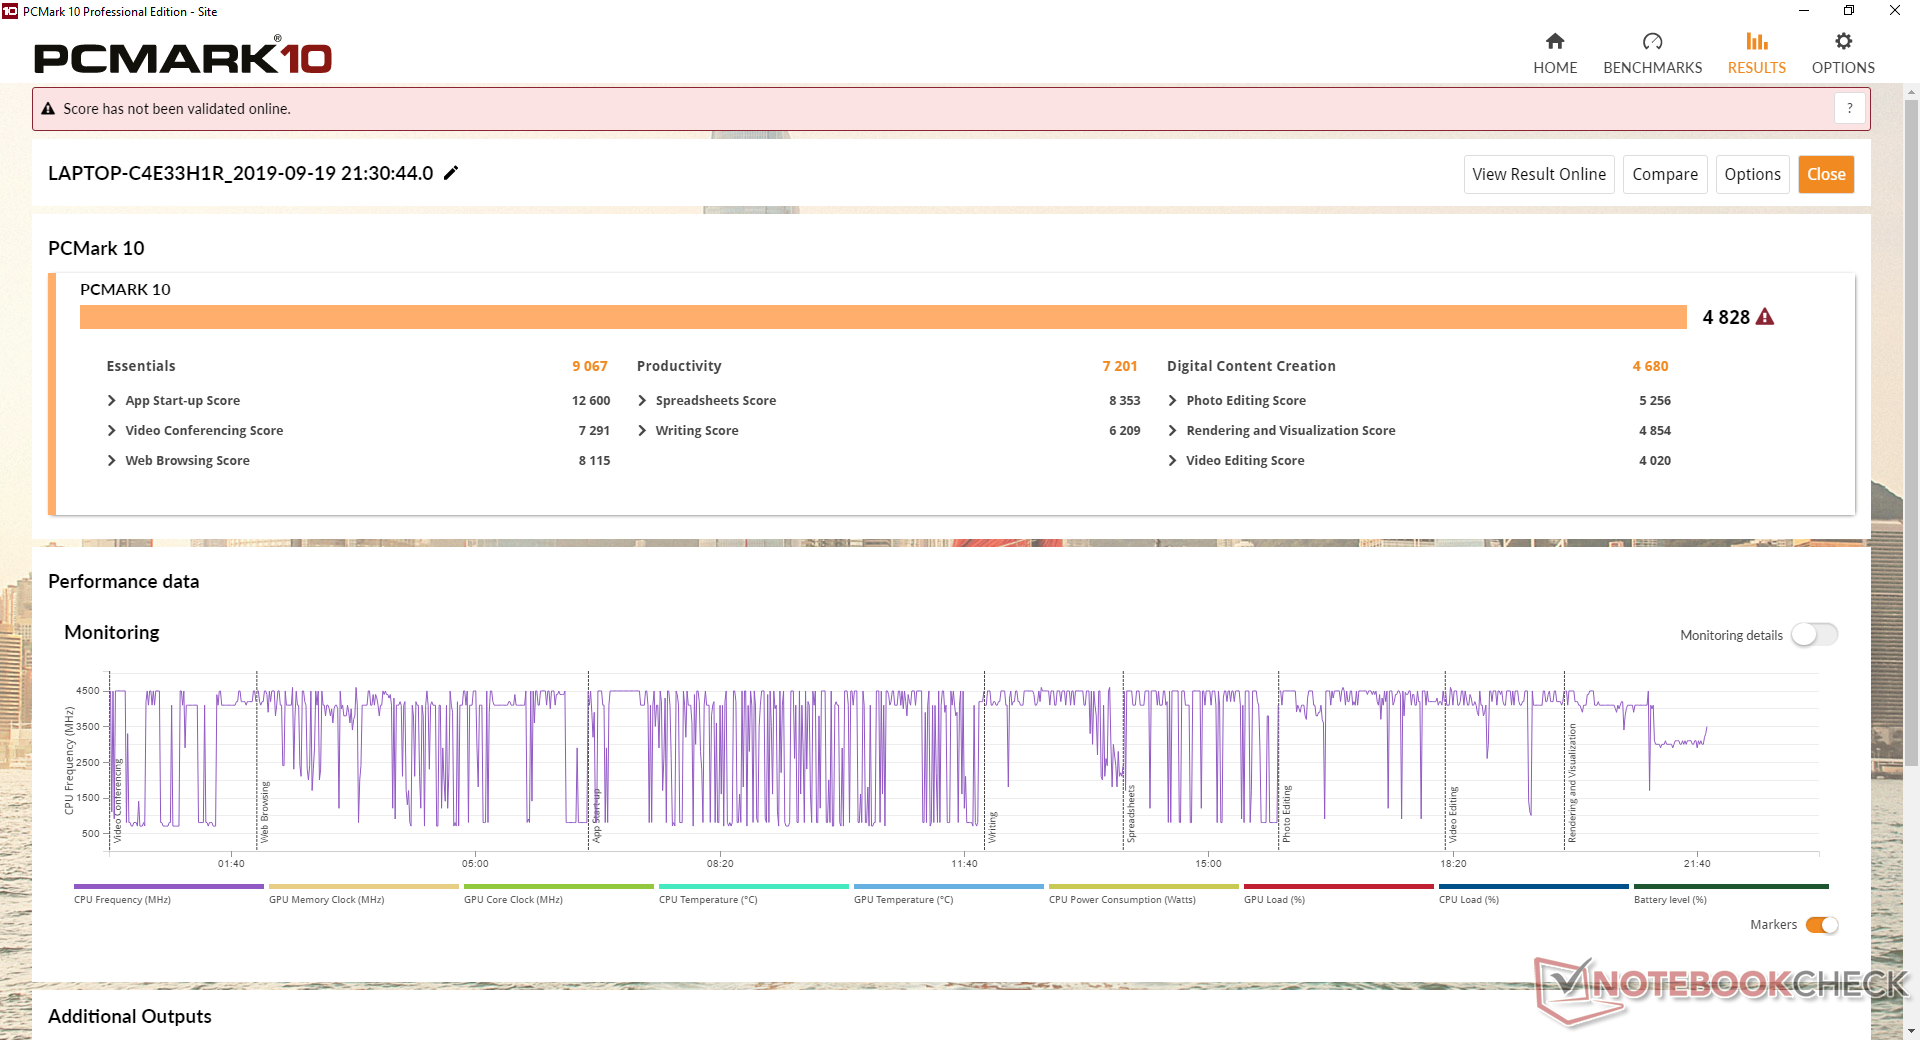
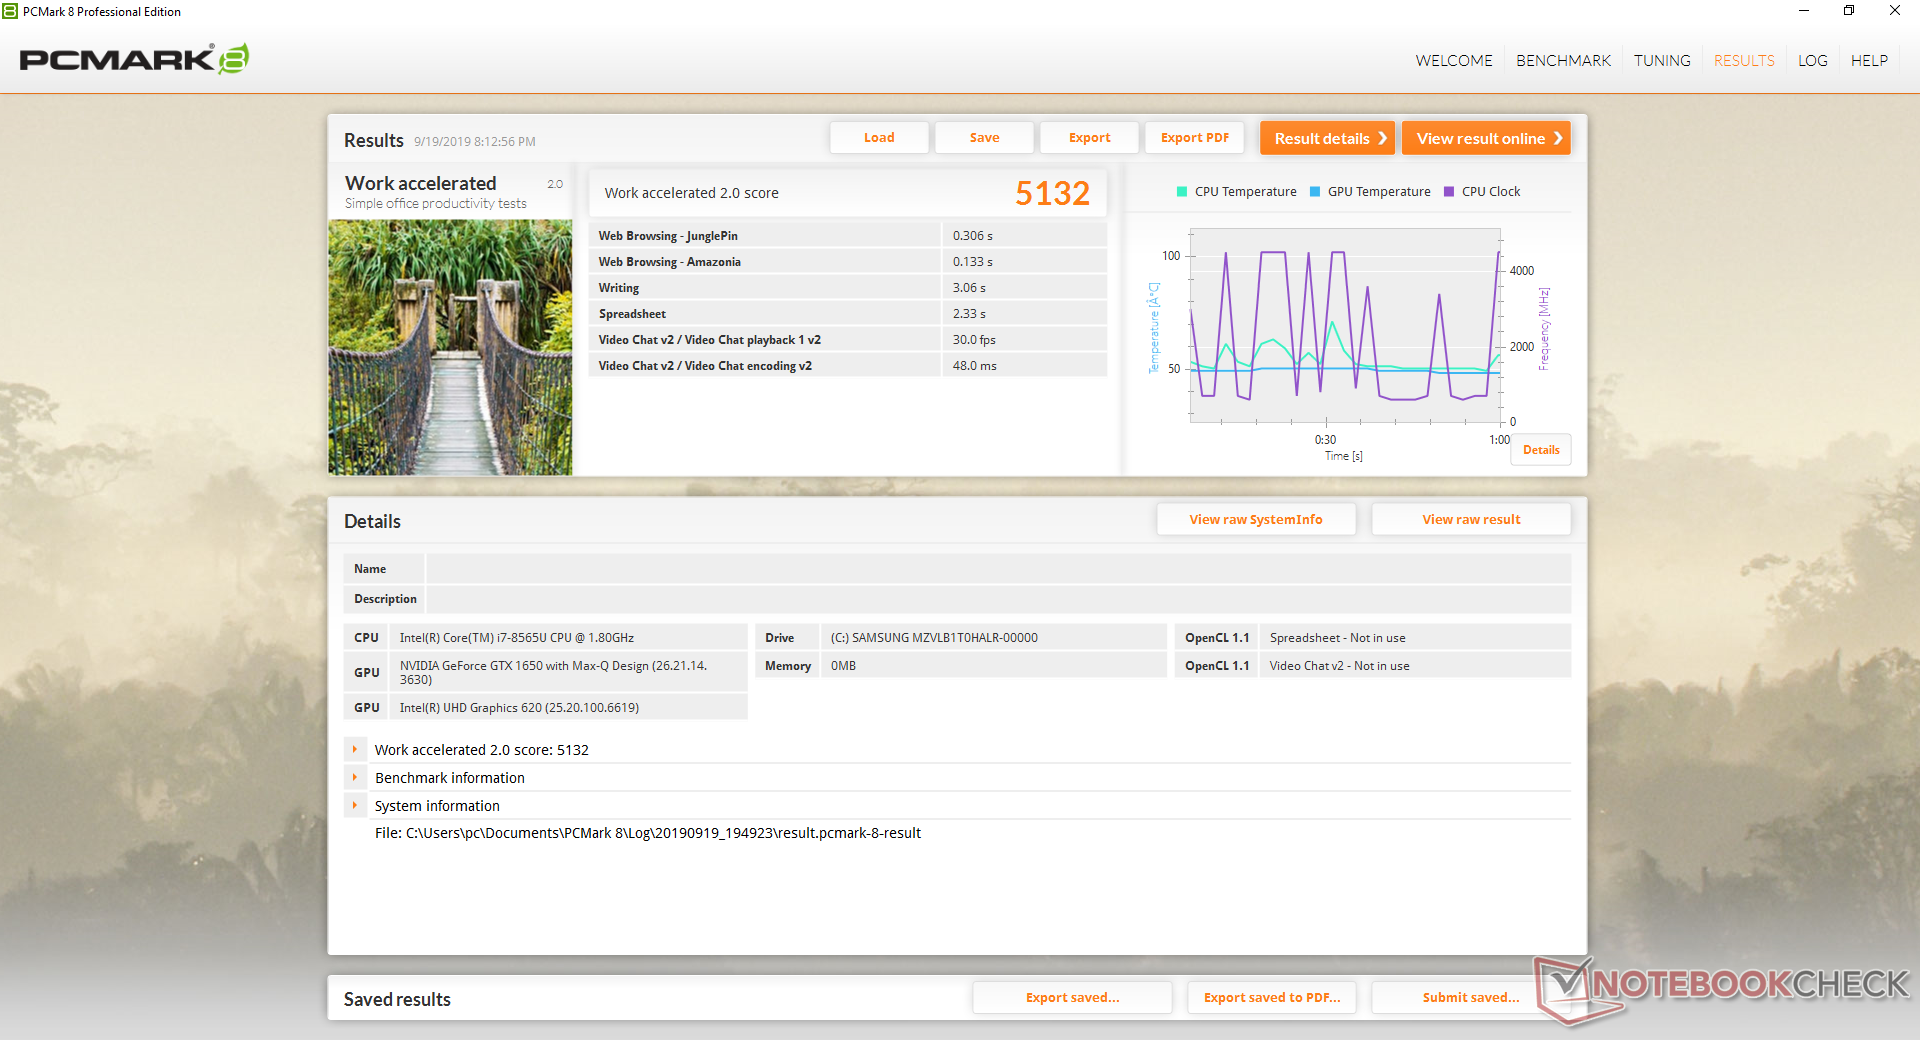
PCMark results are where we expect them to be when considering the CPU and GPU. The only other laptop in our database with the same CPU and GPU as our ZenBook is the MSI Prestige 14 and so both systems share similar PCMark data. However, be prepared for a deluge of annoying popups from Asus encouraging you to register for their cloud or app services upon startup.
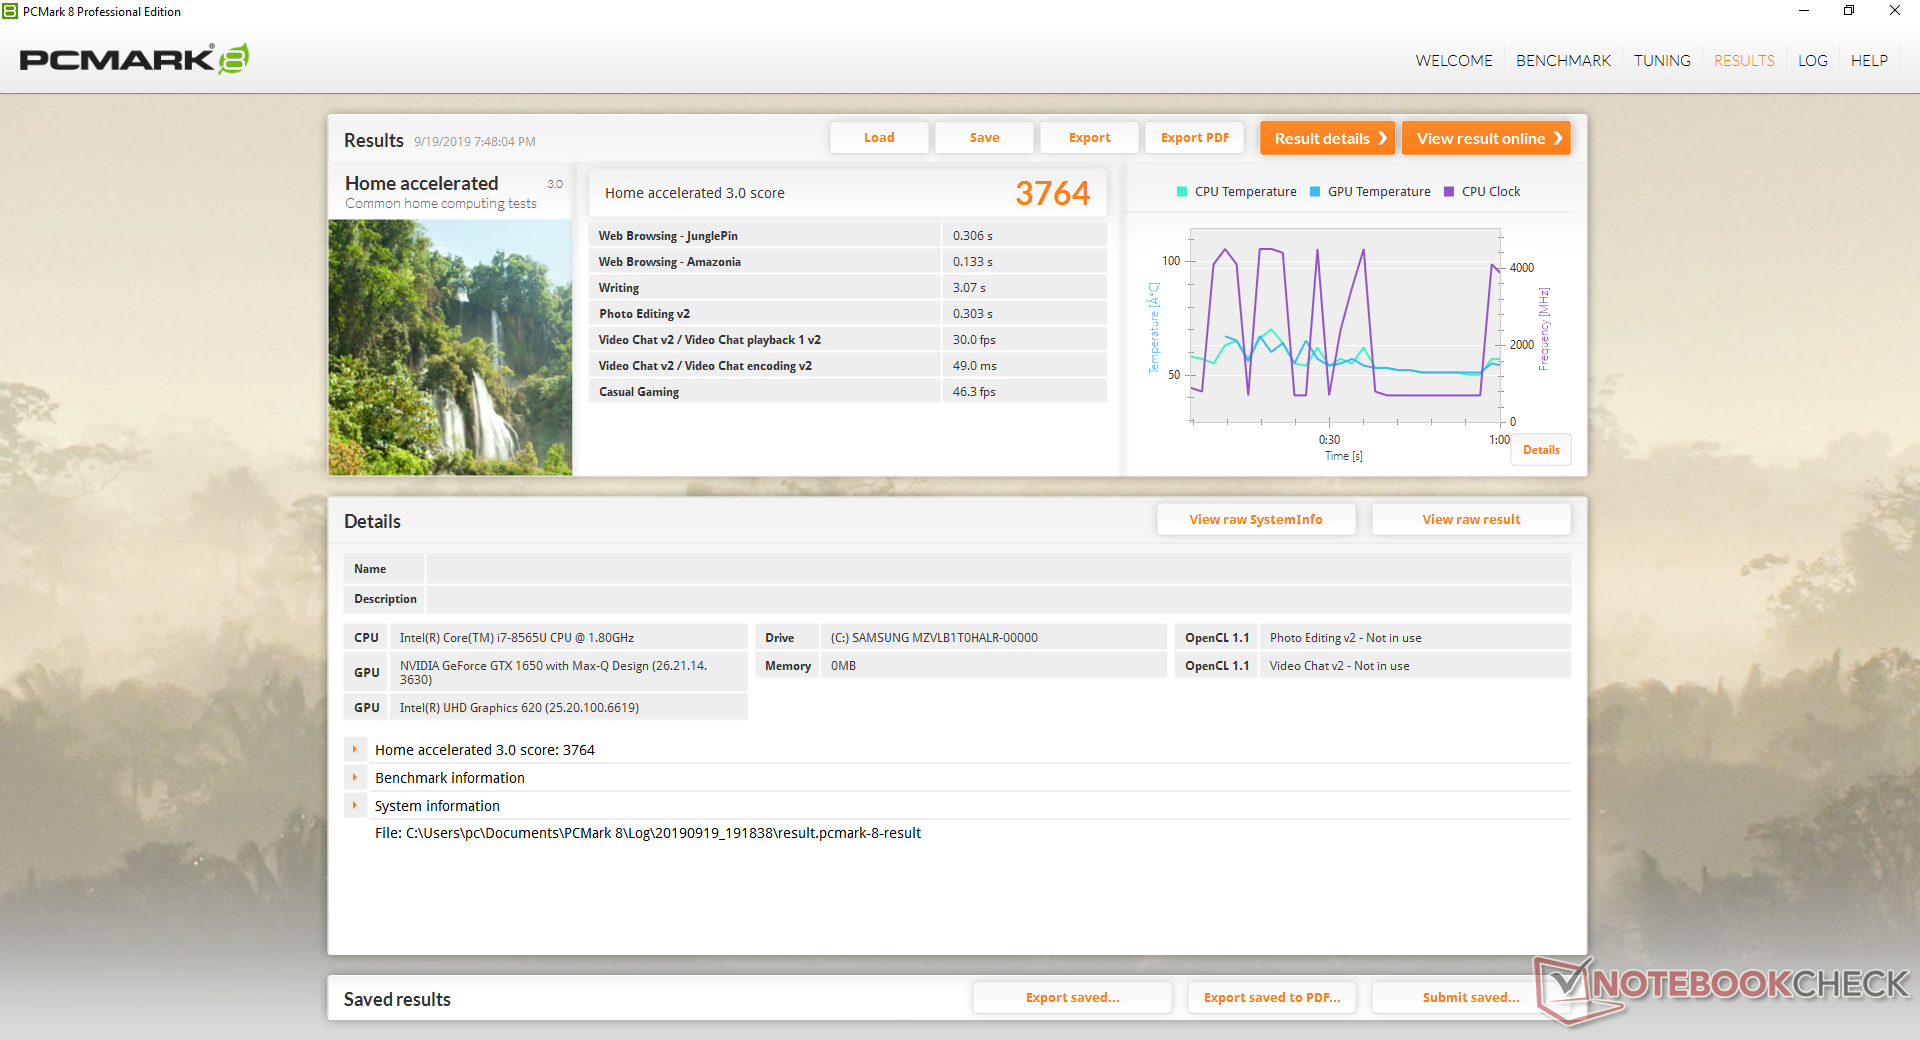
| PCMark 8 Home Score Accelerated v2 | 3764 points | |
| PCMark 8 Work Score Accelerated v2 | 5132 points | |
| PCMark 10 Score | 4828 points | |
Help | ||
Storage Devices - One Slot Only
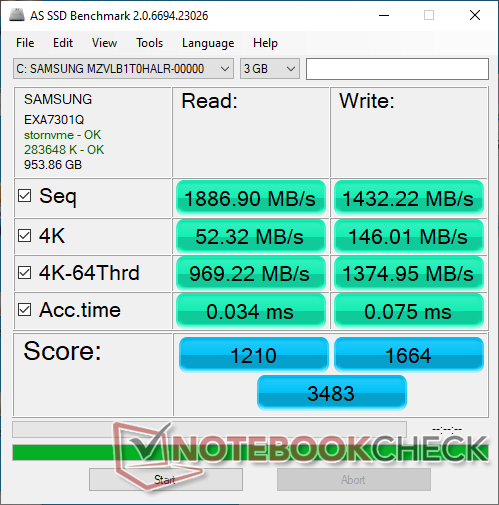
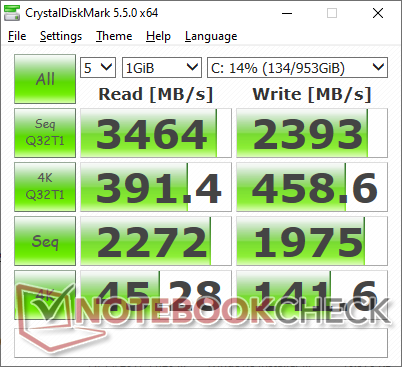
A single M.2 PCIe x4 2280 slot is available with no secondary options which can make storage expansion costly. The 1 TB Samsung SSD PM981 SSD in our unit is the same one as found on our ZenBook Pro Duo and so both systems share similar AS SSD and CDM results. Expect different drives depending on the retailer or online shop.
See our table of HDDs and SSDs for more benchmark comparisons.
| Asus ZenBook 15 UX534FT-DB77 Samsung SSD PM981 MZVLB1T0HALR | Dell XPS 15 7590 9980HK GTX 1650 Toshiba XG6 KXG60ZNV1T02 | HP Spectre x360 15-df0126ng Toshiba XG5-P KXG50PNV2T04 | Lenovo Yoga 730-15IKB SK Hynix PC401 512GB M.2 (HFS512GD9TNG) | Asus ZenBook Pro Duo UX581GV Samsung SSD PM981 MZVLB1T0HALR | Razer Blade 15 GTX 1660 Ti Samsung SSD PM981 MZVLB256HAHQ | |
|---|---|---|---|---|---|---|
| AS SSD | 18% | -43% | -25% | 7% | -14% | |
| Seq Read (MB/s) | 1887 | 1723 -9% | 2018 7% | 2158 14% | 1409 -25% | 1829 -3% |
| Seq Write (MB/s) | 1432 | 1386 -3% | 773 -46% | 680 -53% | 1316 -8% | 1315 -8% |
| 4K Read (MB/s) | 52.3 | 43.25 -17% | 24.62 -53% | 44.74 -14% | 44.99 -14% | 51.3 -2% |
| 4K Write (MB/s) | 146 | 98.3 -33% | 92.8 -36% | 123 -16% | 93 -36% | 106 -27% |
| 4K-64 Read (MB/s) | 969 | 1078 11% | 845 -13% | 623 -36% | 1092 13% | 917 -5% |
| 4K-64 Write (MB/s) | 1375 | 1456 6% | 957 -30% | 486 -65% | 1810 32% | 1212 -12% |
| Access Time Read * (ms) | 0.034 | 0.05 -47% | 0.147 -332% | 0.044 -29% | 0.041 -21% | 0.063 -85% |
| Access Time Write * (ms) | 0.075 | 0.039 48% | 0.057 24% | 0.051 32% | 0.118 -57% | 0.104 -39% |
| Score Read (Points) | 1210 | 1294 7% | 1071 -11% | 884 -27% | 1278 6% | 1152 -5% |
| Score Write (Points) | 1664 | 1693 2% | 1127 -32% | 677 -59% | 2034 22% | 1450 -13% |
| Score Total (Points) | 3483 | 3638 4% | 2684 -23% | 1951 -44% | 3970 14% | 3177 -9% |
| Copy ISO MB/s (MB/s) | 1375 | 3182 131% | 1652 20% | 1641 19% | 2112 54% | 1539 12% |
| Copy Program MB/s (MB/s) | 468 | 984 110% | 328.5 -30% | 390 -17% | 874 87% | 513 10% |
| Copy Game MB/s (MB/s) | 1287 | 1824 42% | 700 -46% | 574 -55% | 1677 30% | 1150 -11% |
* ... smaller is better

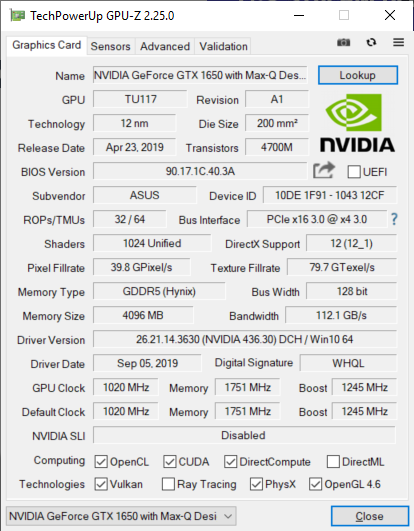
GPU Performance - Gaming Power in an Ultrabook Form Factor
The GTX 1650 Max-Q is performing where we expect it to be in relation to other laptops equipped with the same GPU. Users can expect almost 20 percent slower performance than the standard non-Max-Q GTX 1650 or almost 50 percent slower performance than the GTX 1660 Ti. Raw performance is actually quite similar to the last generation GTX 1050 Ti while being more power efficient in the process. As always, remember to enable DX12 if possible as Nvidia Turing has been optimized for the DX12 games.
Idling on Witcher 3 shows no sudden frame drops or interrupting background activity. The GPU is powerful enough to play even the latest titles at 1080p30 on Medium to High settings. 60 FPS is possible on lower settings but anything greater will begin to stress the ULV CPU.
See our dedicated page on the GTX 1650 Max-Q for more technical information and benchmark comparisons.
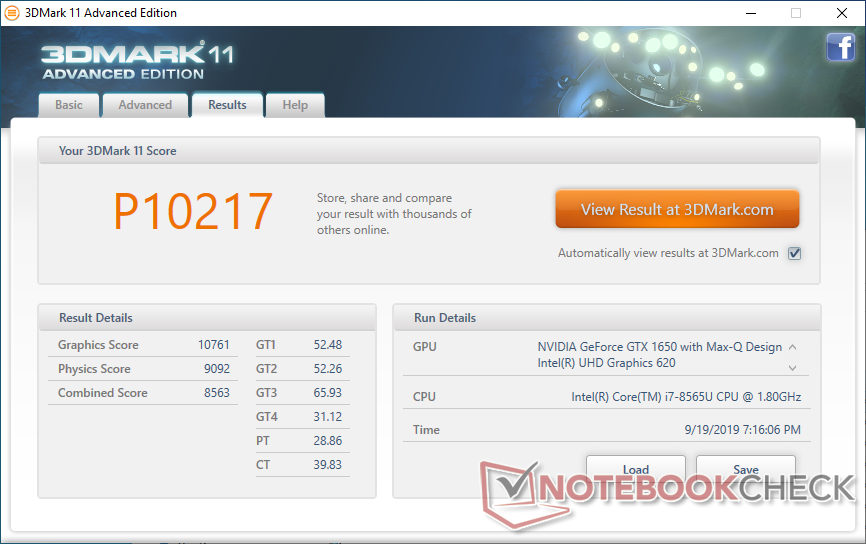
| 3DMark 11 Performance | 10217 points | |
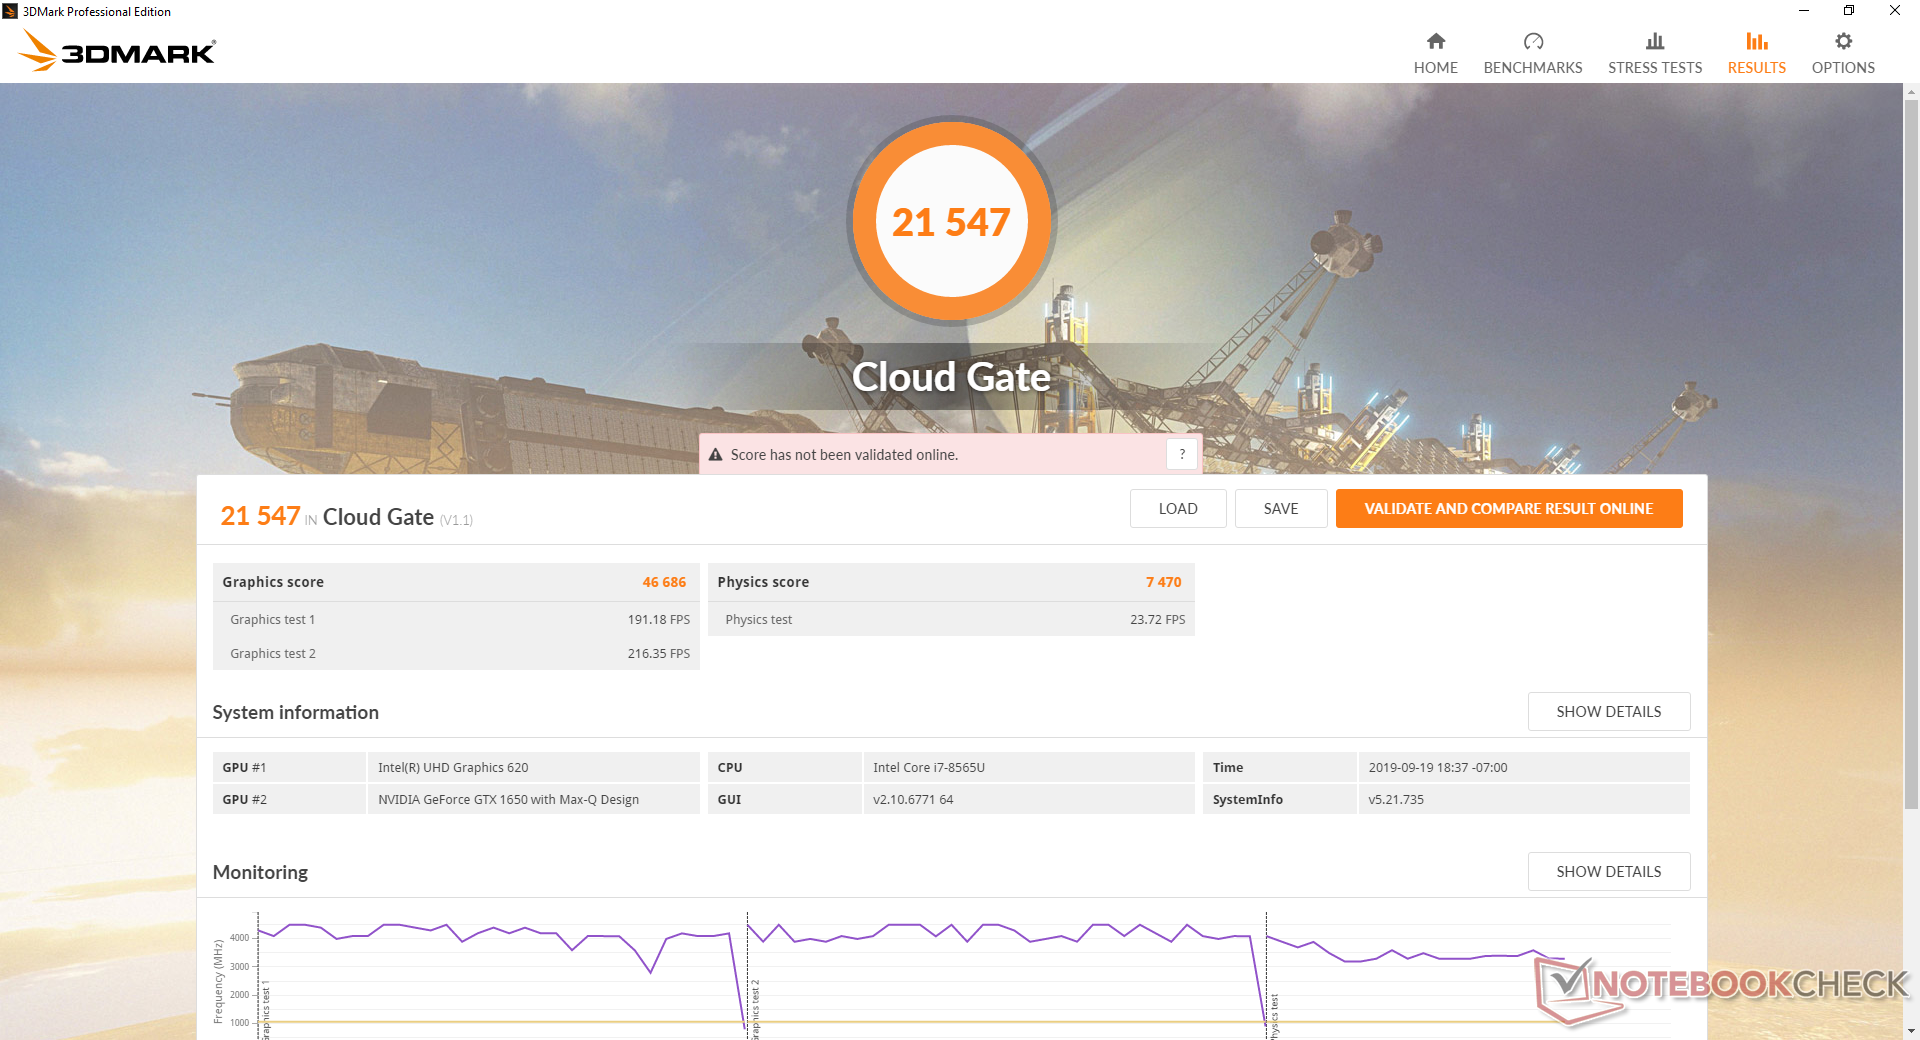
| 3DMark Cloud Gate Standard Score | 21547 points | |
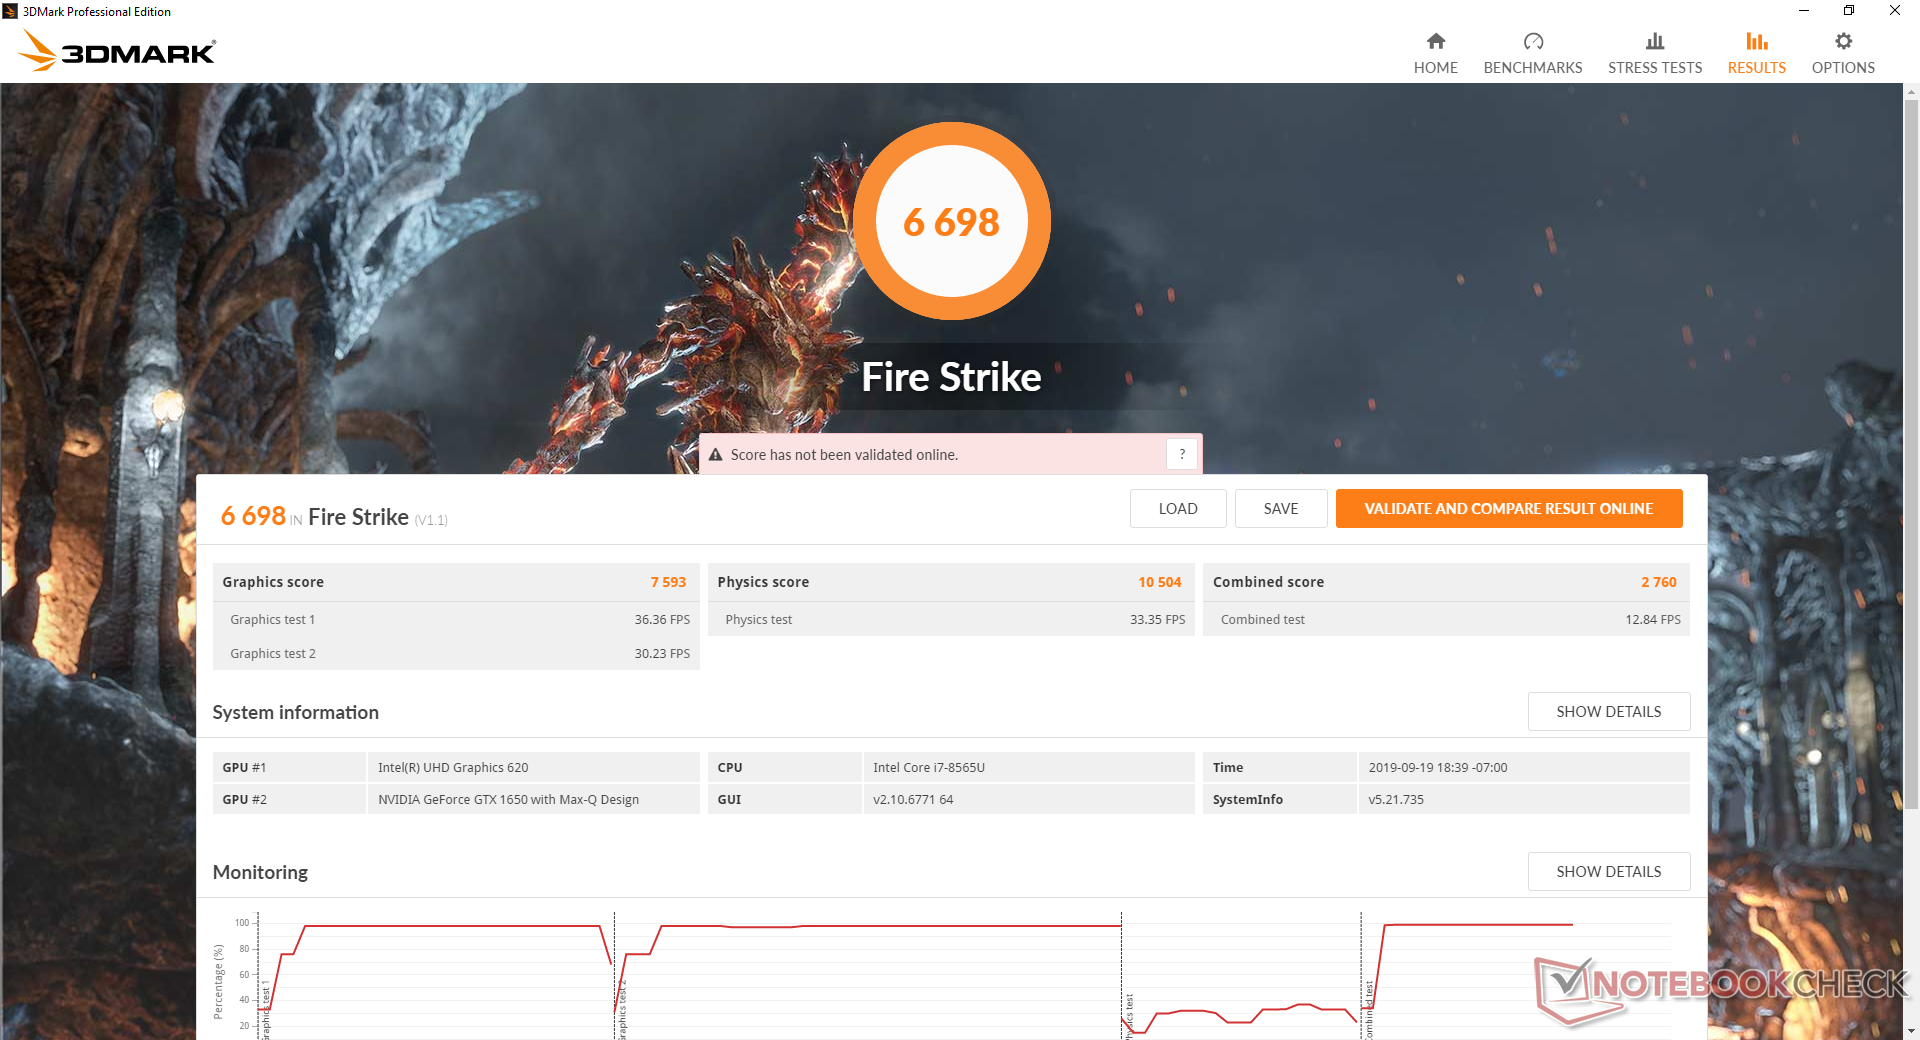
| 3DMark Fire Strike Score | 6698 points | |
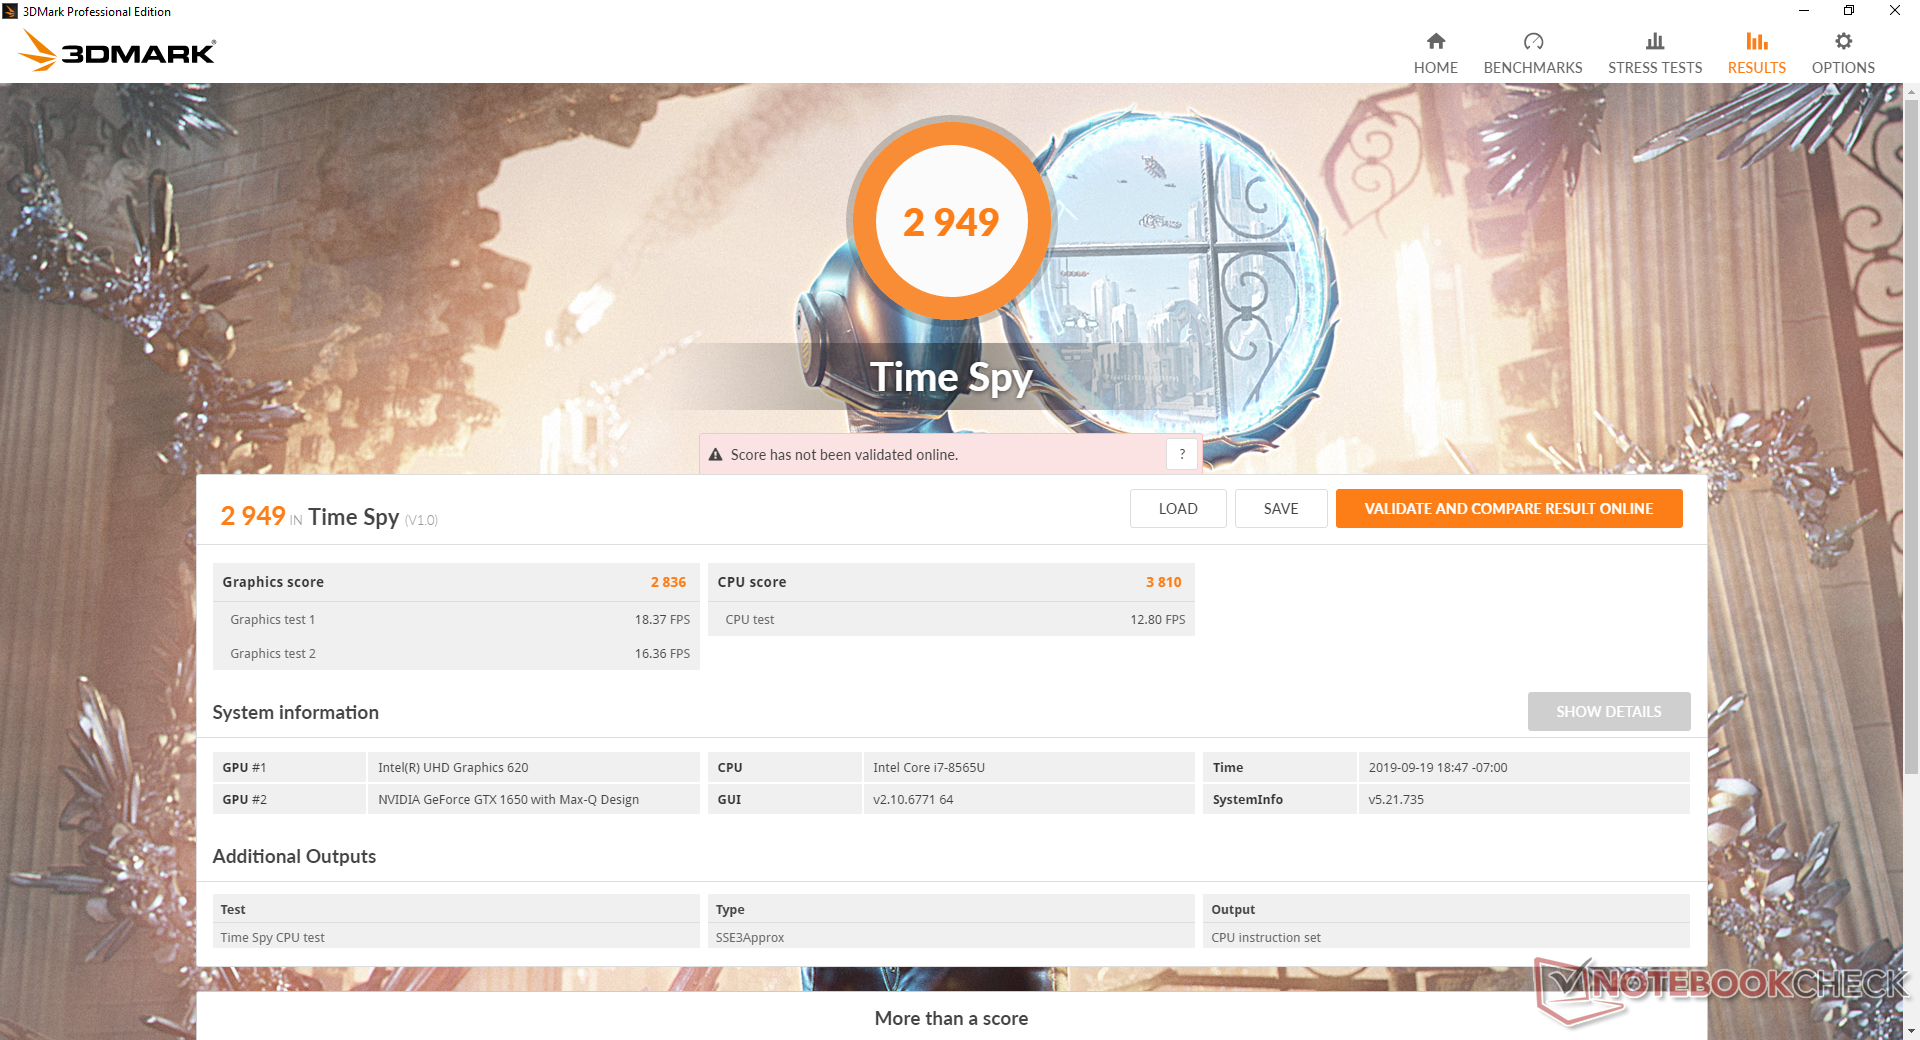
| 3DMark Time Spy Score | 2949 points | |
Help | ||
| low | med. | high | ultra | |
|---|---|---|---|---|
| BioShock Infinite (2013) | 259.1 | 196.1 | 172.2 | 72 |
| The Witcher 3 (2015) | 156.1 | 93.6 | 54.3 | 30.7 |
| Rocket League (2017) | 216.1 | 138.1 | 97.8 | |
| Shadow of the Tomb Raider (2018) | 92 | 48 | 39 | 34 |
Emissions
System Noise - Just Slightly Noisier than a typical Ultrabook
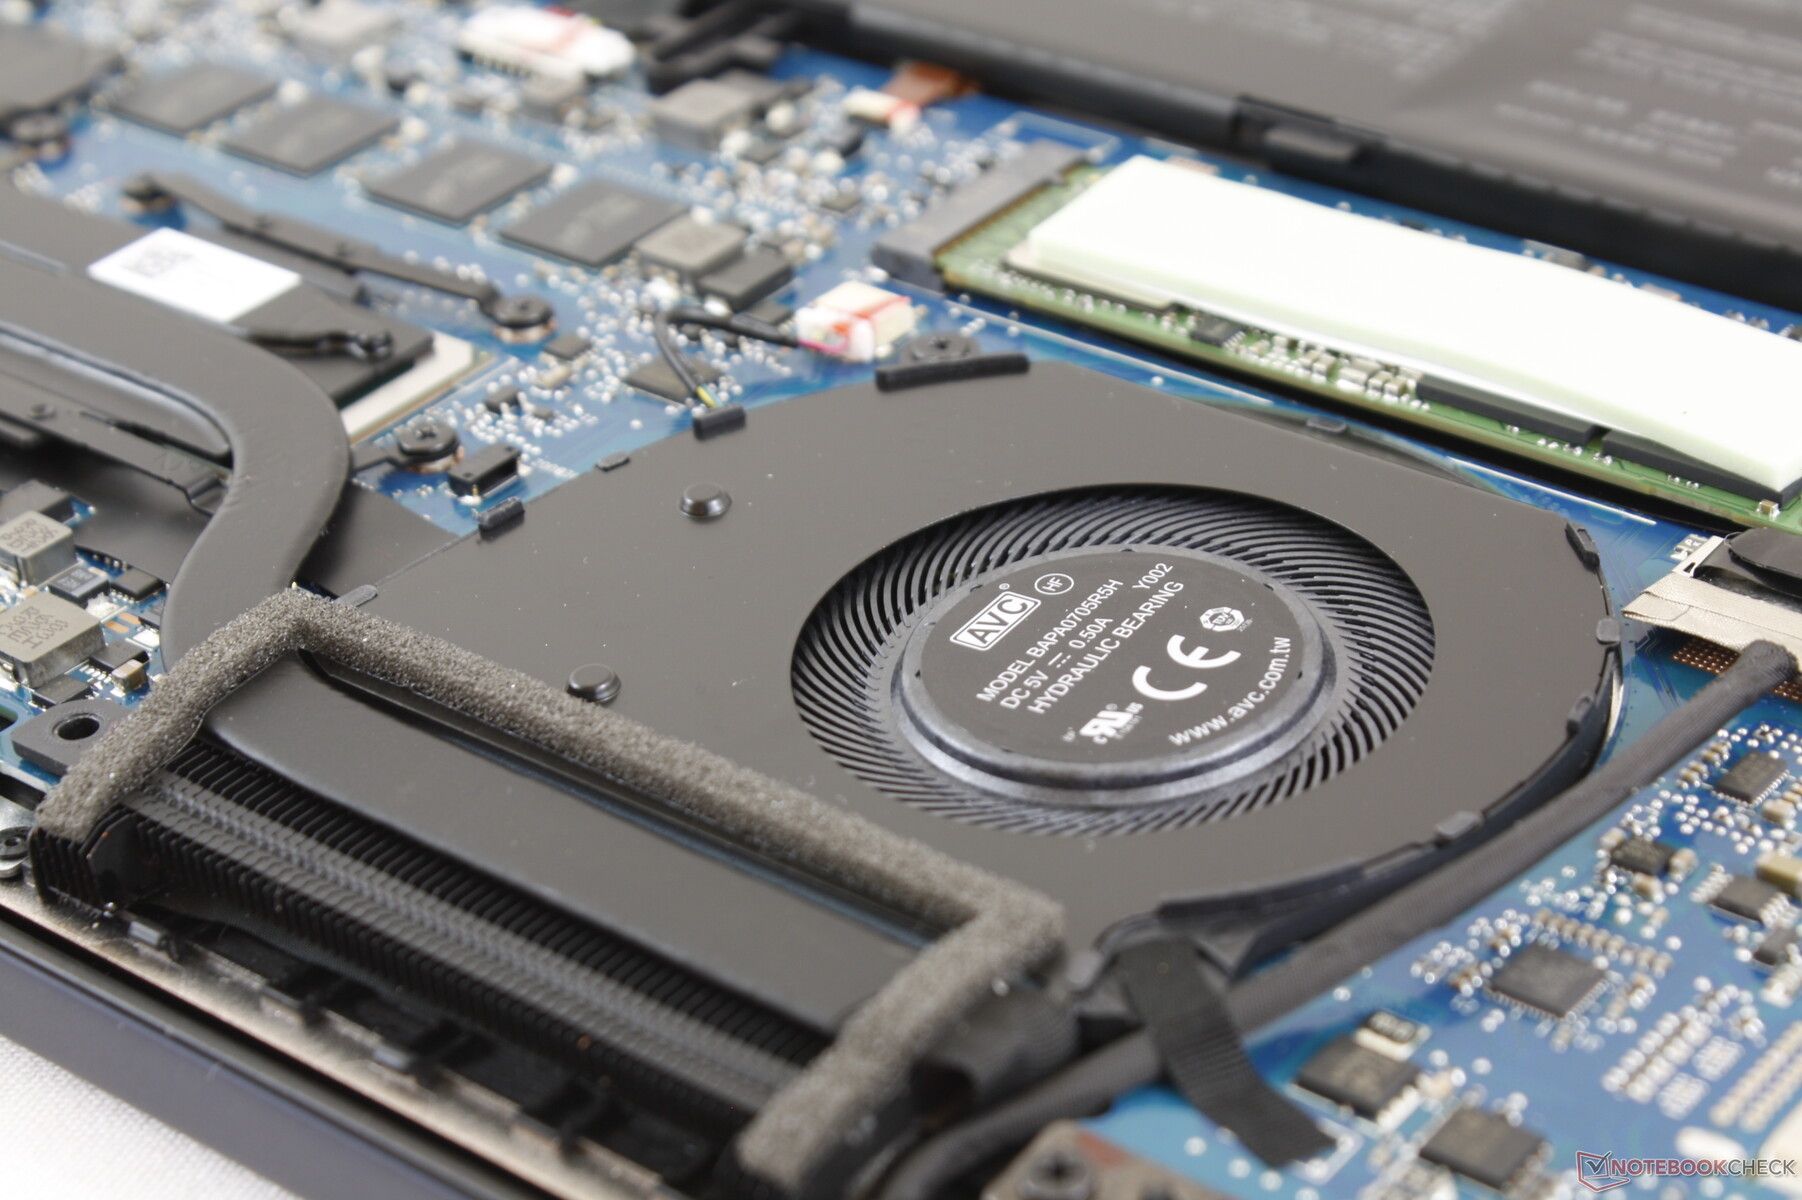
The cooling solution consists of twin ~45 mm fans and just two heat pipes between them. When browsing, emailing, or video streaming, fan noise remains quiet at under 32.5 dB(A). Both fans almost never pulse and the will even idle when the system is idling on desktop.
Fan noise when gaming is just under 40 dB(A) to be quieter than dedicated gaming laptops where the high 40 dB(A) to low 50 dB(A) range is common. Most Ultrabooks tend to max out at under 40 dB(A) as well.
We're able to notice very slight coil whine on our unit that only becomes noticeable when placing an ear on the keyboard.

| Asus ZenBook 15 UX534FT-DB77 GeForce GTX 1650 Max-Q, i7-8565U, Samsung SSD PM981 MZVLB1T0HALR | Dell XPS 15 7590 9980HK GTX 1650 GeForce GTX 1650 Mobile, i9-9980HK, Toshiba XG6 KXG60ZNV1T02 | Asus ZenBook Pro Duo UX581GV GeForce RTX 2060 Mobile, i9-9980HK, Samsung SSD PM981 MZVLB1T0HALR | Razer Blade 15 GTX 1660 Ti GeForce GTX 1660 Ti Mobile, i7-9750H, Samsung SSD PM981 MZVLB256HAHQ | HP Spectre x360 15-df0126ng GeForce GTX 1050 Ti Max-Q, i7-8750H, Toshiba XG5-P KXG50PNV2T04 | Lenovo Yoga 730-15IKB GeForce GTX 1050 Mobile, i5-8550U, SK Hynix PC401 512GB M.2 (HFS512GD9TNG) | |
|---|---|---|---|---|---|---|
| Noise | -10% | -6% | -13% | -9% | -5% | |
| off / environment * (dB) | 28.4 | 28.2 1% | 28.4 -0% | 28.5 -0% | 30.4 -7% | 30.5 -7% |
| Idle Minimum * (dB) | 28.4 | 28.2 1% | 29 -2% | 30.3 -7% | 30.4 -7% | 30.5 -7% |
| Idle Average * (dB) | 28.4 | 28.2 1% | 29 -2% | 30.5 -7% | 30.4 -7% | 30.5 -7% |
| Idle Maximum * (dB) | 28.4 | 30.4 -7% | 29 -2% | 30.5 -7% | 31.6 -11% | 30.5 -7% |
| Load Average * (dB) | 33.9 | 43.8 -29% | 35.4 -4% | 41 -21% | 43.2 -27% | 37.5 -11% |
| Witcher 3 ultra * (dB) | 39.8 | 47.2 -19% | 42 -6% | 48 -21% | ||
| Load Maximum * (dB) | 40.2 | 47.2 -17% | 50 -24% | 51.9 -29% | 38.3 5% | 37.5 7% |
* ... smaller is better
Noise level
| Idle |
| 28.4 / 28.4 / 28.4 dB(A) |
| Load |
| 33.9 / 40.2 dB(A) |
 | ||
30 dB silent 40 dB(A) audible 50 dB(A) loud |
||
min: | ||
Temperature
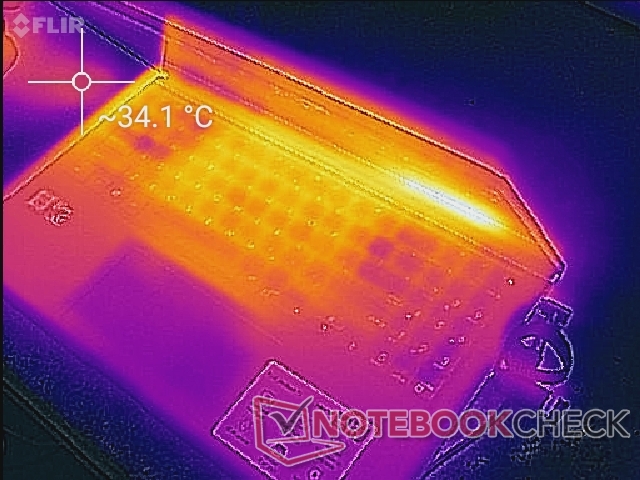
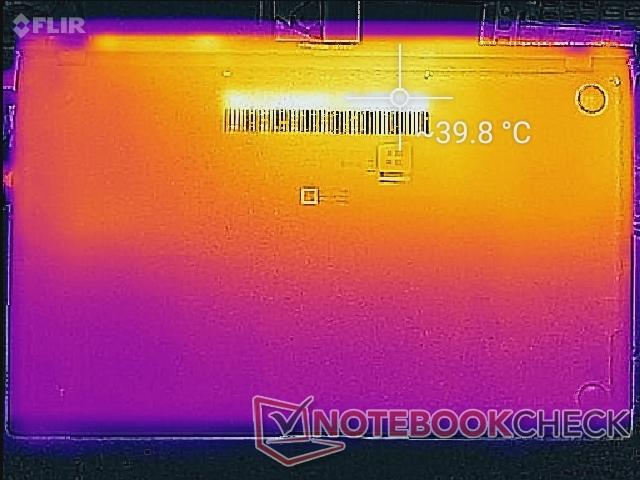
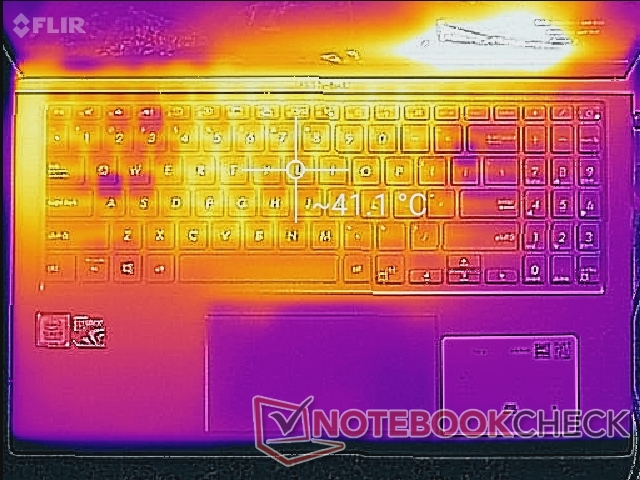
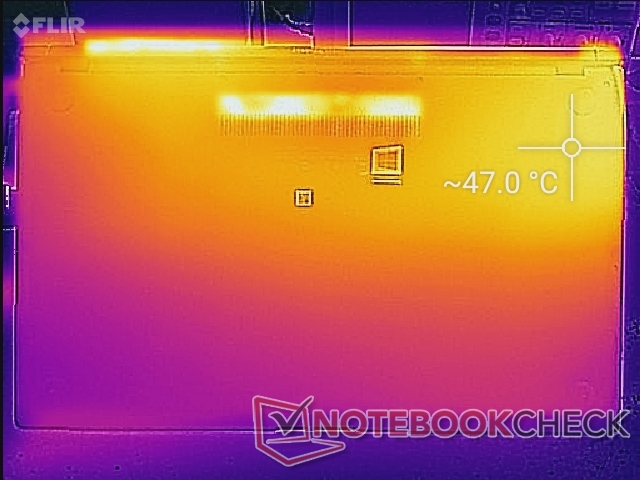
Surface temperatures are warm even when simply idling on desktop. We're able to measure hot spots of 35 C and 40 C on the top and bottom surfaces, respectively. When under gaming stress, these hot spots can become as warm as 45 C to 47 C each. These temperatures are actually quite close to what we recorded on the 2018 Apple MacBook Pro 15.
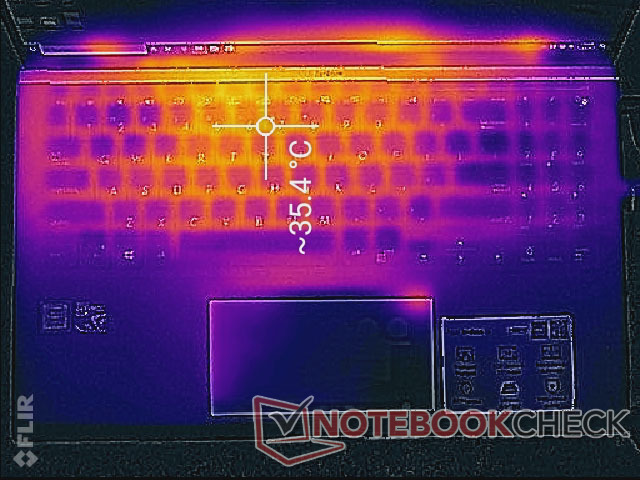
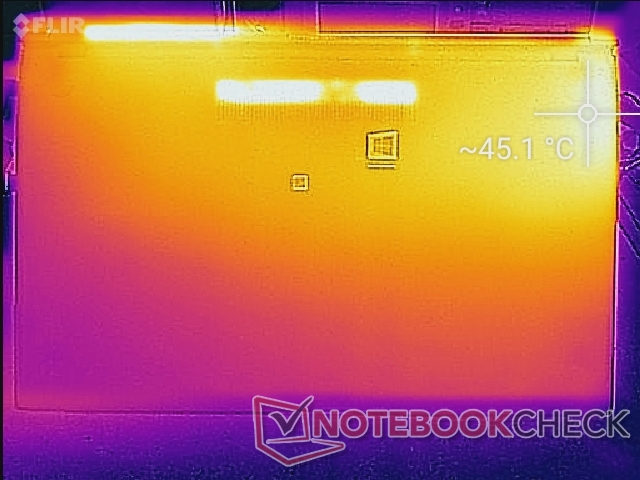
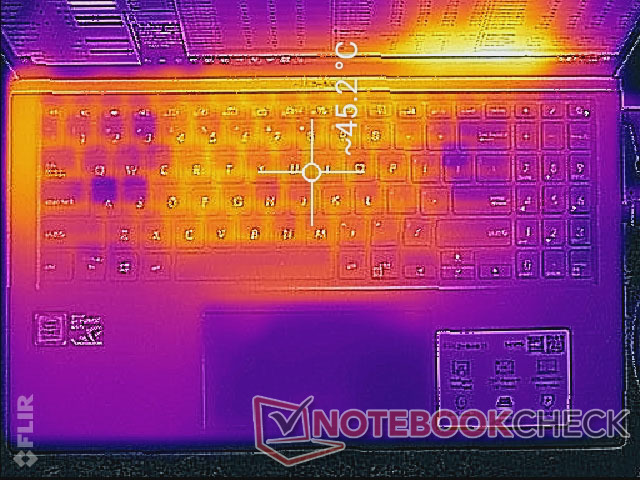
(-) The maximum temperature on the upper side is 45.4 °C / 114 F, compared to the average of 36.8 °C / 98 F, ranging from 21 to 71 °C for the class Multimedia.
(-) The bottom heats up to a maximum of 51.6 °C / 125 F, compared to the average of 39.1 °C / 102 F
(+) In idle usage, the average temperature for the upper side is 31.6 °C / 89 F, compared to the device average of 31.3 °C / 88 F.
(±) Playing The Witcher 3, the average temperature for the upper side is 34.7 °C / 94 F, compared to the device average of 31.3 °C / 88 F.
(+) The palmrests and touchpad are reaching skin temperature as a maximum (35 °C / 95 F) and are therefore not hot.
(-) The average temperature of the palmrest area of similar devices was 28.7 °C / 83.7 F (-6.3 °C / -11.3 F).
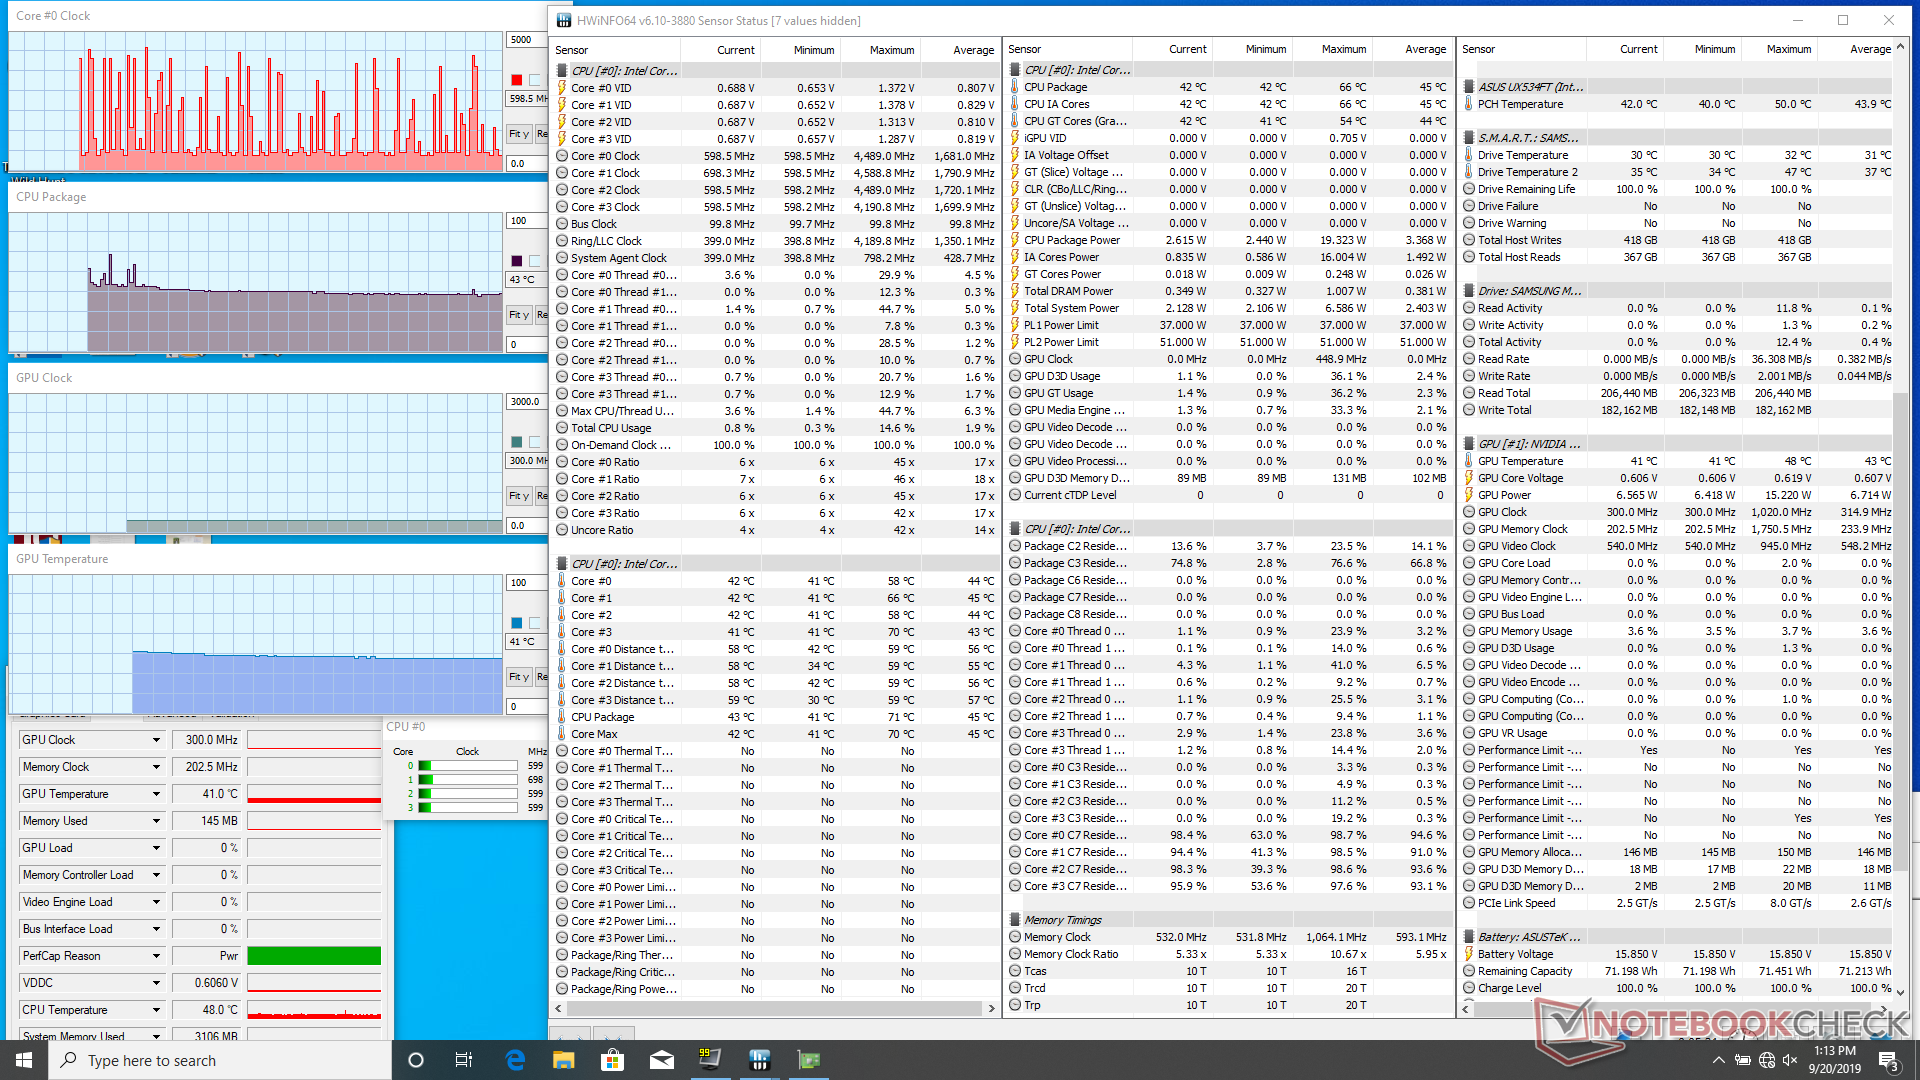
Stress Test
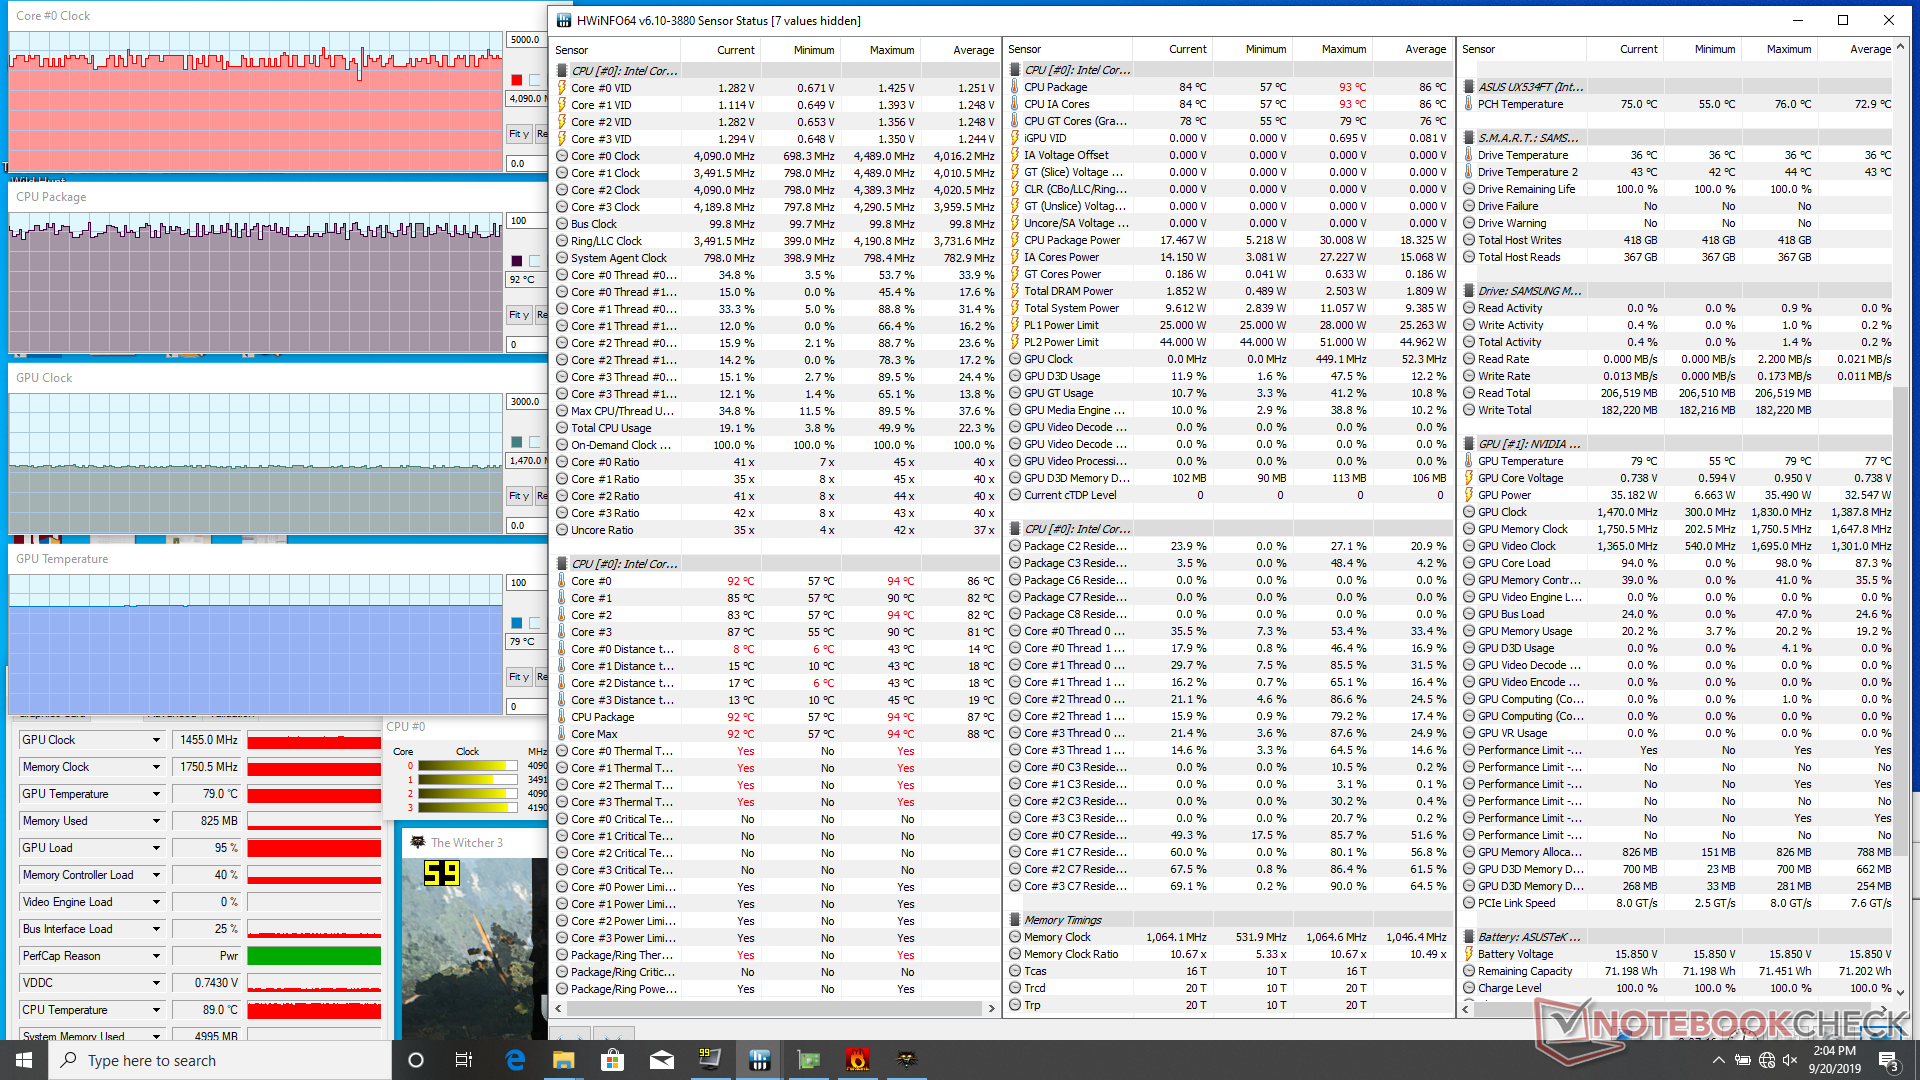
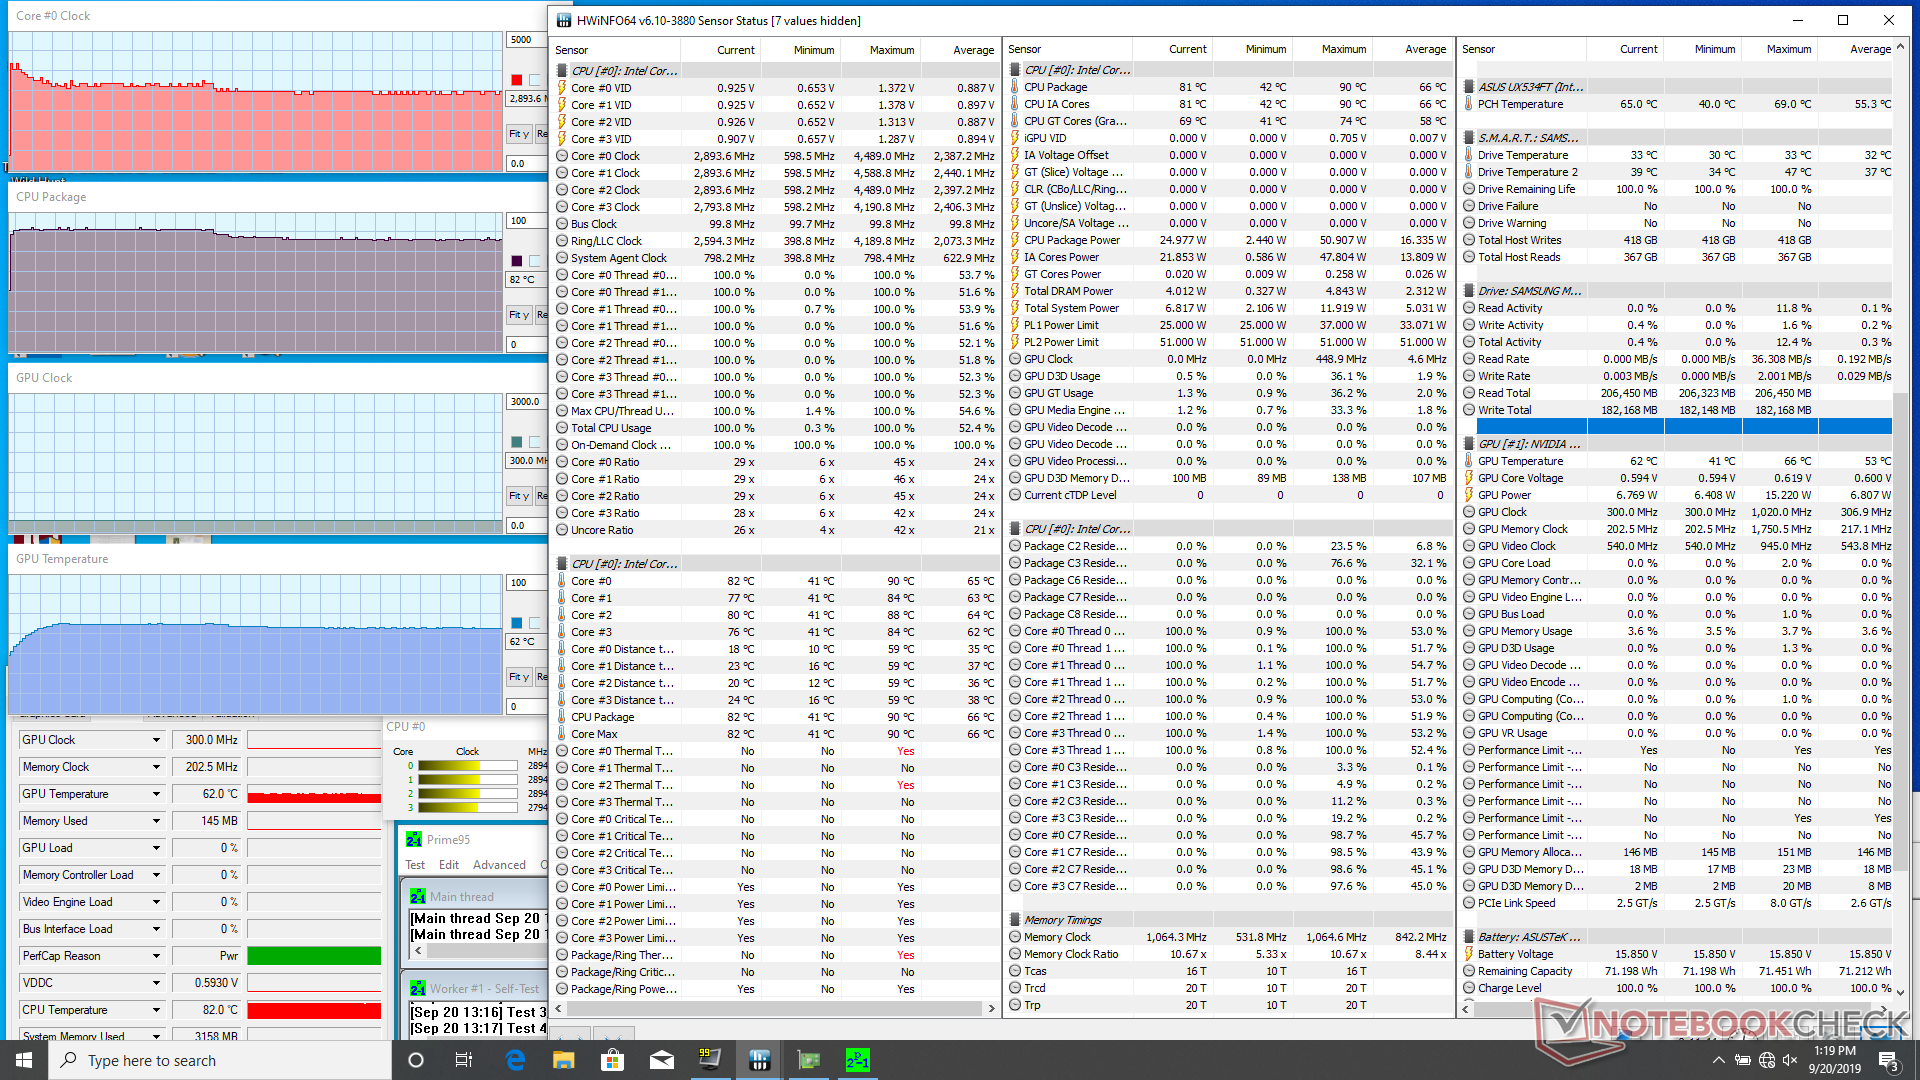
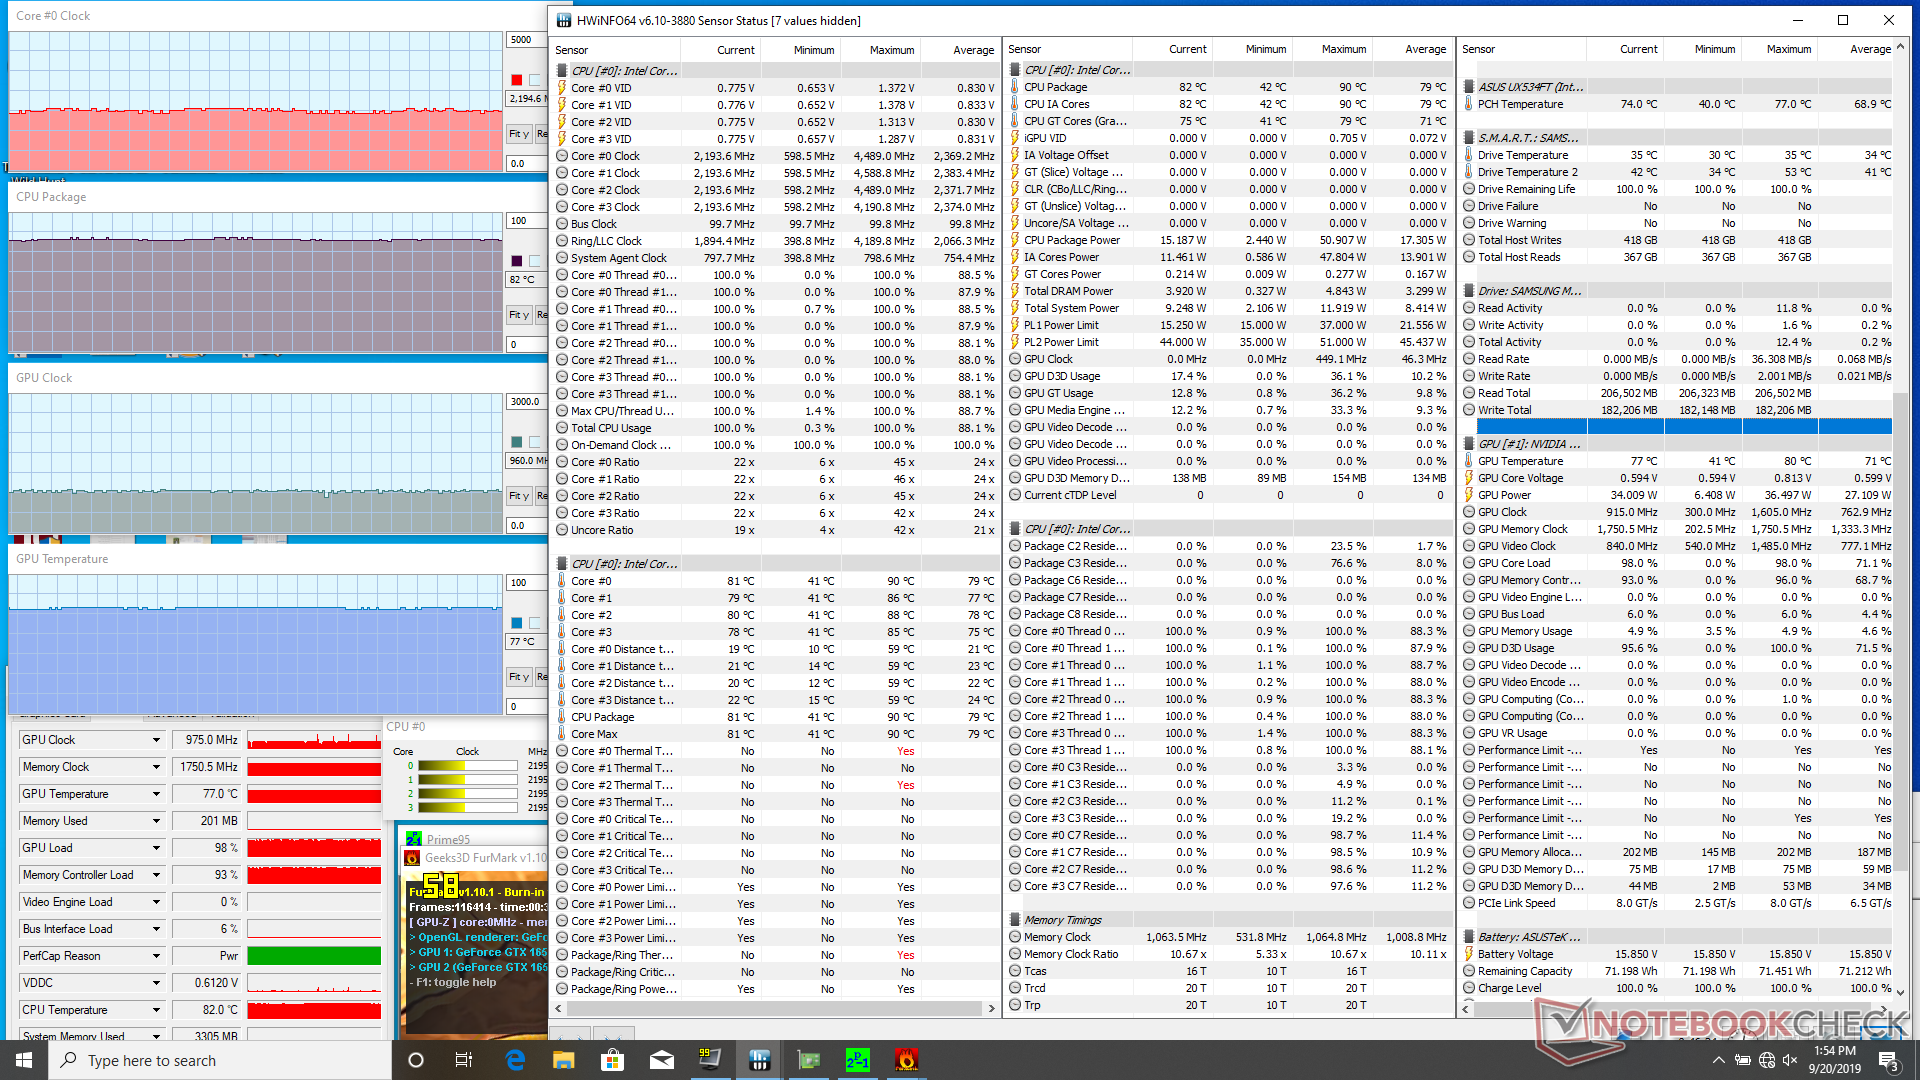
When subjected to Prime95 stress, clock rates will spike to 3.7 GHz for the first few seconds until hitting a core temperature of 89 C. Thereafter, clock rates steadily drop until they stabilize at the 2.7 to 2.8 GHz range in order to maintain a cooler core temperature of 82 C. When running Witcher 3, CPU and GPU temperatures will stabilize at 92 C and 79 C, respectively, to be significantly warmer than most other Ultrabooks with ULV CPUs. This same CPU in the VivoBook S15 S532F, for example, stabilizes at only 78 C when under the same gaming conditions.
Surprisingly, running on battery power will not limit performance by all that much. A Fire Strike run on batteries returns Physics and Graphics scores of 9384 and 7032 points, respectively, compared to 10504 and 7593 points when on mains.
| CPU Clock (GHz) | GPU Clock (MHz) | Average CPU Temperature (°C) | Average GPU Temperature (°C) | |
| System Idle | -- | -- | 43 | 41 |
| Prime95 Stress | 2.7 - 2.8 | -- | 82 | 62 |
| Prime95 + FurMark Stress | 2.2 | 975 | 82 | 77 |
| Witcher 3 Stress | ~4.1 | 1455 | 92 | 79 |
Speakers


Asus ZenBook 15 UX534FT-DB77 audio analysis
(±) | speaker loudness is average but good (77.5 dB)
Bass 100 - 315 Hz
(±) | reduced bass - on average 12.4% lower than median
(±) | linearity of bass is average (14.9% delta to prev. frequency)
Mids 400 - 2000 Hz
(+) | balanced mids - only 4.5% away from median
(+) | mids are linear (5.8% delta to prev. frequency)
Highs 2 - 16 kHz
(+) | balanced highs - only 2.6% away from median
(±) | linearity of highs is average (7.4% delta to prev. frequency)
Overall 100 - 16.000 Hz
(±) | linearity of overall sound is average (19% difference to median)
Compared to same class
» 60% of all tested devices in this class were better, 7% similar, 33% worse
» The best had a delta of 5%, average was 17%, worst was 45%
Compared to all devices tested
» 45% of all tested devices were better, 7% similar, 48% worse
» The best had a delta of 4%, average was 23%, worst was 134%
Apple MacBook 12 (Early 2016) 1.1 GHz audio analysis
(+) | speakers can play relatively loud (83.6 dB)
Bass 100 - 315 Hz
(±) | reduced bass - on average 11.3% lower than median
(±) | linearity of bass is average (14.2% delta to prev. frequency)
Mids 400 - 2000 Hz
(+) | balanced mids - only 2.4% away from median
(+) | mids are linear (5.5% delta to prev. frequency)
Highs 2 - 16 kHz
(+) | balanced highs - only 2% away from median
(+) | highs are linear (4.5% delta to prev. frequency)
Overall 100 - 16.000 Hz
(+) | overall sound is linear (10.2% difference to median)
Compared to same class
» 7% of all tested devices in this class were better, 2% similar, 91% worse
» The best had a delta of 5%, average was 18%, worst was 53%
Compared to all devices tested
» 5% of all tested devices were better, 1% similar, 94% worse
» The best had a delta of 4%, average was 23%, worst was 134%
Energy Management
Power Consumption - Efficient with Long Runtimes
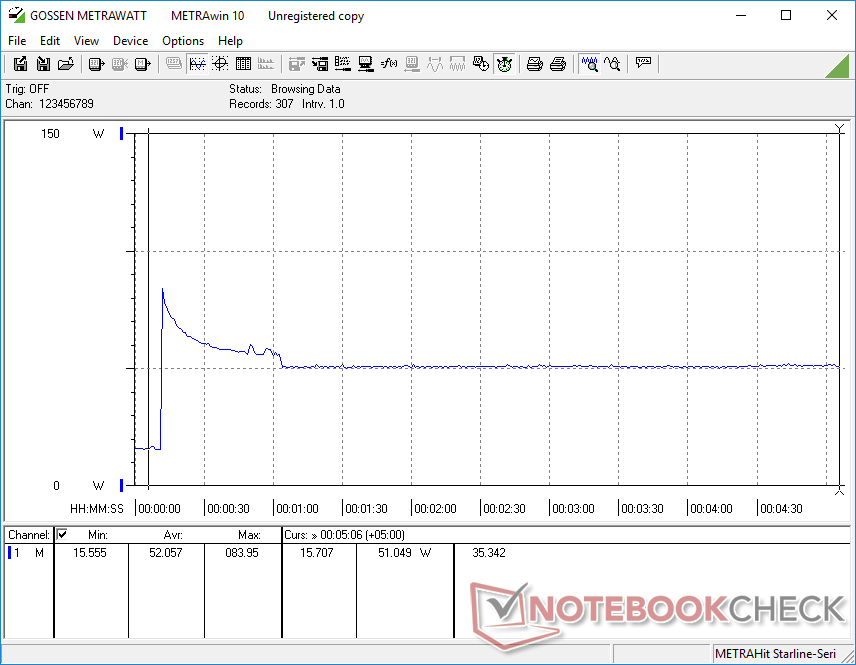
Idling on desktop consumes between 5 W and 24 W compared to just 3 W and 11 W on the UX533. The power consumption difference between a disabled ScreenPad and an active ScreenPad on maximum brightness is only about 4 W. The system is significantly more power efficient than last year's ZenBook Pro 15 UX580 which partly explains the impressive battery life results in our next section.
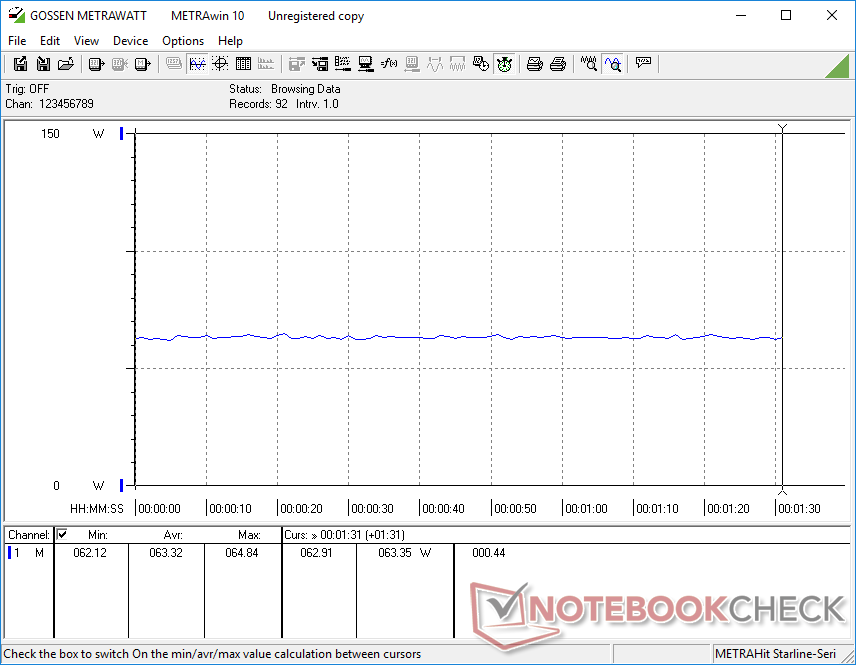
When running Witcher 3, consumption jumps to 63 W compared to 92 W and 86 W on the XPS 15 7590 (GTX 1650) and HP Pavilion Gaming 15 (GTX 1050 Ti), respectively. The Intel U-series CPU of the ZenBook 15 UX534 allows for higher power savings than the Core H-powered XPS 15 or HP Spectre x360 15 families.
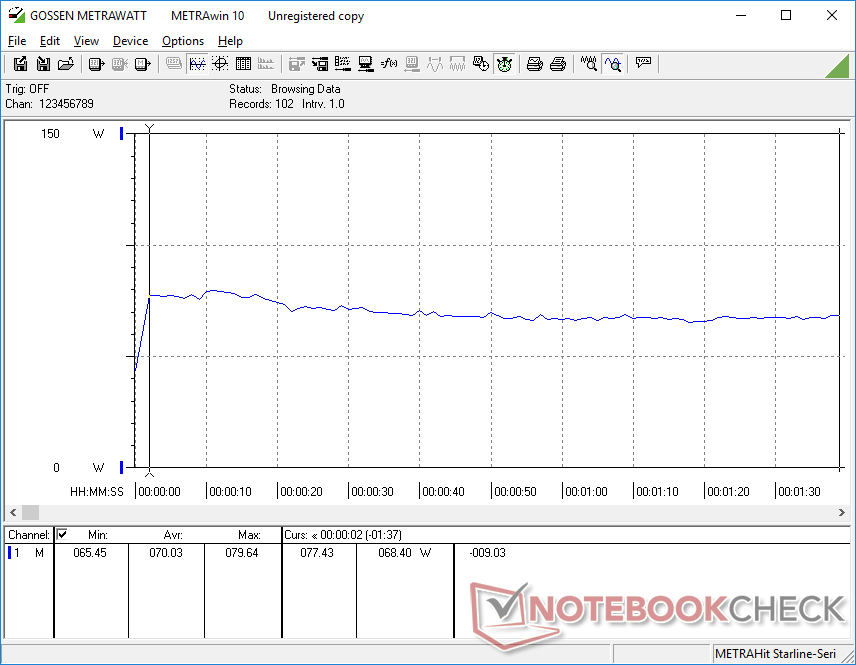
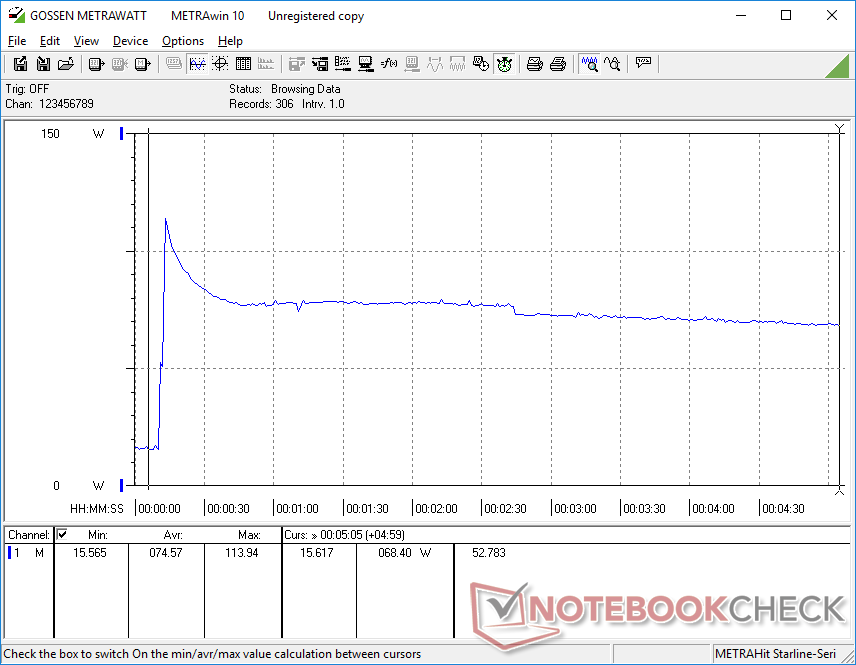
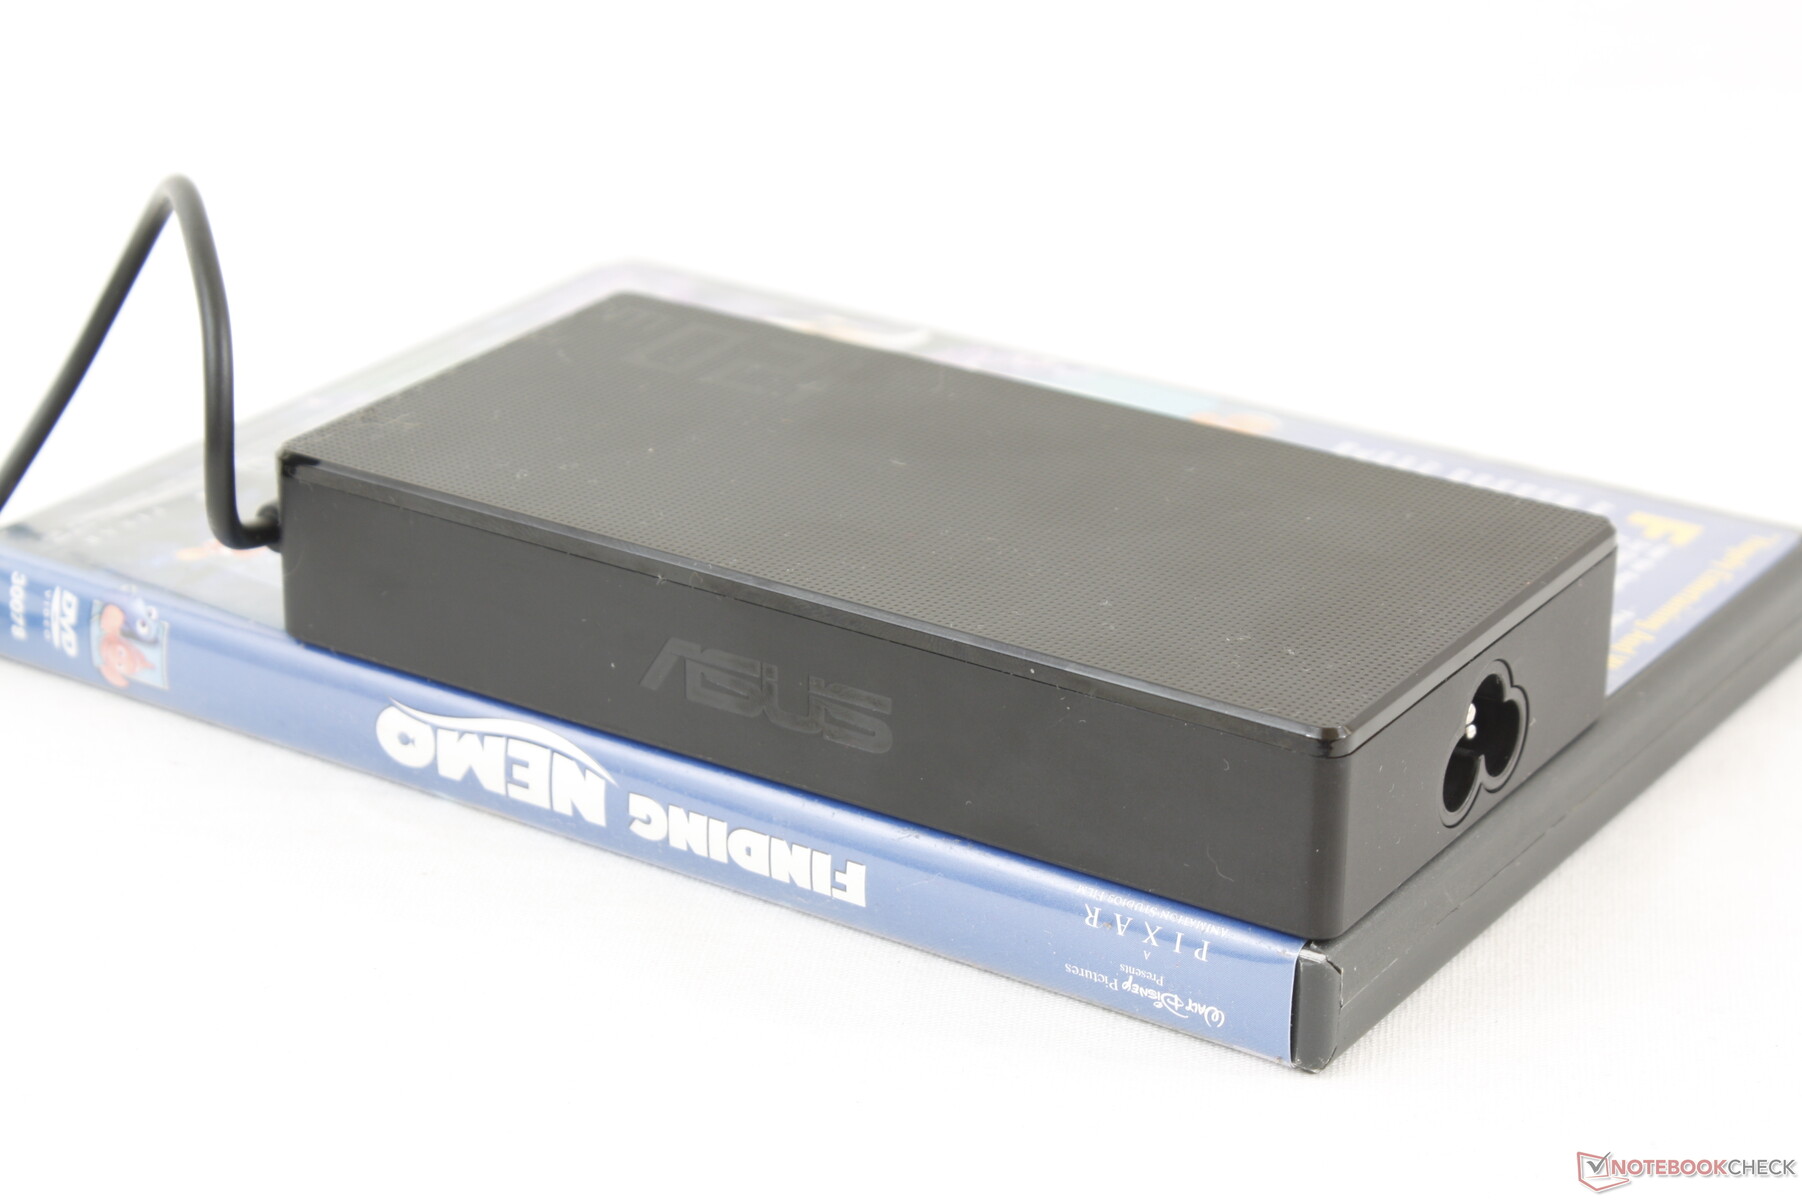
At worst, we're able to record a maximum spike of 114 W from the small-medium (~13.7 x 6.8 x 2.4 cm) 120 W AC adapter when running both Prime95 and FurMark simultaneously. Consumption eventually falls to 69 W after the initial spike due to thermal limitations when under such extreme processing loads.
| Off / Standby | |
| Idle | |
| Load |
|
Key:
min: | |
| Asus ZenBook 15 UX534FT-DB77 i7-8565U, GeForce GTX 1650 Max-Q, Samsung SSD PM981 MZVLB1T0HALR, IPS, 1920x1080, 15.6" | Dell XPS 15 7590 9980HK GTX 1650 i9-9980HK, GeForce GTX 1650 Mobile, Toshiba XG6 KXG60ZNV1T02, OLED, 3840x2160, 15.6" | Asus ZenBook Pro Duo UX581GV i9-9980HK, GeForce RTX 2060 Mobile, Samsung SSD PM981 MZVLB1T0HALR, OLED, 3840x2160, 15.6" | Razer Blade 15 GTX 1660 Ti i7-9750H, GeForce GTX 1660 Ti Mobile, Samsung SSD PM981 MZVLB256HAHQ, IPS, 1920x1080, 15.6" | Apple MacBook Pro 15 2018 (2.6 GHz, 560X) i7-8850H, Radeon Pro 560X, Apple SSD AP0512, IPS, 2880x1800, 15.4" | Lenovo Yoga 730-15IKB i5-8550U, GeForce GTX 1050 Mobile, SK Hynix PC401 512GB M.2 (HFS512GD9TNG), IPS, 3840x2160, 15.6" | HP Spectre x360 15-df0126ng i7-8750H, GeForce GTX 1050 Ti Max-Q, Toshiba XG5-P KXG50PNV2T04, IPS, 3840x2160, 15.6" | |
|---|---|---|---|---|---|---|---|
| Power Consumption | -16% | -108% | -117% | 19% | 27% | 27% | |
| Idle Minimum * (Watt) | 5 | 6.2 -24% | 19.3 -286% | 18.7 -274% | 3.4 32% | 4.8 4% | 2.1 58% |
| Idle Average * (Watt) | 13.2 | 9.6 27% | 24.2 -83% | 30.7 -133% | 11 17% | 10.1 23% | 6.7 49% |
| Idle Maximum * (Watt) | 24 | 21.2 12% | 24.5 -2% | 33.9 -41% | 14.9 38% | 10.7 55% | 11.4 52% |
| Load Average * (Watt) | 70 | 104.3 -49% | 122.3 -75% | 93.4 -33% | 78.9 -13% | 44 37% | 77.7 -11% |
| Witcher 3 ultra * (Watt) | 63.3 | 91.7 -45% | 137 -116% | 158.9 -151% | |||
| Load Maximum * (Watt) | 114 | 135.3 -19% | 208.4 -83% | 195.3 -71% | 91.2 20% | 94.7 17% | 131.5 -15% |
* ... smaller is better
Battery Life
Runtimes are not all that different from the ZenBook 15 UX533. Battery capacity remains almost the same between them (71 Wh vs. 73 Wh) with real-world WLAN runtimes approaching 8.5 hours each. Results are much better than what we were expecting since the ZenBook Pro Duo and older ZenBook Pro 15 UX580 both exhibited shorter runtimes.
Charging from empty to full capacity takes about 1.5 hours. Attempting to recharge the laptop via USB Type-C will not work.
| Asus ZenBook 15 UX534FT-DB77 i7-8565U, GeForce GTX 1650 Max-Q, 71 Wh | Dell XPS 15 7590 9980HK GTX 1650 i9-9980HK, GeForce GTX 1650 Mobile, 97 Wh | HP Spectre x360 15-df0126ng i7-8750H, GeForce GTX 1050 Ti Max-Q, 84 Wh | Lenovo Yoga 730-15IKB i5-8550U, GeForce GTX 1050 Mobile, 51.5 Wh | Asus ZenBook Pro Duo UX581GV i9-9980HK, GeForce RTX 2060 Mobile, 71 Wh | Razer Blade 15 GTX 1660 Ti i7-9750H, GeForce GTX 1660 Ti Mobile, 65 Wh | |
|---|---|---|---|---|---|---|
| Battery runtime | -7% | -10% | -48% | -47% | -35% | |
| Reader / Idle (h) | 21.5 | 15.2 -29% | 18.8 -13% | 11.6 -46% | 13.1 -39% | |
| WiFi v1.3 (h) | 8.4 | 7.8 -7% | 8.8 5% | 6.2 -26% | 4.1 -51% | 5.5 -35% |
| Load (h) | 2.9 | 3.3 14% | 2.3 -21% | 0.8 -72% | 1.4 -52% |
Pros
Cons
Verdict

The ZenBook 15 UX533 and UX534 offer something that most other 15.6-inch Ultrabooks don't: An ULV Intel CPU paired with a GeForce GTX 1650 Max-Q GPU. Competitors like the Dell XPS 15 or HP Spectre x360 15 have faster Core H-series CPUs with GTX 1650 options and they are subsequently larger and heavier than the ZenBook. These processors are best for content creators and digital artists and so they tend to be overkill for tasks like web browsing, video streaming, or word processing. The ZenBook 15 UX533/UX534 is the middle-ground solution fit for everyday multimedia loads while offering nearly the same gaming performance as the aforementioned Dell or HP systems but in a more power efficient package. With dedicated gaming laptops being threatened by the like of Google Stadia, the ZenBook 15 UX534 walks a comfortable line between an Ultrabook and an entry-level gaming machine.
The wild card for Asus is its ScreenPad as it entails an additional $200. If your ZenBook is going to be anchored at home or on a desk most of the time, then you would be better off investing that $200 on a proper external monitor instead. If you do a lot of multi-tasking between tabs and windows at coffee shops, airports, or out of office, then there is a lot of value in having a second screen everywhere you go. Be prepared to carry an external mouse with you to better exploit the dual monitor setup.
The ZenBook 15 UX534 is more efficient than most other Ultrabooks of its size class when it comes to gaming. You'll have to give up Thunderbolt 3 and Core H-series CPUs in the process, but you might not even notice these omissions if you plan on using the ZenBook mostly for multimedia playback, gaming, and word processing when on the go.
Asus ZenBook 15 UX534FT-DB77
- 09/29/2019 v7 (old)
Allen Ngo
Price comparison
