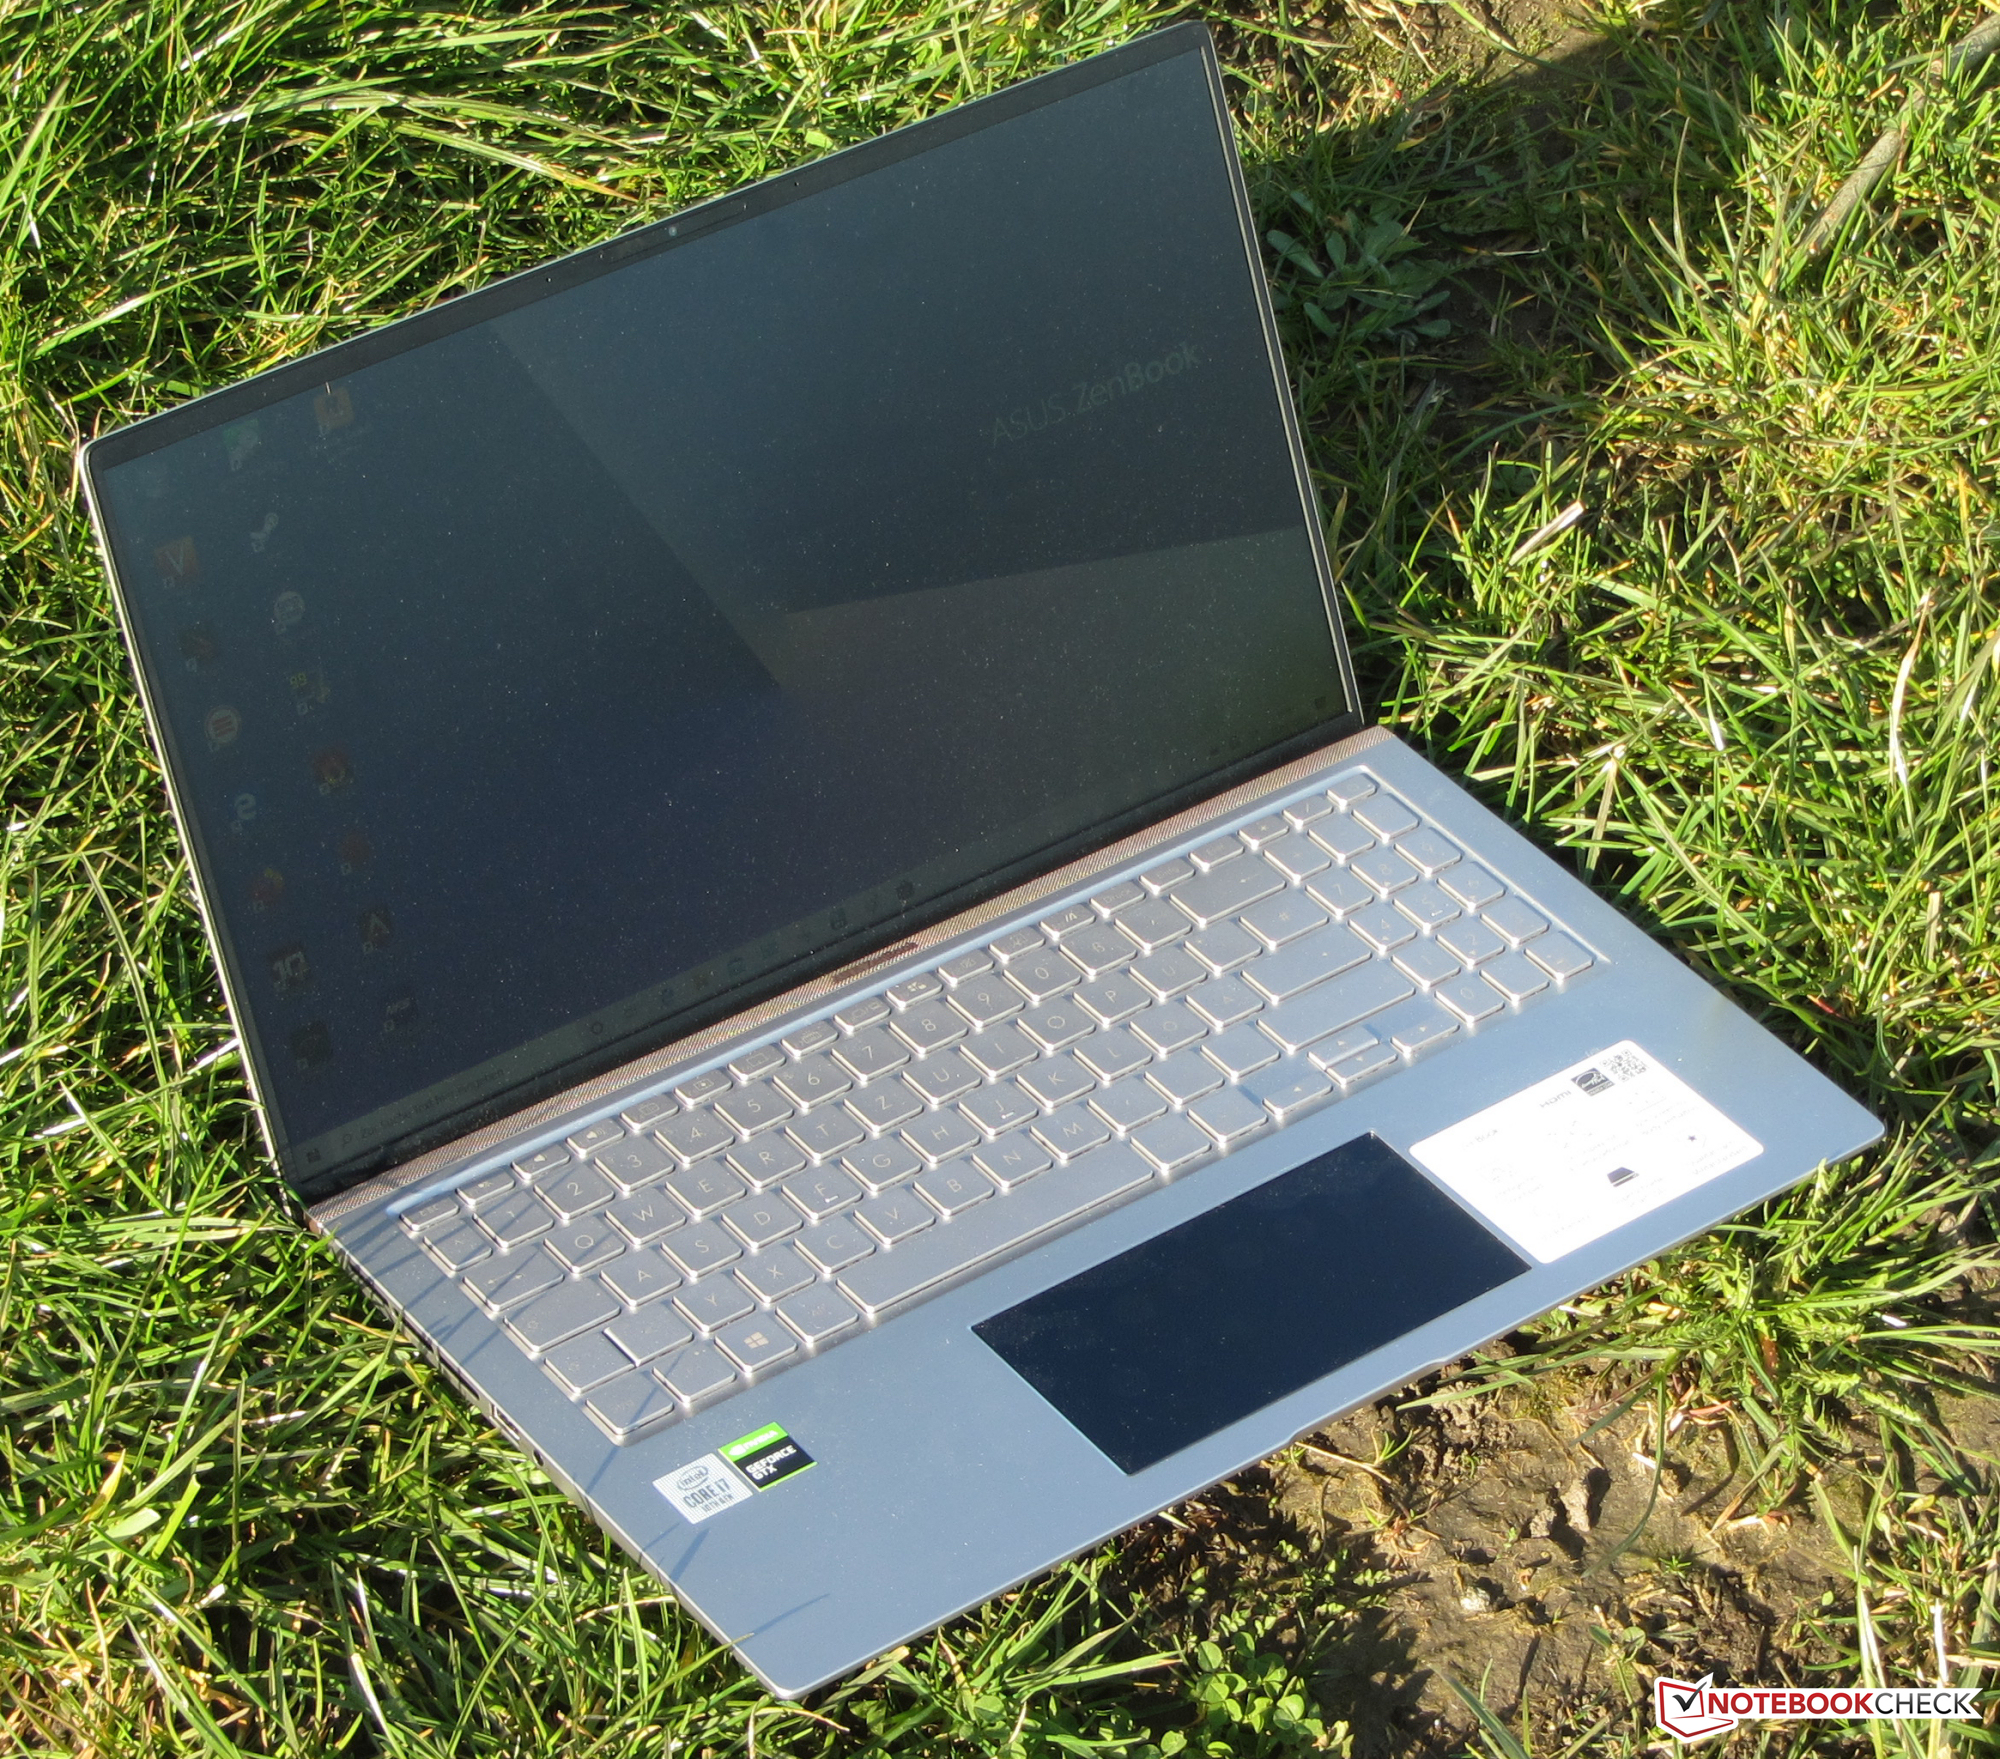
Asus ZenBook 15 UX534FTC in Review: Matte, powerful king of battery life

The Asus ZenBook 15 UX534FTC is one of the few slim, compact, lightweight 15.6-inch laptops that do not lack processing power. There is a four-core Core i7-10510U processor and a GeForce GTX 1650 Max-Q graphics card on board. We have already tested the ZenBook 15 UX534FT from the same product family and the physically identical predecessor ZenBook 15 UX533FD. Competing devices include the Acer ConceptD 5 CN515-51, Dell XPS 15 7590, and the Apple MacBook Pro 16. While the latter two devices are heavier and more expensive than the ZenBook, they are directed at the same group of customers.
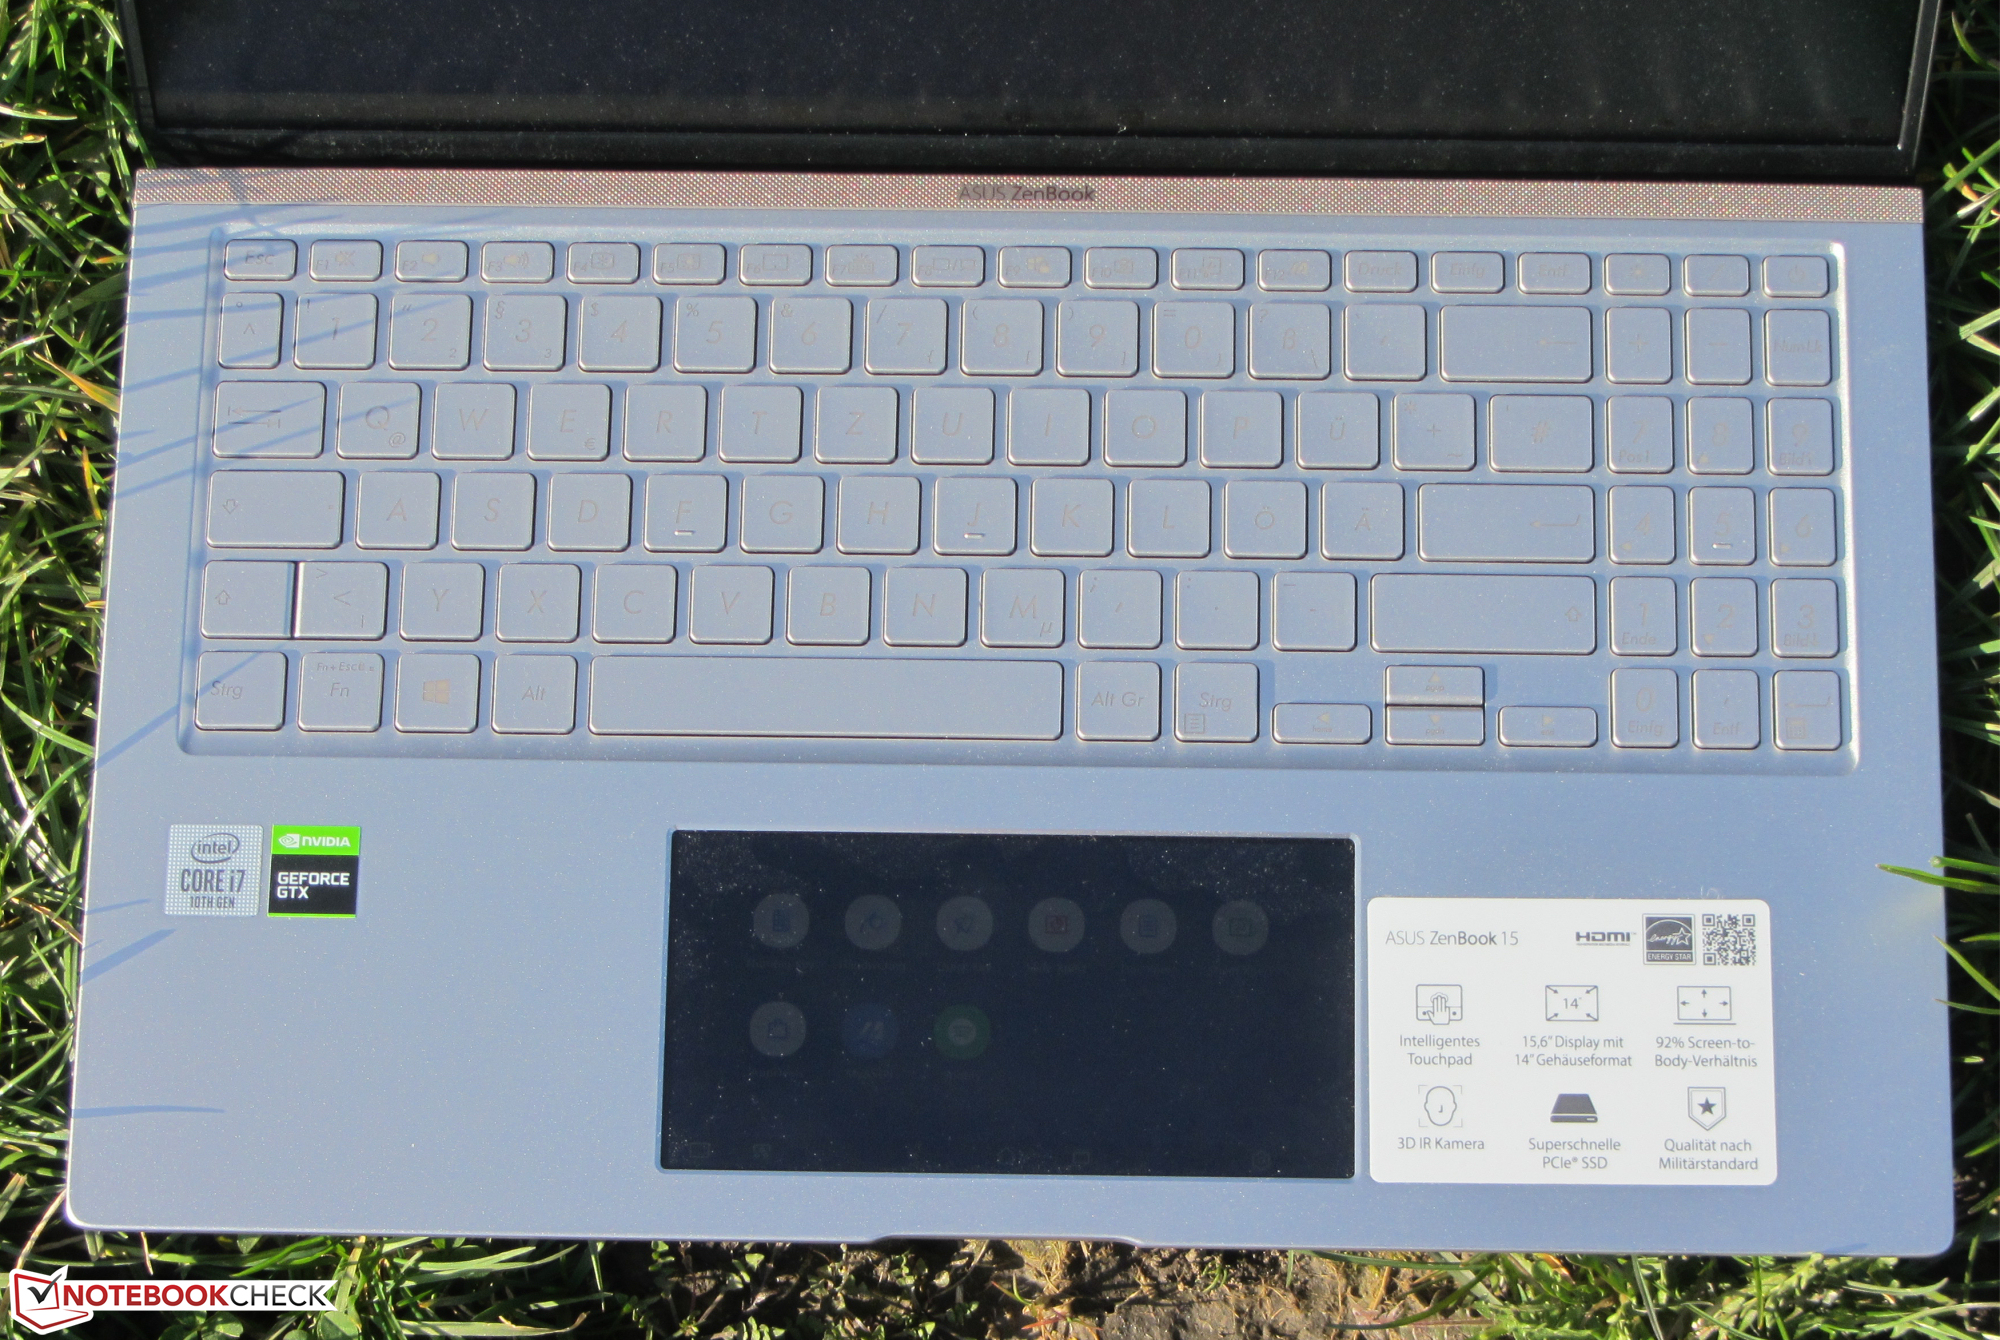
Since the ZenBook 15 models are physically identical, we will not focus on the chassis, features, input devices, or speakers in this article. This information can be found in our review of the ZenBook 15 UX533FD.
Rating | Date | Model | Weight | Height | Size | Resolution | Price |
|---|---|---|---|---|---|---|---|
| 85.2 % v7 (old) | 03 / 2020 | Asus ZenBook 15 UX534FTC-A8190T i7-10510U, GeForce GTX 1650 Max-Q | 1.6 kg | 18.9 mm | 15.60" | 1920x1080 | |
| 82.7 % v7 (old) | 02 / 2020 | Acer ConceptD 5 CN515-51-73Z7 i7-8705G, Vega M GL / 870 | 1.5 kg | 17 mm | 15.60" | 3840x2160 | |
| 87.8 % v7 (old) | 08 / 2019 | Dell XPS 15 7590 9980HK GTX 1650 i9-9980HK, GeForce GTX 1650 Mobile | 2 kg | 17 mm | 15.60" | 3840x2160 | |
| 89.7 % v7 (old) | 12 / 2019 | Apple MacBook Pro 16 2019 i9 5500M i9-9880H, Radeon Pro 5500M | 2 kg | 16.2 mm | 16.00" | 3072x1920 |
| SD Card Reader | |
| average JPG Copy Test (av. of 3 runs) | |
| Dell XPS 15 7590 9980HK GTX 1650 (Toshiba Exceria Pro SDXC 64 GB UHS-II) | |
| Average of class Multimedia (23 - 531, n=44, last 2 years) | |
| Asus ZenBook 15 UX534FTC-A8190T (Toshiba Exceria Pro SDXC 64 GB UHS-II) | |
| Asus ZenBook 15 UX534FT-DB77 (Toshiba Exceria Pro SDXC 64 GB UHS-II) | |
| Asus ZenBook 15 UX533FD (Toshiba Exceria Pro SDXC 64 GB UHS-II) | |
| Acer ConceptD 5 CN515-51-73Z7 (Toshiba Exceria Pro SDXC 64 GB UHS-II) | |
| maximum AS SSD Seq Read Test (1GB) | |
| Dell XPS 15 7590 9980HK GTX 1650 (Toshiba Exceria Pro SDXC 64 GB UHS-II) | |
| Average of class Multimedia (27.9 - 1455, n=43, last 2 years) | |
| Asus ZenBook 15 UX534FT-DB77 (Toshiba Exceria Pro SDXC 64 GB UHS-II) | |
| Asus ZenBook 15 UX533FD (Toshiba Exceria Pro SDXC 64 GB UHS-II) | |
| Acer ConceptD 5 CN515-51-73Z7 (Toshiba Exceria Pro SDXC 64 GB UHS-II) | |
Webcam
The integrated webcam takes pictures with a maximum resolution of 1280x720 pixels. The results look slightly washed-out. The color accuracy is also severely lacking. The deltaE value of 18.44 misses the mark (deltaE of less than 3) by quite a large margin.

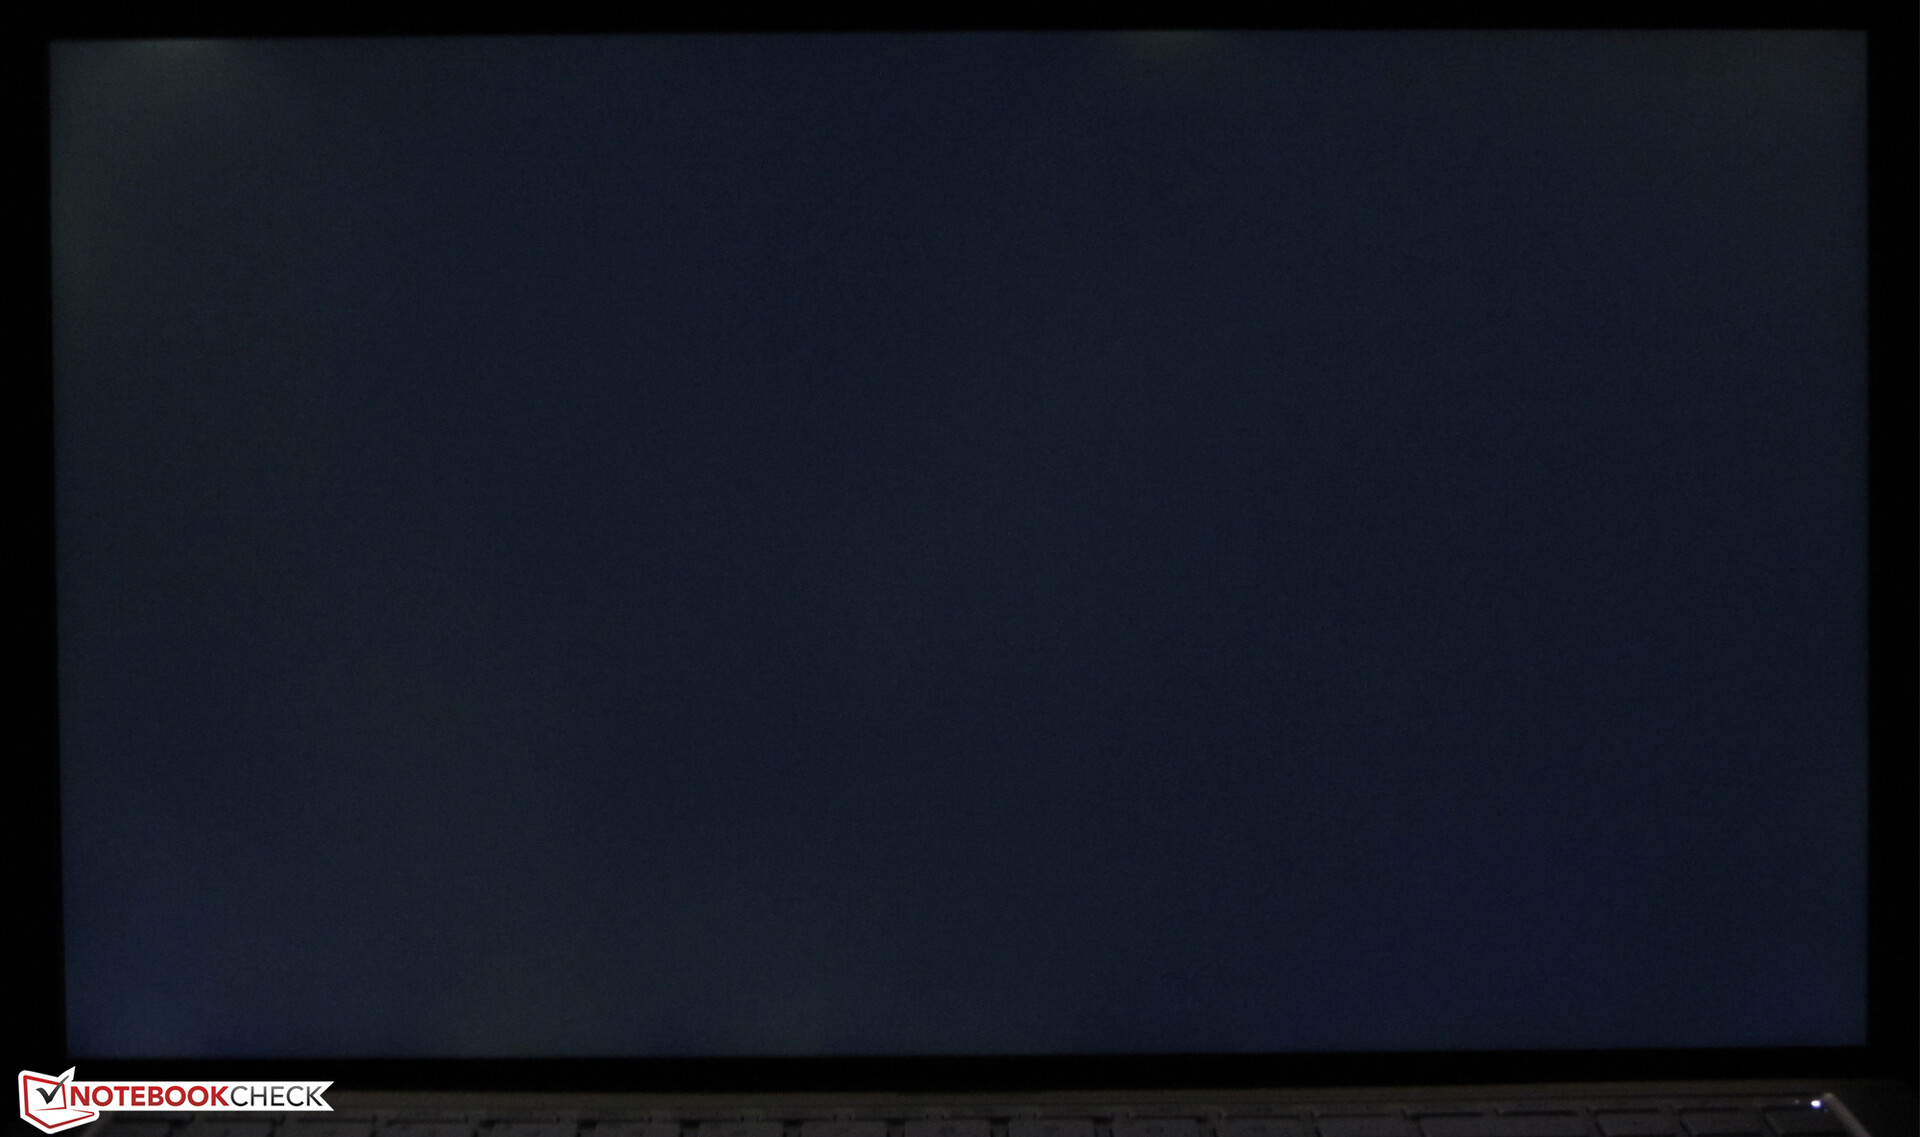
Display - Matte IPS Panel for the UX534FTC
The matte 15.6-inch display of the ZenBook 15 has a native resolution of 1920x1080 pixels. While its contrast ratio (1,424:1) is good, the brightness (279.7 cd/m²) leaves something to be desired. For a laptop in this price range, a brighter screen is far from an unreasonable demand. We consider values of above 300 cd/m² good. Positive: The display does not exhibit PWM flickering.
| |||||||||||||||||||||||||
Brightness Distribution: 89 %
Center on Battery: 300 cd/m²
Contrast: 1424:1 (Black: 0.21 cd/m²)
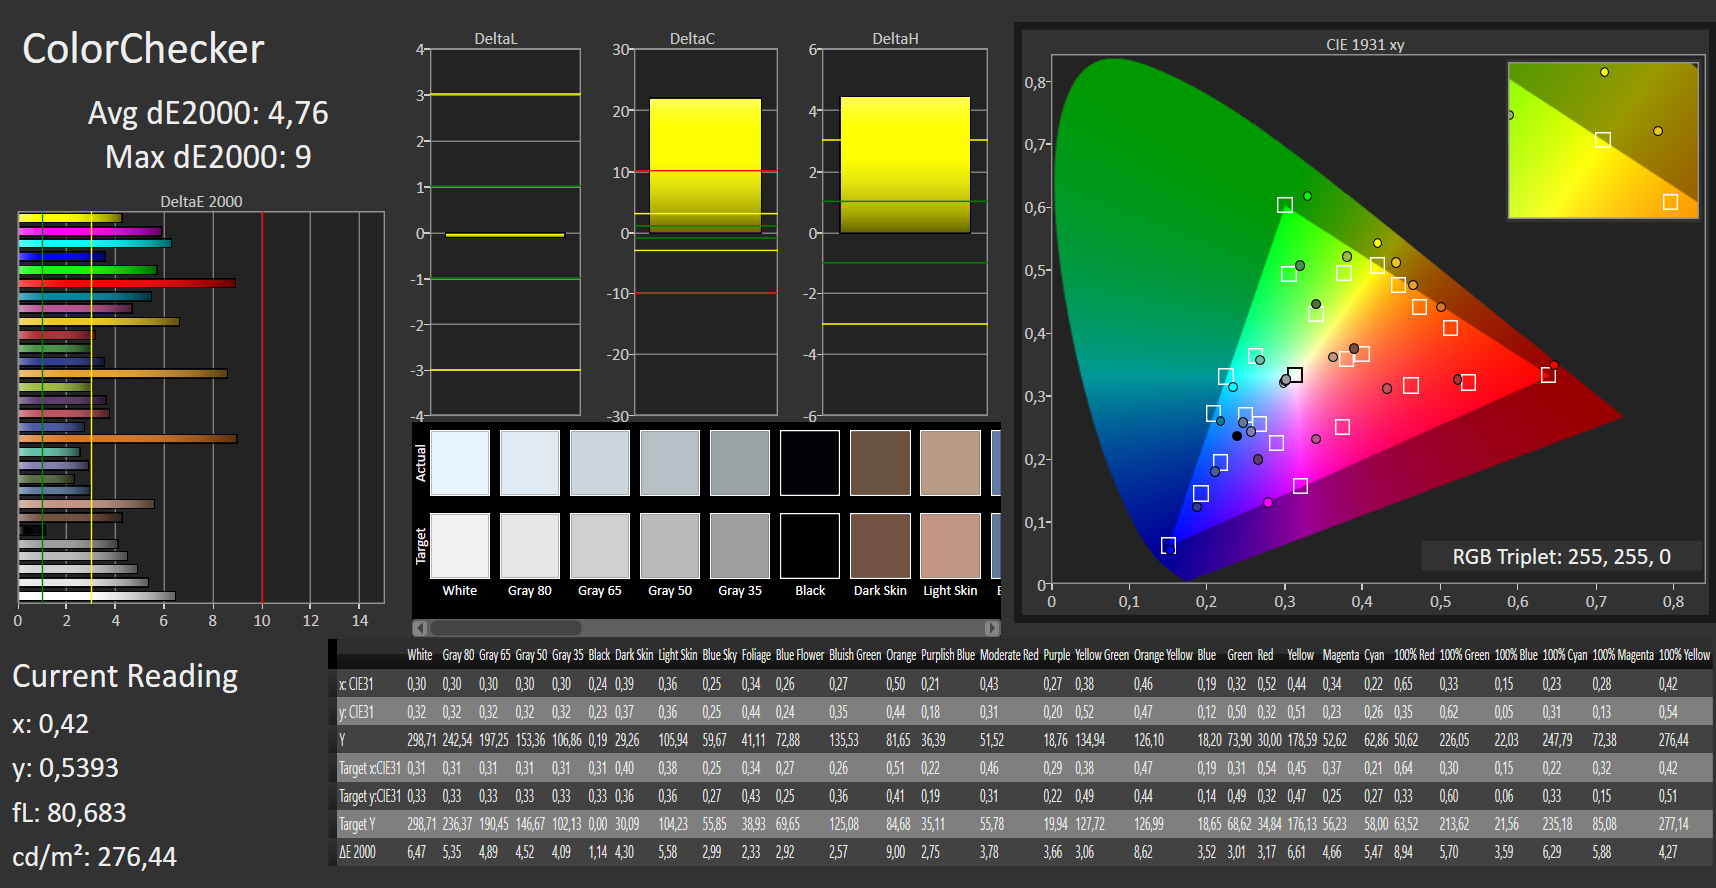
ΔE ColorChecker Calman: 4.76 | ∀{0.5-29.43 Ø4.72}
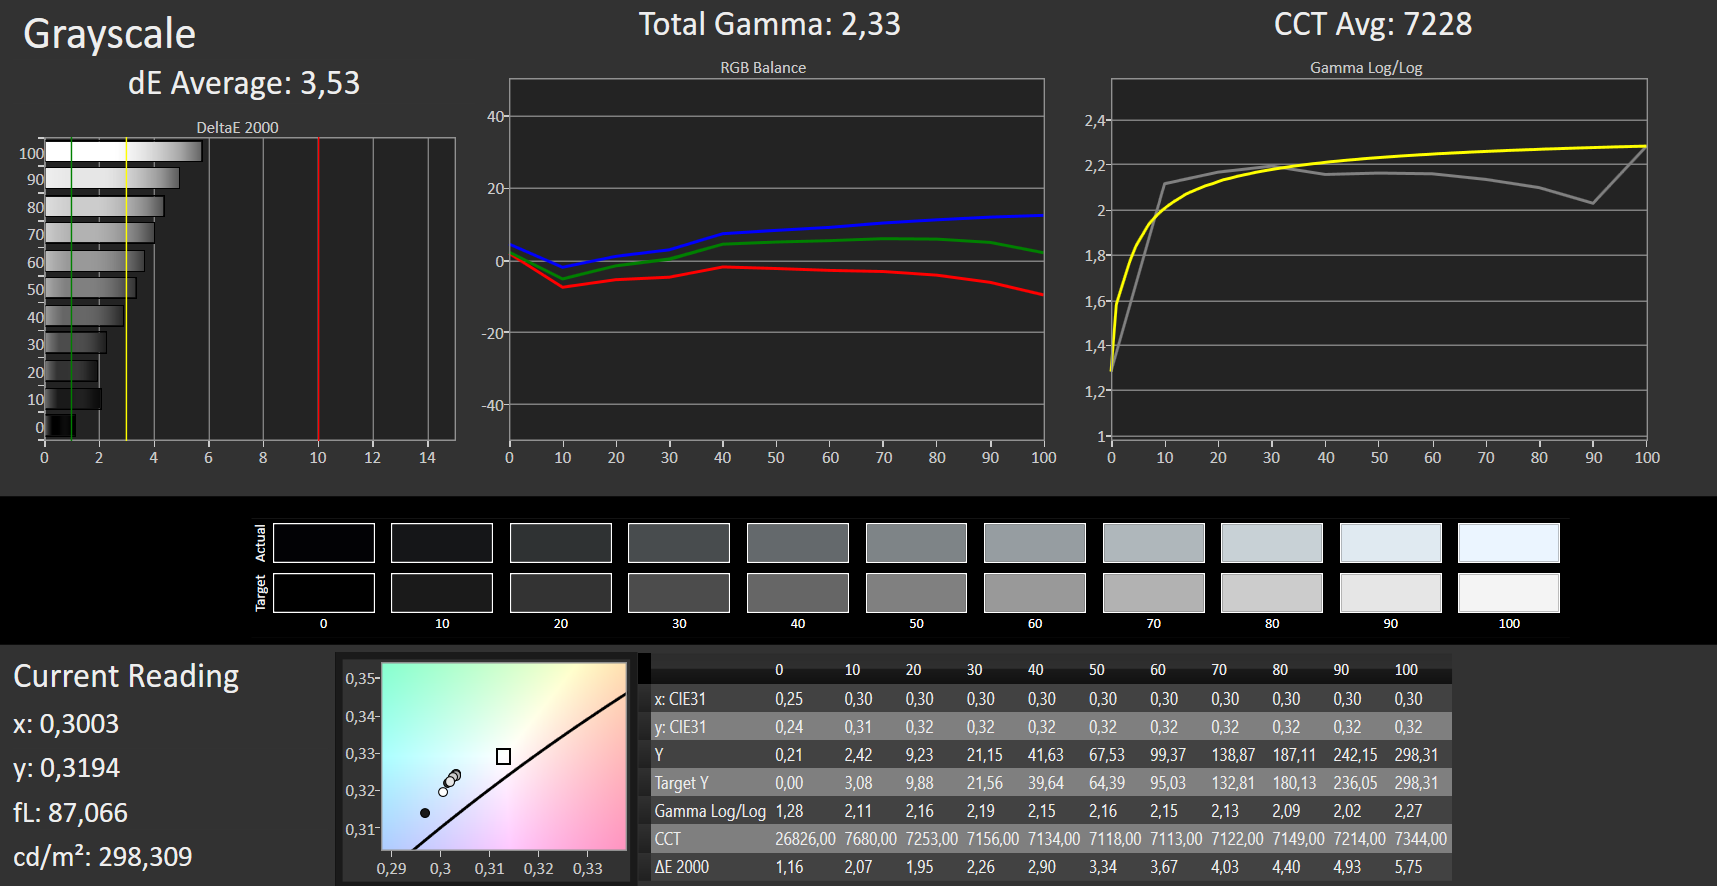
ΔE Greyscale Calman: 3.53 | ∀{0.09-98 Ø4.97}
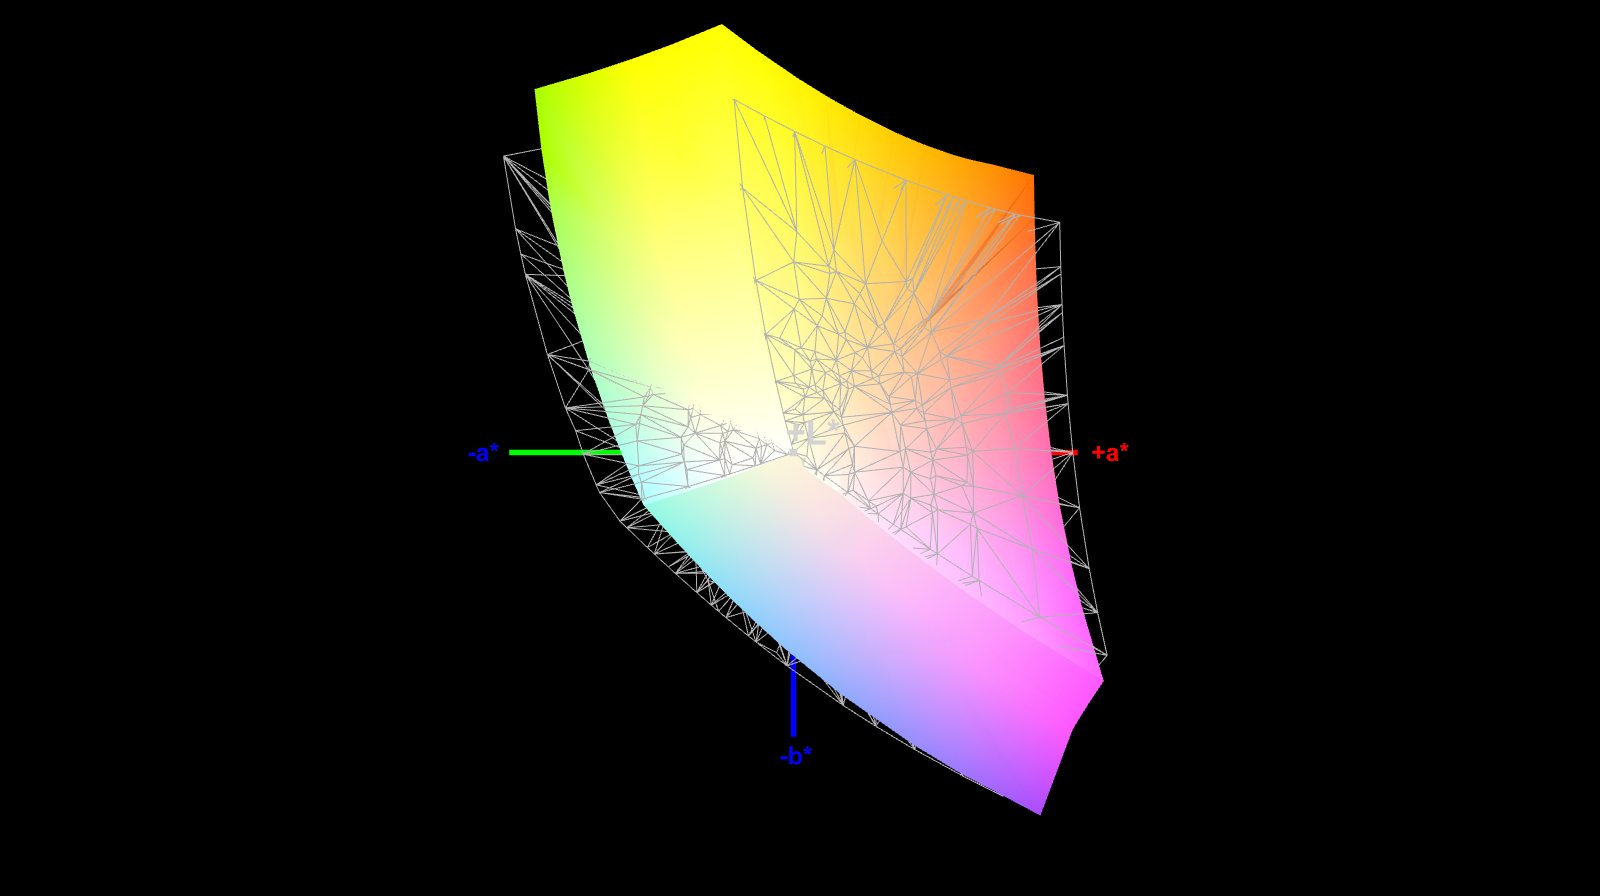
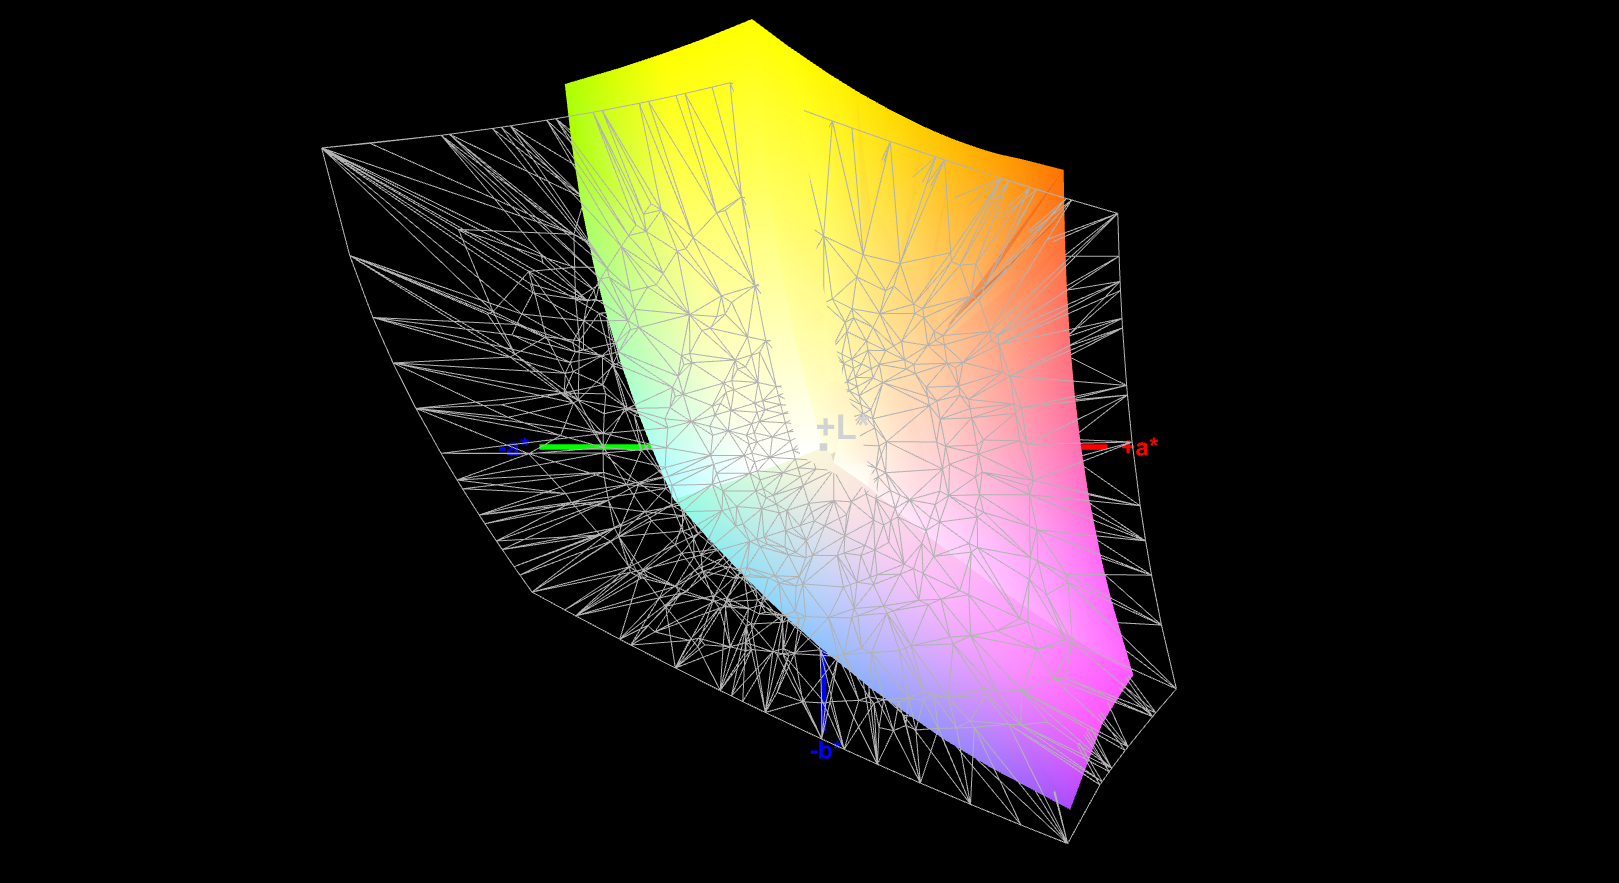
86% sRGB (Argyll 1.6.3 3D)
56% AdobeRGB 1998 (Argyll 1.6.3 3D)
62.9% AdobeRGB 1998 (Argyll 3D)
86.2% sRGB (Argyll 3D)
65% Display P3 (Argyll 3D)
Gamma: 2.3
CCT: 7228 K
| Asus ZenBook 15 UX534FTC-A8190T IPS, 1920x1080, 15.6" | Asus ZenBook 15 UX534FT-DB77 IPS, 1920x1080, 15.6" | Asus ZenBook 15 UX533FD IPS, 1920x1080, 15.6" | Acer ConceptD 5 CN515-51-73Z7 LTPS IPS LED, 3840x2160, 15.6" | Dell XPS 15 7590 9980HK GTX 1650 OLED, 3840x2160, 15.6" | Apple MacBook Pro 16 2019 i9 5500M IPS, 3072x1920, 16" | |
|---|---|---|---|---|---|---|
| Display | 2% | 3% | 35% | 33% | ||
| Display P3 Coverage (%) | 65 | 66.6 2% | 67.2 3% | 86.1 32% | 88.1 36% | |
| sRGB Coverage (%) | 86.2 | 87.7 2% | 88.4 3% | 100 16% | 99.6 16% | |
| AdobeRGB 1998 Coverage (%) | 62.9 | 64.1 2% | 64.6 3% | 99.2 58% | 91.8 46% | |
| Response Times | 2% | -8% | -33% | 94% | -13% | |
| Response Time Grey 50% / Grey 80% * (ms) | 45 ? | 41.2 ? 8% | 45 ? -0% | 63 ? -40% | 2.3 ? 95% | 52.4 ? -16% |
| Response Time Black / White * (ms) | 32 ? | 33.2 ? -4% | 37 ? -16% | 40 ? -25% | 2.4 ? 92% | 34.9 ? -9% |
| PWM Frequency (Hz) | 59.5 ? | 131700 | ||||
| Screen | -14% | -6% | 5% | 15% | 27% | |
| Brightness middle (cd/m²) | 299 | 312.6 5% | 311 4% | 350 17% | 421.2 41% | 519 74% |
| Brightness (cd/m²) | 280 | 290 4% | 303 8% | 329 18% | 417 49% | 477 70% |
| Brightness Distribution (%) | 89 | 85 -4% | 81 -9% | 86 -3% | 94 6% | 86 -3% |
| Black Level * (cd/m²) | 0.21 | 0.31 -48% | 0.24 -14% | 0.265 -26% | 0.39 -86% | |
| Contrast (:1) | 1424 | 1008 -29% | 1296 -9% | 1321 -7% | 1331 -7% | |
| Colorchecker dE 2000 * | 4.76 | 5.78 -21% | 5.1 -7% | 5.08 -7% | 6.06 -27% | 2.28 52% |
| Colorchecker dE 2000 max. * | 9 | 8.86 2% | 8.91 1% | 10.25 -14% | 11.89 -32% | 6.54 27% |
| Greyscale dE 2000 * | 3.53 | 5.4 -53% | 4.93 -40% | 3.62 -3% | 2.8 21% | 0.9 75% |
| Gamma | 2.3 96% | 2.21 100% | 2.44 90% | 2.27 97% | 2.15 102% | 2145 0% |
| CCT | 7228 90% | 7864 83% | 7641 85% | 6389 102% | 6235 104% | 6572 99% |
| Color Space (Percent of AdobeRGB 1998) (%) | 56 | 57.1 2% | 58 4% | 88 57% | 81 45% | 78 39% |
| Color Space (Percent of sRGB) (%) | 86 | 87.4 2% | 88 2% | 100 16% | 99.6 16% | |
| Colorchecker dE 2000 calibrated * | 3.78 | 2.48 | 4.38 | 0.86 | ||
| Total Average (Program / Settings) | -3% /
-9% | -4% /
-4% | 2% /
6% | 47% /
31% | 7% /
20% |
* ... smaller is better
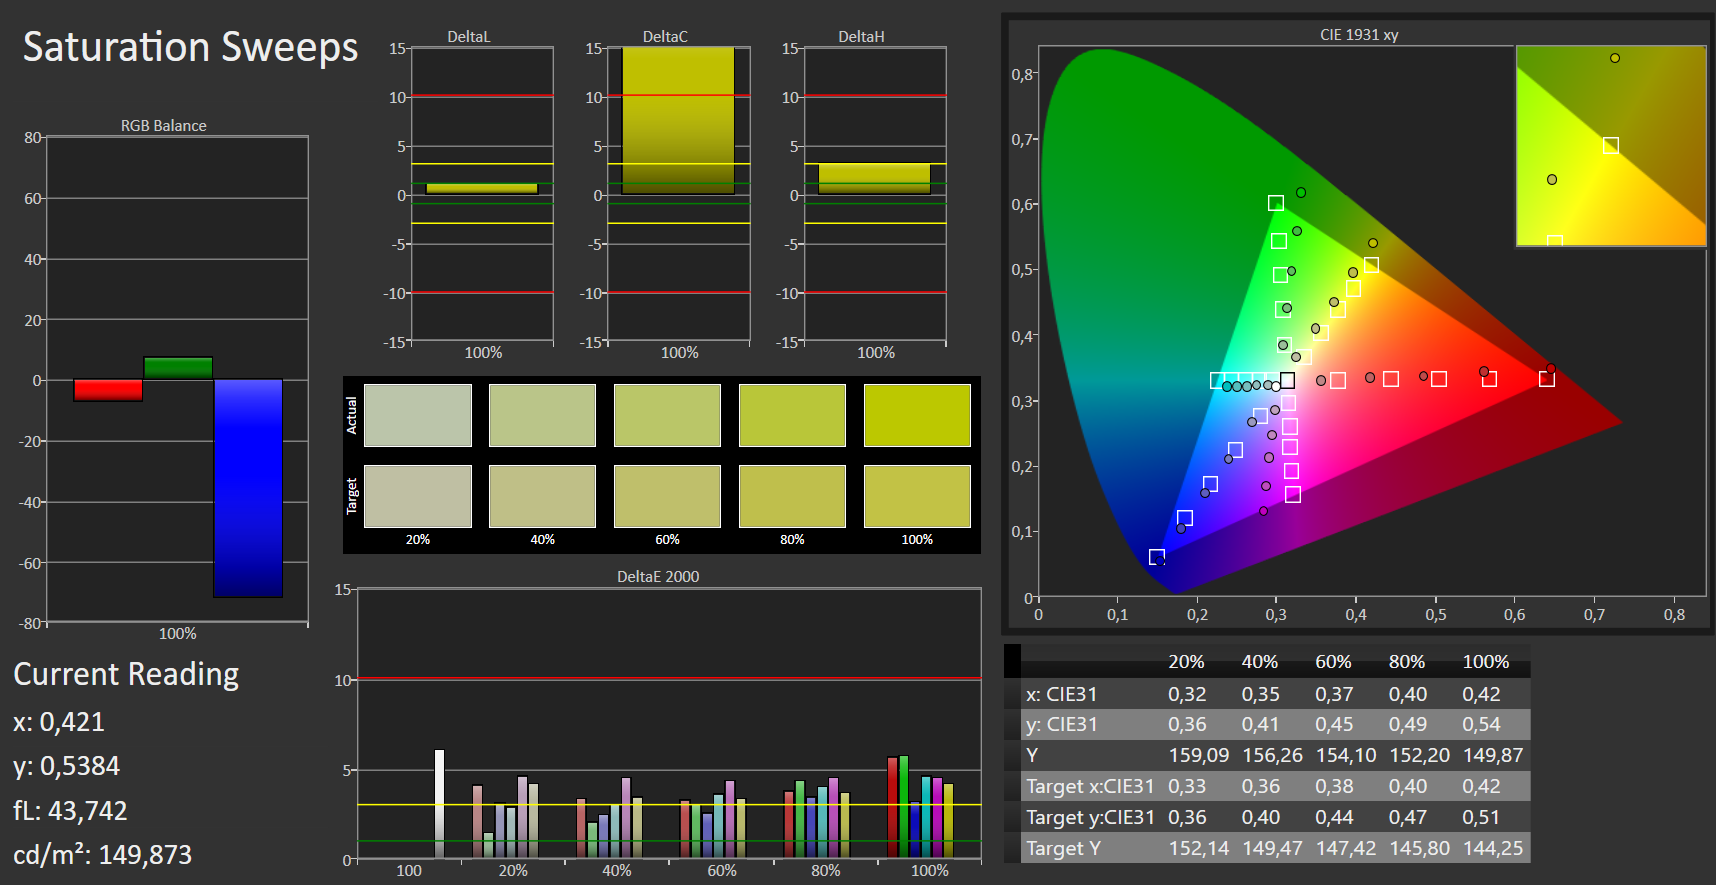
The display represents colors fairly accurately ex-factory. However, it misses the mark (deltaE of less than 3) with a deltaE-2000 color deviation of 4.76. The display does not suffer from a blue tint. The screen covers neither the AdobeRGB (56%) nor the sRGB (86%) color space fully.
Display Response Times
| ↔ Response Time Black to White | ||
|---|---|---|
| 32 ms ... rise ↗ and fall ↘ combined | ↗ 18 ms rise | 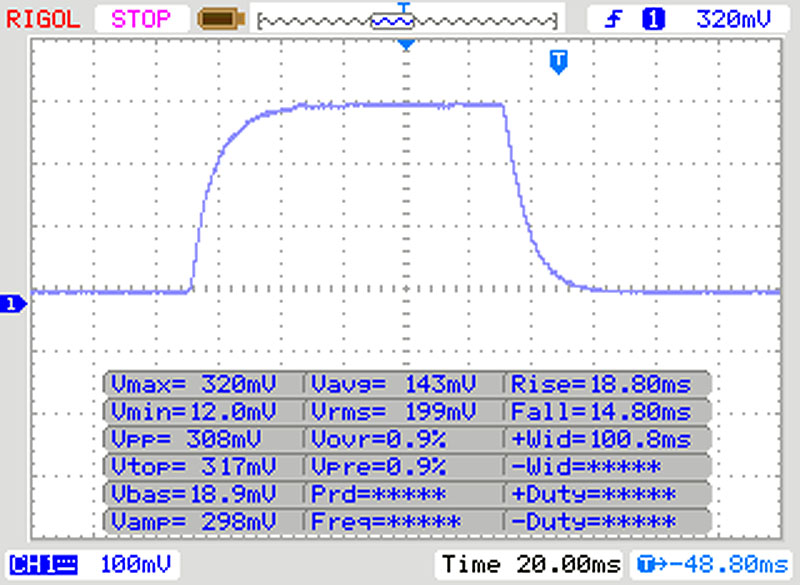 |
| ↘ 14 ms fall | ||
| The screen shows slow response rates in our tests and will be unsatisfactory for gamers. In comparison, all tested devices range from 0.1 (minimum) to 240 (maximum) ms. » 86 % of all devices are better. This means that the measured response time is worse than the average of all tested devices (19.8 ms). | ||
| ↔ Response Time 50% Grey to 80% Grey | ||
| 45 ms ... rise ↗ and fall ↘ combined | ↗ 24 ms rise | 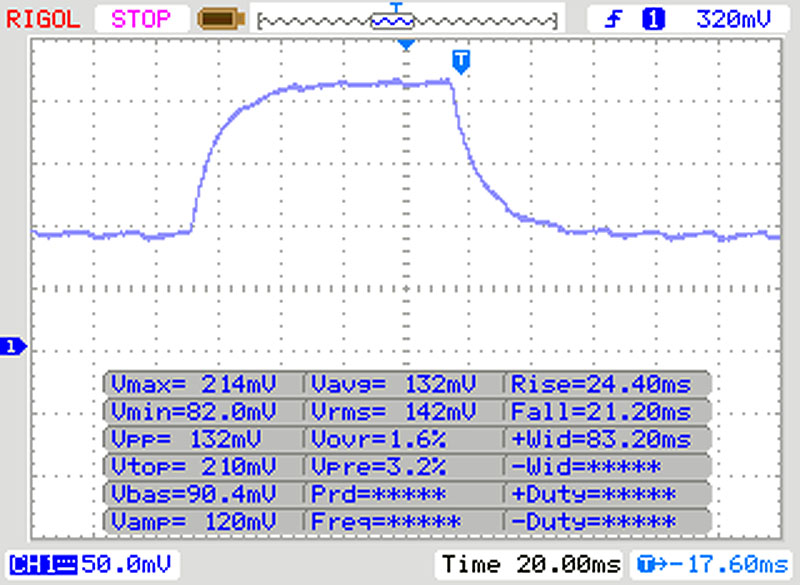 |
| ↘ 21 ms fall | ||
| The screen shows slow response rates in our tests and will be unsatisfactory for gamers. In comparison, all tested devices range from 0.165 (minimum) to 636 (maximum) ms. » 77 % of all devices are better. This means that the measured response time is worse than the average of all tested devices (31 ms). | ||
Screen Flickering / PWM (Pulse-Width Modulation)
| Screen flickering / PWM not detected | 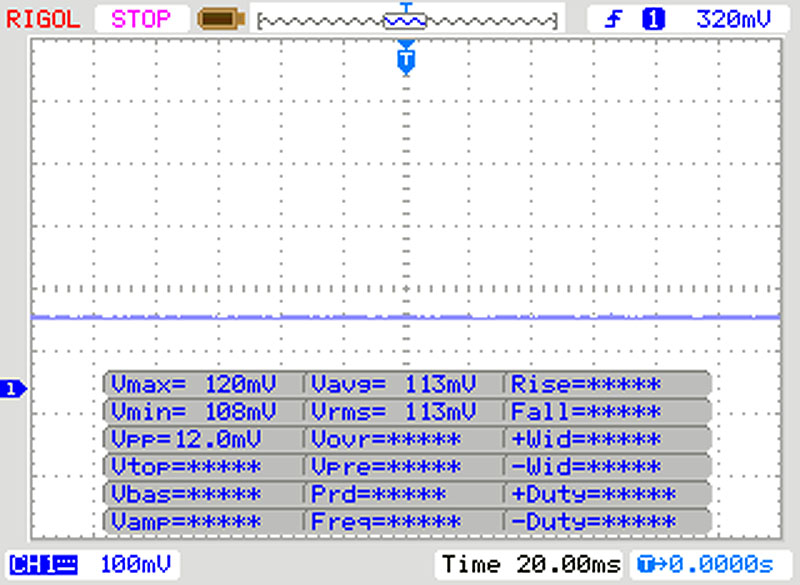 | ||
In comparison: 52 % of all tested devices do not use PWM to dim the display. If PWM was detected, an average of 7772 (minimum: 5 - maximum: 343500) Hz was measured. | |||
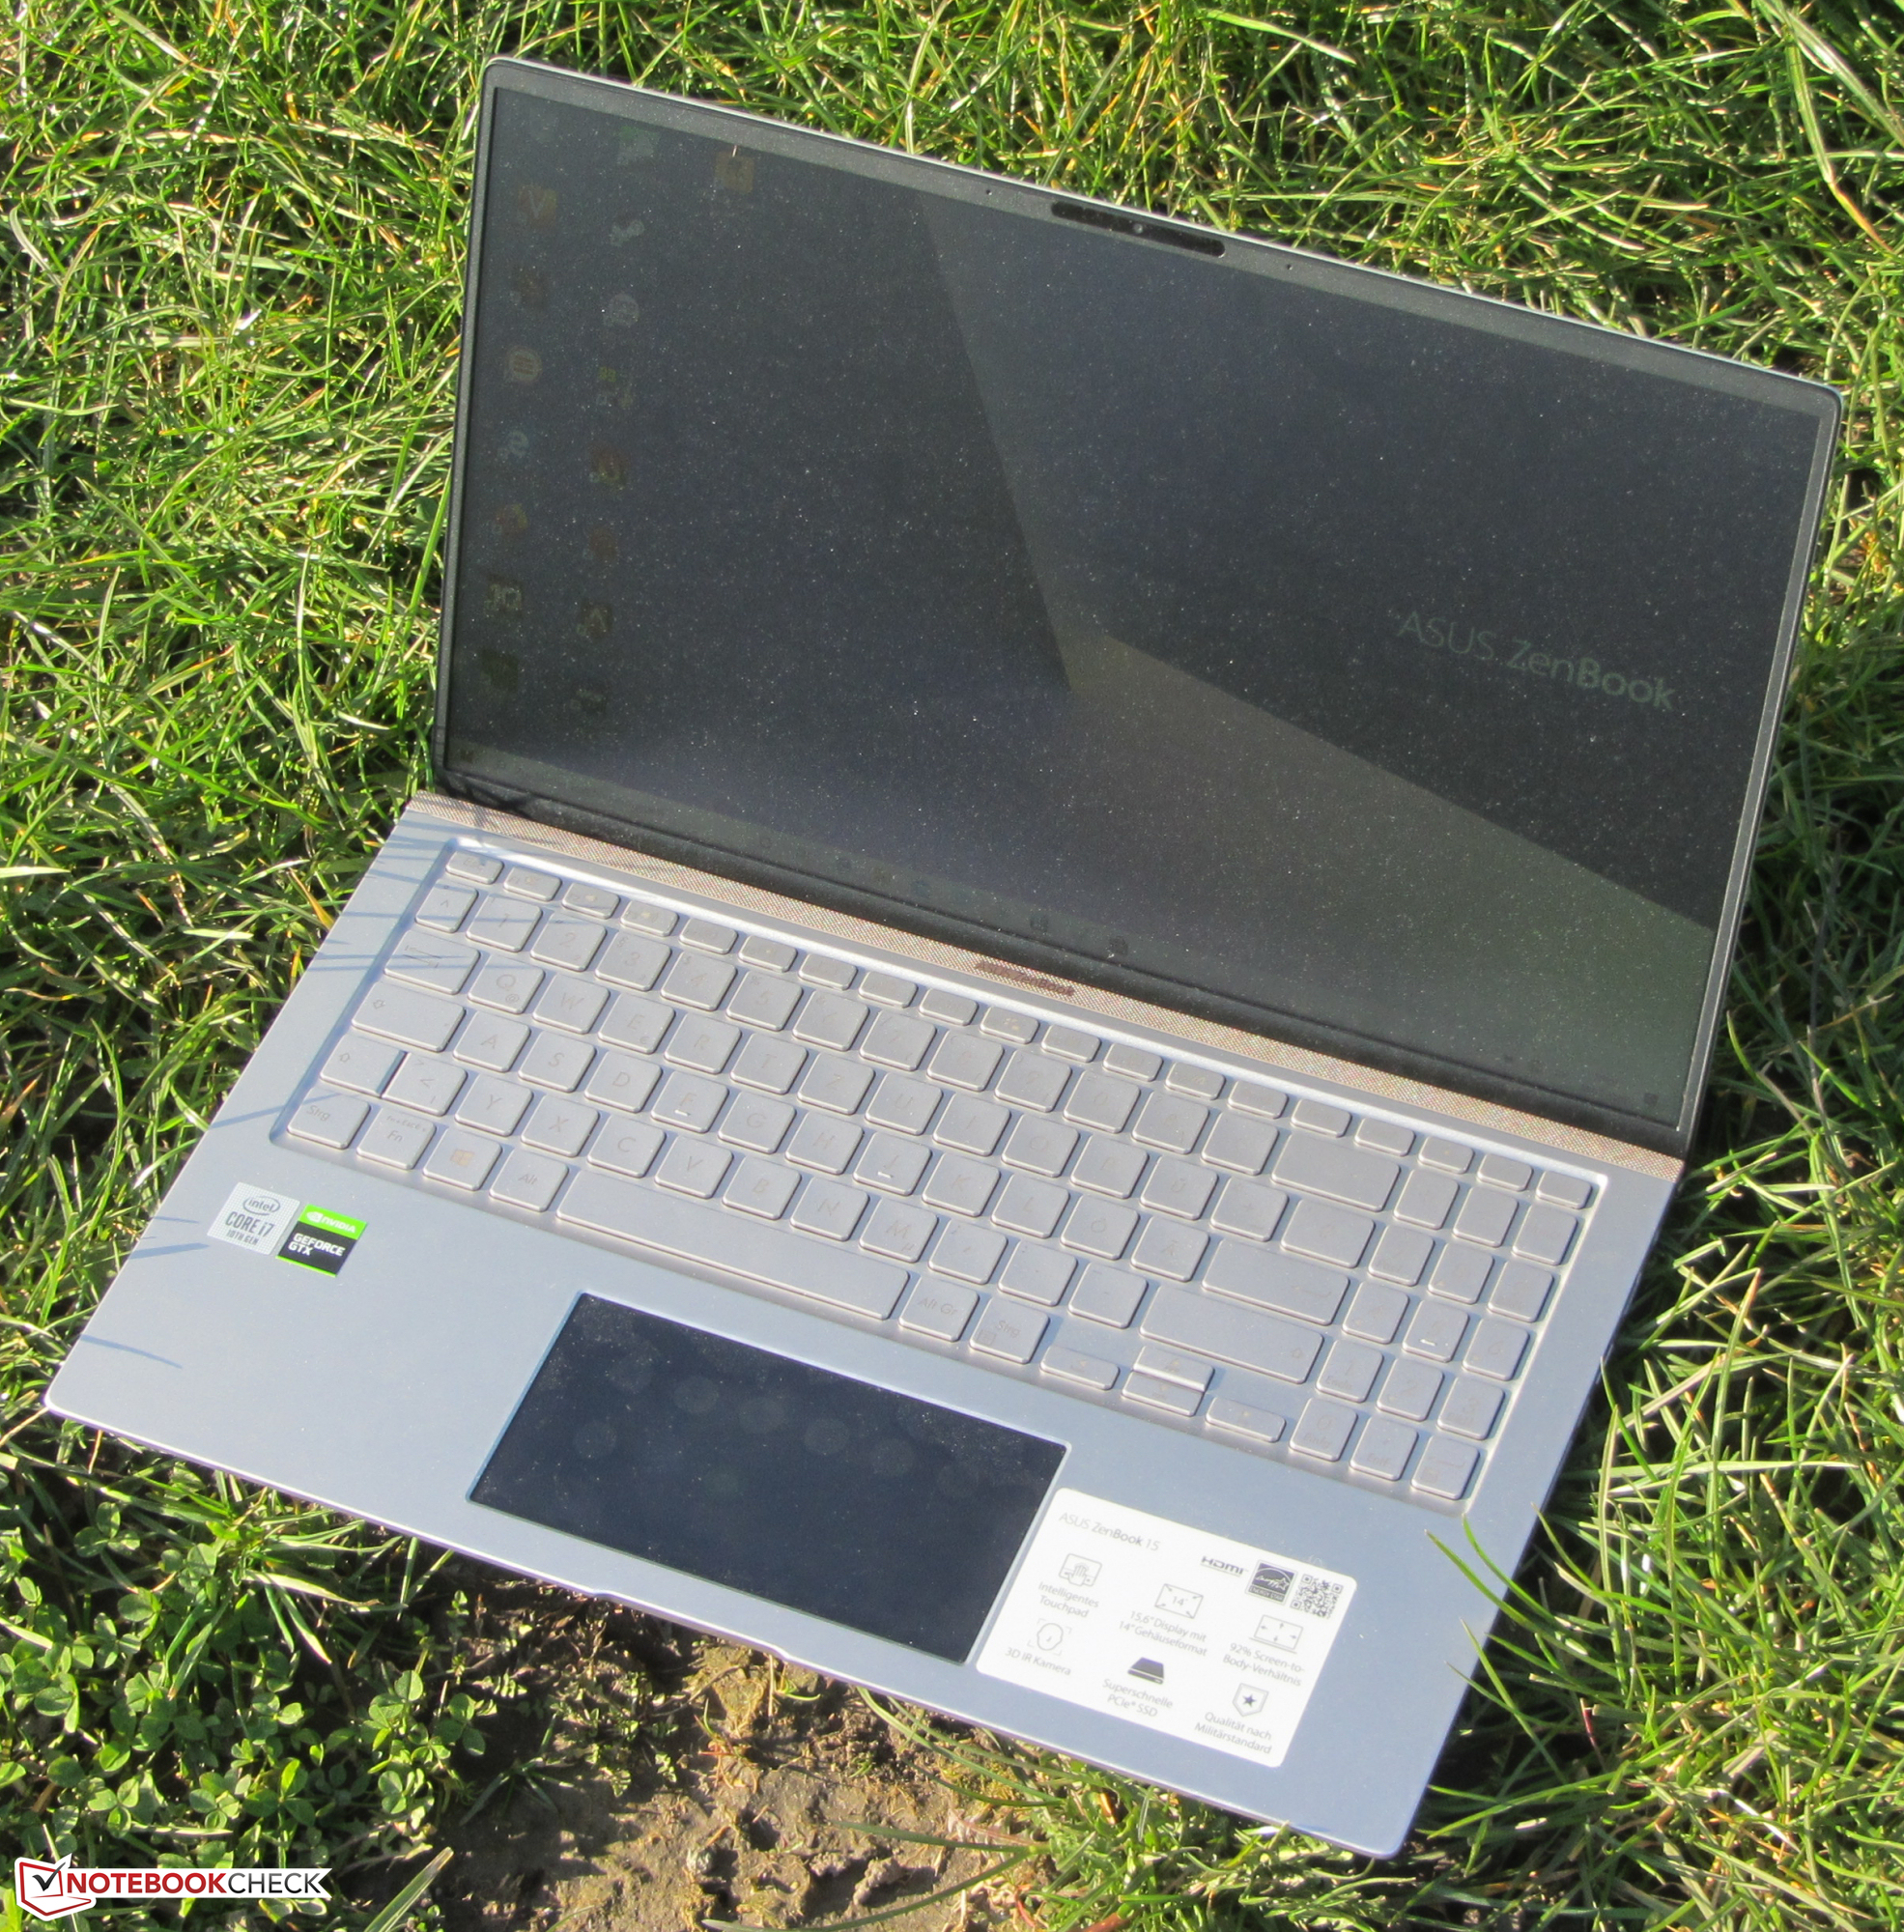
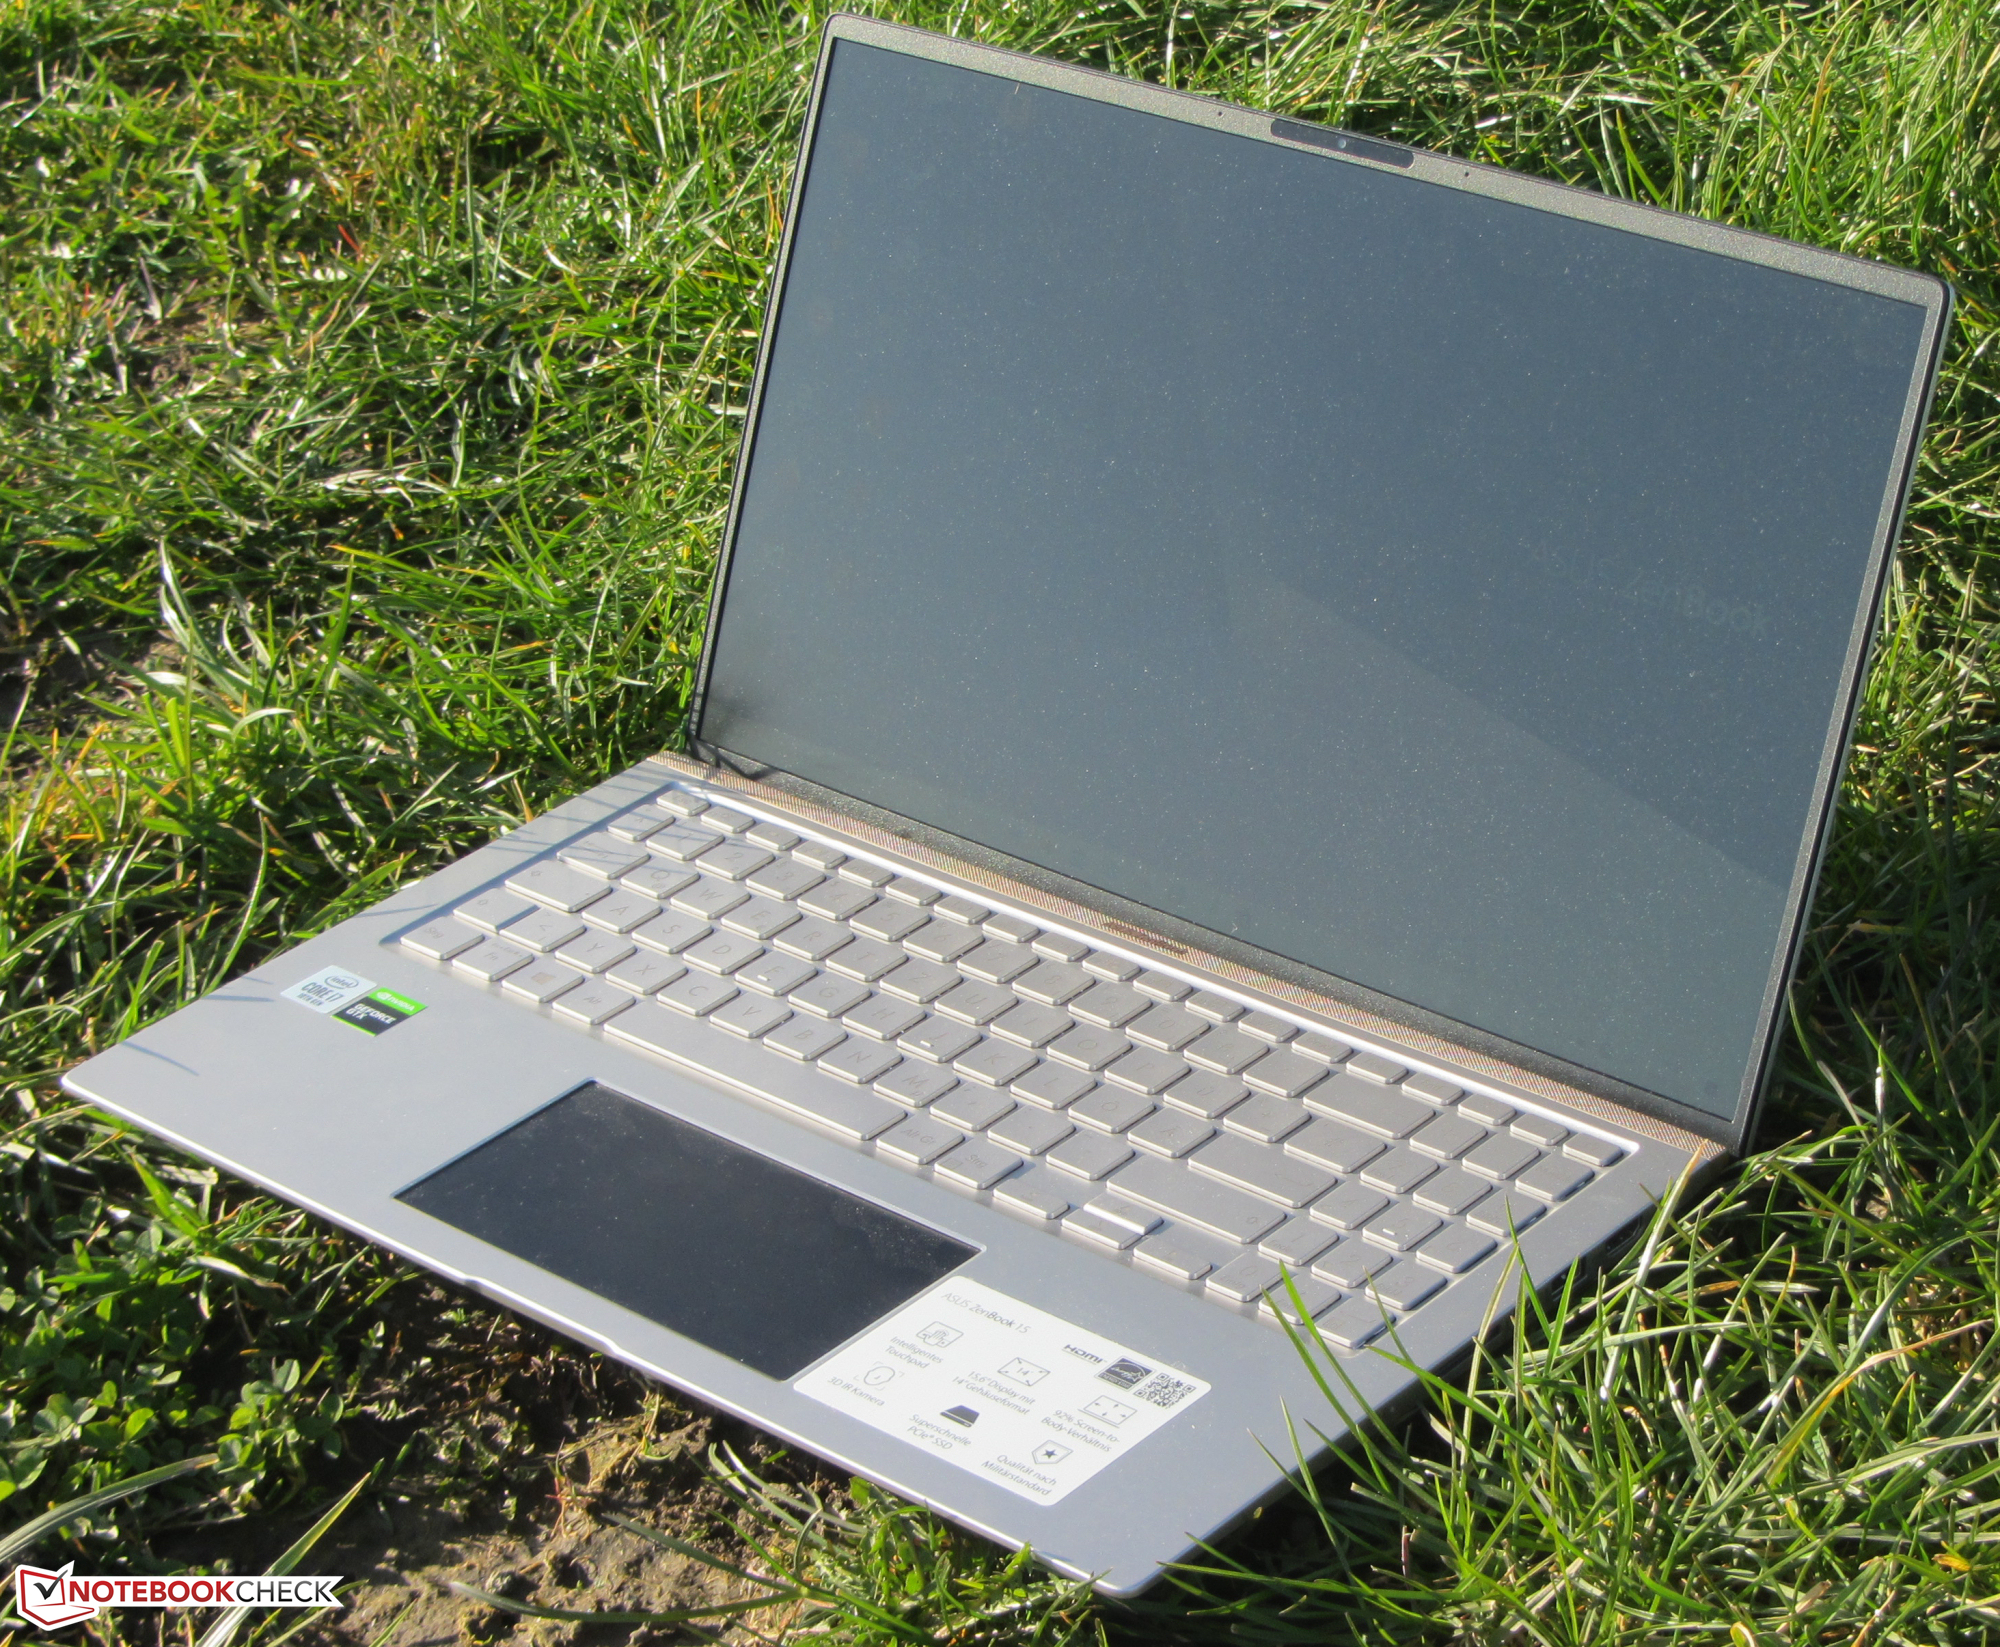
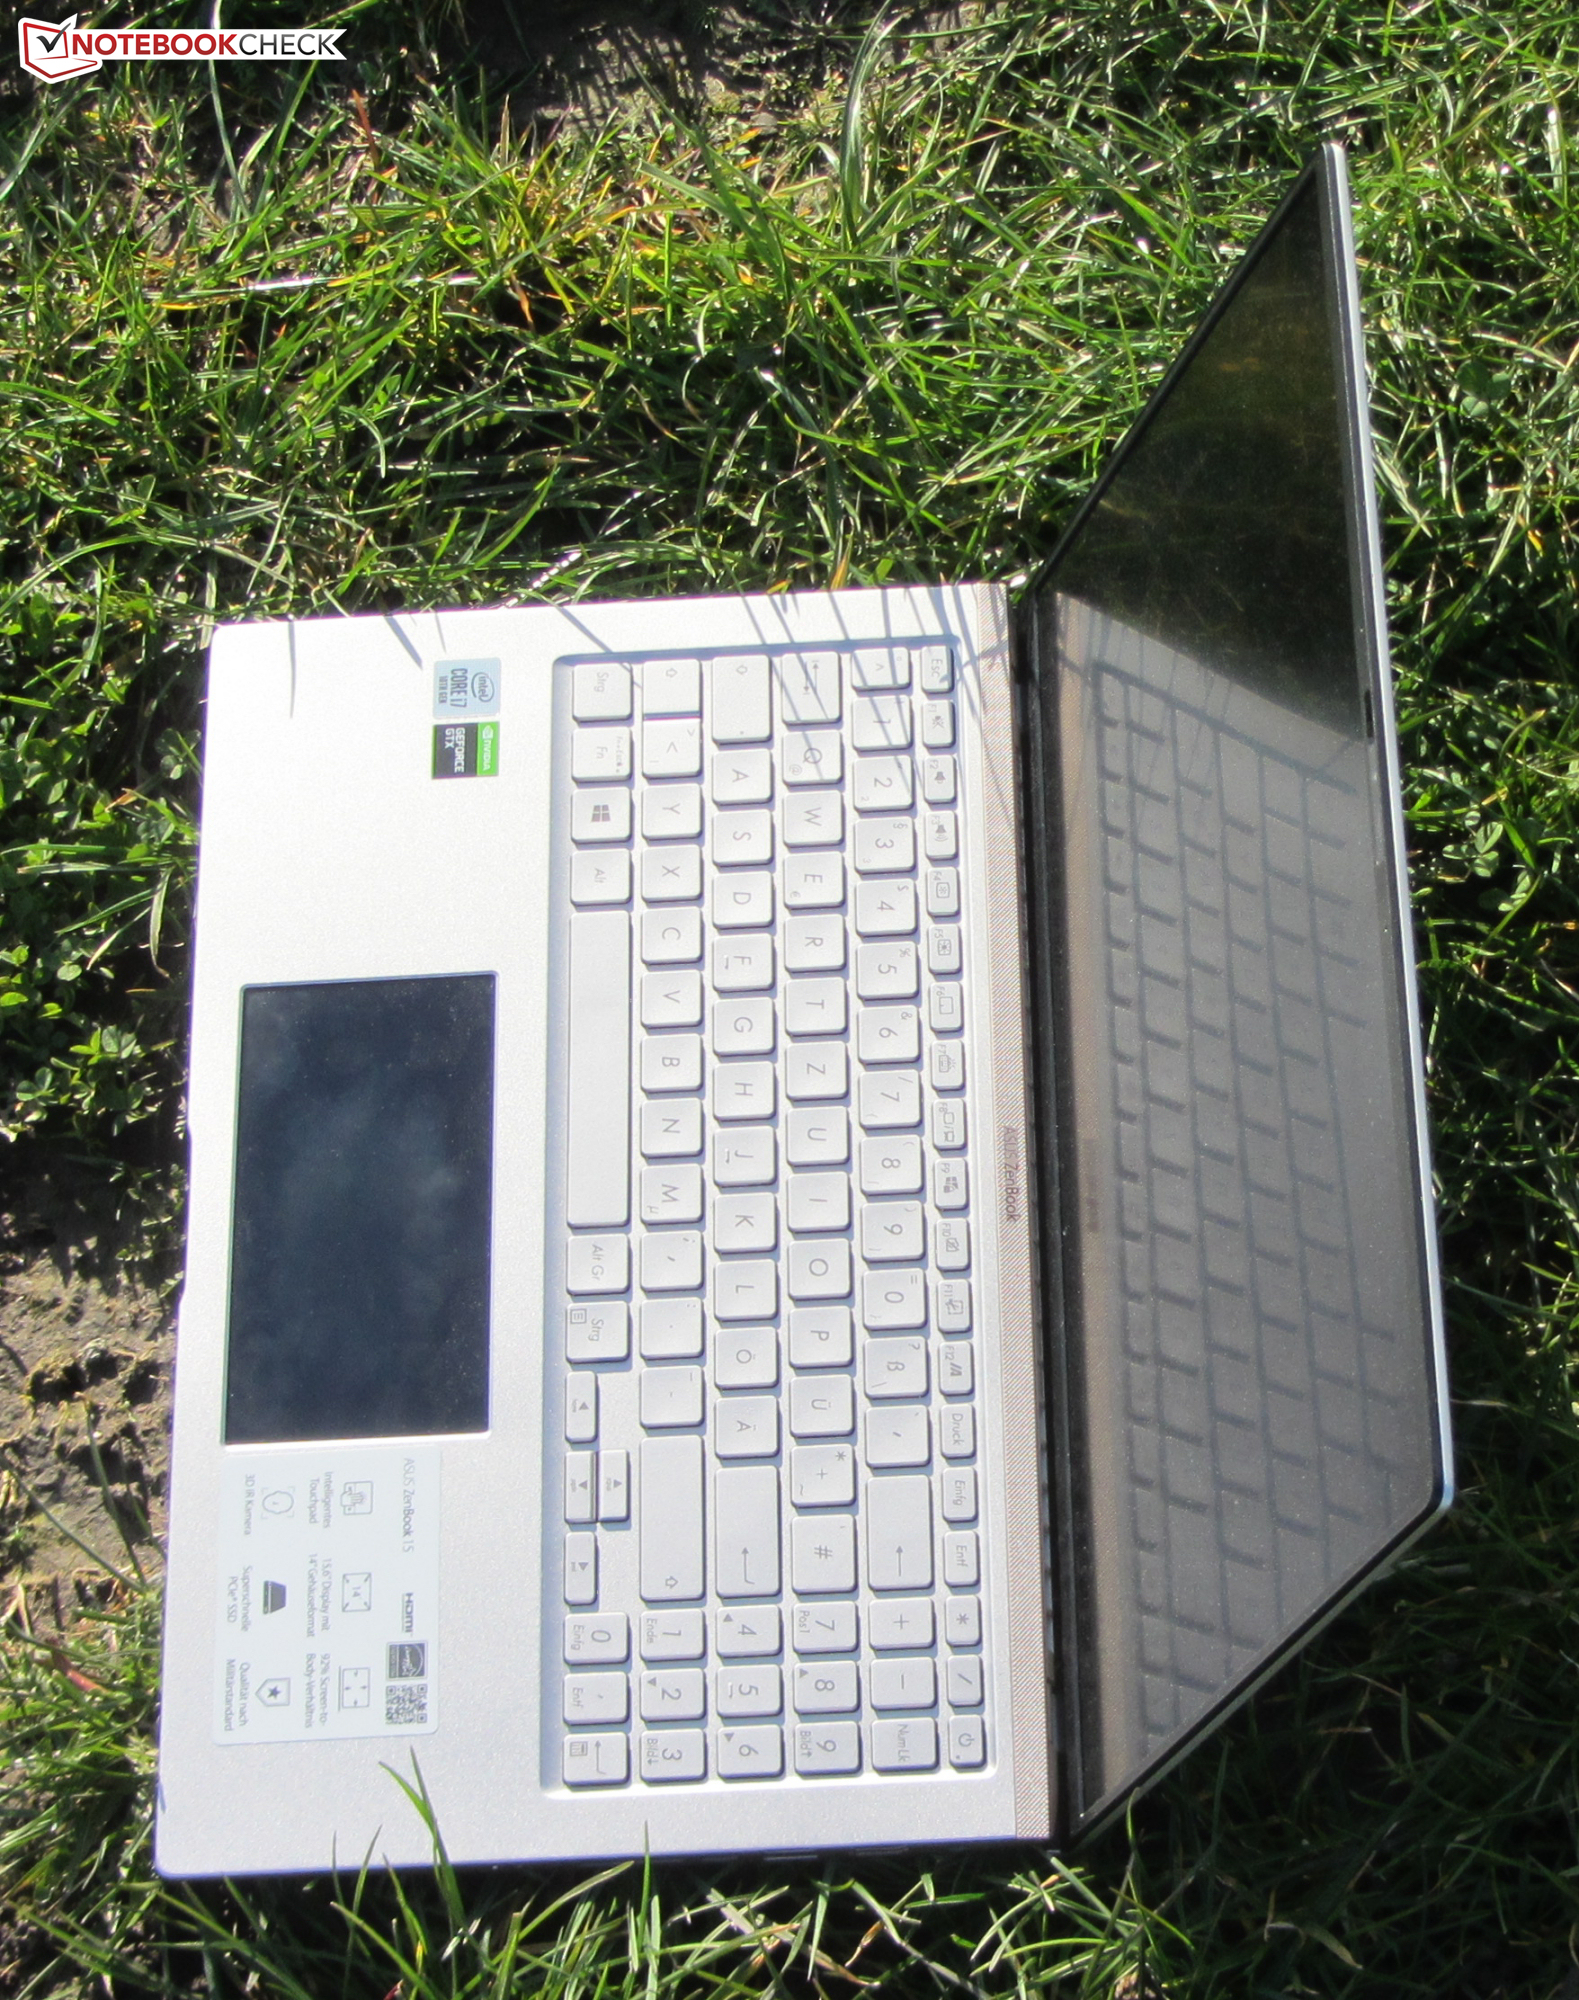
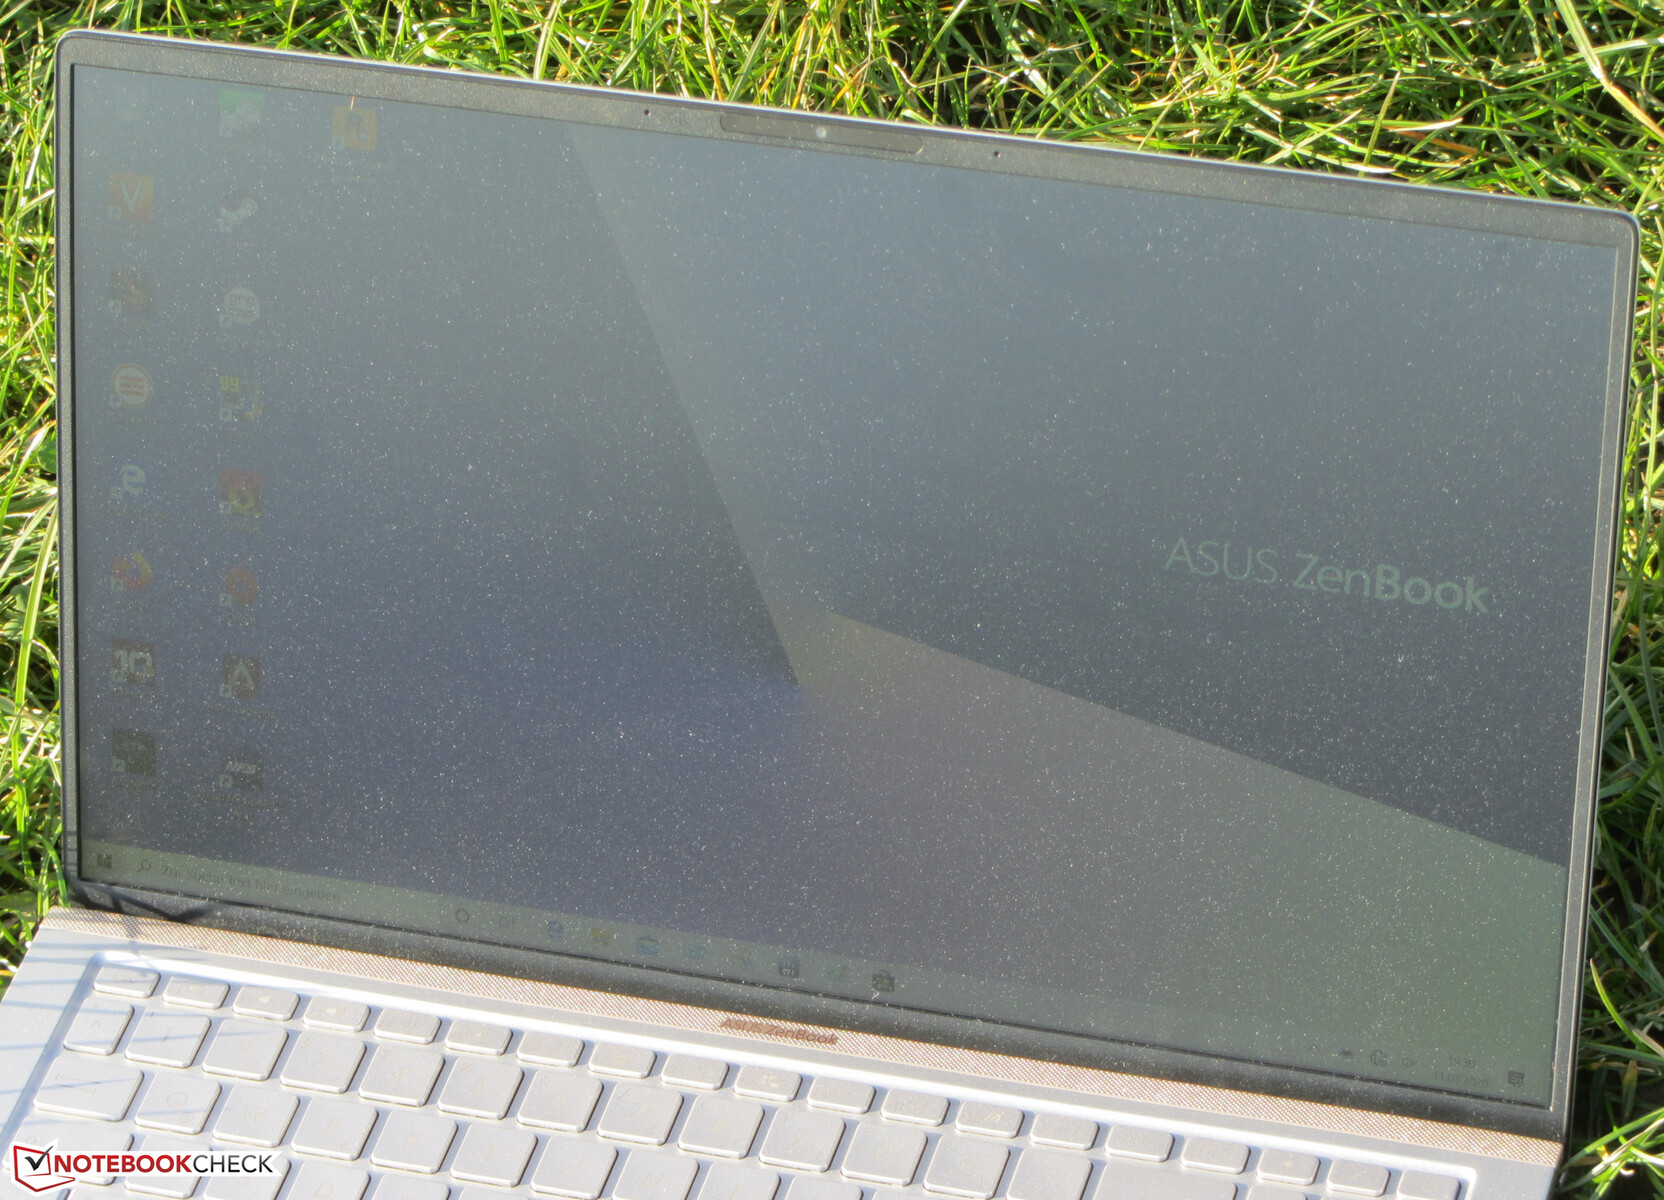
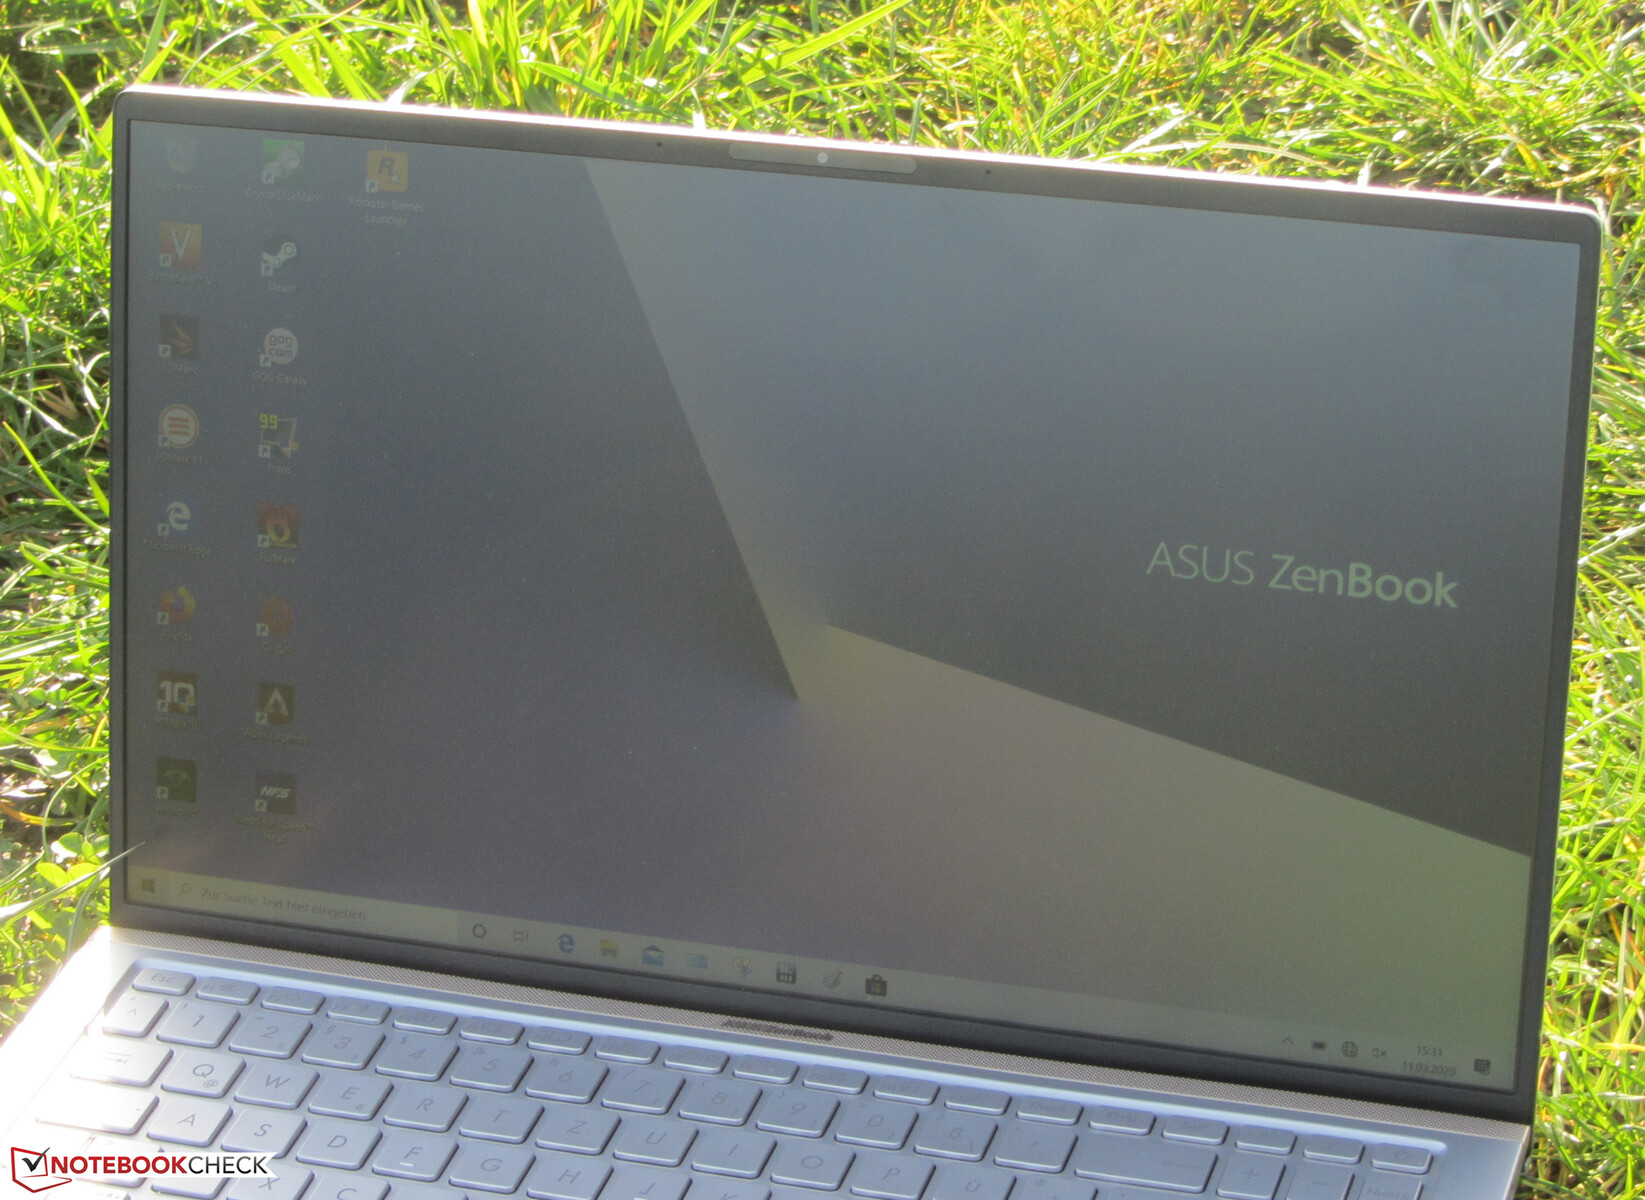
Asus has equipped the ZenBook with an IPS panel with good viewing angles. As a result, the screen can be read from any position. Outdoors, the screen content is discernible provided the sun does not shine too brightly.

Performance - Compact ZenBook with Lots of Performance
With the ZenBook 15 UX534FTC, Asus has delivered a slim, compact 15.6-inch laptop with enough performance for office applications, web applications and beyond. Thanks to the dedicated graphics chip, gaming is also possible. Our test device can be purchased for around 1,600 Euros (~$1,787) as configured. Other configurations are available as well.
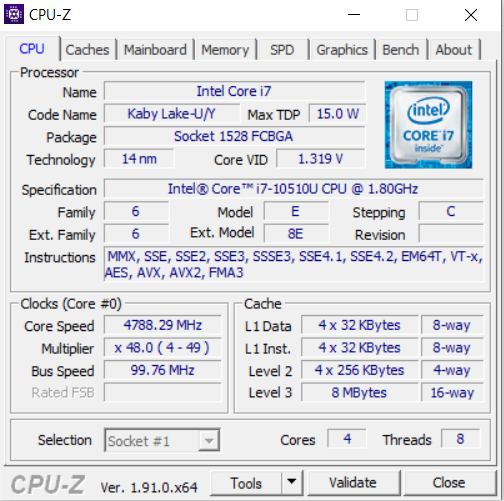
Processor
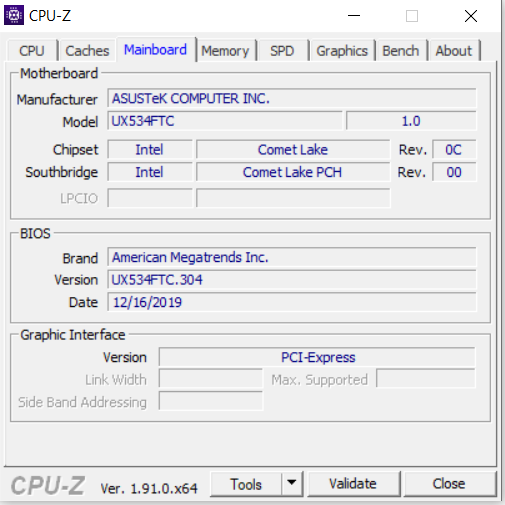
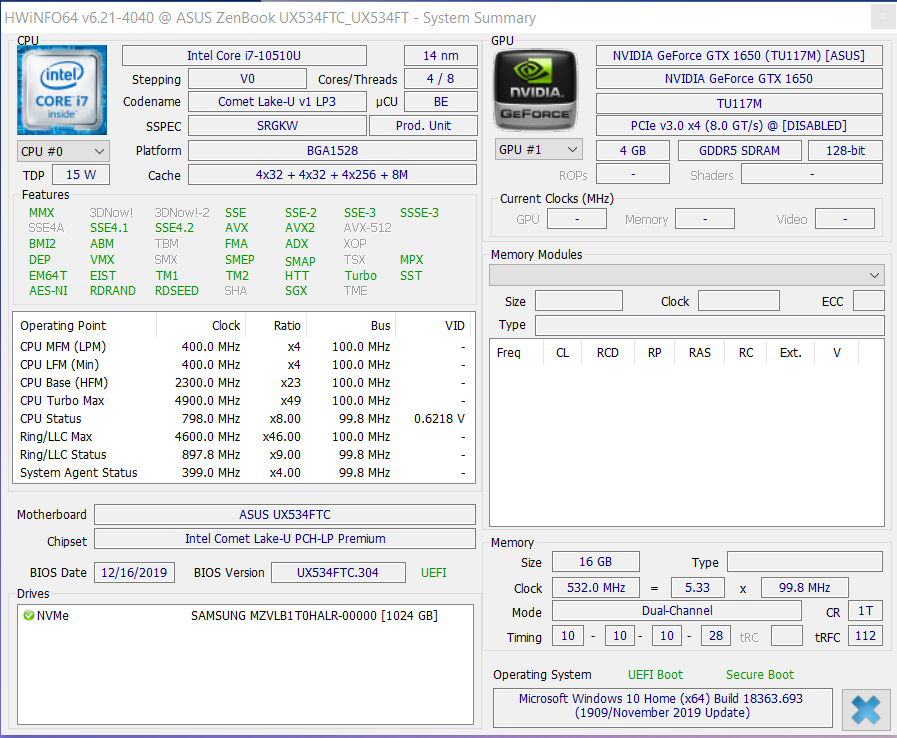
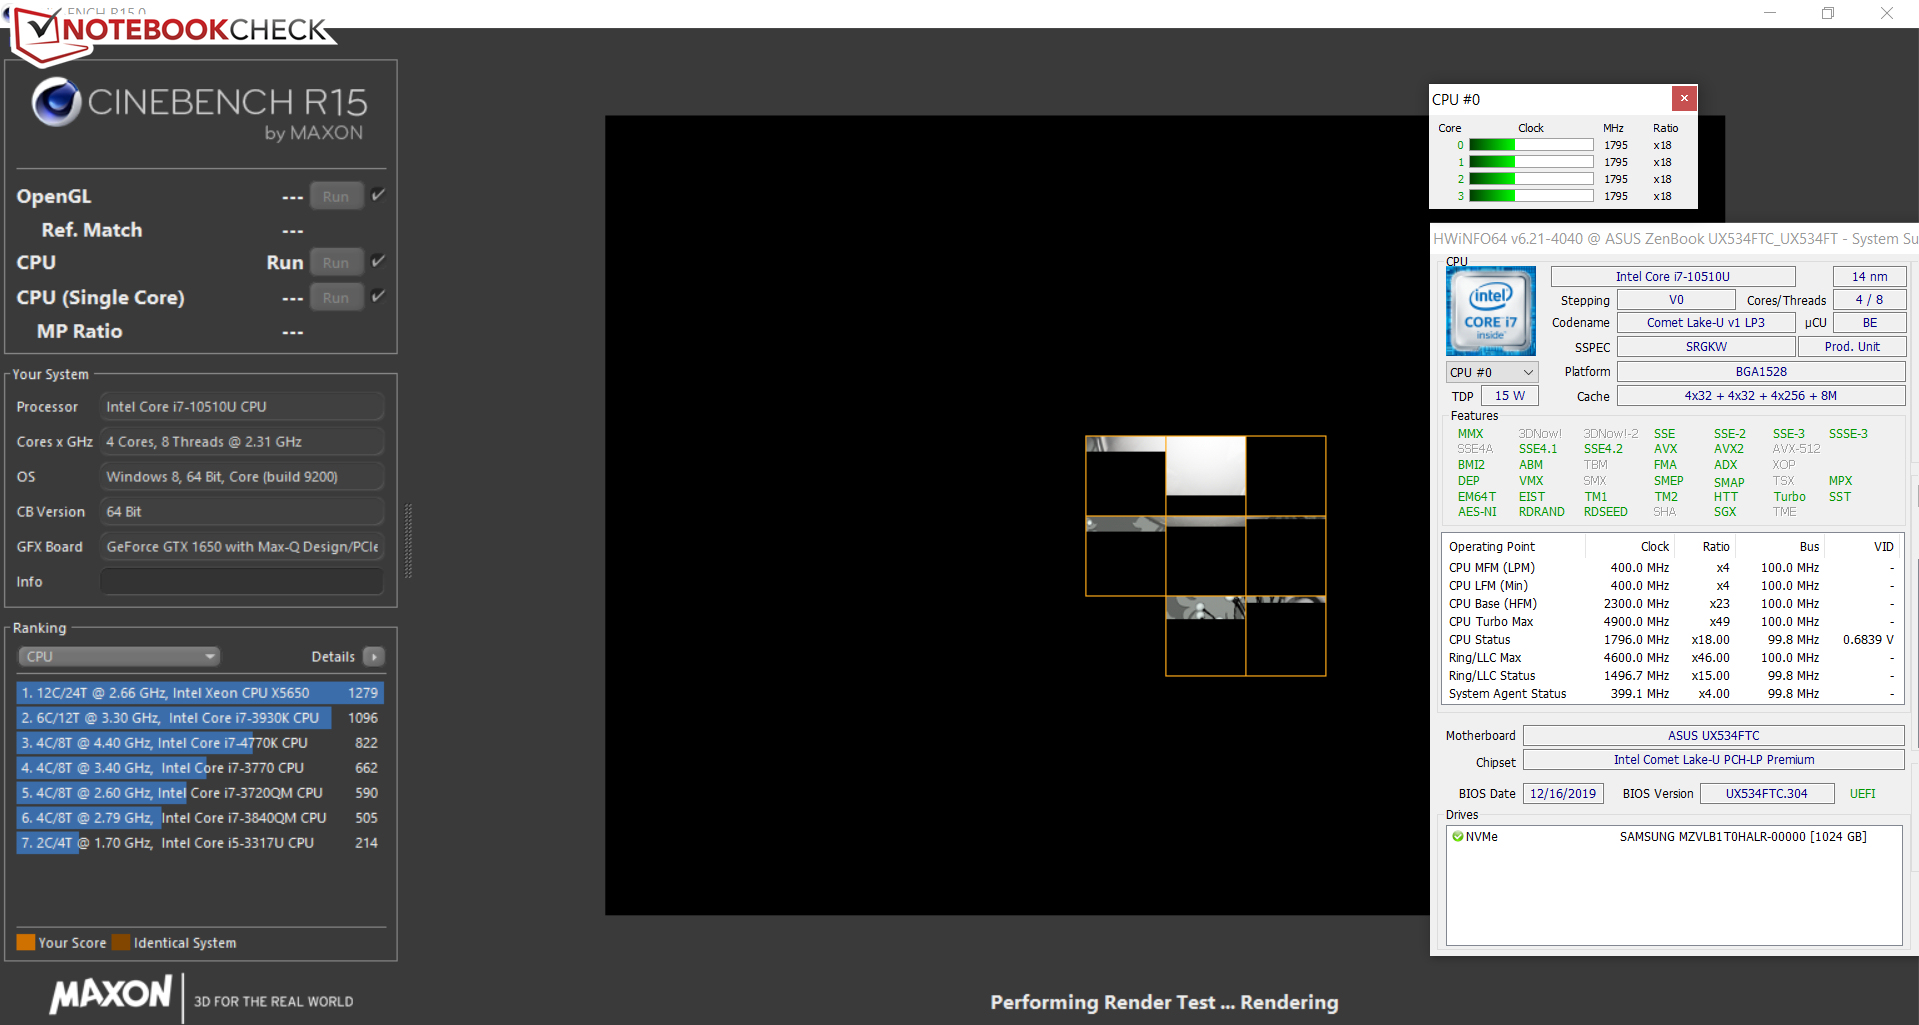
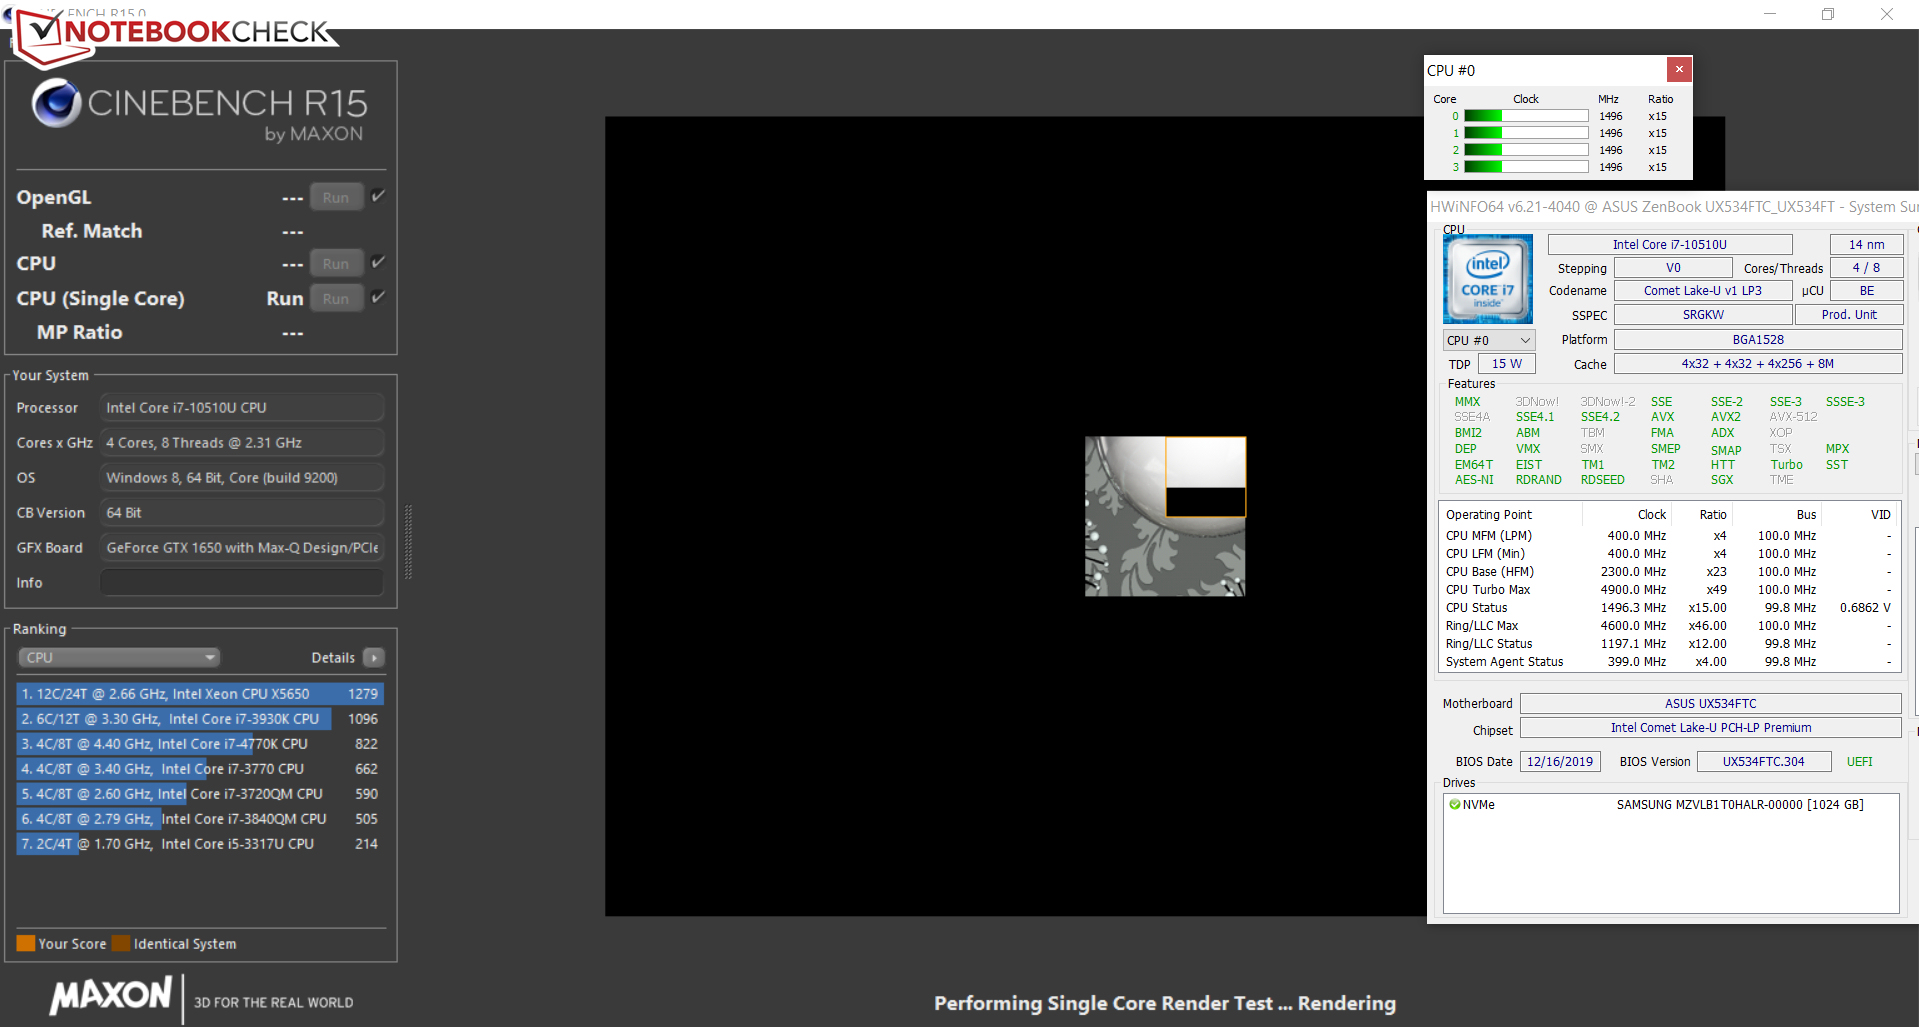
The ZenBook sports a four-core Intel Core-i7-10510U CPU. The ULV model is based on Intel's Comet Lake architecture. The processor runs at a base clock speed of 1.8 GHz. Via Turbo Boost, the CPU can increase its clock rate to 4.3 GHz (all four cores), 4.8 GHz (two cores), or 4.9 GHz (single core).
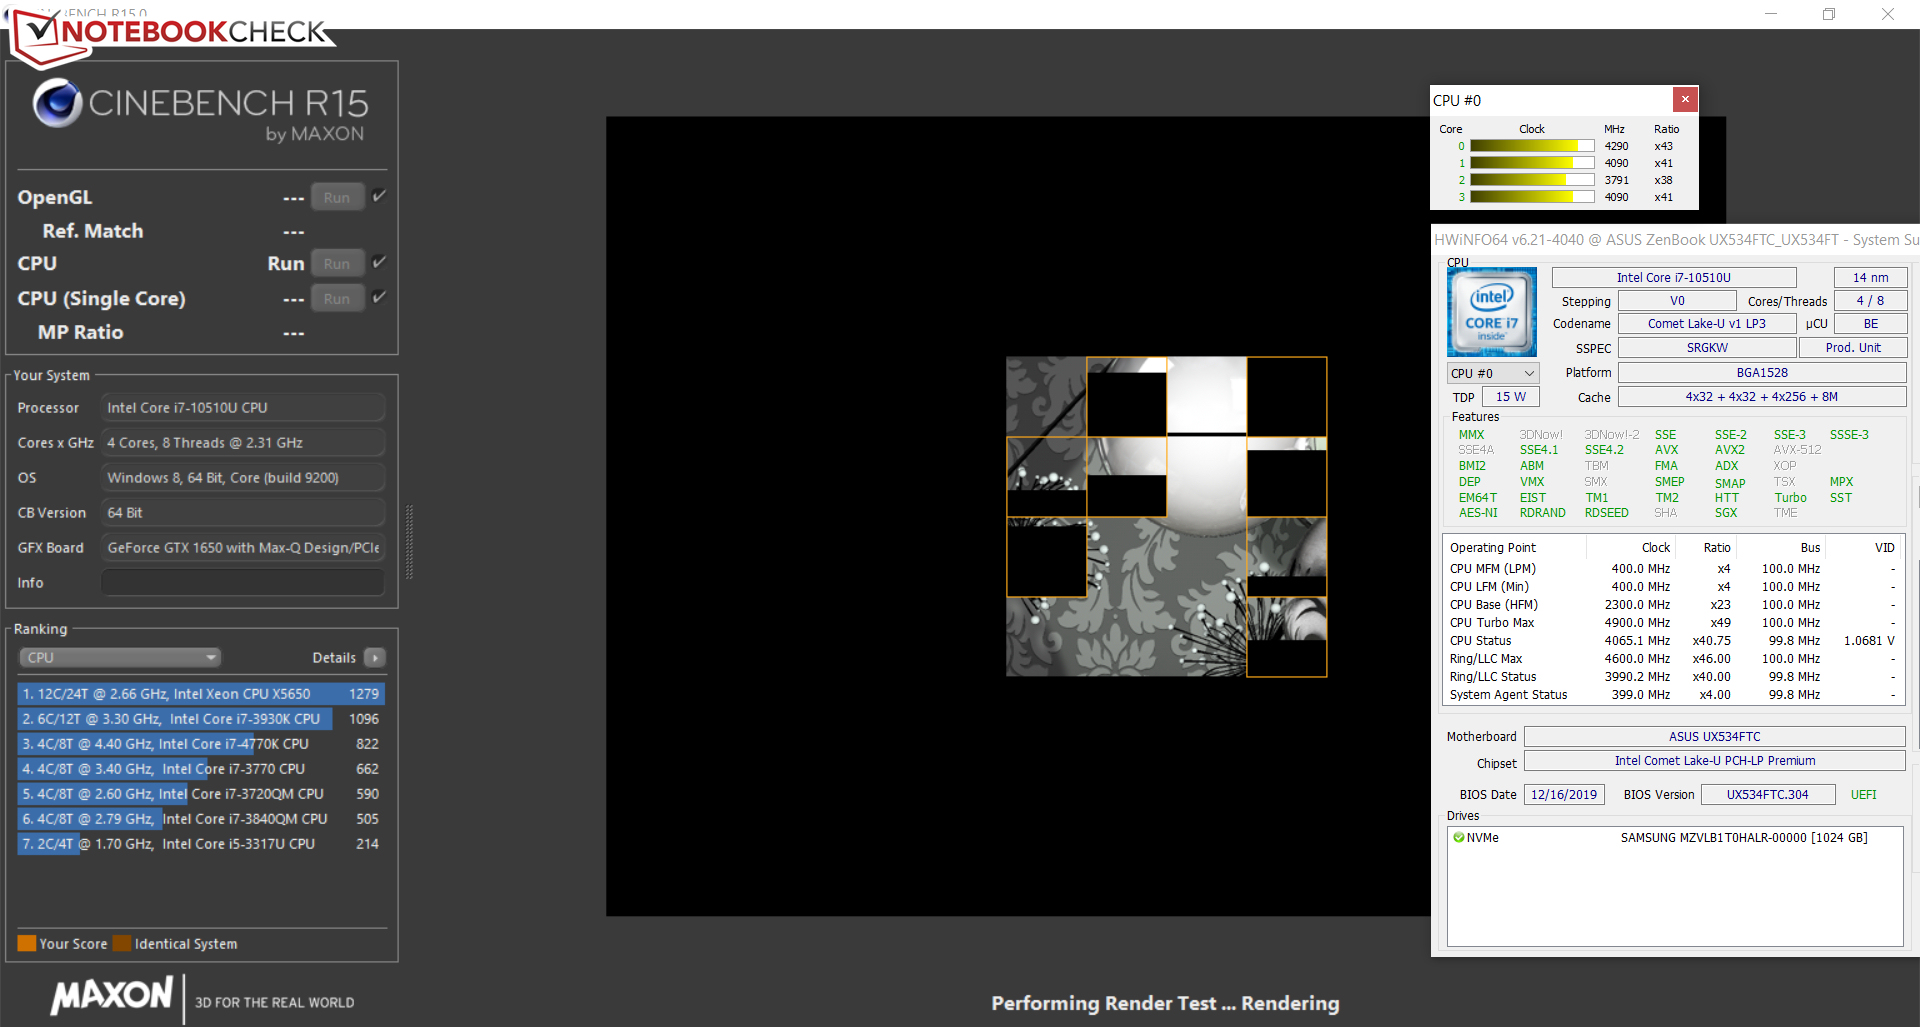
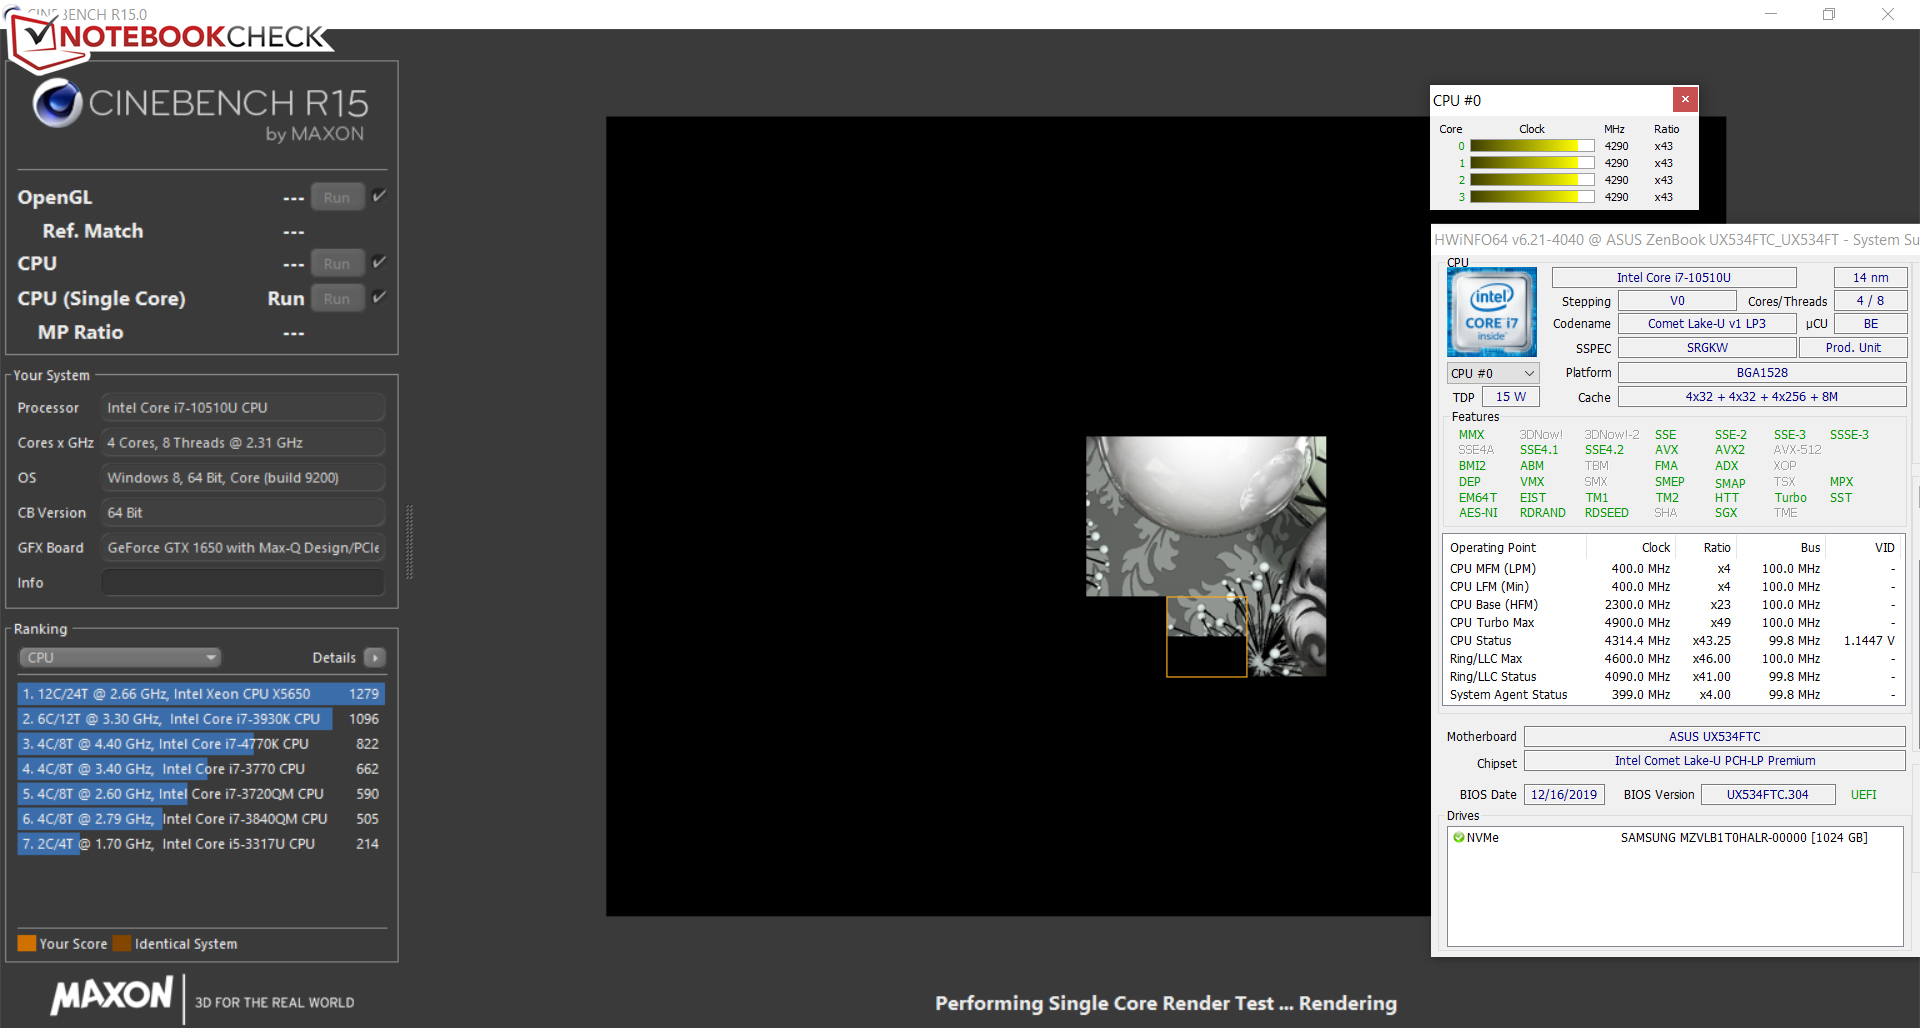
During the Cinebench multithread tests, the CPU temporarily runs at 3.8 to 4.3 GHz. Subsequently, the clock speed drops to the 3.8 GHz to 4 GHz range. During the single-thread tests, the clock rate ranges from 4.3 GHz to 4.6 GHz. The aforementioned values correspond to the behavior while on mains. In battery mode, clock speeds of 1.8 GHz to 2.2 GHz (multithread) and 1.4 GHz to 1.8 GHz (single-thread) can be achieved.
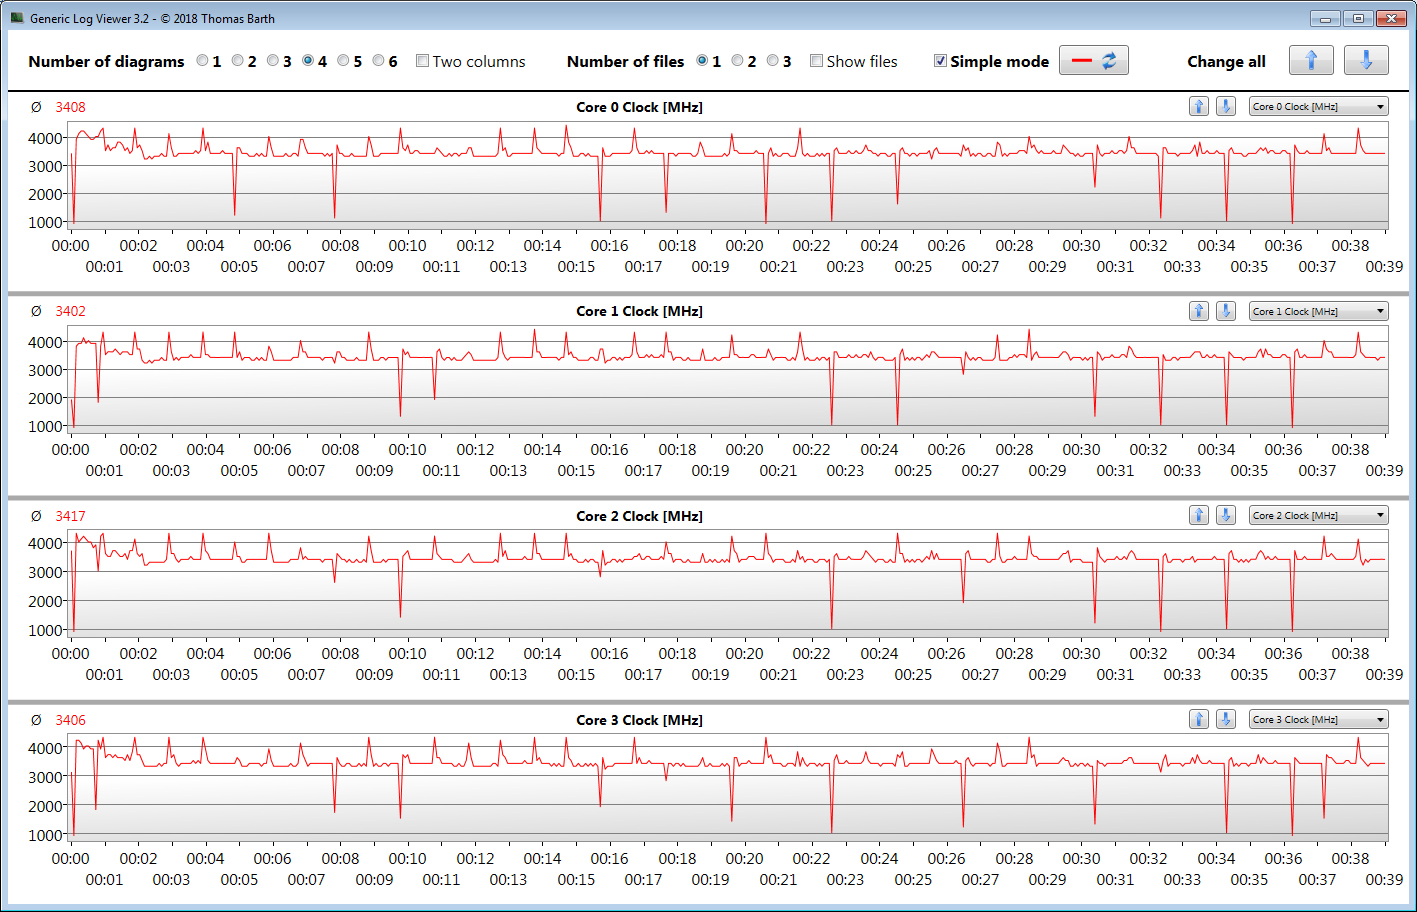
By running Cinebench R15's multithread benchmark in a loop for at least 30 minutes, we assess whether the CPU's Turbo Boost is permanently active while the laptop is connected to an outlet. The initial scores drop off by the third loop and remain on a relatively consistent level thereafter. During this, the CPU Turbo Boost is active.
| Geekbench 3 | |
| 32 Bit Multi-Core Score | |
| Average Intel Core i7-10510U (16742 - 16838, n=2) | |
| Asus ZenBook 15 UX534FTC-A8190T | |
| 32 Bit Single-Core Score | |
| Average Intel Core i7-10510U (4369 - 4485, n=2) | |
| Asus ZenBook 15 UX534FTC-A8190T | |
| Geekbench 4.4 | |
| 64 Bit Multi-Core Score | |
| Average of class Multimedia (n=1last 2 years) | |
| Apple MacBook Pro 16 2019 i9 5500M (macOS 10.15.1) | |
| Apple MacBook Pro 16 2019 i9 5500M (Win 10) | |
| Asus ZenBook 15 UX534FTC-A8190T | |
| Average Intel Core i7-10510U (13116 - 18364, n=14) | |
| 64 Bit Single-Core Score | |
| Average of class Multimedia (n=1last 2 years) | |
| Apple MacBook Pro 16 2019 i9 5500M (macOS 10.15.1) | |
| Apple MacBook Pro 16 2019 i9 5500M (Win 10) | |
| Average Intel Core i7-10510U (4976 - 5832, n=14) | |
| Asus ZenBook 15 UX534FTC-A8190T | |
| Geekbench 5.0 | |
| 5.0 Multi-Core | |
| Apple MacBook Pro 16 2019 i9 5500M (Win 10) | |
| Apple MacBook Pro 16 2019 i9 5500M (mac OS 15.1.0) | |
| Asus ZenBook 15 UX534FTC-A8190T | |
| Average Intel Core i7-10510U (3143 - 4476, n=12) | |
| 5.0 Single-Core | |
| Apple MacBook Pro 16 2019 i9 5500M (mac OS 15.1.0) | |
| Apple MacBook Pro 16 2019 i9 5500M (Win 10) | |
| Average Intel Core i7-10510U (1118 - 1278, n=12) | |
| Asus ZenBook 15 UX534FTC-A8190T | |
| Mozilla Kraken 1.1 - Total | |
| Acer ConceptD 5 CN515-51-73Z7 (Edge) | |
| Asus ZenBook 15 UX534FT-DB77 (Edge 44.17763.1.0) | |
| Asus ZenBook 15 UX534FTC-A8190T (Edge 44) | |
| Dell XPS 15 7590 9980HK GTX 1650 (Edge 44.18362.267.0) | |
| Apple MacBook Pro 16 2019 i9 5500M (Win 10 Chrome 82) | |
| Average Intel Core i7-10510U (742 - 1184, n=36) | |
| Asus ZenBook 15 UX533FD | |
| Average of class Multimedia (228 - 835, n=73, last 2 years) | |
| Octane V2 - Total Score | |
| Average of class Multimedia (64079 - 153175, n=34, last 2 years) | |
| Asus ZenBook 15 UX533FD | |
| Average Intel Core i7-10510U (31505 - 51741, n=17) | |
| Dell XPS 15 7590 9980HK GTX 1650 (Edge 44.18362.267.0) | |
| Asus ZenBook 15 UX534FTC-A8190T (Edge 44) | |
| Asus ZenBook 15 UX534FT-DB77 (Edge 44.17763.1.0) | |
| Acer ConceptD 5 CN515-51-73Z7 (Edge) | |
| JetStream 1.1 - 1.1 Total | |
| Average of class Multimedia (n=1last 2 years) | |
| Dell XPS 15 7590 9980HK GTX 1650 (Edge 44.18362.267.0) | |
| Asus ZenBook 15 UX534FTC-A8190T (Edge 44) | |
| Asus ZenBook 15 UX534FT-DB77 (Edge 44.17763.1.0) | |
| Average Intel Core i7-10510U (142.6 - 296, n=15) | |
| Asus ZenBook 15 UX533FD | |
* ... smaller is better
System Performance
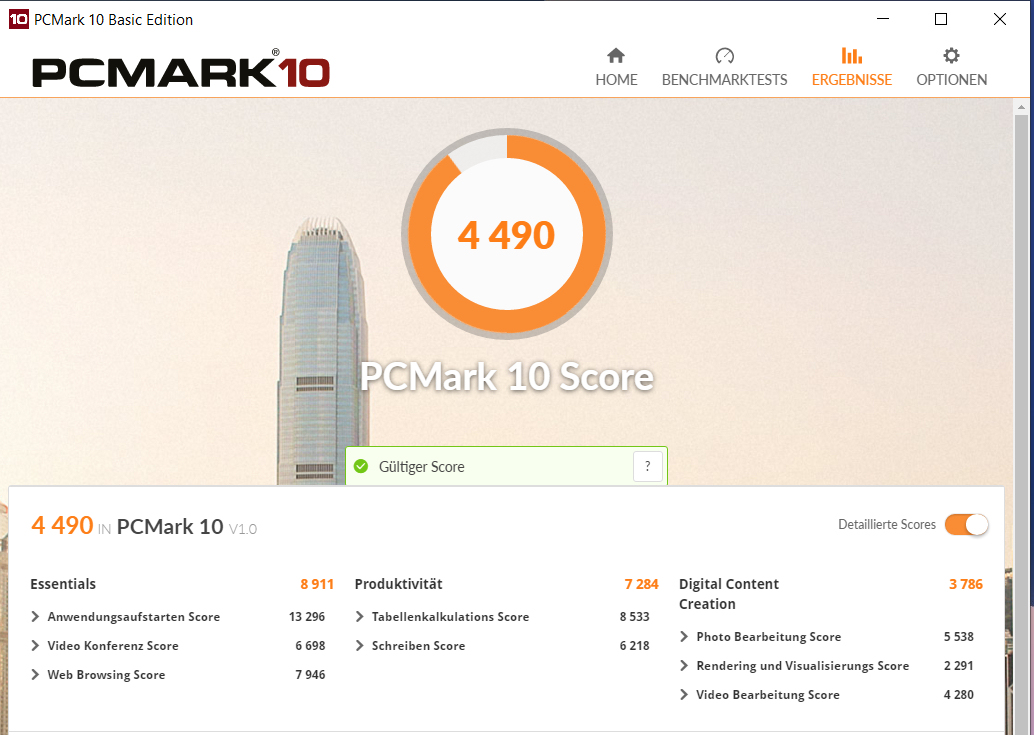
We did not encounter any issues with our ZenBook. The system is responsive and runs smoothly. The processor delivers a performance level that is more than sufficient for most use cases. On top of that, gaming is possible thanks to the dedicated graphics card. Similarly, the PCMark benchmark results are good as well.
| PCMark 8 Home Score Accelerated v2 | 3761 points | |
| PCMark 8 Creative Score Accelerated v2 | 3959 points | |
| PCMark 8 Work Score Accelerated v2 | 5265 points | |
| PCMark 10 Score | 4490 points | |
Help | ||
Storage Solution
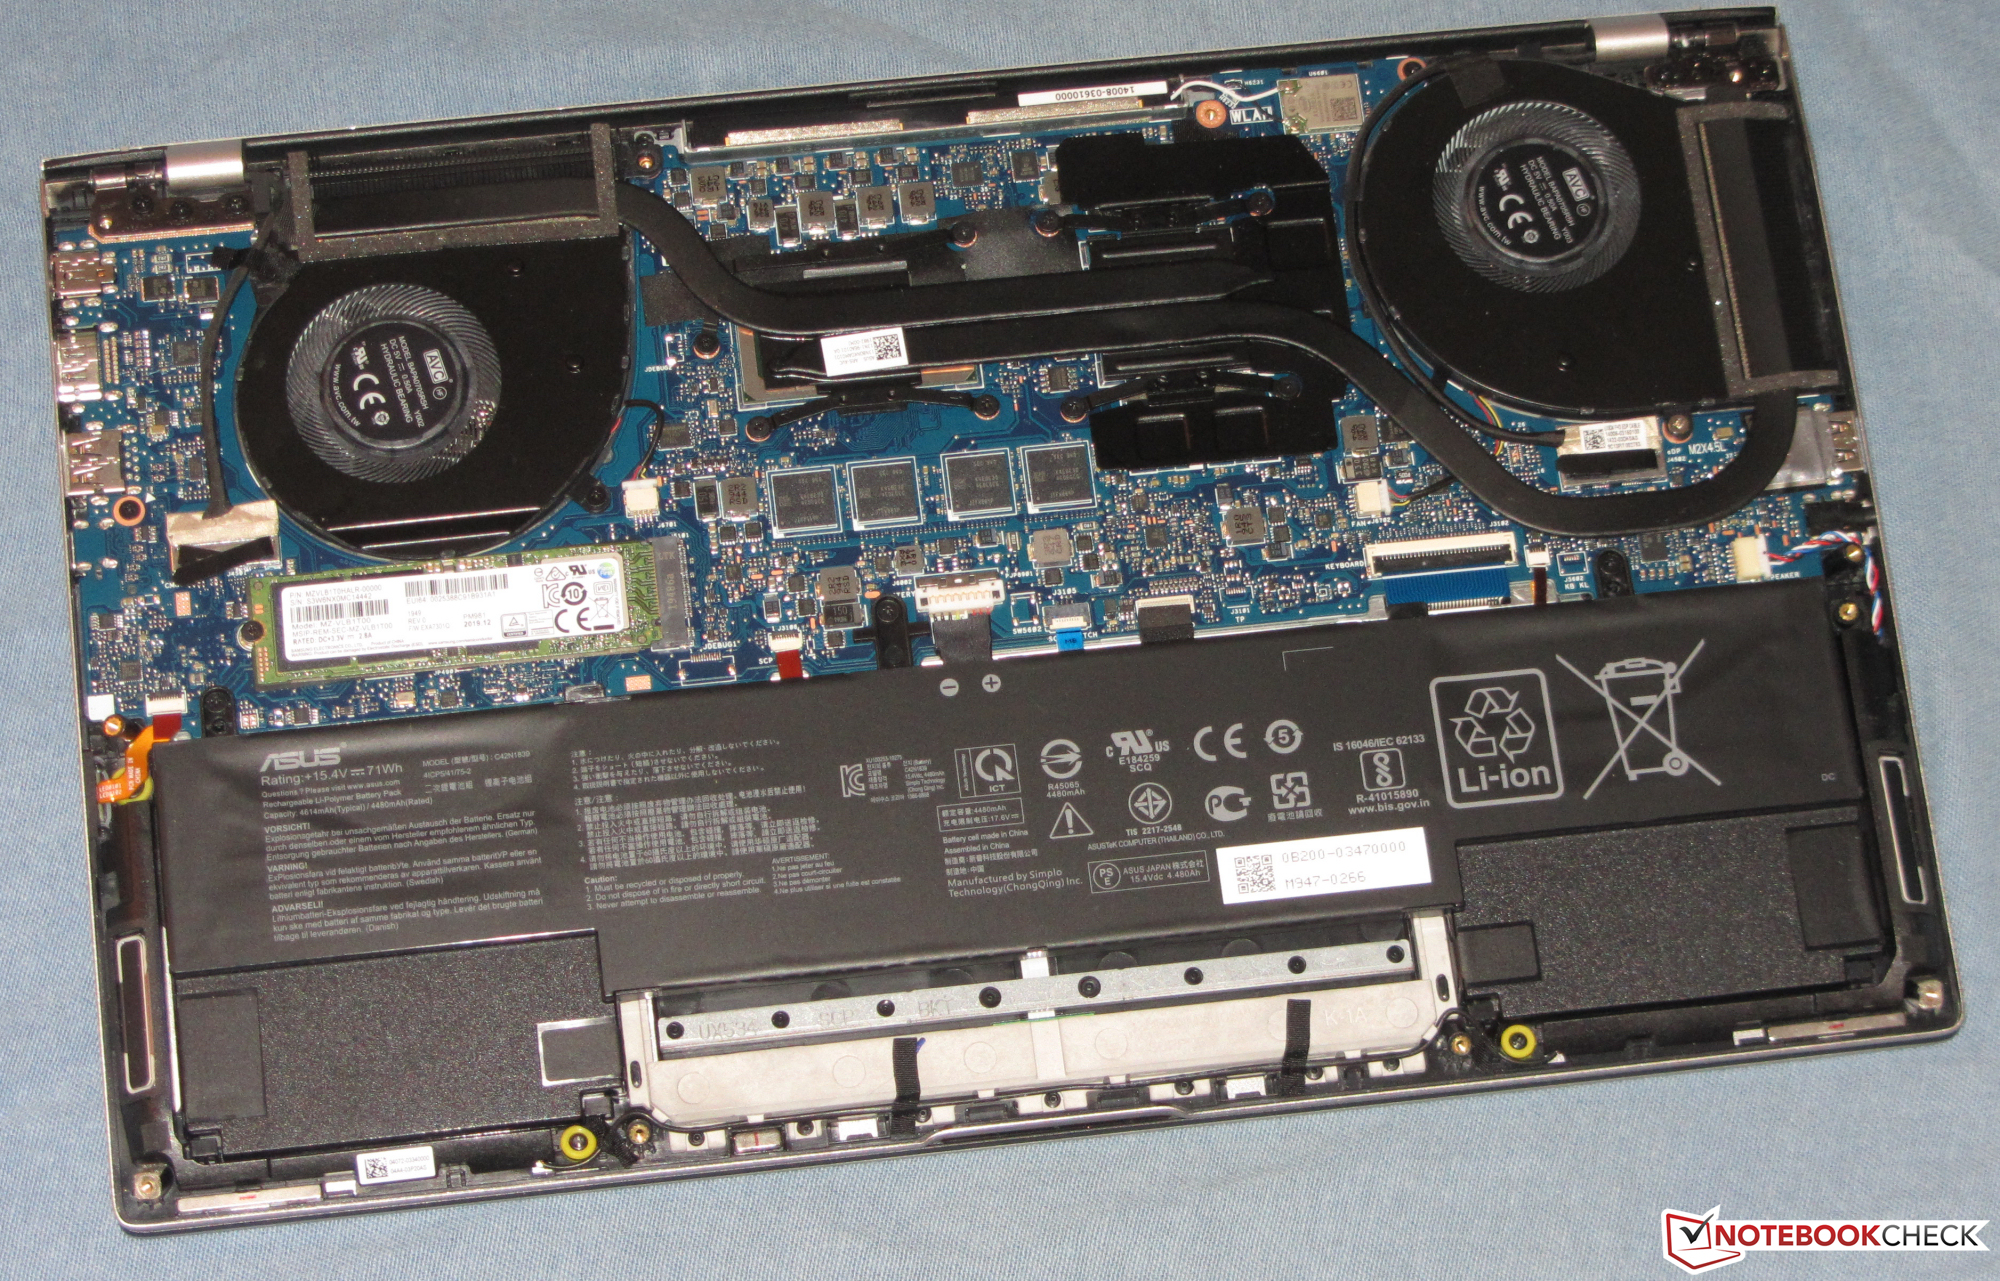
A 1 TB NVMe SSD (M.2-2280) from Samsung serves as the system drive and offers very good transfer rates. There is no space for additional drives on this laptop.
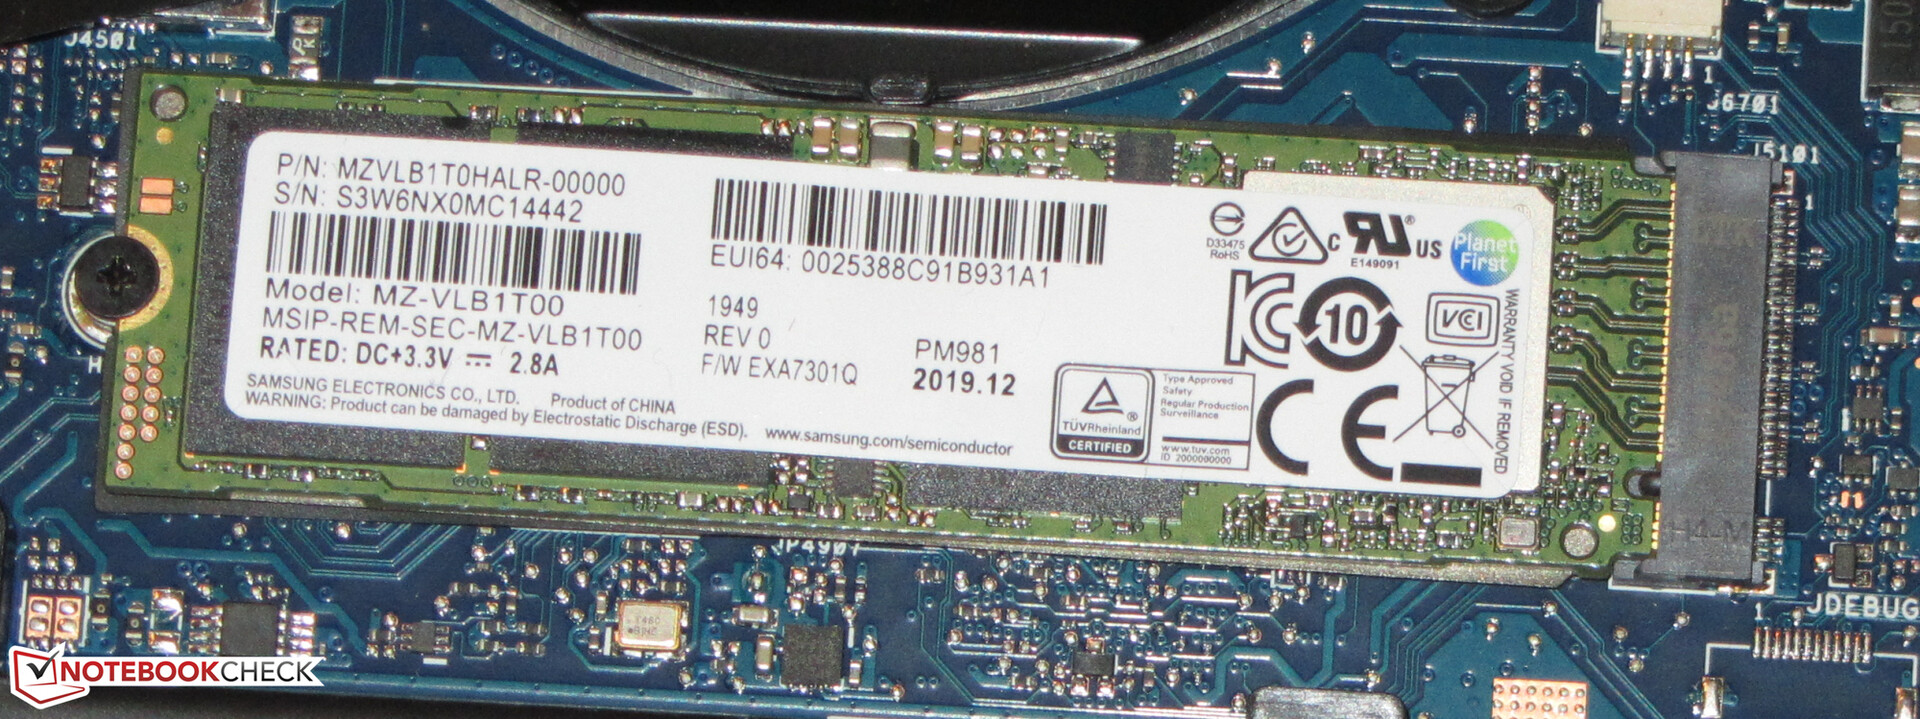

| Asus ZenBook 15 UX534FTC-A8190T Samsung SSD PM981 MZVLB1T0HALR | Asus ZenBook 15 UX534FT-DB77 Samsung SSD PM981 MZVLB1T0HALR | Acer ConceptD 5 CN515-51-73Z7 WDC PC SN720 SDAPNTW-512G | Dell XPS 15 7590 9980HK GTX 1650 Toshiba XG6 KXG60ZNV1T02 | Asus ZenBook 15 UX533FD WDC PC SN520 SDAPNUW-512G | Apple MacBook Pro 16 2019 i9 5500M Apple SSD AP1024 7171 | Average Samsung SSD PM981 MZVLB1T0HALR | |
|---|---|---|---|---|---|---|---|
| CrystalDiskMark 5.2 / 6 | 0% | -6% | -5% | -29% | -12% | -2% | |
| Write 4K (MB/s) | 138.1 | 141.6 3% | 120.6 -13% | 104.3 -24% | 126.2 -9% | 55.5 -60% | 165.7 ? 20% |
| Read 4K (MB/s) | 45.89 | 45.28 -1% | 41.43 -10% | 45.23 -1% | 41.2 -10% | 16.21 -65% | 44.6 ? -3% |
| Write Seq (MB/s) | 2147 | 1975 -8% | 2402 12% | 1729 -19% | 1055 -51% | 1959 -9% | 1982 ? -8% |
| Read Seq (MB/s) | 2188 | 2272 4% | 1997 -9% | 1861 -15% | 884 -60% | 1763 -19% | 1764 ? -19% |
| Write 4K Q32T1 (MB/s) | 427.8 | 458.6 7% | 335.2 -22% | 509 19% | 445.5 4% | 398.5 -7% | 395 ? -8% |
| Read 4K Q32T1 (MB/s) | 404 | 391.4 -3% | 381.7 -6% | 388.5 -4% | 338.8 -16% | 648 60% | 434 ? 7% |
| Write Seq Q32T1 (MB/s) | 2396 | 2393 0% | 2553 7% | 2813 17% | 1453 -39% | 2727 14% | 2351 ? -2% |
| Read Seq Q32T1 (MB/s) | 3454 | 3464 0% | 3356 -3% | 2906 -16% | 1734 -50% | 3242 -6% | 3234 ? -6% |
GPU Performance
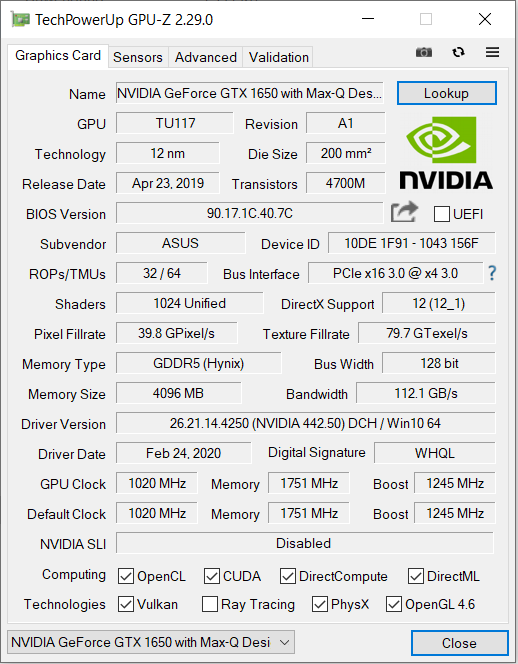
The GeForce GTX 1650 Max-Q GPU (TDP: 35 watts) is a version of the regular GTX 1650 (TDP: 50 watts) that has been trimmed for better efficiency. Unlike RTX 2000 Turing GPUs, neither one of these Turing GPUs offer ray-tracing capabilities or tensor cores, however.
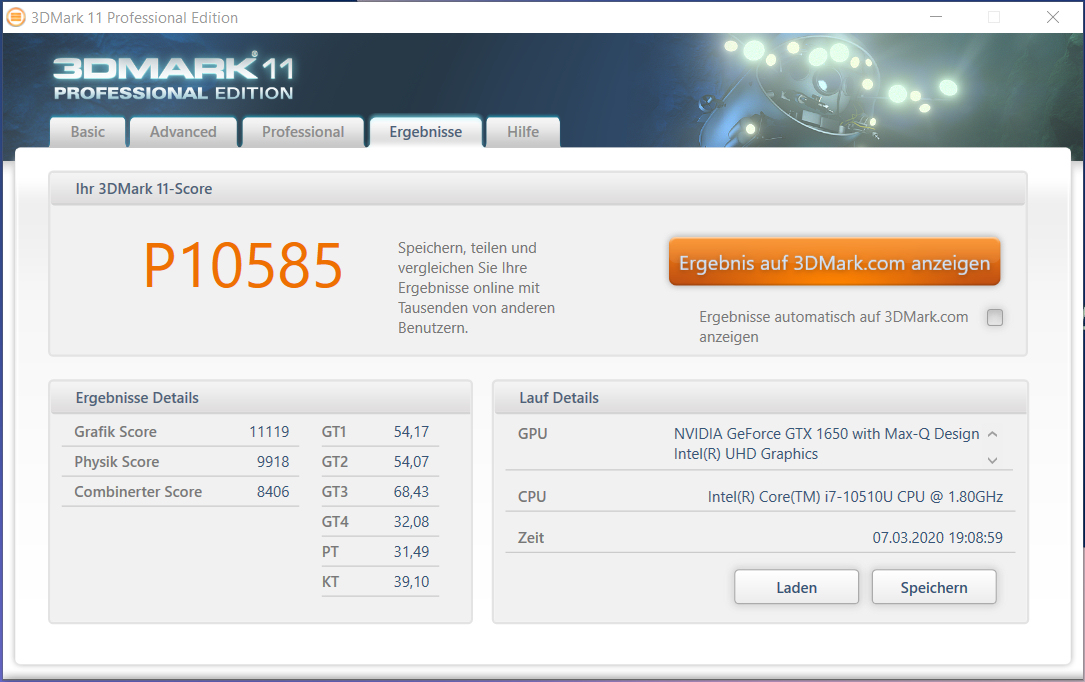
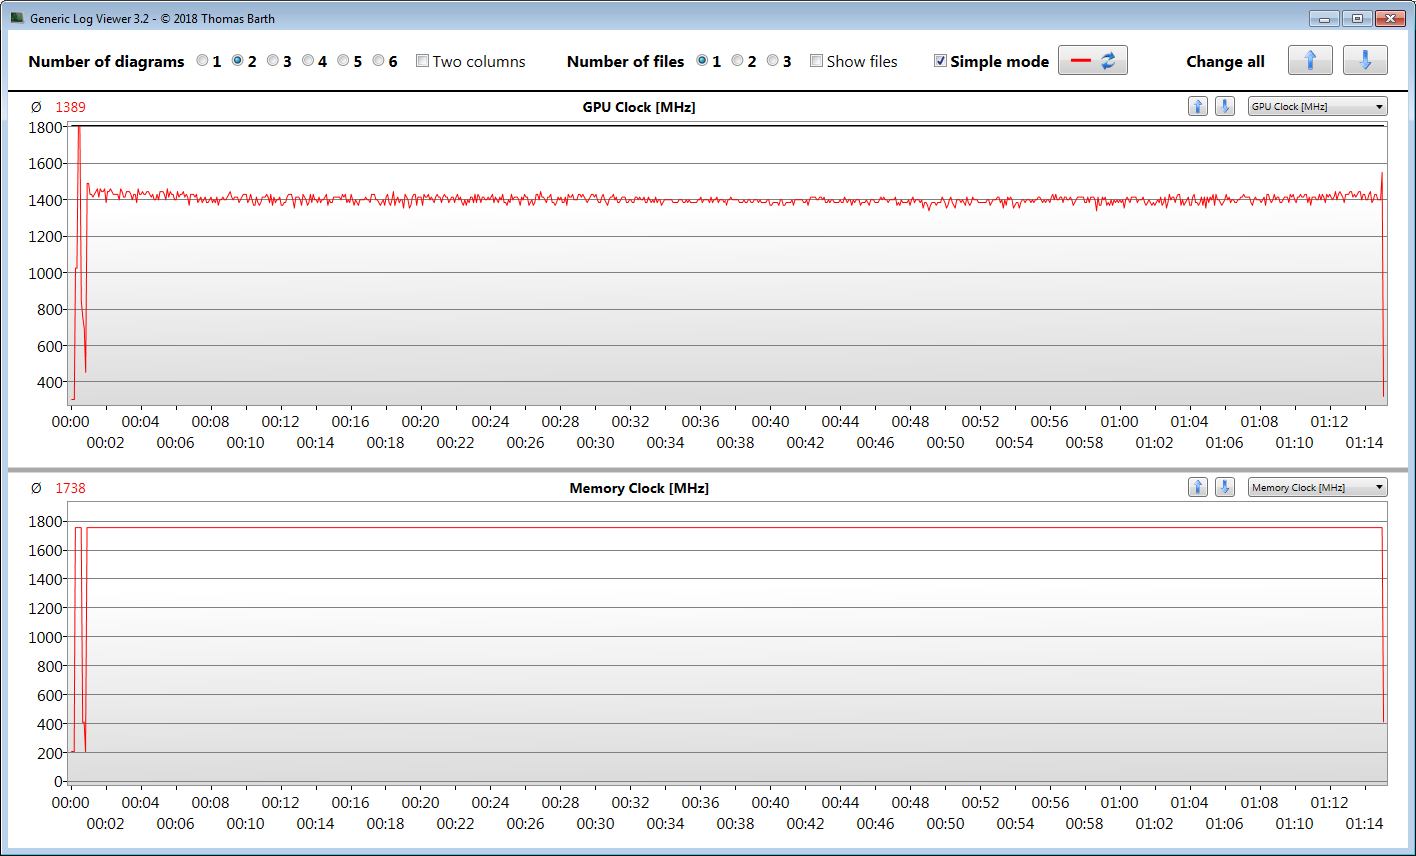
The GTX 1650 Max-Q has a base clock of 1,020 MHz. Via boost, this can be increased to up to 1,245 MHz. As long as the GPU does not cross a certain temperature and/or energy consumption threshold, even faster speeds are possible. During our The Witcher 3 test, it runs at an average clock speed of 1,389 MHz for example. We recorded a maximum clock rate of 1,802 MHz. Furthermore, the GPU has access to fast GDDR5 video memory (4,096 MB).
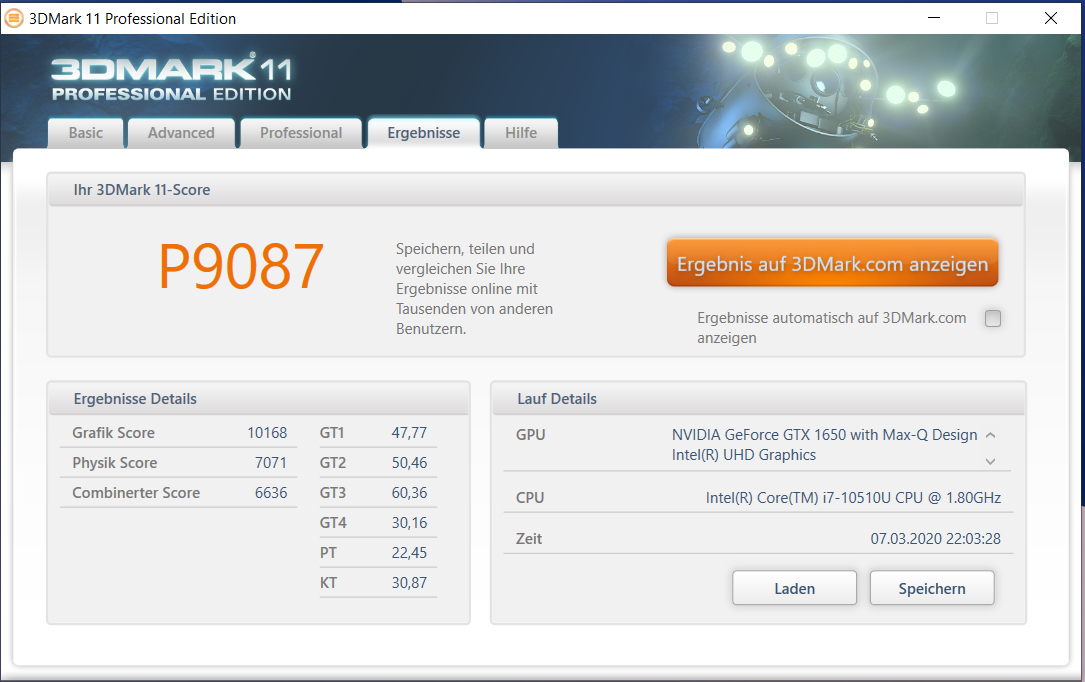
The 3DMark benchmark results match our expectations for this GPU. In battery mode, the raw graphics performance is only about 10% lower. The integrated UHD Graphics 620 is active and the laptop uses Nvidia's graphics-switching technology Optimus.
| 3DMark 06 Standard Score | 32594 points | |
| 3DMark 11 Performance | 10585 points | |
| 3DMark Ice Storm Standard Score | 88439 points | |
| 3DMark Cloud Gate Standard Score | 22796 points | |
| 3DMark Fire Strike Score | 6906 points | |
| 3DMark Time Spy Score | 2945 points | |
Help | ||
Gaming Performance
Even though the ZenBook is not technically a gaming laptop, the installed hardware is able to smoothly run all of the games in our database. Generally, users can run titles in Full HD resolution and at medium to high graphics settings. In some cases, even higher settings are possible. However, the dedicated GPU is not designed for resolutions higher than Full HD.
| BioShock Infinite - 1920x1080 Ultra Preset, DX11 (DDOF) | |
| Average NVIDIA GeForce GTX 1650 Max-Q (70.2 - 84.3, n=7) | |
| Asus ZenBook 15 UX534FTC-A8190T | |
| Asus ZenBook 15 UX534FT-DB77 | |
| Dell XPS 15 7590 9980HK GTX 1650 | |
| Acer ConceptD 5 CN515-51-73Z7 | |
| Asus ZenBook 15 UX533FD | |
| The Witcher 3 - 1920x1080 Ultra Graphics & Postprocessing (HBAO+) | |
| Average of class Multimedia (11 - 121, n=13, last 2 years) | |
| Apple MacBook Pro 16 2019 i9 5500M | |
| Dell XPS 15 7590 9980HK GTX 1650 | |
| Average NVIDIA GeForce GTX 1650 Max-Q (27.5 - 36.5, n=11) | |
| Asus ZenBook 15 UX534FT-DB77 | |
| Asus ZenBook 15 UX533FD | |
| Asus ZenBook 15 UX534FTC-A8190T | |
| Acer ConceptD 5 CN515-51-73Z7 | |
| Apex Legends - 1920x1080 Maximum Settings AA:TS AF:16x | |
| Apple MacBook Pro 16 2019 i9 5500M | |
| Asus ZenBook 15 UX534FTC-A8190T | |
| Average NVIDIA GeForce GTX 1650 Max-Q (54.3 - 59.1, n=3) | |
| Need for Speed Heat - 1920x1080 High Preset | |
| Apple MacBook Pro 16 2019 i9 5500M | |
| Average NVIDIA GeForce GTX 1650 Max-Q (44 - 46.8, n=2) | |
| Asus ZenBook 15 UX534FTC-A8190T | |
In order to test the long-term frame-rate stability, we ran The Witcher 3 for around 60 minutes at Full HD resolution and maximum graphics settings. The character portrayed by the player was not moved over the entire duration of the test. Here, we did not observe frame-rate dips.
| low | med. | high | ultra | |
|---|---|---|---|---|
| Counter-Strike: GO (2012) | 309.6 | 294.4 | 258.6 | 166.6 |
| Tomb Raider (2013) | 367.2 | 253.9 | 191.5 | 92.7 |
| BioShock Infinite (2013) | 286.7 | 208.1 | 182 | 72.7 |
| GTA V (2015) | 162.7 | 142.8 | 76.5 | 36 |
| The Witcher 3 (2015) | 144.6 | 87.2 | 48.7 | 28.1 |
| Batman: Arkham Knight (2015) | 121 | 75 | 64 | 38 |
| Dota 2 Reborn (2015) | 158.2 | 130.9 | 128 | 101.7 |
| World of Warships (2015) | 179 | 144.1 | 117.7 | 104.2 |
| Ashes of the Singularity (2016) | 60.3 | 42.5 | 36.9 | |
| Rocket League (2017) | 249.4 | 193.9 | 131 | |
| World of Tanks enCore (2018) | 414.6 | 160.1 | 59.4 | |
| Far Cry 5 (2018) | 91 | 52 | 48 | 45 |
| Forza Horizon 4 (2018) | 112 | 74 | 69 | 55 |
| Apex Legends (2019) | 143.9 | 78.7 | 59.4 | 59.1 |
| Anthem (2019) | 51.3 | 44.6 | 40.9 | 30.3 |
| Total War: Three Kingdoms (2019) | 150.1 | 52.4 | 31.9 | 23 |
| Control (2019) | 102.8 | 36.1 | 26.3 | |
| Borderlands 3 (2019) | 103.1 | 50.5 | 33.2 | 25.1 |
| FIFA 20 (2019) | 198.6 | 127.9 | 121.5 | 117.7 |
| Ghost Recon Breakpoint (2019) | 75 | 43 | 41 | 24 |
| GRID 2019 (2019) | 121.5 | 60 | 47.6 | 35.2 |
| Call of Duty Modern Warfare 2019 (2019) | 85 | 54.8 | 44.1 | 38.4 |
| Need for Speed Heat (2019) | 68.9 | 50.6 | 44 | 40.6 |
| Red Dead Redemption 2 (2019) | 54.4 | 40.1 | 26.5 | 16.2 |
| Hunt Showdown (2020) | 114.8 | 45.6 | 35.3 |
Emissions - Asus Laptop with Moderate Heat Development
System Noise
In spite of the powerful components, the noise level is reasonable across all load scenarios. While idling, the fans often idle as well for silent operation. Even under load, they remain fairly subtle. In our stress test for example, we register a maximum noise level of 38.2 dB(A) - a rather good result.
Noise level
| Idle |
| 30.3 / 30.3 / 30.9 dB(A) |
| Load |
| 31.3 / 38.2 dB(A) |
 | ||
30 dB silent 40 dB(A) audible 50 dB(A) loud |
||
min: | ||
| Asus ZenBook 15 UX534FTC-A8190T i7-10510U, GeForce GTX 1650 Max-Q | Asus ZenBook 15 UX534FT-DB77 i7-8565U, GeForce GTX 1650 Max-Q | Acer ConceptD 5 CN515-51-73Z7 i7-8705G, Vega M GL / 870 | Dell XPS 15 7590 9980HK GTX 1650 i9-9980HK, GeForce GTX 1650 Mobile | Asus ZenBook 15 UX533FD i7-8565U, GeForce GTX 1050 Max-Q | Apple MacBook Pro 16 2019 i9 5500M i9-9880H, Radeon Pro 5500M | Average NVIDIA GeForce GTX 1650 Max-Q | Average of class Multimedia | |
|---|---|---|---|---|---|---|---|---|
| Noise | 1% | -1% | -9% | -7% | -10% | -5% | 6% | |
| off / environment * (dB) | 30.3 | 28.4 6% | 30.3 -0% | 28.2 7% | 30.5 -1% | 29.8 2% | 29.6 ? 2% | 24.2 ? 20% |
| Idle Minimum * (dB) | 30.3 | 28.4 6% | 30.3 -0% | 28.2 7% | 30.5 -1% | 29.9 1% | 30.2 ? -0% | 24.3 ? 20% |
| Idle Average * (dB) | 30.3 | 28.4 6% | 30.3 -0% | 28.2 7% | 30.5 -1% | 29.9 1% | 30.4 ? -0% | 24.7 ? 18% |
| Idle Maximum * (dB) | 30.9 | 28.4 8% | 30.3 2% | 30.4 2% | 30.5 1% | 29.9 3% | 30.9 ? -0% | 26.4 ? 15% |
| Load Average * (dB) | 31.3 | 33.9 -8% | 32.6 -4% | 43.8 -40% | 40.8 -30% | 43 -37% | 38.2 ? -22% | 37.3 ? -19% |
| Witcher 3 ultra * (dB) | 38.1 | 39.8 -4% | 47.2 -24% | 45.4 -19% | ||||
| Load Maximum * (dB) | 38.2 | 40.2 -5% | 40.2 -5% | 47.2 -24% | 41.8 -9% | 46.1 -21% | 41.2 ? -8% | 45.8 ? -20% |
* ... smaller is better
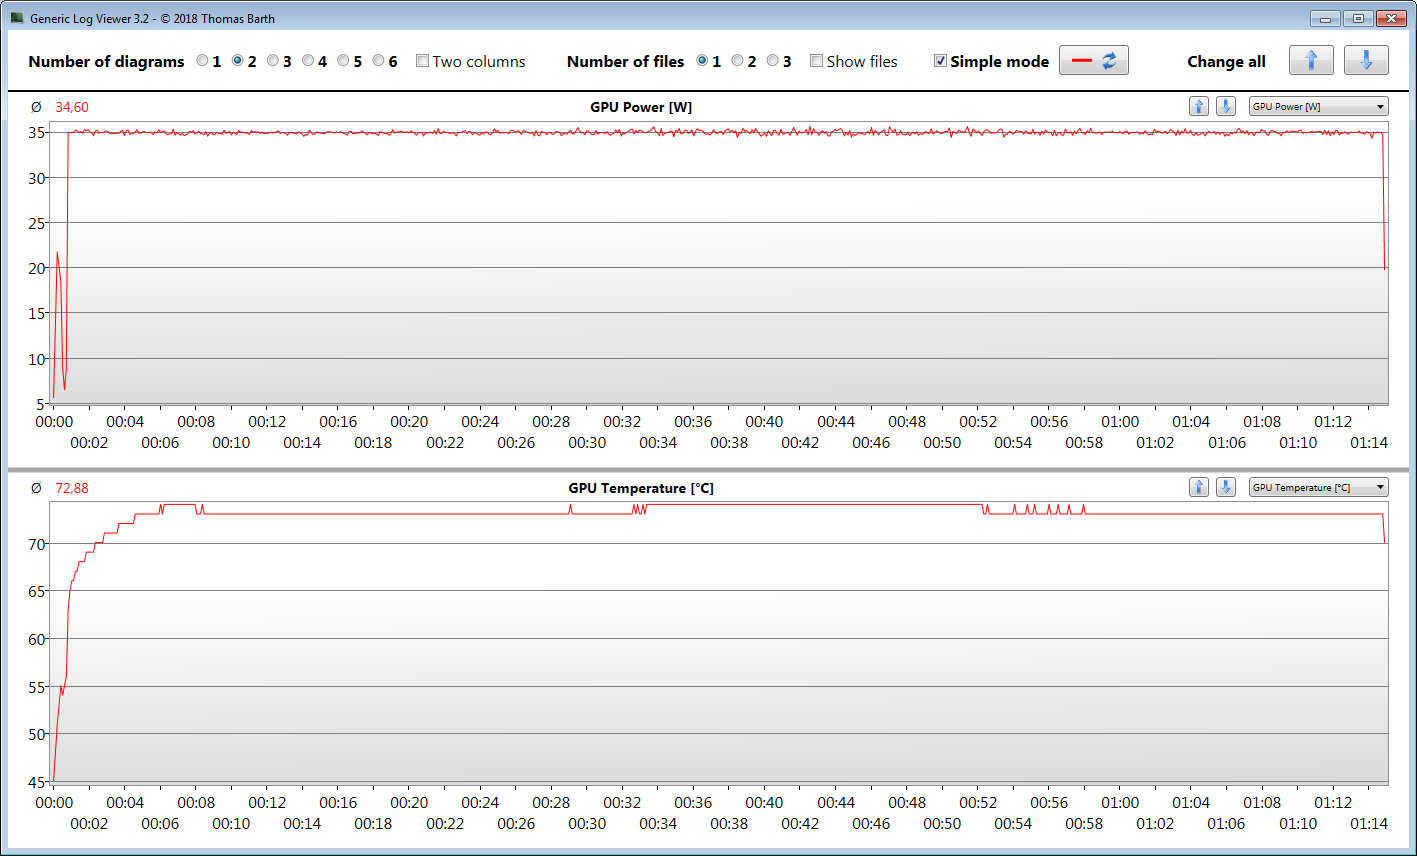
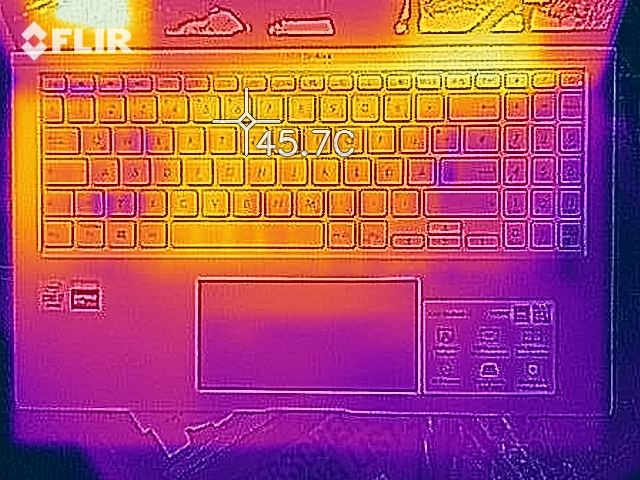
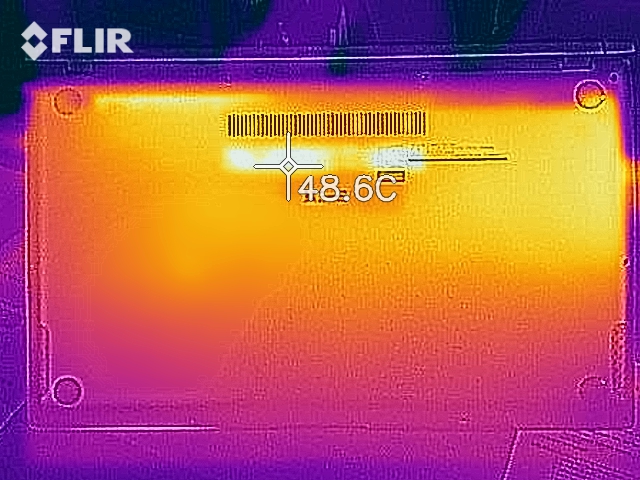
Temperature
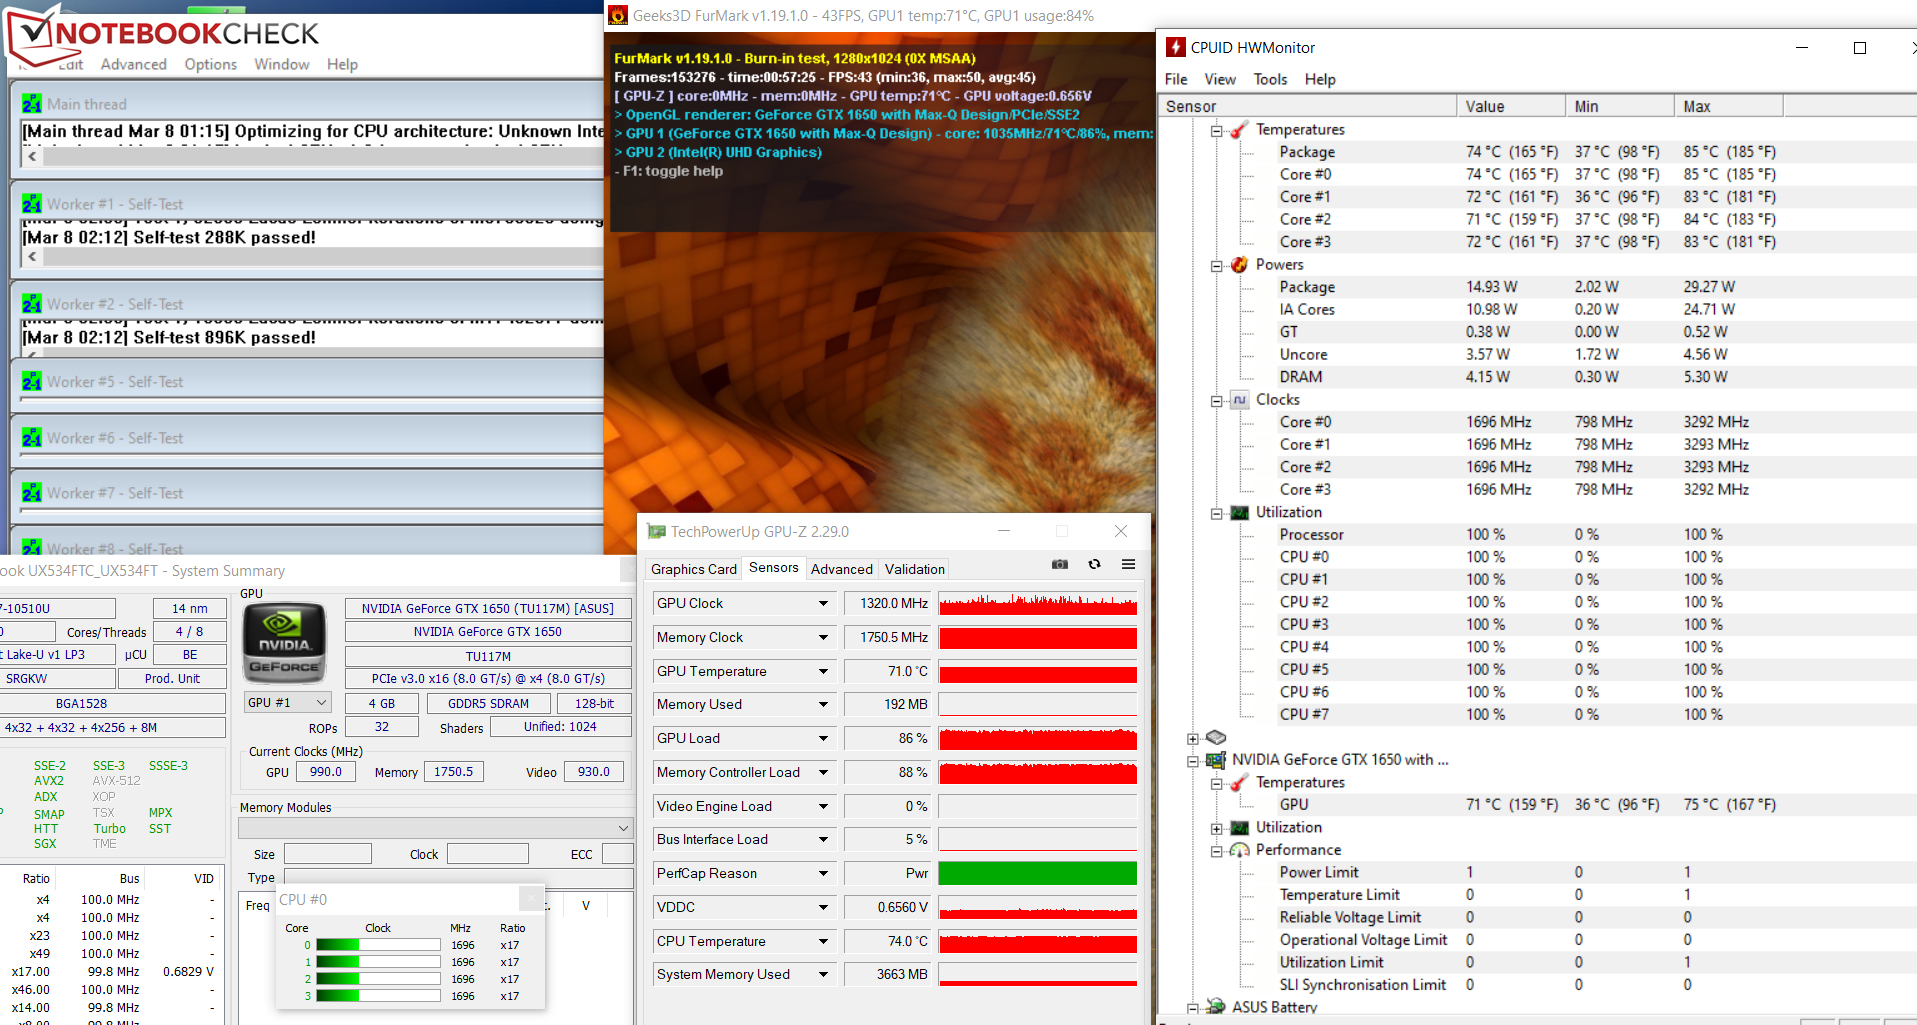
While on mains, the processor runs at 2.5 to 2.6 GHz during the stress test (running Prime95 and FurMark for at least one hour). Over time, the clock speed drops to 1.7 GHz. Meanwhile, the GPU runs at 900 to 1,000 MHz. In battery mode, the clock speeds range from 1.8 GHz to 2.2 GHz (CPU) and 600 MHz to 700 MHz (GPU). The stress test represents an extreme scenario that does not occur during day-to-day use. We use this test to determine whether the system is stable even under maximum load.
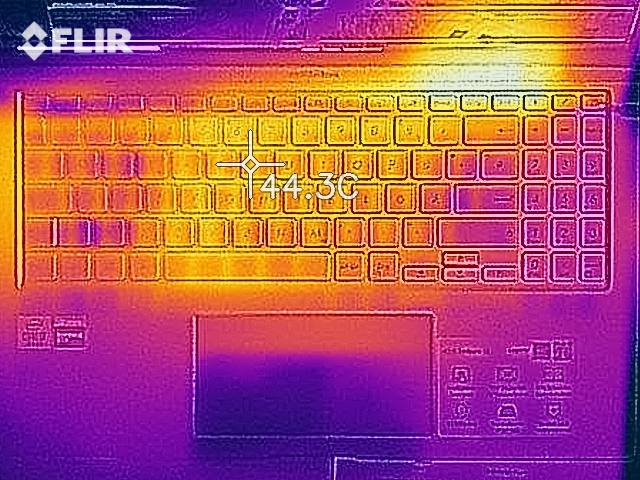
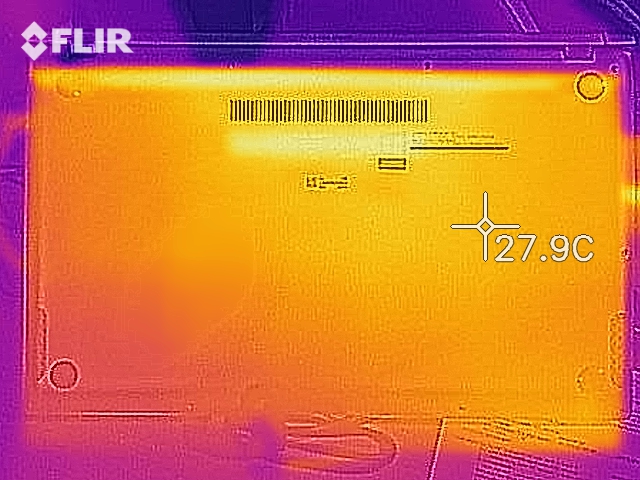
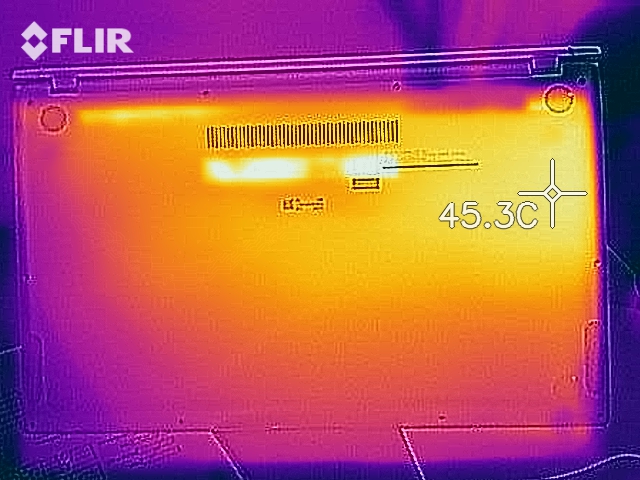
There is not a lot of heat development. During the stress test, we recorded temperatures of just above 40 °C in three spots. In our The Witcher 3 test (running the game for one hour in Full HD resolution and at maximum detail settings), the increase in temperature is even less dramatic. During day-to-day use, users will not have to worry about the temperatures, either.
(±) The maximum temperature on the upper side is 41.4 °C / 107 F, compared to the average of 36.8 °C / 98 F, ranging from 21 to 71 °C for the class Multimedia.
(±) The bottom heats up to a maximum of 40.3 °C / 105 F, compared to the average of 39.1 °C / 102 F
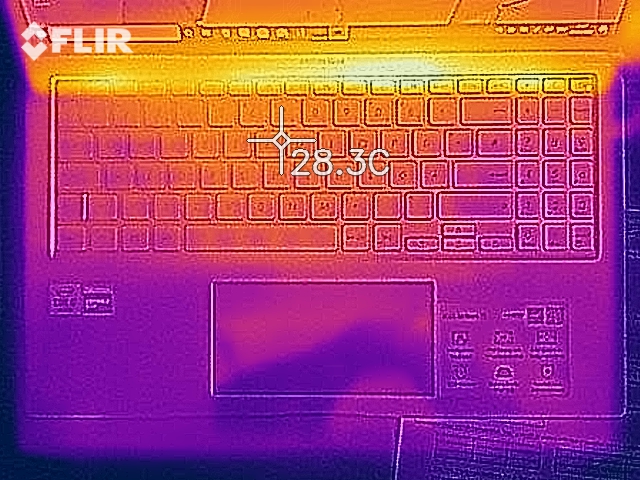
(+) In idle usage, the average temperature for the upper side is 24.3 °C / 76 F, compared to the device average of 31.3 °C / 88 F.
(±) Playing The Witcher 3, the average temperature for the upper side is 34.3 °C / 94 F, compared to the device average of 31.3 °C / 88 F.
(+) The palmrests and touchpad are cooler than skin temperature with a maximum of 30.2 °C / 86.4 F and are therefore cool to the touch.
(±) The average temperature of the palmrest area of similar devices was 28.7 °C / 83.7 F (-1.5 °C / -2.7 F).
| Asus ZenBook 15 UX534FTC-A8190T i7-10510U, GeForce GTX 1650 Max-Q | Asus ZenBook 15 UX534FT-DB77 i7-8565U, GeForce GTX 1650 Max-Q | Acer ConceptD 5 CN515-51-73Z7 i7-8705G, Vega M GL / 870 | Dell XPS 15 7590 9980HK GTX 1650 i9-9980HK, GeForce GTX 1650 Mobile | Asus ZenBook 15 UX533FD i7-8565U, GeForce GTX 1050 Max-Q | Apple MacBook Pro 16 2019 i9 5500M i9-9880H, Radeon Pro 5500M | Average NVIDIA GeForce GTX 1650 Max-Q | Average of class Multimedia | |
|---|---|---|---|---|---|---|---|---|
| Heat | -33% | -6% | -30% | -7% | 3% | -18% | -6% | |
| Maximum Upper Side * (°C) | 41.4 | 45.4 -10% | 44.6 -8% | 50.4 -22% | 47.2 -14% | 42 -1% | 47.4 ? -14% | 41.2 ? -0% |
| Maximum Bottom * (°C) | 40.3 | 51.6 -28% | 45.4 -13% | 49.2 -22% | 43.2 -7% | 38 6% | 49.4 ? -23% | 43.8 ? -9% |
| Idle Upper Side * (°C) | 25.7 | 35.4 -38% | 26.1 -2% | 34.8 -35% | 27.7 -8% | 25 3% | 29.9 ? -16% | 27 ? -5% |
| Idle Bottom * (°C) | 25.8 | 40 -55% | 26.4 -2% | 36.4 -41% | 25.6 1% | 25 3% | 30.8 ? -19% | 28 ? -9% |
* ... smaller is better
Speakers
The stereo speakers are located on the bottom of the device. Although they produce audio with a wide sound stage that sounds fairly good overall, they lack bass. The maximum volume could have been higher as well.
Asus ZenBook 15 UX534FTC-A8190T audio analysis
(-) | not very loud speakers (63.8 dB)
Bass 100 - 315 Hz
(-) | nearly no bass - on average 16.8% lower than median
(±) | linearity of bass is average (13.7% delta to prev. frequency)
Mids 400 - 2000 Hz
(+) | balanced mids - only 4.9% away from median
(+) | mids are linear (6.1% delta to prev. frequency)
Highs 2 - 16 kHz
(+) | balanced highs - only 1.5% away from median
(+) | highs are linear (4.7% delta to prev. frequency)
Overall 100 - 16.000 Hz
(±) | linearity of overall sound is average (22.2% difference to median)
Compared to same class
» 79% of all tested devices in this class were better, 4% similar, 17% worse
» The best had a delta of 5%, average was 17%, worst was 45%
Compared to all devices tested
» 64% of all tested devices were better, 6% similar, 29% worse
» The best had a delta of 4%, average was 24%, worst was 134%
Energy Management - Asus Laptop Does Not Lack Stamina
Energy Consumption
The energy consumption of the UX534FTC is nothing out of the ordinary. We recorded a maximum consumption of 9.4 watts while idling. During the stress test, this value increases to up to 116 watts. While gaming (The Witcher 3 test), we register a consumption of about 62 watts. The power supply is rated for 120 watts.
| Off / Standby | |
| Idle | |
| Load |
|
Key:
min: | |
| Asus ZenBook 15 UX534FTC-A8190T i7-10510U, GeForce GTX 1650 Max-Q | Asus ZenBook 15 UX534FT-DB77 i7-8565U, GeForce GTX 1650 Max-Q | Acer ConceptD 5 CN515-51-73Z7 i7-8705G, Vega M GL / 870 | Dell XPS 15 7590 9980HK GTX 1650 i9-9980HK, GeForce GTX 1650 Mobile | Asus ZenBook 15 UX533FD i7-8565U, GeForce GTX 1050 Max-Q | Apple MacBook Pro 16 2019 i9 5500M i9-9880H, Radeon Pro 5500M | Average NVIDIA GeForce GTX 1650 Max-Q | Average of class Multimedia | |
|---|---|---|---|---|---|---|---|---|
| Power Consumption | -55% | -110% | -70% | -4% | -48% | -66% | -34% | |
| Idle Minimum * (Watt) | 2.8 | 5 -79% | 12 -329% | 6.2 -121% | 2.7 4% | 3.7 -32% | 7.75 ? -177% | 5.64 ? -101% |
| Idle Average * (Watt) | 7.7 | 13.2 -71% | 17.8 -131% | 9.6 -25% | 8 -4% | 12.1 -57% | 11.8 ? -53% | 10 ? -30% |
| Idle Maximum * (Watt) | 9.4 | 24 -155% | 19.7 -110% | 21.2 -126% | 10.6 -13% | 17 -81% | 16.6 ? -77% | 12.2 ? -30% |
| Load Average * (Watt) | 57 | 70 -23% | 59 -4% | 104.3 -83% | 74 -30% | 91.5 -61% | 75.2 ? -32% | 64.8 ? -14% |
| Witcher 3 ultra * (Watt) | 62 | 63.3 -2% | 91.7 -48% | 103 -66% | ||||
| Load Maximum * (Watt) | 116 | 114 2% | 87 25% | 135.3 -17% | 89 23% | 102.3 12% | 105.5 ? 9% | 111.7 ? 4% |
* ... smaller is better
Battery Life
In our real-world Wi-Fi test, the Asus laptop achieves a runtime of 12:23 h. During the test, a script simulates a web-browsing load. We selected the "balanced" profile, disabled energy-saver features and reduced the display brightness to about 150 cd/m². Our video test was completed by the 15.6-inch device after 11:54 h. Here, we play the short film Big Buck Bunny (H.264 codec, 1920x1080 pixels) in a loop. For this test, we selected the "balanced" profile, disabled the wireless modules and energy saver features, and the display brightness was set to 150 cd/m².
| Asus ZenBook 15 UX534FTC-A8190T i7-10510U, GeForce GTX 1650 Max-Q, 71 Wh | Asus ZenBook 15 UX533FD i7-8565U, GeForce GTX 1050 Max-Q, 73 Wh | Acer ConceptD 5 CN515-51-73Z7 i7-8705G, Vega M GL / 870, 48 Wh | Dell XPS 15 7590 9980HK GTX 1650 i9-9980HK, GeForce GTX 1650 Mobile, 97 Wh | Asus ZenBook 15 UX534FT-DB77 i7-8565U, GeForce GTX 1650 Max-Q, 71 Wh | Apple MacBook Pro 16 2019 i9 5500M i9-9880H, Radeon Pro 5500M, 99.8 Wh | Average of class Multimedia | |
|---|---|---|---|---|---|---|---|
| Battery runtime | -4% | -55% | -14% | -11% | -26% | -1% | |
| Reader / Idle (h) | 27.2 | 26.5 -3% | 7.7 -72% | 15.2 -44% | 21.5 -21% | 25.2 ? -7% | |
| H.264 (h) | 11.9 | 6.9 -42% | 9.7 -18% | 16.4 ? 38% | |||
| WiFi v1.3 (h) | 12.4 | 8.7 -30% | 4.6 -63% | 7.8 -37% | 8.4 -32% | 12 -3% | 12 ? -3% |
| Load (h) | 2.4 | 2.9 21% | 1.4 -42% | 3.3 38% | 2.9 21% | 1 -58% | 1.675 ? -30% |
| Witcher 3 ultra (h) | 0.9 |
Pros
Cons
Verdict
With the ZenBook 15 UX534FTC, Asus has created a sleek, slim 15.6-inch laptop that almost has the dimensions of a 14-inch device. Despite the compact construction, it does not lack performance. Both the four-core Core i7-10510U and the dedicated GeForce GTX 1650 Max-Q are able to consistently run at high speeds.
For the CPU, this only holds true while on mains, however. In battery mode, the CPU Turbo Boost usage is poor to non-existent. Evidently, this is the cost of the laptop's excellent battery life. Positive: The heat development is moderate at worst and the noise level is acceptable as well.
The Asus ZenBook 15 UX534FTC combines high performance with outstanding battery life.
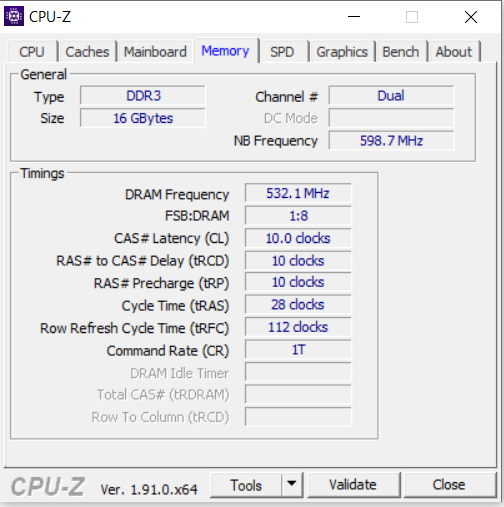
The installed NVMe SSD provides enough storage and fast transfer rates. Replacing the SSD would require users to open the case, which is not a particularly complicated task. By contrast, the RAM (up to 16 GB) cannot be upgraded, since it is soldered. We would have liked to see an optional ZenBook model with 32 GB of RAM for users who are looking for a more future-proof configuration.
The matte IPS display shines with solid viewing angles, a good contrast ratio and decent color representation. That being said, the brightness level is insufficient for a device in this price range. The keyboard backlight has proven to be a handy extra during daily use.
Furthermore, we criticize the lack of a Thunderbolt 3 port. On a compact, mobile 1,600-Euro (~$1,787) laptop, it should be included by default. The connector would have allowed for the use of feature-rich docking stations and more powerful, external GPUs. As it stands, Asus has only equipped the ZenBook with two USB 3.2 Gen 2 ports (1x Type-A, 1x Type-C). Here, the Type-C port can only be used for peripherals. It does not support the DisplayPort via USB Type-C feature.
Asus ZenBook 15 UX534FTC-A8190T
- 03/16/2020 v7 (old)
Sascha Mölck
Price comparison

