Power Overwhelming: Dell XPS 15 7590 Core i9 and GeForce GTX 1650 OLED Laptop Review
Dell unveiled its XPS 15 7590 at Computex 2019 as a relatively minor update to last year's XPS 15 9570. Aside from the expected upgrade to Intel 9th gen Core ix and Nvidia Turing GTX options, the latest model addresses the infamous "nose cam" similar to the latest XPS 13 9380 model. Current SKUs range from the Core i5-9300H to the unlocked Core i9-9980HK, 1080p matte to 4K IPS touch or 4K OLED non-touch, and UHD Graphics 630 to the GeForce GTX 1650 GPU. The wide selection of SKUs allows for an equally wide range of prices from $1000 to over $2600 USD.
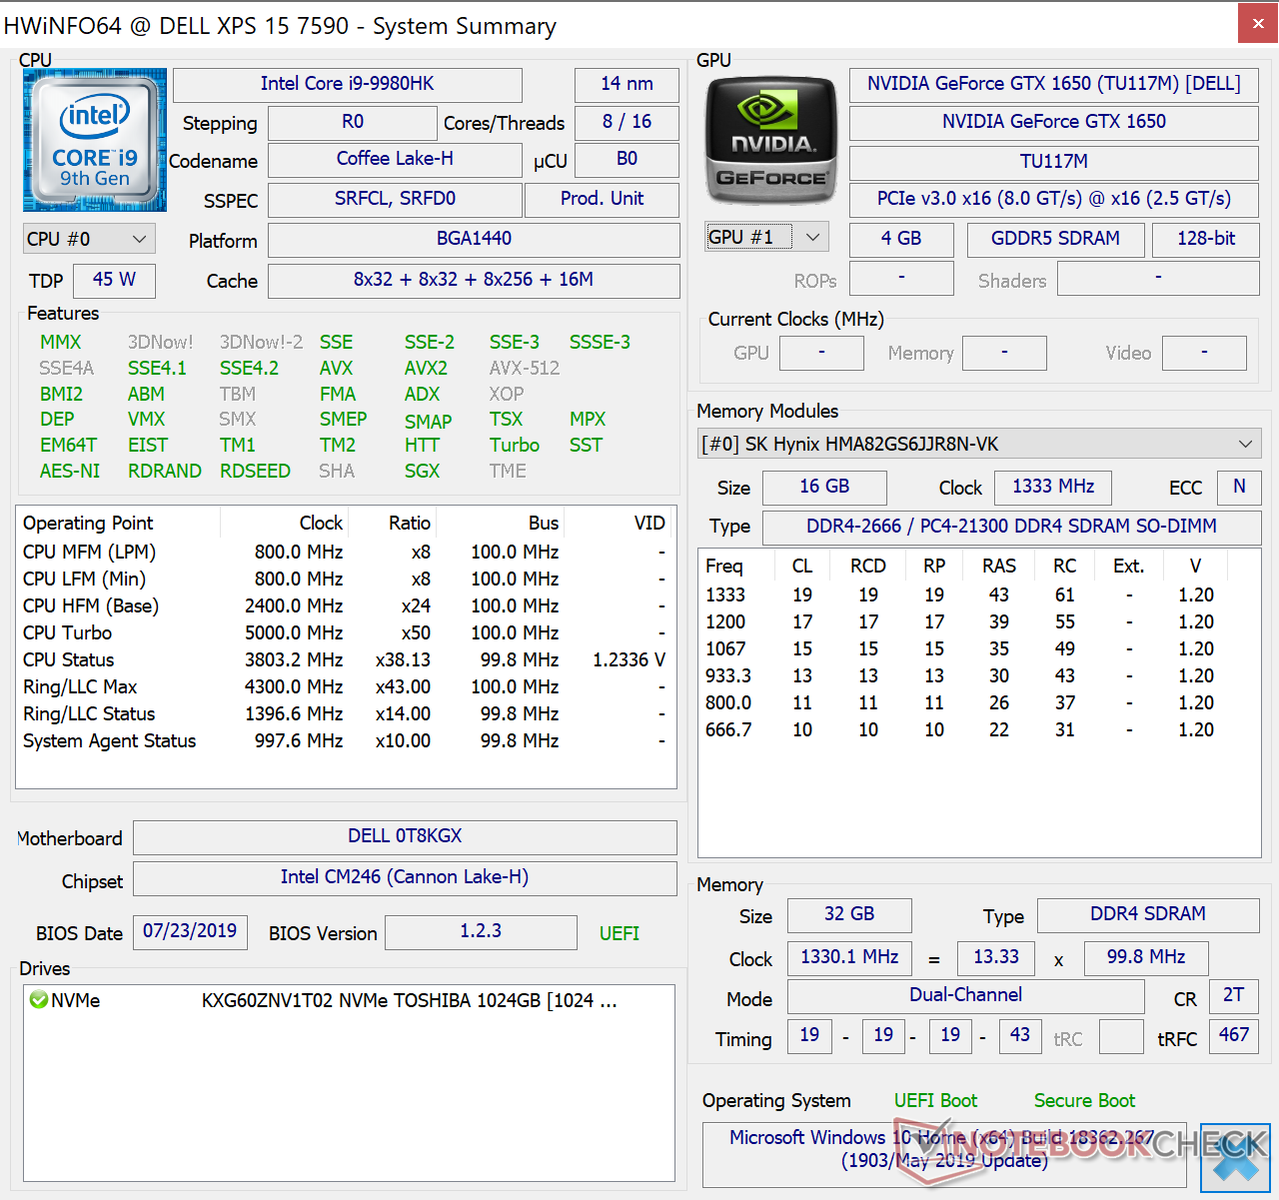
The configuration we'll be looking at today is the higher-end SKU with the Core i9 CPU, OLED display, and GeForce GTX GPU to represent the best that the XPS 15 7590 has to offer — in theory, at least. Our review below will show why Dell may still be packing in too much power for this aging chassis to handle. We fully intend to check out the Core i5 and Core i7 SKUs as well in the near future to get a bigger picture of the 7590 series and to find out which SKU is the most balanced.
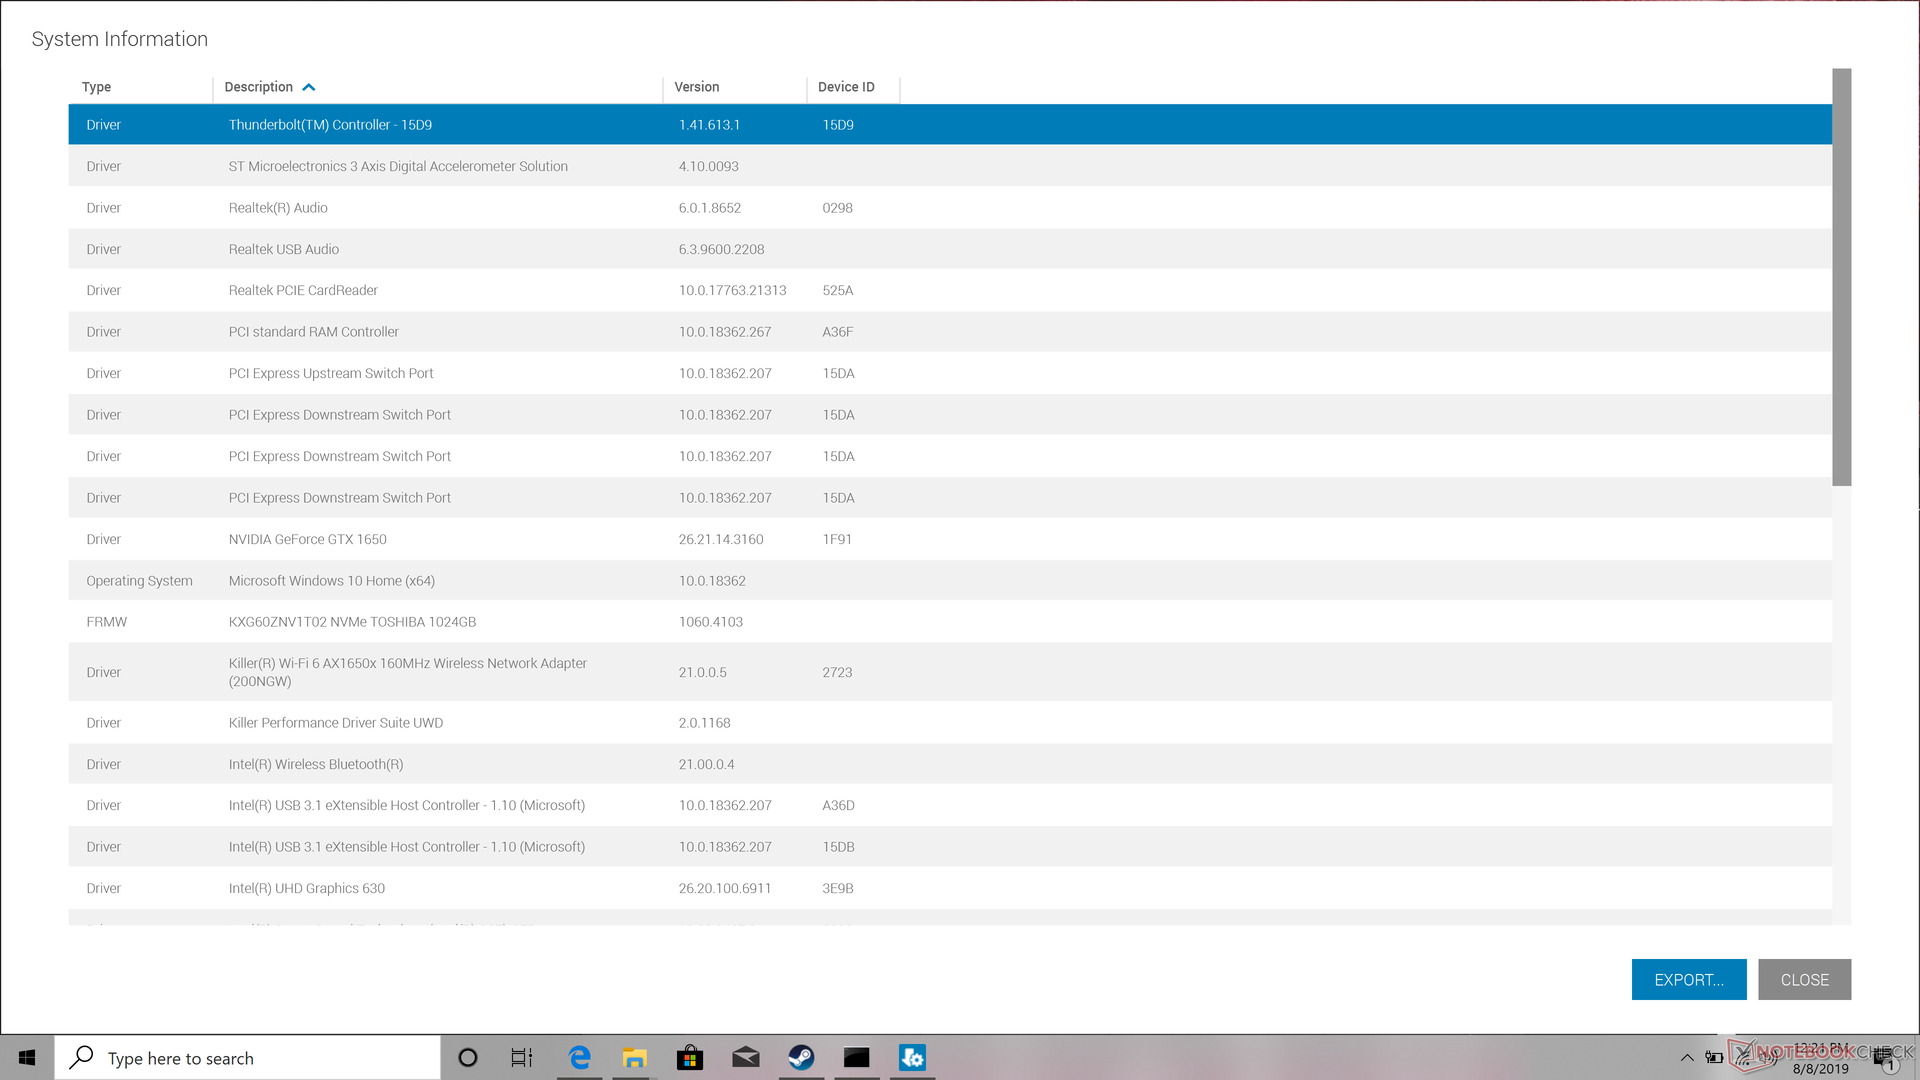
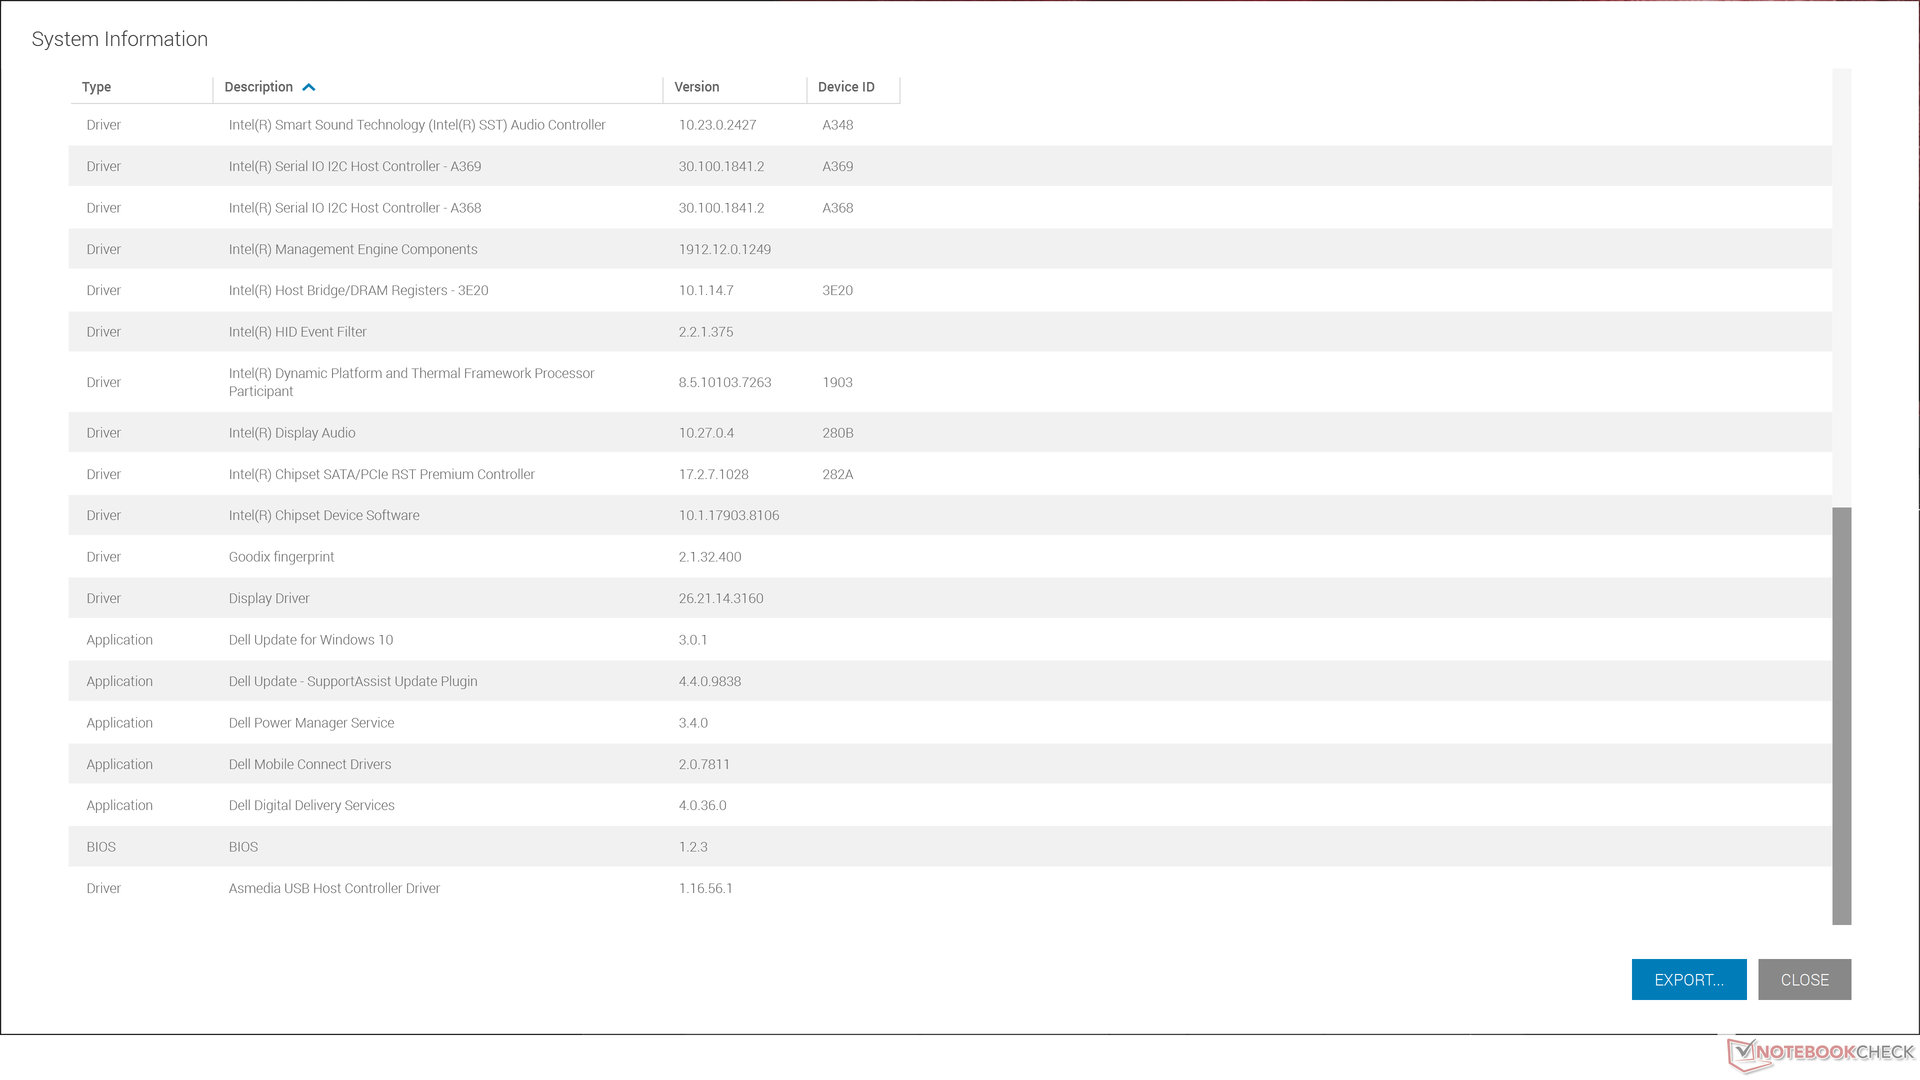
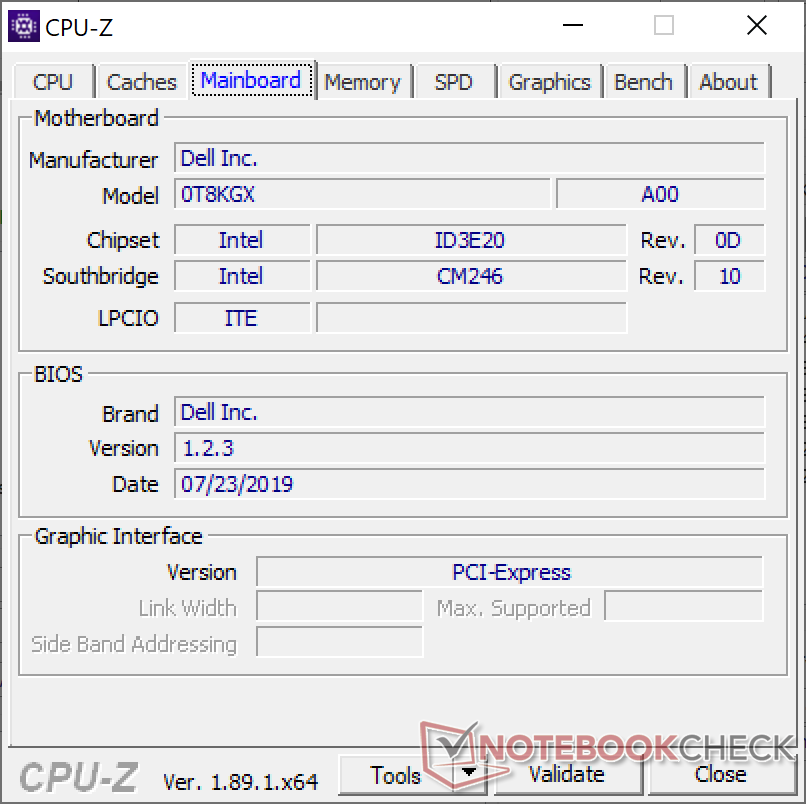
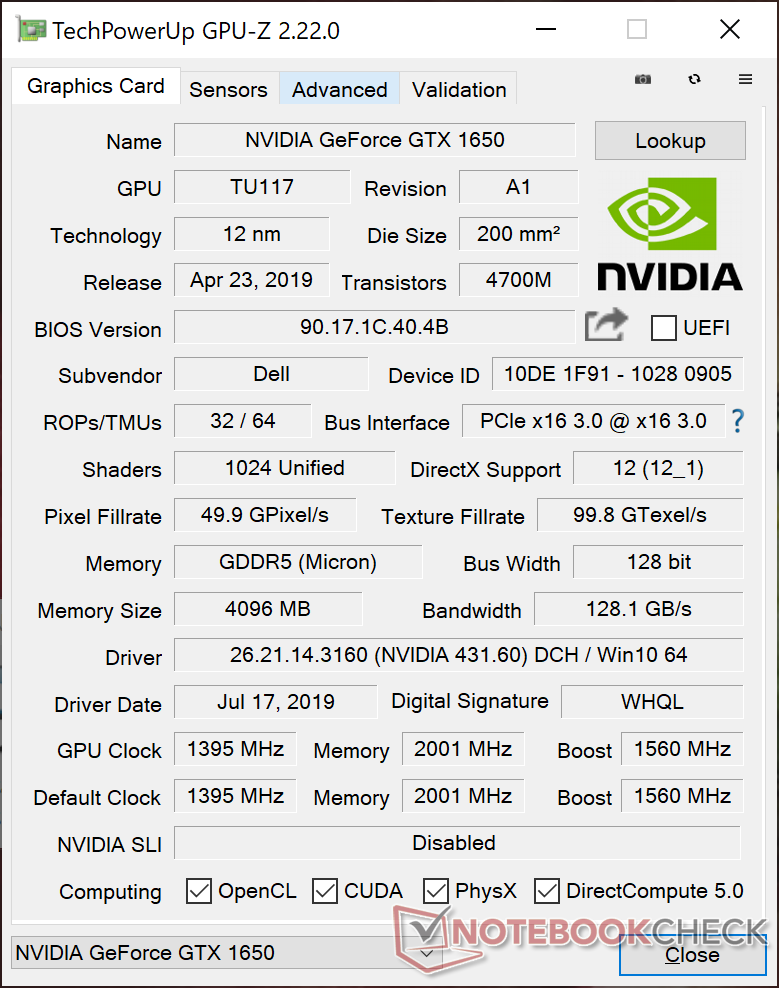
We recommend checking out our existing reviews on the XPS 15 9550, 9560, and 9570 for more information on the chassis, ports, keyboard, speakers, and other physical features since the 7590 is essentially the same design all over again. Our findings and experience with this particular 7590 review unit reflect the following driver versions as noted by the screenshots below.
The XPS 15 series competes directly with other flagship 15.6-inch Ultrabooks including the Asus ZenBook Pro 15 UX580, HP Spectre x360 15, Gigabyte Aero 15, and the MacBook Pro 15.
See our biggest takeaways between the XPS 15 7590 Core i5 and XPS 15 7590 Core i9 SKUs here.
More Dell XPS 15 reviews:
- XPS 15 9570 (i9-8950HK, 4K UHD IPS, GTX 1050 Ti Max-Q)
- XPS 15 9570 (i7-8750H, 4K UHD IPS, GTX 1050 Ti Max-Q)
- XPS 15 9570 (i5-8300H, FHD, GTX 1050)
- XPS 15 9560 (i7-7700HQ, 4K UHD, GTX 1050)
- XPS 15 9560 (i5-7300HQ, FHD, GTX 1050)
- XPS 15 9550 (i5-6300HQ, FHD, GTX 960M)
Please note: We updated this review on 09/26/2019 to our new rating version 7. The former rating according to version 6 was 90%. If you would like to learn more about our new rating system please click here.
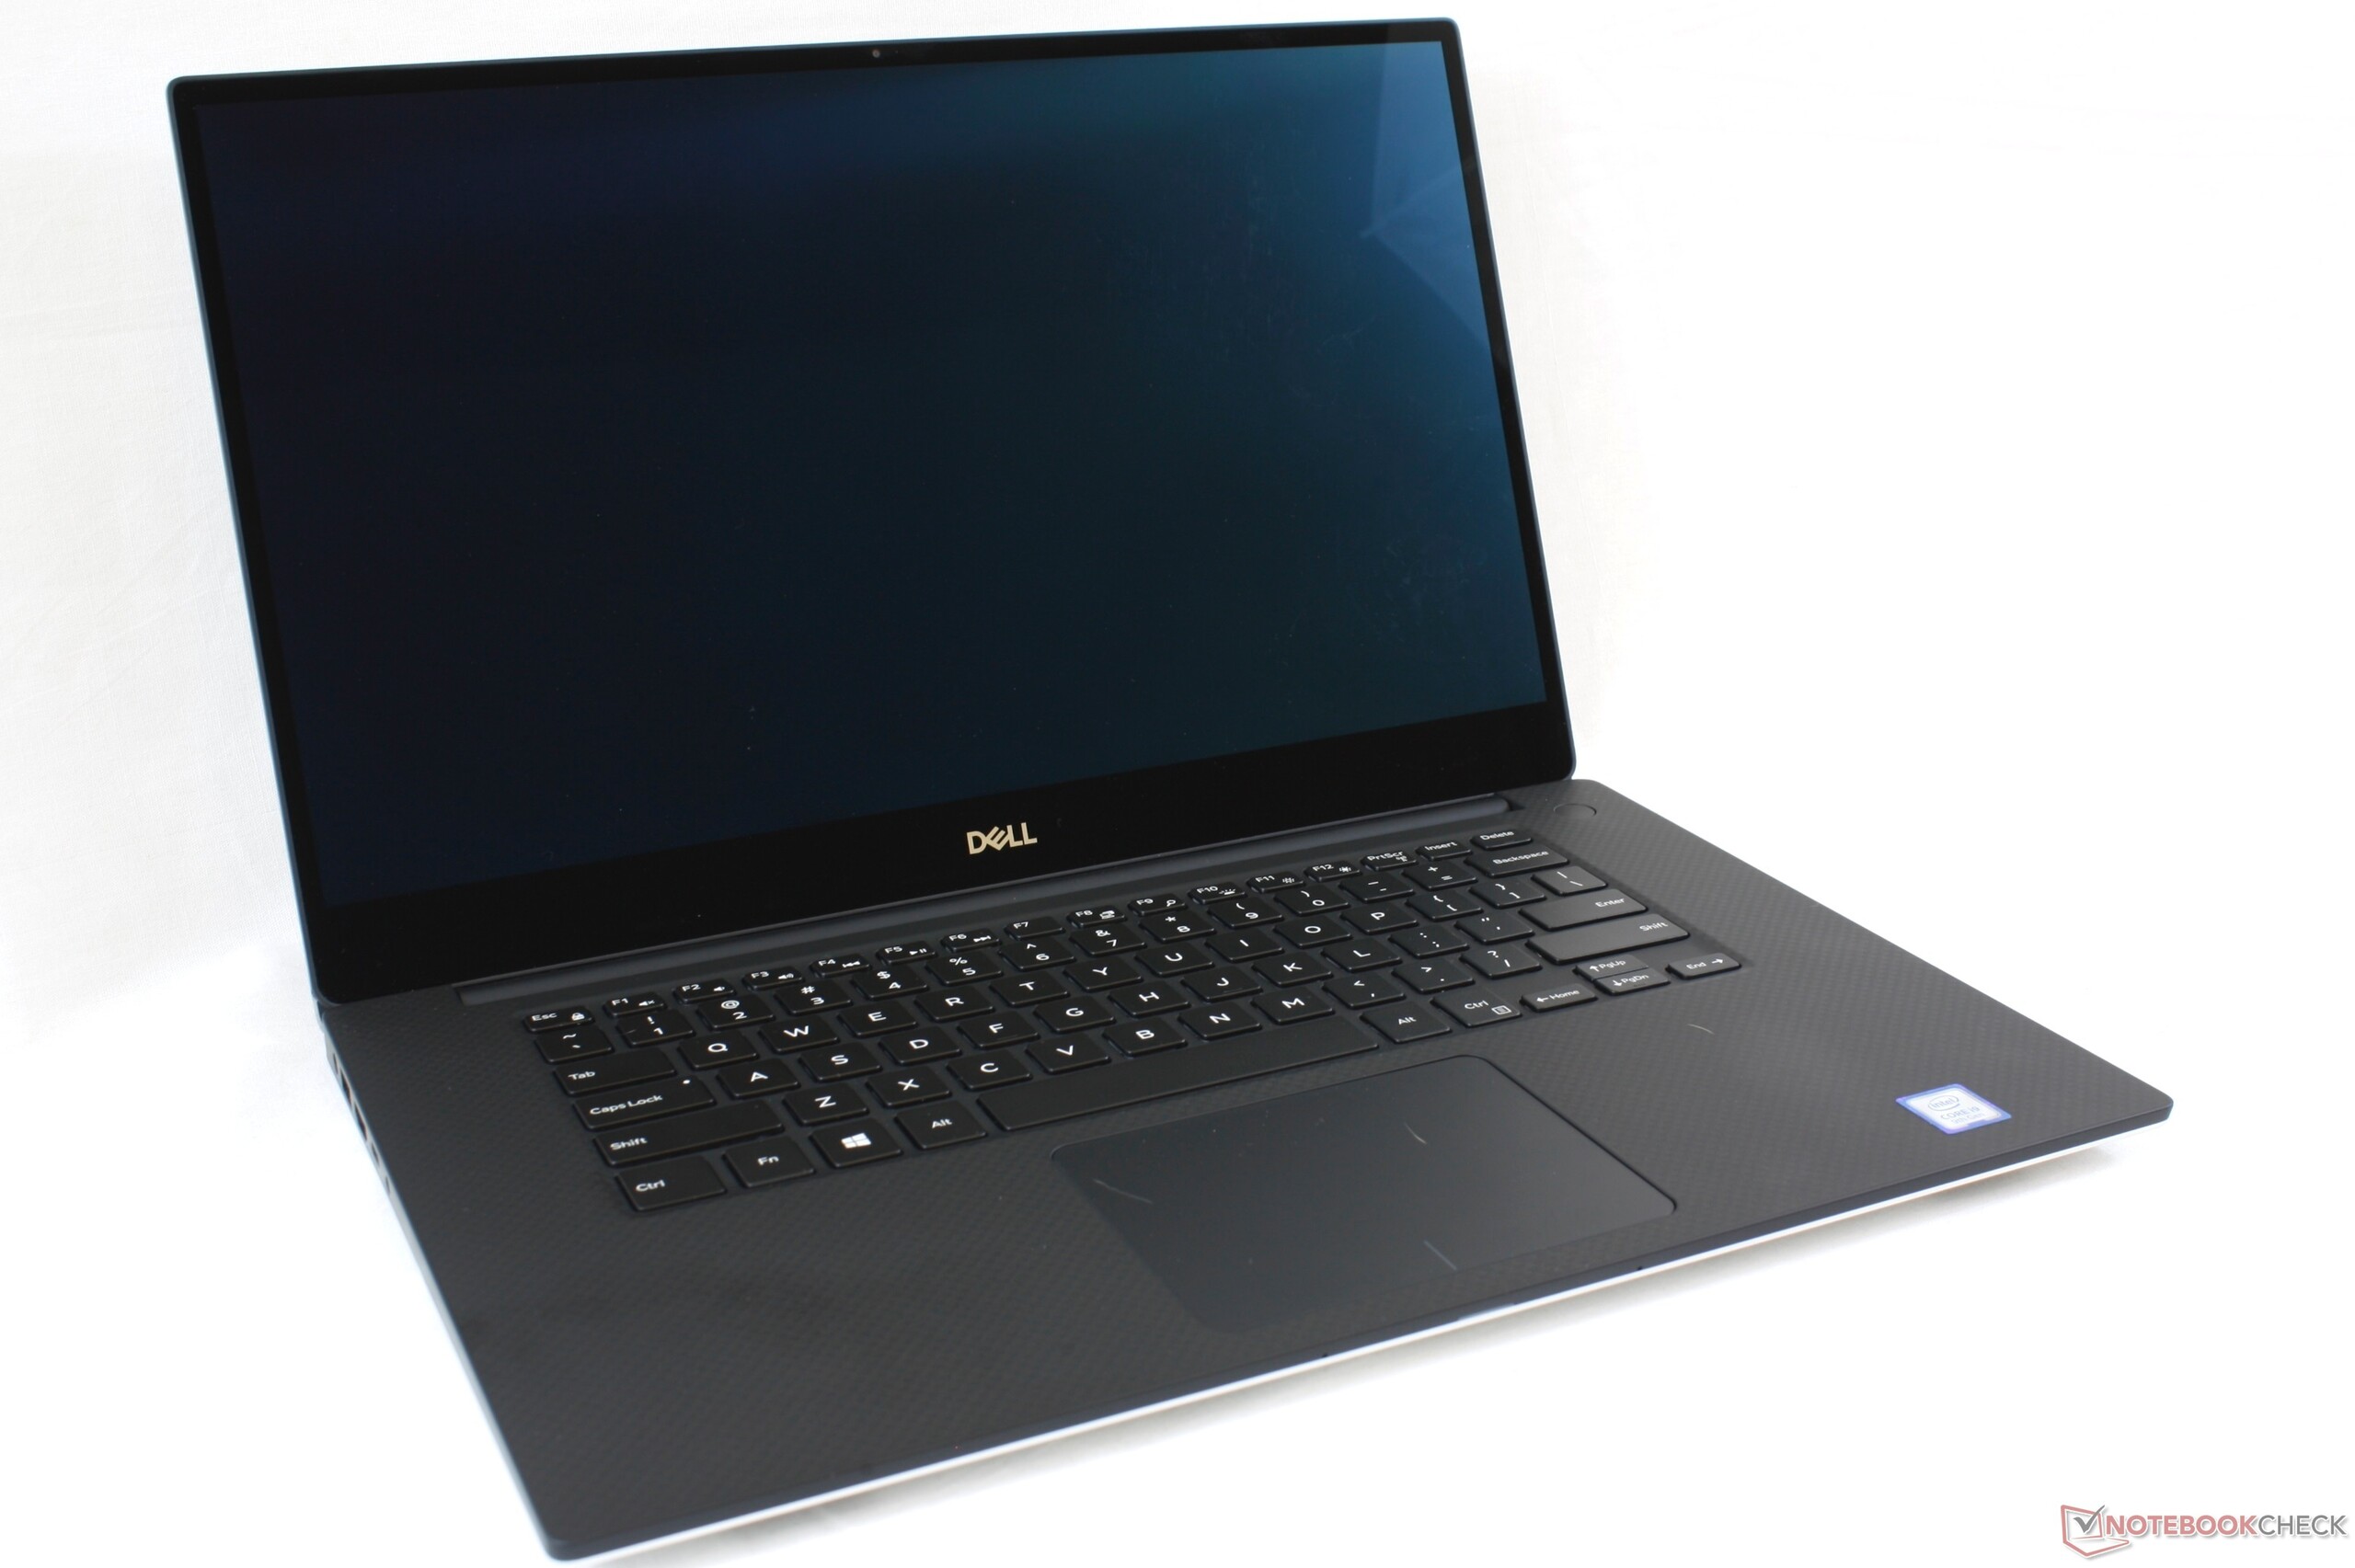
Case
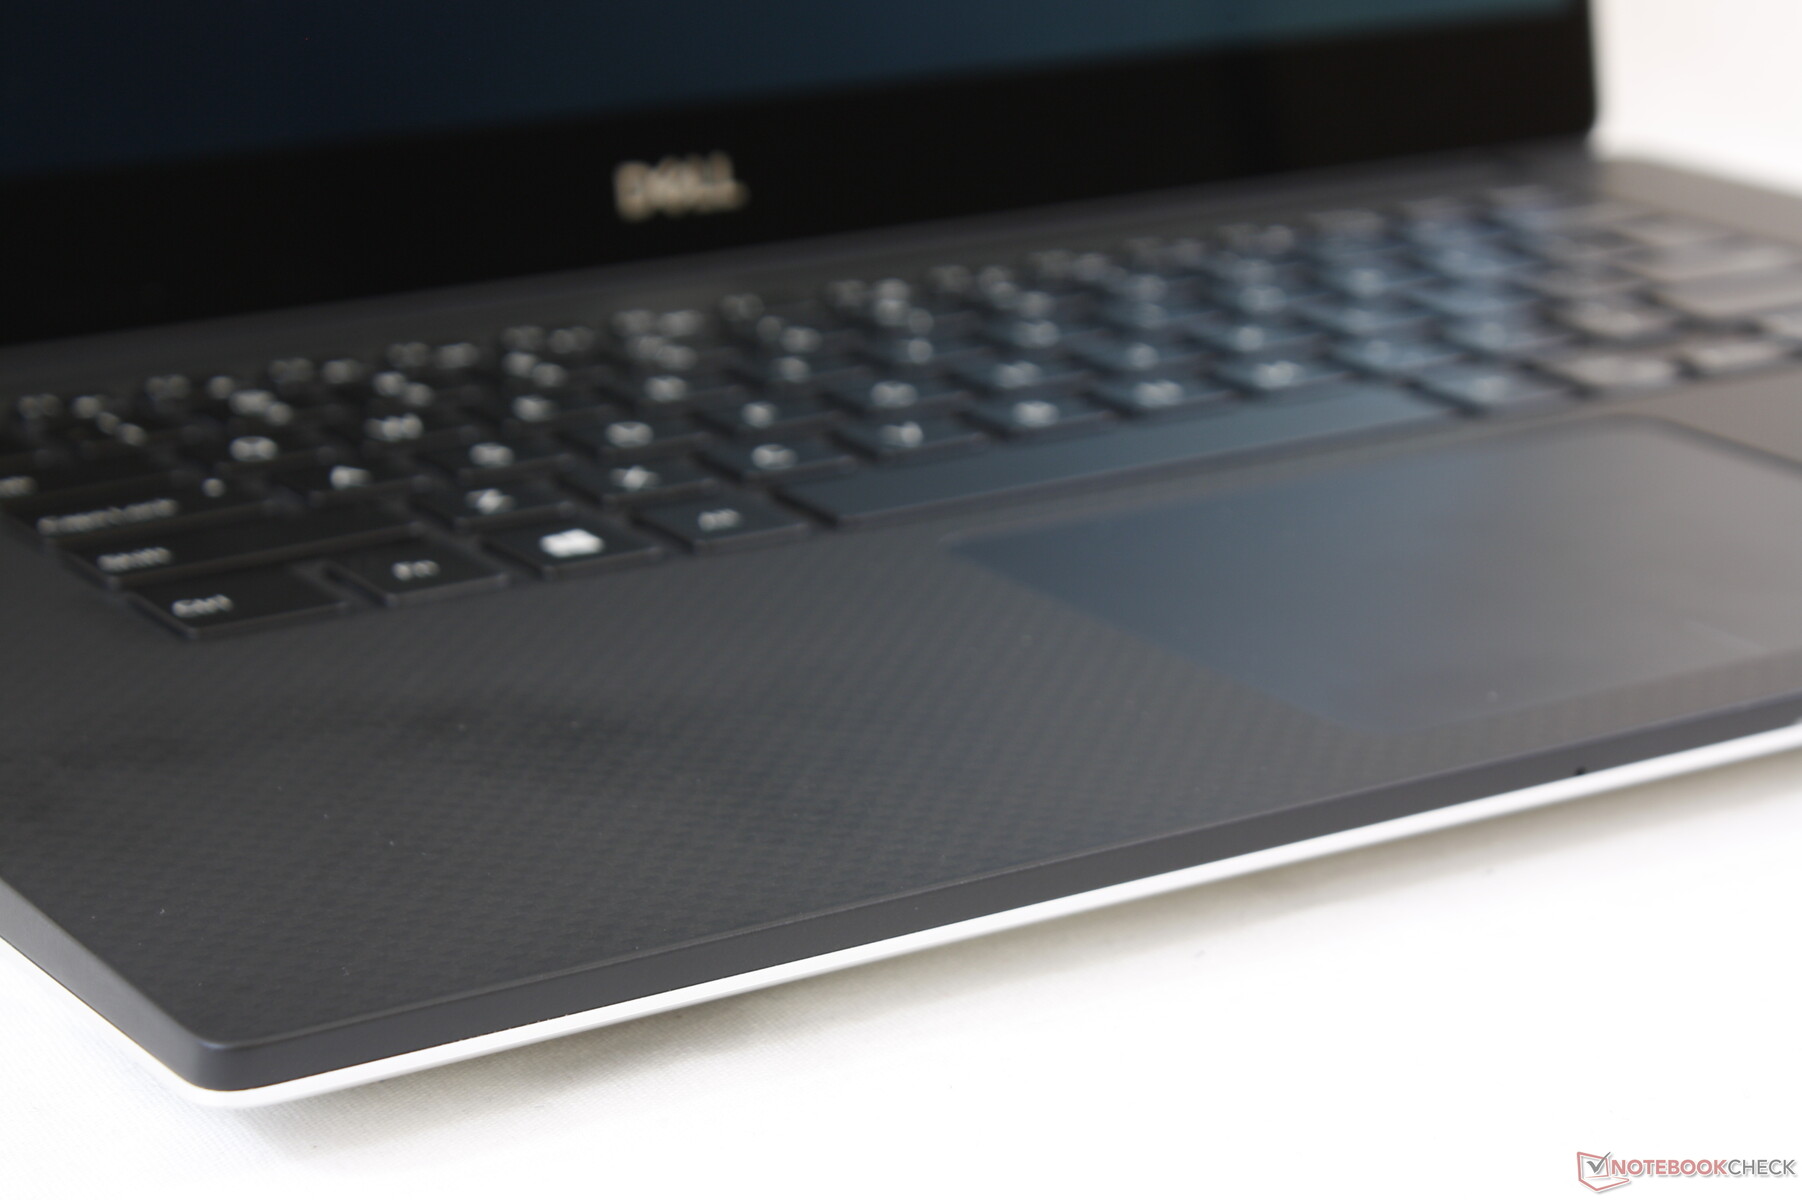
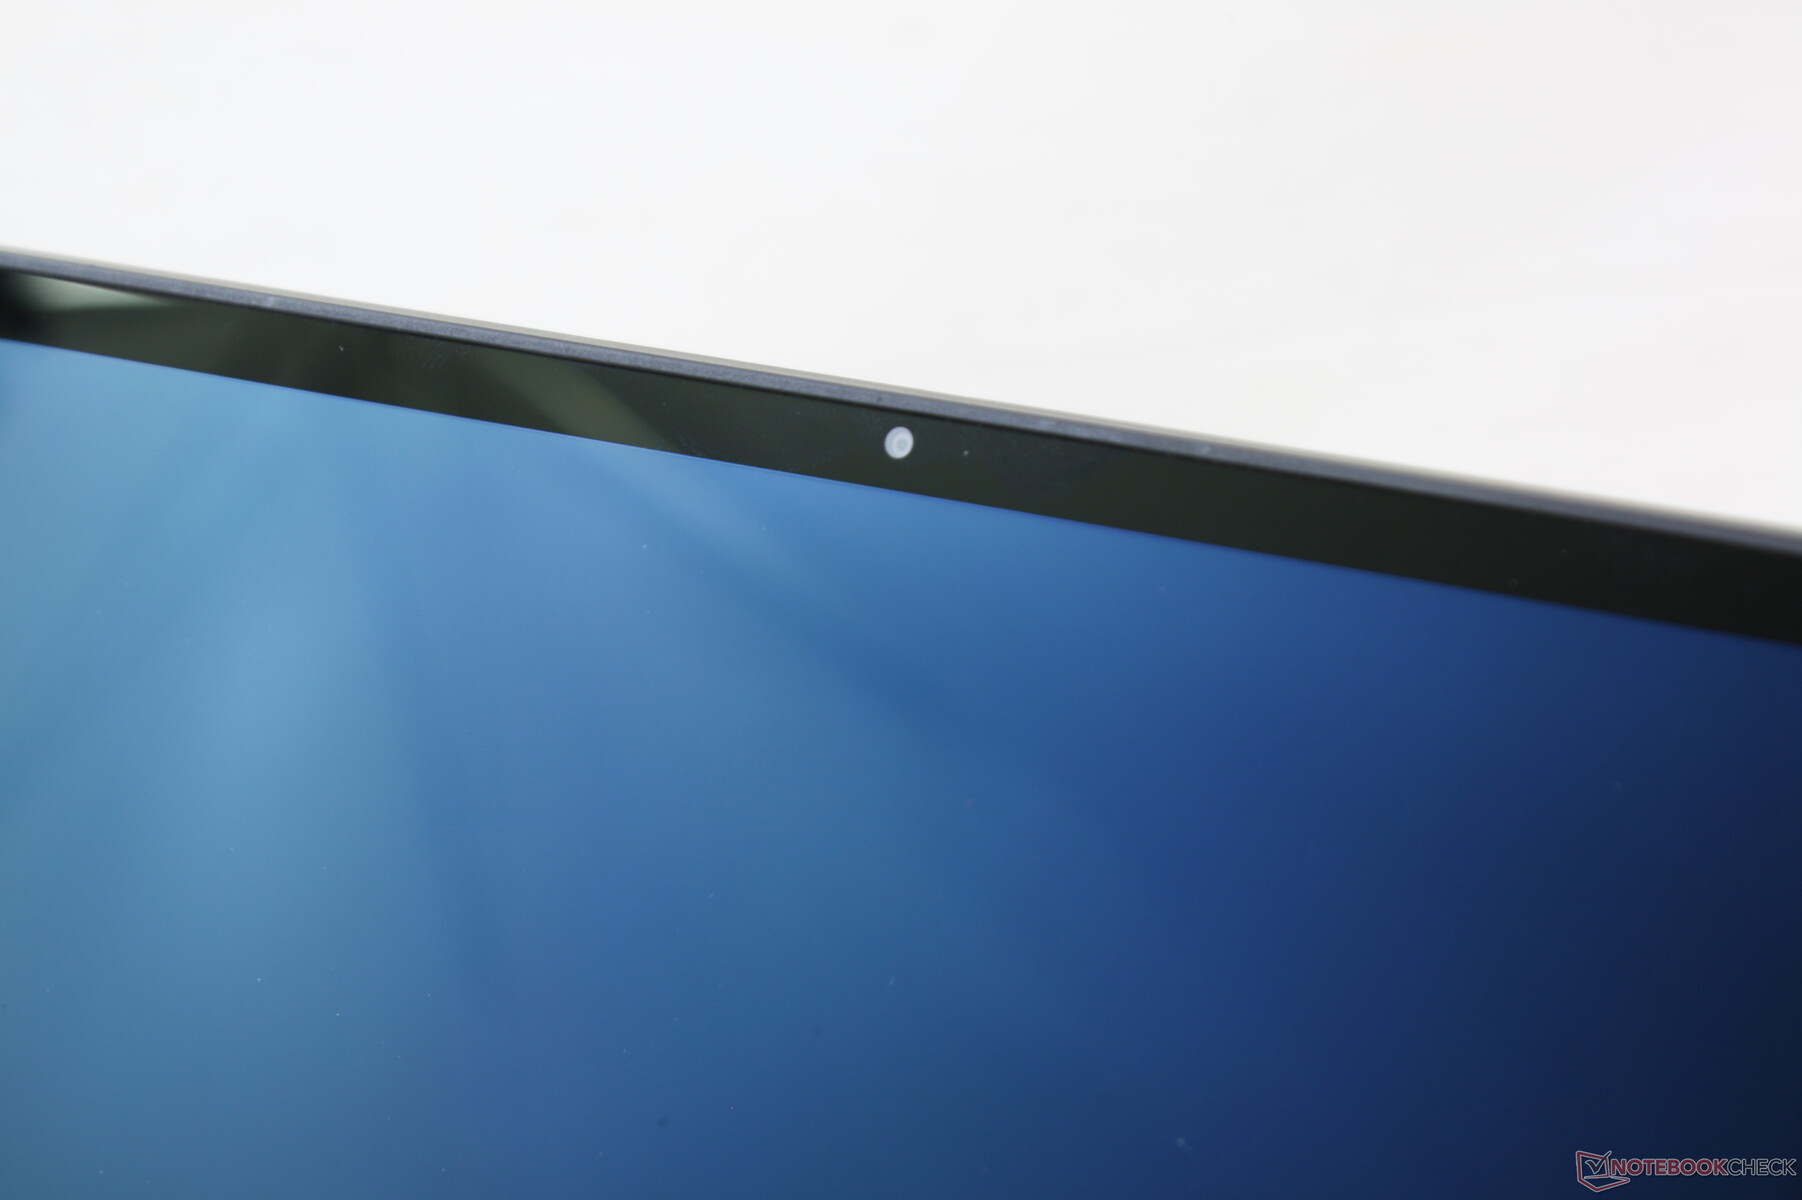
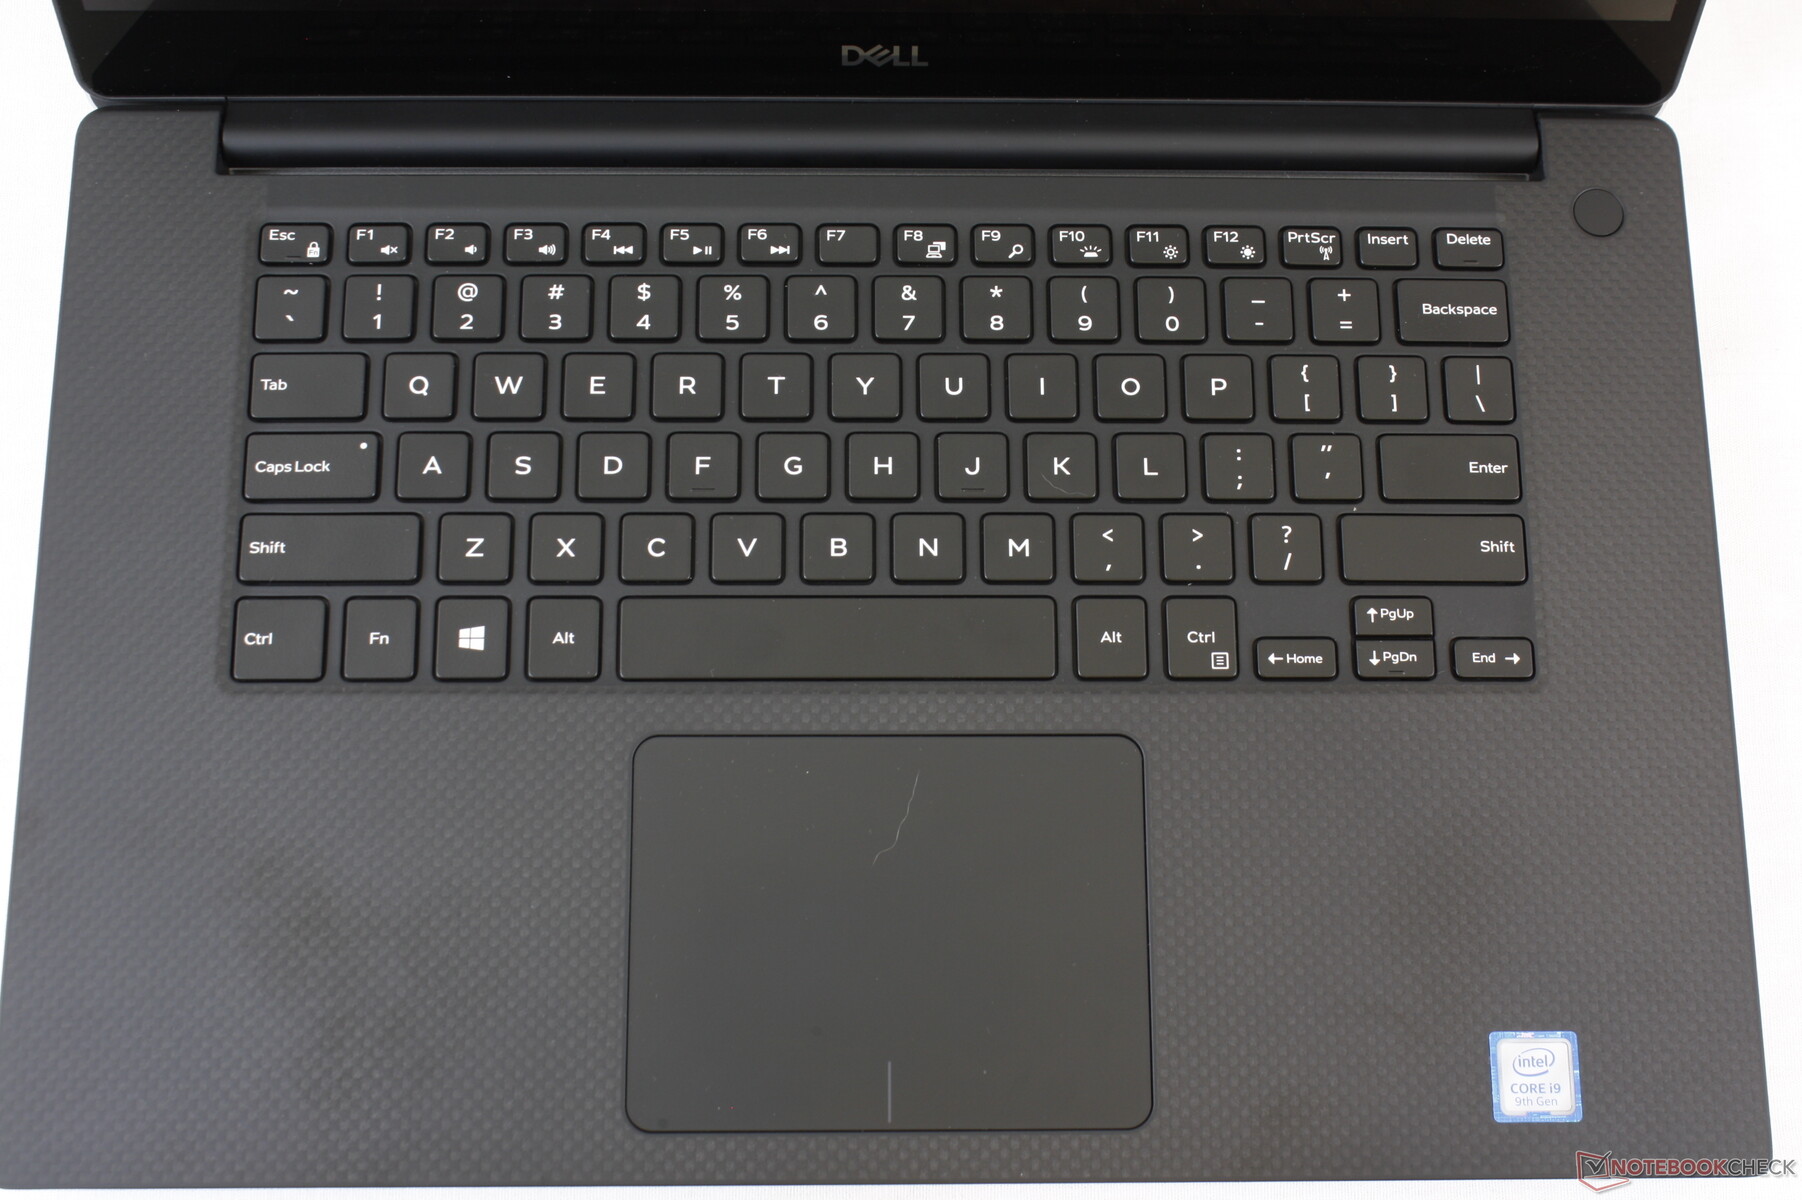
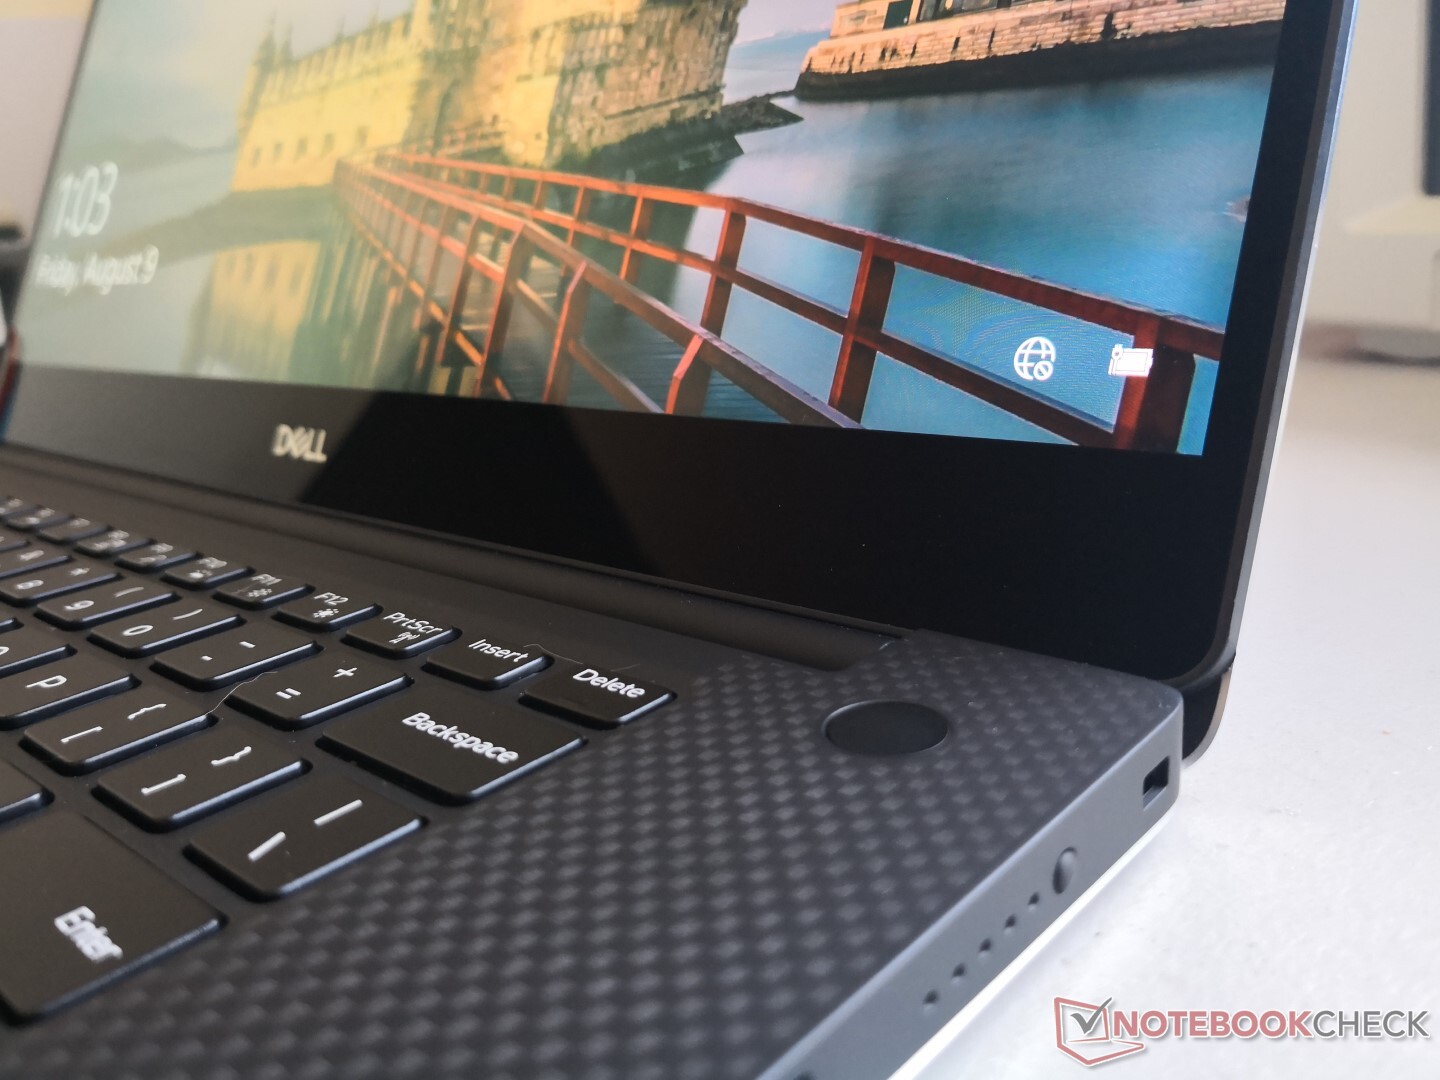
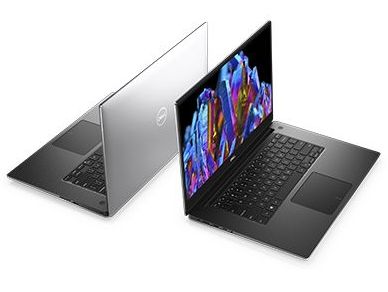
Visually, this is the same chassis that many of us are already familiar with. The magnesium alloy outer lid and bottom base with carbon fiber keyboard deck hold up really well despite launching almost five years ago. The most notable change is the re-positioned webcam along the top edge of the screen instead of the bottom. Dell had to shift the screen slightly lower by a millimeter or two to make room for the camera, but the overall chassis dimensions are identical to the XPS 15 9570/9560.
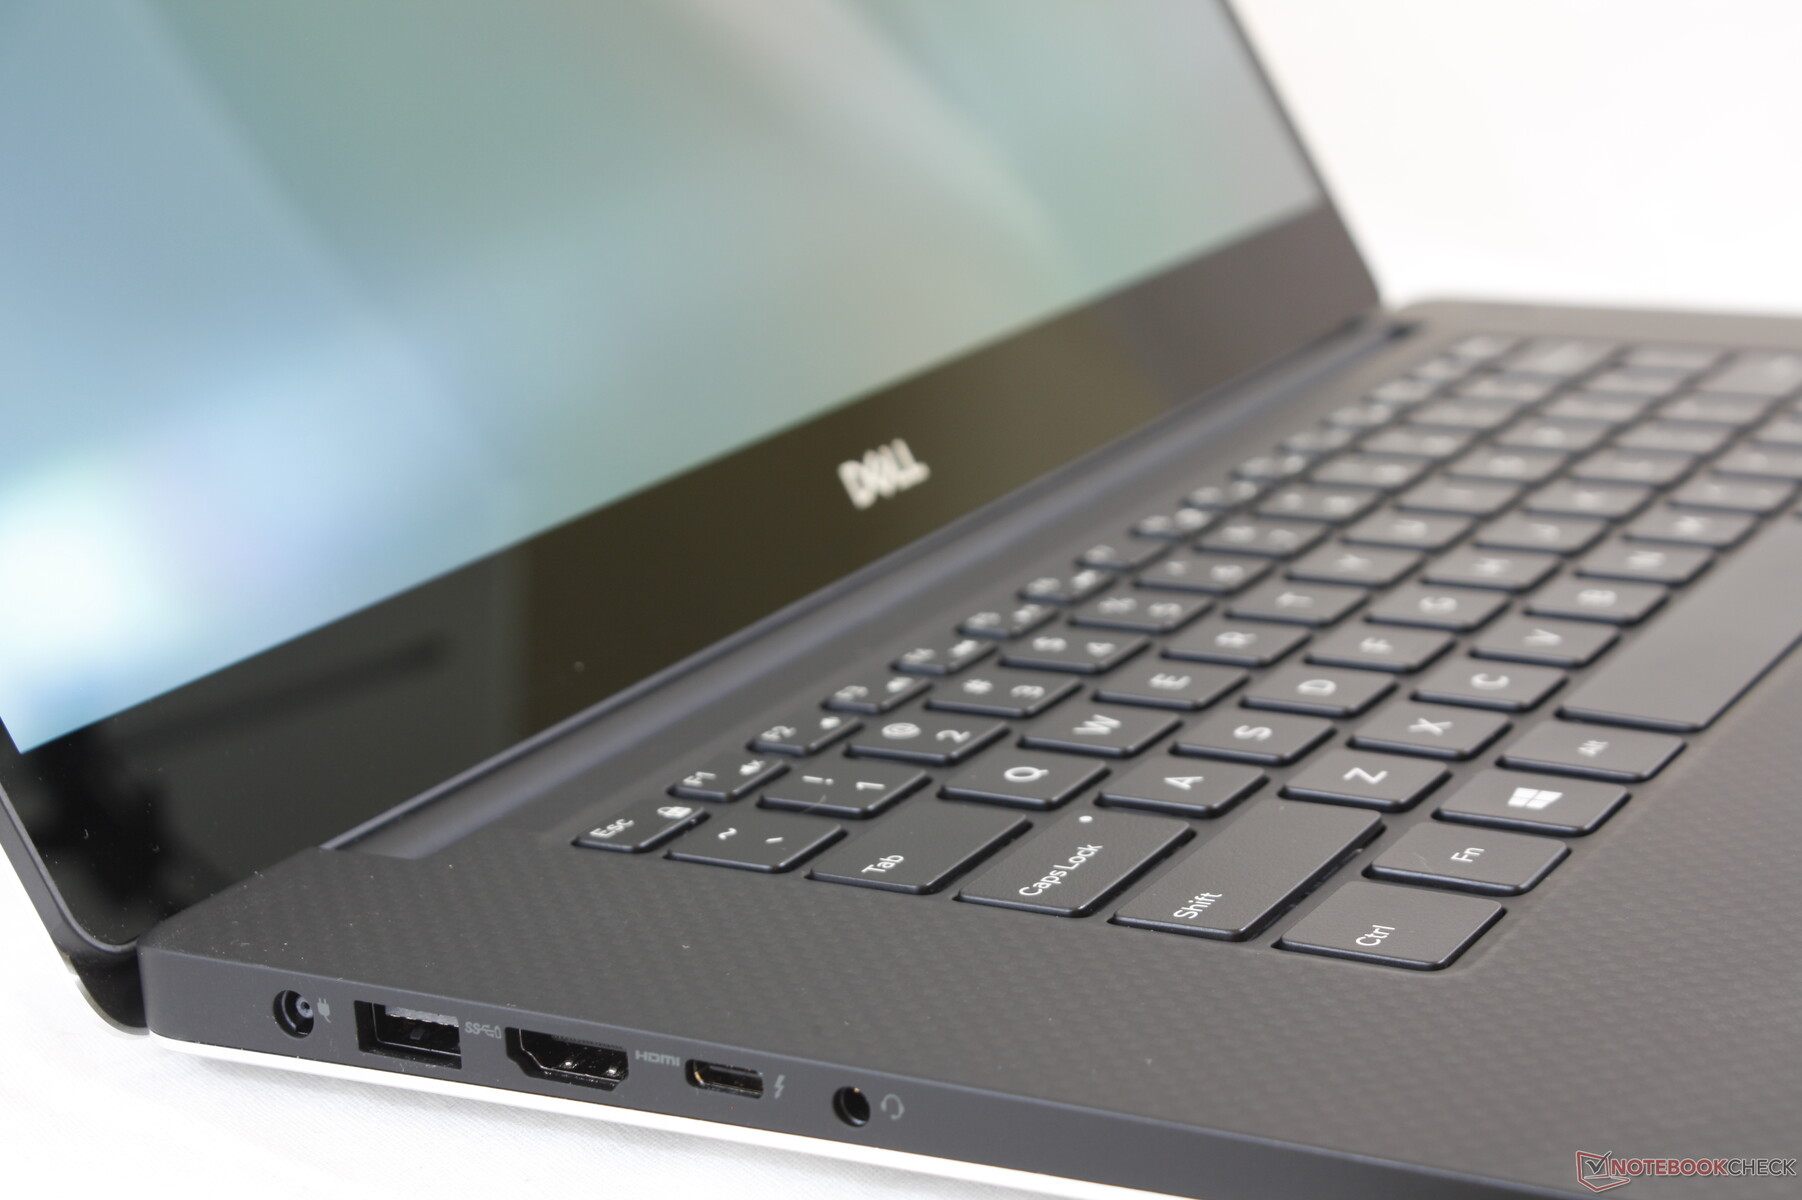

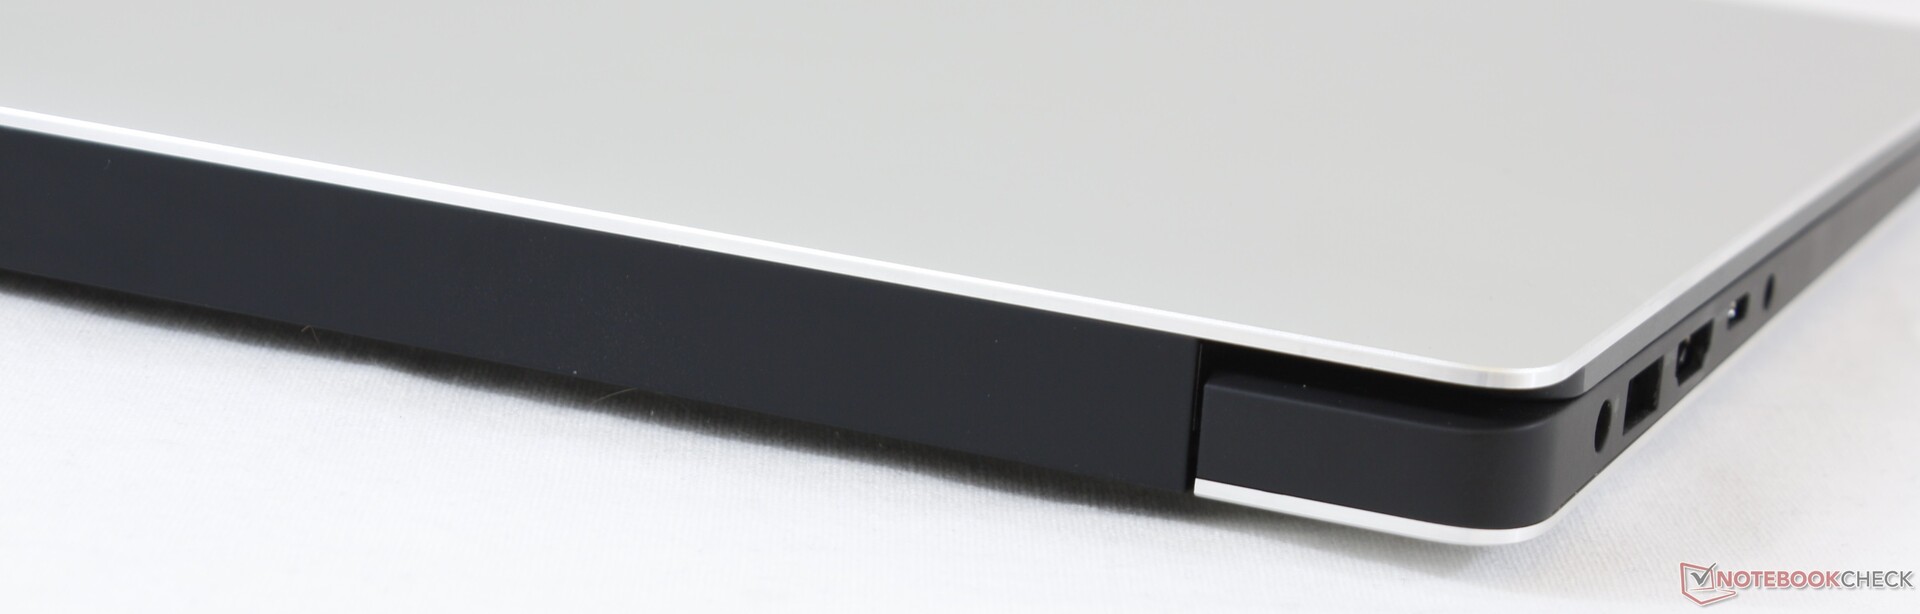
Connectivity
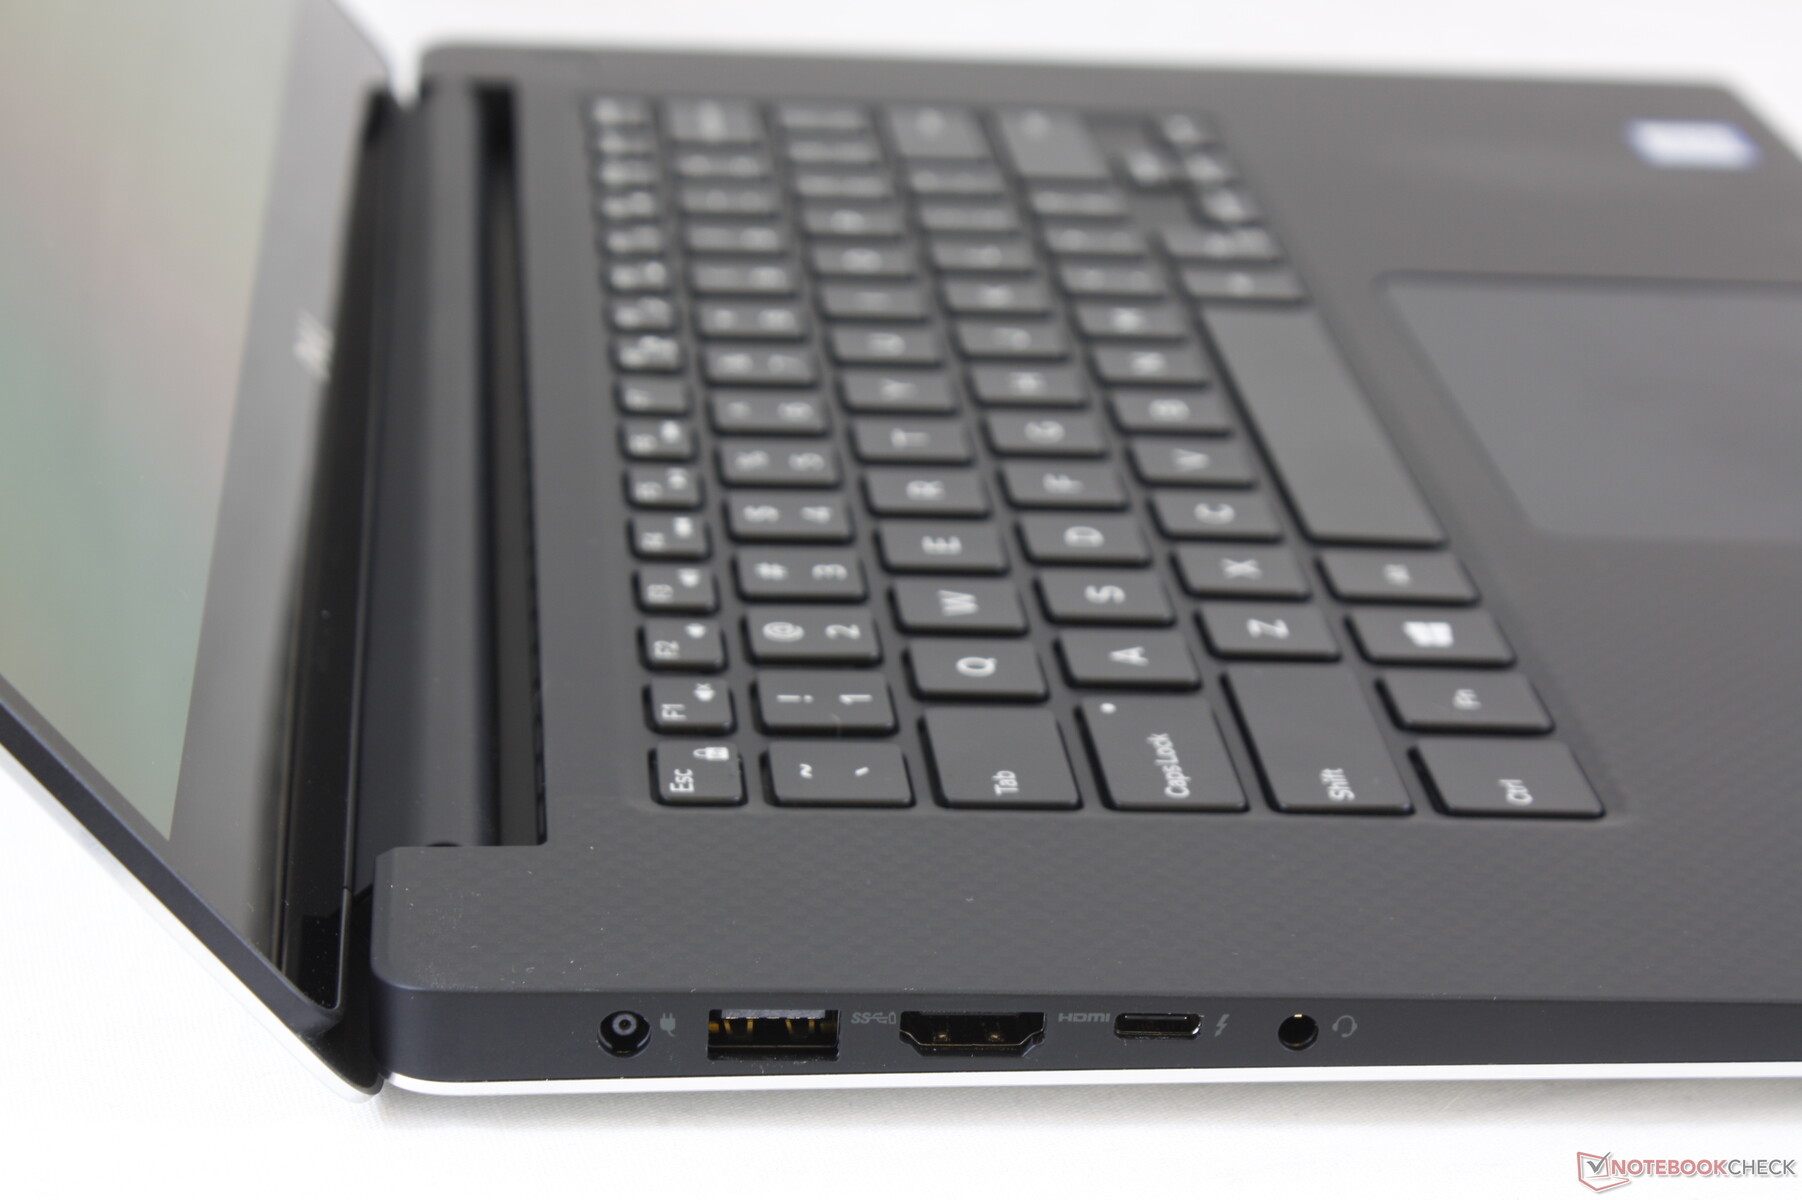
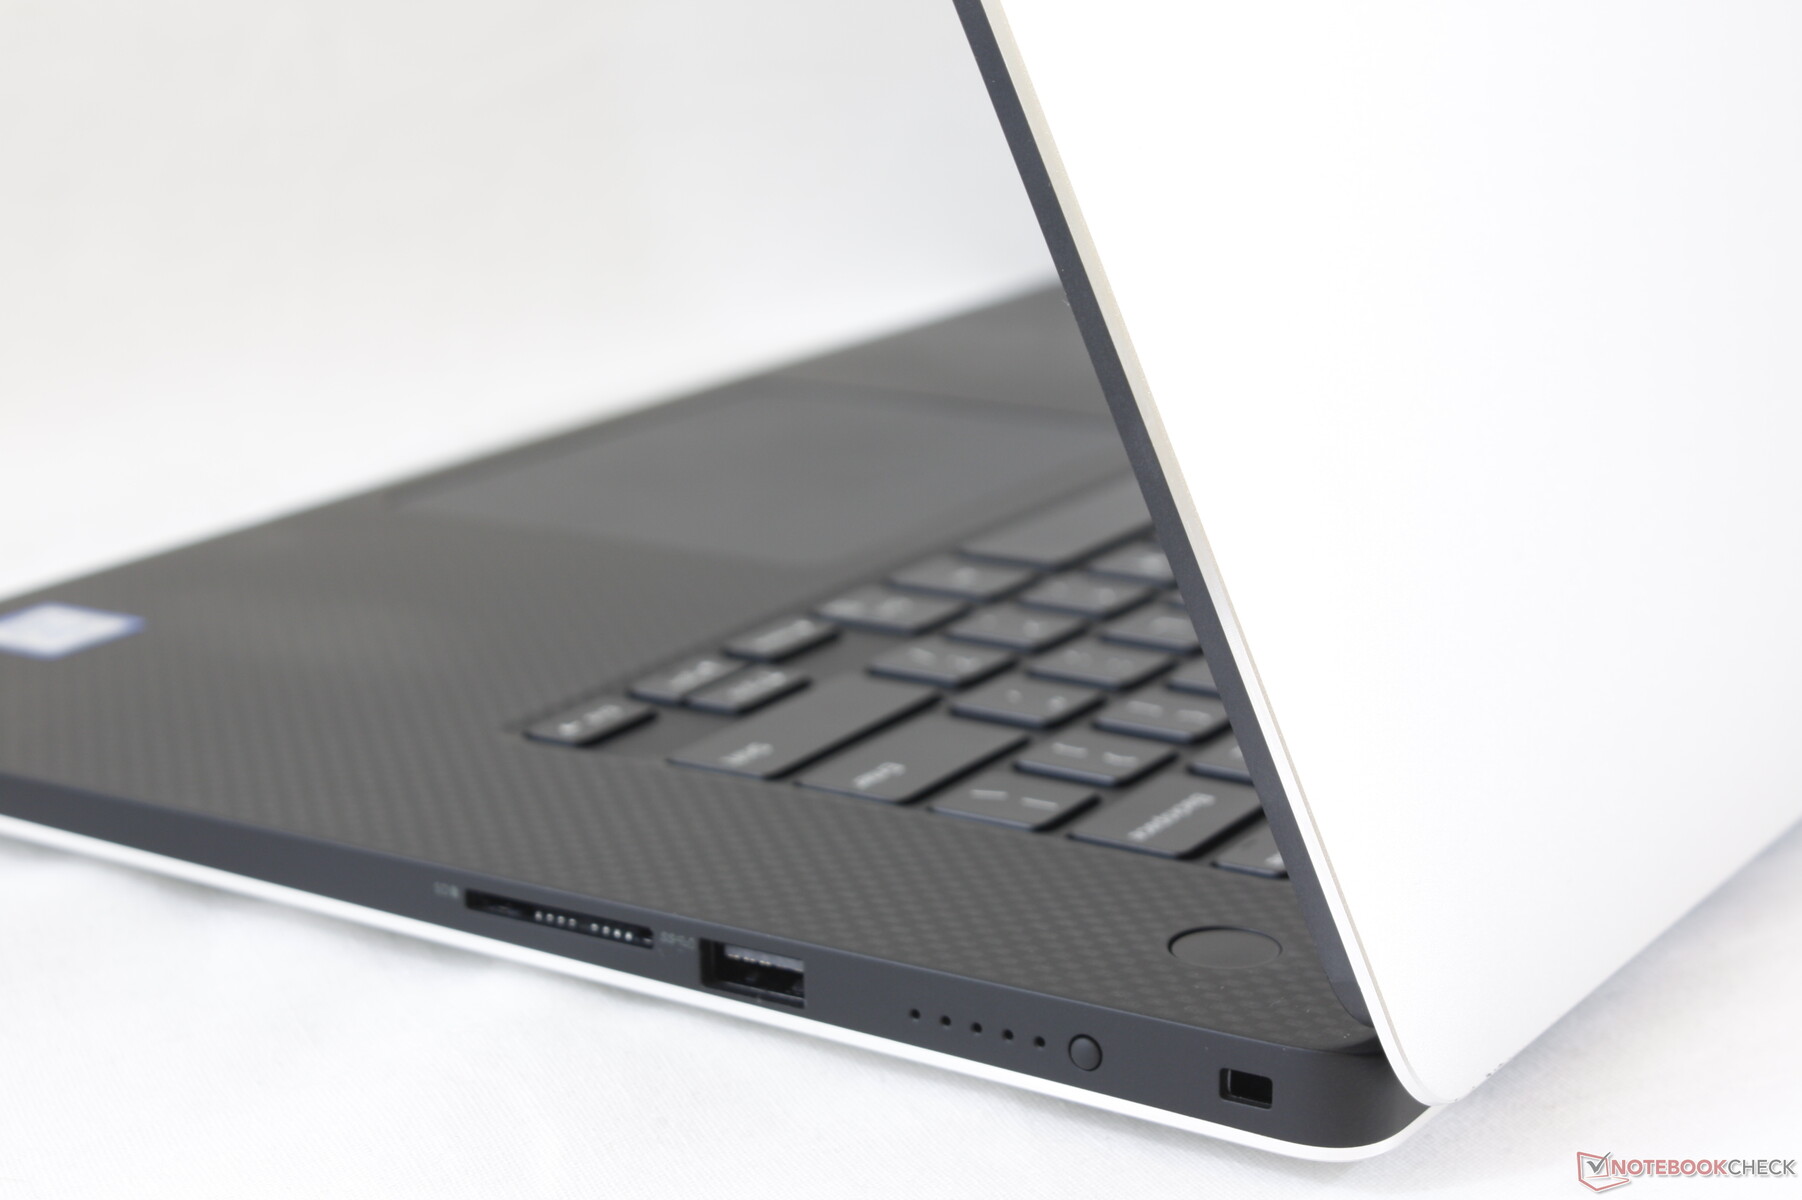
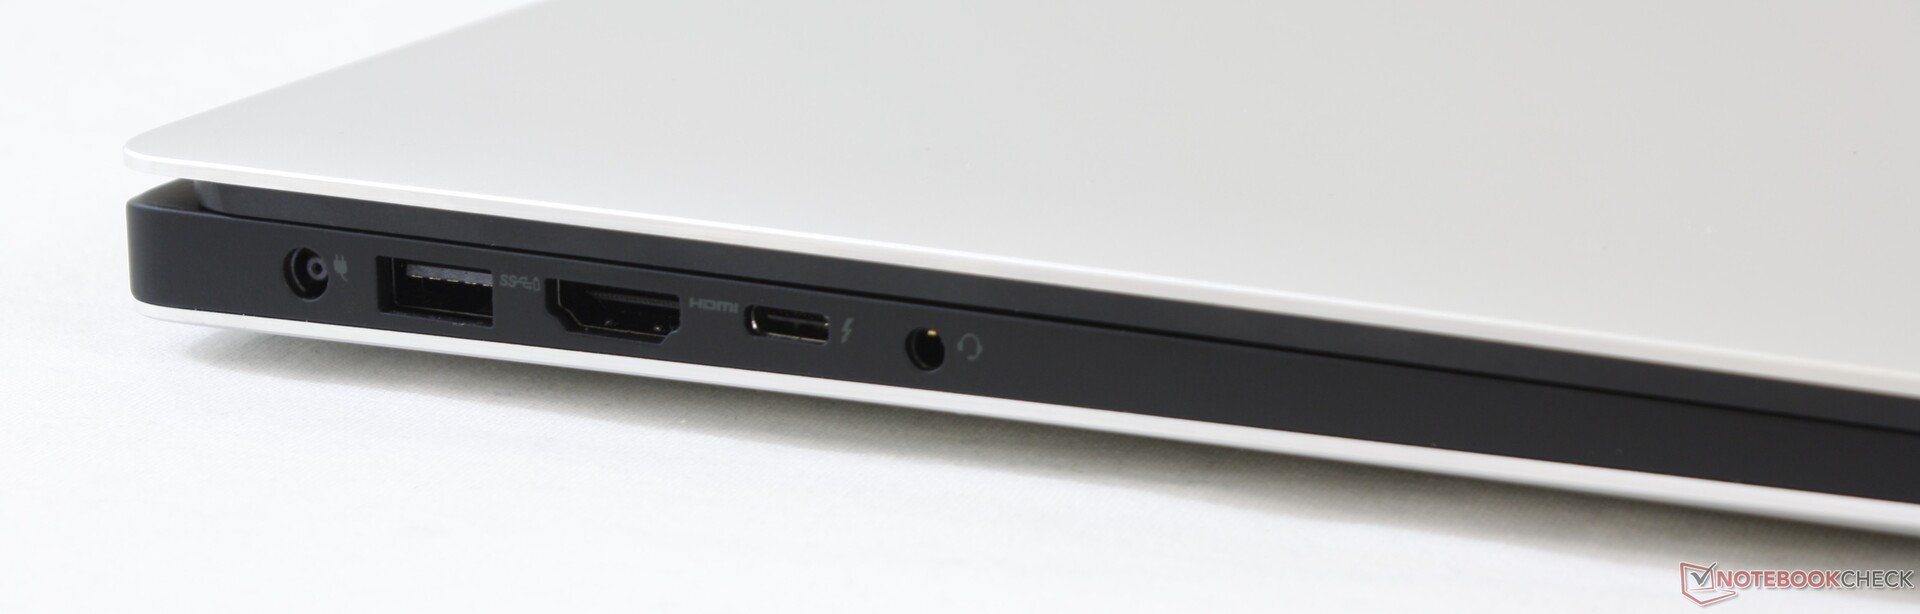
Port options are still competitive after all these years. The full-size SD reader in particular is becoming increasingly uncommon on newer Ultrabooks like the Asus ZenBook Pro 15 UX580 or the HP Spectre x360 15. The Thunderbolt 3 port offers the full four PCIe lanes that eGPU enthusiasts will want to take advantage of.
The battery indicator button is back yet again which we suspect very few users will even use. This is more likely a relic of the past with a high chance of being omitted on future XPS 15 models.
Recharging the system via USB Type-C is possible and we can confirm this when connecting a 130 W Dell USB Type-C charger to the XPS 15 7590.
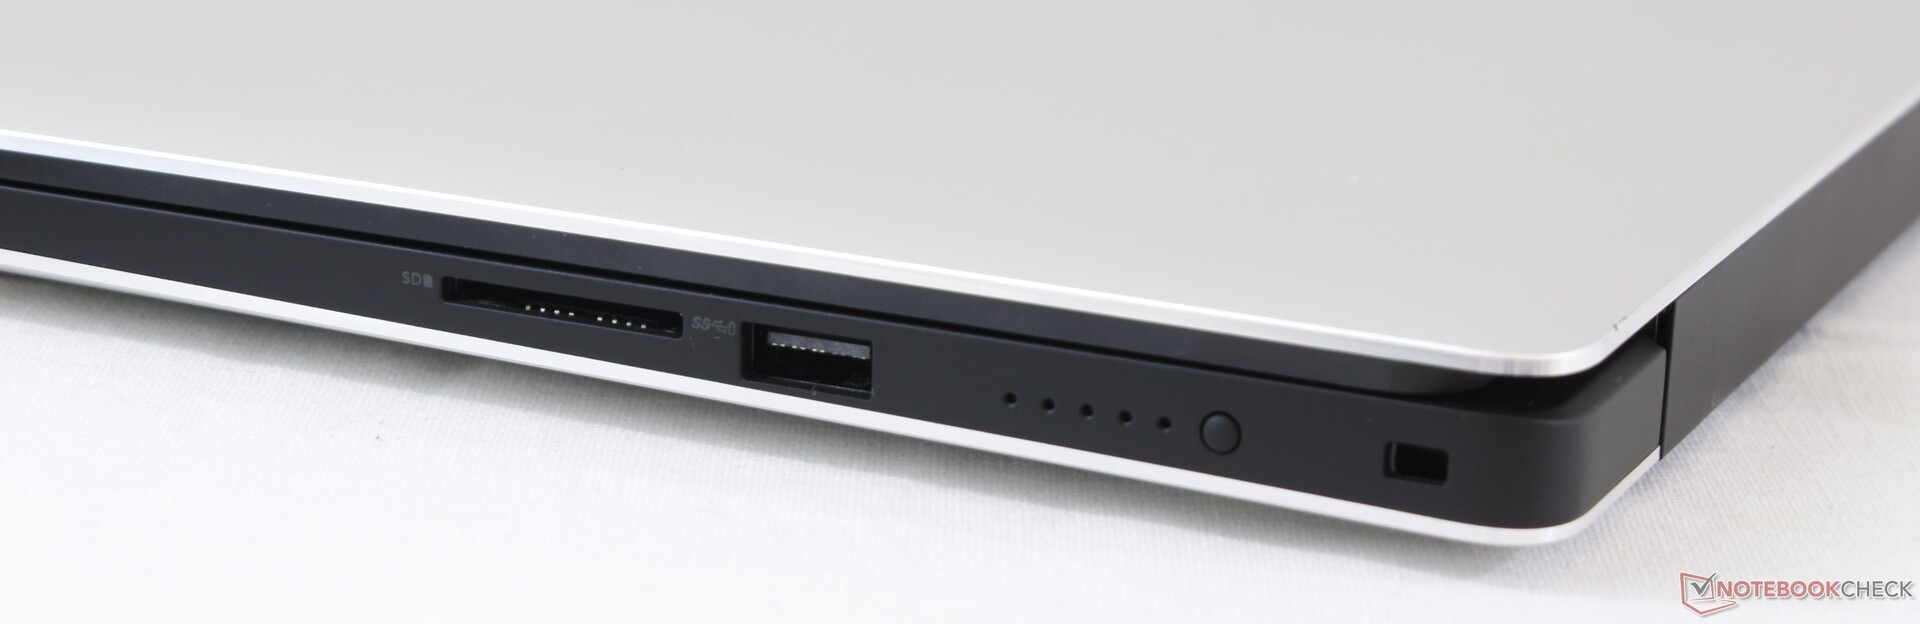
SD Card Reader
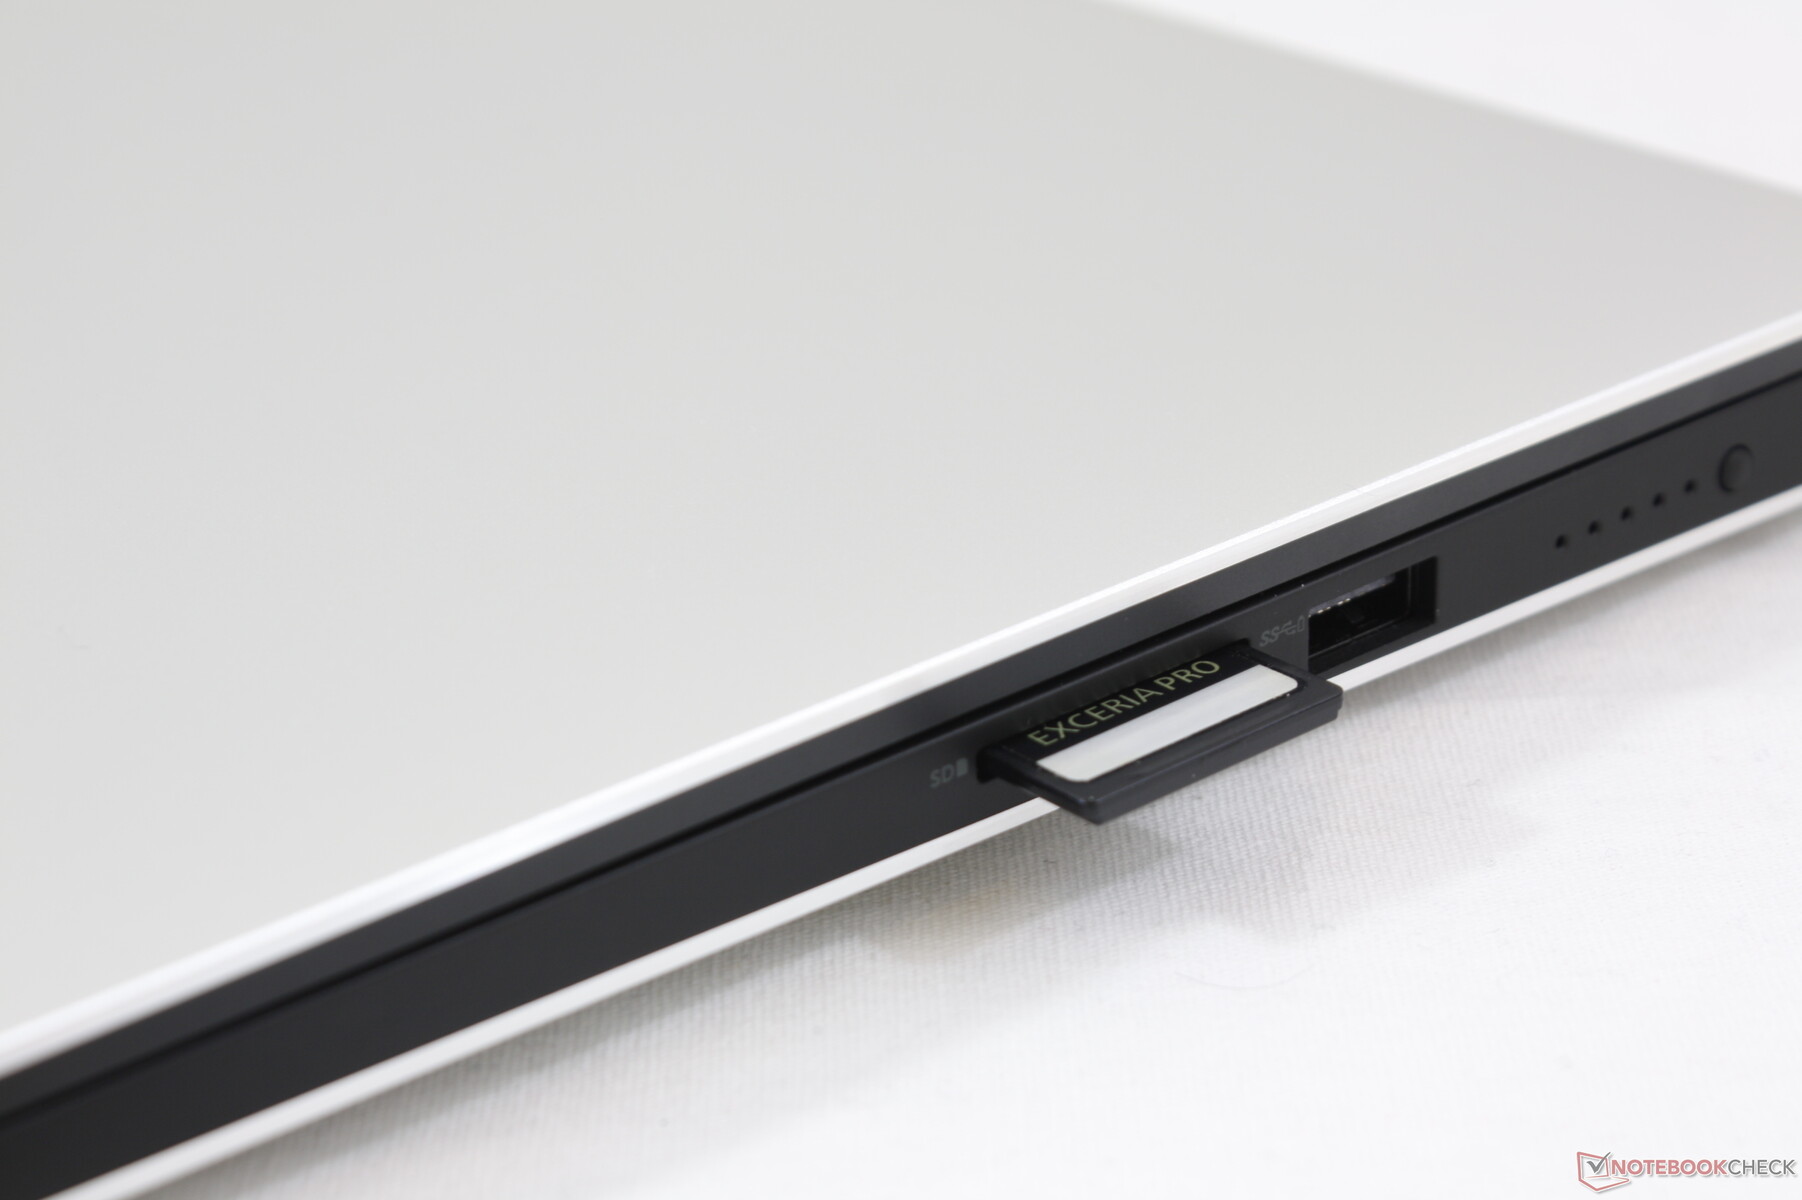
Transfer rates from the integrated SD card reader are some of the fastest on any laptop save for the UHS-III card reader on the Razer Blade Pro 17. Moving 1 GB worth of pictures from our UHS-II test card takes about 6 to 7 seconds compared to ~15 seconds on the Asus ZenBook UX533. Our only complaint is that a fully inserted SD card does not sit flush against the edge making it unsafe for transport in contrast to the spring-loaded SD card reader of the Razer Blade Pro 17.
| SD Card Reader | |
| average JPG Copy Test (av. of 3 runs) | |
| Gigabyte Aero 15 OLED XA (Toshiba Exceria Pro SDXC 64 GB UHS-II) | |
| Dell XPS 15 9570 Core i9 UHD (Toshiba Exceria Pro SDXC 64 GB UHS-II) | |
| Dell XPS 15 7590 9980HK GTX 1650 (Toshiba Exceria Pro SDXC 64 GB UHS-II) | |
| HP Spectre x360 15-df0126ng (Toshiba Exceria Pro M501 microSDXC 64GB) | |
| Asus ZenBook 15 UX533FD (Toshiba Exceria Pro SDXC 64 GB UHS-II) | |
| maximum AS SSD Seq Read Test (1GB) | |
| Gigabyte Aero 15 OLED XA (Toshiba Exceria Pro SDXC 64 GB UHS-II) | |
| Dell XPS 15 9570 Core i9 UHD (Toshiba Exceria Pro SDXC 64 GB UHS-II) | |
| HP Spectre x360 15-df0126ng (Toshiba Exceria Pro M501 microSDXC 64GB) | |
| Dell XPS 15 7590 9980HK GTX 1650 (Toshiba Exceria Pro SDXC 64 GB UHS-II) | |
| Asus ZenBook 15 UX533FD (Toshiba Exceria Pro SDXC 64 GB UHS-II) | |
Communication
All current SKUs come standard with a Killer AX1650x WLAN module to be Wi-Fi 6 ready. Intel will be pushing Wi-Fi 6 more heavily onto Ultrabooks soon and so this is simply Dell's way of future-proofing its XPS lineup. The Killer AX1650x is the gaming variant of the Intel AX200 similar to how the Killer 1550 is the gaming variant of the Intel 9560. More details on Killer-specific WLAN features can be found on our review of the Killer 1535 here.
Note that performance can be faster than what we've recorded below since our current server setup is limited by a 1 Gbps line. Unless if you have a compatible router, don't expect to be fully exploiting Wi-Fi 6 speeds anytime soon. We didn't experience any issues related to connectivity during our time with the test unit.
Maintenance
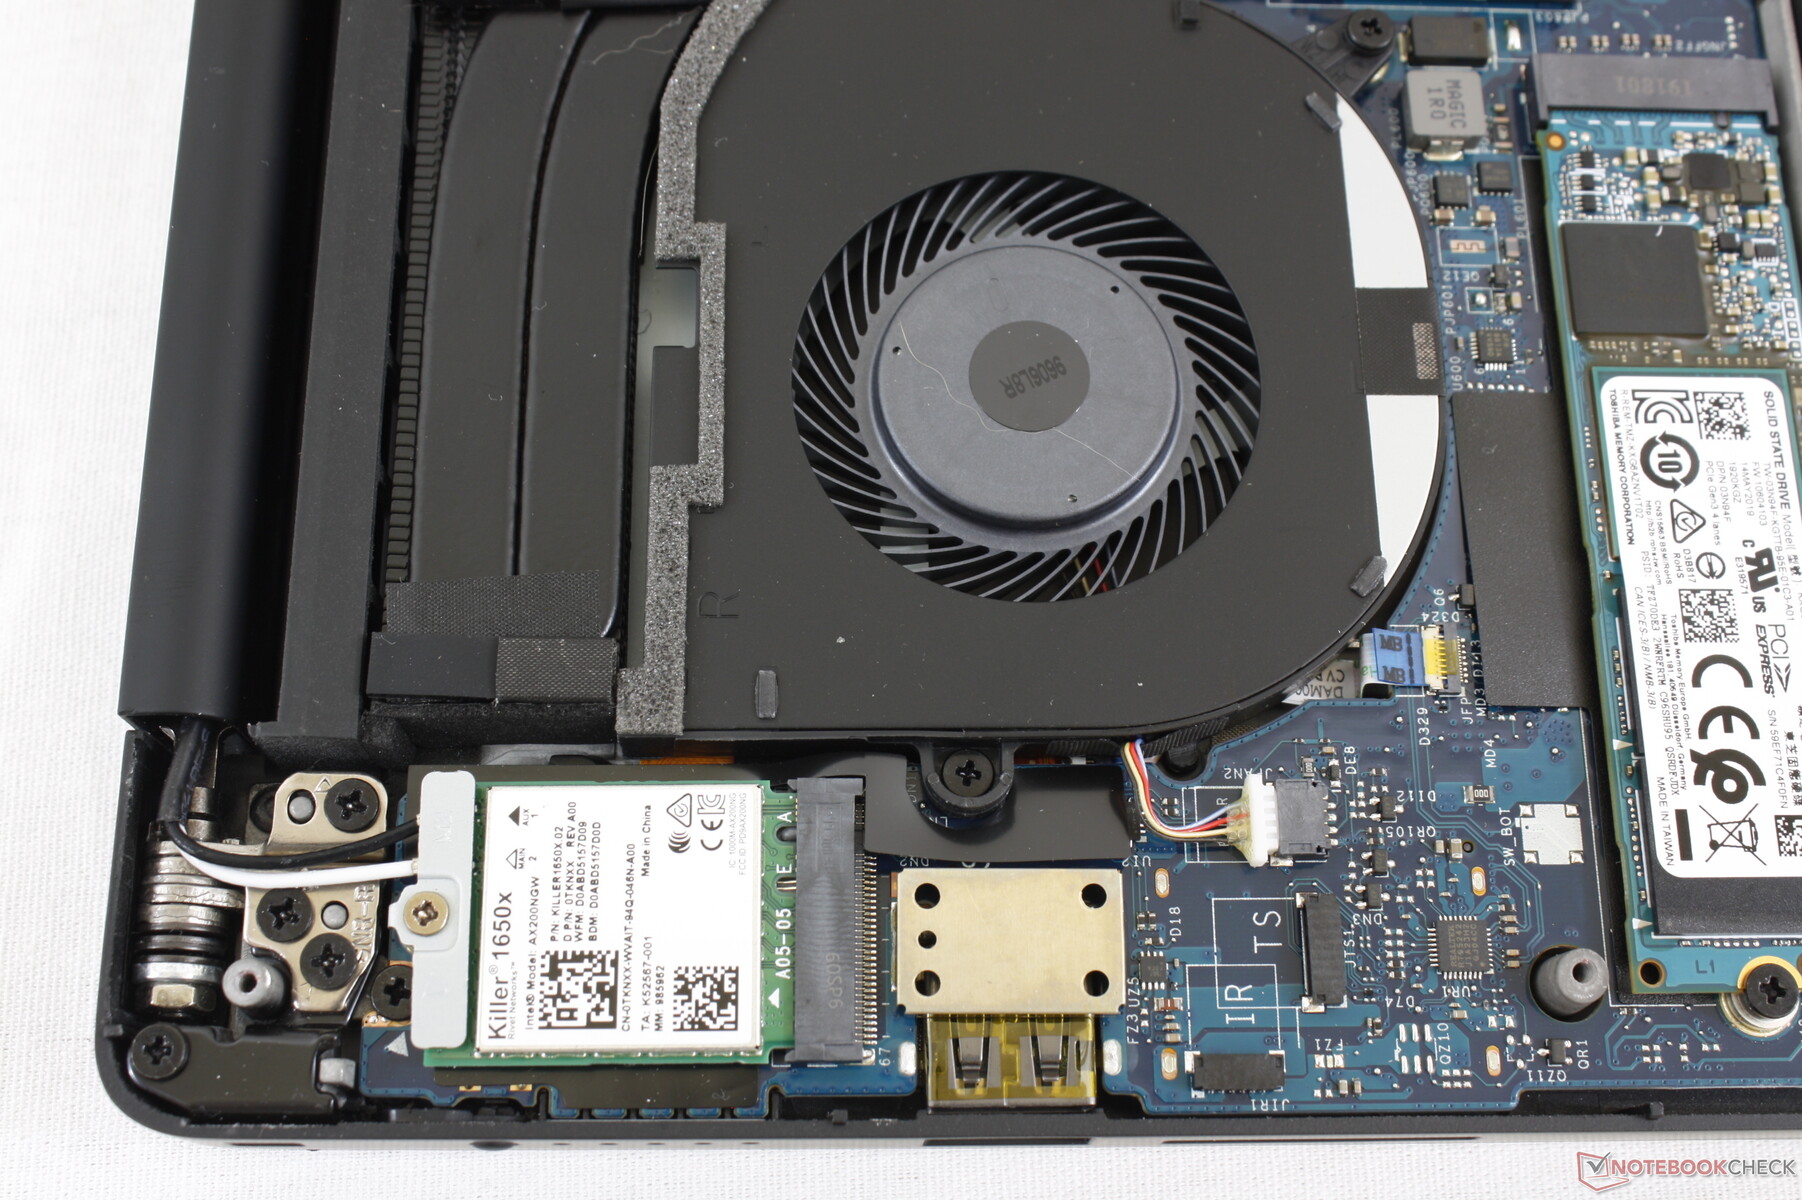
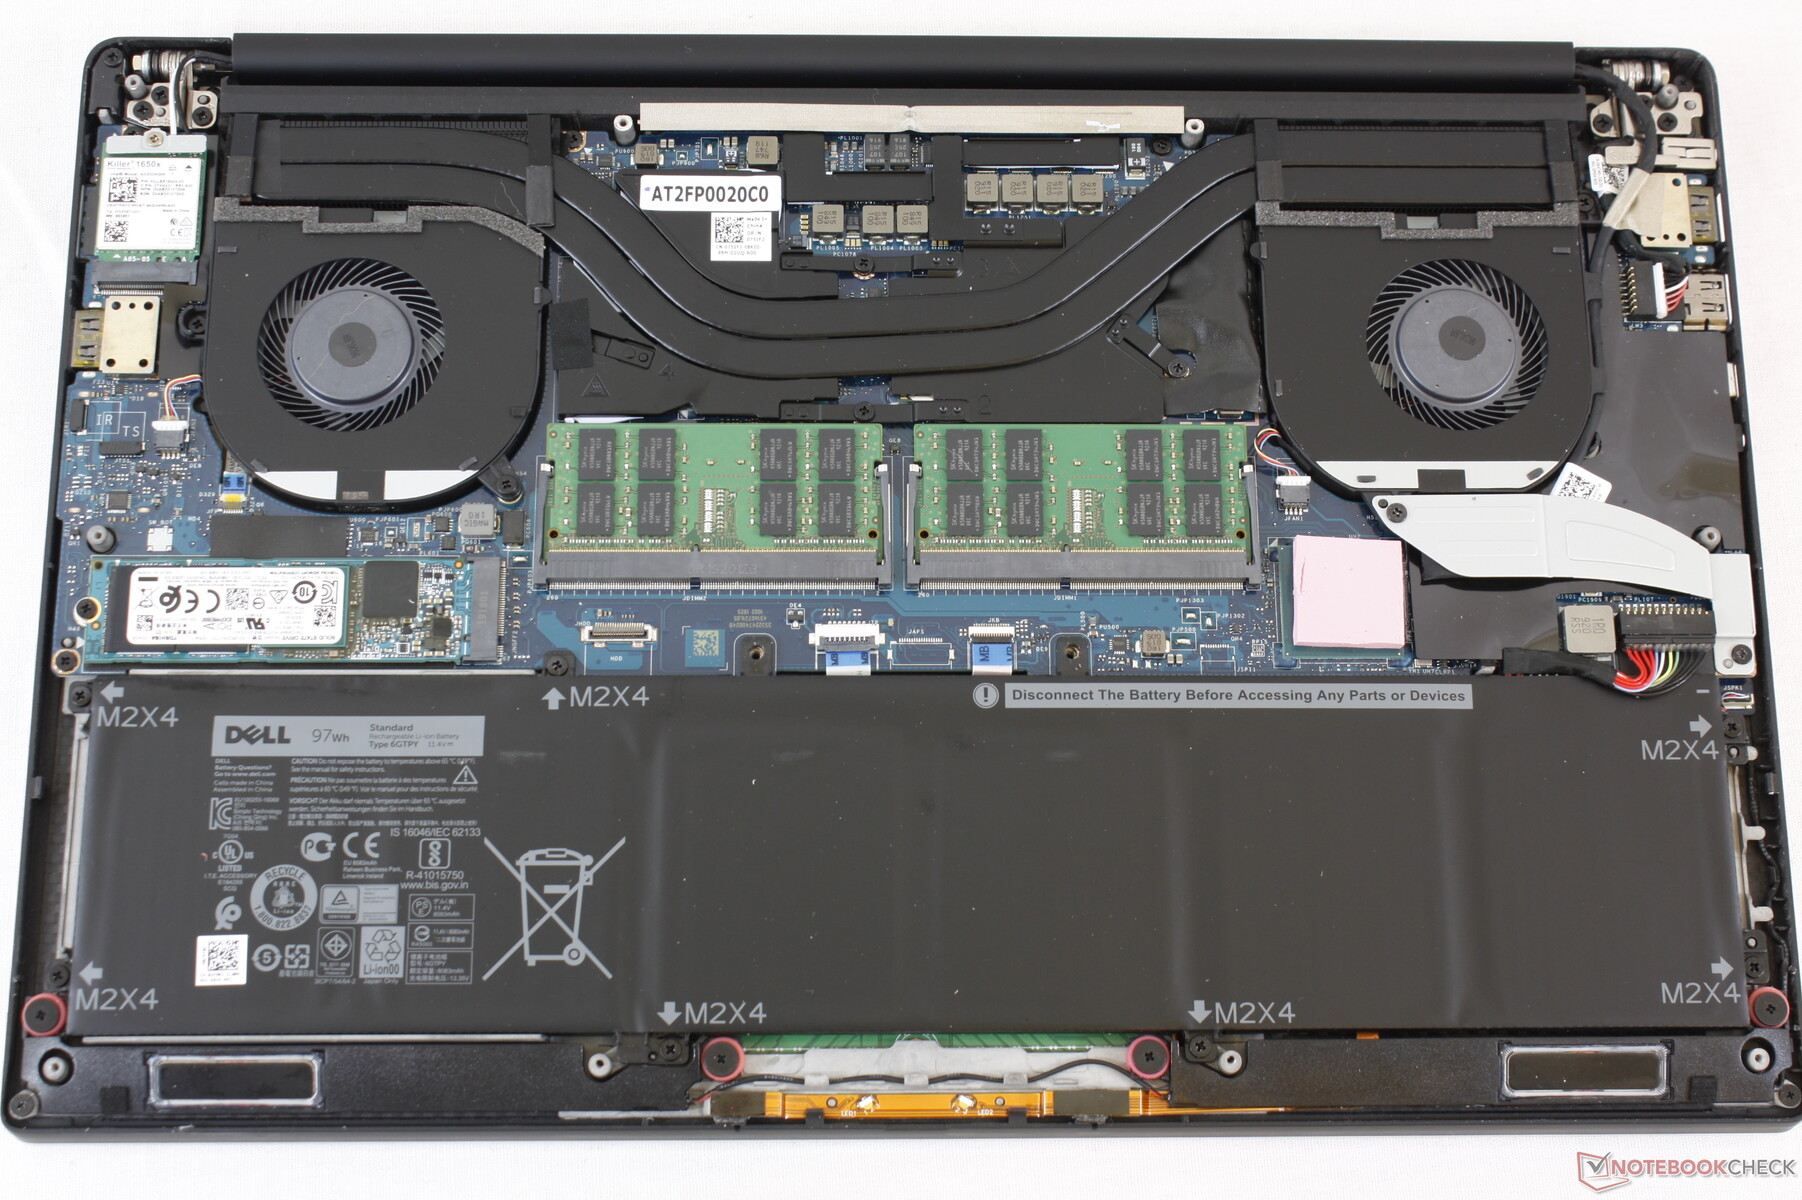
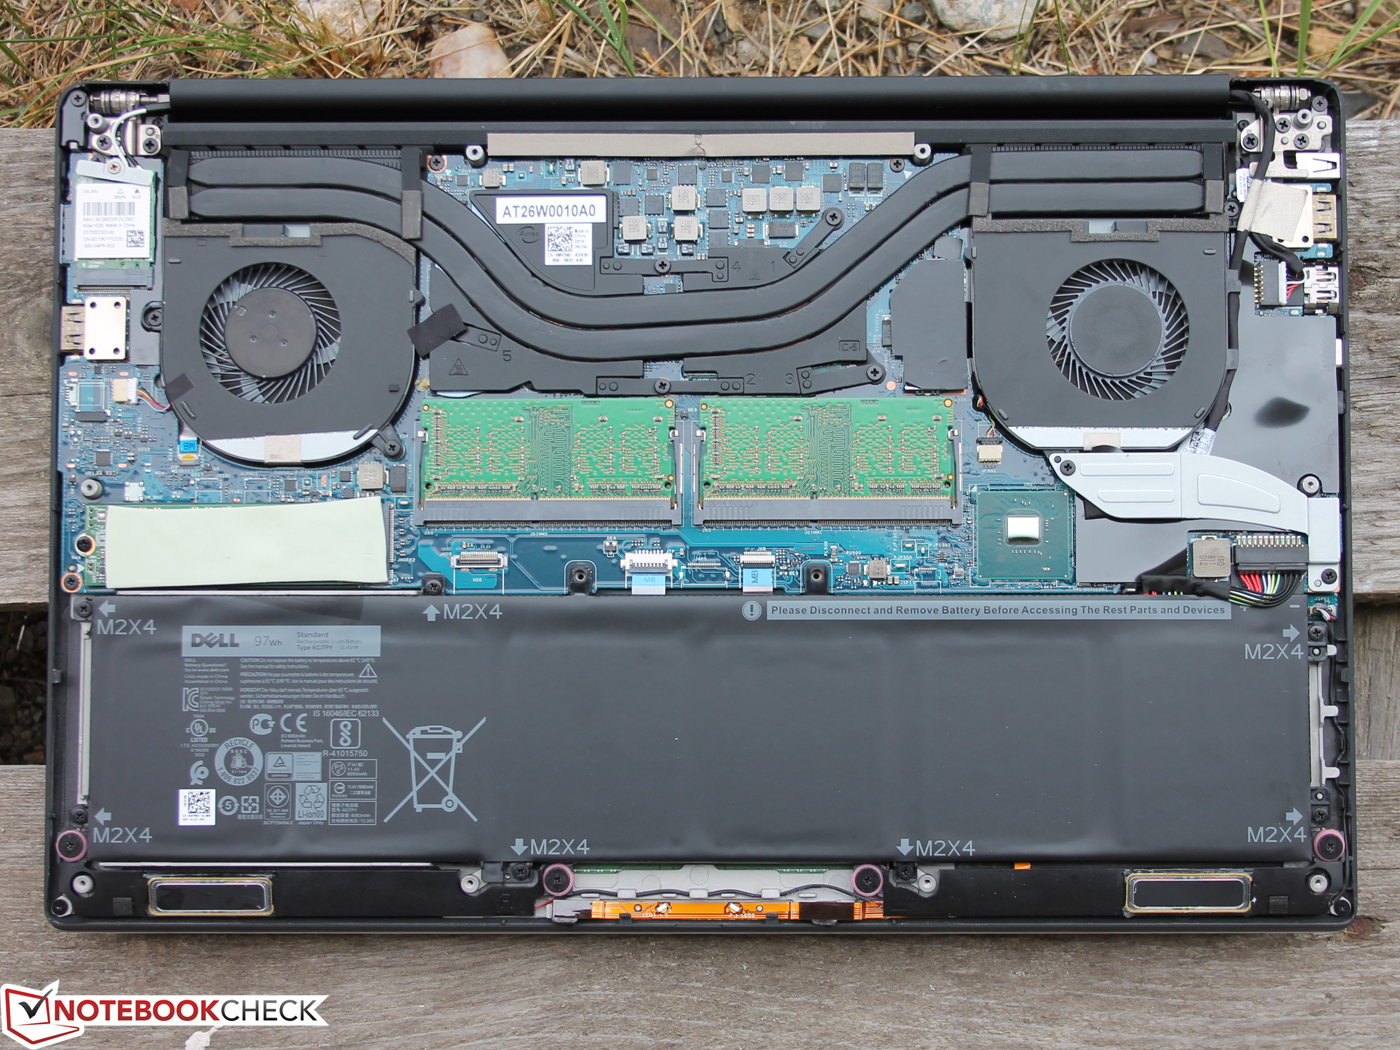
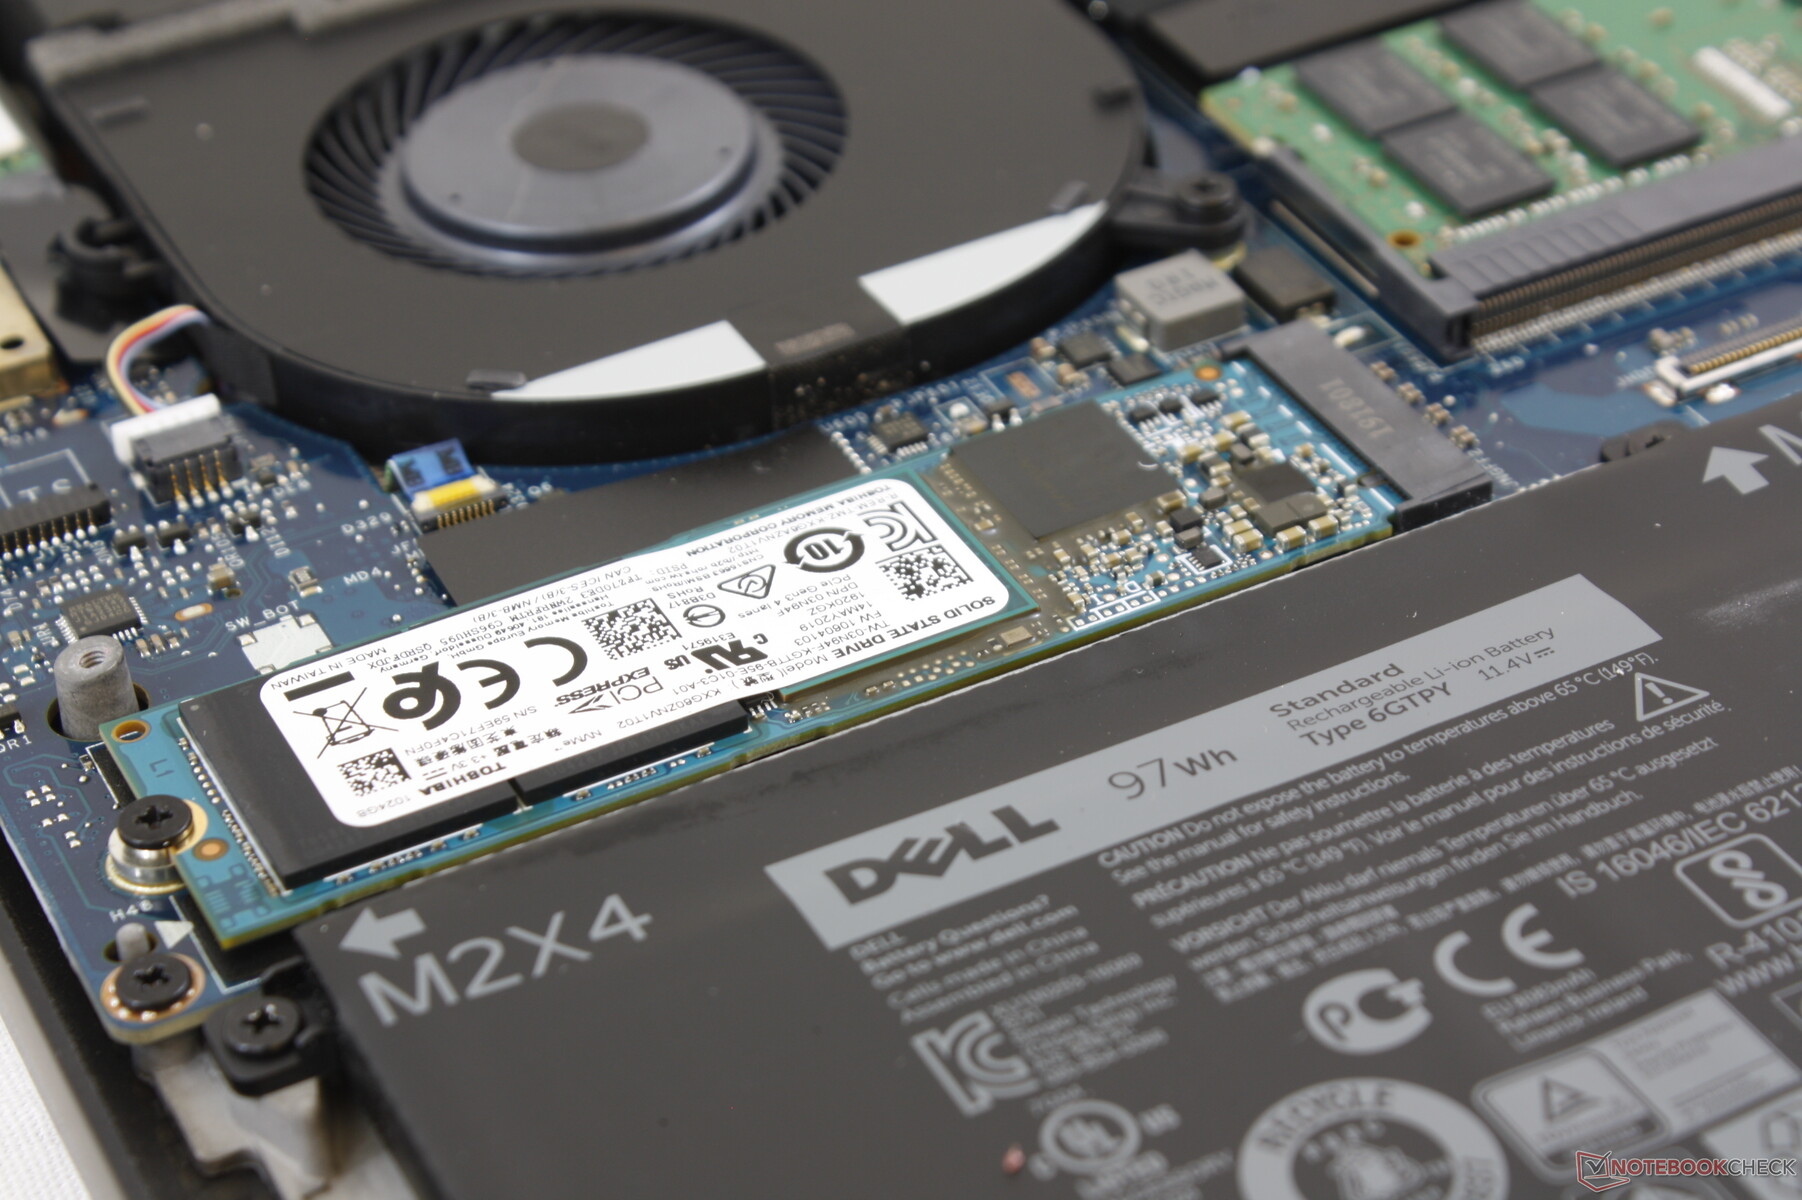
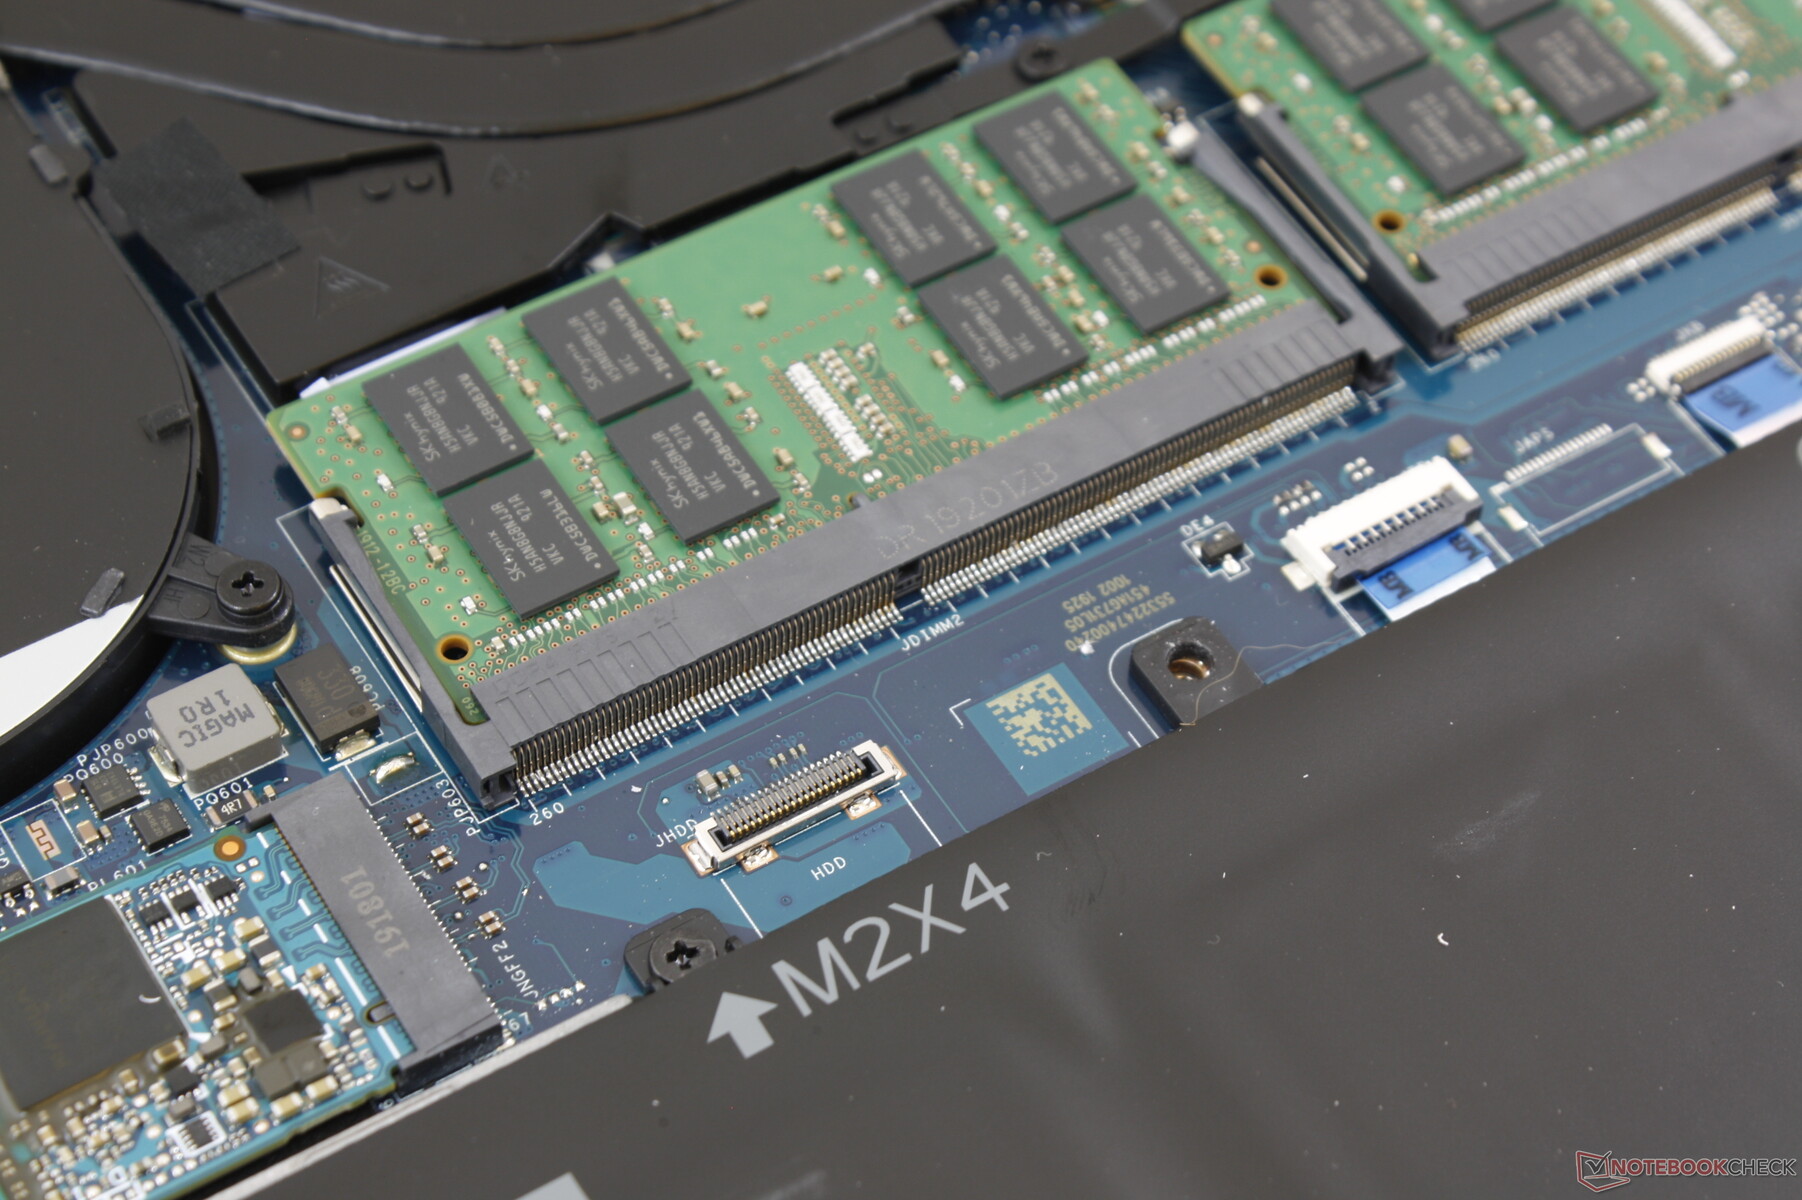
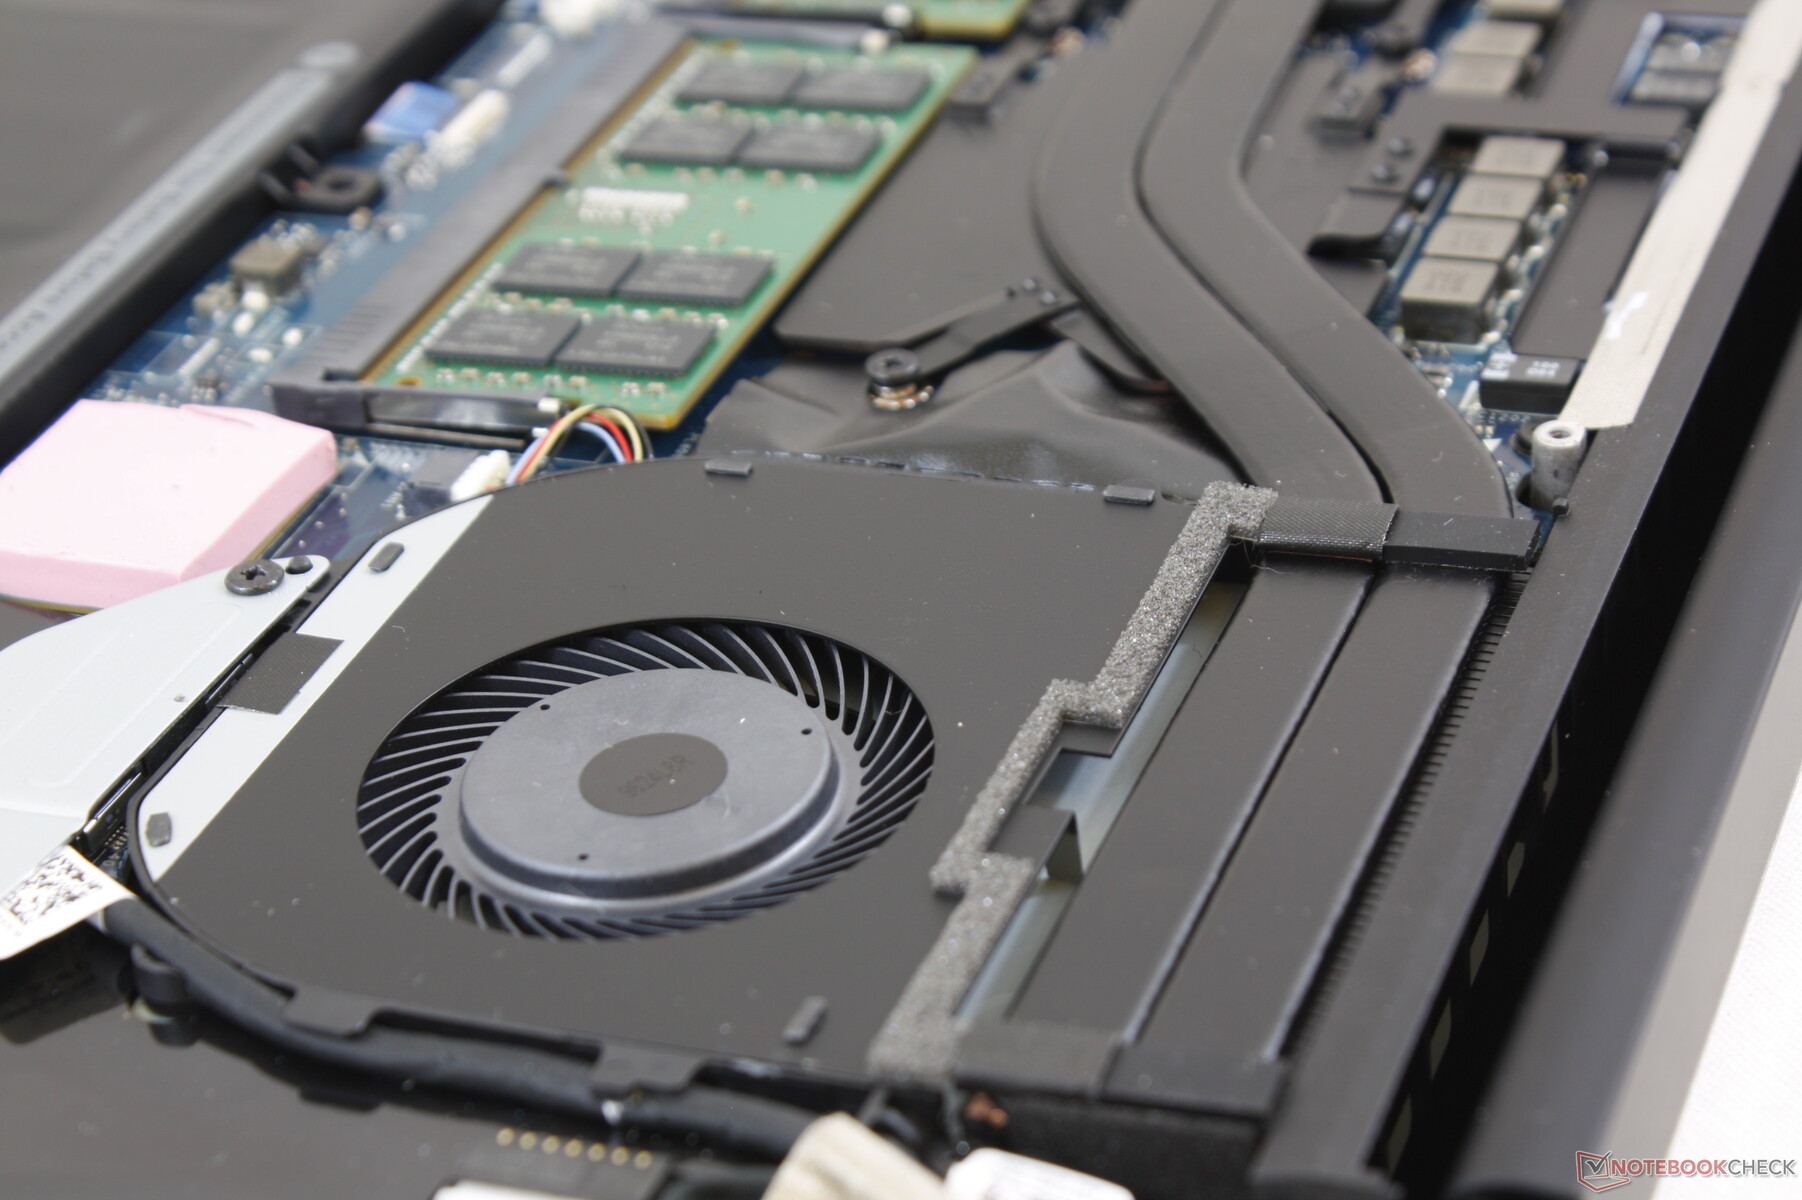
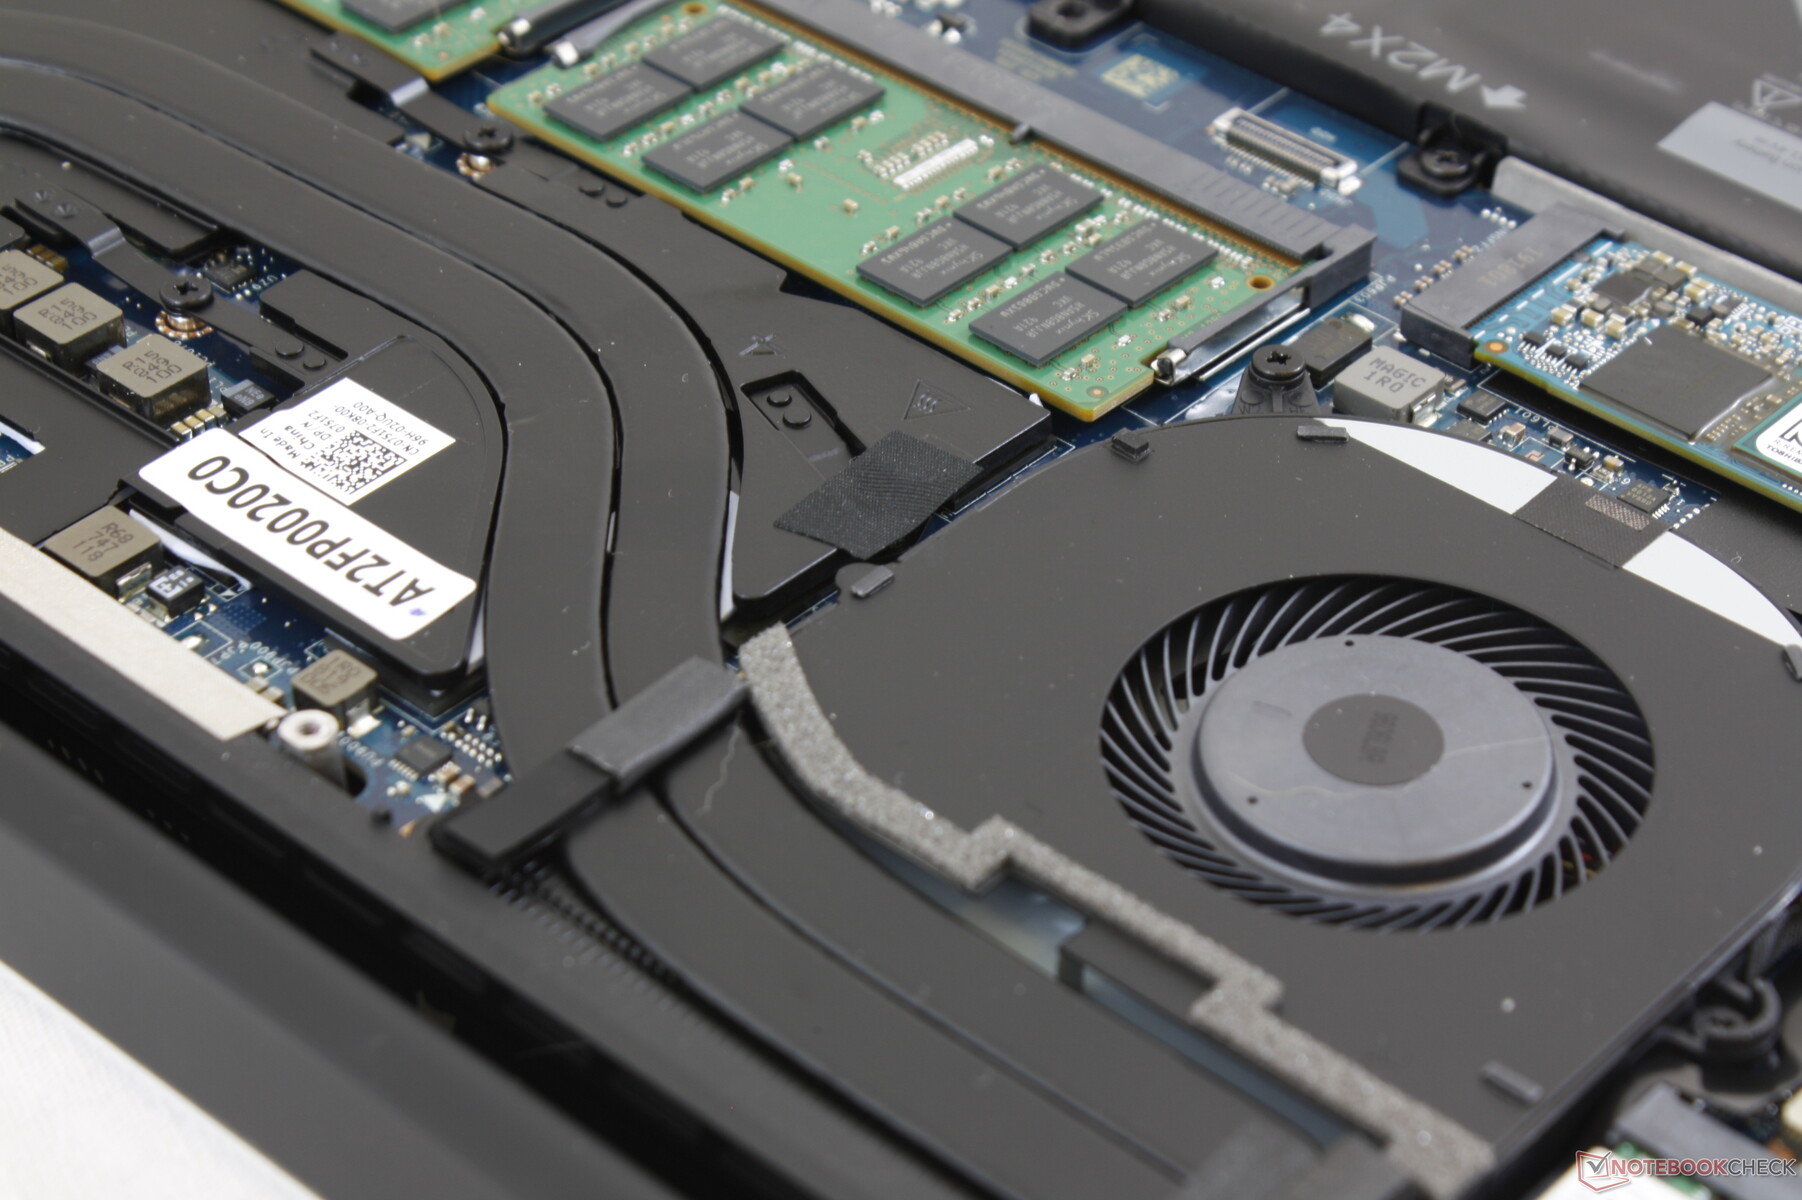
Not much has changed internally over the XPS 15 9570 as expected from a visual standpoint. RAM, WLAN, and M.2 storage are all still upgradeable and a lower battery capacity option (56 Wh) is still available on lesser SKUs for users who want secondary 2.5-inch SATA III storage.
While the cooling solution between the various XPS 15 SKUs may appear mostly identical, the Core i9 7590 SKUs come equipped with copper pipes and fins instead of the usual aluminum. Dell says this change will help cool the demanding hardware more effectively even though our benchmark data below will show that this might not be enough.
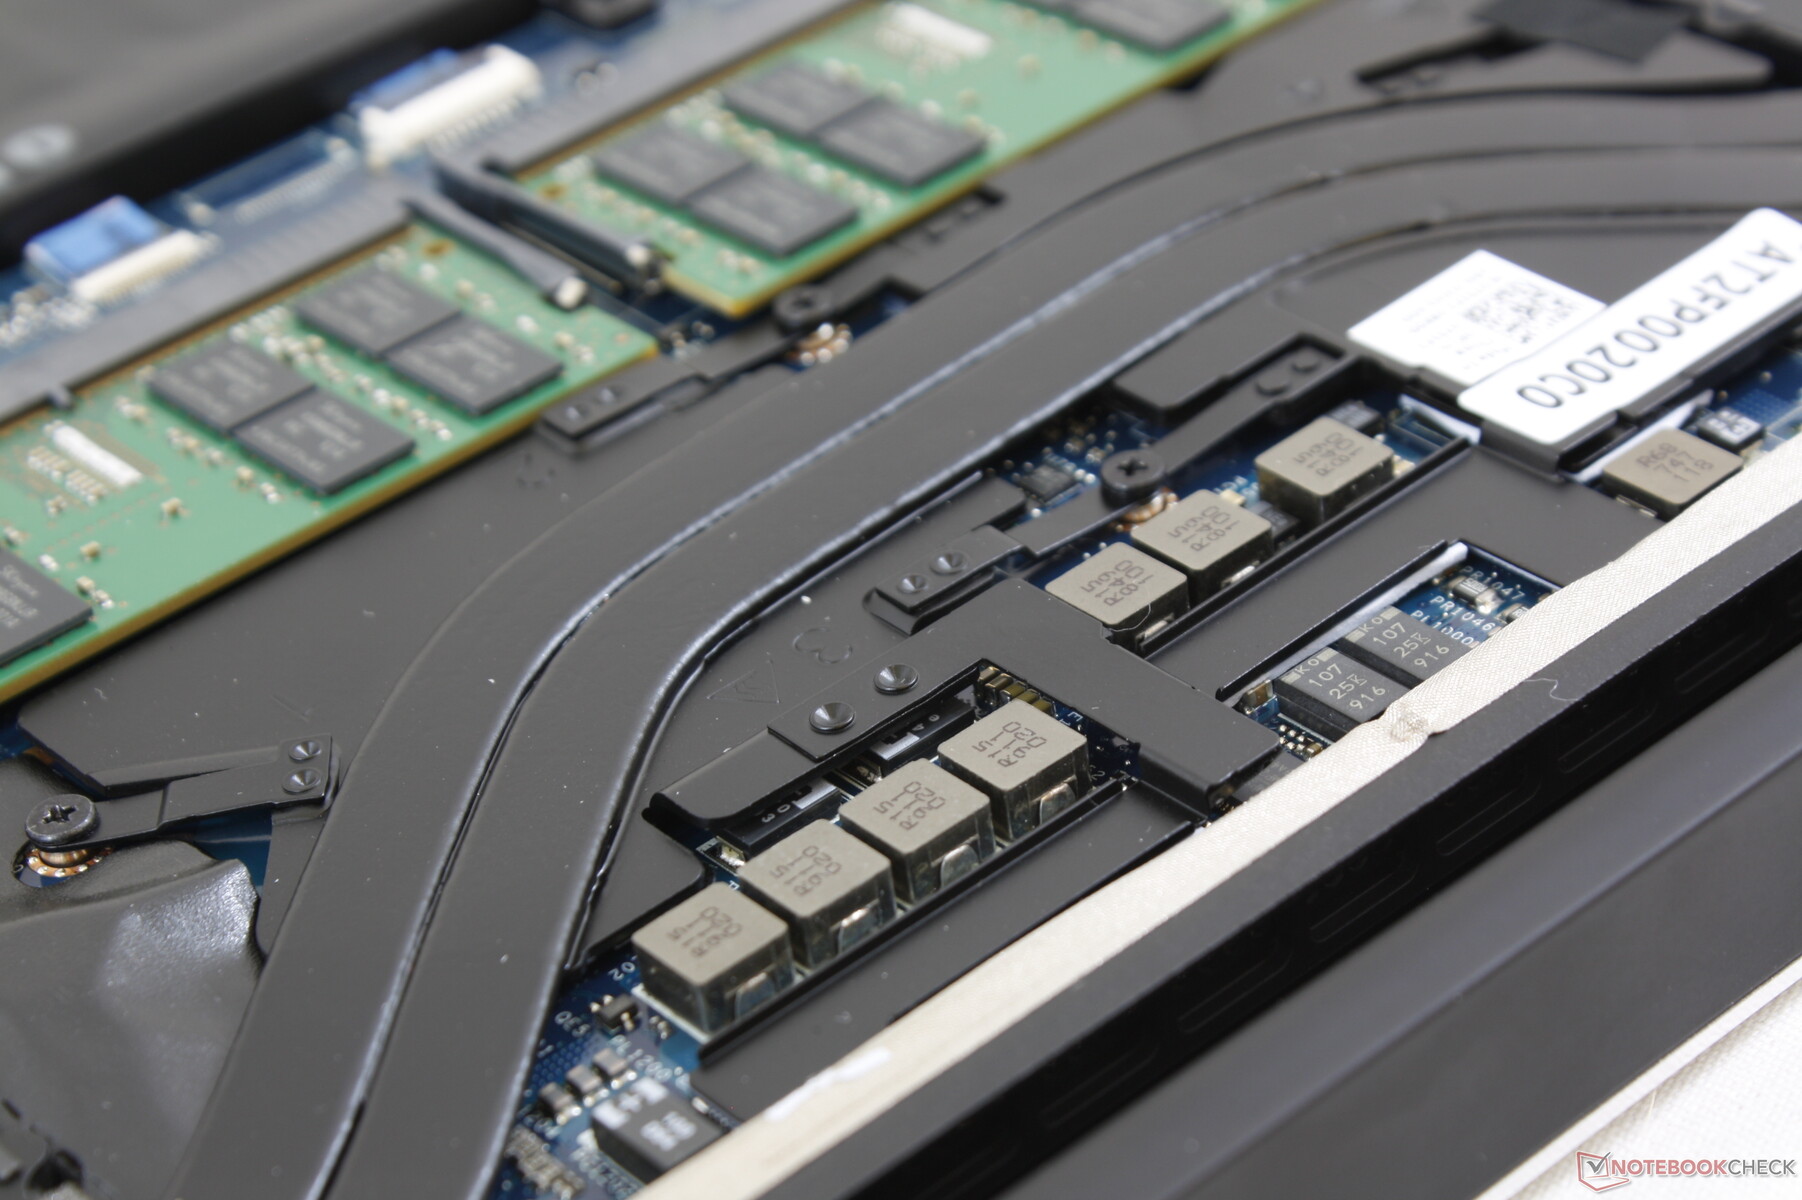
Dell has implemented additional cooling measures over the VRM MOSFET components that lie directly above the processors.
Accessories and Warranty
There are no extras in the box other than the usual paperwork. A USB-to-Ethernet adapter or cleaning cloth would have been nice additions.
The standard one-year limited warranty applies. As one of the world's largest OEMs and providers of IT services, Dell also offers a wider range of warranty extensions than most. Buyers can sign up for up to 4 years of premium support and 2 years of extended battery service if desired.
Input Devices
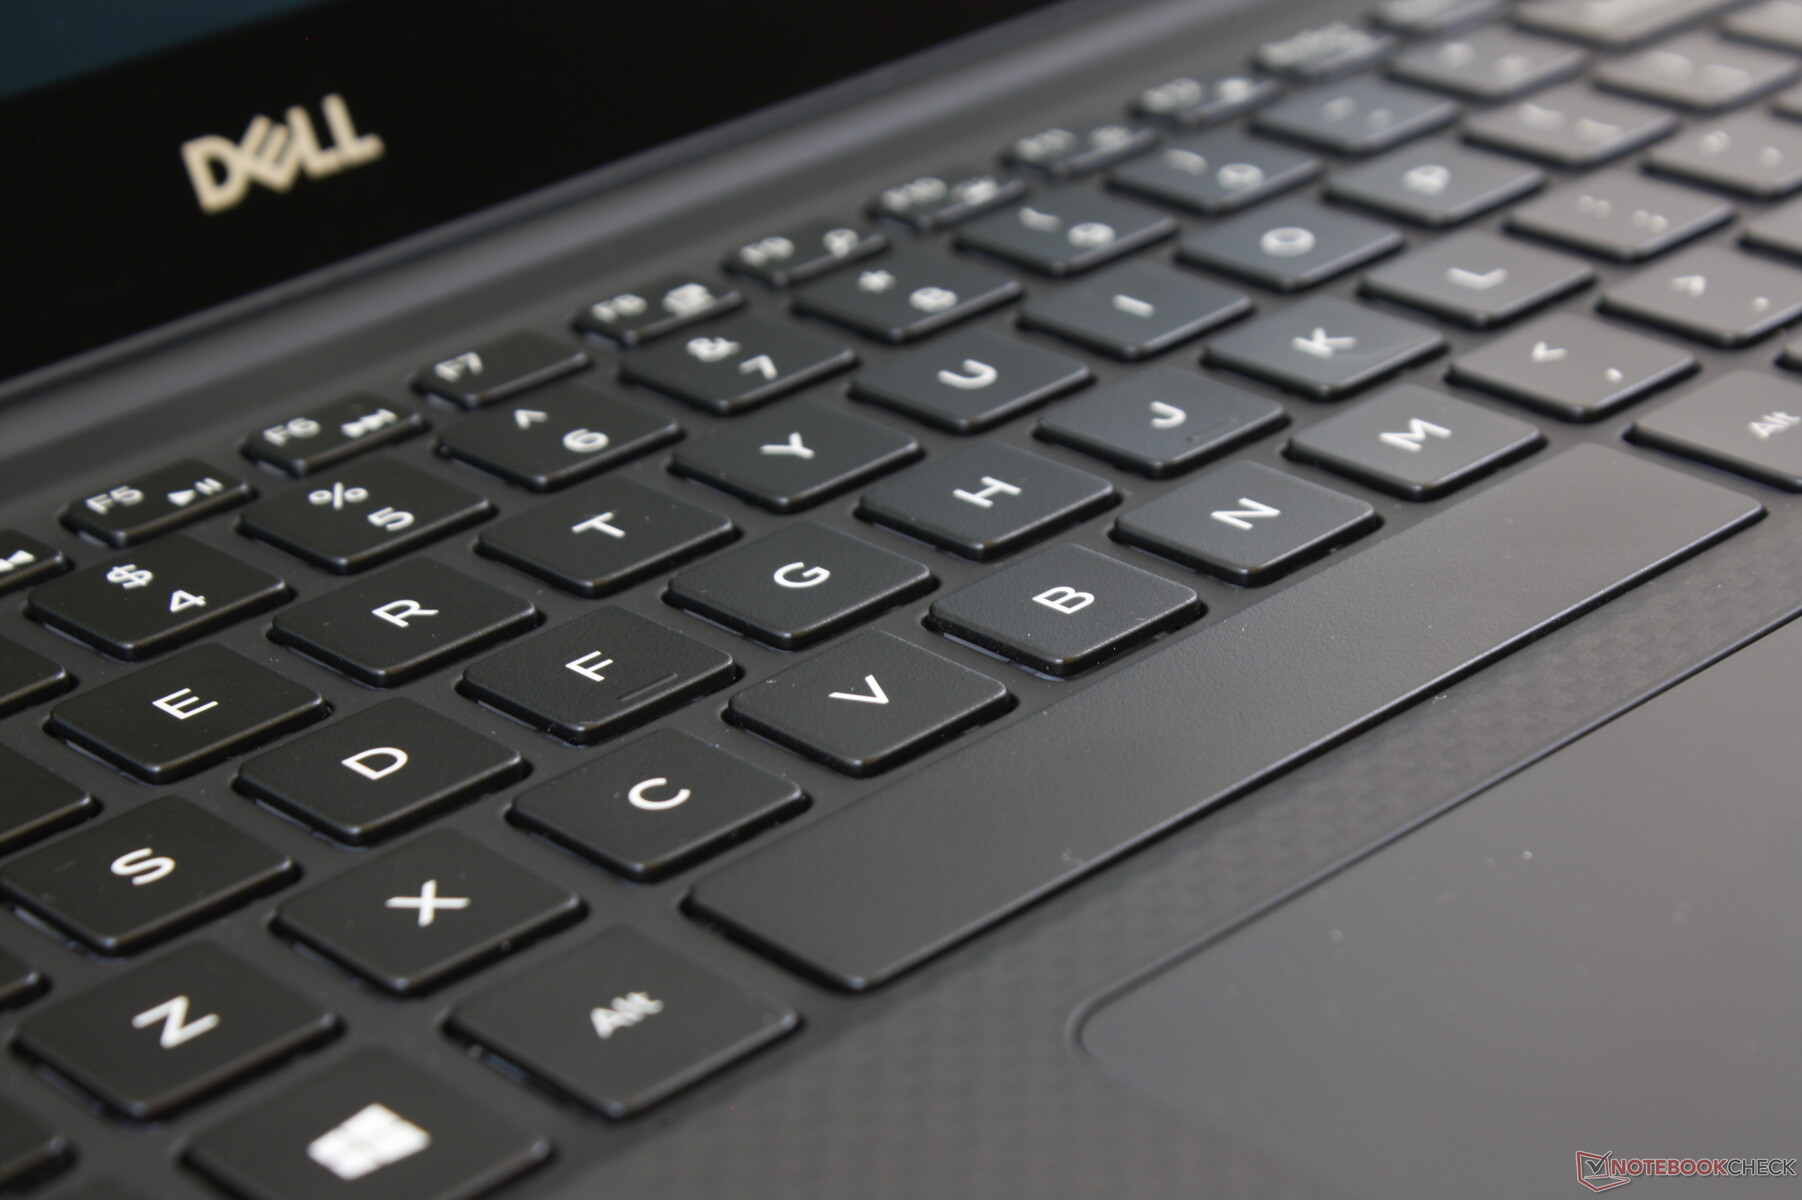
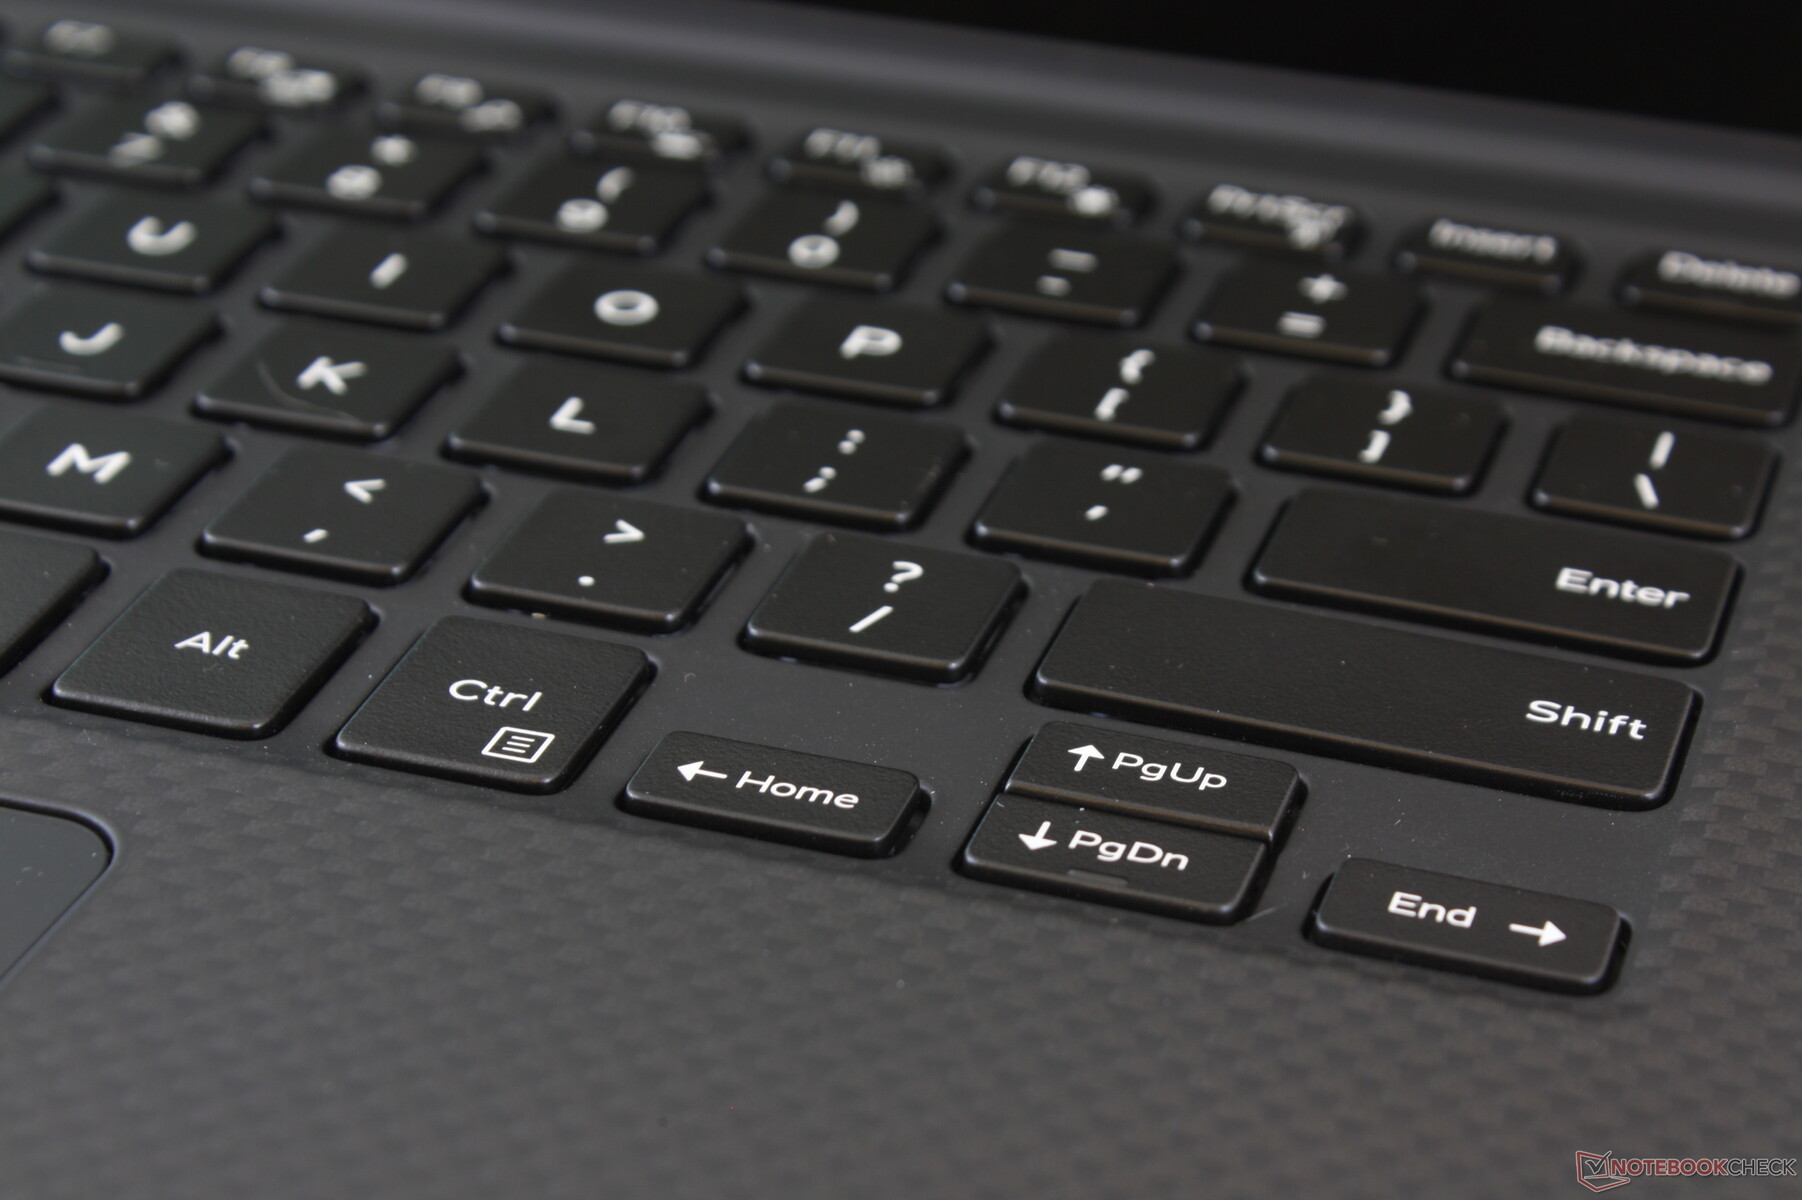
Keyboard and Trackpad
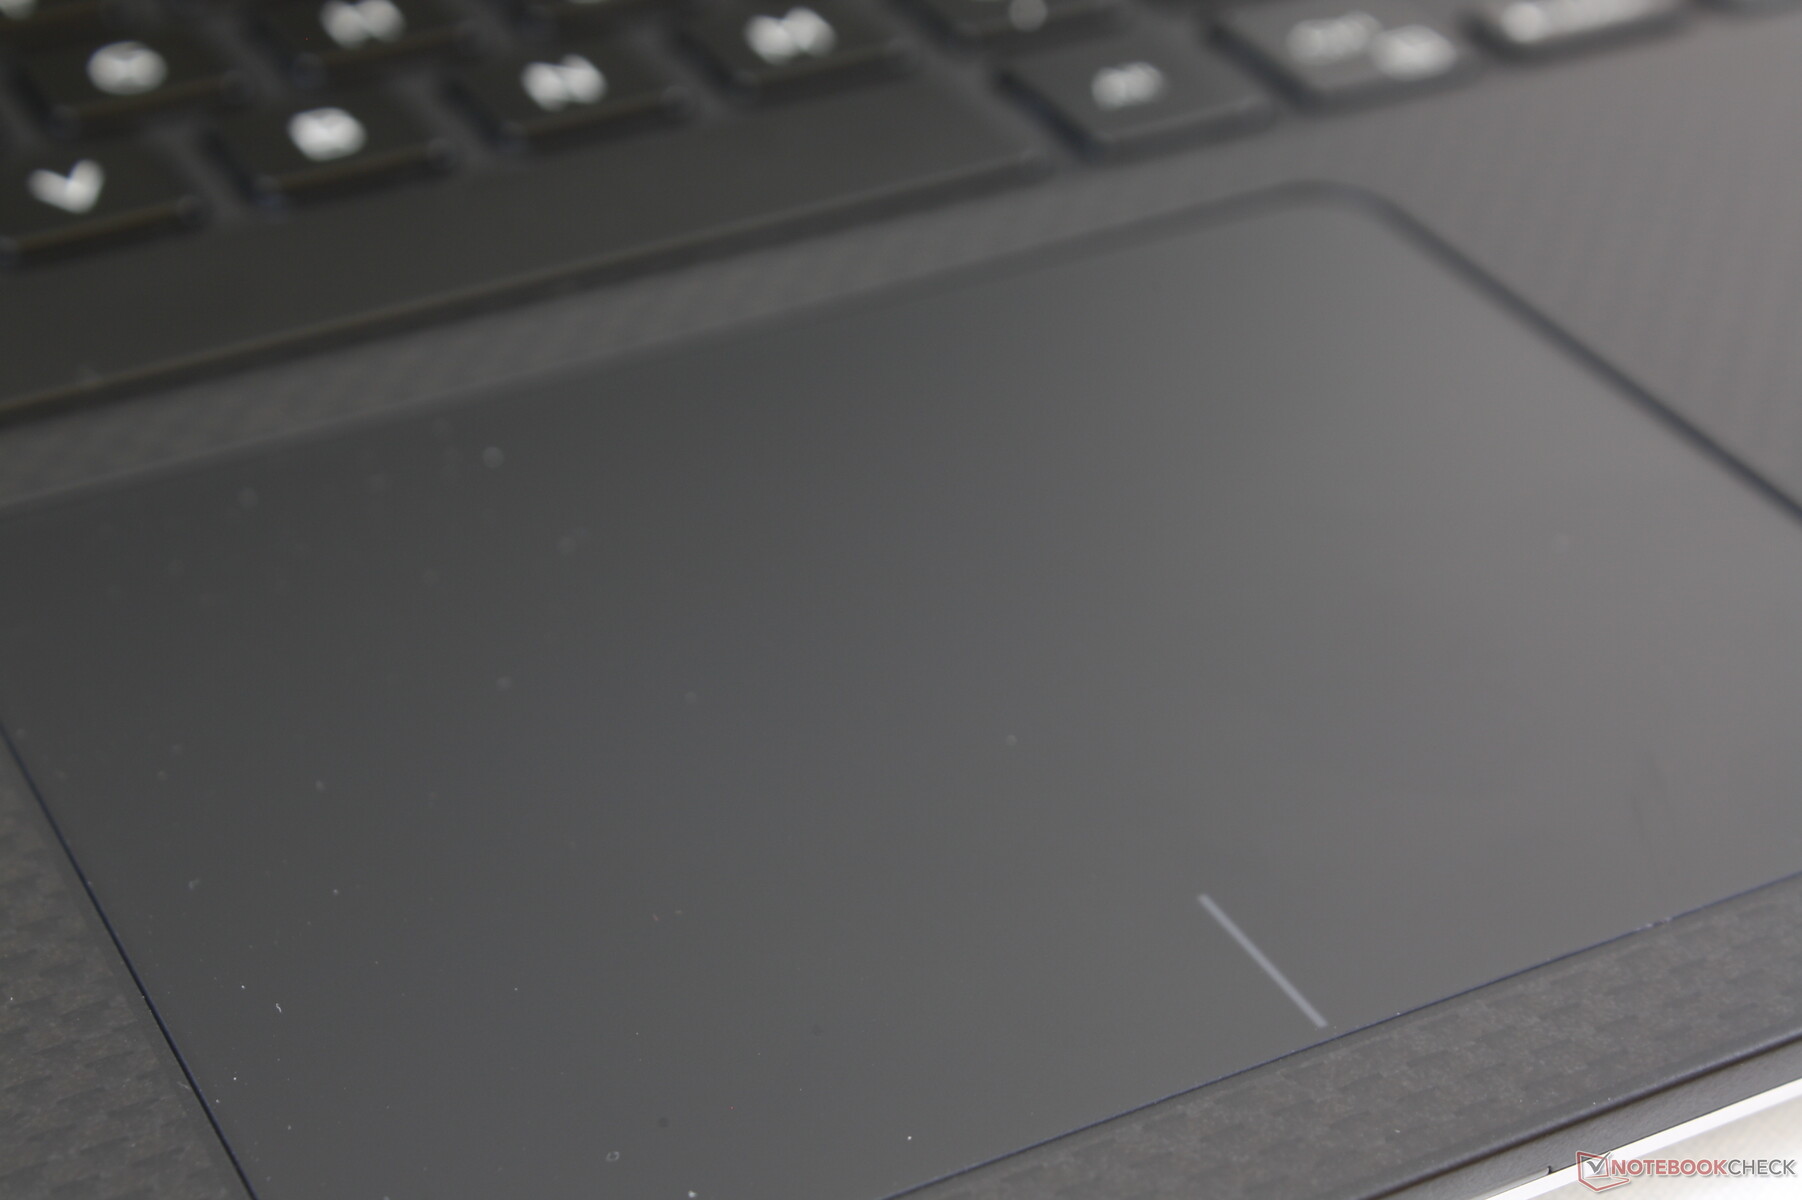
The input devices have not changed since the early XPS 15 9550 days meaning that our 2015 comments still apply here. Since then, however, newer Ultrabooks have come to market with crisper and firmer keys for a less spongy feel. We personally prefer the keyboard on the Spectre x360 15 over the XPS 15 as its keys have stronger and "clickier" feedback when pressed in addition to an integrated NumPad. Meanwhile, the glass clickpad continues to be reliable without any major issues even though it's not as accurate as touchpads with dedicated mouse keys.
Display
All 15.6-inch 4K UHD OLED laptops thus far have been sourcing their panels from Samsung. Thus, they all offer very similar visual experiences between them. In the case of the XPS 15, OLED addresses one of our biggest gripes about the series: slow black-white and gray-gray response times. The IPS panels of XPS 15 laptops have always had very noticeable ghosting especially now that fast 3 ms and 5 ms IPS panels are becoming more commonplace. The glossy OLED panel offers the crispness of 4K UHD IPS with essentially infinite contrast and no ghosting to be the best-looking XPS 15 display yet. It's tough to go back to the "regular" 60 Hz 4K UHD IPS SKU after growing accustomed to 60 Hz 4K UHD OLED.
There are a few drawbacks to the OLED panel. While bright at 400 nits, Dell's baseline 1080p IPS matte option is actually brighter at 500 nits. Secondly, it has the potential to consume more power than IPS depending on what is displayed as shown on our Power Consumption section. Thirdly, OLED is limited to a refresh rate of 60 Hz meaning that 120/144/240 Hz IPS panels, which aren't available on the XPS 15 yet, feel smoother to use. And lastly, only higher-end SKUs of the XPS 15 7590 with Core i7 and discrete GeForce graphics can be configured with OLED.


| |||||||||||||||||||||||||
Brightness Distribution: 94 %
Center on Battery: 418.4 cd/m²
Contrast: ∞:1 (Black: 0 cd/m²)
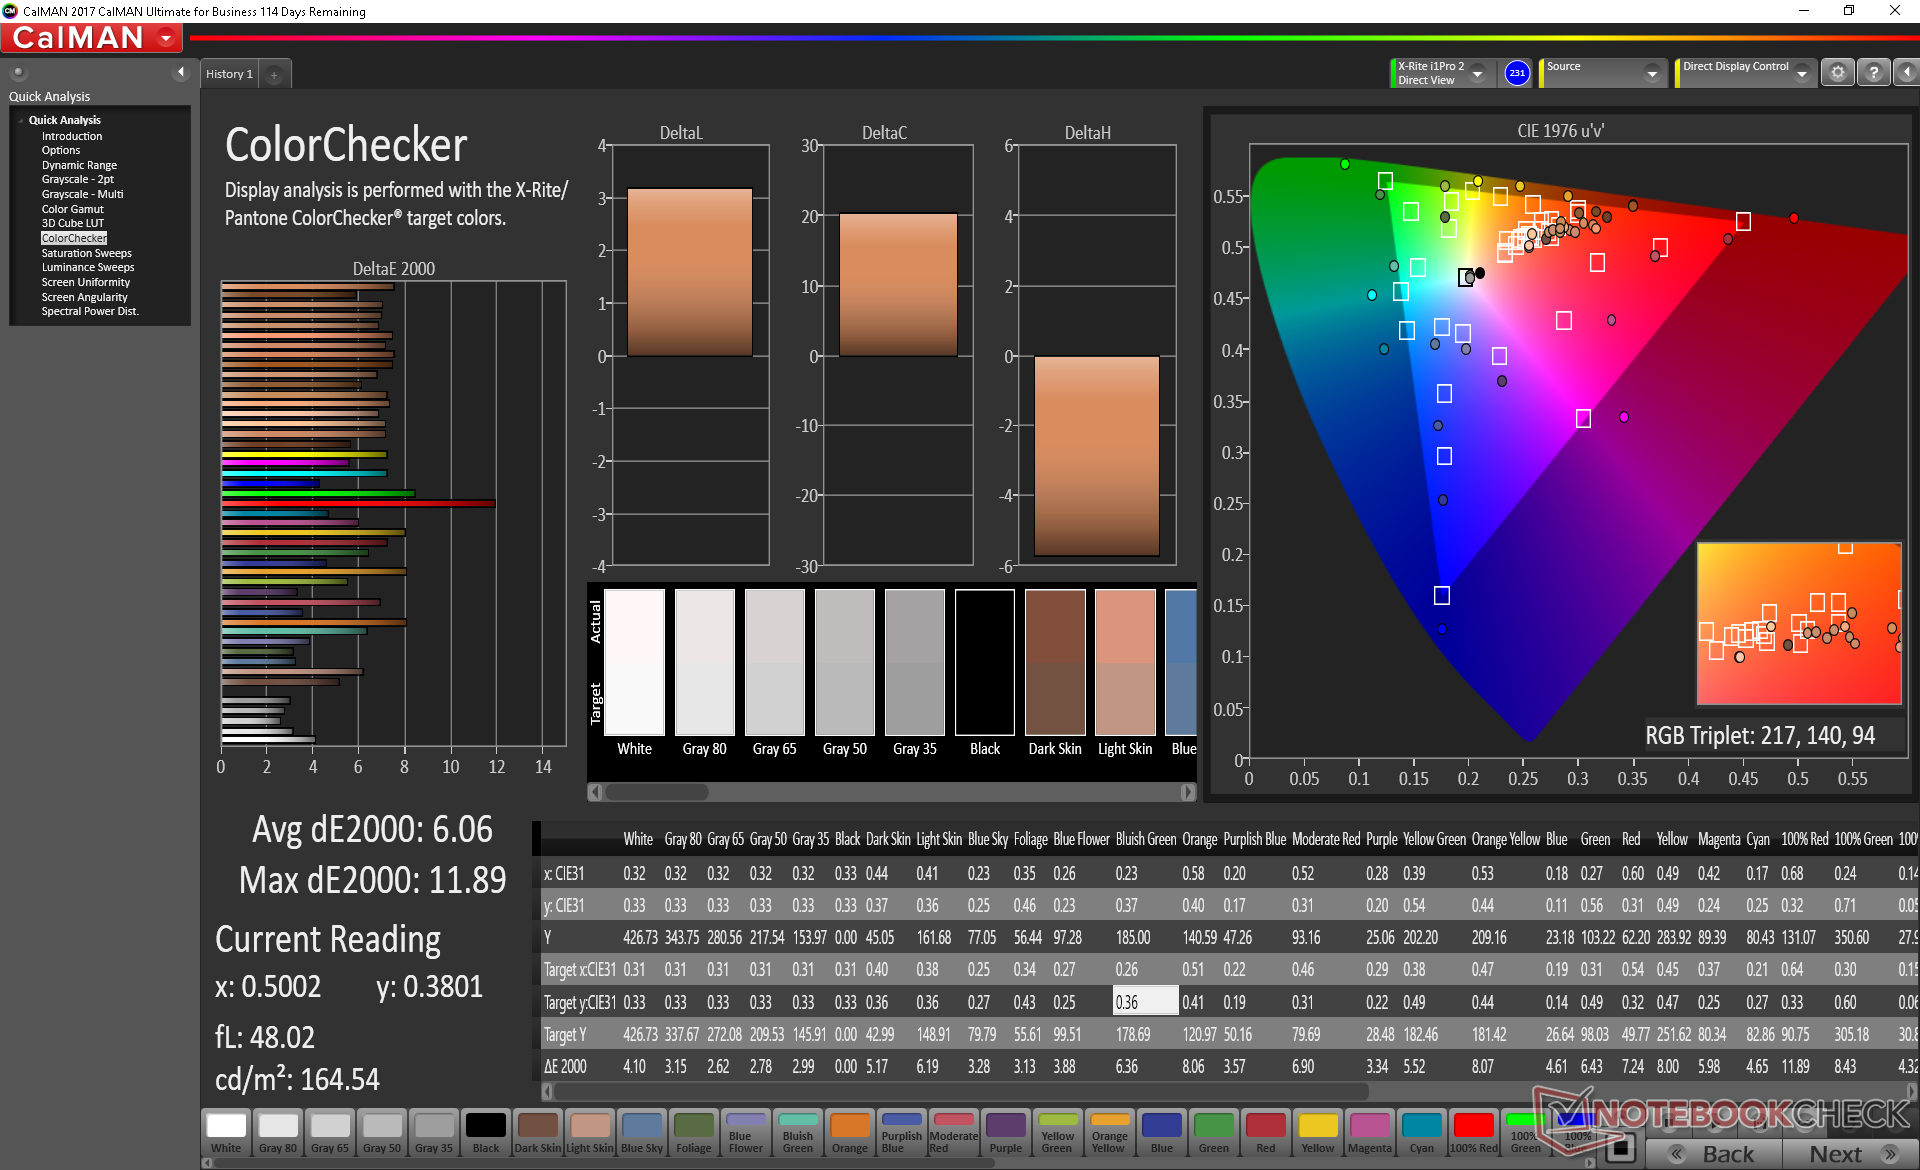
ΔE ColorChecker Calman: 6.06 | ∀{0.5-29.43 Ø4.71}
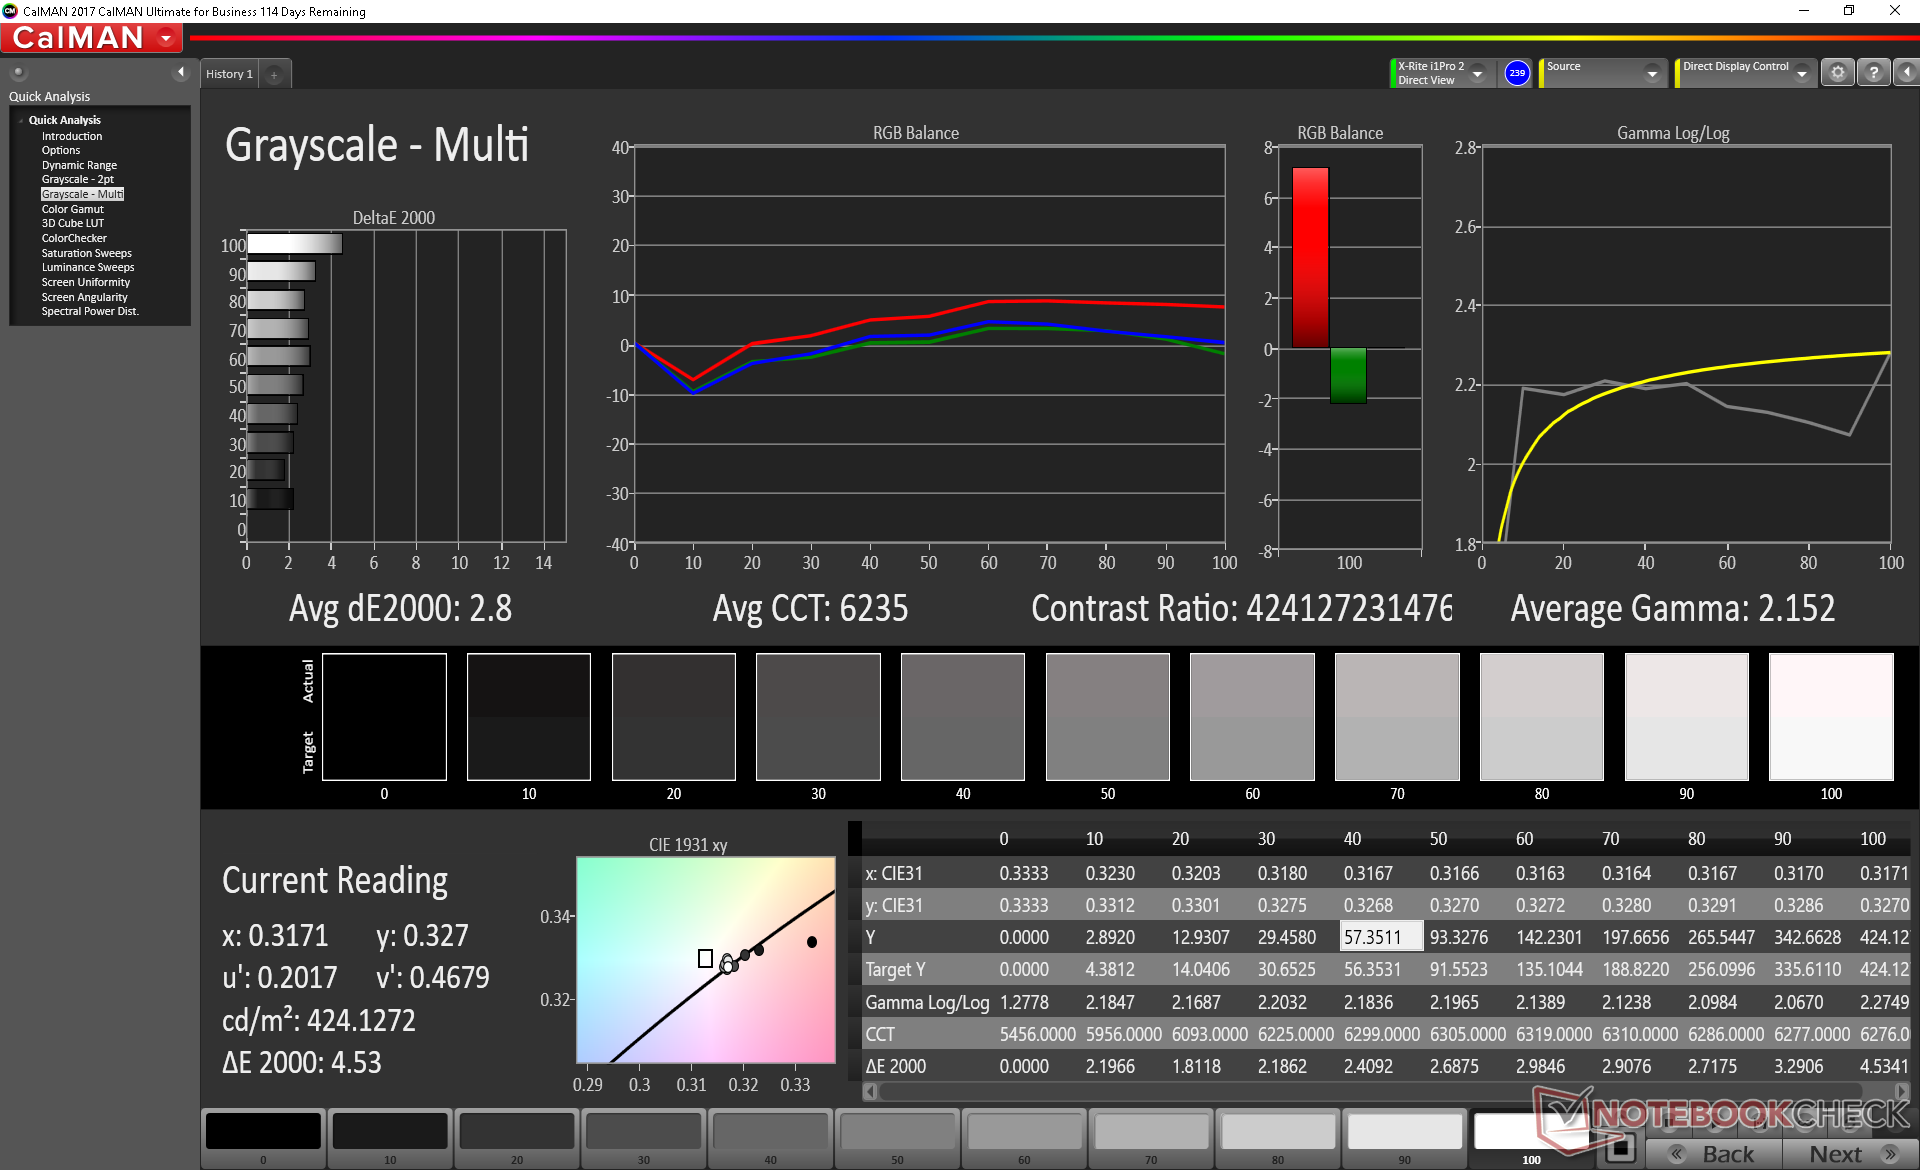
ΔE Greyscale Calman: 2.8 | ∀{0.09-98 Ø4.96}
99.6% sRGB (Argyll 1.6.3 3D)
81% AdobeRGB 1998 (Argyll 1.6.3 3D)
91.8% AdobeRGB 1998 (Argyll 3D)
99.6% sRGB (Argyll 3D)
88.1% Display P3 (Argyll 3D)
Gamma: 2.15
CCT: 6235 K
| Dell XPS 15 7590 9980HK GTX 1650 Samsung 156WR04, SDCA029, OLED, 15.6", 3840x2160 | Dell XPS 15 9570 Core i9 UHD LQ156D1, IPS, 15.6", 3840x2160 | Asus ZenBook 15 UX533FD BOE07D8, IPS, 15.6", 1920x1080 | HP Spectre x360 15-df0126ng AU Optronics AUO30EB, IPS, 15.6", 3840x2160 | Gigabyte Aero 15 OLED XA Samsung SDCA029, OLED, 15.6", 3840x2160 | Razer Blade 15 RTX 2080 Max-Q Sharp LQ156M1JW03 (SHP14C5), IPS, 15.6", 1920x1080 | |
|---|---|---|---|---|---|---|
| Display | -8% | -22% | -18% | -17% | ||
| Display P3 Coverage (%) | 88.1 | 79.6 -10% | 67.2 -24% | 68.1 -23% | 66.9 -24% | |
| sRGB Coverage (%) | 99.6 | 98.4 -1% | 88.4 -11% | 94.2 -5% | 98.1 -2% | |
| AdobeRGB 1998 Coverage (%) | 91.8 | 79.7 -13% | 64.6 -30% | 68.4 -25% | 68.5 -25% | |
| Response Times | -1698% | -1650% | -1785% | 2% | -395% | |
| Response Time Grey 50% / Grey 80% * (ms) | 2.3 ? | 52.4 ? -2178% | 45 ? -1857% | 57 ? -2378% | 2.4 ? -4% | 12.8 ? -457% |
| Response Time Black / White * (ms) | 2.4 ? | 31.6 ? -1217% | 37 ? -1442% | 31 ? -1192% | 2.2 ? 8% | 10.4 ? -333% |
| PWM Frequency (Hz) | 59.5 ? | 1000 ? | 60 ? | 23810 ? | ||
| Screen | -28% | -18% | -9% | 7% | 8% | |
| Brightness middle (cd/m²) | 421.2 | 451.9 7% | 311 -26% | 330 -22% | 373 -11% | 293 -30% |
| Brightness (cd/m²) | 417 | 414 -1% | 303 -27% | 310 -26% | 375 -10% | 270 -35% |
| Brightness Distribution (%) | 94 | 81 -14% | 81 -14% | 87 -7% | 93 -1% | 87 -7% |
| Black Level * (cd/m²) | 0.36 | 0.24 | 0.37 | 0.29 | ||
| Colorchecker dE 2000 * | 6.06 | 5.62 7% | 5.1 16% | 4.03 33% | 3.98 34% | 1.69 72% |
| Colorchecker dE 2000 max. * | 11.89 | 19.1 -61% | 8.91 25% | 6.74 43% | 6.28 47% | 3.37 72% |
| Greyscale dE 2000 * | 2.8 | 6.9 -146% | 4.93 -76% | 4.49 -60% | 2.81 -0% | 2.3 18% |
| Gamma | 2.15 102% | 2.2 100% | 2.44 90% | 2.57 86% | 2.62 84% | 2.3 96% |
| CCT | 6235 104% | 6254 104% | 7641 85% | 6744 96% | 6434 101% | 6758 96% |
| Color Space (Percent of AdobeRGB 1998) (%) | 81 | 71.8 -11% | 58 -28% | 61 -25% | 78 -4% | 63 -22% |
| Color Space (Percent of sRGB) (%) | 99.6 | 98.5 -1% | 88 -12% | 94 -6% | 97 -3% | 98.5 -1% |
| Contrast (:1) | 1255 | 1296 | 892 | 1010 | ||
| Colorchecker dE 2000 calibrated * | 2.69 | 2.48 | 1.96 | 1.24 | ||
| Total Average (Program / Settings) | -578% /
-280% | -563% /
-270% | -604% /
-284% | 5% /
6% | -135% /
-60% |
* ... smaller is better
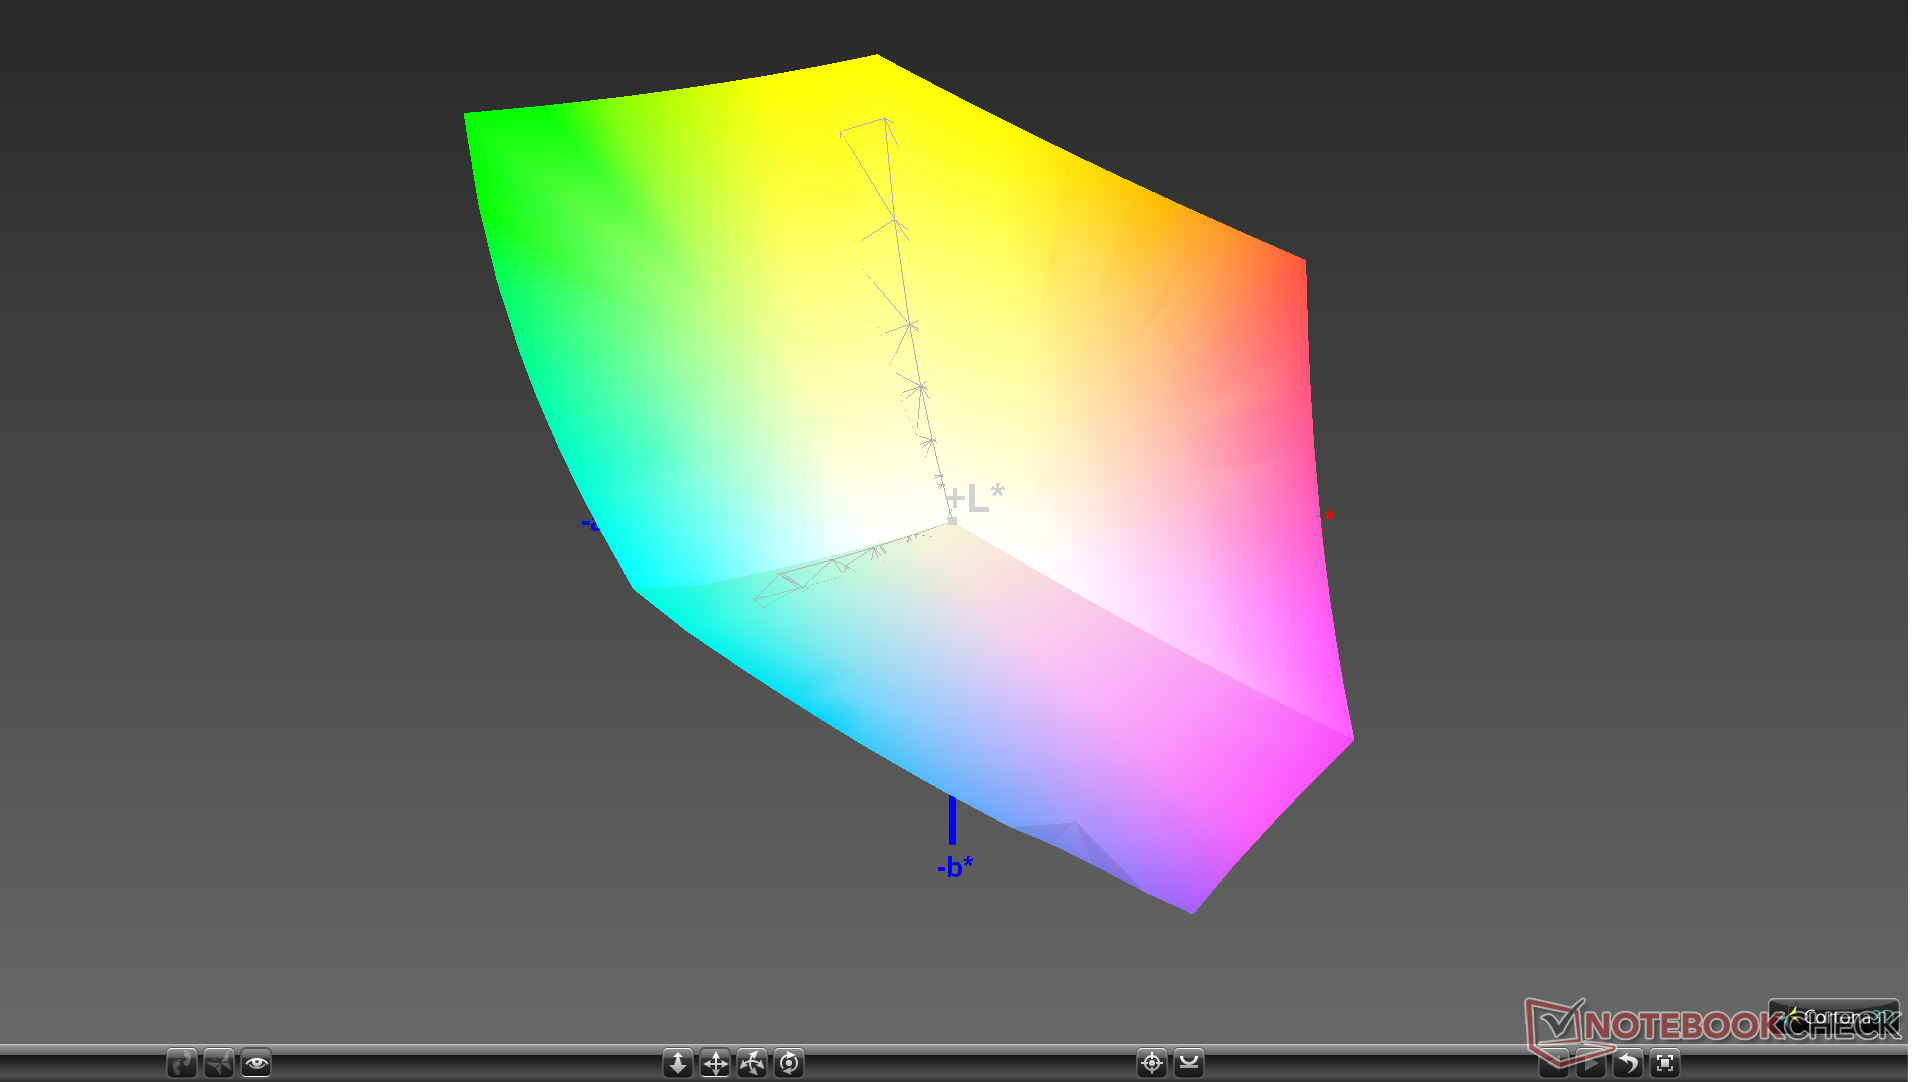
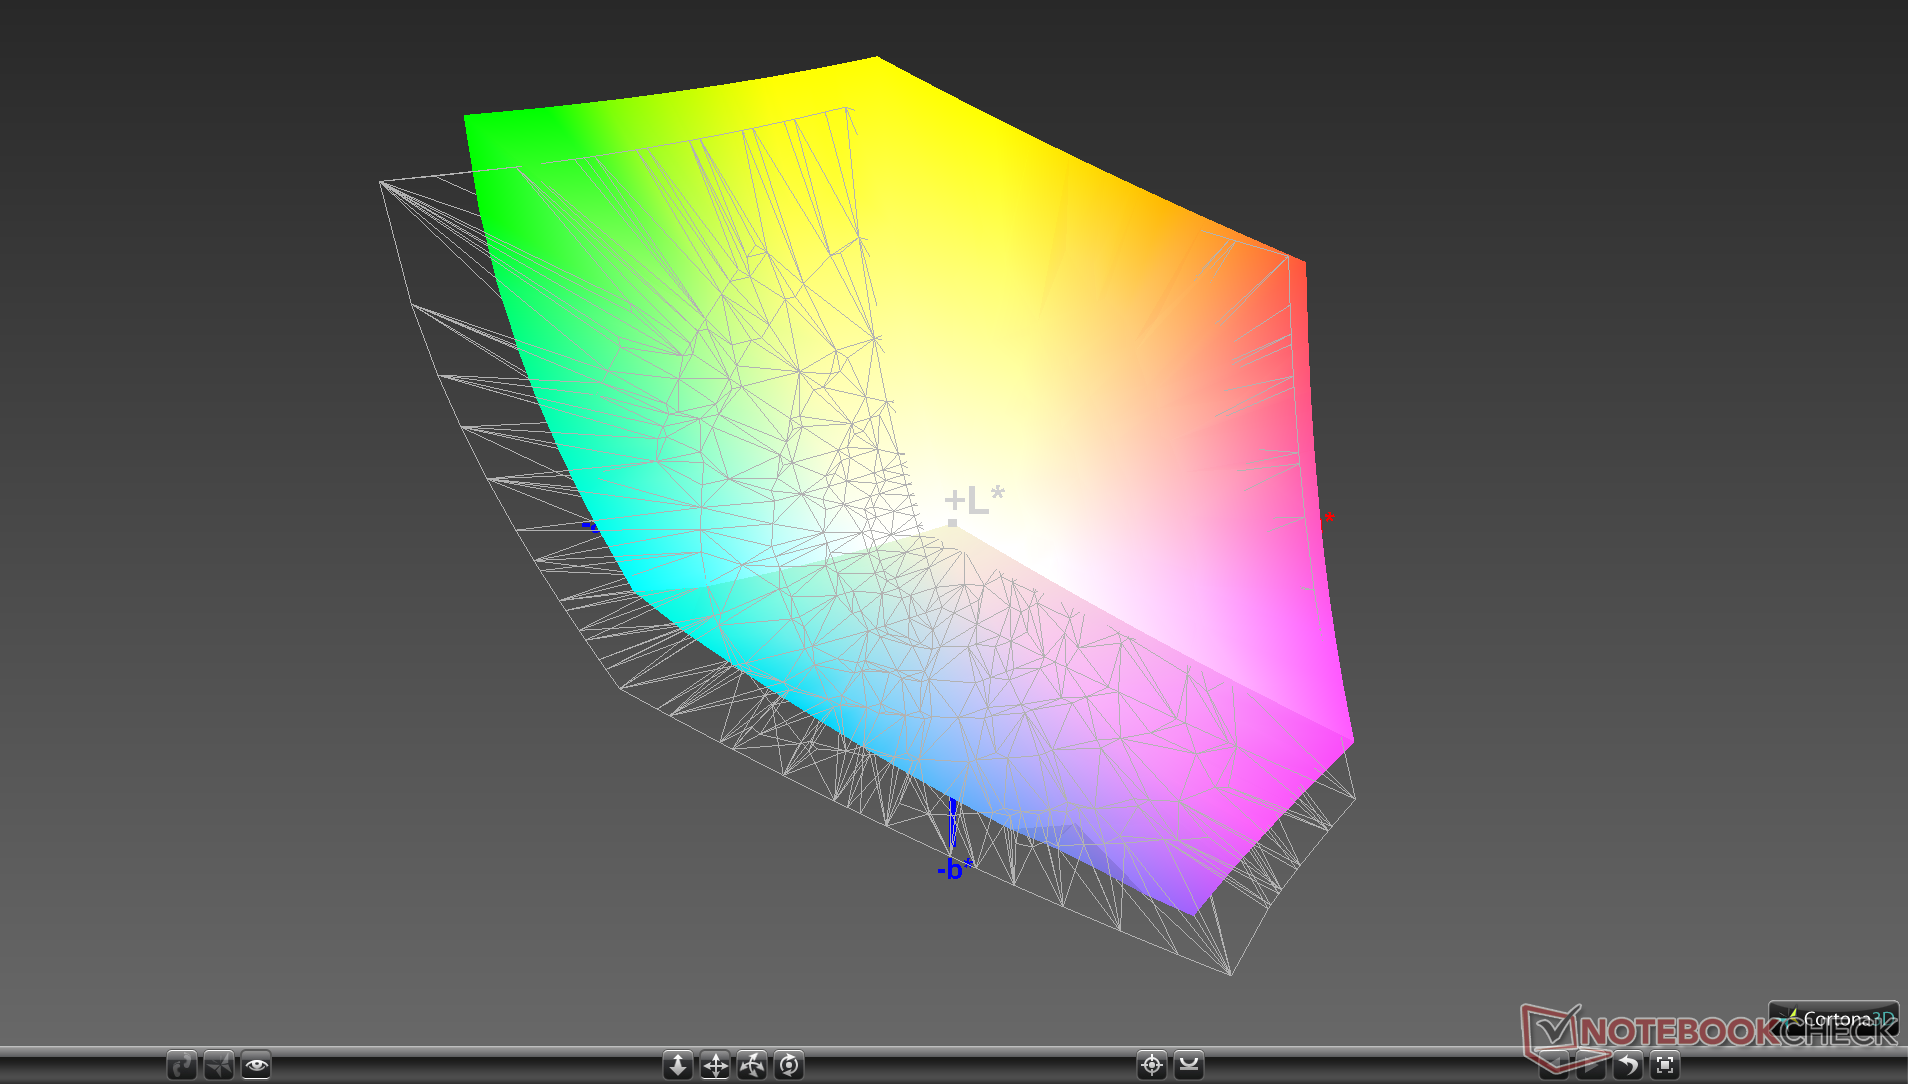
The Samsung panel promises 100 percent DCI-P3 coverage to offer similar color reproduction as many OLED smartphones including the iPhone 8 and Google Pixel 3. Our own independent calculations show 81 percent 3D coverage of the AdobeRGB standard to be wider than on the 4K UHD IPS XPS 15 9570. In other words, it's capable of displaying deeper colors than most other IPS Ultrabooks where ~60 percent AdobeRGB coverage is more common.
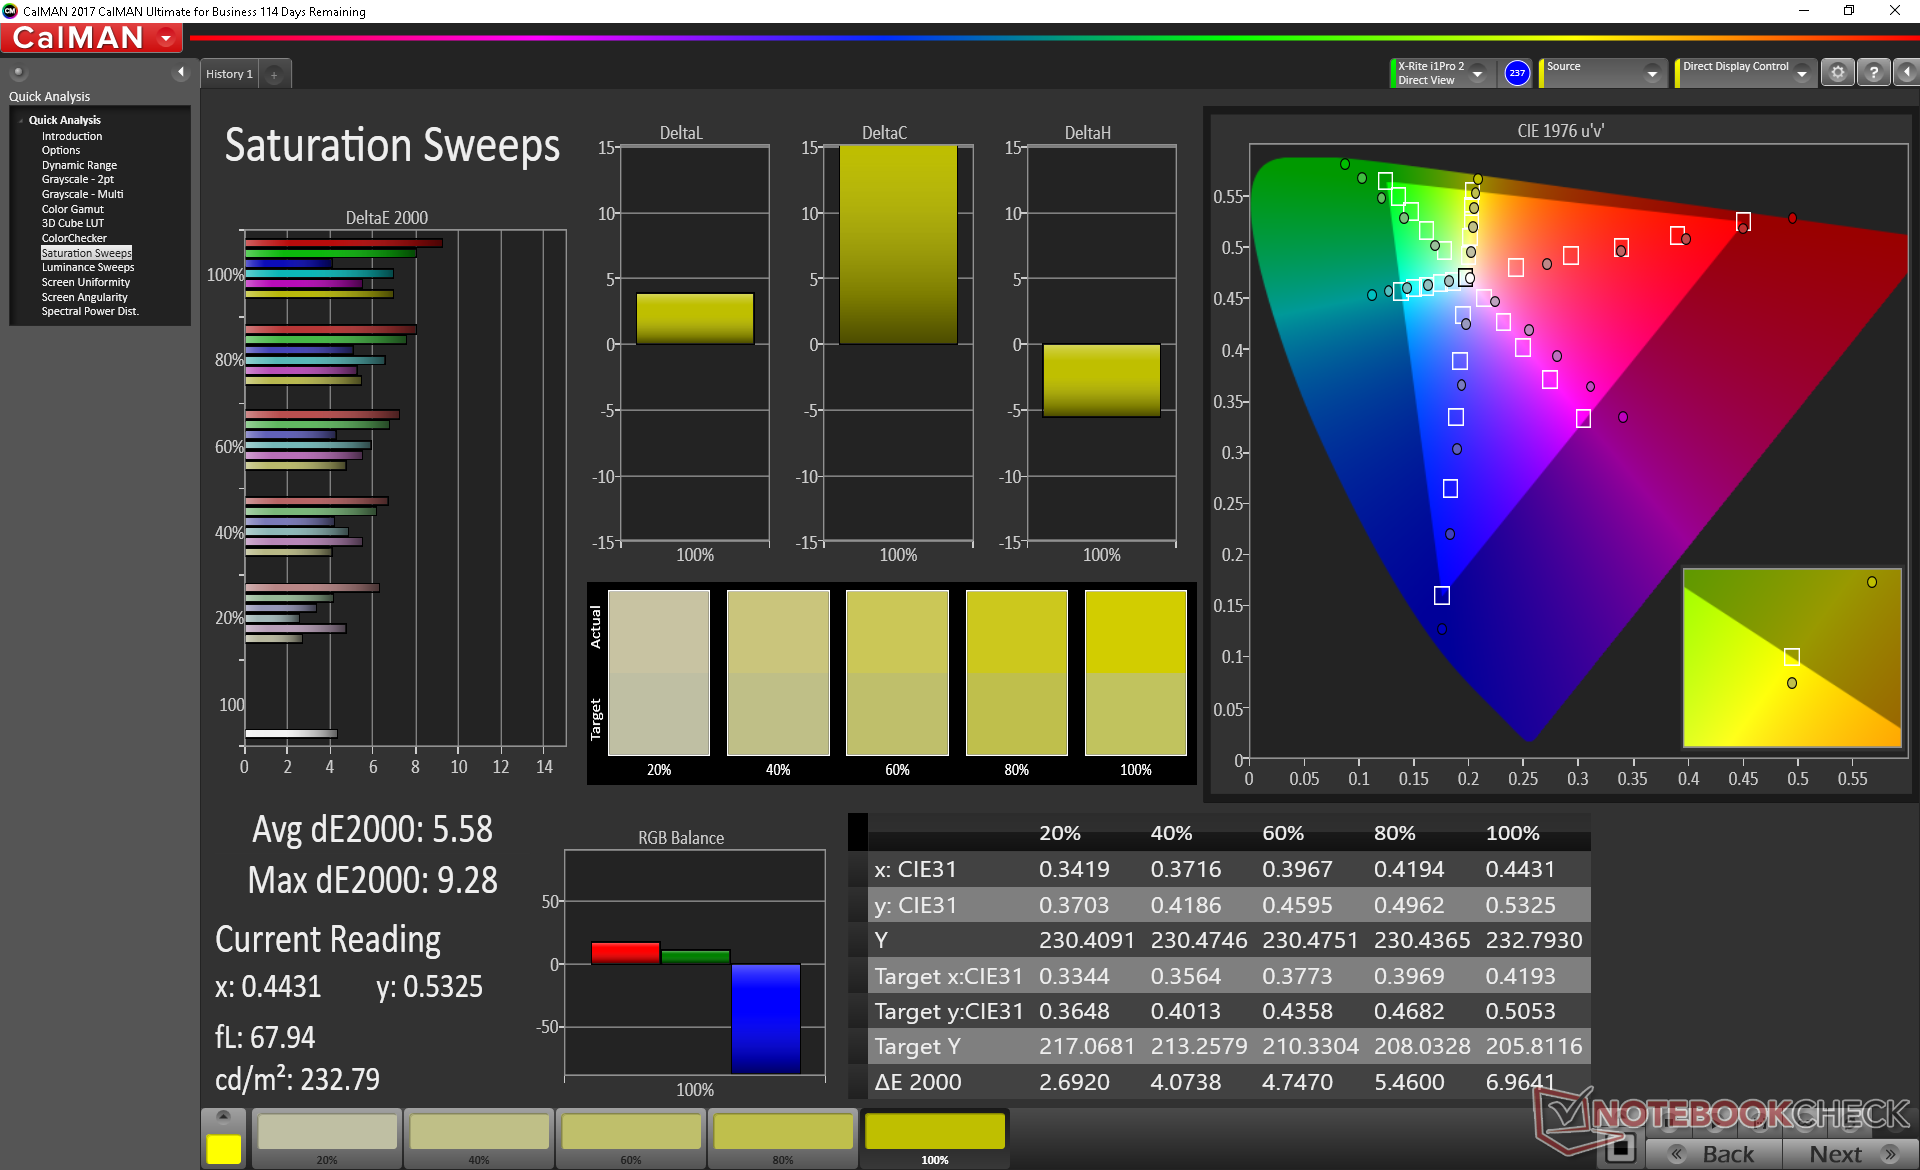
X-Rite colorimeter measurements show color temperature to be slightly warmer than expected. Thus, deltaE of colors and grayscale will trend higher when at higher saturation levels. An end-user calibration would address this, but it's not necessary for most users.
Display Response Times
| ↔ Response Time Black to White | ||
|---|---|---|
| 2.4 ms ... rise ↗ and fall ↘ combined | ↗ 1.1 ms rise | 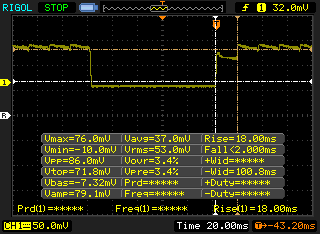 |
| ↘ 1.3 ms fall | ||
| The screen shows very fast response rates in our tests and should be very well suited for fast-paced gaming. In comparison, all tested devices range from 0.1 (minimum) to 240 (maximum) ms. » 13 % of all devices are better. This means that the measured response time is better than the average of all tested devices (19.8 ms). | ||
| ↔ Response Time 50% Grey to 80% Grey | ||
| 2.3 ms ... rise ↗ and fall ↘ combined | ↗ 1.1 ms rise | 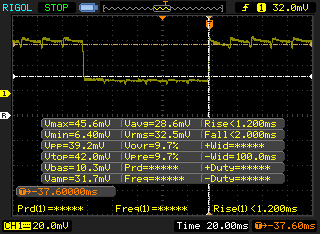 |
| ↘ 1.2 ms fall | ||
| The screen shows very fast response rates in our tests and should be very well suited for fast-paced gaming. In comparison, all tested devices range from 0.165 (minimum) to 636 (maximum) ms. » 11 % of all devices are better. This means that the measured response time is better than the average of all tested devices (31 ms). | ||
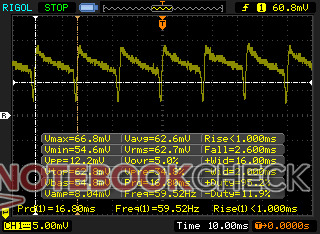
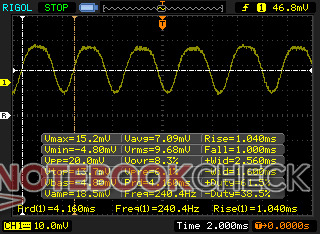
Screen Flickering / PWM (Pulse-Width Modulation)
| Screen flickering / PWM detected | 59.5 Hz | ≤ 100 % brightness setting | 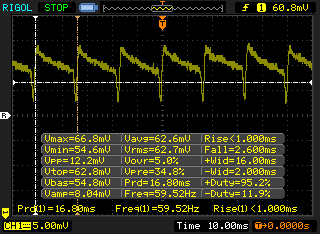 |
The display backlight flickers at 59.5 Hz (worst case, e.g., utilizing PWM) Flickering detected at a brightness setting of 100 % and below. There should be no flickering or PWM above this brightness setting. The frequency of 59.5 Hz is very low, so the flickering may cause eyestrain and headaches after extended use. In comparison: 52 % of all tested devices do not use PWM to dim the display. If PWM was detected, an average of 7757 (minimum: 5 - maximum: 343500) Hz was measured. | |||
After checking out a handful of OLED laptops, we've noticed that they all exhibit unique PWM behaviors not found on standard IPS laptops and the XPS 15 OLED is no different. Our results below show a pulse-width modulation frequency of 59.52 Hz even when at the maximum brightness setting. This frequency changes to 240.4 Hz when the brightness is set to 51 percent or lower not unlike what we discovered on the Razer Blade 15 OLED. Unless if your eyes are super-sensitive to onscreen flickering, however, then you're likely not going to notice.
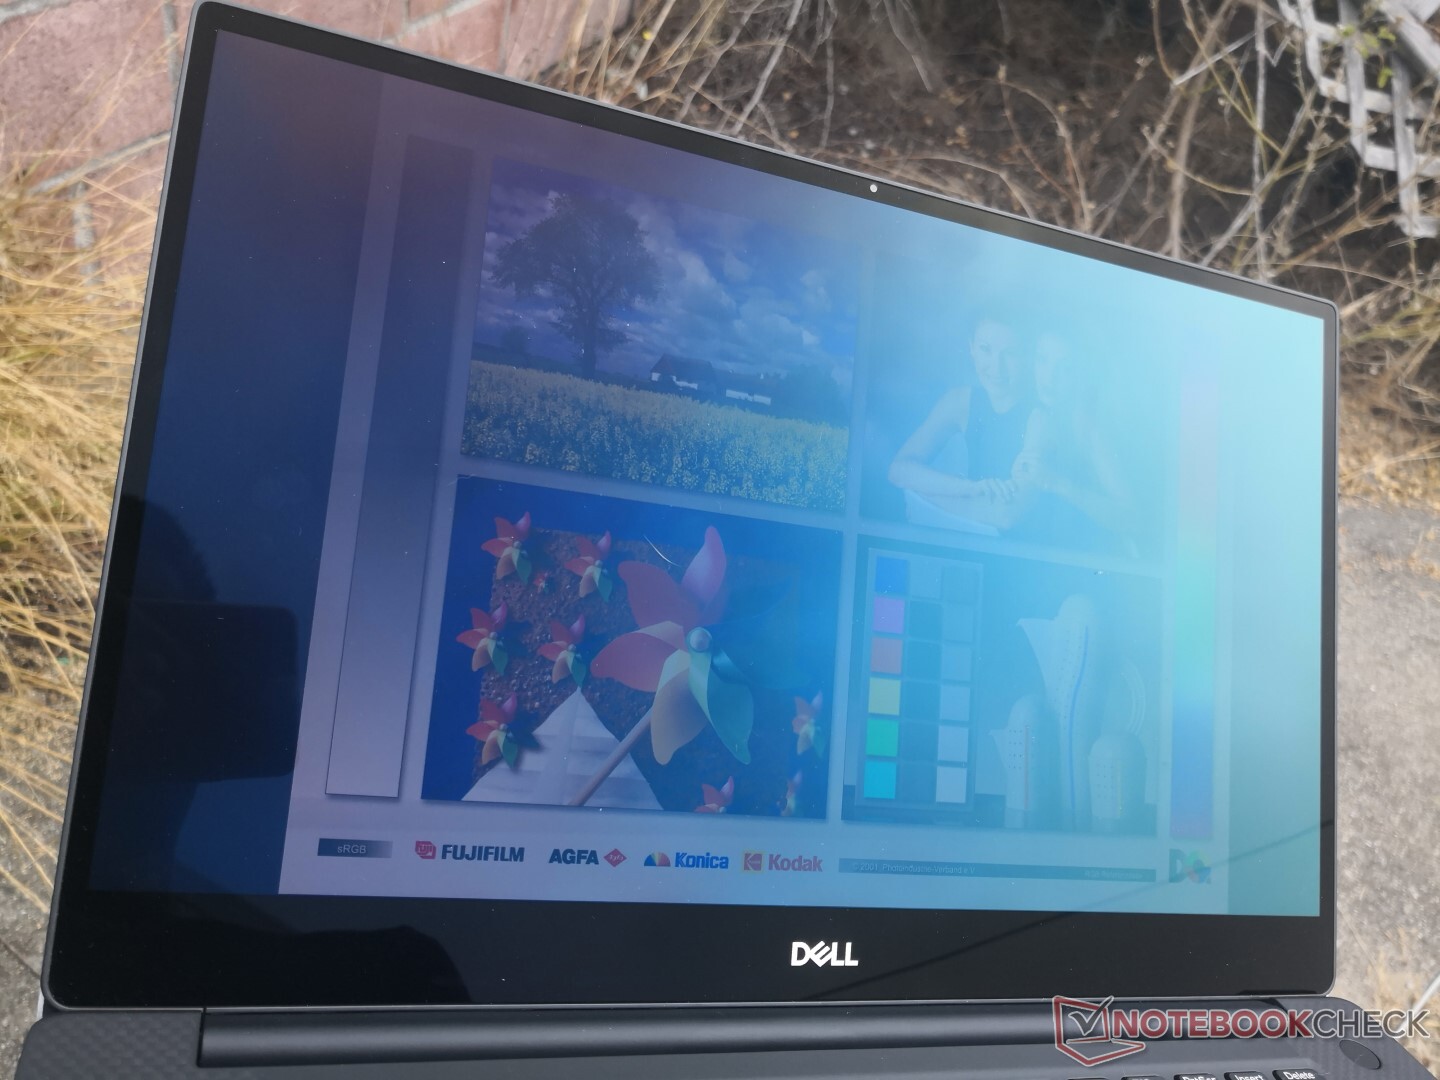
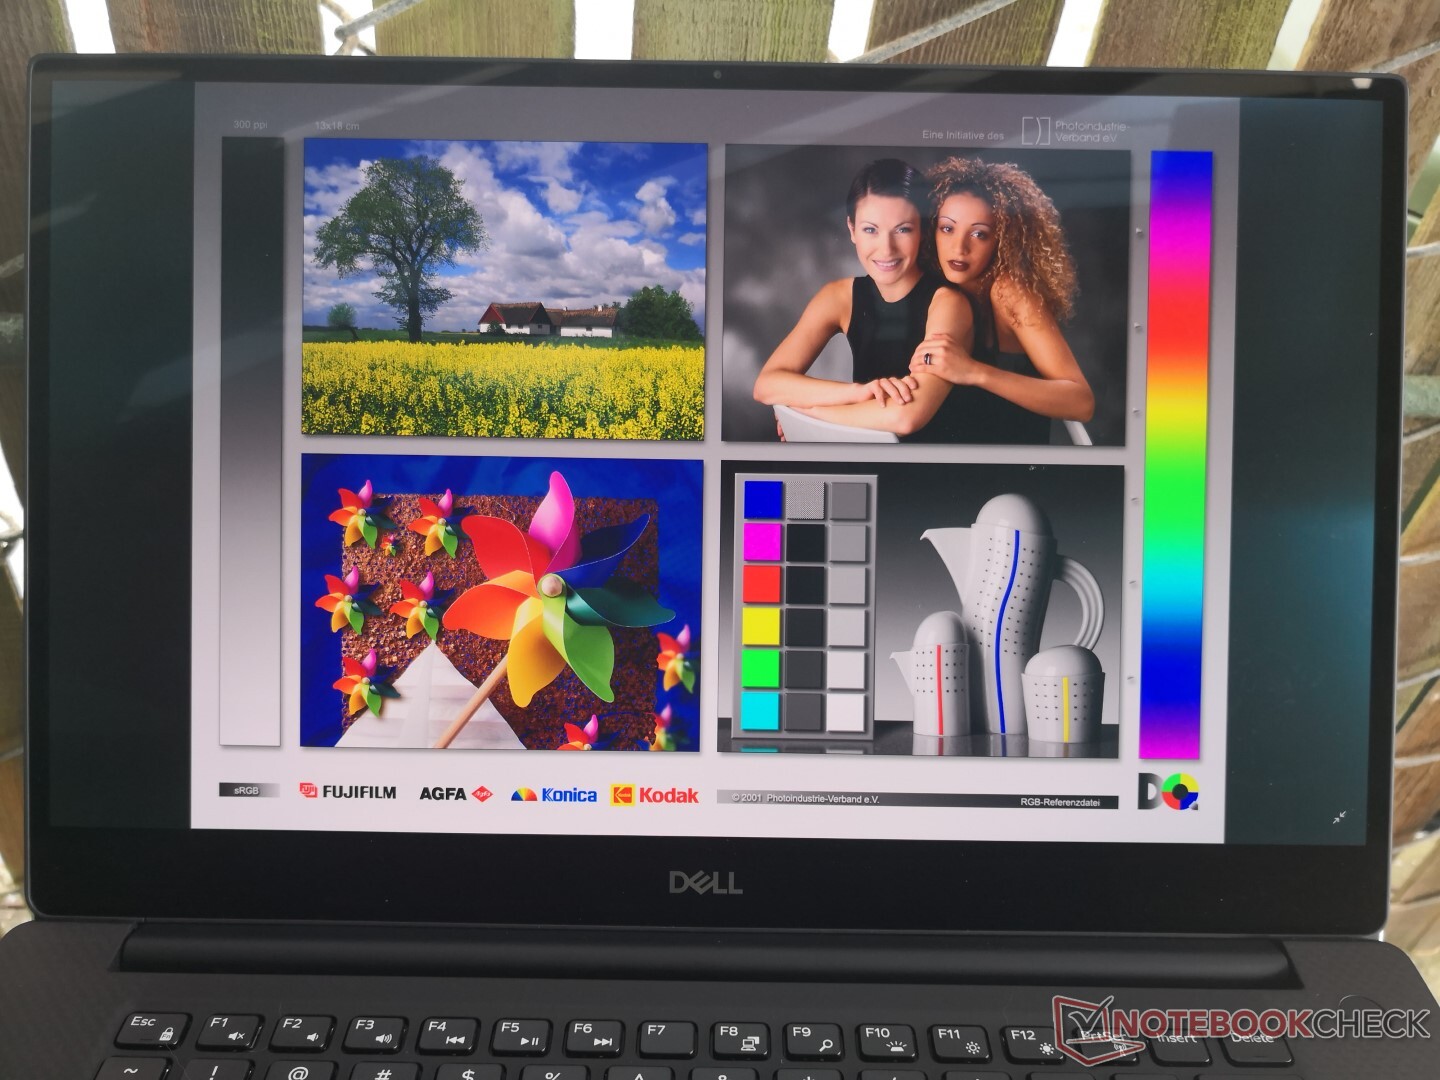
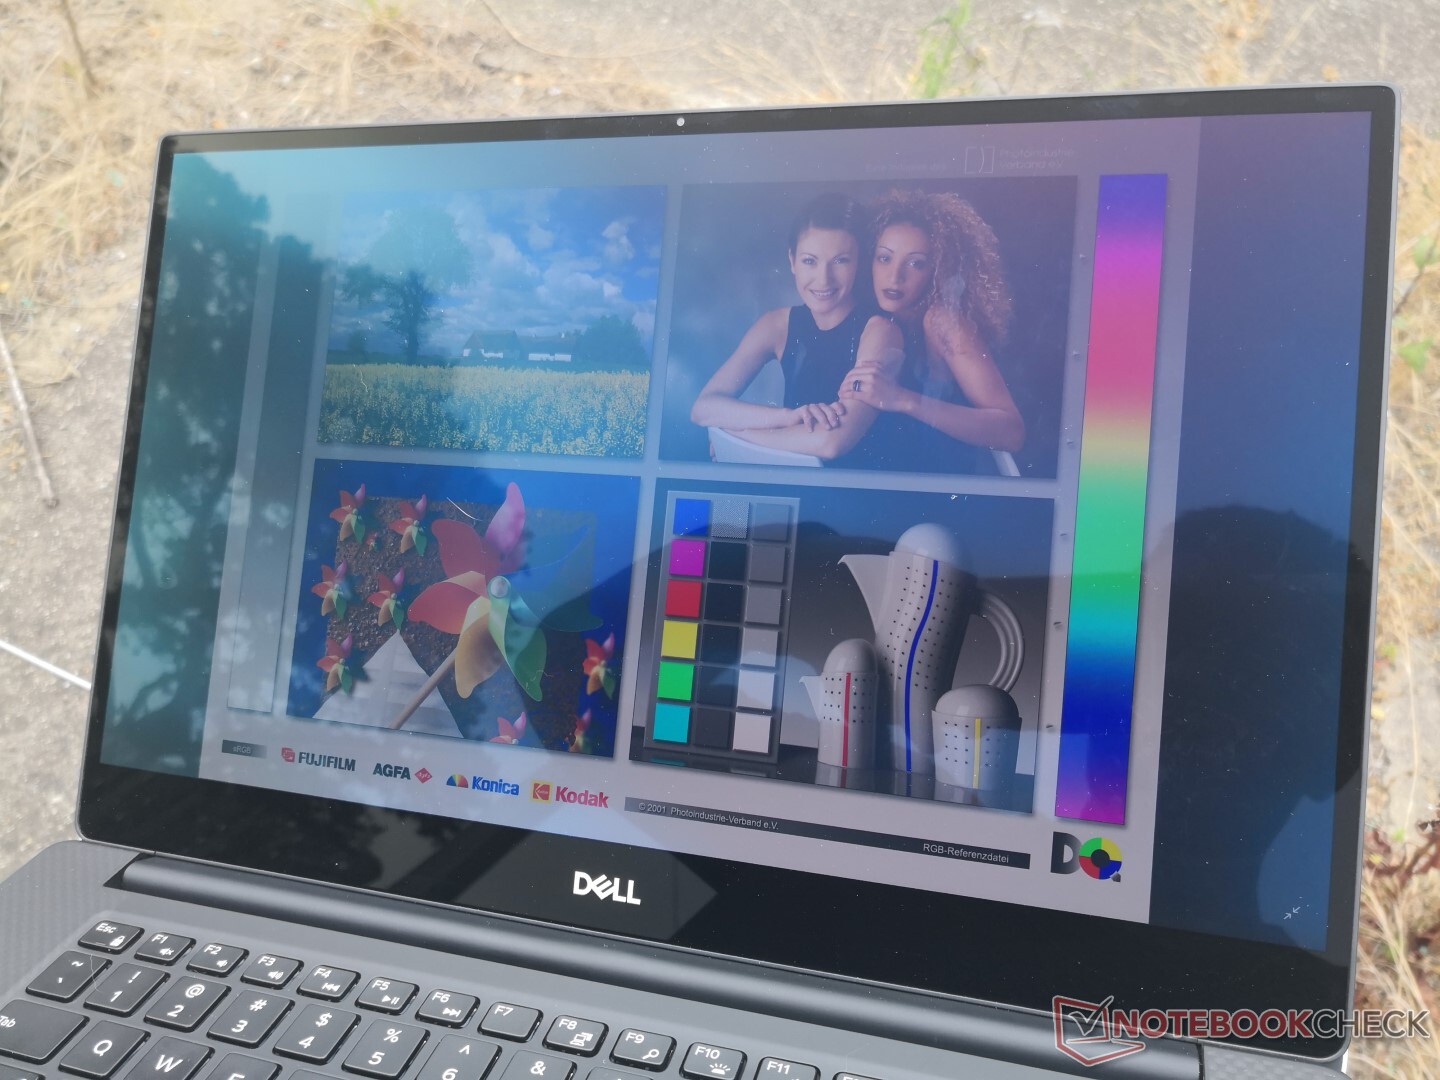
Outdoor visibility seems better than a typical IPS panel. The bright backlight and very high contrast of OLED help to alleviate washed out colors and text when outside. Viewing from slight angles will introduce a blue hue to impact visibility and colors that would otherwise not occur on an IPS display. This will impact the viewing experience of peripheral users if sharing the laptop outdoors.
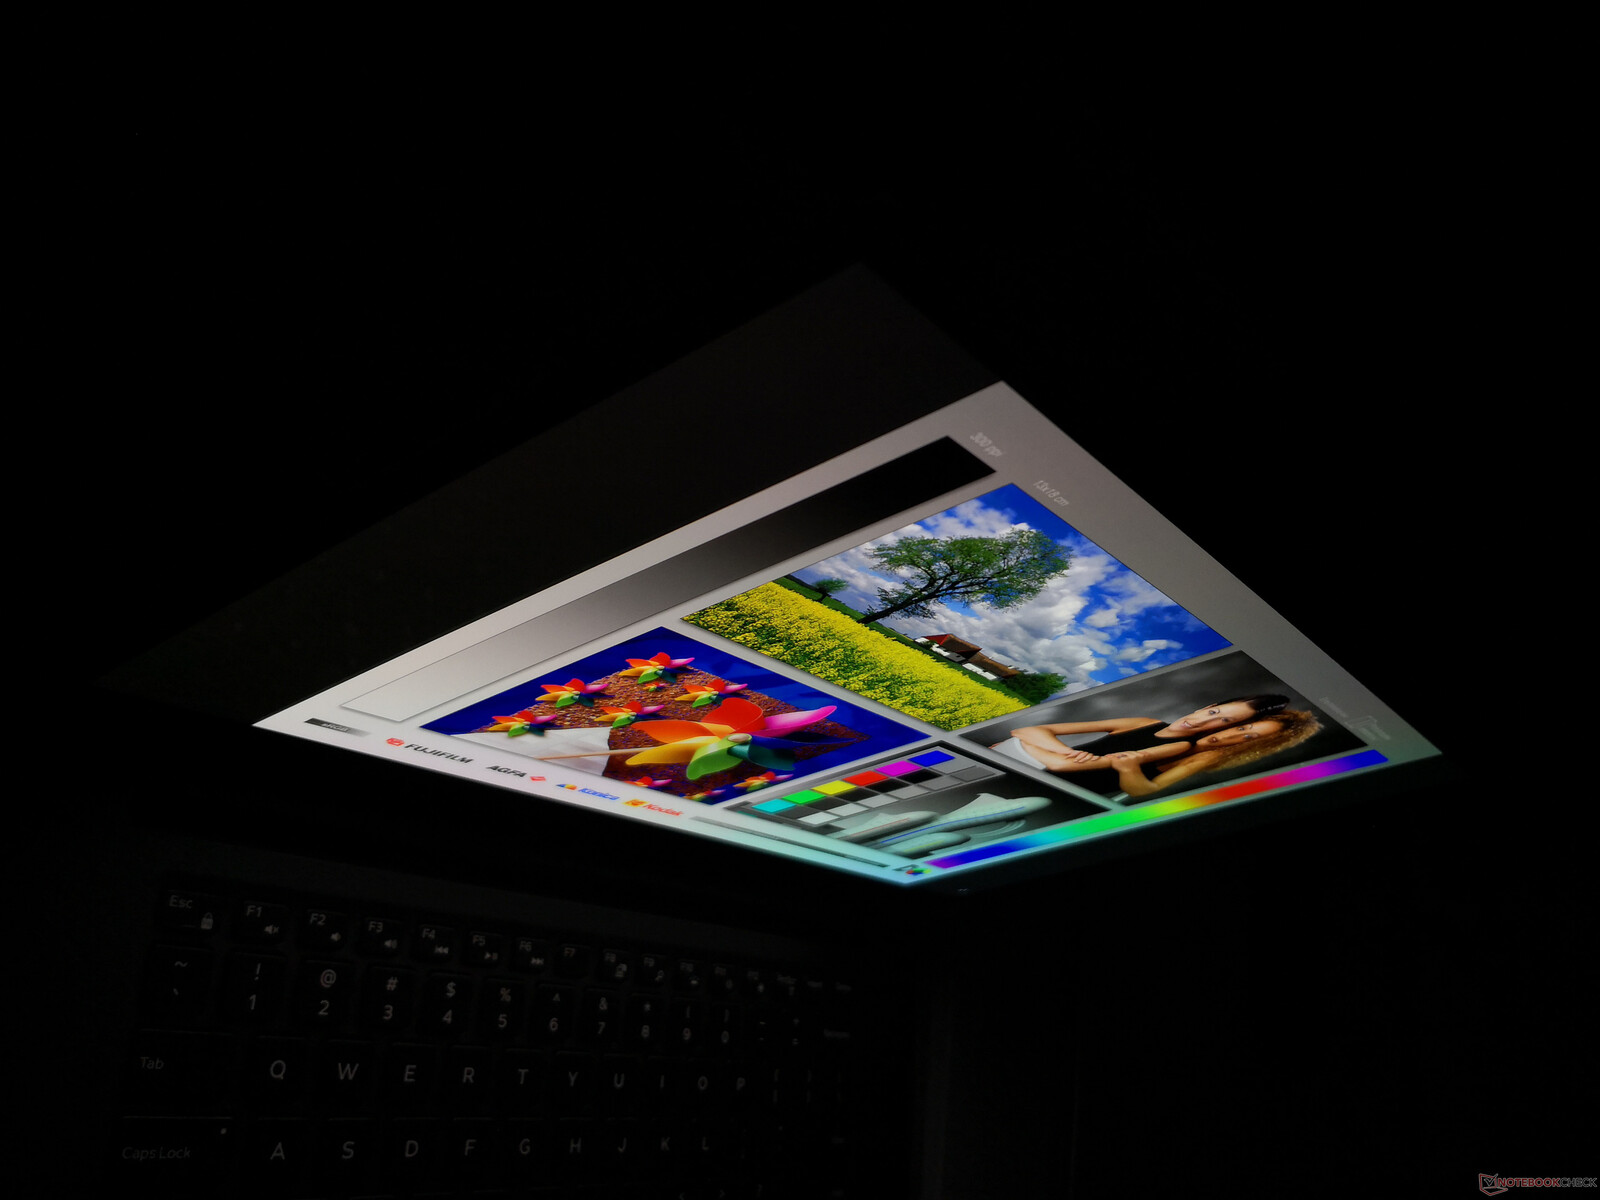
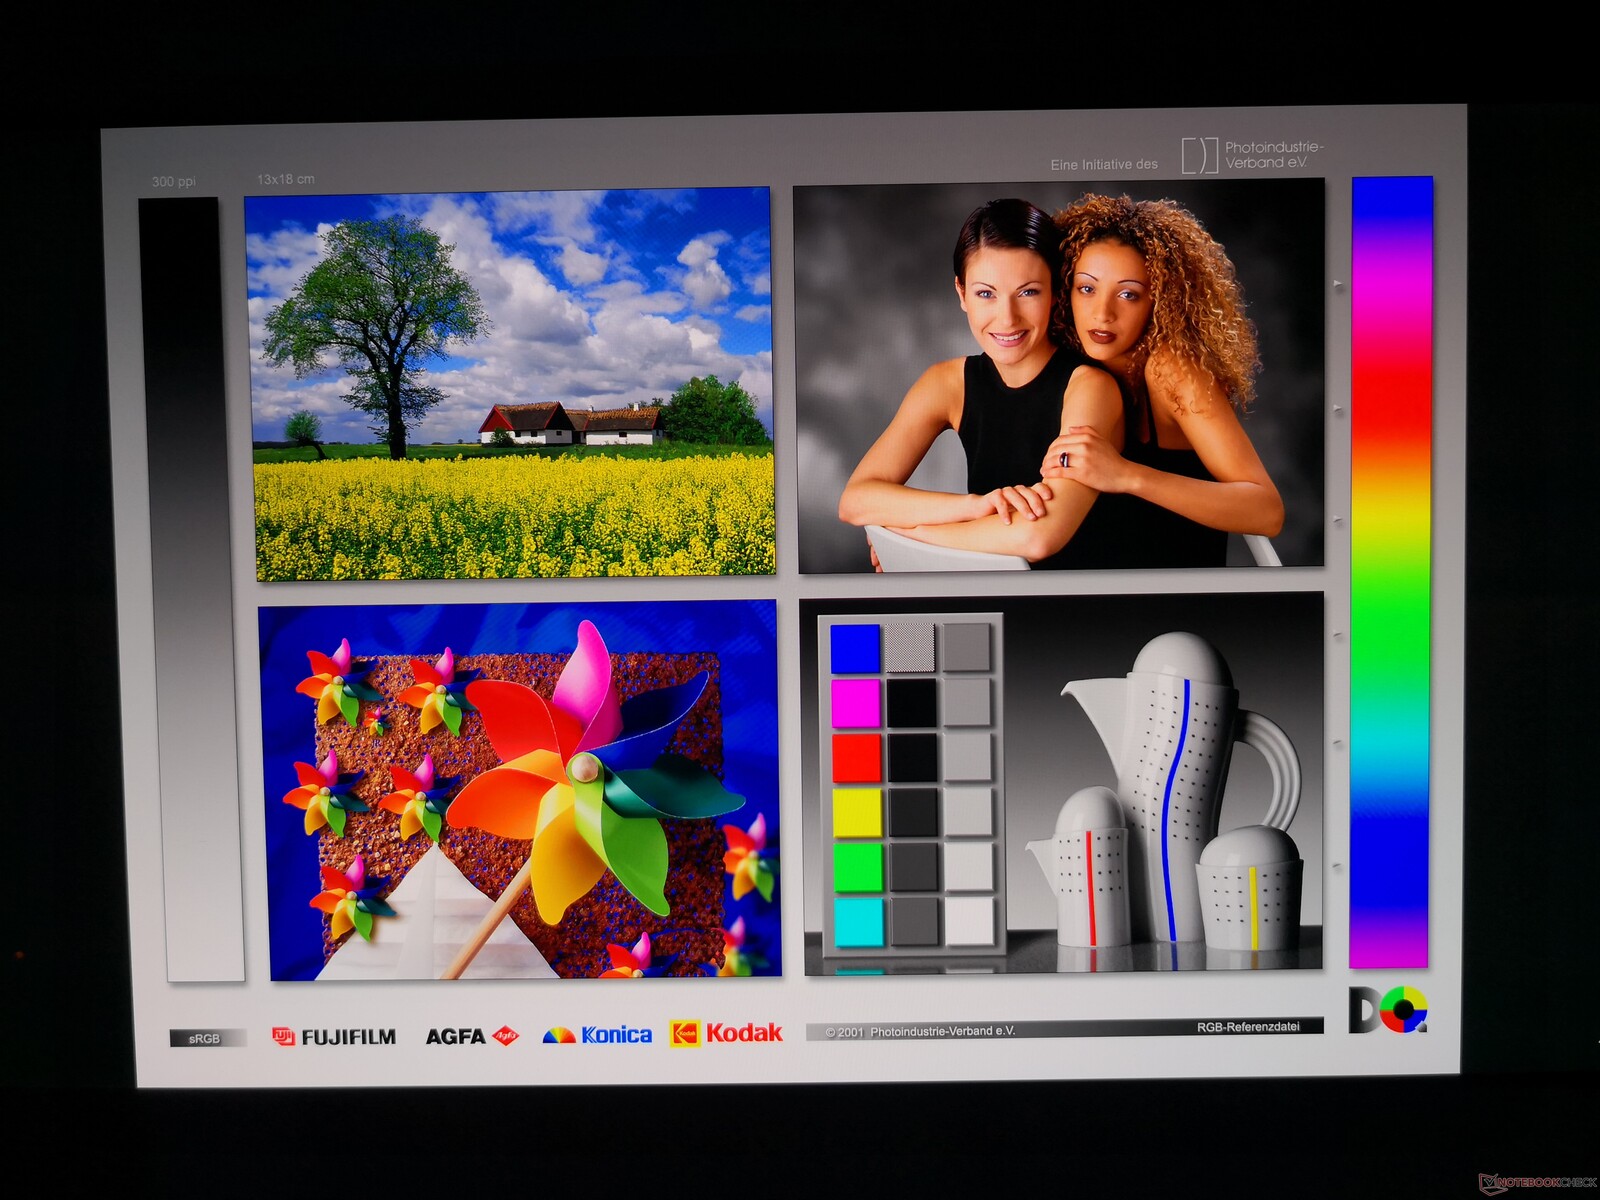
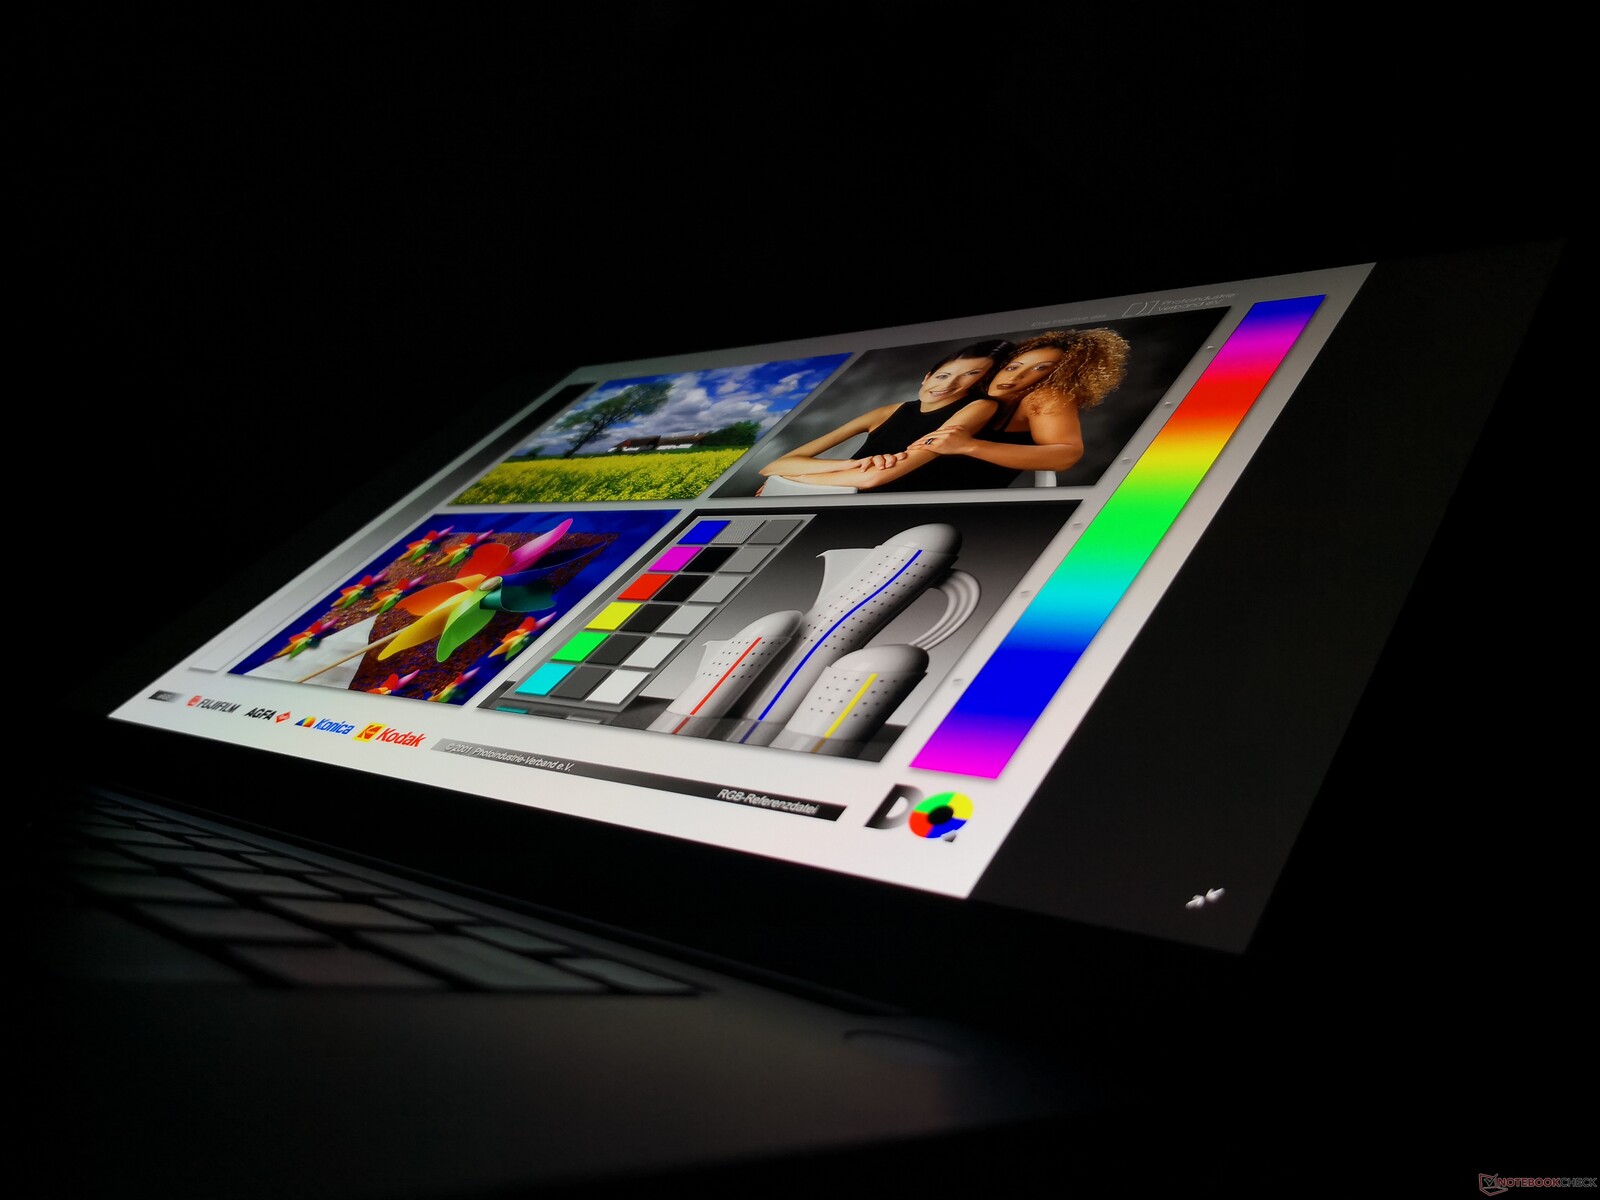
Viewing angles are better than IPS in that contrast and grayscale remain almost the same from extreme angles whereas an IPS panel will have slight but noticeable shifting. Unique to OLED, however, is that extreme angles (~150 degrees or more) will introduce a rainbow banding effect that impacts colors as shown by a screenshot below. This thankfully does not occur when looking directly at the screen from a normal angle.
Performance
The XPS 15 series has always been about offering high performance Ultrabooks with Intel Core H-series CPUs and dedicated GPU options. However, Dell may be packing in *too* much performance for the higher-end SKUs as our results below will show. With that said, very few ultra-thin alternatives exist with the same unlocked Core i9 CPU and GTX 1650 graphics options as found on our specific configuration.
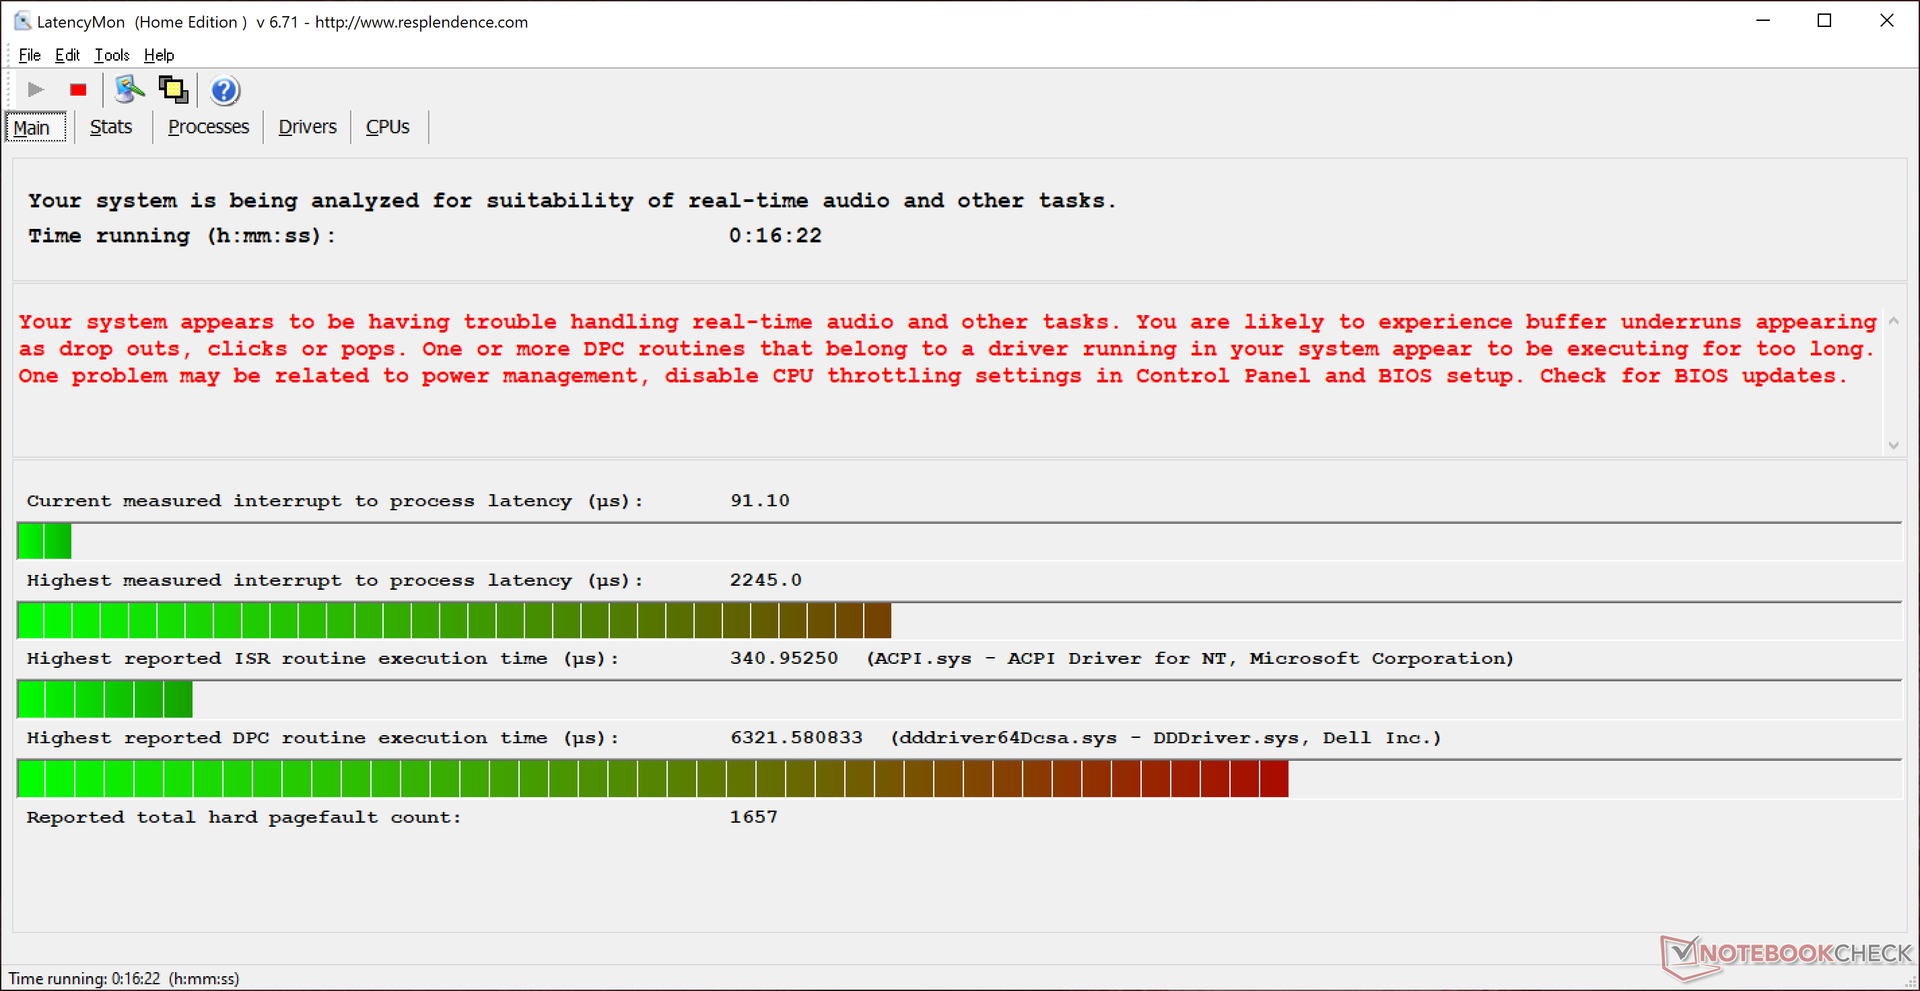
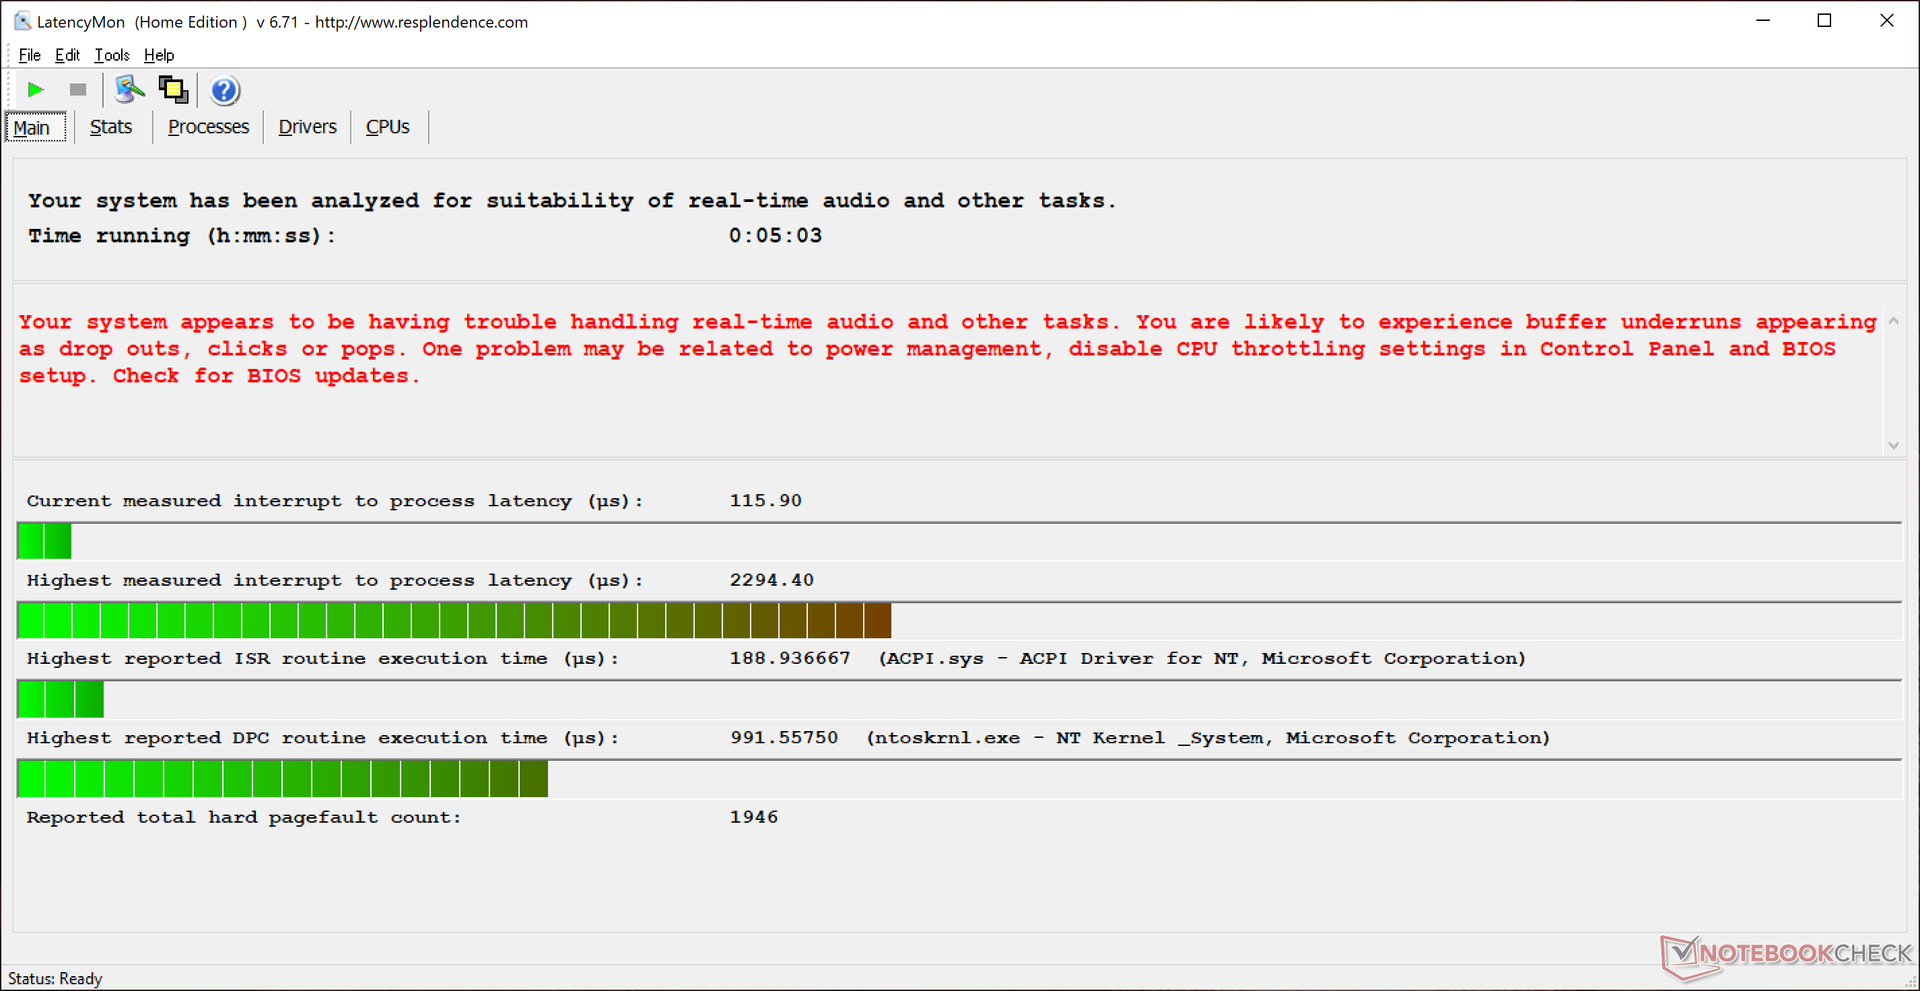
LatencyMon shows poor interrupt times yet again despite what Dell may have suggested in the past. The issue occurs more frequently when the wireless is enabled and so we recommend disabling the wireless if low latency is priority.
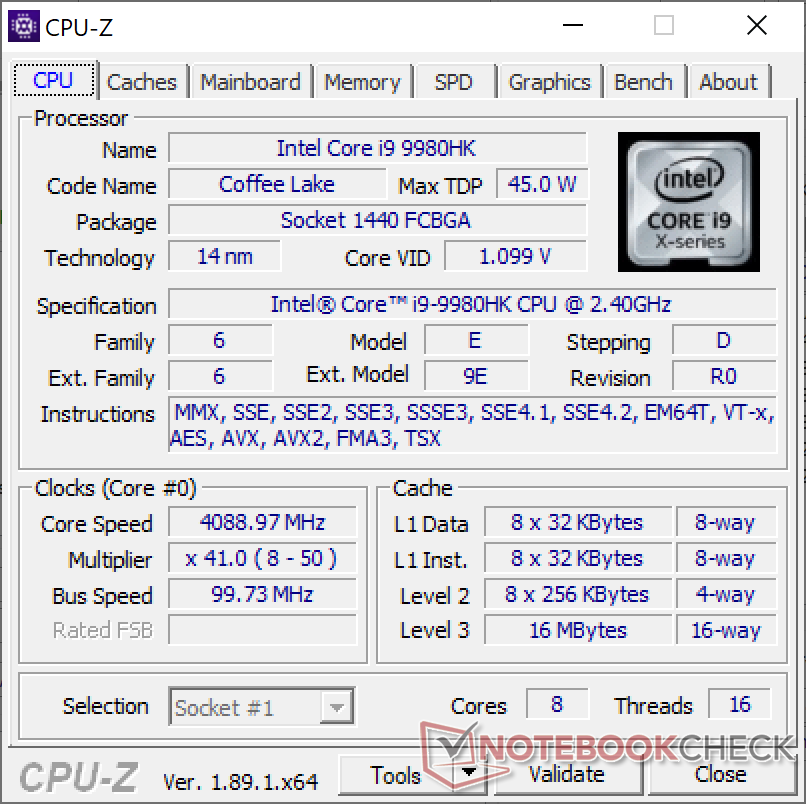

Processor
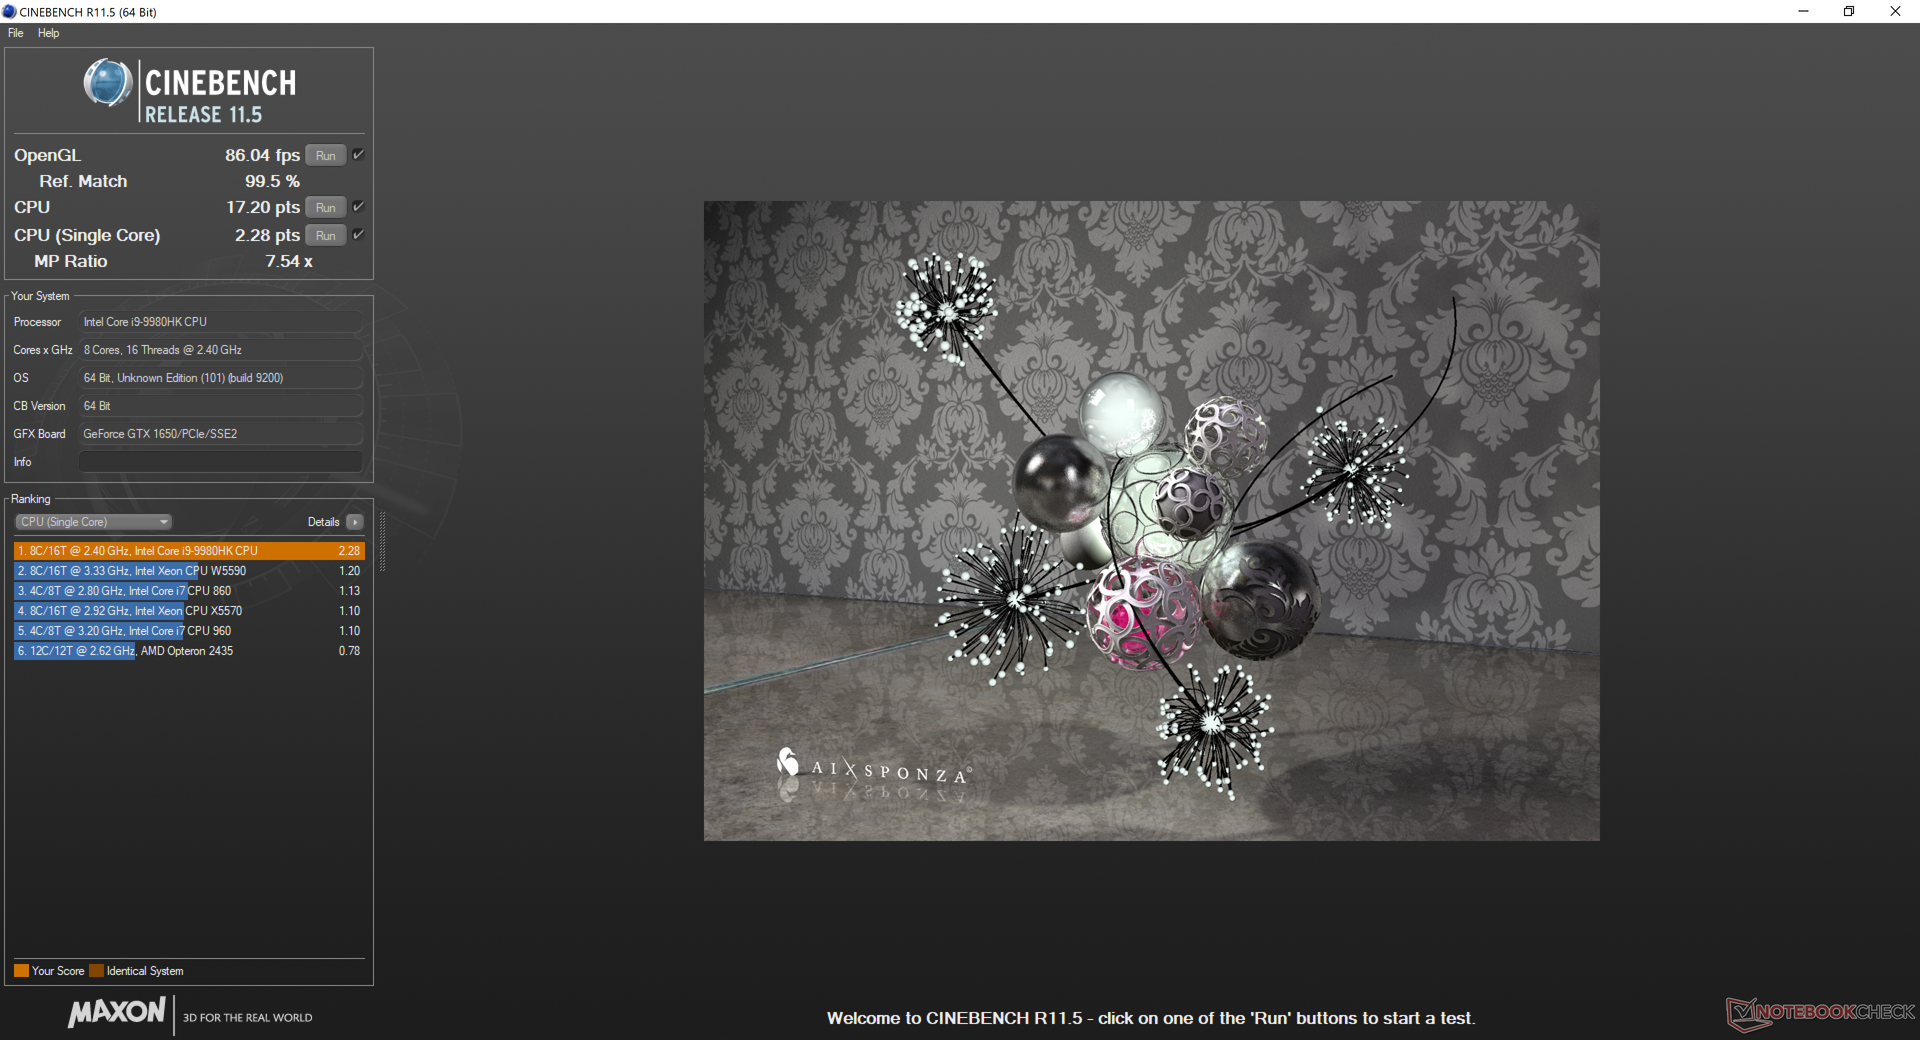
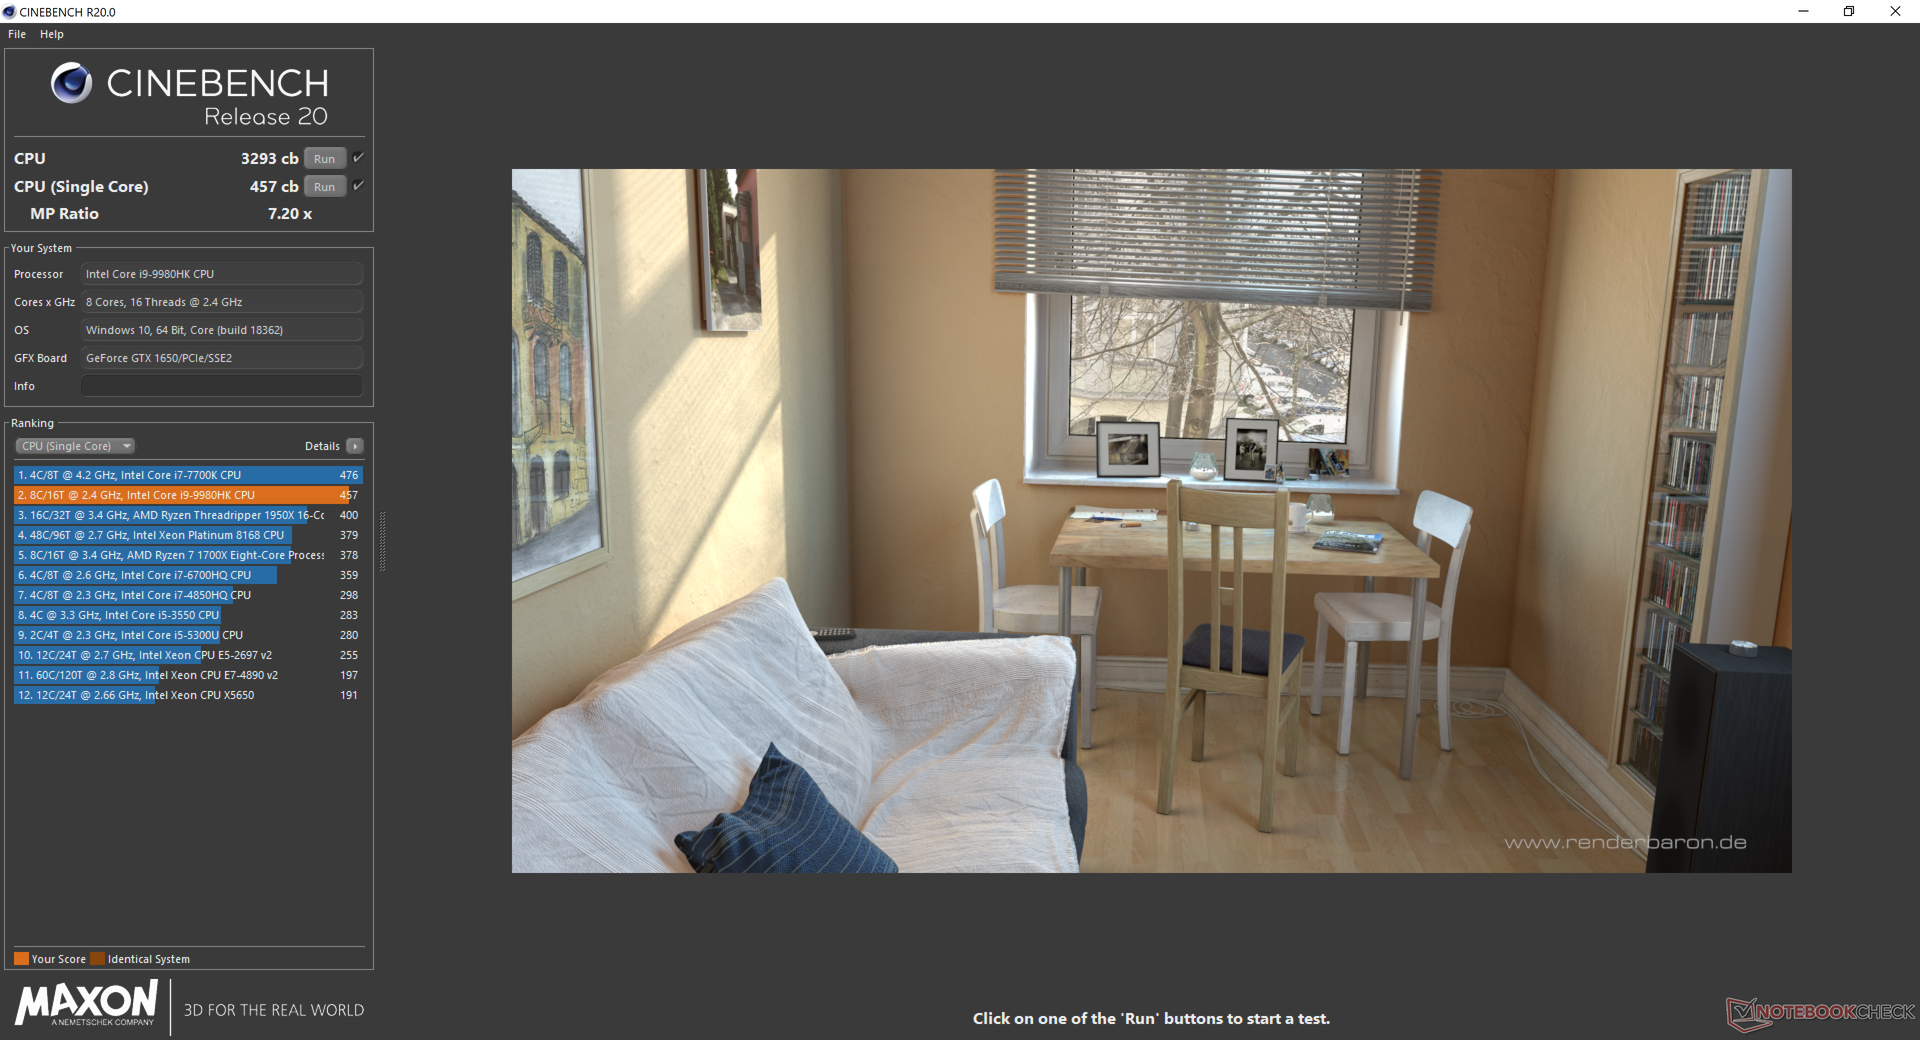
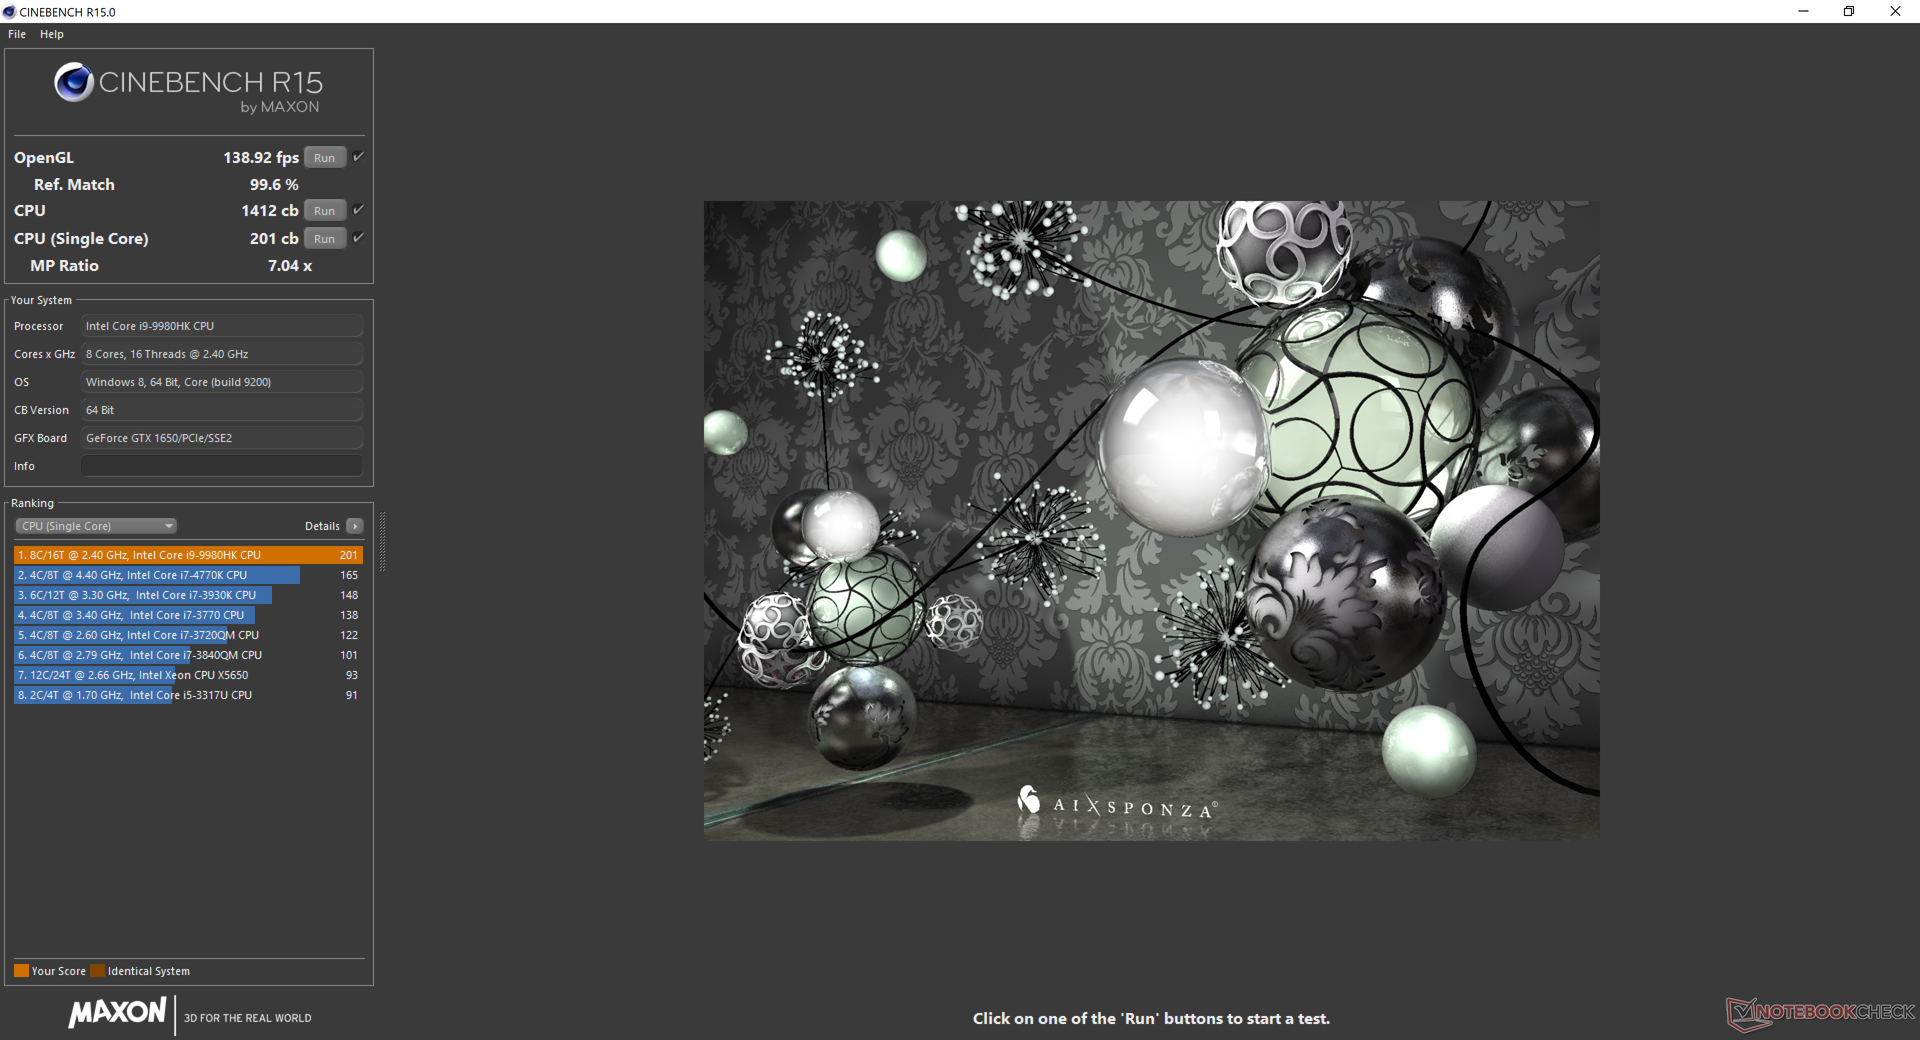
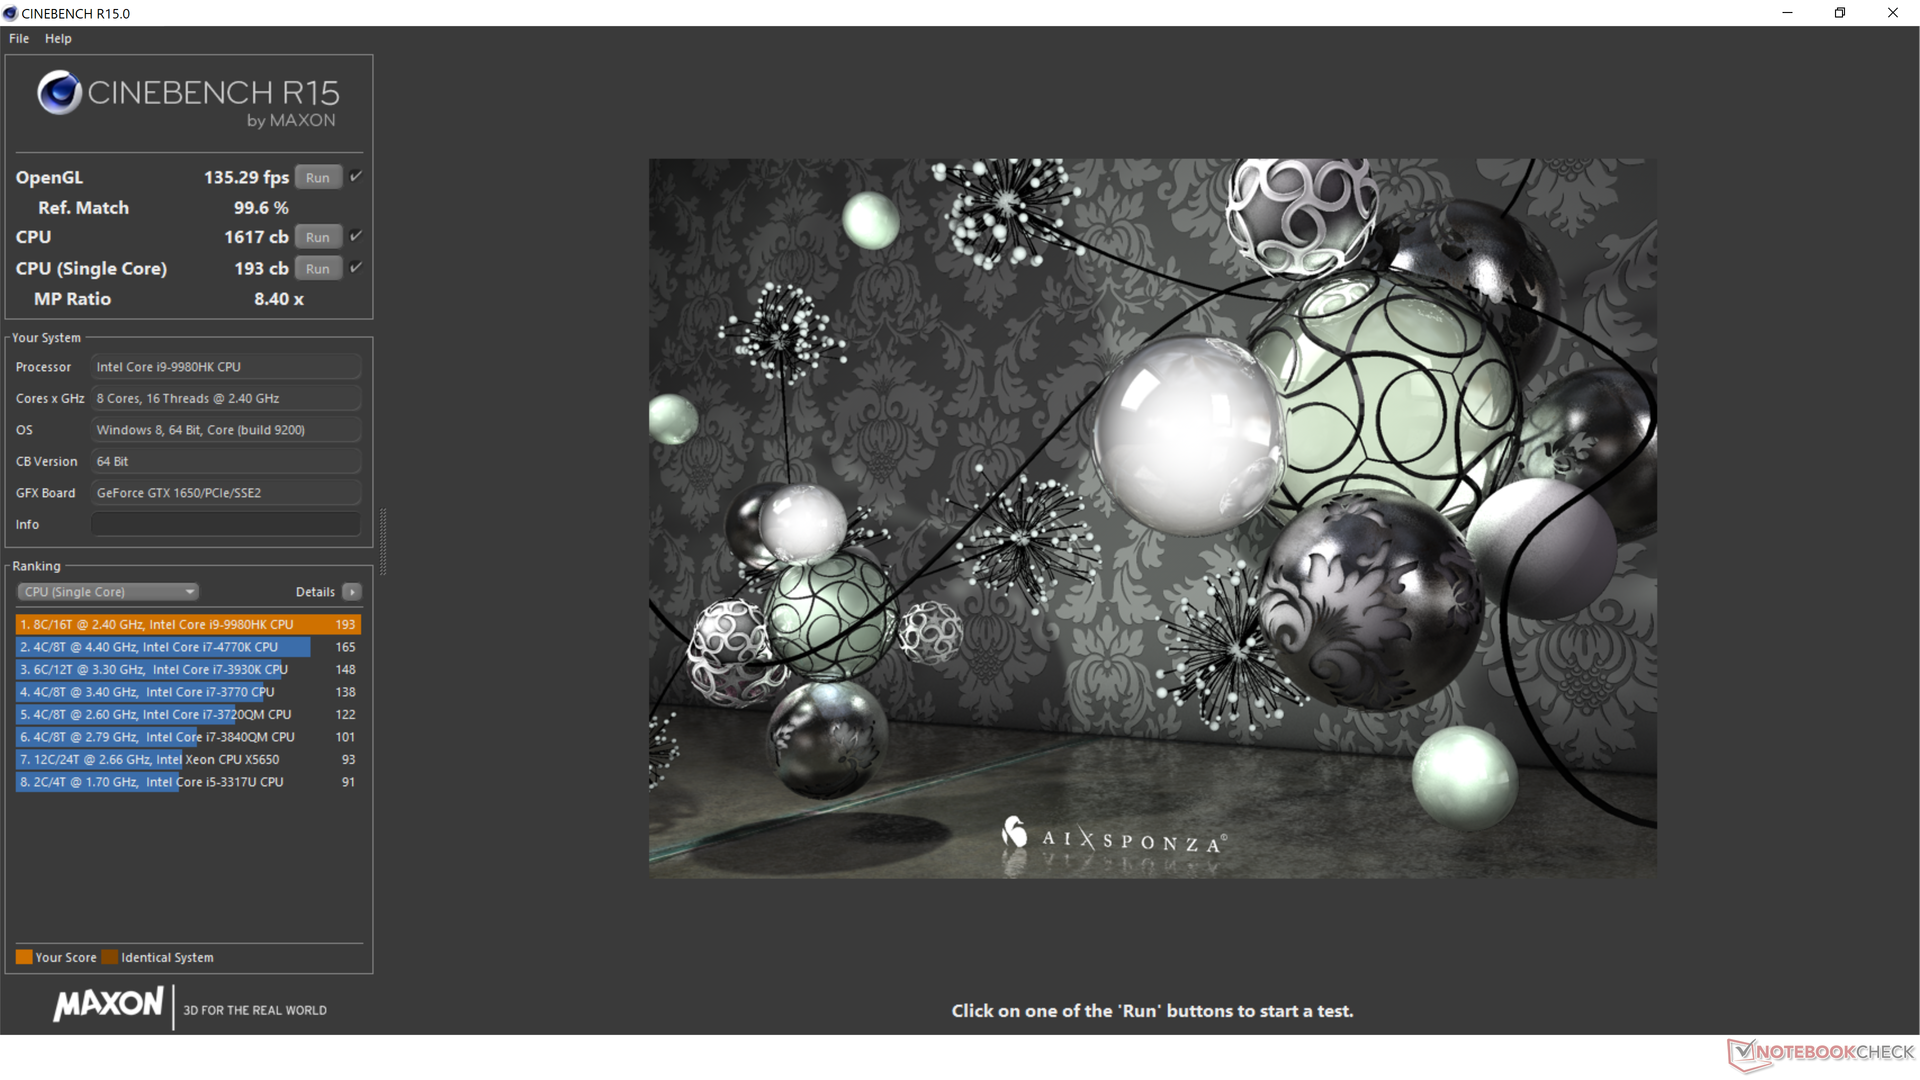
CPU performance is not very consistent. Scores will look excellent if you're only running benchmarks once and then call it a day, but weaknesses become apparent when running CPU heavy tasks for extended periods. As shown by our CineBench R15 Multi-Thread loop graph below, the Dell system is unable to maintain high Turbo Boost clock rates for very long at all with noticeable performance drops of about 15 percent to 20 percent almost immediately. After accounting for throttling, raw multi-thread performance is only about 15 percent faster than the older Core i9-8950HK in the XPS 15 9570. Our thicker Schenker gaming laptop equipped with the same unlocked i9-9980HK as our XPS 15 7590 is able to maintain higher Turbo Boost clock rates over time for roughly 12 percent faster performance.
The tendency for the Core i9 CPU in the XPS to throttle sooner also means that it is the slowest iteration of the i9-9980HK we've seen thus far. Results are about 15 percent slower than the average i9-9980HK in our database. If you want the best that the 9th gen Core i9 has to offer, then you would be better off with the much larger MSI GE75 or Schenker.
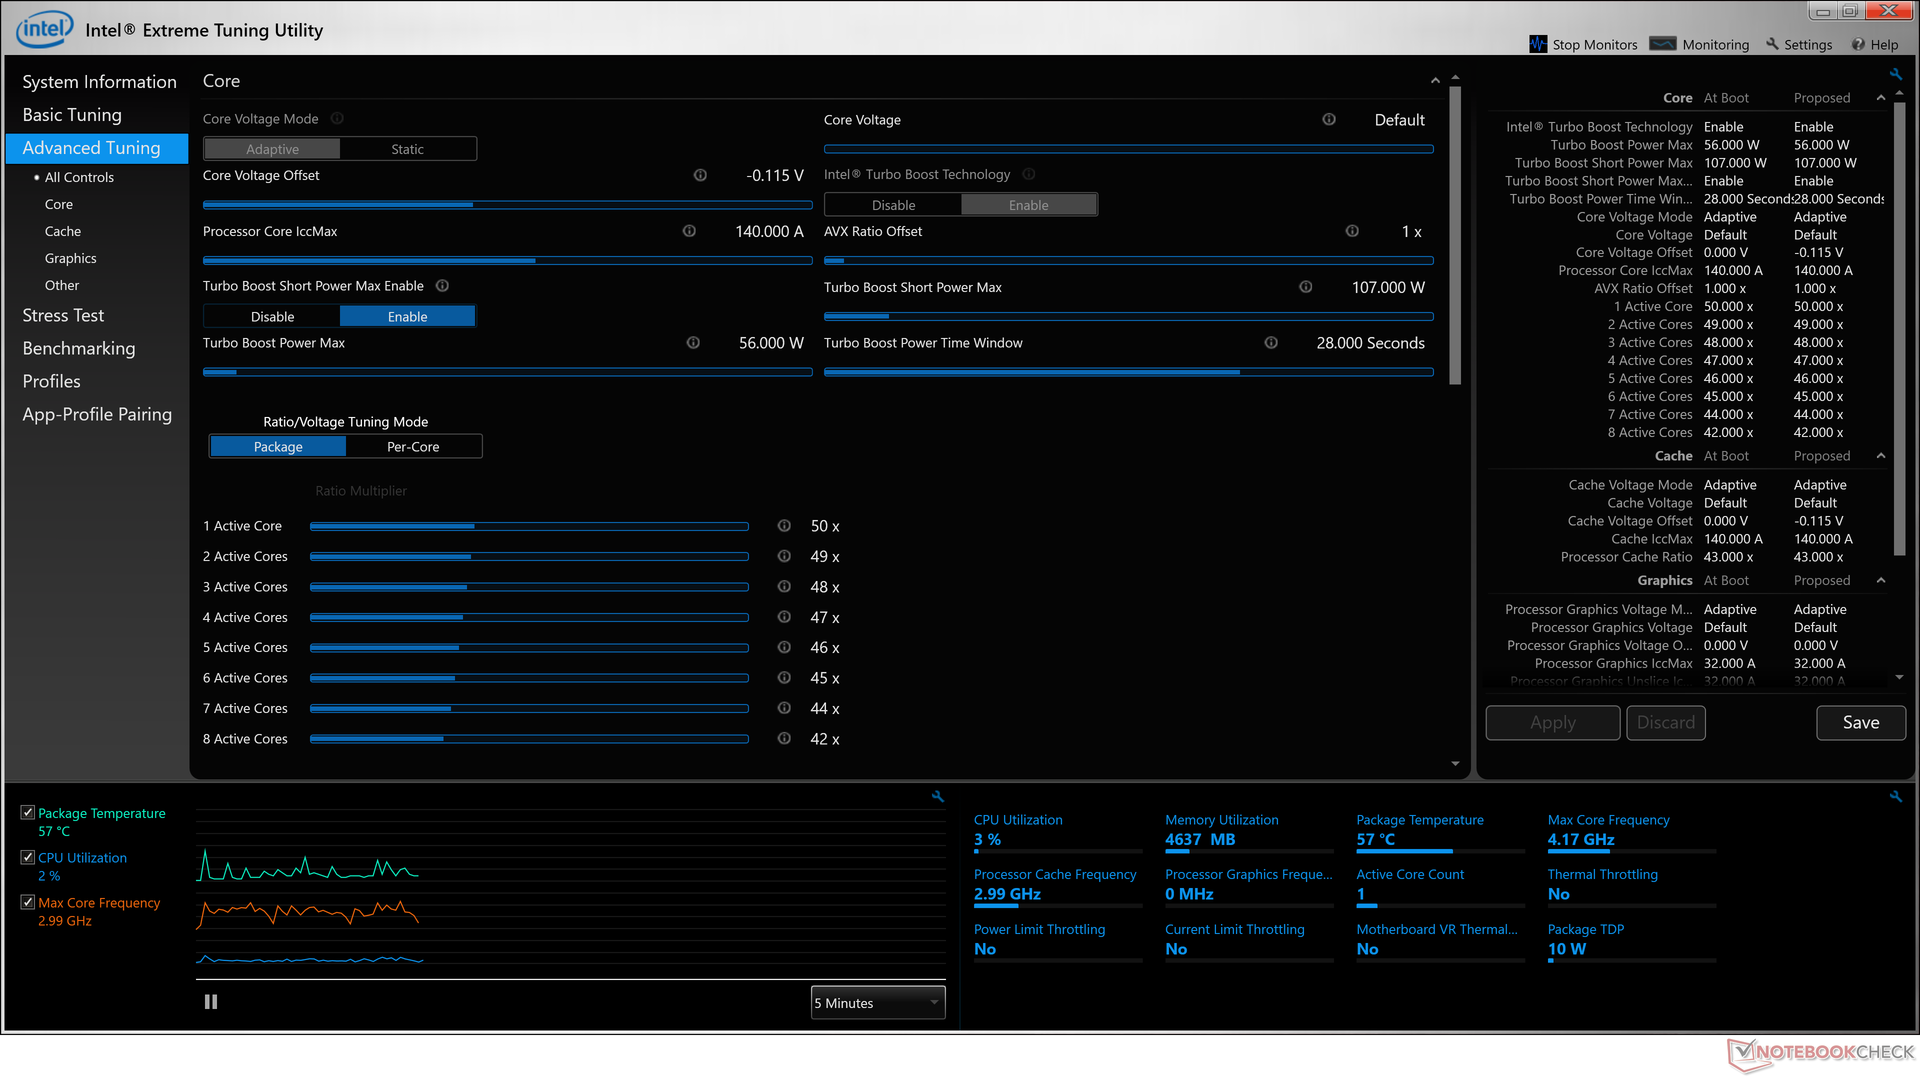
Undervolting by 0.115 V will produce better scores on average much like what we discovered on the last generation XPS 15 9570. We're able to record a stable performance boost of about 8 to 15 percent when undervolted. Pushing our luck even further to -0.125 V would result in a system crash.
Since the high Turbo Boost clock rate is so short-lived on the XPS 15, the Core i9 SKU will most benefit users who want that short burst of CPU power instead of performance sustainability.
See our dedicated page on the Core i9-9980HK for more technical information and benchmarks.
| wPrime 2.10 - 1024m | |
| Asus ROG Zephyrus G15 GA502DU | |
| Eurocom Sky X4C | |
| Average Intel Core i9-9980HK (110.4 - 120.2, n=2) | |
* ... smaller is better
System Performance
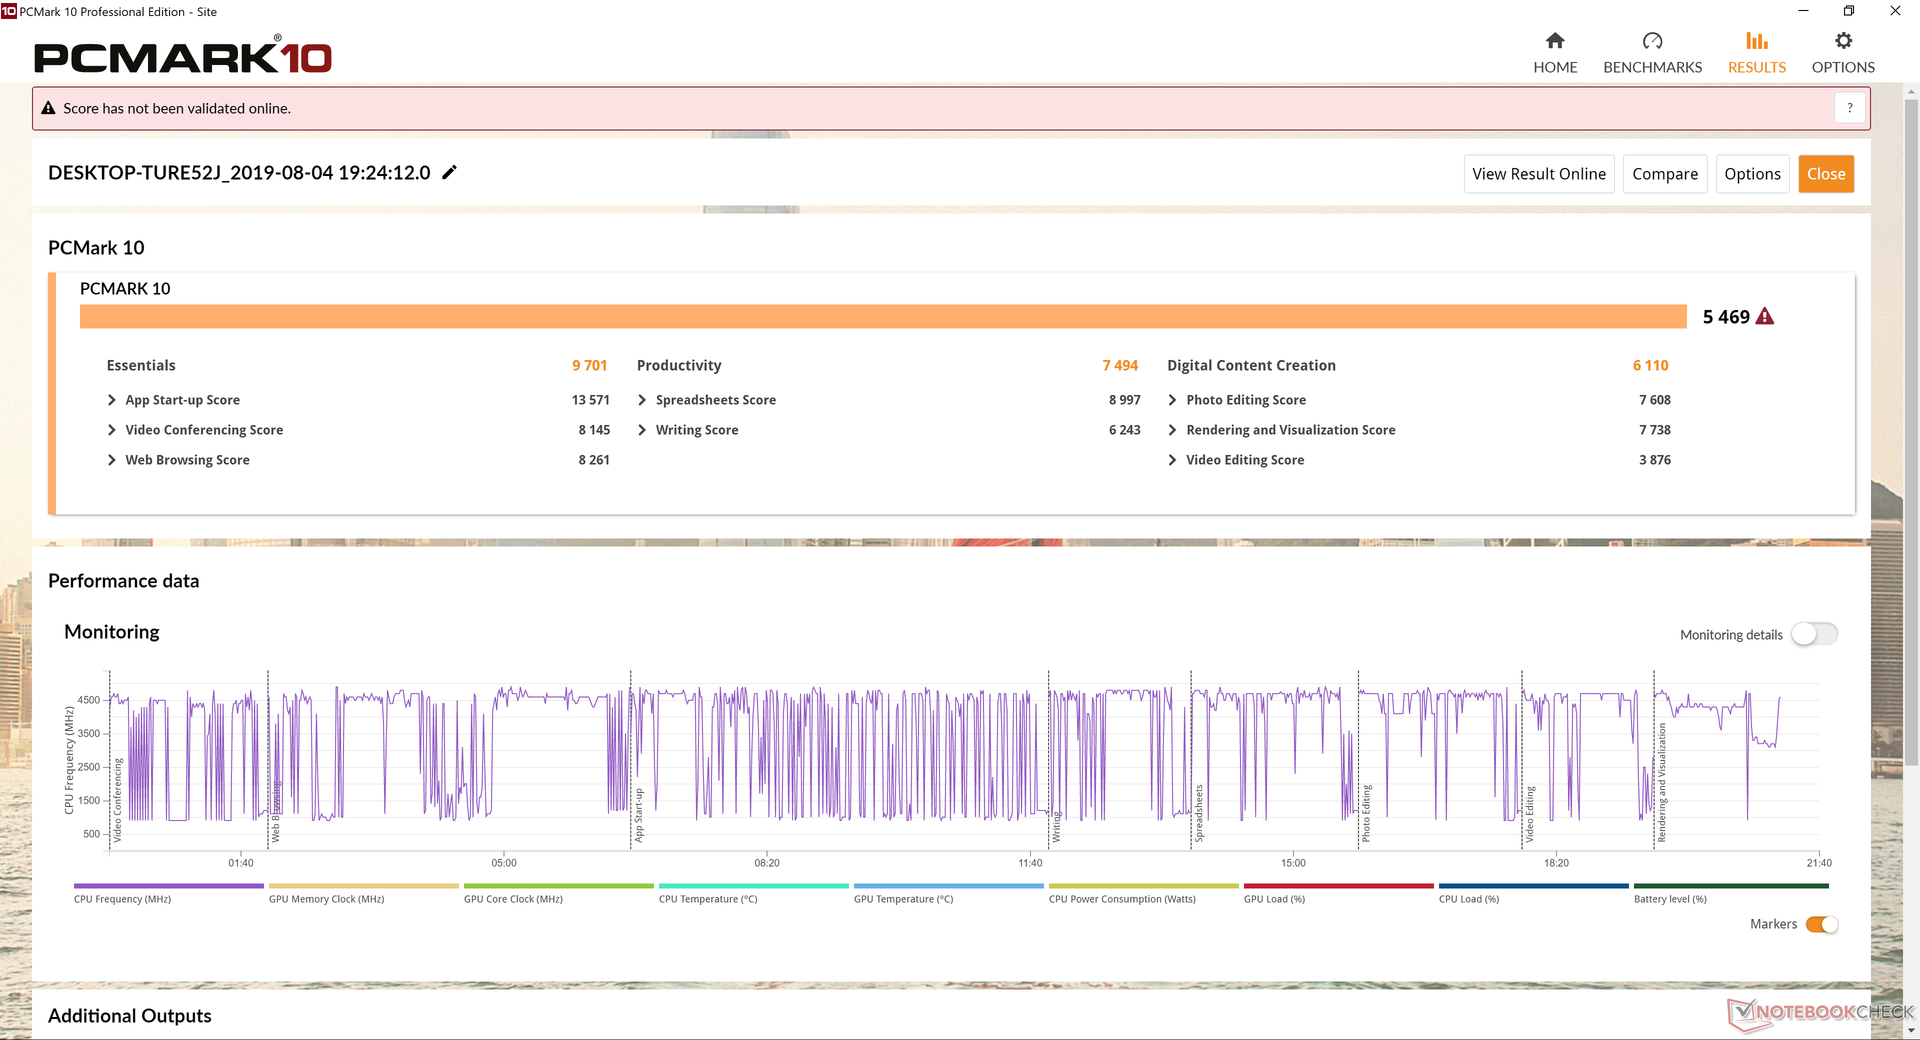
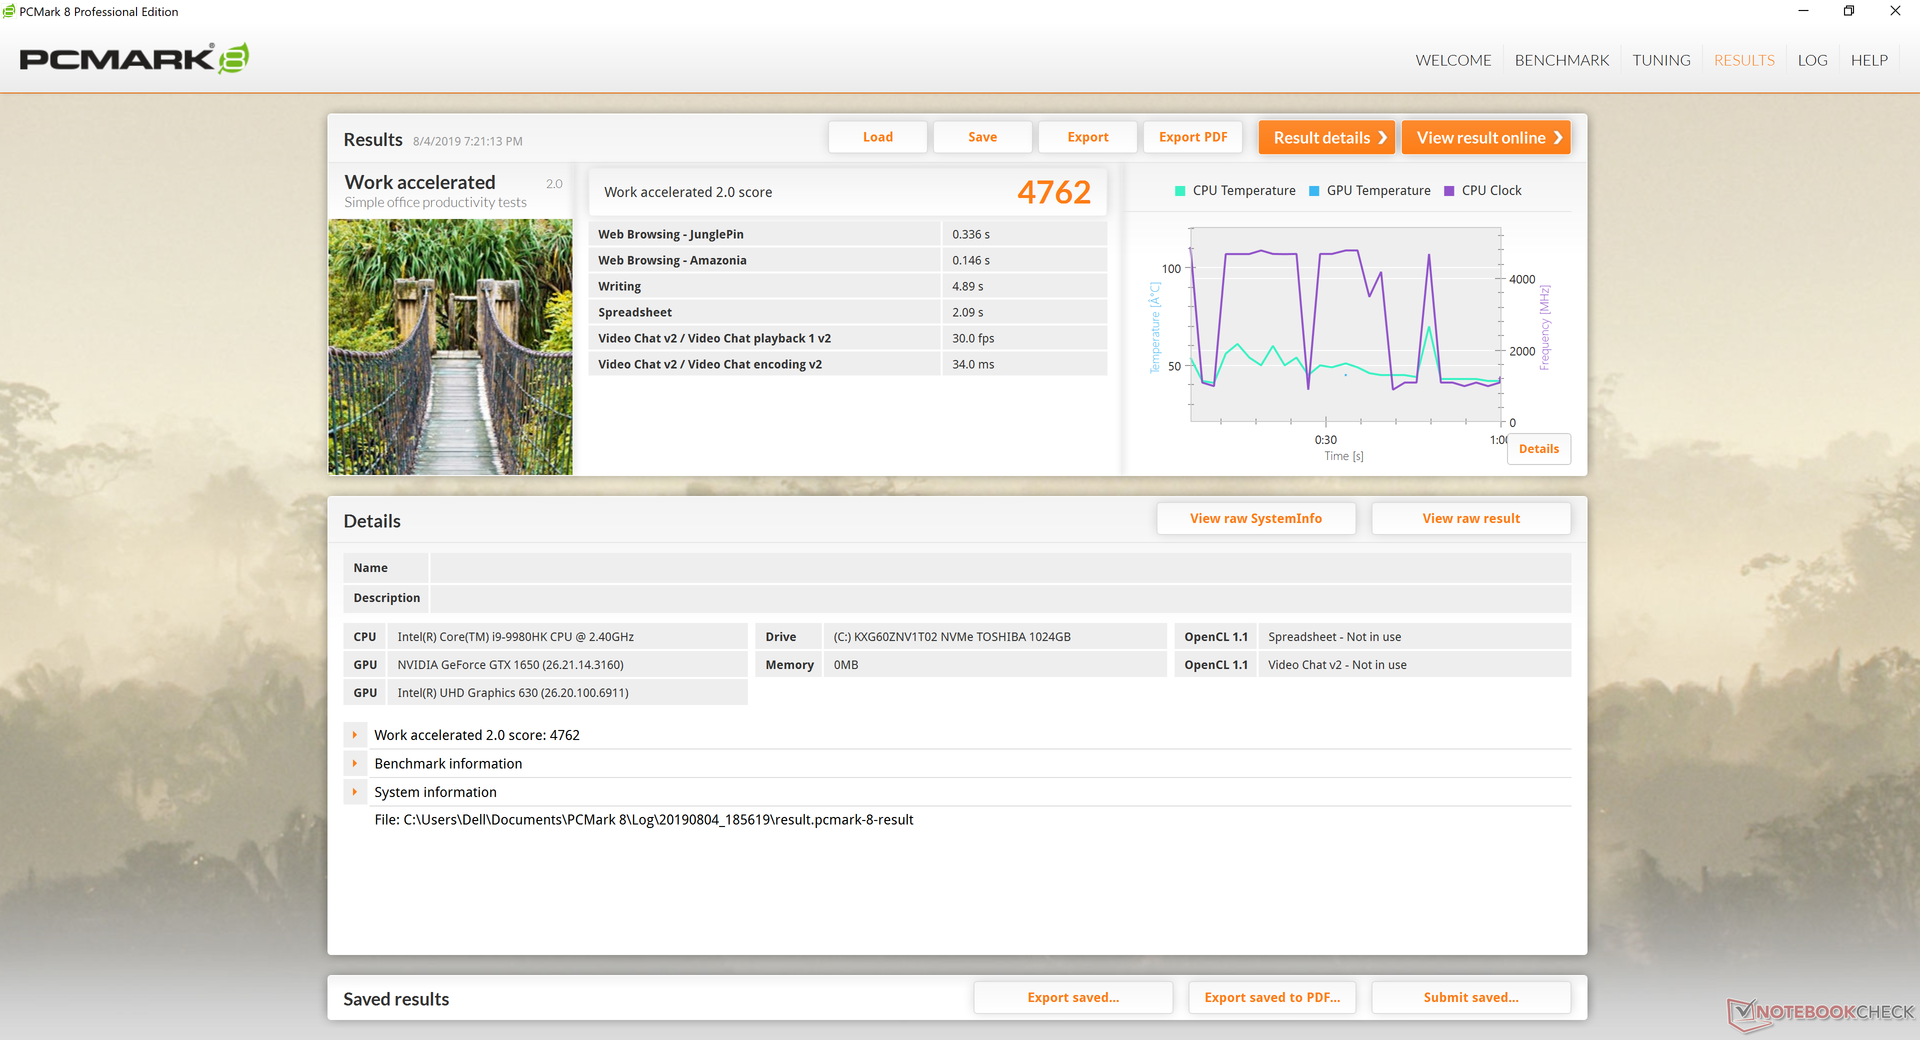
PCMark results are consistently higher than what the last generation XPS 15 9570 was able to offer and even many gaming laptops with GeForce RTX graphics. The only exception is in the Digital Creation benchmark which favors systems with higher-end GPUs.
We didn't experience any wake-sleep fan issues that some last generation models suffered from including on our last XPS 15 9570. We will say, however, that power consumption when in Sleep mode would sometimes be as high as 9 W to 19 W likely due to Microsoft's Modern Standby mode. Even the bottom of the notebook would grow warm just by being in Sleep mode. When most other laptops are in Sleep mode, consumption would be just under 2 W.
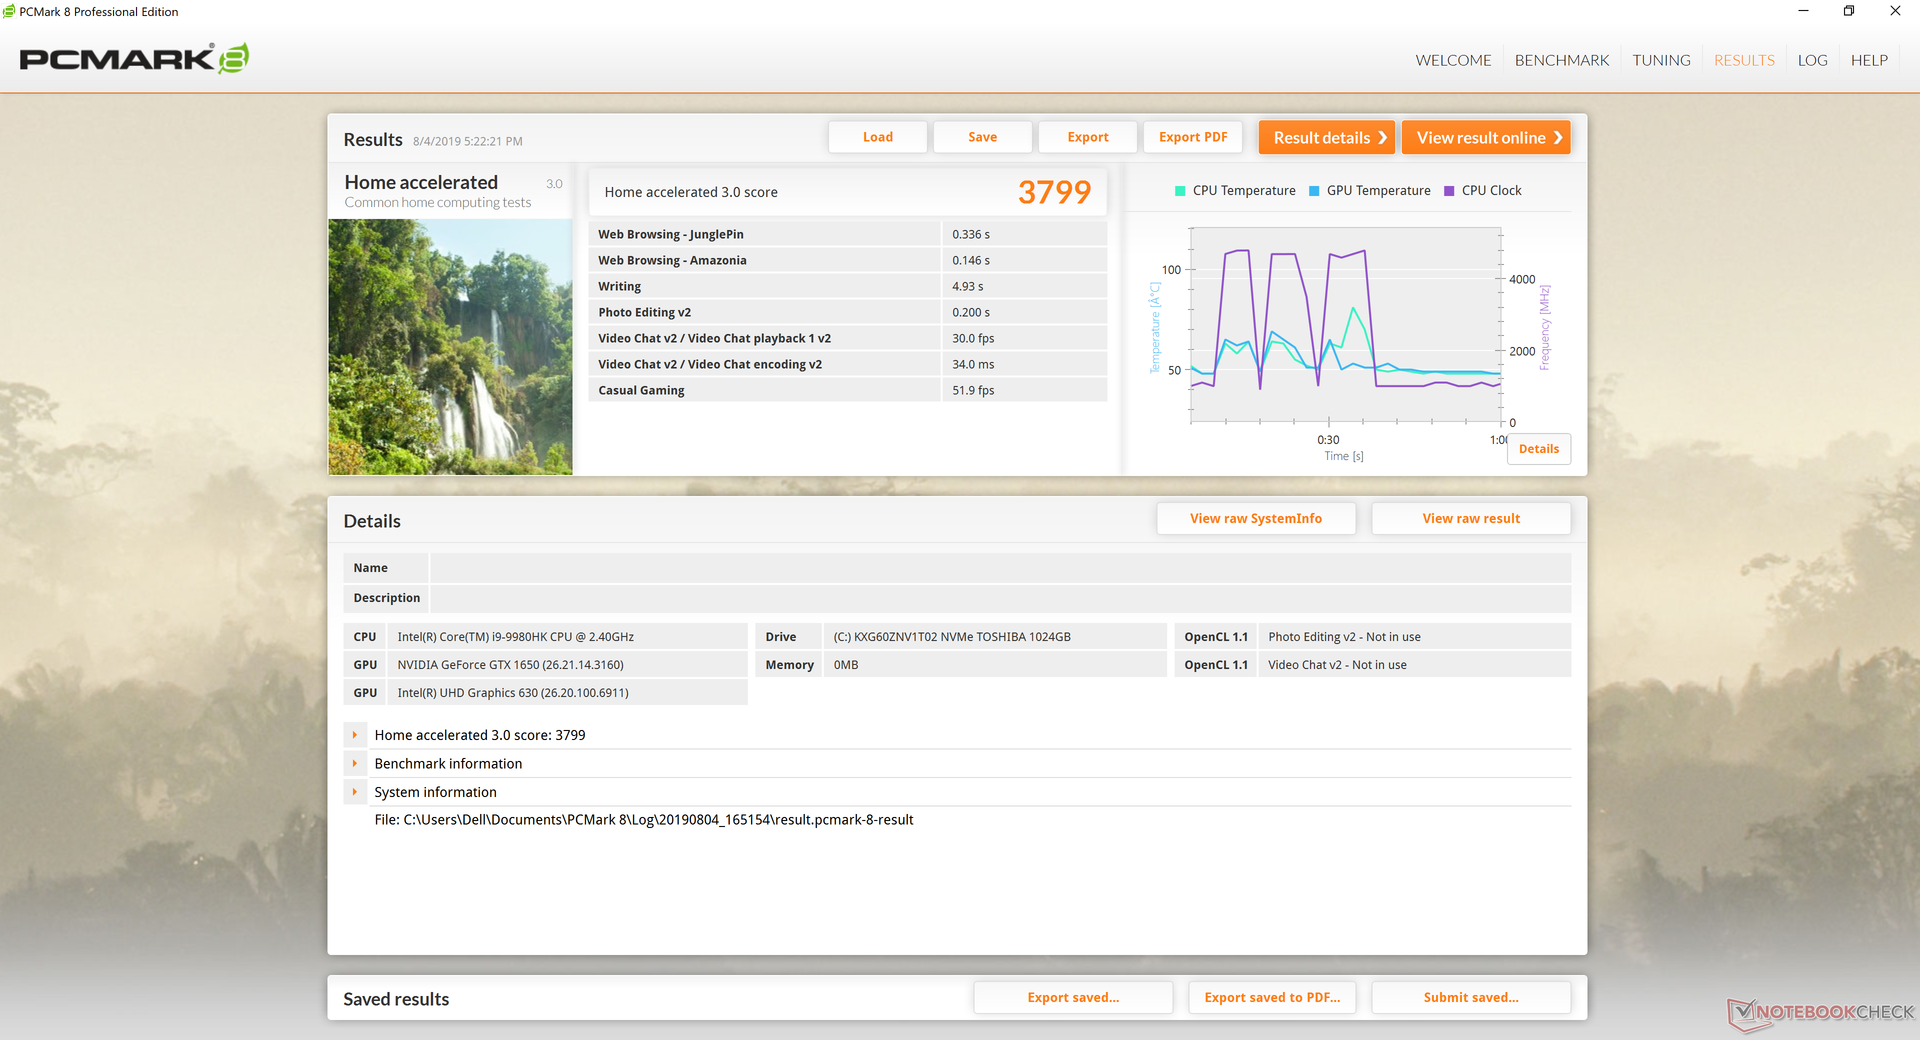
| PCMark 8 Home Score Accelerated v2 | 3799 points | |
| PCMark 8 Work Score Accelerated v2 | 4762 points | |
| PCMark 10 Score | 5469 points | |
Help | ||
Storage Devices
The three XPS 15 9570 SKUs we tested last year all came with three different SSDs from Samsung, Lite-On, and Toshiba. It's more than likely that Dell sources multiple OEMs for all its storage needs in contrast to Razer and its exclusive Blade 15/17 Samsung SSD offerings. This approach can make it challenging for users who may prefer a specific brand of SSD when purchasing an XPS.
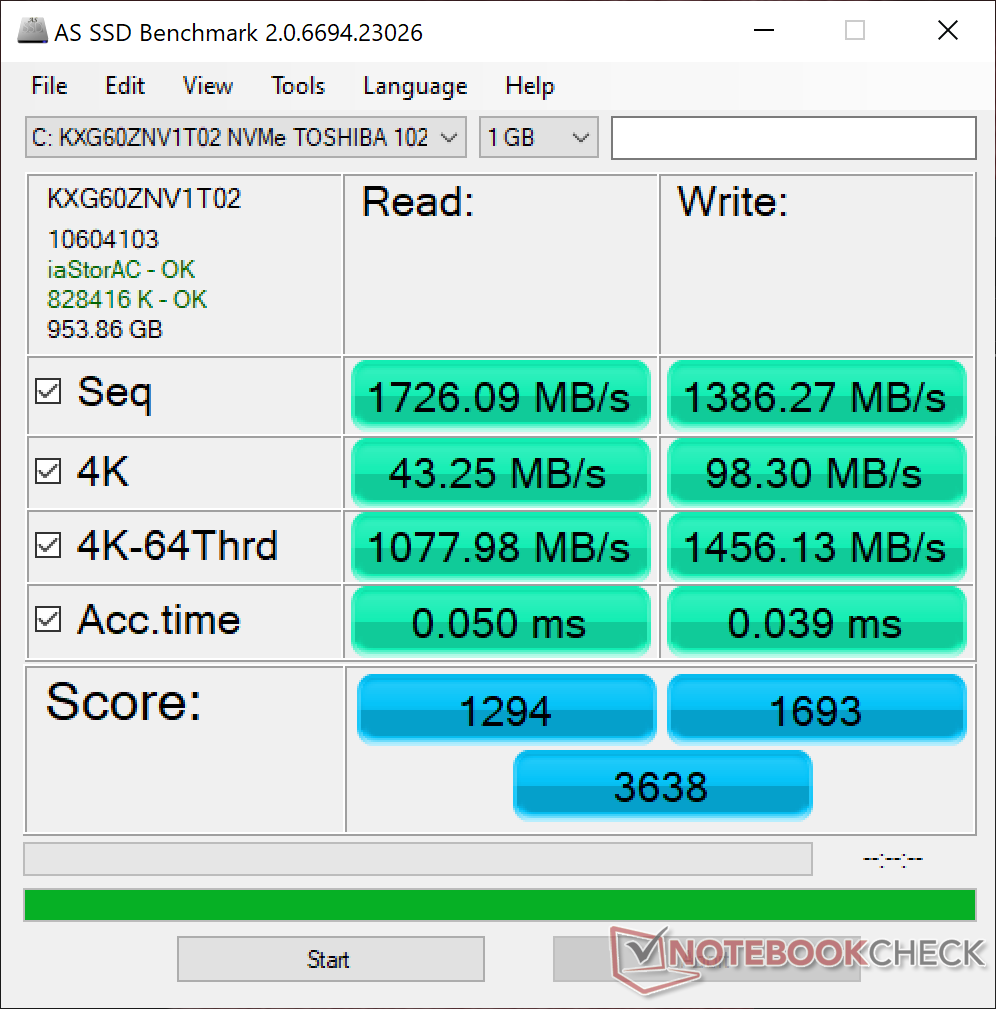
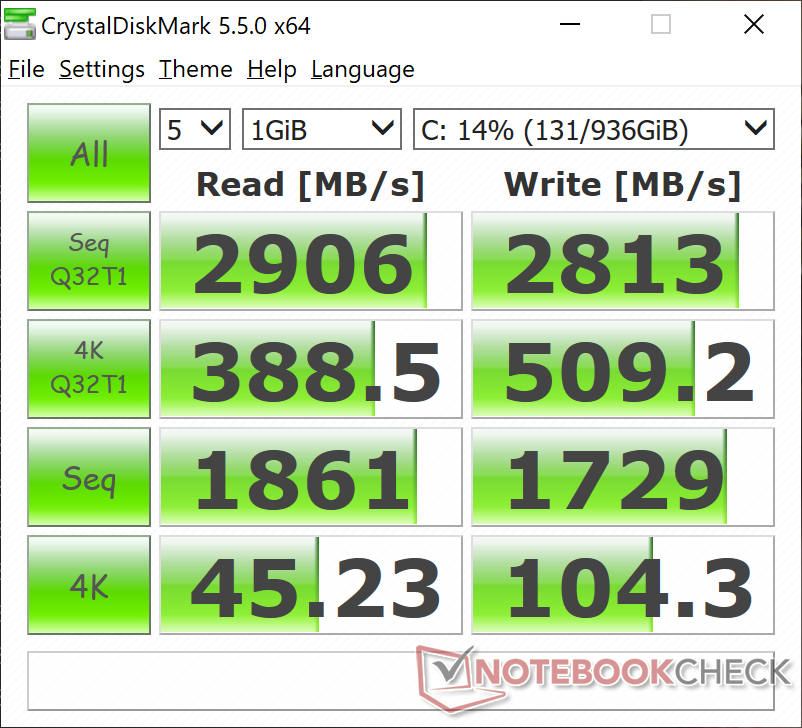
Our 7590 SKU comes equipped with a 1 TB Toshiba XG6 NVMe M.2 drive which is an upgrade from the Toshiba XG5 as found on one of our last XPS 15 9570 SKUs. The XG6 offers about the same theoretical sequential read speeds over the XG5 (3180 MB/s vs. 3000 MB/s) but with much faster sequential write speeds (2960 MB/s vs. 2100 MB/s). CDM 5.5 results show write speeds to be faster than the XG5 especially when writing at smaller block sizes.
Note that results will vary between different storage capacities especially since there could be multiple SSD manufacturers involved.
| Dell XPS 15 7590 9980HK GTX 1650 Toshiba XG6 KXG60ZNV1T02 | Dell XPS 15 9570 Core i9 UHD Samsung SSD PM981 MZVLB1T0HALR | Asus ZenBook 15 UX533FD WDC PC SN520 SDAPNUW-512G | HP Spectre x360 15-df0126ng Toshiba XG5-P KXG50PNV2T04 | Gigabyte Aero 15 OLED XA Intel SSD 600p SSDPEKKW512G8L | |
|---|---|---|---|---|---|
| AS SSD | -4% | -22% | -45% | -4% | |
| Seq Read (MB/s) | 1723 | 1320 -23% | 579 -66% | 2018 17% | 2095 22% |
| Seq Write (MB/s) | 1386 | 1500 8% | 411.8 -70% | 773 -44% | 1464 6% |
| 4K Read (MB/s) | 43.25 | 30.73 -29% | 41.81 -3% | 24.62 -43% | 56.8 31% |
| 4K Write (MB/s) | 98.3 | 94.4 -4% | 131.6 34% | 92.8 -6% | 109.8 12% |
| 4K-64 Read (MB/s) | 1078 | 1453 35% | 975 -10% | 845 -22% | 871 -19% |
| 4K-64 Write (MB/s) | 1456 | 1815 25% | 1047 -28% | 957 -34% | 773 -47% |
| Access Time Read * (ms) | 0.05 | 0.061 -22% | 0.08 -60% | 0.147 -194% | 0.045 10% |
| Access Time Write * (ms) | 0.039 | 0.044 -13% | 0.027 31% | 0.057 -46% | 0.033 15% |
| Score Read (Points) | 1294 | 1616 25% | 1075 -17% | 1071 -17% | 1137 -12% |
| Score Write (Points) | 1693 | 2059 22% | 1220 -28% | 1127 -33% | 1029 -39% |
| Score Total (Points) | 3638 | 4507 24% | 2845 -22% | 2684 -26% | 2732 -25% |
| Copy ISO MB/s (MB/s) | 3182 | 2577 -19% | 1652 -48% | ||
| Copy Program MB/s (MB/s) | 984 | 515 -48% | 328.5 -67% | ||
| Copy Game MB/s (MB/s) | 1824 | 1120 -39% | 700 -62% |
* ... smaller is better

GPU Performance
The Turing GTX 1650 offers 15 to 50 percent faster graphics performance over the Pascal GTX 1050 Ti Max-Q as found on last generation XPS 15 9570 SKUs. As mentioned before, Turing GPUs are highly optimized for DX12 meaning that you'll have to be playing DX12-compatible games if you want that massive 50 percent boost over the GTX 1050 Ti. If you plan on mainly playing DX11 titles or older or running other applications that don't utilize DX12, however, then you won't be exploiting all the benefits of the GTX 1650. Users can expect gaming performance to be about 10 to 25 percent slower than the popular mobile GTX 1060.
When compared to the average GTX 1650 GPU in our database taken from 11 other laptops, the XPS 15 9570 comes out at the bottom to be about 4 to 8 percent slower than expected.
Dell says it has no plans to introduce faster GTX 1660 Ti or GTX 1660 Ti Max-Q SKUs at the moment. The GTX 1660 Ti Max-Q GPU has a 10 W higher power envelope than the GTX 1650 and such a configuration would be straining the XPS 15 cooling system even more than it already is.
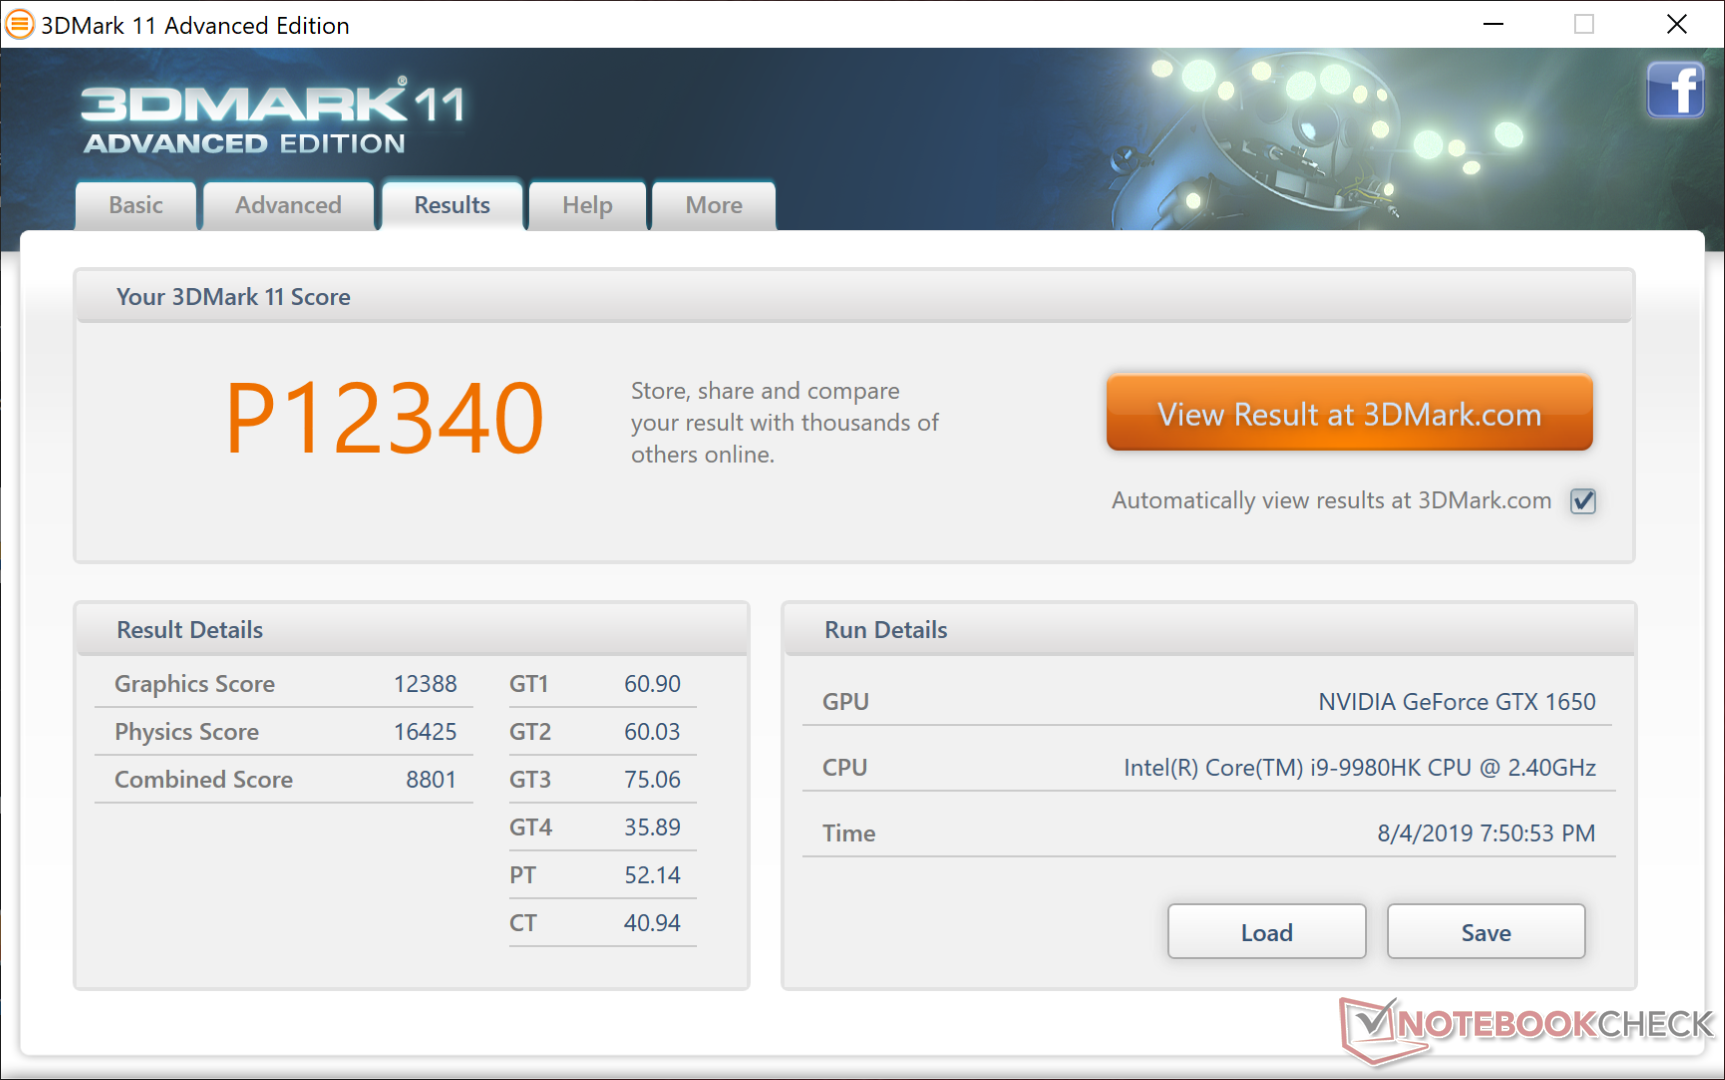

| 3DMark 11 Performance | 12340 points | |
| 3DMark Cloud Gate Standard Score | 30573 points | |
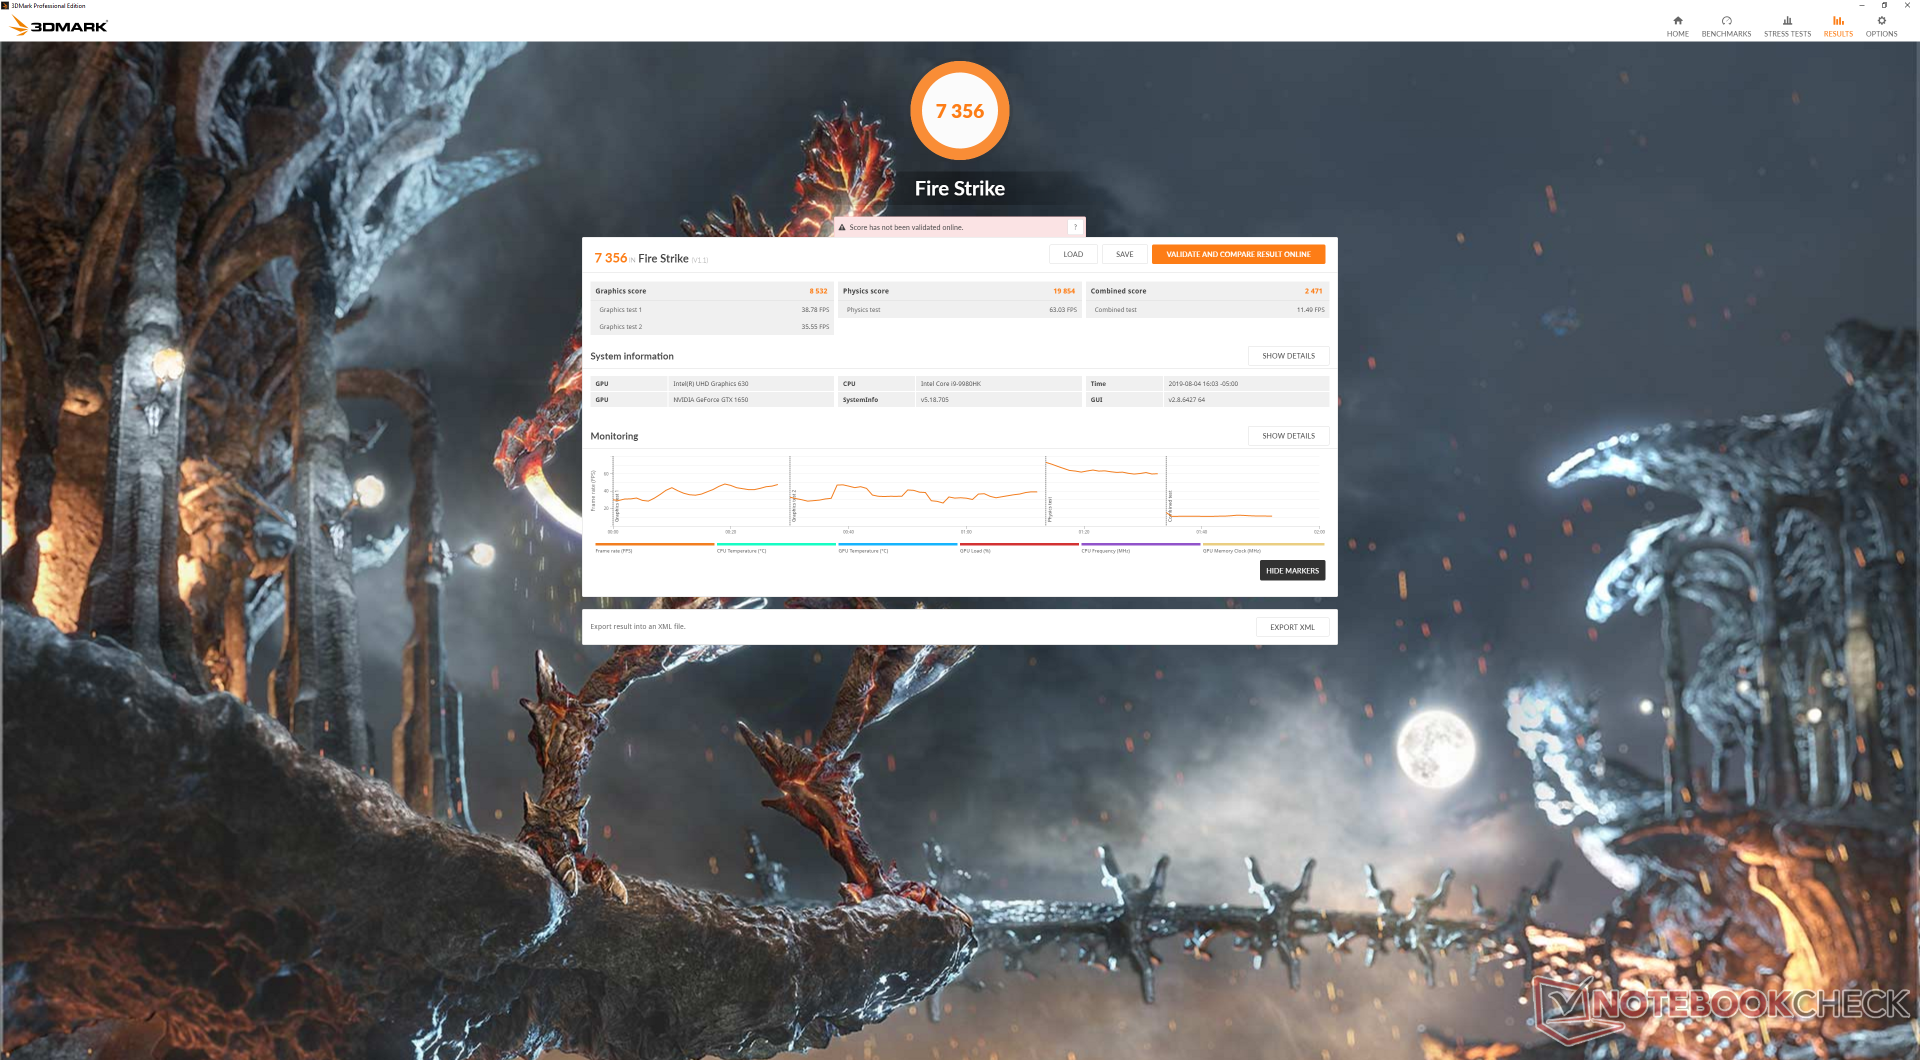
| 3DMark Fire Strike Score | 7356 points | |
| 3DMark Time Spy Score | 3676 points | |
Help | ||
Gaming Performance
Real-world gaming performance paints a similar picture to the above findings, if not worse. When compared to other laptops with the same GTX 1650 GPU, frame rates on the XPS 15 7590 would be about 15 to 25 percent slower. This means that the performance delta between the GTX 1650 and last generation GTX 1050 Ti Max-Q are much narrower than anticipated. In other words, you can still game on the XPS 15, but don't expect it to be that much better than on last year's model. A "proper" gaming laptop with the exact same GTX 1650 GPU like the MSI GF75, for example, is able to deliver up to 30 percent faster frame rates than our XPS 15 in Shadow of the Tomb Raider.
Idling on Witcher 3 shows consistent frame rates throughout with no recurring dips. There is no throttling behavior to speak of on our unit; instead, performance is just slower than average for this particular GPU.
See our dedicated page on the GeForce GTX 1650 for more technical information and average benchmark comparisons.
| Shadow of the Tomb Raider - 1920x1080 Highest Preset AA:T | |
| Alienware Area-51m i9-9900K RTX 2080 | |
| MSI GE75 9SG | |
| Razer Blade Pro 17 RTX 2060 | |
| Gigabyte Aero 15 OLED XA | |
| HP Pavilion Gaming 17-cd0085cl | |
| MSI GF75 Thin 9SC | |
| Average NVIDIA GeForce GTX 1650 Mobile (34 - 47, n=15) | |
| Asus Zephyrus S GX531GM | |
| Asus G752VY | |
| Dell XPS 15 7590 9980HK GTX 1650 | |
| Asus TUF FX705GE-EW096T | |
| Rocket League - 1920x1080 High Quality AA:High FX | |
| Average NVIDIA GeForce GTX 1650 Mobile (96.4 - 162.2, n=6) | |
| HP Spectre x360 15-df0126ng | |
| Asus GL703GE-ES73 | |
| Dell XPS 15 7590 9980HK GTX 1650 | |
| low | med. | high | ultra | 4K | |
|---|---|---|---|---|---|
| BioShock Infinite (2013) | 342.5 | 223.4 | 171.8 | 68.5 | |
| The Witcher 3 (2015) | 183.5 | 111.5 | 64.8 | 36 | |
| Rocket League (2017) | 248 | 152.5 | 96.4 | 41.1 | |
| Shadow of the Tomb Raider (2018) | 111 | 42 | 38 | 34 | 14 |
Emissions
System Noise
The cooling solution has remained largely intact despite having gone through multiple generations of CPUs and GPUs over the years. After all, Dell can only optimize the cooling so many times without completely redesigning the chassis. Fan noise and behavior are therefore similar to the XPS 15 9570 for better or worse depending on how you may see things. From a glass half full perspective, you're getting higher performance over the last generation at the same level of fan noise. On the other hand, users who may have been crossing their fingers for a quieter system will not be getting their wish.
A notable observation on our 7590 SKU is that its fans would pulse louder sooner when subjected to higher loads than what we experienced on the Core i9 XPS 15 9570. Core temperature can jump up to 100 C very quickly and so the fans will respond promptly. Gaming will cause the fans to stabilize at their maximum RPMs to be almost as loud as most dedicated gaming laptops with faster GPUs.
Setting the system to Quiet or Power Saver through the Dell Power Manager software will prevent the fans from pulsing to high speeds if simply word processing or video streaming for a near-silent system. Our particular unit doesn't suffer from any noticeable electronic noise or coil whine issues.
| Dell XPS 15 7590 9980HK GTX 1650 GeForce GTX 1650 Mobile, i9-9980HK, Toshiba XG6 KXG60ZNV1T02 | Dell XPS 15 9570 Core i9 UHD GeForce GTX 1050 Ti Max-Q, i9-8950HK, Samsung SSD PM981 MZVLB1T0HALR | Asus ZenBook 15 UX533FD GeForce GTX 1050 Max-Q, i7-8565U, WDC PC SN520 SDAPNUW-512G | HP Spectre x360 15-df0126ng GeForce GTX 1050 Ti Max-Q, i7-8750H, Toshiba XG5-P KXG50PNV2T04 | Gigabyte Aero 15 OLED XA GeForce RTX 2070 Max-Q, i7-9750H, Intel SSD 600p SSDPEKKW512G8L | Razer Blade 15 RTX 2080 Max-Q GeForce RTX 2080 Max-Q, i7-9750H, Samsung SSD PM981 MZVLB512HAJQ | |
|---|---|---|---|---|---|---|
| Noise | 3% | -1% | -1% | -17% | 5% | |
| off / environment * (dB) | 28.2 | 28.2 -0% | 30.5 -8% | 30.4 -8% | 30 -6% | 28.3 -0% |
| Idle Minimum * (dB) | 28.2 | 28.5 -1% | 30.5 -8% | 30.4 -8% | 34 -21% | 28.8 -2% |
| Idle Average * (dB) | 28.2 | 28.6 -1% | 30.5 -8% | 30.4 -8% | 35 -24% | 28.8 -2% |
| Idle Maximum * (dB) | 30.4 | 28.8 5% | 30.5 -0% | 31.6 -4% | 45 -48% | 29 5% |
| Load Average * (dB) | 43.8 | 36.2 17% | 40.8 7% | 43.2 1% | 43 2% | 33.5 24% |
| Witcher 3 ultra * (dB) | 47.2 | 47.6 -1% | 52 -10% | 45 5% | ||
| Load Maximum * (dB) | 47.2 | 47.6 -1% | 41.8 11% | 38.3 19% | 54 -14% | 45.2 4% |
* ... smaller is better
Noise level
| Idle |
| 28.2 / 28.2 / 30.4 dB(A) |
| Load |
| 43.8 / 47.2 dB(A) |
 | ||
30 dB silent 40 dB(A) audible 50 dB(A) loud |
||
min: | ||
Temperature
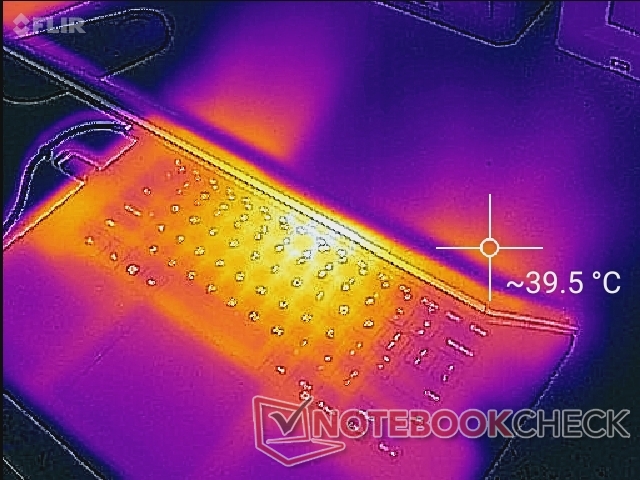
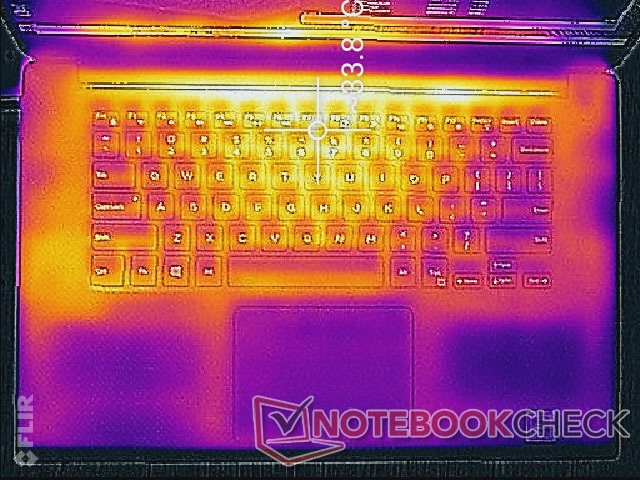
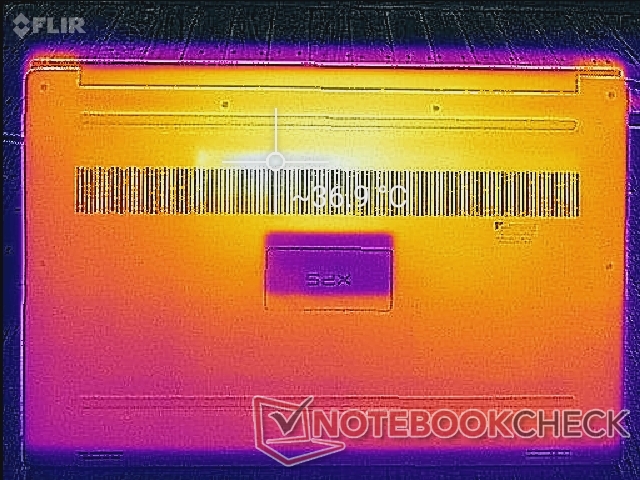
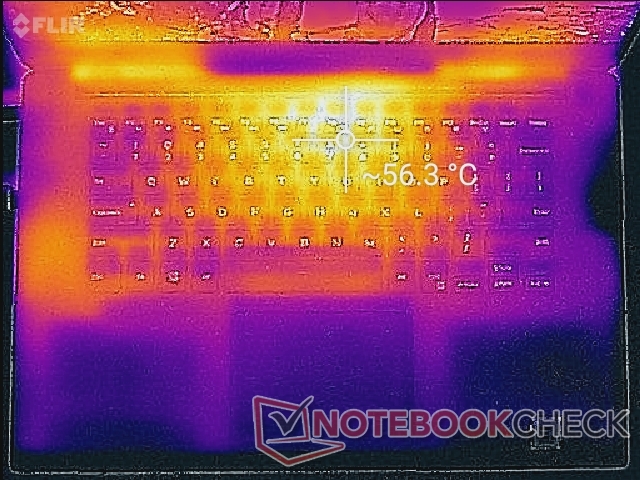
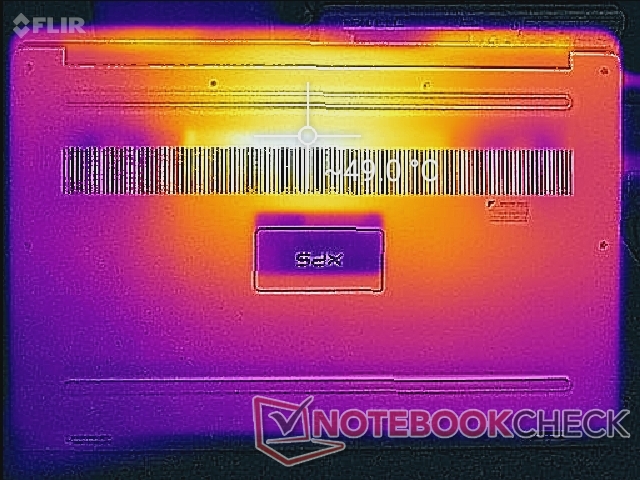
Surface temperatures are nothing new and not unlike last year's XPS 15 9570 since the underlying cooling solution and power envelope have not changed significantly. Temperature development remains nearly symmetrical with the hot spot towards the center of the keyboard. When gaming, this spot can become as warm as 56 C as shown by our temperature maps below. The carbon fiber palm rests will always be warm to the touch as well albeit nowhere near as warm as the keyboard keys. The WASD keys in particular can be as warm as 37 C when under high processing loads. If you've ever tried gaming on any XPS 15 SKU with GeForce graphics, then all these observations should sound familiar.
SKUs that have a secondary 2.5-inch SATA III drive will always be a few degrees C warmer on the right palm rest due to the positioning of the drive.
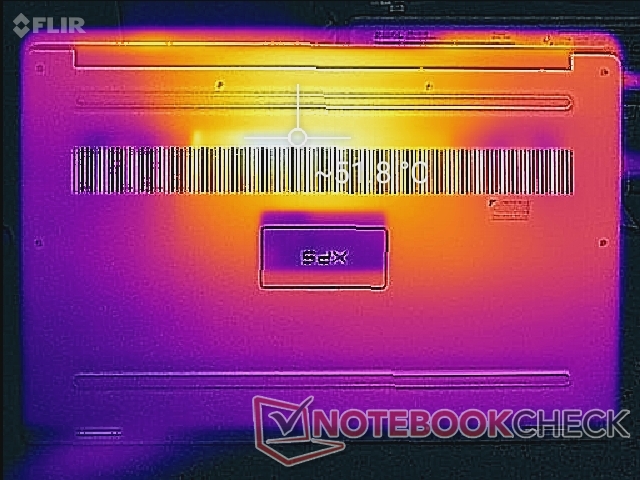
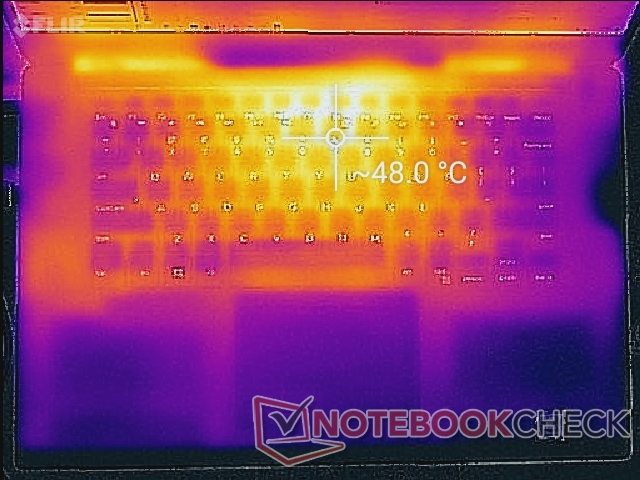
(-) The maximum temperature on the upper side is 50.4 °C / 123 F, compared to the average of 36.8 °C / 98 F, ranging from 21 to 71 °C for the class Multimedia.
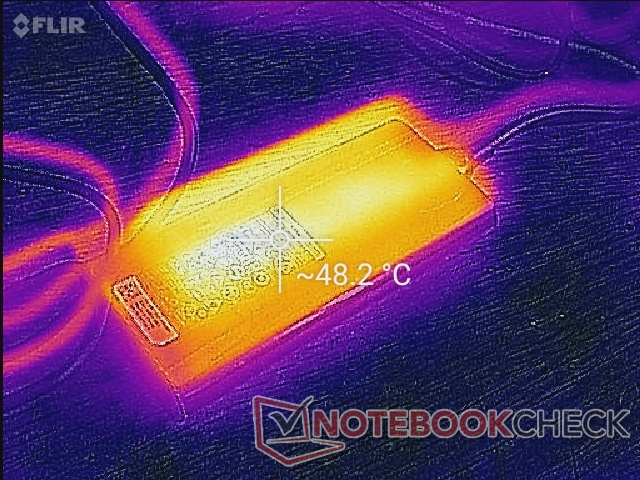
(-) The bottom heats up to a maximum of 49.2 °C / 121 F, compared to the average of 39.1 °C / 102 F
(+) In idle usage, the average temperature for the upper side is 30.9 °C / 88 F, compared to the device average of 31.3 °C / 88 F.
(-) Playing The Witcher 3, the average temperature for the upper side is 39.4 °C / 103 F, compared to the device average of 31.3 °C / 88 F.
(+) The palmrests and touchpad are cooler than skin temperature with a maximum of 31.8 °C / 89.2 F and are therefore cool to the touch.
(-) The average temperature of the palmrest area of similar devices was 28.7 °C / 83.7 F (-3.1 °C / -5.5 F).
Stress Test
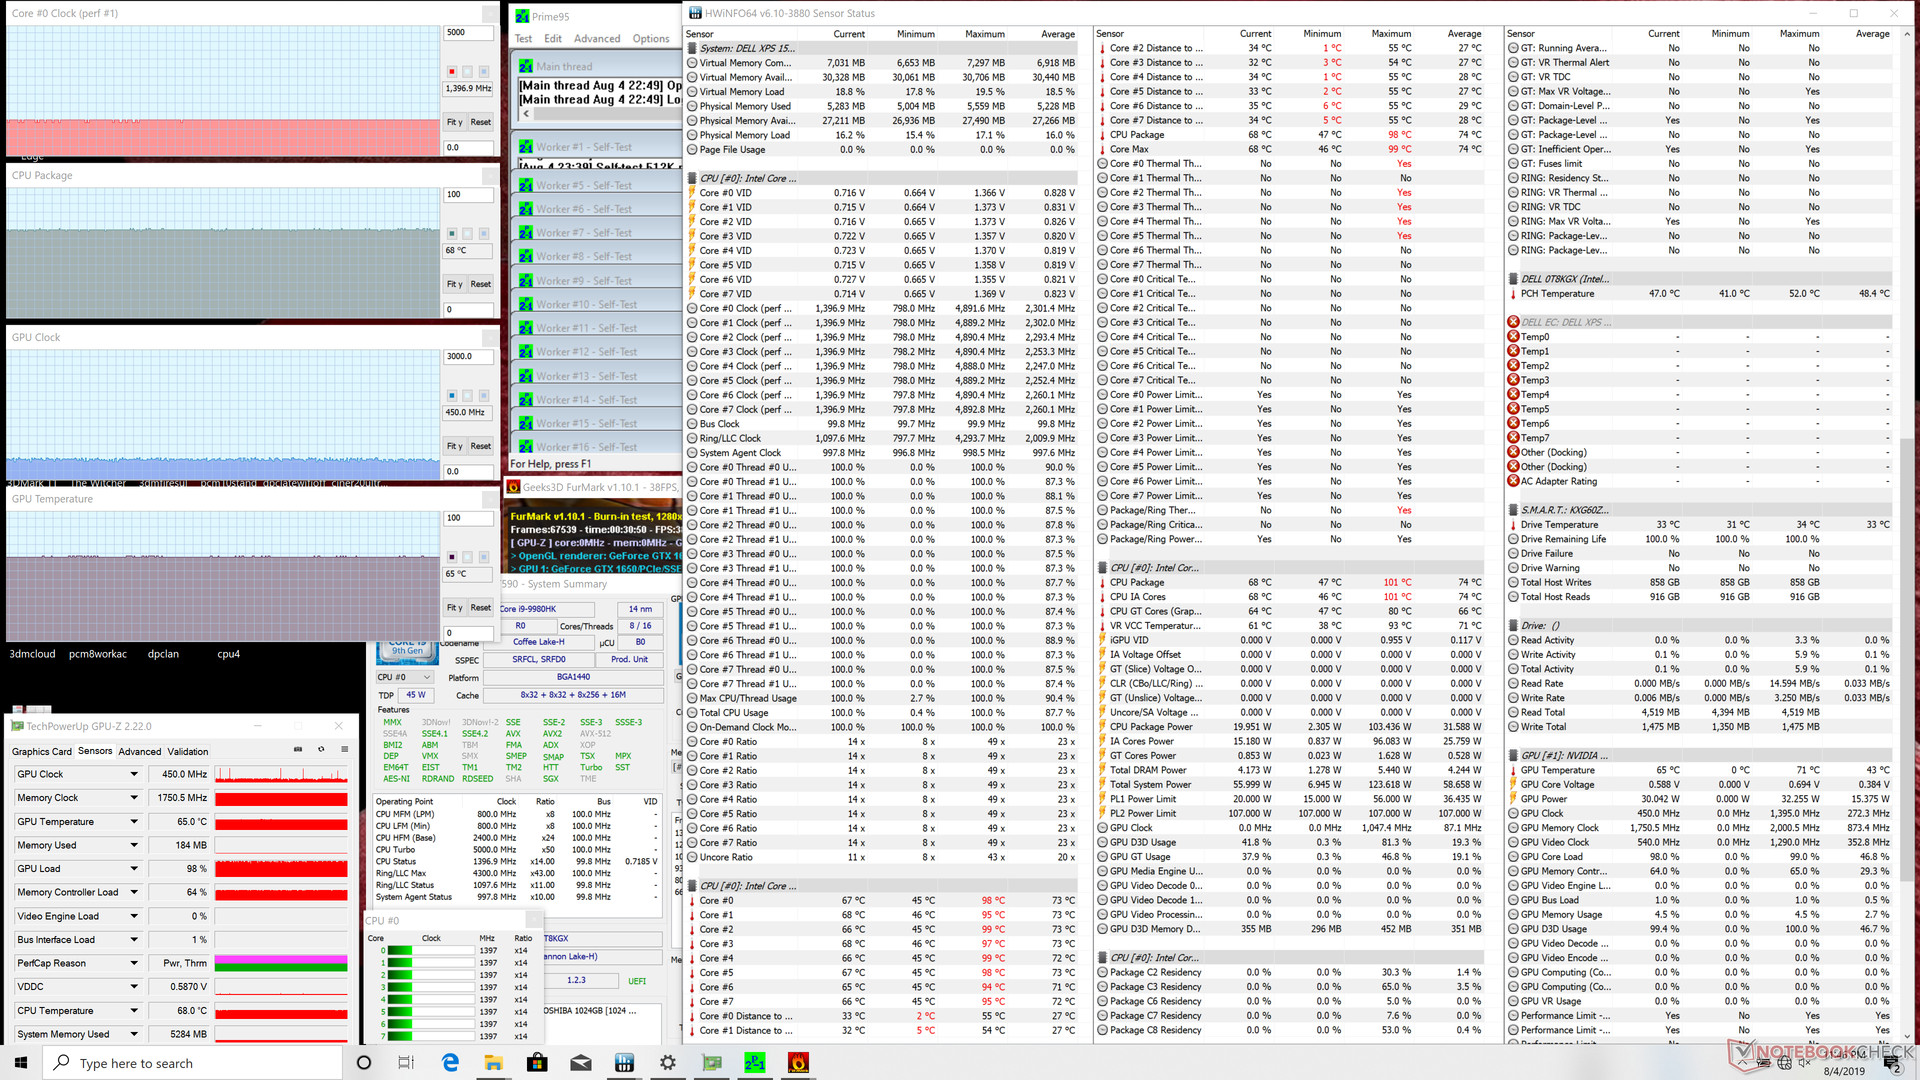
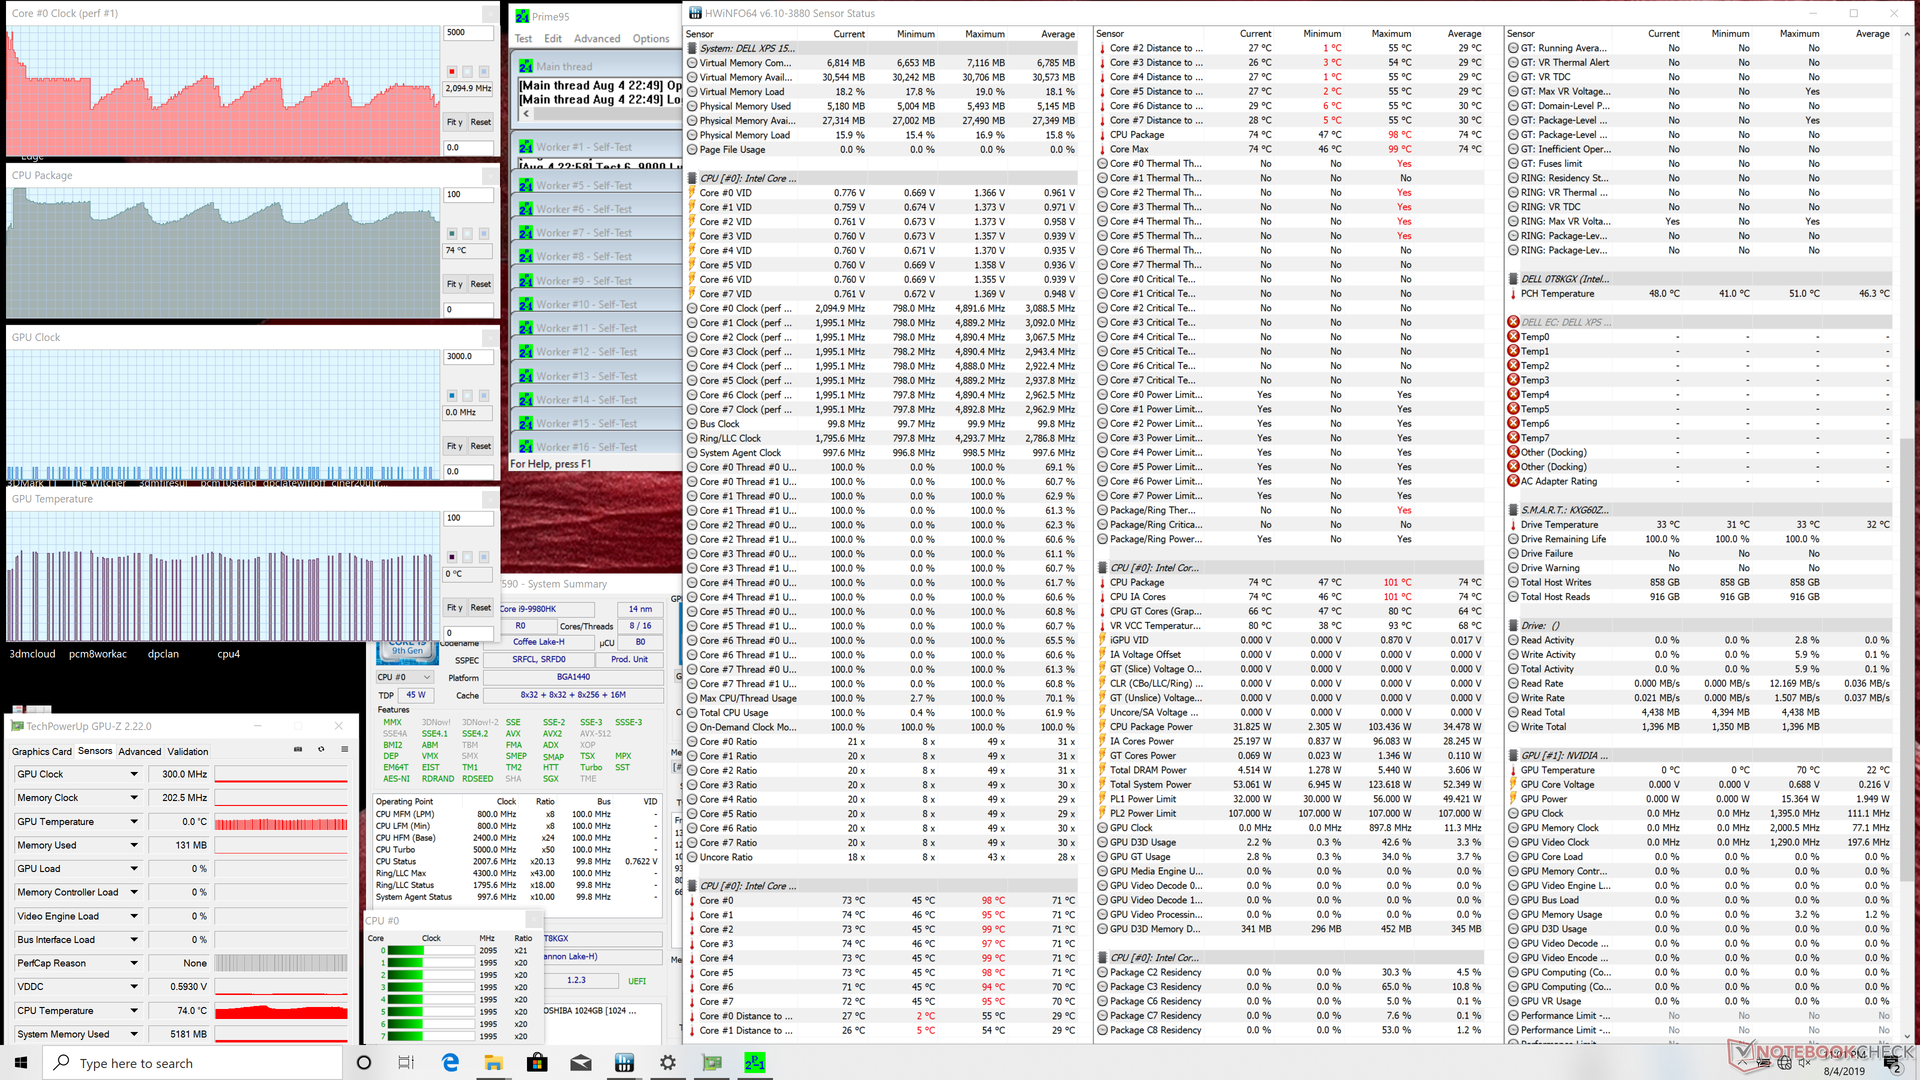
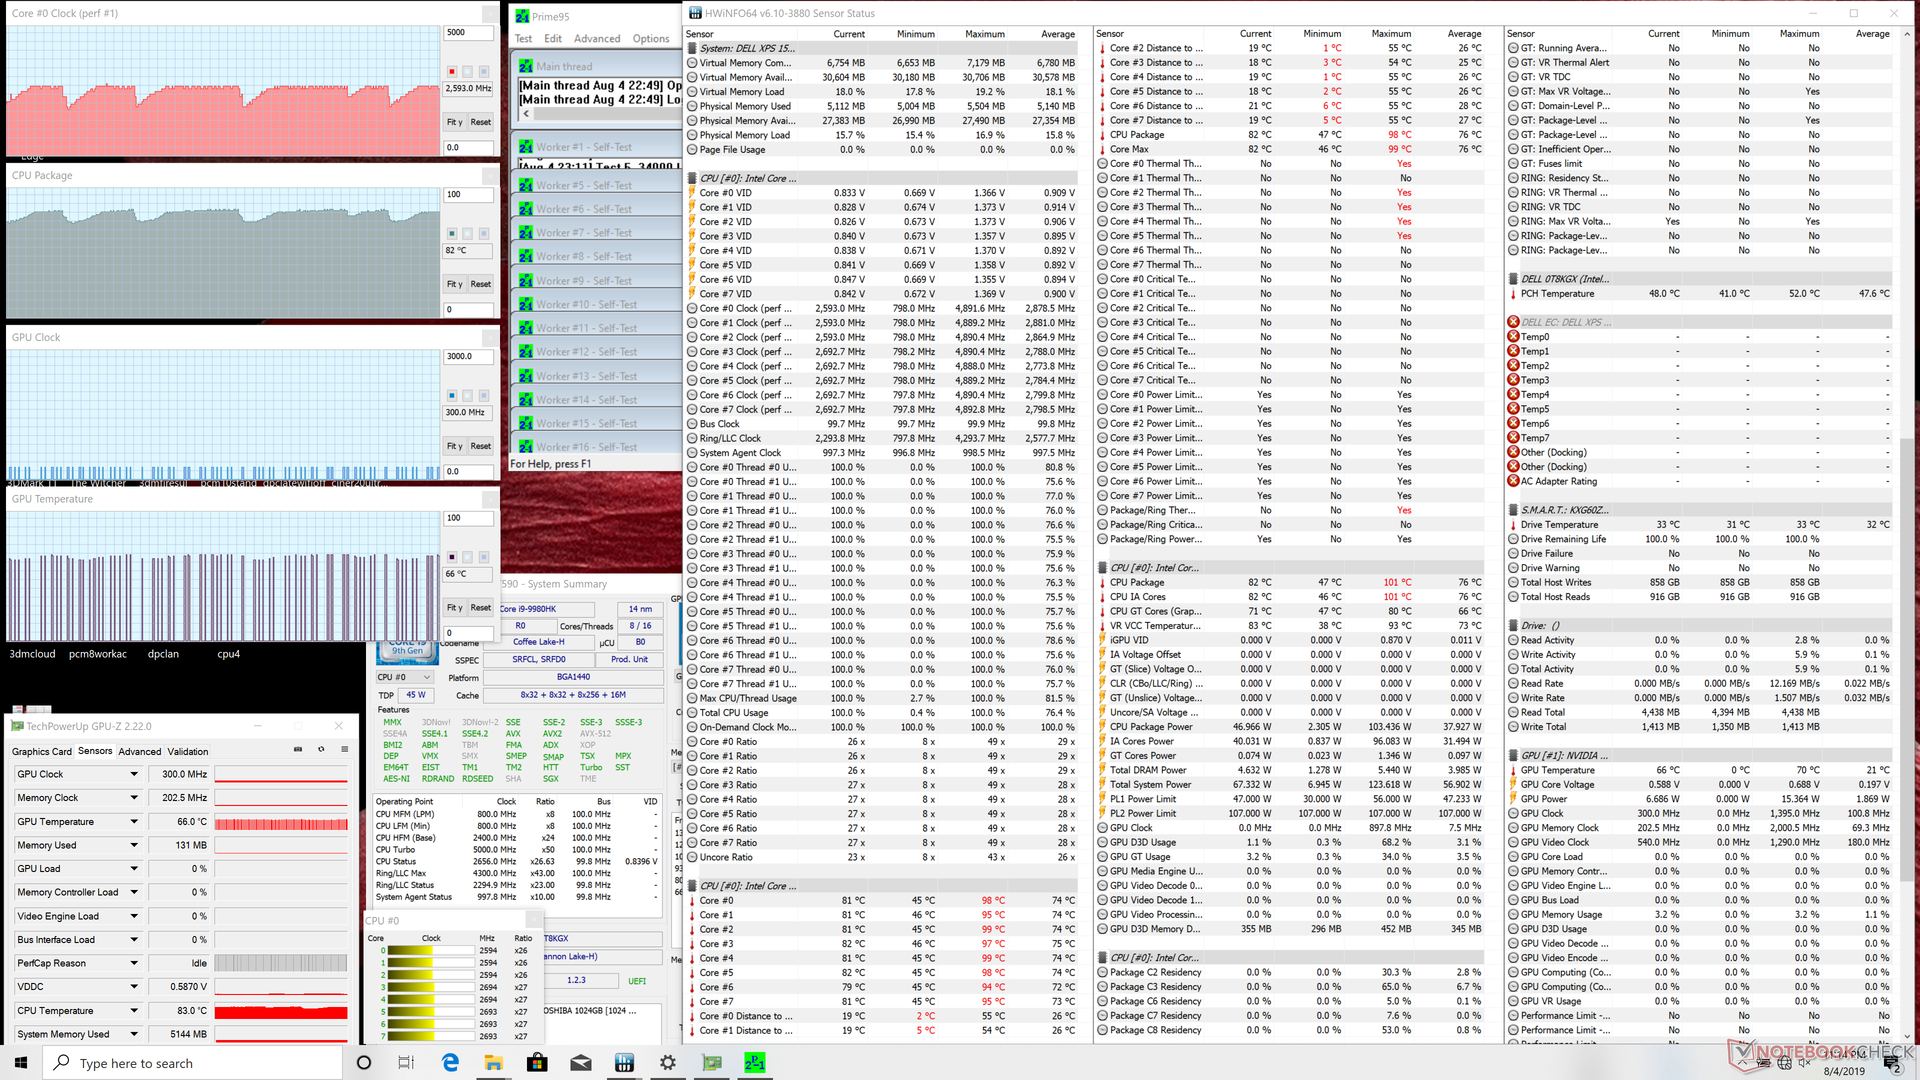
We stress the system with synthetic loads to identify for any potential throttling or stability issues. When running Prime95, CPU temperature jumps almost instantaneously to 100 C and 3.5 GHz for the first few seconds before falling to 3 GHz and 88 C. After a few minutes, clock rate drops again to cycle between 1.9 GHz and 2.7 GHz and 74 C to 83 C as shown our screenshot below. This cycling behavior mirrors our power consumption observations below and CineBench loop test observations above.
Since the base clock rate of the Core i9-9980HK is 2.4 GHz, the CPU will occasionally throttle down to as low 1.9 GHz with weak Turbo Boost of only +300 MHz. Most other Core H-series laptops will typically maintain a fixed clock rate and temperature when subjected to the same Prime95 conditions and so this is likely Dell's way of squeezing out more performance from the processor when it is fully stressed. Nonetheless, there's no question that the Core i9-9980HK is capable of so much more and that the XPS 15 is holding back its full performance potential.
Running both Prime95 and FurMark simultaneously will throttle the CPU and GPU to even slower clock rates. Of course, such extreme loads are unrepresentative of daily workloads.
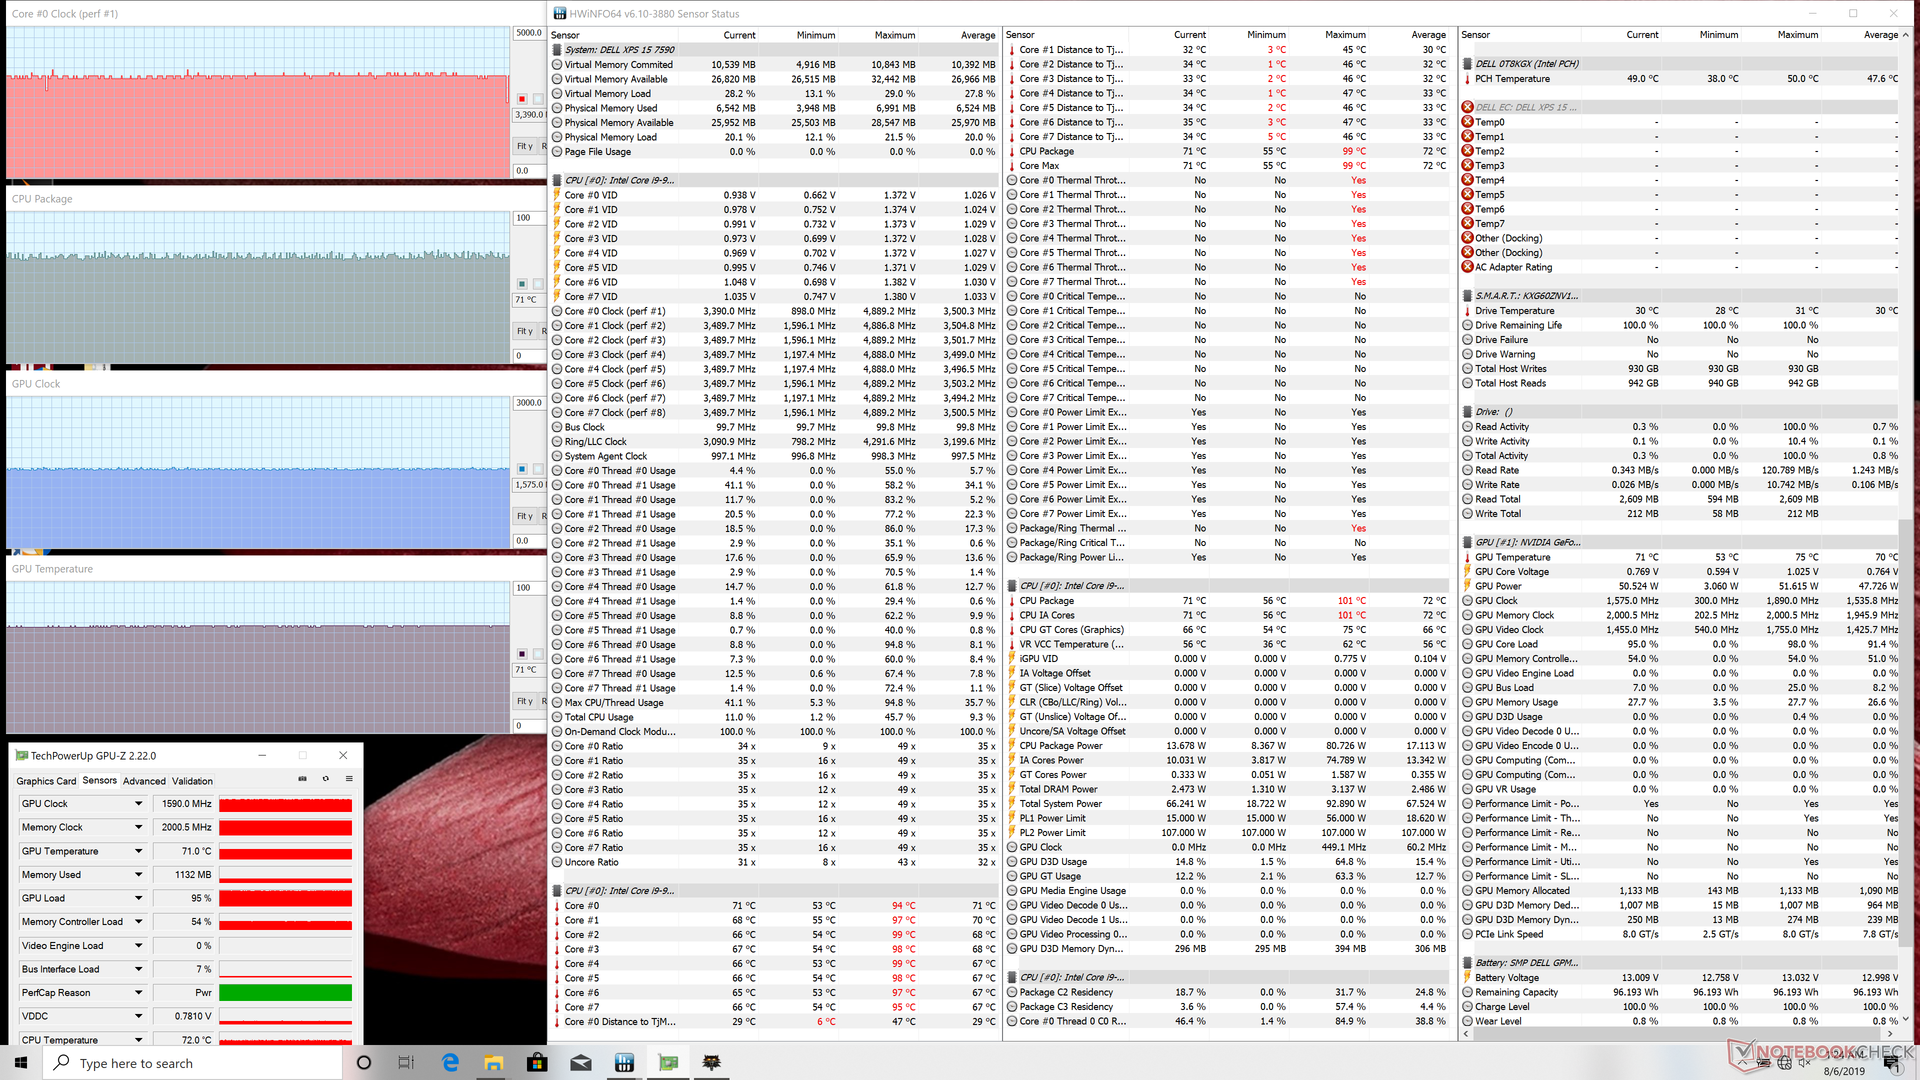
Running Witcher 3 is more representative of demanding real-world loads. The CPU and GPU would each stabilize at about 71 C with no throttling to speak of. These temperatures are relatively cool when compared to GTX/RTX gaming laptops where ~80 C readings are common.
Running on battery power will limit performance. A Fire Strike run on batteries returns Physics and Graphics scores of 17790 and 6927, respectively, compared to 19854 and 8532 points when on mains.
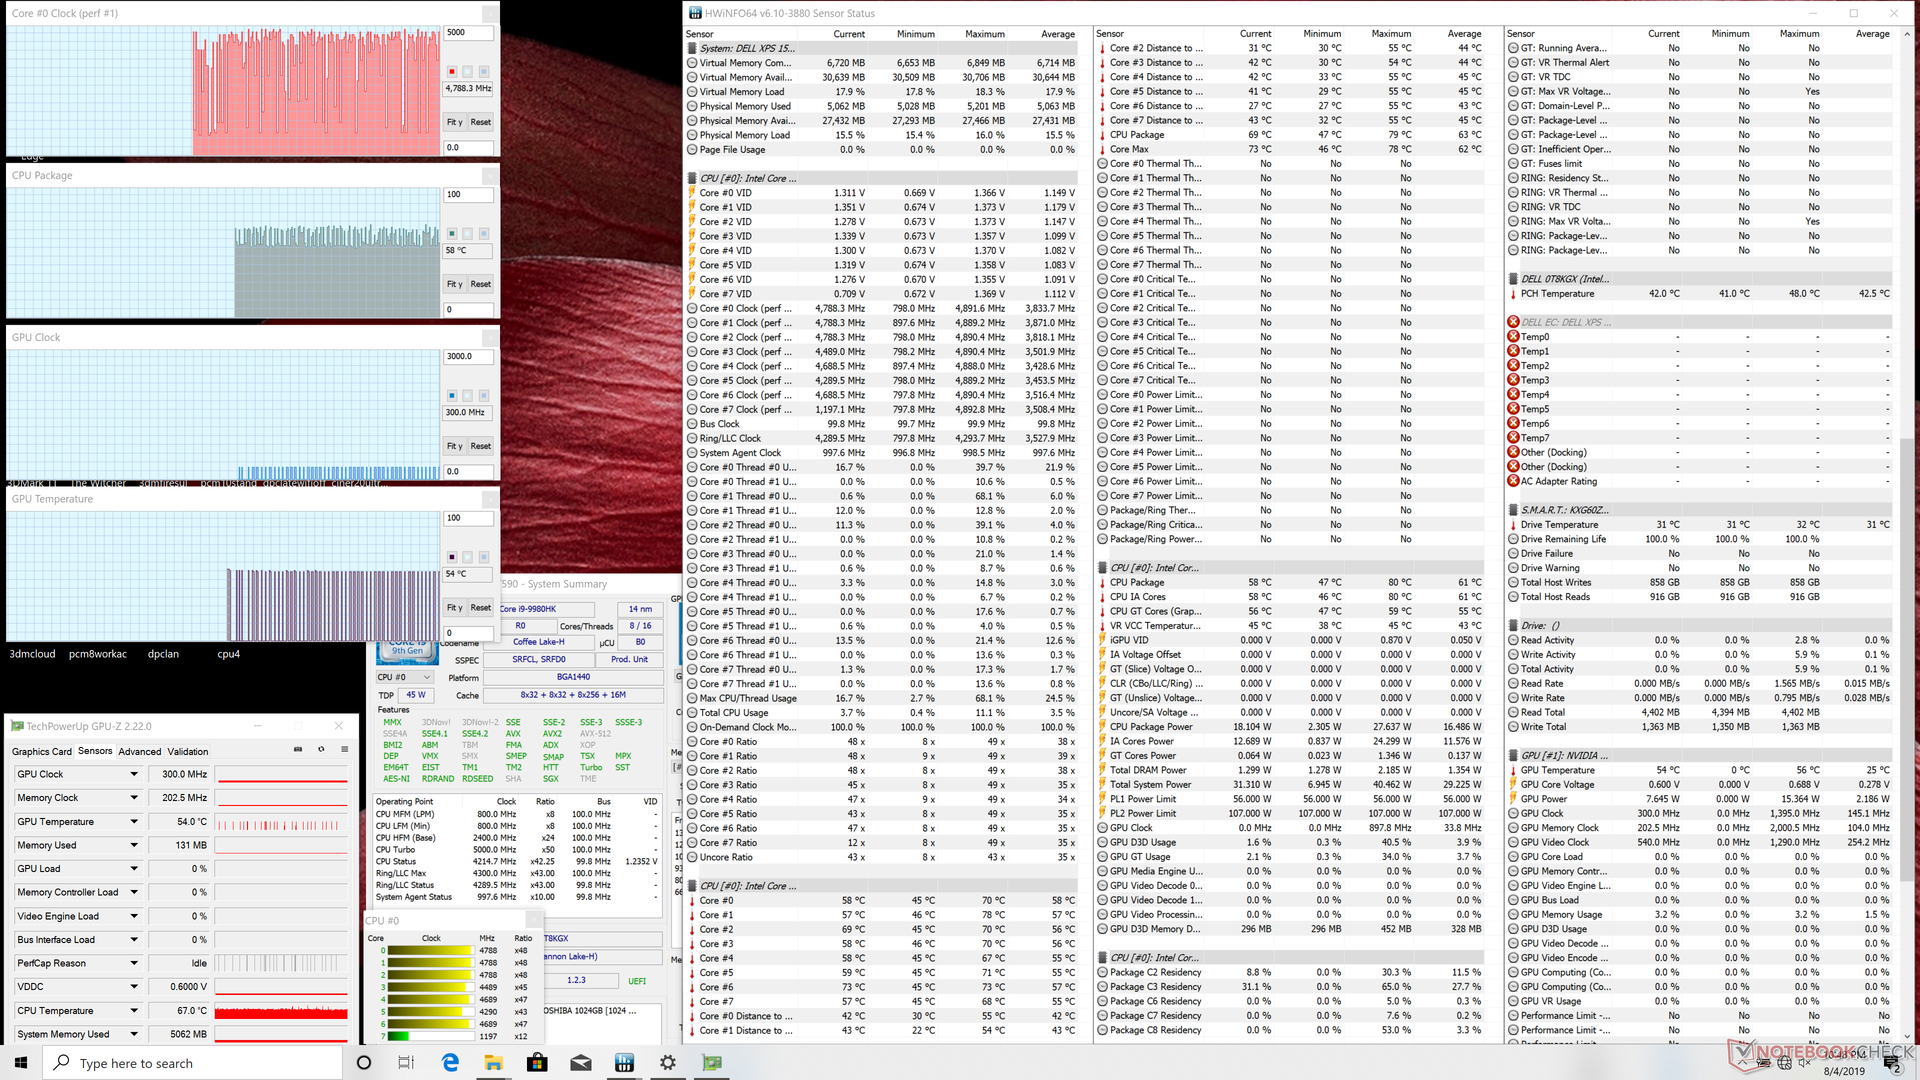
| CPU Clock (GHz) | GPU Clock (MHz) | Average CPU Temperature (°C) | Average GPU Temperature (°C) | |
| System Idle | -- | -- | ~58 | 54 |
| Prime95 Stress | 1.9 - 2.7 | -- | 62 - 66 | 74 - 83 |
| Prime95 + FurMark Stress | 1.4 | 450 | 68 | 65 |
| Witcher 3 Stress | 3.9 | 1590 | 71 | 71 |
Speakers


Dell XPS 15 7590 9980HK GTX 1650 audio analysis
(+) | speakers can play relatively loud (88.4 dB)
Bass 100 - 315 Hz
(-) | nearly no bass - on average 24.9% lower than median
(±) | linearity of bass is average (14.4% delta to prev. frequency)
Mids 400 - 2000 Hz
(+) | balanced mids - only 2.8% away from median
(±) | linearity of mids is average (7.8% delta to prev. frequency)
Highs 2 - 16 kHz
(+) | balanced highs - only 1.9% away from median
(+) | highs are linear (5.3% delta to prev. frequency)
Overall 100 - 16.000 Hz
(±) | linearity of overall sound is average (17.8% difference to median)
Compared to same class
» 52% of all tested devices in this class were better, 7% similar, 41% worse
» The best had a delta of 5%, average was 17%, worst was 45%
Compared to all devices tested
» 36% of all tested devices were better, 8% similar, 56% worse
» The best had a delta of 4%, average was 23%, worst was 134%
Apple MacBook 12 (Early 2016) 1.1 GHz audio analysis
(+) | speakers can play relatively loud (83.6 dB)
Bass 100 - 315 Hz
(±) | reduced bass - on average 11.3% lower than median
(±) | linearity of bass is average (14.2% delta to prev. frequency)
Mids 400 - 2000 Hz
(+) | balanced mids - only 2.4% away from median
(+) | mids are linear (5.5% delta to prev. frequency)
Highs 2 - 16 kHz
(+) | balanced highs - only 2% away from median
(+) | highs are linear (4.5% delta to prev. frequency)
Overall 100 - 16.000 Hz
(+) | overall sound is linear (10.2% difference to median)
Compared to same class
» 7% of all tested devices in this class were better, 2% similar, 90% worse
» The best had a delta of 5%, average was 18%, worst was 53%
Compared to all devices tested
» 5% of all tested devices were better, 1% similar, 94% worse
» The best had a delta of 4%, average was 23%, worst was 134%
Energy Management
Power Consumption
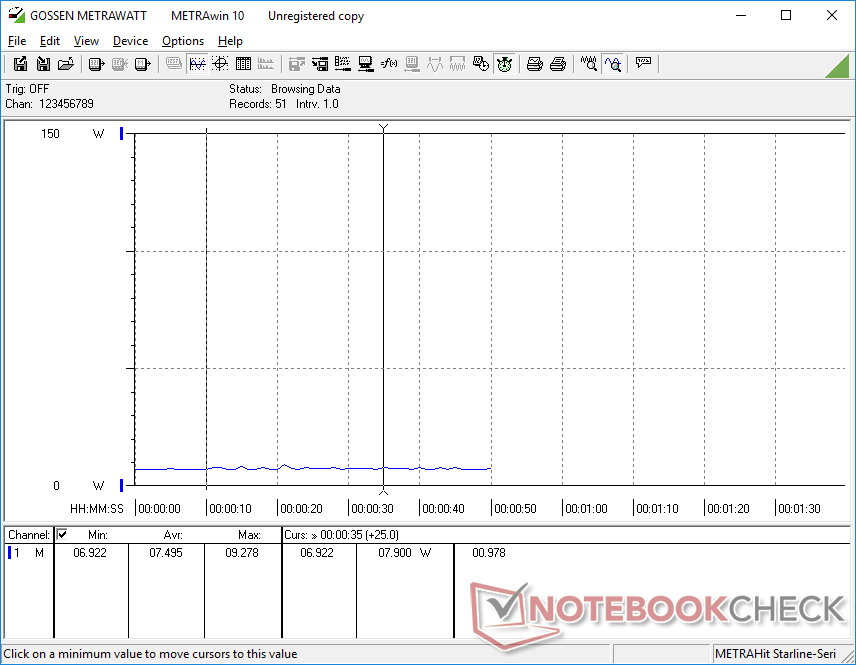
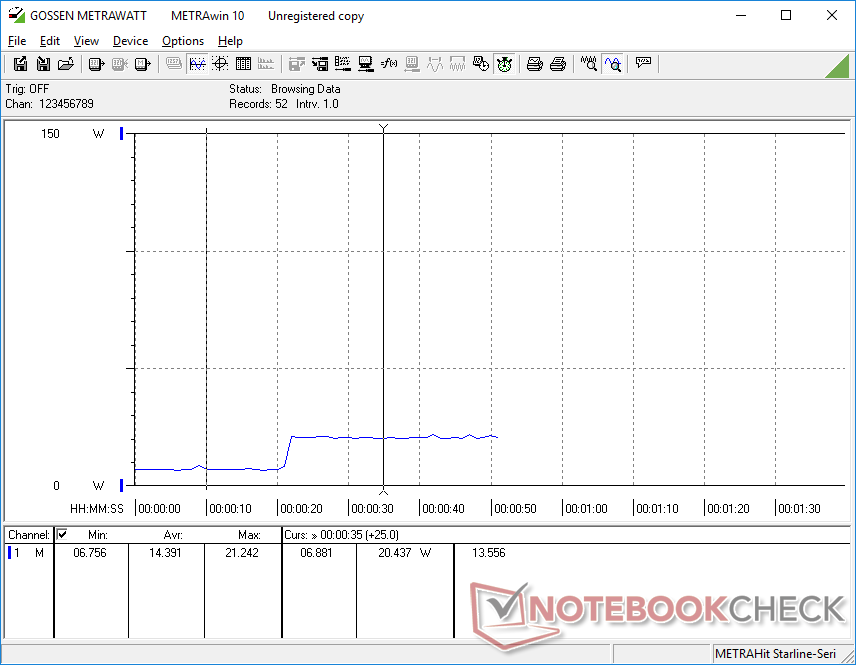
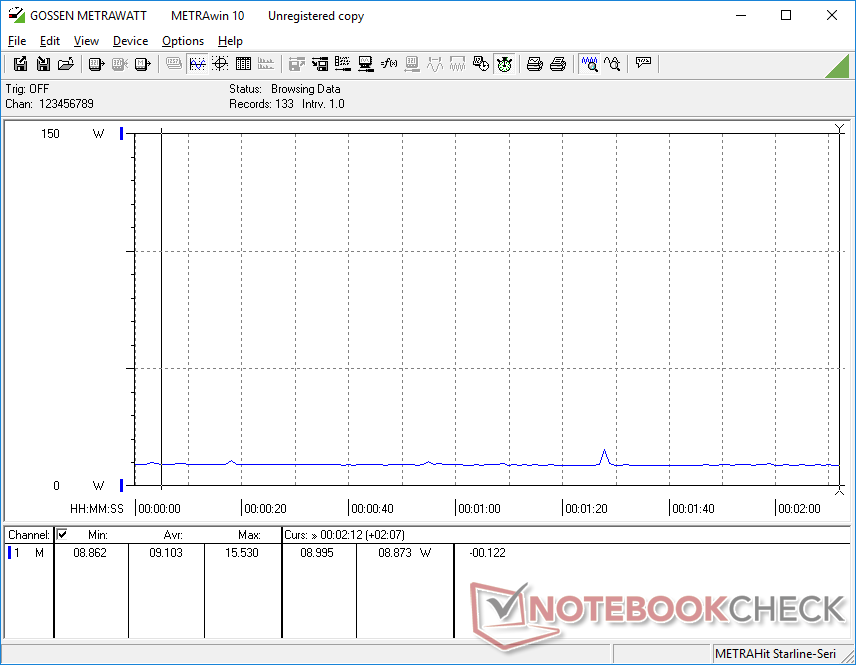
Idling on desktop demands anywhere between 6 W and 22 W. Unlike laptops with IPS or TN panels, however, OLED power consumption is tied to onscreen colors. As shown by our power consumption graphs below, idling on a completely black screen and a completely white screen at minimum brightness is a difference of just 1 W. Meanwhile, idling on a completely black screen and a completely white screen at maximum brightness is a difference of 13.5 W. Displaying white on an OLED panel draws significantly more power than a typical IPS display which we explored in more detail here with the Razer Blade 15 OLED.
Manufacturers are well aware of how white colors can impact OLED power consumption. It's not a coincidence that OLED laptops from Dell, Alienware, and Razer all default to gray or black Windows color schemes instead of the usual white to save on power and extend the life of the panel.
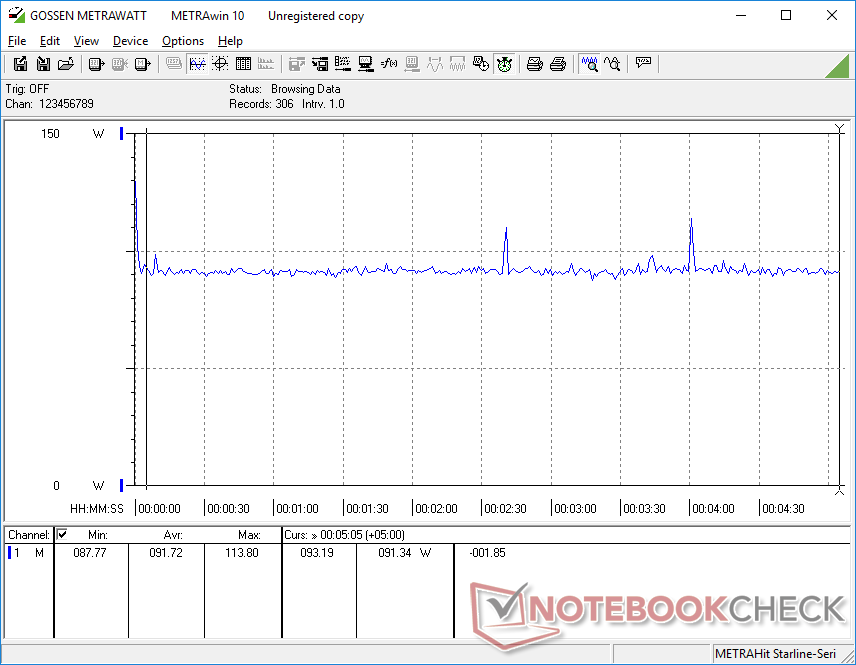
When running Witcher 3, consumption remains constant at just under 92 W to be about 11 percent more power efficient than the XPS 15 9570 with GTX 1050 Ti Max-Q graphics. These results are excellent when considering that the GTX 1650 can be up to 50 percent faster than the GTX 1050 Ti Max-Q on paper for significantly improved performance-per-Watt. In reality, however, real-world gaming performance on the XPS 15 7590 can be slower than the average GTX 1650 depending on the title and so its performance-per-Watt advantage is not as high as it could have been.
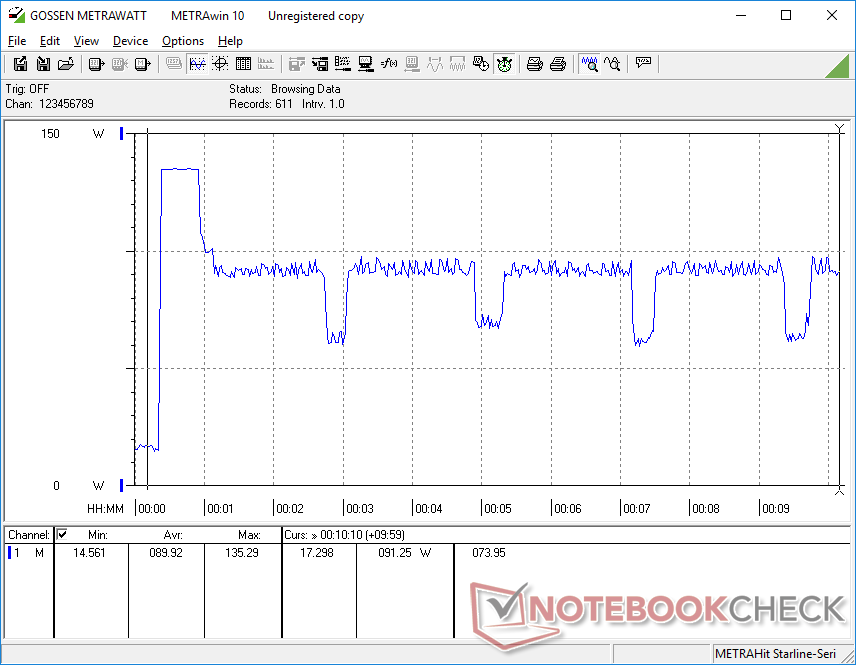
Power consumption becomes a roller coaster ride when running Prime95. These findings are important to mention because they relate directly to clock rates and thus the cycling CPU performance as shown by our CineBench loop test and Stress Test results above. Consumption spikes to 135.3 W for the first 10 seconds after initiating Prime95 before eventually dropping to 98.3 W for the next 4.5 minutes. Thereafter, consumption would cycle between 60 W and 98 W indefinitely. These results back up our stress test observations above where clock rates would be highest at about 3.4 GHz only during the start of the test before falling and cycling between 1.9 GHz and 2.7 GHz. This is unusual because most other laptops with Core H series CPUs do not behave this way; instead, they would spike up to a maximum for a few seconds before falling and stabilizing at a fixed rate of consumption and frequency.
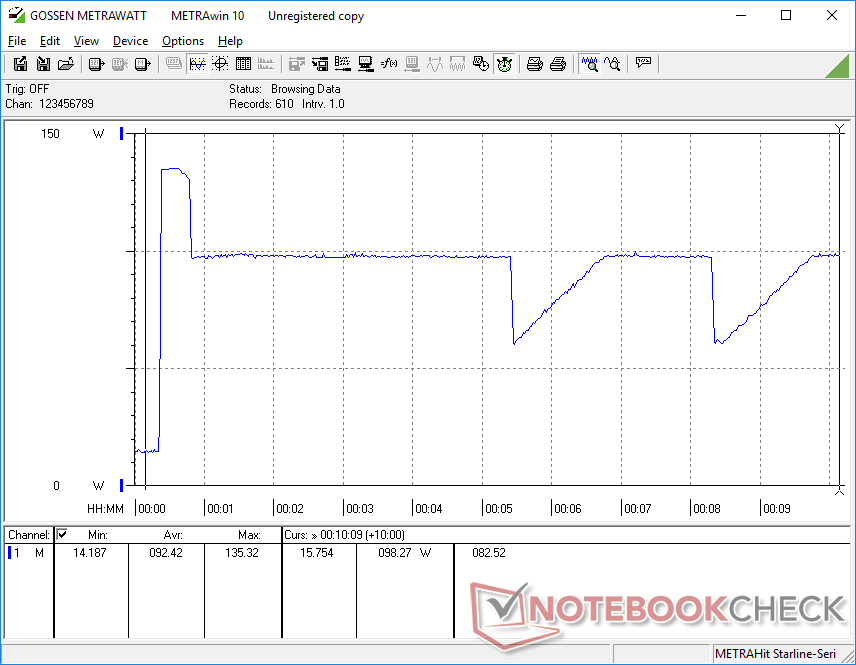
We're able to record a maximum draw of 135.3 W from the compact (~14.5 x 6.5 x 2.3 cm) 130 W AC adapter when running both Prime95 and FurMark simultaneously. Much like our Prime95 results above, however, this high of a consumption is unsustainable and so it eventually falls to the 60 W to 90 W range to keep temperatures in check. It is therefore possible to recharge the system at a decent rate while running extreme processing loads.
| Off / Standby | |
| Idle | |
| Load |
|
Key:
min: | |
| Dell XPS 15 7590 9980HK GTX 1650 i9-9980HK, GeForce GTX 1650 Mobile, Toshiba XG6 KXG60ZNV1T02, OLED, 3840x2160, 15.6" | Dell XPS 15 9570 Core i9 UHD i9-8950HK, GeForce GTX 1050 Ti Max-Q, Samsung SSD PM981 MZVLB1T0HALR, IPS, 3840x2160, 15.6" | Asus ZenBook 15 UX533FD i7-8565U, GeForce GTX 1050 Max-Q, WDC PC SN520 SDAPNUW-512G, IPS, 1920x1080, 15.6" | HP Spectre x360 15-df0126ng i7-8750H, GeForce GTX 1050 Ti Max-Q, Toshiba XG5-P KXG50PNV2T04, IPS, 3840x2160, 15.6" | Gigabyte Aero 15 OLED XA i7-9750H, GeForce RTX 2070 Max-Q, Intel SSD 600p SSDPEKKW512G8L, OLED, 3840x2160, 15.6" | Razer Blade 15 RTX 2080 Max-Q i7-9750H, GeForce RTX 2080 Max-Q, Samsung SSD PM981 MZVLB512HAJQ, IPS, 1920x1080, 15.6" | MSI GF75 Thin 9SC i7-9750H, GeForce GTX 1650 Mobile, Crucial P1 SSD CT1000P1SSD8, IPS, 1920x1080, 17.3" | |
|---|---|---|---|---|---|---|---|
| Power Consumption | -6% | 37% | 34% | -101% | -46% | -13% | |
| Idle Minimum * (Watt) | 6.2 | 7.1 -15% | 2.7 56% | 2.1 66% | 23 -271% | 12.5 -102% | 6.1 2% |
| Idle Average * (Watt) | 9.6 | 13.6 -42% | 8 17% | 6.7 30% | 25 -160% | 15.3 -59% | 11.2 -17% |
| Idle Maximum * (Watt) | 21.2 | 14.1 33% | 10.6 50% | 11.4 46% | 33 -56% | 20.7 2% | 24.5 -16% |
| Load Average * (Watt) | 104.3 | 103.9 -0% | 74 29% | 77.7 26% | 96 8% | 90.2 14% | 94.7 9% |
| Witcher 3 ultra * (Watt) | 91.7 | 103 -12% | 168 -83% | 162 -77% | 105.8 -15% | ||
| Load Maximum * (Watt) | 135.3 | 130.9 3% | 89 34% | 131.5 3% | 197 -46% | 209.3 -55% | 192.2 -42% |
* ... smaller is better
Battery Life
Runtimes are shorter than last year's XPS 15 9570 by about 30 to 60 minutes when subjected to the same WLAN conditions. Still, battery life is above average for its category at almost 8 hours of real-world browsing due in part to the large 97 Wh battery. No mass produced laptop model at the moment offers >100 Wh internal batteries since it would be considered a flying hazard and so 97 Wh is likely the highest we're going to see.
Keep in mind that white colors will consume much more power than dark colors on OLED panels. If your usual workloads are word processing or browsing where backgrounds are primarily white, then inverting the colors or setting them to darker tones will help extend battery life. The XPS 15 7590 SKUs with standard IPS panels will likely have different battery life results than what we've recorded here.
Charging from empty to full capacity takes about 2 hours compared to 1.5 hours of most other Ultrabooks. The large battery capacity is likely responsible for the slower charge rate.
| Dell XPS 15 7590 9980HK GTX 1650 i9-9980HK, GeForce GTX 1650 Mobile, 97 Wh | Dell XPS 15 9570 Core i9 UHD i9-8950HK, GeForce GTX 1050 Ti Max-Q, 97 Wh | Asus ZenBook 15 UX533FD i7-8565U, GeForce GTX 1050 Max-Q, 73 Wh | HP Spectre x360 15-df0126ng i7-8750H, GeForce GTX 1050 Ti Max-Q, 84 Wh | Gigabyte Aero 15 OLED XA i7-9750H, GeForce RTX 2070 Max-Q, 94.24 Wh | Razer Blade 15 RTX 2080 Max-Q i7-9750H, GeForce RTX 2080 Max-Q, 80 Wh | MSI GF75 Thin 9SC i7-9750H, GeForce GTX 1650 Mobile, 51 Wh | |
|---|---|---|---|---|---|---|---|
| Battery runtime | -20% | 25% | 2% | -29% | -19% | -40% | |
| Reader / Idle (h) | 15.2 | 15 -1% | 26.5 74% | 18.8 24% | 9.9 -35% | 15.9 5% | |
| WiFi v1.3 (h) | 7.8 | 8.6 10% | 8.7 12% | 8.8 13% | 5.7 -27% | 6.6 -15% | 4.7 -40% |
| Load (h) | 3.3 | 1 -70% | 2.9 -12% | 2.3 -30% | 2.5 -24% | 1.7 -48% |
Pros
Cons
Verdict
The XPS 15 7590 with Core i9-9980HK and GTX 1650 is the fastest iteration of the XPS 15 yet — as it should be. On the other hand, it's also the slowest iteration of the i9-9980HK and GTX 1650 we've tested on a laptop thus far. There's a reason why you don't see many Ultrabooks with Core i9 CPUs let alone unlocked Core i9 CPUs *and* GeForce GTX GPUs. Jamming so much performance in a chassis this size will limit the full potential of the processors because they will be at the mercy of the cooling solution. We know that both the Core i9 and GTX 1650 in the XPS 15 are capable of performing much faster based on what we've recorded from other larger laptops with the same CPU and GPU options.
The data makes sense once you look at the history of the current XPS 15 design. Its chassis was developed nearly five years ago during the Intel Skylake days before Core i9 even existed. Core i9 CPUs are notable for their very high Turbo Boost clock rates that can only be exploited with a suitable cooling solution. If you can't maintain those high Turbo Boost clock rates, then overall performance won't be all that much better than a regular Core i7. These fancy new processors are pushing the limits of what the aging XPS 15 chassis is capable of running.
Despite the shaky CPU and GeForce GTX performance results, the XPS 15 continues to be one of the most recognizable Ultrabooks in the market. It's surprising that the visual design has aged so well in terms of build quality and aesthetics even in the face of newer 15.6-inch Ultrabooks. For better performance-per-dollar and a more balanced machine, however, we recommend the Core i7 or Core i5 SKUs of the XPS 15 7590 instead.
The Core i9-9980HK and GTX 1650 configuration performs faster than last year's Core i9-8950H and GTX 1050 Ti Max-Q configuration, but the deltas are minor and not as wide as they could have been. These unlocked Core i9 options just don't work that well for the current iteration of the XPS 15 chassis. The most compelling feature of the 7590 series is not the CPU or GPU update, but the introduction of an OLED option.
Dell XPS 15 7590 9980HK GTX 1650
- 08/31/2022 v7 (old)
Allen Ngo
Price comparison
