Dell Latitude 3590 review: Office laptop with major flaws

The Dell Latitude 3590 is an office/business laptop which is positioned in the (depending on configuration) lower to middle price class which, according to Dell, is aimed at the small to medium business community. They tout its easy servicing as well as its security features such as Windows 10 with Bitlocker drive encryption, TPM 2.0, fingerprint reader and the Dell Data Protection Suite.
The Latitude 15 3000 series first appeared in 2016, and we tested this model's predecessor, the 3570. Whilst the 2016 models were all equipped with a TN screen and 1,366x768 resolution, the current variants are all equipped with a FullHD panel - also based on the TN technology.
As well as the screen and Windows 10 Pro license, all models in the series share the same chassis, input devices and connectivity with the exception of an optional microSIM slot. Configuration options include CPU; RAM as well as SSD capacity (a more pedestrian 1 TB HDD is also available). The models on offer are not very clearly defined - the majority of variants however, are equipped with 8 GB of RAM and a 256 GB SSD. That goes for our review sample also with its i5-8250U CPU which has the model number D643G, and is available from 800 Euros (~$912).
To select the competition for this laptop, we focused on the same class and format and of course the same price segment. Due to a lack of selection and for size comparison purposes, we have also included a 14-inch office/business laptop in the lineup. Joining the Dell on the start line are:
- Lenovo ThinkPad E590 (AMD GPU)
- Toshiba Tecra A50-E-110
- Dell Latitude 14 5495 (14 inch, AMD CPU and GPU)
Case - Some Minor Issues
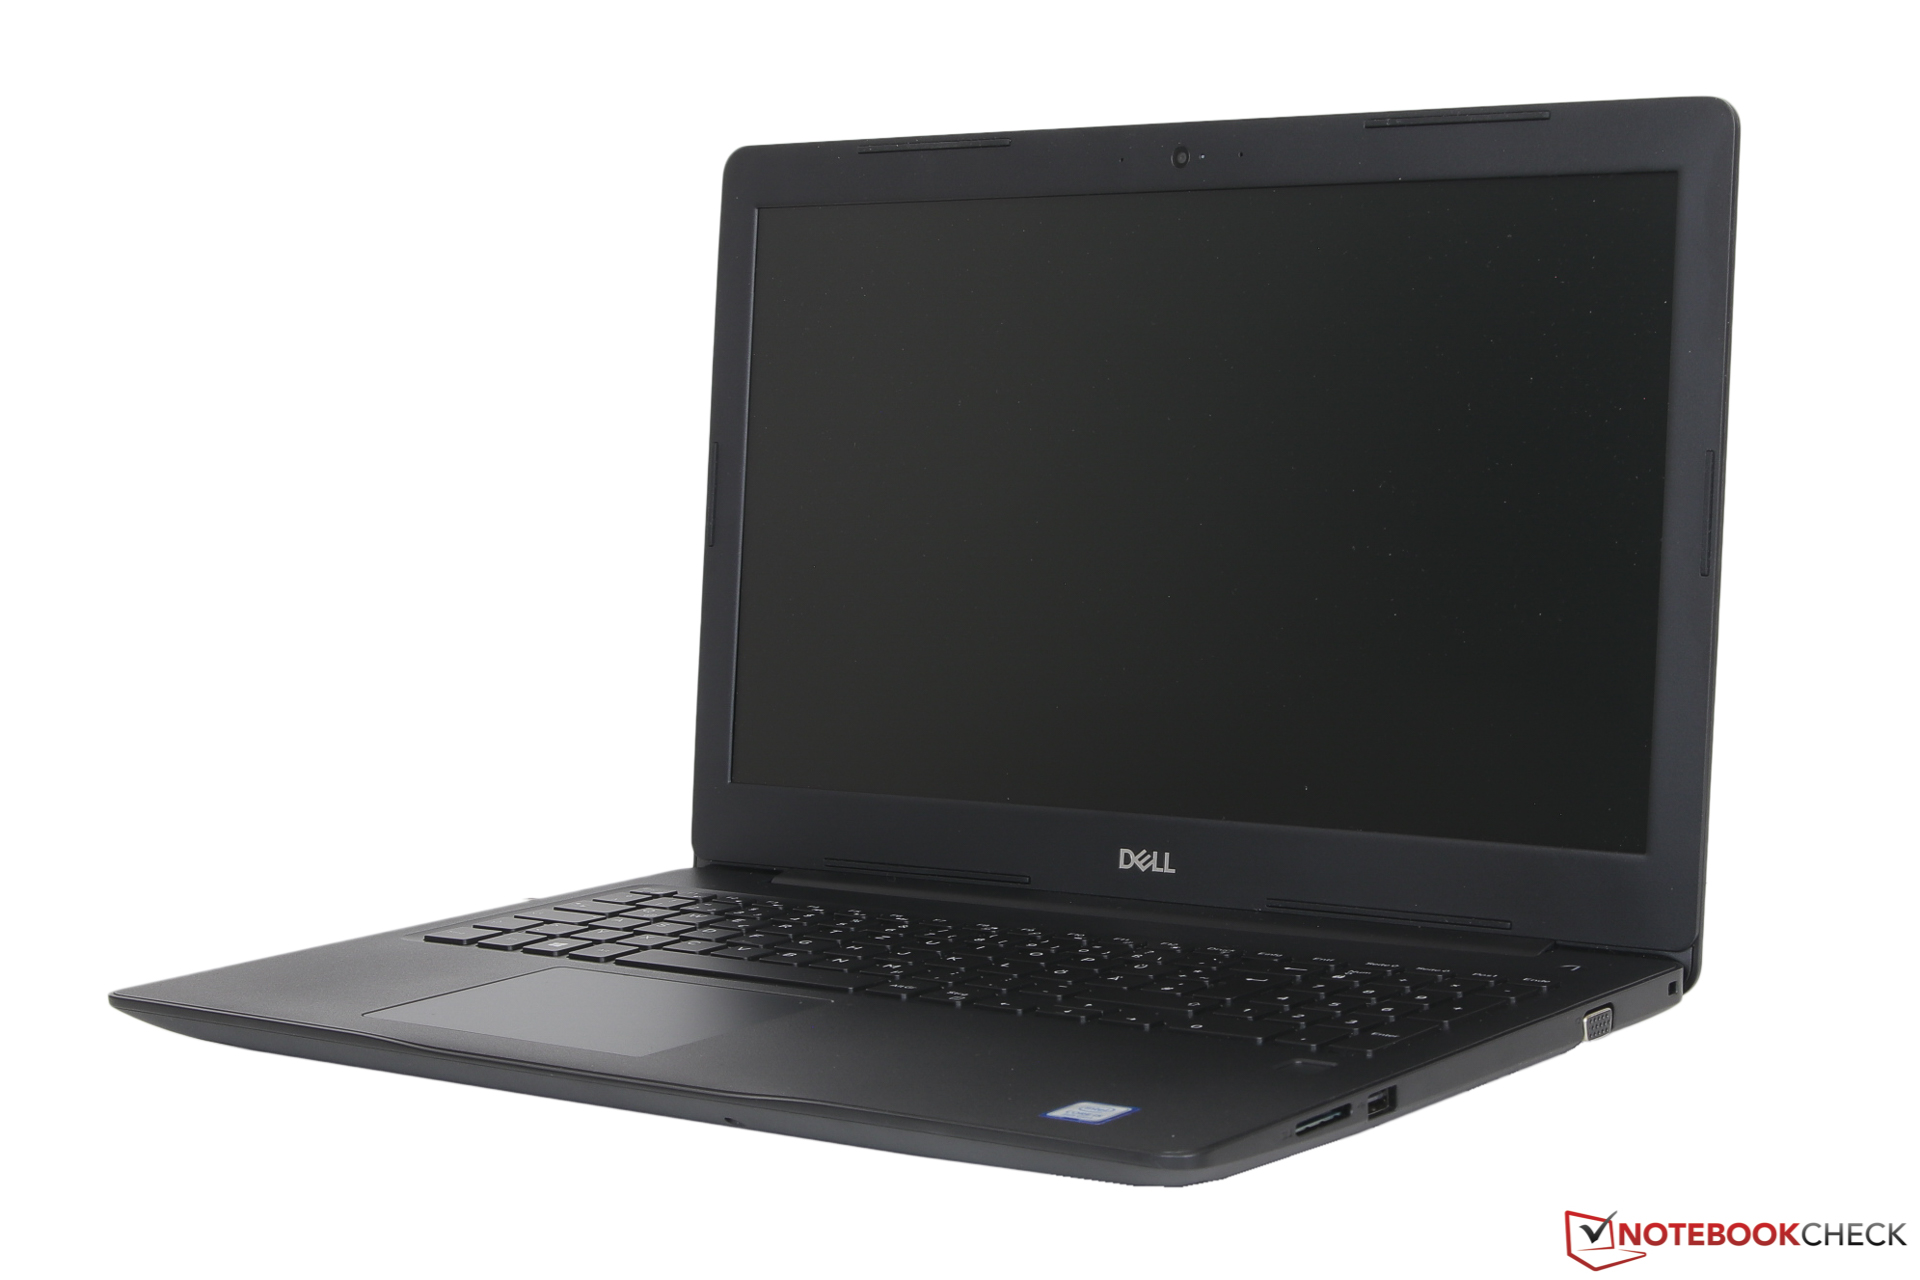
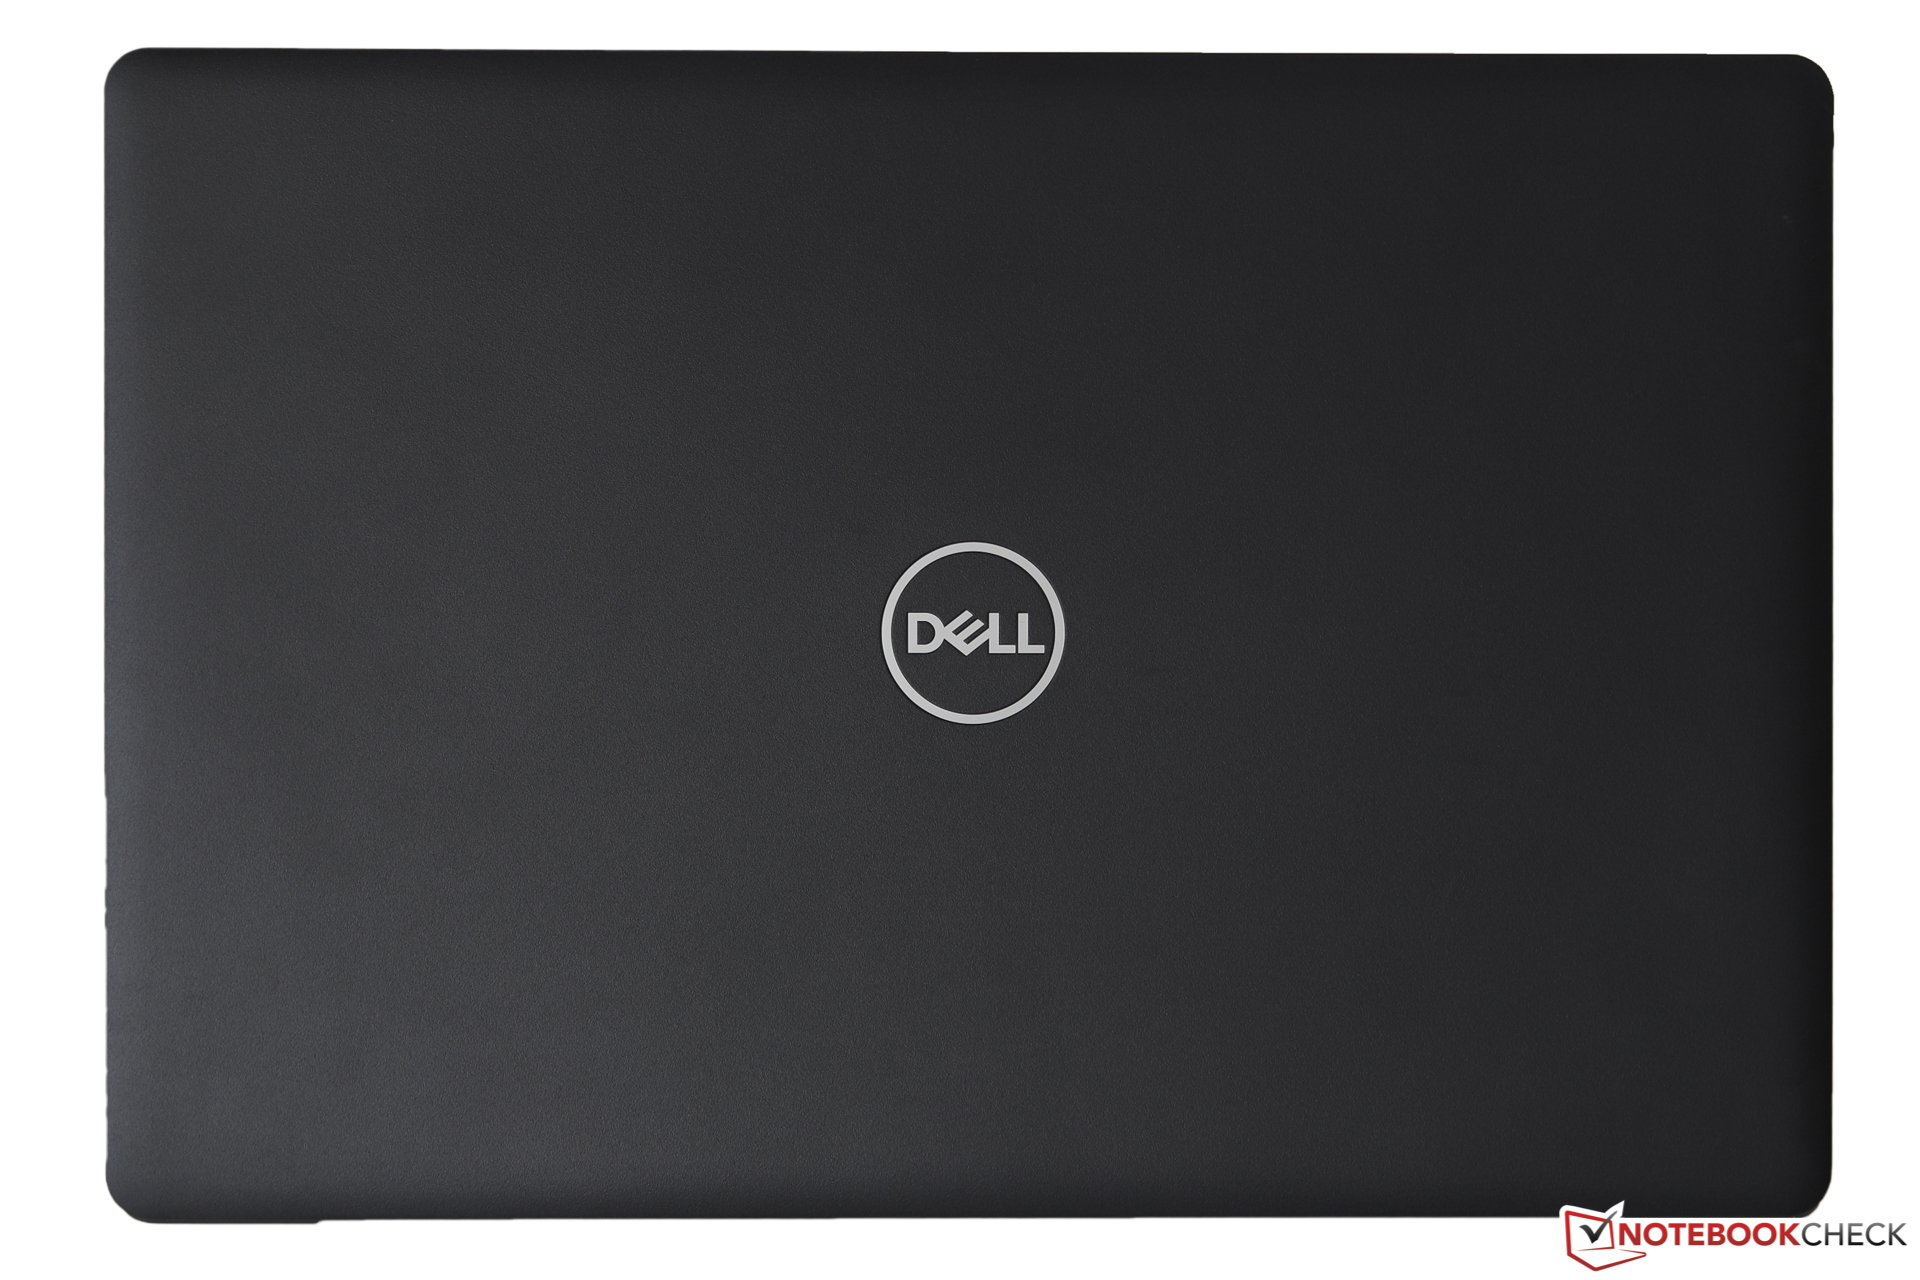
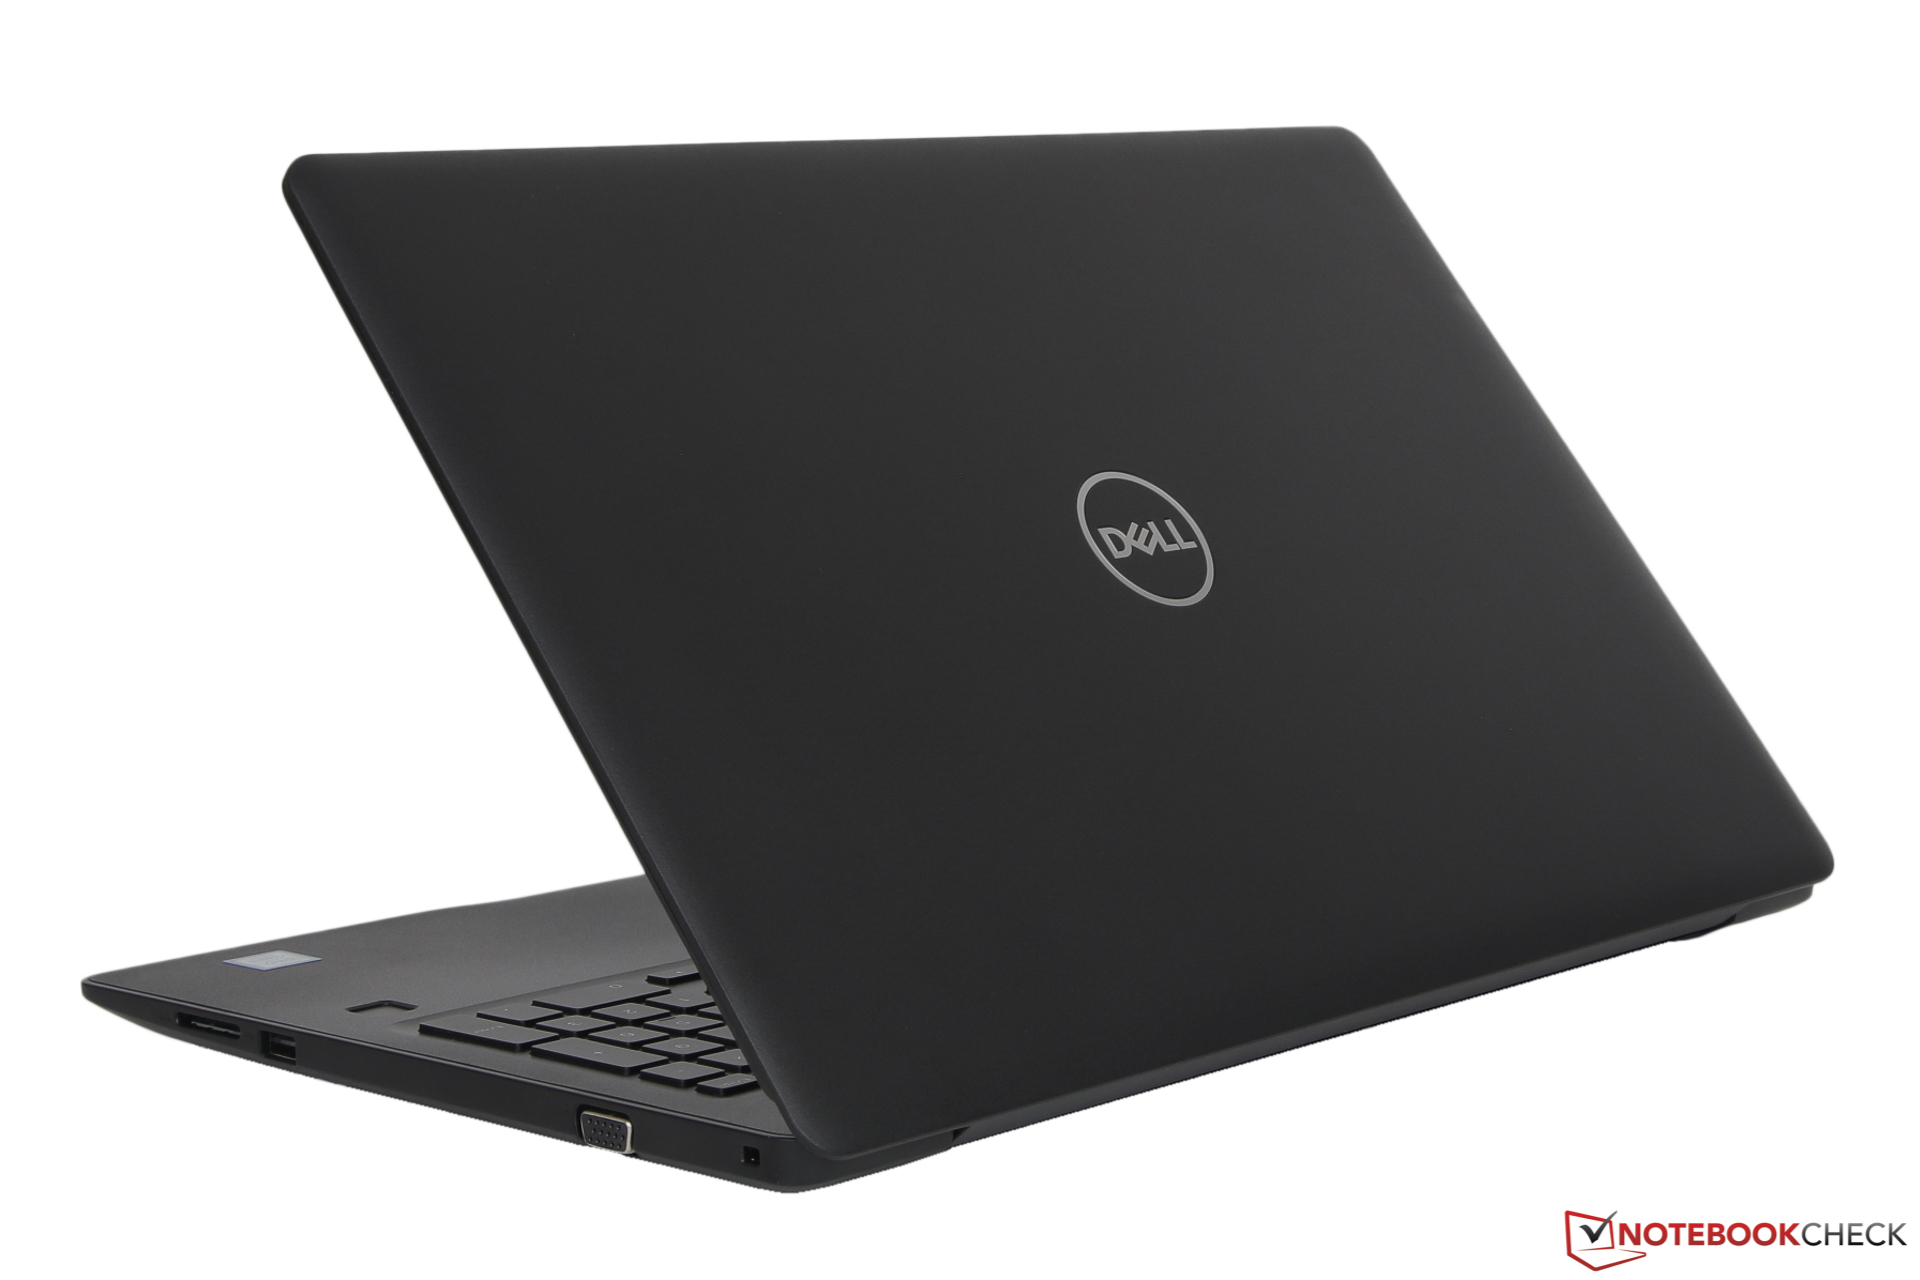
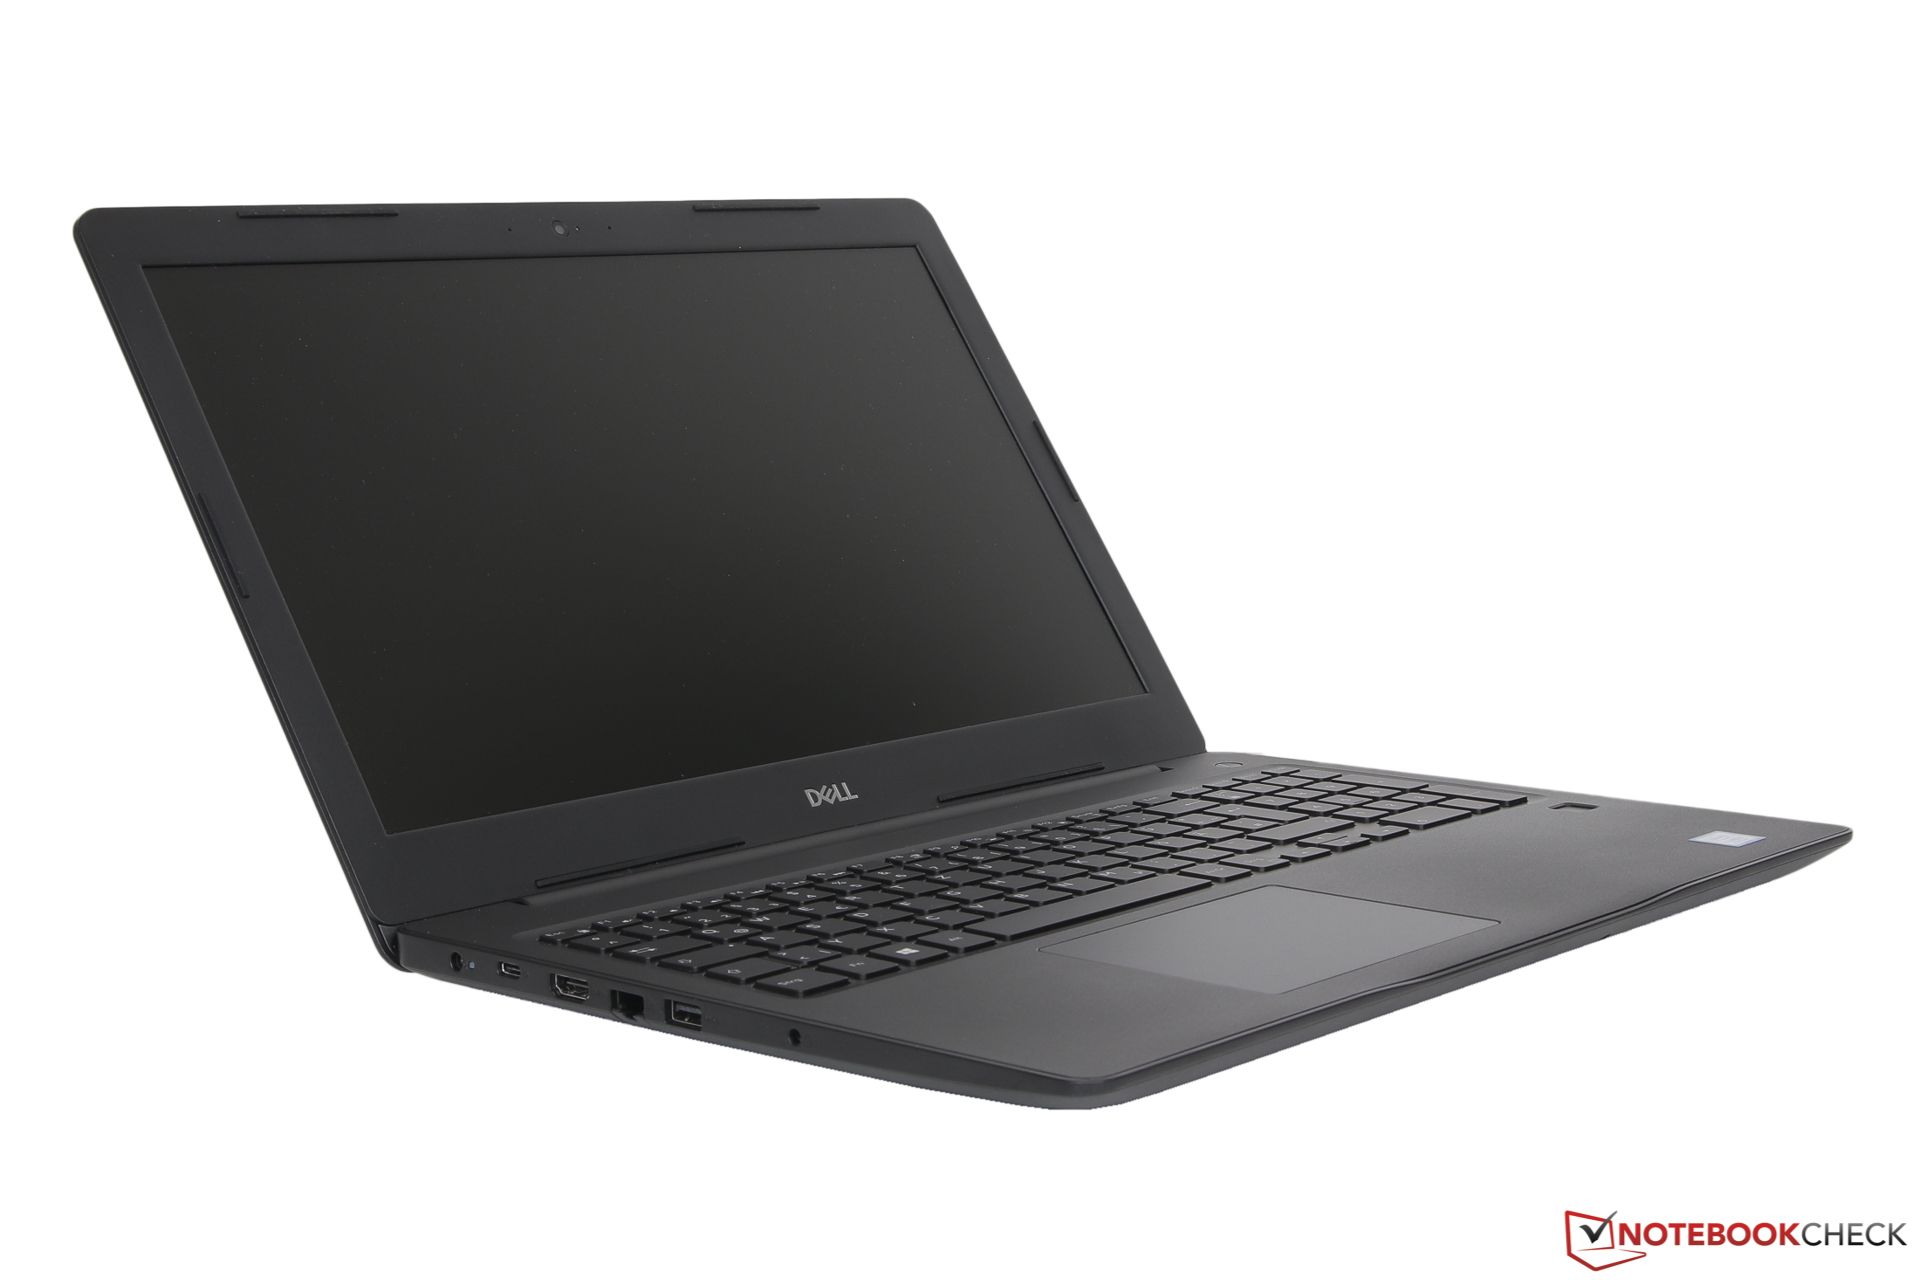
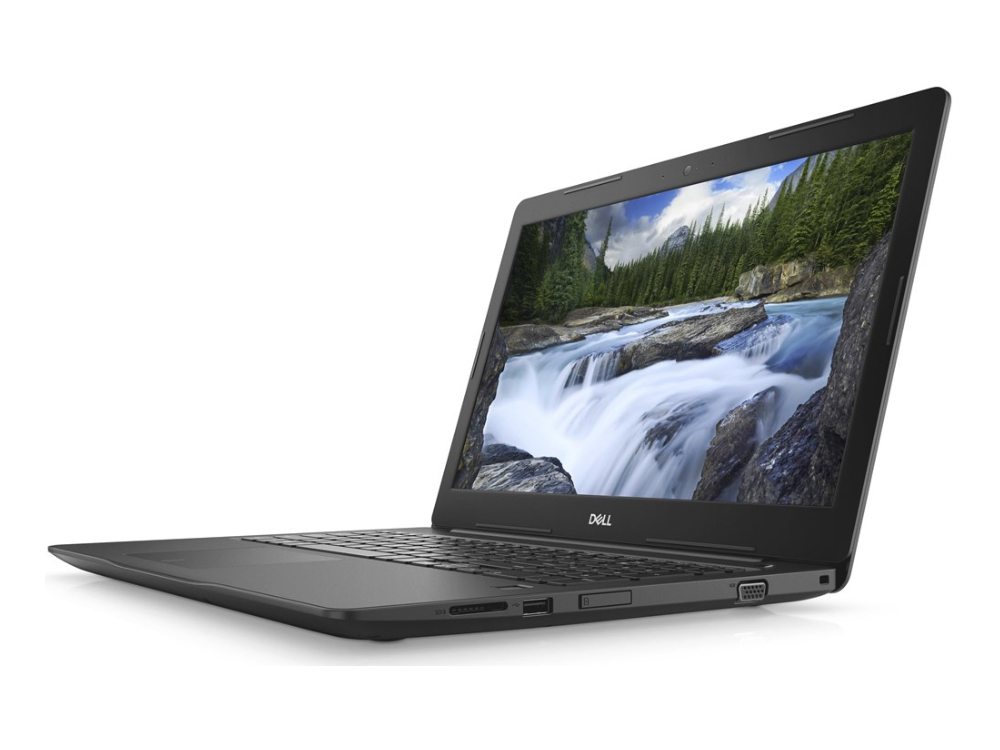
The housing is comprised completely of black and grippy plastic whose matte surface is quite fingerprint-prone. Design accents are absent apart from the silver logo on the lid - simple is the design language here.
With a little applied force, the base does flex, but only very slightly, and exhibits very little in the way of creaking or cracking noises. Below the screen, the laptop case can be pushed slightly inwards but overall gives a very solid, if not particularly premium, impression. In terms of workmanship, aside from a few areas where panels do not always line up precisely, there are no issues with overhangs or sharp edges. Not so nice: The gap between base and top panel of the main unit goes around the entirety of the device and is so wide in areas, that dirt could accumulate in it.
The screen bezel, relatively wide by today's standards, means that the Latitude 3590 is not a compact 15-inch device. The display portion of the laptop is also not particularly solid and is easily twisted to the degree that distortion on the screen is visible. It also only requires light force pressing on the rear of the display to result in the same distortion. We would have expected more solidity in this area. Opening the laptop with one hand is not possible as this will raise the base along with the display. If bumped, the display will also sway back and forth for a couple of seconds.
As alluded to above, the Dell 3590 is a relatively bulky and not particularly light 15.6-incher whose measurements are almost identical to the Toshiba Tecra A50. The Lenovo ThinkPad is somewhat slimmer, lighter and narrower whilst the single 14-inch model in the comparison, the Dell Latitude 14 5495, has around 33% less footprint whilst being around the same height at 22.5mm (~0.9 in).
Dell Laptop with Business Configuration
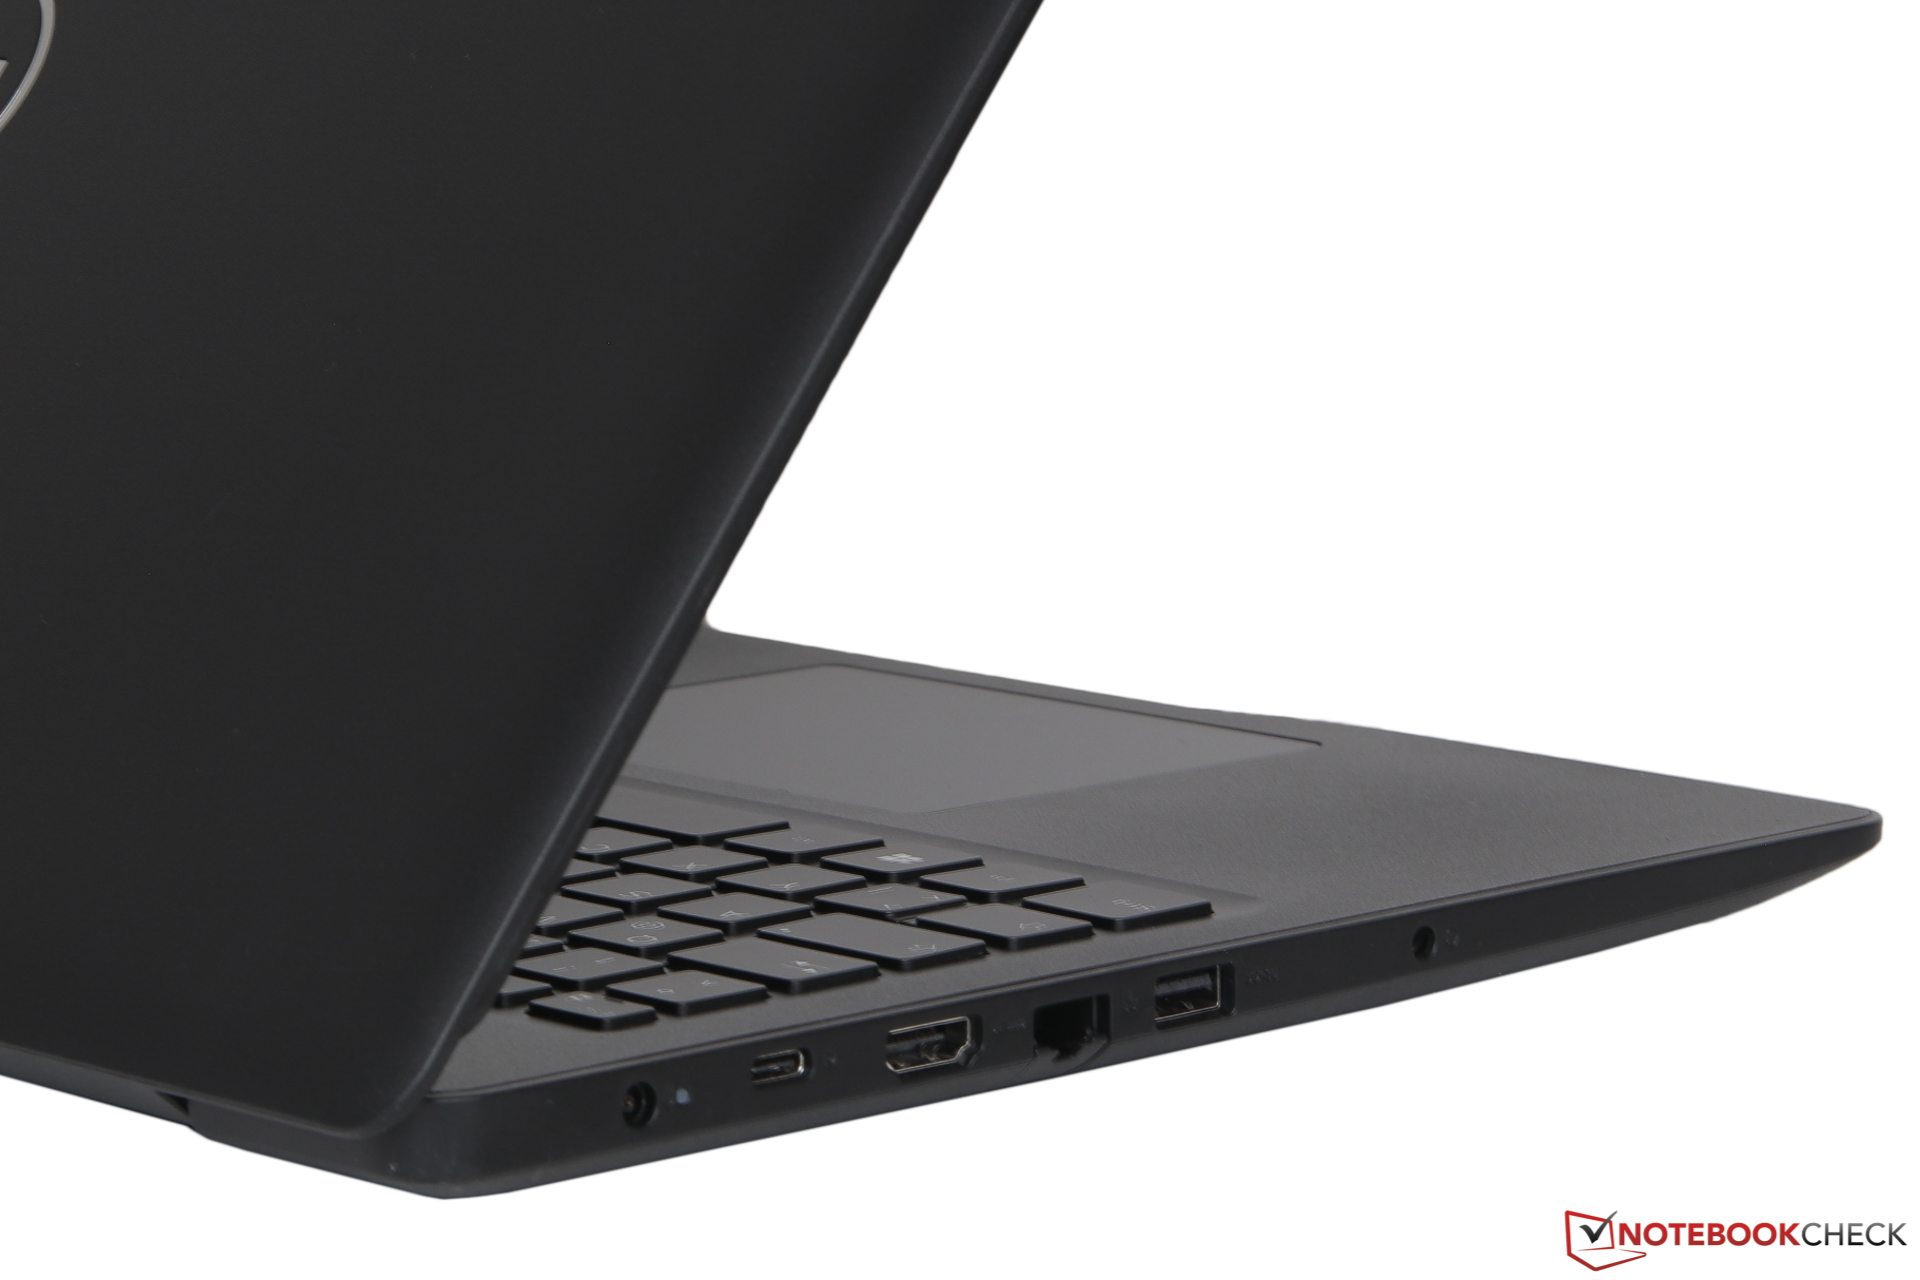
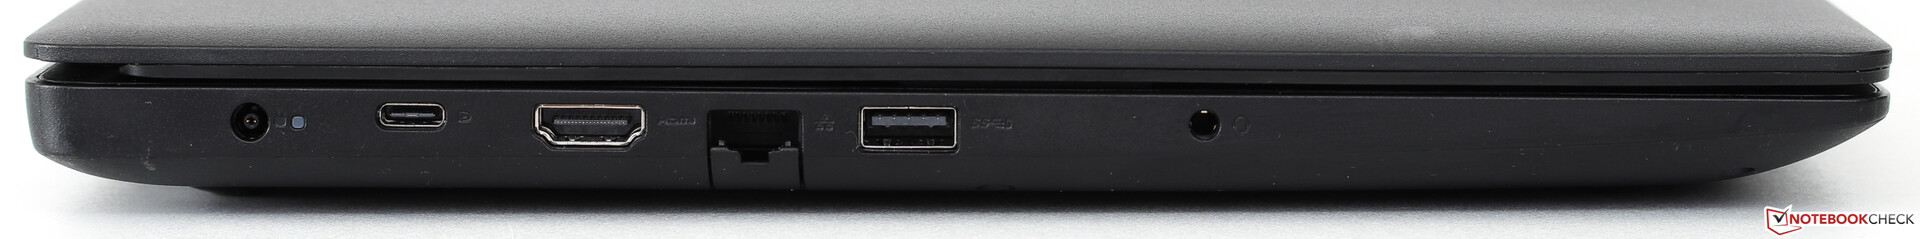
In terms of connectivity we would expect everything to be pretty much included, as required by its target market. Of the three USB 3 ports, one is a type-C and offers a DisplayPort option alongside HDMI 1.4 and the venerable VGA port, often included on business laptops for connecting to projectors in meeting rooms. For permanent desk usage, a flip-down Ethernet port is present.
Whilst the ports on the left side of the device are in the middle to the rear of the device, a USB 2.0 port, most likely destined to be used for connecting an external mouse, is located on the front right of the laptop - a double faux-pas, given its old and slow technology, and the likelihood that it will get in the way of other cables and USB sticks etc. For this reason, the ports do have a good distance between them.
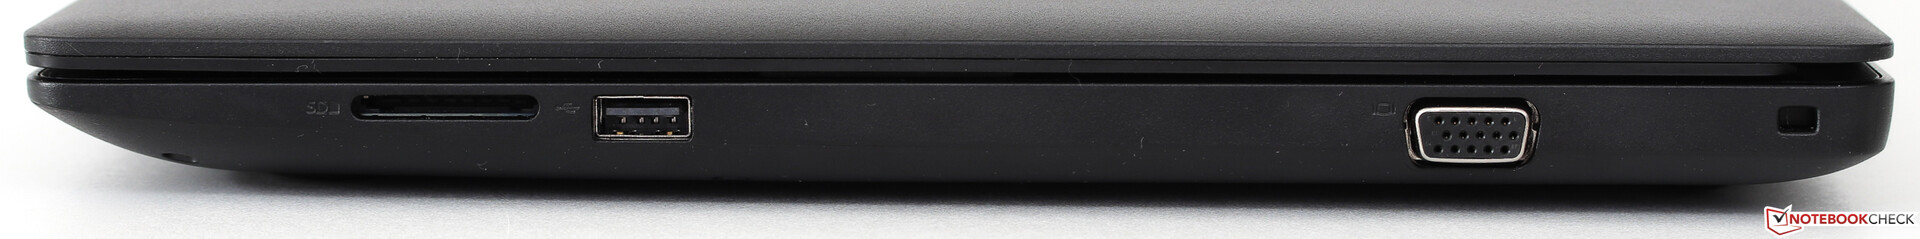
SD Card Reader
Using our reference SD card, a Toshiba Exceria Pro SDXC 64 GB UHS-II, the card readers of the Dell as well as the Toshiba Tecra are not able to exceed the poor transfer speed limitations of USB 2.0. Photographers who frequently transfer large image files from SD cards to their laptop should give these devices a wide berth - however, as will become clear in the display section below, that is far from the biggest reason why they should avoid this model. To see how an SD card reader can be done properly we need only look so far as the smaller Latitude model, which achieves 5 to 8 times faster data transfers.
| SD Card Reader | |
| average JPG Copy Test (av. of 3 runs) | |
| Dell Latitude 14 5495 (Toshiba Exceria Pro SDXC 64 GB UHS-II) | |
| Lenovo ThinkPad E590-20NB0012GE (Toshiba Exceria Pro M501) | |
| Average of class Office (19.8 - 198.5, n=22, last 2 years) | |
| Toshiba Tecra A50-E-110 (Toshiba Exceria Pro SDXC 64 GB UHS-II) | |
| Dell Latitude 15 3590 (Toshiba Exceria Pro SDXC 64 GB UHS-II) | |
| maximum AS SSD Seq Read Test (1GB) | |
| Dell Latitude 14 5495 (Toshiba Exceria Pro SDXC 64 GB UHS-II) | |
| Lenovo ThinkPad E590-20NB0012GE (Toshiba Exceria Pro M501) | |
| Average of class Office (27.4 - 249, n=21, last 2 years) | |
| Toshiba Tecra A50-E-110 (Toshiba Exceria Pro SDXC 64 GB UHS-II) | |
| Dell Latitude 15 3590 (Toshiba Exceria Pro SDXC 64 GB UHS-II) | |
Communication
Taking care of communications is the Qualcomm/Atheros QCA6174 (Dualband, 802.11ac, MU-MIMO 2x2, max. 867 MBit/s) module with Bluetooth 4.2 - also included in the smaller Latitude 14 5495. In that model the module doesn't achieve more than an average of 452 MBit/s in best-case conditions, however the review laptop is even worse, only managing a woeful 292 MBit/s. The recently released Intel Wireless-AC 9260 module in the Lenovo ThinkPad 590 is able to score around 20% higher results compared to the rest of the field. When it comes to transmit speeds however, there is little difference.
| Networking | |
| iperf3 transmit AX12 | |
| Lenovo ThinkPad E590-20NB0012GE | |
| Dell Latitude 15 3590 | |
| Toshiba Tecra A50-E-110 | |
| Dell Latitude 14 5495 | |
| iperf3 receive AX12 | |
| Lenovo ThinkPad E590-20NB0012GE | |
| Dell Latitude 14 5495 | |
| Toshiba Tecra A50-E-110 | |
| Dell Latitude 15 3590 | |
Security
For mobile usage this model is equipped with a comprehensive package of security features. Along with the Trusted Platform Module version 2.0, there is a simple to use and good functioning fingerprint reader which in Windows 10 can also be used in conjunction with BitLocker drive encryption and the Dell Data Protection Suite.
Accessories
Alongside the usual power adaptor, there is only a quick start guide as well as a page with safety information in the plain box.
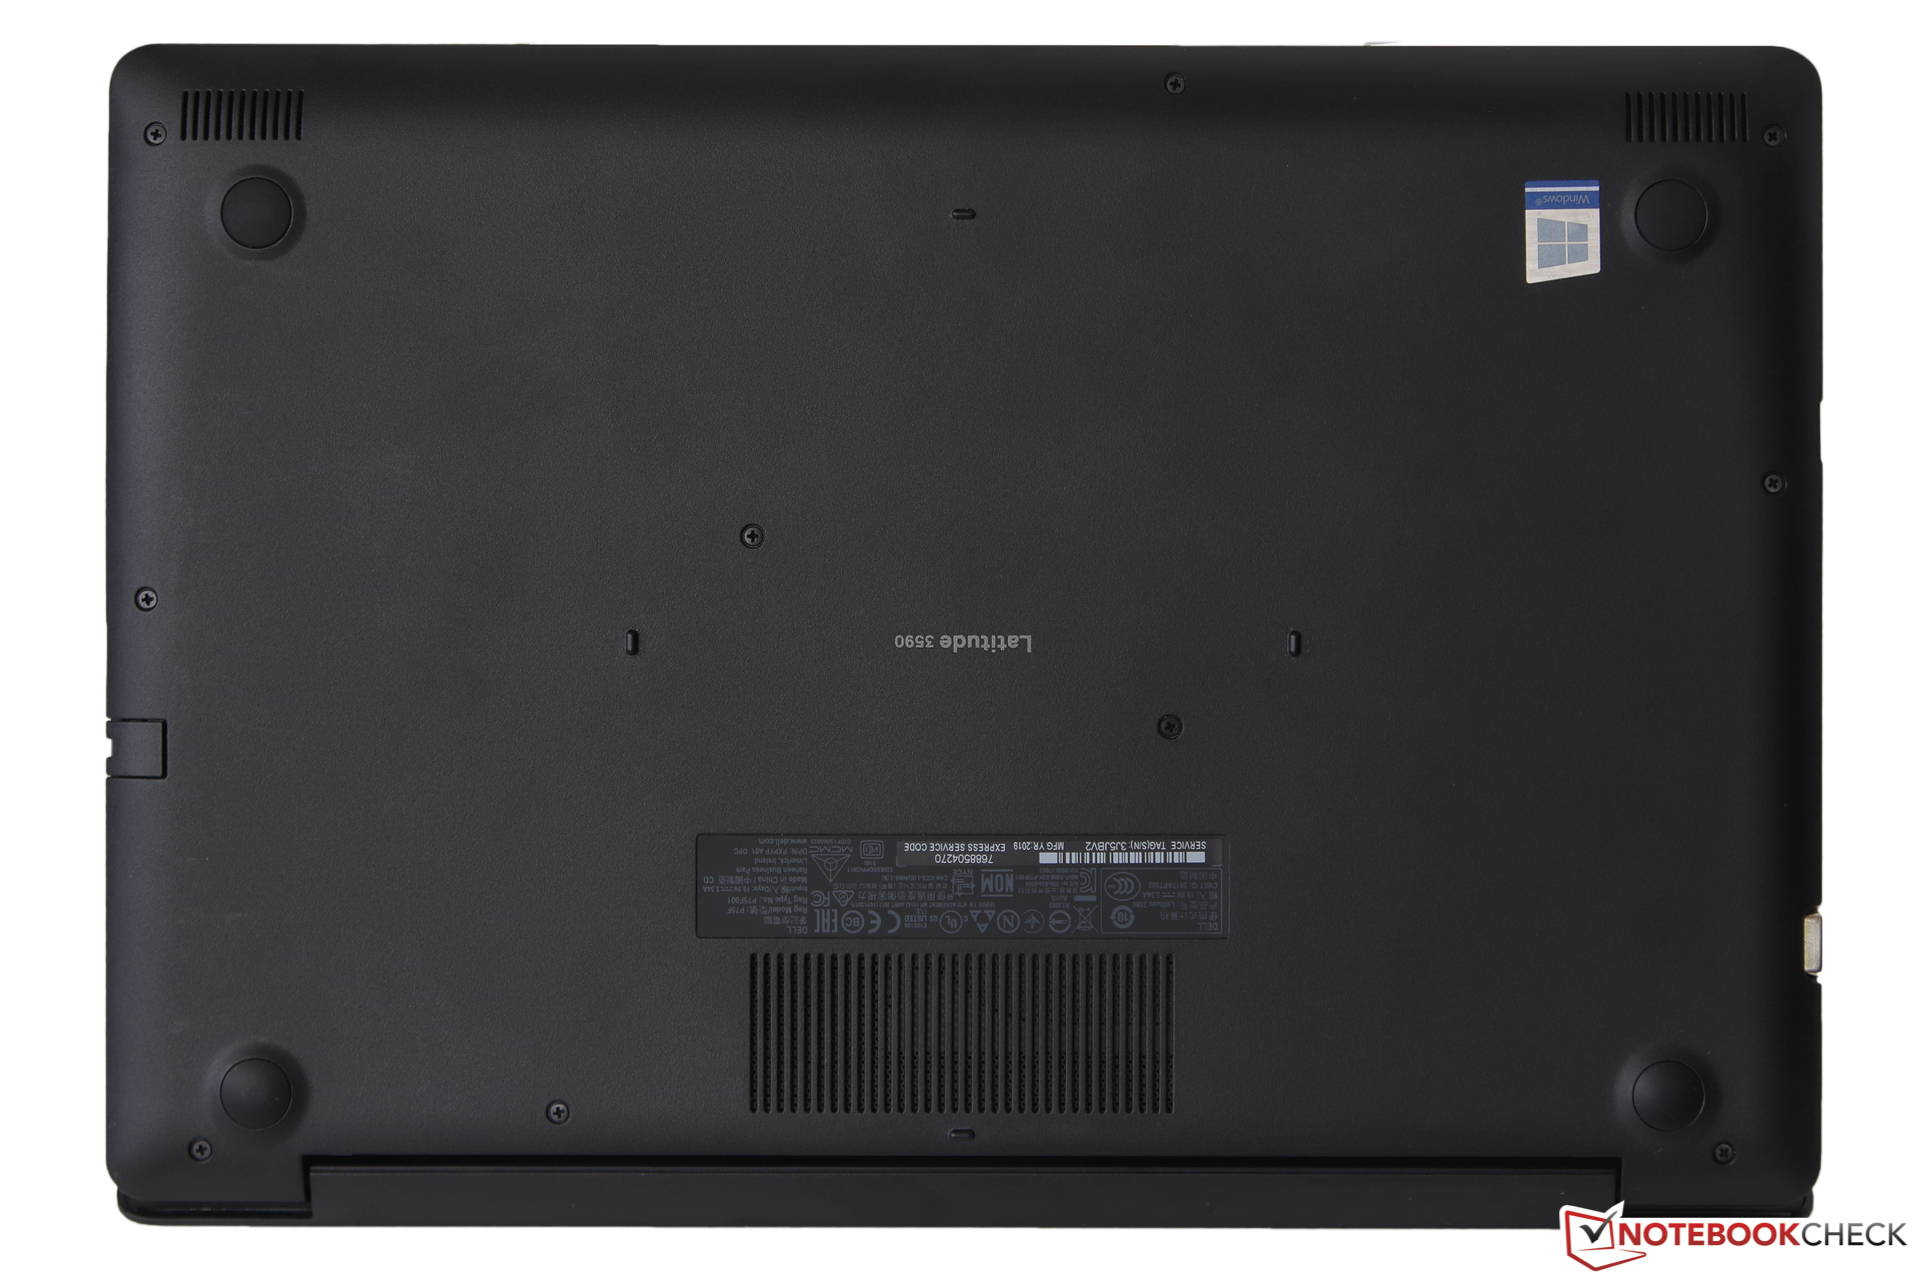
Self-Servicing
There is no flap to replace components, and no removable battery. The bottom panel can be removed with nine philips screws. However, as the panel wraps around to meet the top portion of the laptop, this makes removal a little trickier and as our review sample was a shop device, we decided not to attempt removal.
Guarantee
Dell includes a 1 year basic support - next working day plan, which offers onsite repairs. When purchased directly from Dell it is possible to purchase additional service and guarantee options such as longer guarantee windows, faster response times, or next-day replacement device, etc.
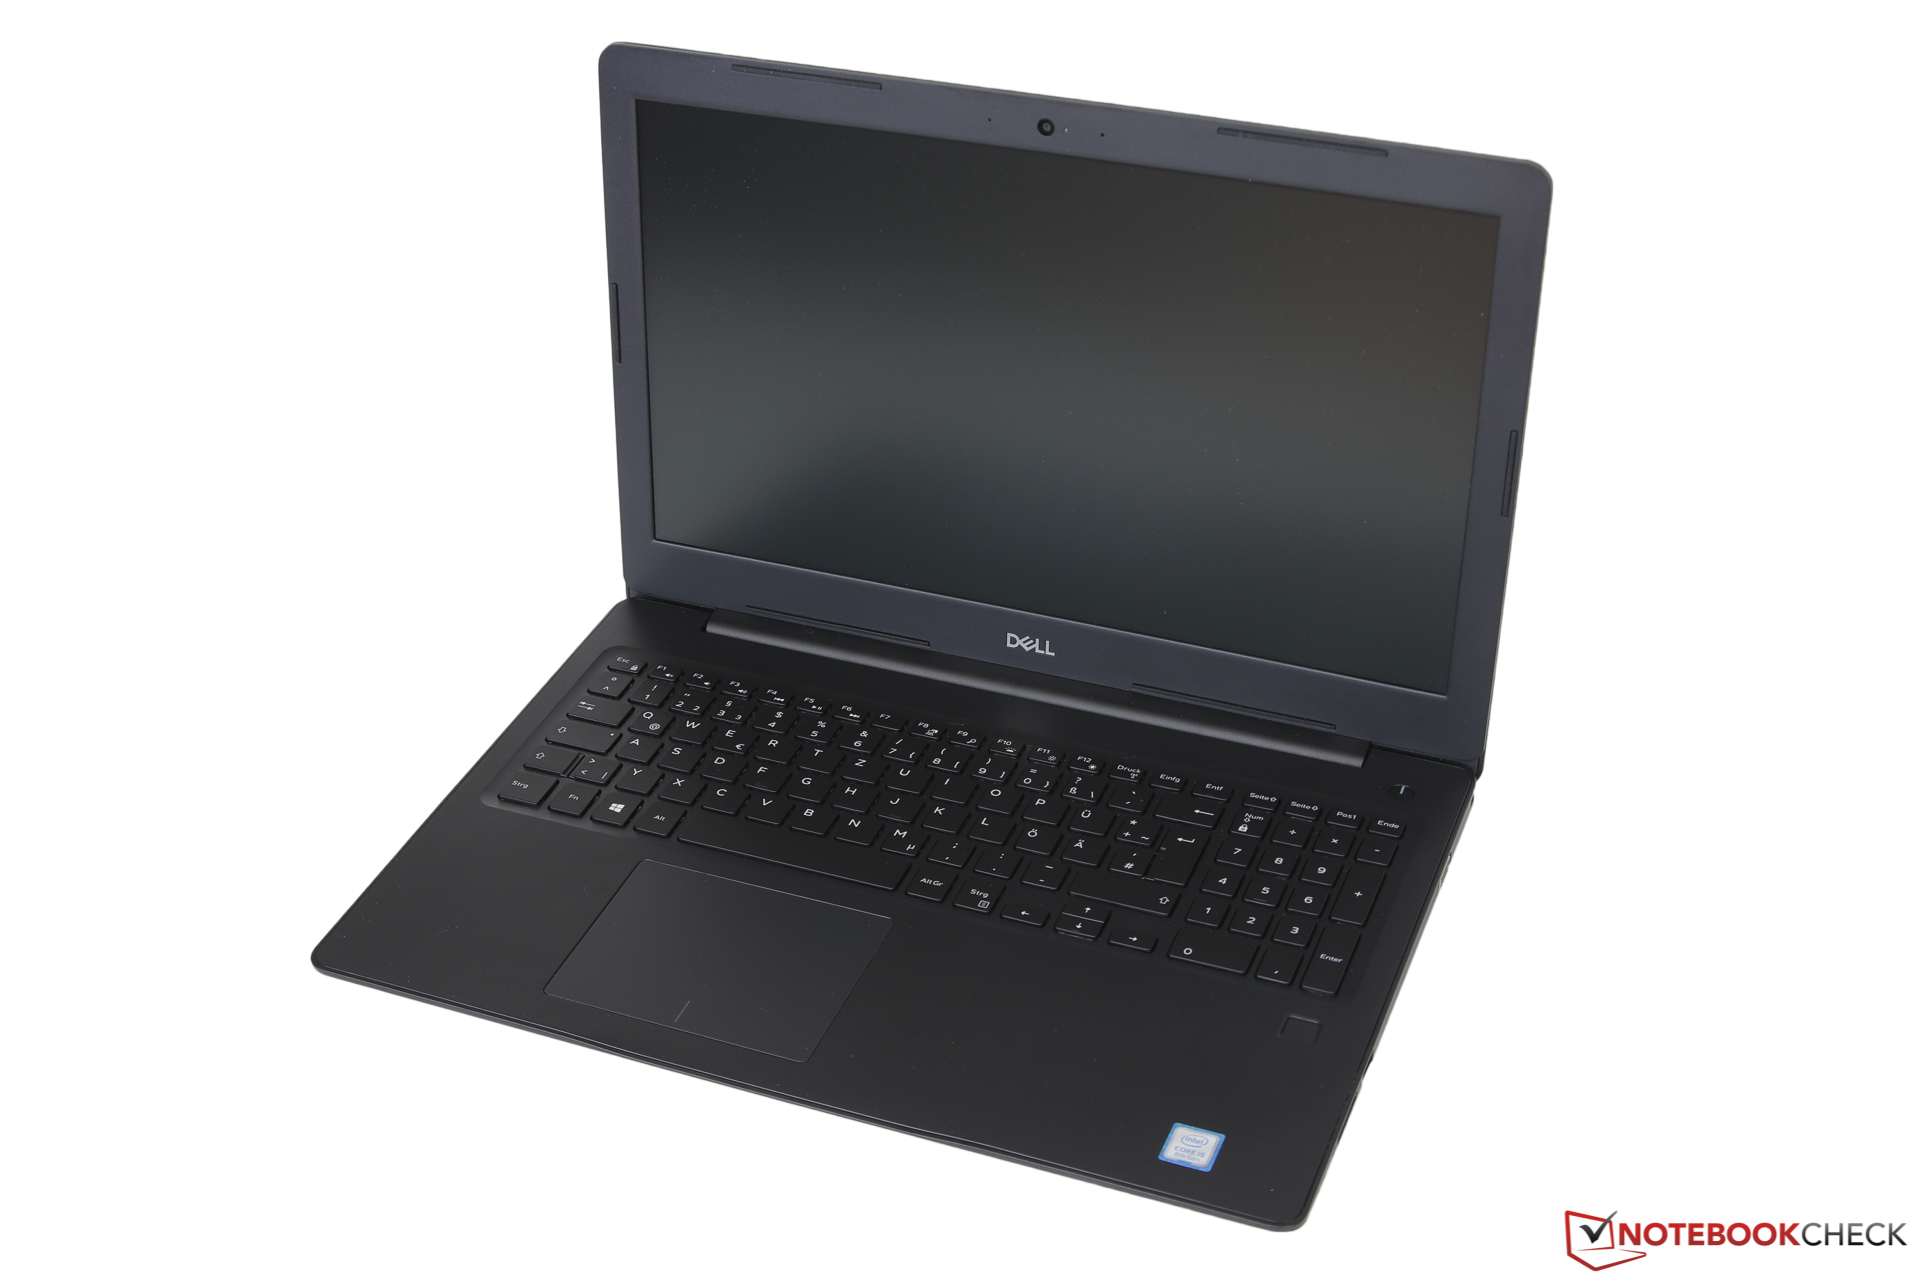
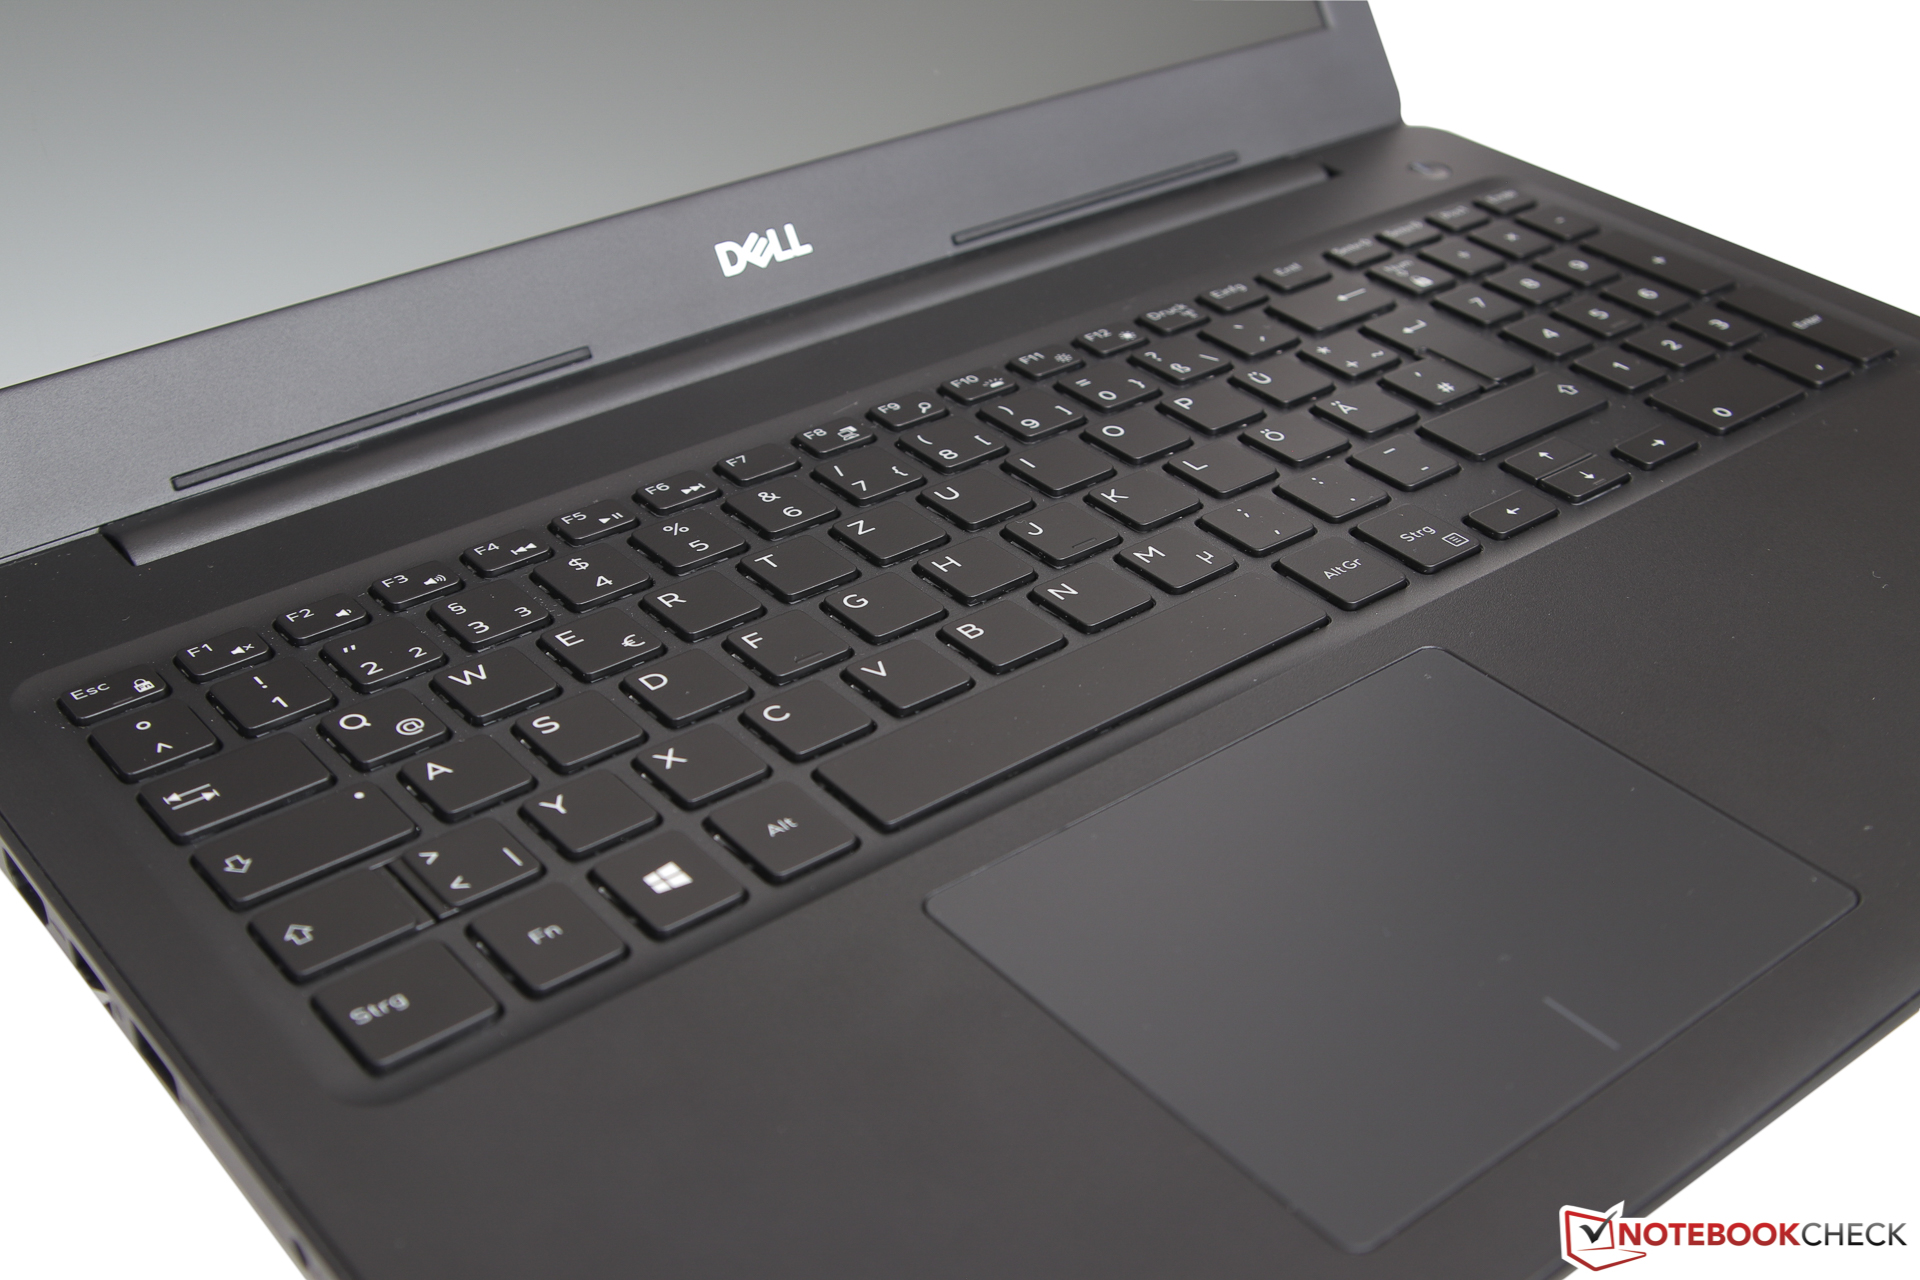
Input Devices - A Strength of The Latitude
Keyboard
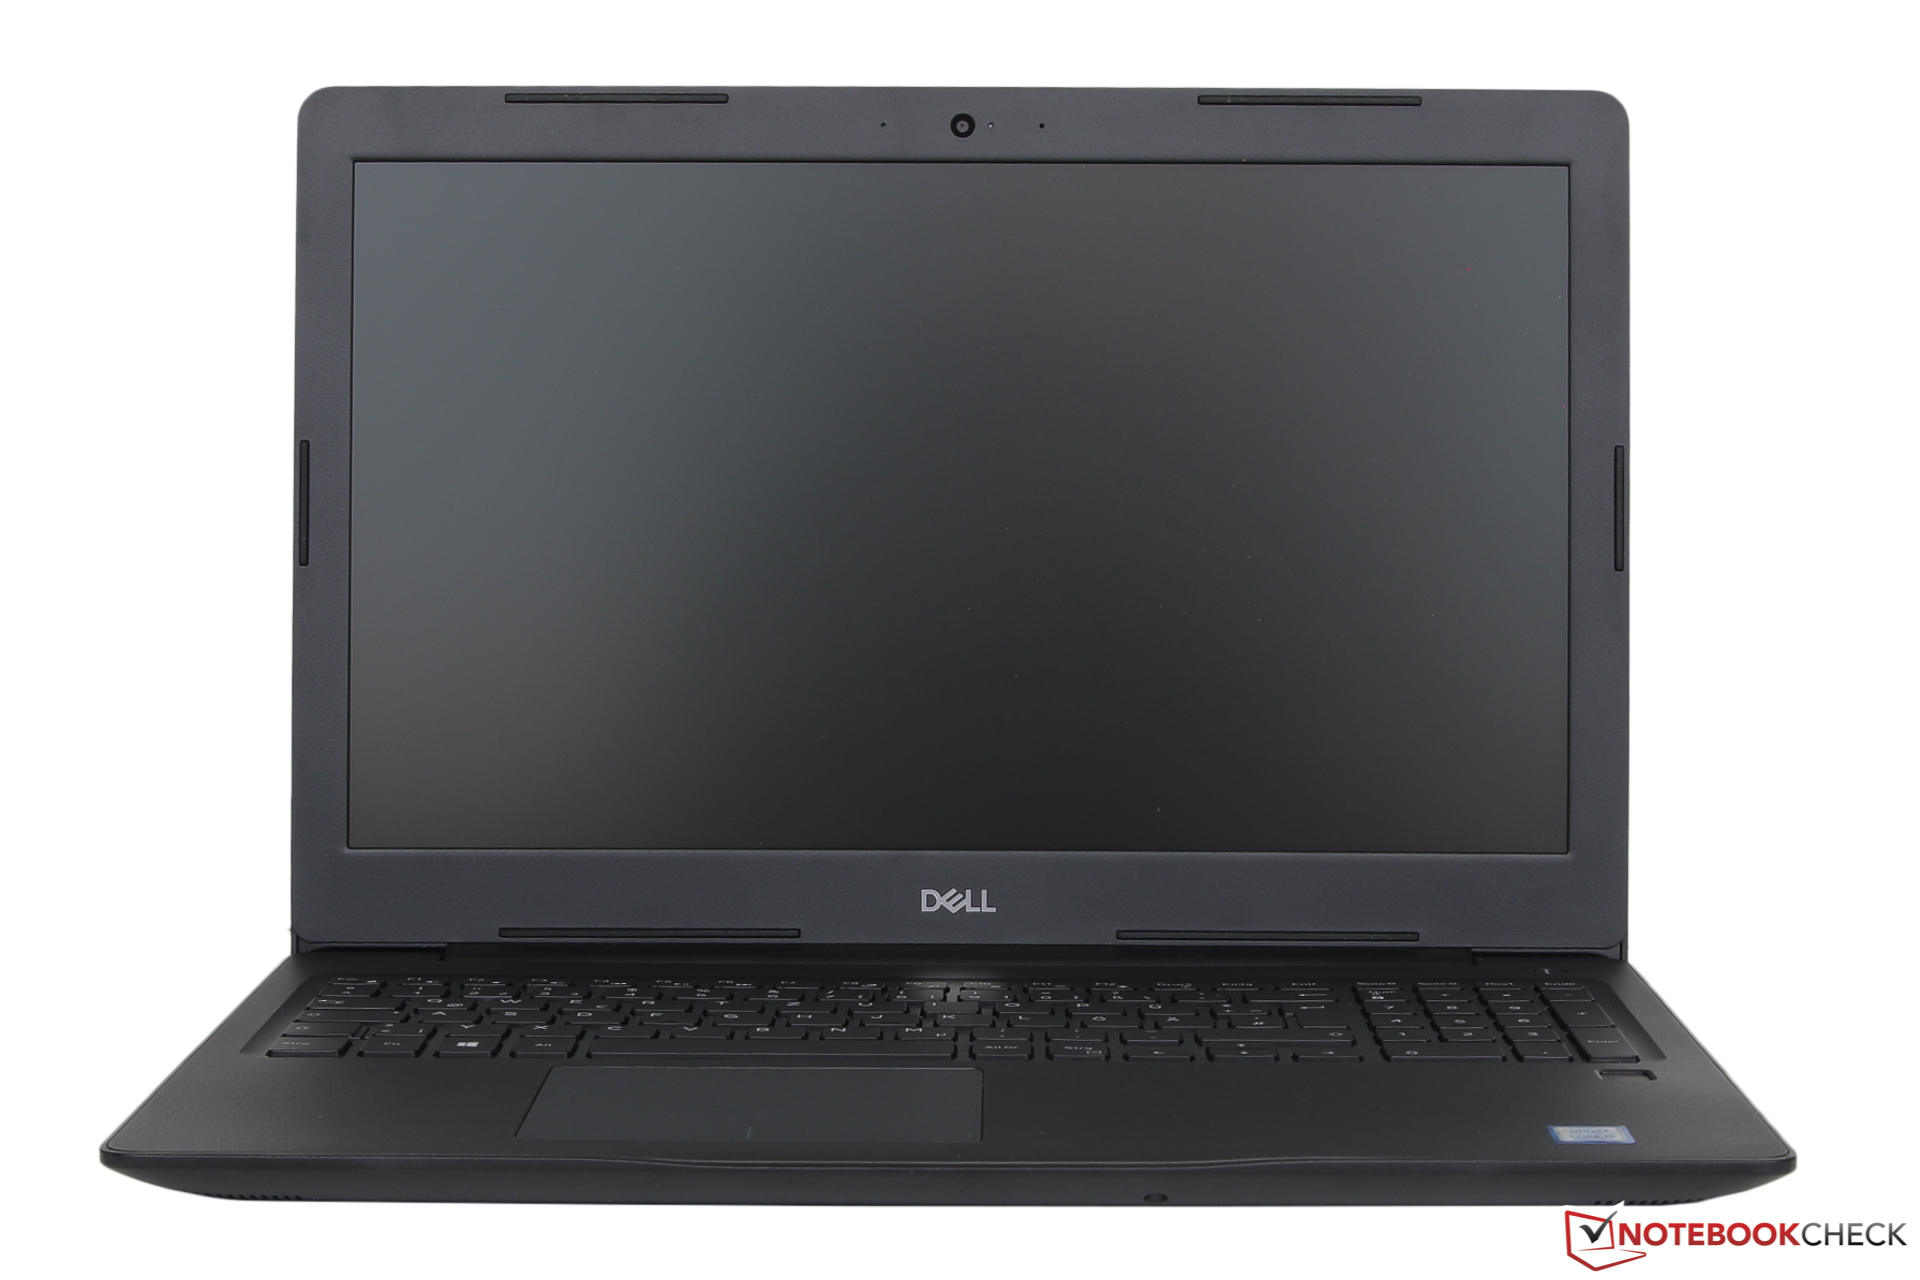
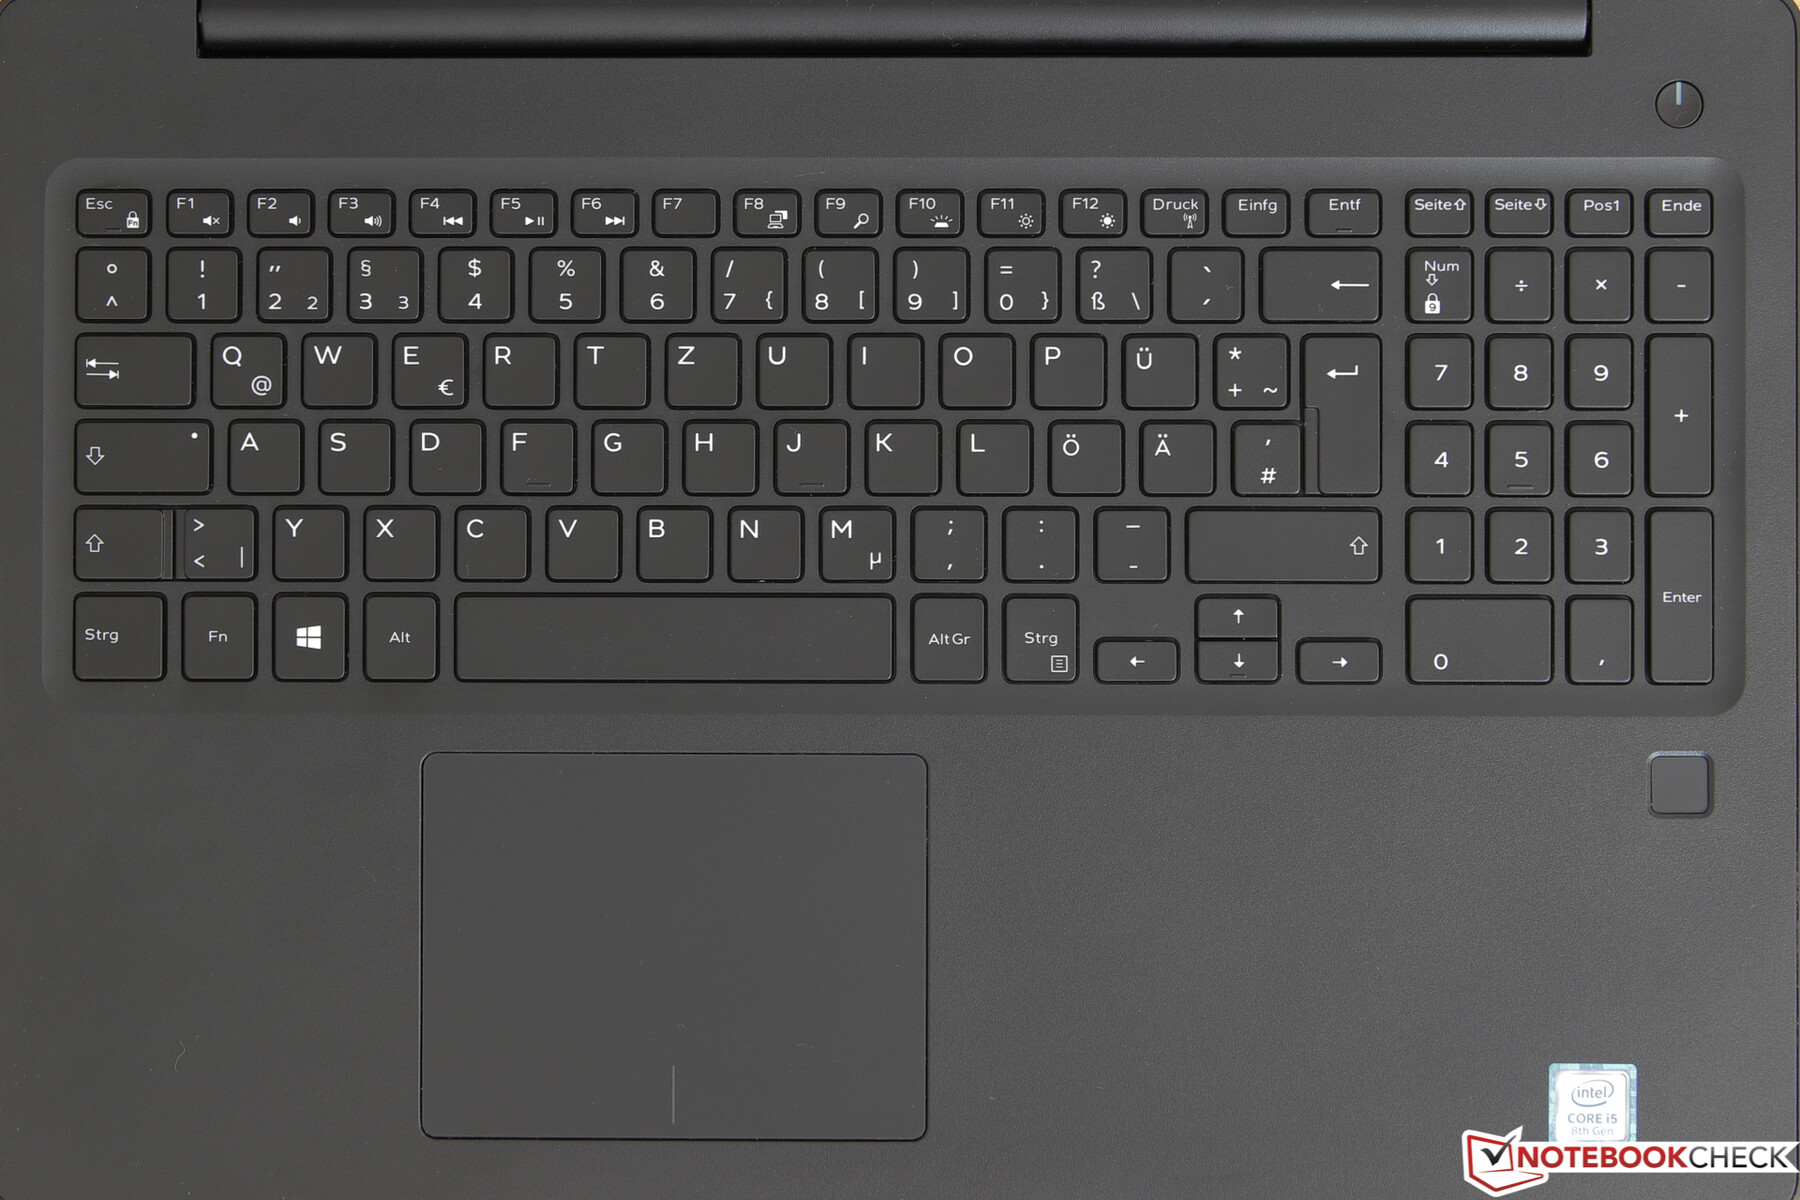
Dell has used the available space well and equipped the 3590 with a chiclet keyboard, whose width is almost the same as a standard desktop keyboard. The number pad is also only a few millimeters narrower than standard. As the layout is also standard, it should not take long to get used to typing on this keyboard. The pause key however has been left out for space reasons.
The flat, simply-marked keys have very little travel with a tactile actuation point and a very hard stop. The key sizes and separation are generous.
The keyboard does not flex under normal and realistic usage. Although the smaller keys whilst typing are not particularly noticeable in terms of noise, with the larger keys you might want to be a bit more delicate in more noise-sensitive environments. We liked the two-stage, evenly lit and sufficiently bright backlighting on the keyboard.
Touchpad
Even for a 15-inch laptop the ClickPad, without separate physical buttons, offers plenty of room. In order to provide friction-free usage with dry and lightly damp fingers the ClickPad surface is only minimally textured. Even with very sweaty hands the drag effect is kept in check and only really causes problems with movements from bottom to top, which is very good. In terms of accuracy and responsiveness, the ClickPad is unremarkable. The mouse pointer can be moved pixel-by-pixel, and faster movements are accurately tracked.
The two mouse buttons are able to impress. For my personal preference, they offer perfect resistance, a good actuation point, sufficient travel as well as good haptic and audible feedback. Gestures with up to four fingers are 'only' able to be used when configured in the Windows configuration panel for touchpads, which in recent times has become quite feature-rich.
Display - Don't Expect Much
What does not count towards the strengths of the 3590 is, unfortunately, the 15.6-inch, matte, full HD TN Panel (all other laptops in this comparison have an IPS screen). For instance, the brightness of the screen at 215 cd/m² is not exactly up with the times for an office machine. However in an indoor environment it generally should not present any problems. The smaller Dell here is actually even worse, whilst the candidates from Lenovo and Toshiba achieve very good results. The backlight uniformity is somewhat above average, which the Tecra A50 has problems with.
Whether or not the screen has issues with backlight bleeding is somewhat hard to determine due to the issues with viewing angles - more on this later.
| |||||||||||||||||||||||||
Brightness Distribution: 91 %
Center on Battery: 212 cd/m²
Contrast: 558:1 (Black: 0.385 cd/m²)
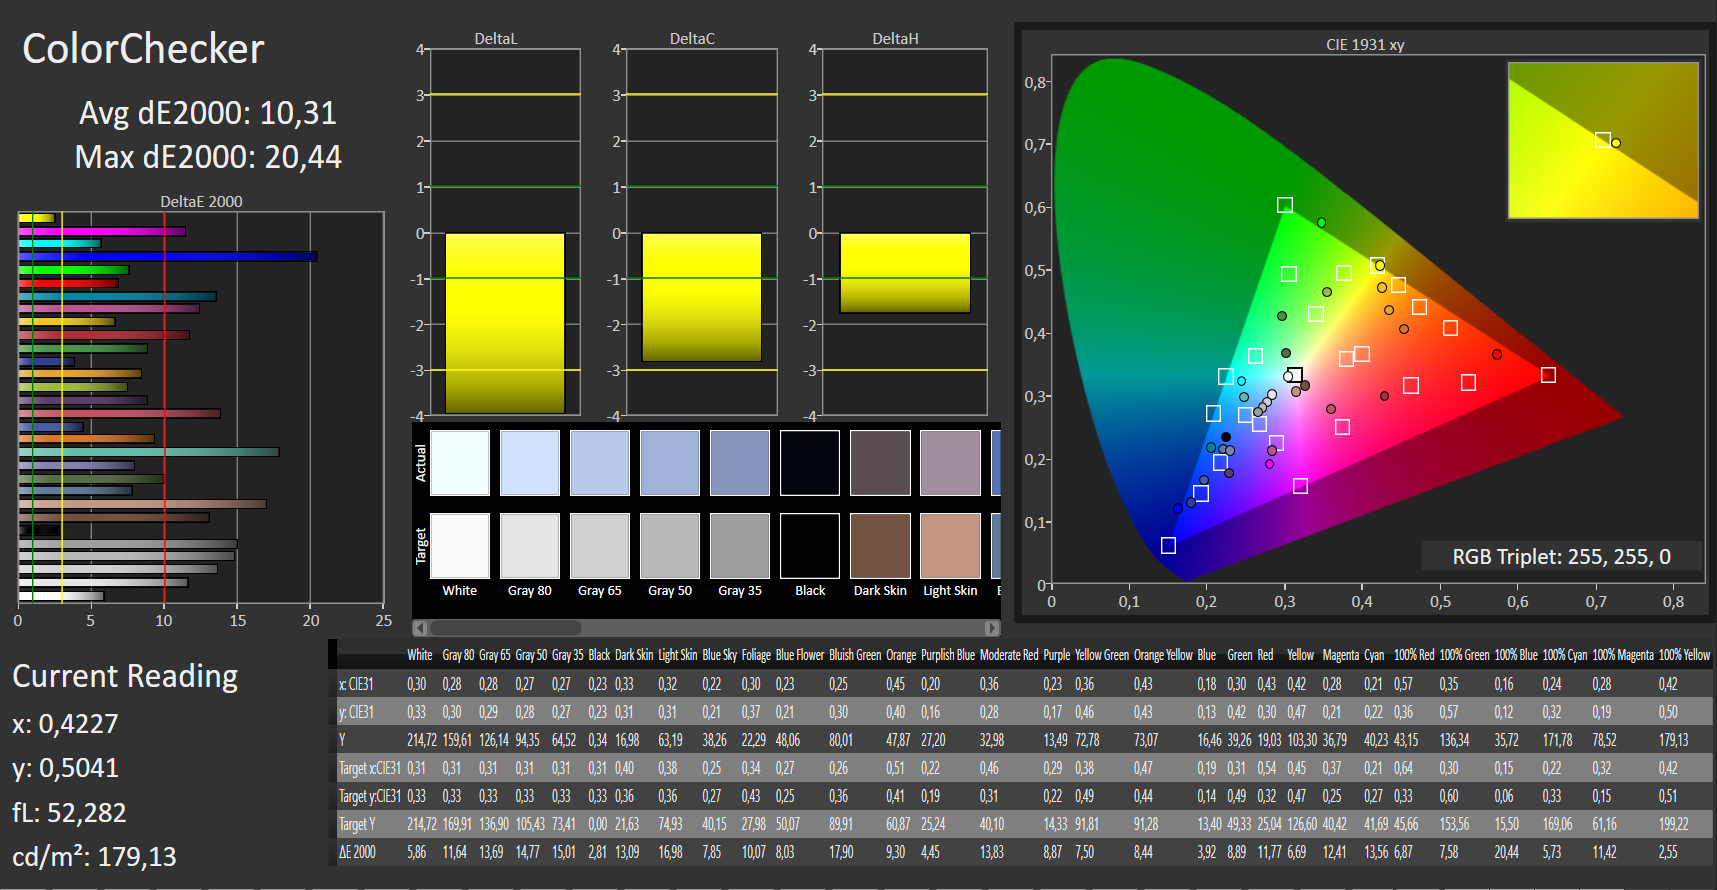
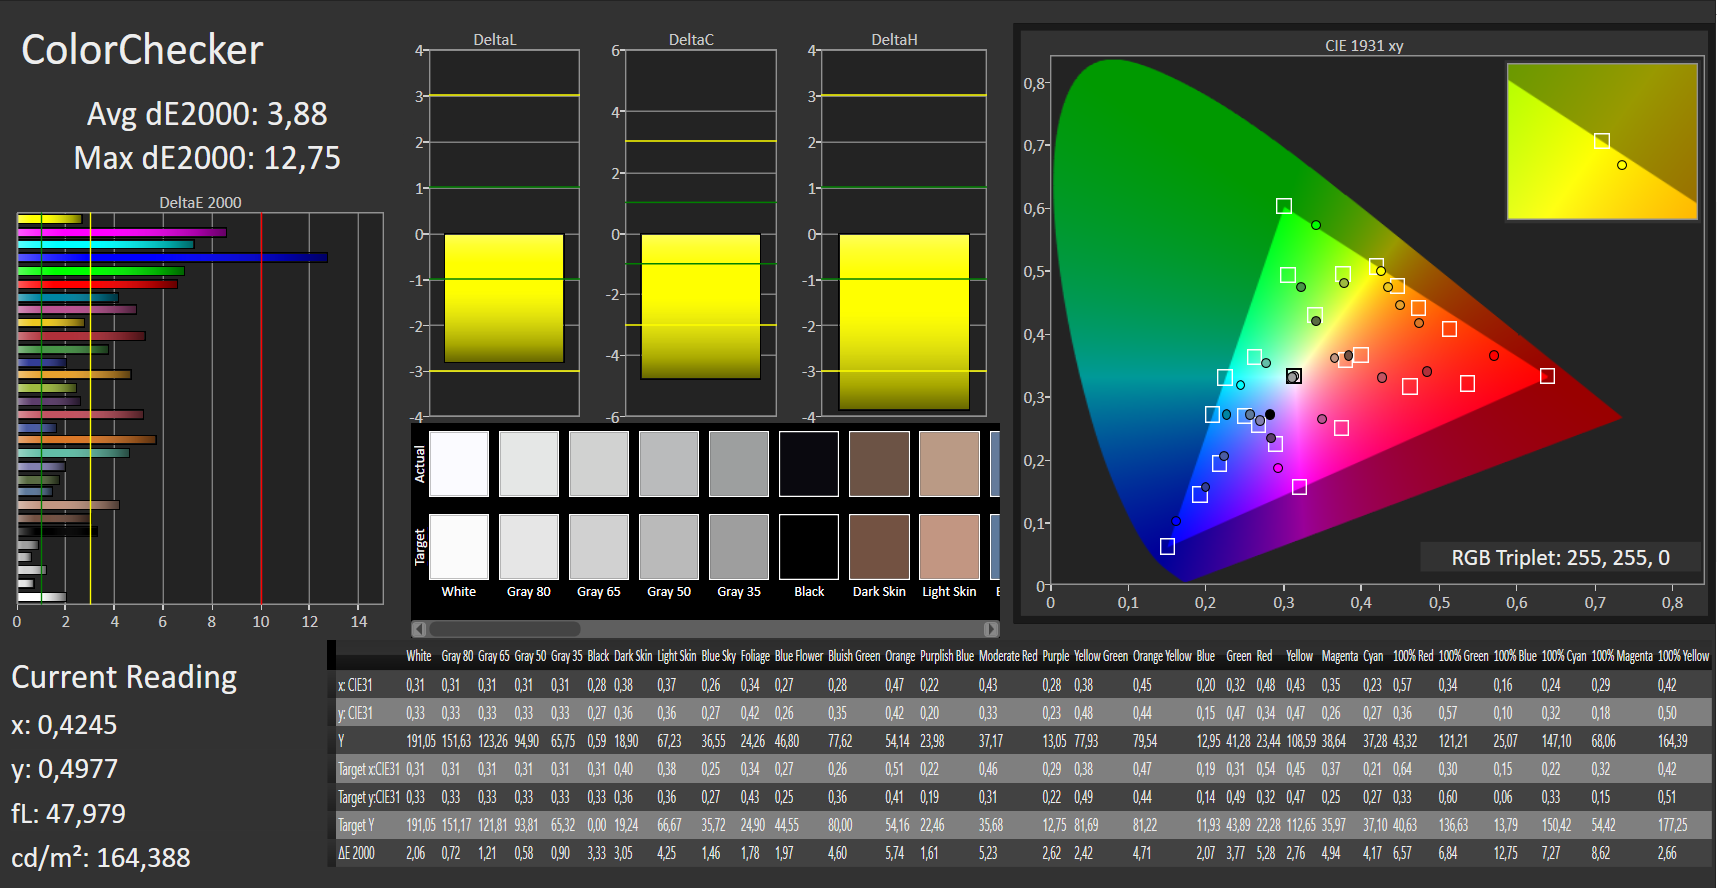
ΔE ColorChecker Calman: 10.31 | ∀{0.5-29.43 Ø4.72}
calibrated: 3.88
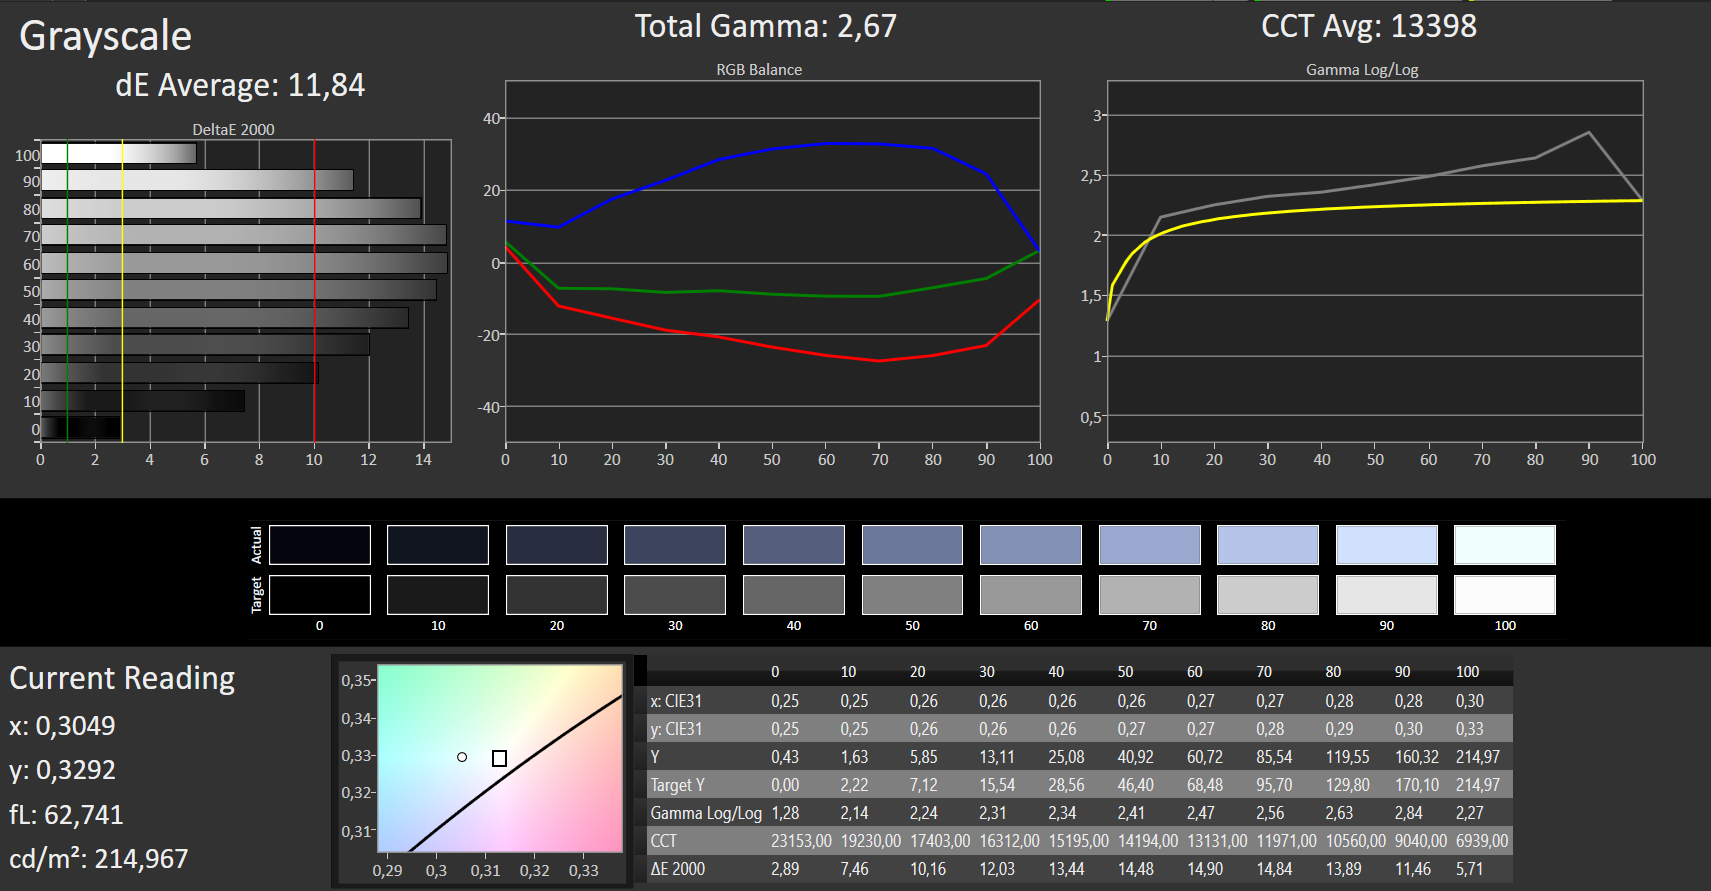
ΔE Greyscale Calman: 11.84 | ∀{0.09-98 Ø4.97}
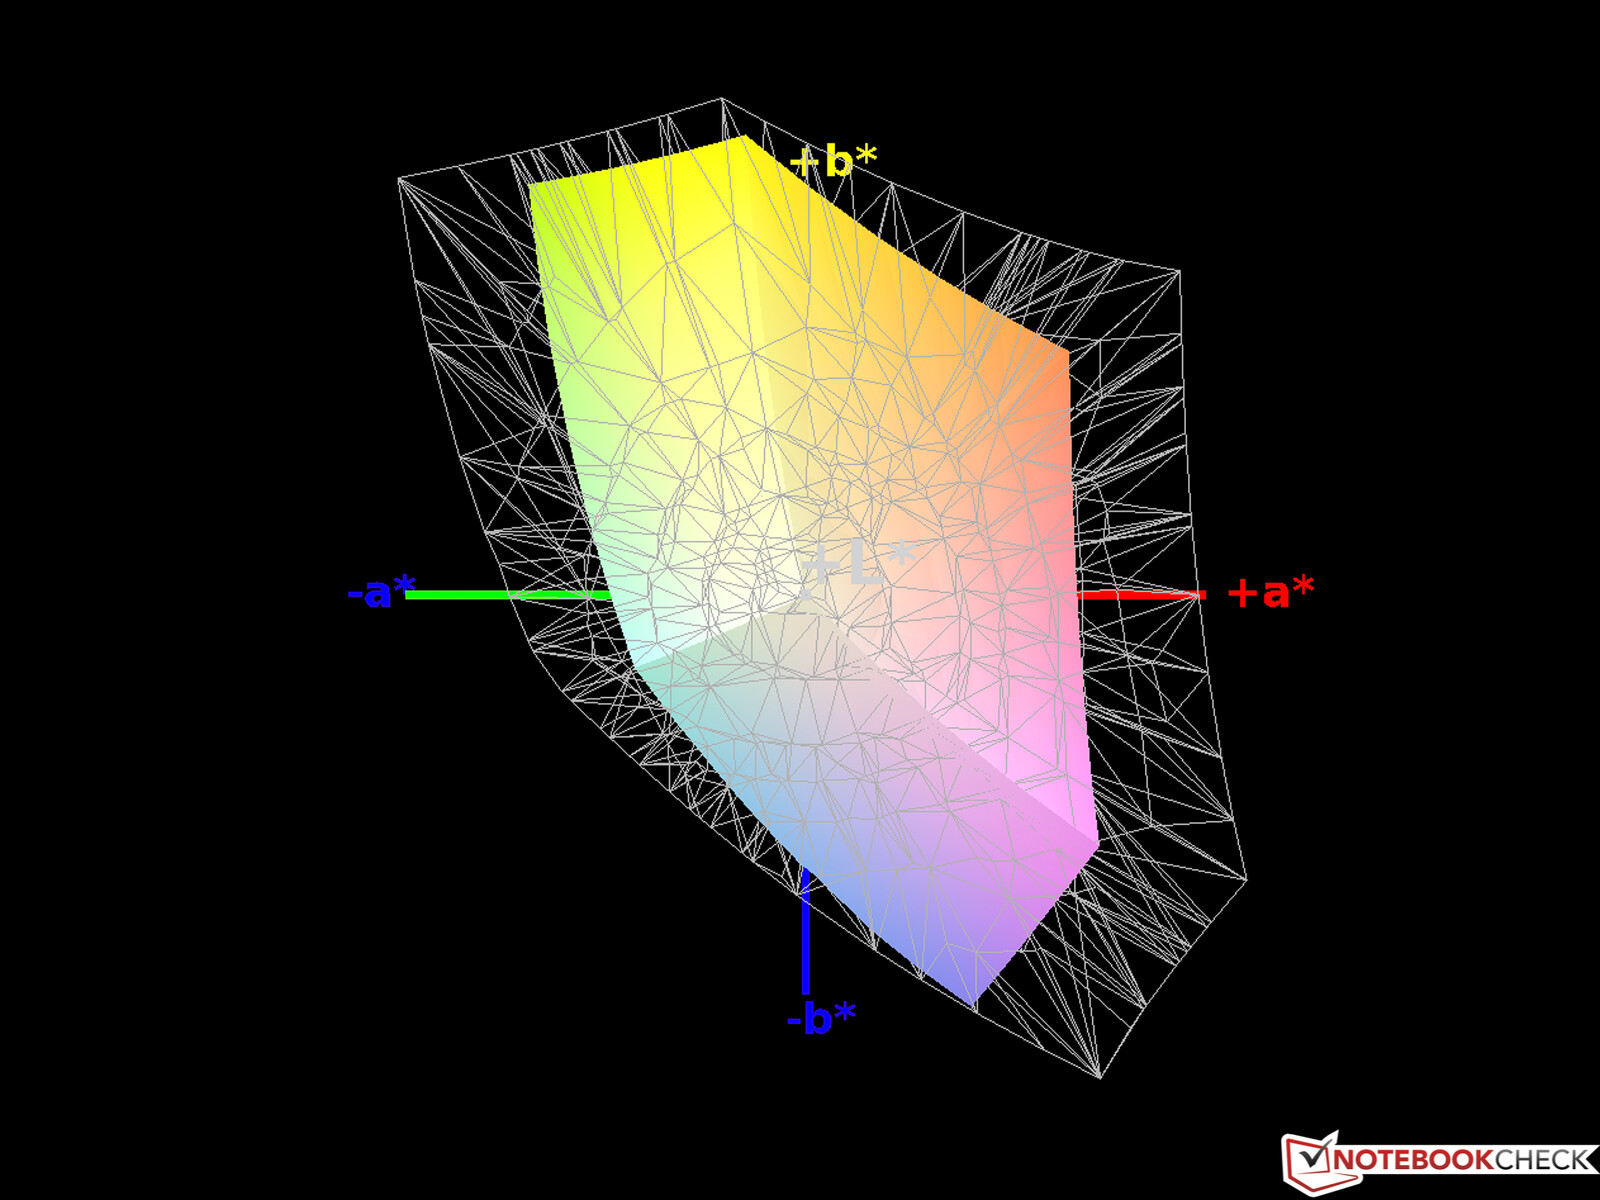
61% sRGB (Argyll 1.6.3 3D)
39% AdobeRGB 1998 (Argyll 1.6.3 3D)
40.99% AdobeRGB 1998 (Argyll 3D)
59.7% sRGB (Argyll 3D)
39.67% Display P3 (Argyll 3D)
Gamma: 2.67
CCT: 13398 K
| Dell Latitude 15 3590 BOE0802 / NT15N41 / Dell: M9P74, , 1920x1080, 15.6" | Lenovo ThinkPad E590-20NB0012GE Lenovo B156HAN02.1, , 1920x1080, 15.6" | Toshiba Tecra A50-E-110 TOS508F, , 1920x1080, 15.6" | Dell Latitude 14 5495 CMN14C9, , 1920x1080, 14" | |
|---|---|---|---|---|
| Display | 1% | 54% | 3% | |
| Display P3 Coverage (%) | 39.67 | 39.88 1% | 65 64% | 40.94 3% |
| sRGB Coverage (%) | 59.7 | 59.9 0% | 85.9 44% | 61.4 3% |
| AdobeRGB 1998 Coverage (%) | 40.99 | 41.21 1% | 62.8 53% | 42.32 3% |
| Response Times | -94% | -79% | -75% | |
| Response Time Grey 50% / Grey 80% * (ms) | 41 ? | 47.2 ? -15% | 44 ? -7% | 41 ? -0% |
| Response Time Black / White * (ms) | 12 ? | 32.8 ? -173% | 30 ? -150% | 30 ? -150% |
| PWM Frequency (Hz) | 250 ? | 20000 ? | 25000 ? | |
| Screen | 33% | 34% | 29% | |
| Brightness middle (cd/m²) | 215 | 284 32% | 290 35% | 212 -1% |
| Brightness (cd/m²) | 214 | 272 27% | 249 16% | 200 -7% |
| Brightness Distribution (%) | 91 | 92 1% | 78 -14% | 89 -2% |
| Black Level * (cd/m²) | 0.385 | 0.21 45% | 0.38 1% | 0.23 40% |
| Contrast (:1) | 558 | 1352 142% | 763 37% | 922 65% |
| Colorchecker dE 2000 * | 10.31 | 5.3 49% | 4.35 58% | 4.34 58% |
| Colorchecker dE 2000 max. * | 20.44 | 18.9 8% | 11.06 46% | 9.01 56% |
| Colorchecker dE 2000 calibrated * | 3.88 | 4.4 -13% | ||
| Greyscale dE 2000 * | 11.84 | 3.2 73% | 3.01 75% | 2.81 76% |
| Gamma | 2.67 82% | 2.41 91% | 2.44 90% | 2.22 99% |
| CCT | 13398 49% | 6736 96% | 7198 90% | 6286 103% |
| Color Space (Percent of AdobeRGB 1998) (%) | 39 | 37.9 -3% | 56 44% | 39 0% |
| Color Space (Percent of sRGB) (%) | 61 | 59.7 -2% | 86 41% | 61 0% |
| Total Average (Program / Settings) | -20% /
11% | 3% /
23% | -14% /
10% |
* ... smaller is better
Due to a combination of a significantly high black level of almost 0.4 cd/m² (average 0.23 cd/m²) and low brightness the Dell has a terrible contrast ratio of only 558:1. The opposite is true of the screen in the ThinkPad E590, which manages a very good 1,352:1. Due to the instability of viewing angles, it is not possible to subjectively rate whether the screen achieves good black saturation.
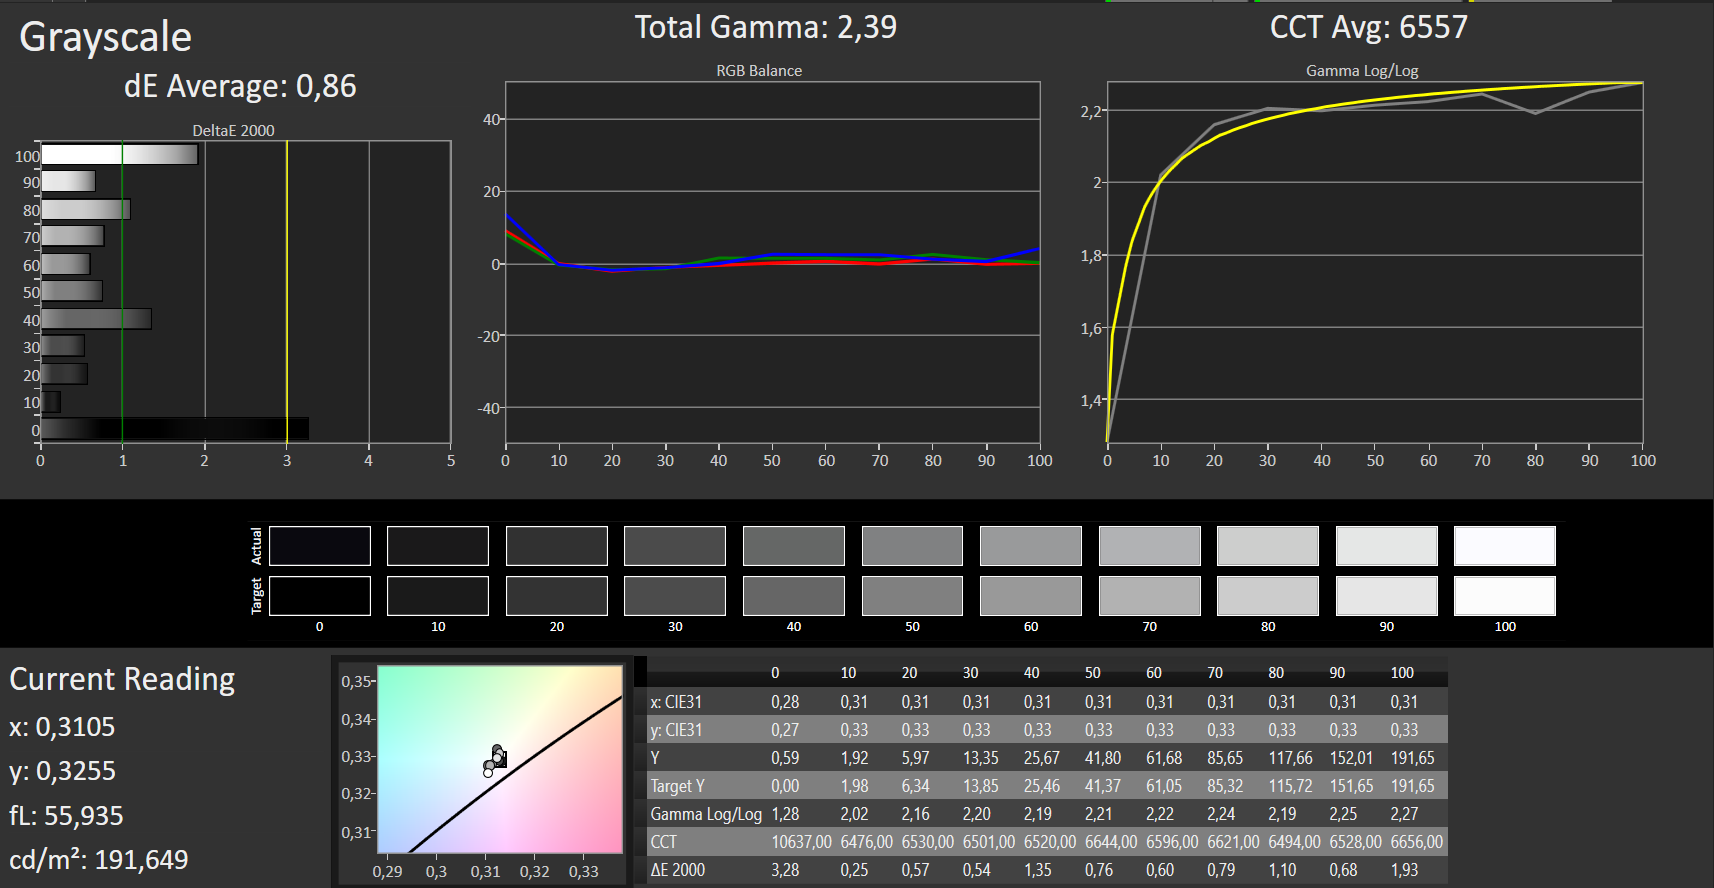
Things look very bad with the factory settings in terms of colour space. As delivered, the Latitude 3590 has a significantly noticeable blue tint - the worst that this reviewer has ever encountered. The target value for colour temperature is around 6,500 K - this review sample measured an unbelievable 13,398 K - almost double what it should be. Through calibration and creating a profile (profile is linked below) we were able to bring the values back down to acceptable levels, so that no more blue tint was noticeable.
In terms of colour accuracy, the three IPS panels in the comparison also do not cover themselves with glory, however the Delta-E levels of the 3590, measured at 10 - 12, are two to three times higher and only encountered these days inc heap TN screens. This is exactly what we find built into the review device today.
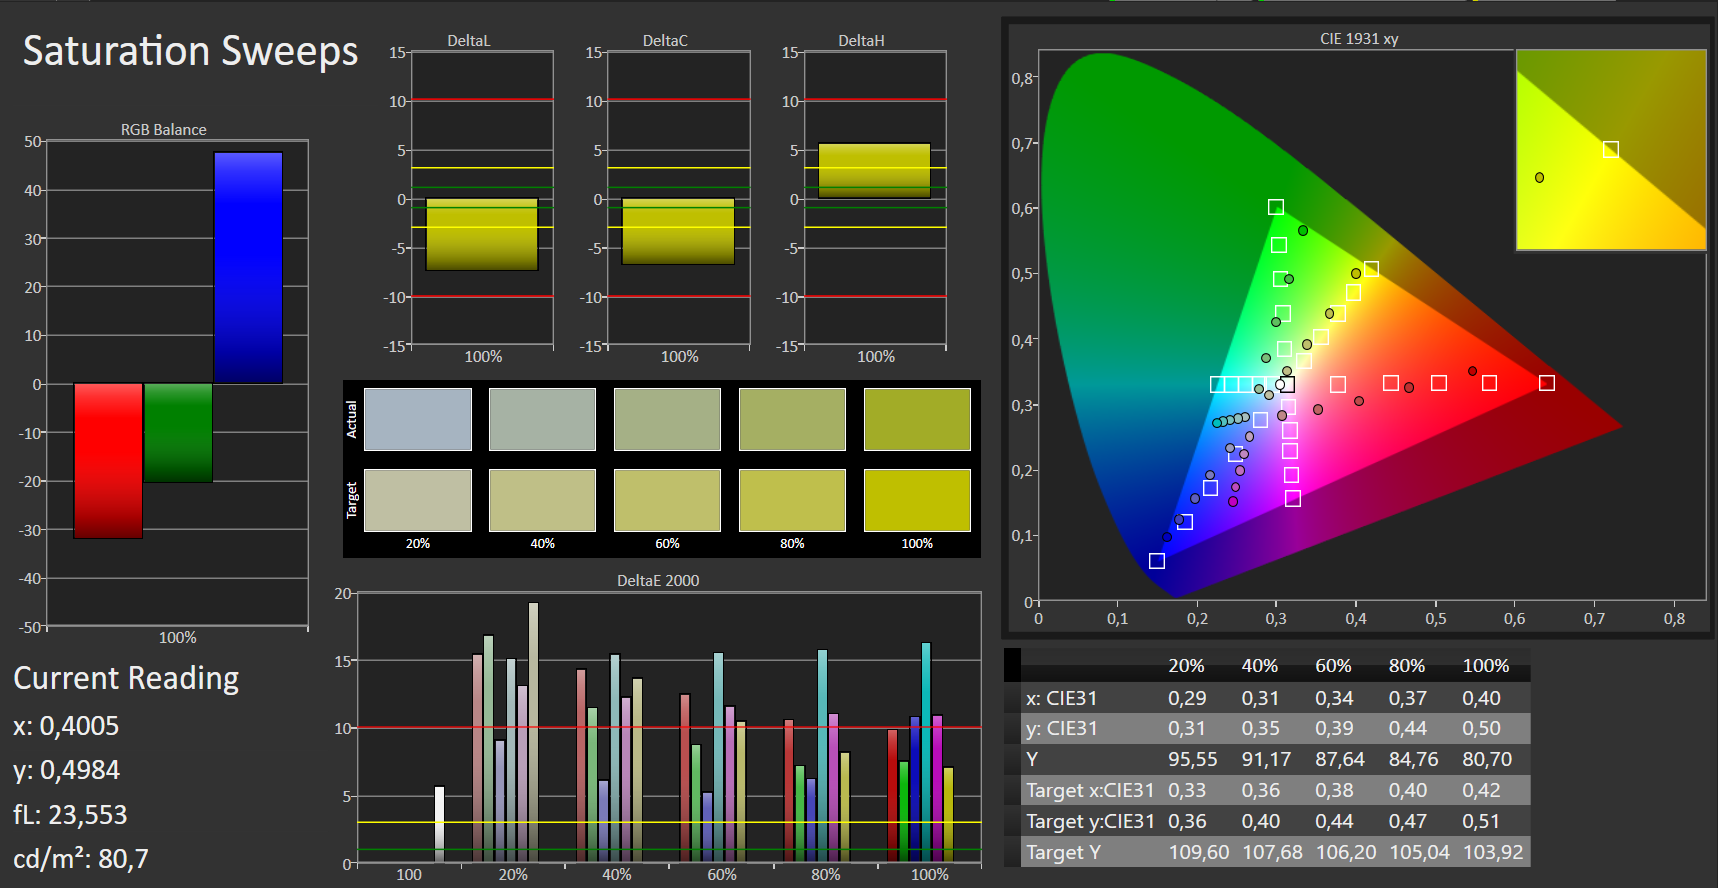
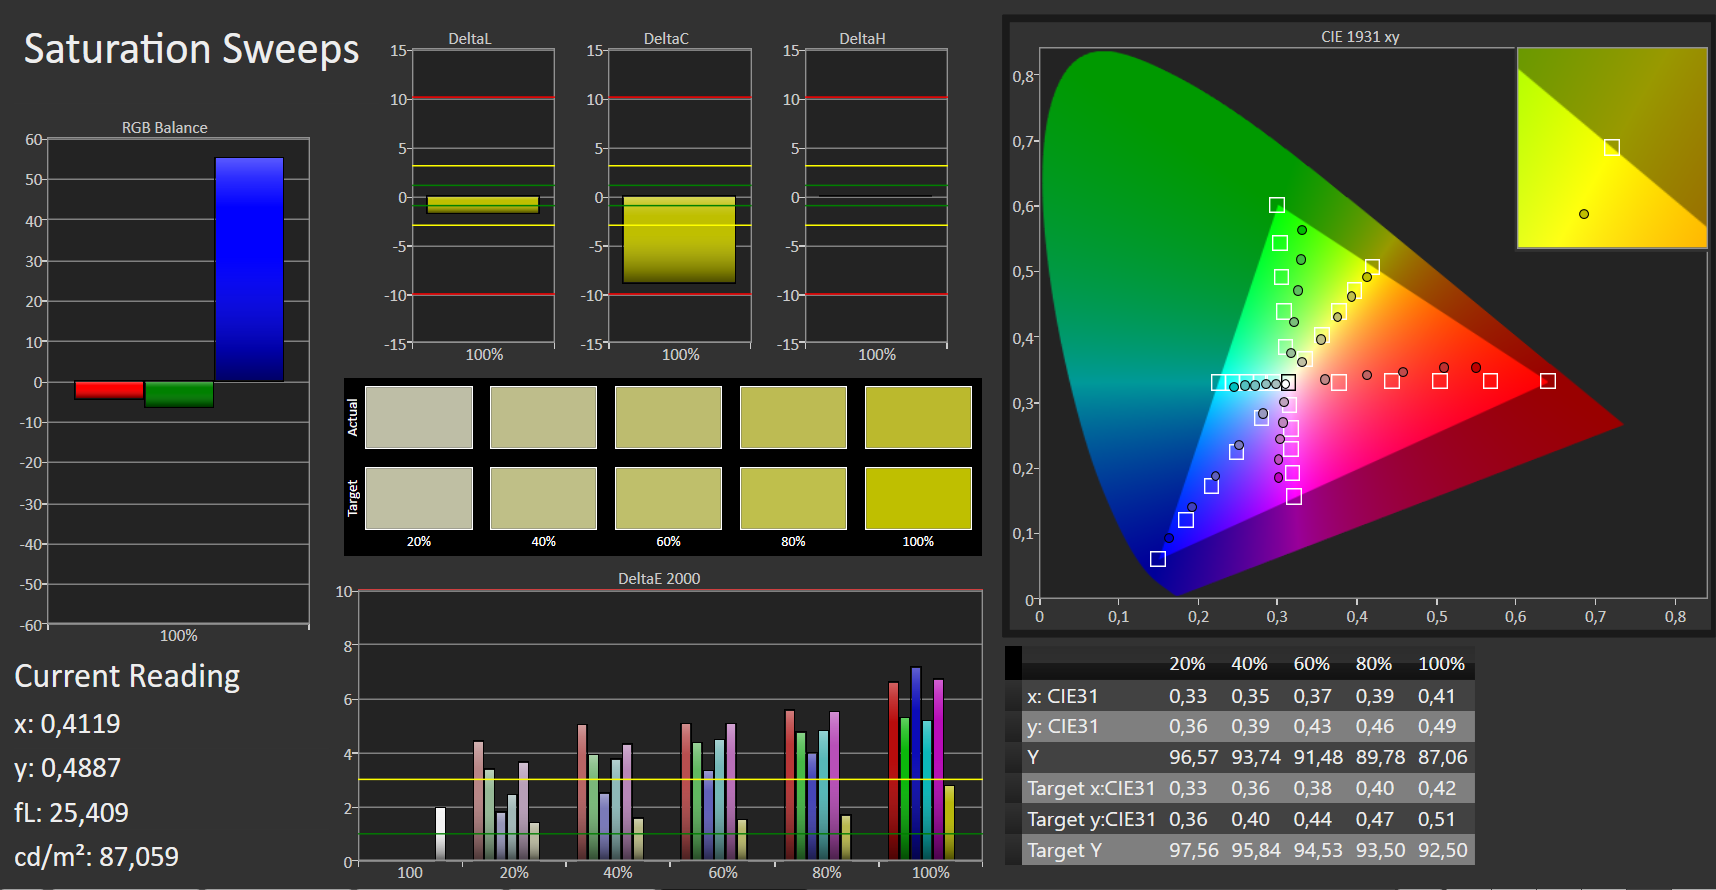
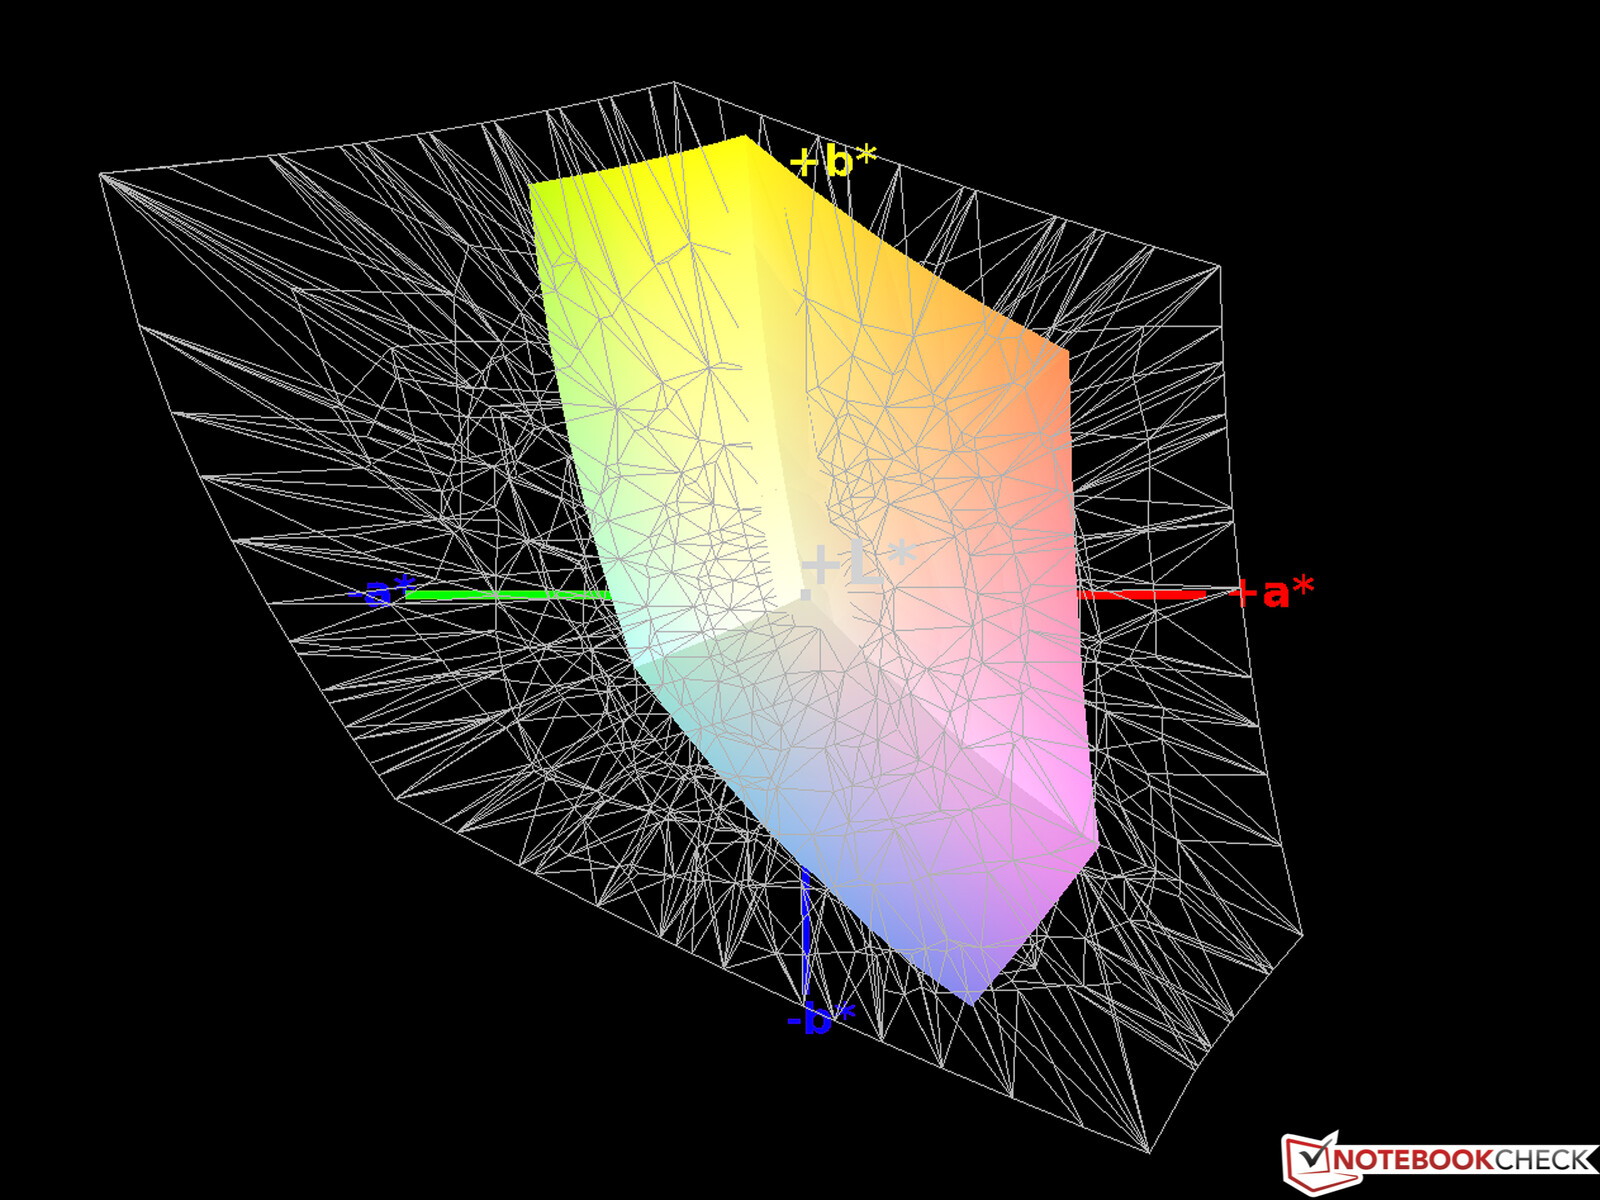
To put paid to any notion of serious image editing, the laptop has a far too low a colour space coverage rating of only 61% of the already quite small sRGB space. It is worth noting though that none of the laptops in this test fulfil (semi)professional requirements.
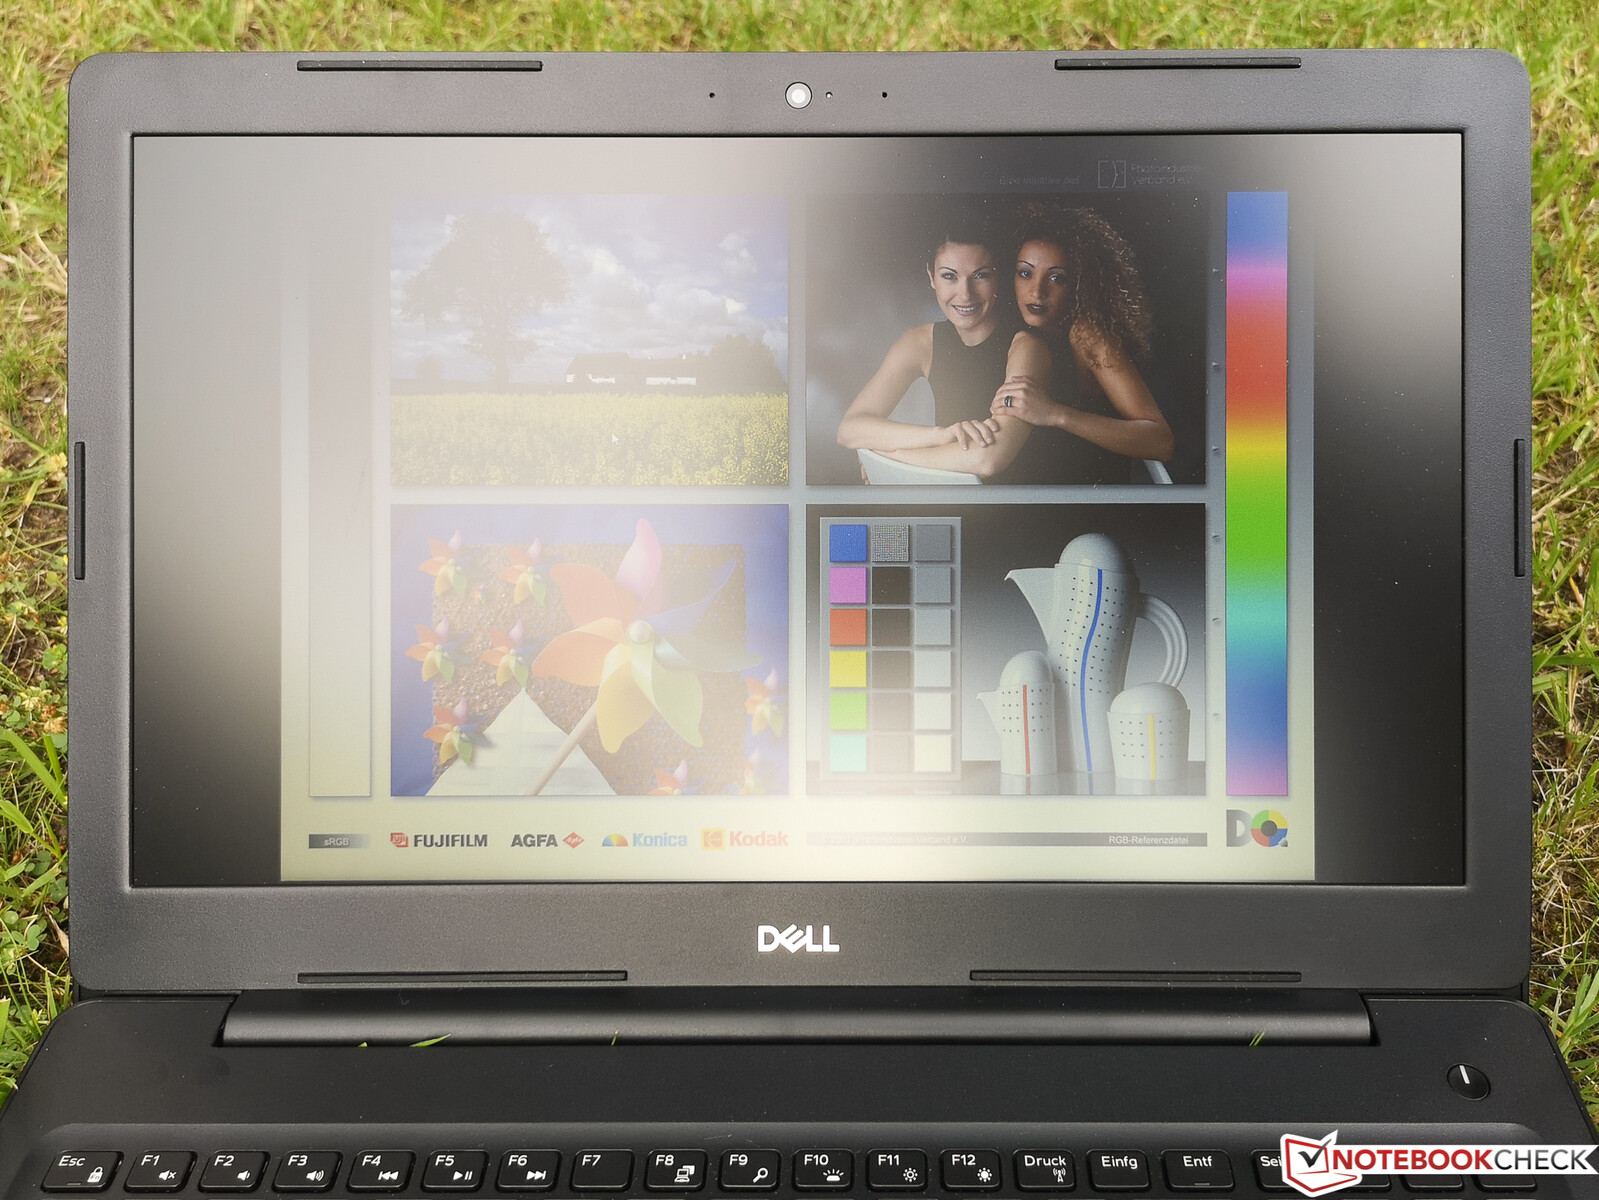
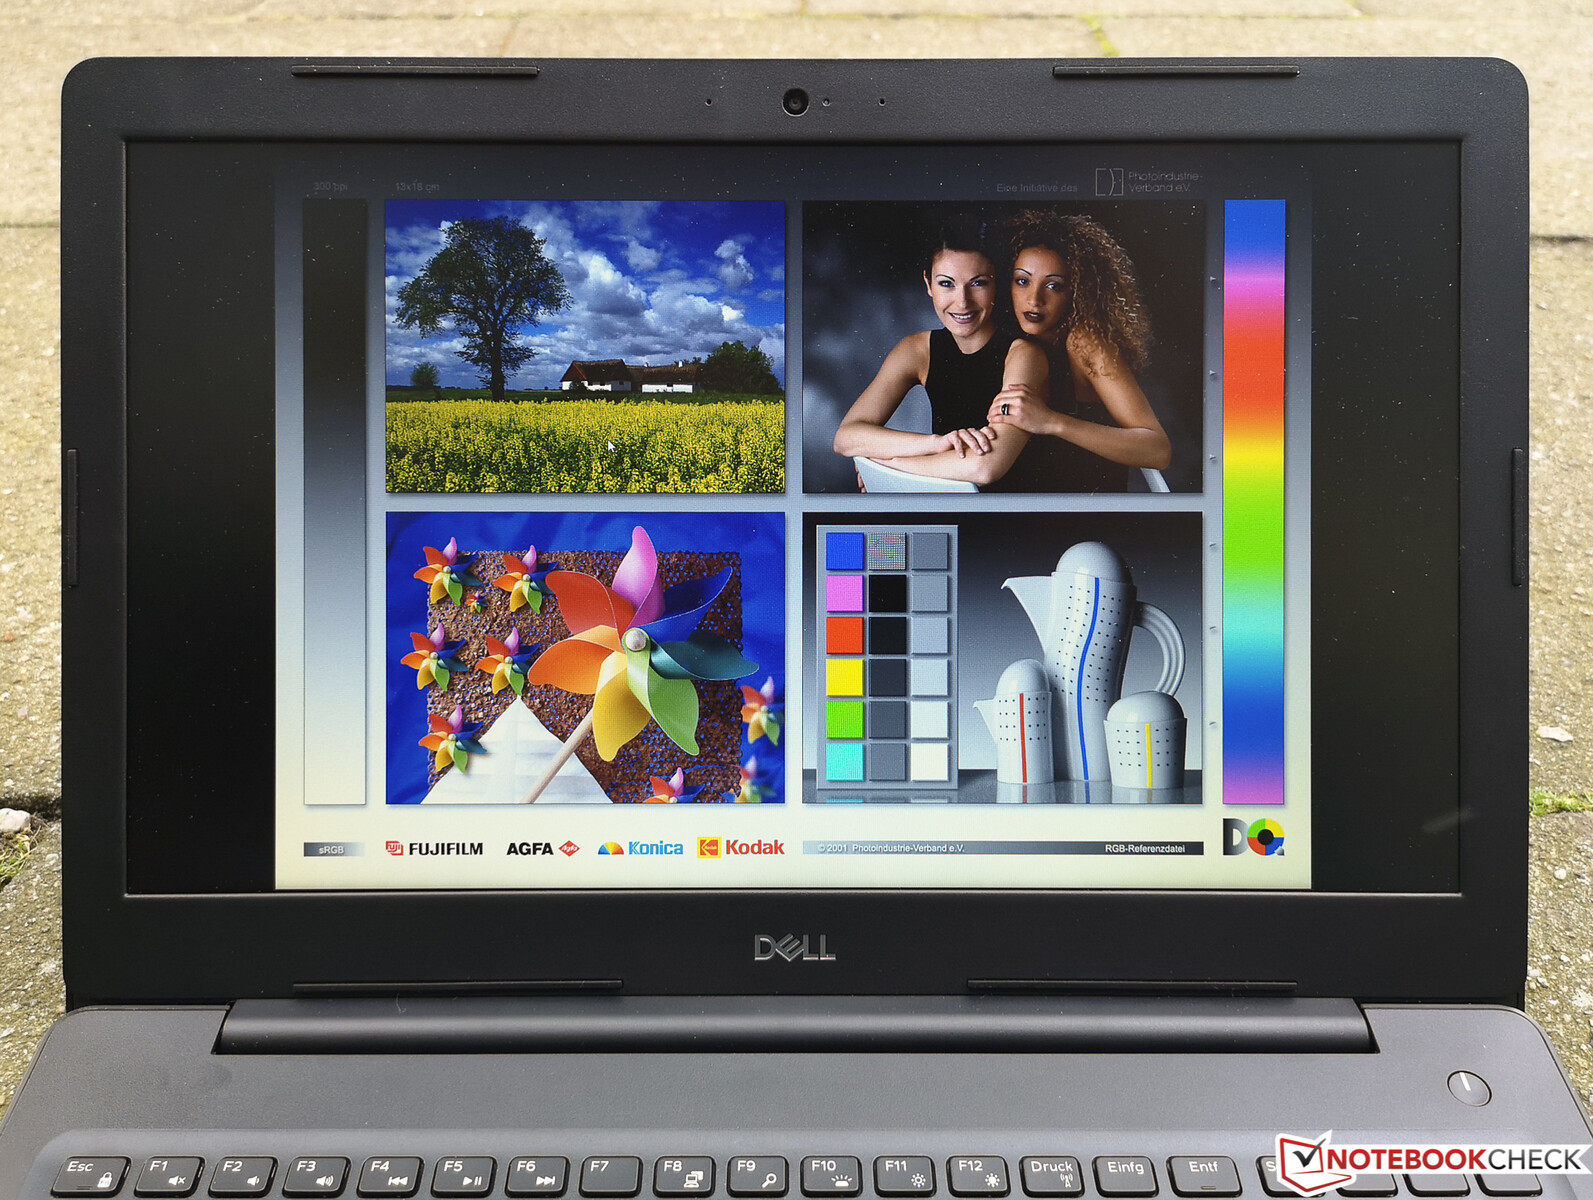
During the outdoor test it was overcast, so the matte but not particularly bright display of the review laptop was able to benefit from the conditions. In the left photo, we tried to tilt the screen to reflect the sky. You can see to the left the shadowing caused by the photographer and to the right the screen is covered in reflections. Had the sun been shining, it would not have been possible to make anything out. The photo on the right was taken under ideal conditions with a house entrance to our back. The poor reproductive qualities of the display are clearly visible here, since when taking the photo we were unable to find a suitable viewing angle. In good weather this photo would have looked similar.
Display Response Times
| ↔ Response Time Black to White | ||
|---|---|---|
| 12 ms ... rise ↗ and fall ↘ combined | ↗ 8 ms rise | 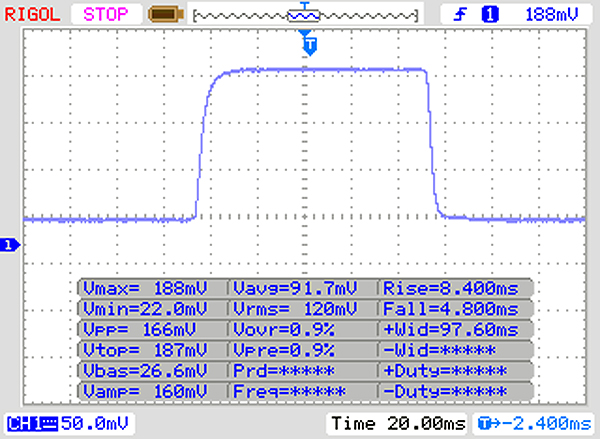 |
| ↘ 4 ms fall | ||
| The screen shows good response rates in our tests, but may be too slow for competitive gamers. In comparison, all tested devices range from 0.1 (minimum) to 240 (maximum) ms. » 31 % of all devices are better. This means that the measured response time is better than the average of all tested devices (19.9 ms). | ||
| ↔ Response Time 50% Grey to 80% Grey | ||
| 41 ms ... rise ↗ and fall ↘ combined | ↗ 22 ms rise | 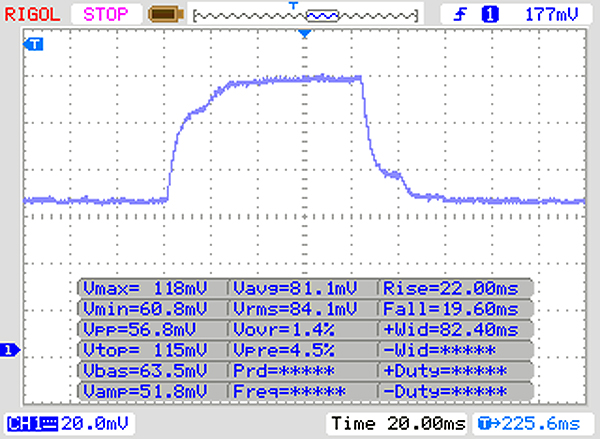 |
| ↘ 19 ms fall | ||
| The screen shows slow response rates in our tests and will be unsatisfactory for gamers. In comparison, all tested devices range from 0.165 (minimum) to 636 (maximum) ms. » 65 % of all devices are better. This means that the measured response time is worse than the average of all tested devices (31.1 ms). | ||
Screen Flickering / PWM (Pulse-Width Modulation)
| Screen flickering / PWM detected | 250 Hz | ≤ 90 % brightness setting | 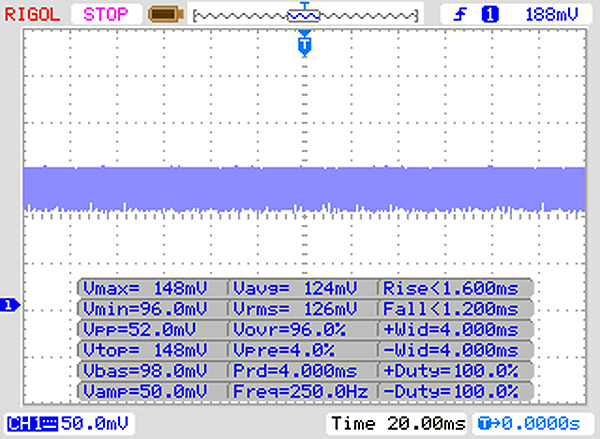 |
The display backlight flickers at 250 Hz (worst case, e.g., utilizing PWM) Flickering detected at a brightness setting of 90 % and below. There should be no flickering or PWM above this brightness setting. The frequency of 250 Hz is relatively low, so sensitive users will likely notice flickering and experience eyestrain at the stated brightness setting and below. In comparison: 52 % of all tested devices do not use PWM to dim the display. If PWM was detected, an average of 7784 (minimum: 5 - maximum: 343500) Hz was measured. | |||
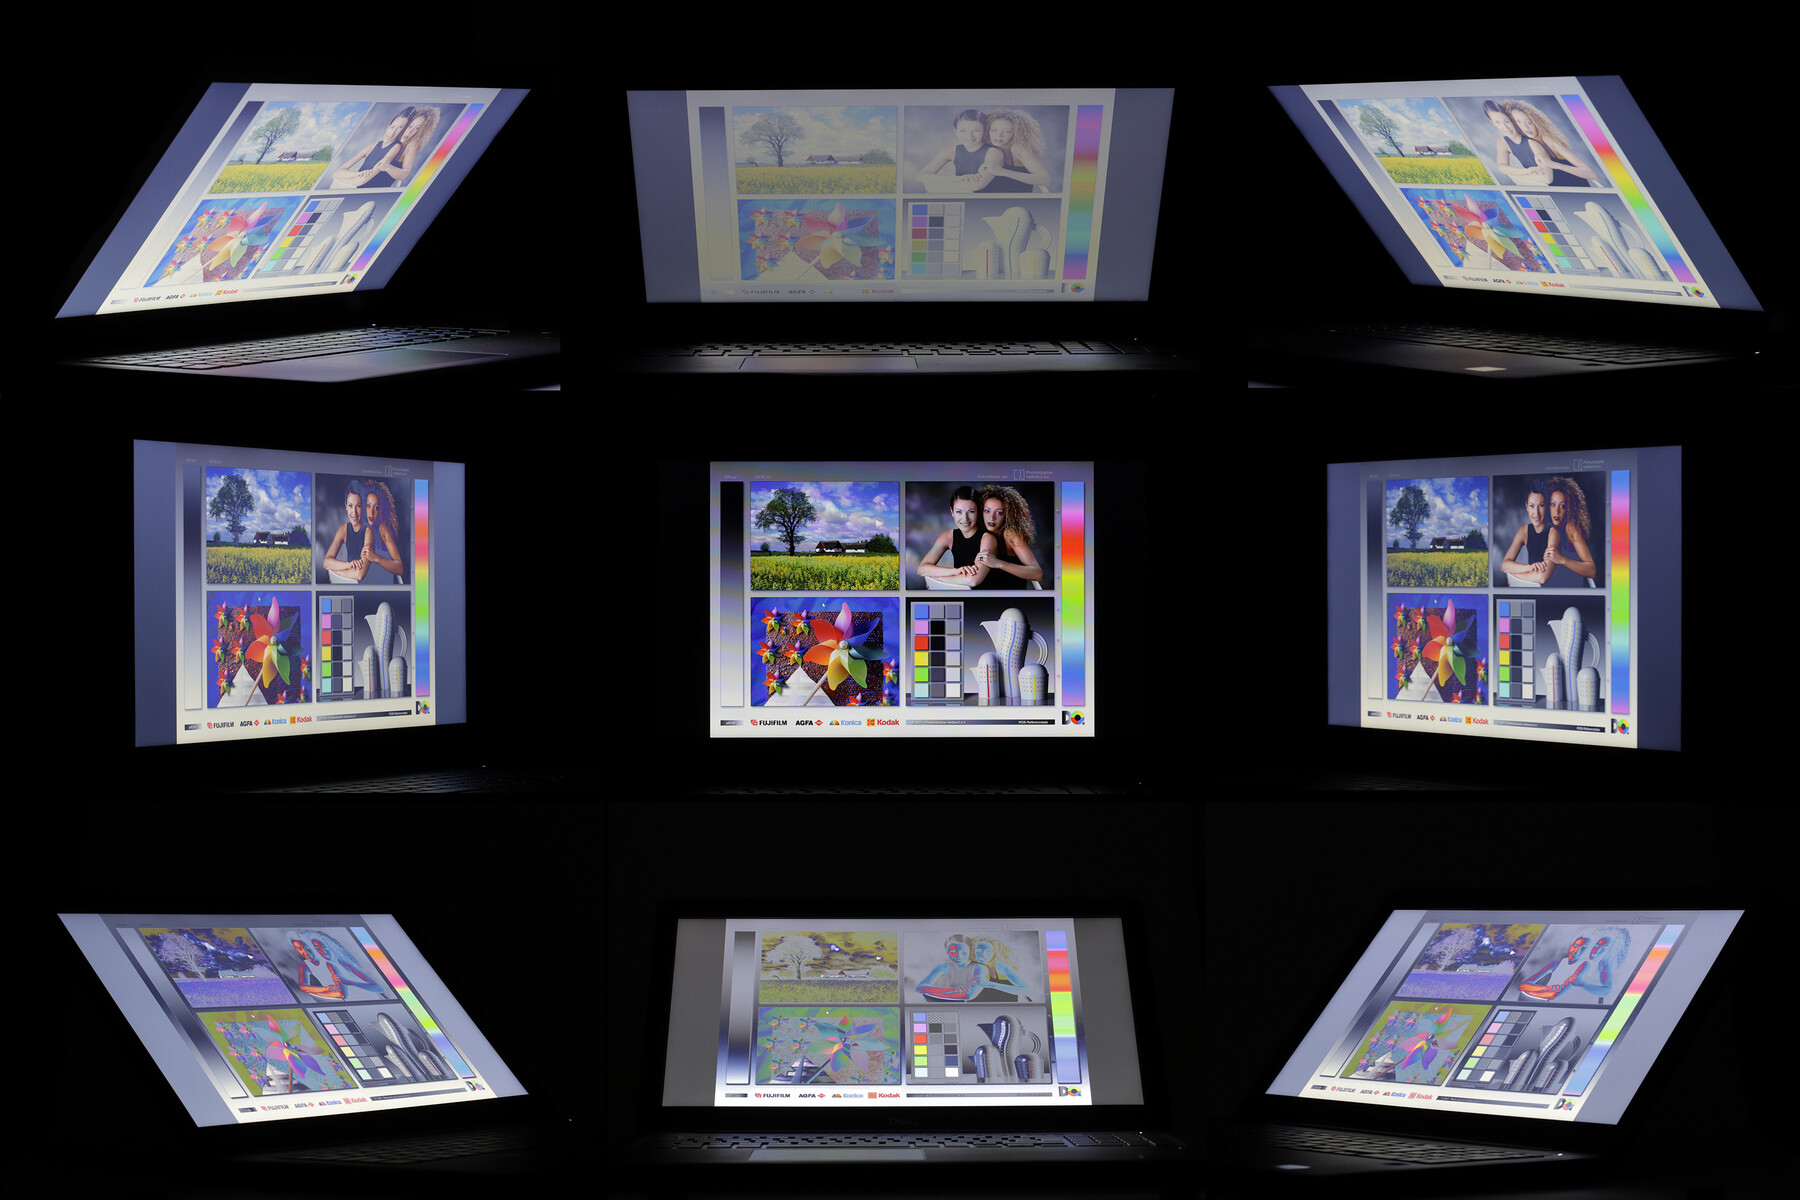
As already stressed, this panel is hopeless in terms of viewing angles. Even when sitting directly in front of the screen, various portions of the screen will appear differently to the center. This means that with some elements on screen, colour and contrast will be presented incorrectly. When viewing from the side, the screen almost inverts to a negative image - even worse when viewing from below. As is usual with TN screens, viewing from above results in the picture appearing washed out and milky.
Performance - Office and More
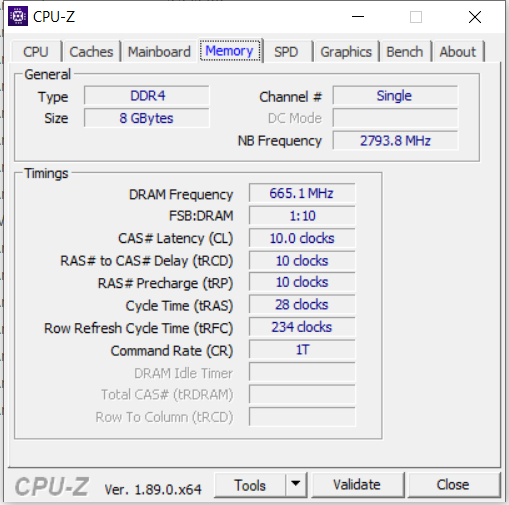
Thanks to its powerful quad core processor, RAM and SSD, the Dell 3590 is not only suitable for Office duties, but also more demanding software and multitasking will not overwhelm it. Software designed for multithreading such as video editing applications will benefit from the available eight threads - it is possible though that for these tasks the RAM configuration may prove to be a bottleneck, as it is in single-channel mode only (although it can be expanded). For games the Dell laptop is very limited, due to its lack of a dedicated GPU.
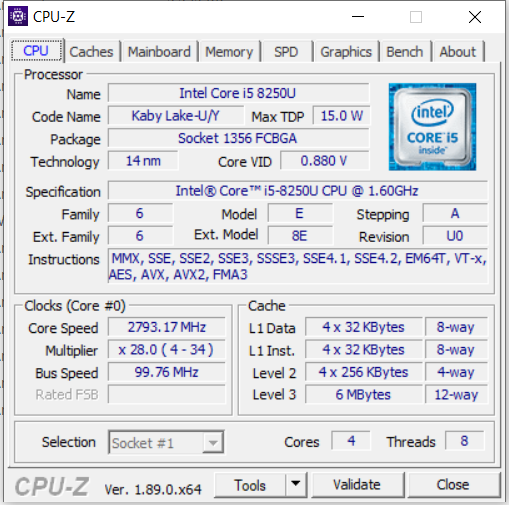
Processor
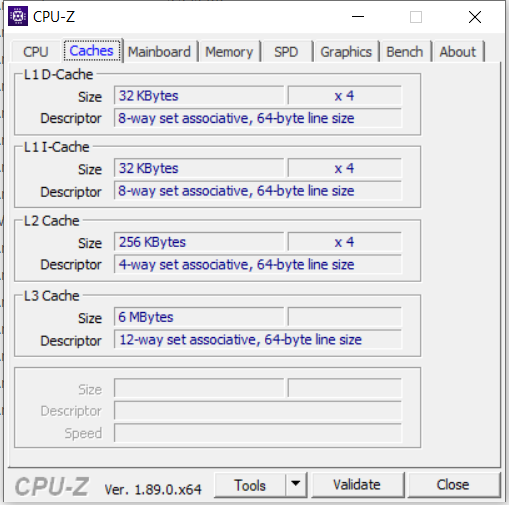
The Intel Core i5-8250U is a very popular ULV processor with four physical cores and Hyperthreading (8 threads), and a base clock of 1.6 GHz which can turbo boost up to 3.4 GHz. This CPU is part of the Kaby Lake refresh family from August 2017 and due to its TDP of only 15 watts, is suitable for slim and light subnotebooks and ultrabooks.
Compared to its predecessor, the i5-7200U (2 x 2.5 - 3.1 GHz, Hyperthreading, TDP 15 W), which only featured two physical cores, it is possible to realise performance increases in multi-threaded applications of up to 40%. Including on-die are a DDR4 memory controller and Intel's UHD Graphics 620 GPU. H.265 encoding and decoding is handled by the GPU in hardware.
Using our Cinebench R15 routine we test how the CPU performs in terms of clock rates with high, but realistic, load over time. With 565 points from its first run-through, the processor performed at expected levels for an i5-8250U. The second run-through resulted in the score already sinking down to 518 points and from this point through to 20 runs, the score bounced between this and 528 points. We observed during these runs that the clock rate generally sat at around 2.6 GHz.
So far, so good - but from run 21 the typical 3590 chaos started with wild swings in results between 375 and 571 points. We will address this behaviour in the temperature section later. Due to the extreme variation in results we ran the test multiple times - sometimes we saw massive score and clock rate swings as early as the 2nd run-through. It would be reasonable to assume that the chaotic swings in clock rate and performance would also be noticeable in daily use and provide a negative experience.
UPDATE 08.07.2019: After updating the BIOS to version 1.9.8 the frequency behaviour remains somewhat unusual - in the first benchmark runs the clock rates achieved are below what we would expect to see, and it's only the second run that they achieve the levels we saw before the update in the first run. From run 3 onward, the clock rates increase further, reaching levels that we previously didn't see before the BIOS update. This is no doubt due to better turbo boost behaviour as a result of changes to the cooling/fan profile. After this point, the clock rate behaviour is normal.
System Performance
In terms of total, overall system performance, the Lenovo ThinkPad, with its newer and faster Core i7-8565U (Whiskey Lake, 4 x 1.8 - 4.6 GHz, Hyperthreading, TDP 15 watts), faster NVMe-SSD and dedicated GPU on board was able to take top place in the field. The two candidates that share the same hardware as the review candidate as well as the Toshiba Tecra are more or less at level pegging and deliver performance as expected, whereas the Dell Latitude 14 5495 with its significantly higher-end Ryzen 7 2700U continued to have problems with PCMark benchmarking.
Subjectively, performance seems to be absolutely fine. The OS and applications start quickly, and with multitasking this business laptop does not miss a step.
| PCMark 8 Home Score Accelerated v2 | 3532 points | |
| PCMark 8 Work Score Accelerated v2 | 4727 points | |
| PCMark 10 Score | 3487 points | |
Help | ||
Storage
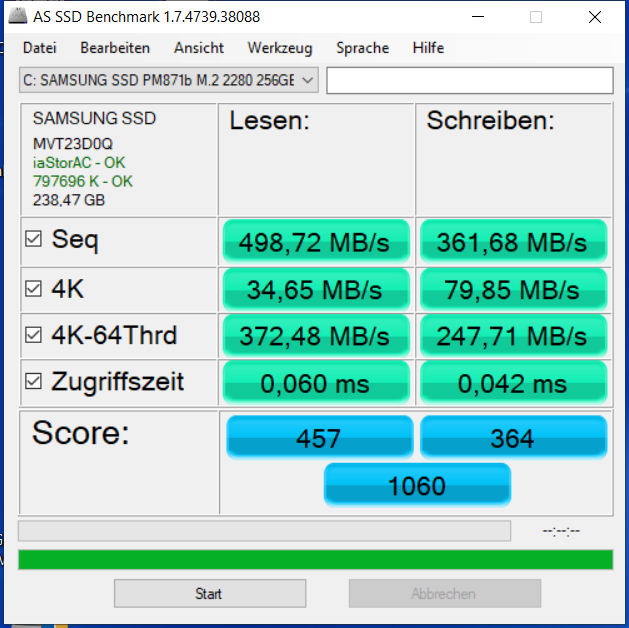
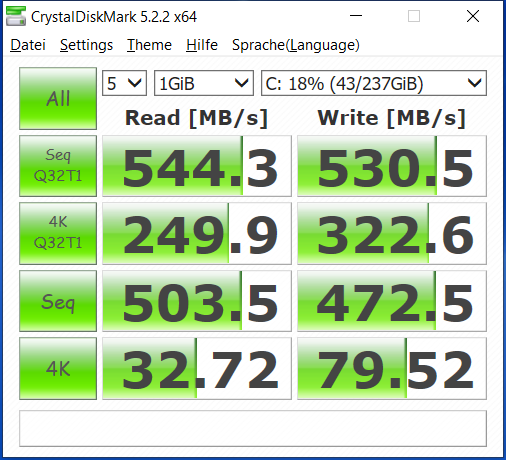
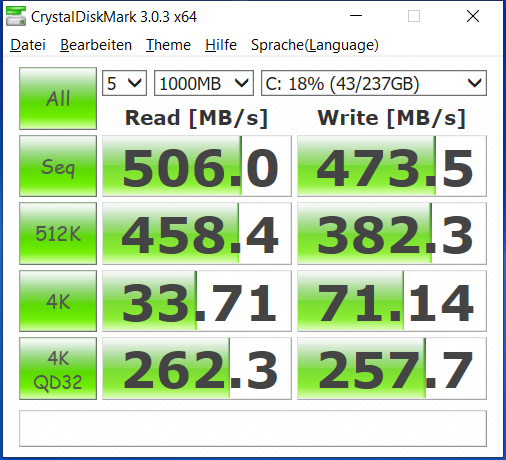
Dell has chosen to equip this laptop with a SATA III 256 GB SSD from Samsung. Its performance, considering its older interface, is subjectively good and lags behind the SSDs of the Toshiba Tecra and the smaller Dell 14-inch by 10 to 35%. The NVMe SSD in the Lenovo ThinkPad is of course in a different league.
| Dell Latitude 15 3590 Samsung SSD PM871b MZ7LN256HAJQ | Lenovo ThinkPad E590-20NB0012GE Toshiba KBG30ZMT256G | Toshiba Tecra A50-E-110 Samsung SSD PM871b MZNLN256HAJQ | Dell Latitude 14 5495 Intel SSDSCKKF256G8 | Average Samsung SSD PM871b MZ7LN256HAJQ | |
|---|---|---|---|---|---|
| CrystalDiskMark 5.2 / 6 | 61% | -4% | -21% | -5% | |
| Write 4K (MB/s) | 79.5 | 111.2 40% | 80.1 1% | 48.45 -39% | 83.7 ? 5% |
| Read 4K (MB/s) | 32.72 | 49.01 50% | 32.05 -2% | 25.11 -23% | 32.4 ? -1% |
| Write Seq (MB/s) | 472.5 | 586 24% | 505 7% | 341.2 -28% | 481 ? 2% |
| Read Seq (MB/s) | 504 | 783 55% | 528 5% | 521 3% | 515 ? 2% |
| Write 4K Q32T1 (MB/s) | 322.6 | 263 -18% | 204.9 -36% | 202 -37% | 229 ? -29% |
| Read 4K Q32T1 (MB/s) | 249.9 | 481.5 93% | 226.6 -9% | 243.5 -3% | 216 ? -14% |
| Write Seq Q32T1 (MB/s) | 531 | 784 48% | 533 0% | 320.8 -40% | 512 ? -4% |
| Read Seq Q32T1 (MB/s) | 544 | 1602 194% | 551 1% | 555 2% | 541 ? -1% |
| Write 4K Q8T8 (MB/s) | 247.5 | ||||
| Read 4K Q8T8 (MB/s) | 253.4 | ||||
| AS SSD | -2% | -15% | -45% | -17% | |
| Seq Read (MB/s) | 498.7 | 1316 164% | 513 3% | 507 2% | 494 ? -1% |
| Seq Write (MB/s) | 361.7 | 735 103% | 493.3 36% | 286.5 -21% | 430 ? 19% |
| 4K Read (MB/s) | 34.65 | 47.61 37% | 30.36 -12% | 19.76 -43% | 30.6 ? -12% |
| 4K Write (MB/s) | 79.8 | 90.3 13% | 78.8 -1% | 34.58 -57% | 67.6 ? -15% |
| 4K-64 Read (MB/s) | 372.5 | 643 73% | 366.8 -2% | 238.4 -36% | 264 ? -29% |
| 4K-64 Write (MB/s) | 247.7 | 314.1 27% | 156.1 -37% | 225.2 -9% | 213 ? -14% |
| Access Time Read * (ms) | 0.06 | 0.162 -170% | 0.129 -115% | 0.128 -113% | 0.08 ? -33% |
| Access Time Write * (ms) | 0.042 | 0.228 -443% | 0.046 -10% | 0.101 -140% | 0.06 ? -43% |
| Score Read (Points) | 457 | 822 80% | 448 -2% | 309 -32% | 344 ? -25% |
| Score Write (Points) | 364 | 478 31% | 284 -22% | 288 -21% | 324 ? -11% |
| Score Total (Points) | 1060 | 1706 61% | 971 -8% | 751 -29% | 852 ? -20% |
| Copy ISO MB/s (MB/s) | 532 | 441.3 | 278 ? | ||
| Copy Program MB/s (MB/s) | 165.4 | 152.1 | 106.3 ? | ||
| Copy Game MB/s (MB/s) | 405 | 260 | 190.8 ? | ||
| Total Average (Program / Settings) | 30% /
24% | -10% /
-11% | -33% /
-35% | -11% /
-12% |
* ... smaller is better

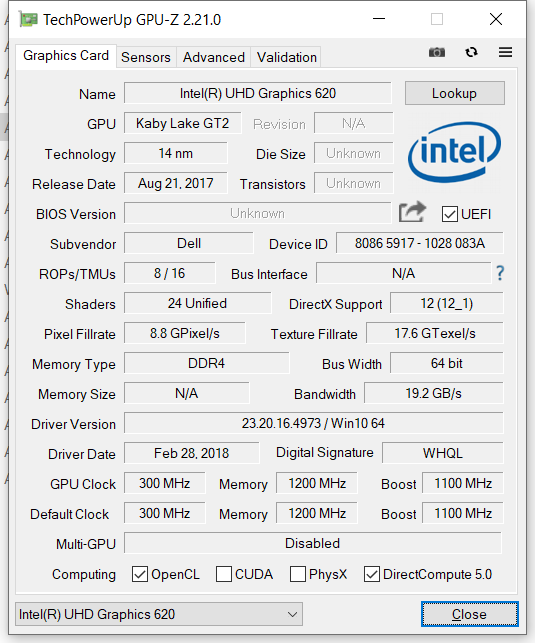
GPU
The Intel UHD Graphics 620 GPU is a basic integrated GPU intended for normal desktop usage from 2017 which shares main memory with the CPU. It benefits significantly from fast DDR4 RAM in dual-channel mode. DDR4 memory is available, but dual-channel is not.
It is no surprise therefore that in testing it comes in somewhat below average. The AMD GPU equipped CPU of the smaller Latitude is able to place far higher up the ladder, whilst the AMD Radeon RX 550X in the Lenovo E590, theoretically playing in a much higher league, is not able to fully realise its potential due to thermal issues. The 3DMark 11 scores remained the same whether on mains or battery power.
| 3DMark 11 Performance | 1778 points | |
| 3DMark Cloud Gate Standard Score | 6006 points | |
| 3DMark Fire Strike Score | 968 points | |
Help | ||
Gaming Performance
Dusting off "BioShock Infinite" from 2013, the integrated GPU scores placed below average for UHD 620 results and was only able to drive the, still very attractive, 3D shooter with a resolution of 1,280x720 and low details at reasonable frame rates. With the current, not particularly demanding, "Farming Simulator 19" we find again that only with the lowest details preset and the same resolution is acceptable performance achieved.
"Rise of the Tome Raider" (2016) acts as an example of the numerous 3D games which, with a UHD 620, can only be played at the very lowest detail settings and a pixelated 1,024x768 resolution. The GPU in this review device however does not even manage that. The majority of indie games run without issues, and games with an isometric view such as "Diablo III" and "Starcraft II" can in contrast be run with medium settings, depending on the game.
| BioShock Infinite | |
| 1280x720 Very Low Preset | |
| Lenovo ThinkPad E590-20NB0012GE | |
| Dell Latitude 14 5495 | |
| Average Intel UHD Graphics 620 (18.3 - 90.2, n=187) | |
| Dell Latitude 15 3590 | |
| Toshiba Tecra A50-E-110 | |
| 1366x768 Medium Preset | |
| Lenovo ThinkPad E590-20NB0012GE | |
| Average Intel UHD Graphics 620 (11.5 - 45.5, n=187) | |
| Dell Latitude 15 3590 | |
| Toshiba Tecra A50-E-110 | |
| Rise of the Tomb Raider - 1024x768 Lowest Preset | |
| Dell Latitude 14 5495 | |
| Average Intel UHD Graphics 620 (10.4 - 110.7, n=82) | |
| Dell Latitude 15 3590 | |
| low | med. | high | ultra | |
|---|---|---|---|---|
| BioShock Infinite (2013) | 52.4 | 29.5 | ||
| Rise of the Tomb Raider (2016) | 18.7 | |||
| Farming Simulator 19 (2018) | 54.8 | 20.8 |
Emissions - Annoying Noise Profile
Noise Emissions
While idling, the fan of the laptop is switched off, but occasionally makes itself known by spinning up without there being an obvious reason for doing so. Whilst Windows updates were running we noticed this issue repeatedly, whereas whilst we were running two cycles of the Kraken 1.1 browser benchmark the issue did not occur consistently. At its lowest speed level, the fan is only audible from close up.
After starting our stress test (Prime95 and FurMark) we were surprised to see that the fan only ran at a very low speed - this resulted in immediate and severe throttling (more later) of the CPU. Only after a (temporary) return to good clock speeds did the fan then spin up to a higher level. The noise that resulted was mostly typical for a fan of this type, but in a quieter room it would definitely be noticeable from several meters away and is unfortunately accompanied by an annoying high-pitched whine.
UPDATE 08.07.2019: After upgrading the BIOS to version 1.9.8 the fan is not so quick to spin up whilst under load (or does not spin up at all). After starting Prime95 and FurMark, it took around 15 seconds before the fan started to spin up to higher speeds. Around one second later, these speeds also then began to decrease. Further increases in fan speed were more gradual and measured right up to its maximum level.
Noise level
| Idle |
| 30.6 / 31.9 / 31.9 dB(A) |
| Load |
| 39 / 39.1 dB(A) |
 | ||
30 dB silent 40 dB(A) audible 50 dB(A) loud |
||
min: | ||
Temperature
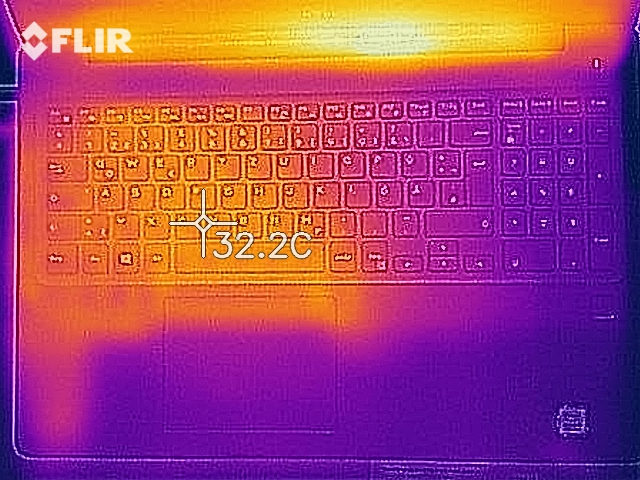
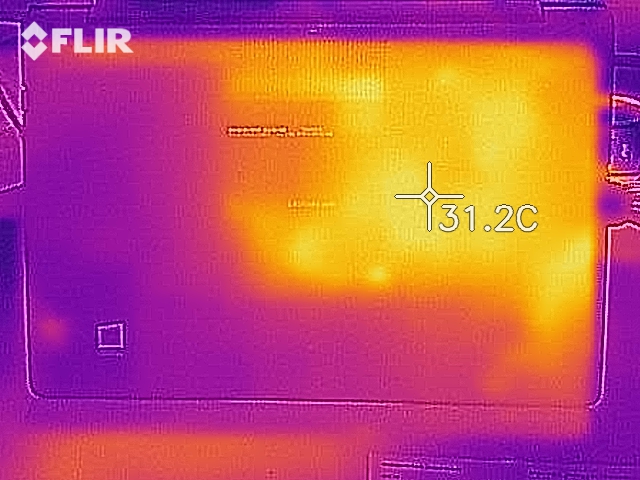
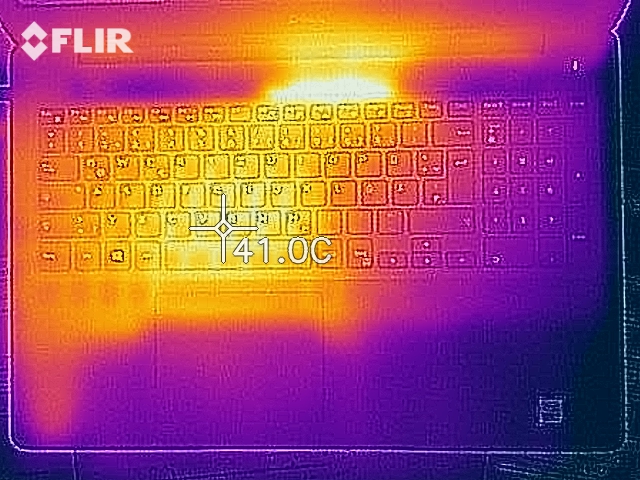
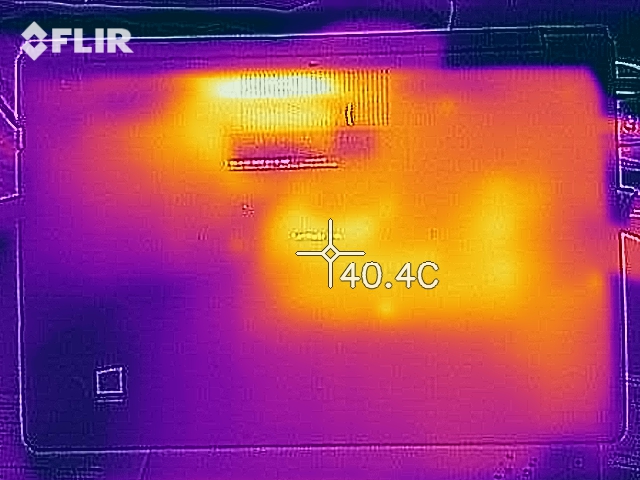
The top side of the laptop has no issues with temperature. We measured a maximum of 26 °C (~79 °F) at idle, and 41 °C (~106 °F) under sustained load. The bottom of the laptop whilst being used on one's knees reached temperatures that may be an issue for more 'delicate' body parts.
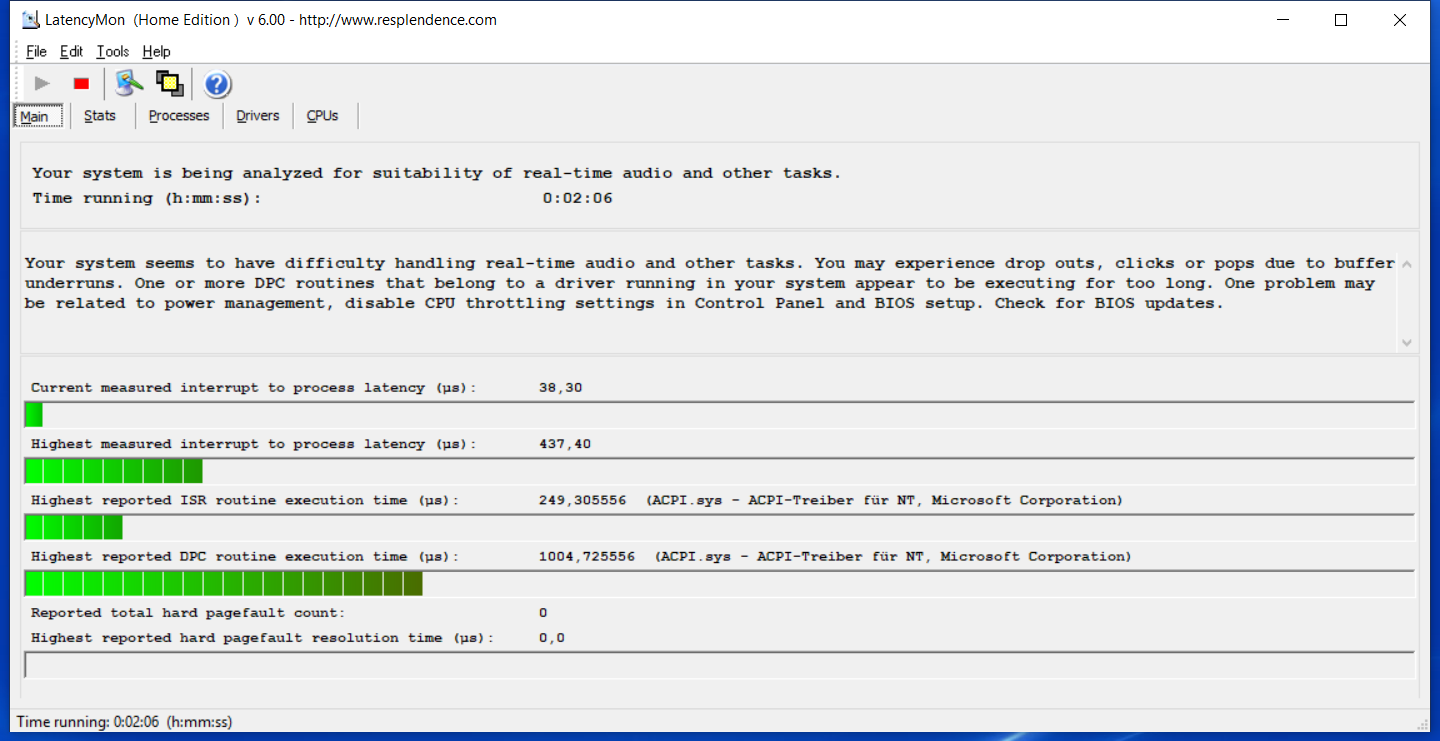
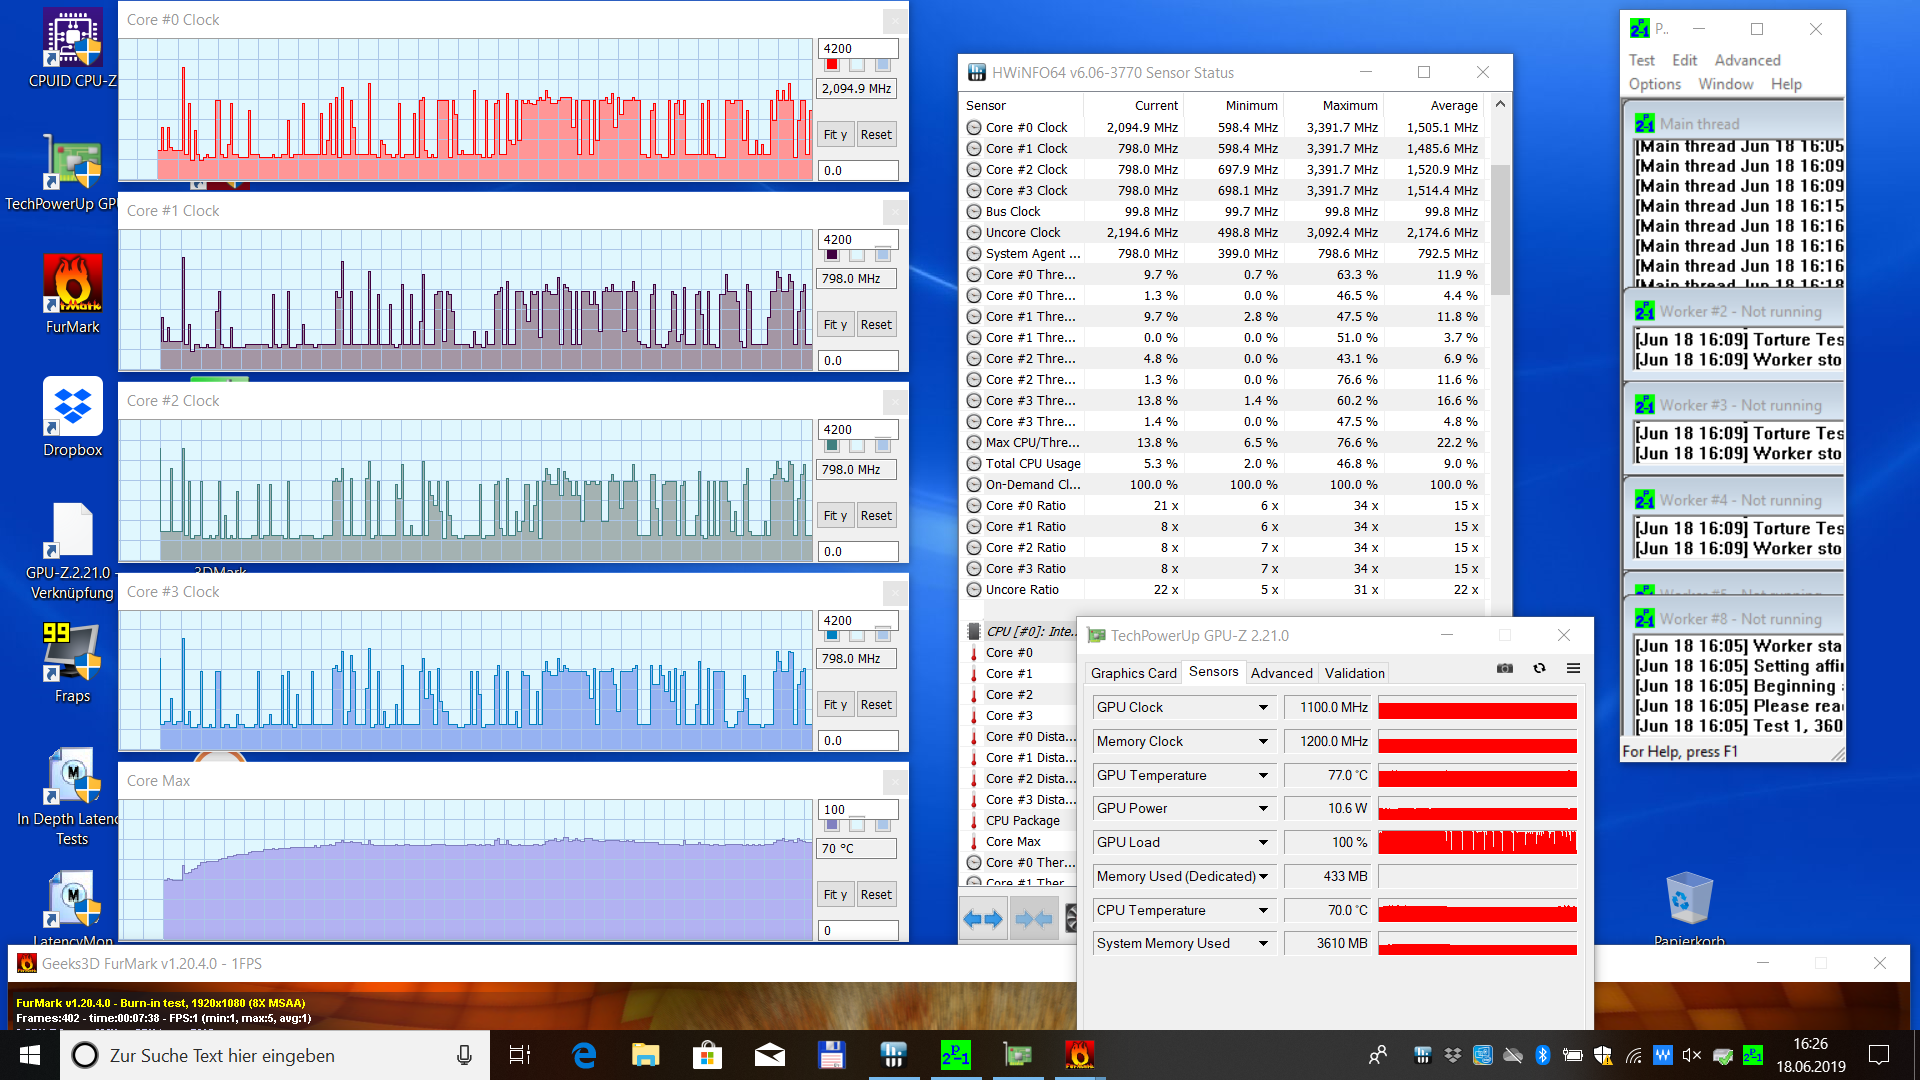
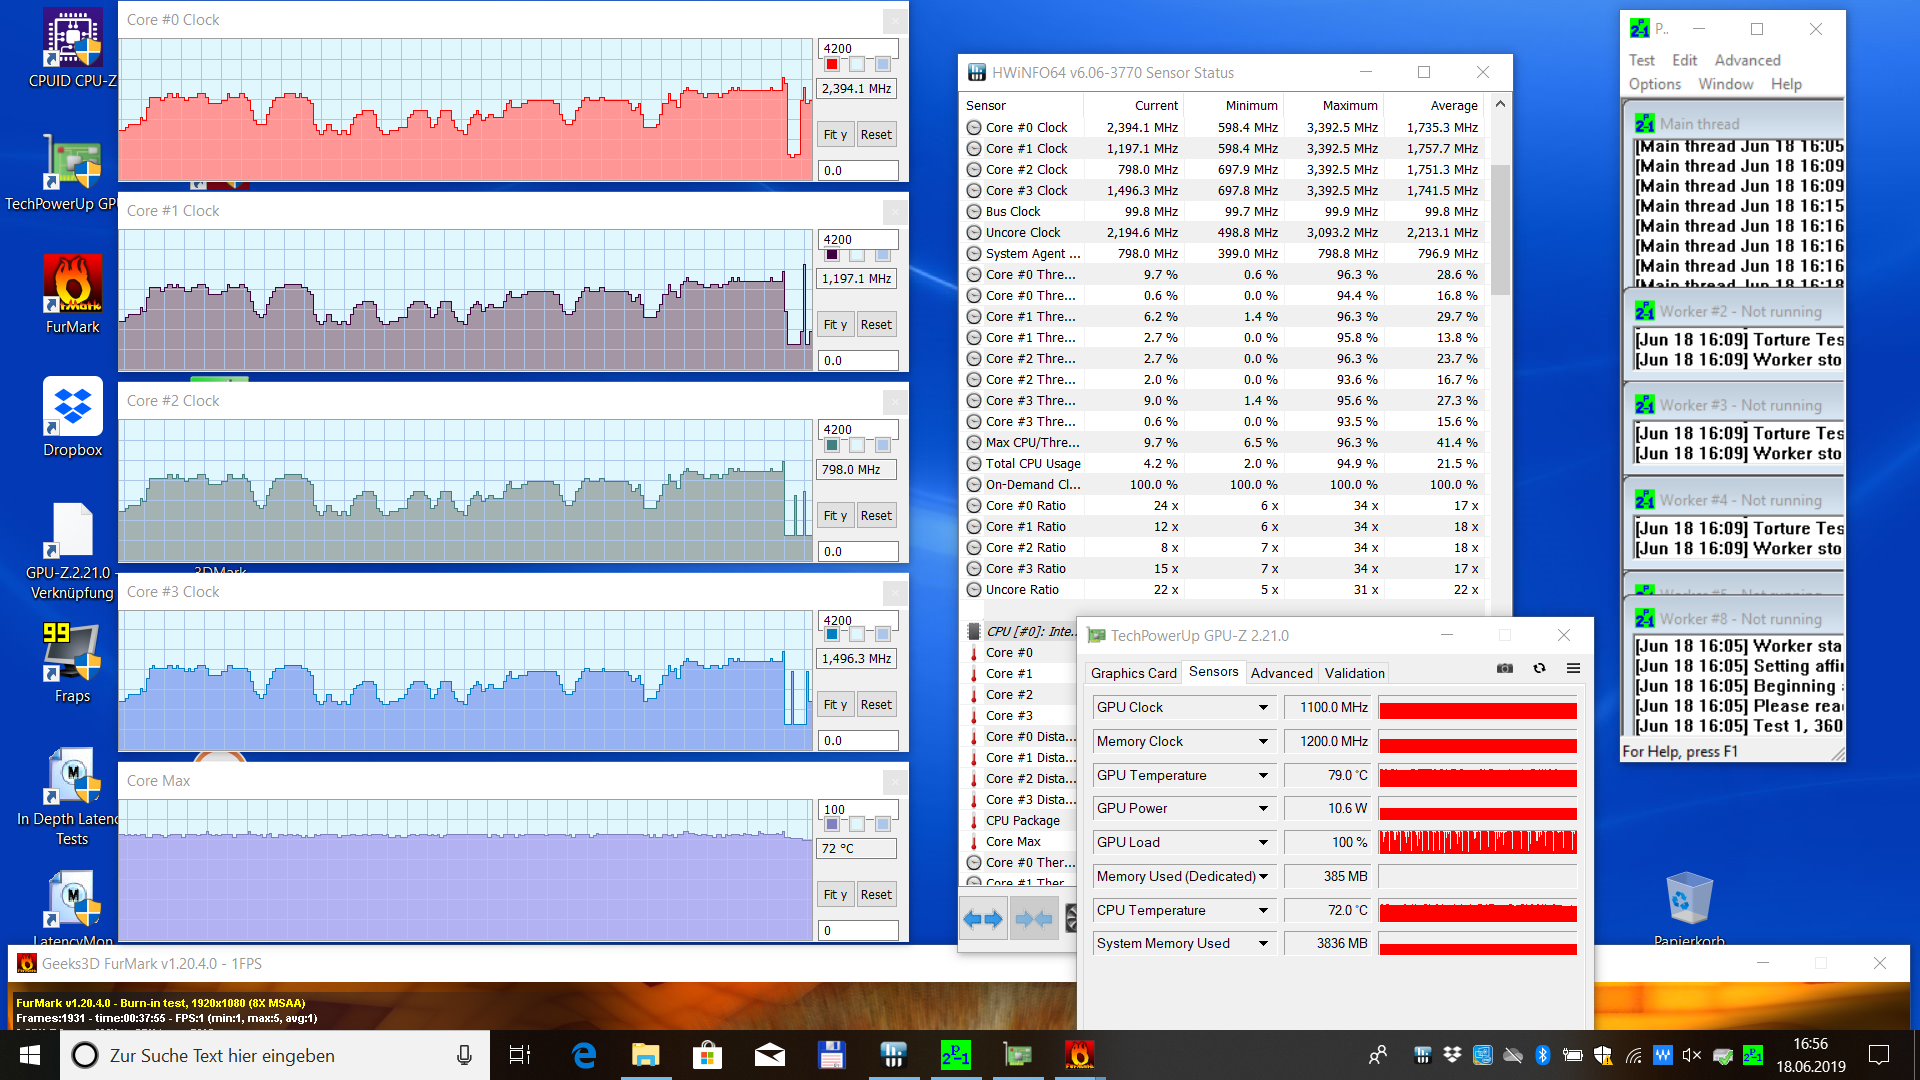
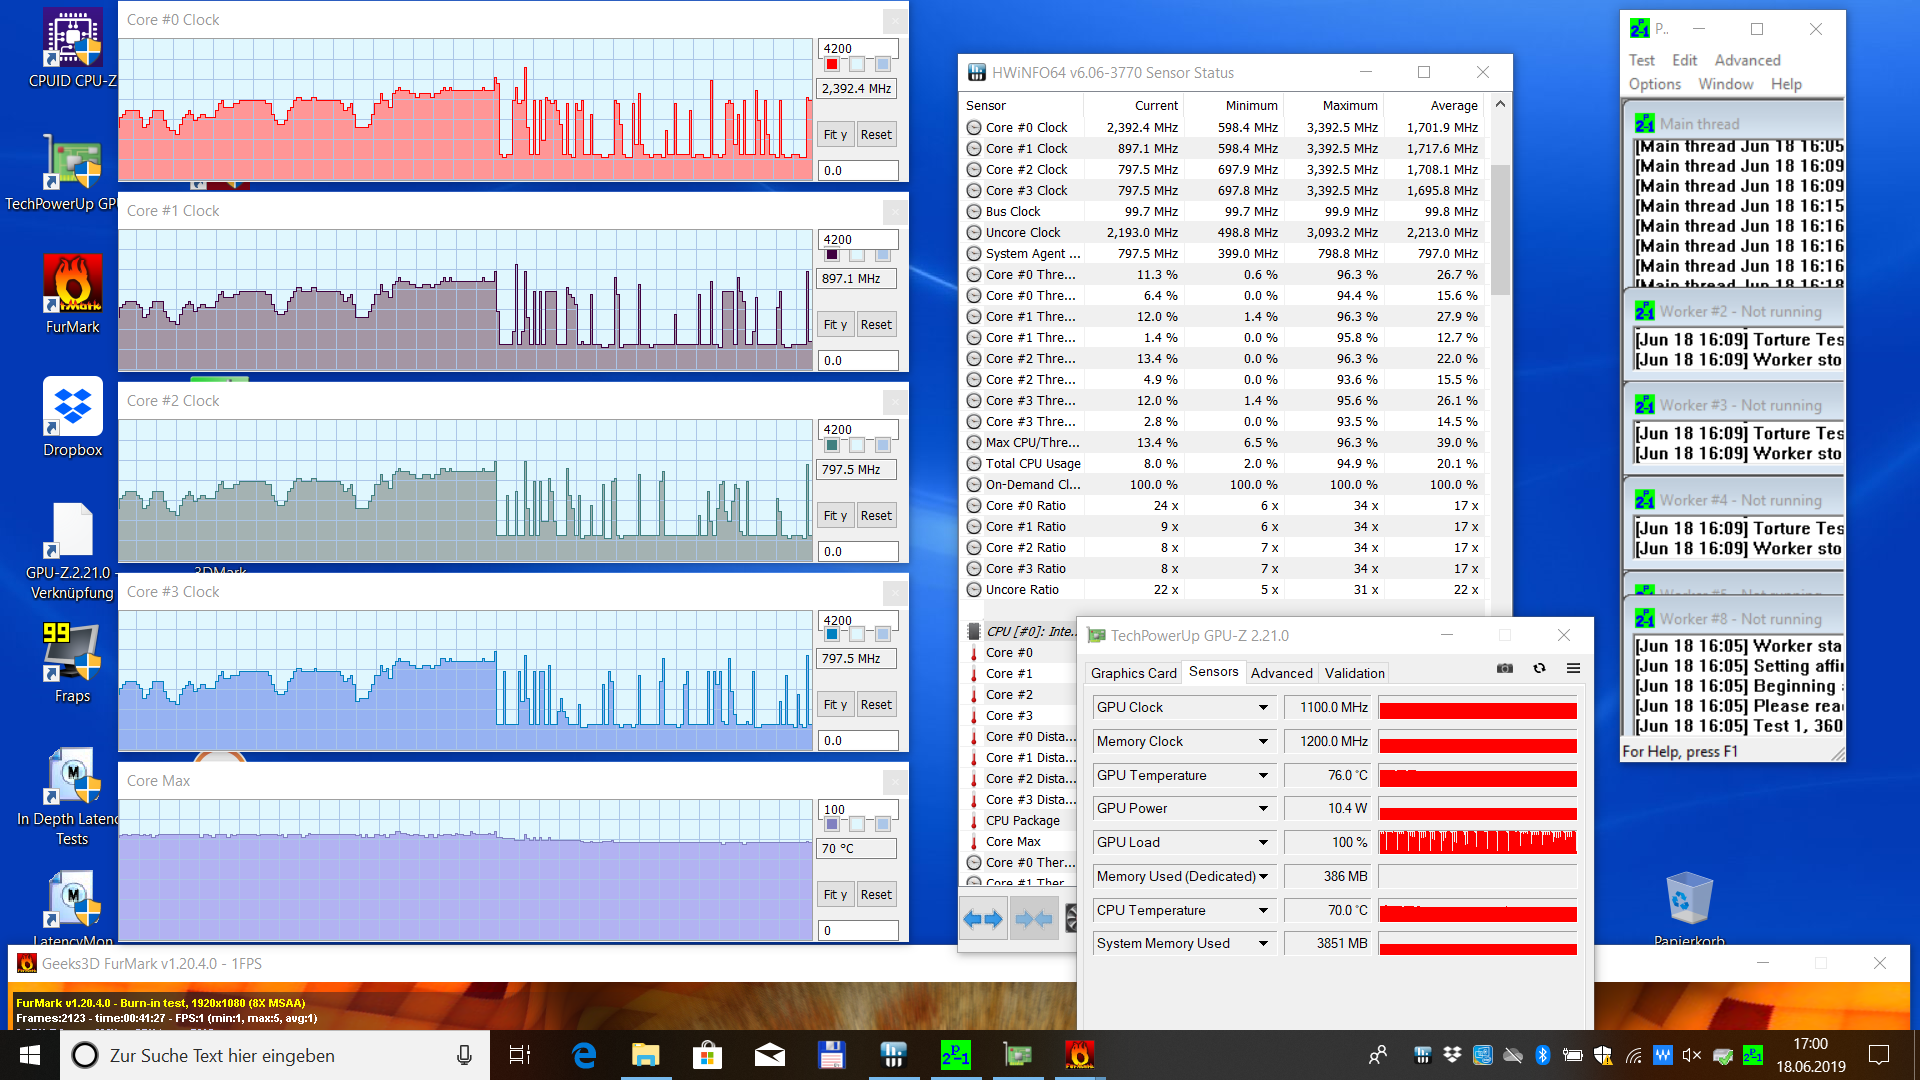
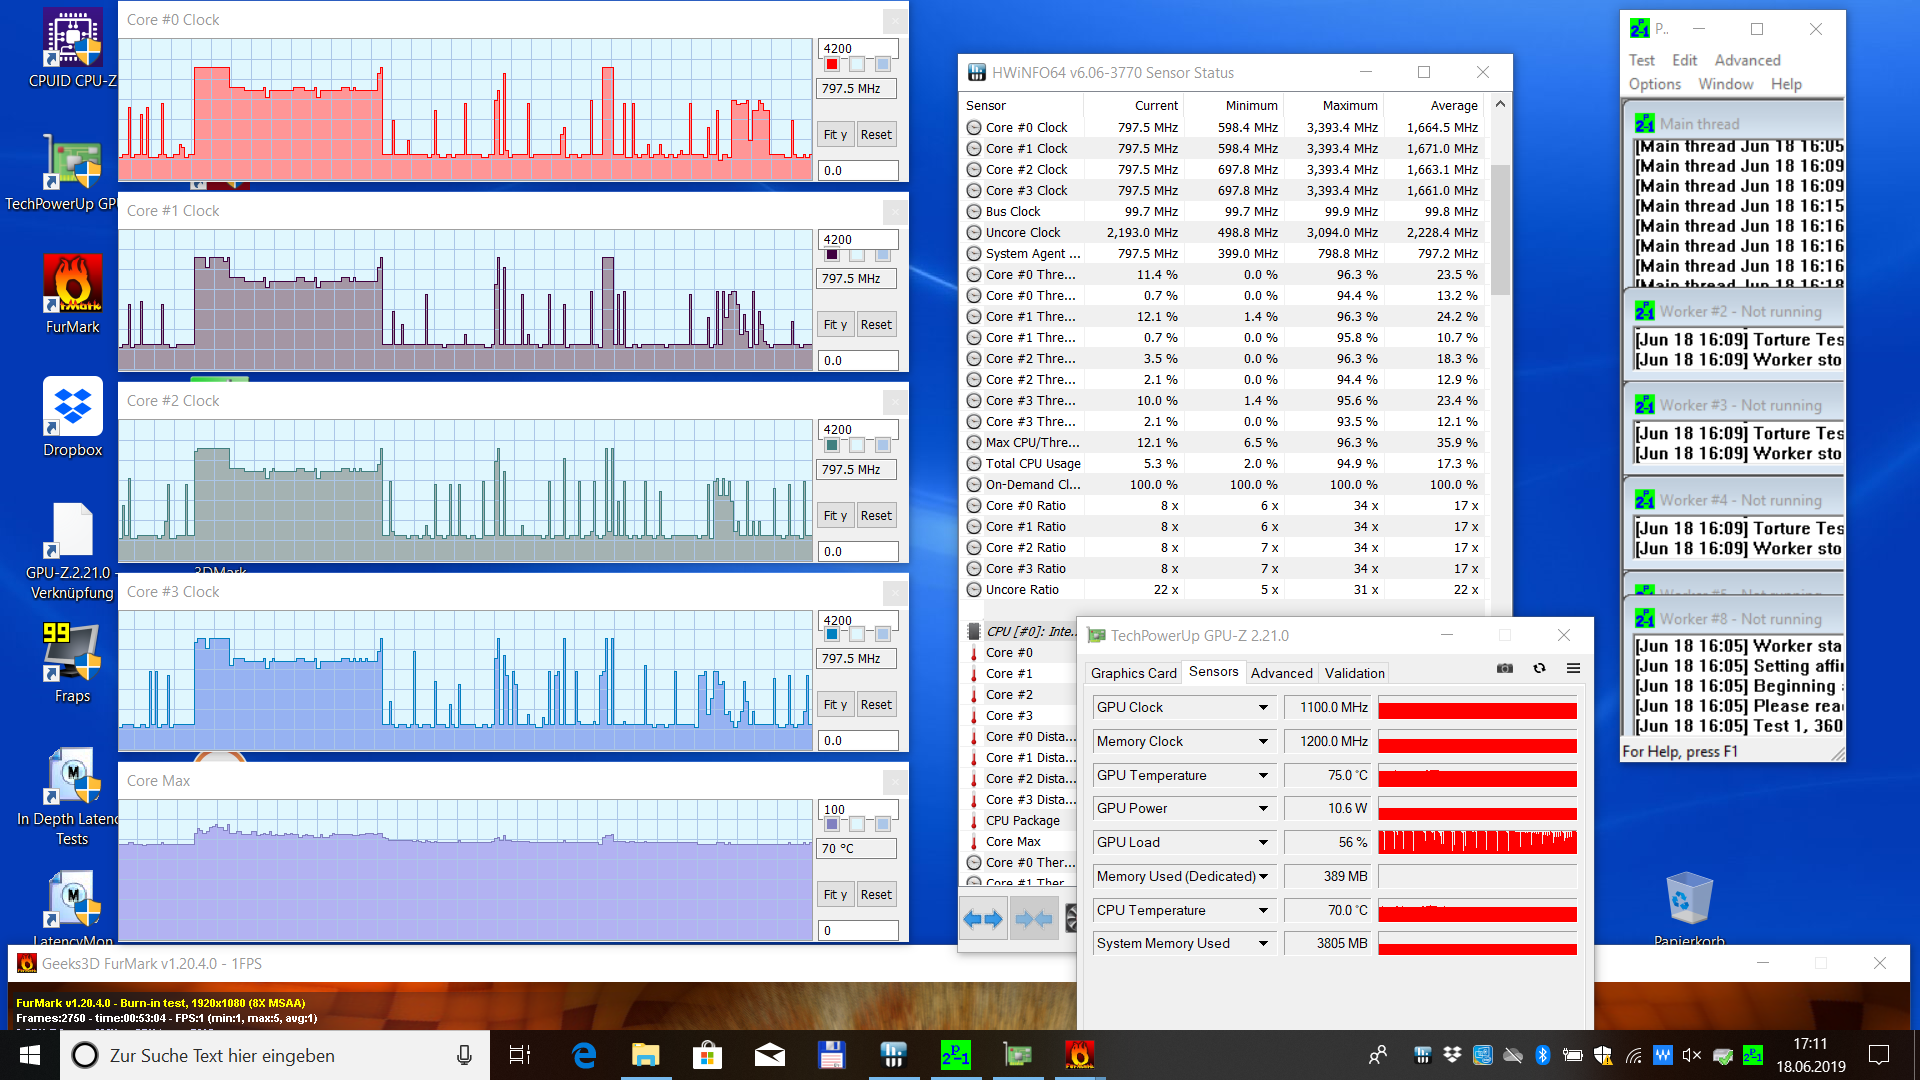
As we mentioned whilst discussing noise emissions, and as can be seen in the leftmost screenshot, after starting our stress test there was no break in the CPU clock rate. They simply remained at idle levels and only after a few minutes had elapsed did they raise to a more constant, higher level. When this occurred, the fan also ramped up considerably.
The resulting clock rate behaviour can only be described as chaotic - this is easily seen in the two middle and right hand screenshots below. You will notice also that there were phases of abrupt swings in clock rate (saw-tooth) as well as phases with small swings in clock rate (hills/valleys) - this occurred during constant load. To date, the reviewer has not seen behaviour like this, and it is clear that there is a problem with the fan and cooling profile. We noticed on several occasions that the fan only span up to higher speeds after the CPU had already exceeded the 90 °C (~194 °F) mark.
The CPU during our testing was only once able to rise above the 2.7 GHz level. It more frequently operated at 700 or 800 MHz. In this, admittedly not real-world, scenario, there was massive throttling. The GPU did not have to contend with this issue, and its clockrate was able to almost constantly maintain a 1.1 GHz clock. The highest recorded core temperatures during the stress test runs was 85 °C (~185 °F).
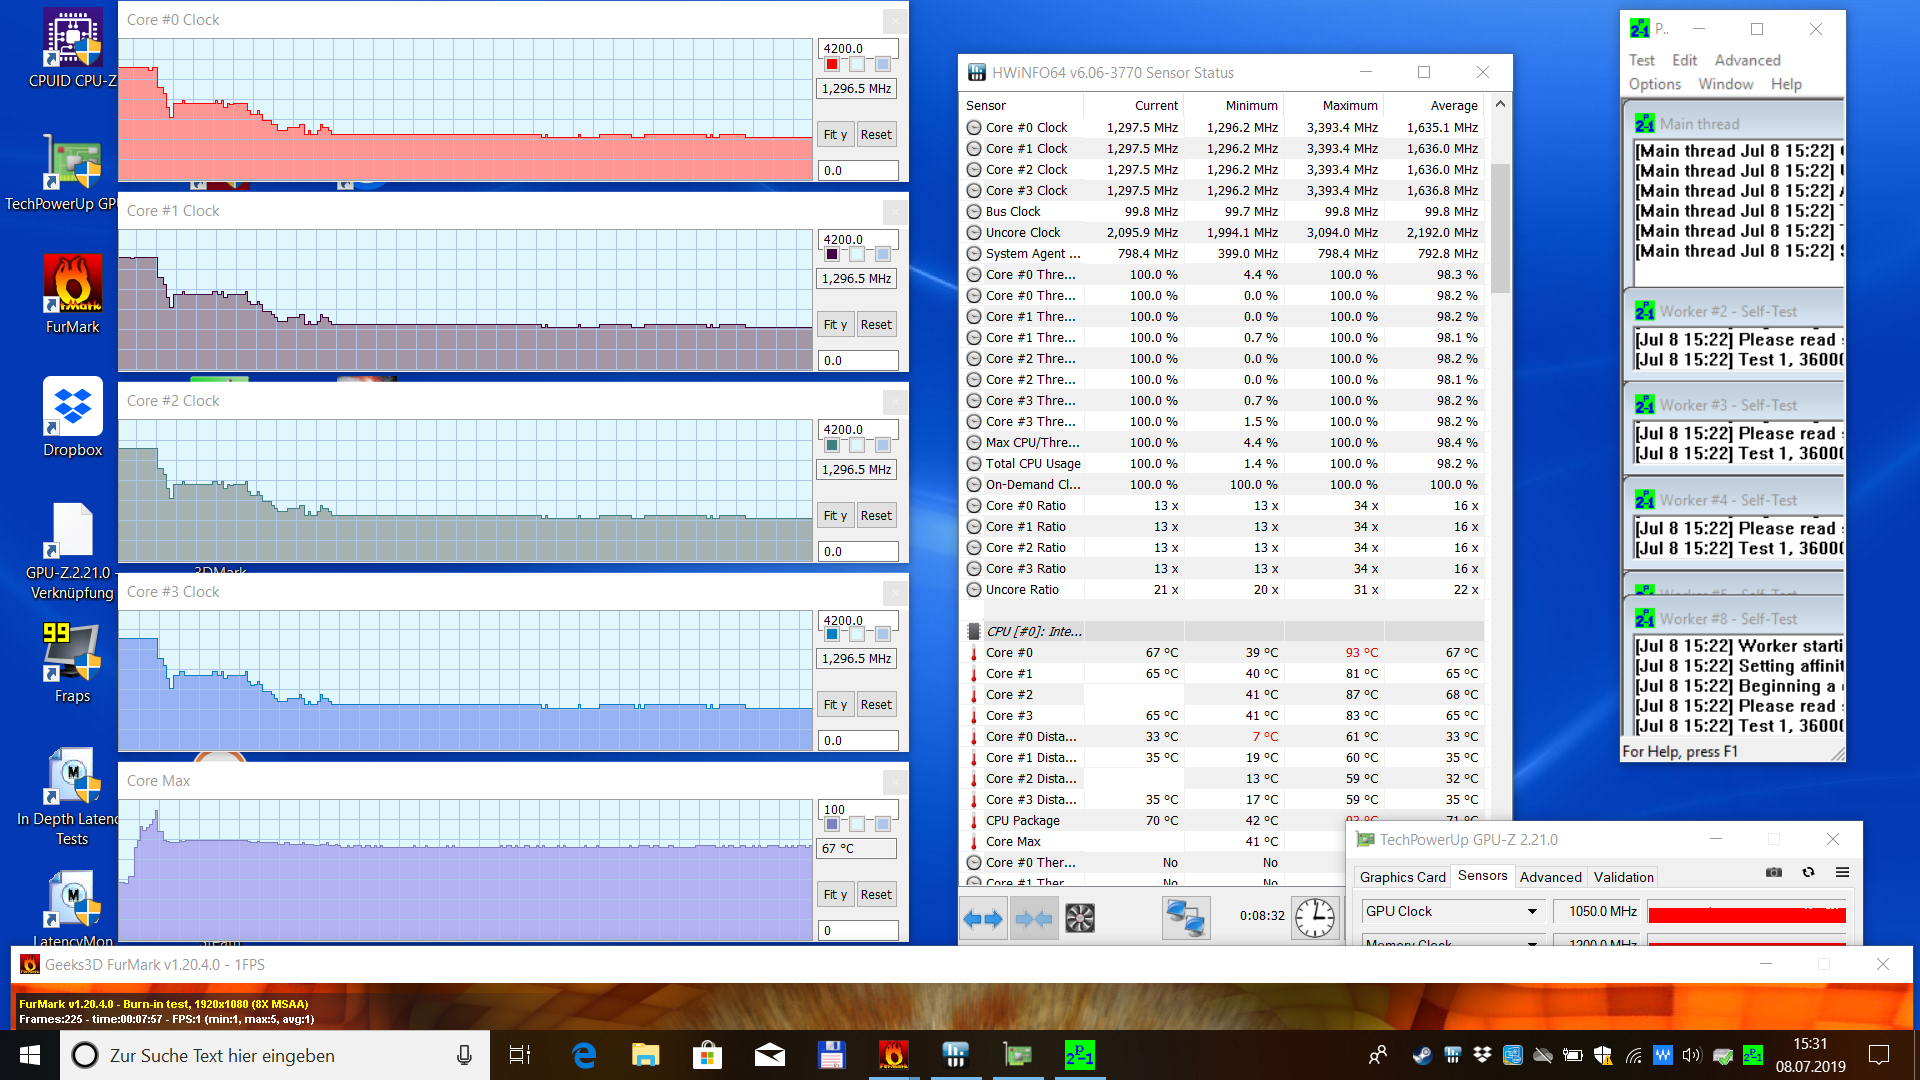
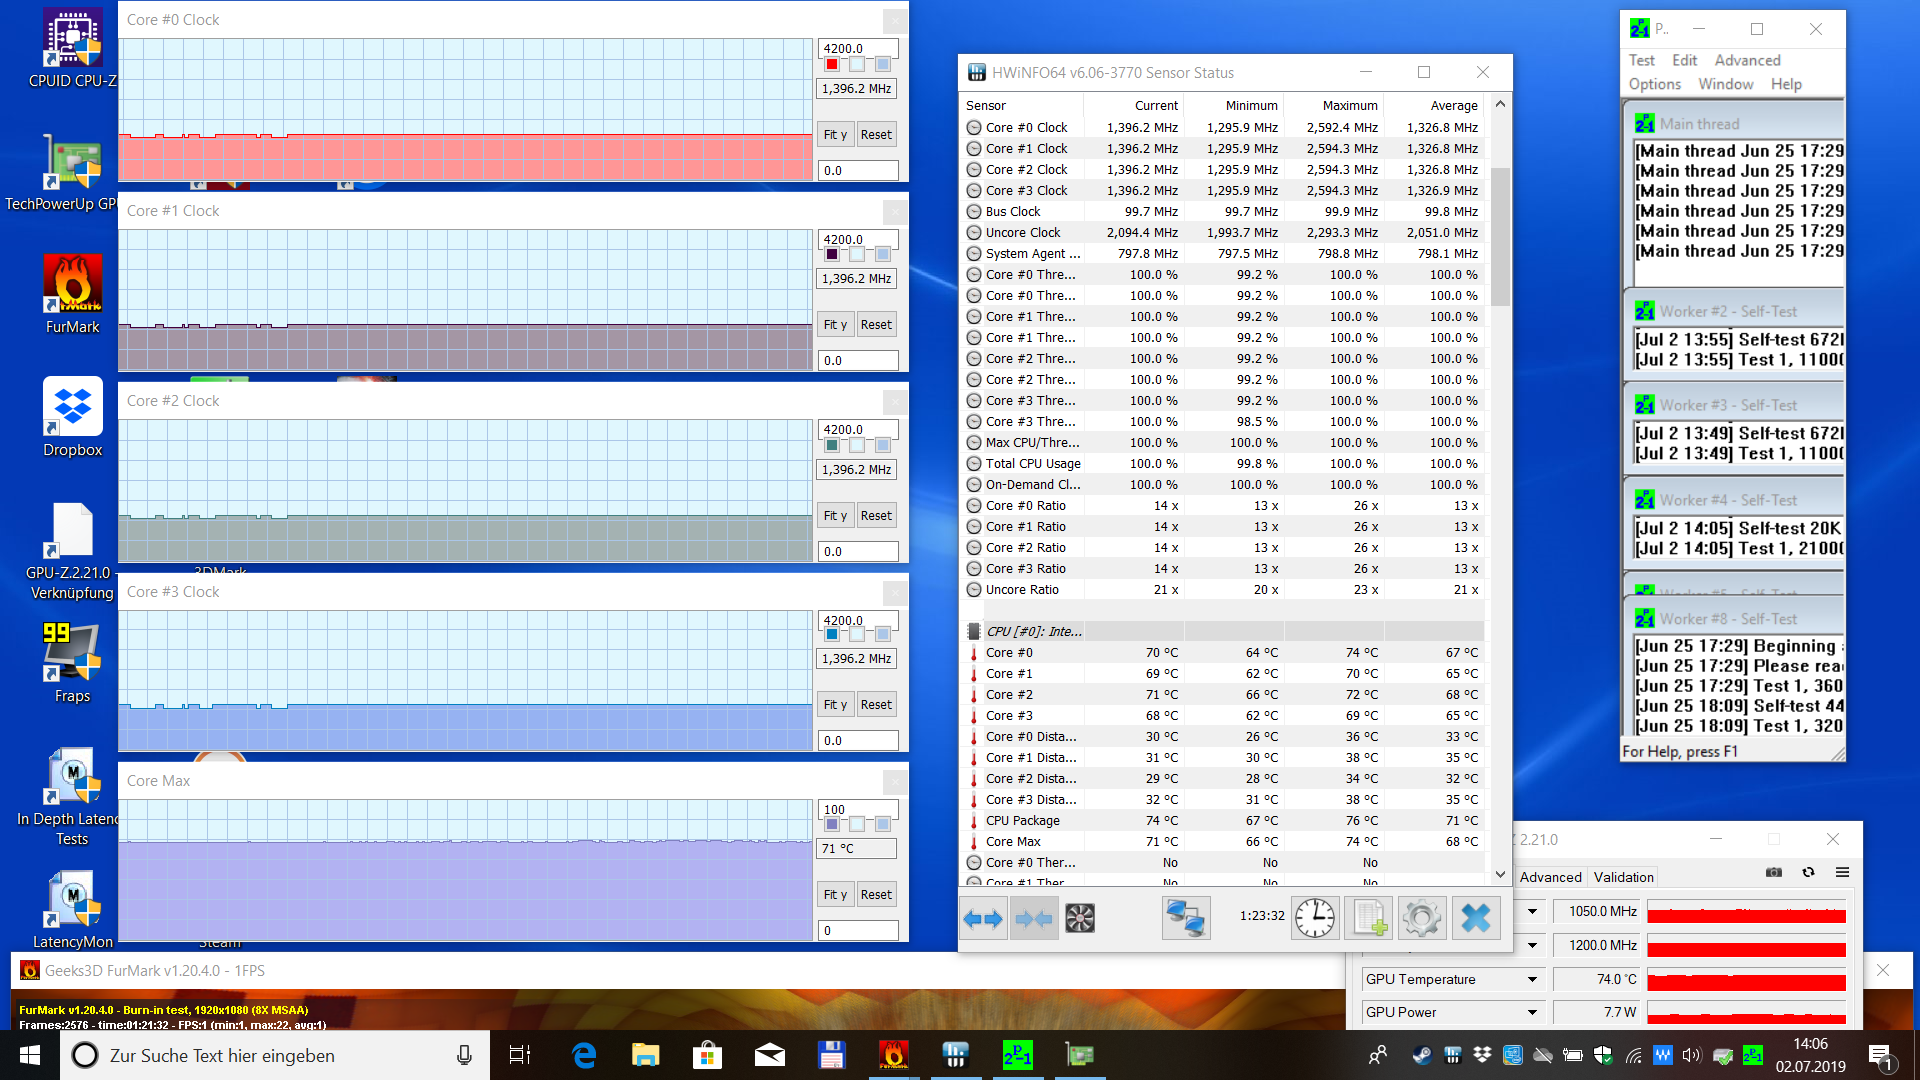
UPDATE 08.07.2019: As can be seen in the screenshots below ("Stress test new BIOS"), frequency behaviour was also more normal with the new BIOS. After one minute the clock rate reduced to 2.3 GHz, and after a further minute was down to 1.3 to 1.4 GHz which was maintained to the end of the test. Throttling in this scenario is absolutely normal and seen with the new BIOS also.
(±) The maximum temperature on the upper side is 40.6 °C / 105 F, compared to the average of 34.3 °C / 94 F, ranging from 21.2 to 62.5 °C for the class Office.
(+) The bottom heats up to a maximum of 37.5 °C / 100 F, compared to the average of 36.8 °C / 98 F
(+) In idle usage, the average temperature for the upper side is 24.8 °C / 77 F, compared to the device average of 29.5 °C / 85 F.
(+) The palmrests and touchpad are cooler than skin temperature with a maximum of 27.7 °C / 81.9 F and are therefore cool to the touch.
(±) The average temperature of the palmrest area of similar devices was 27.5 °C / 81.5 F (-0.2 °C / -0.4 F).
Speakers
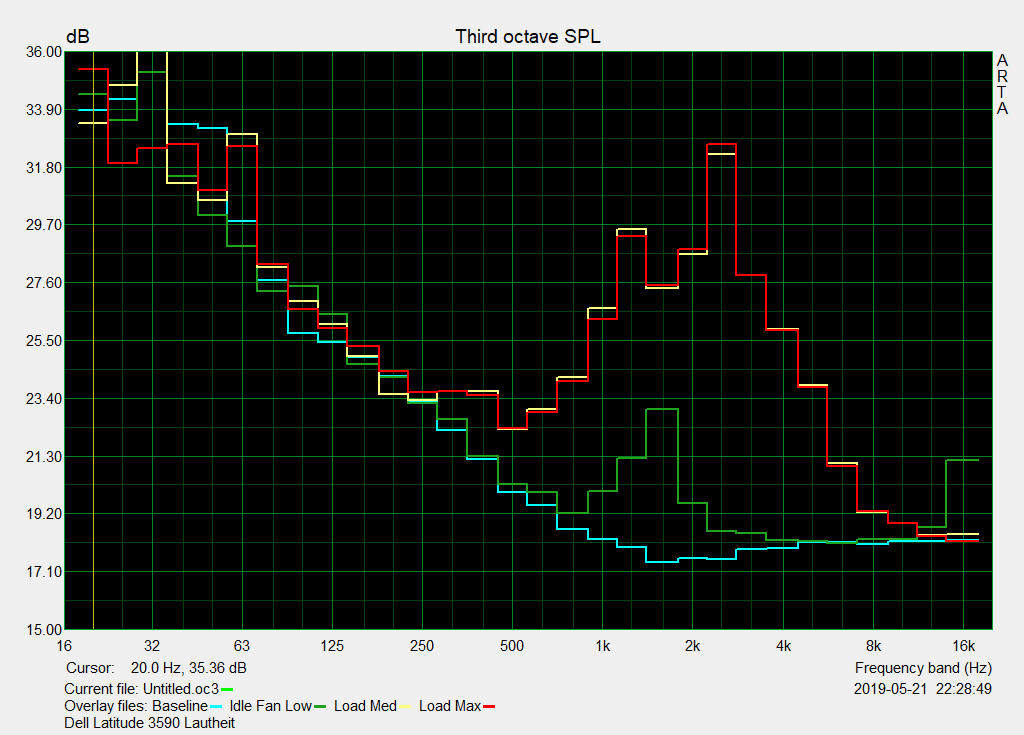
The two mini speakers, located towards the front and underneath, are lacking significantly in both bass and volume. They do however OK in terms of dynamics with more wide-ranging tracks. Filling a room with sound though is out of the question, as the maximum volume is just enough for a medium sized room.
With music titles that are somewhat heavier, with multiple loud instruments (metal, punk etc.) differentiation between instruments suffers immensely and the sound dynamics suffer, tending towards sounding like a shrill mess. There are also issues with significant volume shifts. Playing at reduced volume levels will generally result in a more pleasant experience.
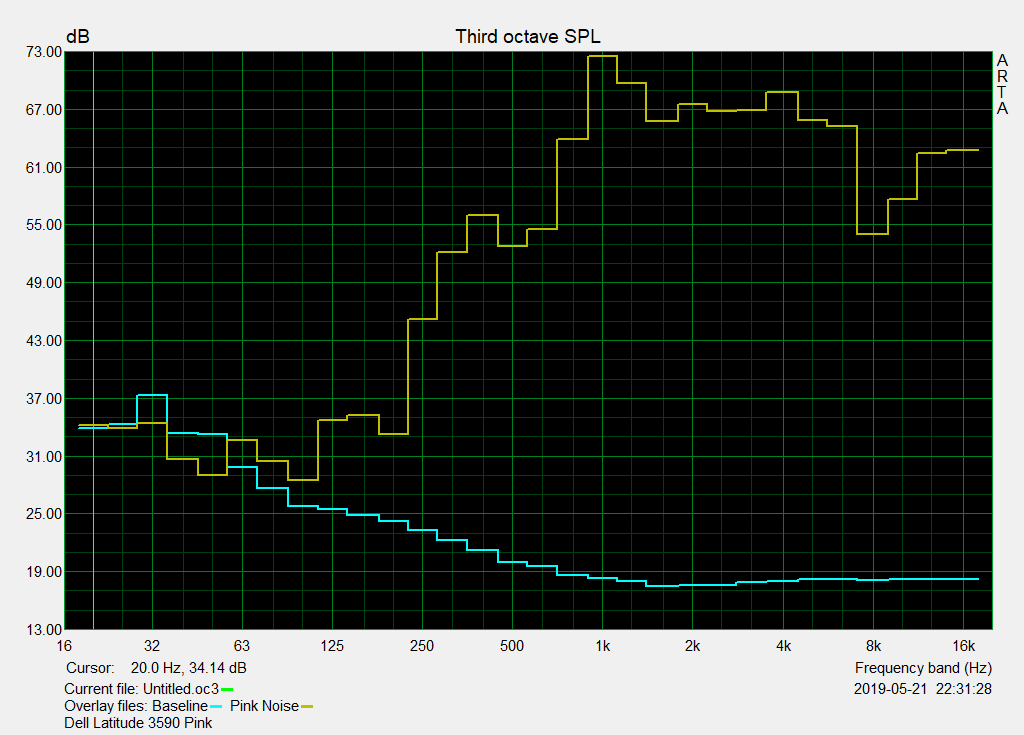
Dell Latitude 15 3590 audio analysis
(±) | speaker loudness is average but good (72.5 dB)
Bass 100 - 315 Hz
(-) | nearly no bass - on average 24.2% lower than median
(±) | linearity of bass is average (11.2% delta to prev. frequency)
Mids 400 - 2000 Hz
(±) | higher mids - on average 6.4% higher than median
(±) | linearity of mids is average (10% delta to prev. frequency)
Highs 2 - 16 kHz
(+) | balanced highs - only 4.9% away from median
(+) | highs are linear (6.8% delta to prev. frequency)
Overall 100 - 16.000 Hz
(±) | linearity of overall sound is average (24.6% difference to median)
Compared to same class
» 73% of all tested devices in this class were better, 7% similar, 21% worse
» The best had a delta of 7%, average was 21%, worst was 53%
Compared to all devices tested
» 75% of all tested devices were better, 5% similar, 20% worse
» The best had a delta of 4%, average was 24%, worst was 134%
Toshiba Tecra A50-E-110 audio analysis
(-) | not very loud speakers (71.8 dB)
Bass 100 - 315 Hz
(-) | nearly no bass - on average 30.1% lower than median
(+) | bass is linear (4% delta to prev. frequency)
Mids 400 - 2000 Hz
(±) | higher mids - on average 5.8% higher than median
(-) | mids are not linear (16.8% delta to prev. frequency)
Highs 2 - 16 kHz
(±) | higher highs - on average 5.6% higher than median
(±) | linearity of highs is average (9.3% delta to prev. frequency)
Overall 100 - 16.000 Hz
(-) | overall sound is not linear (34.7% difference to median)
Compared to same class
» 97% of all tested devices in this class were better, 1% similar, 2% worse
» The best had a delta of 7%, average was 21%, worst was 53%
Compared to all devices tested
» 93% of all tested devices were better, 1% similar, 6% worse
» The best had a delta of 4%, average was 24%, worst was 134%
Dell Latitude 14 5495 audio analysis
(±) | speaker loudness is average but good (76.1 dB)
Bass 100 - 315 Hz
(-) | nearly no bass - on average 17.1% lower than median
(±) | linearity of bass is average (9.7% delta to prev. frequency)
Mids 400 - 2000 Hz
(±) | higher mids - on average 5.5% higher than median
(±) | linearity of mids is average (8.6% delta to prev. frequency)
Highs 2 - 16 kHz
(+) | balanced highs - only 2.1% away from median
(+) | highs are linear (5.3% delta to prev. frequency)
Overall 100 - 16.000 Hz
(±) | linearity of overall sound is average (17.5% difference to median)
Compared to same class
» 27% of all tested devices in this class were better, 7% similar, 66% worse
» The best had a delta of 7%, average was 21%, worst was 53%
Compared to all devices tested
» 34% of all tested devices were better, 8% similar, 58% worse
» The best had a delta of 4%, average was 24%, worst was 134%
Power Management - Efficient due to Throttling
Power Consumption
The power consumption of the Dell 3590 is typical for a system with these components and does not exceed expectations under any load conditions - with one exception: under maximum load the laptop consumes only 24 watts - a noticeably low level which is the result of its massive issues with throttling.
| Off / Standby | |
| Idle | |
| Load |
|
Key:
min: | |
| Dell Latitude 15 3590 i5-8250U, UHD Graphics 620, Samsung SSD PM871b MZ7LN256HAJQ, TN LED, 1920x1080, 15.6" | Lenovo ThinkPad E590-20NB0012GE i7-8565U, Radeon RX 550X (Laptop), Toshiba KBG30ZMT256G, IPS, 1920x1080, 15.6" | Toshiba Tecra A50-E-110 i5-8250U, UHD Graphics 620, Samsung SSD PM871b MZNLN256HAJQ, IPS, 1920x1080, 15.6" | Dell Latitude 14 5495 R7 2700U, Vega 10, Intel SSDSCKKF256G8, IPS LED, 1920x1080, 14" | Average Intel UHD Graphics 620 | Average of class Office | |
|---|---|---|---|---|---|---|
| Power Consumption | -43% | -3% | -4% | -13% | -35% | |
| Idle Minimum * (Watt) | 4.3 | 3.48 19% | 3.8 12% | 4.3 -0% | 3.81 ? 11% | 4.41 ? -3% |
| Idle Average * (Watt) | 7.2 | 7.2 -0% | 7.7 -7% | 6.6 8% | 6.94 ? 4% | 7.37 ? -2% |
| Idle Maximum * (Watt) | 9.8 | 10.2 -4% | 9.3 5% | 7.7 21% | 8.75 ? 11% | 8.58 ? 12% |
| Load Average * (Watt) | 38 | 59.6 -57% | 31 18% | 32 16% | 35 ? 8% | 43 ? -13% |
| Load Maximum * (Watt) | 24 | 65.1 -171% | 34.6 -44% | 40 -67% | 47.5 ? -98% | 64.6 ? -169% |
| Witcher 3 ultra * (Watt) | 49 |
* ... smaller is better
Battery Life
And now we come to battery life, which is without doubt one of the few strong points of the Latitude 3590. With 56 Wh the battery has a relatively high capacity, which in combination with its sparing power consumption results in very good battery life and longevity. In our WLAN test, which aims to simulate real-world usage, at reduced brightness, the Dell Latitude lasted a good nine hours and should therefore last the entire day for most users.
The runtimes of the competition from Lenovo and Toshiba are, due to their smaller 45 Wh batteries and other hardware spec, not directly comparable. It is clear from first impressions however that the runtime of theTecra in our WLAN test was very week. Our AMD based Dell Latitude 5495 with its smaller screen and slightly larger battery produced a result comparable to our review laptop.
| Dell Latitude 15 3590 i5-8250U, UHD Graphics 620, 56 Wh | Lenovo ThinkPad E590-20NB0012GE i7-8565U, Radeon RX 550X (Laptop), 45 Wh | Toshiba Tecra A50-E-110 i5-8250U, UHD Graphics 620, 45 Wh | Dell Latitude 14 5495 R7 2700U, Vega 10, 61 Wh | Average of class Office | |
|---|---|---|---|---|---|
| Battery runtime | -15% | -46% | 3% | 22% | |
| Reader / Idle (h) | 20.2 | 18.9 -6% | 18.2 -10% | 23.7 ? 17% | |
| H.264 (h) | 10.3 | 9 -13% | 11.8 15% | 15 ? 46% | |
| WiFi v1.3 (h) | 9.1 | 7.1 -22% | 4.9 -46% | 9.4 3% | 12.9 ? 42% |
| Load (h) | 2.2 | 1.8 -18% | 2.3 5% | 1.794 ? -18% |
Pros
Cons
Verdict
On the positive side of the pro/contra list for this failed attempt at an office notebook with business ambitions are the truly very good input devices, as well as very good battery life. In this sense, the Dell Latitude 15 3590 does deliver on its professional ambitions. This applies also to its included security package and its business-oriented connectivity options. The chassis also impresses.
What is absolutely unacceptable for an 800-Euro (~$912) device, however, is the display which in every conceivable discipline is absolutely terrible. It is a TN-type display with terrible viewing angles, miserable contrast, a severe blue tint from factory and very low colour range. Adding to this are the subpar card reader, significantly poor WLAN performance and the fan, which whines constantly in the background when the laptop is under any load at all. This is no doubt due to the unusable fan profile and control which results in an absolutely chaotic clock rate behaviour under load with occasionally massive throttling.
Lurking very much in the foreground with the issues this laptop presents is the fan profile, which results in absolutely chaotic frequency behaviour under load with occasionally massive throttling. We can only hope that a future BIOS update will improve upon these issues - until then, we cannot recommend this laptop.
UPDATE 08.07.2019: After installing the new BIOS version 1.9.8, fan and frequency behaviours are more normal and much improved, and we have increased our rating for this laptop as a result.
Dell Latitude 15 3590
- 07/08/2019 v6 (old)
Sven Kloevekorn
Price comparison
