Dell Latitude 5495 (Ryzen 7 Pro, FHD) Laptop Review
So far, AMD Ryzen has failed to really capture a huge part of the laptop market, which is in contrast to its success in desktops. In part, this could be attributed to some of the weaknesses the platform has (like the comparably high-energy consumption), but a huge part of the missing success probably can be attributed to the missing interest from the PC manufacturers. The selection of available Ryzen laptops is still much smaller than the selection of Intel laptops. Case in point: Compared with the vast lineup of Intel-based Latitude business laptop systems, there is only a single AMD Ryzen based model, the Latitude 14 5495, a 14-inch Dell laptop,
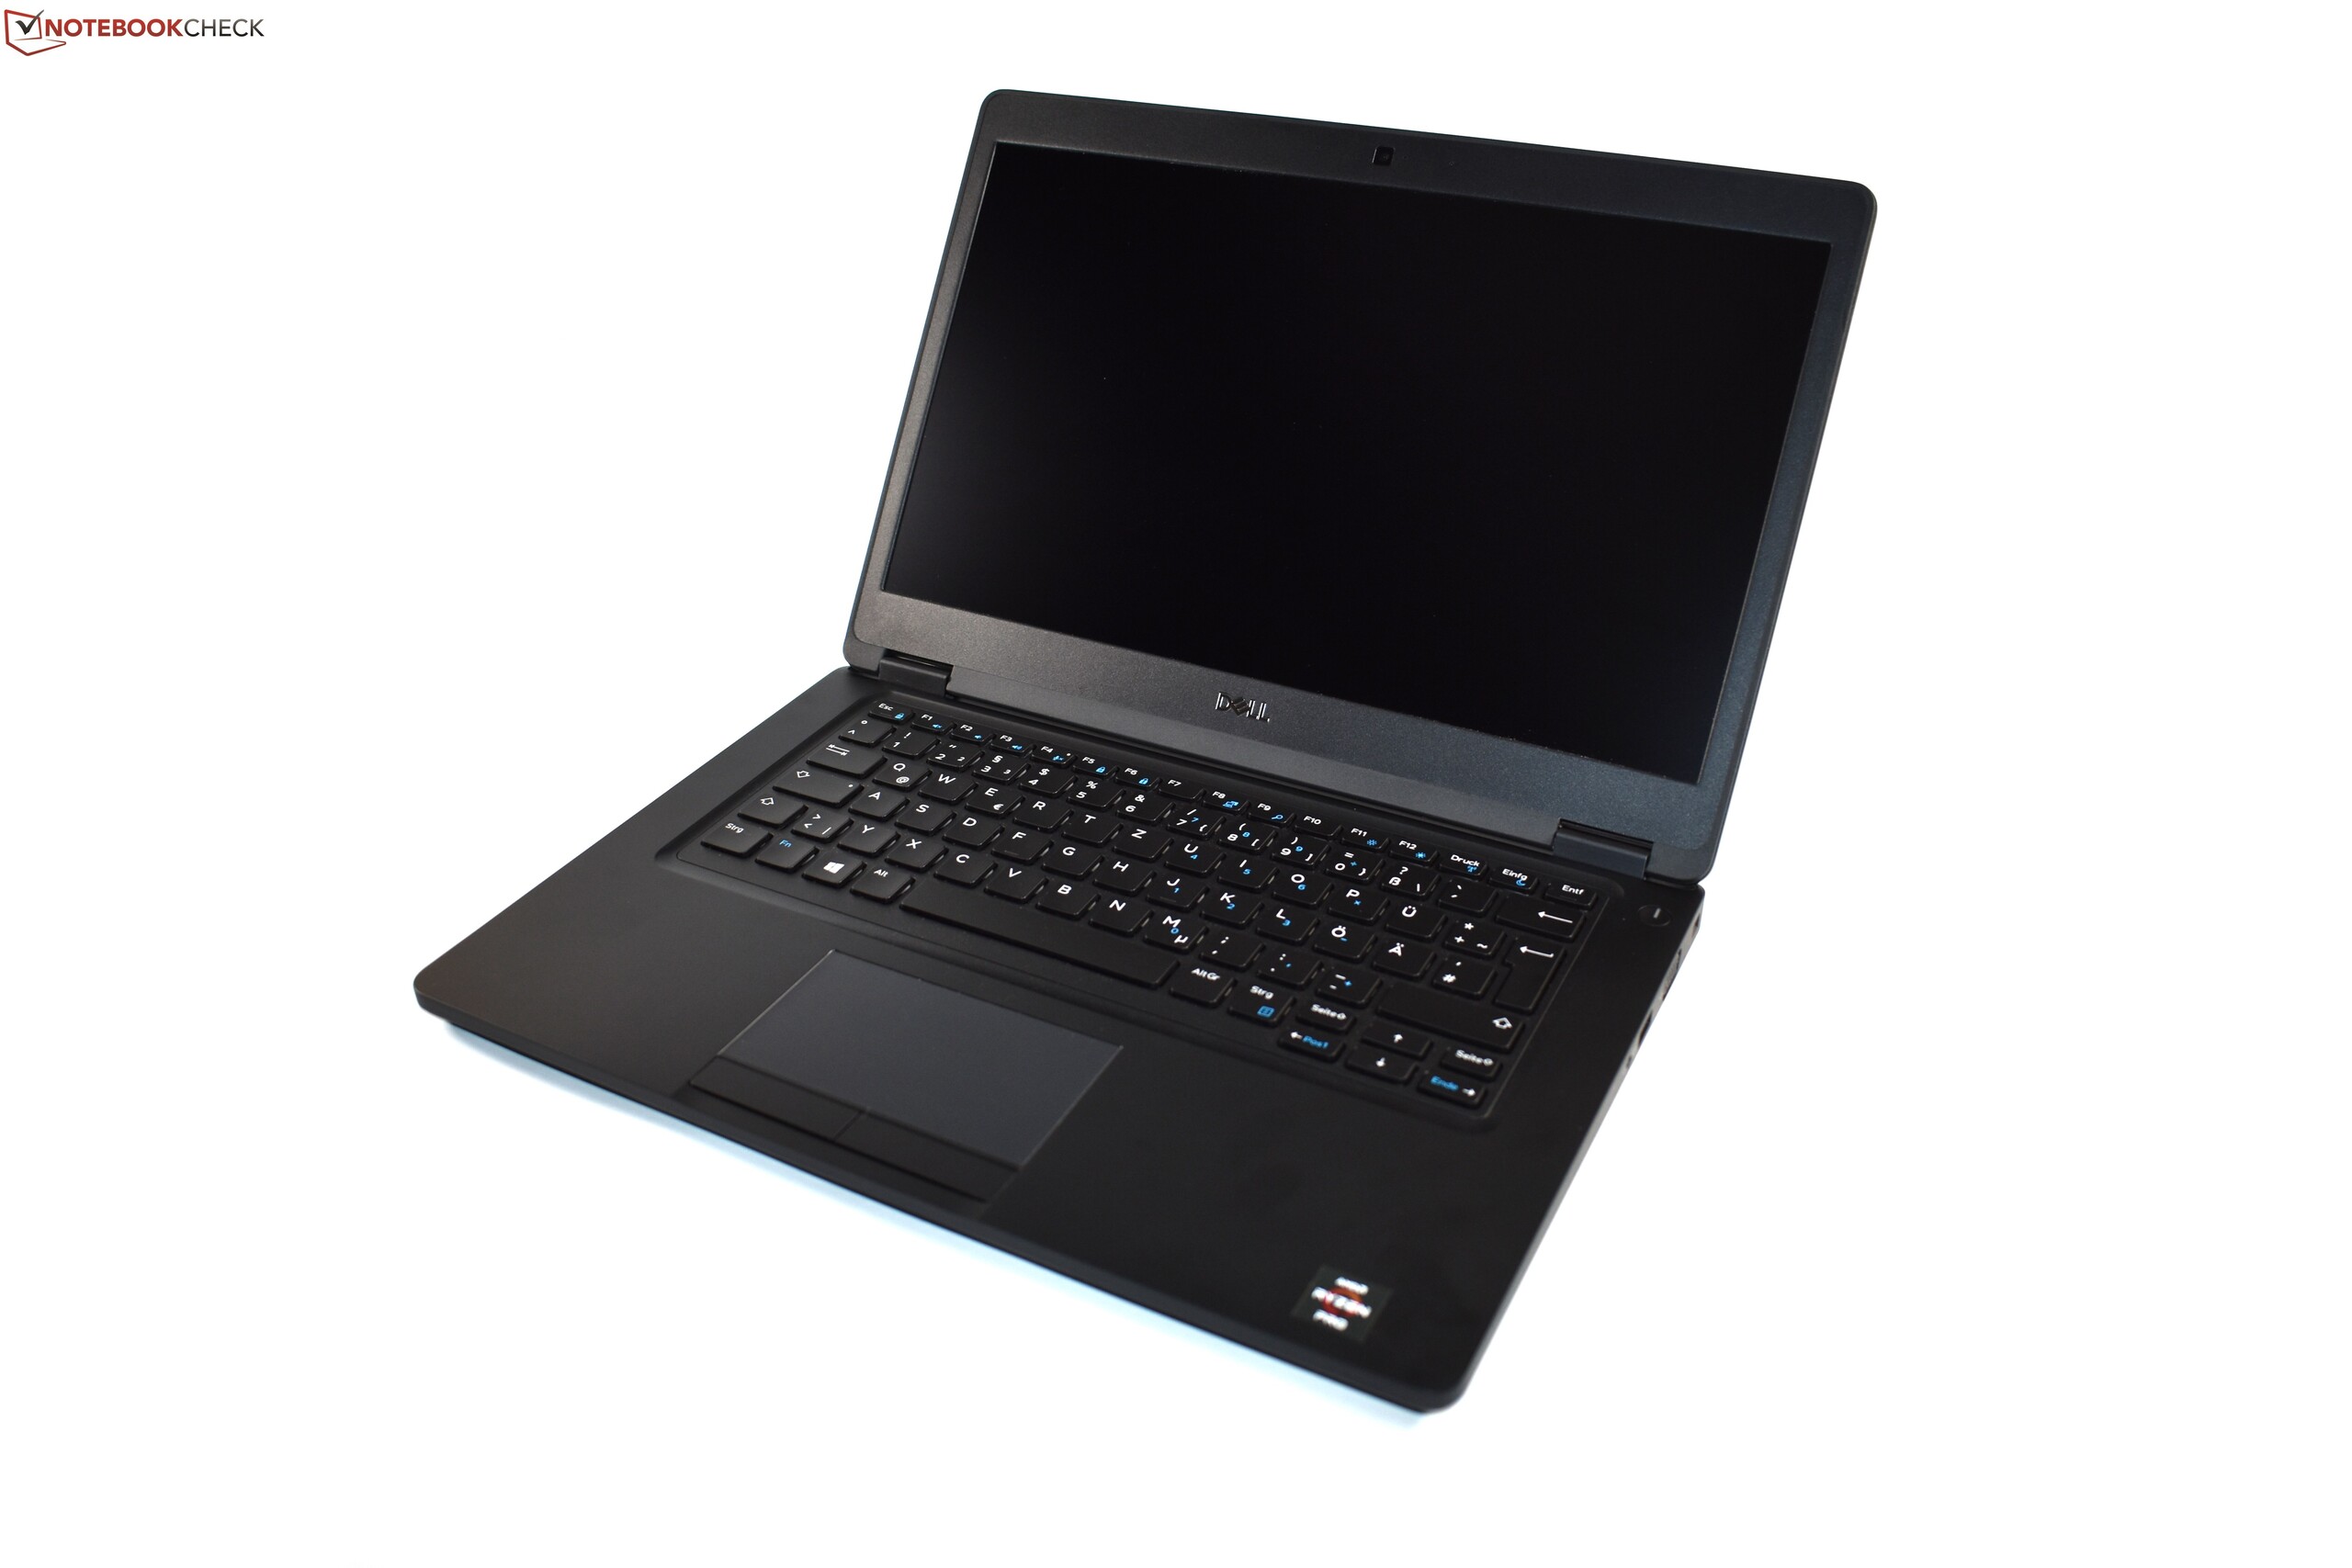
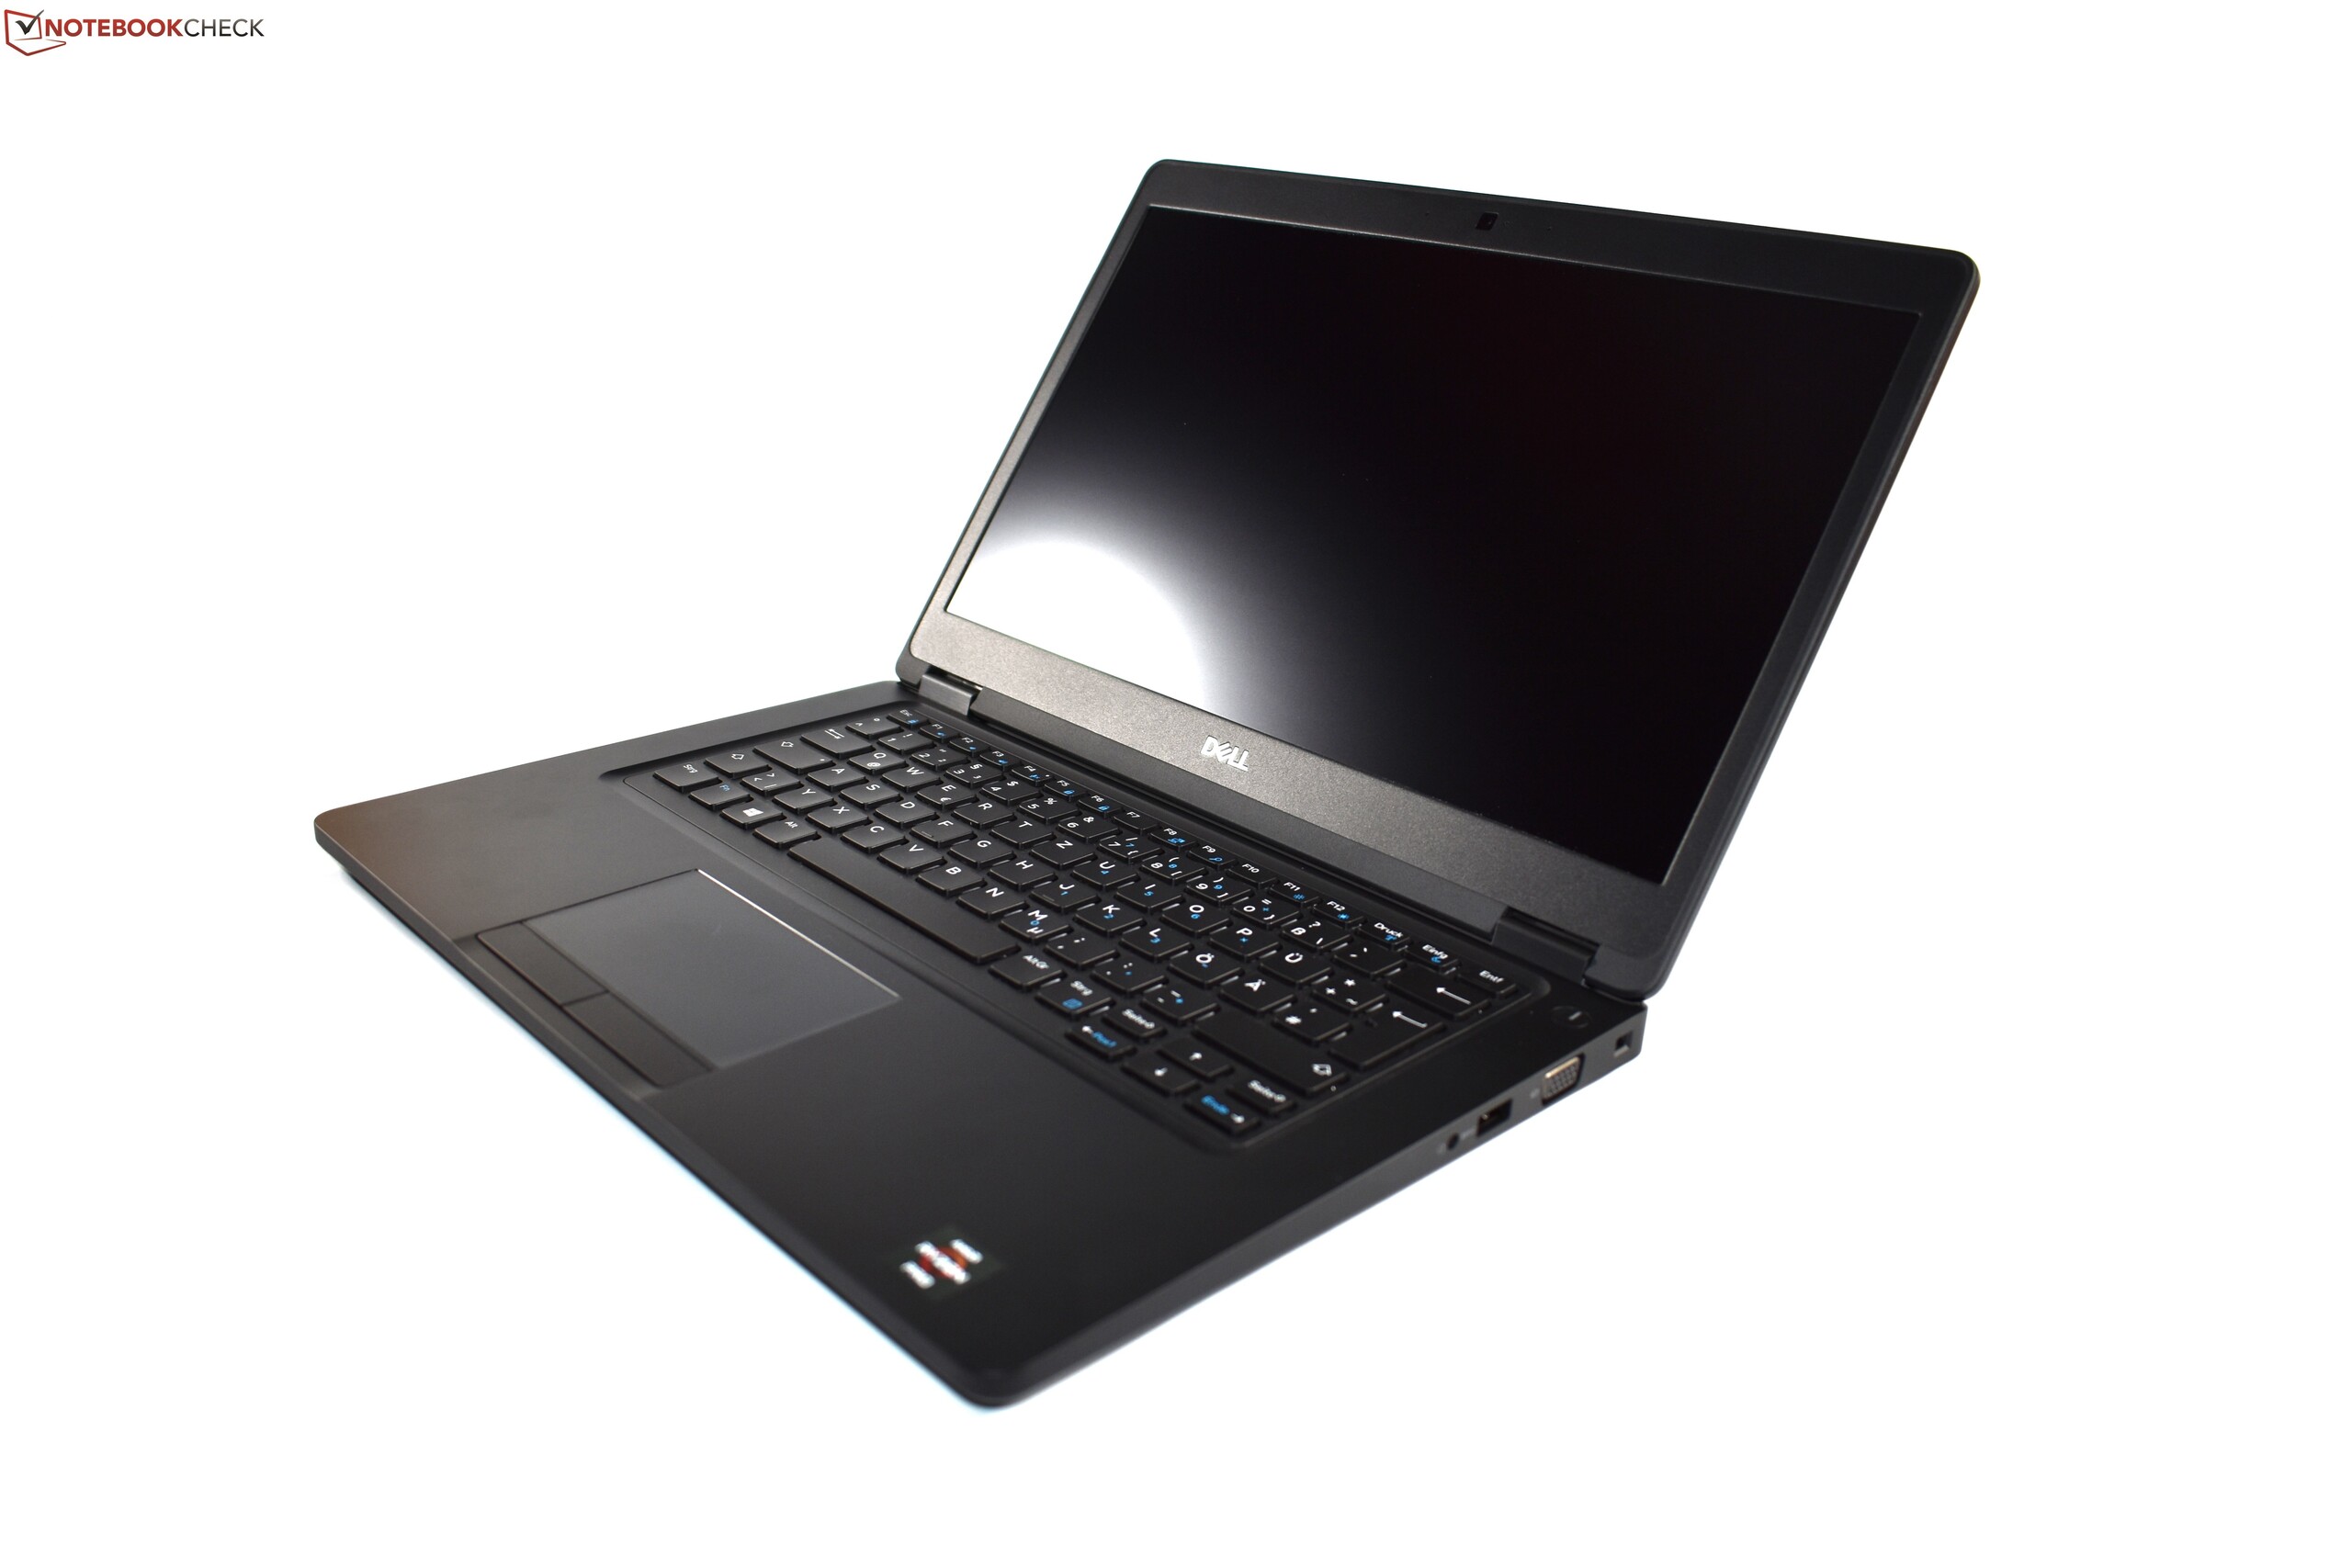
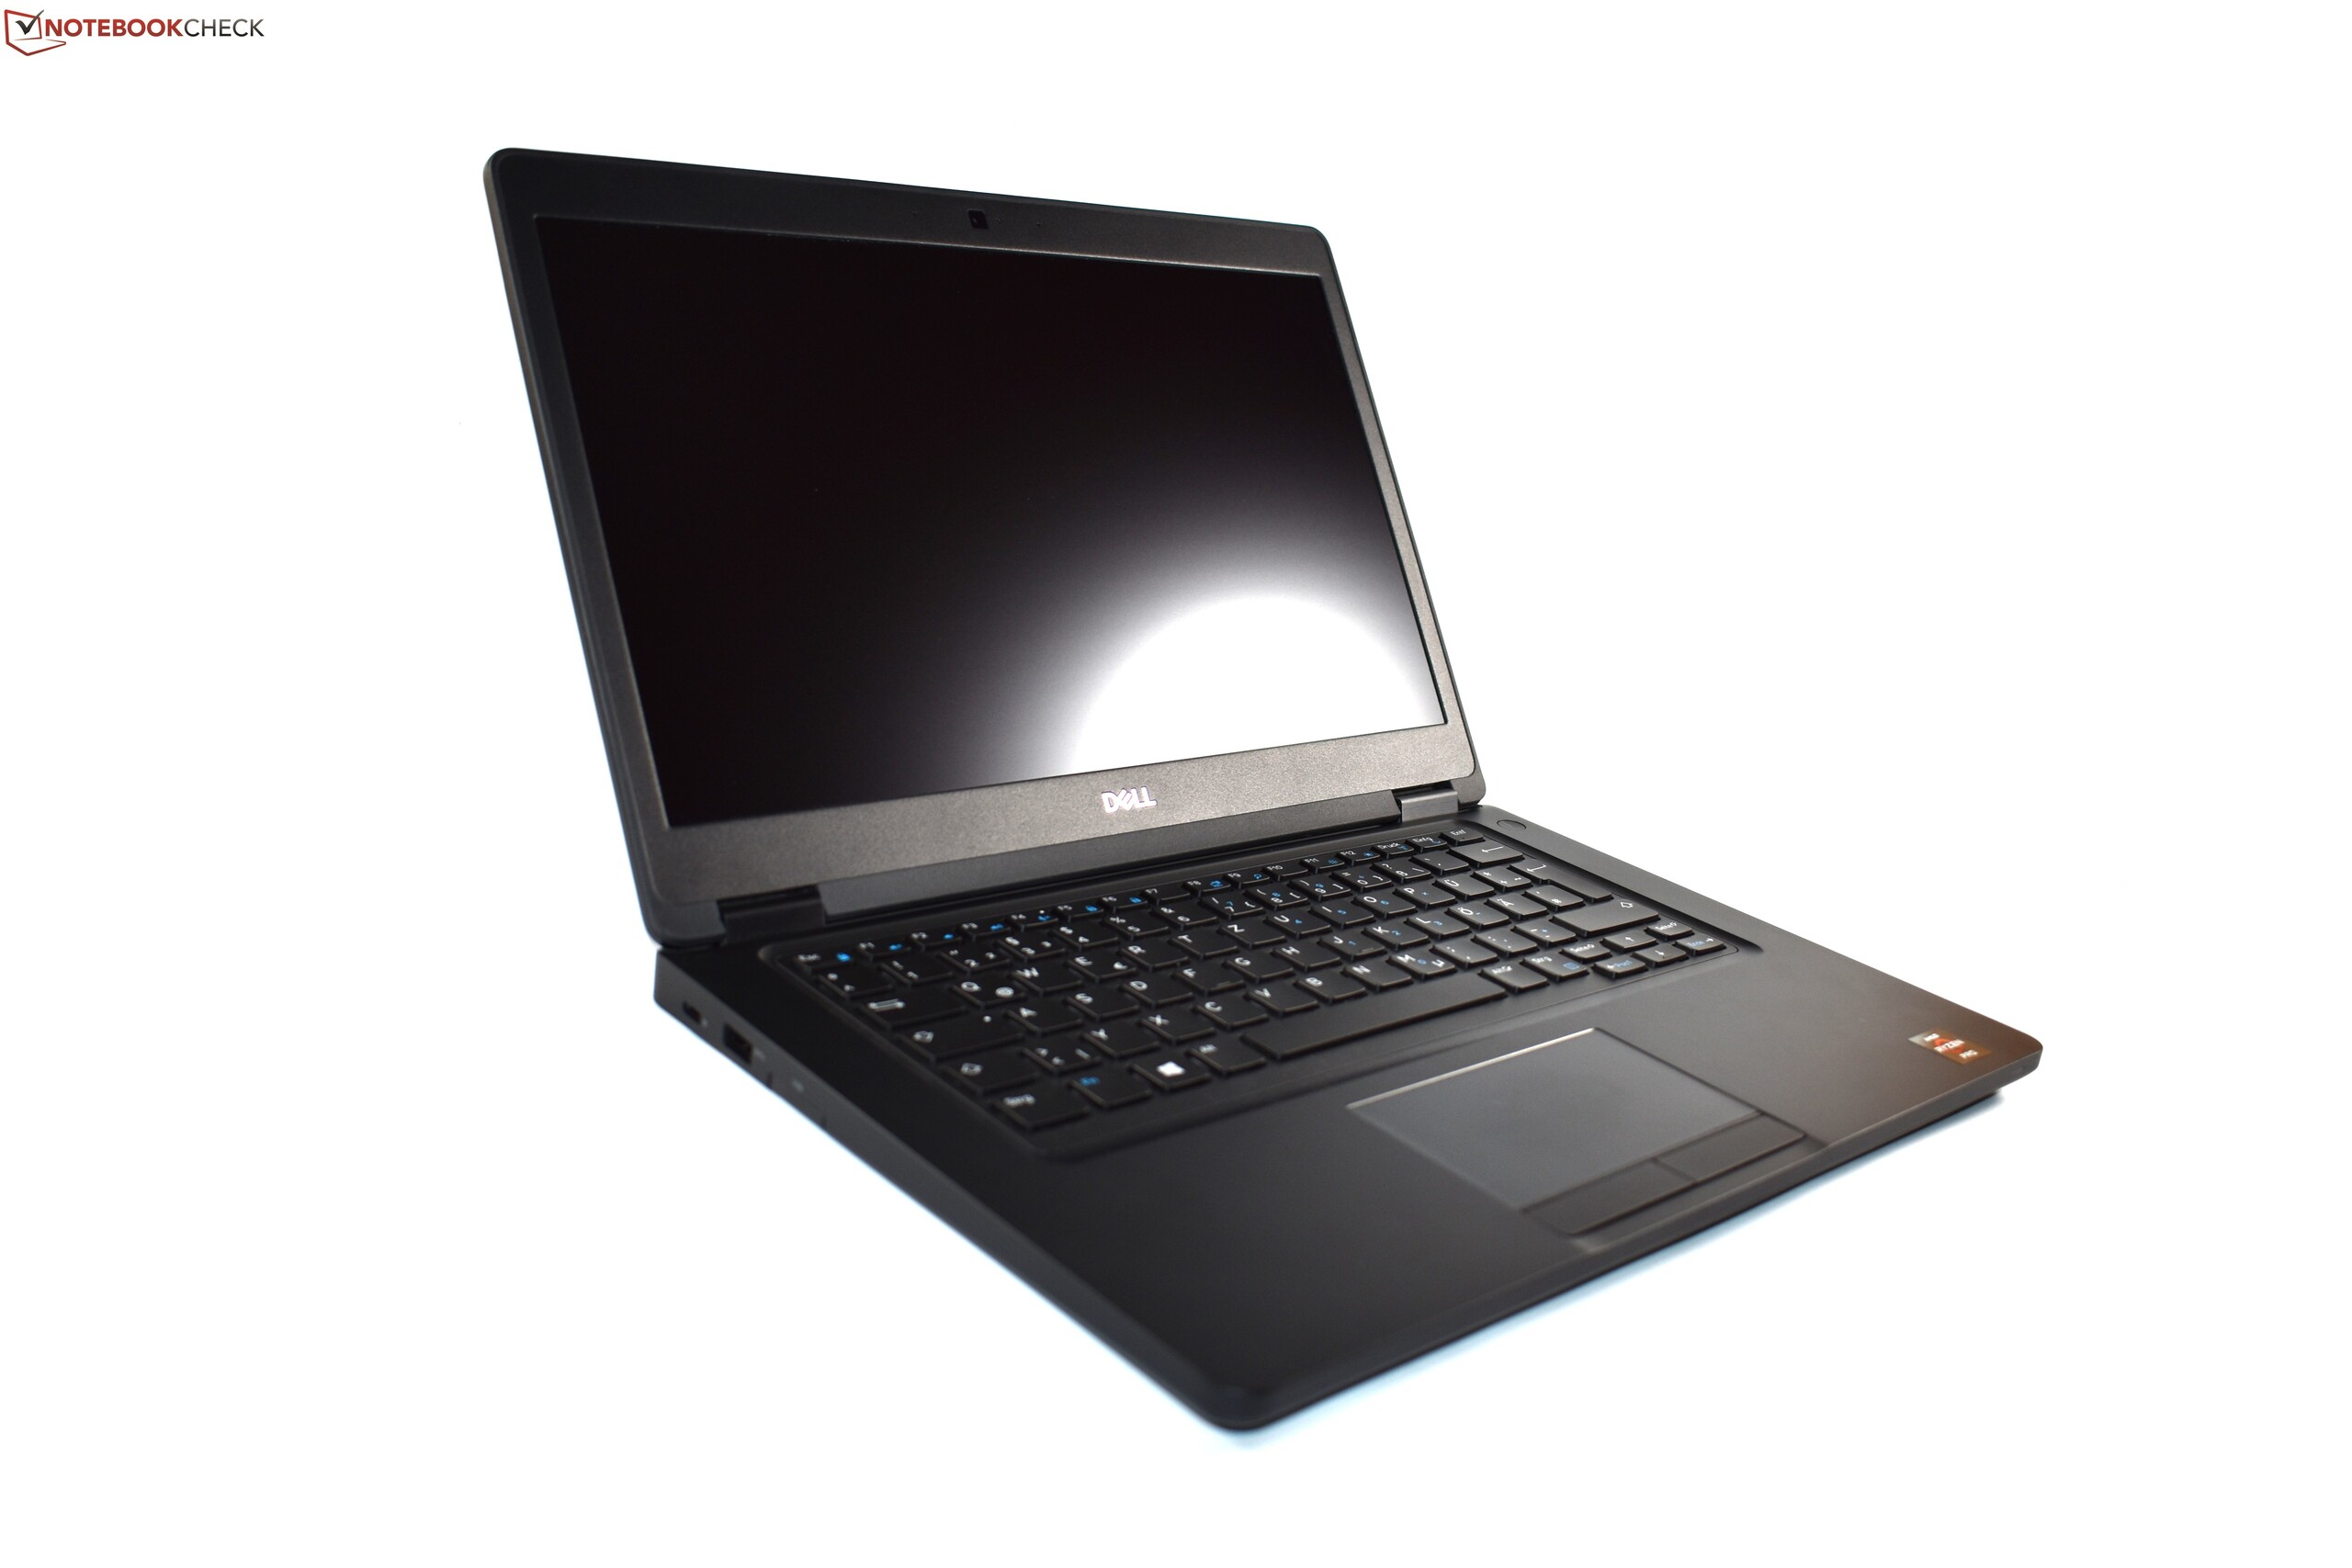
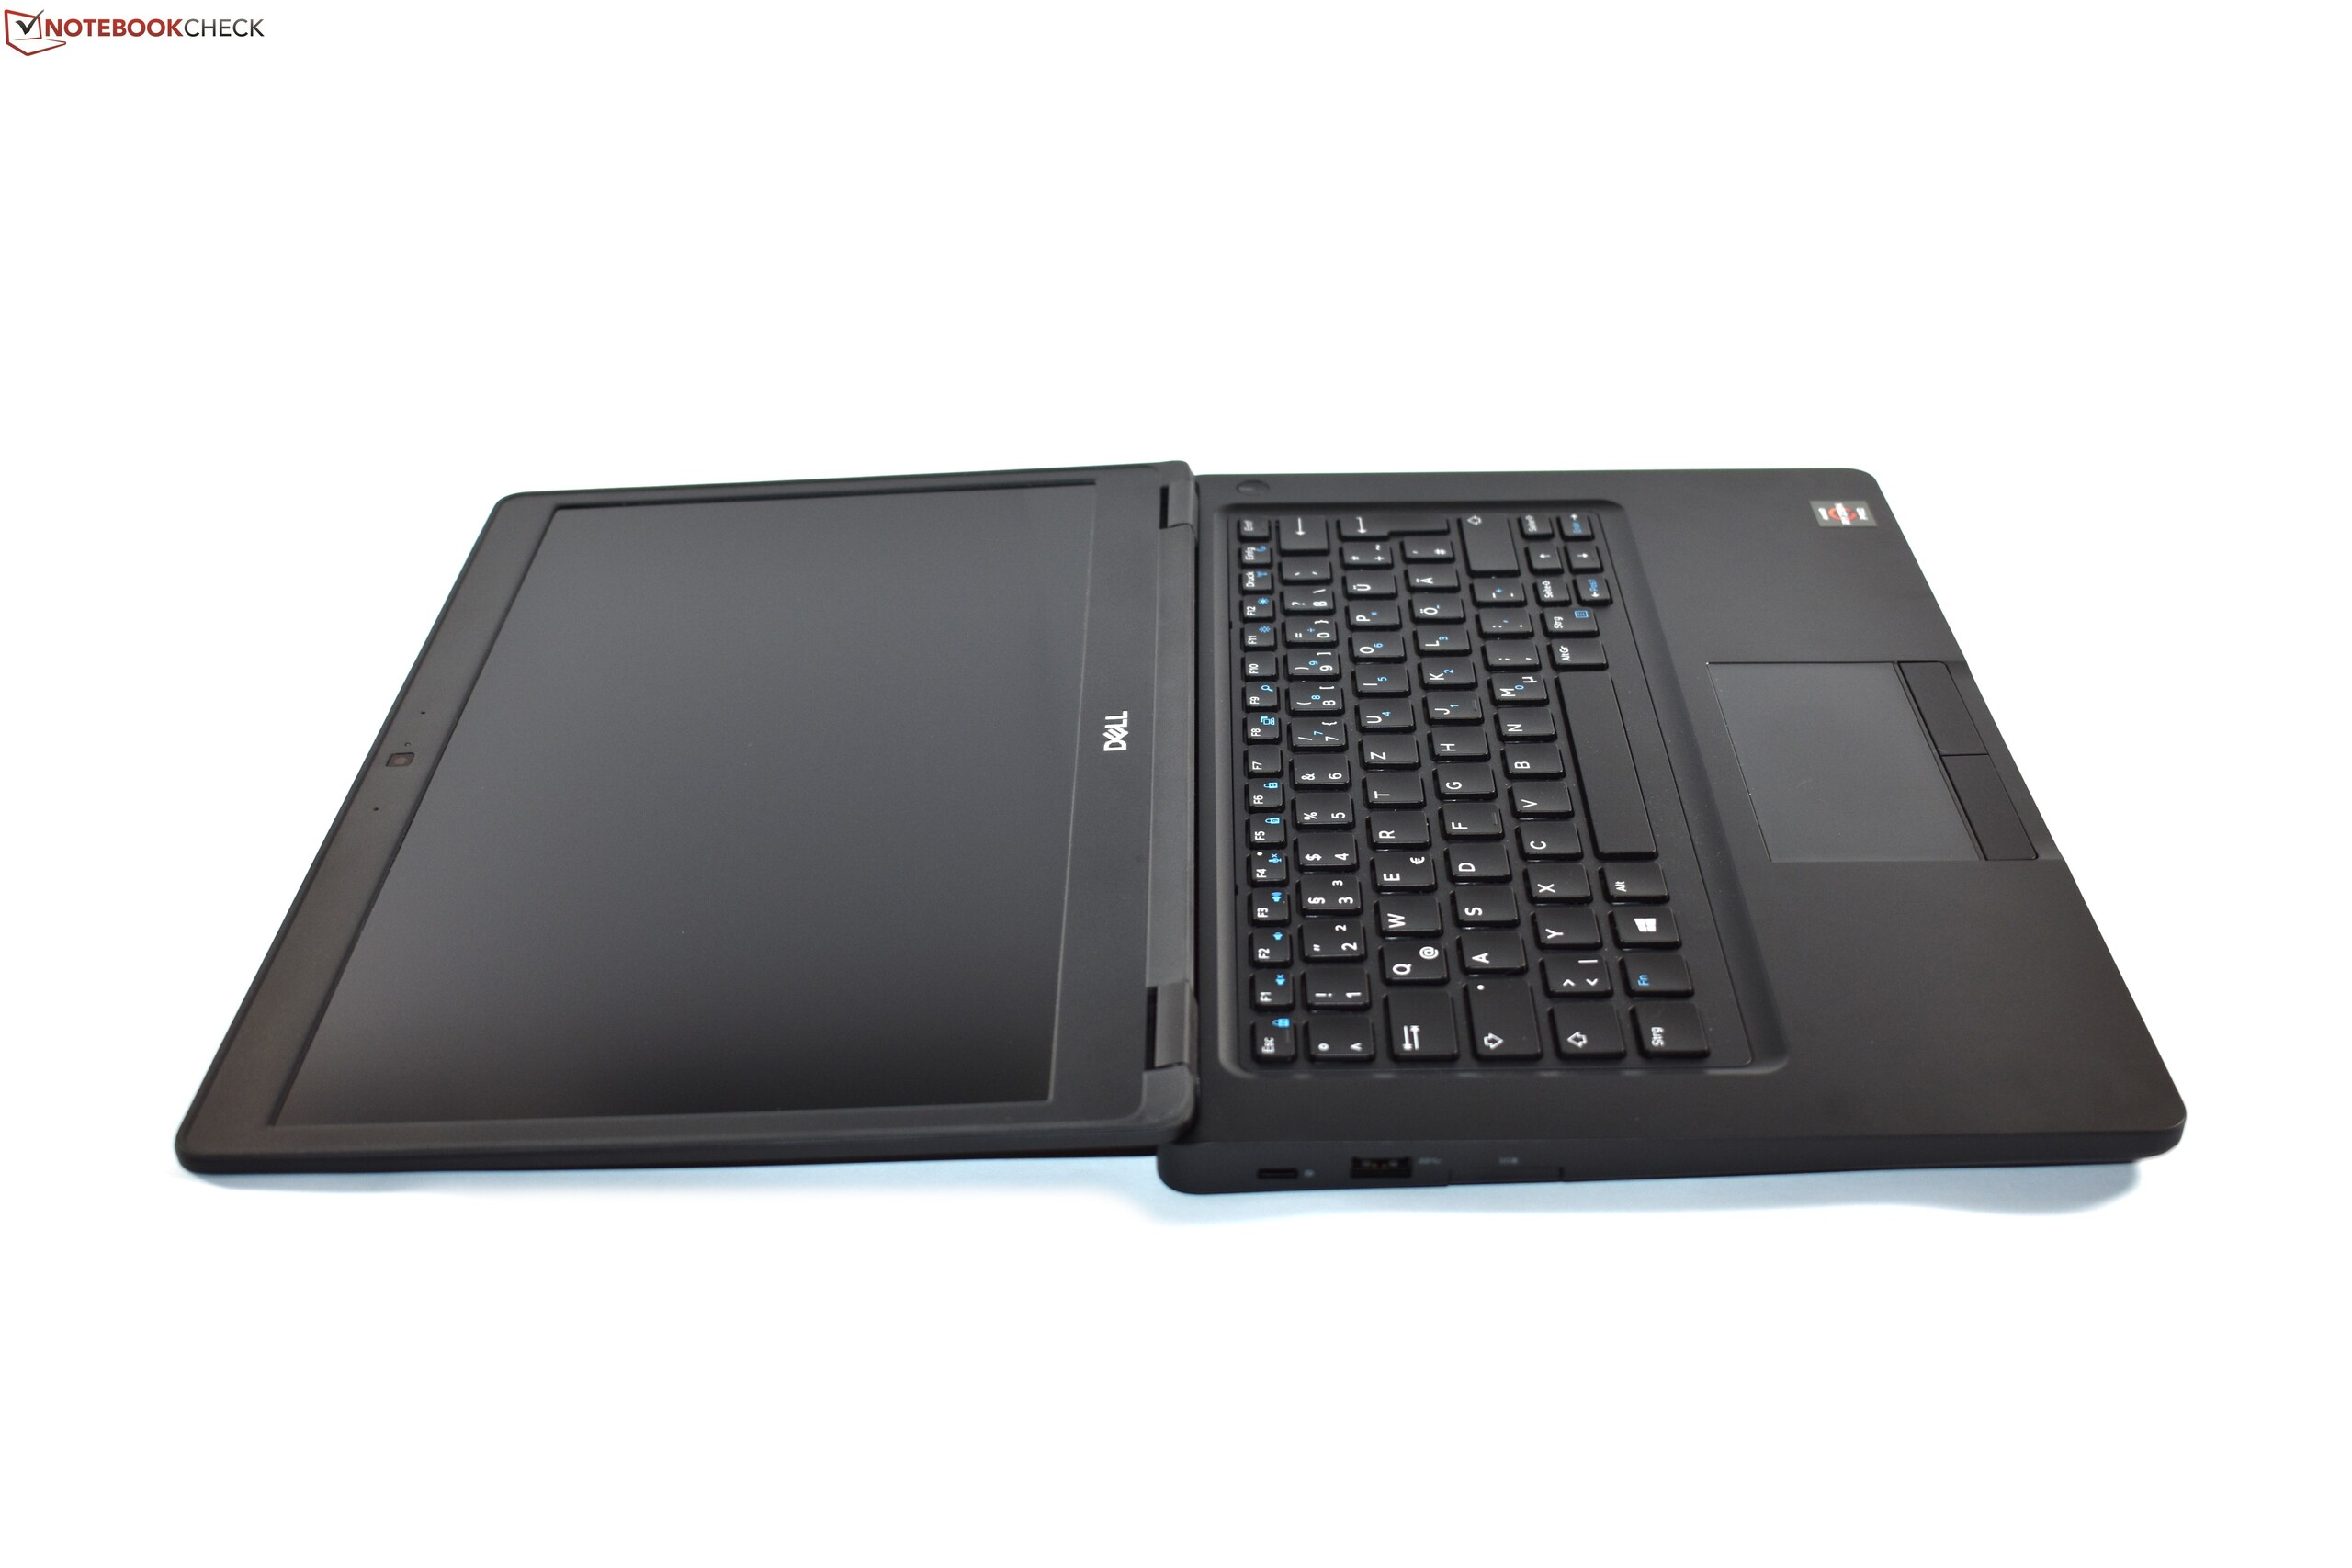
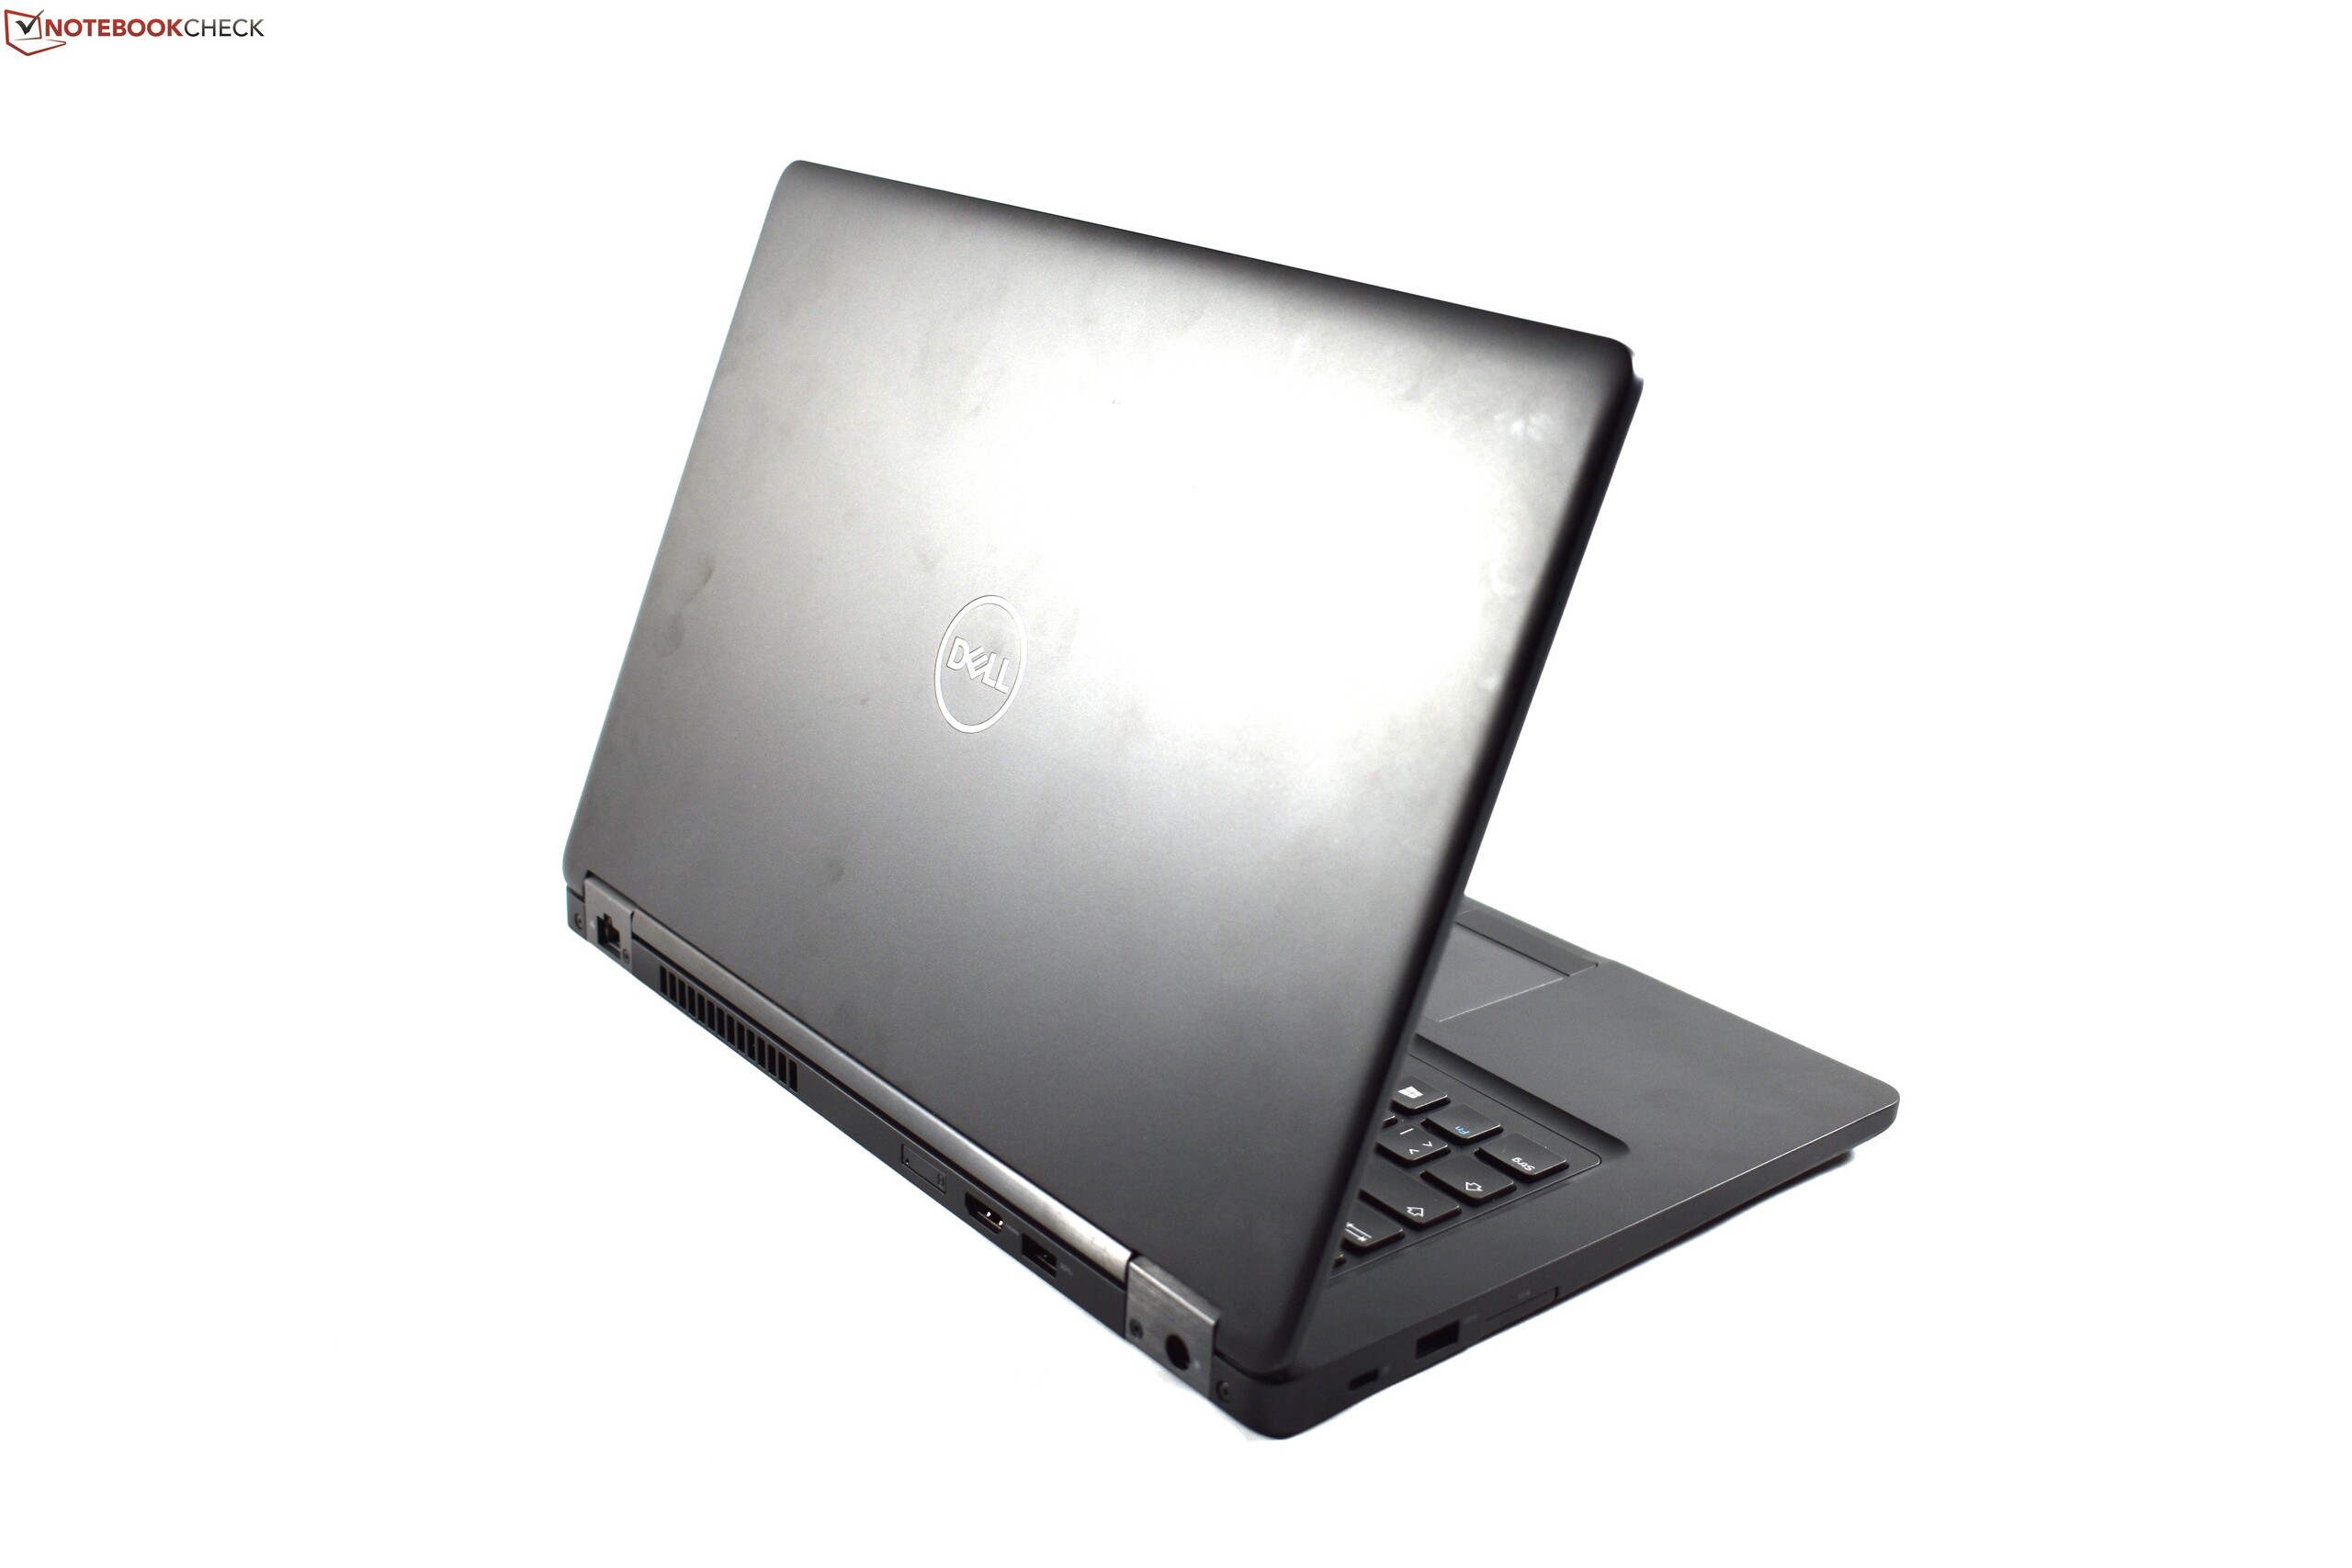
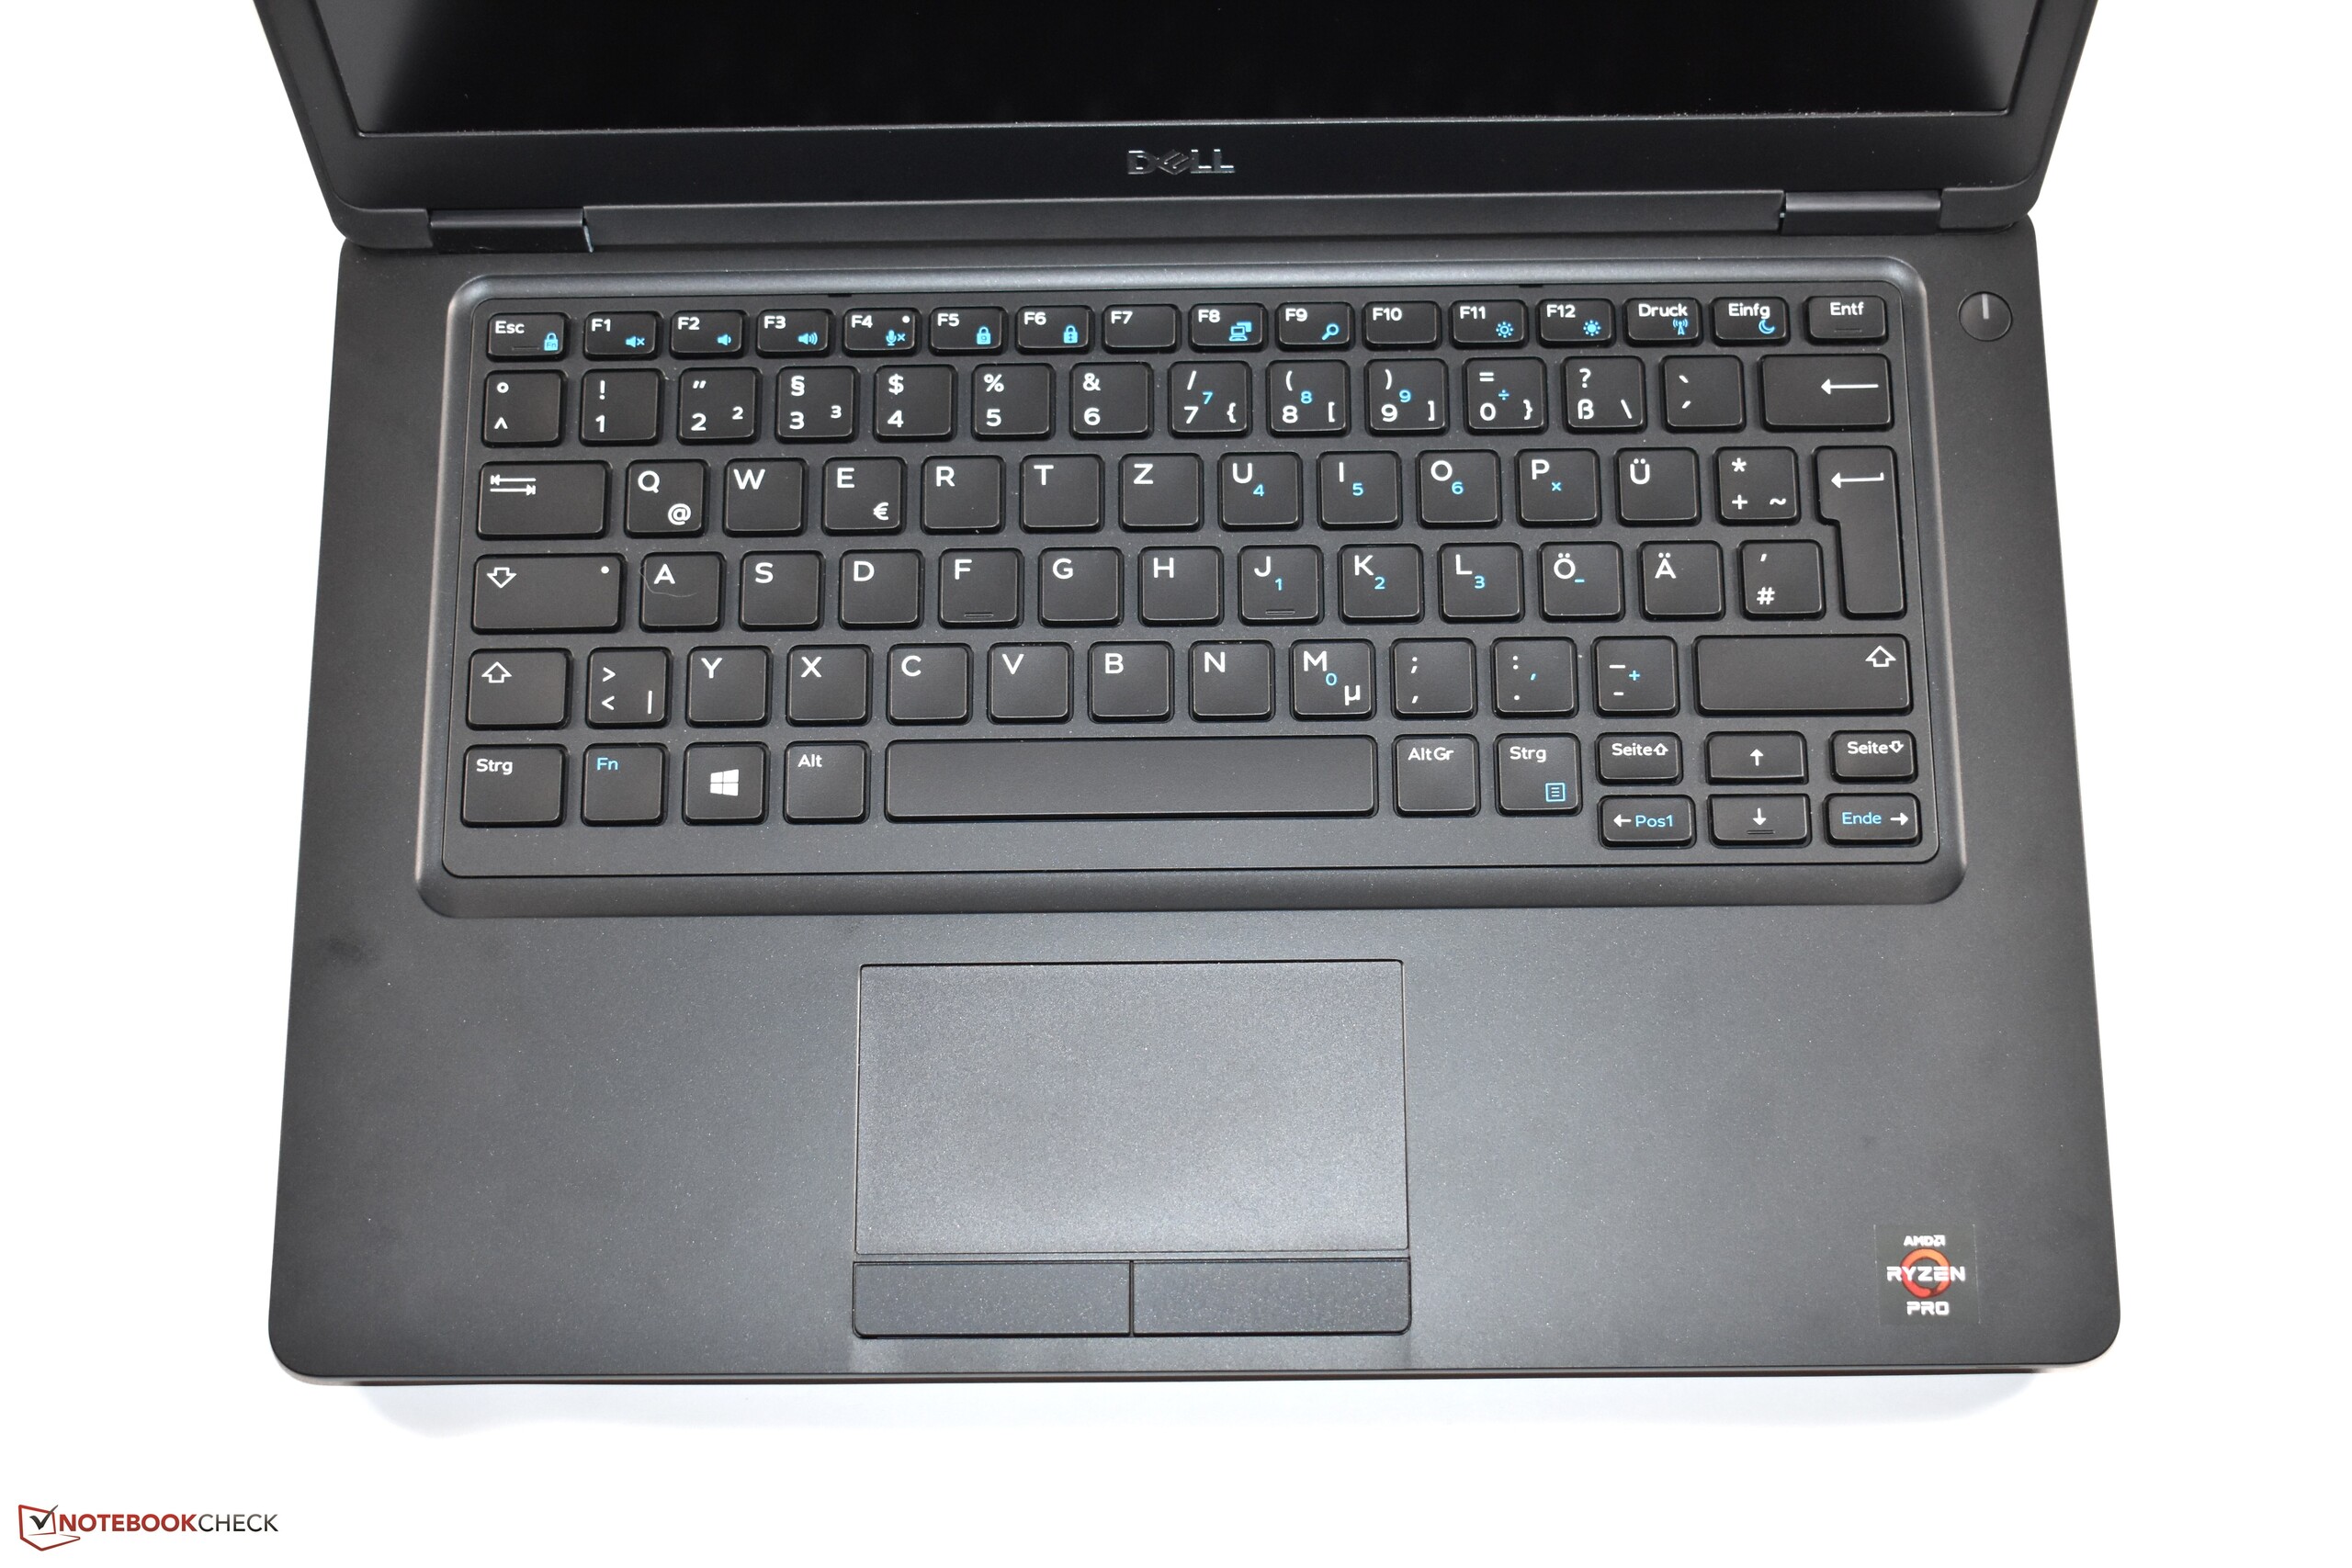
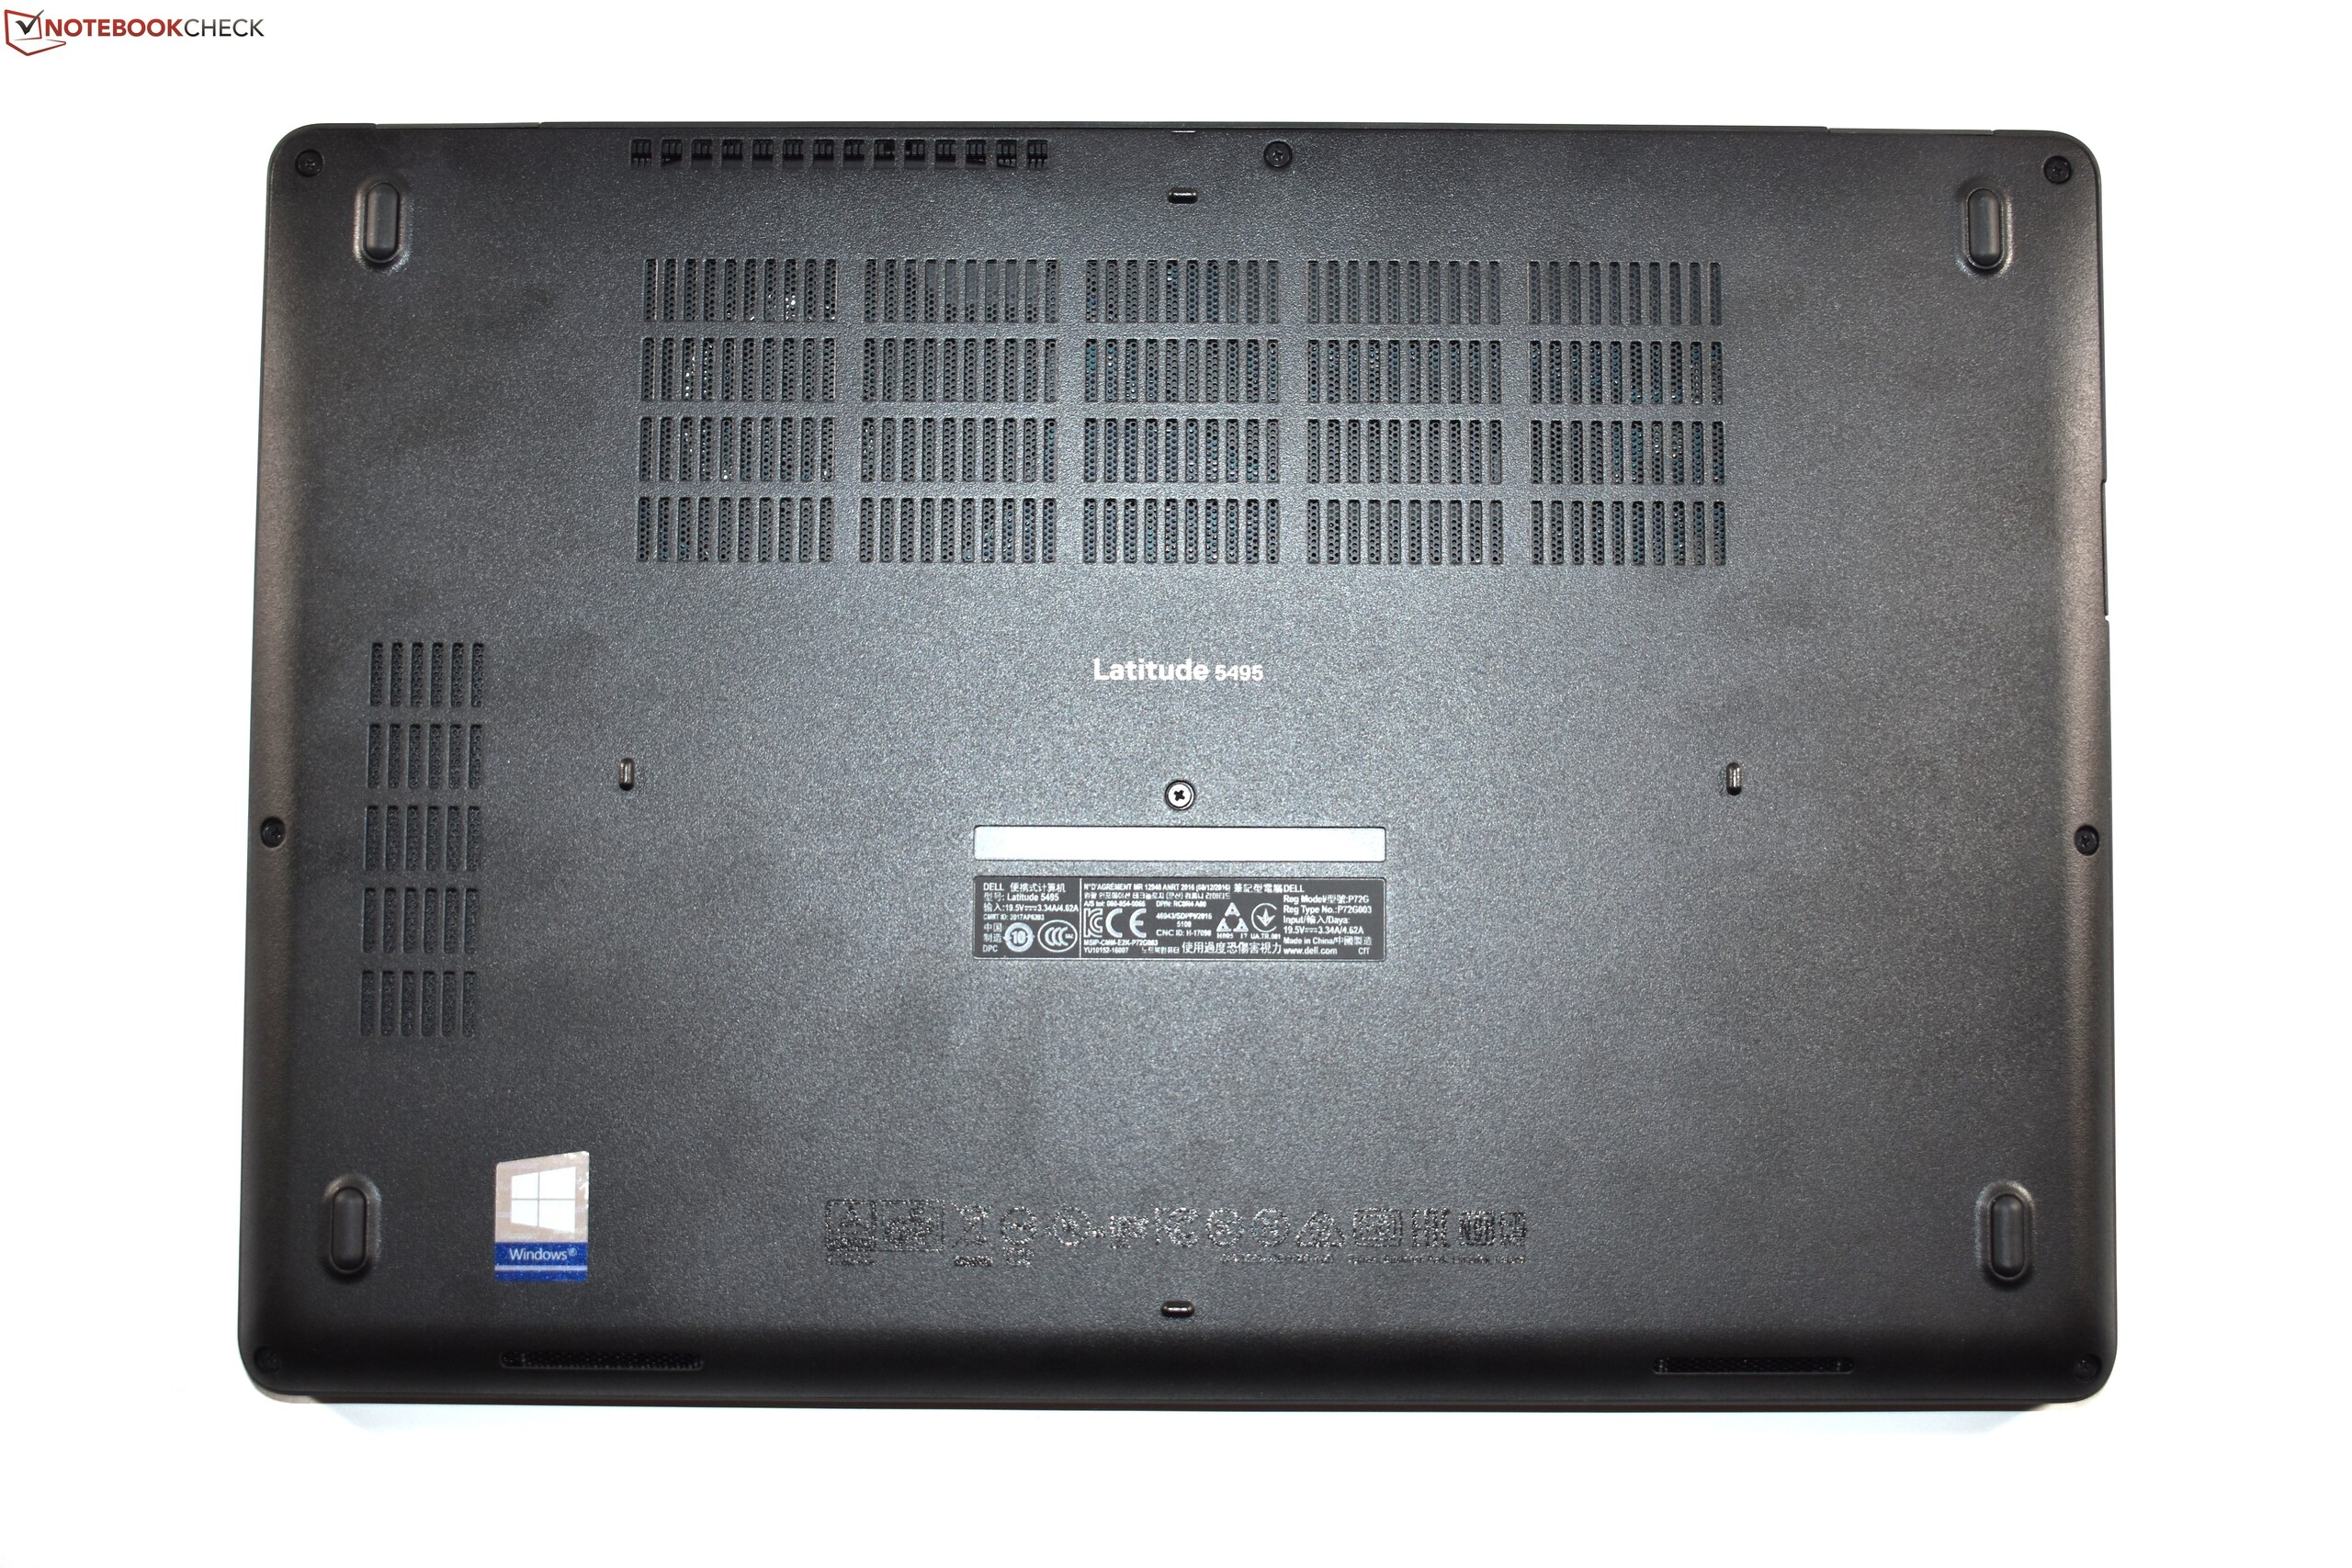
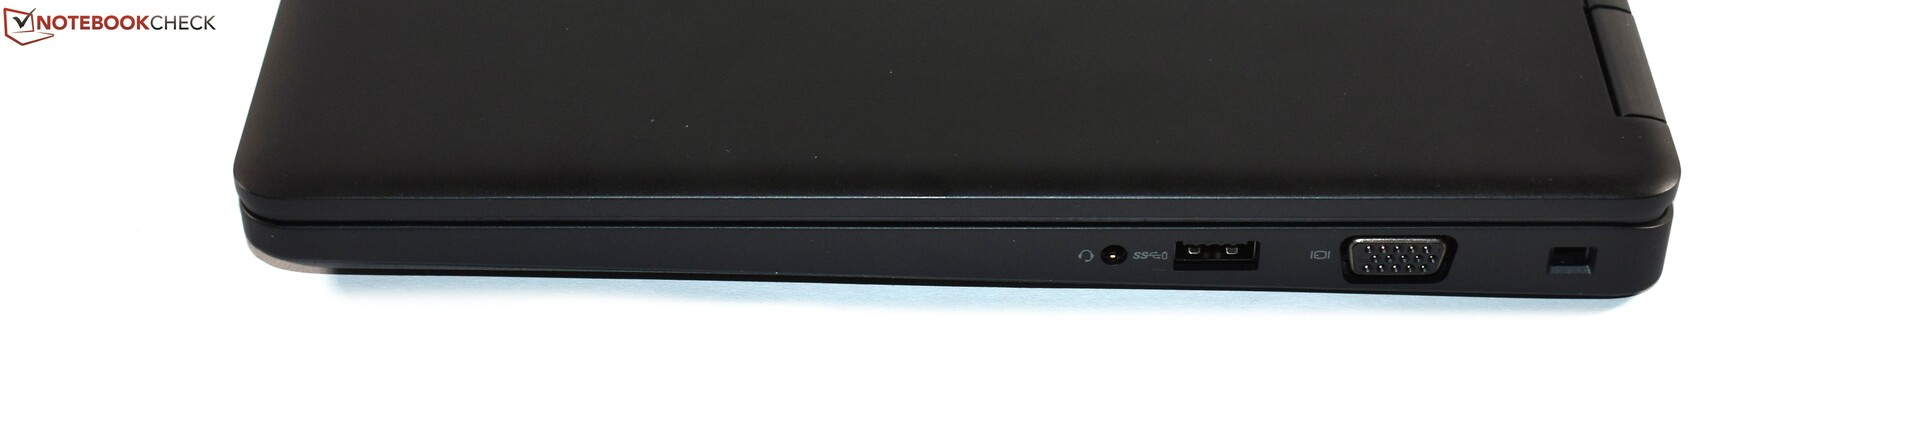
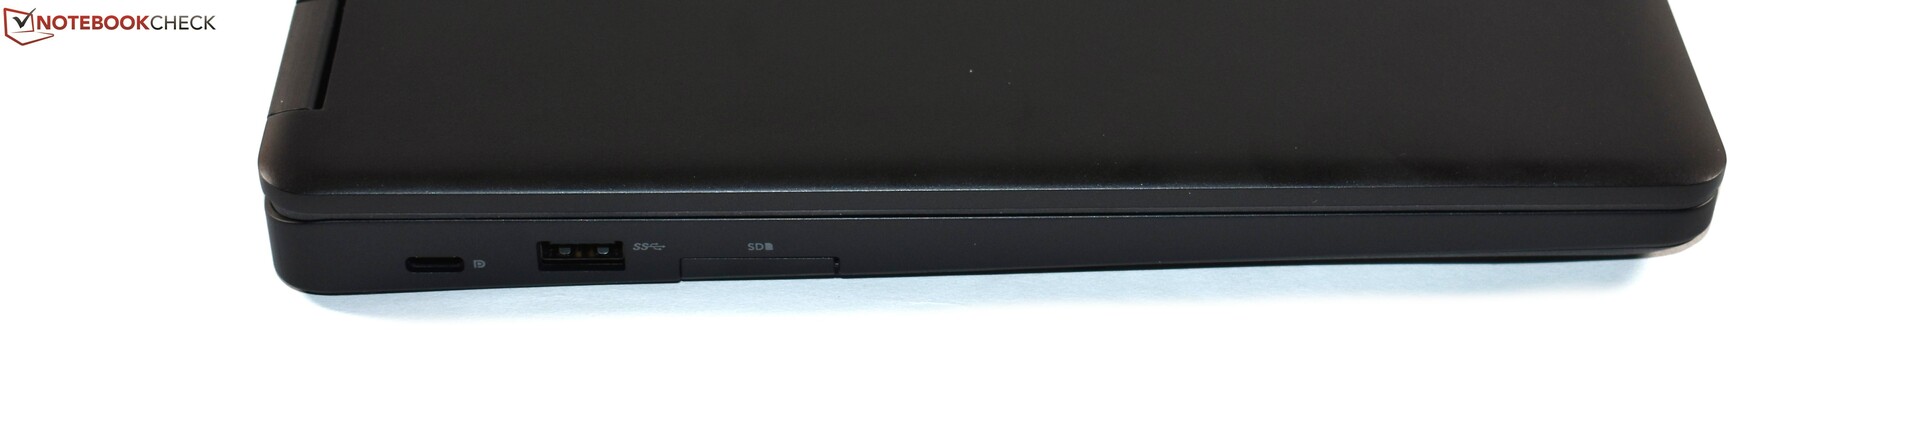
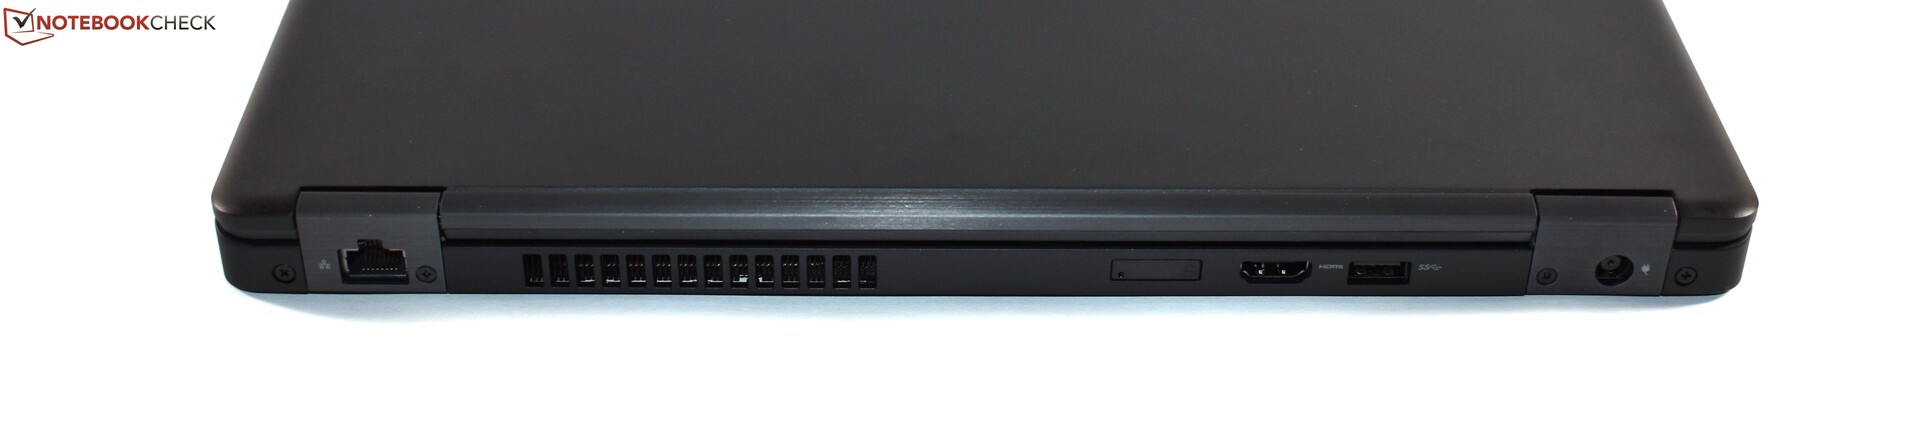
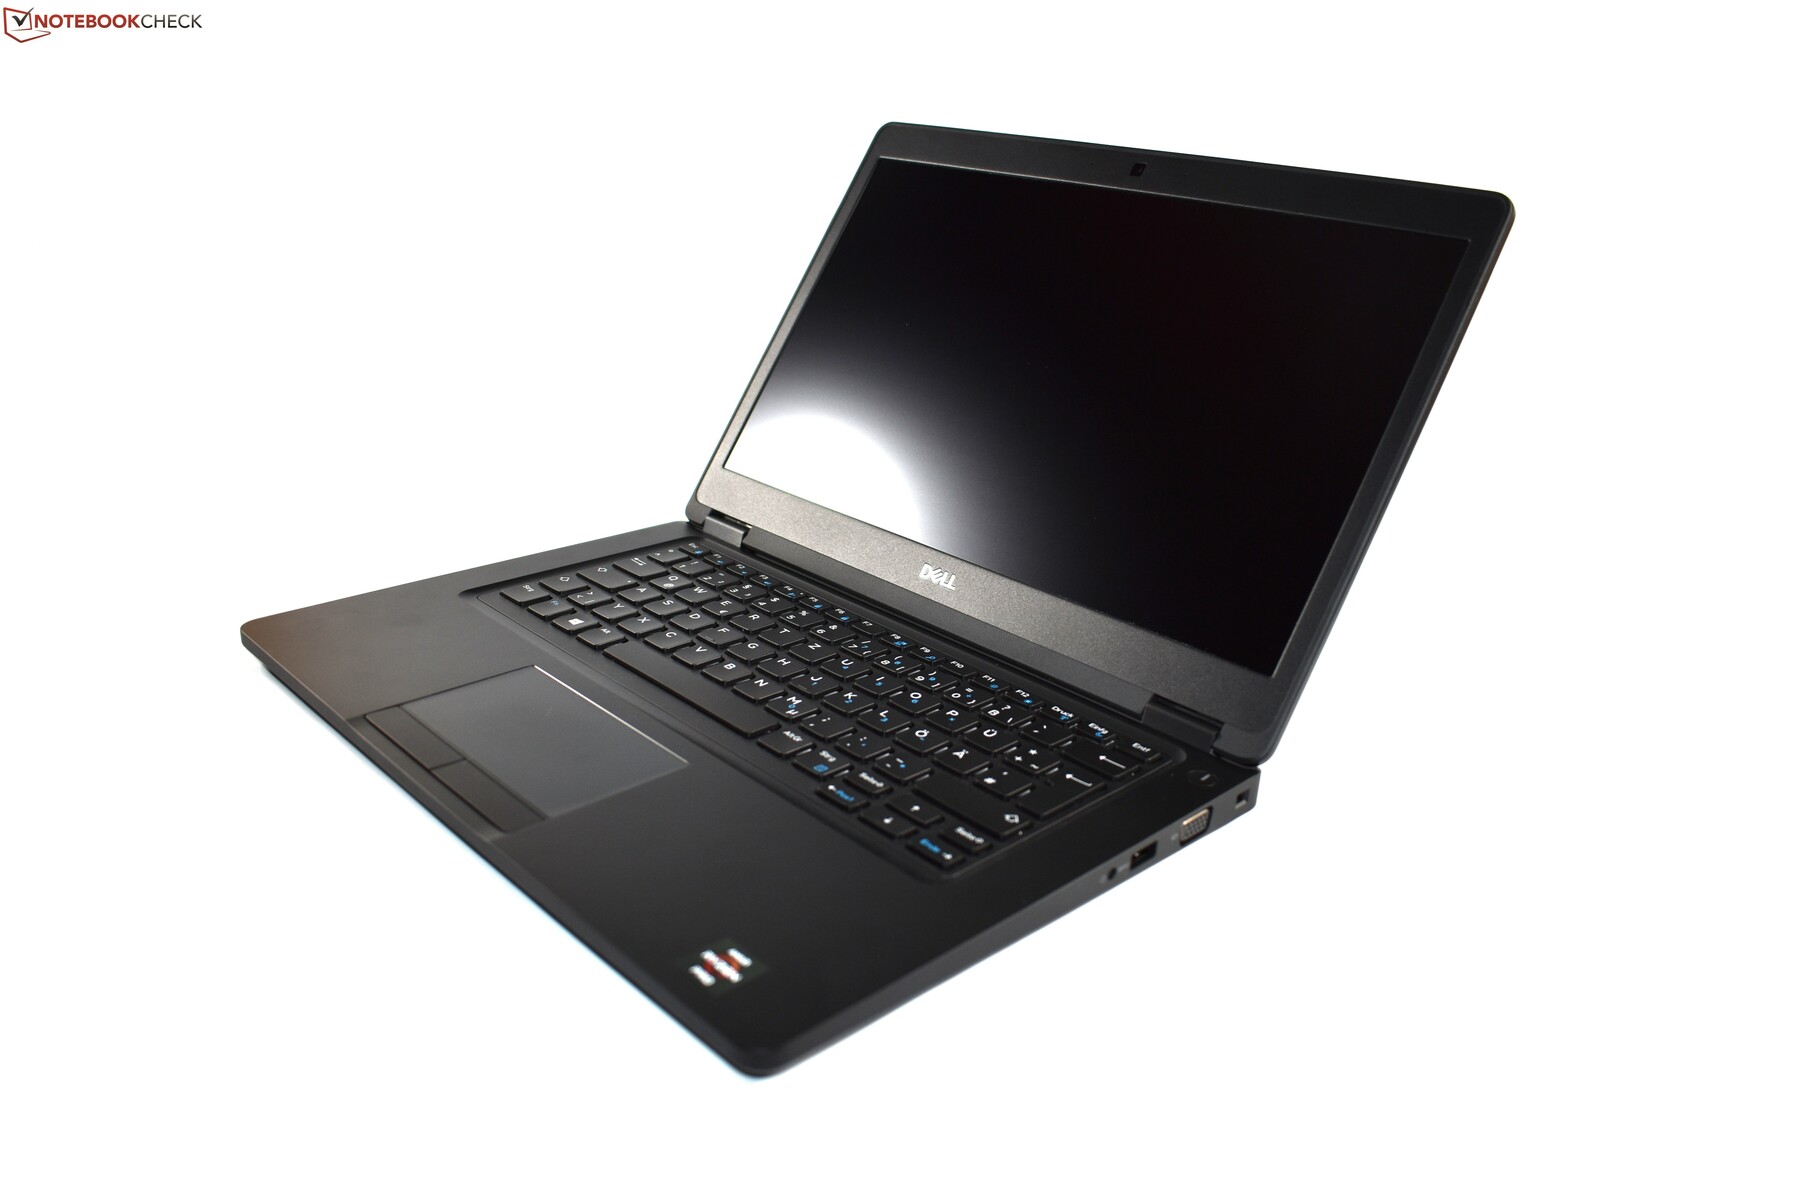
This laptop is based on another Latitude, its Intel sister model in the form of the Dell Latitude 5490. Since the chassis, the input devices and the port selection of the Latitude 5495 are identical to the Latitude 5490, we skip the description of those features and jump directly to the screen. Aside from the Intel based sister model, we compare the Latitude 5495 to its closest 14-inch business competitors, the Lenovo ThinkPad A485 and the HP EliteBook 745 G5.
Our review unit of the Dell Latitude 5495 contains the AMD Ryzen 7 Pro 2700U, 8 GB RAM, a 256 GB SSD and a FHD screen. This configuration costs €870 (~$977) in Germany.
| SD Card Reader | |
| average JPG Copy Test (av. of 3 runs) | |
| Dell Latitude 5490-TD70X (Toshiba Exceria Pro SDXC 64 GB UHS-II) | |
| Dell Latitude 14 5495 (Toshiba Exceria Pro SDXC 64 GB UHS-II) | |
| Lenovo ThinkPad A485-20MU000CGE (Toshiba Exceria Pro SDXC 64 GB UHS-II) | |
| Average of class Office (22.4 - 198.5, n=21, last 2 years) | |
| maximum AS SSD Seq Read Test (1GB) | |
| Dell Latitude 5490-TD70X (Toshiba Exceria Pro SDXC 64 GB UHS-II) | |
| Dell Latitude 14 5495 (Toshiba Exceria Pro SDXC 64 GB UHS-II) | |
| Lenovo ThinkPad A485-20MU000CGE (Toshiba Exceria Pro SDXC 64 GB UHS-II) | |
| Average of class Office (27.4 - 249, n=20, last 2 years) | |
Display

There are three different display options available for the Dell Latitude 14 5495: a HD (1,366 x 768) TN panel as well as two FHD (1,920 x 1,080) IPS LCDs. One of those FHD screens supports touch.
There is one commonality between all the display options of the Dell Latitude 5495: their disappointing brightness. Even the two FHD screens are only supposed to reach 220 cd/m² according to Dell. The matte FHD screen without touch in our review sample does not even manage to reach that brightness-value. We measured an average brightness of just 200 cd/m², which is the absolute minimum we are willing to accept in a modern laptop. The Intel model Dell Latitude 5490 had a similarly dim screen, but the competitors from Lenovo and HP are better: The ThinkPad A485 reached an average brightness of 272 cd/m² and the EliteBook 745 G5 even accomplished 398 cd/m², which makes its panel pretty much twice as bright compared with the Latitude. The ranking of the different screens is clear and the Dell Latitude is clearly the worst of the bunch, though it should be noted that the EliteBook is slightly more expensive than its competitors.
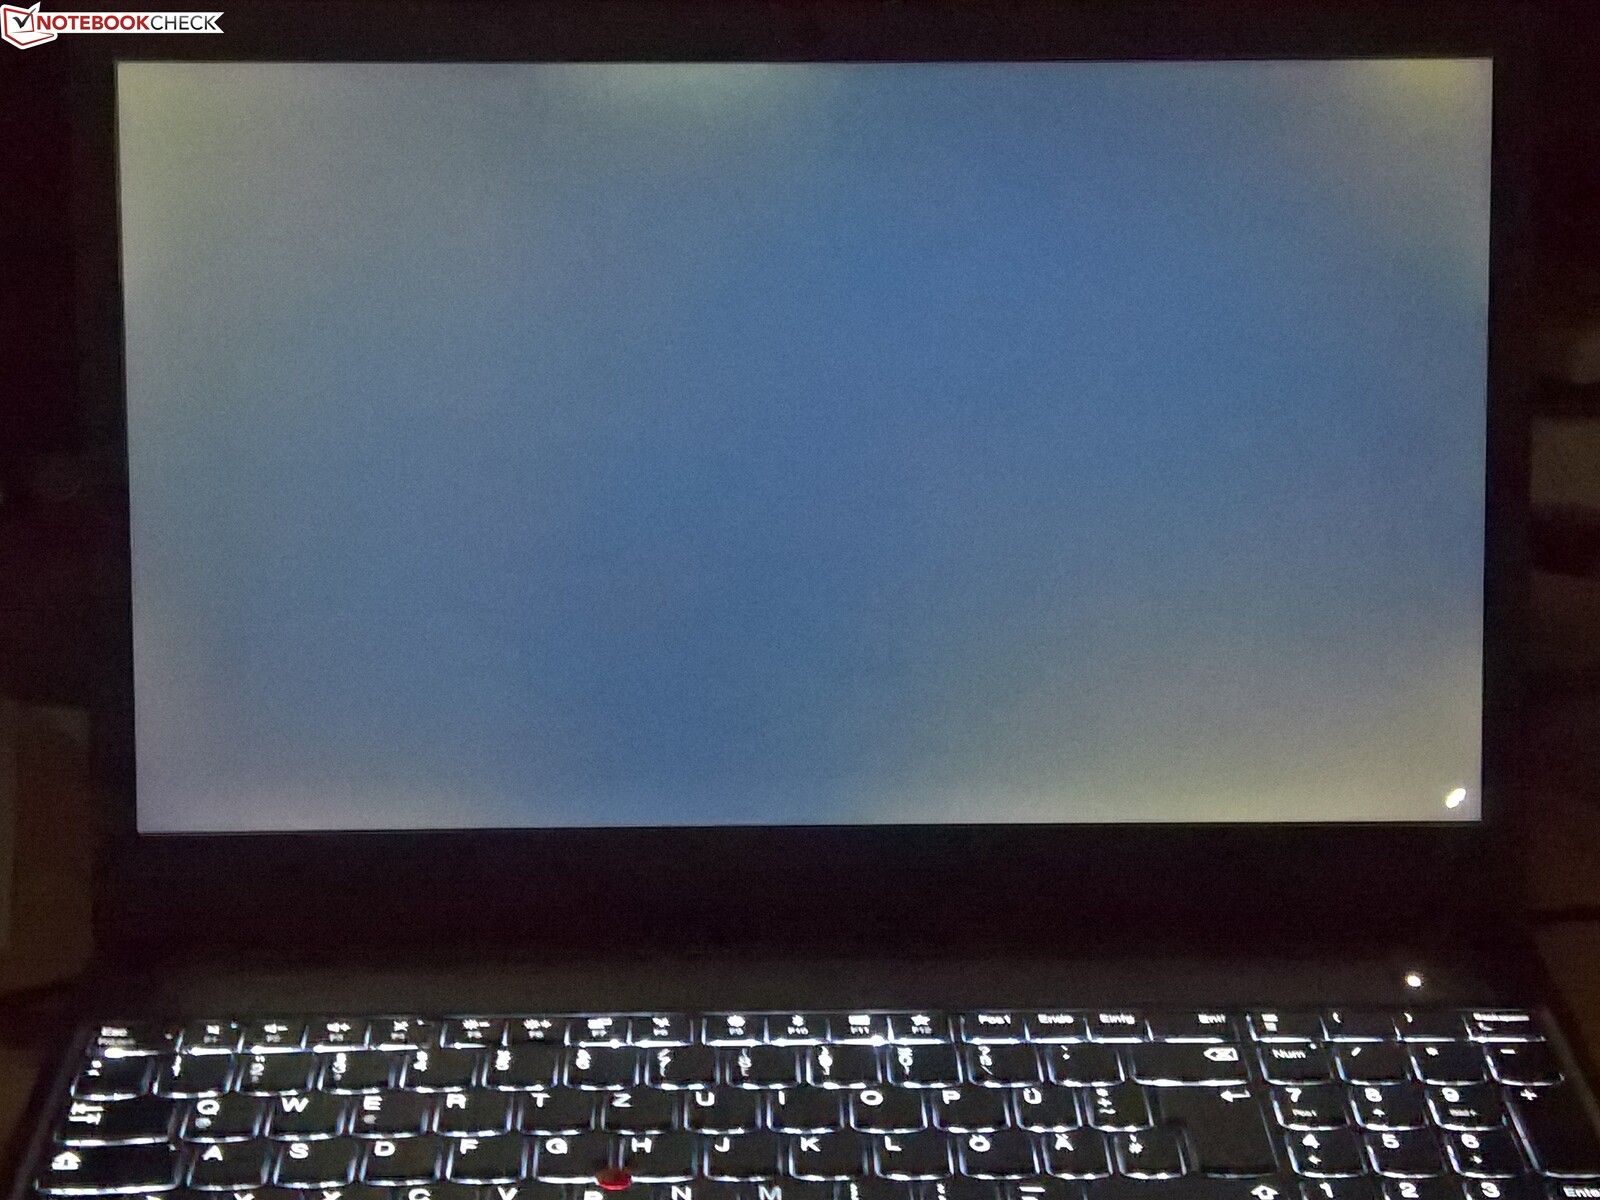
Unfortunately, we did detect annoying backlight bleeding. The same can be said about PWM, though the PWM frequency was so high that it was not a problem. The brightness distribution of 89% was good.
| |||||||||||||||||||||||||
Brightness Distribution: 89 %
Center on Battery: 210 cd/m²
Contrast: 922:1 (Black: 0.23 cd/m²)
ΔE ColorChecker Calman: 4.34 | ∀{0.5-29.43 Ø4.73}
ΔE Greyscale Calman: 2.81 | ∀{0.09-98 Ø4.97}
61% sRGB (Argyll 1.6.3 3D)
39% AdobeRGB 1998 (Argyll 1.6.3 3D)
42.32% AdobeRGB 1998 (Argyll 3D)
61.4% sRGB (Argyll 3D)
40.94% Display P3 (Argyll 3D)
Gamma: 2.22
CCT: 6286 K
| Dell Latitude 14 5495 CMN14C9, , 1920x1080, 14" | Dell Latitude 5490-TD70X AU Optronics AUO263D, , 1920x1080, 14" | Lenovo ThinkPad A485-20MU000CGE NV140FHM-N46, , 1920x1080, 14" | HP EliteBook 745 G5 3UN74EA AUO383D, , 1920x1080, 14" | |
|---|---|---|---|---|
| Display | -11% | -2% | 47% | |
| Display P3 Coverage (%) | 40.94 | 36.28 -11% | 40.24 -2% | 61.3 50% |
| sRGB Coverage (%) | 61.4 | 54.6 -11% | 60 -2% | 87.6 43% |
| AdobeRGB 1998 Coverage (%) | 42.32 | 37.48 -11% | 41.57 -2% | 62.3 47% |
| Response Times | -9% | -13% | 16% | |
| Response Time Grey 50% / Grey 80% * (ms) | 41 ? | 46.9 ? -14% | 44.8 ? -9% | 35 ? 15% |
| Response Time Black / White * (ms) | 30 ? | 31.2 ? -4% | 35.2 ? -17% | 25 ? 17% |
| PWM Frequency (Hz) | 25000 ? | 1000 ? | ||
| Screen | -13% | -13% | 36% | |
| Brightness middle (cd/m²) | 212 | 227 7% | 275 30% | 421 99% |
| Brightness (cd/m²) | 200 | 211 6% | 272 36% | 398 99% |
| Brightness Distribution (%) | 89 | 88 -1% | 85 -4% | 86 -3% |
| Black Level * (cd/m²) | 0.23 | 0.19 17% | 0.26 -13% | 0.27 -17% |
| Contrast (:1) | 922 | 1195 30% | 1058 15% | 1559 69% |
| Colorchecker dE 2000 * | 4.34 | 5.6 -29% | 5.9 -36% | 4.08 6% |
| Colorchecker dE 2000 max. * | 9.01 | 22.4 -149% | 20 -122% | 7.48 17% |
| Greyscale dE 2000 * | 2.81 | 2.4 15% | 3.6 -28% | 2.92 -4% |
| Gamma | 2.22 99% | 2.44 90% | 2.36 93% | 2.32 95% |
| CCT | 6286 103% | 6506 100% | 6798 96% | 7043 92% |
| Color Space (Percent of AdobeRGB 1998) (%) | 39 | 34.5 -12% | 38.1 -2% | 57 46% |
| Color Space (Percent of sRGB) (%) | 61 | 54.4 -11% | 59.6 -2% | 87 43% |
| Colorchecker dE 2000 calibrated * | 4.9 | |||
| Total Average (Program / Settings) | -11% /
-12% | -9% /
-11% | 33% /
35% |
* ... smaller is better
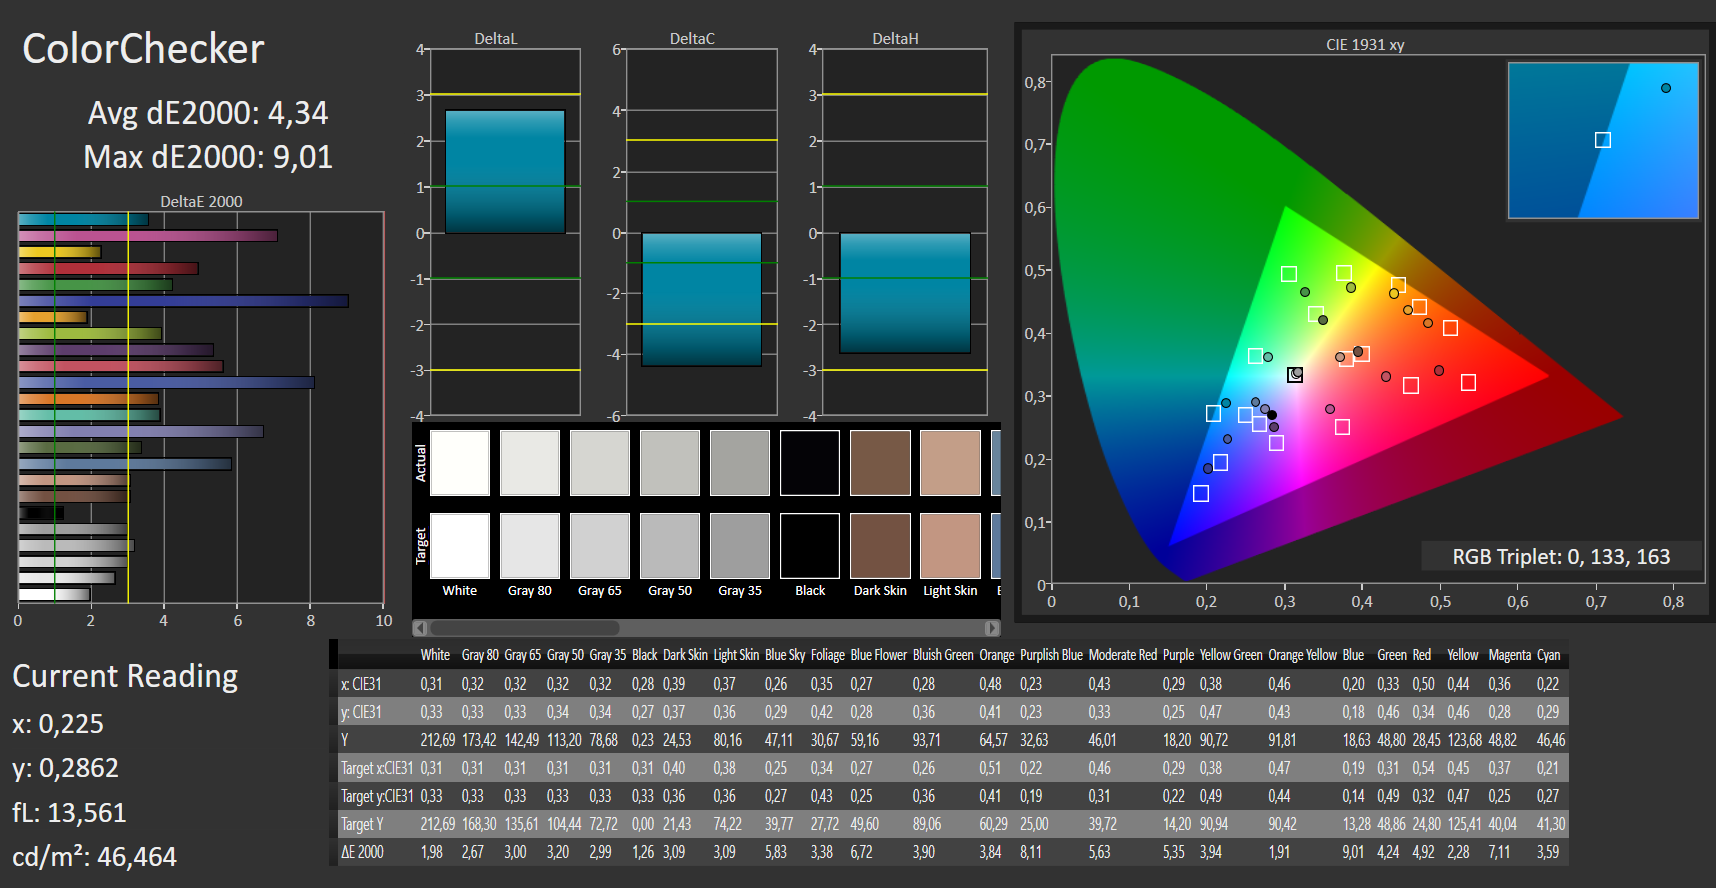
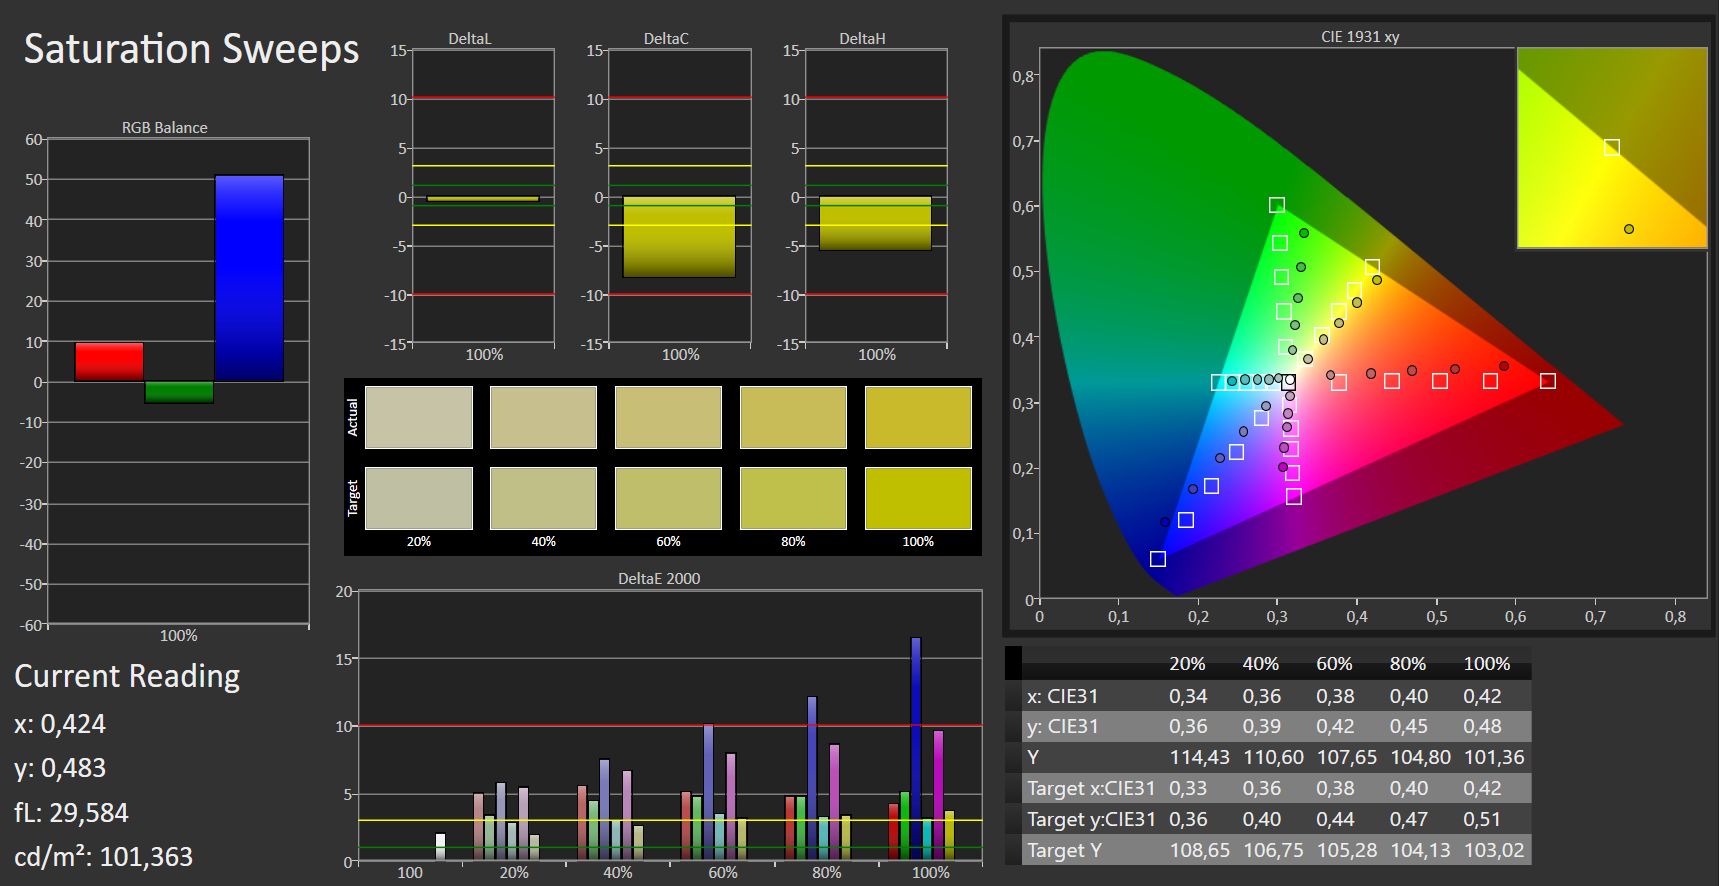

Subjectively, the display quality is good – probably thanks to the good contrast of 922:1. Also, we were able to calibrate the screen with pretty good results. With the calibration, there were no huge deviations from the expected gray-scale and saturation results. The color profile that we created for this review is freely available to download, as always.
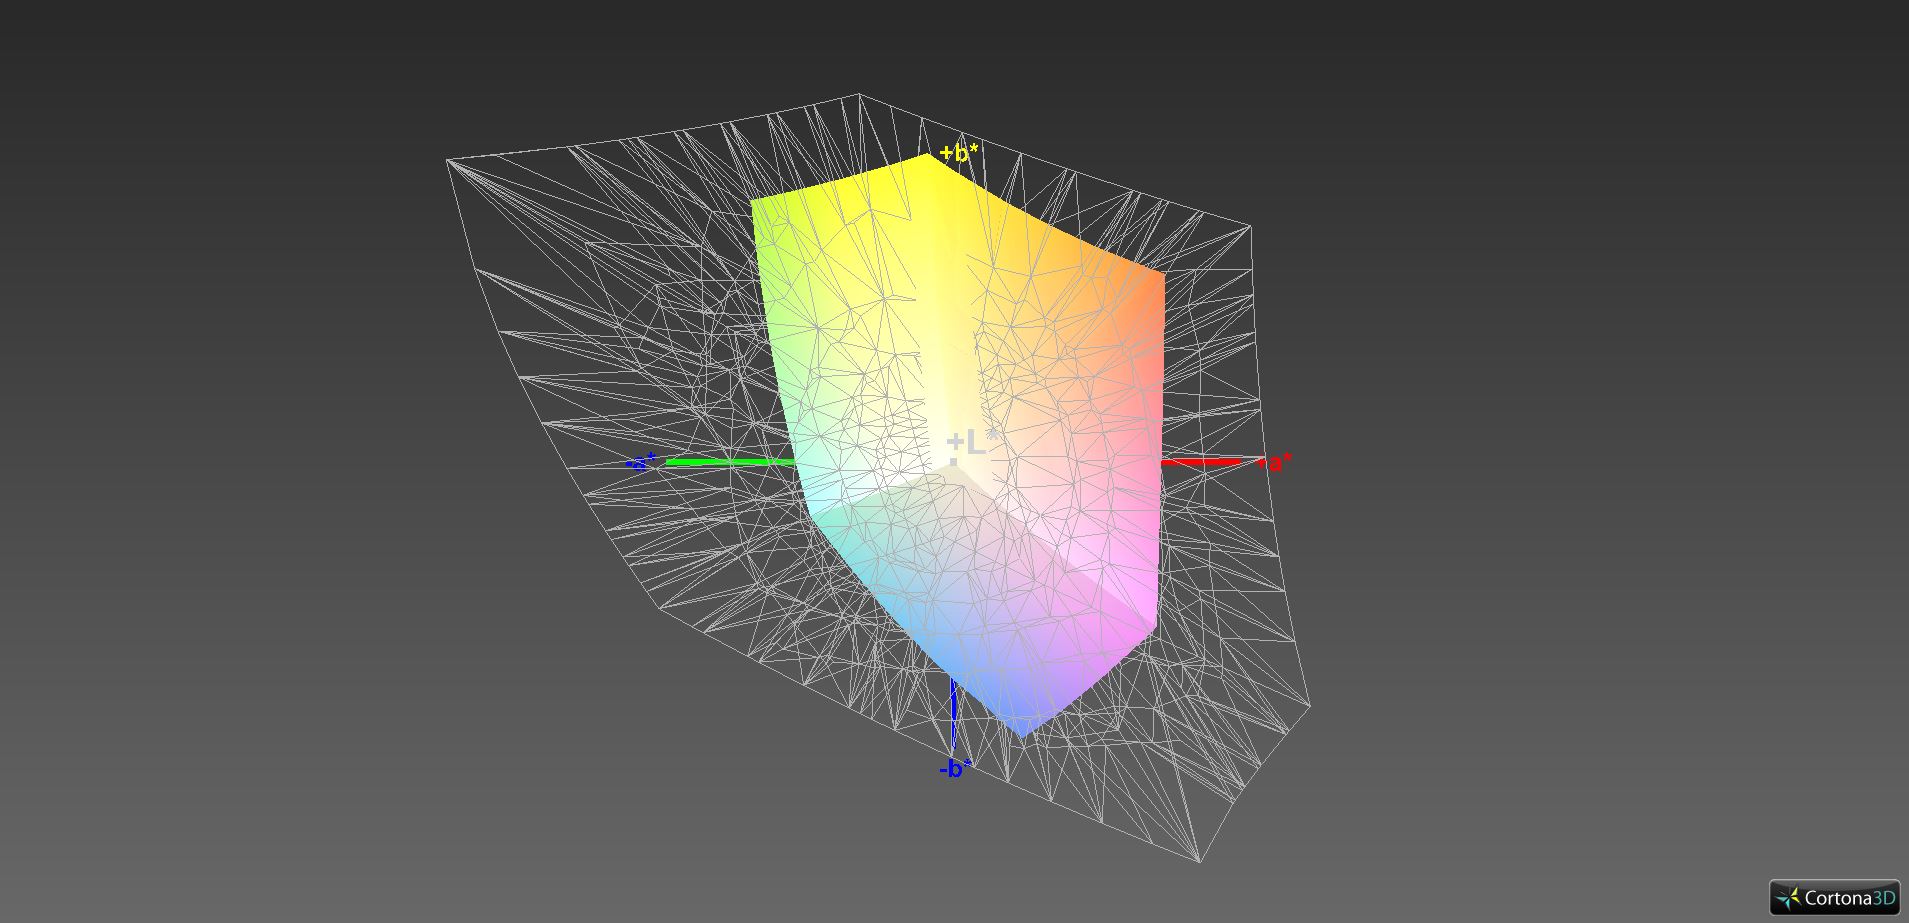
With the bad screen brightness in mind, it is not surprising in any way that the screen has a disappointingly bad color gamut as well. The sRGB color space is only 61% covered, rendering the screen unusable for photo editing. While the Lenovo ThinkPad A485 is as bad in this regard, the HP EliteBook 745 G5 has a much better color gamut of 87% sRGB.

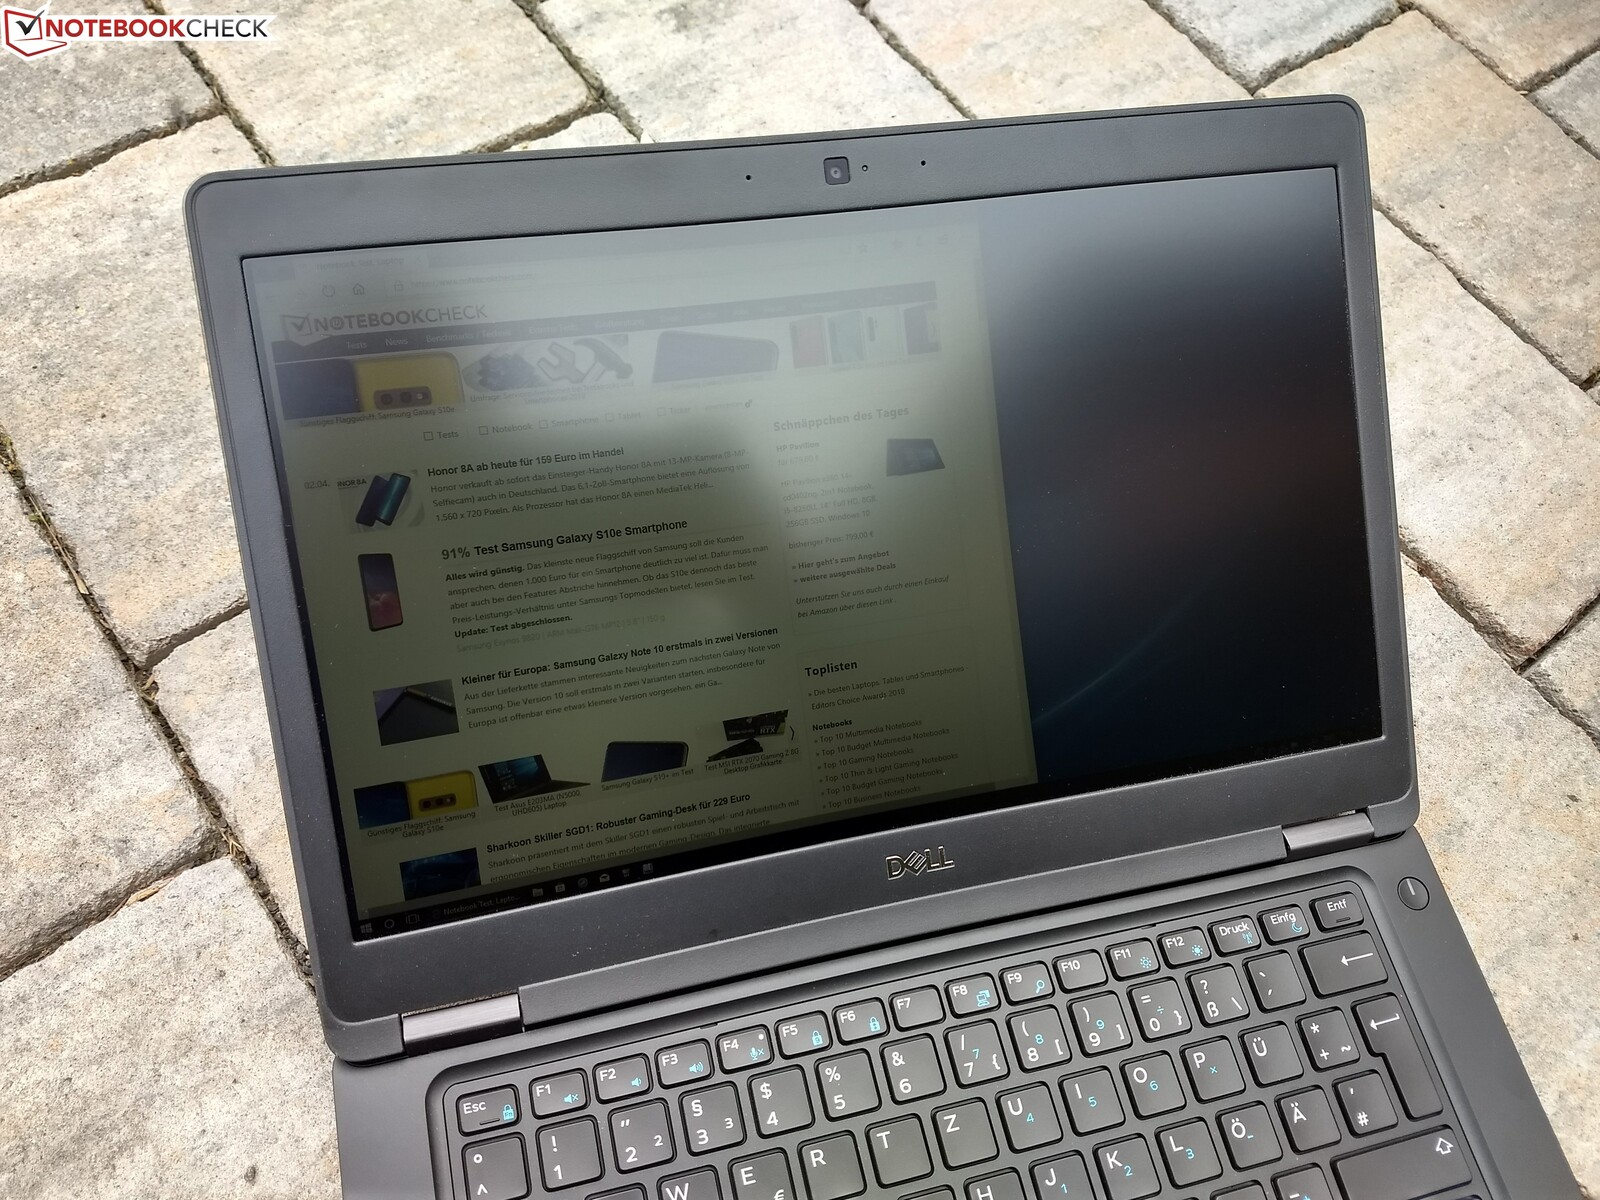
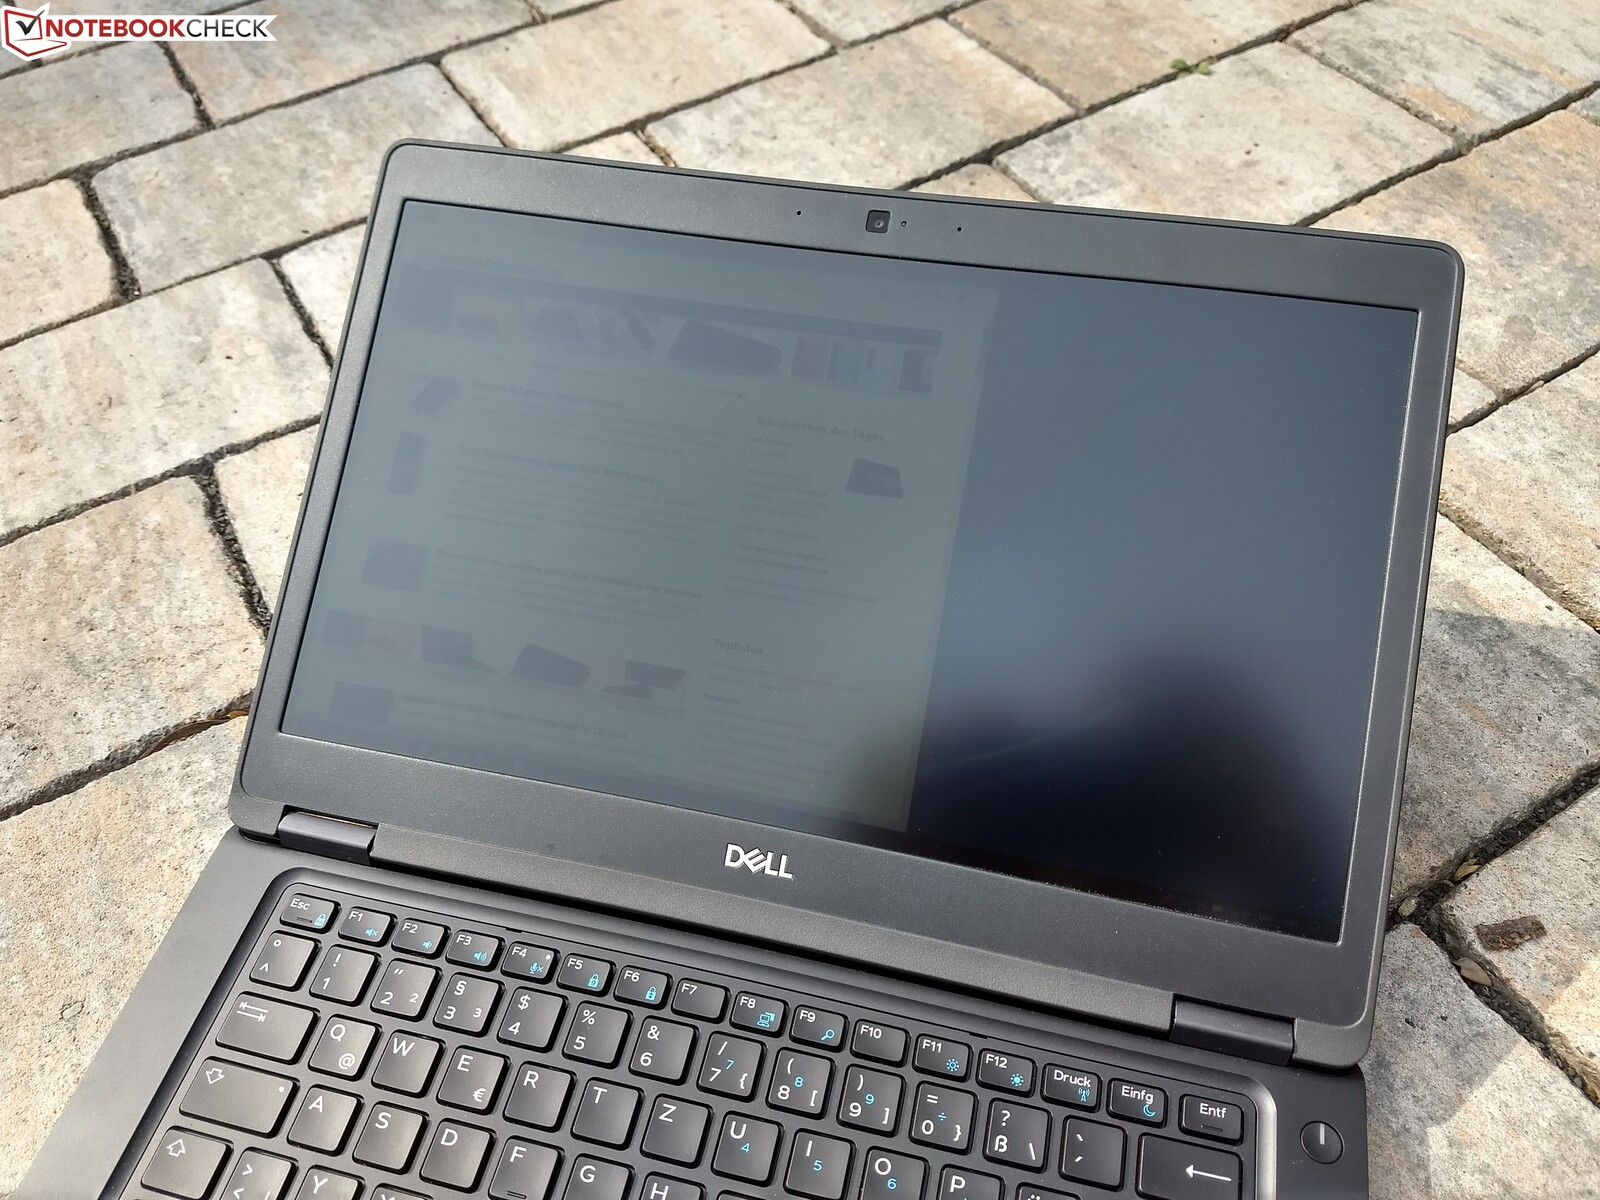
In spite of the matte screen surface, the Dell Latitude 5495 is practically unusable outdoors. Even in the shadow, the LCD is too dim and the screen content can barely be distinguished.
Display Response Times
| ↔ Response Time Black to White | ||
|---|---|---|
| 30 ms ... rise ↗ and fall ↘ combined | ↗ 19 ms rise | 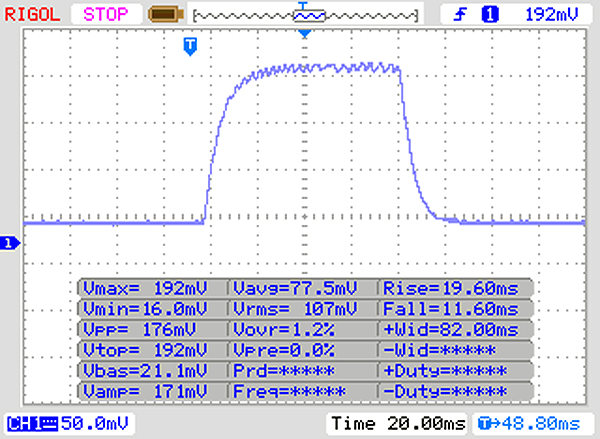 |
| ↘ 11 ms fall | ||
| The screen shows slow response rates in our tests and will be unsatisfactory for gamers. In comparison, all tested devices range from 0.1 (minimum) to 240 (maximum) ms. » 80 % of all devices are better. This means that the measured response time is worse than the average of all tested devices (19.9 ms). | ||
| ↔ Response Time 50% Grey to 80% Grey | ||
| 41 ms ... rise ↗ and fall ↘ combined | ↗ 24 ms rise | 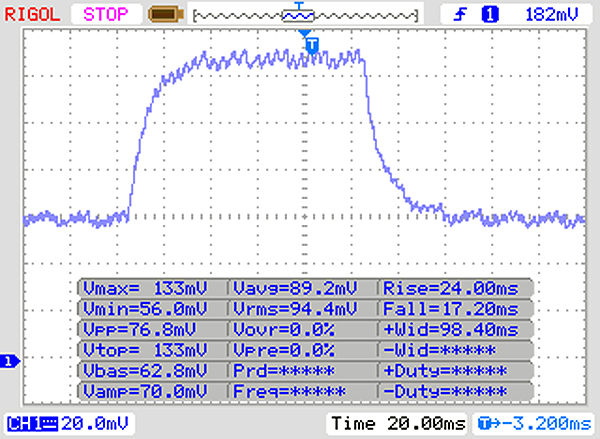 |
| ↘ 17 ms fall | ||
| The screen shows slow response rates in our tests and will be unsatisfactory for gamers. In comparison, all tested devices range from 0.165 (minimum) to 636 (maximum) ms. » 65 % of all devices are better. This means that the measured response time is worse than the average of all tested devices (31.1 ms). | ||
Screen Flickering / PWM (Pulse-Width Modulation)
| Screen flickering / PWM detected | 25000 Hz | ≤ 30 % brightness setting | 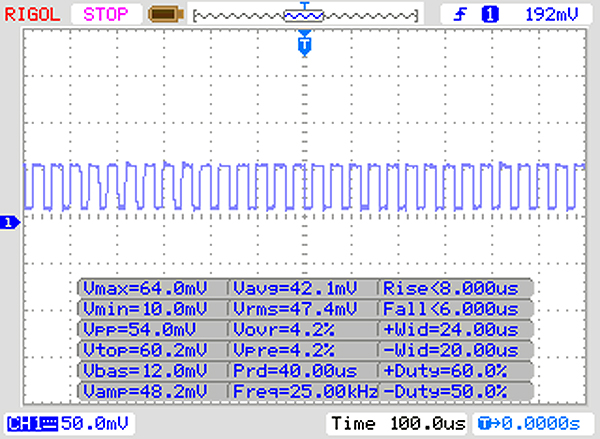 |
The display backlight flickers at 25000 Hz (worst case, e.g., utilizing PWM) Flickering detected at a brightness setting of 30 % and below. There should be no flickering or PWM above this brightness setting. The frequency of 25000 Hz is quite high, so most users sensitive to PWM should not notice any flickering. In comparison: 52 % of all tested devices do not use PWM to dim the display. If PWM was detected, an average of 7794 (minimum: 5 - maximum: 343500) Hz was measured. | |||
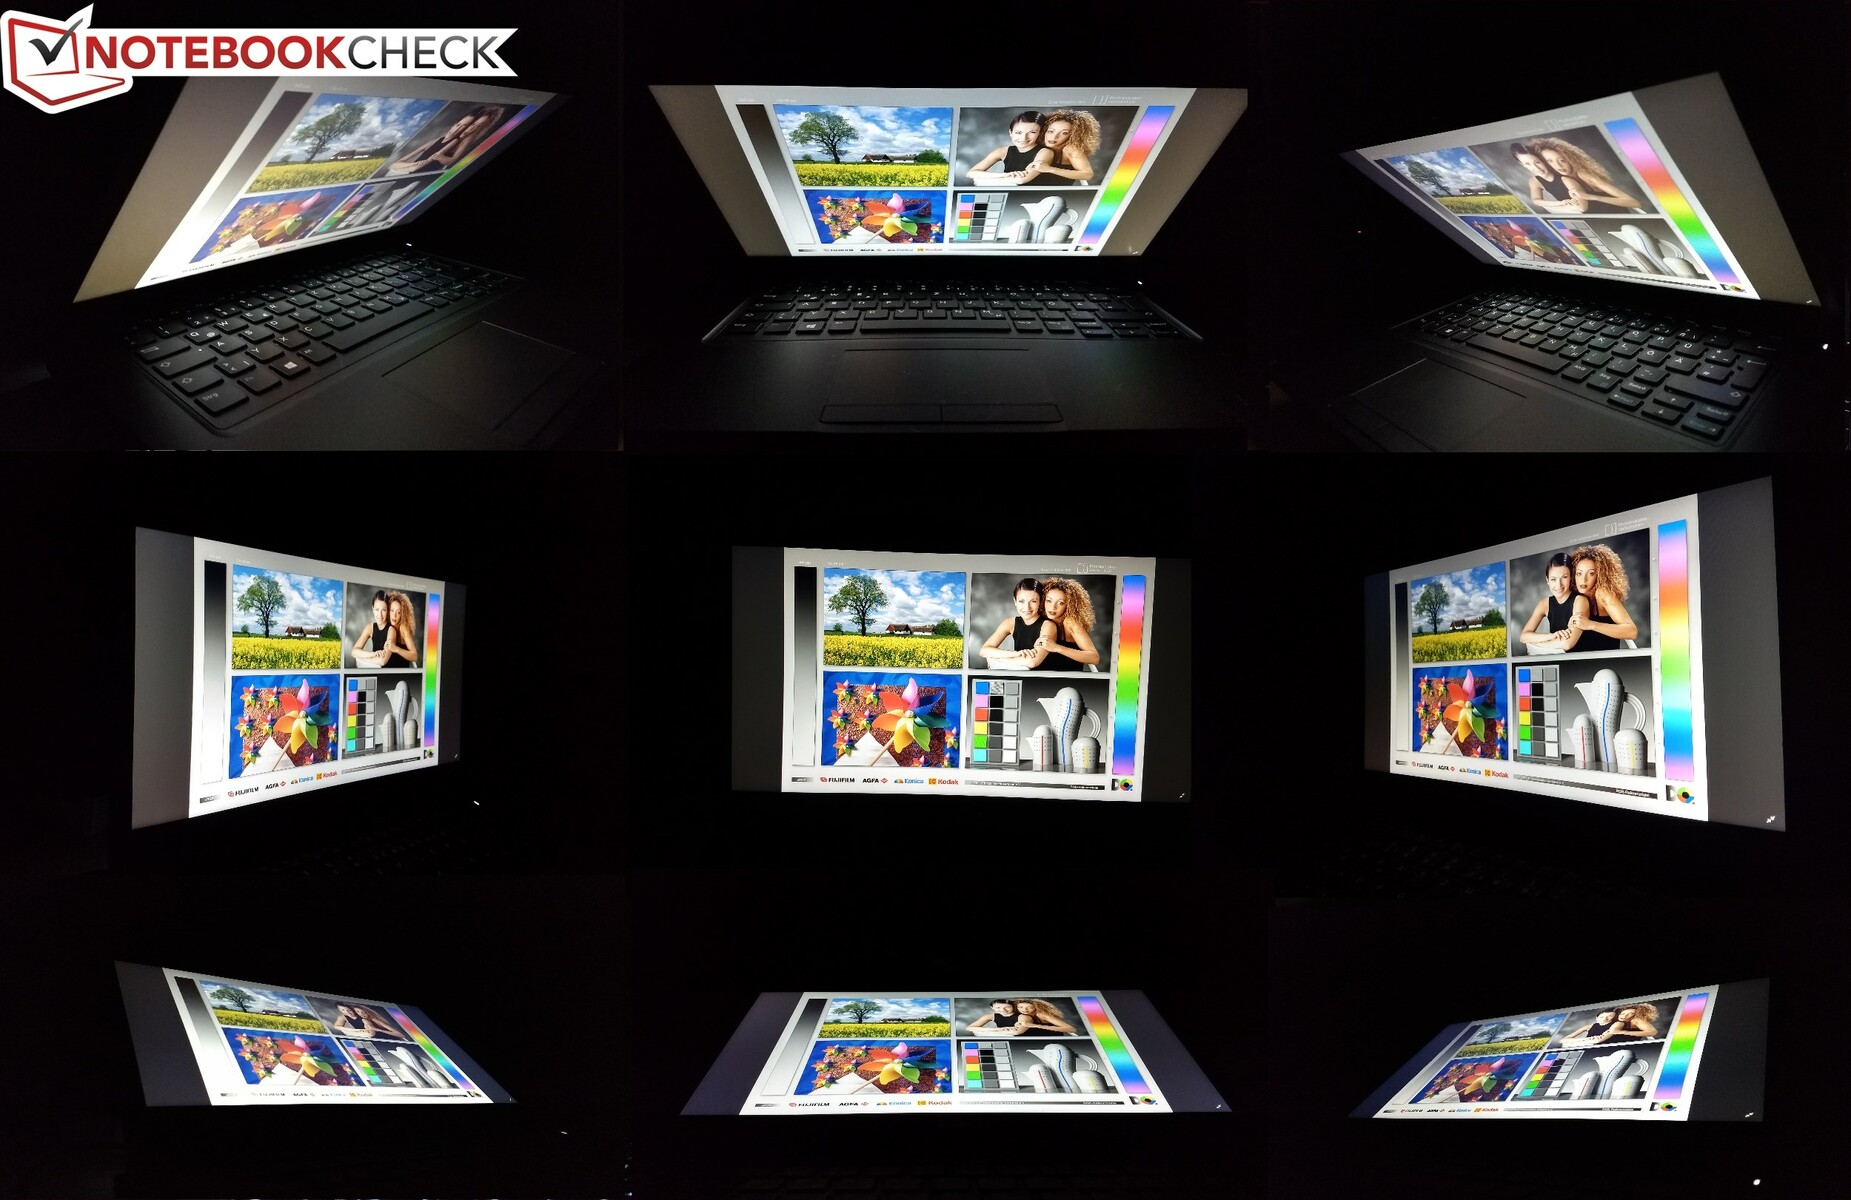
There is nothing to criticize about the viewing-angle stability. The IPS screen does have the IPS glow, though this should not affect everyday use.
Performance
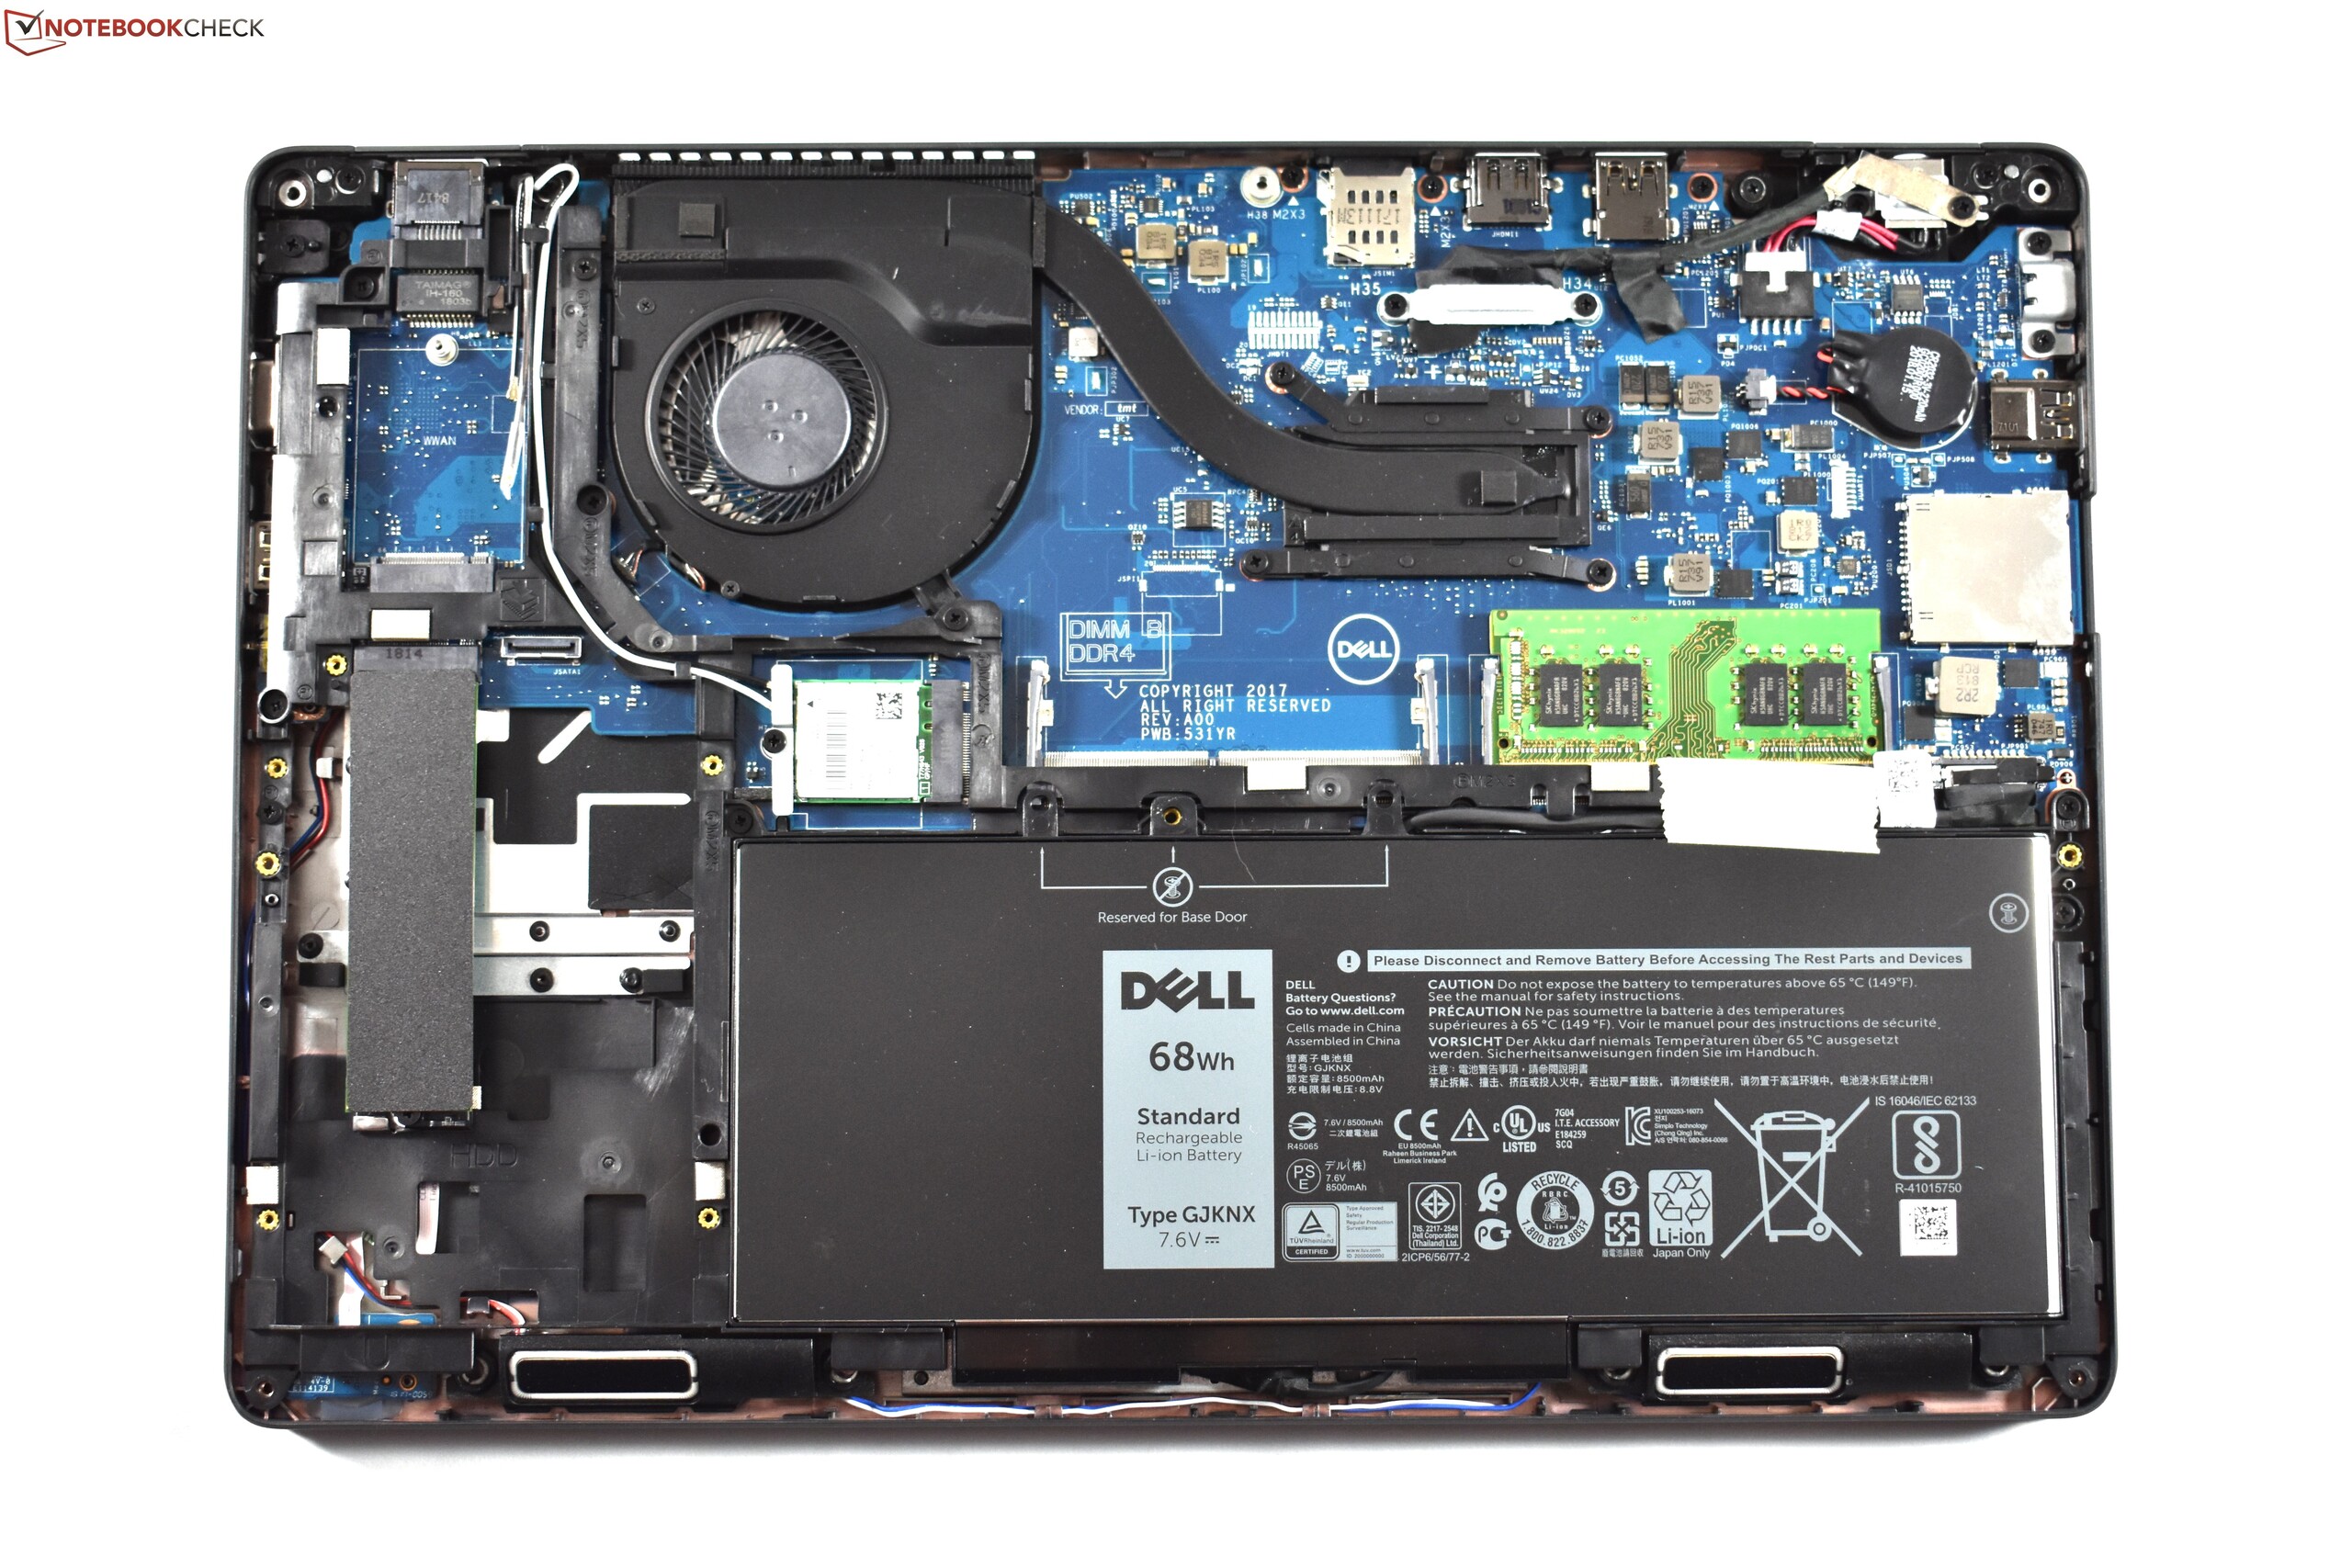
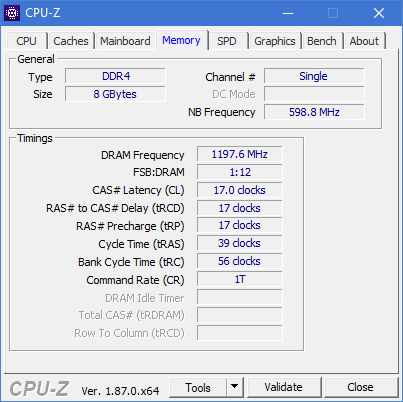
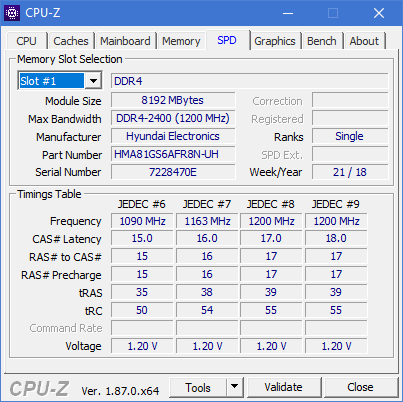
There are four different models of the Dell laptop in Germany. Three configurations use the AMD Ryzen 7 Pro 2700U as their processor; one contains the slower Ryzen 5 Pro 2500U. These processors are complemented by either 8 or 16 GB of DDR4-2400 memory (officially with a maximum of 32 GB, though 64 GB might be possible with two 32 GB modules). The SSD in all German models has a capacity of 256 GB.
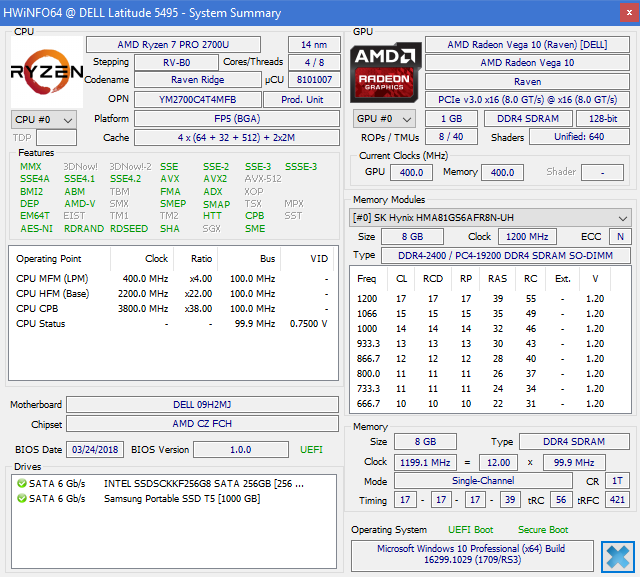
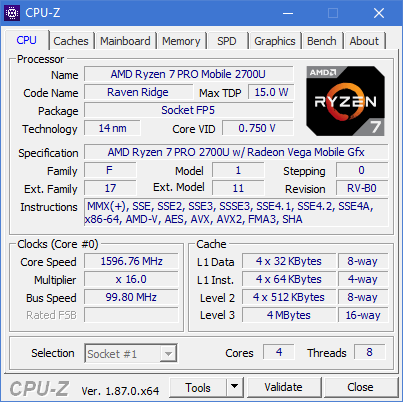
Processor
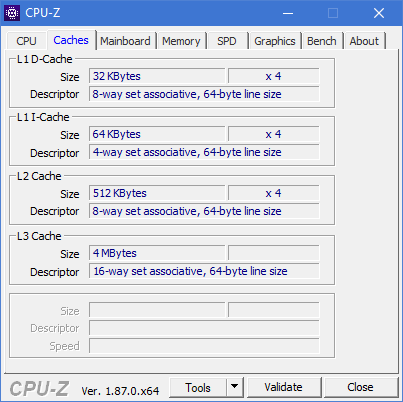
The Ryzen 7 Pro 2700U is an AMD processor for laptops and ultrabooks. Its four Zen-cores have a clock-rate that ranges between 2.2 and 3.8 GHz. The typical maximum power consumption of this CPU is 15 W. Comparisons with other processors are possible through our CPU comparison table.
In the Cinebench multicore test, the processor can consume up to 25 W, which means the cores can reach 3 to 3.2 GHz. The CPU temperatures reach 65 degrees Celsius (149 degrees Fahrenheit). In the Cinebench loop, which is our test to simulate continuous load, the Ryzen processor was able to maintain its performance for the first few iterations of the loop. Only after the tenth iteration, the performance starts to drop, as the CPU temperatures exceed 70 degrees Celsius (158 Fahrenheit). The CPU can still consume up to 20 W and the clock-rates of the four cores fall to 2.8 GHz.
The Dell Latitude 5495 laptop achieves the best CPU performance out of all the tested 14-inch Ryzen business laptops, no matter if we look at the boost-performance or sustained load. The Intel model Dell Latitude 5490 also performed worse than its AMD counterpart, though the difference between the two is quite small under sustained load.
The CPU is not throttled when the device is running on battery power.
System performance
Though the Dell Latitude 14 5495 did perform worse in some of the individual PCMark tests compared with the direct competitors, this did not at all translate negatively into everyday use. The system always ran smoothly.
| PCMark 8 Home Score Accelerated v2 | 3256 points | |
| PCMark 8 Work Score Accelerated v2 | 2438 points | |
| PCMark 10 Score | 2585 points | |
Help | ||
Storage
The SSD in our review unit is a 256 GB model made by Intel. This SSD is a very slow SATA III model and it performs accordingly. It should be noted though that the Dell Latitude 5490 also contained a SATA III SSD and the one in the Latitude 5495 is even slower. Much faster are the PCIe NVMe SSDs in the Lenovo ThinkPad A485 and the HP EliteBook 745 G5. The SSD in the Dell Latitude 5495 is fast enough for everyday use, but we still would expect a PCIe NVMe SSD in this price range.
| Dell Latitude 14 5495 Intel SSDSCKKF256G8 | Dell Latitude 5490-TD70X Toshiba KSG60ZMV512G | Lenovo ThinkPad A485-20MU000CGE Samsung SSD PM981 MZVLB256HAHQ | HP EliteBook 745 G5 3UN74EA Toshiba XG5 KXG50ZNV256G | Average Intel SSDSCKKF256G8 | |
|---|---|---|---|---|---|
| CrystalDiskMark 5.2 / 6 | 31% | 146% | 108% | 0% | |
| Write 4K (MB/s) | 48.45 | 90.4 87% | 114.8 137% | 119.5 147% | 48.5 ? 0% |
| Read 4K (MB/s) | 25.11 | 28.24 12% | 41.33 65% | 31.9 27% | 25.1 ? 0% |
| Write Seq (MB/s) | 341.2 | 433.7 27% | 1271 273% | 351.1 3% | 341 ? 0% |
| Read Seq (MB/s) | 521 | 469.3 -10% | 1171 125% | 1665 220% | 521 ? 0% |
| Write 4K Q32T1 (MB/s) | 202 | 297.6 47% | 218.4 8% | 268.4 33% | 202 ? 0% |
| Read 4K Q32T1 (MB/s) | 243.5 | 293.9 21% | 308.5 27% | 333.1 37% | 244 ? 0% |
| Write Seq Q32T1 (MB/s) | 320.8 | 534 66% | 1460 355% | 351.8 10% | 321 ? 0% |
| Read Seq Q32T1 (MB/s) | 555 | 531 -4% | 1529 175% | 2705 387% | 555 ? 0% |

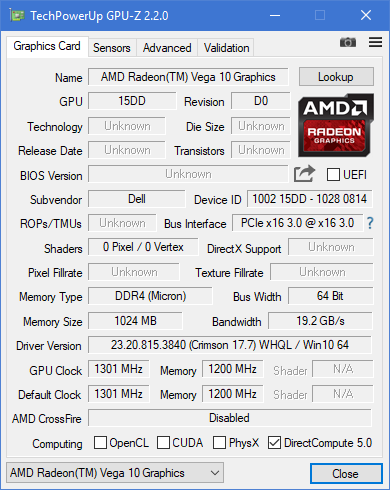
GPU
One of the biggest advantages of the Ryzen platform is the integrated GPU. The Ryzen 7 Pro 2700U for example has the AMD Radeon RX Vega 10, which is a lot faster than the Intel UHD Graphics 620. Our benchmark results do reflect this, as the Intel iGPU in the Dell Latitude 5490 is only half as fast as the AMD iGPU.
Even so, the maximum potential of the RX Vega 10 is not completely reached. As this is an integrated graphics processor, the Vega has to rely on the main system memory. Since the system memory runs in single channel mode, as there is only a single RAM module ex factory, the GPU cannot fully realize its potential. With dual channel RAM like in the Acer Swift 3, the GPU performance could be enhanced by roughly 33%. By adding a second RAM module, the integrated Vega GPU would not be very far away from the Nvidia GeForce MX150 performance-wise – at least when it comes to the slower 10 W model of the MX150 that is used in the Lenovo ThinkPad T480s.
The GPU performance is 100% available on battery power.
| 3DMark 11 Performance | 3129 points | |
| 3DMark Cloud Gate Standard Score | 8942 points | |
| 3DMark Fire Strike Score | 1659 points | |
Help | ||
Gaming performance
The Dell Latitude 14 5495 is a business laptop without any focus on gaming. Despite this, it can be used to play newer games, though only in reduced details and lower resolutions. If the user adds a second RAM module, it should be possible to increase the level of graphical details in many games at least by a little bit.
As there is no Thunderbolt 3 port, it is not possible to connect an eGPU to the Dell laptop.
| low | med. | high | ultra | |
|---|---|---|---|---|
| BioShock Infinite (2013) | 85.7 | 14.4 | ||
| The Witcher 3 (2015) | 33 | 10.7 | ||
| Rise of the Tomb Raider (2016) | 37.6 | 12.3 |
Emissions
Noise
The Latitude brings a mixed performance to the table when it comes to noise. When idle, the Dell laptop stays completely quiet with a fan that is disabled almost 100% of the time. Under load, the fan runs constantly. That is normal, but unfortunately, the cooling system emits a much louder and more high-frequent noise compared with the competitors from HP and Lenovo.
We could not hear any coil-whine with this review unit.
Noise level
| Idle |
| 30.7 / 30.7 / 30.7 dB(A) |
| Load |
| 35.4 / 43 dB(A) |
 | ||
30 dB silent 40 dB(A) audible 50 dB(A) loud |
||
min: | ||
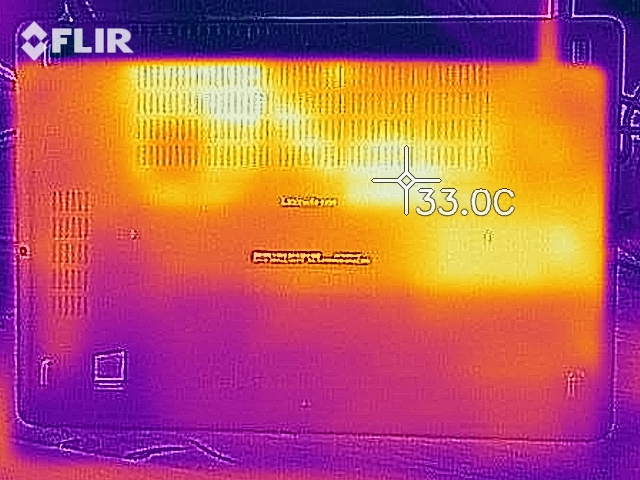
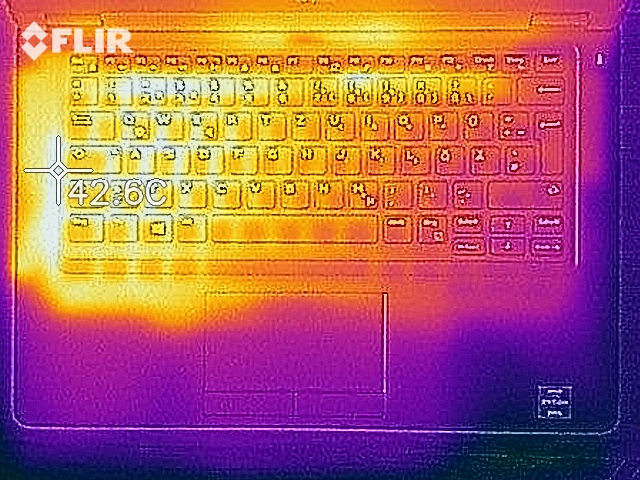
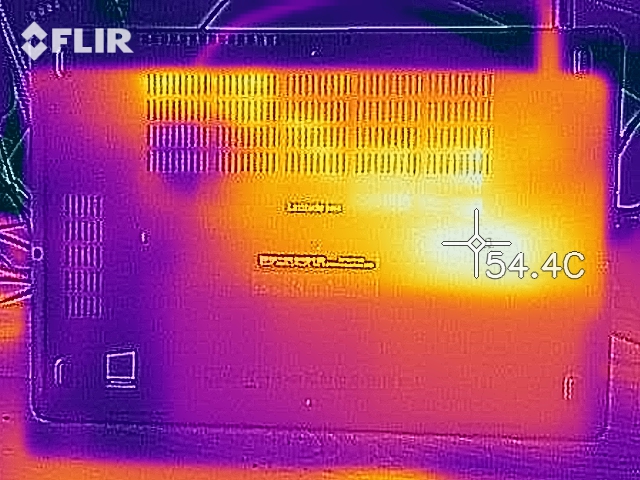
Temperatures
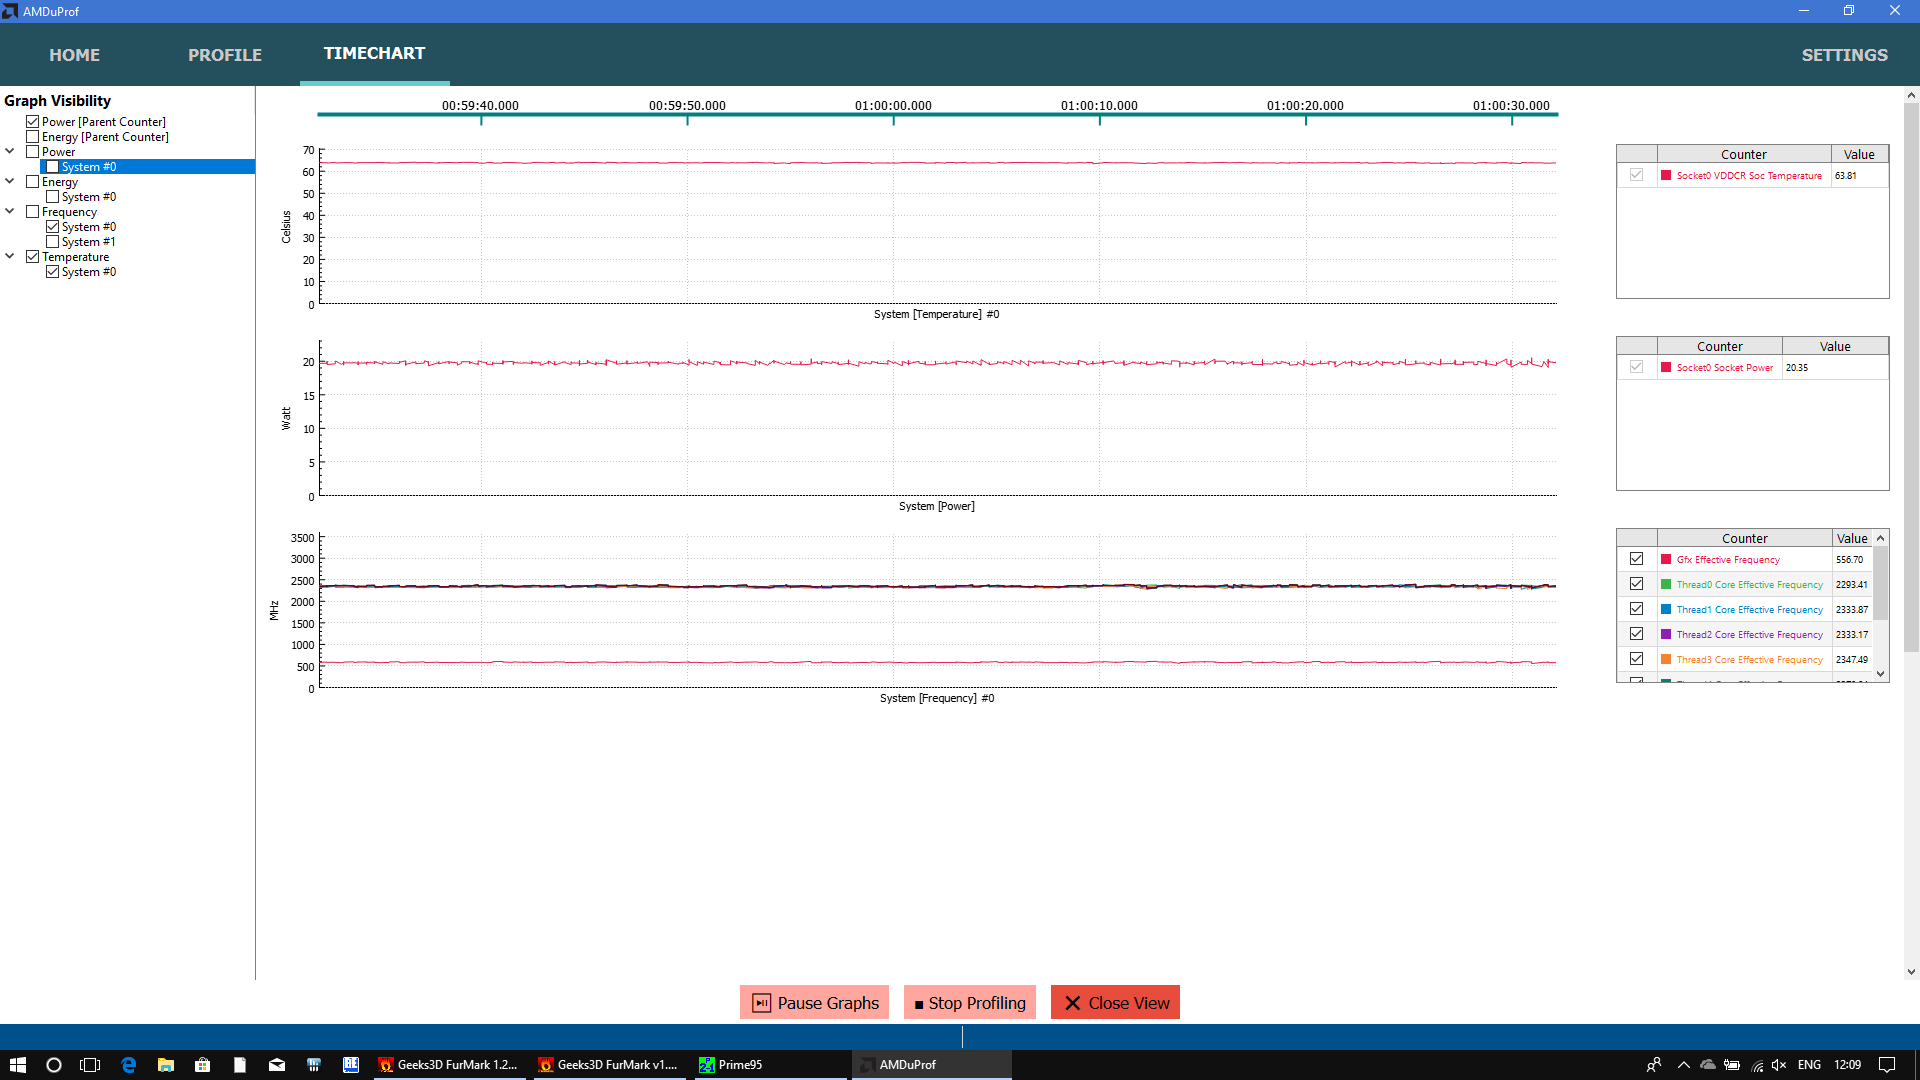
The Dell Latitude 5495 is a comparably cool specimen. In the stress test, we measured a maximum temperature of 45.6 degrees Celsius (~114 degrees Fahrenheit) – not problematic at all. The palm rest always stayed cool.
In the stress test with Prime95 and FurMark, the GPU and CPU together consumed 21 W. The CPU clock-rate reached 2.5 GHz, while the GPU clock-rate was sitting at 700 MHz at the start of the test. The temperatures climb to 66 degrees Celsius (~151 Fahrenheit) after six minutes. Roughly half an hour later, the power consumption still reached 19 W, which means that the CPU cores had a clock-rate of 2.3 W, while the GPU had a clock-rate of 500 MHz. The system can sustain this level of performance until the end of the test. There was no throttling at all.
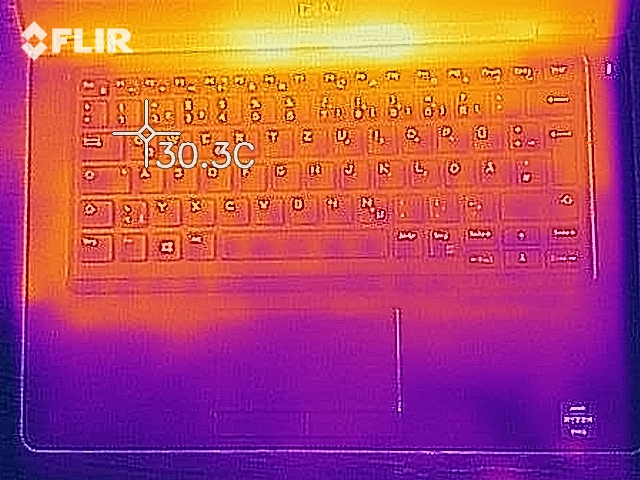
(+) The maximum temperature on the upper side is 37.1 °C / 99 F, compared to the average of 34.3 °C / 94 F, ranging from 21.2 to 62.5 °C for the class Office.
(-) The bottom heats up to a maximum of 45.6 °C / 114 F, compared to the average of 36.8 °C / 98 F
(+) In idle usage, the average temperature for the upper side is 23.1 °C / 74 F, compared to the device average of 29.5 °C / 85 F.
(+) The palmrests and touchpad are cooler than skin temperature with a maximum of 27.2 °C / 81 F and are therefore cool to the touch.
(±) The average temperature of the palmrest area of similar devices was 27.5 °C / 81.5 F (+0.3 °C / 0.5 F).
Speakers
Dell places the stereo speakers at the bottom near the front edge. They emit a loud but unbalanced sound. Unfortunately, this means that the good level of loudness is of no use here, as the speakers sound especially bad on higher loudness levels.
Instead of the integrated speakers, we recommend external ones or headphones. Both can be connected to the system via the combo audio port.
Dell Latitude 14 5495 audio analysis
(±) | speaker loudness is average but good (76.1 dB)
Bass 100 - 315 Hz
(-) | nearly no bass - on average 17.1% lower than median
(±) | linearity of bass is average (9.7% delta to prev. frequency)
Mids 400 - 2000 Hz
(±) | higher mids - on average 5.5% higher than median
(±) | linearity of mids is average (8.6% delta to prev. frequency)
Highs 2 - 16 kHz
(+) | balanced highs - only 2.1% away from median
(+) | highs are linear (5.3% delta to prev. frequency)
Overall 100 - 16.000 Hz
(±) | linearity of overall sound is average (17.5% difference to median)
Compared to same class
» 27% of all tested devices in this class were better, 7% similar, 66% worse
» The best had a delta of 7%, average was 21%, worst was 53%
Compared to all devices tested
» 34% of all tested devices were better, 8% similar, 58% worse
» The best had a delta of 4%, average was 24%, worst was 134%
HP EliteBook 745 G5 3UN74EA audio analysis
(-) | not very loud speakers (71.2 dB)
Bass 100 - 315 Hz
(-) | nearly no bass - on average 27.1% lower than median
(±) | linearity of bass is average (10.7% delta to prev. frequency)
Mids 400 - 2000 Hz
(+) | balanced mids - only 2.4% away from median
(±) | linearity of mids is average (8.6% delta to prev. frequency)
Highs 2 - 16 kHz
(+) | balanced highs - only 2.7% away from median
(+) | highs are linear (5.6% delta to prev. frequency)
Overall 100 - 16.000 Hz
(±) | linearity of overall sound is average (20.2% difference to median)
Compared to same class
» 43% of all tested devices in this class were better, 10% similar, 46% worse
» The best had a delta of 7%, average was 21%, worst was 53%
Compared to all devices tested
» 52% of all tested devices were better, 8% similar, 39% worse
» The best had a delta of 4%, average was 24%, worst was 134%
Energy management
Power consumption
In the introduction of this review, we mentioned how Ryzen laptops often have had a higher power consumption than Intel system so far. Does this still hold true? Yes and no. The power consumption of the Dell Latitude 5495 is indeed lower compared with the Lenovo ThinkPad A485 and the HP EliteBook 745 G5 (which we both reviewed last year), but the Intel-based Dell Latitude 5490 is still more efficient when idle.
For the 65 W charger, the maximum power consumption of 40 W was no challenge at all.
| Off / Standby | |
| Idle | |
| Load |
|
Key:
min: | |
| Dell Latitude 14 5495 R7 2700U, Vega 10, Intel SSDSCKKF256G8, IPS LED, 1920x1080, 14" | Dell Latitude 5490-TD70X i5-8350U, UHD Graphics 620, Toshiba KSG60ZMV512G, IPS, 1920x1080, 14" | Lenovo ThinkPad A485-20MU000CGE R5 PRO 2500U, Vega 8, Samsung SSD PM981 MZVLB256HAHQ, IPS LED, 1920x1080, 14" | HP EliteBook 745 G5 3UN74EA R7 2700U, Vega 10, Toshiba XG5 KXG50ZNV256G, IPS LED, 1920x1080, 14" | Average AMD Radeon RX Vega 10 | Average of class Office | |
|---|---|---|---|---|---|---|
| Power Consumption | -10% | -30% | -16% | -13% | -24% | |
| Idle Minimum * (Watt) | 4.3 | 3.3 23% | 5.3 -23% | 4.9 -14% | 4.73 ? -10% | 4.44 ? -3% |
| Idle Average * (Watt) | 6.6 | 5.54 16% | 8.3 -26% | 8.1 -23% | 7.61 ? -15% | 7.38 ? -12% |
| Idle Maximum * (Watt) | 7.7 | 6.59 14% | 11.4 -48% | 10.6 -38% | 9.63 ? -25% | 8.59 ? -12% |
| Load Average * (Watt) | 32 | 42.4 -33% | 42 -31% | 32.2 -1% | 33.3 ? -4% | 43 ? -34% |
| Load Maximum * (Watt) | 40 | 67.6 -69% | 48.8 -22% | 42.3 -6% | 45.1 ? -13% | 64.5 ? -61% |
* ... smaller is better
Battery life
Dell offers four different internal batteries for the Latitude 5495. The smallest battery has a capacity of 42 Wh, the next biggest has 51 Wh. The two biggest batteries have a capacity of 68 Wh, which means that the Dell Latitude 5495 can offer a much larger battery capacity than the competition from HP. At least on paper: The battery in our review unit has a capacity of just 61 Wh – if we would have bought this system for ourselves, we would have returned it.
Despite this, the Latitude 5495 still had the biggest battery capacity of all the tested 14-inch AMD business laptops. Because of the bigger battery and the lower power consumption, it is not surprising that the Latitude 5495 outperformed both the ThinkPad A485 and the EliteBook 745 G5 in the Wi-Fi test. In this test, the Latitude scored a result of more than 9 hours, while the ThinkPad A485 just achieved 5.5 hours and the EliteBook 745 G5 just 6.5 hours.
| Dell Latitude 14 5495 R7 2700U, Vega 10, 61 Wh | Dell Latitude 5490-TD70X i5-8350U, UHD Graphics 620, 68 Wh | Lenovo ThinkPad A485-20MU000CGE R5 PRO 2500U, Vega 8, 48 Wh | HP EliteBook 745 G5 3UN74EA R7 2700U, Vega 10, 50 Wh | Average of class Office | |
|---|---|---|---|---|---|
| Battery runtime | 21% | -45% | -35% | 18% | |
| Reader / Idle (h) | 18.2 | 25.9 42% | 11.2 -38% | 10.7 -41% | 23.7 ? 30% |
| H.264 (h) | 11.8 | 13.2 12% | 6.1 -48% | 7.1 -40% | 15 ? 27% |
| WiFi v1.3 (h) | 9.4 | 15 60% | 5.5 -41% | 6.6 -30% | 12.9 ? 37% |
| Load (h) | 2.3 | 1.6 -30% | 1.1 -52% | 1.6 -30% | 1.807 ? -21% |
Pros
Cons
Verdict
The Dell Latitude 5495 could be a very good laptop with AMD Ryzen mobile. The focus here is on the "could", as Dell does almost as many things wrong as it does things right.
First things first though: We were very interested how well the Latitude would utilize the performance potential of Ryzen – the verdict in this aspect is "very good". The Latitude 5495 manages to beat its Intel sister model Latitude 5490 as well as the known competitors like the Lenovo ThinkPad A485 and the HP EliteBook 745 G5. Both are also much worse in terms of battery life, despite the battery of the Latitude having a smaller capacity than advertised. Aside from these advantages, the Latitude 5495 also offers a very fast SD card-reader, a robust chassis with good upgradeability and mostly good input devices. Also, the fan stayed silent when idle, while the chassis did not get very hot, even under load.
Where there is light, there also is shadow. In this case, the shadow is represented by the screen. The screen does glow with light, but dimly, with just 200 cd/m² on average. This should be and could be better, as 200 cd/m² can even be problematic in bright indoor environments. In addition, the screen exhibited backlight bleeding and its color space coverage was insufficient. The screen is the most glaring issue, but not the only one. The chassis is heavier and much thicker than the competitors, which probably explains how Dell was able to put in such a large battery. The Dell Latitude 5495 also misses features that we would expect to find in a business laptop of this price range. Examples are a fingerprint-reader, a Pointing Stick or a backlit keyboard – these features are only available as expensive options. Thunderbolt 3 is not available either, though in this case not even as an option. Also, Dell cheapens out on the SSD – that is the only way we can explain the slow SATA III SSD. The same thing is true for the short standard warranty of just 12 months.
Difficult assessment: The Dell Latitude 5495 has many positive aspects to it, but also many drawbacks as well.
In such cases, it is difficult for us to recommend a device or to advise against purchasing it. The Dell Latitude 5495 certainly has its advantages, but for us, the dark screen is simply a no-go – but we also know that many business customers often have different priorities than the screen quality. All things considered, we probably would prefer the competitors Lenovo ThinkPad A485 and HP EliteBook 745 G5, though their worse battery life is a big argument for the Latitude. In any case, it still holds true that the perfect laptop with AMD Ryzen has yet to be invented.
Dell Latitude 14 5495
- 04/06/2019 v6 (old)
Benjamin Herzig
Price comparison
