Lenovo ThinkPad A485 (Ryzen 5 Pro) Laptop Review
When Lenovo introduced a completely new sub-series of its ThinkPad business laptops with AMD processors to the market at the end of last fall, it was a bit surprising. After all, the first models of the new ThinkPad A series, the ThinkPad A275 and the ThinkPad A475, were based on the "Bristol-Ridge" processors from AMD. These were already aged at the time and ready to be replaced by the "Raven-Ridge" mobile Ryzen processors. However, it was already clear then that the first two models were only place holders to establish the ThinkPad A series and bridge the time until the Ryzen.
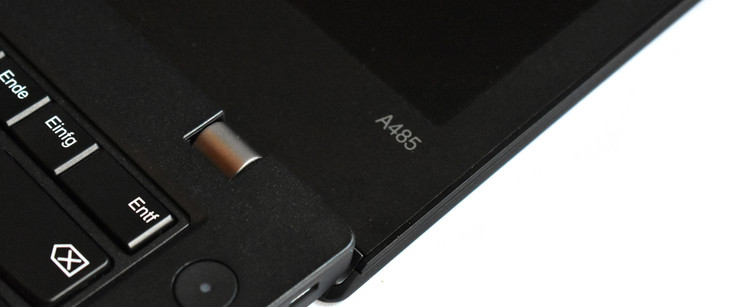
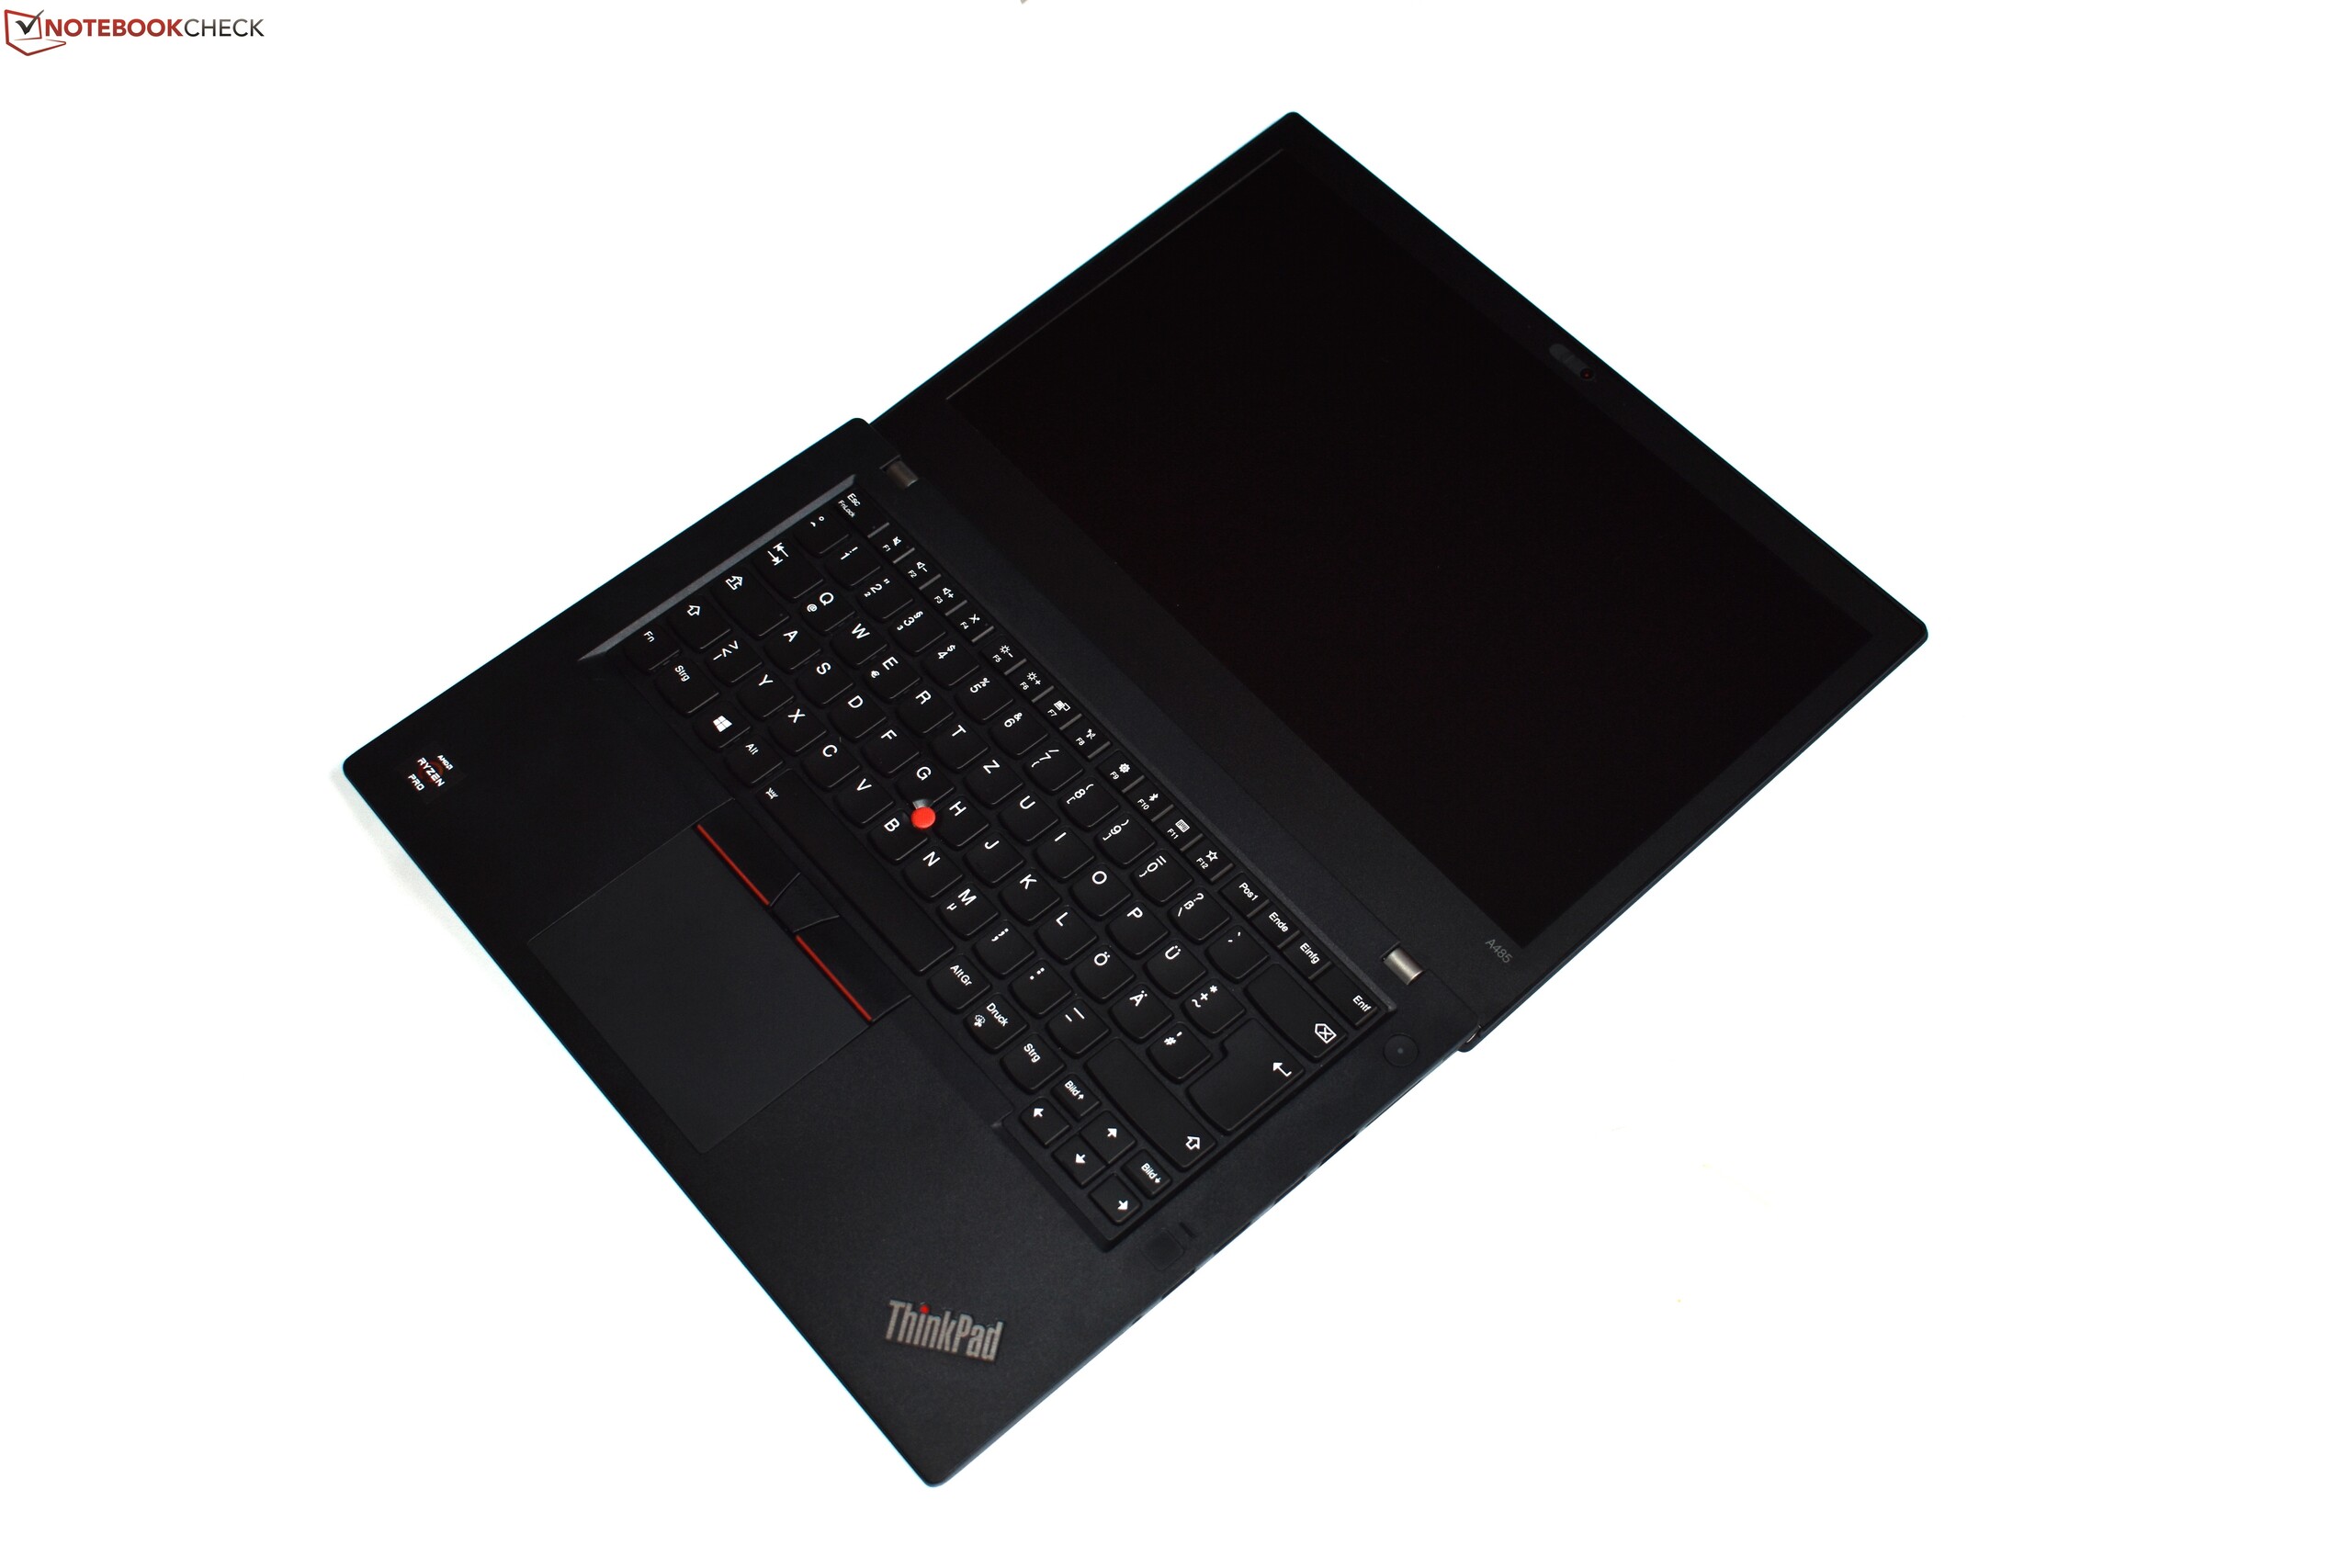
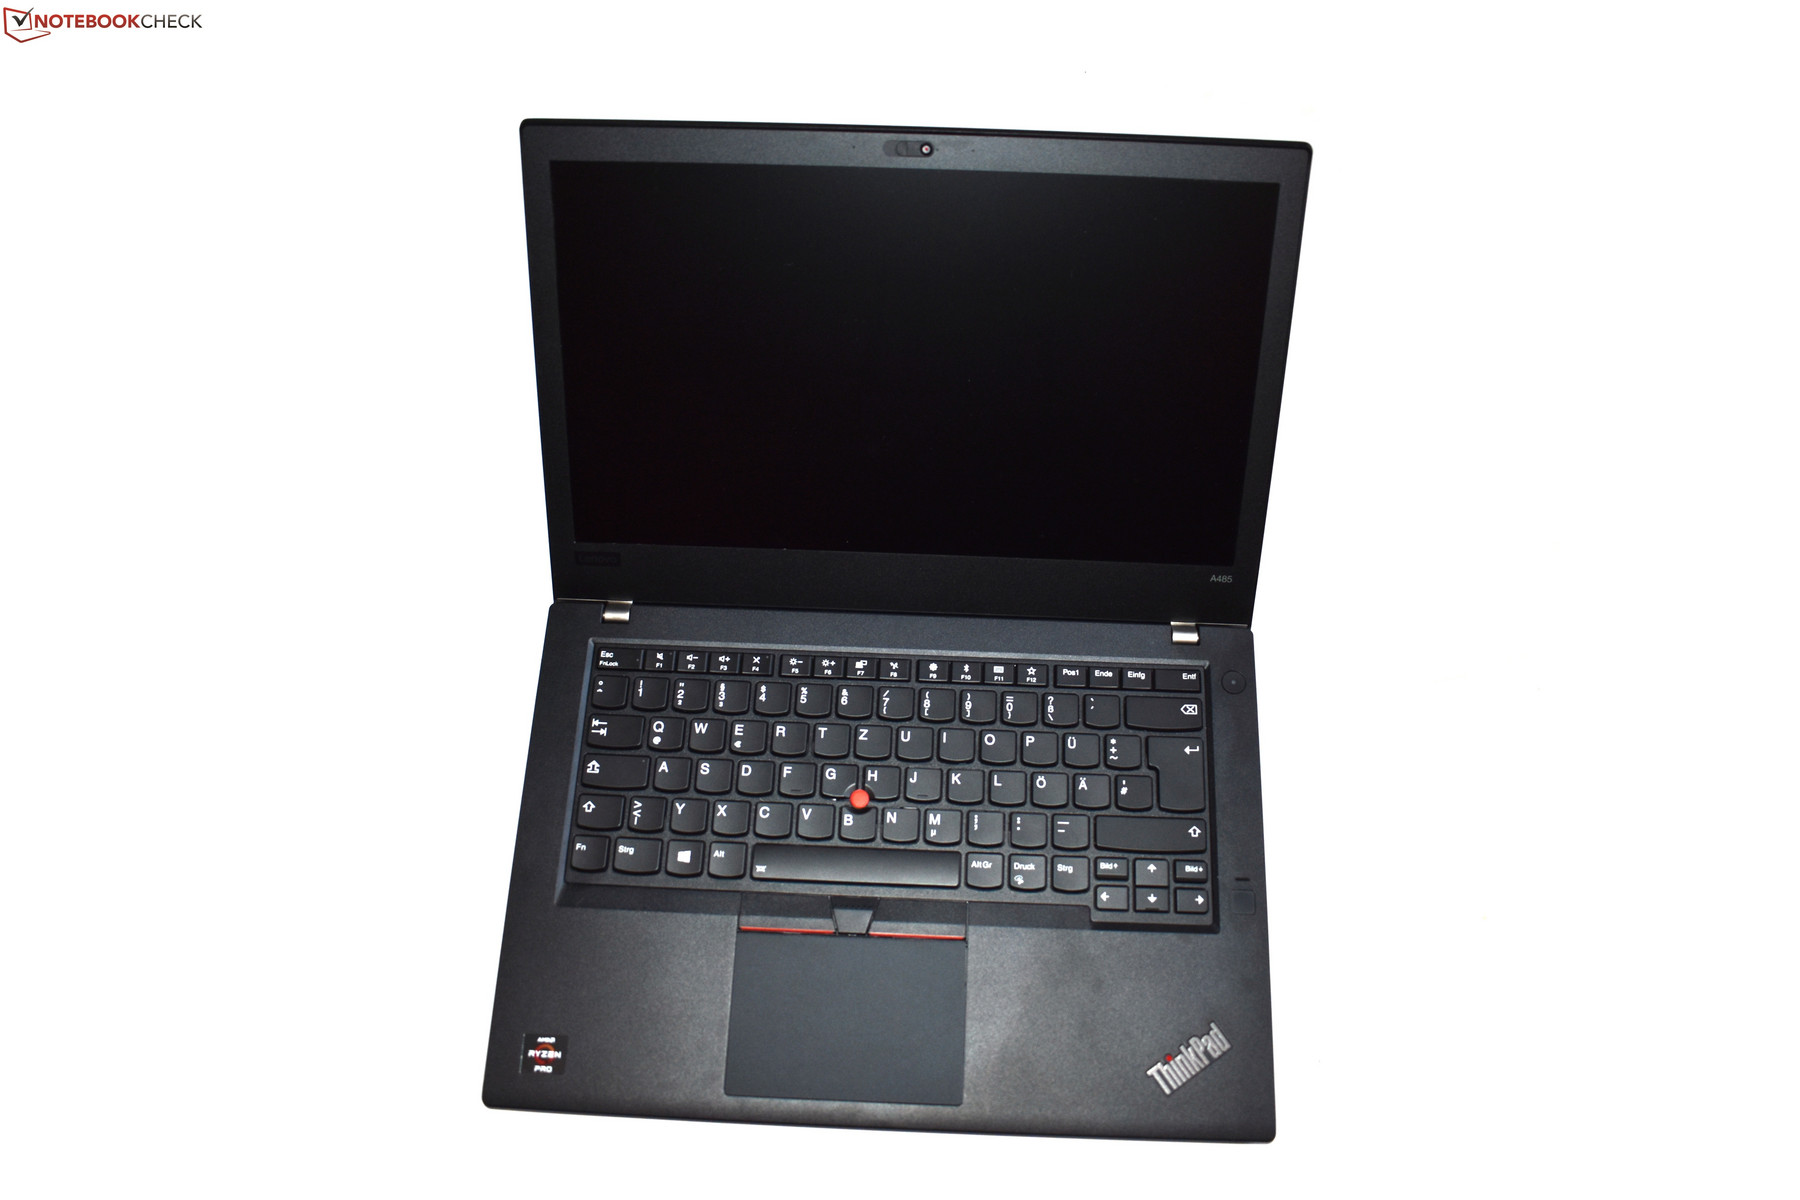
Now, almost one year later, the second generation of the Lenovo ThinkPad A series is on the market, and it finally contains the newest Ryzen processors. The design continues to be based on the current models of the ThinkPad X and the ThinkPad T series. For the smaller ThinkPad A285, the Intel equivalent would be the Lenovo ThinkPad X280, while our current test unit, the ThinkPad A485, is based on the design of the Lenovo ThinkPad T480. We can therefore leave out the description of the case, connections, and input devices, since you can find all this information in the detailed review of the Lenovo ThinkPad T480.
In addition to the ThinkPad T480 as the most obvious reference comparison, the main competitor to the Lenovo ThinkPad A485 is primarily the HP EliteBook 745 G5. While the Dell Latitude 5495 would also be a good comparison device, since we have not been able to test this model yet, we are comparing the ThinkPad A485 with the Dell Latitude 5490 with Intel internals instead.
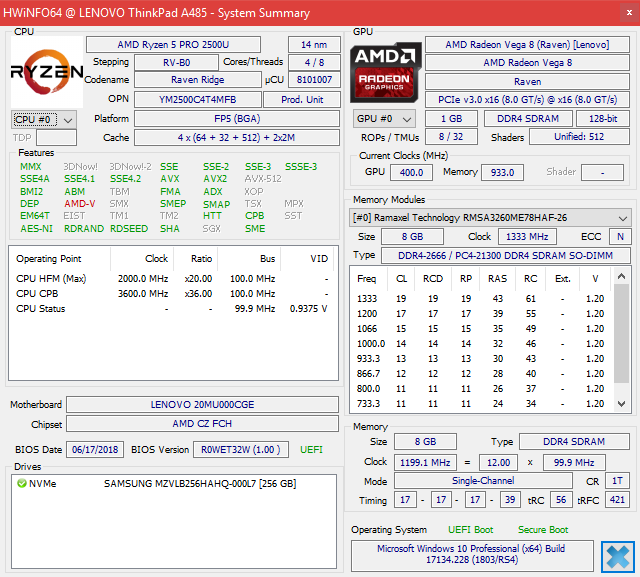
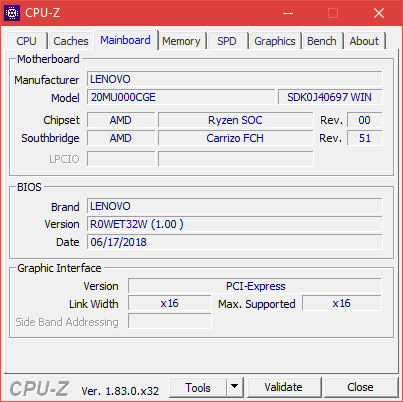
Our test unit is currently the only best-selling model on the German market. This configuration with the model number 20MU000CGE contains the AMD Ryzen 5 2500U, 8 GB of RAM, a 256-GB SSD, as well as an IPS display with Full HD resolution (1920x1080).

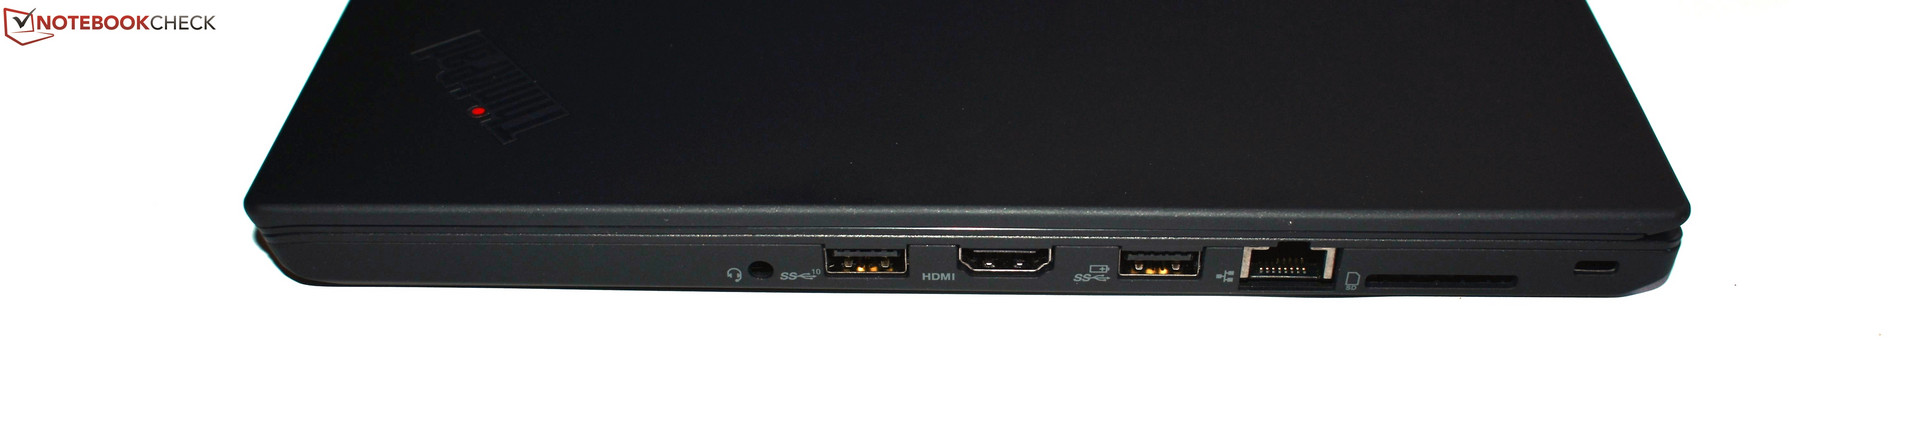
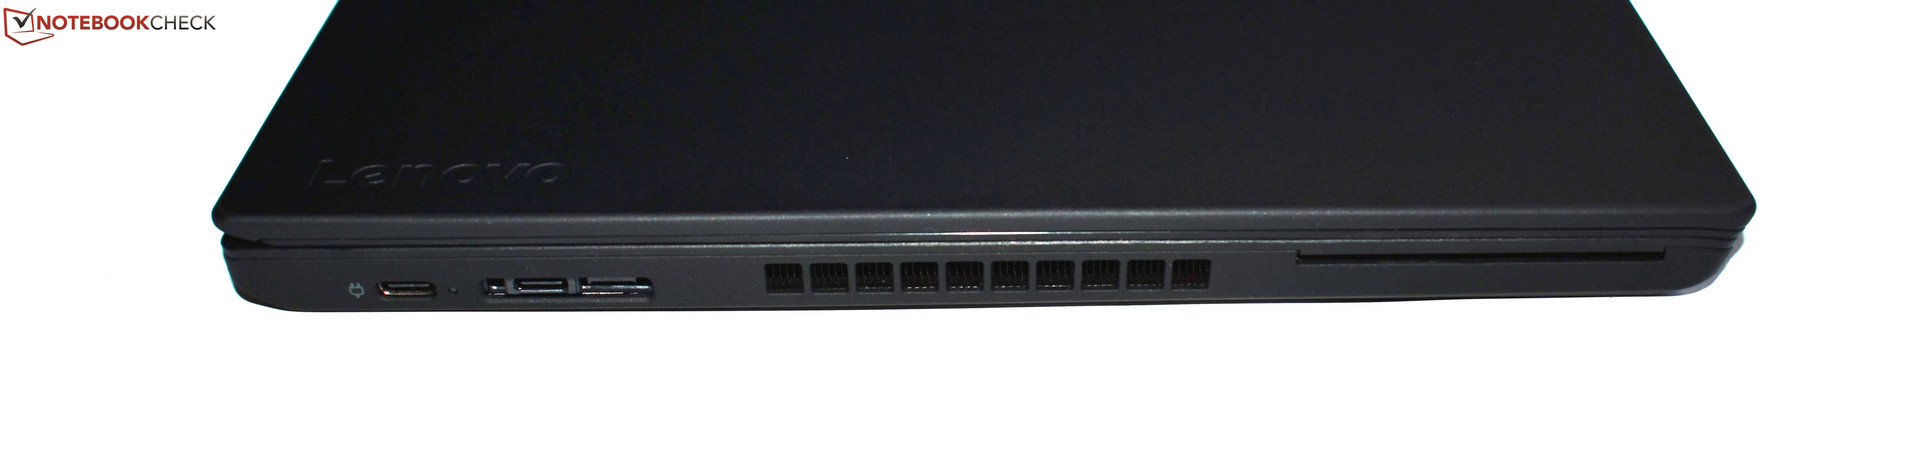
Connections
| SD Card Reader | |
| average JPG Copy Test (av. of 3 runs) | |
| Dell Latitude 5490-TD70X (Toshiba Exceria Pro SDXC 64 GB UHS-II) | |
| Lenovo ThinkPad T480-20L6S01V00 (Toshiba Exceria Pro SDXC 64 GB UHS-II) | |
| Lenovo ThinkPad A485-20MU000CGE (Toshiba Exceria Pro SDXC 64 GB UHS-II) | |
| Average of class Office (19.8 - 198.5, n=22, last 2 years) | |
| maximum AS SSD Seq Read Test (1GB) | |
| Dell Latitude 5490-TD70X (Toshiba Exceria Pro SDXC 64 GB UHS-II) | |
| Lenovo ThinkPad T480-20L6S01V00 (Toshiba Exceria Pro SDXC 64 GB UHS-II) | |
| Lenovo ThinkPad A485-20MU000CGE (Toshiba Exceria Pro SDXC 64 GB UHS-II) | |
| Average of class Office (27.4 - 249, n=21, last 2 years) | |
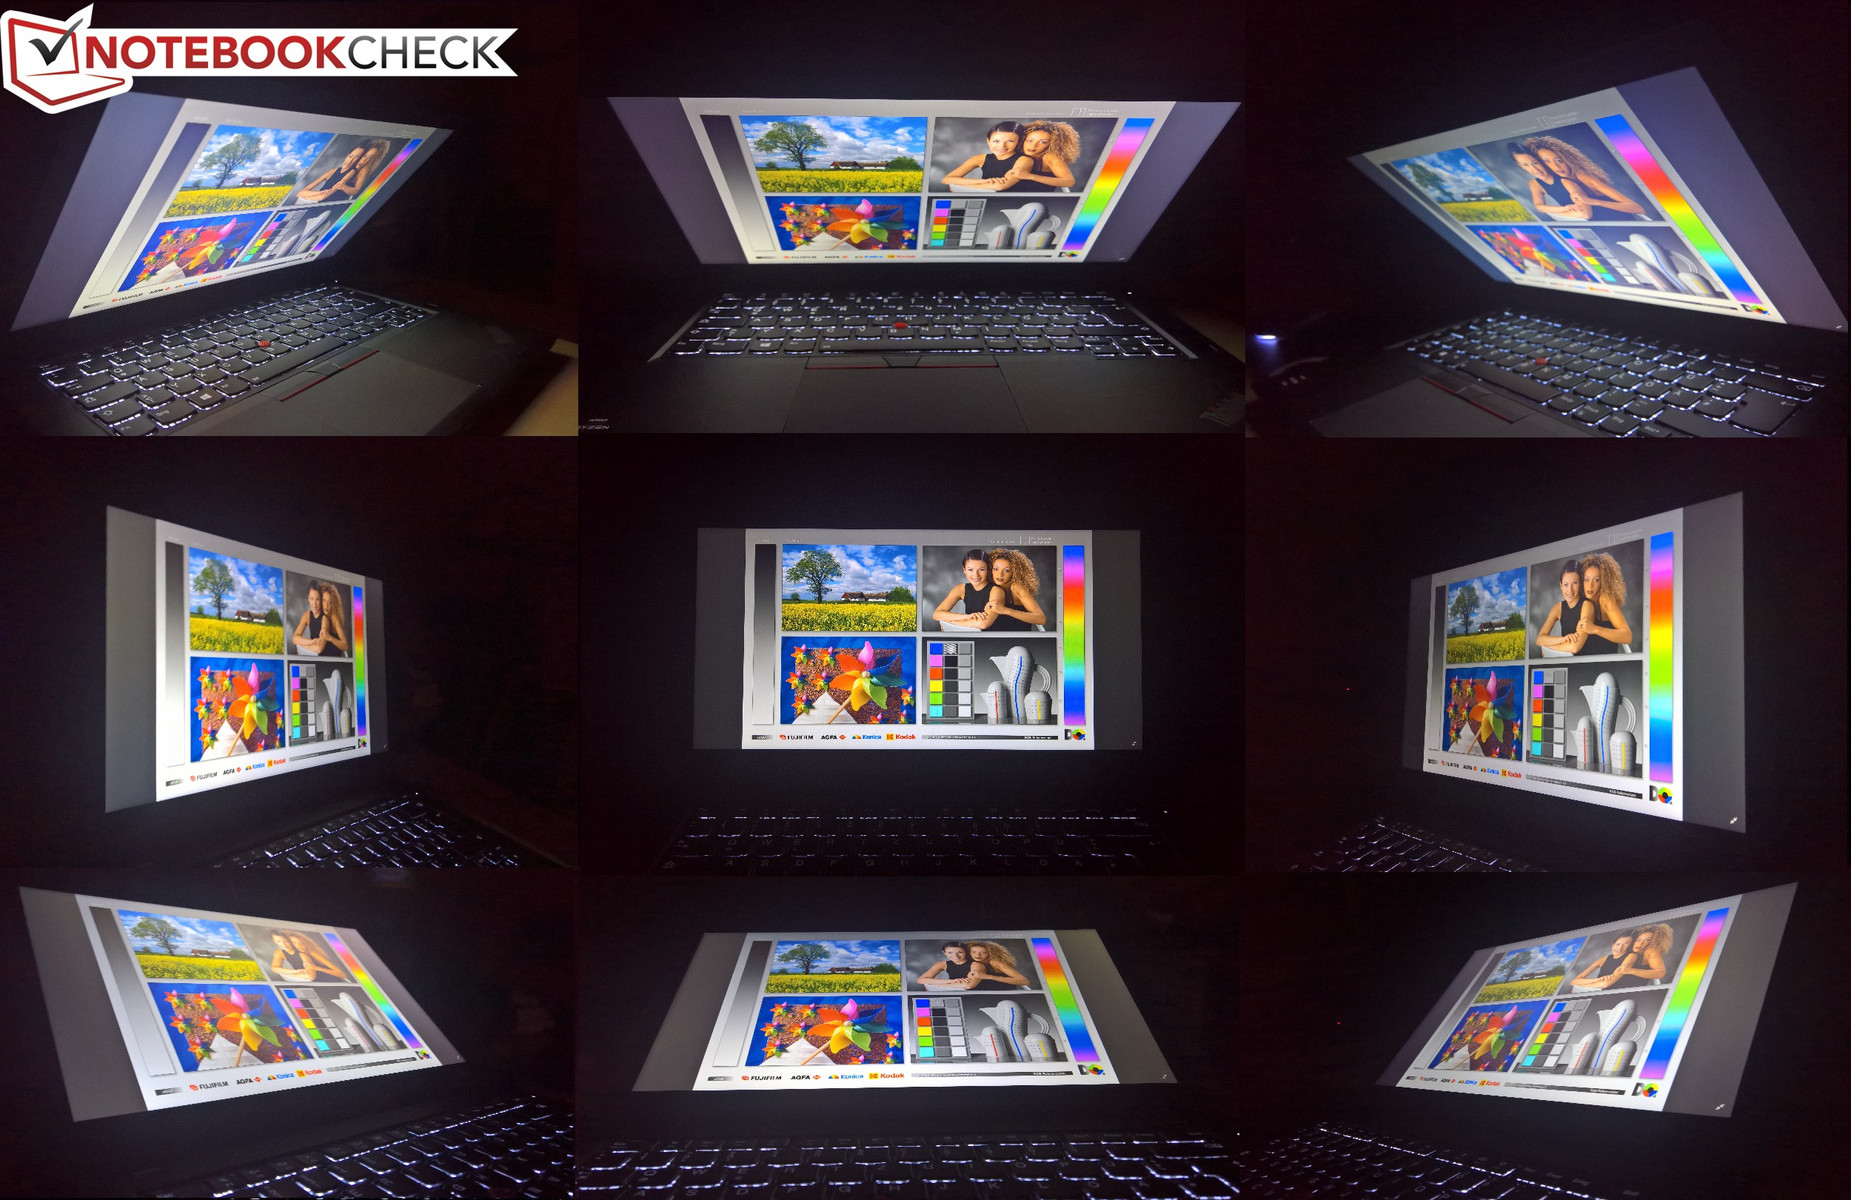
Display
The number of display options for the Lenovo A485 AMD ThinkPad is less than with the ThinkPad T480 Intel model. Instead of four, there are only three different displays. The QHD IPS display (2560x1440), the best display option in the T480, is not offered for the A485. Instead, you have the choice between an HD TN panel (1366x768), which you should definitely avoid, a Full HD IPS display (1920x1080) with touch, and a Full HD IPS screen without touch. All the offered displays are matte.
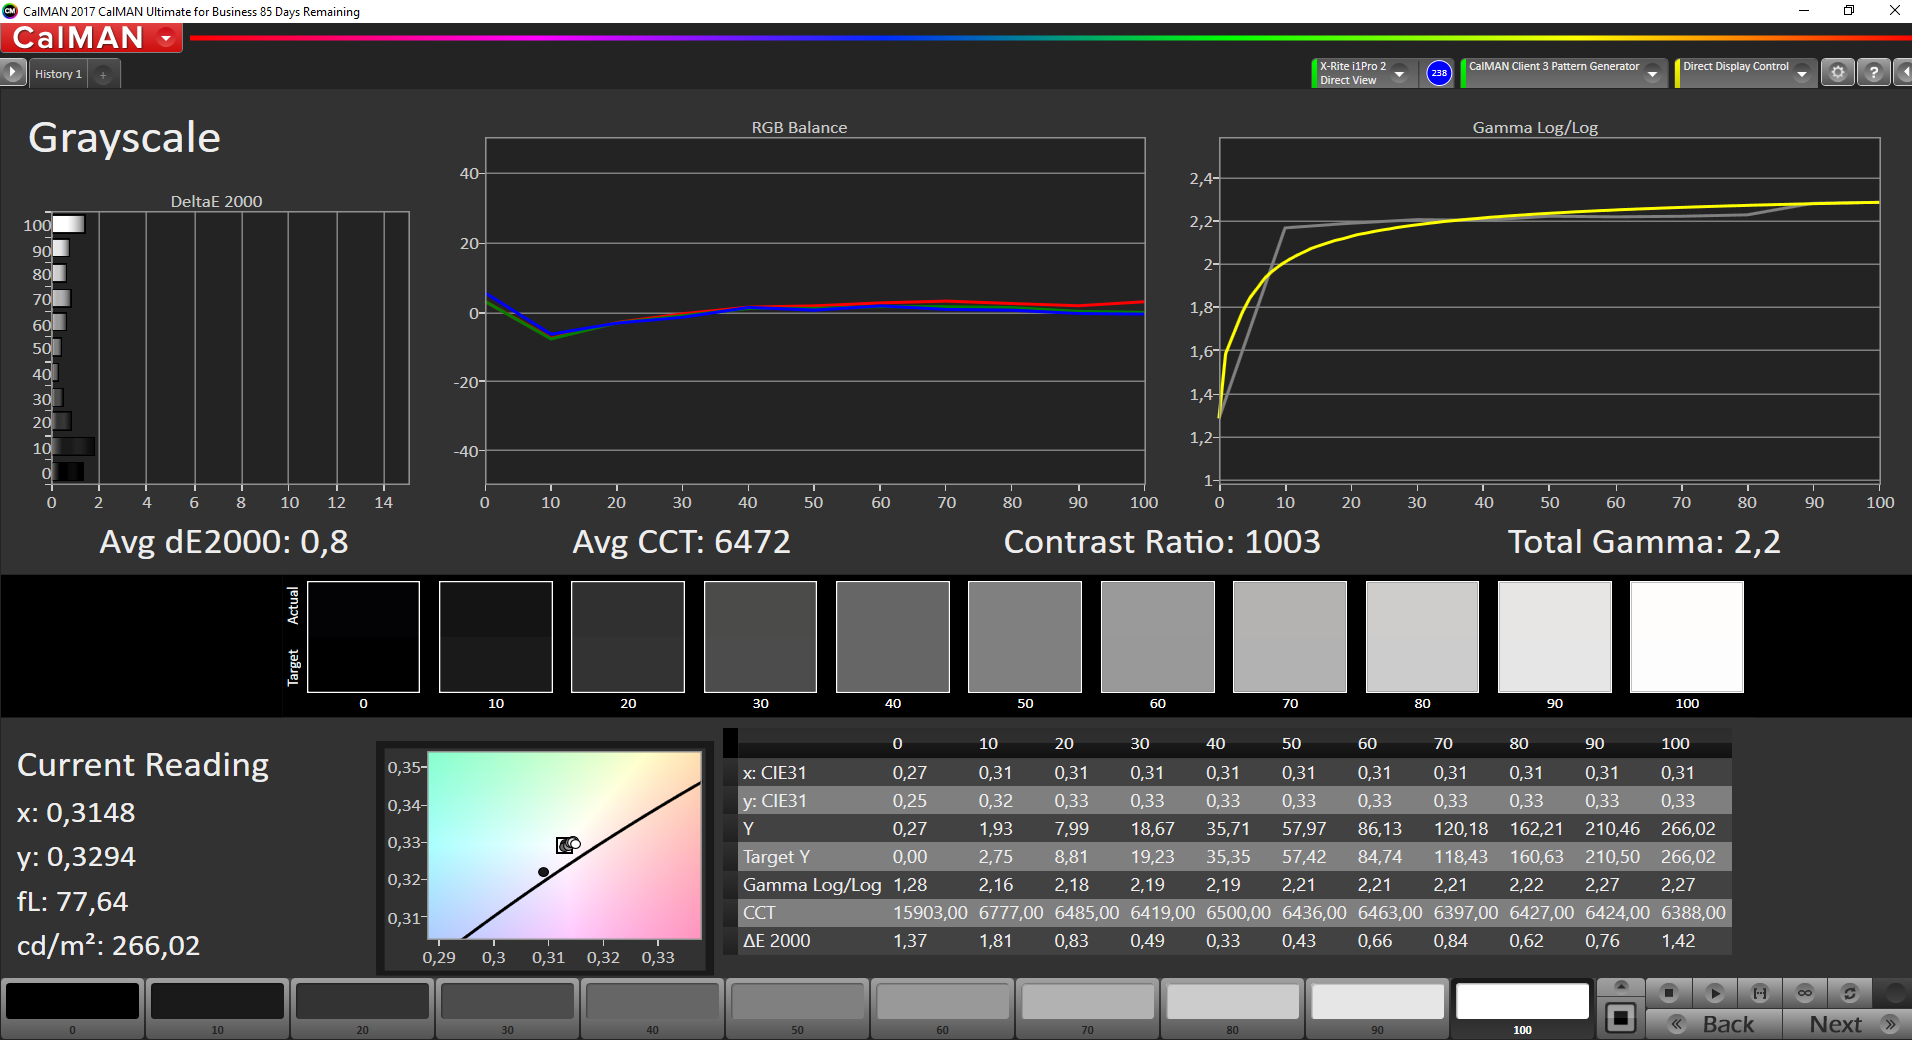
Our test unit has the Full HD IPS panel without touch. According to Lenovo, it should achieve a brightness of 250 cd/m², but according to our measurements it surpassed this value with an average of 271 cd/m². This makes this display significantly brighter than the very dark Full HD IPS LCD in the Dell Latitude 5490. On the other hand, the HP EliteBook 745 G5 clearly surpasses all the competitors, offering a display brightness of almost 400 cd/m². So in this regard the A485 places between the competitors, but it is unfortunate that Lenovo does not offer the brighter QHD display.
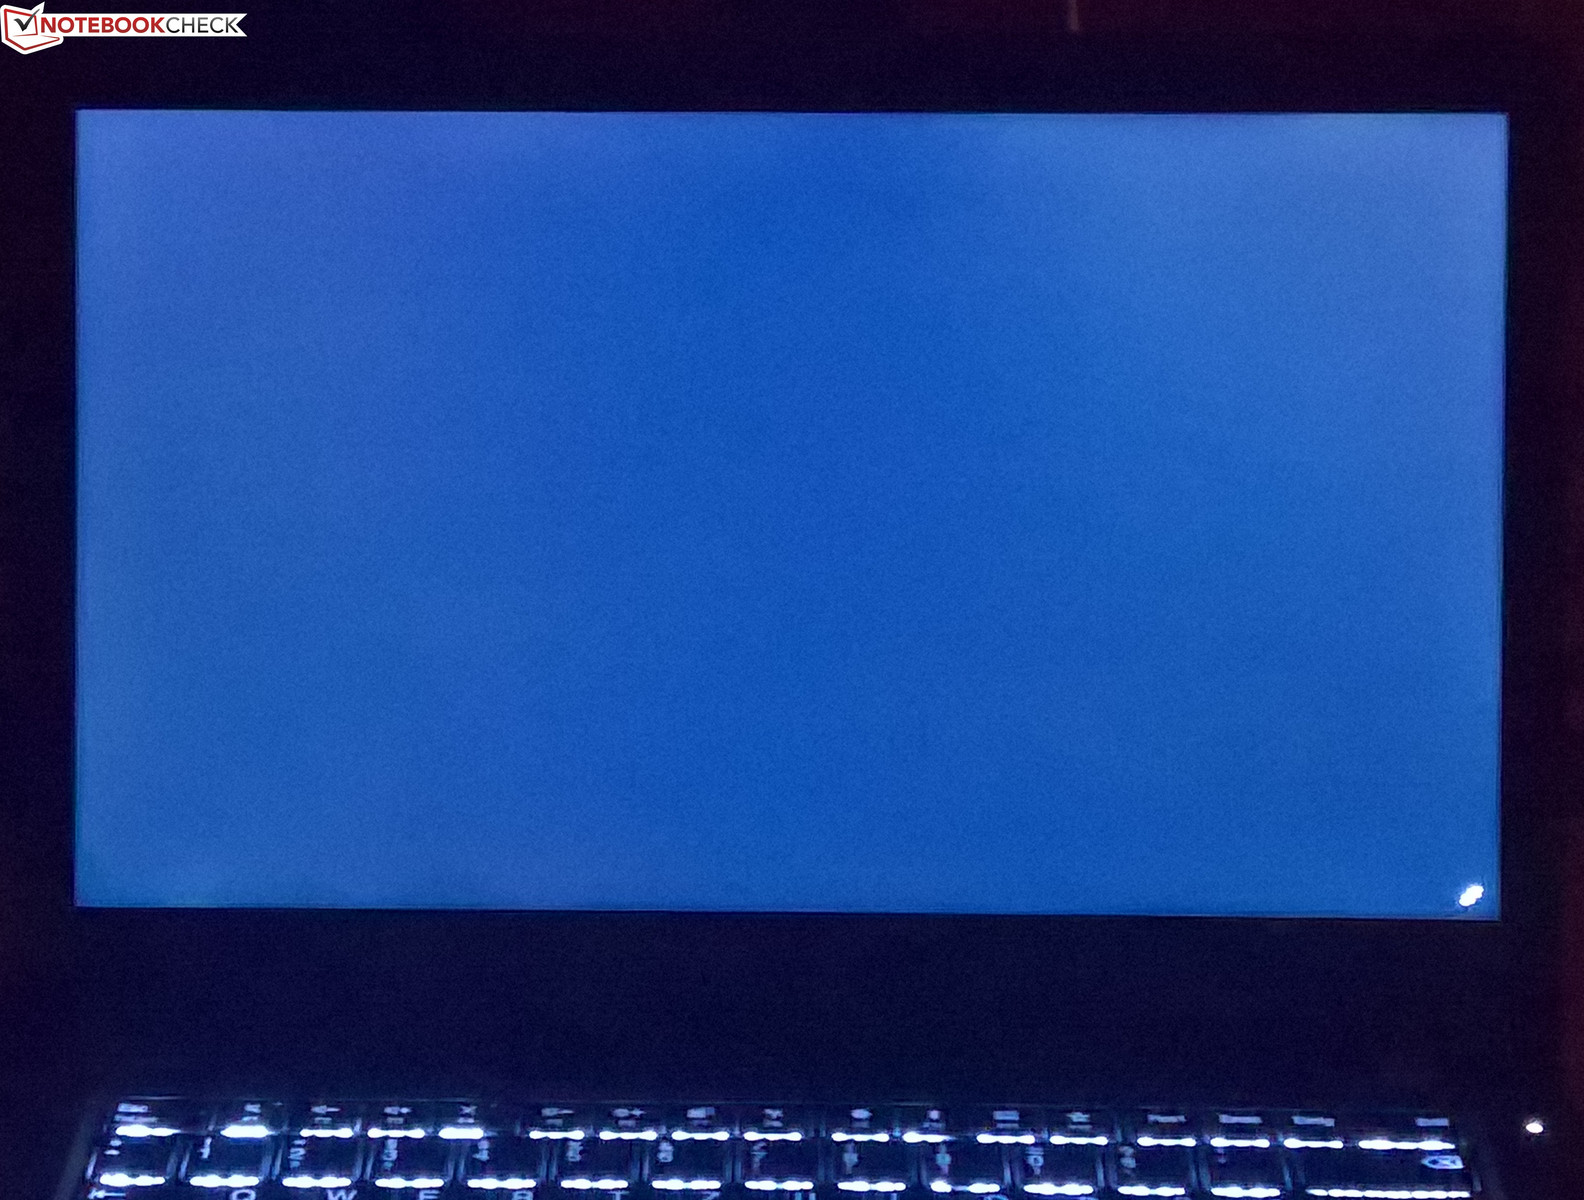
The built-in panel with the model number NV140FHM-N46 from the manufacturer BOE hardly shows any backlight bleeding, and at 85% the brightness distribution is sufficiently good. Unfortunately, we noticed some PWM, but at 1000 Hz its frequency is high enough to not give any problems to most users.
| |||||||||||||||||||||||||
Brightness Distribution: 85 %
Center on Battery: 273 cd/m²
Contrast: 1058:1 (Black: 0.26 cd/m²)
ΔE ColorChecker Calman: 5.9 | ∀{0.5-29.43 Ø4.72}
calibrated: 4.9
ΔE Greyscale Calman: 3.6 | ∀{0.09-98 Ø4.97}
59.6% sRGB (Argyll 1.6.3 3D)
38.1% AdobeRGB 1998 (Argyll 1.6.3 3D)
41.57% AdobeRGB 1998 (Argyll 3D)
60% sRGB (Argyll 3D)
40.24% Display P3 (Argyll 3D)
Gamma: 2.36
CCT: 6798 K
| Lenovo ThinkPad A485-20MU000CGE NV140FHM-N46, , 1920x1080, 14" | Lenovo ThinkPad T480-20L6S01V00 Lenovo LP140WF6-SPB7, , 1920x1080, 14" | Dell Latitude 5490-TD70X AU Optronics AUO263D, , 1920x1080, 14" | HP EliteBook 745 G5 3UN74EA AUO383D, , 1920x1080, 14" | Lenovo ThinkPad T480s-20L8S02D00 LP140QH2-SPB1, , 2560x1440, 14" | |
|---|---|---|---|---|---|
| Display | -2% | -10% | 49% | 74% | |
| Display P3 Coverage (%) | 40.24 | 39.24 -2% | 36.28 -10% | 61.3 52% | 72.8 81% |
| sRGB Coverage (%) | 60 | 58.8 -2% | 54.6 -9% | 87.6 46% | 97.9 63% |
| AdobeRGB 1998 Coverage (%) | 41.57 | 40.56 -2% | 37.48 -10% | 62.3 50% | 74.1 78% |
| Response Times | 26% | 3% | 26% | 17% | |
| Response Time Grey 50% / Grey 80% * (ms) | 44.8 ? | 35.6 ? 21% | 46.9 ? -5% | 35 ? 22% | 38.4 ? 14% |
| Response Time Black / White * (ms) | 35.2 ? | 24.8 ? 30% | 31.2 ? 11% | 25 ? 29% | 28.4 ? 19% |
| PWM Frequency (Hz) | 1000 ? | ||||
| Screen | 4% | 1% | 35% | 16% | |
| Brightness middle (cd/m²) | 275 | 307 12% | 227 -17% | 421 53% | 352 28% |
| Brightness (cd/m²) | 272 | 295 8% | 211 -22% | 398 46% | 343 26% |
| Brightness Distribution (%) | 85 | 90 6% | 88 4% | 86 1% | 91 7% |
| Black Level * (cd/m²) | 0.26 | 0.25 4% | 0.19 27% | 0.27 -4% | 0.46 -77% |
| Contrast (:1) | 1058 | 1228 16% | 1195 13% | 1559 47% | 765 -28% |
| Colorchecker dE 2000 * | 5.9 | 5.7 3% | 5.6 5% | 4.08 31% | 3.3 44% |
| Colorchecker dE 2000 max. * | 20 | 21.3 -7% | 22.4 -12% | 7.48 63% | 7.3 63% |
| Colorchecker dE 2000 calibrated * | 4.9 | 4.7 4% | |||
| Greyscale dE 2000 * | 3.6 | 3.7 -3% | 2.4 33% | 2.92 19% | 5.3 -47% |
| Gamma | 2.36 93% | 2.11 104% | 2.44 90% | 2.32 95% | 2.22 99% |
| CCT | 6798 96% | 7353 88% | 6506 100% | 7043 92% | 6452 101% |
| Color Space (Percent of AdobeRGB 1998) (%) | 38.1 | 37.4 -2% | 34.5 -9% | 57 50% | 68.4 80% |
| Color Space (Percent of sRGB) (%) | 59.6 | 58.7 -2% | 54.4 -9% | 87 46% | 98 64% |
| Total Average (Program / Settings) | 9% /
5% | -2% /
-1% | 37% /
37% | 36% /
28% |
* ... smaller is better
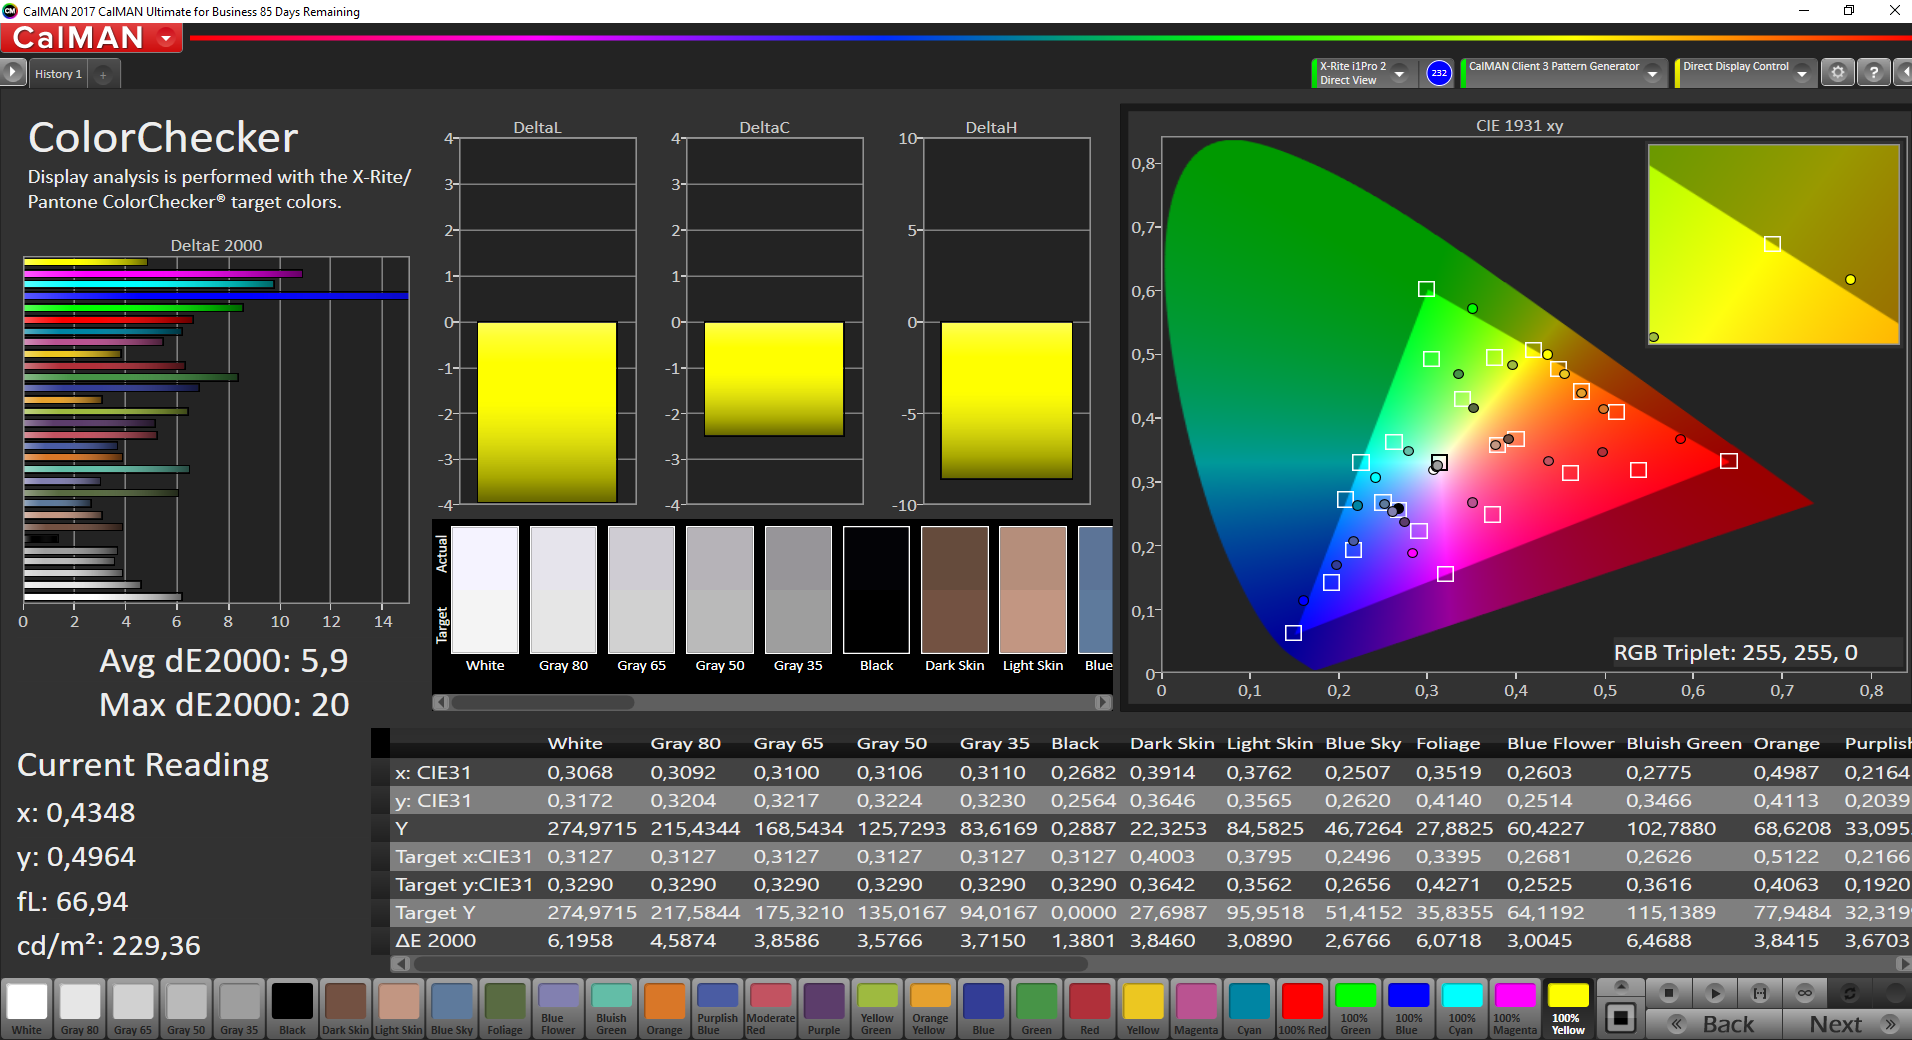
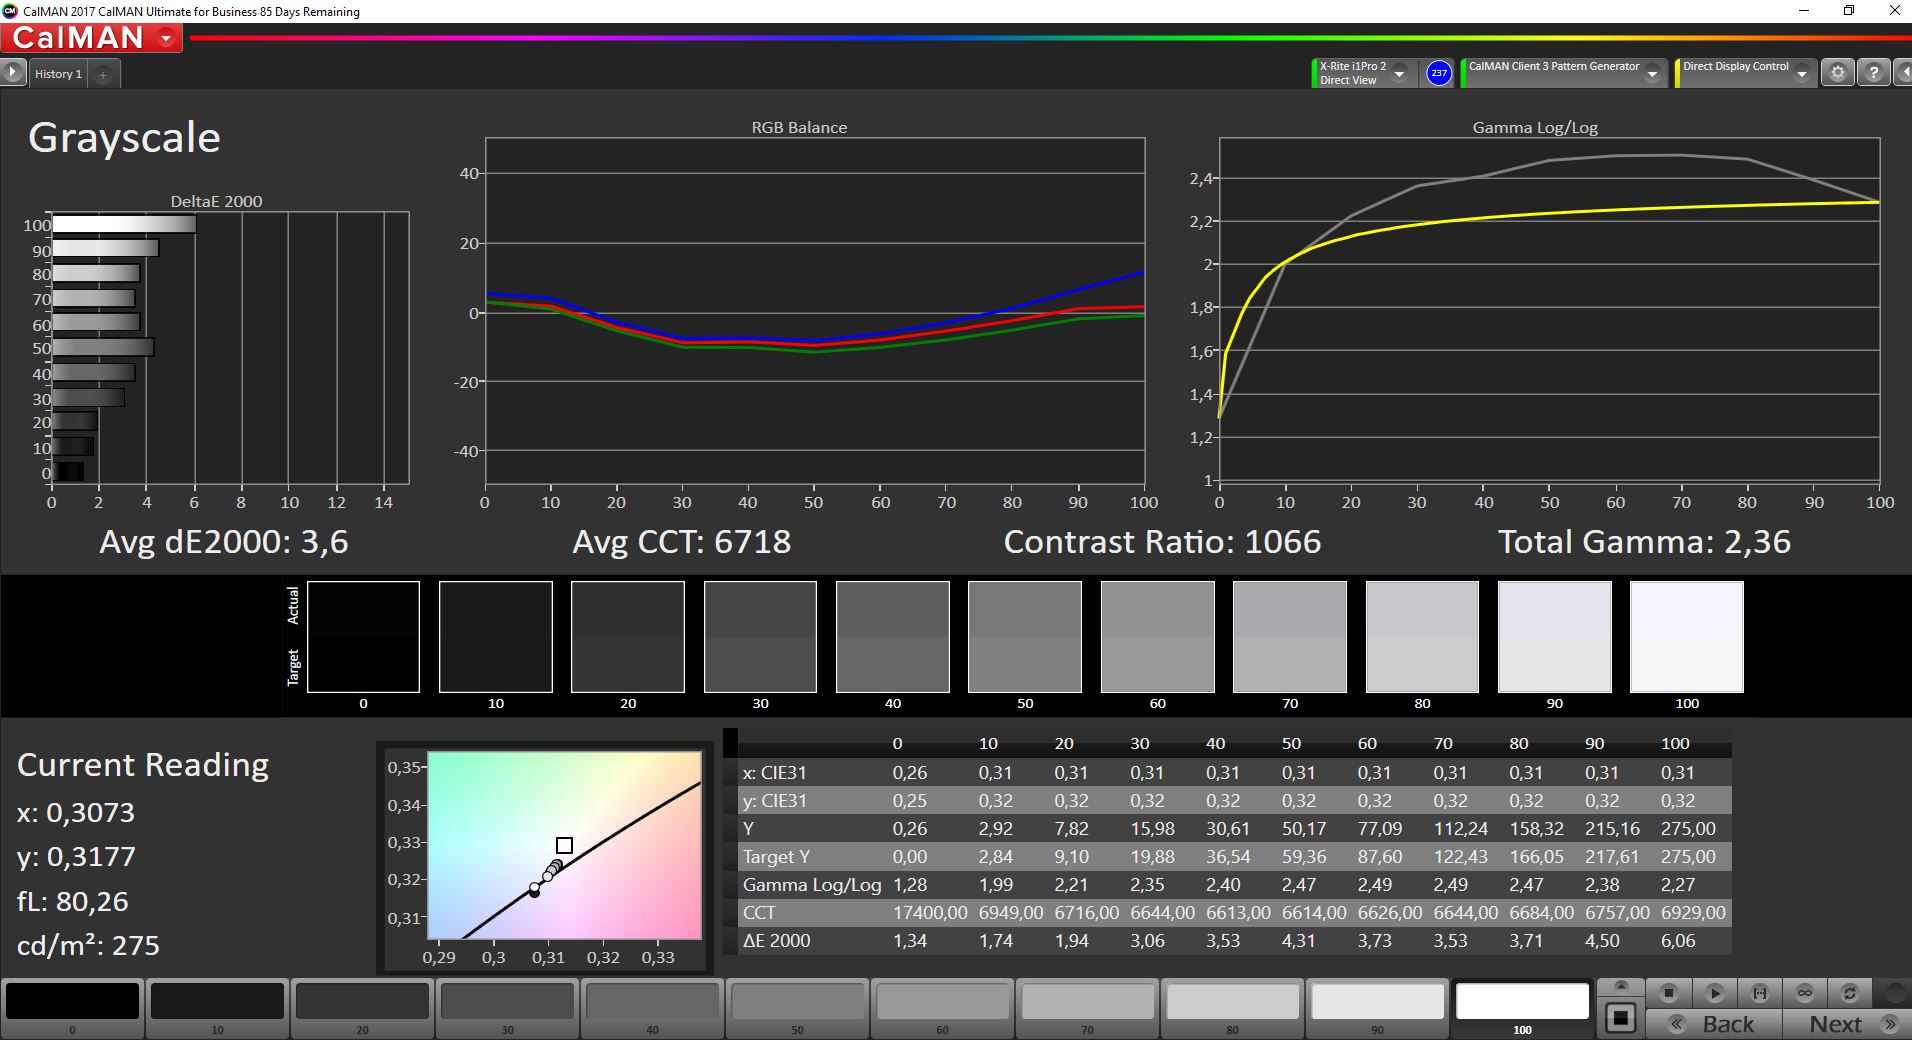
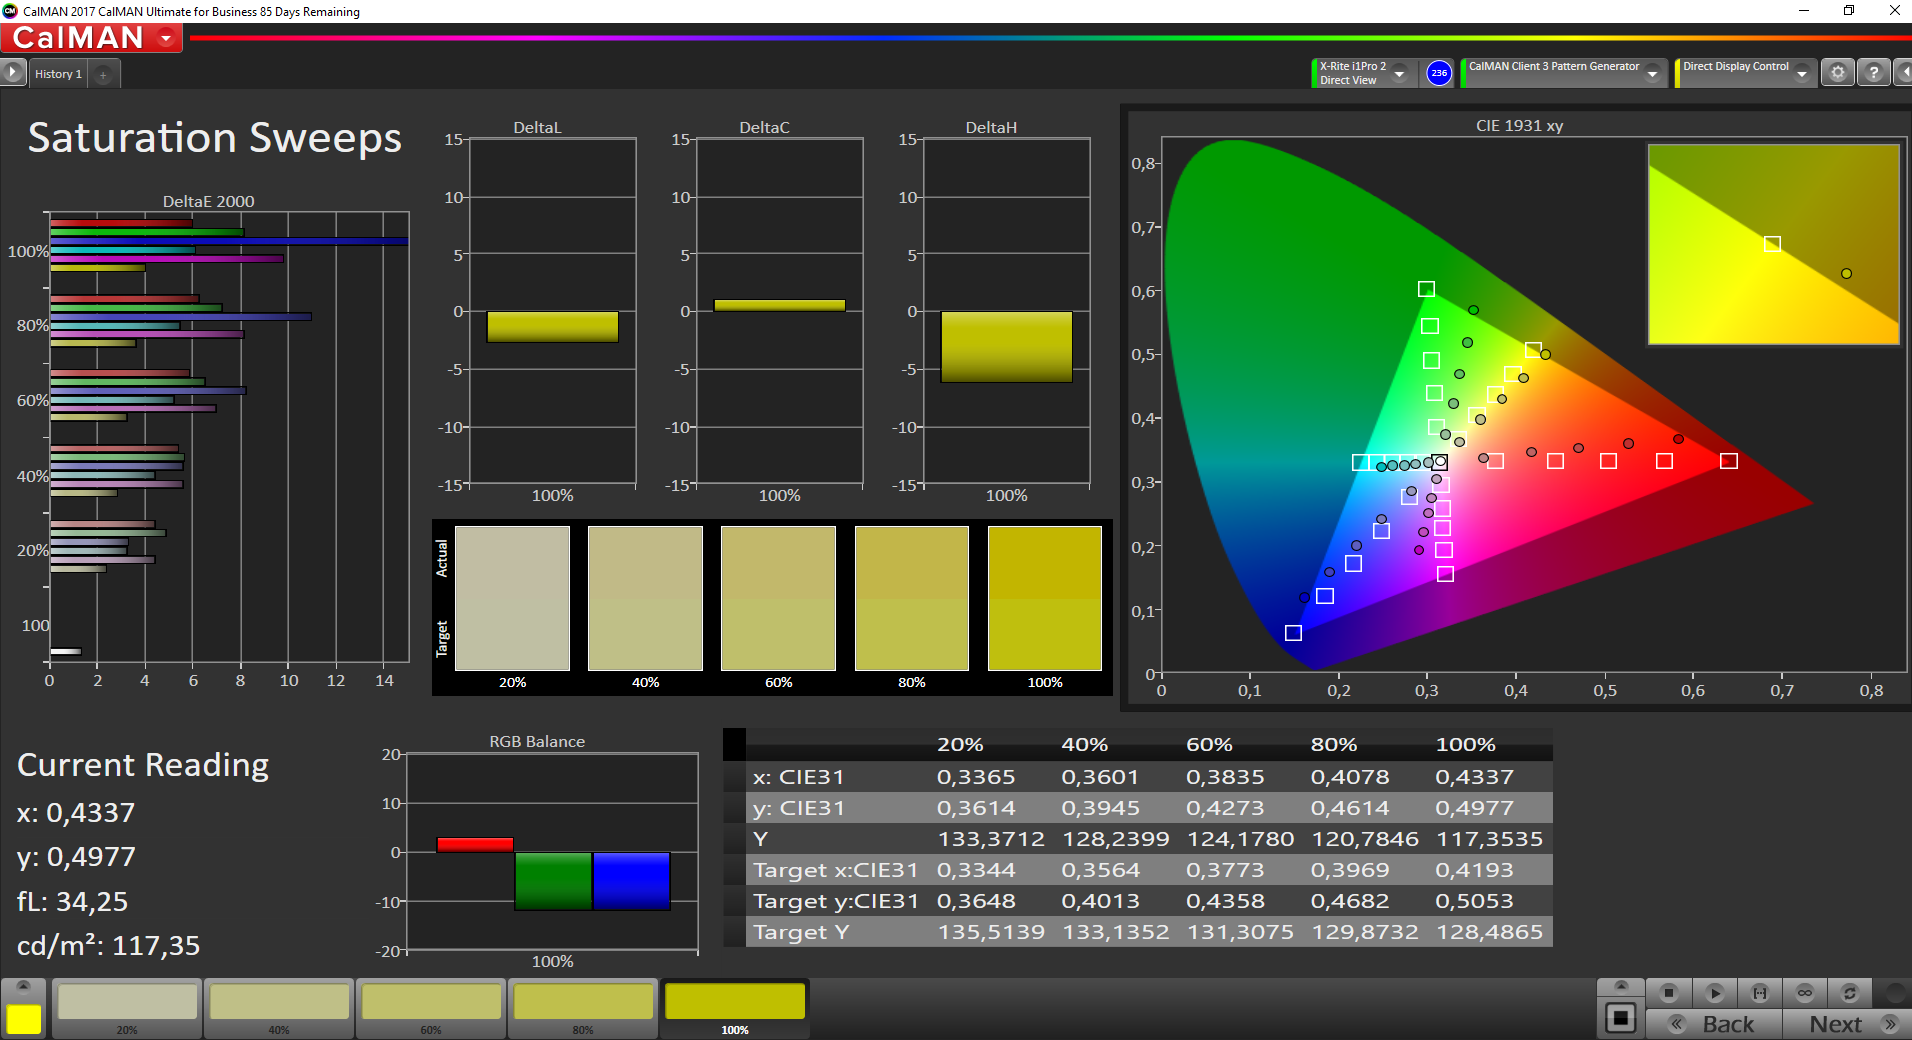
At 1058:1, the contrast is within a suitably good range. The competitors turn out similarly good, and only the HP EliteBook 745 G5 is clearly better with more than 1500:1. In its original settings, the display of the ThinkPad A485 struggles with some color deviations, although that can be corrected to a large extent via calibration. As always, we offer the corresponding color profile for this.
The color-space coverage is probably the area where the lack of the QHD option hurts most, since the LCD built-in here is only able to cover 59% of the sRGB color space. This is not sufficient for any kind of image-processing, particularly since the missing percentage values also result in some pale colors overall. In this area, the Full HD display of the EliteBook 745 G5 is again significantly better. However, the QHD display that Lenovo has built into the T480 and T480s and has kept from the A485 is even better than that.
The outdoor suitability of the display can only be judged as barely suitable. While the matte surface and display brightness of 200 cd/m² basically enable outdoor usage, this is not really sufficient to be comfortable. The LCD is barely bright enough for using it in the shade.
Display Response Times
| ↔ Response Time Black to White | ||
|---|---|---|
| 35.2 ms ... rise ↗ and fall ↘ combined | ↗ 19.6 ms rise | 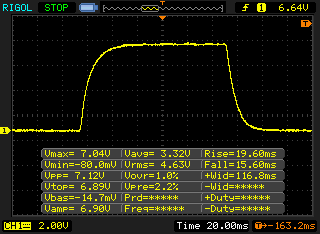 |
| ↘ 15.6 ms fall | ||
| The screen shows slow response rates in our tests and will be unsatisfactory for gamers. In comparison, all tested devices range from 0.1 (minimum) to 240 (maximum) ms. » 93 % of all devices are better. This means that the measured response time is worse than the average of all tested devices (19.8 ms). | ||
| ↔ Response Time 50% Grey to 80% Grey | ||
| 44.8 ms ... rise ↗ and fall ↘ combined | ↗ 22.8 ms rise | 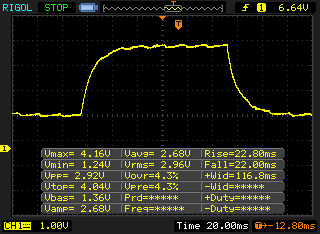 |
| ↘ 22 ms fall | ||
| The screen shows slow response rates in our tests and will be unsatisfactory for gamers. In comparison, all tested devices range from 0.165 (minimum) to 636 (maximum) ms. » 76 % of all devices are better. This means that the measured response time is worse than the average of all tested devices (31 ms). | ||
Screen Flickering / PWM (Pulse-Width Modulation)
| Screen flickering / PWM detected | 1000 Hz | ≤ 99 % brightness setting | 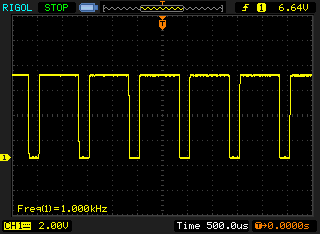 |
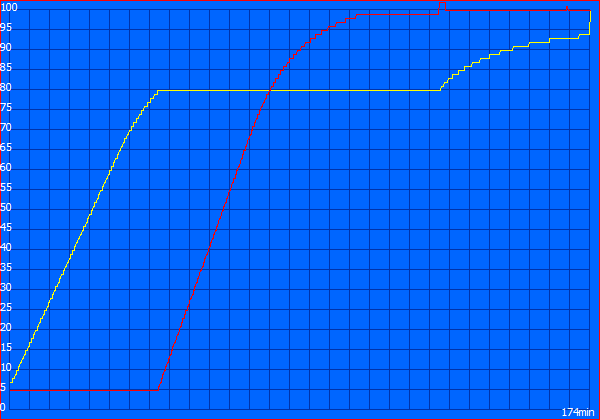
The display backlight flickers at 1000 Hz (worst case, e.g., utilizing PWM) Flickering detected at a brightness setting of 99 % and below. There should be no flickering or PWM above this brightness setting. The frequency of 1000 Hz is quite high, so most users sensitive to PWM should not notice any flickering. In comparison: 52 % of all tested devices do not use PWM to dim the display. If PWM was detected, an average of 7747 (minimum: 5 - maximum: 343500) Hz was measured. | |||
Since this is an IPS display, the viewing-angle stability is very good. Although the IPS glow effect is present, it is not very pronounced.
Performance
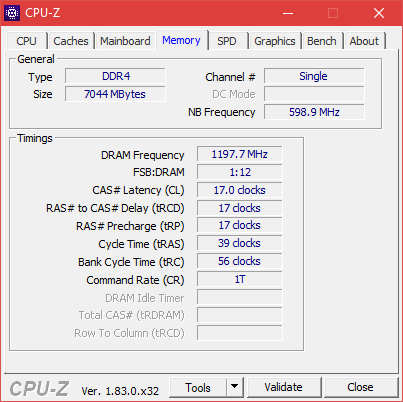
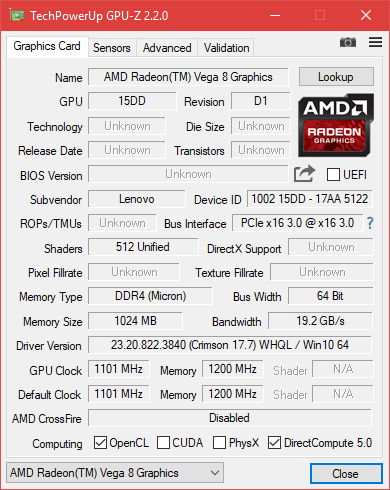
In the German market, Lenovo currently only sells a single model of the ThinkPad A485, which is also the one that we are testing. It is equipped with the AMD Ryzen 5 Pro 2500U, the AMD Radeon RX Vega 8 integrated GPU, an 8 GB DDR4 RAM module (one of two slots occupied, 32 GB max.), as well as the Full HD IPS display and a 256-GB SSD. If you want to purchase the A485 with different components, you have to get it from Lenovo's own shop. The configurator offers additional CPU options such as the AMD Ryzen 3 2300U and the Ryzen 7 Pro 2700U, more working memory and SSD storage, and there are also additional display options (starting at $830 in the US).
Processor
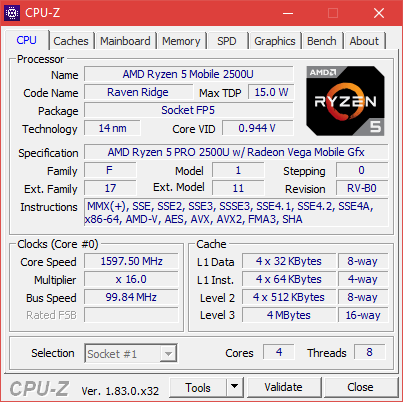
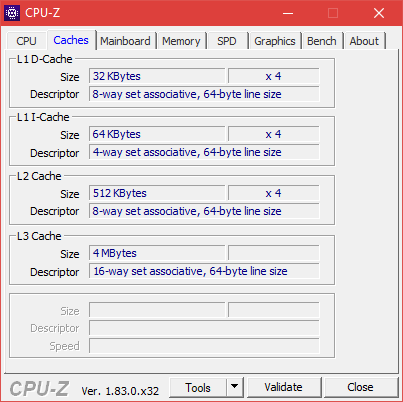
The AMD Ryzen 5 Pro 2500U is a quad-core processor with a TDP of 15 watts. Its four "Zen" cores run at a maximum speed of 3.6 GHz, with a basic clock speed of 2 GHz. You can find comparisons with other processors in our CPU benchmark list.
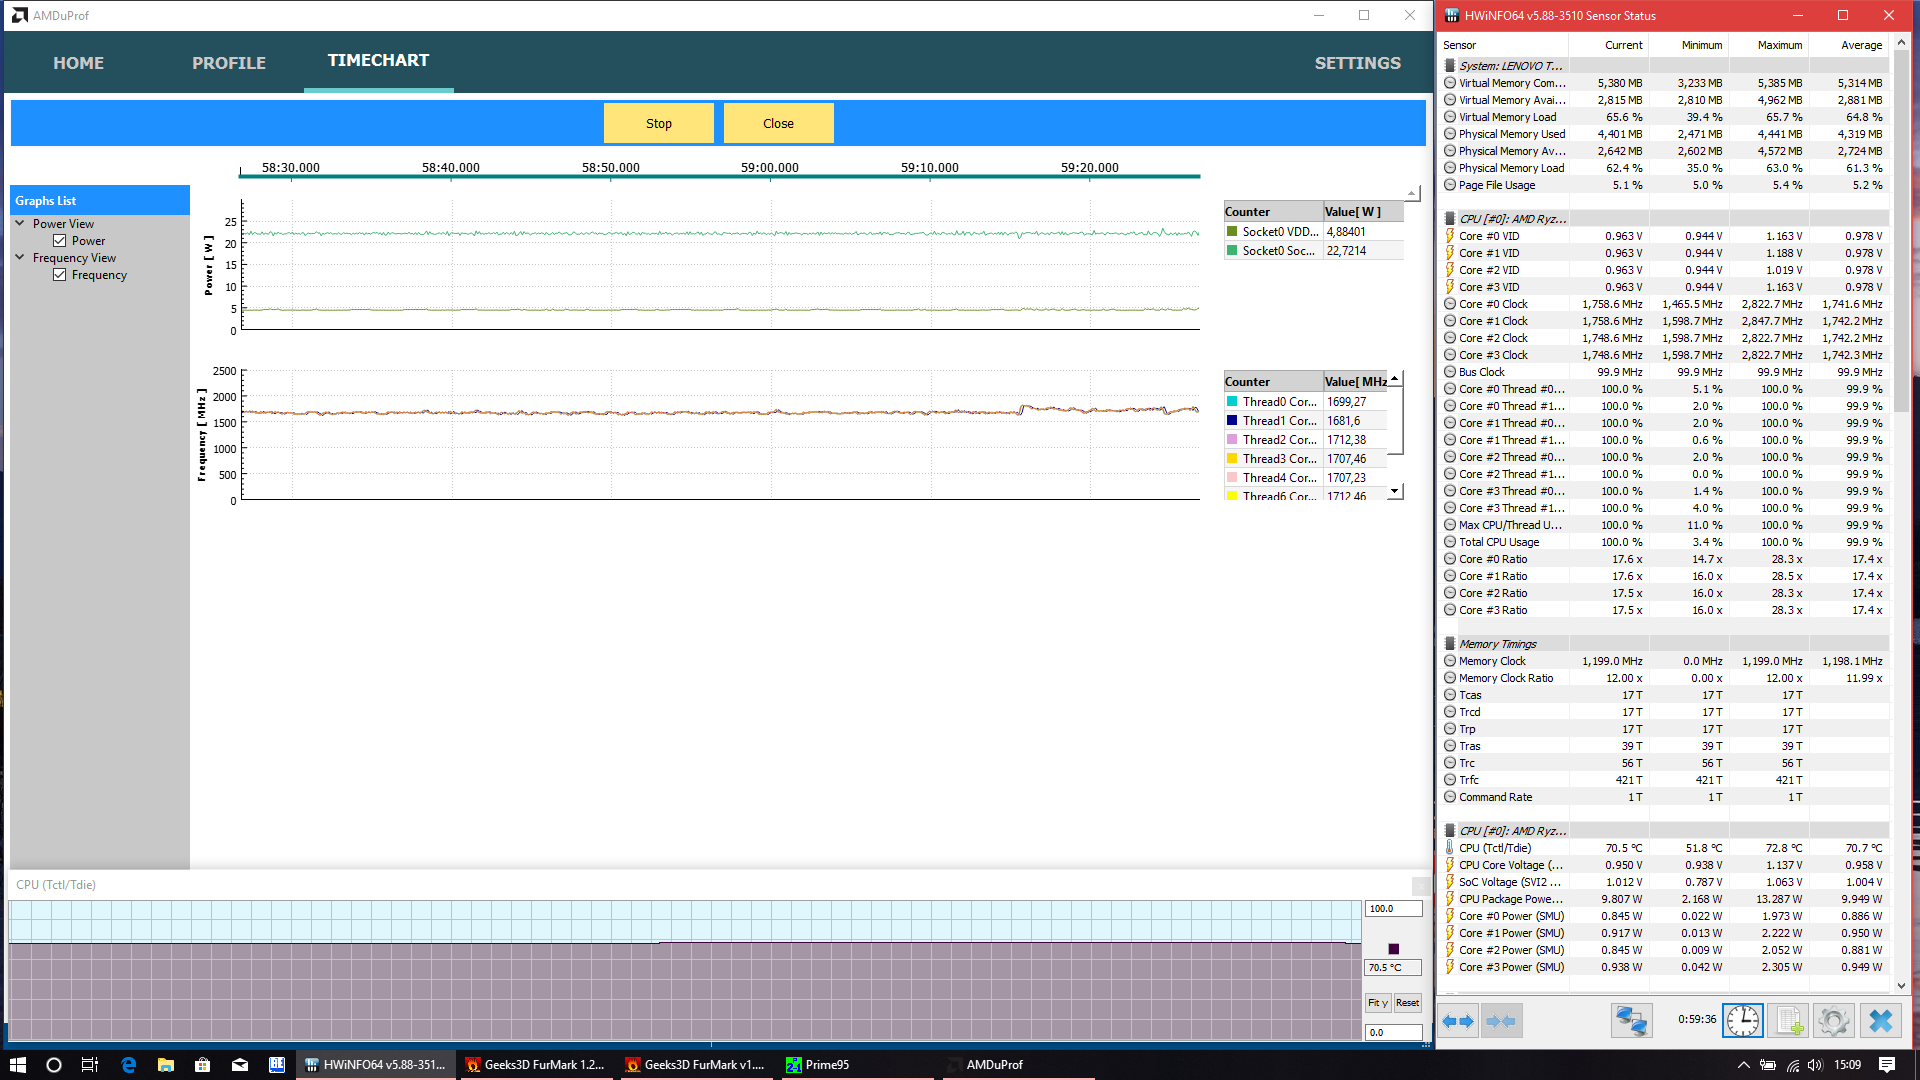
During the Cinebench multicore test, the CPU speed of the Lenovo ThinkPad A485 reaches a maximum of 2.8 GHz, so the CPU is not able to use its full potential. Lenovo allows the processor to use a maximum of 32 watts, but only for a short time. In the Cinebench loop, the CPU achieves relatively high results in the first three iterations of the test. After that, the TDP varies between 8 and 32 watts, so that the CPU runs at 400 MHz for short periods of time. The clock speed varies considerably.
Overall, the performance offered by the AMD ThinkPad A485 is disappointing. The corresponding Intel ThinkPad T480 achieves a significantly higher CPU performance under constant load as well. Of course, this device has the Intel Core i7-8550U, but even in a ThinkPad A485 with the AMD Ryzen 7 Pro 2700U the distance to the Intel model might still be considerable.
The CPU performance is not reduced in battery operation.
Update UEFI version 1.02: Even though the CPU performance overall continues to be far from that of the ThinkPad T480, with the newer UEFI firmware, the ThinkPad A485 is able to maintain its CPU performance a little better than before, at least under constant load. The Cinebench score now levels out at almost 500 points, whereas it was significantly lower under constant load before.
System Performance
In the PCMark benchmarks that simulate daily tasks, the Lenovo ThinkPad A485 only achieves one of the lower places in our comparison. However, this is not really worrisome. For one, the distance to the HP EliteBook 745 G5 is not really large, and then also the system performance is fine and inconspicuous in everyday operation.
| PCMark 8 Home Score Accelerated v2 | 2937 points | |
| PCMark 8 Work Score Accelerated v2 | 4123 points | |
| PCMark 10 Score | 2673 points | |
Help | ||
Storage Solution
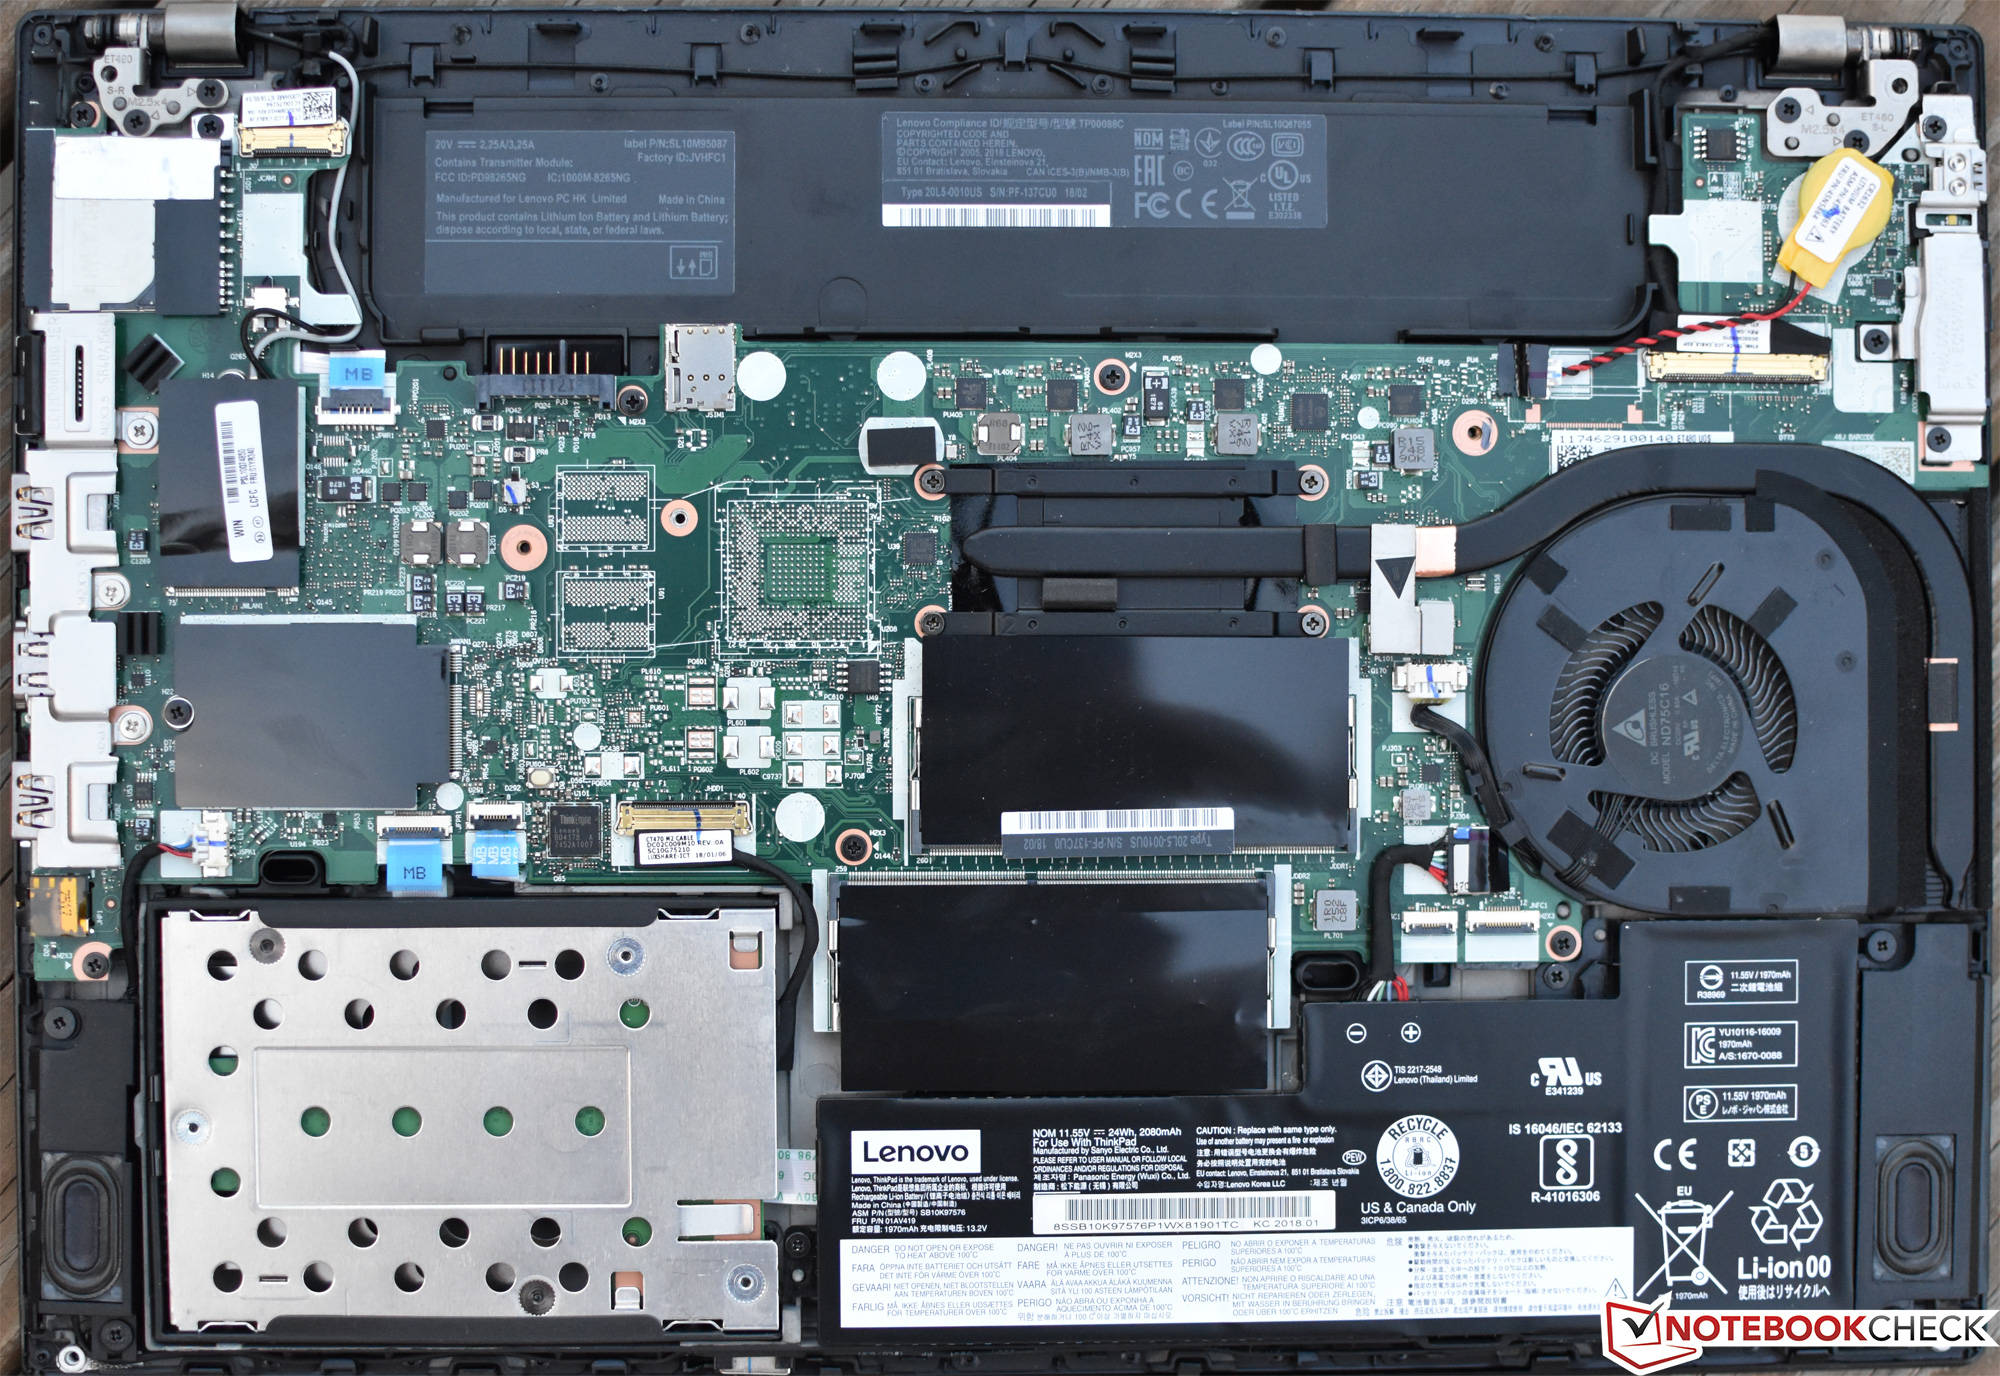
The Lenovo ThinkPad A485 is equipped with a Samsung PM981 with a 256-GB capacity. This is a very fast PCIe NVMe SSD, even though its full potential cannot be used in the ThinkPad. The reason for this is Lenovo's particular storage solution that is used in some of the current ThinkPads such as the T480, T580, and A485, where either a classical 2.5-inch hard drive or a 2280-M.2-SSD serves as the storage. In a model without an HDD such as our current test unit, the SSD sits in an adapter inside the 2.5-inch slot that is connected with the same connector as the hard drive. This causes the performance to be limited to PCIe-3.0-x2 speeds. However, you should almost never notice this limitation during everyday usage.
| Lenovo ThinkPad A485-20MU000CGE Samsung SSD PM981 MZVLB256HAHQ | HP EliteBook 745 G5 3UN74EA Toshiba XG5 KXG50ZNV256G | Lenovo ThinkPad T480s-20L8S02D00 Samsung SSD PM981 MZVLB512HAJQ | Dell Latitude 5490-TD70X Toshiba KSG60ZMV512G | Lenovo ThinkPad T480-20L6S01V00 Samsung SSD PM981 MZVLB512HAJQ | Average Samsung SSD PM981 MZVLB256HAHQ | |
|---|---|---|---|---|---|---|
| CrystalDiskMark 3.0 | -19% | 43% | -30% | -2% | 20% | |
| Read Seq (MB/s) | 1193 | 1549 30% | 1540 29% | 465.1 -61% | 922 -23% | 1837 ? 54% |
| Write Seq (MB/s) | 1280 | 269.7 -79% | 1613 26% | 425 -67% | 928 -27% | 1402 ? 10% |
| Read 512 (MB/s) | 765 | 823 8% | 835 9% | 410.1 -46% | 561 -27% | 860 ? 12% |
| Write 512 (MB/s) | 1169 | 298.1 -74% | 1716 47% | 360.7 -69% | 567 -51% | 1038 ? -11% |
| Read 4k (MB/s) | 52.2 | 24.9 -52% | 66.9 28% | 27.34 -48% | 64.4 23% | 47.2 ? -10% |
| Write 4k (MB/s) | 89.7 | 97.1 8% | 160.6 79% | 89 -1% | 108 20% | 103 ? 15% |
| Read 4k QD32 (MB/s) | 286.5 | 310.6 8% | 444.9 55% | 295.6 3% | 383.4 34% | 348 ? 21% |
| Write 4k QD32 (MB/s) | 205.6 | 208.4 1% | 343 67% | 300.2 46% | 271.4 32% | 341 ? 66% |

Graphics Card
The AMD Radeon RX Vega 8 is an integrated GPU that is used in all the laptops with the AMD Ryzen 5 Pro 2500U. It is significantly faster than comparable Intel-iGPU solutions. However, as in all iGPU solutions, its performance is strongly related to the available working memory, since it does not bring its own RAM. In the ThinkPad A485, only one of the two RAM slots is occupied, causing the working memory to operate in single-channel mode. Due to this, the performance of the GPU is significantly lower compared to the HP ProBook 645 G4, which we were able to test with the same GPU and dual-channel RAM.
We did not notice any reduction in the GPU performance in battery operation.
| 3DMark 06 Standard Score | 10336 points | |
| 3DMark 11 Performance | 2875 points | |
| 3DMark Cloud Gate Standard Score | 8192 points | |
| 3DMark Fire Strike Score | 1585 points | |
Help | ||
Gaming Performance
Although the AMD Radeon RX Vega 8 has a significantly higher potential for gaming than the Intel solutions such as the Intel UHD Graphics 620, it cannot really fully use it in the Lenovo ThinkPad A485. The lack of dual-channel RAM limits the performance considerably, but at least you can upgrade it later, as we already mentioned.
The benchmark comparison using Rise of the Tomb Raider clearly shows what could be possible with the Vega 8, since the HP ProBook 645 G4 achieves a 25% higher result with the same CPU/GPU combination and dual-channel RAM. However, the Nvidia GeForce MX150 in the ThinkPad T480 Intel model remains beyond reach in any case. The unofficial Max-Q version of the MX150, which is built into the ThinkPad T480s, is also slightly faster, with the difference between the Max-Q MX150 and the Vega 8 with dual-channel RAM being about the same as between the Vega 8 with single-channel RAM and the Vega 8 with dual-channel RAM.
| Rise of the Tomb Raider - 1024x768 Lowest Preset | |
| Lenovo ThinkPad T480-20L6S01V00 | |
| Lenovo ThinkPad T480s-20L8S02E00 | |
| HP ProBook 645 G4 3UP62EA | |
| Average AMD Radeon RX Vega 8 (Ryzen 2000/3000) (27.7 - 49.3, n=10) | |
| Lenovo ThinkPad A485-20MU000CGE | |
| HP EliteBook 840 G5-3JX66EA | |
| low | med. | high | ultra | |
|---|---|---|---|---|
| The Witcher 3 (2015) | 29.5 | 9.8 | ||
| Rise of the Tomb Raider (2016) | 34.2 | 10.9 | ||
| Civilization 6 (2016) | 43.6 | 11.1 |
Emissions
Noise Emissions
The fan of the ThinkPad A485 works in a very subdued manner, being almost always turned off during idle mode, and if it does turn on, it is very quiet. Under load, the fan is also hardly audible. In comparison, the HP EliteBook 745 G5 is much louder under load, and the fan also runs at higher frequencies.
Unfortunately, we noticed some coil whine in the Lenovo A485. However, this is only audible if you put your ear right next to the keyboard.
Noise level
| Idle |
| 29.3 / 29.3 / 29.6 dB(A) |
| Load |
| 31.6 / 31.6 dB(A) |
 | ||
30 dB silent 40 dB(A) audible 50 dB(A) loud |
||
min: | ||
Temperature
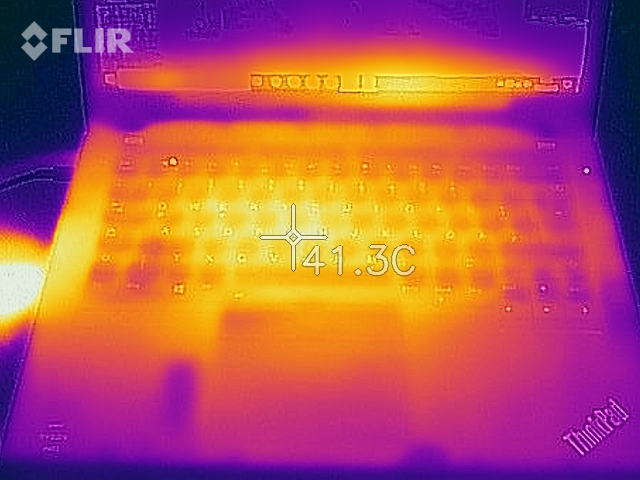
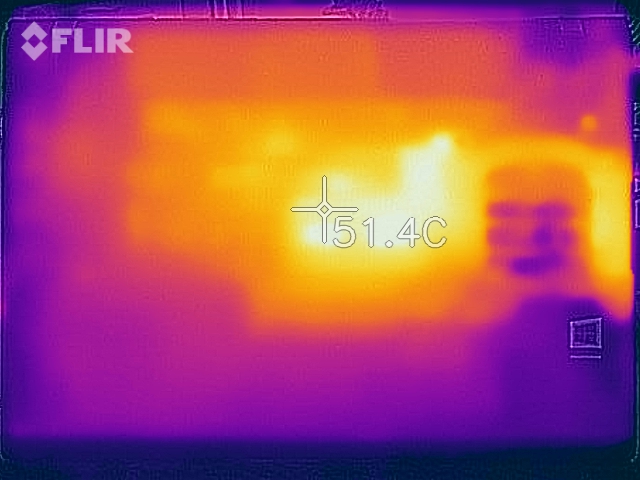
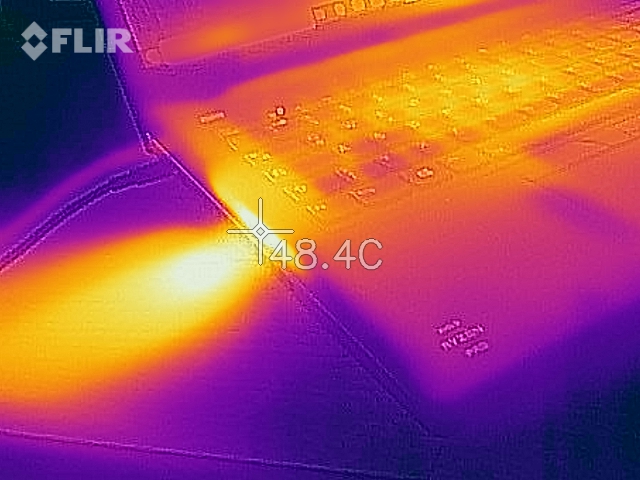
Under load, the temperatures of the ThinkPad A485 exterior remain in a slightly lower range than the ThinkPad T480 with the dGPU, but the difference is not extreme. The A485 reached a maximum temperature of almost 50 °C (122 °F) at the bottom.
During the stress test with Prime95 and FurMark, the CPU and GPU use 25 watts initially. After six minutes, the consumption drops to 22 watts, also causing the CPU clock speed to drop from 2.1 to 1.6 - 1.8 GHz (varying). The fact that the CPU speed dropped below its basic clock speed means that there is TDP-dependent throttling. During the whole test, the temperatures remain within an uncritical range of barely above 70 °C (158 °F).
However, this TDP throttling should not have a negative effect on the everyday performance, since the 3DMark11 benchmark we ran right after the stress test produced normal results.
(+) The maximum temperature on the upper side is 39.1 °C / 102 F, compared to the average of 34.3 °C / 94 F, ranging from 21.2 to 62.5 °C for the class Office.
(-) The bottom heats up to a maximum of 49.9 °C / 122 F, compared to the average of 36.8 °C / 98 F
(+) In idle usage, the average temperature for the upper side is 26.7 °C / 80 F, compared to the device average of 29.5 °C / 85 F.
(+) The palmrests and touchpad are reaching skin temperature as a maximum (32.3 °C / 90.1 F) and are therefore not hot.
(-) The average temperature of the palmrest area of similar devices was 27.5 °C / 81.5 F (-4.8 °C / -8.6 F).
Speakers
The two speakers are located at the bottom of the laptop. Their performance is fairly average for laptop speakers: The sound is neither very loud nor particularly good, and the bass is lacking completely. Instead of the speakers, we recommend using headphones or external speakers, which can be connected via the audio-combo port that works flawlessly.
Lenovo ThinkPad A485-20MU000CGE audio analysis
(±) | speaker loudness is average but good (74.1 dB)
Bass 100 - 315 Hz
(-) | nearly no bass - on average 24.7% lower than median
(±) | linearity of bass is average (11.9% delta to prev. frequency)
Mids 400 - 2000 Hz
(+) | balanced mids - only 2.9% away from median
(±) | linearity of mids is average (7.5% delta to prev. frequency)
Highs 2 - 16 kHz
(+) | balanced highs - only 2.2% away from median
(+) | highs are linear (6.8% delta to prev. frequency)
Overall 100 - 16.000 Hz
(±) | linearity of overall sound is average (23.8% difference to median)
Compared to same class
» 68% of all tested devices in this class were better, 8% similar, 23% worse
» The best had a delta of 7%, average was 21%, worst was 53%
Compared to all devices tested
» 71% of all tested devices were better, 6% similar, 22% worse
» The best had a delta of 4%, average was 23%, worst was 134%
HP EliteBook 745 G5 3UN74EA audio analysis
(-) | not very loud speakers (71.2 dB)
Bass 100 - 315 Hz
(-) | nearly no bass - on average 27.1% lower than median
(±) | linearity of bass is average (10.7% delta to prev. frequency)
Mids 400 - 2000 Hz
(+) | balanced mids - only 2.4% away from median
(±) | linearity of mids is average (8.6% delta to prev. frequency)
Highs 2 - 16 kHz
(+) | balanced highs - only 2.7% away from median
(+) | highs are linear (5.6% delta to prev. frequency)
Overall 100 - 16.000 Hz
(±) | linearity of overall sound is average (20.2% difference to median)
Compared to same class
» 44% of all tested devices in this class were better, 10% similar, 46% worse
» The best had a delta of 7%, average was 21%, worst was 53%
Compared to all devices tested
» 52% of all tested devices were better, 8% similar, 39% worse
» The best had a delta of 4%, average was 23%, worst was 134%
Power Management
Power Consumption
Until now, laptops with the AMD Ryzen did not really stand out as champions in efficiency. Unfortunately, the Lenovo ThinkPad A485 remains entirely in line with other Ryzen laptops here, since the idle consumption is very high at 8.3 watts on average. The otherwise similarly equipped Lenovo ThinkPad T480 runs significantly more efficiently during idle. The relationship is the opposite under load, but this is of course due to the ThinkPad T480 being equipped with the dedicated Nvidia GeForce MX150 GPU that drives up the power consumption under load.
The maximum consumption under load is 48.8 watts, so the included 65-Watt power supply is sufficiently large.
| Off / Standby | |
| Idle | |
| Load |
|
Key:
min: | |
| Lenovo ThinkPad A485-20MU000CGE R5 PRO 2500U, Vega 8, Samsung SSD PM981 MZVLB256HAHQ, IPS LED, 1920x1080, 14" | HP EliteBook 745 G5 3UN74EA R7 2700U, Vega 10, Toshiba XG5 KXG50ZNV256G, IPS LED, 1920x1080, 14" | Lenovo ThinkPad T480s-20L8S02D00 i5-8250U, UHD Graphics 620, Samsung SSD PM981 MZVLB512HAJQ, IPS, 2560x1440, 14" | Dell Latitude 5490-TD70X i5-8350U, UHD Graphics 620, Toshiba KSG60ZMV512G, IPS, 1920x1080, 14" | Lenovo ThinkPad T480-20L6S01V00 i5-8550U, GeForce MX150, Samsung SSD PM981 MZVLB512HAJQ, IPS, 1920x1080, 14" | Average AMD Radeon RX Vega 8 (Ryzen 2000/3000) | Average of class Office | |
|---|---|---|---|---|---|---|---|
| Power Consumption | 11% | 4% | 15% | -5% | 3% | 4% | |
| Idle Minimum * (Watt) | 5.3 | 4.9 8% | 3.1 42% | 3.3 38% | 3.6 32% | 5.68 ? -7% | 4.3 ? 19% |
| Idle Average * (Watt) | 8.3 | 8.1 2% | 6.8 18% | 5.54 33% | 7.1 14% | 8.75 ? -5% | 7.33 ? 12% |
| Idle Maximum * (Watt) | 11.4 | 10.6 7% | 10.1 11% | 6.59 42% | 9.5 17% | 10.1 ? 11% | 8.59 ? 25% |
| Load Average * (Watt) | 42 | 32.2 23% | 48.4 -15% | 42.4 -1% | 63.9 -52% | 37.8 ? 10% | 43.6 ? -4% |
| Load Maximum * (Watt) | 48.8 | 42.3 13% | 67.1 -38% | 67.6 -39% | 67.3 -38% | 46.2 ? 5% | 64.4 ? -32% |
| Witcher 3 ultra * (Watt) | 53.9 |
* ... smaller is better
Battery Life
The Lenovo ThinkPad A485 has the "PowerBridge" design, which means that the ThinkPad can use two 24-Wh batteries. One is built-in and the other is an external removable battery. This increases the flexibility significantly, as users can take a charged battery with them and replace the battery during operation (hot-swap). Not only that, but you can also use an optional expanded 72-Wh battery, although this will stick out of the case. So you can get a maximum battery capacity of 96 Wh.
Our test unit has the smallest external battery, so it has a total battery capacity of 48 Wh. Unfortunately, the high consumption values create bad results in the battery life tests. After only 4.5 hours in the Wi-Fi test, the lights of the ThinkPad A485 already go out. This is even one step worse than the HP EliteBook 745 G5 that lasted almost two hours longer here.
Of course the Wi-Fi runtime is not really good at about 6.5 hours either, if you compare it with the laptop models with Intel CPUs. For example, the Lenovo ThinkPad T480s with its slightly larger 57-Wh battery ran for almost 9 hours in the WLAN test. To get a similar battery life with the Lenovo ThinkPad A485, you would have to use the heavier and thicker 72-Wh battery. So that battery, which was meant to be optional, is really almost an absolute requirement with the A485.
Update UEFI version 1.02: With the newer firmware version, the battery life of the ThinkPad A485 has slightly improved. Instead of 4.5, it now lasted 5.5 hours in the WiFi test. The battery life also improved slightly in the H.264 video test, where the constant loop of "Big Buck Bunny" now played for about half an hour longer.
| Lenovo ThinkPad A485-20MU000CGE R5 PRO 2500U, Vega 8, 48 Wh | HP EliteBook 745 G5 3UN74EA R7 2700U, Vega 10, 50 Wh | Dell Latitude 5490-TD70X i5-8350U, UHD Graphics 620, 68 Wh | Lenovo ThinkPad T480-20L6S01V00 i5-8550U, GeForce MX150, 72 Wh | Lenovo ThinkPad T480s-20L8S02D00 i5-8250U, UHD Graphics 620, 57 Wh | Average of class Office | |
|---|---|---|---|---|---|---|
| Battery runtime | 19% | 116% | 127% | 84% | 118% | |
| Reader / Idle (h) | 11.2 | 10.7 -4% | 25.9 131% | 27.9 149% | 24.5 ? 119% | |
| H.264 (h) | 6.1 | 7.1 16% | 13.2 116% | 10.6 74% | 12 97% | 15.5 ? 154% |
| WiFi v1.3 (h) | 5.5 | 6.6 20% | 15 173% | 13.2 140% | 9 64% | 13 ? 136% |
| Load (h) | 1.1 | 1.6 45% | 1.6 45% | 2.7 145% | 2.1 91% | 1.808 ? 64% |
Verdict
Pros
Cons
The Lenovo ThinkPad A485 really had a high potential: The ThinkPad T series, which the ThinkPad A is based on, is extremely popular, and there is quite a demand for good Ryzen laptops. However, this Ryzen ThinkPad disappoints us in the test.
For one, this is because Lenovo unnecessarily keeps the QHD display from the ThinkPad A485, and the A485 also lacks Thunderbolt 3. Also, the CPU performance remains far behind that of the ThinkPad T480 Intel sibling model. Even worse is the fact that the consumption is too high, resulting in an extremely bad battery life in comparison. This is only partially Lenovo's fault, since laptops with Ryzen generally struggle with higher consumption compared to Intel-based models.
Of course the Lenovo ThinkPad A485 also has many positive sides, leading to the good evaluation score. These include for example the robust case, the excellent input devices, and the extensive connection equipment. But you can also get all that in the ThinkPad T480. Only in the graphics performance is the A485 ahead, but only compared to the T480 with the iGPU. The model with the GeForce MX150 is also better in this regard.
Not recommended: All that makes the ThinkPad A485 a good laptop, the ThinkPad T480 can also do, while also delivering a better CPU performance and battery life than the A485.
So finally, we cannot really give a recommendation to the ThinkPad A485. In practice, the Lenovo ThinkPad T480 is really the better choice in all respects. On the other hand, if you want to avoid Intel CPUs in general, you should rather choose the HP EliteBook 745 G5, which has a battery life that is not quite as bad and the LCD panel is also better to some extent in this model.
Update UEFI version 1.02: We were able to retest the ThinkPad A485 with a newer version of the UEFI BIOS. The battery life has now slightly improved, and the CPU performance under load is also higher with the newer firmware. We therefore adjusted the evaluation score and also want to slightly modify our verdict: Although the ThinkPad T480 continues to surpass the A485, the ThinkPad A485 might be an interesting option due to its relatively affordable price, particularly if you need a bit more GPU performance.
Lenovo ThinkPad A485-20MU000CGE
- 10/22/2019 v7 (old)
Benjamin Herzig
Price comparison
