Lenovo Legion Y730-17ICH (i7-8750H, GTX 1050 Ti) Laptop Review
The Lenovo Legion Y730 series directly succeeds the Legion Y720 series. Unlike the Y720, however, the Y730 includes both 15-inch and 17-inch screen sizes for a wider range of options than its immediate predecessor. We recommend reading our review on the 15-inch Legion Y530 as it shares a similar aesthetic design to our 17-inch Legion Y730 that we have here today.
As of this writing, there are only two SKUs of the 17-inch Legion Y730 available distinguished by their processors. The first is equipped with a quad-core Core i5-8300H while the second uses a hexa-core i7-8750H. Otherwise, both have the same 1080 IPS matte display and GTX 1050 Ti GPU. Our review unit is the faster configuration retailing for about $1250 USD. As a mainstream gaming laptop from Lenovo, the system has a long line of direct 17-inch competitors including the MSI GP72, HP Omen 17, Dell G3 17, Acer Predator Helios 300, and the Asus ROG GL703GE.
Case
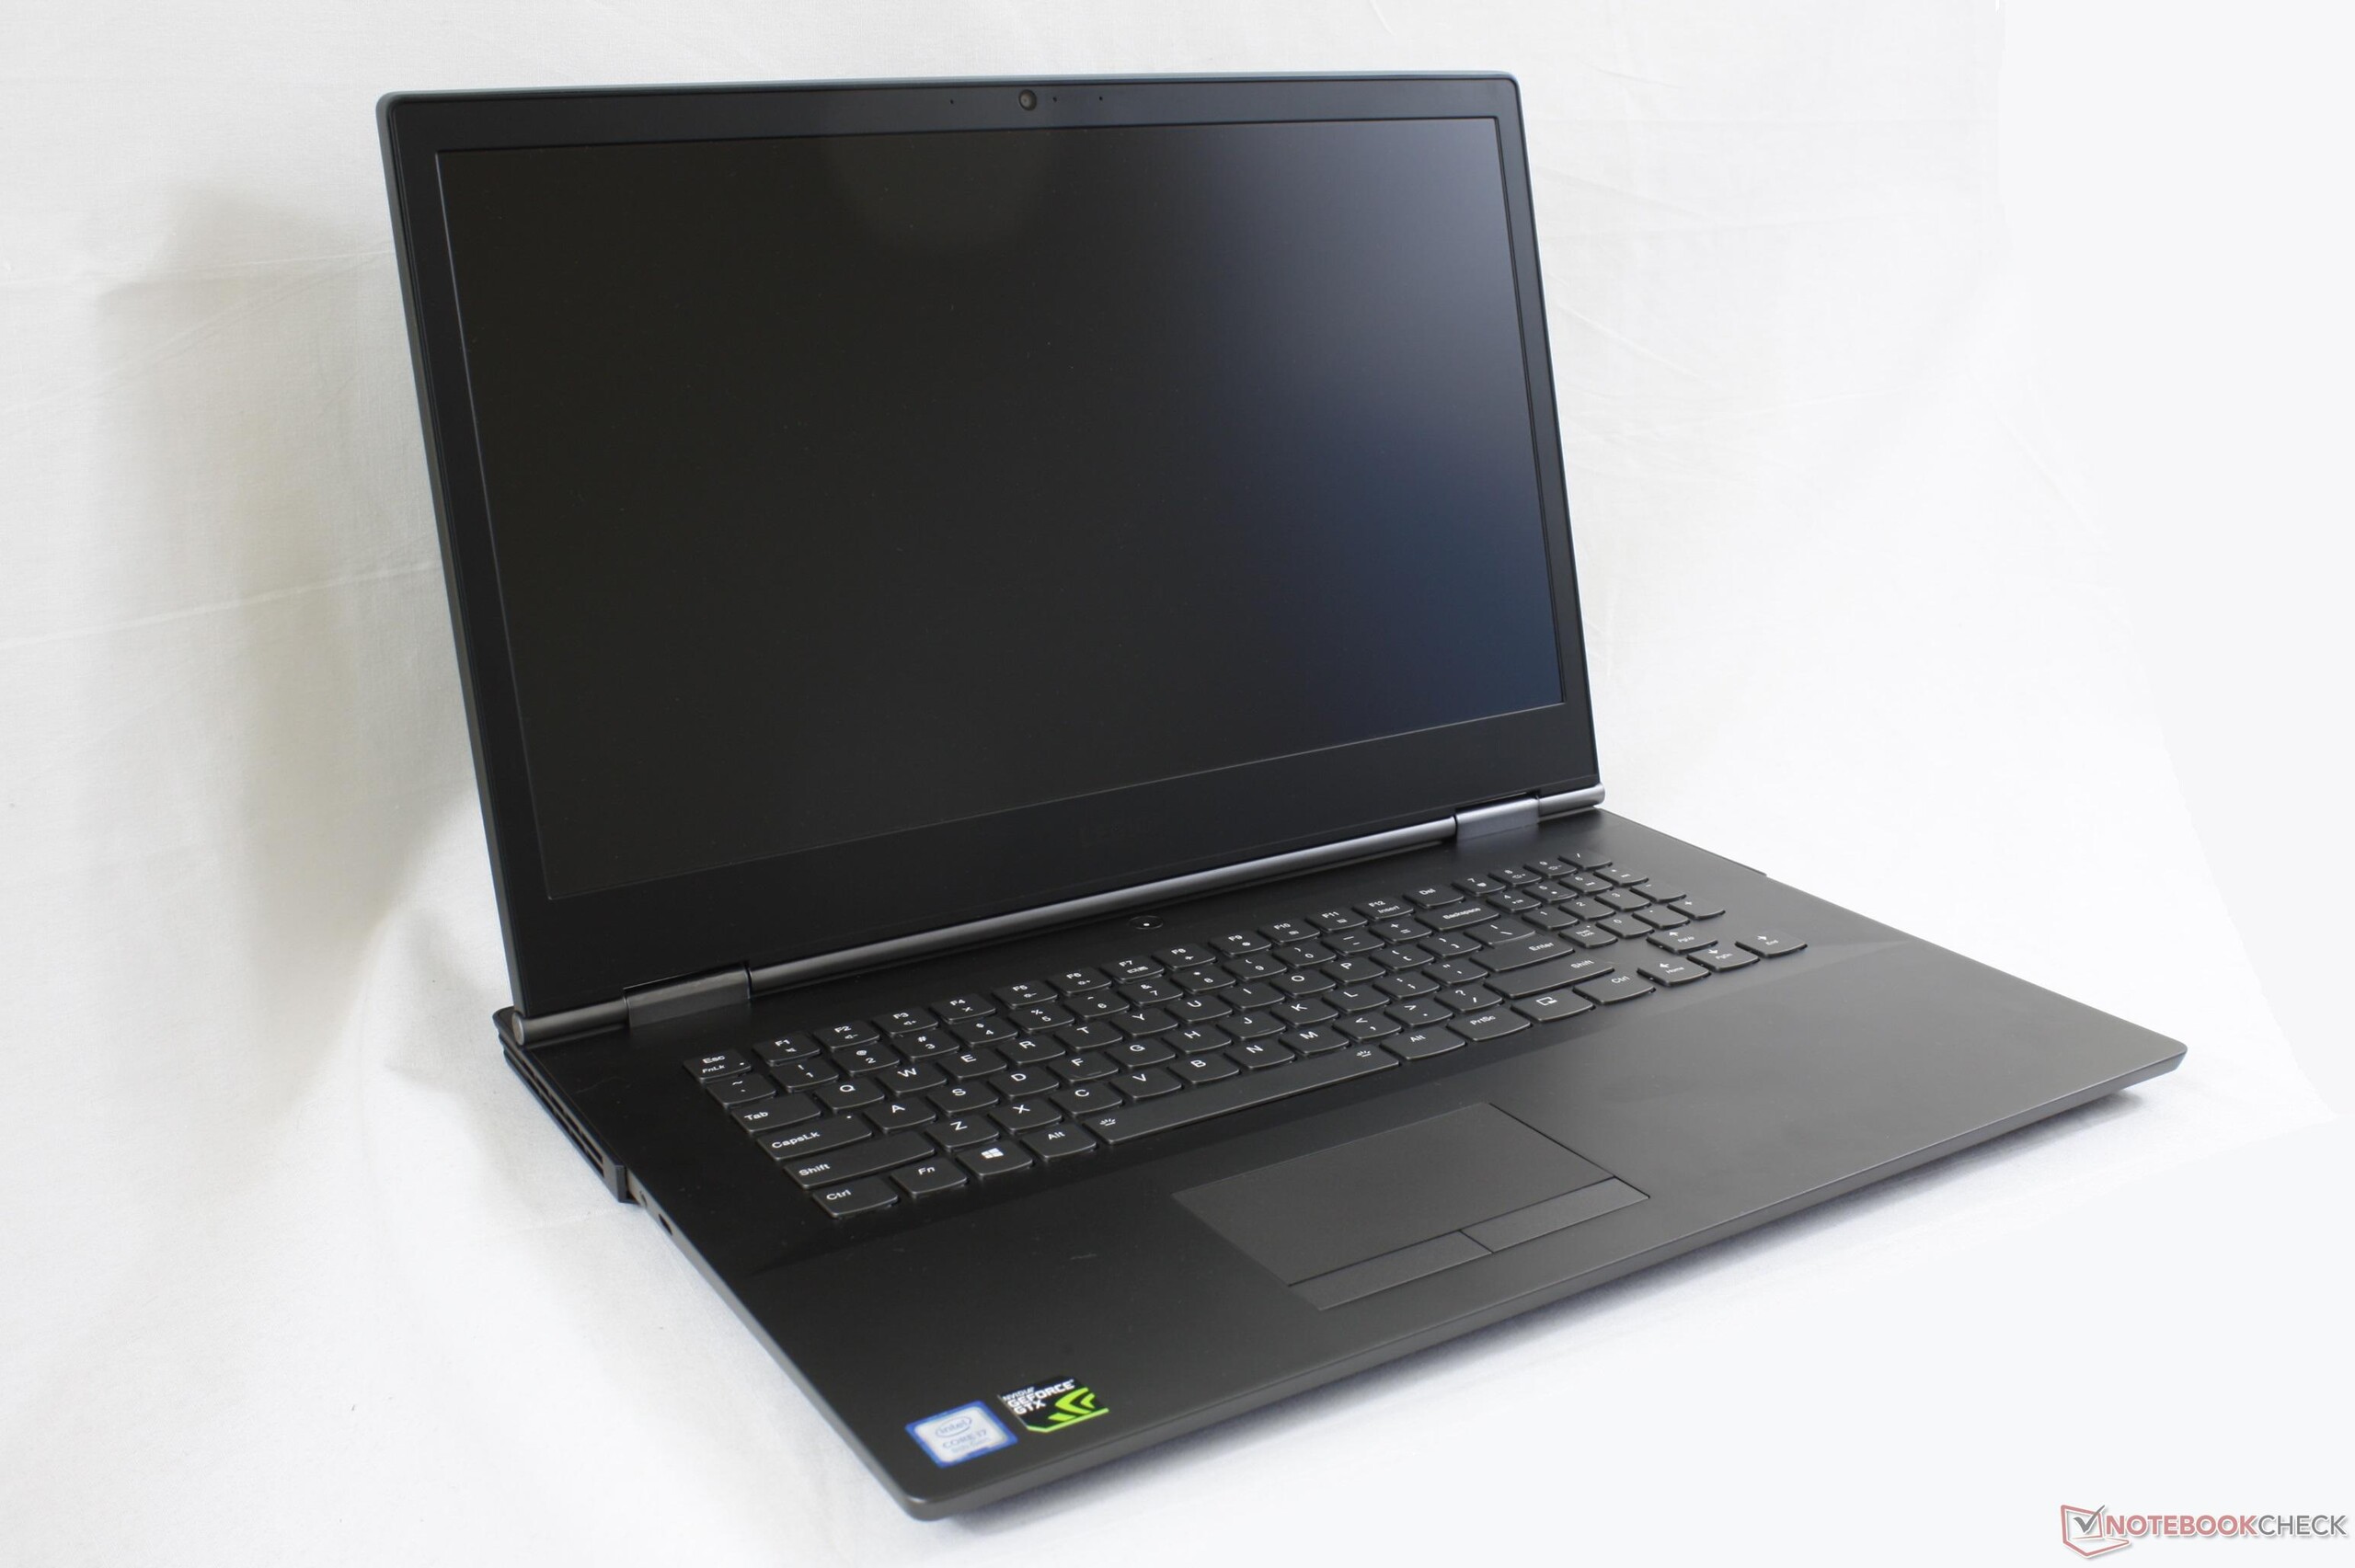
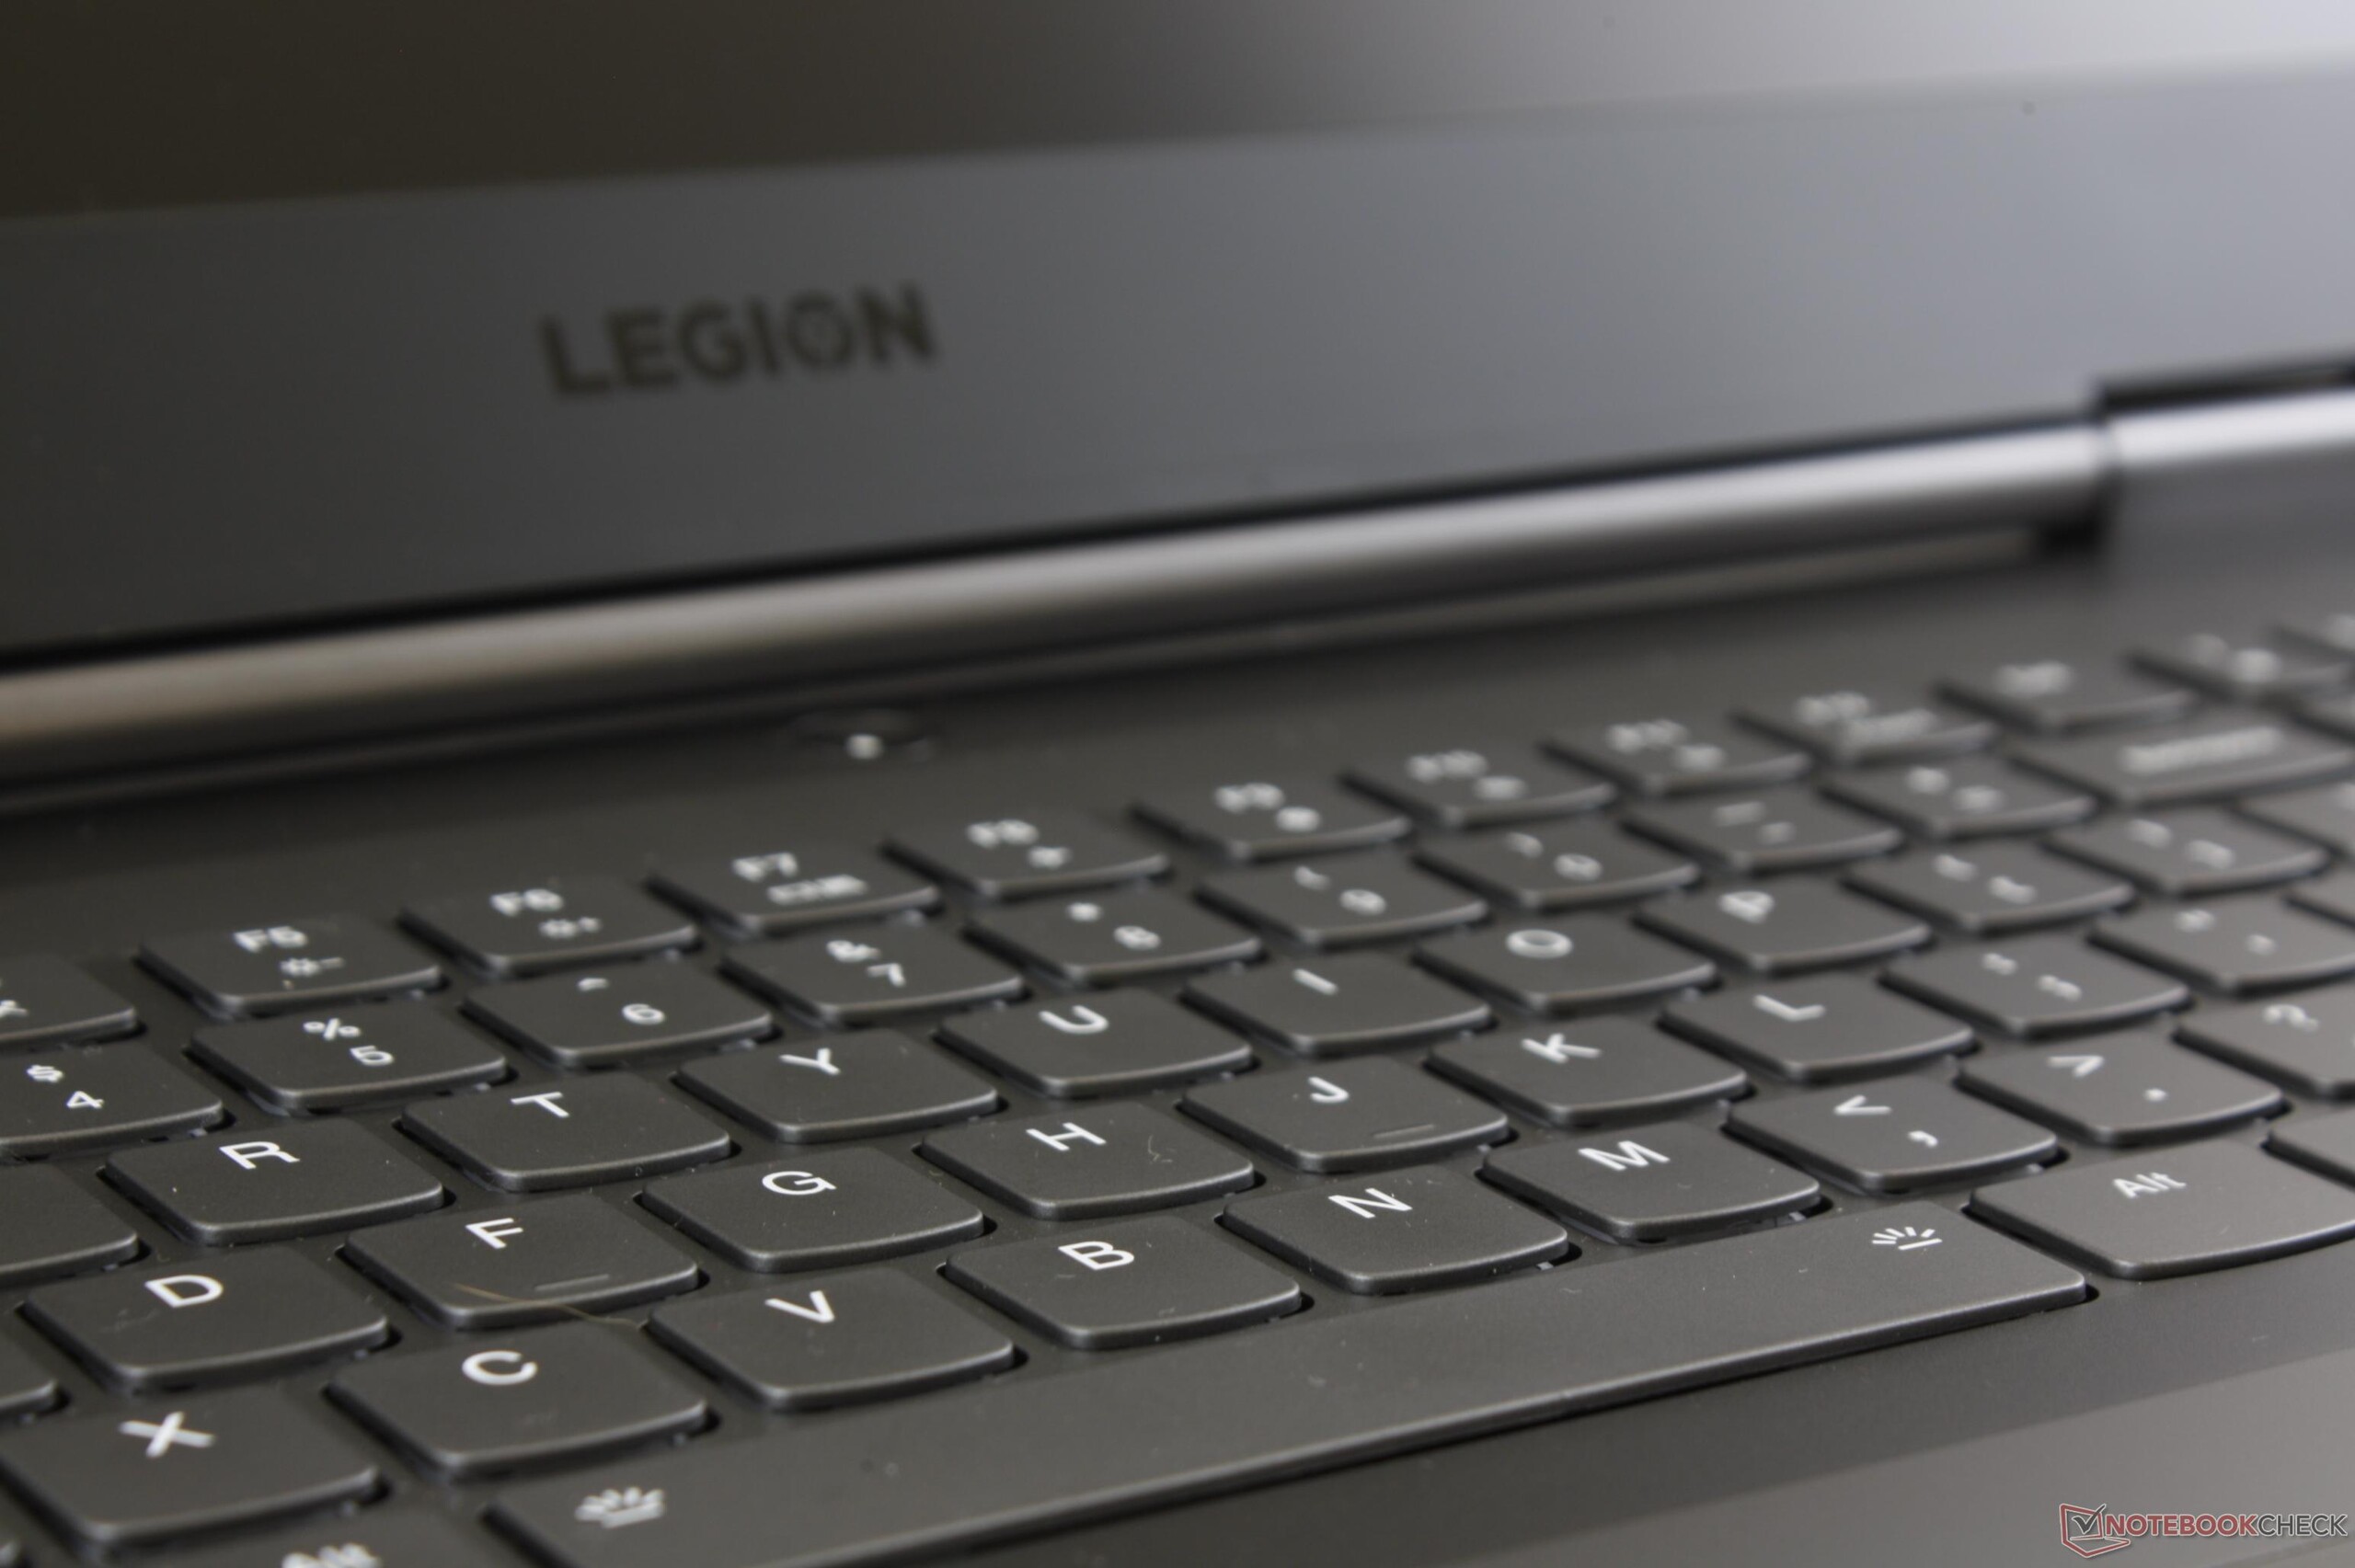
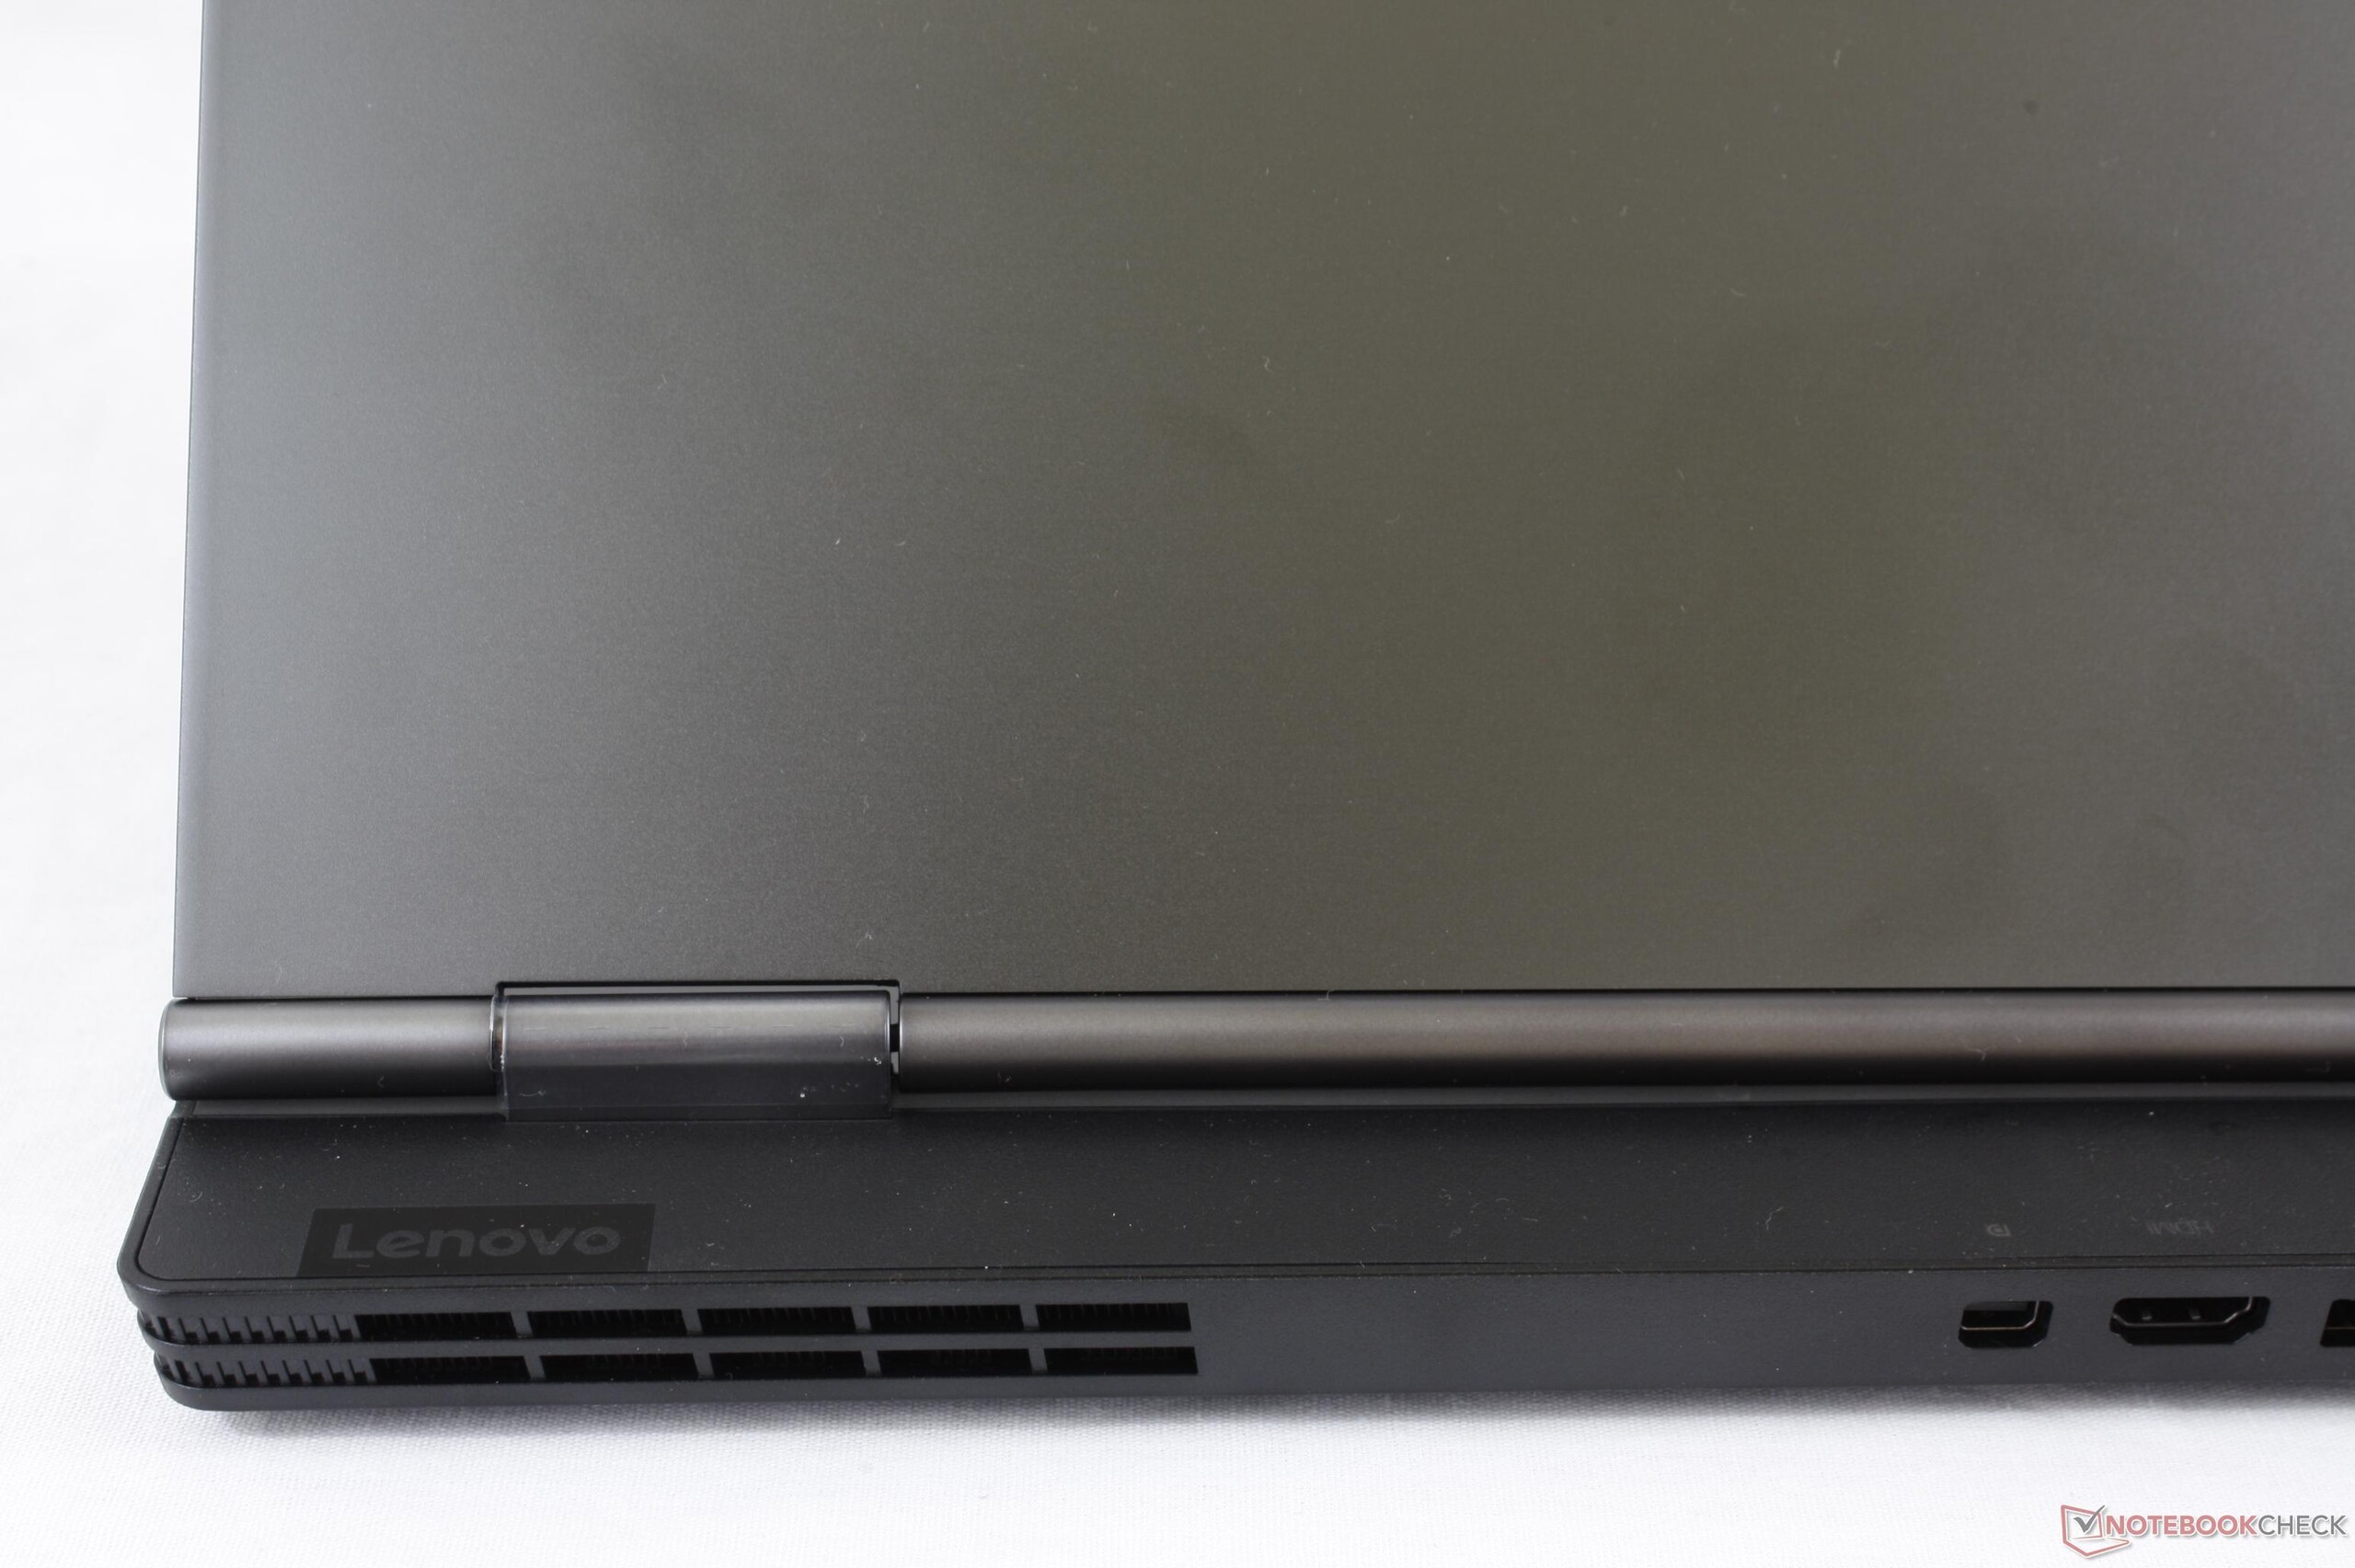
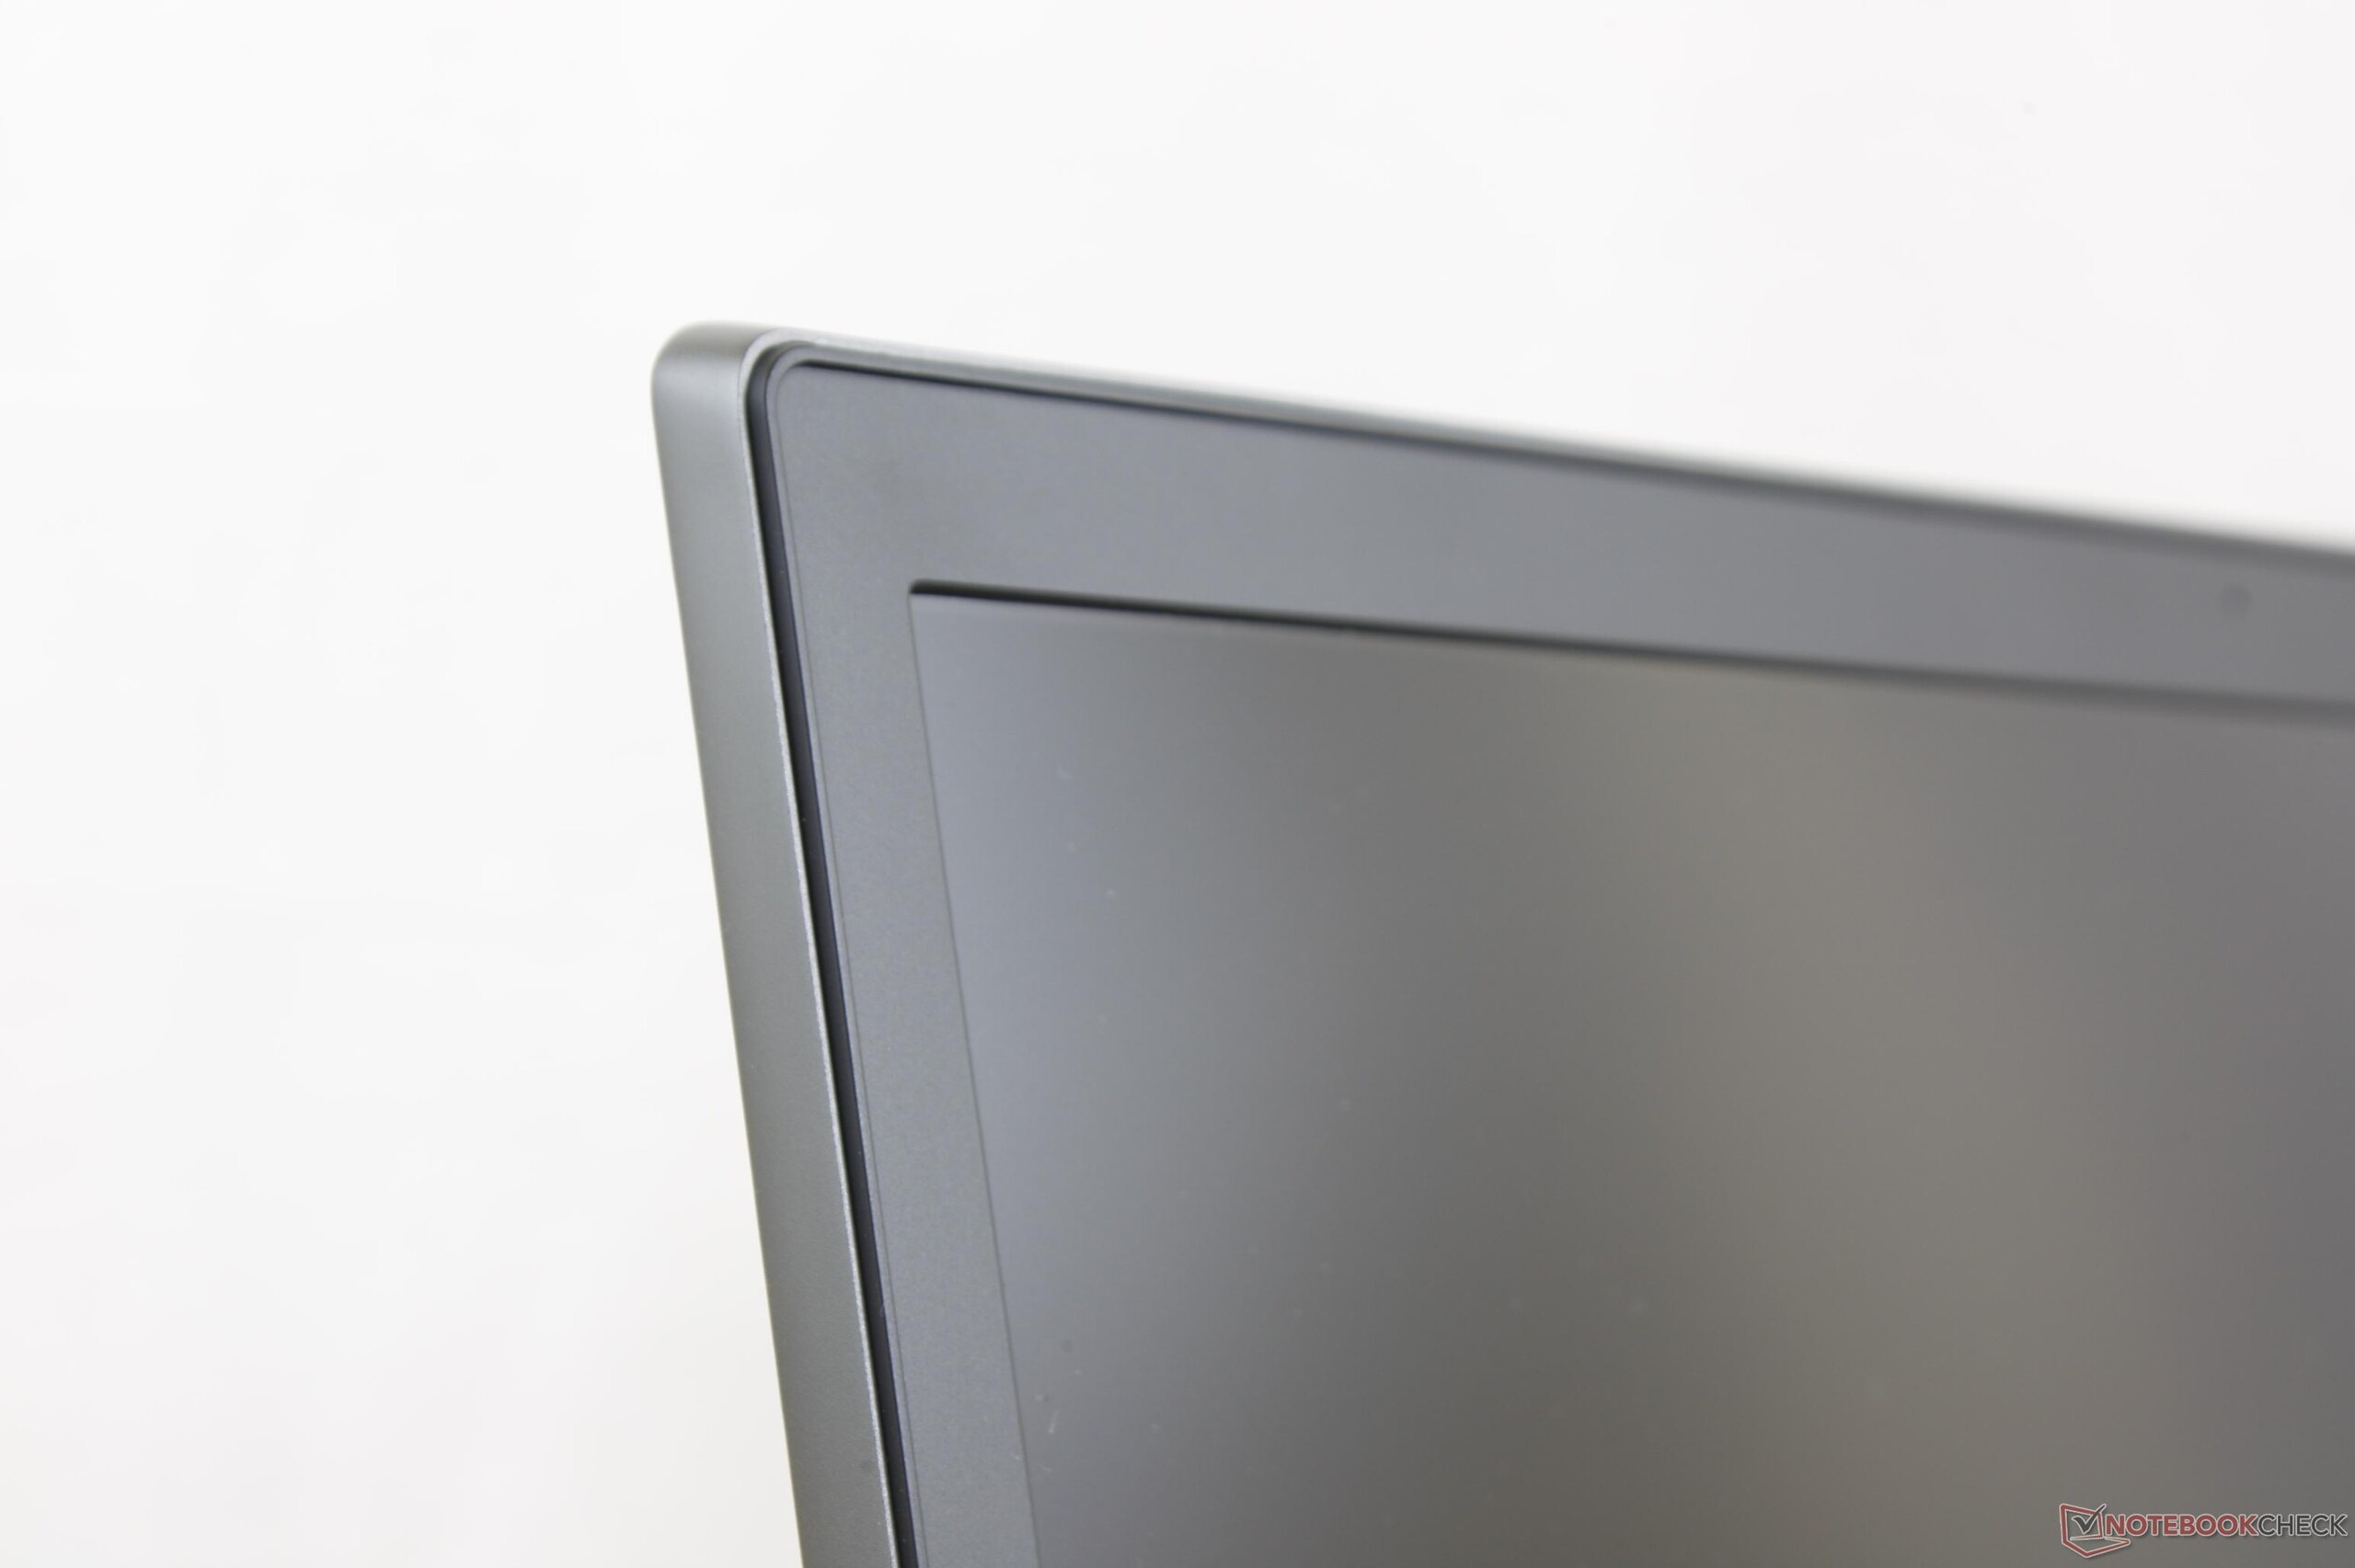
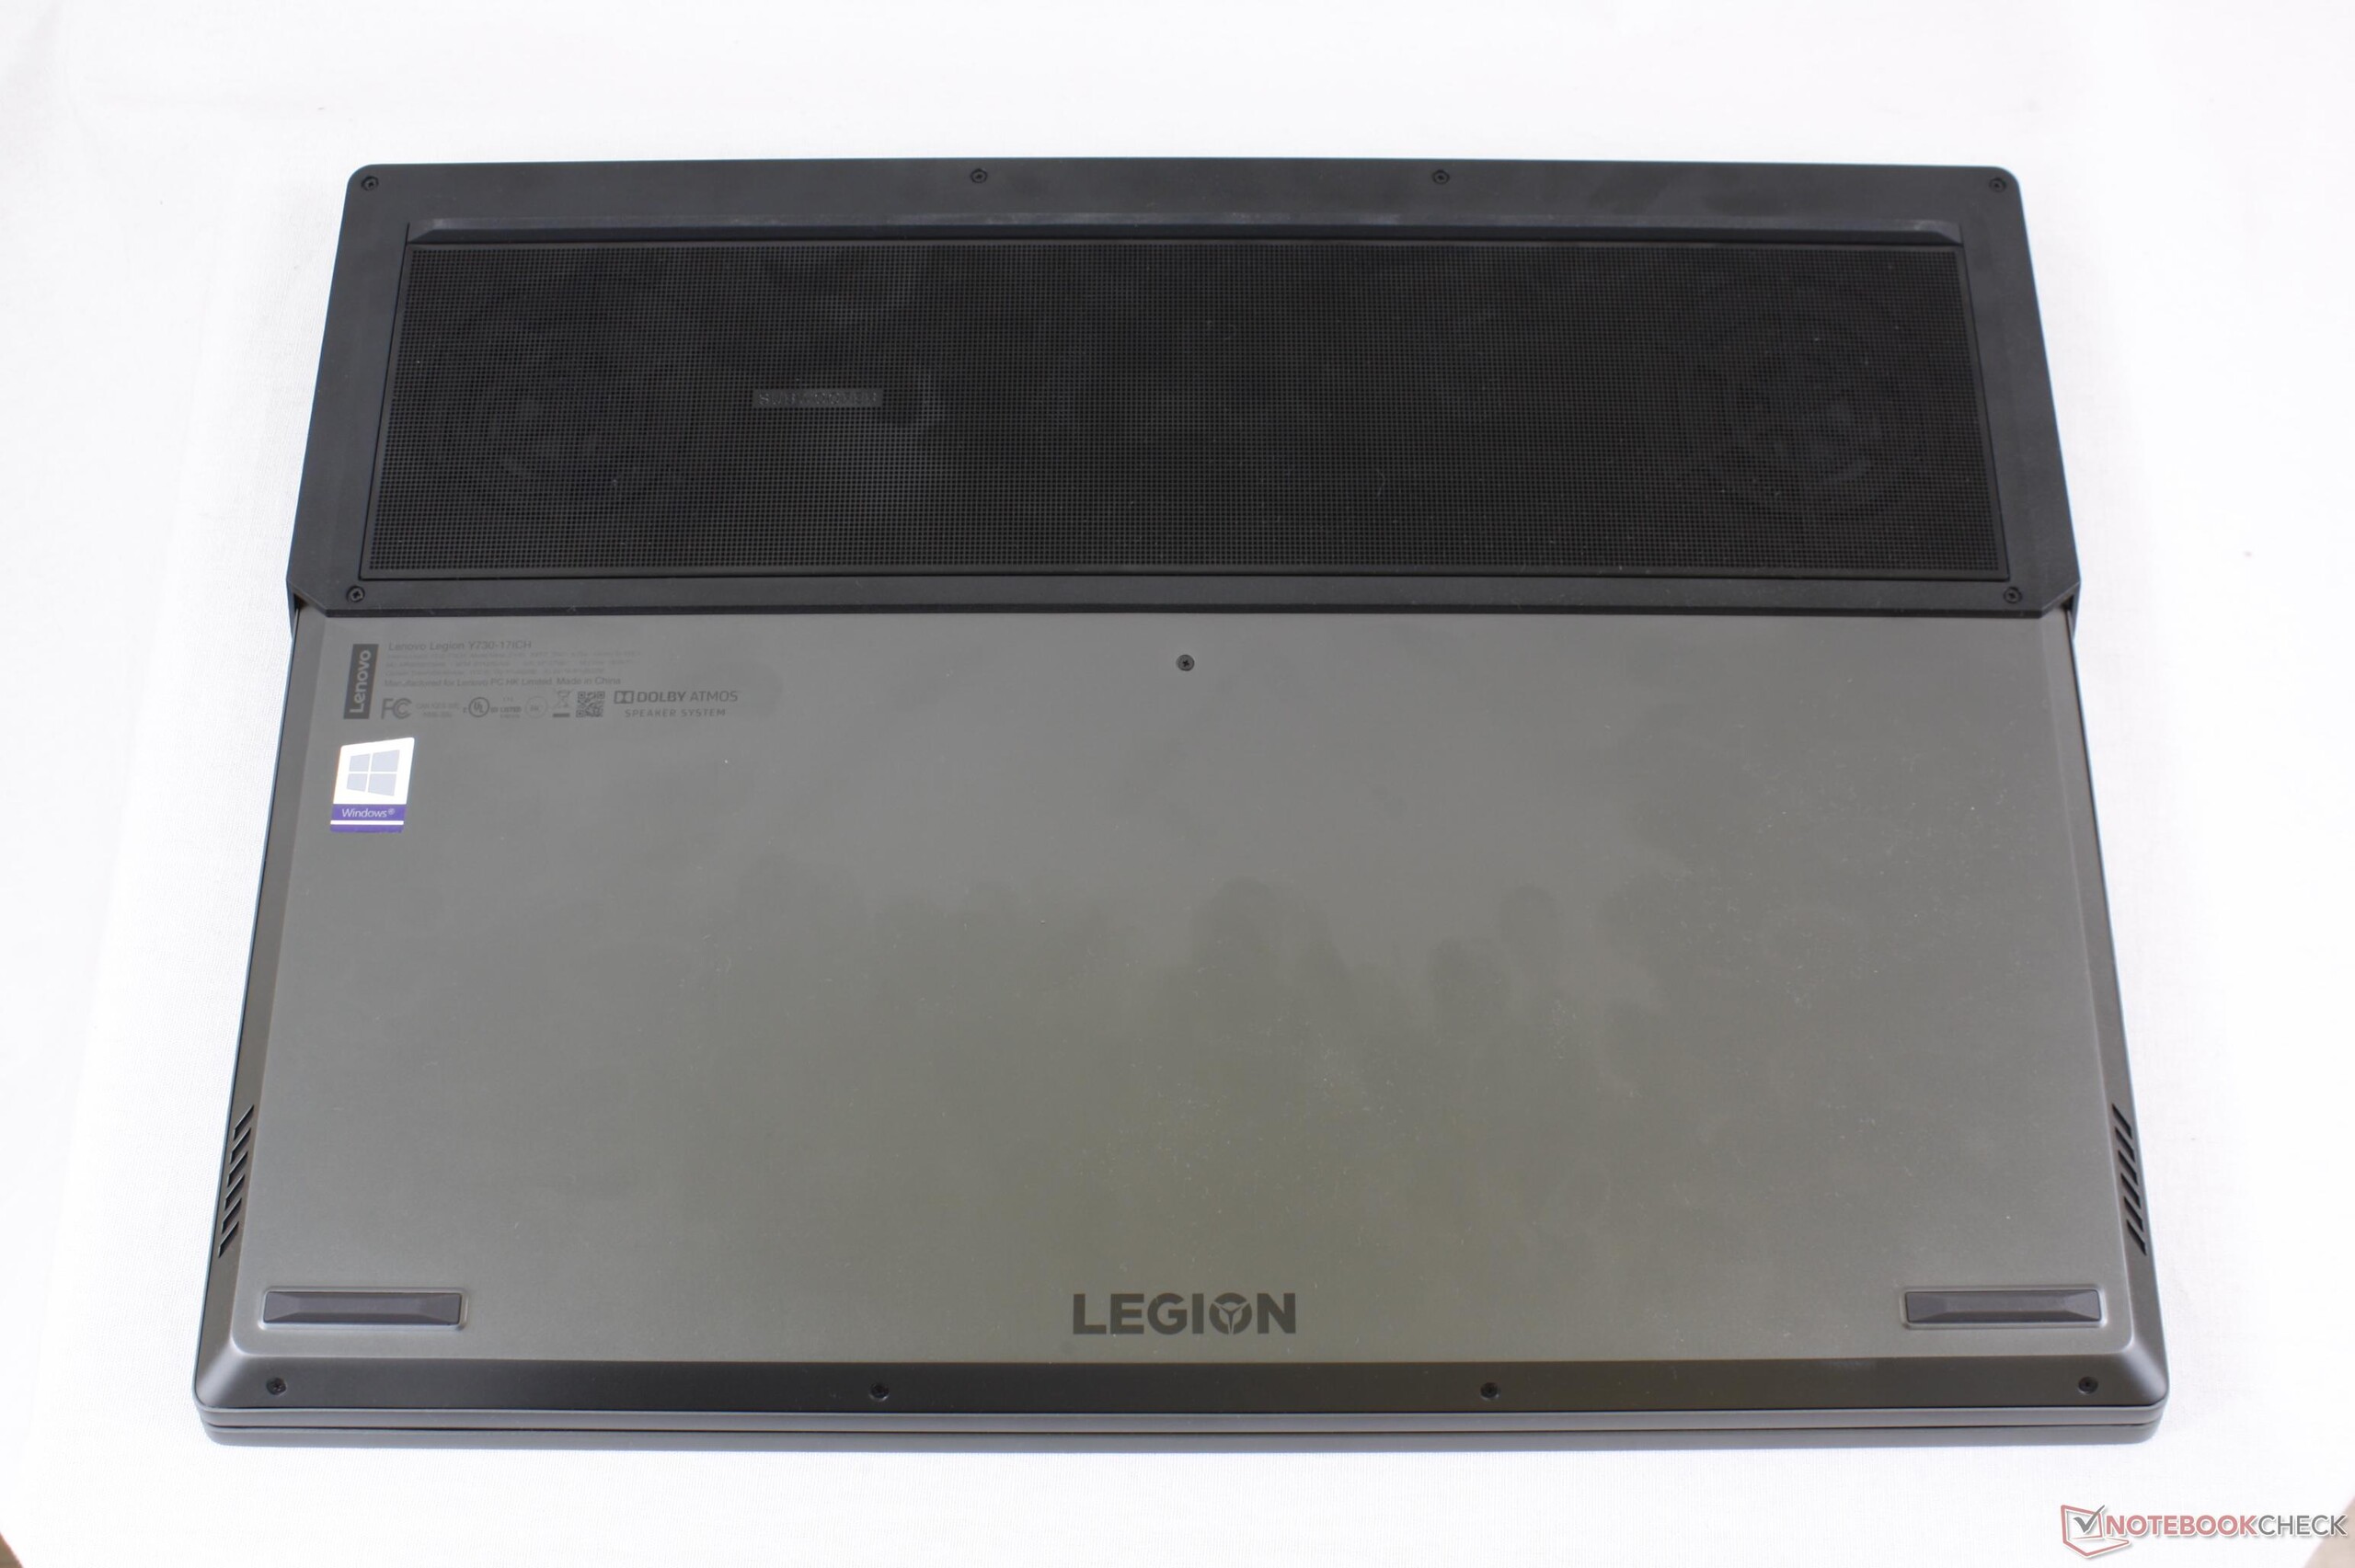
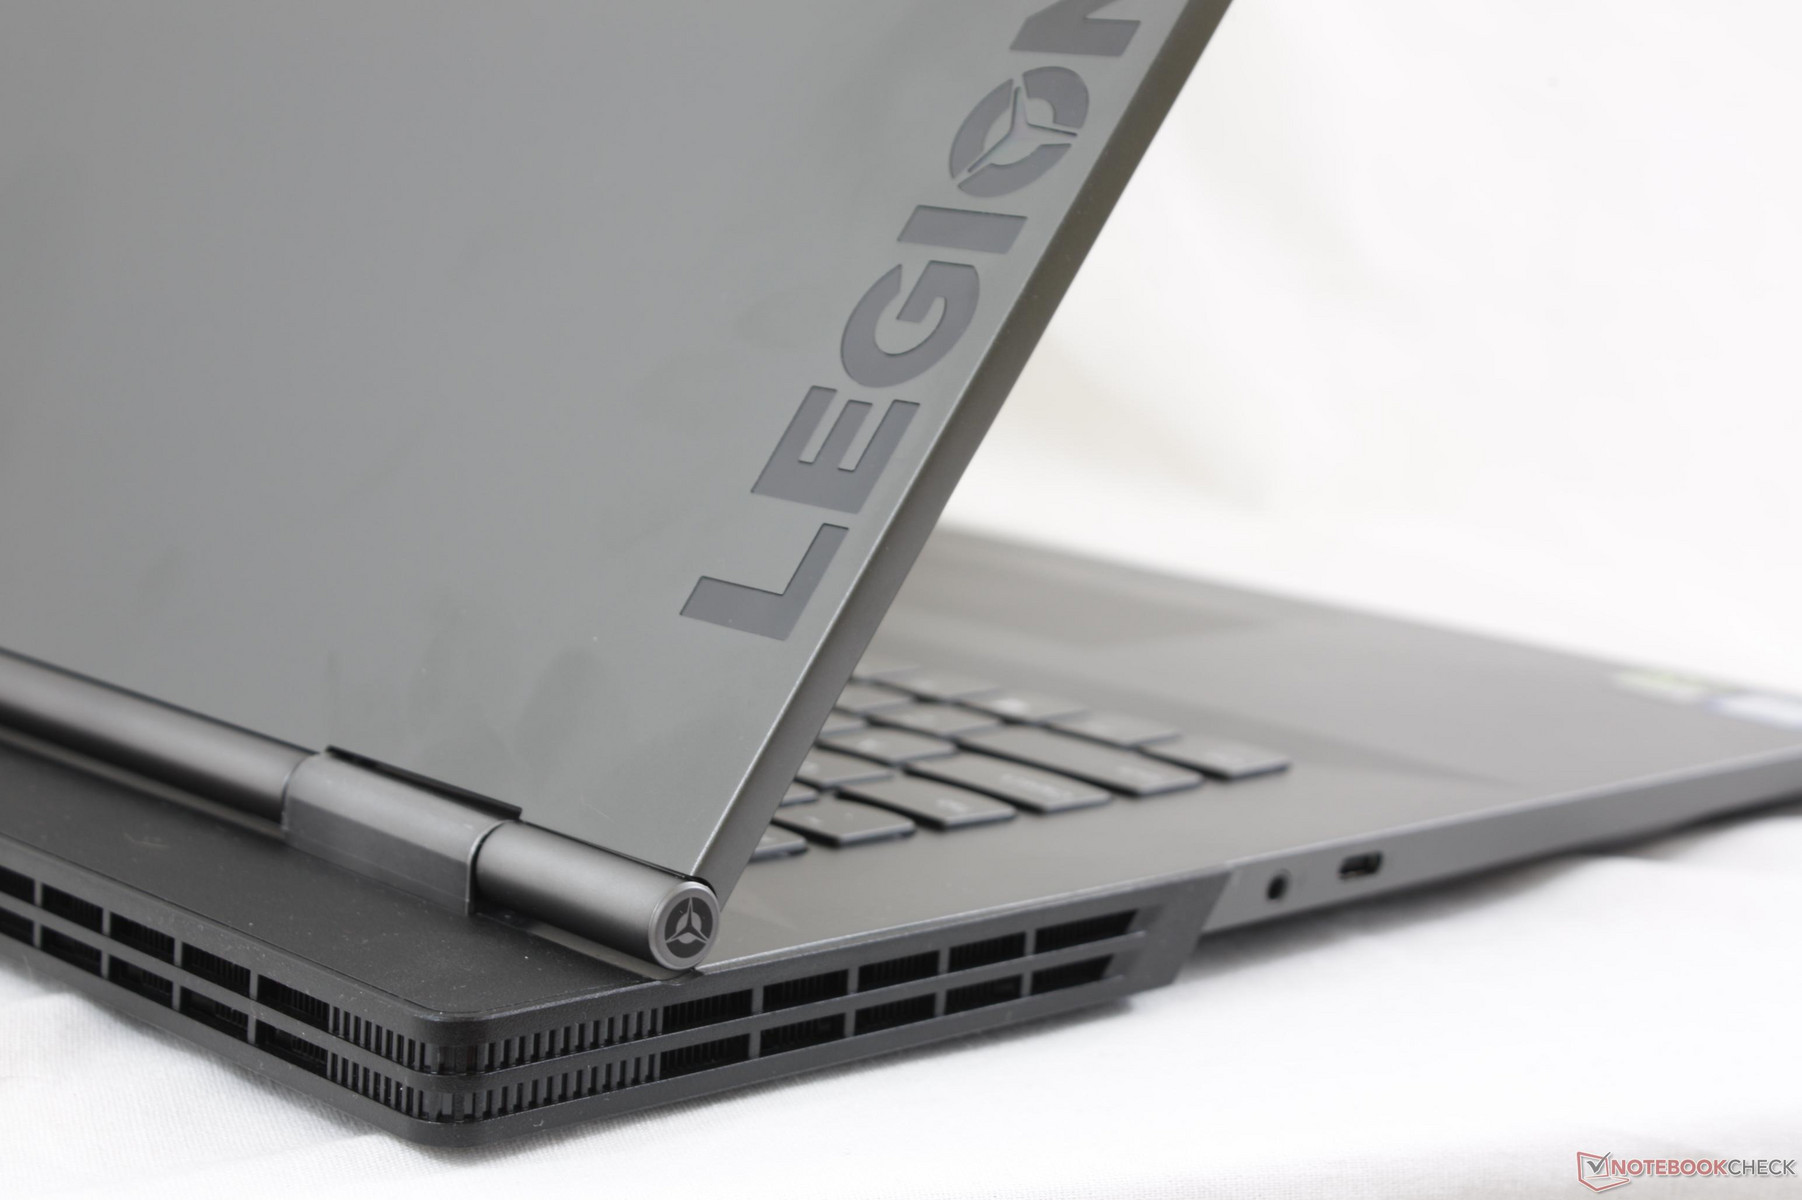
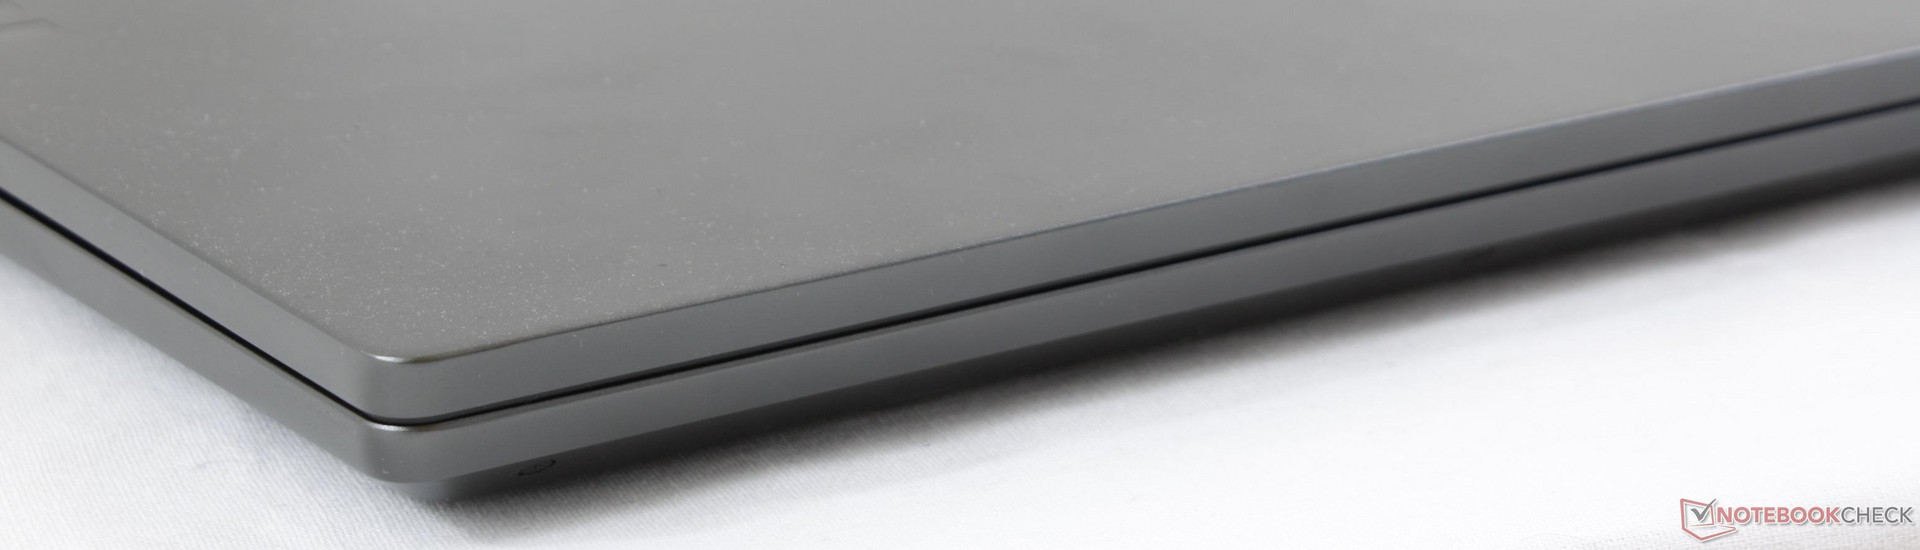
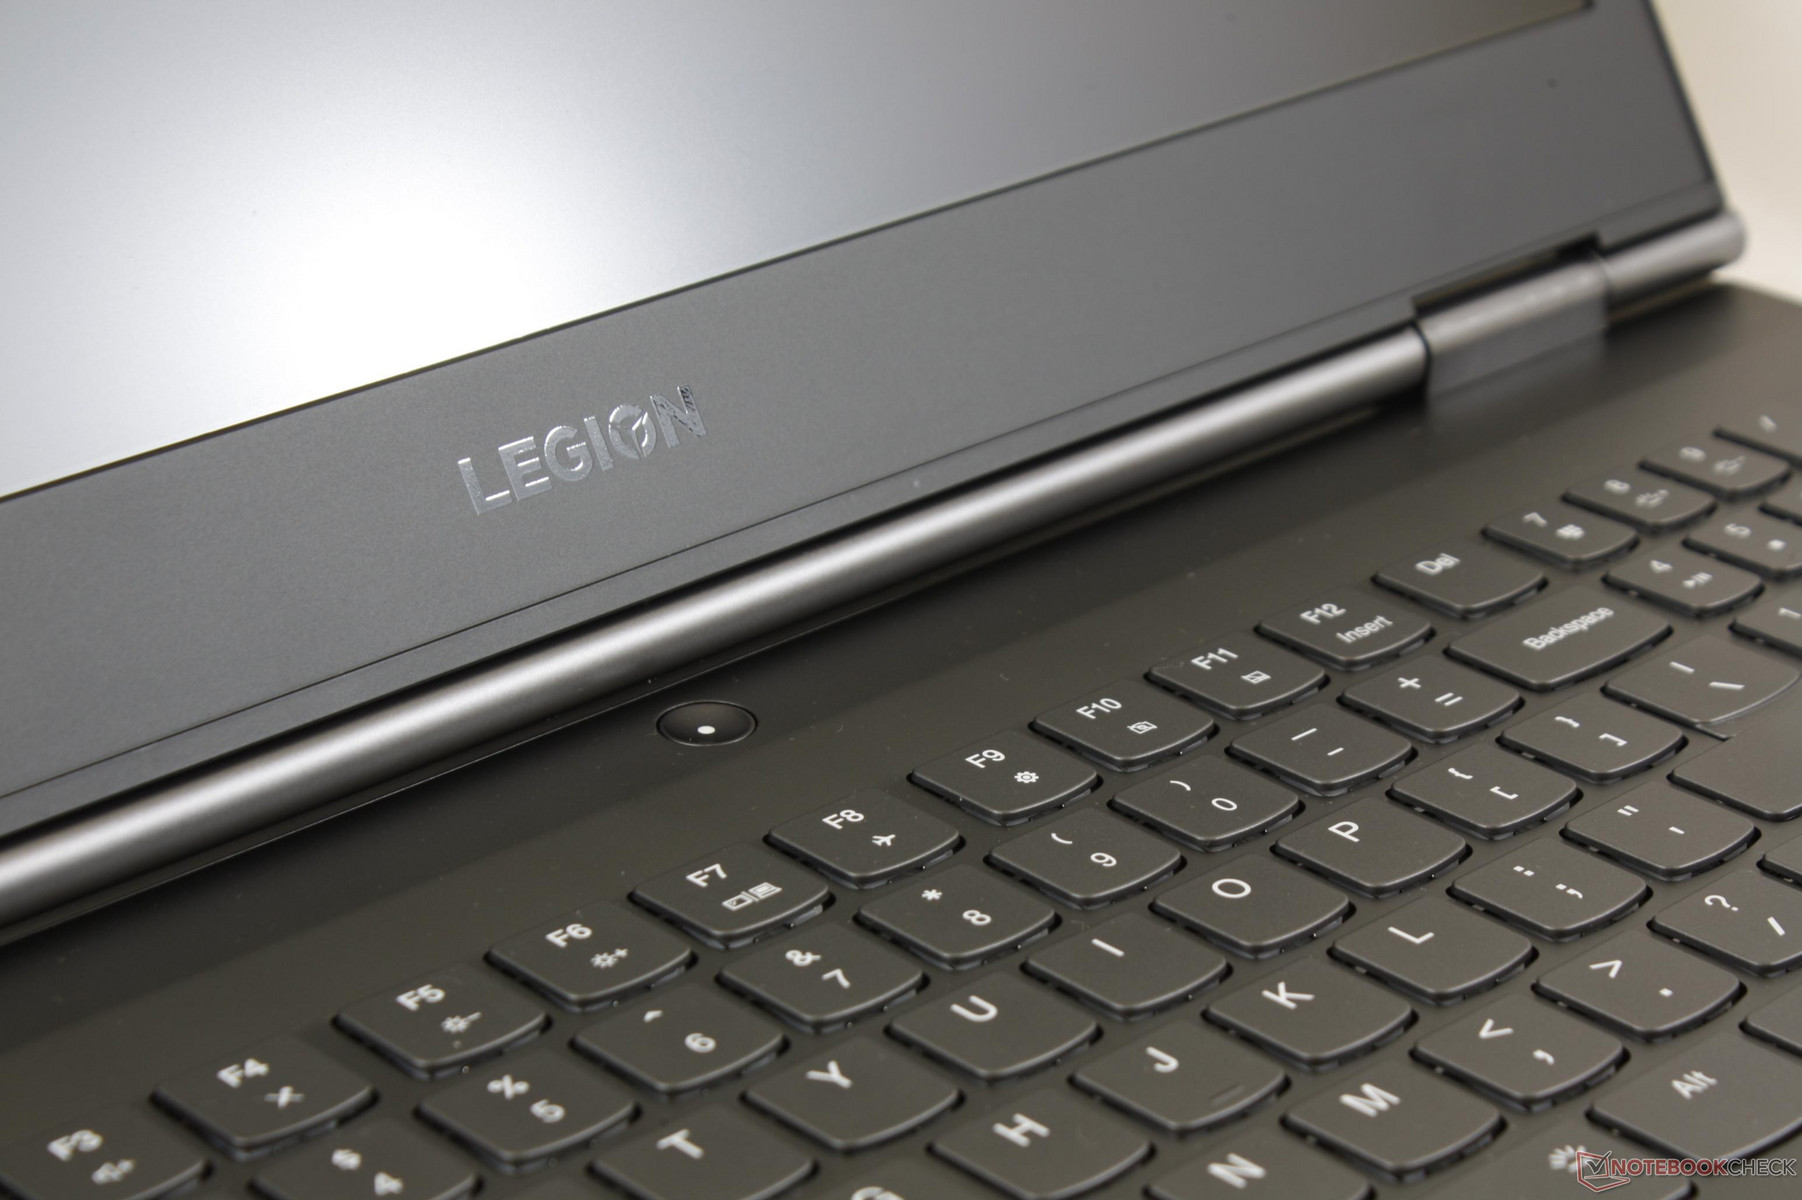
Lenovo has completely redesigned the chassis from previous Legion iterations. The new Y730 is smoother, flatter, thinner, and much less colorful and "gamery" than its predecessors. All hints of red have been dropped in favor of a cleaner matte aluminum finish from top to bottom. This very deliberate change is Lenovo's attempt to broaden the appeal of the Legion series to audiences outside of core gamers. The more subtle and less flashy design is arguably more appropriate for conferences and business settings when compared to the older Legion Y520.
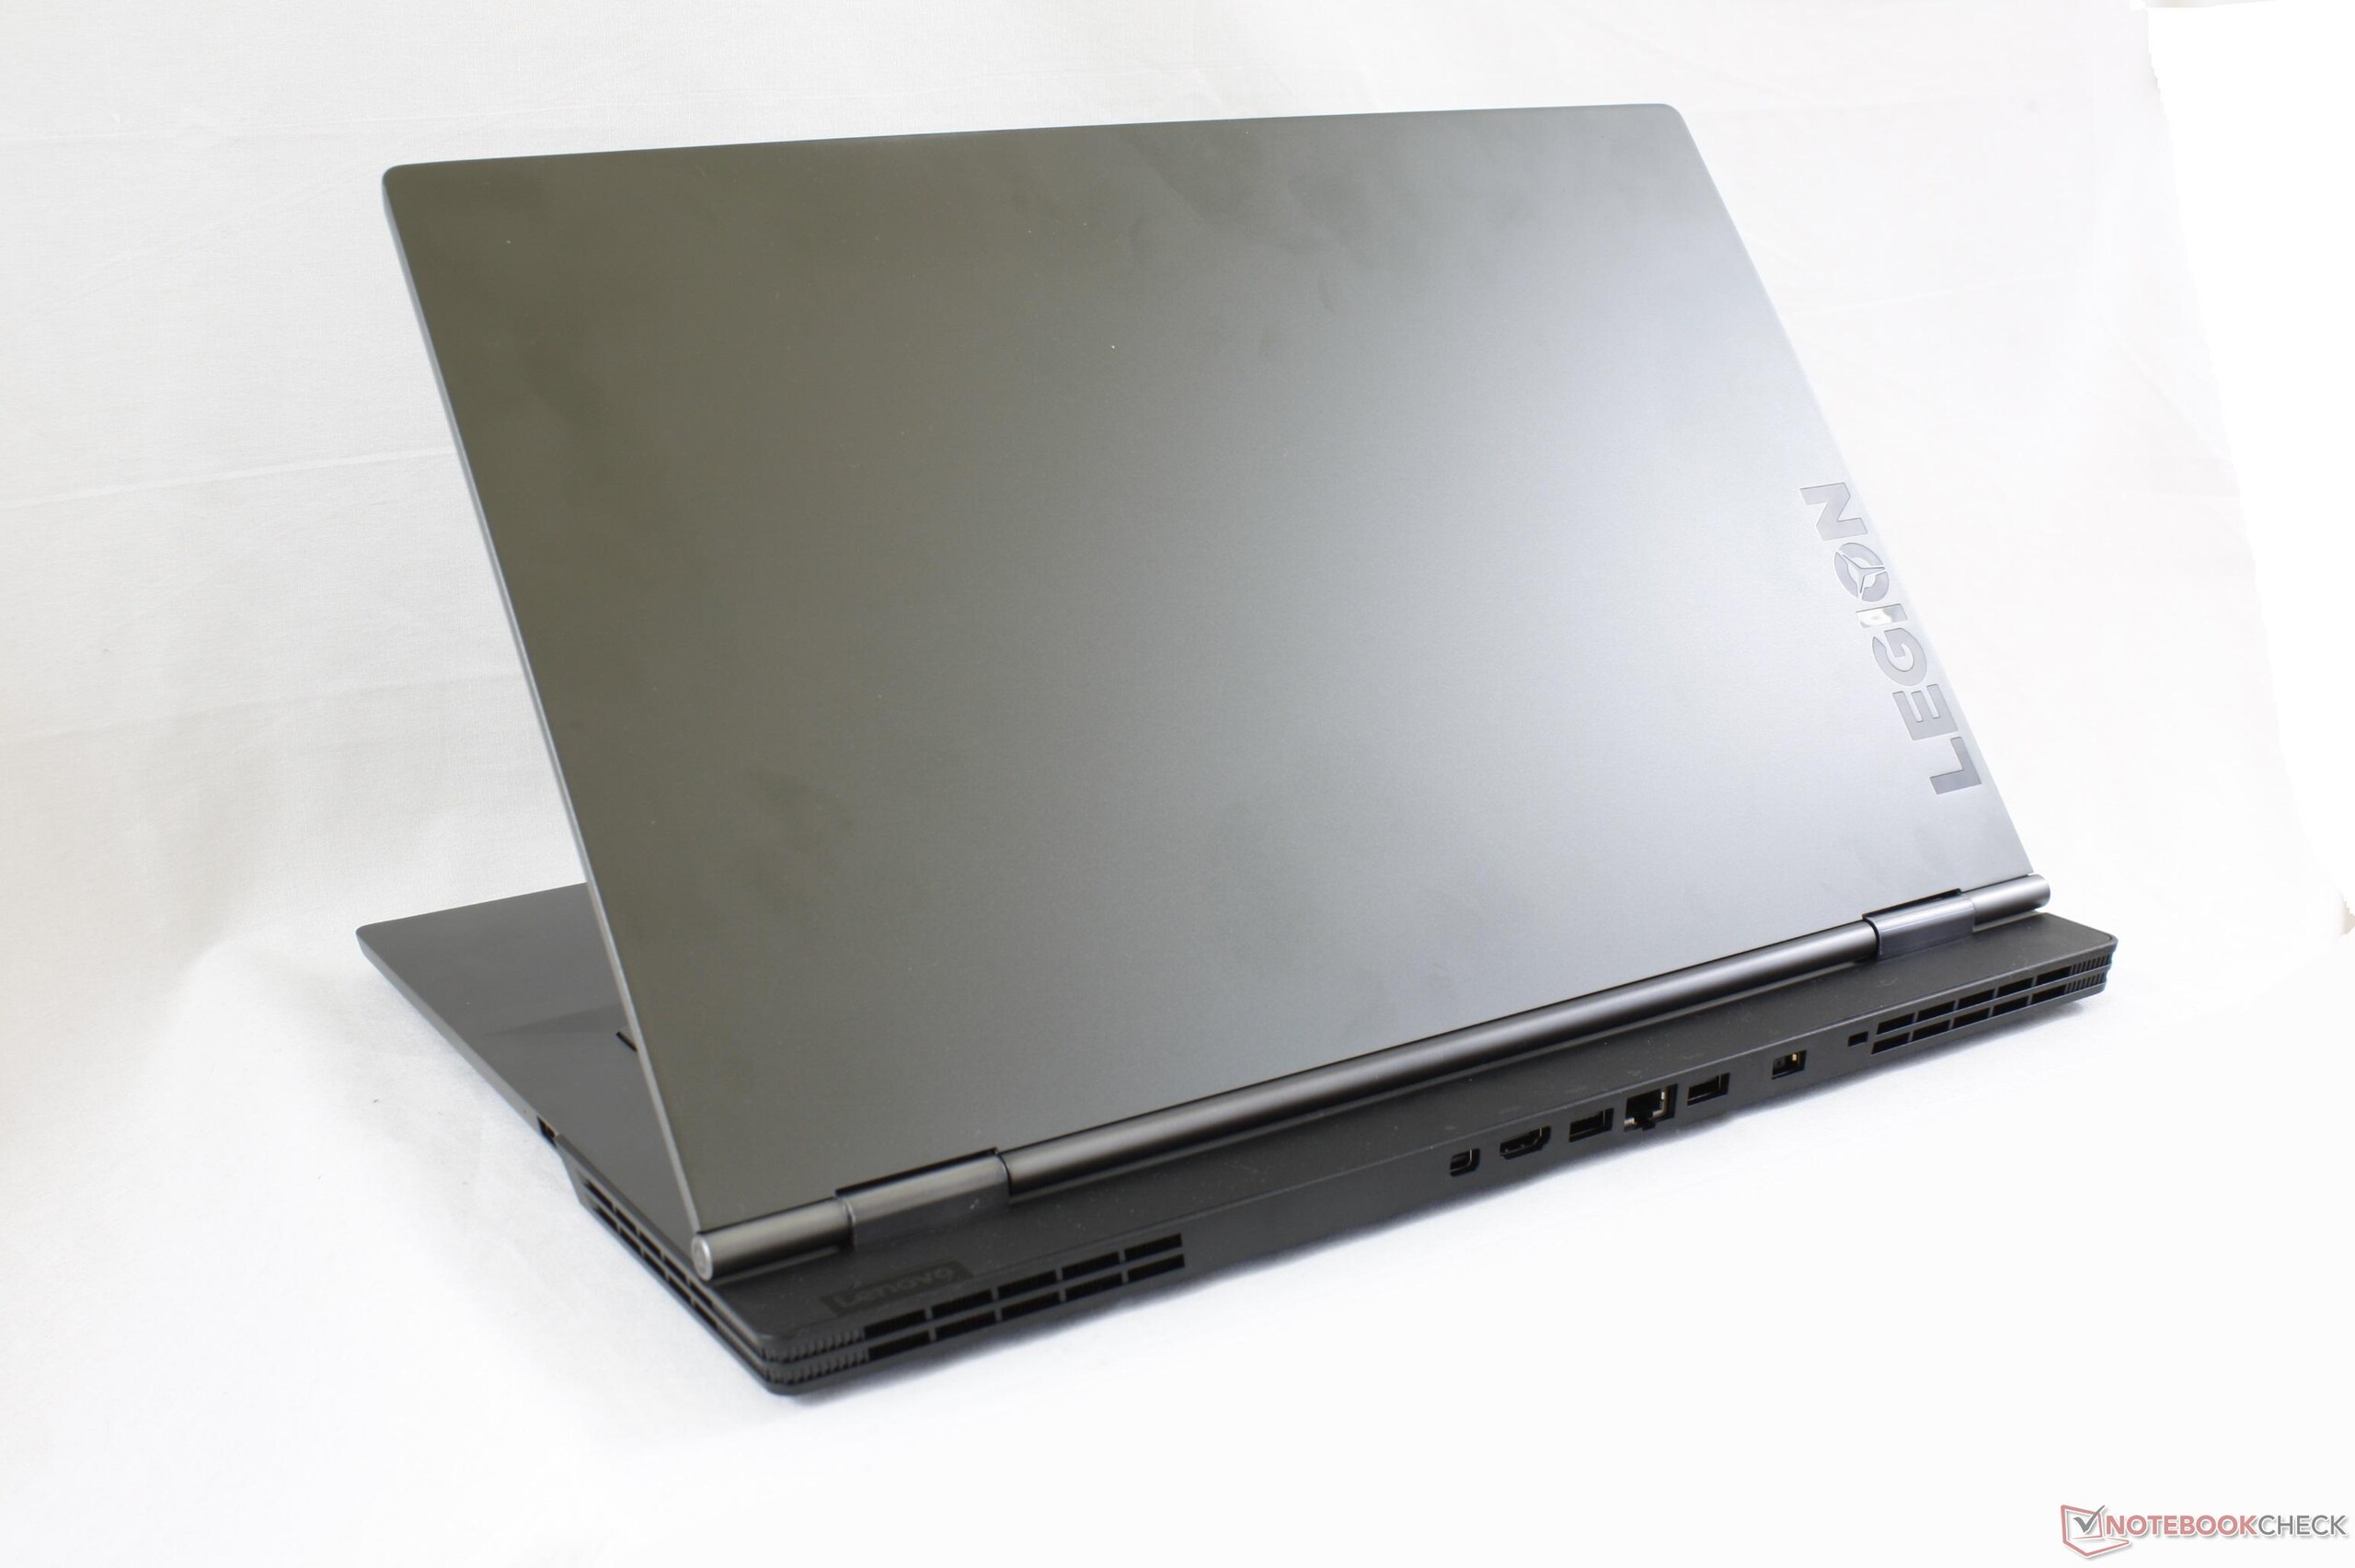
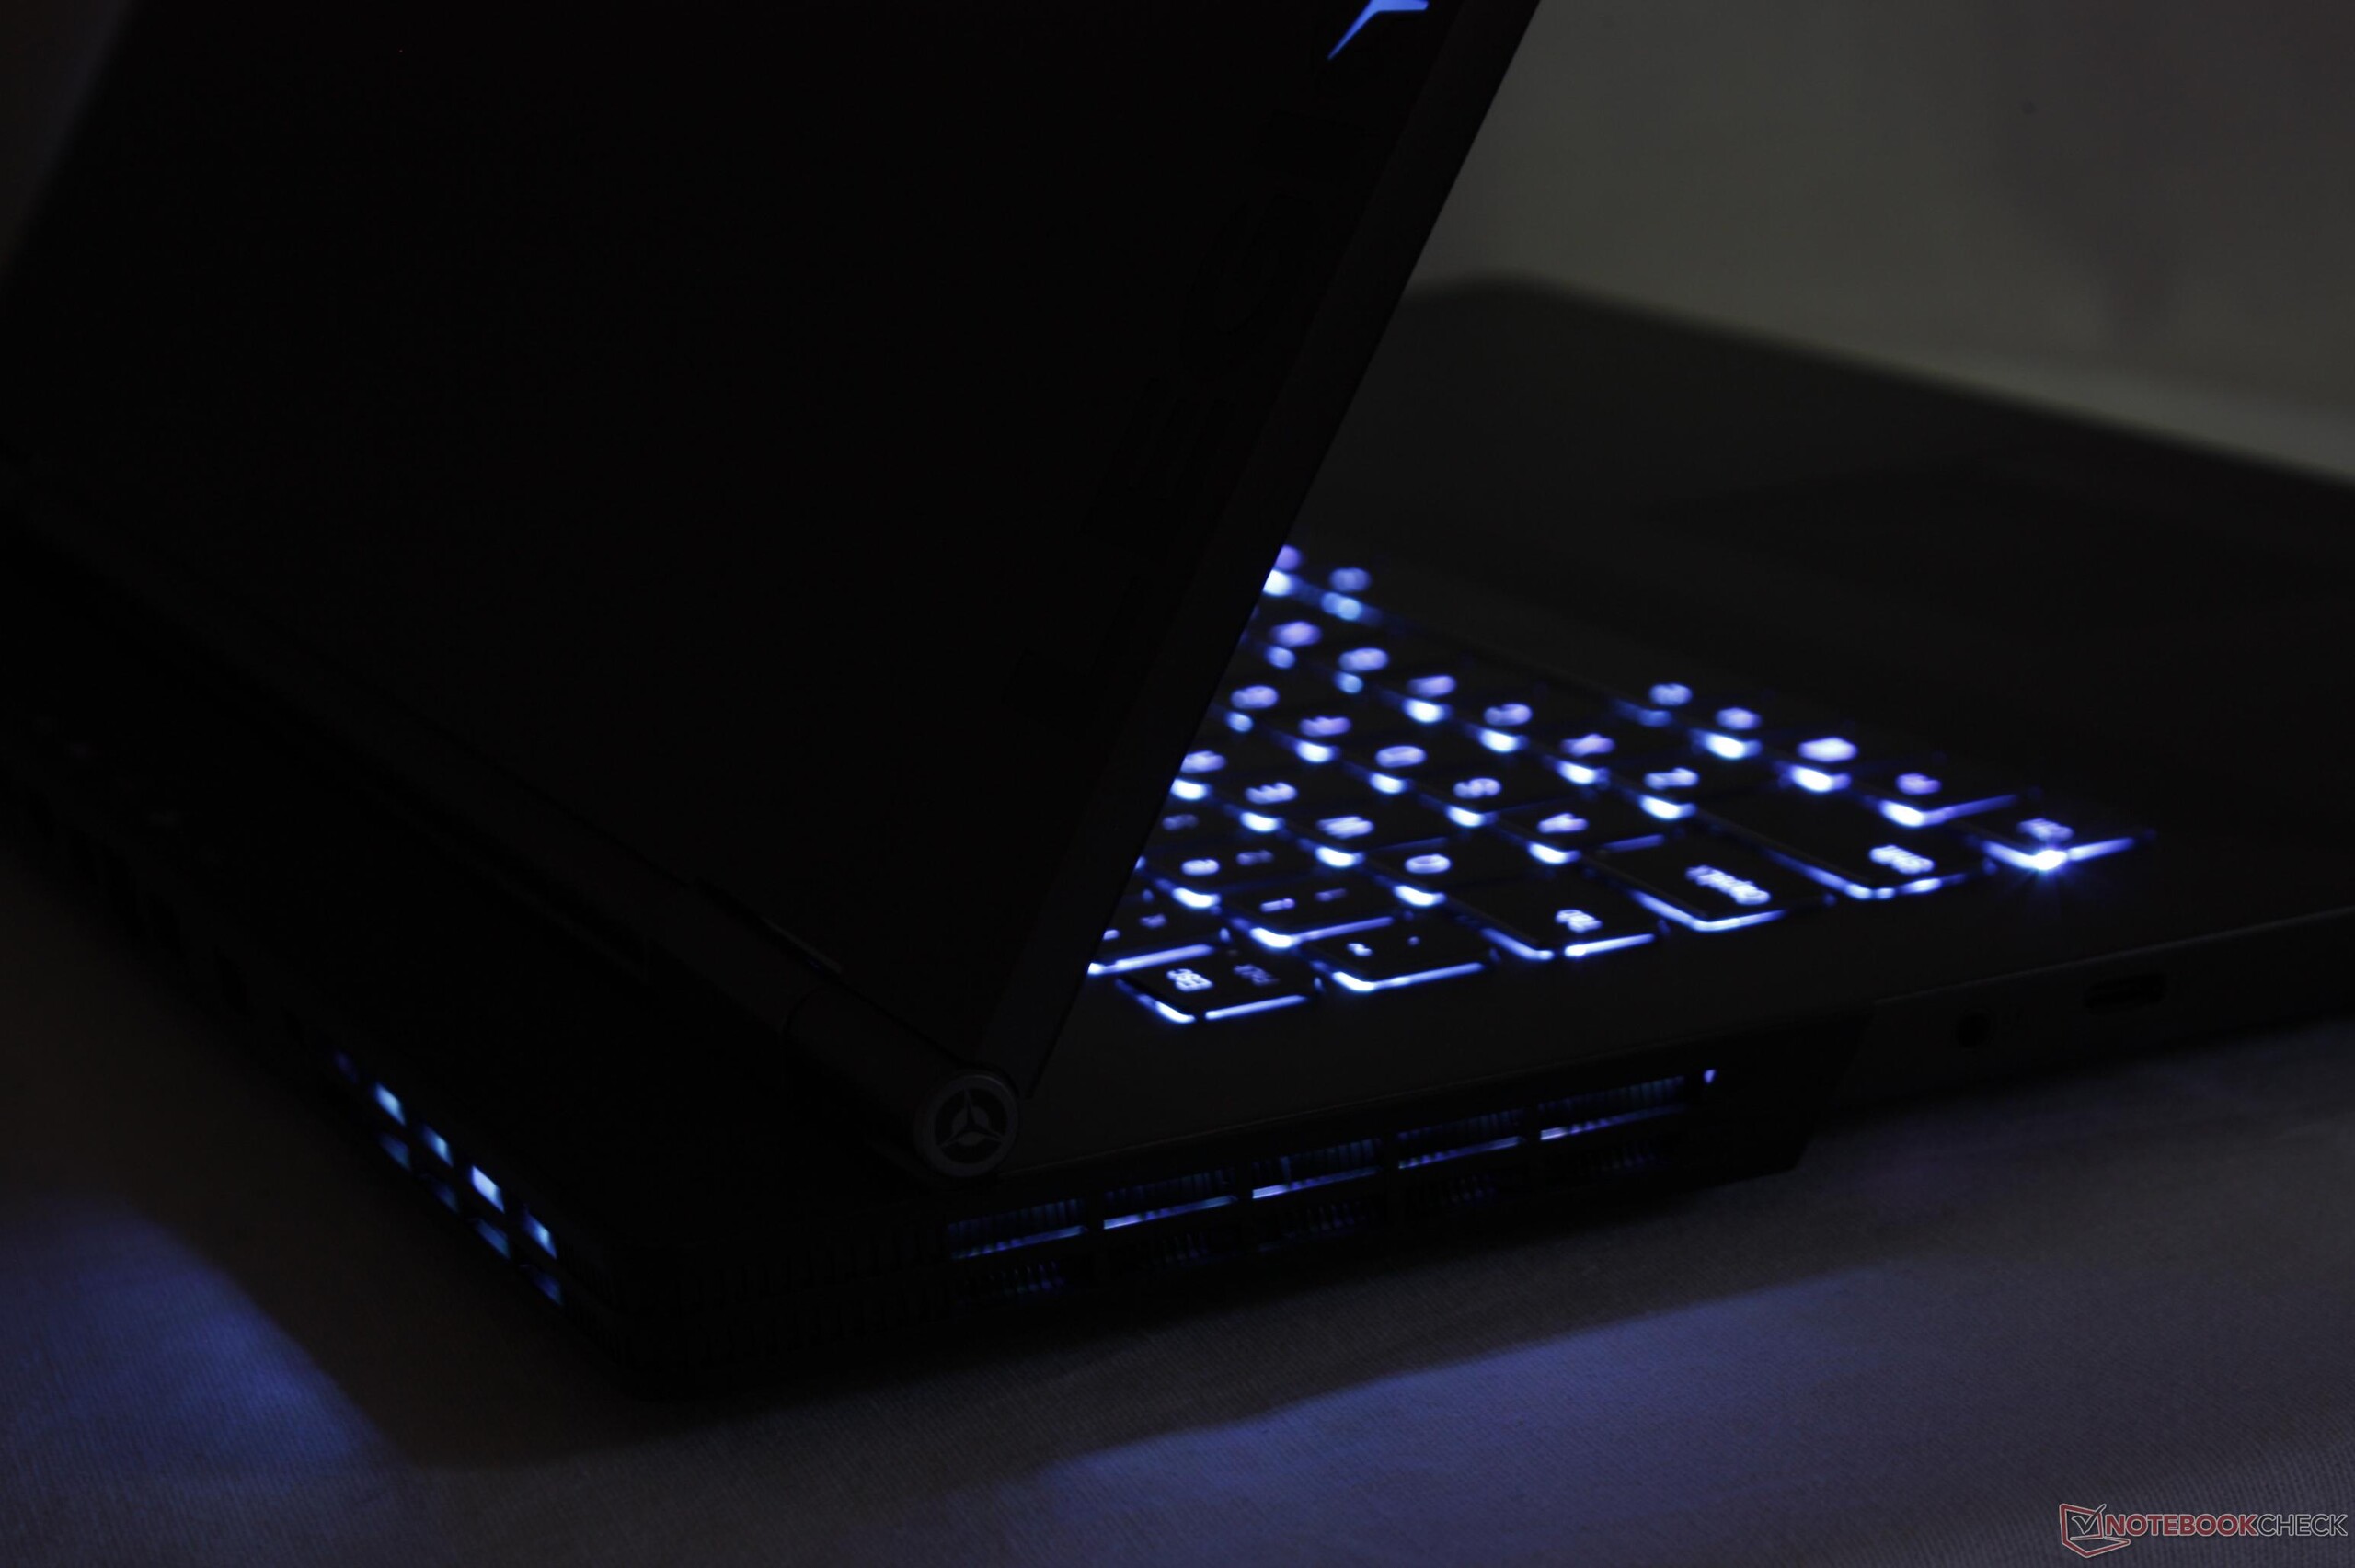
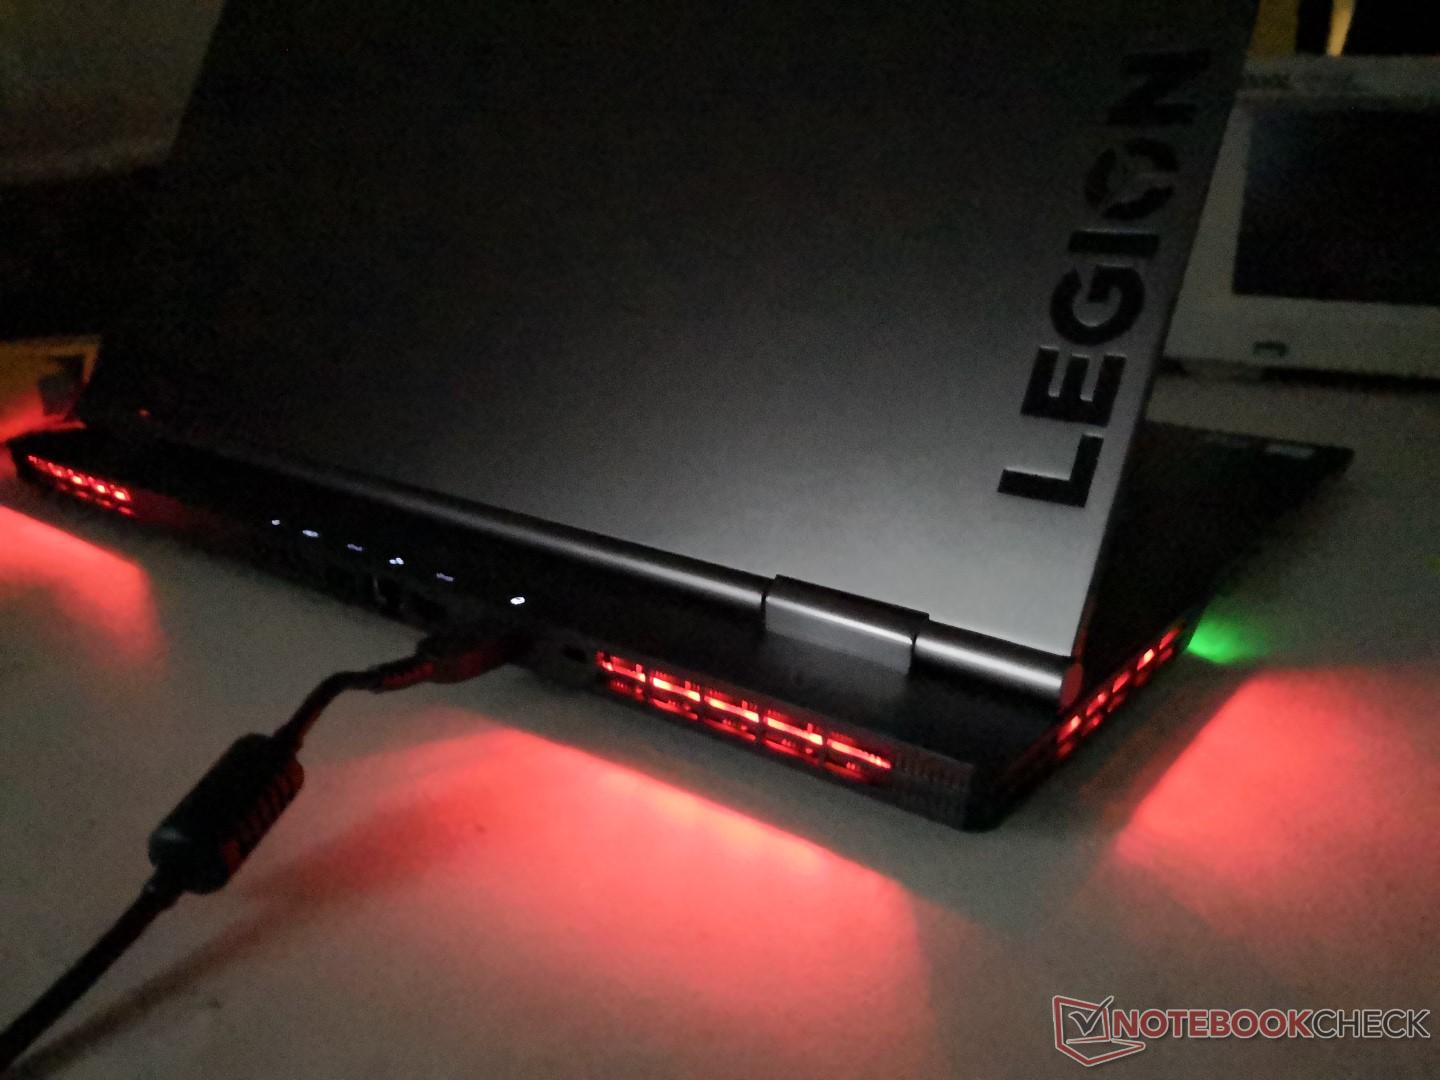
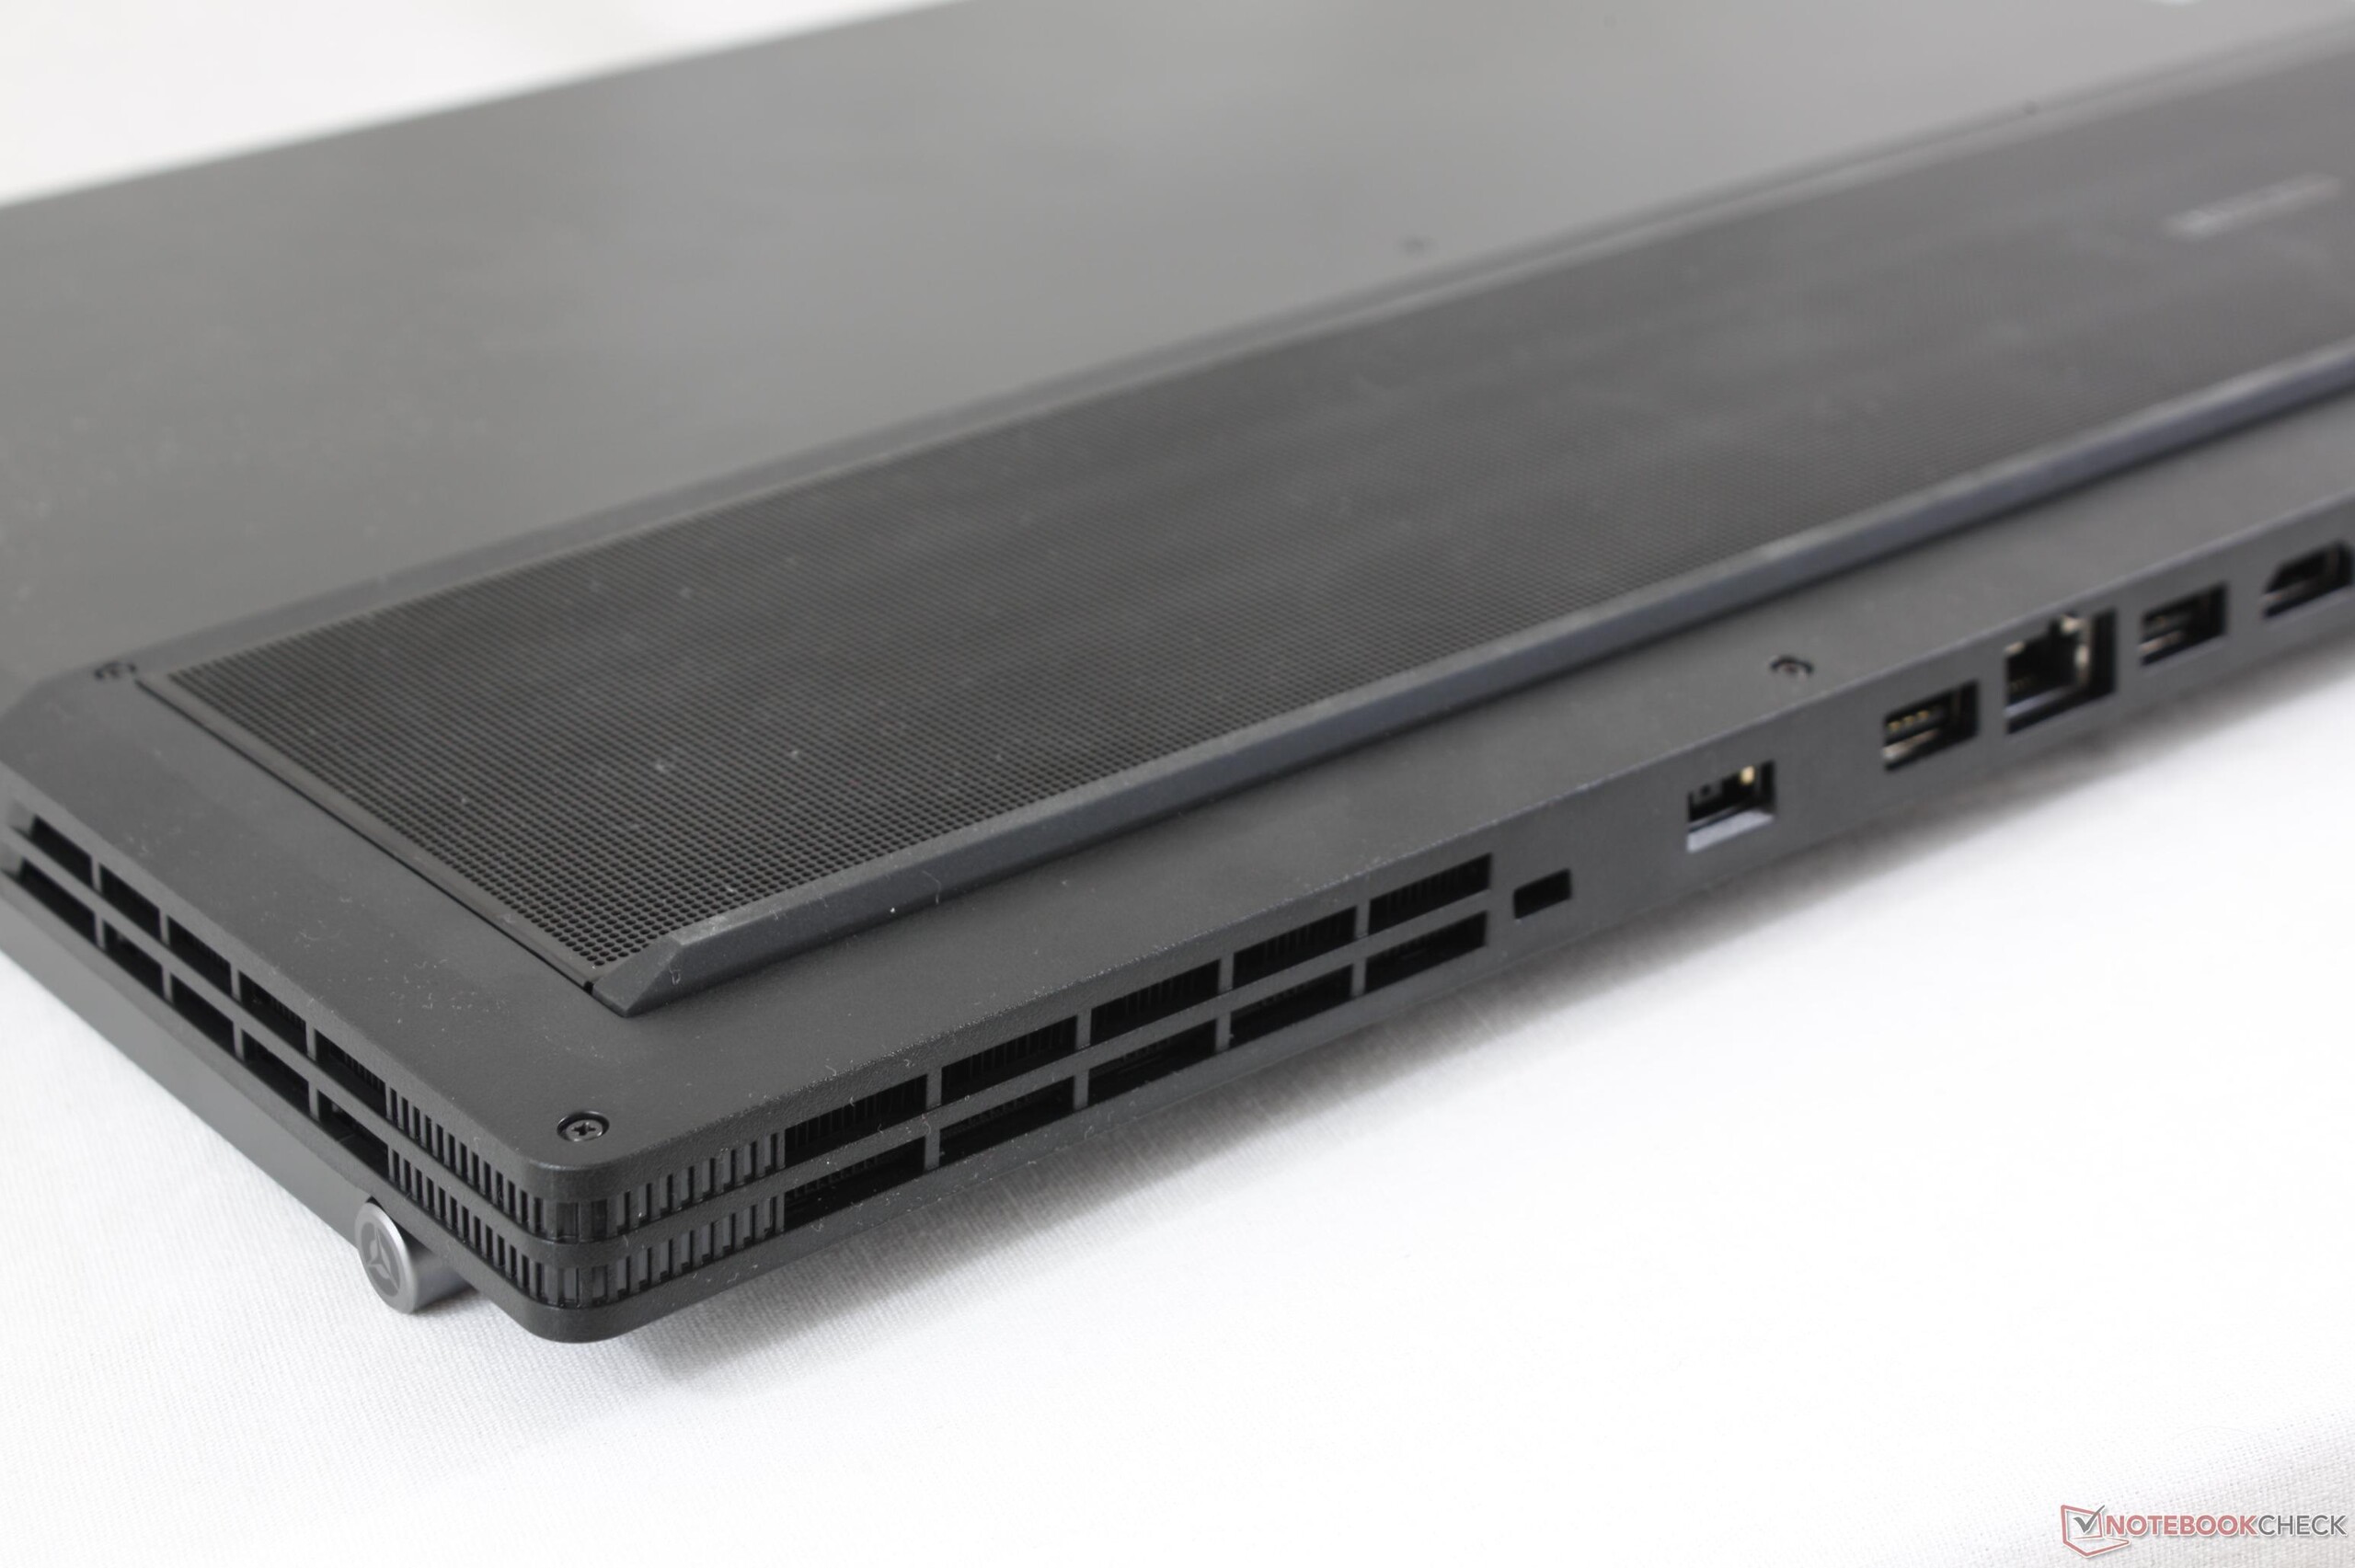
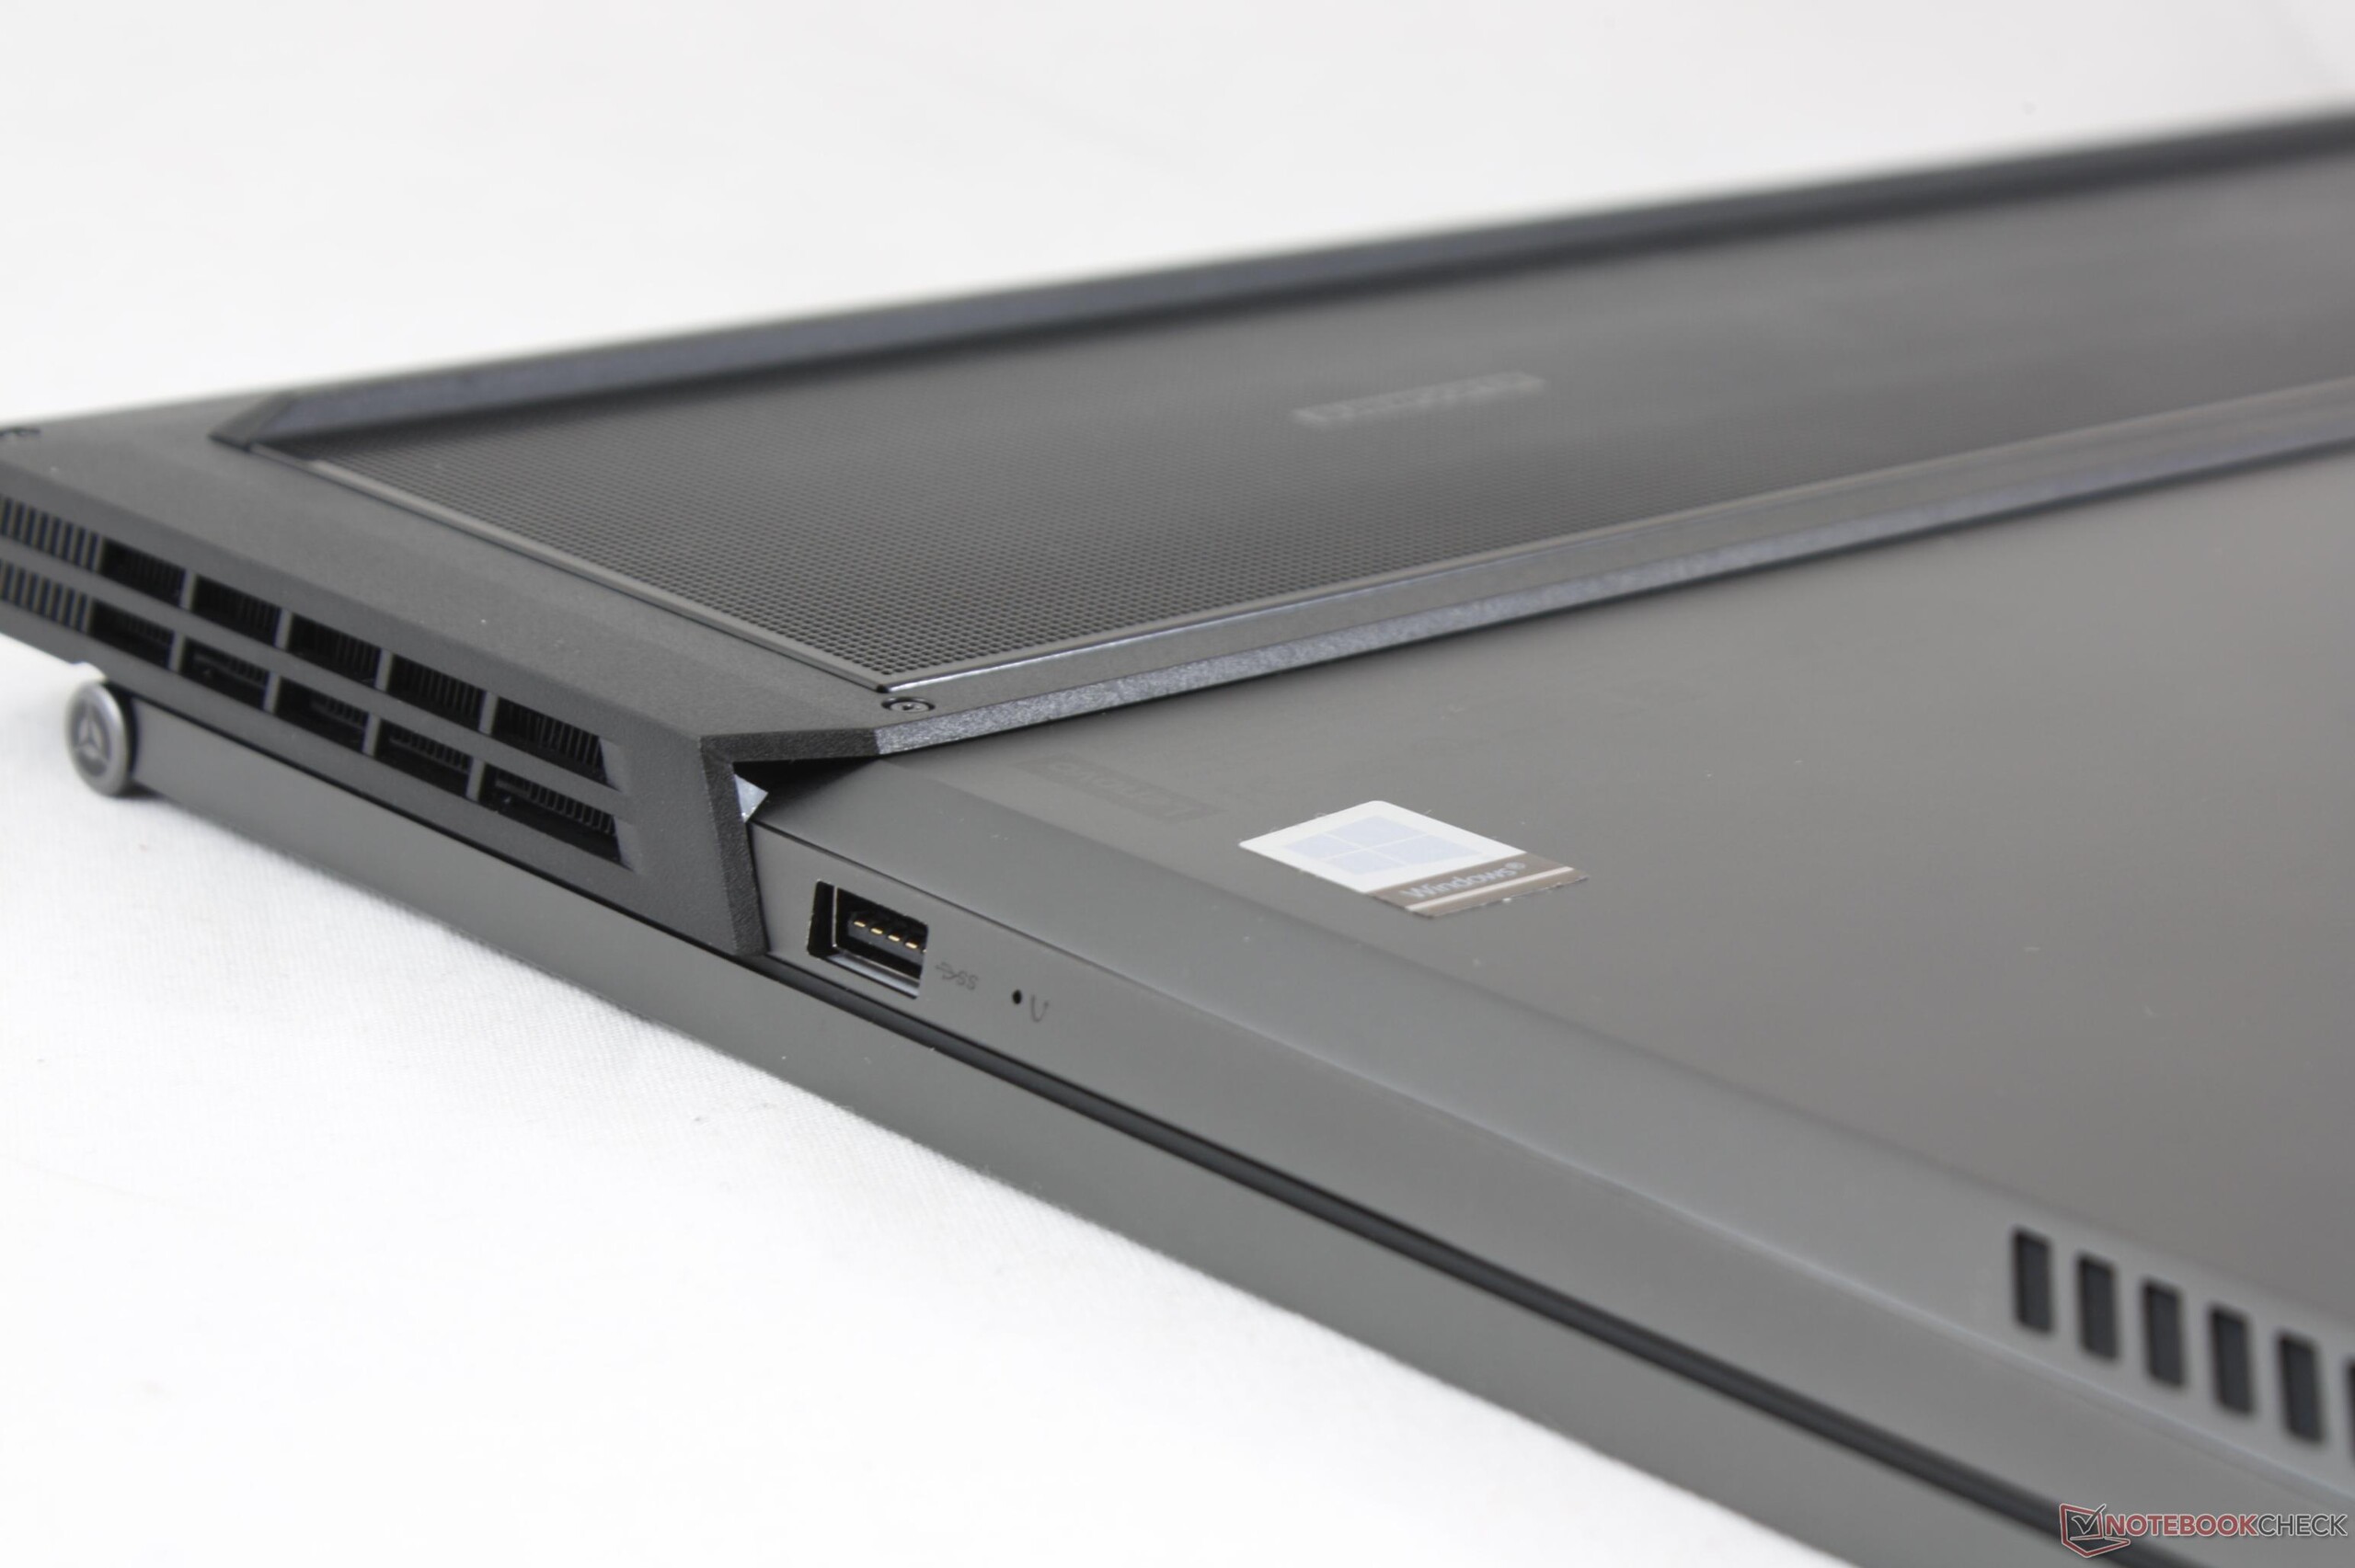
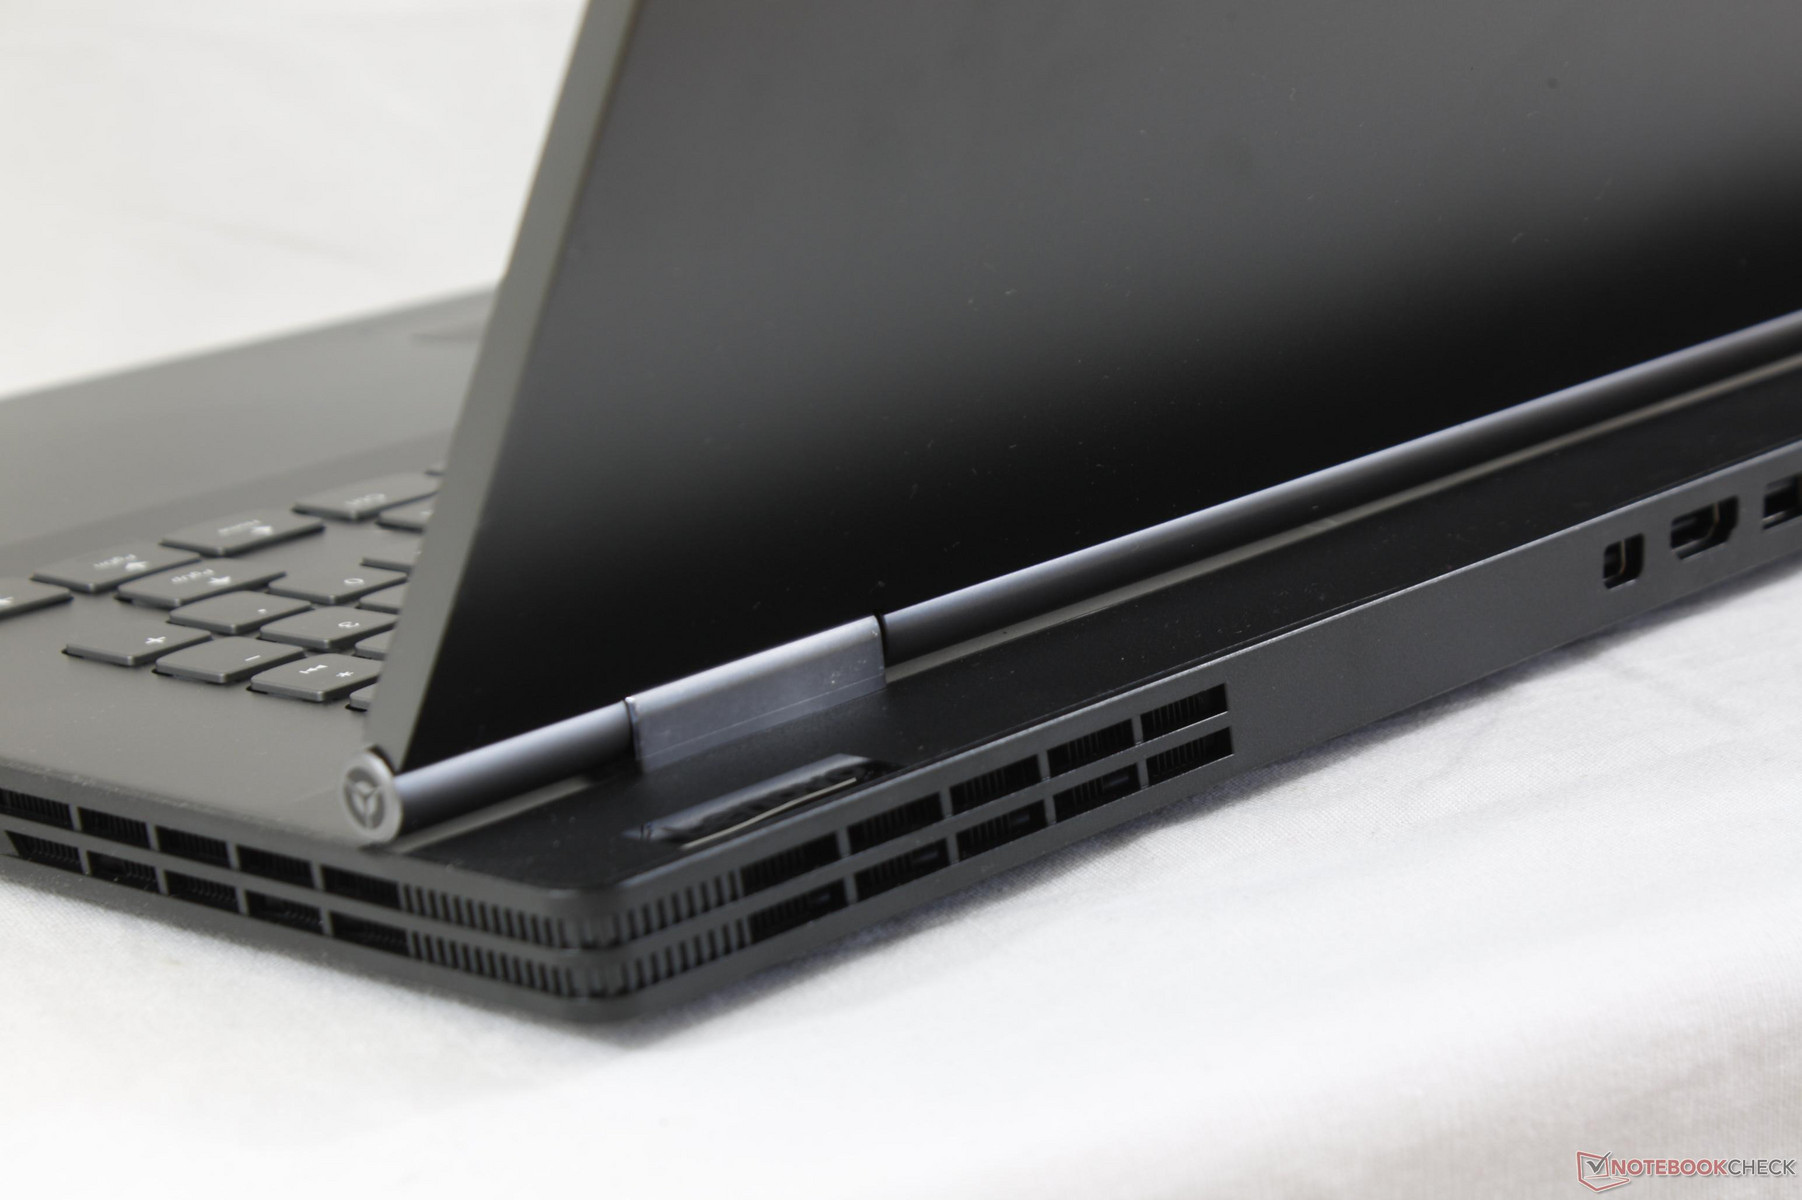
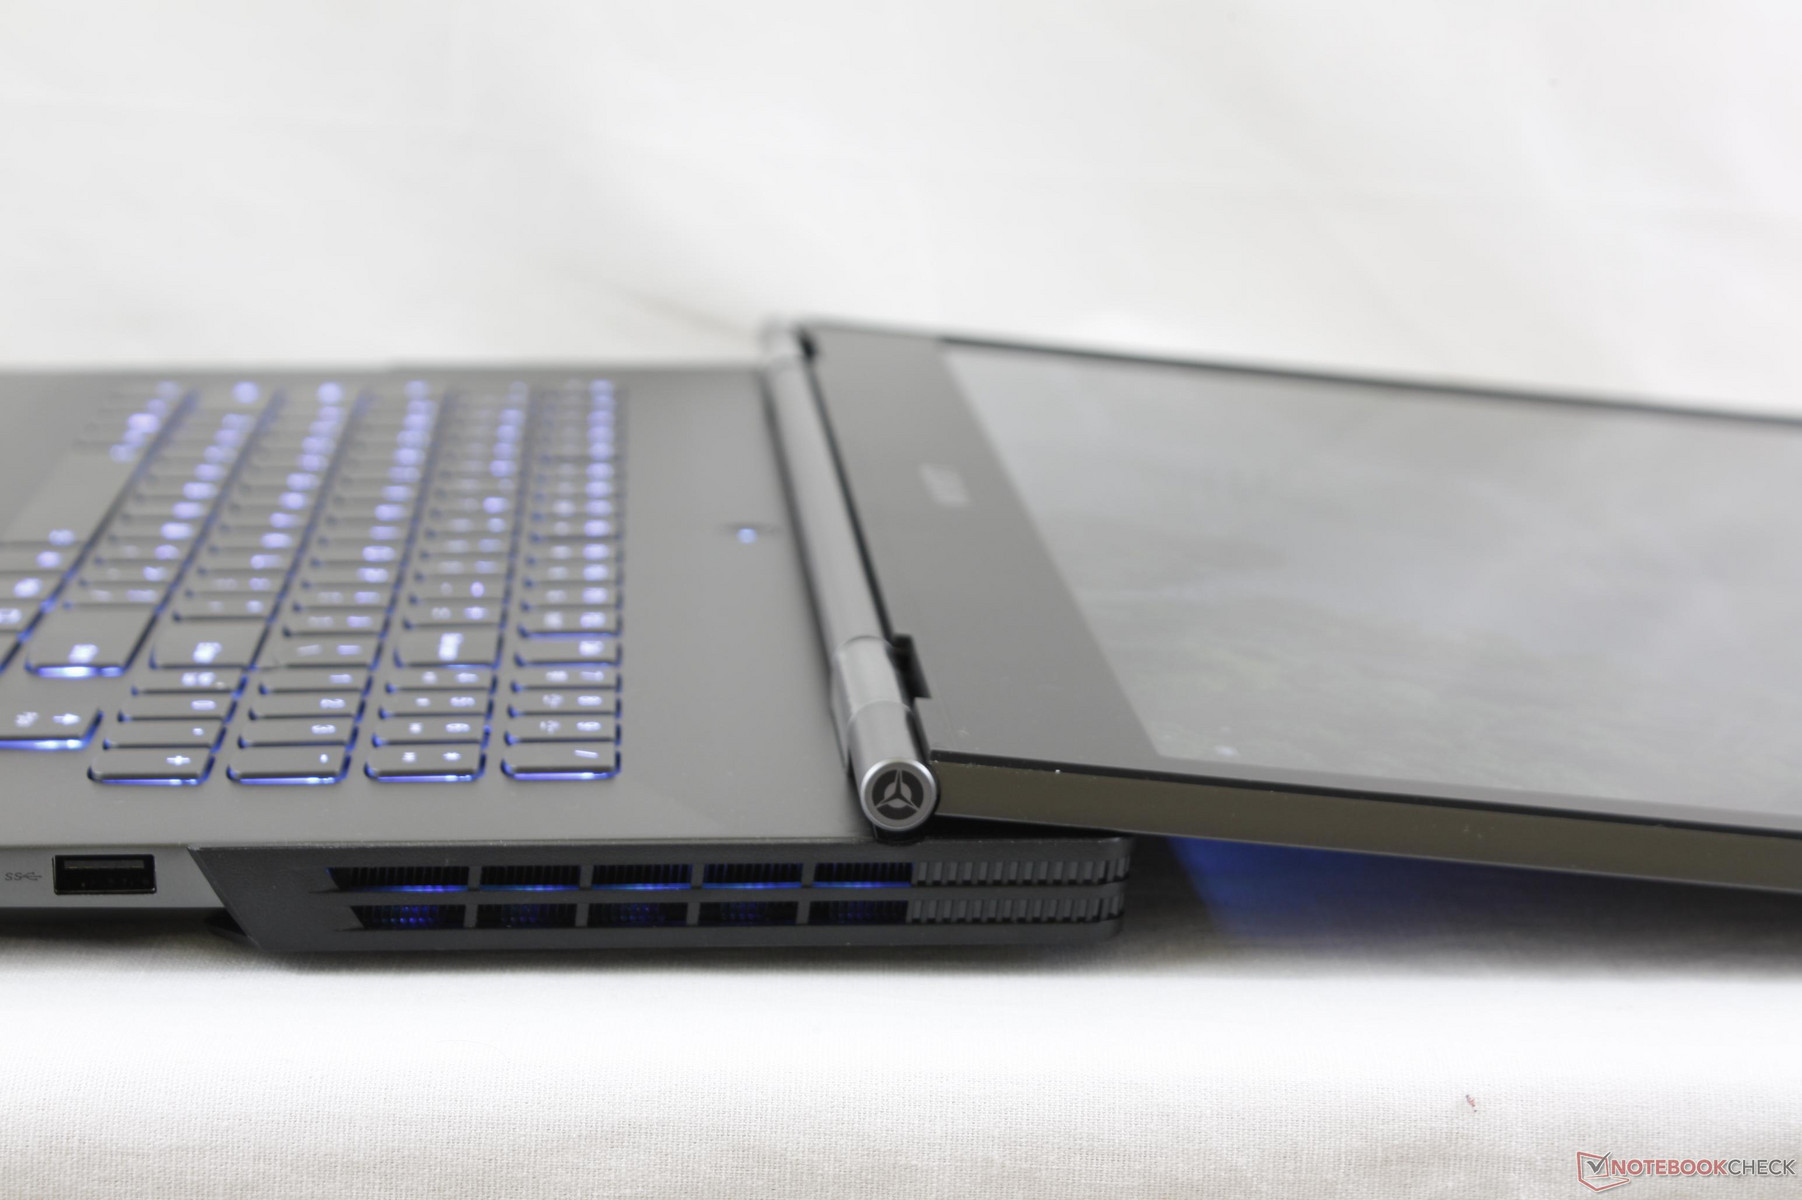
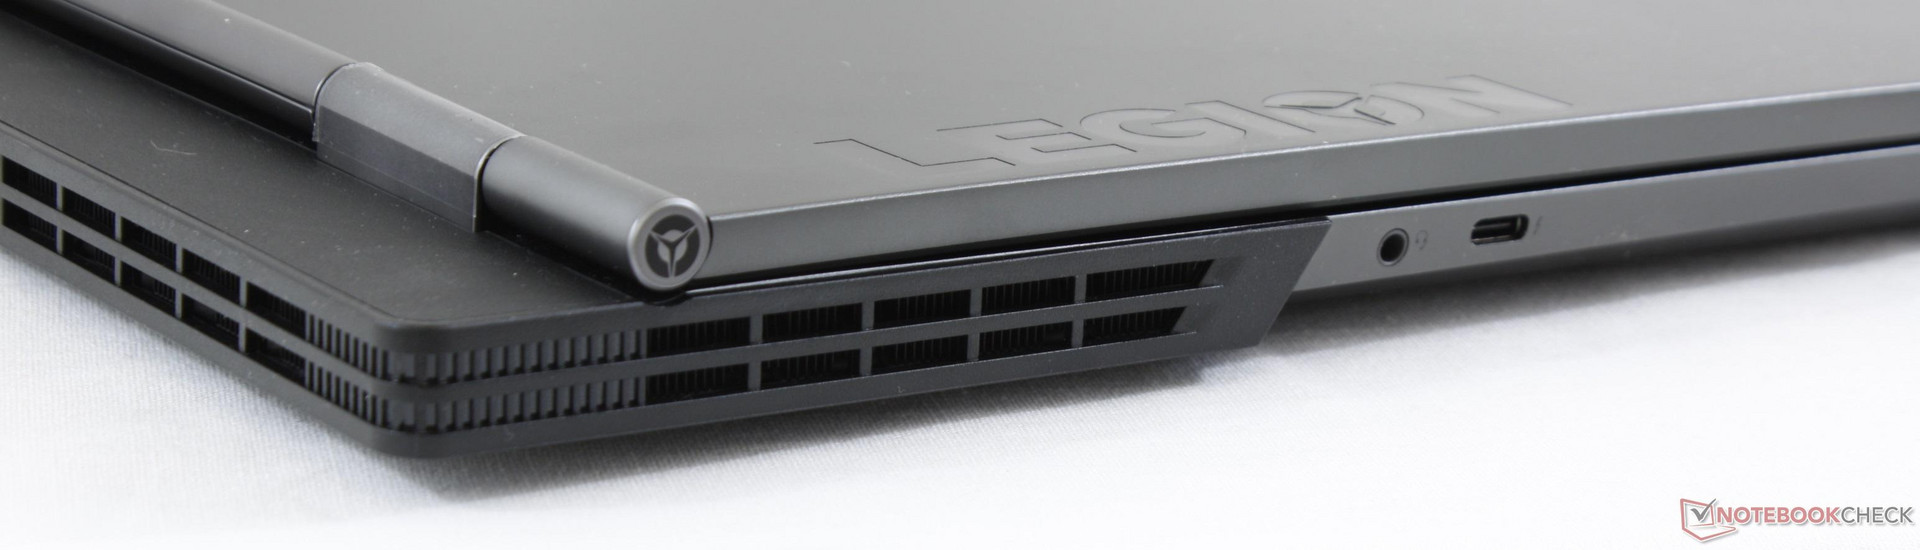
The Y730 is still a gaming laptop at heart with numerous under-the-skin improvements to prove it. Cooling has been strengthened with a wider rear that extends beyond the hinges of the display - similar to the large Asus ROG G700 series or Aorus X7 series - in order to support larger heat sinks and longer heat pipes. New RGB lights are hidden underneath the ventilation grilles for additional color options that can be turned on or off. It's a unique look that works well in multiple environments.
Has chassis quality suffered during the major design transition? The base is rigid with only minor creaking when attempting to twist it and the lid is above average as well. Since the outer lid is so flat, pushing down on its center barely flexes the surface. The keyboard deck flexes slightly but not enough to be of any concern during use. Construction quality is excellent with no unintended gaps or unevenness on our unit. Overall, the Lenovo feels a tad sturdier than the Asus ROG GL703 series for a better first impression.
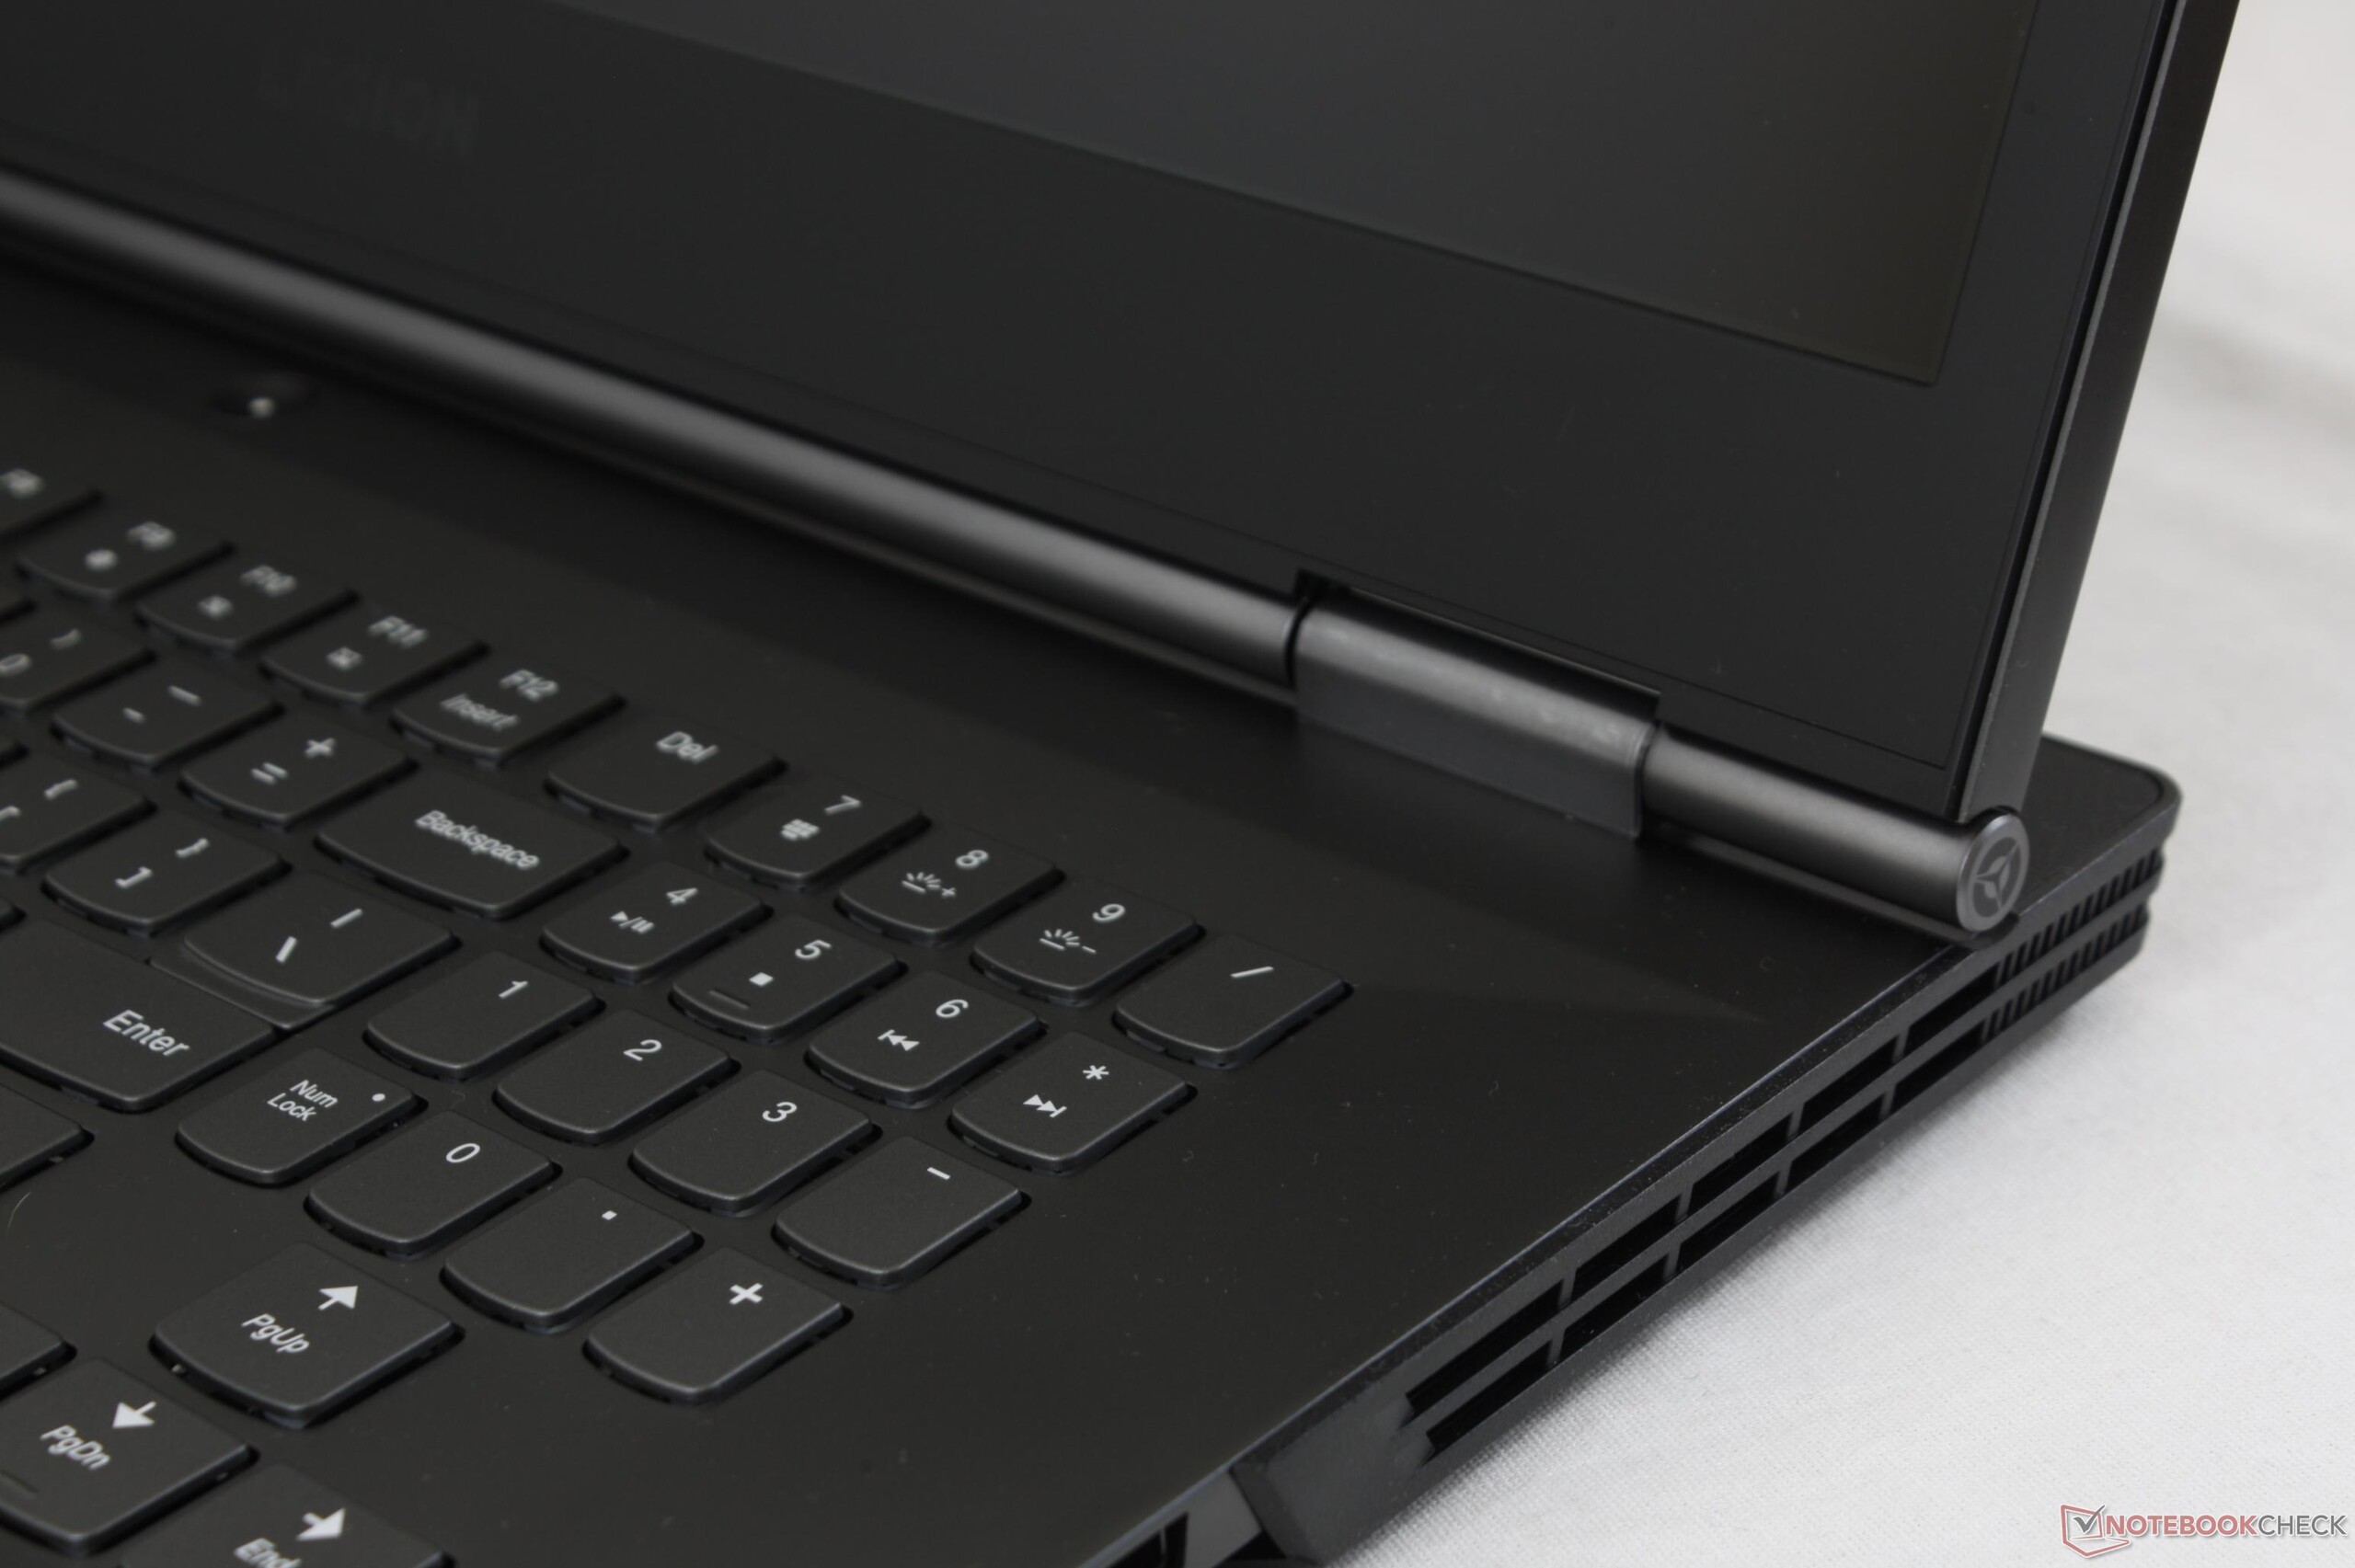
By far the weakest aspect of the design is the dual 180-degree hinges as they become looser at wide angles instead remaining firm throughout. Expect the lid to teeter a bit if not typing on a flat desk. We suspect that the rigidity of the hinges could weaken over time.
Footprint is slightly larger than some competitors because of the extended rear design. For example, the MSI GE73, Dell G3 17, and Asus Strix GL703 are all notably shorter in width by 20 mm or more. The Lenovo makes up for this by being thinner at just under 22 mm in thickness. Weight differences are quite minimal with the Y730 being only about 100 g lighter than the rest.
Connectivity
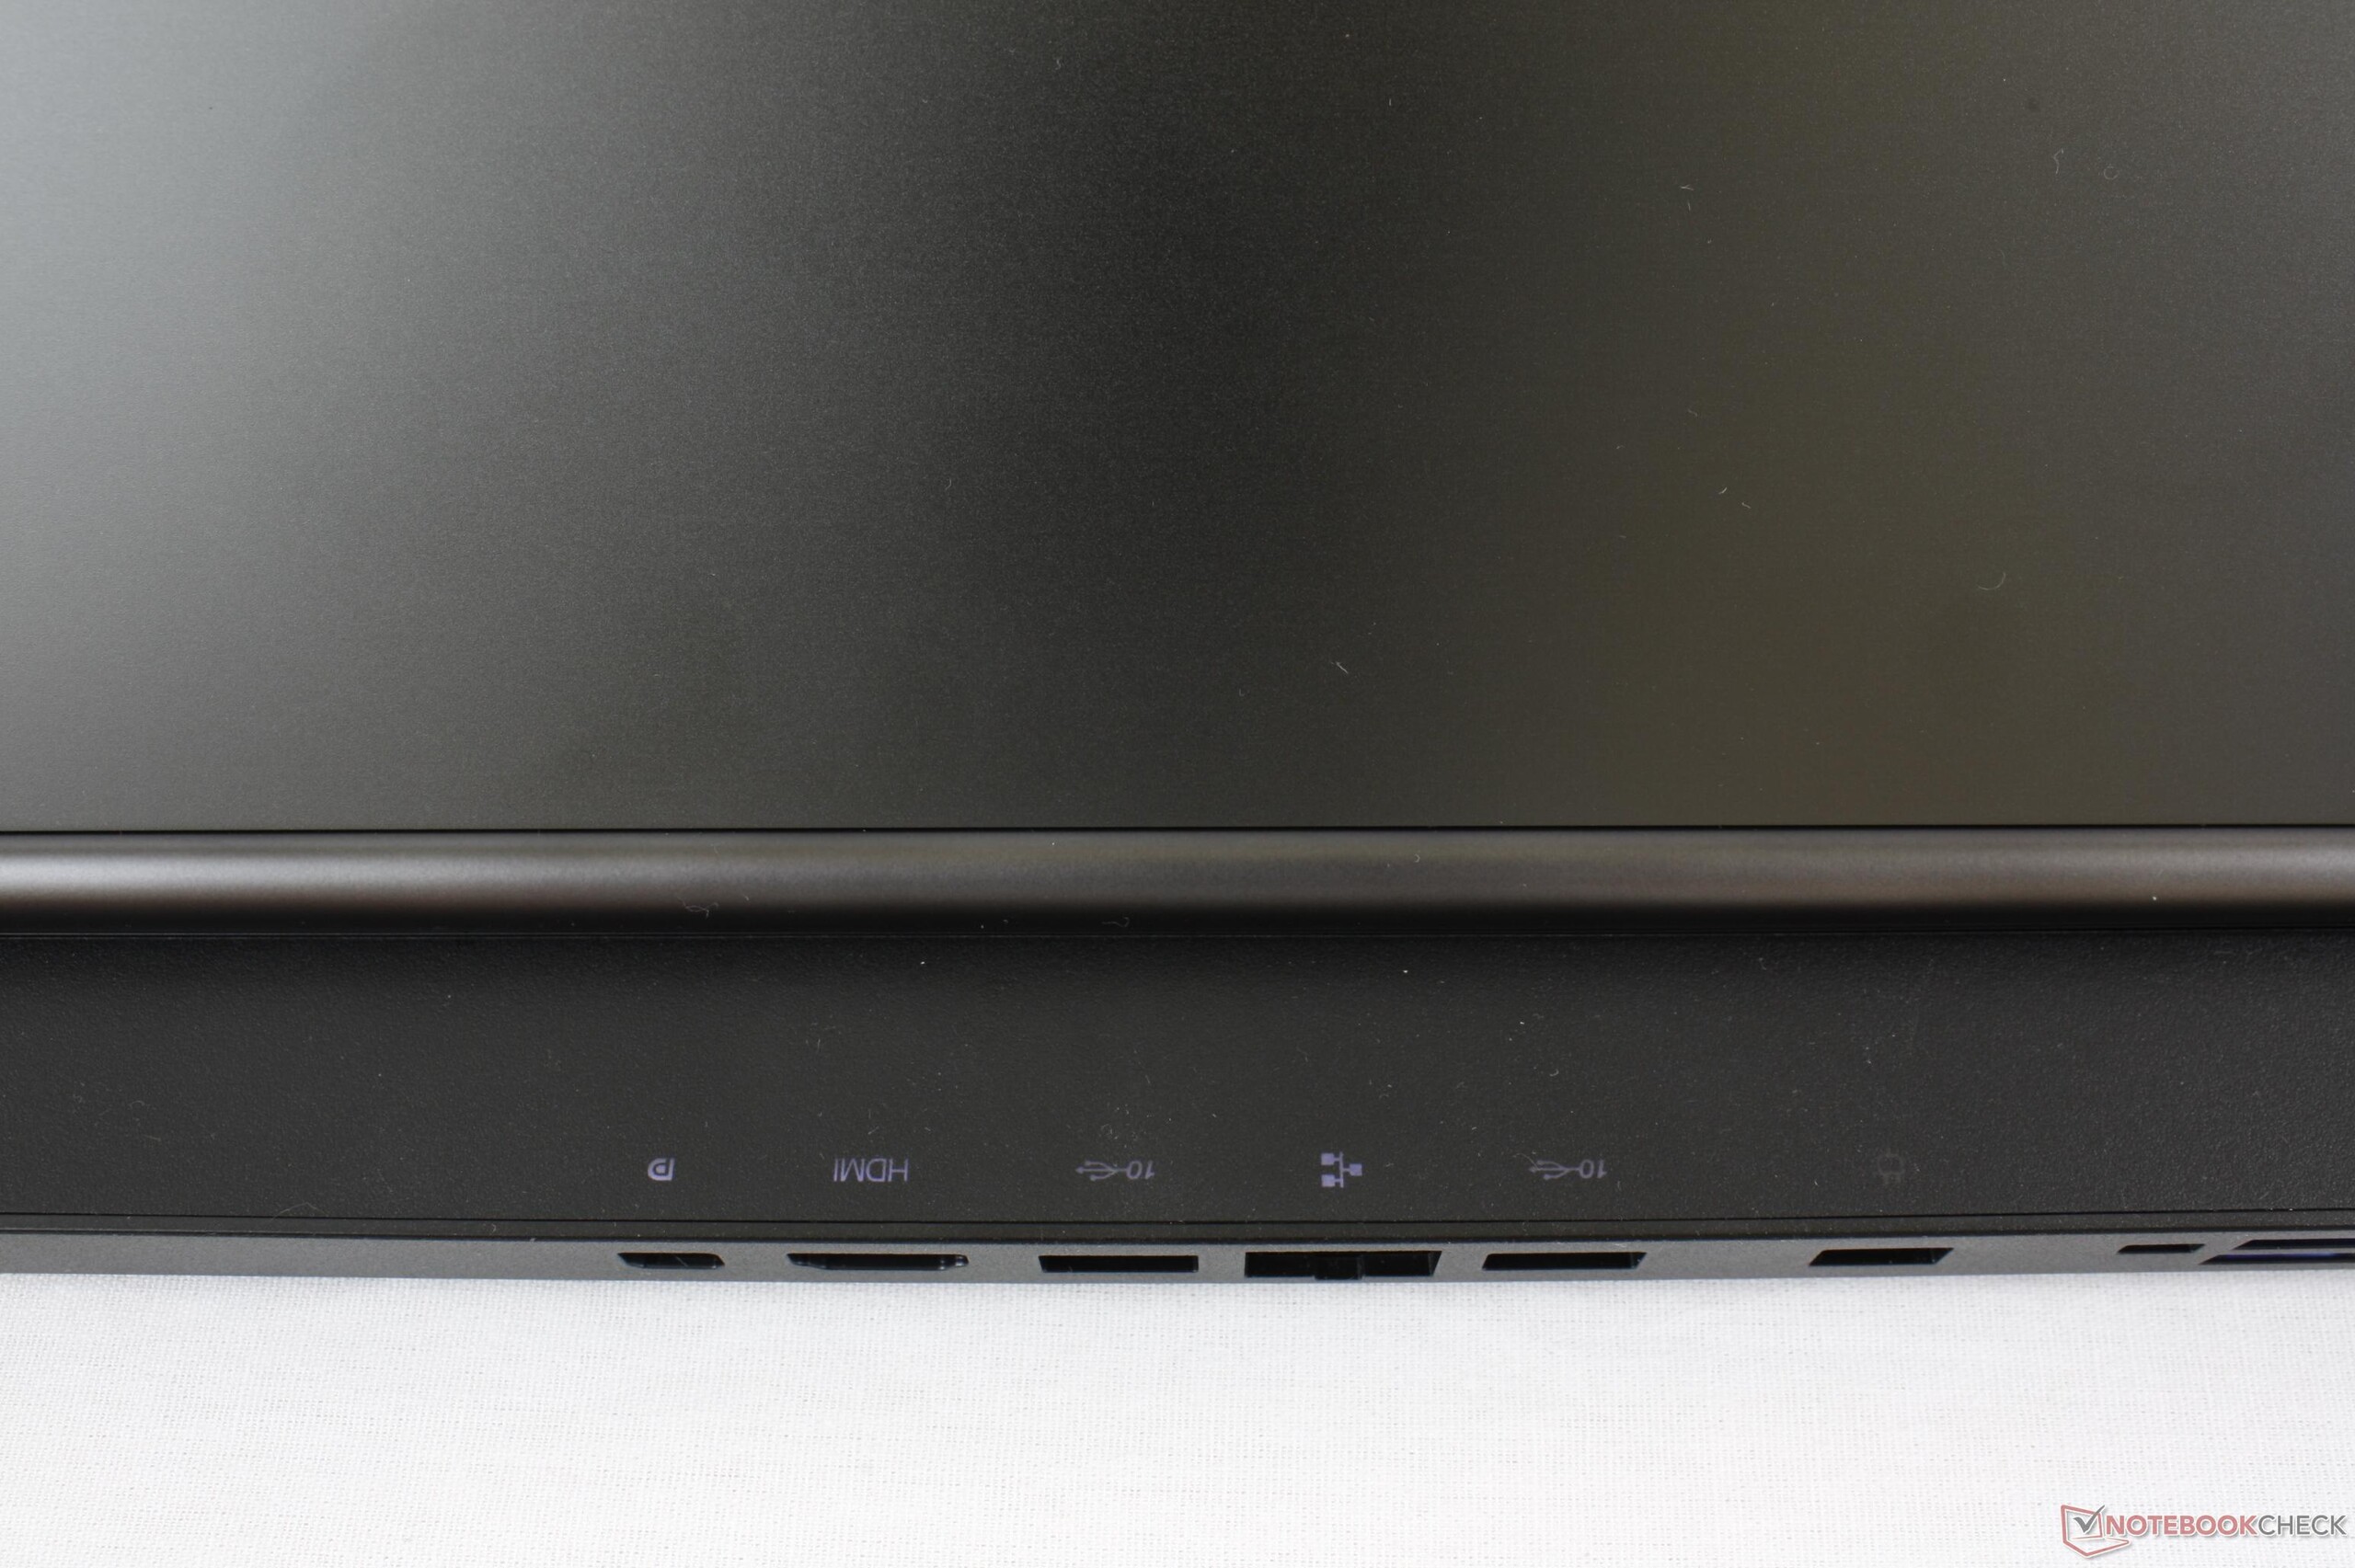
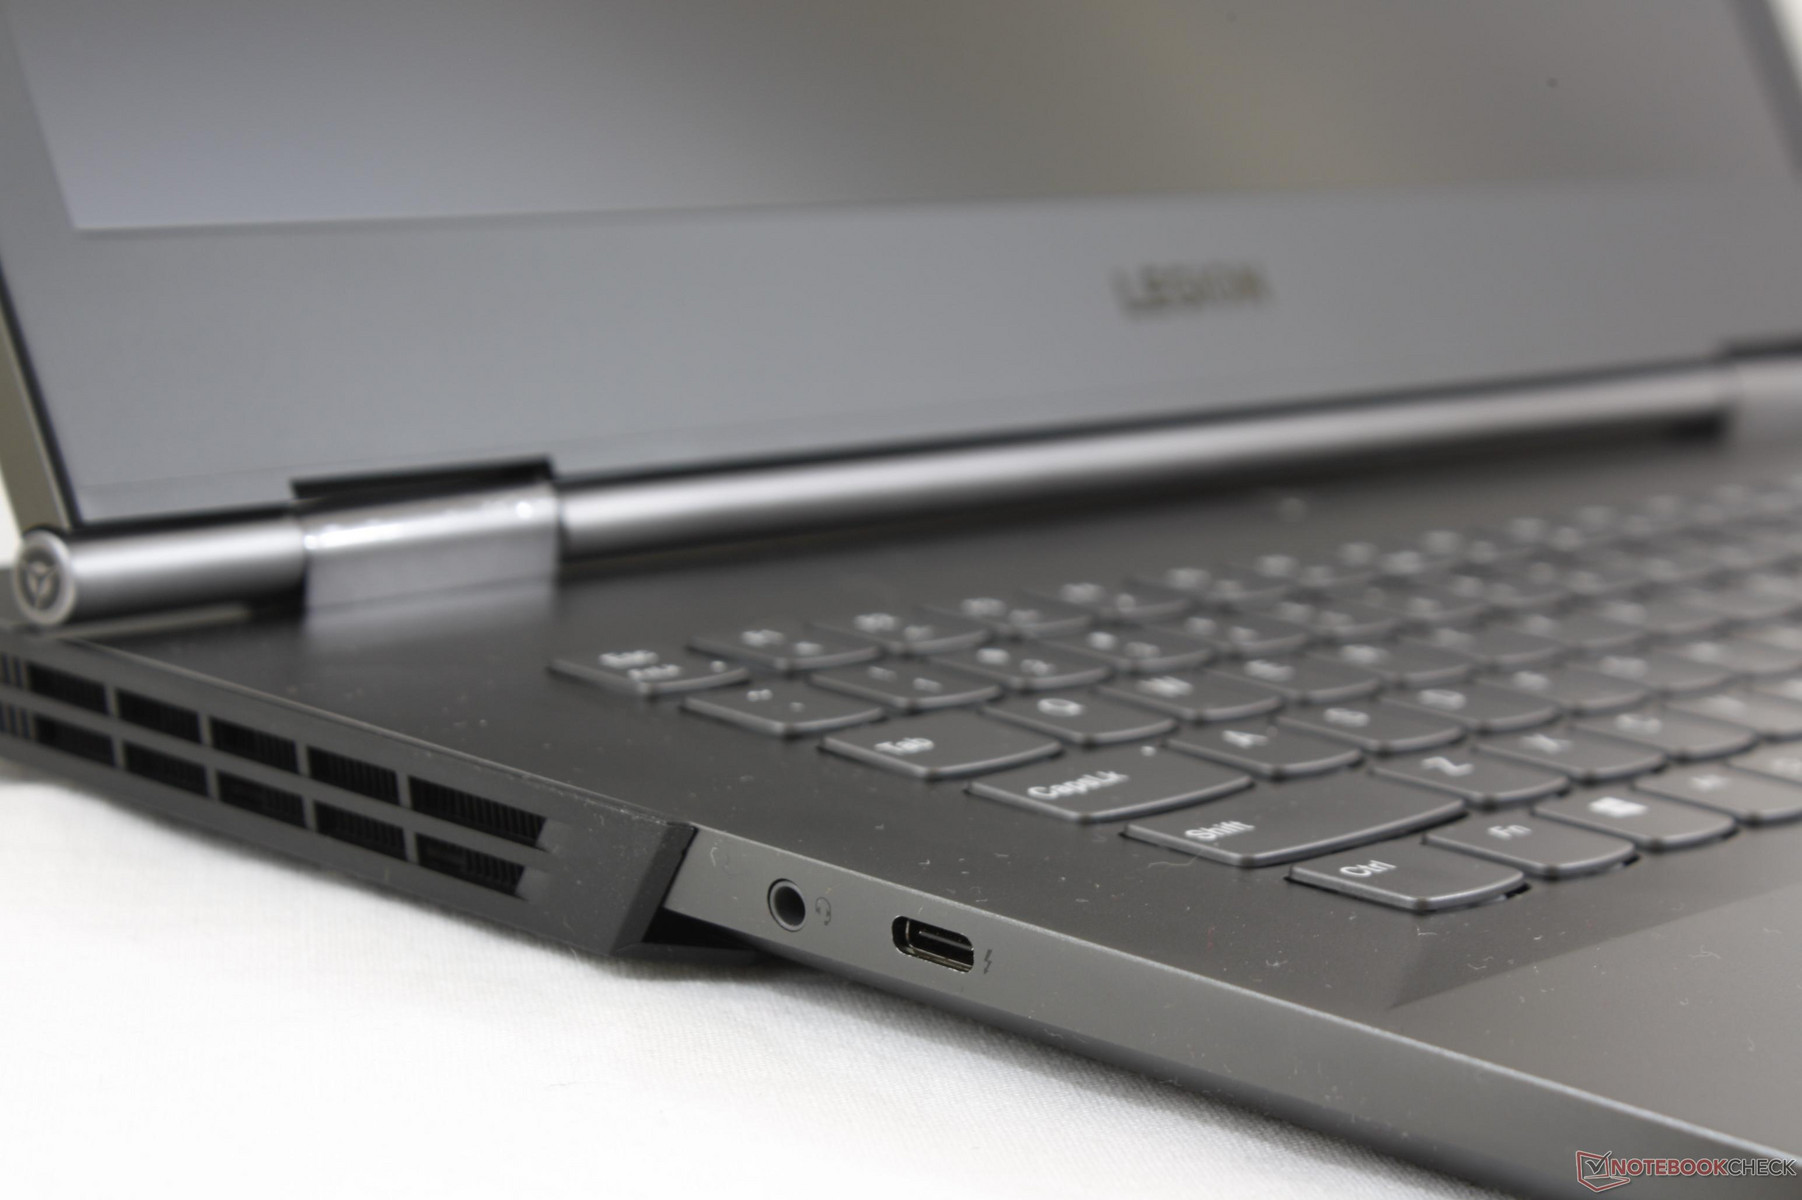
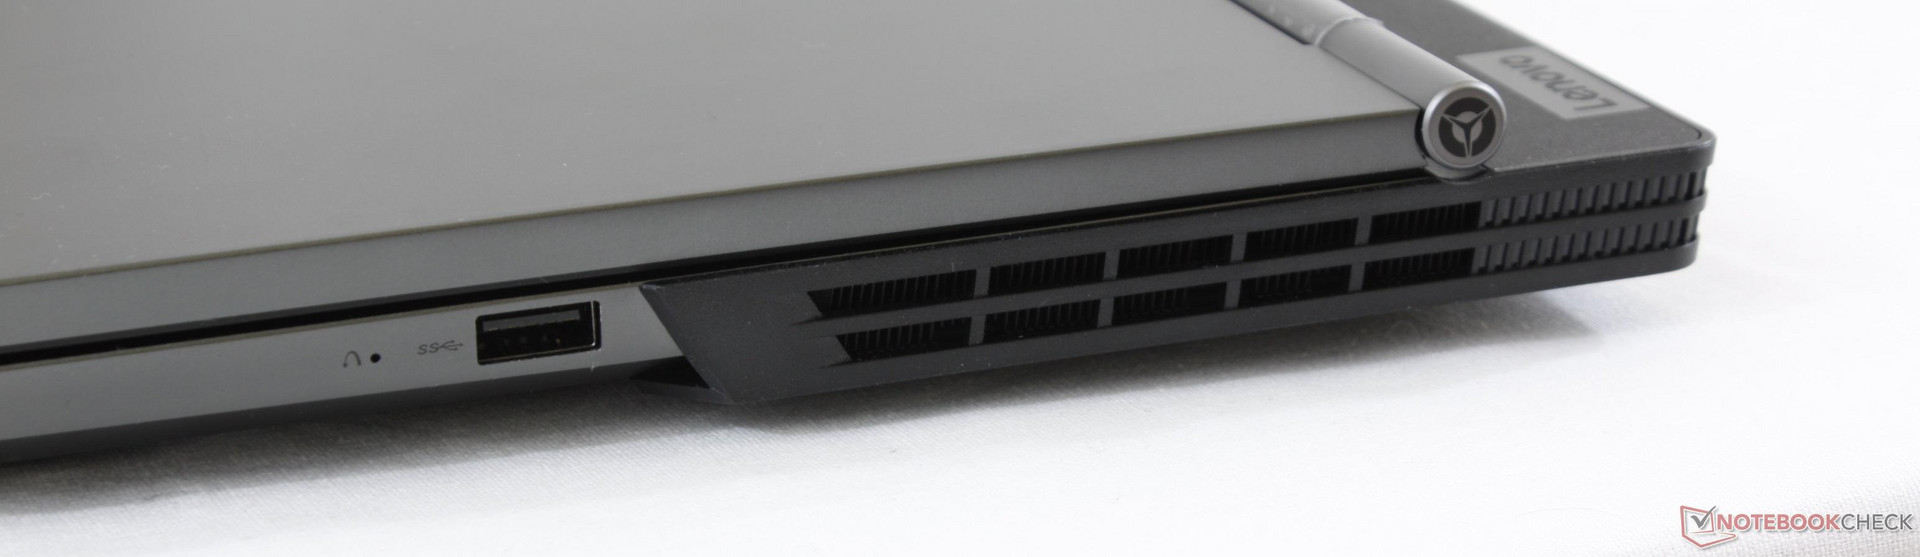
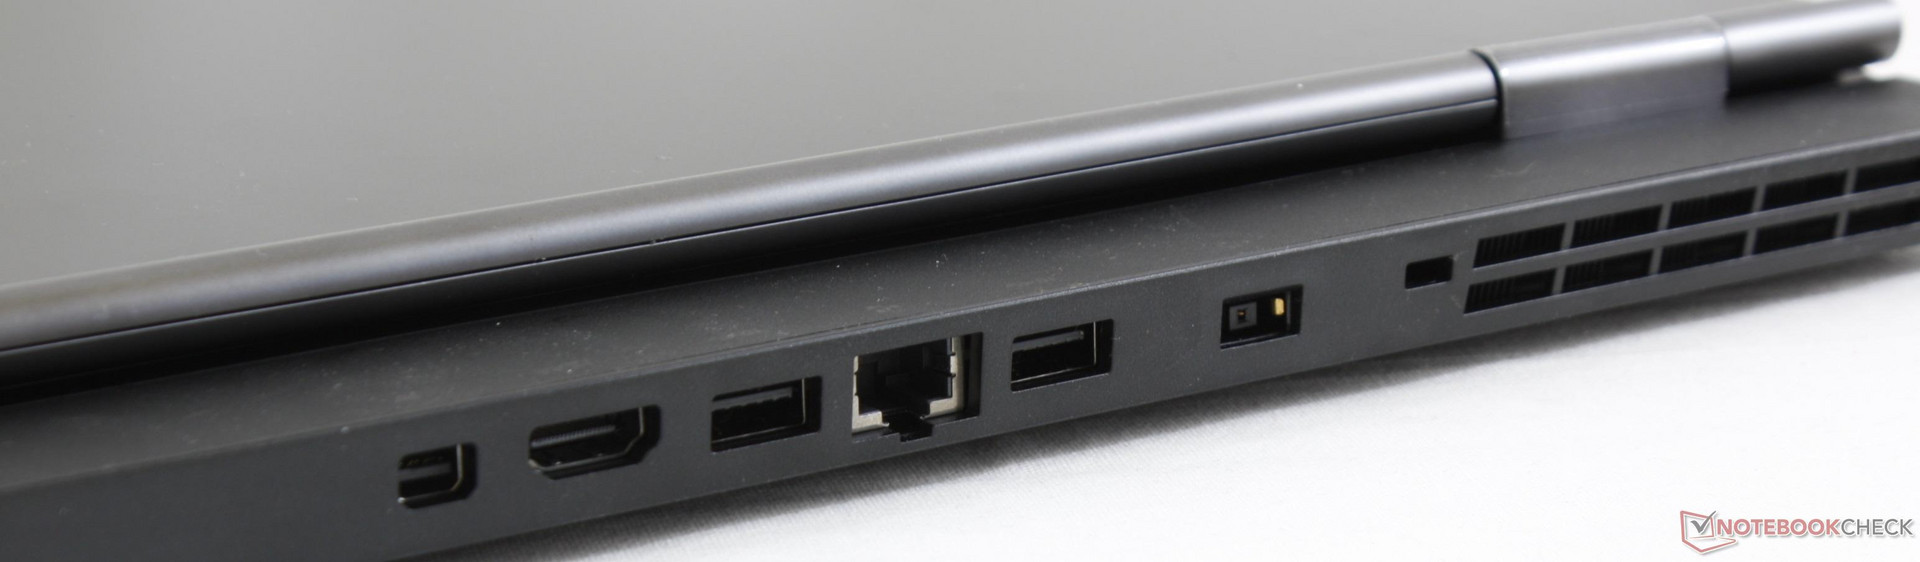
Despite being a 17-inch gaming laptop, the Y730 has a somewhat limited selection of ports. There are only three USB Type-A ports with two of them located on the rear edge of the unit with no SD card reader to speak of. In fact, most of the ports are tightly packed along the rear with only a few on the left and right-hand edges. Port positioning is certainly not as convenient as it could have been especially since there are no USB Type-A ports along the left edge.
We commend Lenovo for including a Thunderbolt 3 port and a rear LED light that makes the back ports easier to see and access.
Communication
Wireless is provided by a 2x2 RealTek RTL8822BE M.2 adapter with integrated Bluetooth 4.1. We experienced no connectivity issues during our time with the test unit. Laptops with Killer modules hand more gamer-centric features to boost wireless performance.
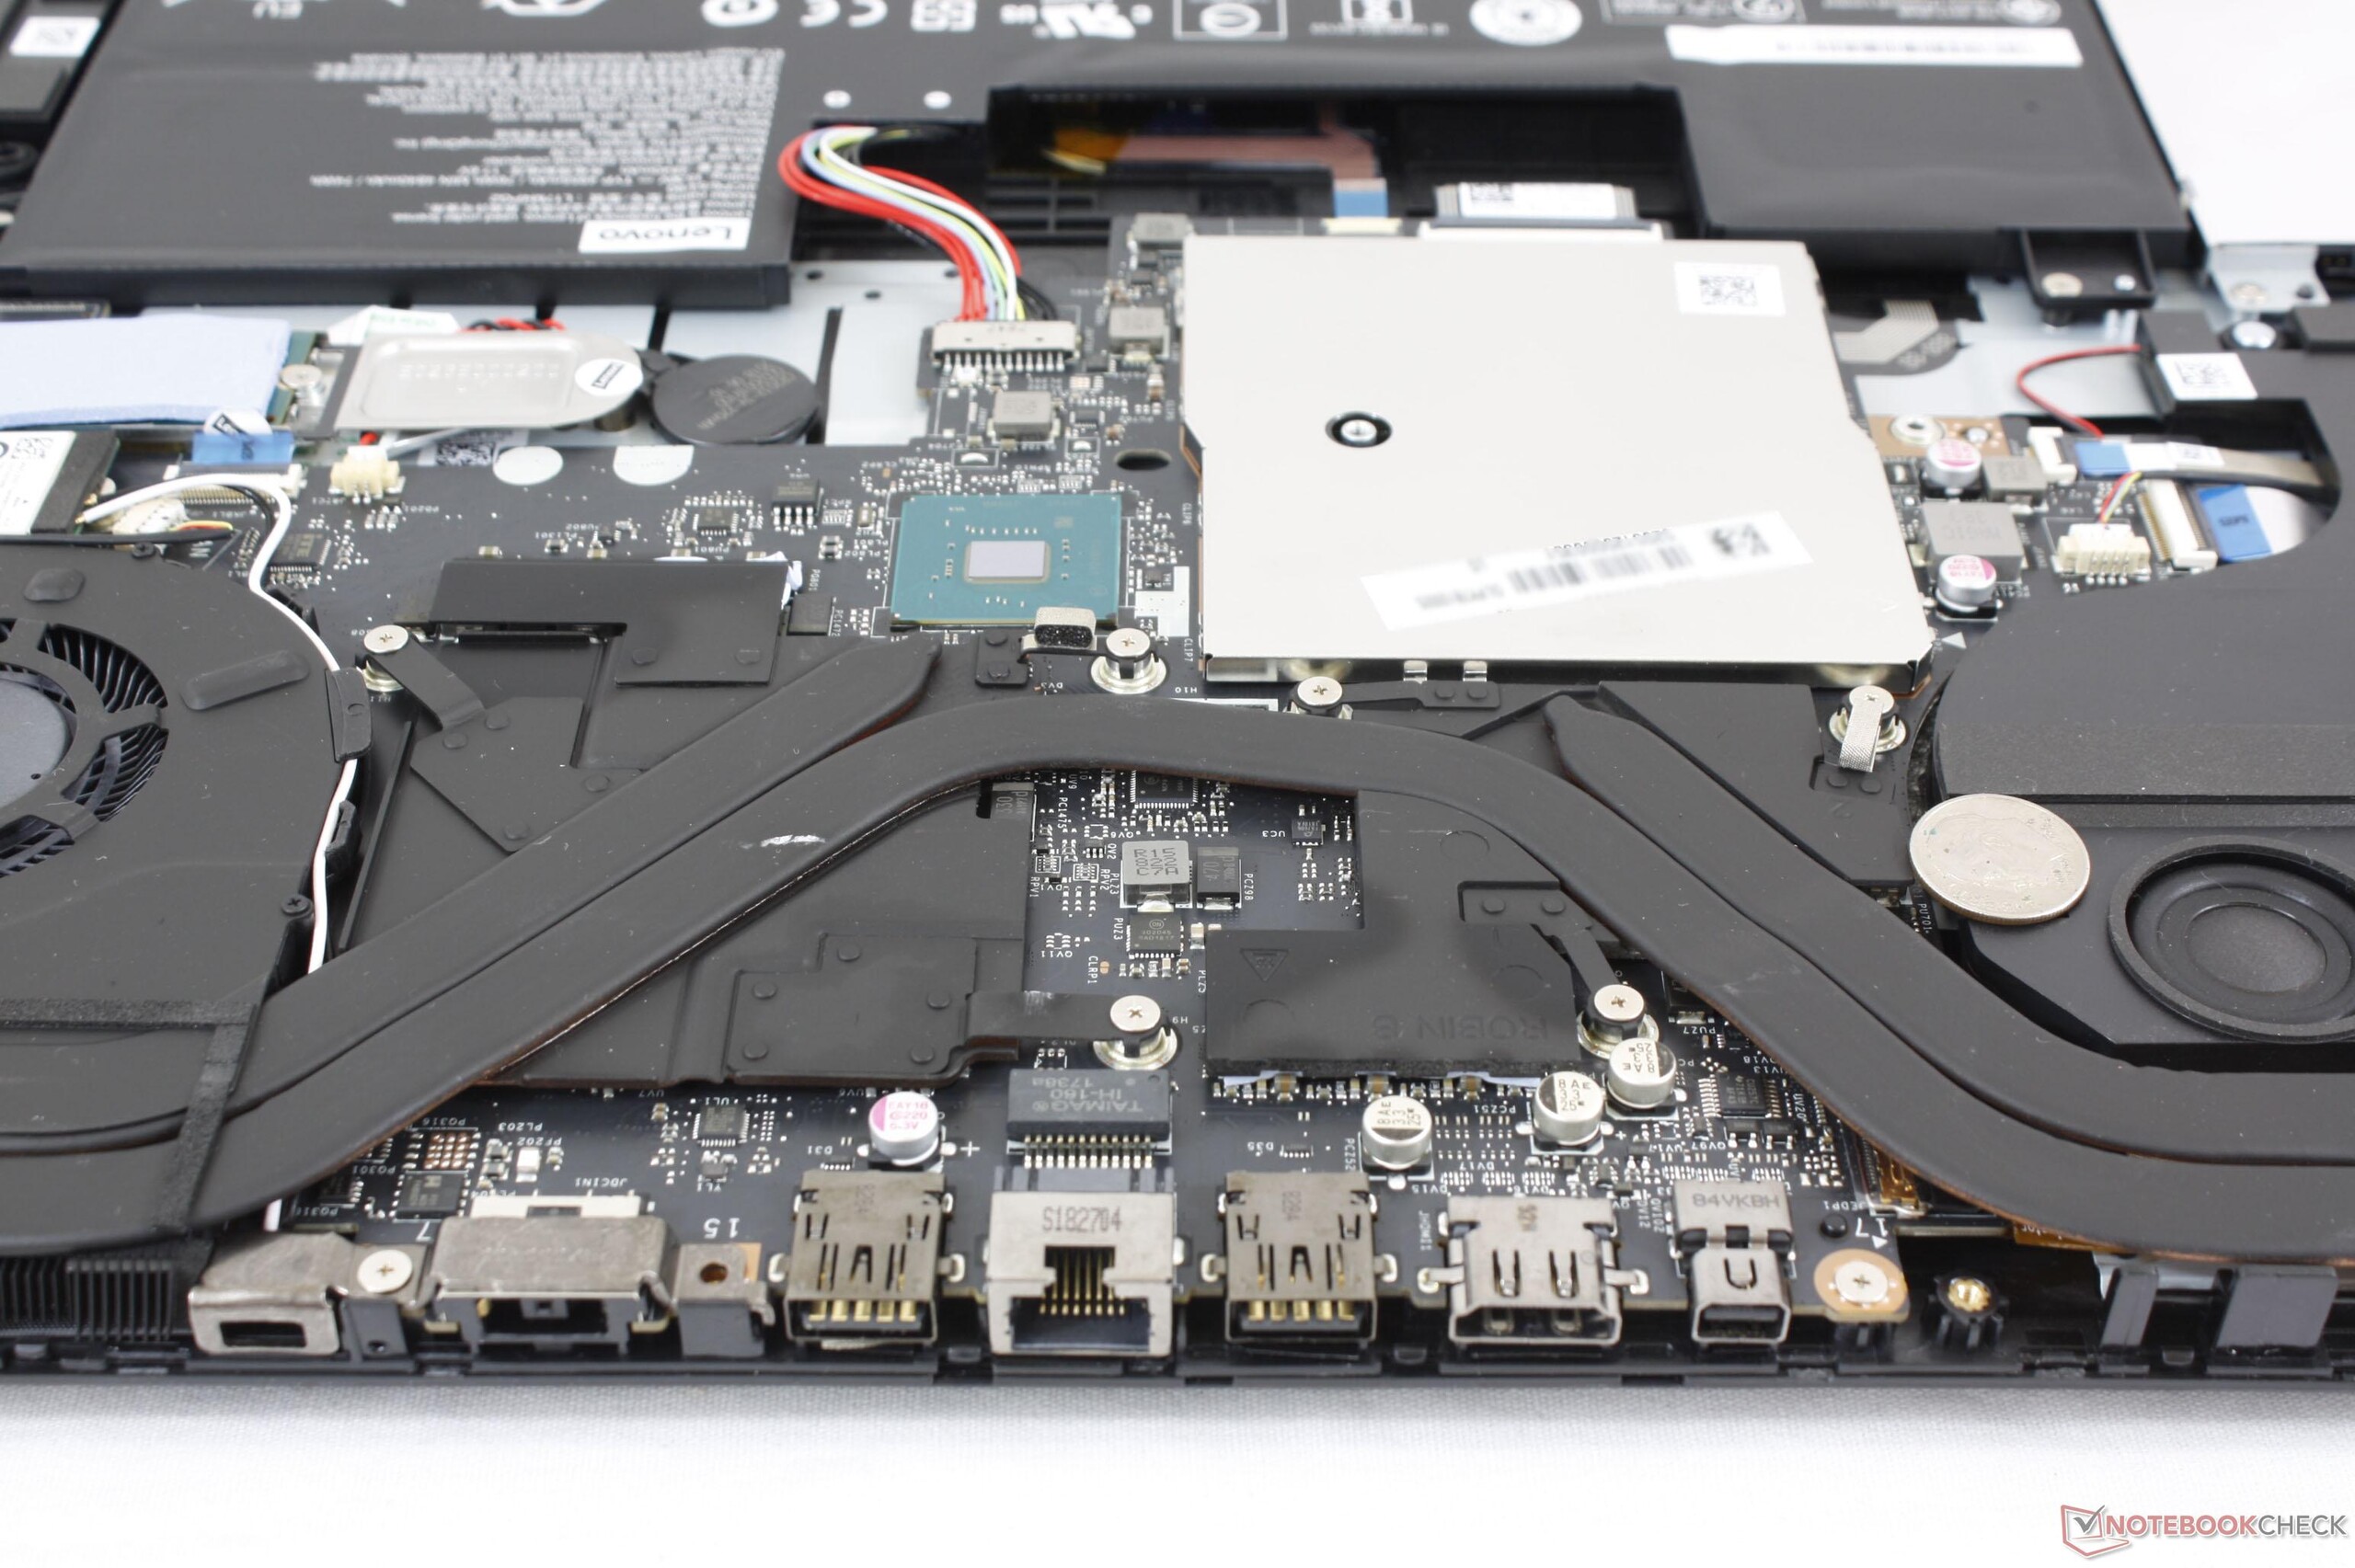
Maintenance
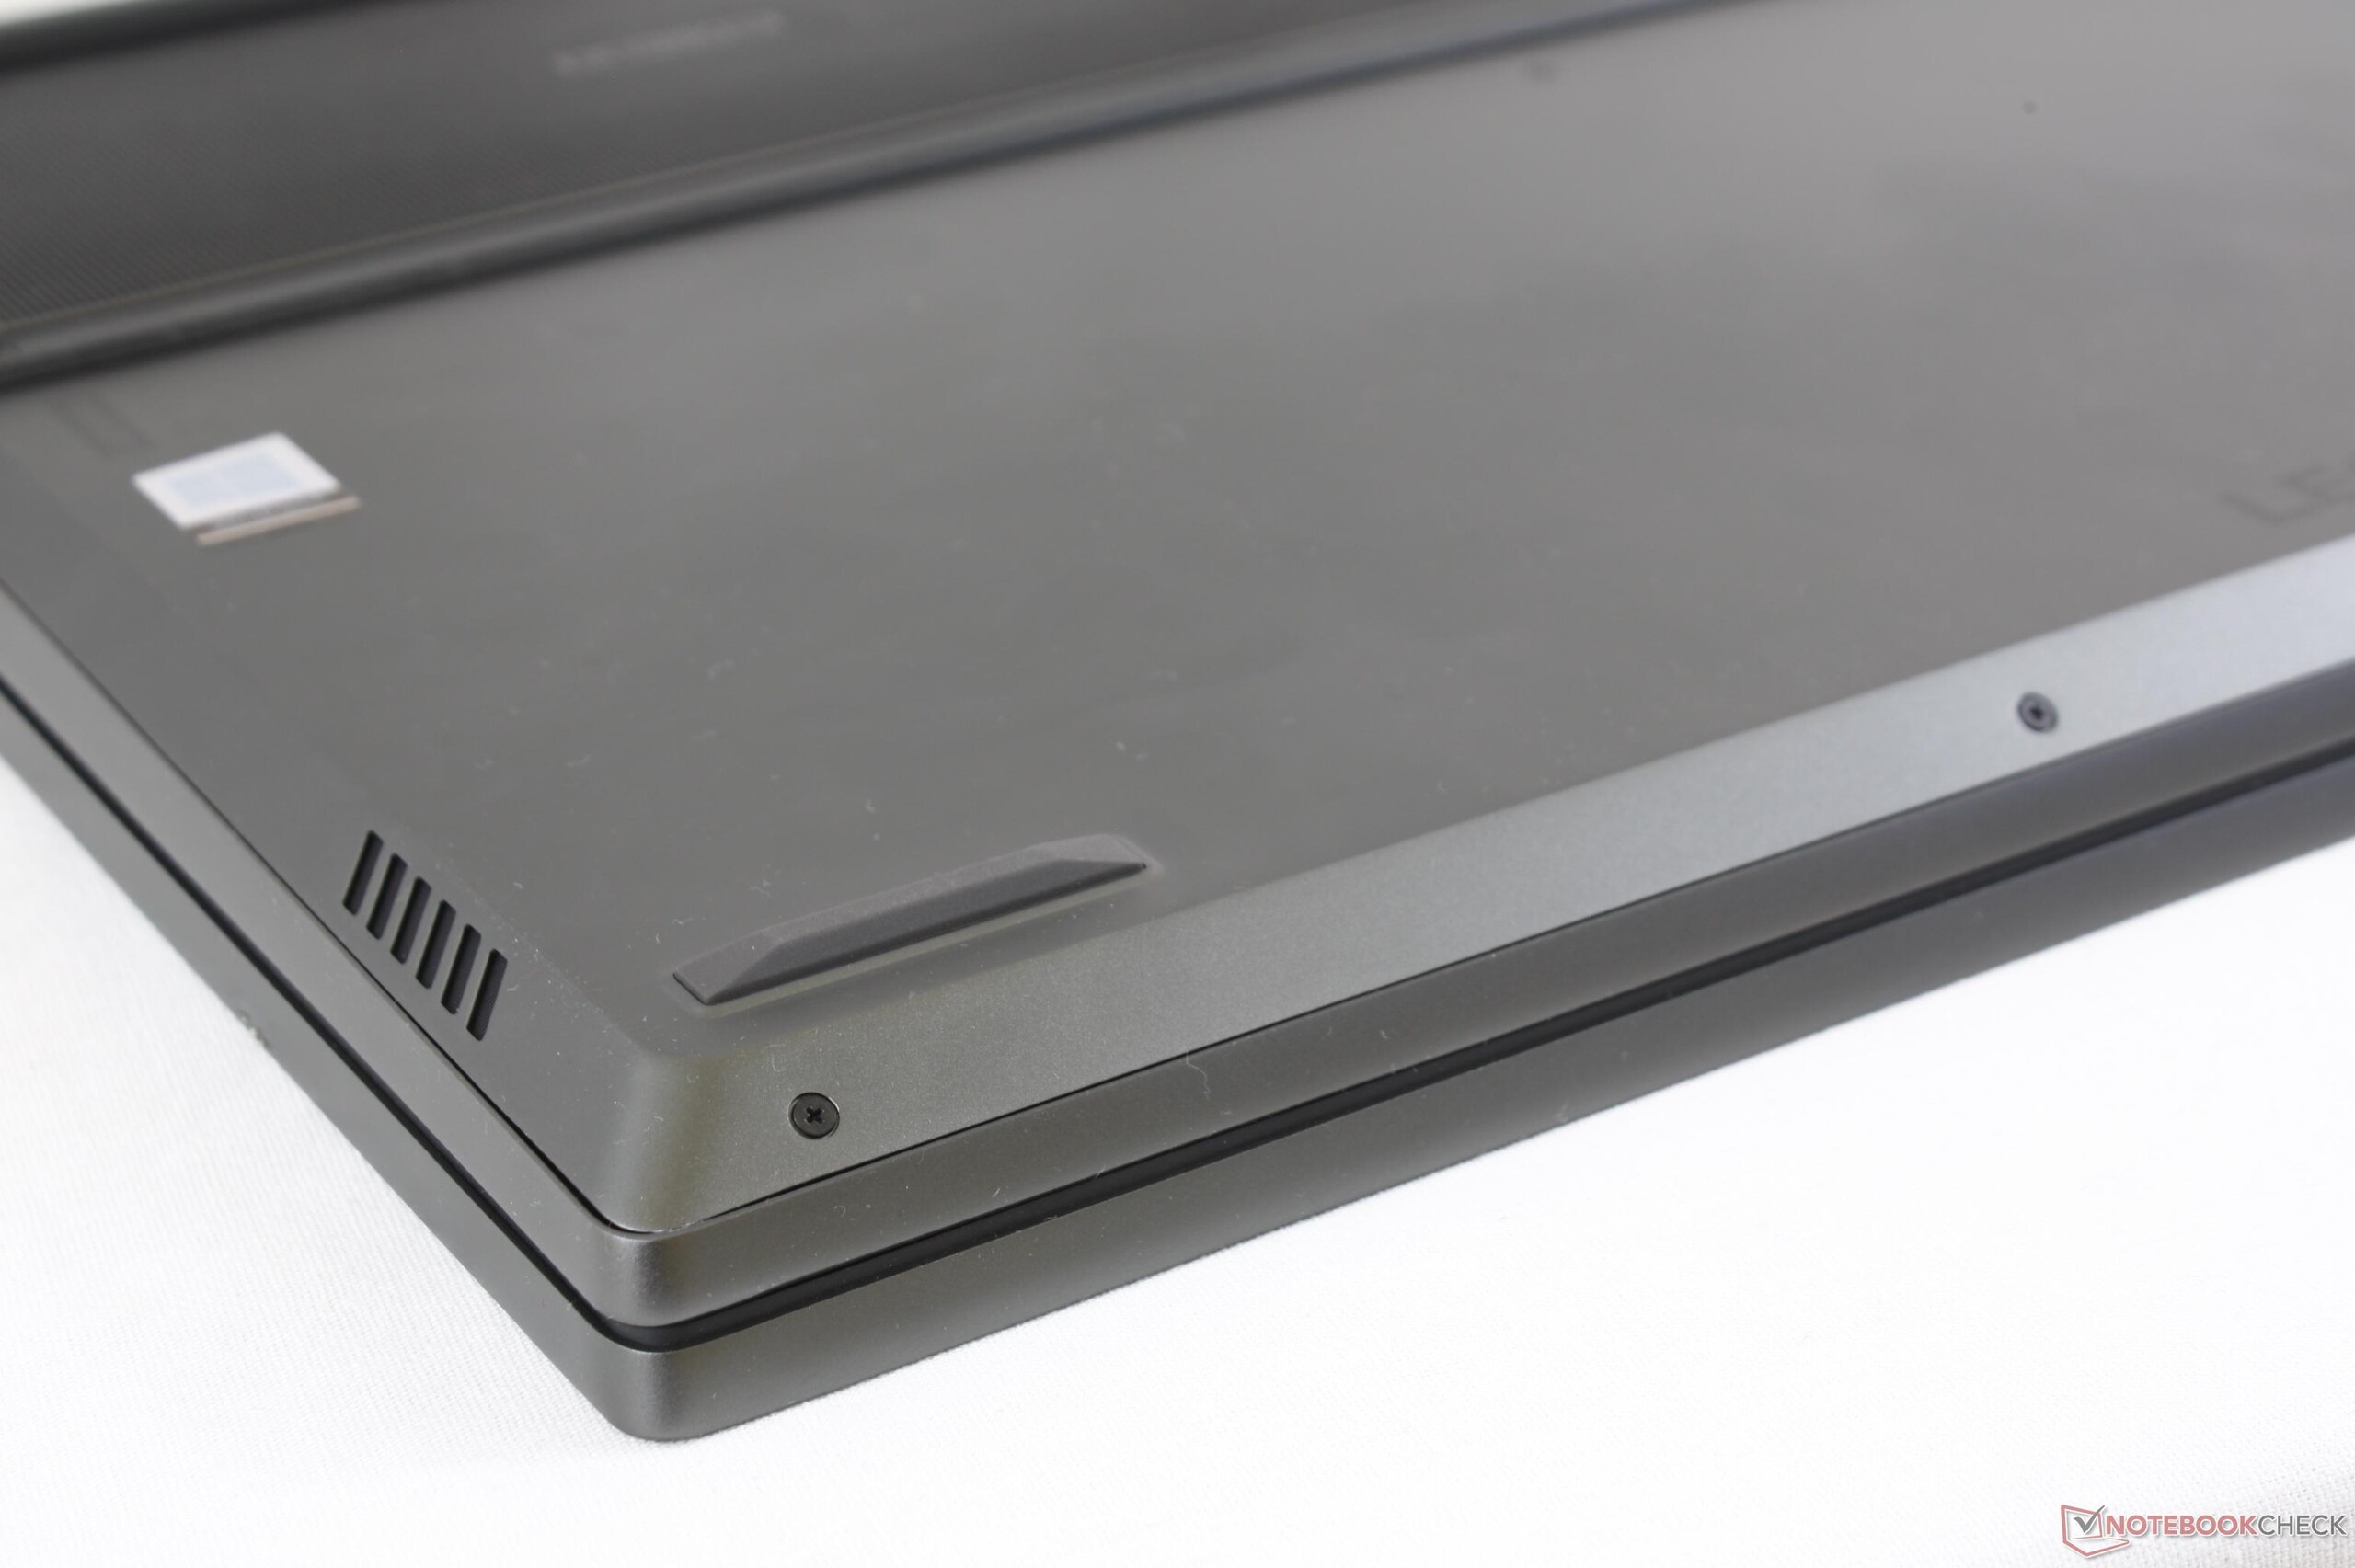
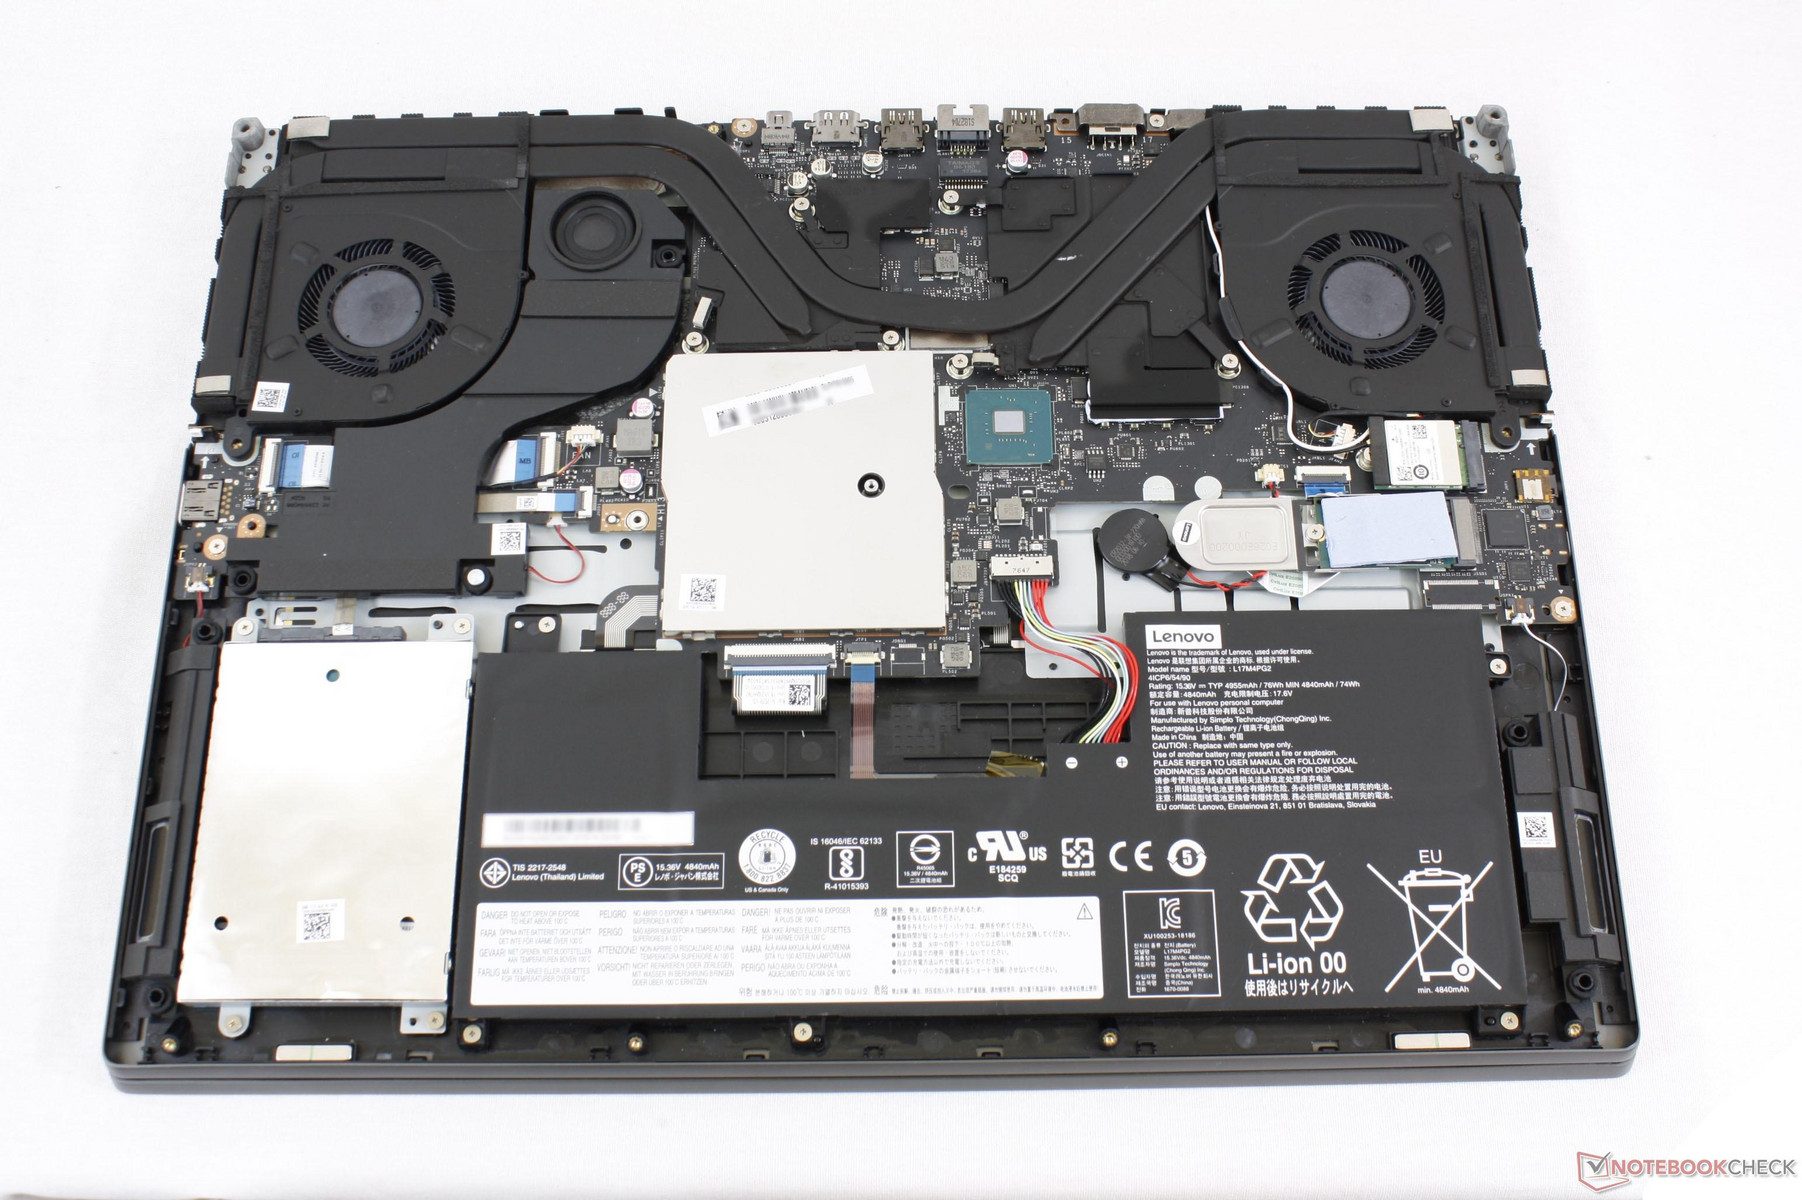
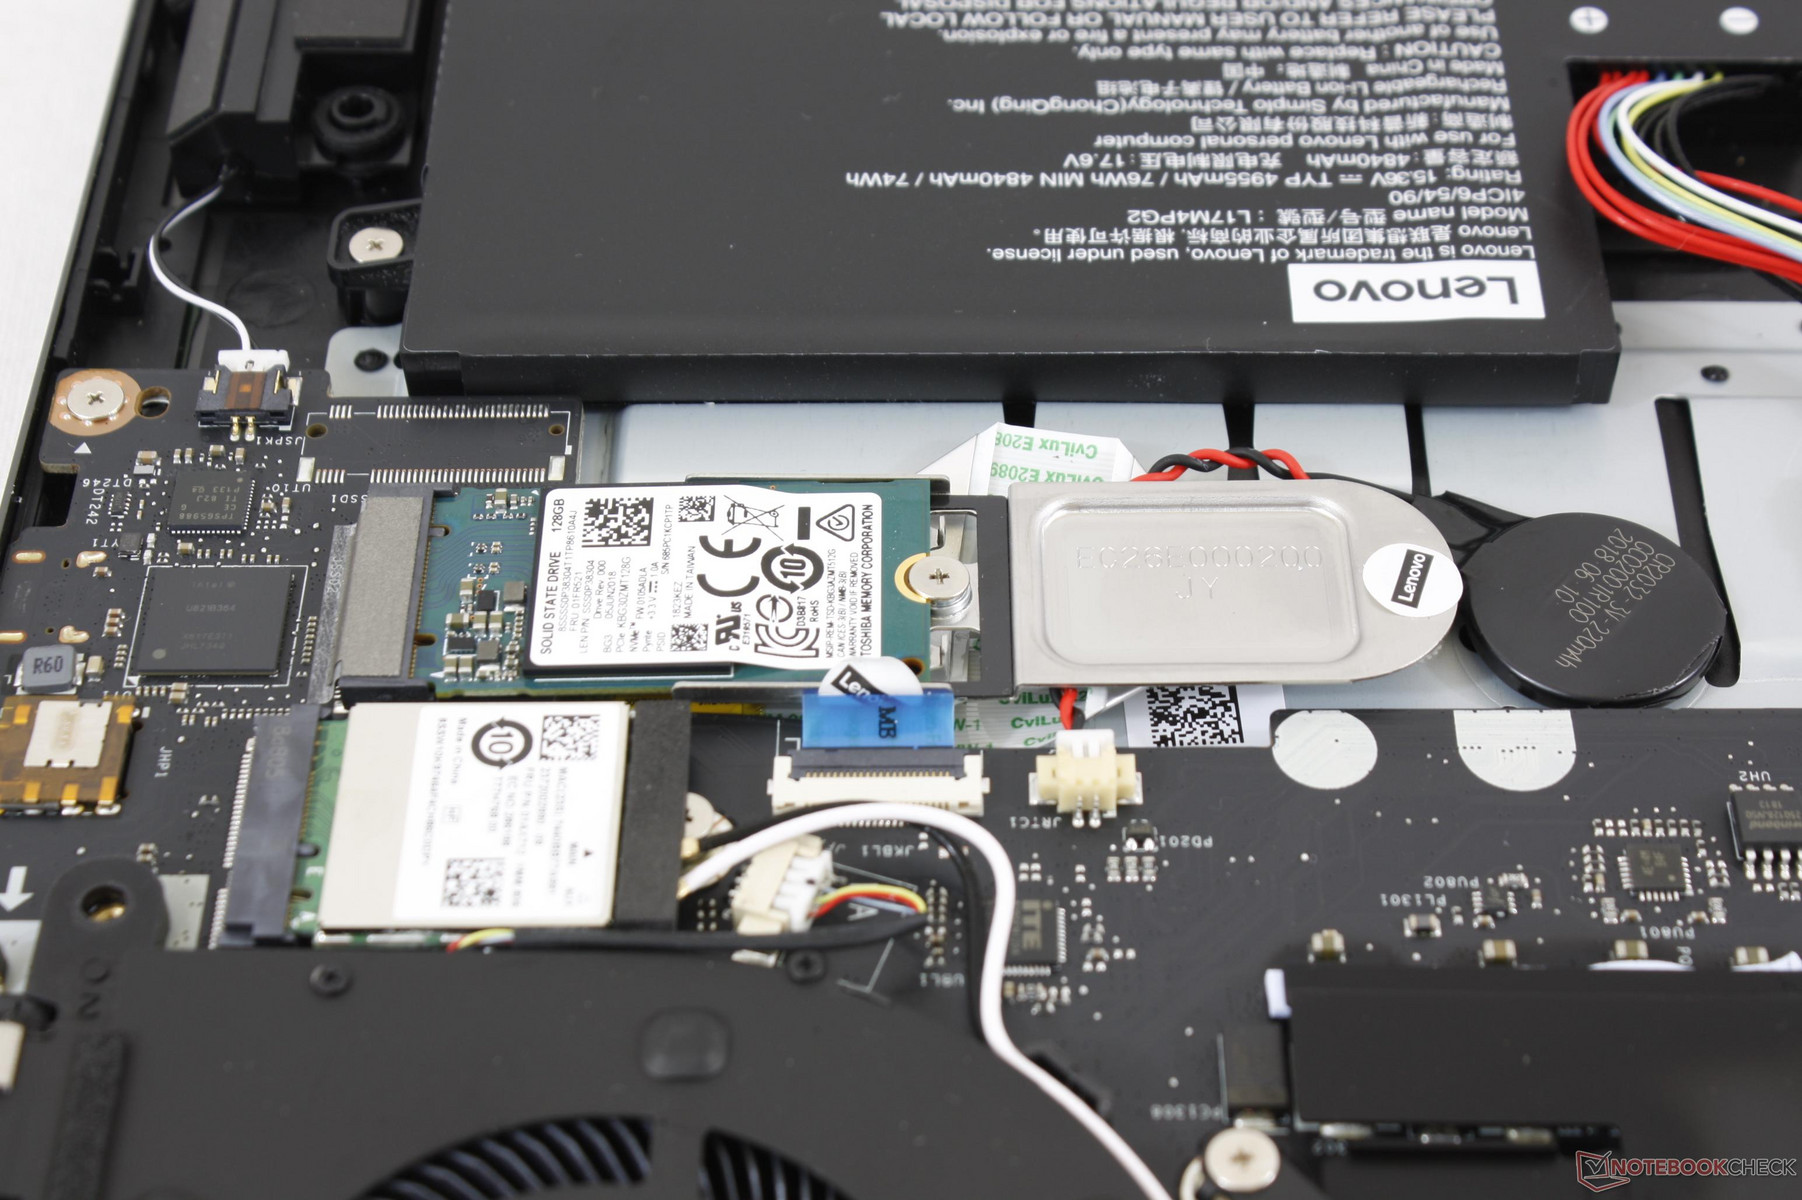
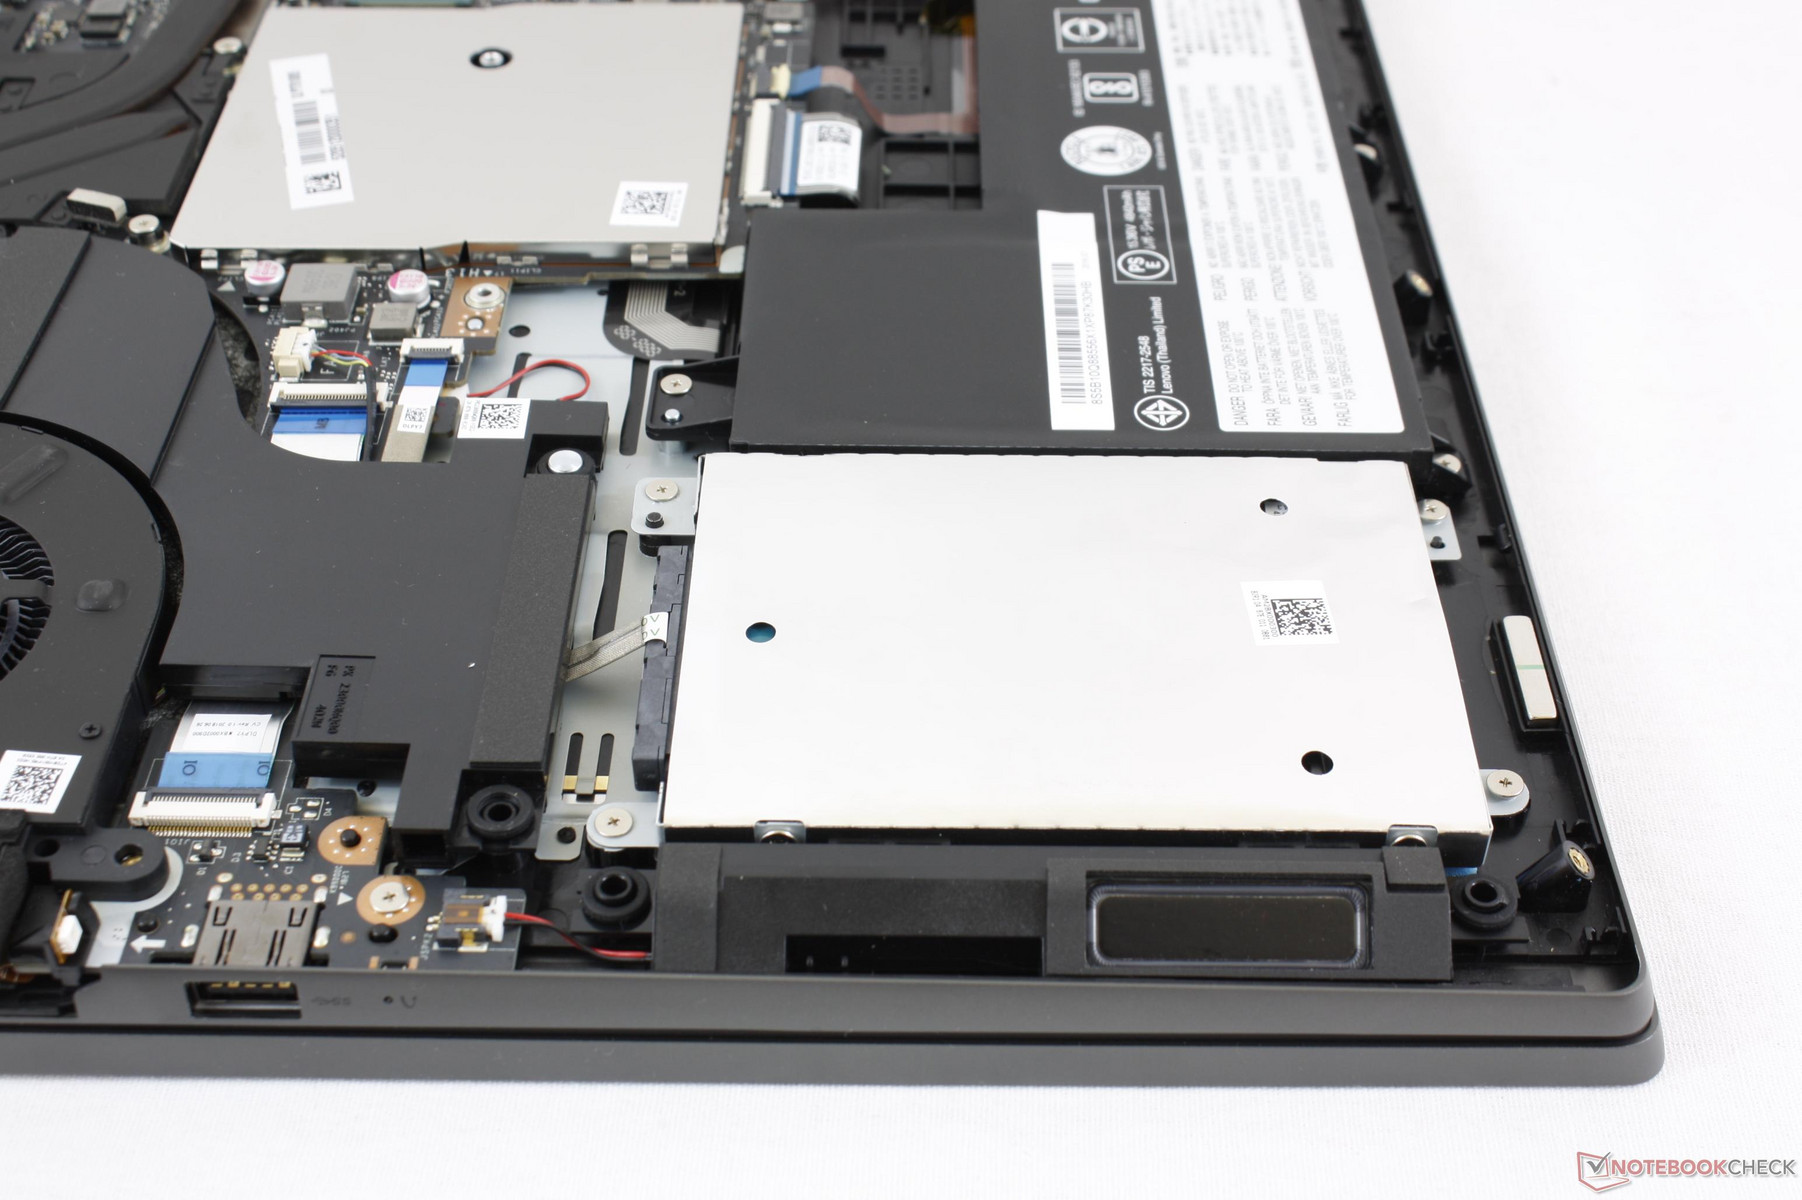
The bottom panel is secured by 11 Philips screws. Removing the panel can be tricky because of the unique rear plastic design of the system and so a sharp edge is recommended. RAM, storage, and WLAN are all accessible and upgradeable. A metal shield protects the two SODIMM slots at the very center of the unit.
Accessories and Warranty
There are no included extras outside of the AC adapter and small Quick Start guide.
The standard one-year limited warranty applies with extension of up to three years and accidental damage protection. Please see our Guarantees, Return policies and Warranties article for country-specific information.
Input Devices
Keyboard
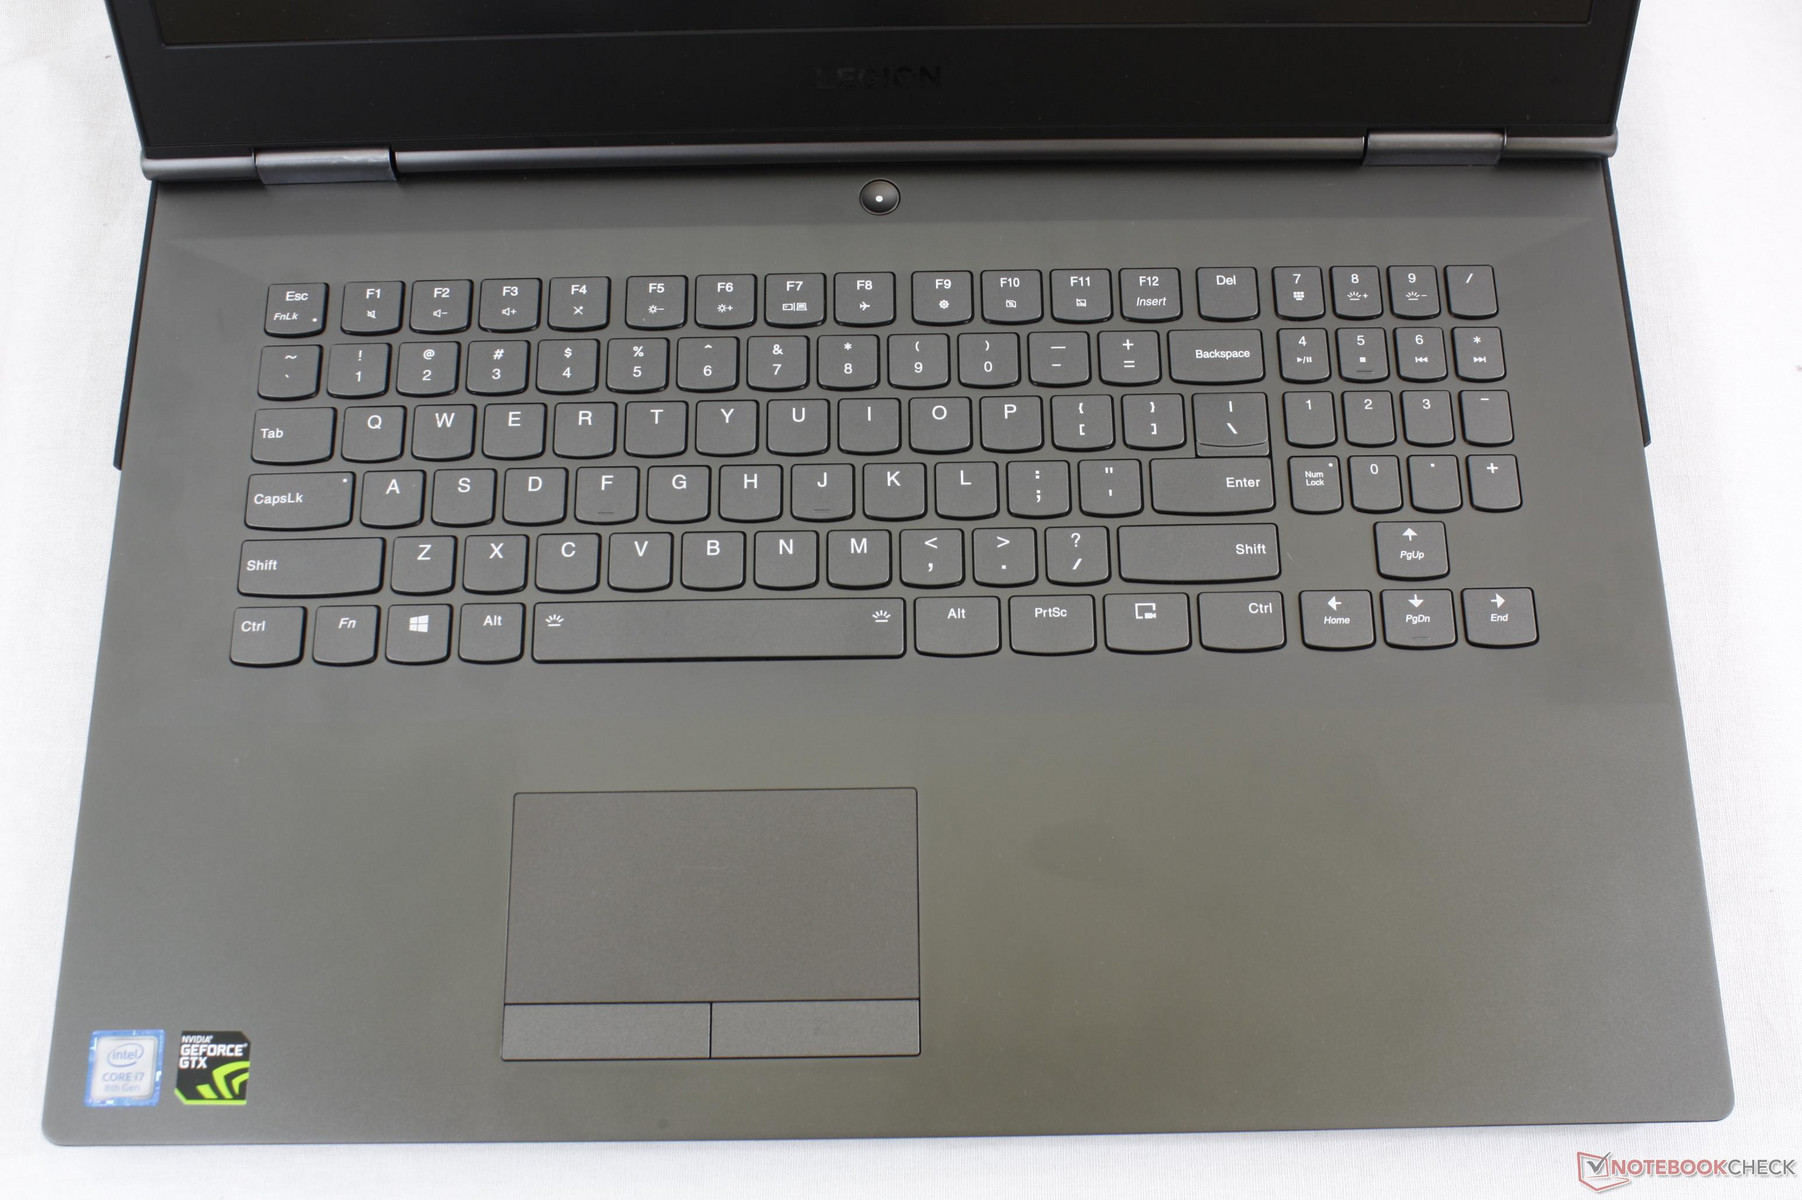
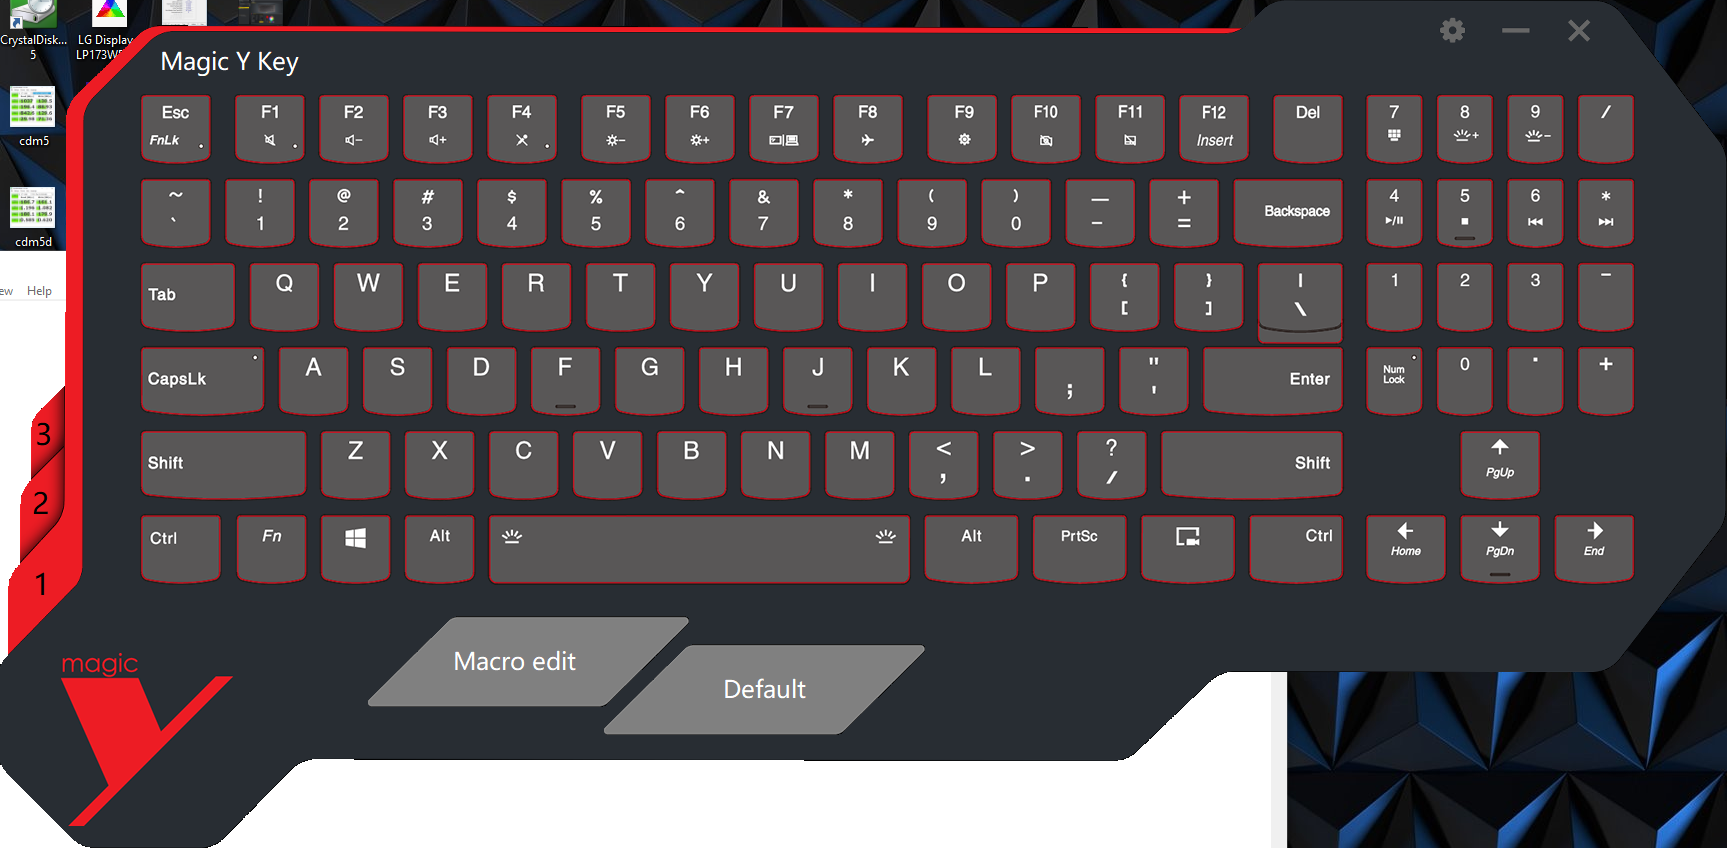
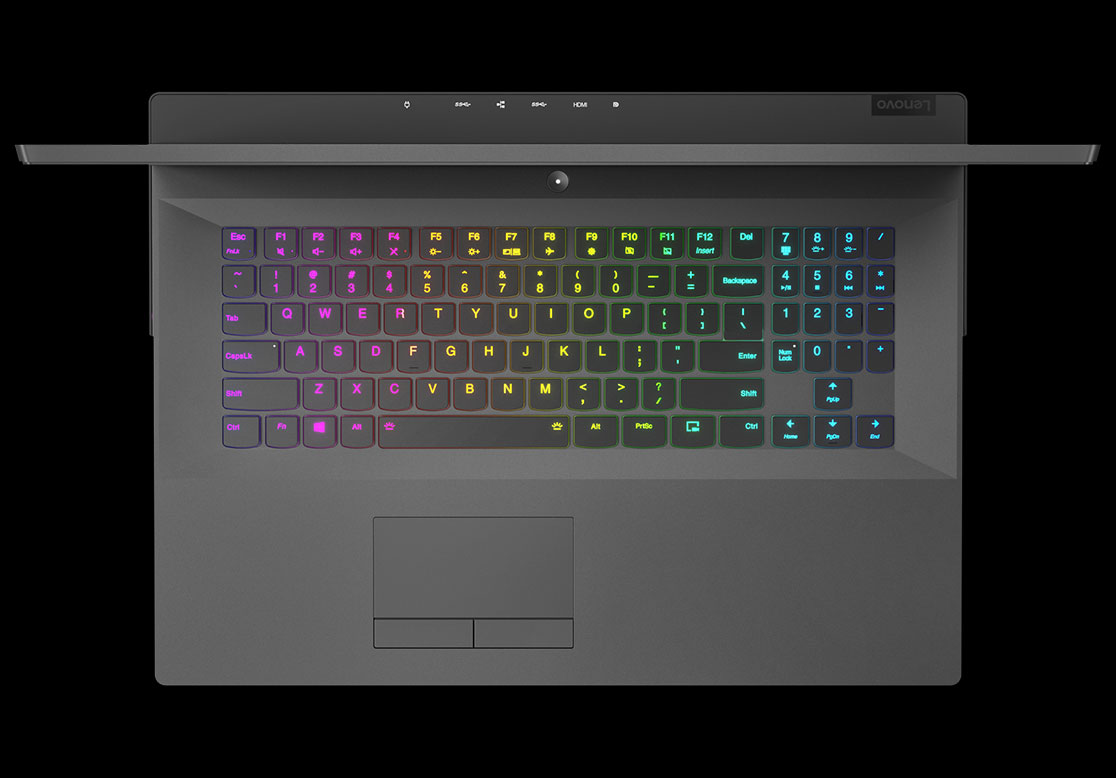
The chiclet keyboard (~30.0 x 10.1 cm) is identical to the keyboard on the 15-inch Y530 in terms of layout and feel. As such, feedback is still on the soft side with moderate clatter similar to most Ultrabooks. The large Arrow keys are a plus especially since other manufacturers often shrink them down to smaller sizes.
The NumPad keys unfortunately get the short end of the stick. They are physically smaller than the QWERTY keys and consequently even spongier in feedback. We find that the SteelSeries keyboards on the MSI GE or GS series tend to offer more uniform feedback across each key when compared to our Lenovo.
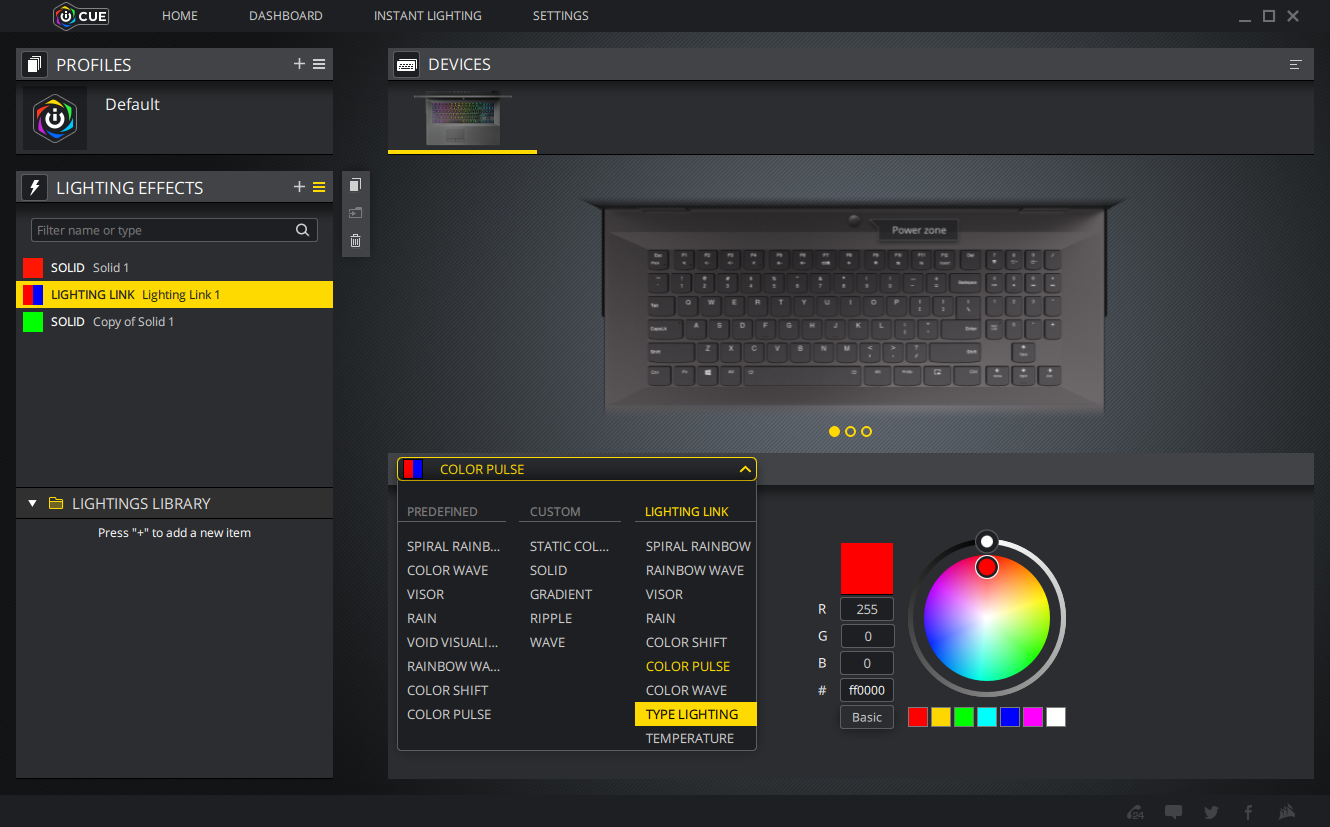
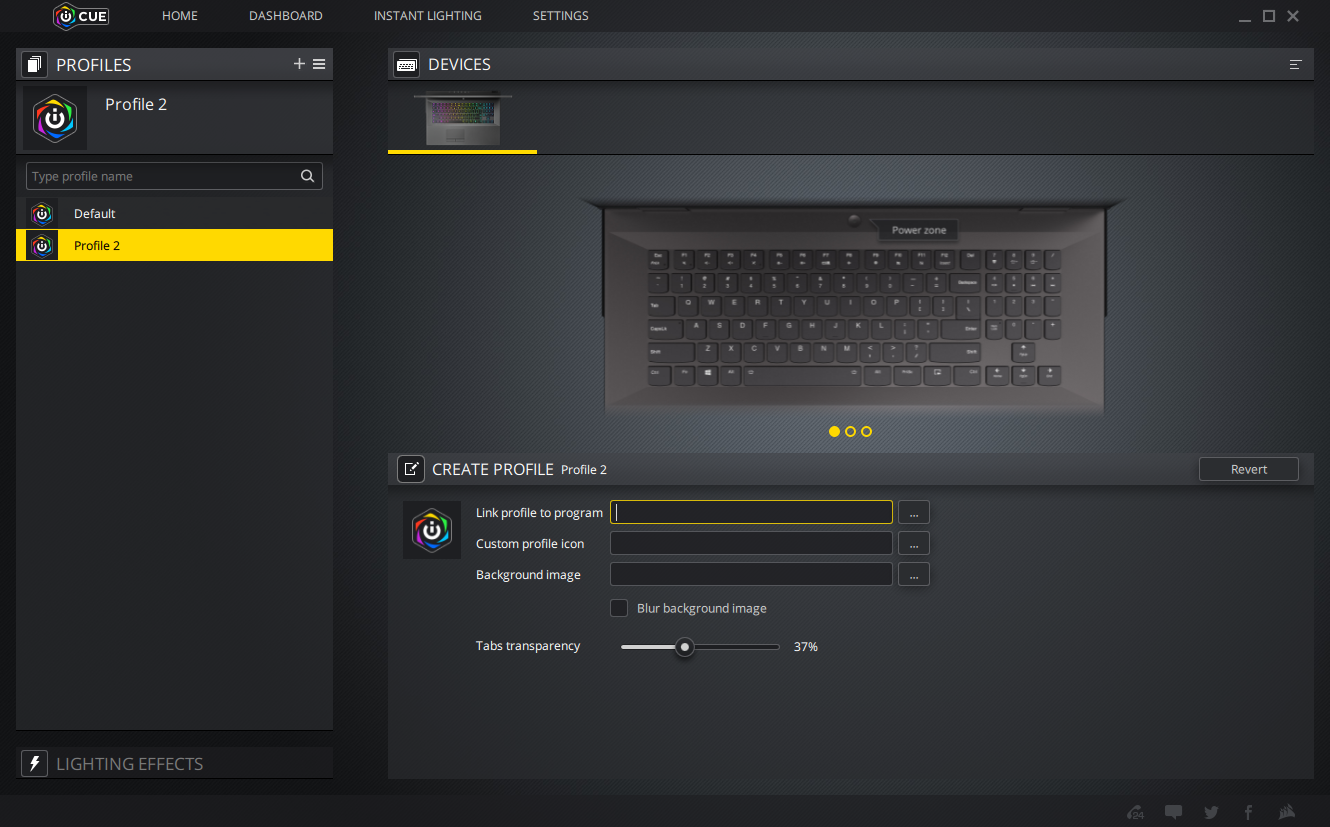
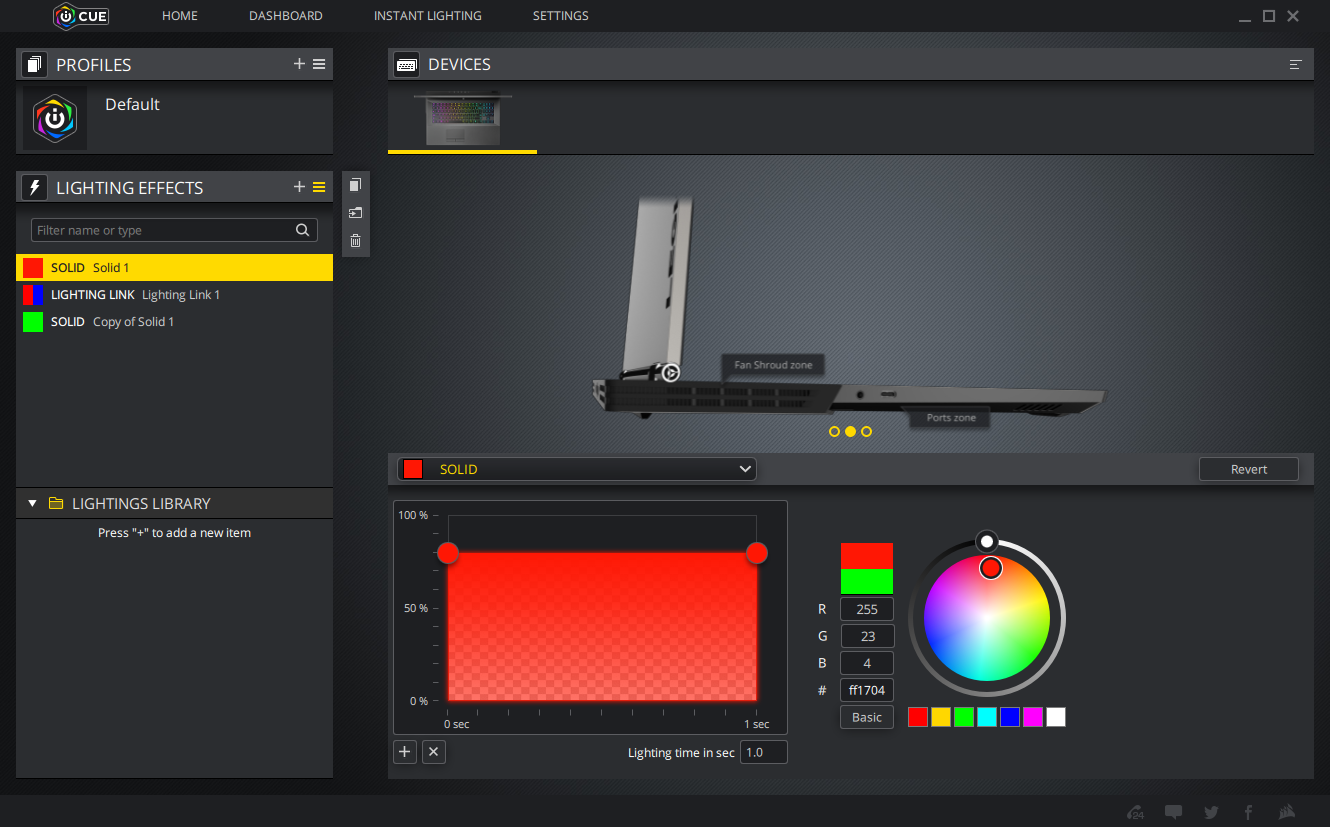
The per-key 16.7M RGB lighting is what separates the keyboard on the Y730 from the keyboard on the Y530. Its lighting effects are powered by the Corsair iCUE software for users to create multiple profiles with numerous presets to choose from. Even the ventilation grilles and side ports can be customized to glow in different colors. It's an excellent implementation overall even though the iCUE software has a bit of a learning curve.
Touchpad
The Precision trackpad is rather small (~10.2 x 5.3 cm) for a 17-inch laptop as even the 15-inch XPS 15 has a larger trackpad (10.5 x 8. 5 cm). To Lenovo's credit, its dedicated mouse keys are more comfortable to use than clickpads especially for dragging and dropping. The trackpad surface can flex slightly with applied pressure but it is otherwise firm and smooth for both slow or fast cursor movement. Its surface, however, is a fingerprint magnet that will accumulate unsightly grease very quickly.
The aforementioned mouse keys are relatively soft in feedback with quiet clatter and moderate travel depth. While we appreciate the quiet operation, less spongy feedback would have been appreciated.
Display
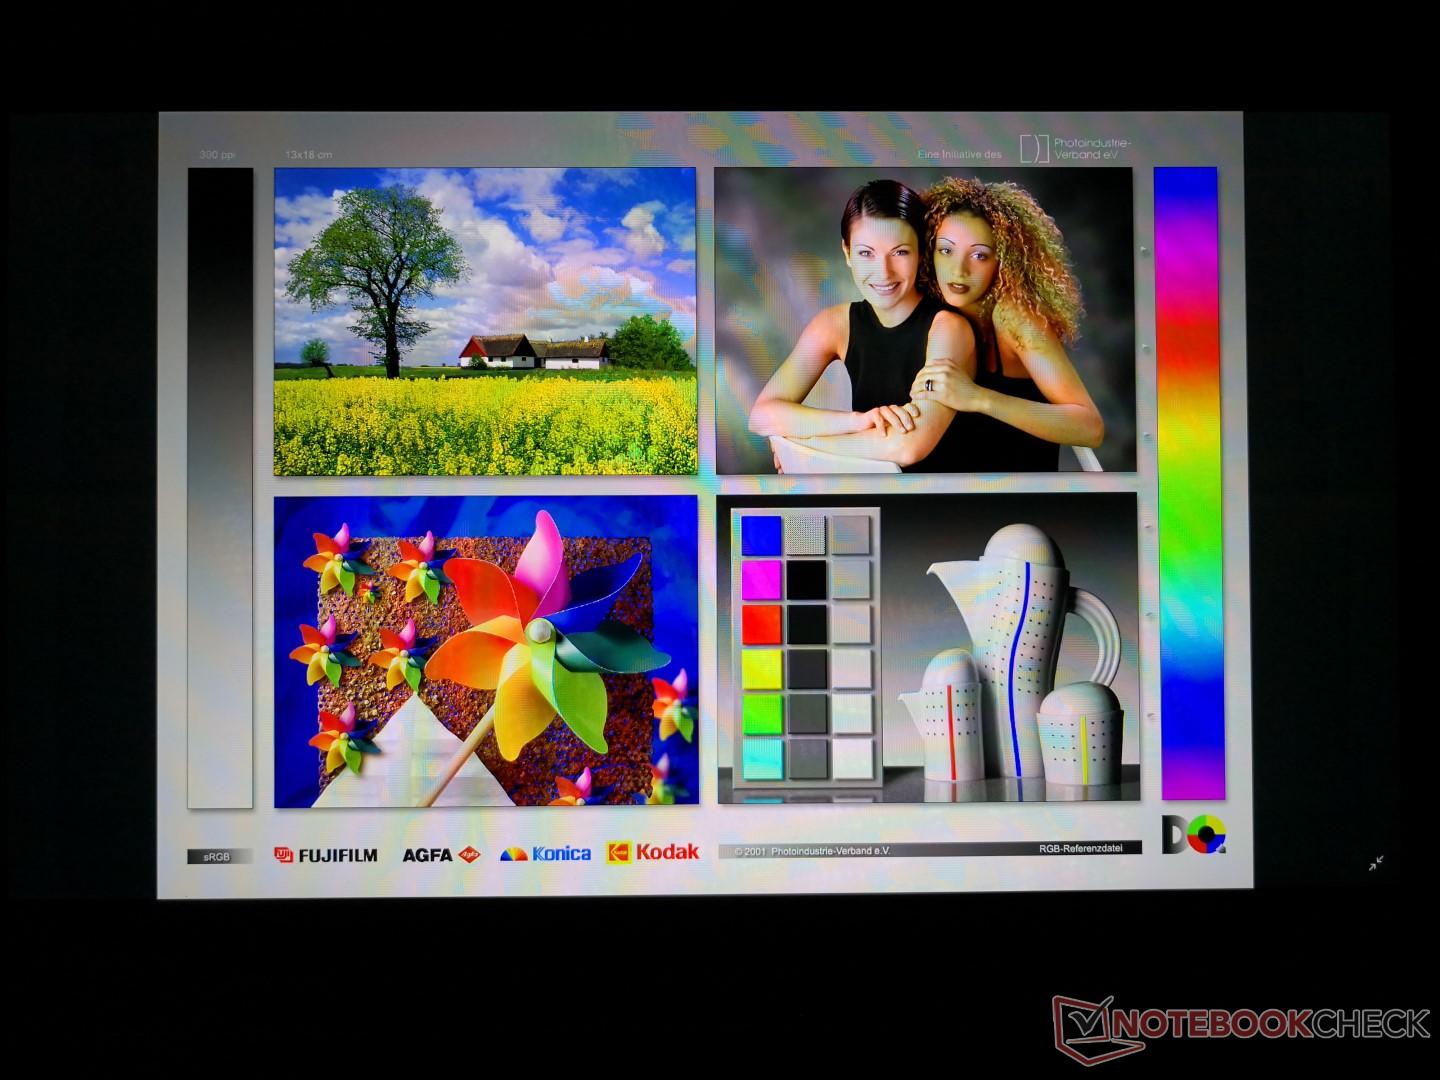
Lenovo offers just one 1080p matte IPS display option for the 17-inch Y730 with no glossy, touchscreen, or 4K choices to speak of. This also means that users will miss out on 120 Hz or 144 Hz panels with fast response times as found on other mainstream gaming laptops like the Pavilion 15 Gaming. Fortunately, the panel here is of good quality with respectable contrast levels, response times, and colors. In fact, the Lenovo carries a very similar LG Philips LP173WF4 panel as the displays of the 17-inch Acer Predator 17 X, Predator Helios 300, and Asus GL703VD and they all share similar characteristics as a result. Higher-end panels like the one for the MSI GS65 are capable of even deeper colors and higher contrast levels with less ghosting.
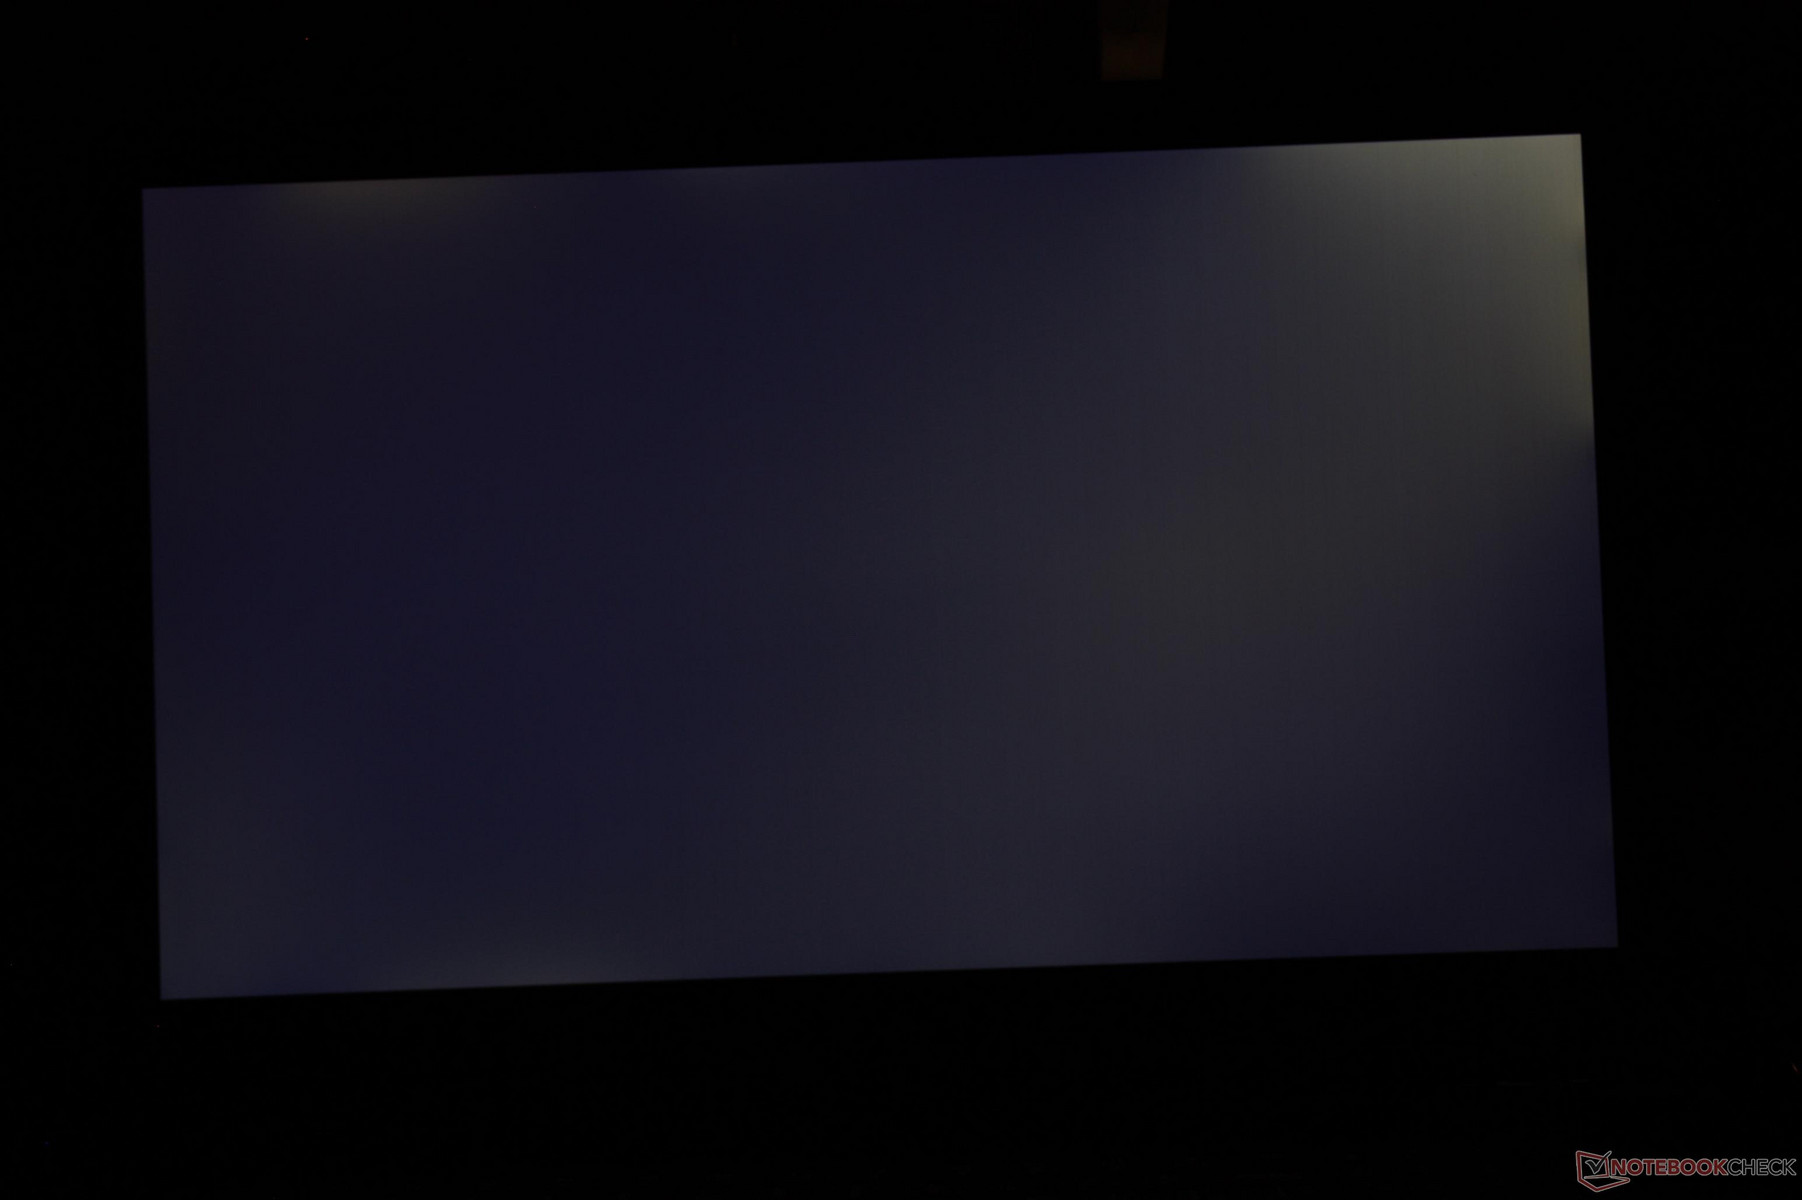
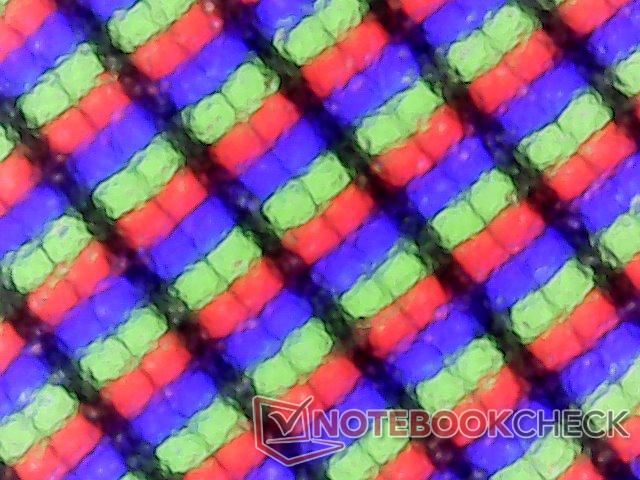
There are no major graininess issues and so the matte panel looks almost like a glossy display without the glare. Unfortunately, moderate backlight bleeding is present on our unit as shown by the picture below. It's unnoticeable when browsing the web, but it's acute enough to be an inconvenience when gaming or watching movies with black borders.
| |||||||||||||||||||||||||
Brightness Distribution: 91 %
Center on Battery: 328.7 cd/m²
Contrast: 645:1 (Black: 0.51 cd/m²)
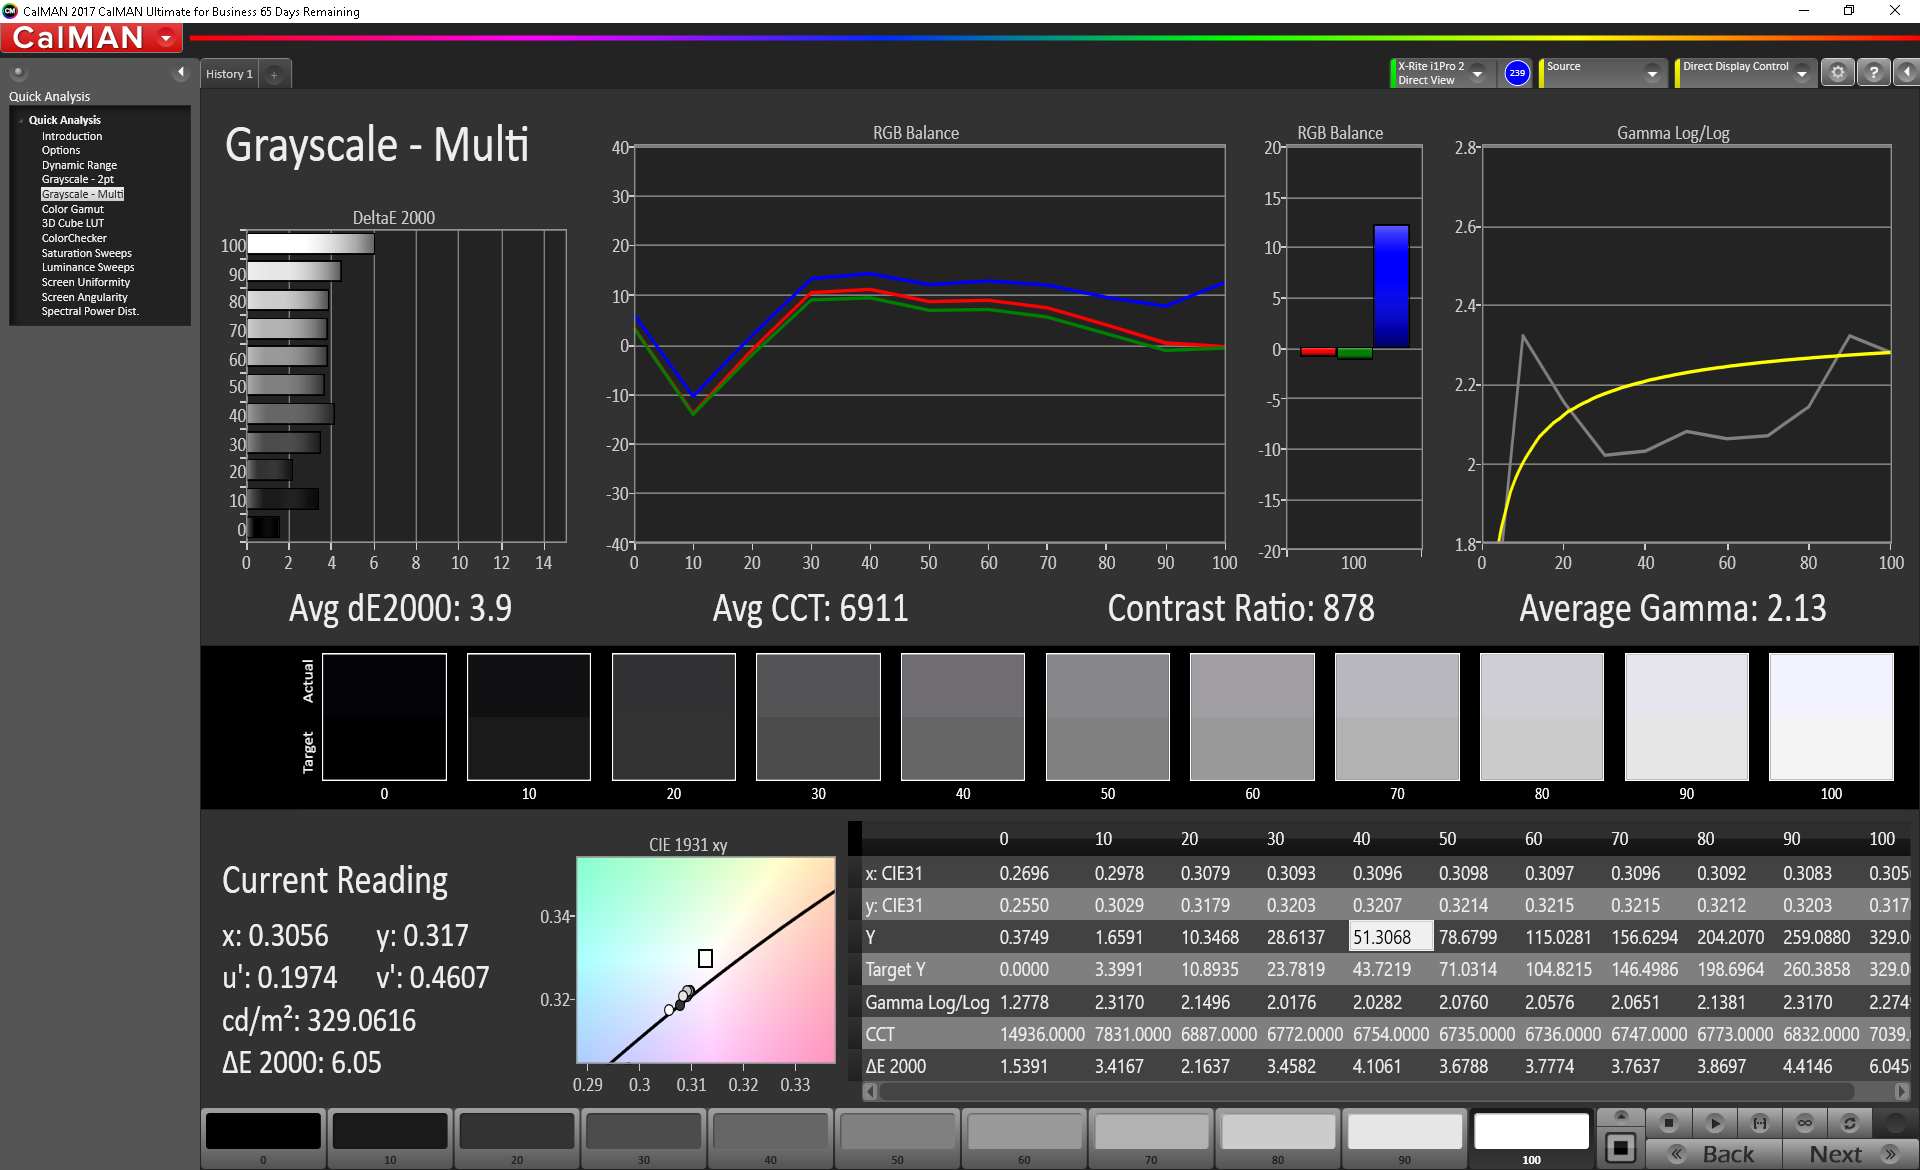
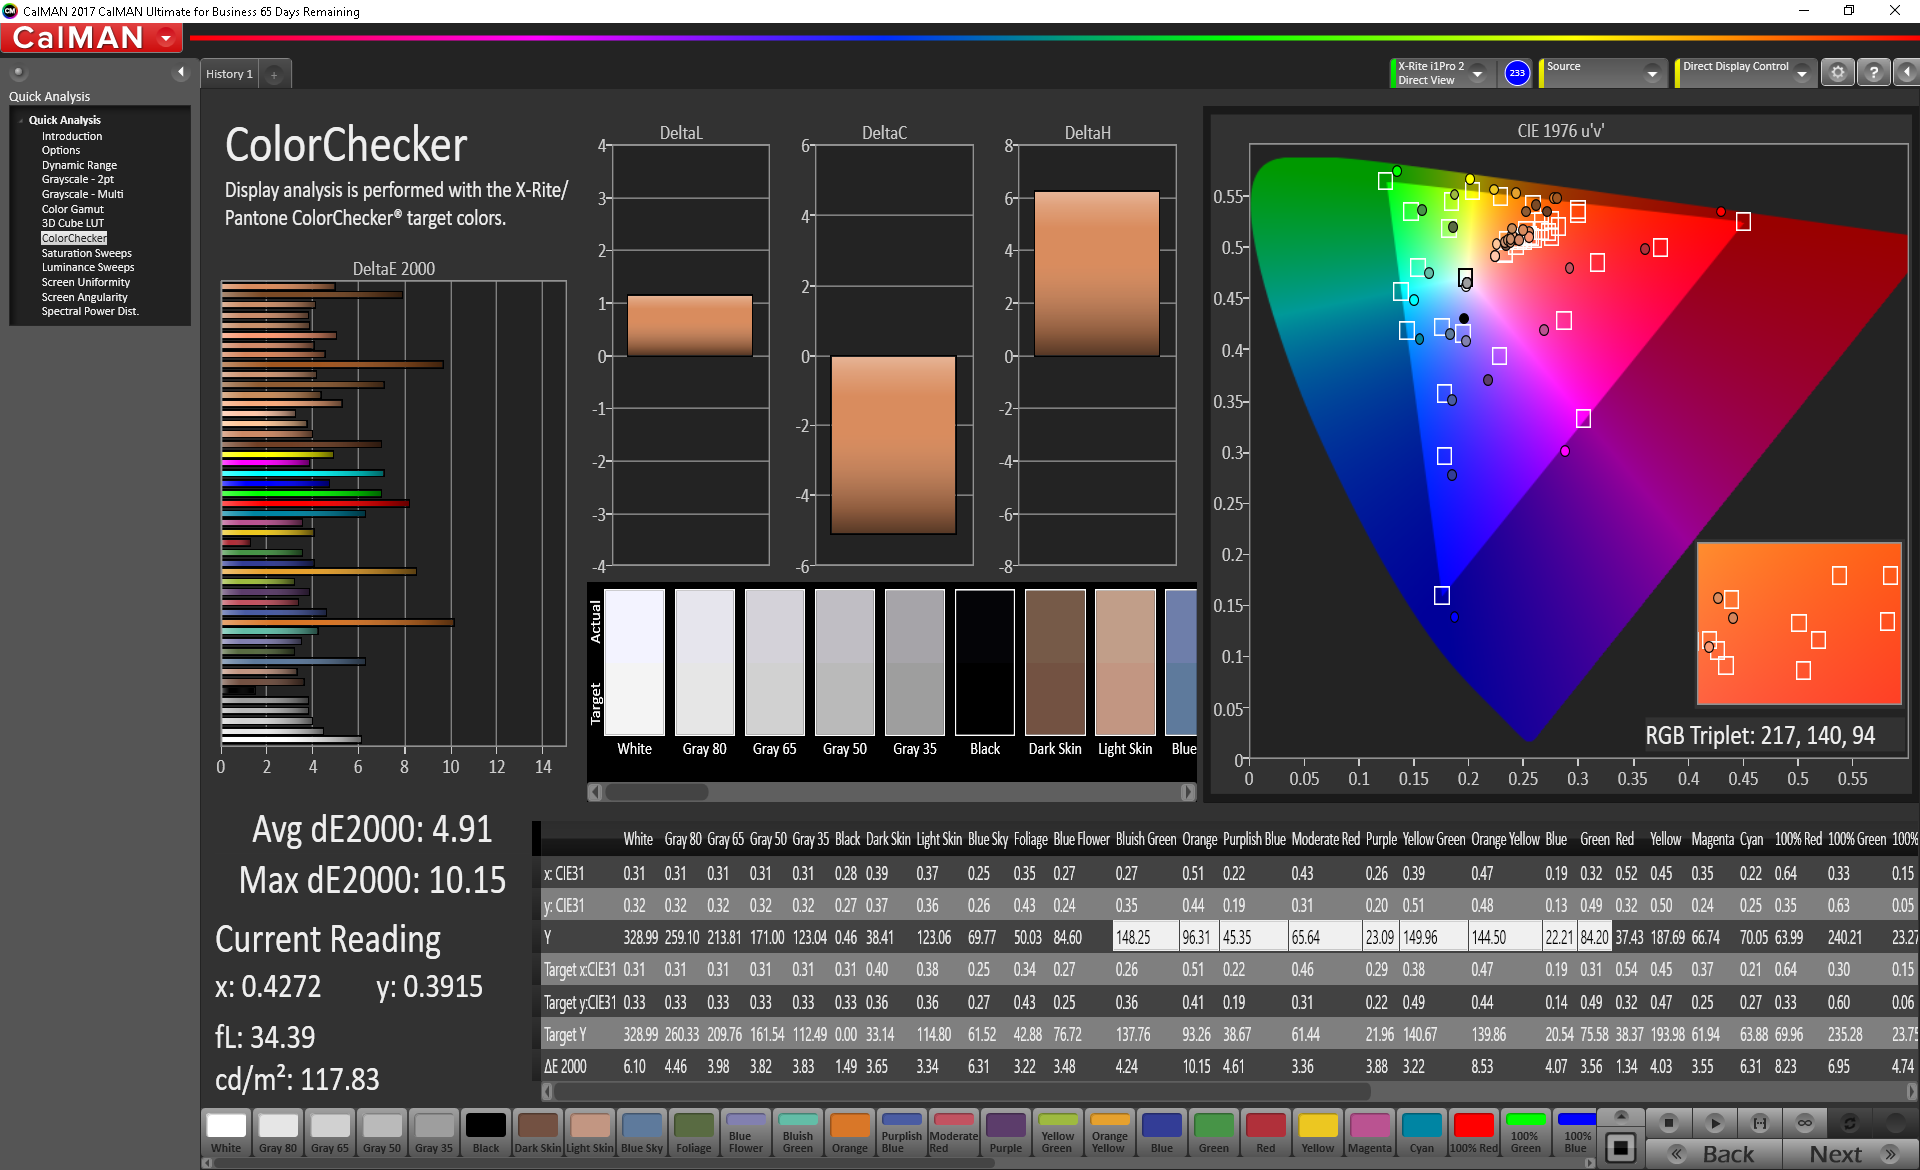
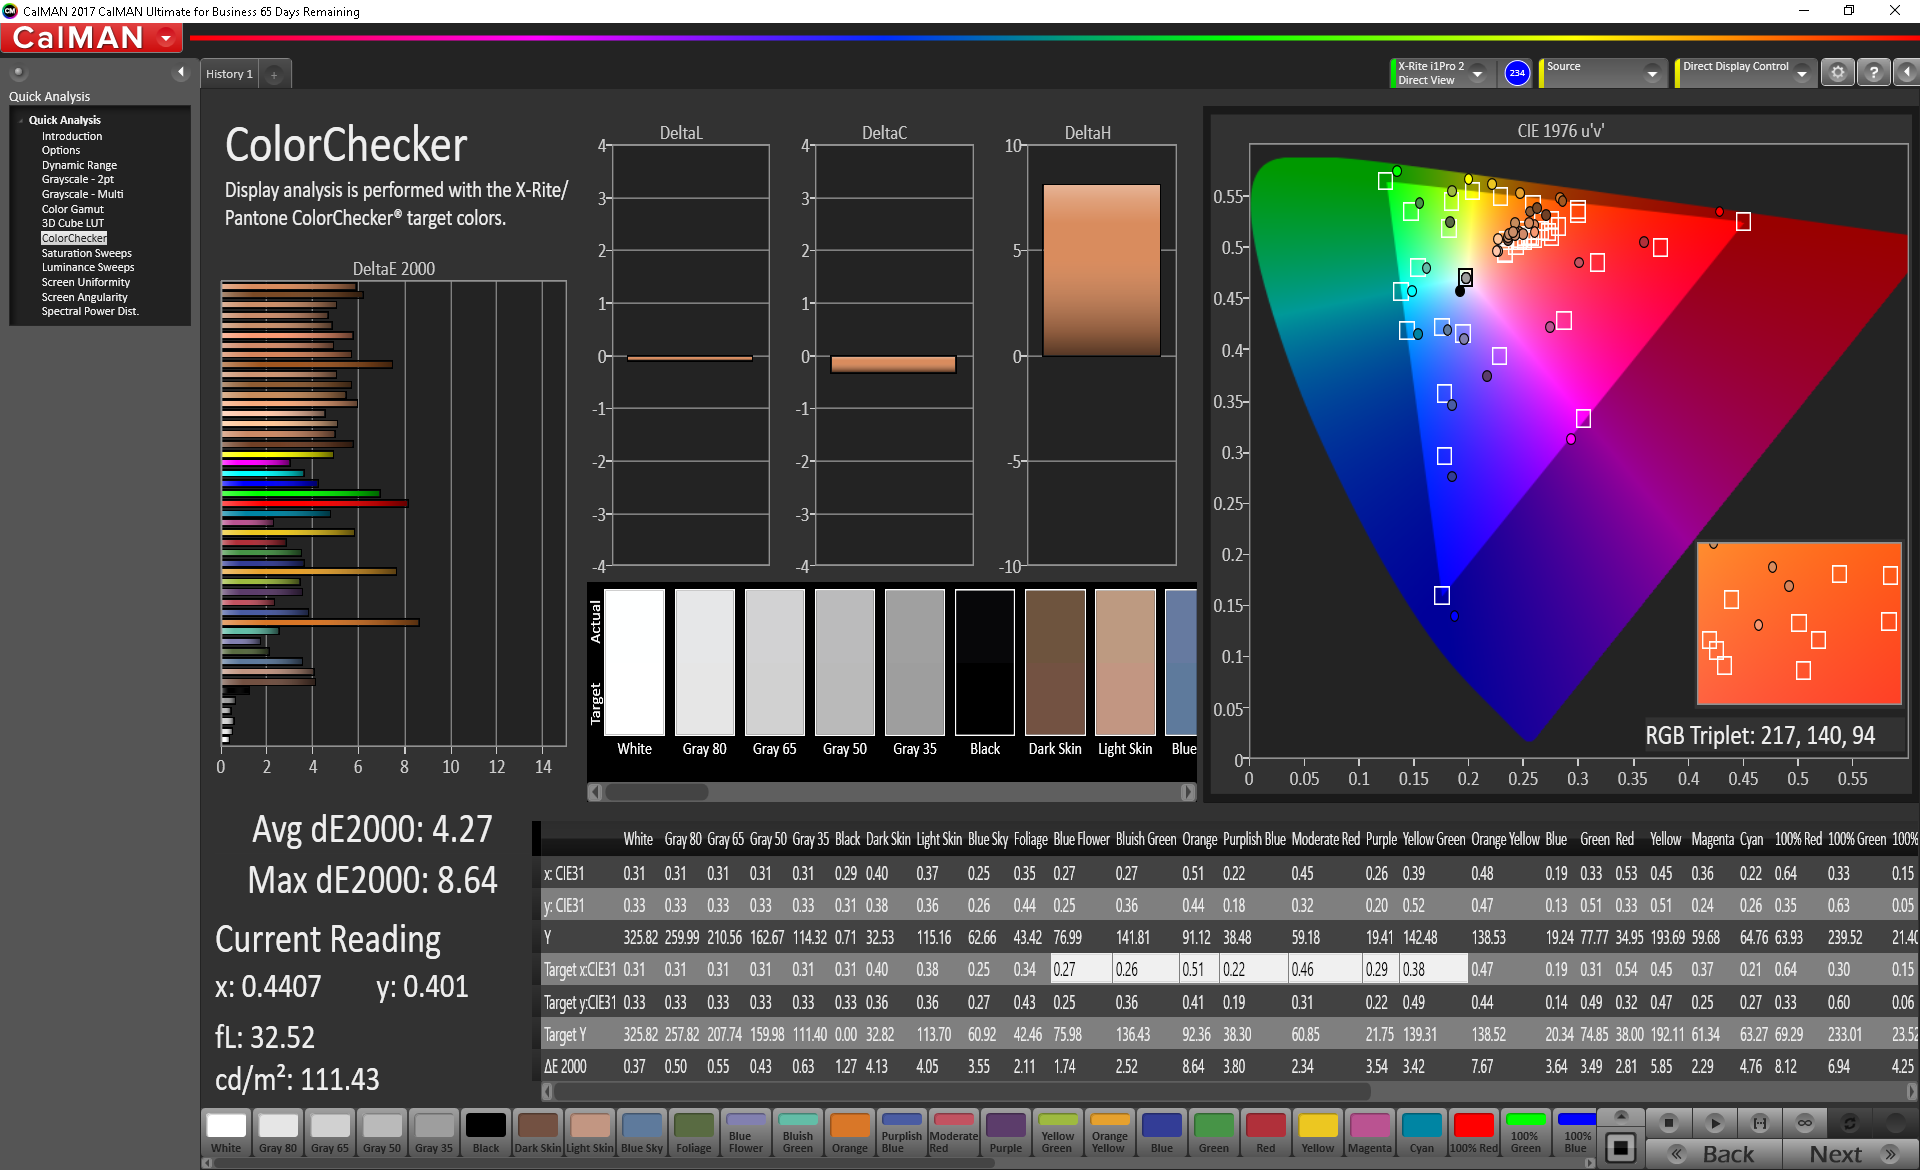
ΔE ColorChecker Calman: 4.91 | ∀{0.5-29.43 Ø4.73}
calibrated: 4.27
ΔE Greyscale Calman: 3.9 | ∀{0.09-98 Ø4.97}
84.7% sRGB (Argyll 1.6.3 3D)
55.6% AdobeRGB 1998 (Argyll 1.6.3 3D)
62.1% AdobeRGB 1998 (Argyll 3D)
84.9% sRGB (Argyll 3D)
66.4% Display P3 (Argyll 3D)
Gamma: 2.13
CCT: 6911 K
| Lenovo Legion Y730-17ICH, i7-8750H LP173WF4-SPF6, IPS, 17.3", 1920x1080 | Alienware 17 R5 JYWWF_B173QTN (AUO1496), TN, 17.3", 2560x1440 | HP Omen 17t-3AW55AV_1 AU Optronics AUO309D, IPS, 17.3", 1920x1080 | Dell G3 17 3779 AUO, B173HAN01.3, IPS, 17.3", 1920x1080 | Asus Strix GL703GM-DS74 Chi Mei CMN1747 M173JJE-G32, TN LED, 17.3", 1920x1080 | MSI GE73 8RF-008 Raider RGB Chi Mei N173HHE-G32 (CMN1747), TN WLED, 17.3", 1920x1080 | |
|---|---|---|---|---|---|---|
| Display | -1% | 3% | 2% | 30% | 31% | |
| Display P3 Coverage (%) | 66.4 | 63.4 -5% | 65.4 -2% | 63.9 -4% | 90 36% | 90.8 37% |
| sRGB Coverage (%) | 84.9 | 86.1 1% | 90 6% | 89.8 6% | 100 18% | 99.9 18% |
| AdobeRGB 1998 Coverage (%) | 62.1 | 62.9 1% | 65.8 6% | 64.9 5% | 84.8 37% | 85.8 38% |
| Response Times | 59% | 55% | -6% | 73% | 34% | |
| Response Time Grey 50% / Grey 80% * (ms) | 36.8 ? | 20.8 ? 43% | 17.6 ? 52% | 38 ? -3% | 8.8 ? 76% | 28 ? 24% |
| Response Time Black / White * (ms) | 24 ? | 6 ? 75% | 10 ? 58% | 26 ? -8% | 7.4 ? 69% | 13.6 ? 43% |
| PWM Frequency (Hz) | 25510 ? | 25000 ? | ||||
| Screen | 4% | 18% | 8% | 16% | 25% | |
| Brightness middle (cd/m²) | 328.7 | 398 21% | 343.6 5% | 323 -2% | 297.8 -9% | 273 -17% |
| Brightness (cd/m²) | 318 | 367 15% | 320 1% | 306 -4% | 285 -10% | 273 -14% |
| Brightness Distribution (%) | 91 | 86 -5% | 87 -4% | 89 -2% | 84 -8% | 90 -1% |
| Black Level * (cd/m²) | 0.51 | 0.51 -0% | 0.34 33% | 0.31 39% | 0.33 35% | 0.26 49% |
| Contrast (:1) | 645 | 780 21% | 1011 57% | 1042 62% | 902 40% | 1050 63% |
| Colorchecker dE 2000 * | 4.91 | 5.45 -11% | 3.74 24% | 4.96 -1% | 3.68 25% | 3.52 28% |
| Colorchecker dE 2000 max. * | 10.15 | 10.36 -2% | 5.33 47% | 8.25 19% | 7.71 24% | 6.34 38% |
| Colorchecker dE 2000 calibrated * | 4.27 | 2.56 40% | 3.49 18% | 2.71 37% | 2.09 51% | |
| Greyscale dE 2000 * | 3.9 | 5.4 -38% | 3.7 5% | 5.65 -45% | 5 -28% | 3.11 20% |
| Gamma | 2.13 103% | 2.4 92% | 2.36 93% | 2.24 98% | 2.06 107% | 2.43 91% |
| CCT | 6911 94% | 7453 87% | 6388 102% | 7441 87% | 6728 97% | 6999 93% |
| Color Space (Percent of AdobeRGB 1998) (%) | 55.6 | 56 1% | 58 4% | 58 4% | 84.77 52% | 76 37% |
| Color Space (Percent of sRGB) (%) | 84.7 | 86 2% | 90 6% | 90 6% | 99.97 18% | 100 18% |
| Total Average (Program / Settings) | 21% /
10% | 25% /
20% | 1% /
5% | 40% /
26% | 30% /
27% |
* ... smaller is better
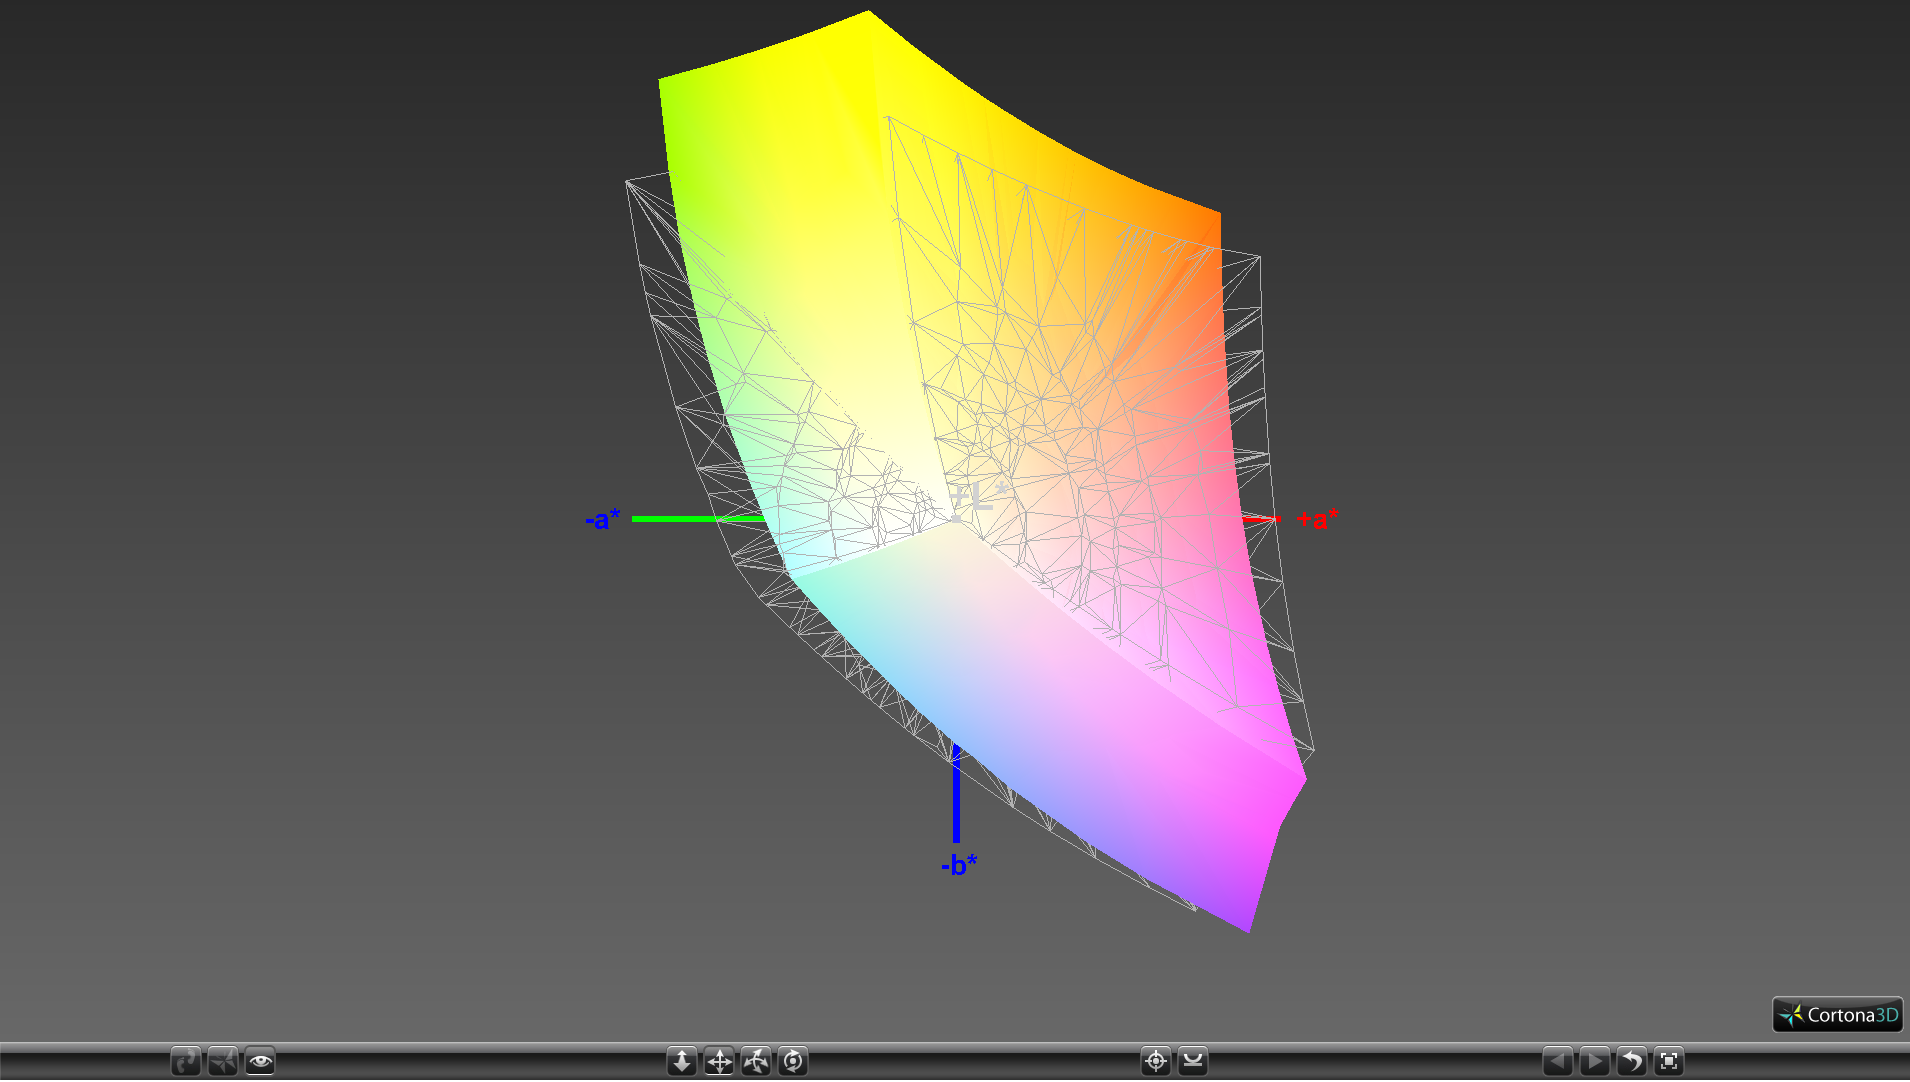
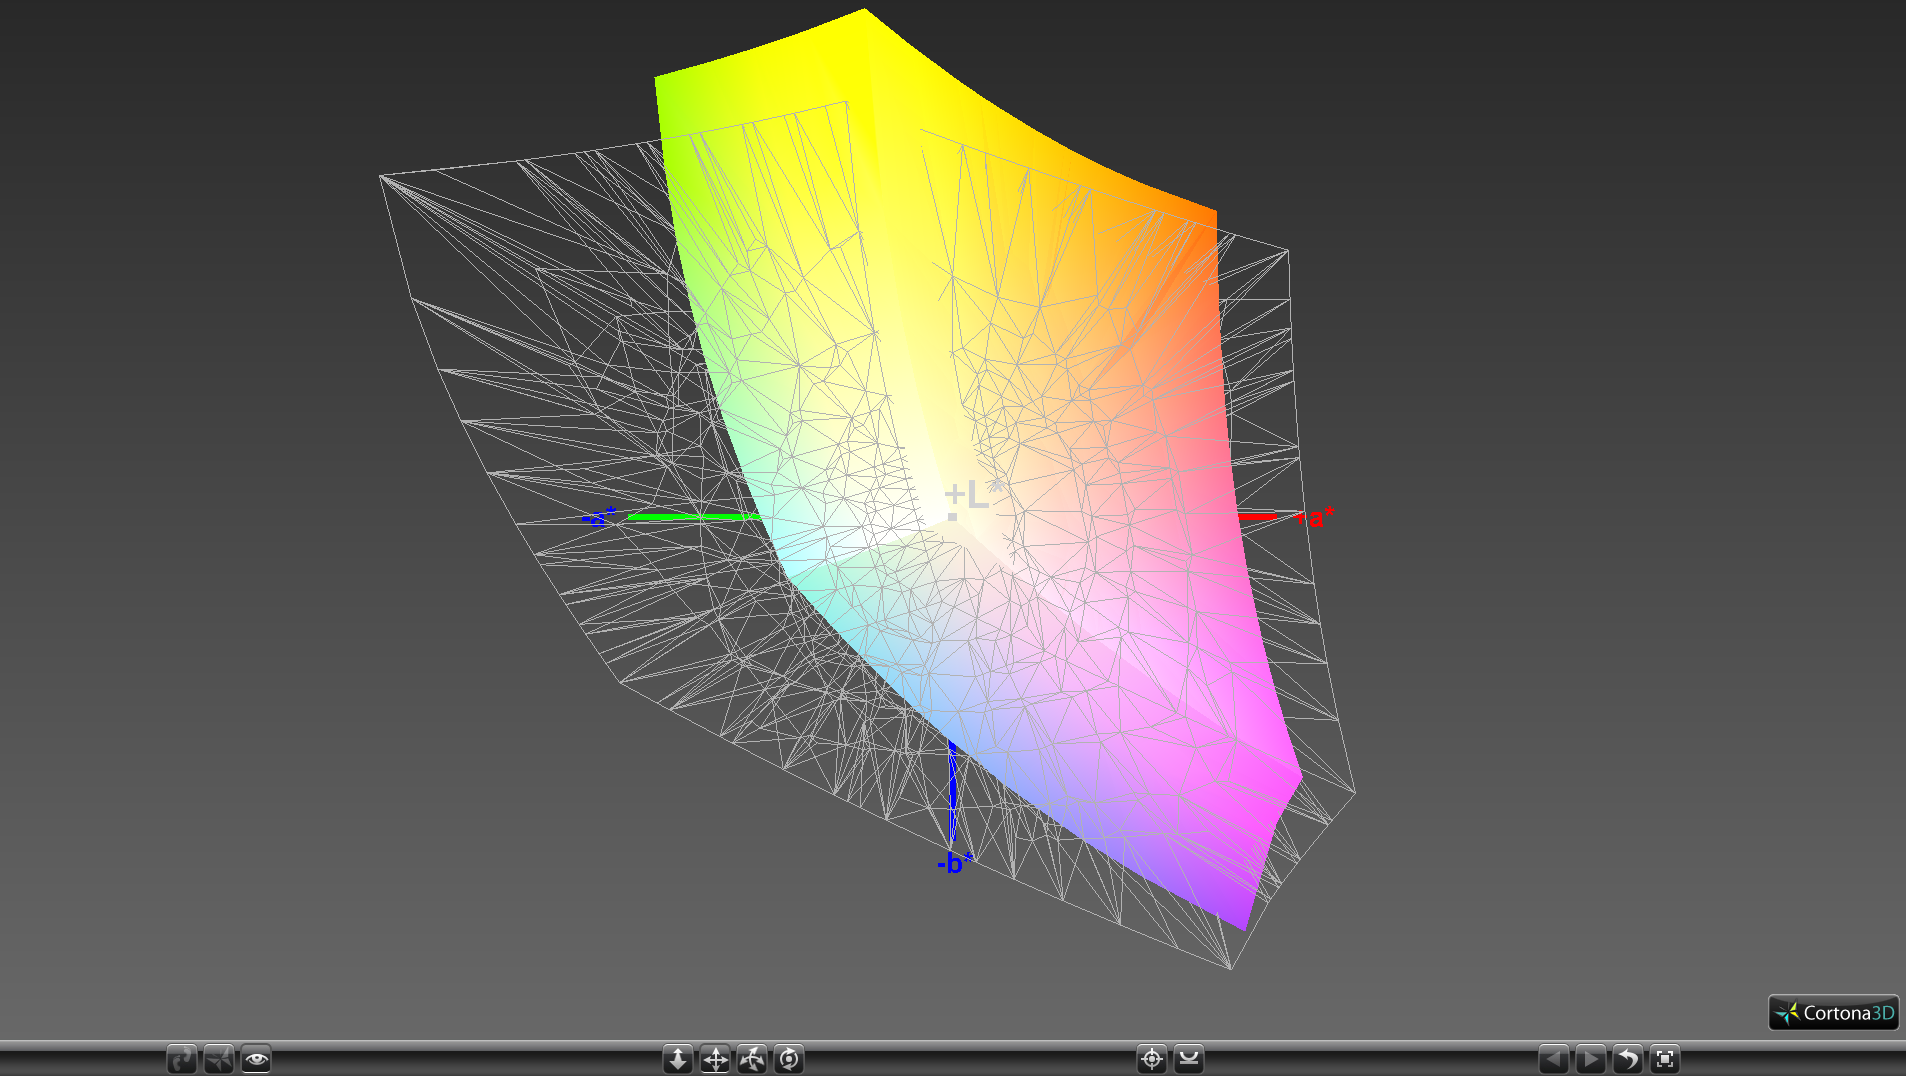
Color space is approximately 56 percent and 85 percent of the AdobeRGB and sRGB standards, respectively, to indicate a mainstream panel. Full sRGB coverage is less important for gaming laptops relative to response times and contrast. Gamers who want full sRGB coverage regardless should consider the Asus GL703 or MSI GE73 series instead where such panel options are available.
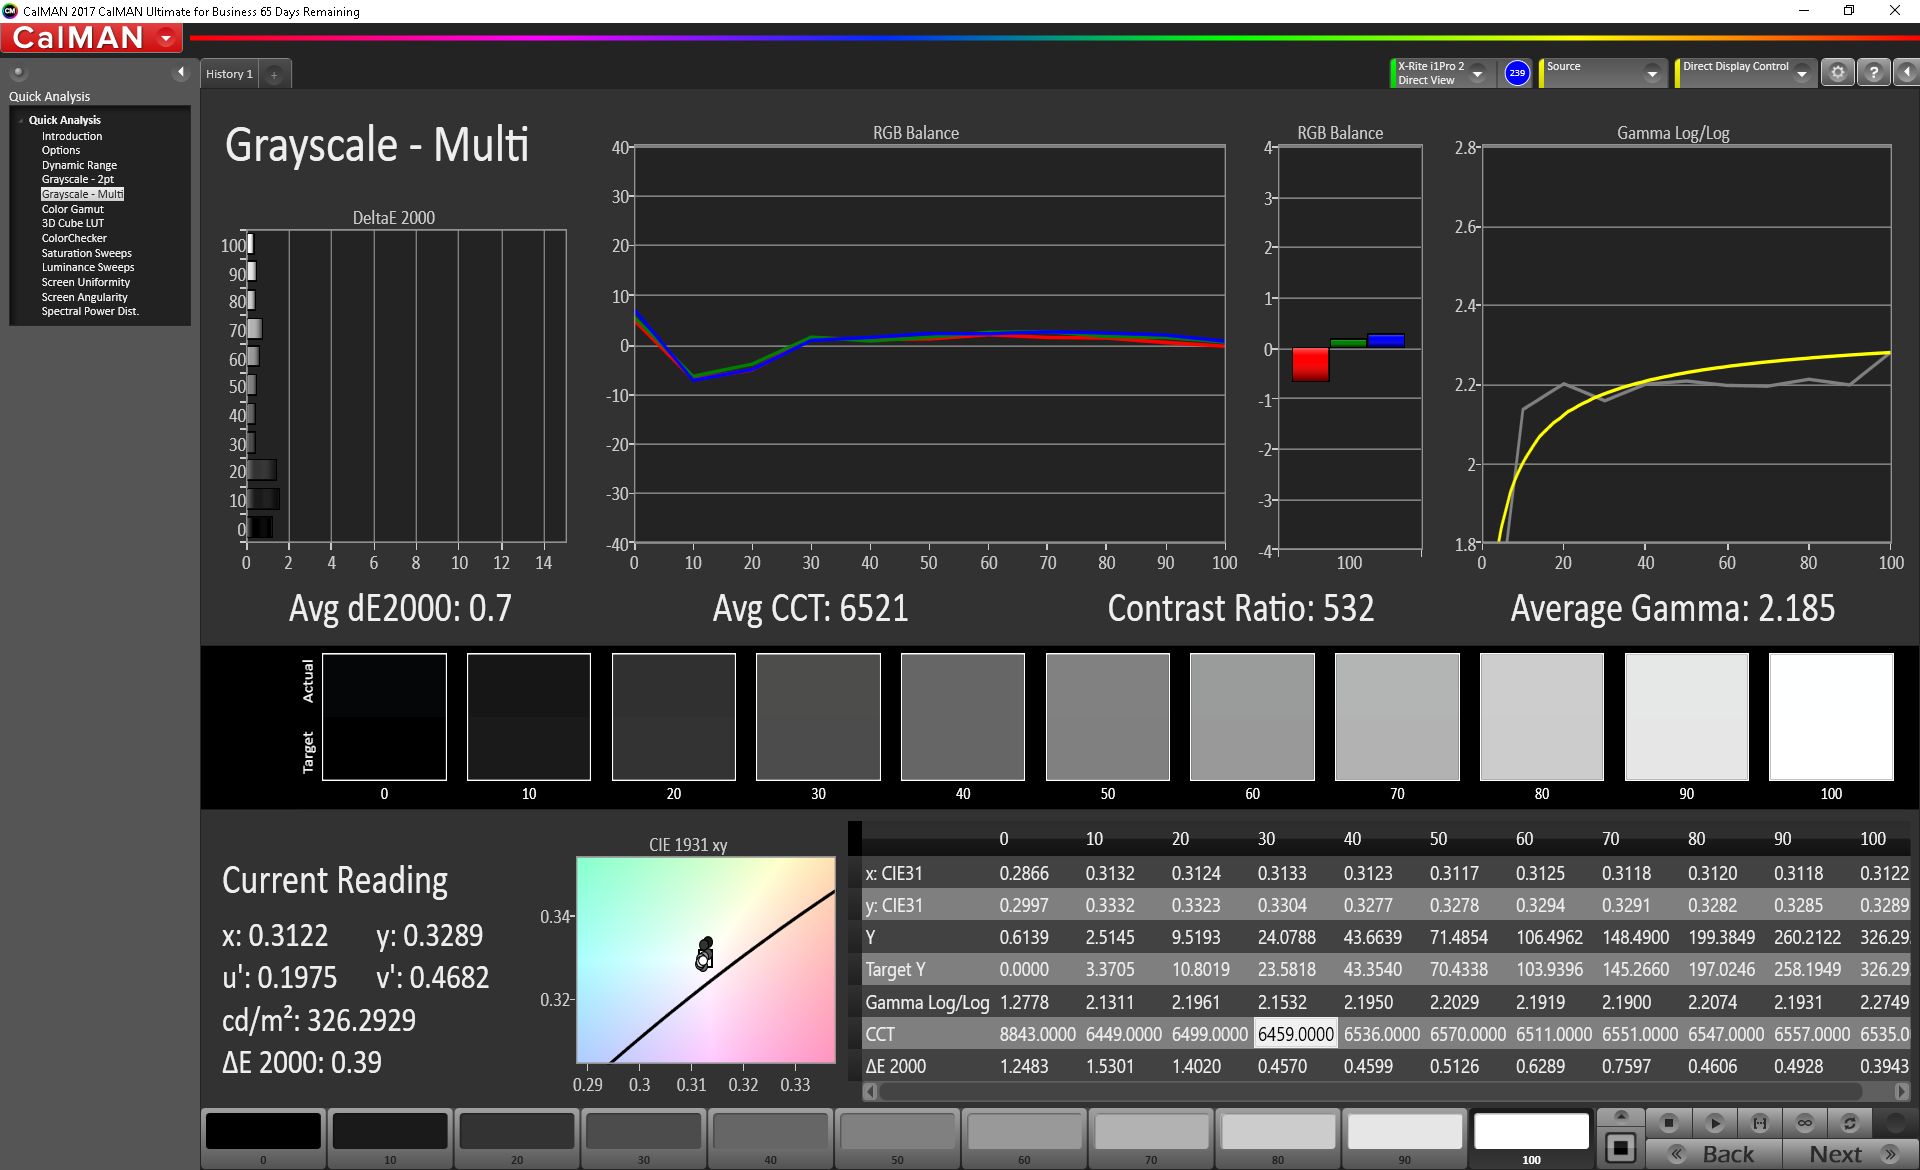
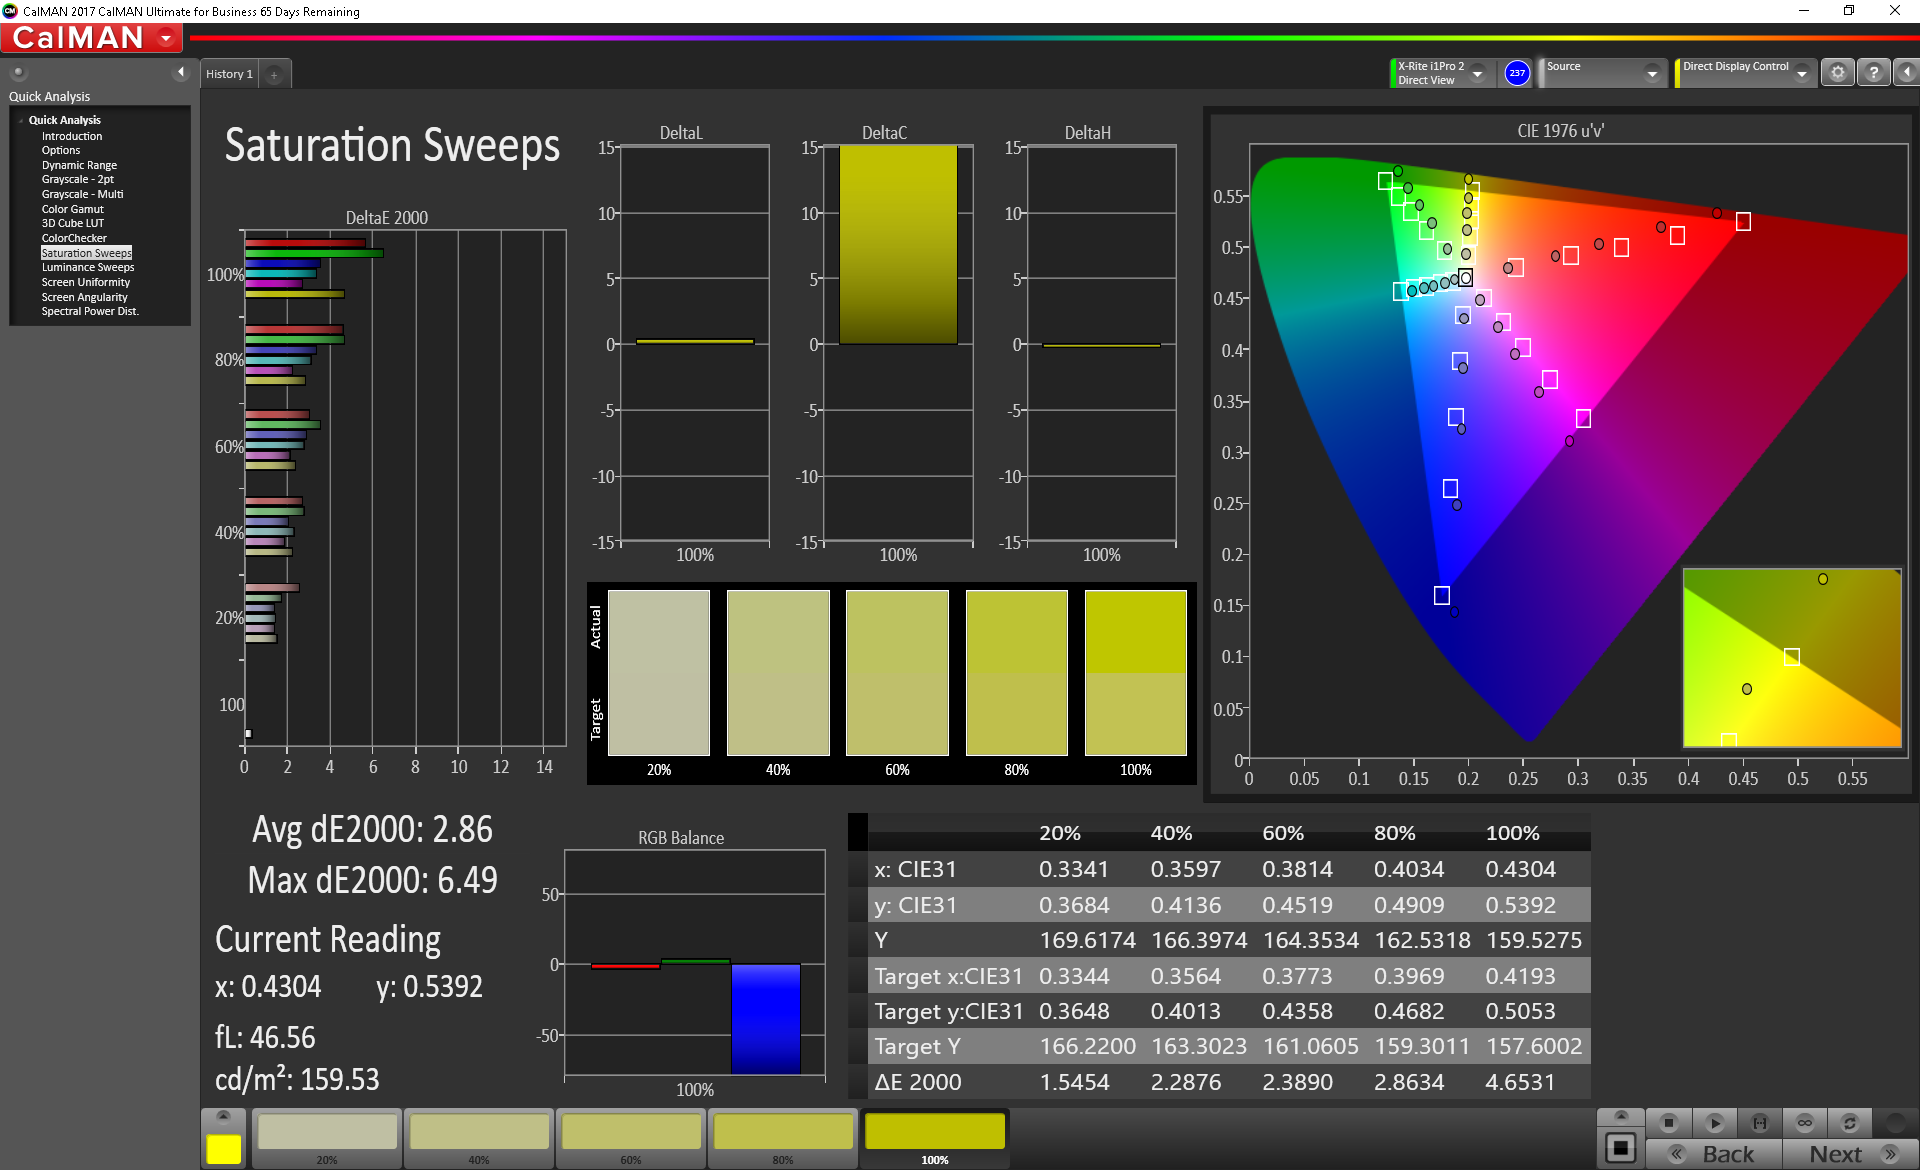
Further analyses with a spectrophotometer reveal above average grayscale and colors out of the box. Our calibration attempts improve accuracy even further and we recommend applying our ICC profile above to get the most out of the display. Colors still become increasingly inaccurate the higher the saturation level due to imperfect sRGB coverage.

Display Response Times
| ↔ Response Time Black to White | ||
|---|---|---|
| 24 ms ... rise ↗ and fall ↘ combined | ↗ 14 ms rise | 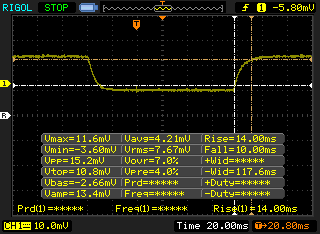 |
| ↘ 10 ms fall | ||
| The screen shows good response rates in our tests, but may be too slow for competitive gamers. In comparison, all tested devices range from 0.1 (minimum) to 240 (maximum) ms. » 54 % of all devices are better. This means that the measured response time is worse than the average of all tested devices (19.9 ms). | ||
| ↔ Response Time 50% Grey to 80% Grey | ||
| 36.8 ms ... rise ↗ and fall ↘ combined | ↗ 18.8 ms rise | 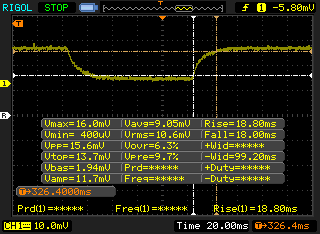 |
| ↘ 18 ms fall | ||
| The screen shows slow response rates in our tests and will be unsatisfactory for gamers. In comparison, all tested devices range from 0.165 (minimum) to 636 (maximum) ms. » 53 % of all devices are better. This means that the measured response time is worse than the average of all tested devices (31.1 ms). | ||
Screen Flickering / PWM (Pulse-Width Modulation)
| Screen flickering / PWM not detected | 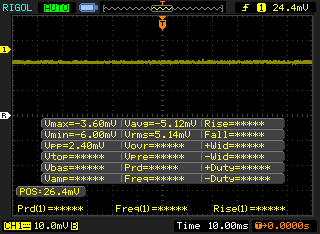 | ||
In comparison: 52 % of all tested devices do not use PWM to dim the display. If PWM was detected, an average of 7798 (minimum: 5 - maximum: 343500) Hz was measured. | |||
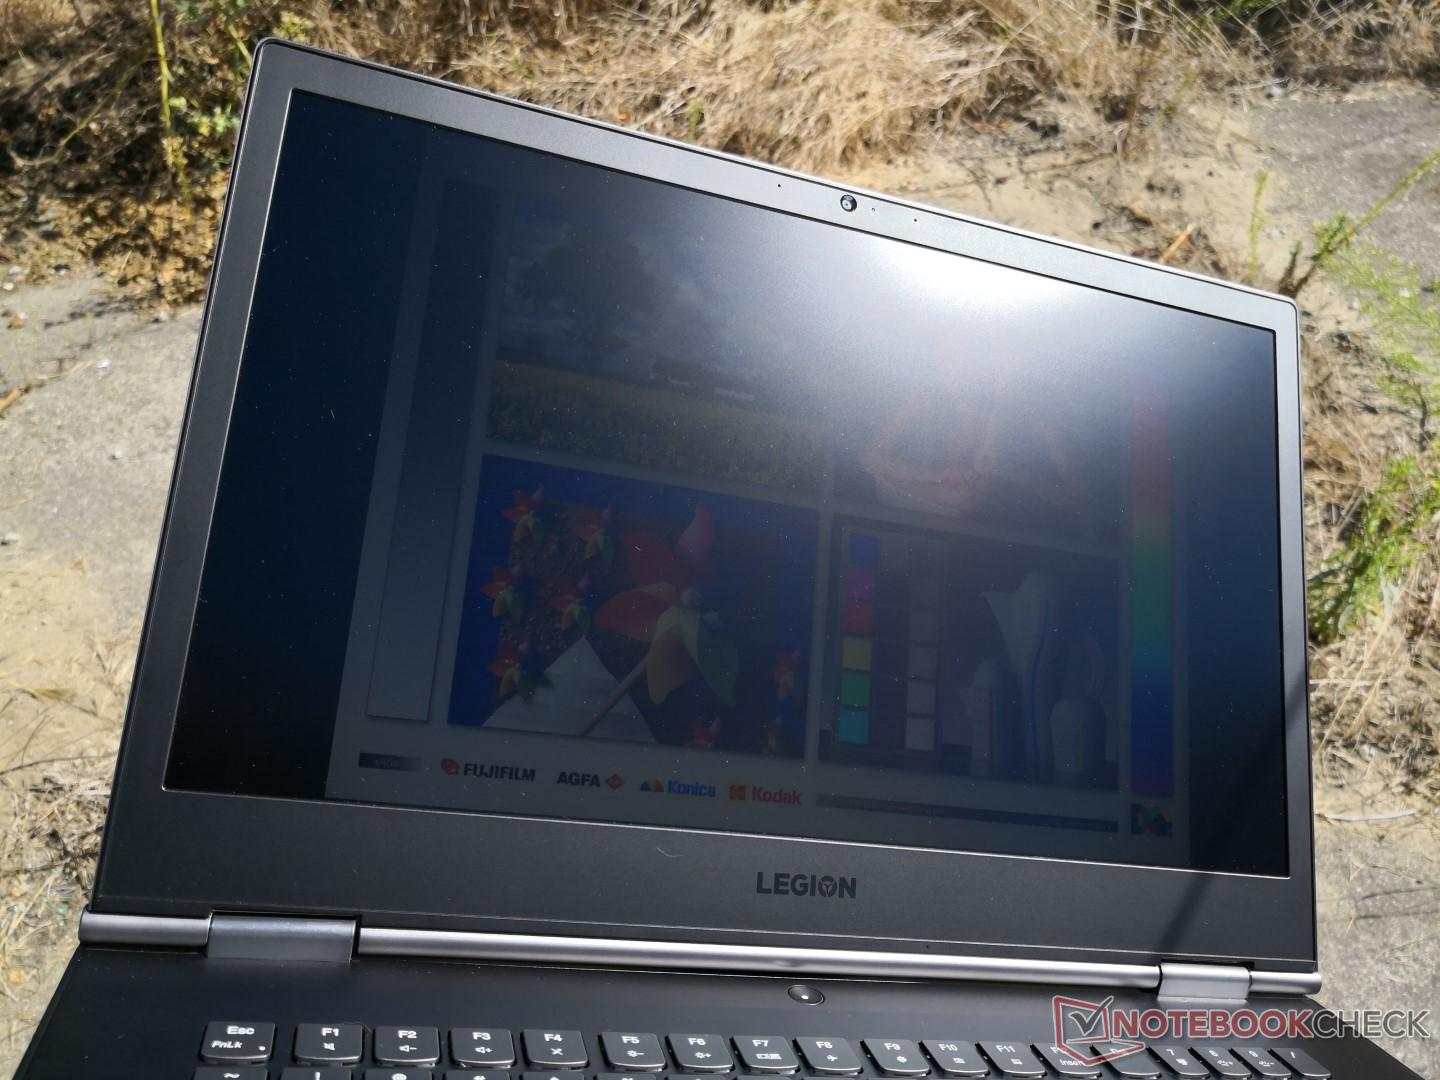
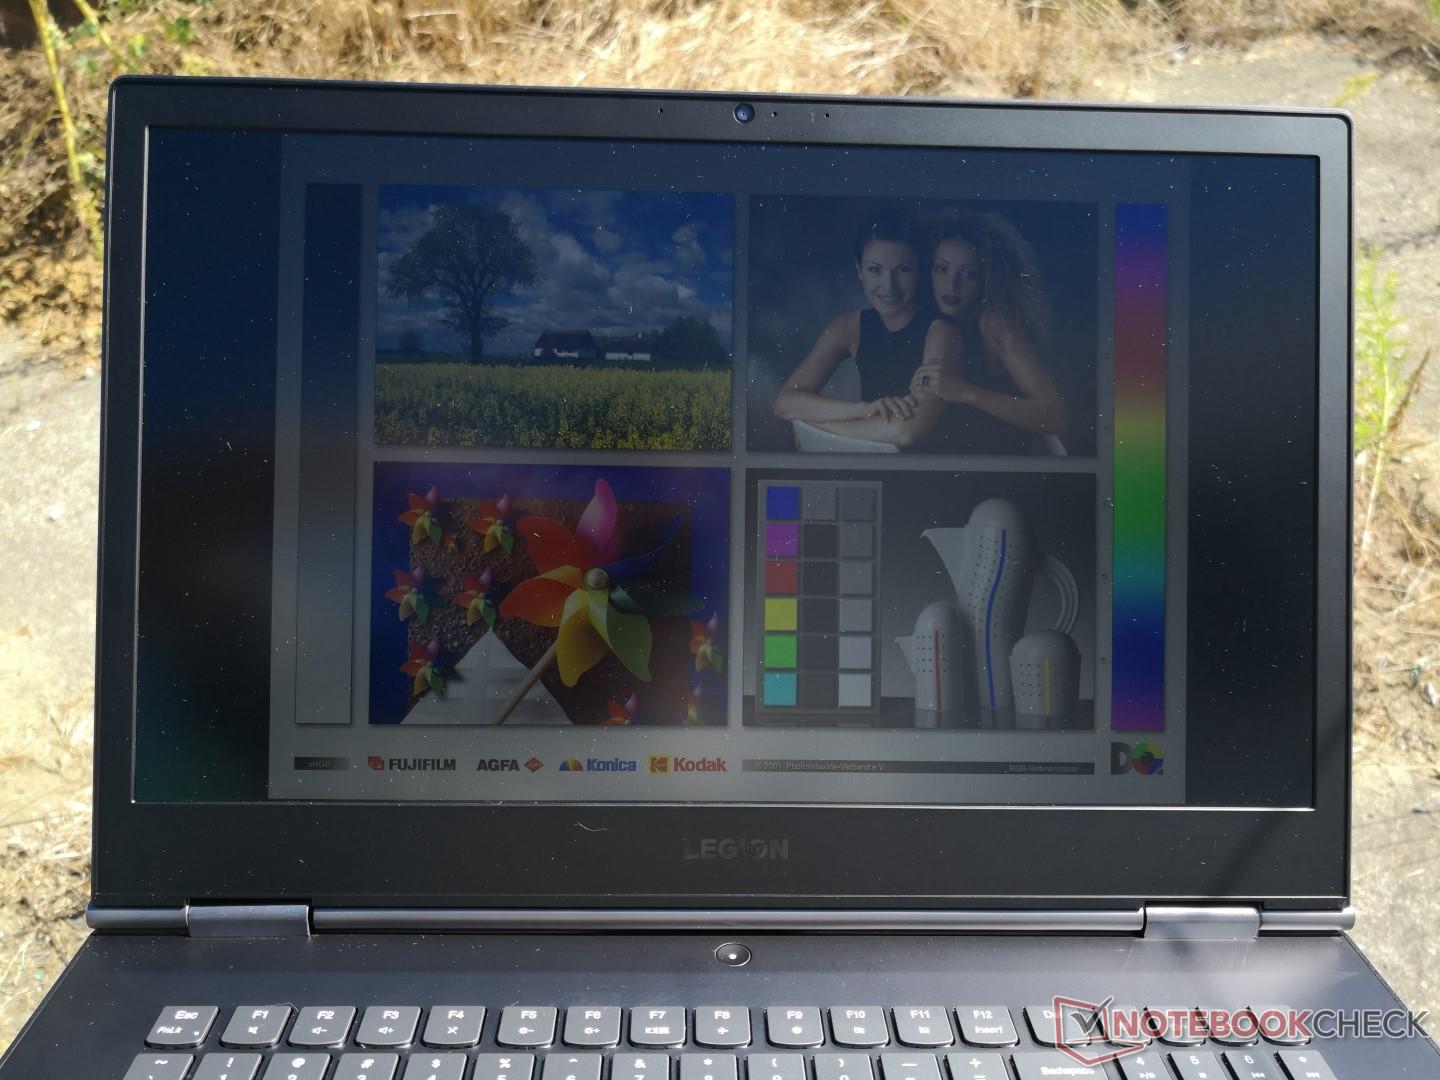
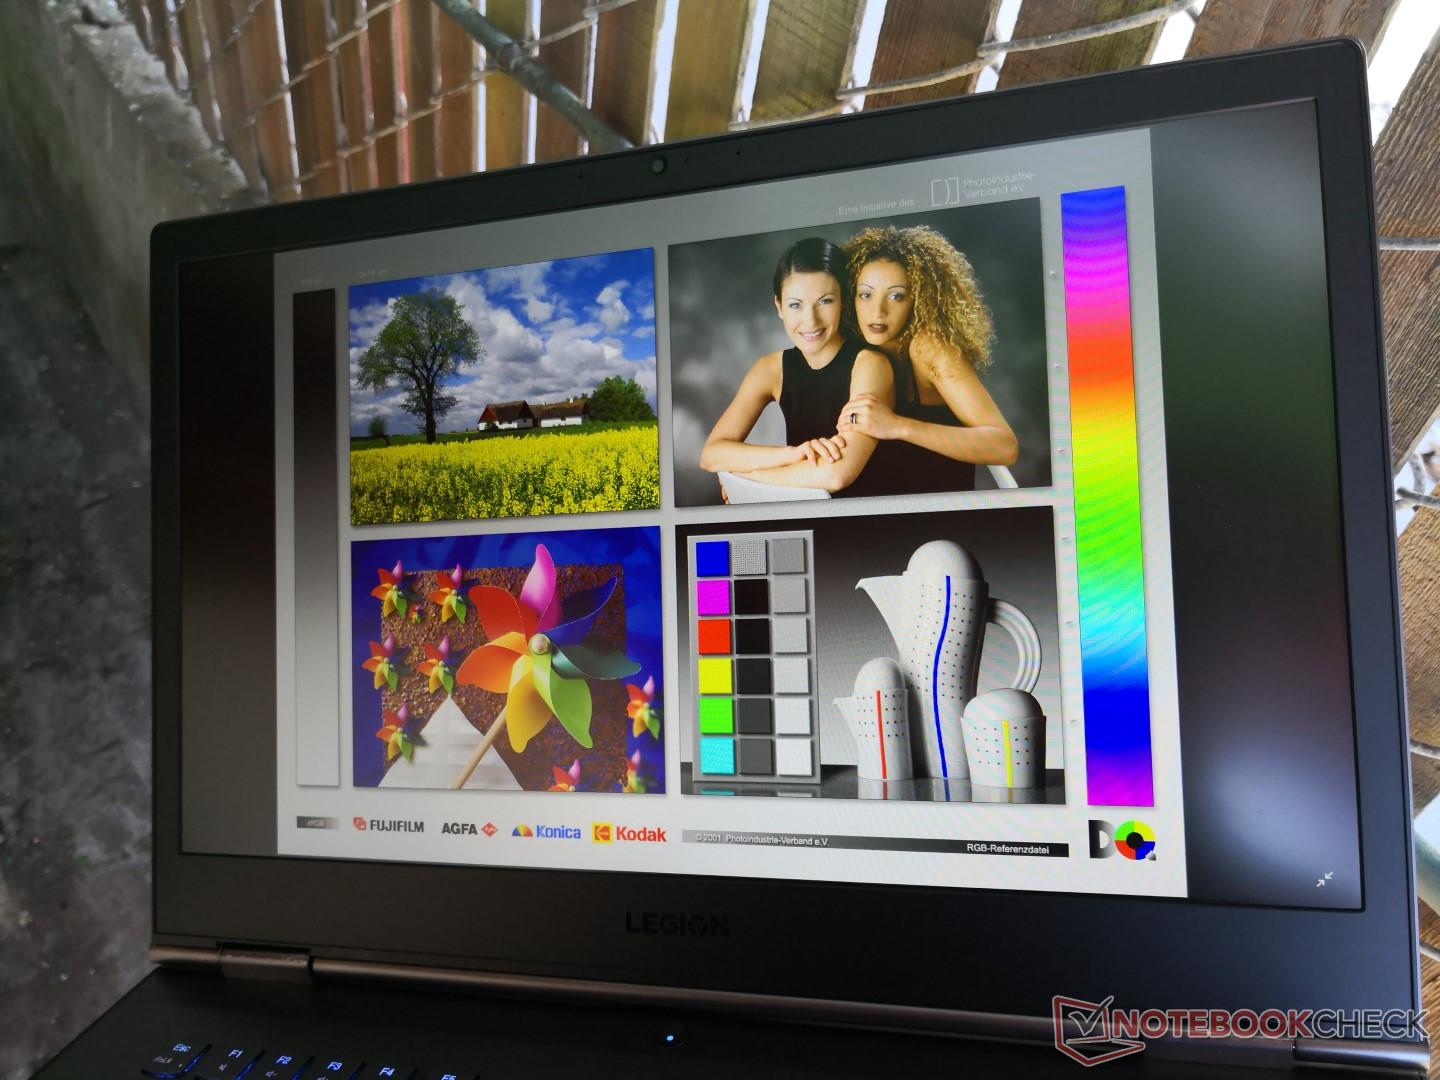
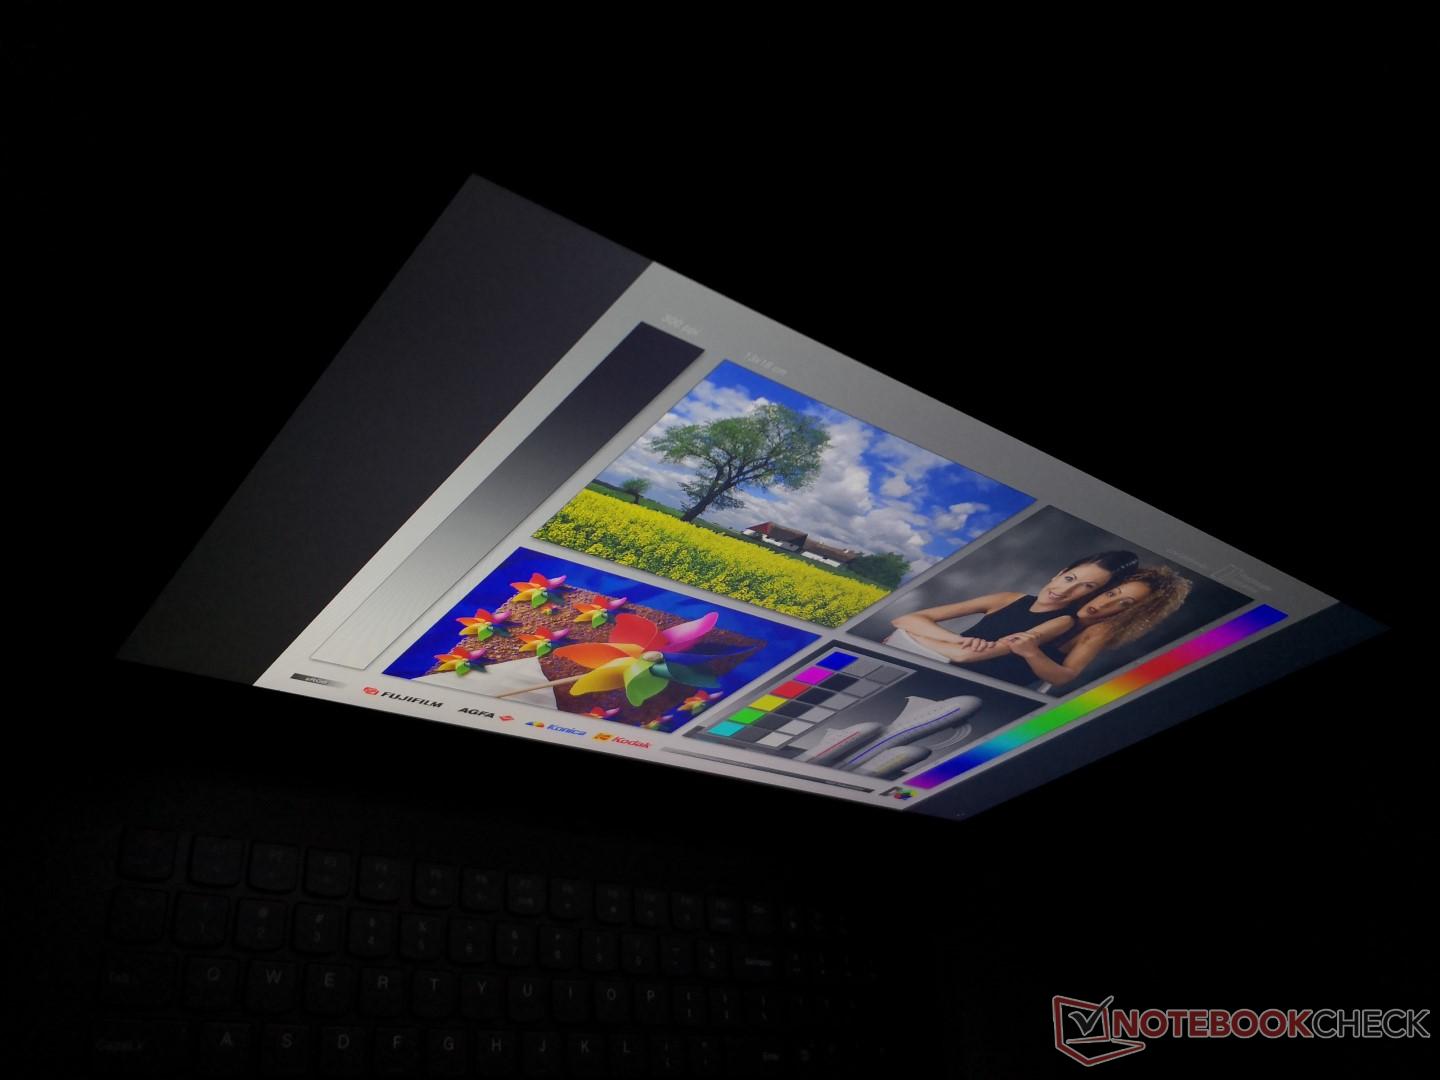
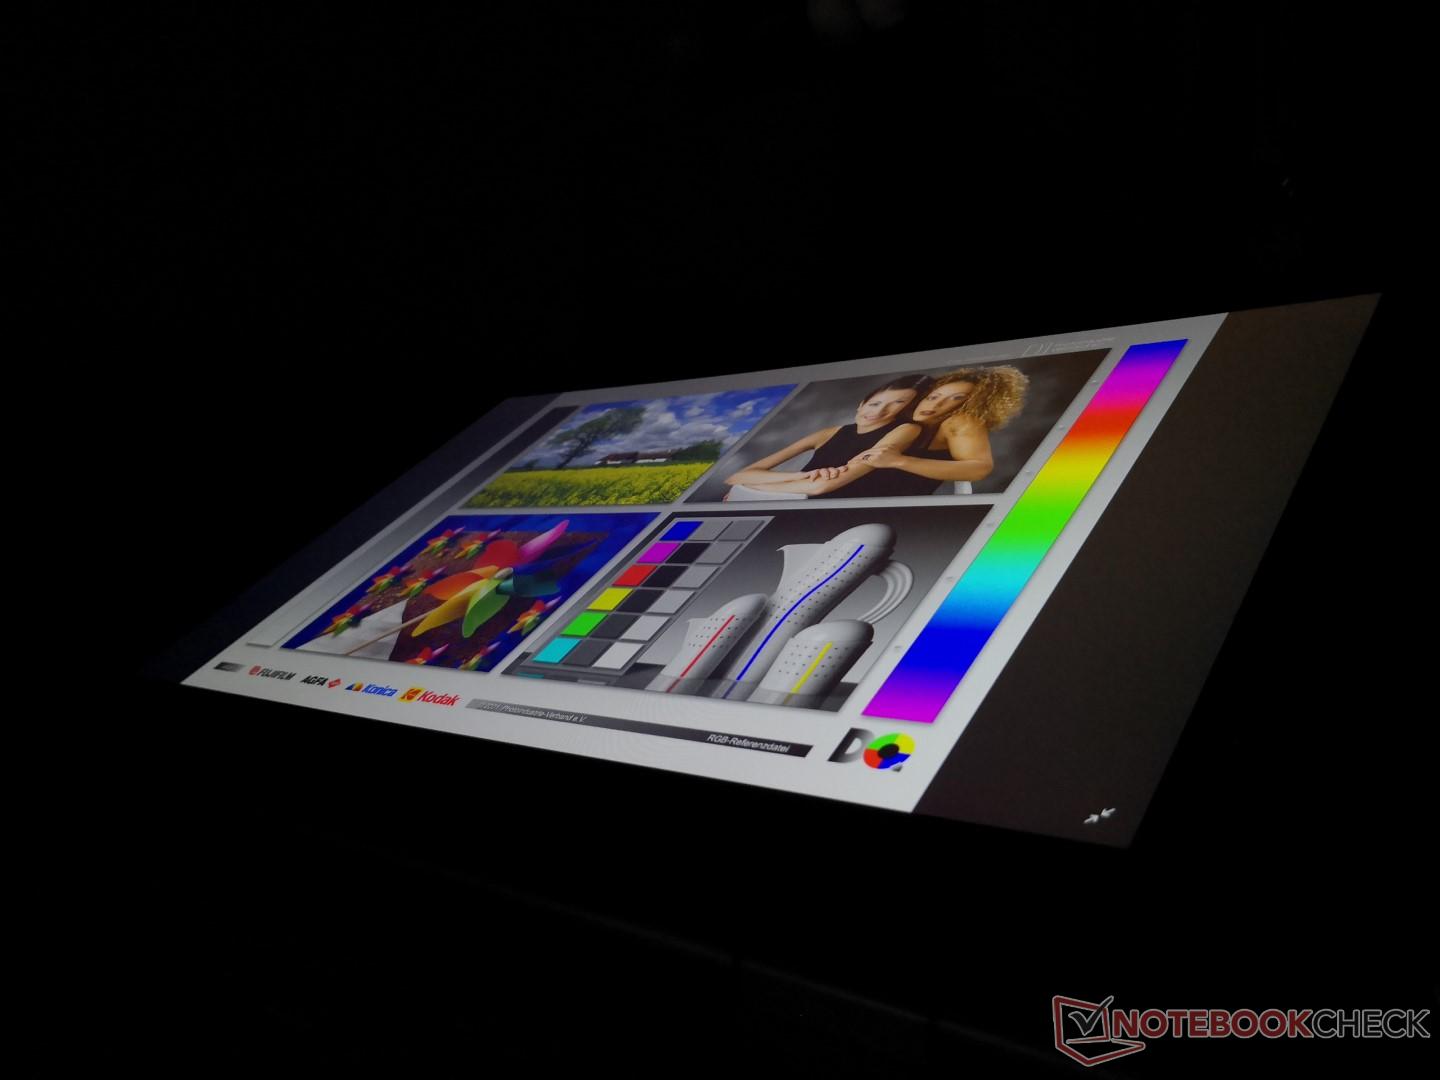
Outdoor visibility is average at best. Its backlight is not any stronger or weaker than most 17-inch gaming laptops and so we can't bump down the system in this regard. The IPS panel allows for very wide viewing angles without color degradation. The hinges, however, could have been more taut for such conditions.
Performance
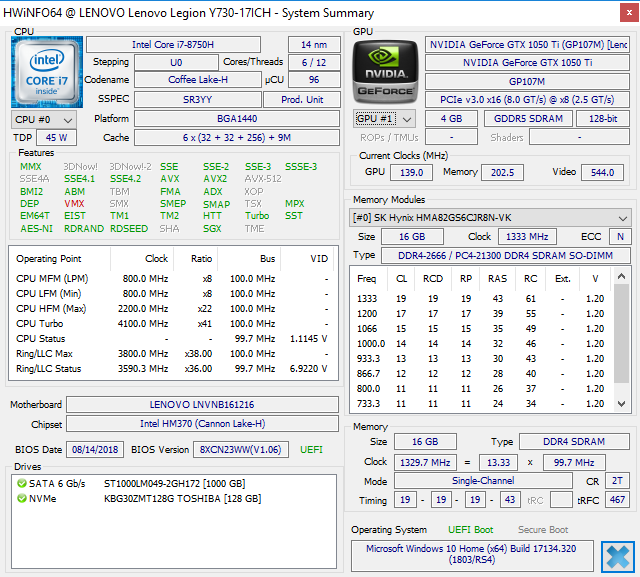
Just two Coffee Lake-H CPU options are available as mentioned in the introduction with no extra GPU options other than the base GTX 1050 Ti. These specifications are common amongst budget-mainstream gaming laptops and the Core i5+GTX 1050 Ti combo strikes an excellent performance balance for gamers on a budget.
Nvidia Optimus is included for automatic or graphics switching to the integrated UHD Graphics 630.
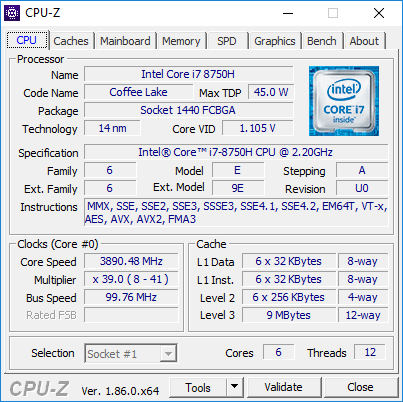
Processor
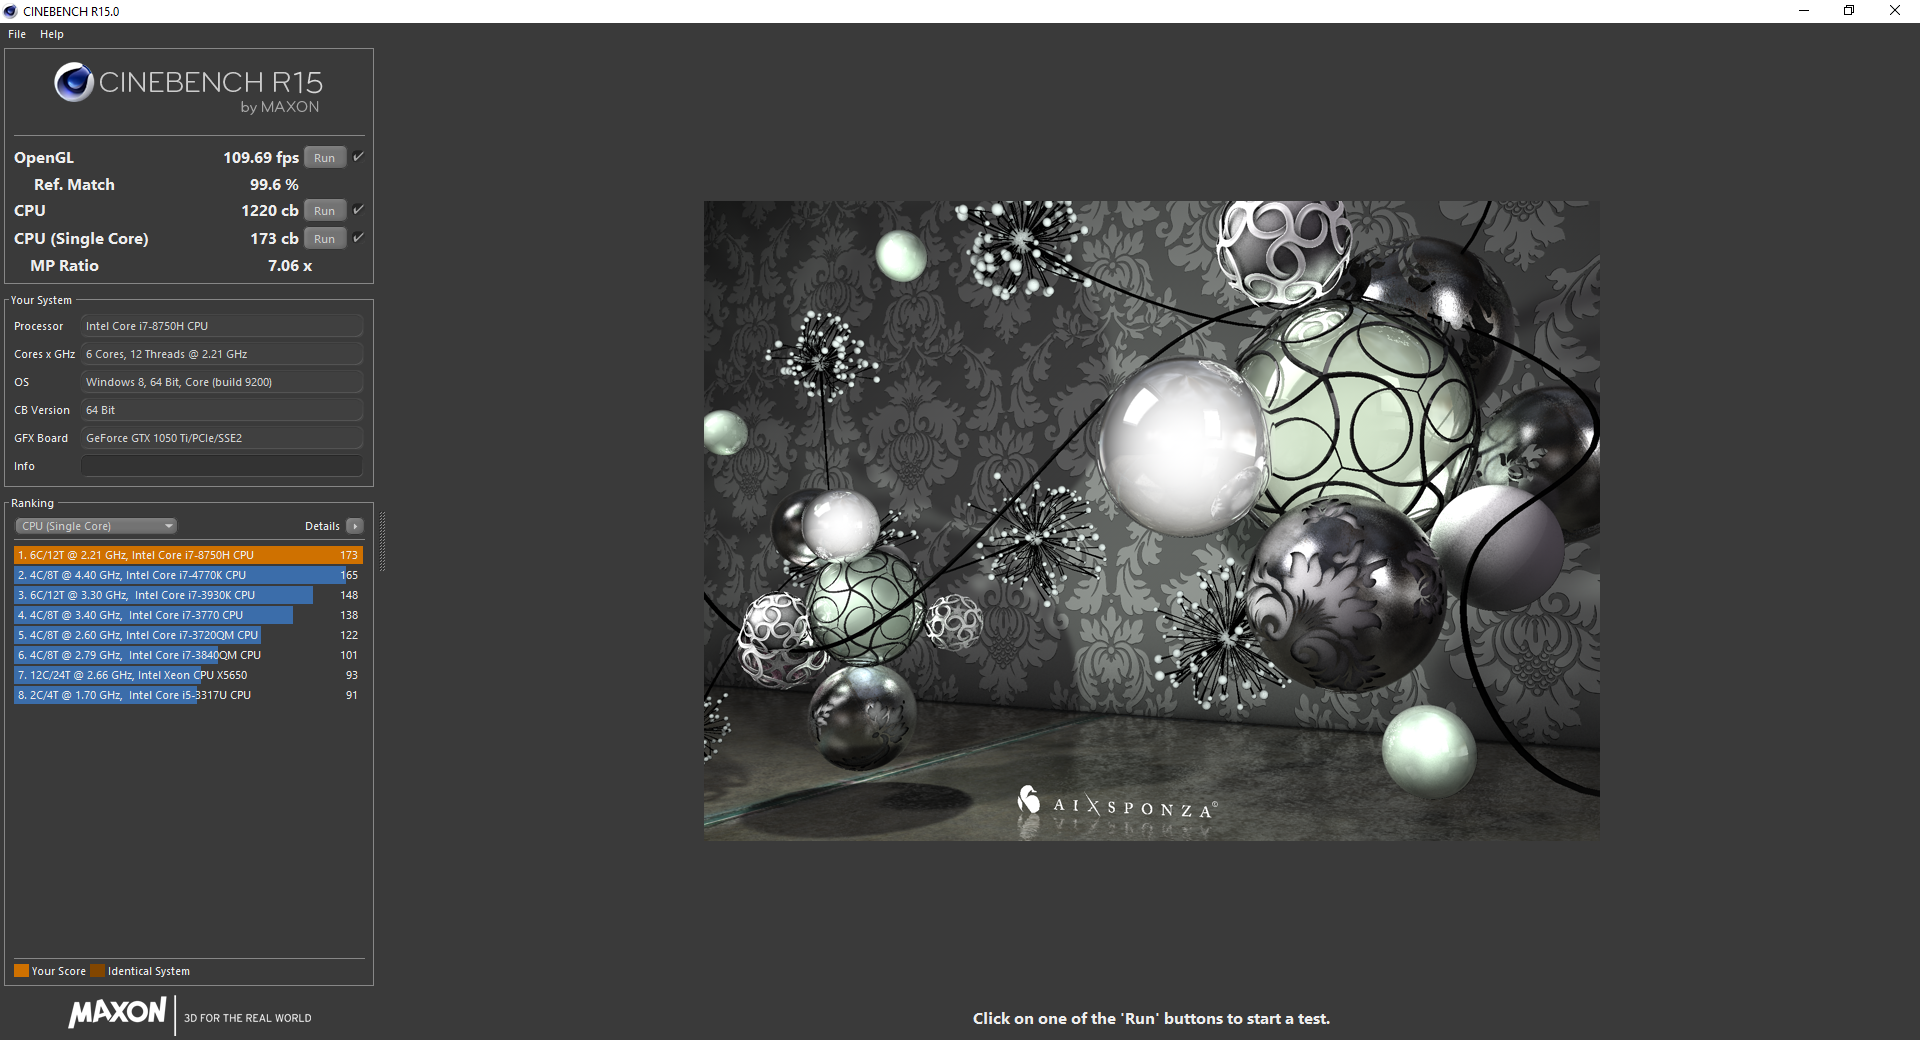
CPU performance is excellent with the CineBench R15 Multi-Thread score in particular being higher than average. Users can expect a performance boost of almost 70 percent when moving up from the last generation Core i7-7700HQ due to the increased number of physical cores. Users who want the base configuration of the Y730 with the slower Core i5-8300H will see a 35 percent decrease in CPU performance from the i7-8750H.
Running CineBench R15 Multi-Thread in a loop reveals stable scores from start to finish to suggest excellent Turbo Boost performance. See our dedicated page on the Core i7-8750H for more technical details and benchmark comparisons.
System Performance
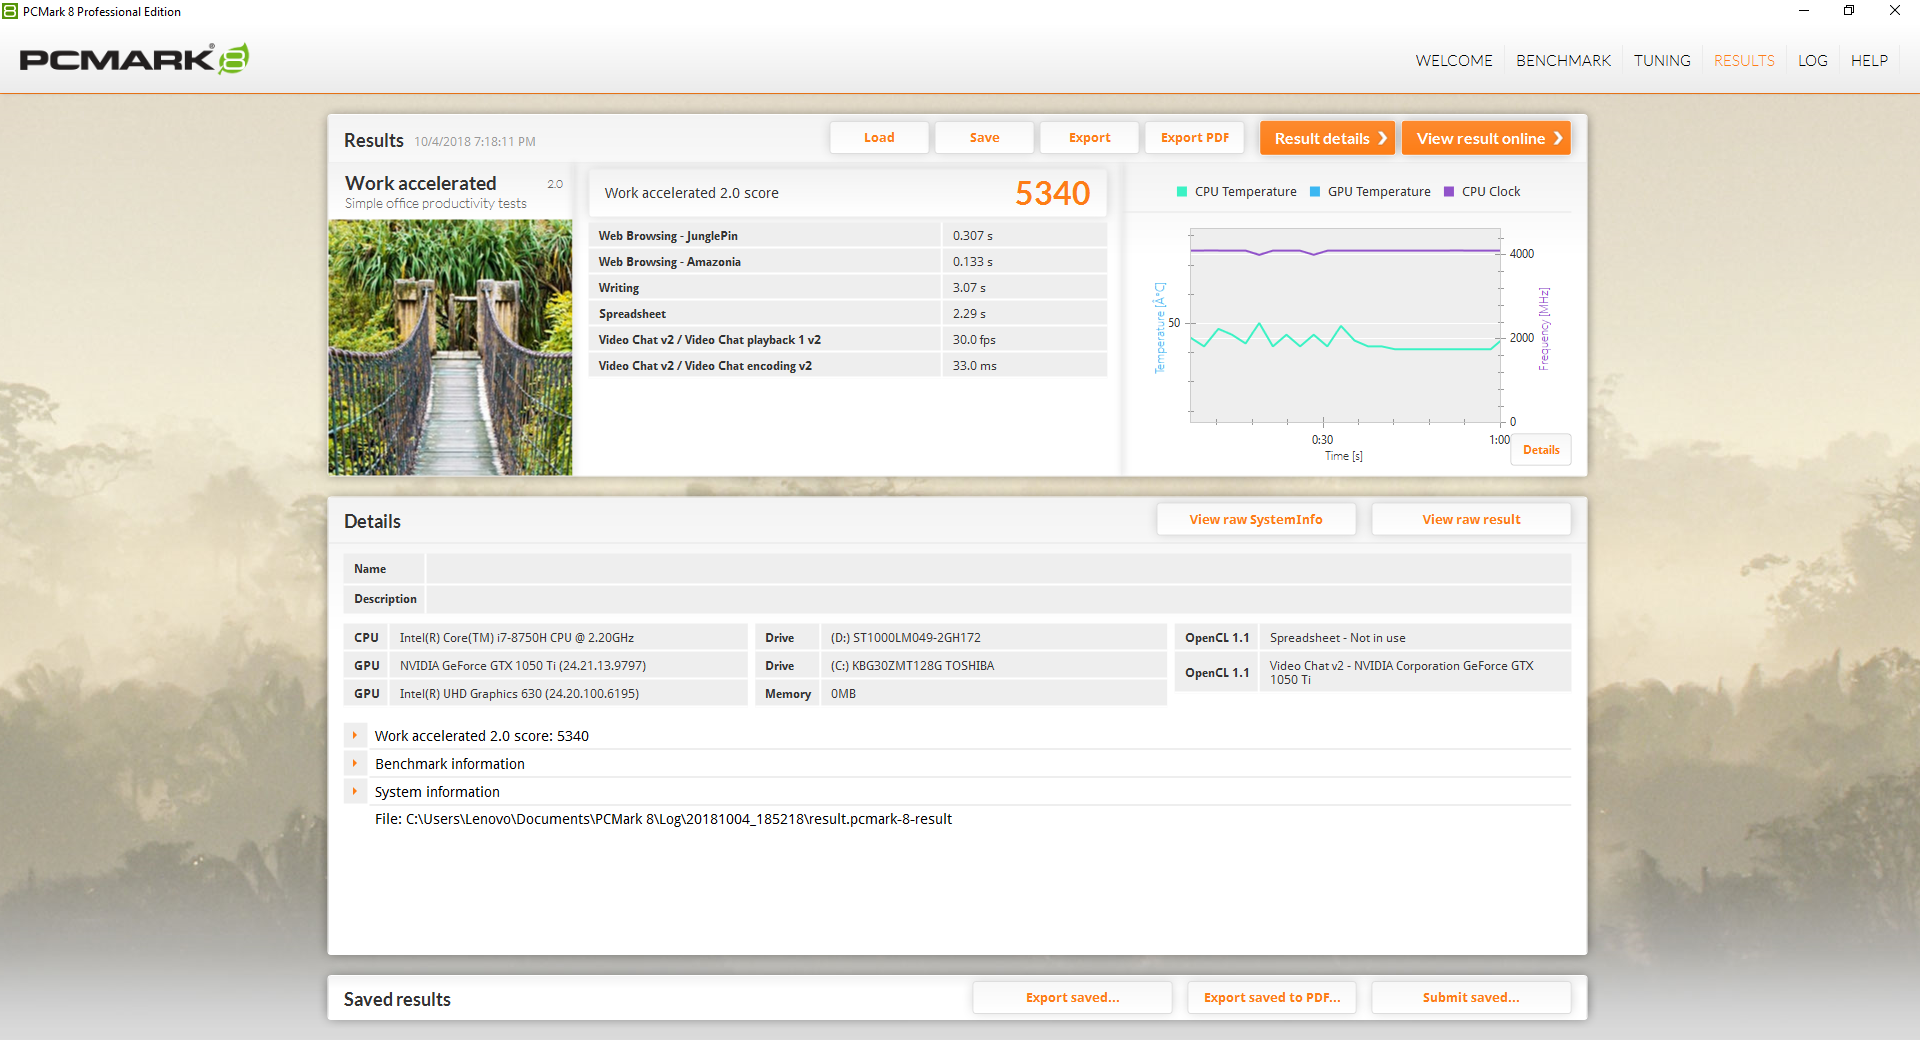
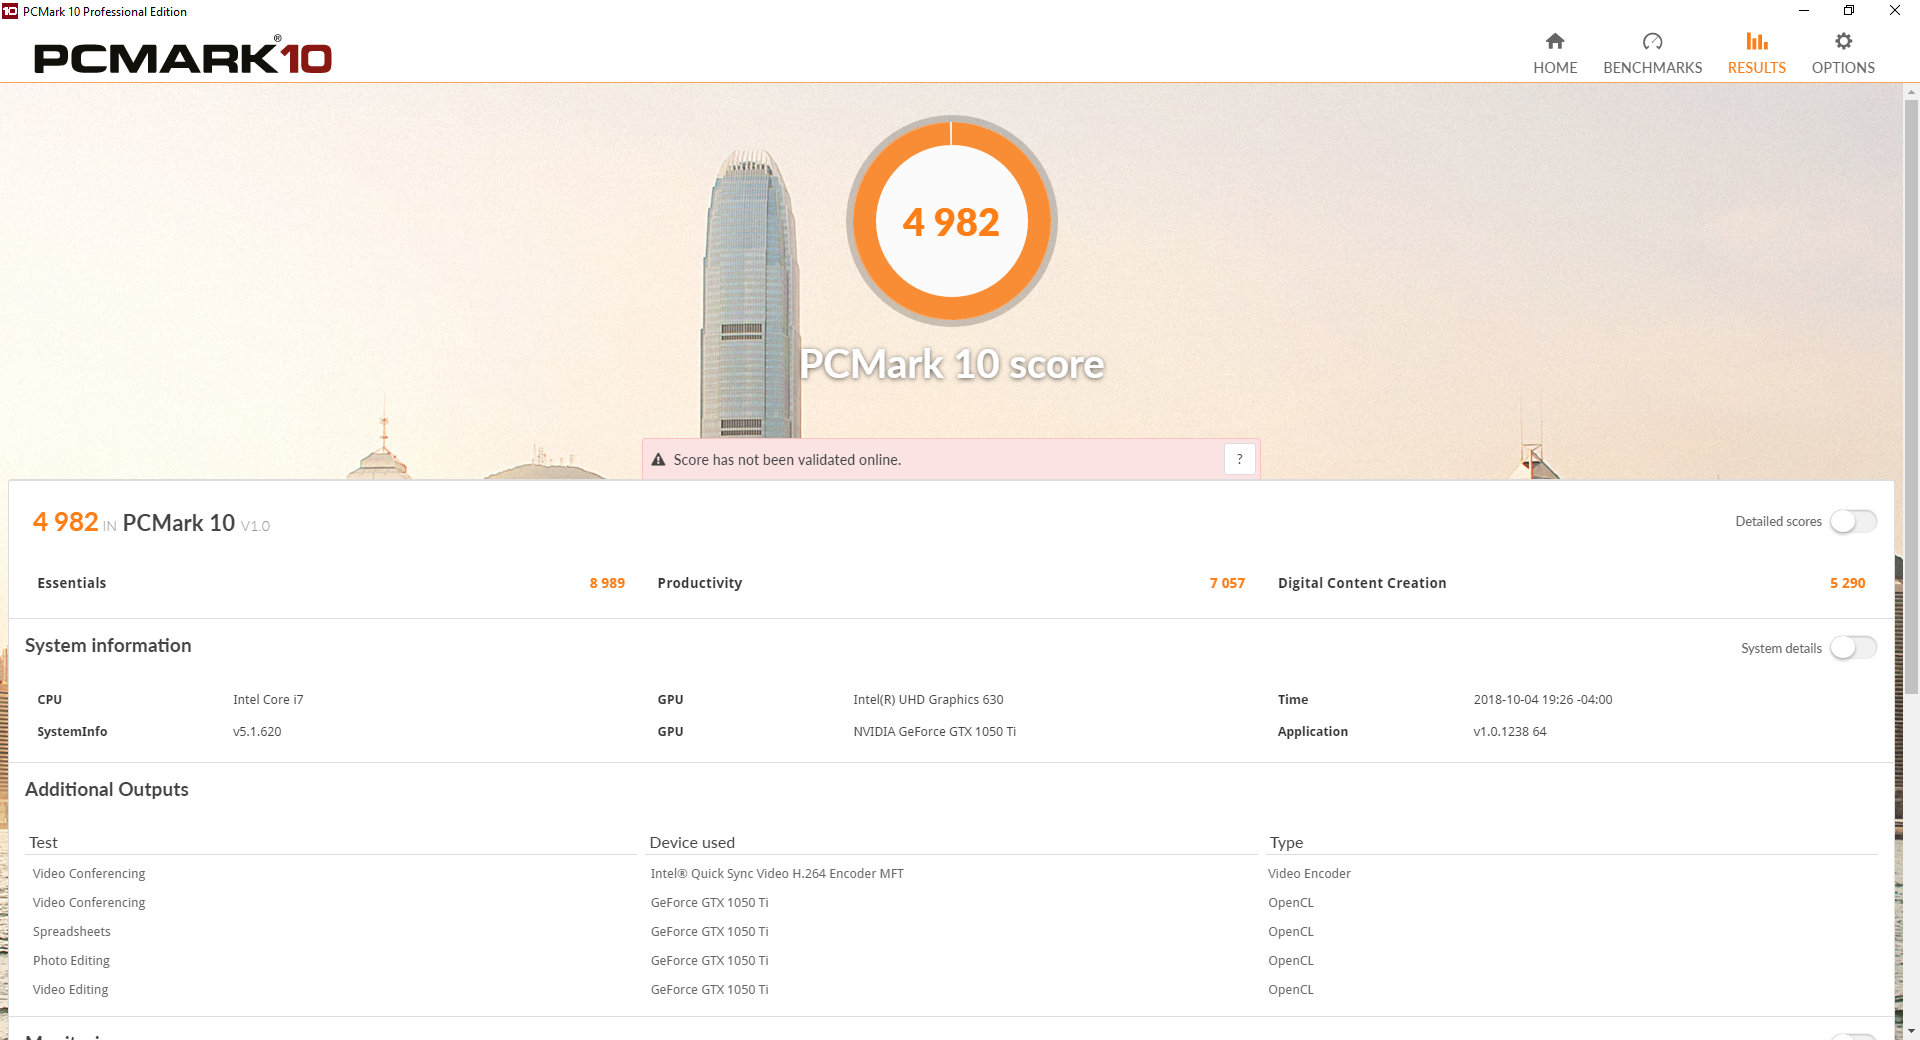
PCMark benchmarks rank our Lenovo in the same ballpark as other gaming laptops equipped with the same CPU and GPU. We experienced no notable software issues during our time with the test unit.
| PCMark 8 Home Score Accelerated v2 | 4148 points | |
| PCMark 8 Work Score Accelerated v2 | 5340 points | |
| PCMark 10 Score | 4982 points | |
Help | ||
Storage Devices
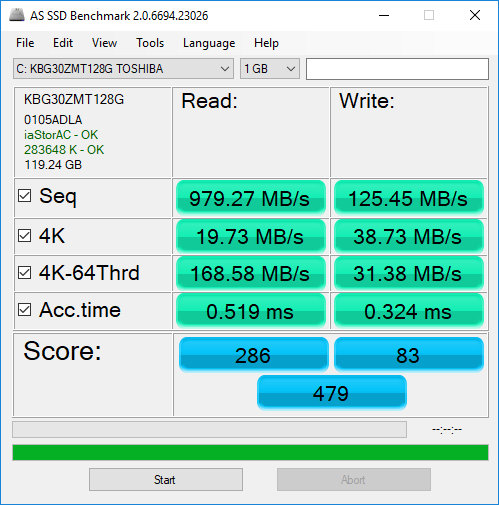
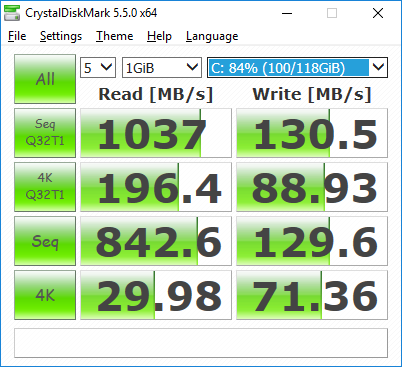
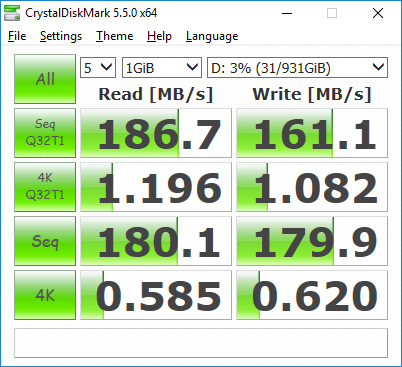
Two internal storage bays are available in the form of M.2 NVMe and 2.5-inch SATA III with support for both 7 mm and 9.5 mm drives. Our test unit is equipped with a primary 128 GB Toshiba KBG30ZMT128G M.2 NVMe SSD and a secondary 1 TB Seagate Barracuda HDD.
The Toshiba SSD performs rather poorly especially for a NVMe drive. Sequential read and write rates are only about 980 MB/s and 125 MB/s, respectively, compared to 2000 MB/s and 1000 MB/s on a Samsung PM961. This is likely a cut corner in order to keep costs low while still leaving room for the high capacity secondary HDD.
See our table of HDDs and SSDs for more benchmark comparisons.
| Lenovo Legion Y730-17ICH, i7-8750H Toshiba KBG30ZMT128G | Alienware 17 R5 SK hynix PC401 HFS256GD9TNG | HP Omen 17t-3AW55AV_1 Samsung SSD PM981 MZVLB512HAJQ | Dell G3 17 3779 SK hynix SC311 SATA | Asus Strix GL703GM-DS74 Samsung PM961 MZVLW256HEHP | Average Toshiba KBG30ZMT128G | |
|---|---|---|---|---|---|---|
| AS SSD | 233% | 915% | 41% | 463% | 28% | |
| Copy Game MB/s (MB/s) | 134.6 | 875 550% | 124.2 -8% | 481 257% | 122.3 ? -9% | |
| Copy Program MB/s (MB/s) | 182.9 | 481.1 163% | 99.8 -45% | 780 326% | 122.6 ? -33% | |
| Copy ISO MB/s (MB/s) | 272.7 | 1080 296% | 154.9 -43% | 1043 282% | 174.8 ? -36% | |
| Score Total (Points) | 479 | 1424 197% | 4142 765% | 552 15% | 3075 542% | 656 ? 37% |
| Score Write (Points) | 86 | 428 398% | 2147 2397% | 199 131% | 825 859% | 149 ? 73% |
| Score Read (Points) | 286 | 706 147% | 1304 356% | 236 -17% | 1520 431% | 360 ? 26% |
| Access Time Write * (ms) | 0.324 | 0.065 80% | 0.047 85% | 0.069 79% | 0.042 87% | 0.27 ? 17% |
| Access Time Read * (ms) | 0.519 | 0.091 82% | 0.071 86% | 0.136 74% | 0.066 87% | 0.3803 ? 27% |
| 4K-64 Write (MB/s) | 31.38 | 279.1 789% | 1866 5846% | 114.8 266% | 633 1917% | 75.1 ? 139% |
| 4K-64 Read (MB/s) | 168.6 | 447.2 165% | 1125 567% | 160.7 -5% | 1285 662% | 222 ? 32% |
| 4K Write (MB/s) | 38.73 | 92.7 139% | 84.4 118% | 58.5 51% | 88.4 128% | 60.8 ? 57% |
| 4K Read (MB/s) | 19.73 | 38.74 96% | 31.66 60% | 24.22 23% | 35.76 81% | 30.3 ? 54% |
| Seq Write (MB/s) | 125.4 | 559 346% | 1962 1465% | 254.4 103% | 1031 722% | 122.4 ? -2% |
| Seq Read (MB/s) | 979 | 2203 125% | 1473 50% | 511 -48% | 1993 104% | 1074 ? 10% |
* ... smaller is better

GPU Performance
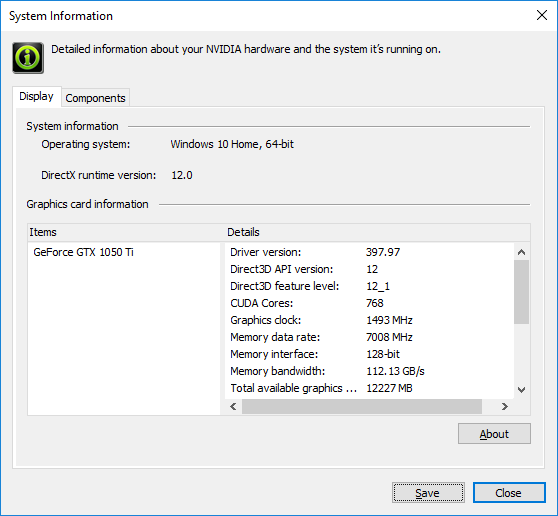
The GeForce GTX 1050 Ti in the Y730 holds no surprises as 3DMark scores are exactly where we expect them to be when compared to the average GTX 1050 Ti in our database. Performance is even within 1 or 2 percent from our GeForce GTX 1050 Ti desktop reference. Users can expect 18 percent slower performance than the last generation GTX 980M and a 27 percent boost from the regular GTX 1050.
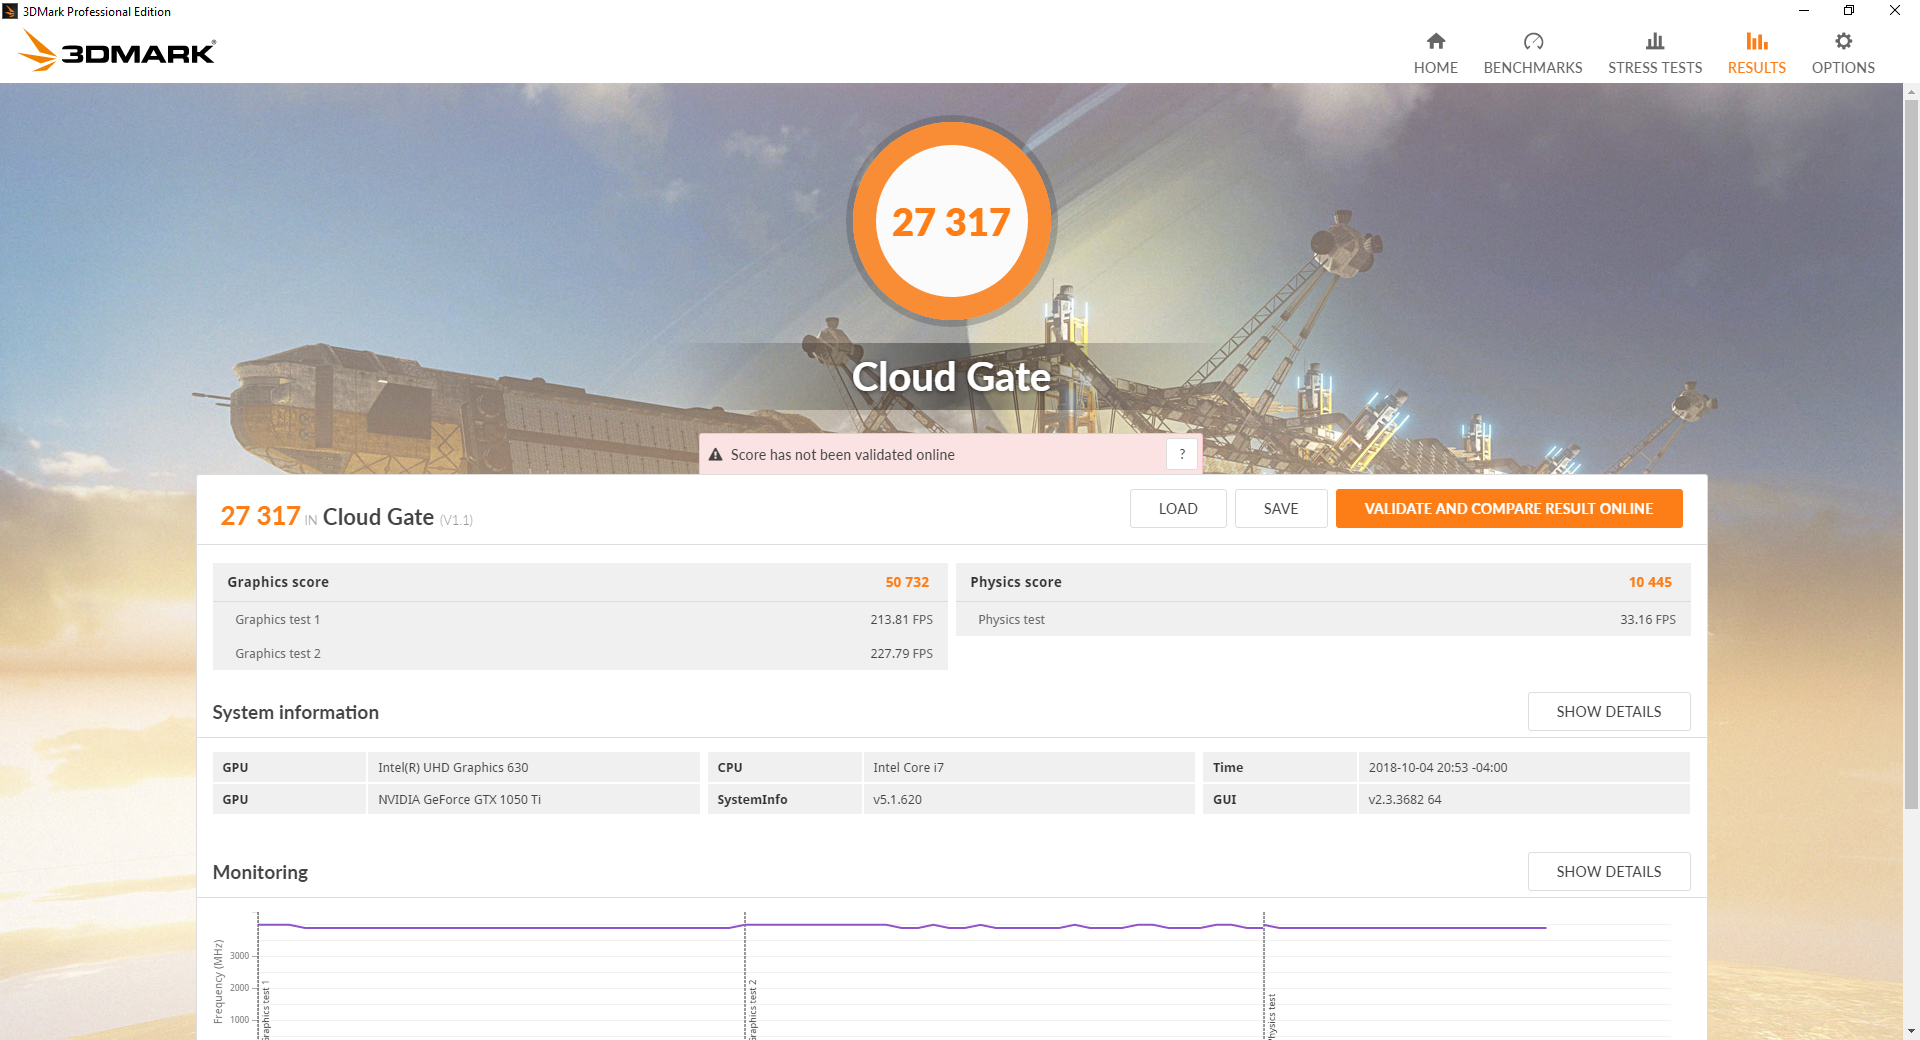
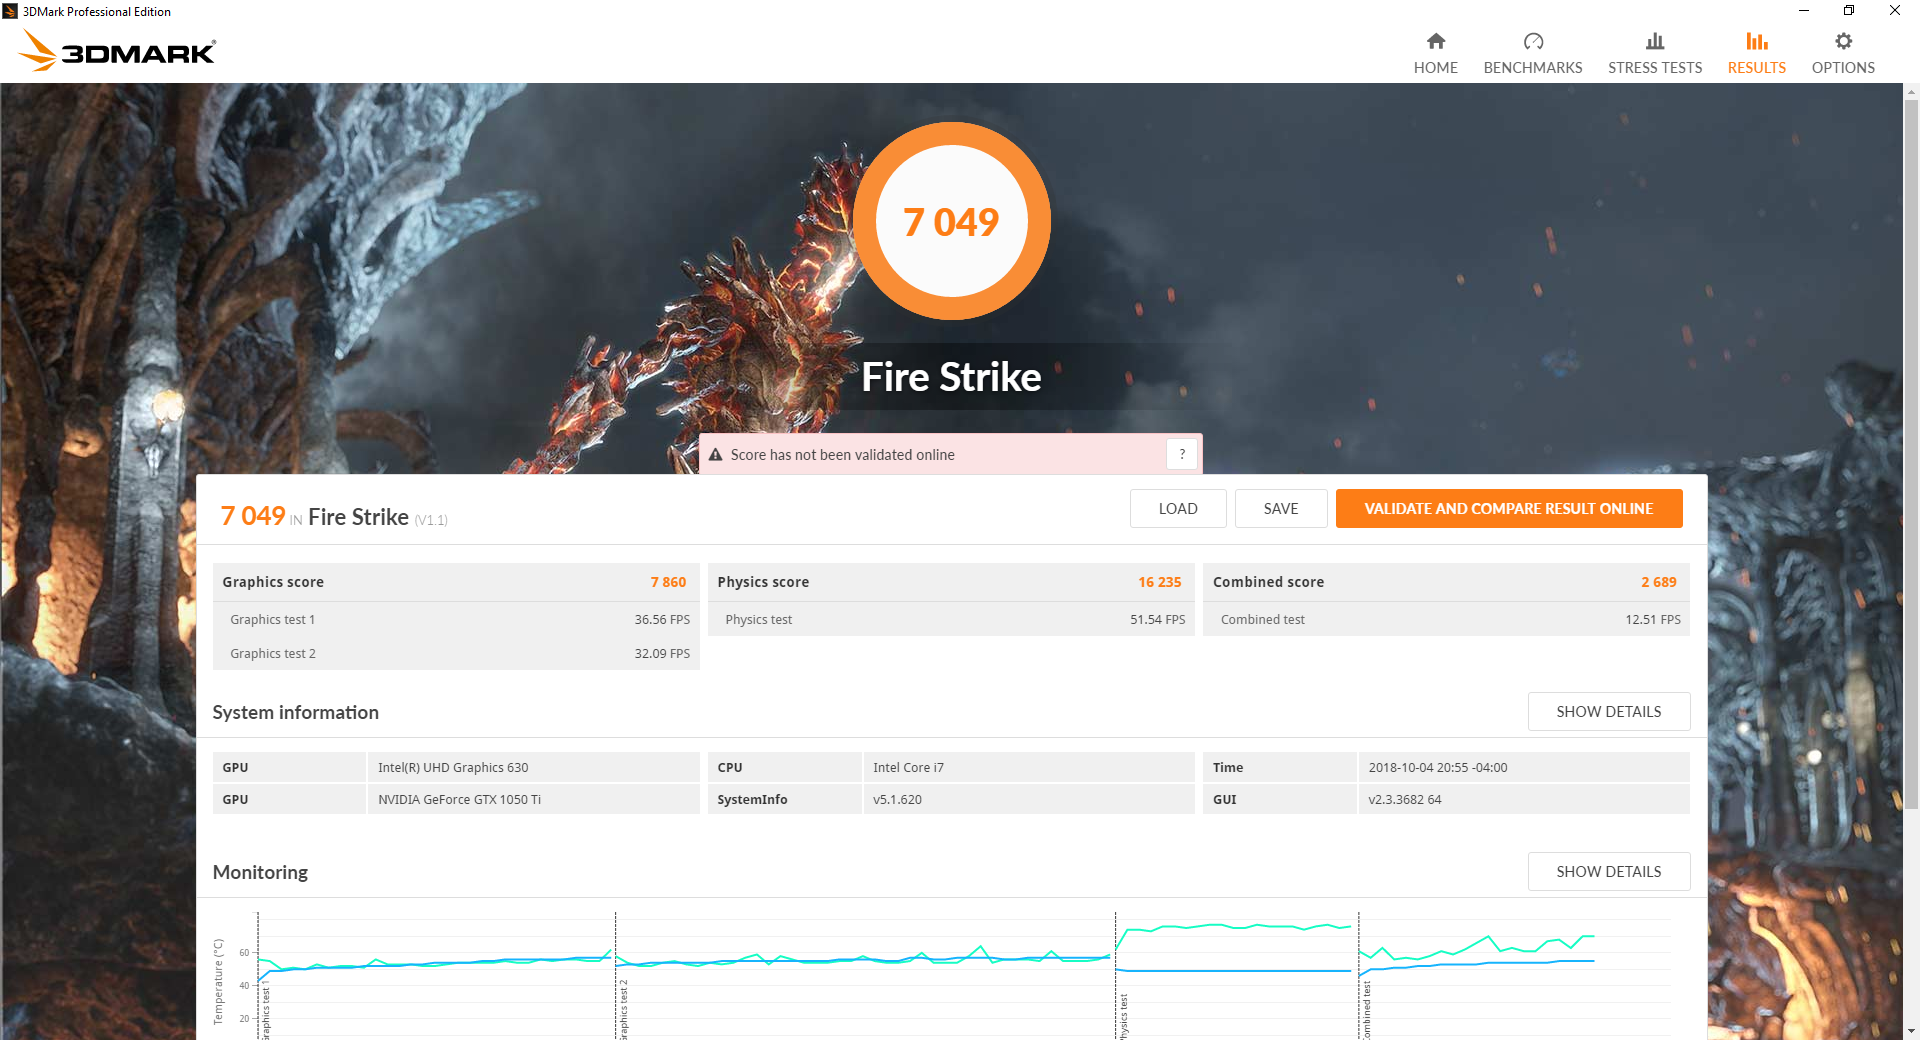
| 3DMark Cloud Gate Standard Score | 27317 points | |
| 3DMark Fire Strike Score | 7049 points | |
Help | ||
Gaming Performance
Real-world gaming performance is very similar to the last generation GTX 970M. Games play very well at 1080p with potential to reach 60 FPS at lower graphical settings. We recommend checking out our dedicated page on the GTX 1050 Ti for more technical information and benchmark comparisons.
| low | med. | high | ultra | |
|---|---|---|---|---|
| BioShock Infinite (2013) | 255.3 | 203.4 | 185.5 | 74.5 |
| The Witcher 3 (2015) | 144.5 | 87.3 | 51 | 26 |
| Rise of the Tomb Raider (2016) | 134.9 | 92.4 | 47.6 | 40.1 |
Stress Test
We stress the system with synthetic loads to identify for any potential throttling or stability issues. When subjected to Prime95, the CPU can be observed running stably at 3.9 GHz with only very slight dips. Since the i7-8750H is rated for a maximum multi-core Turbo Boost of 3.9 GHz, the Legion Y730 is impressively able to maintain its specification even when under extreme CPU stress. This observation explains how the Lenovo can outscore the average i7-8750H CPU in our database by 11 percent according to our CineBench R15 Multi-Thread test above. Core temperature plateaus at a respectable 76 C.
If running both Prime95 and FurMark simultaneously, core clock rate drops to 3.2 GHz with CPU and GPU temperatures stabilizing at 82 C and 71 C, respectively. In contrast, the CPU and GPU in the Dell G3 17 stabilizes at warmer temperatures of 86 C and 83 C, respectively.
Running Witcher 3 is more representative of real-world gaming conditions than the above. The CPU and GPU are much cooler with no performance dips over time as our chart below shows.
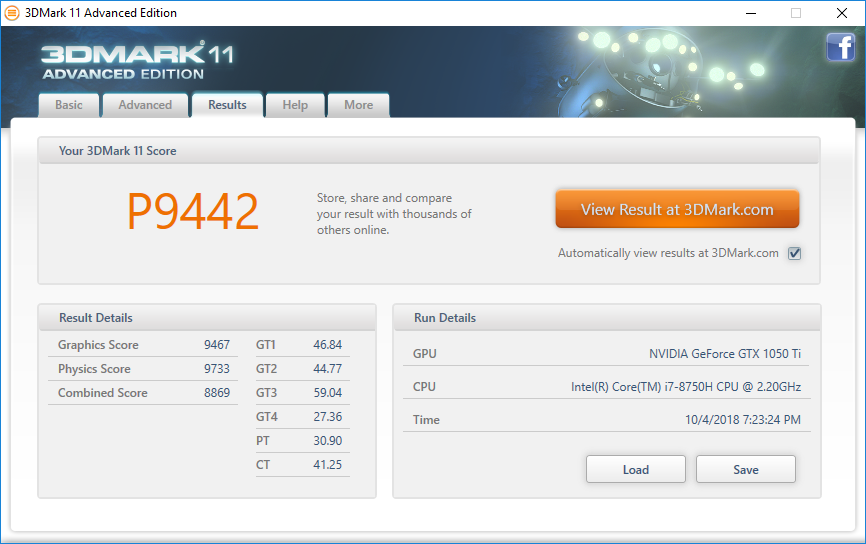
GPU performance is throttled when on battery power. A 3DMark 11 run on batteries returns Physics and Graphics scores of 8813 and 6589 points, respectively, compared to 9733 and 9467 points when on mains. Results do not change even when set to "Prefer maximum performance" in the Nvidia Control Panel menu.
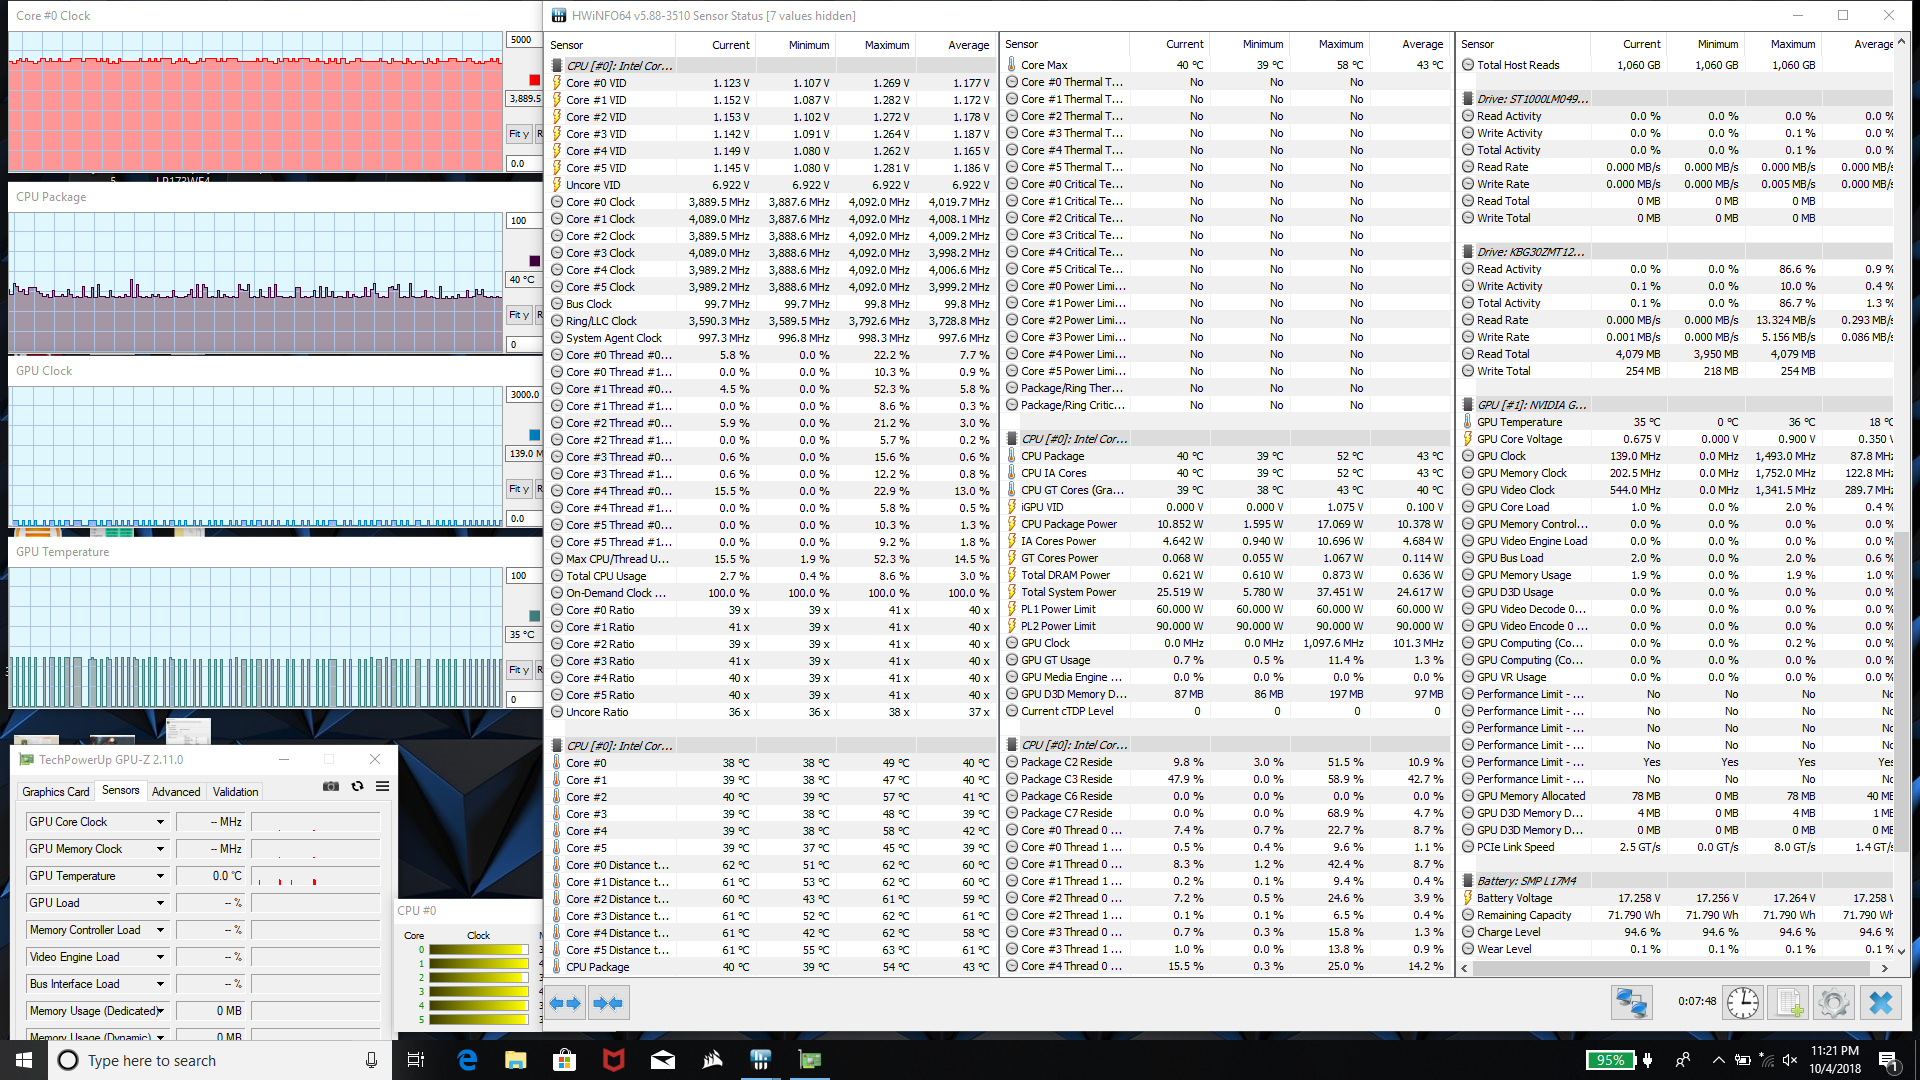
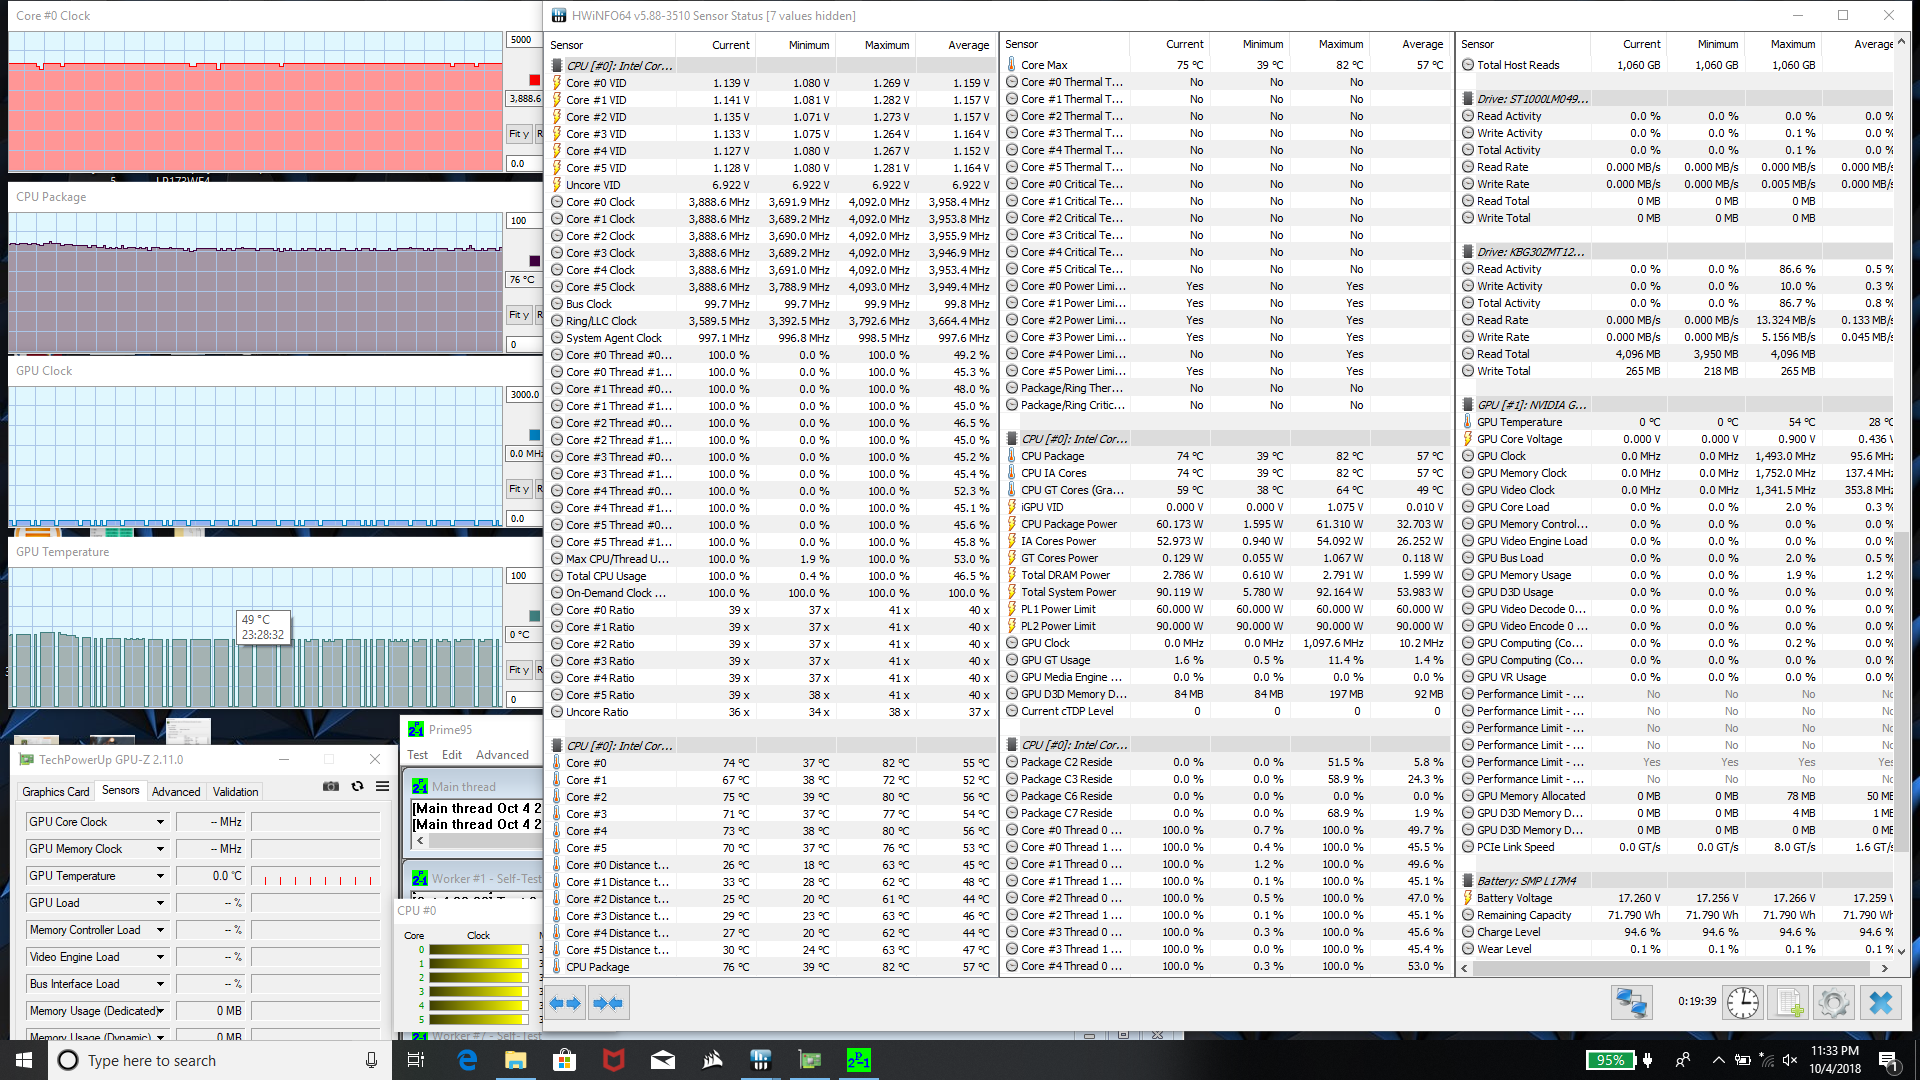
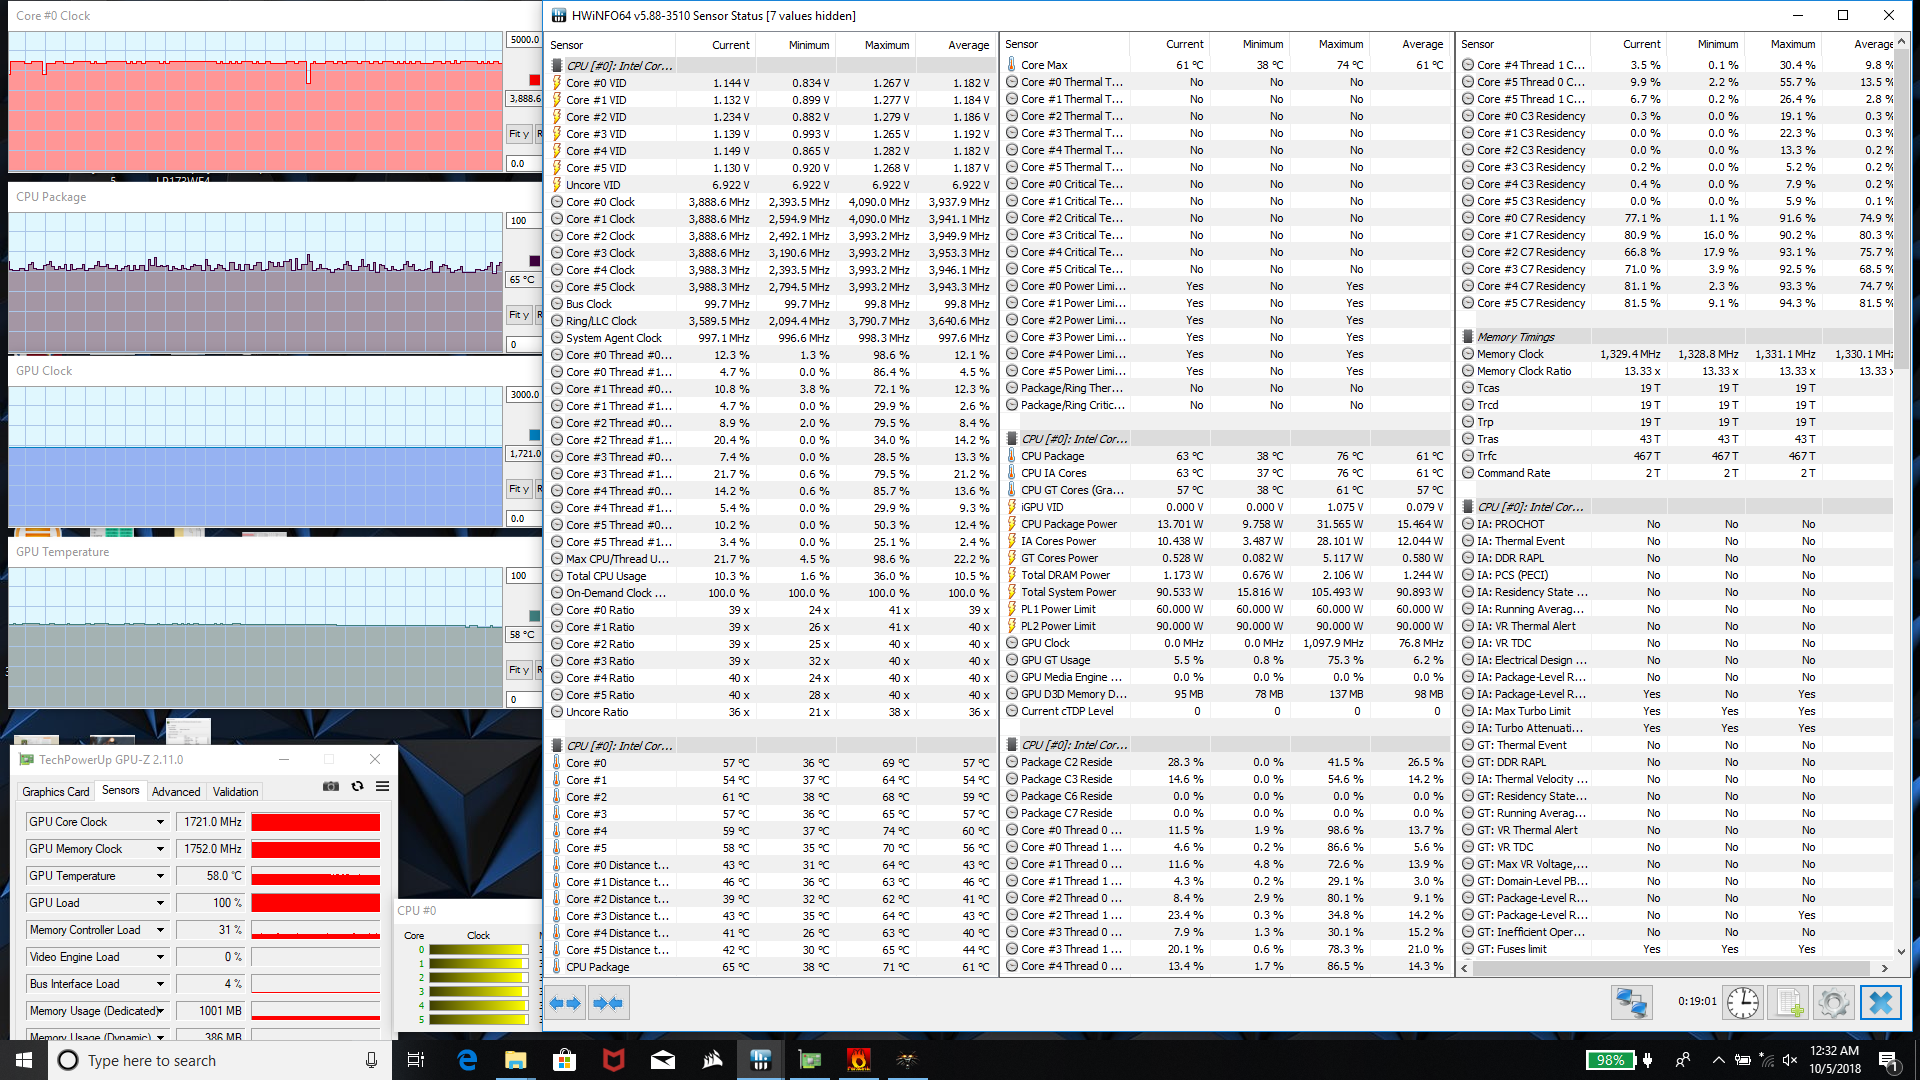
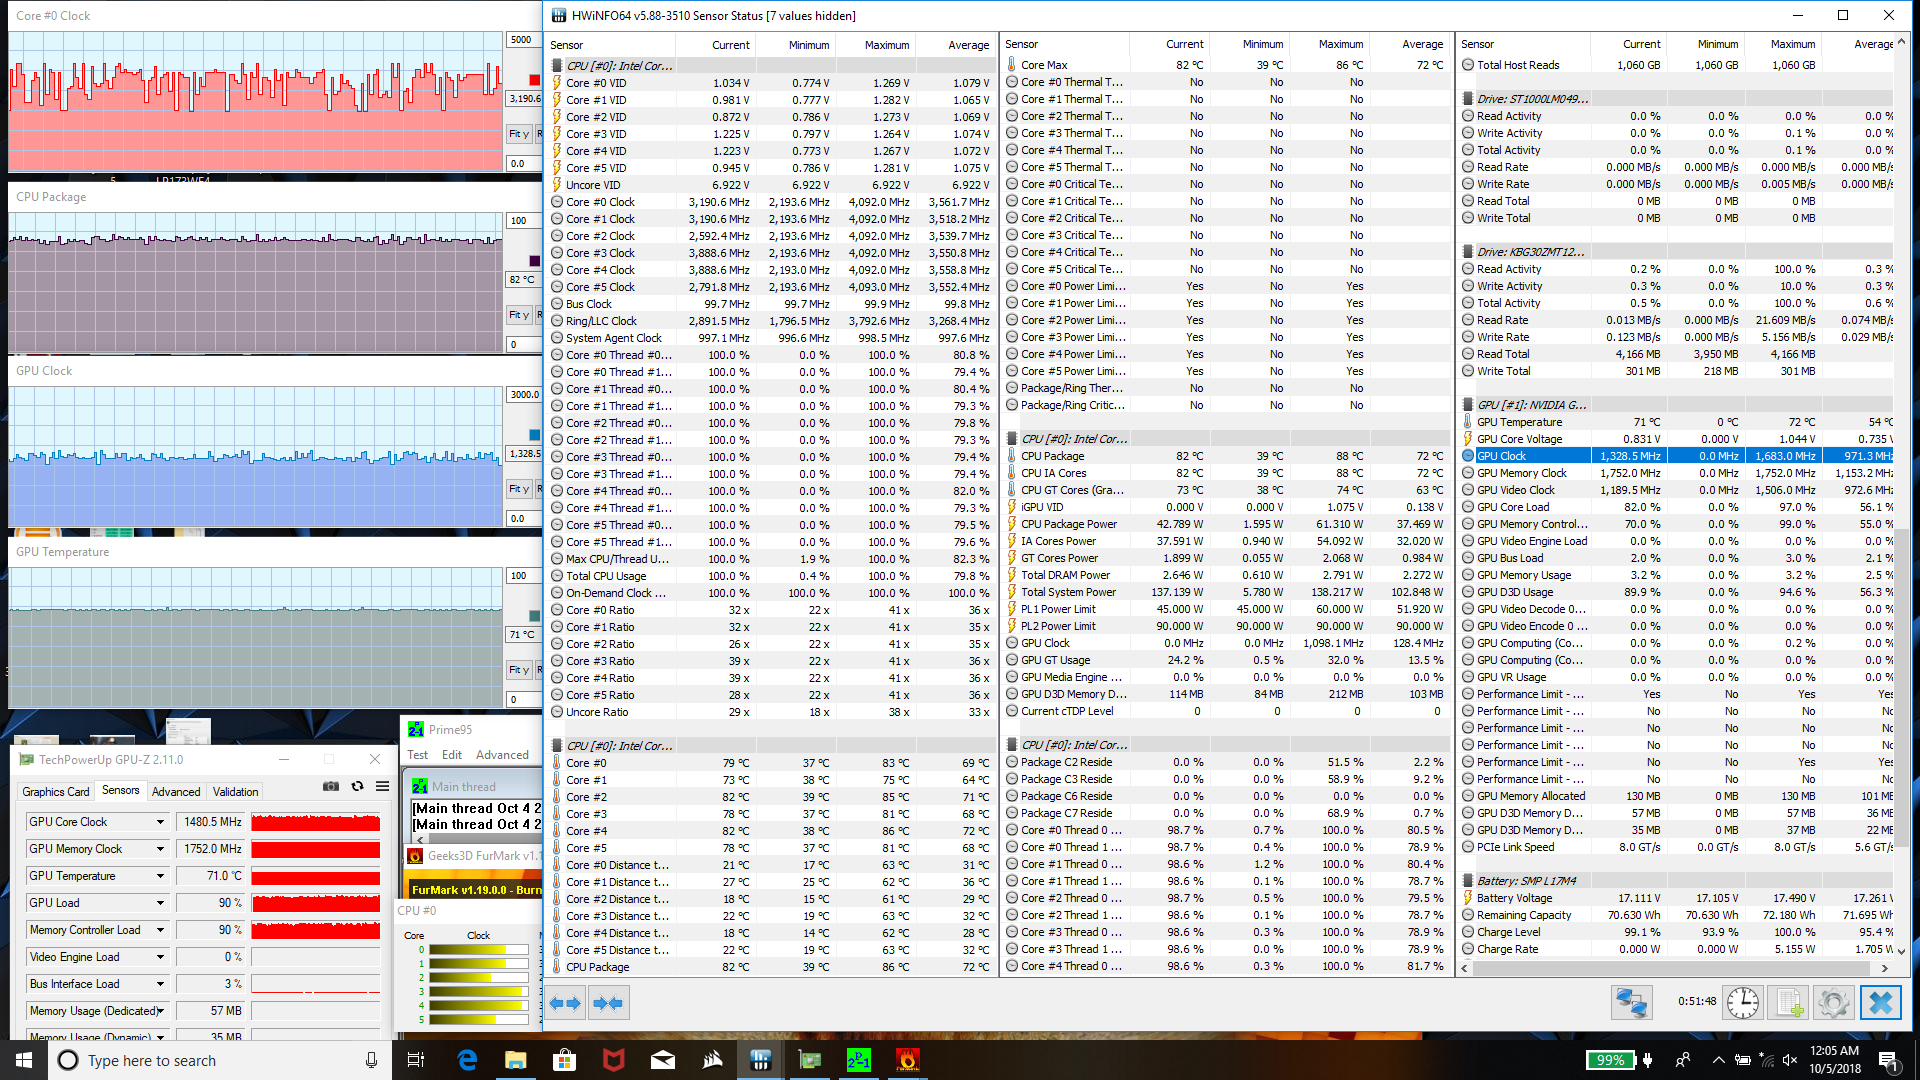
| CPU Clock (GHz) | GPU Clock (MHz) | Average CPU Temperature (°C) | Average GPU Temperature (°C) | |
| Prime95 Stress | 3.9 | -- | 76 | -- |
| Prime95 + FurMark Stress | ~3.2 | 1481 | 82 | 71 |
| Witcher 3 Stress | 3.9 | 1721 | 65 | 58 |
Emissions
System Noise
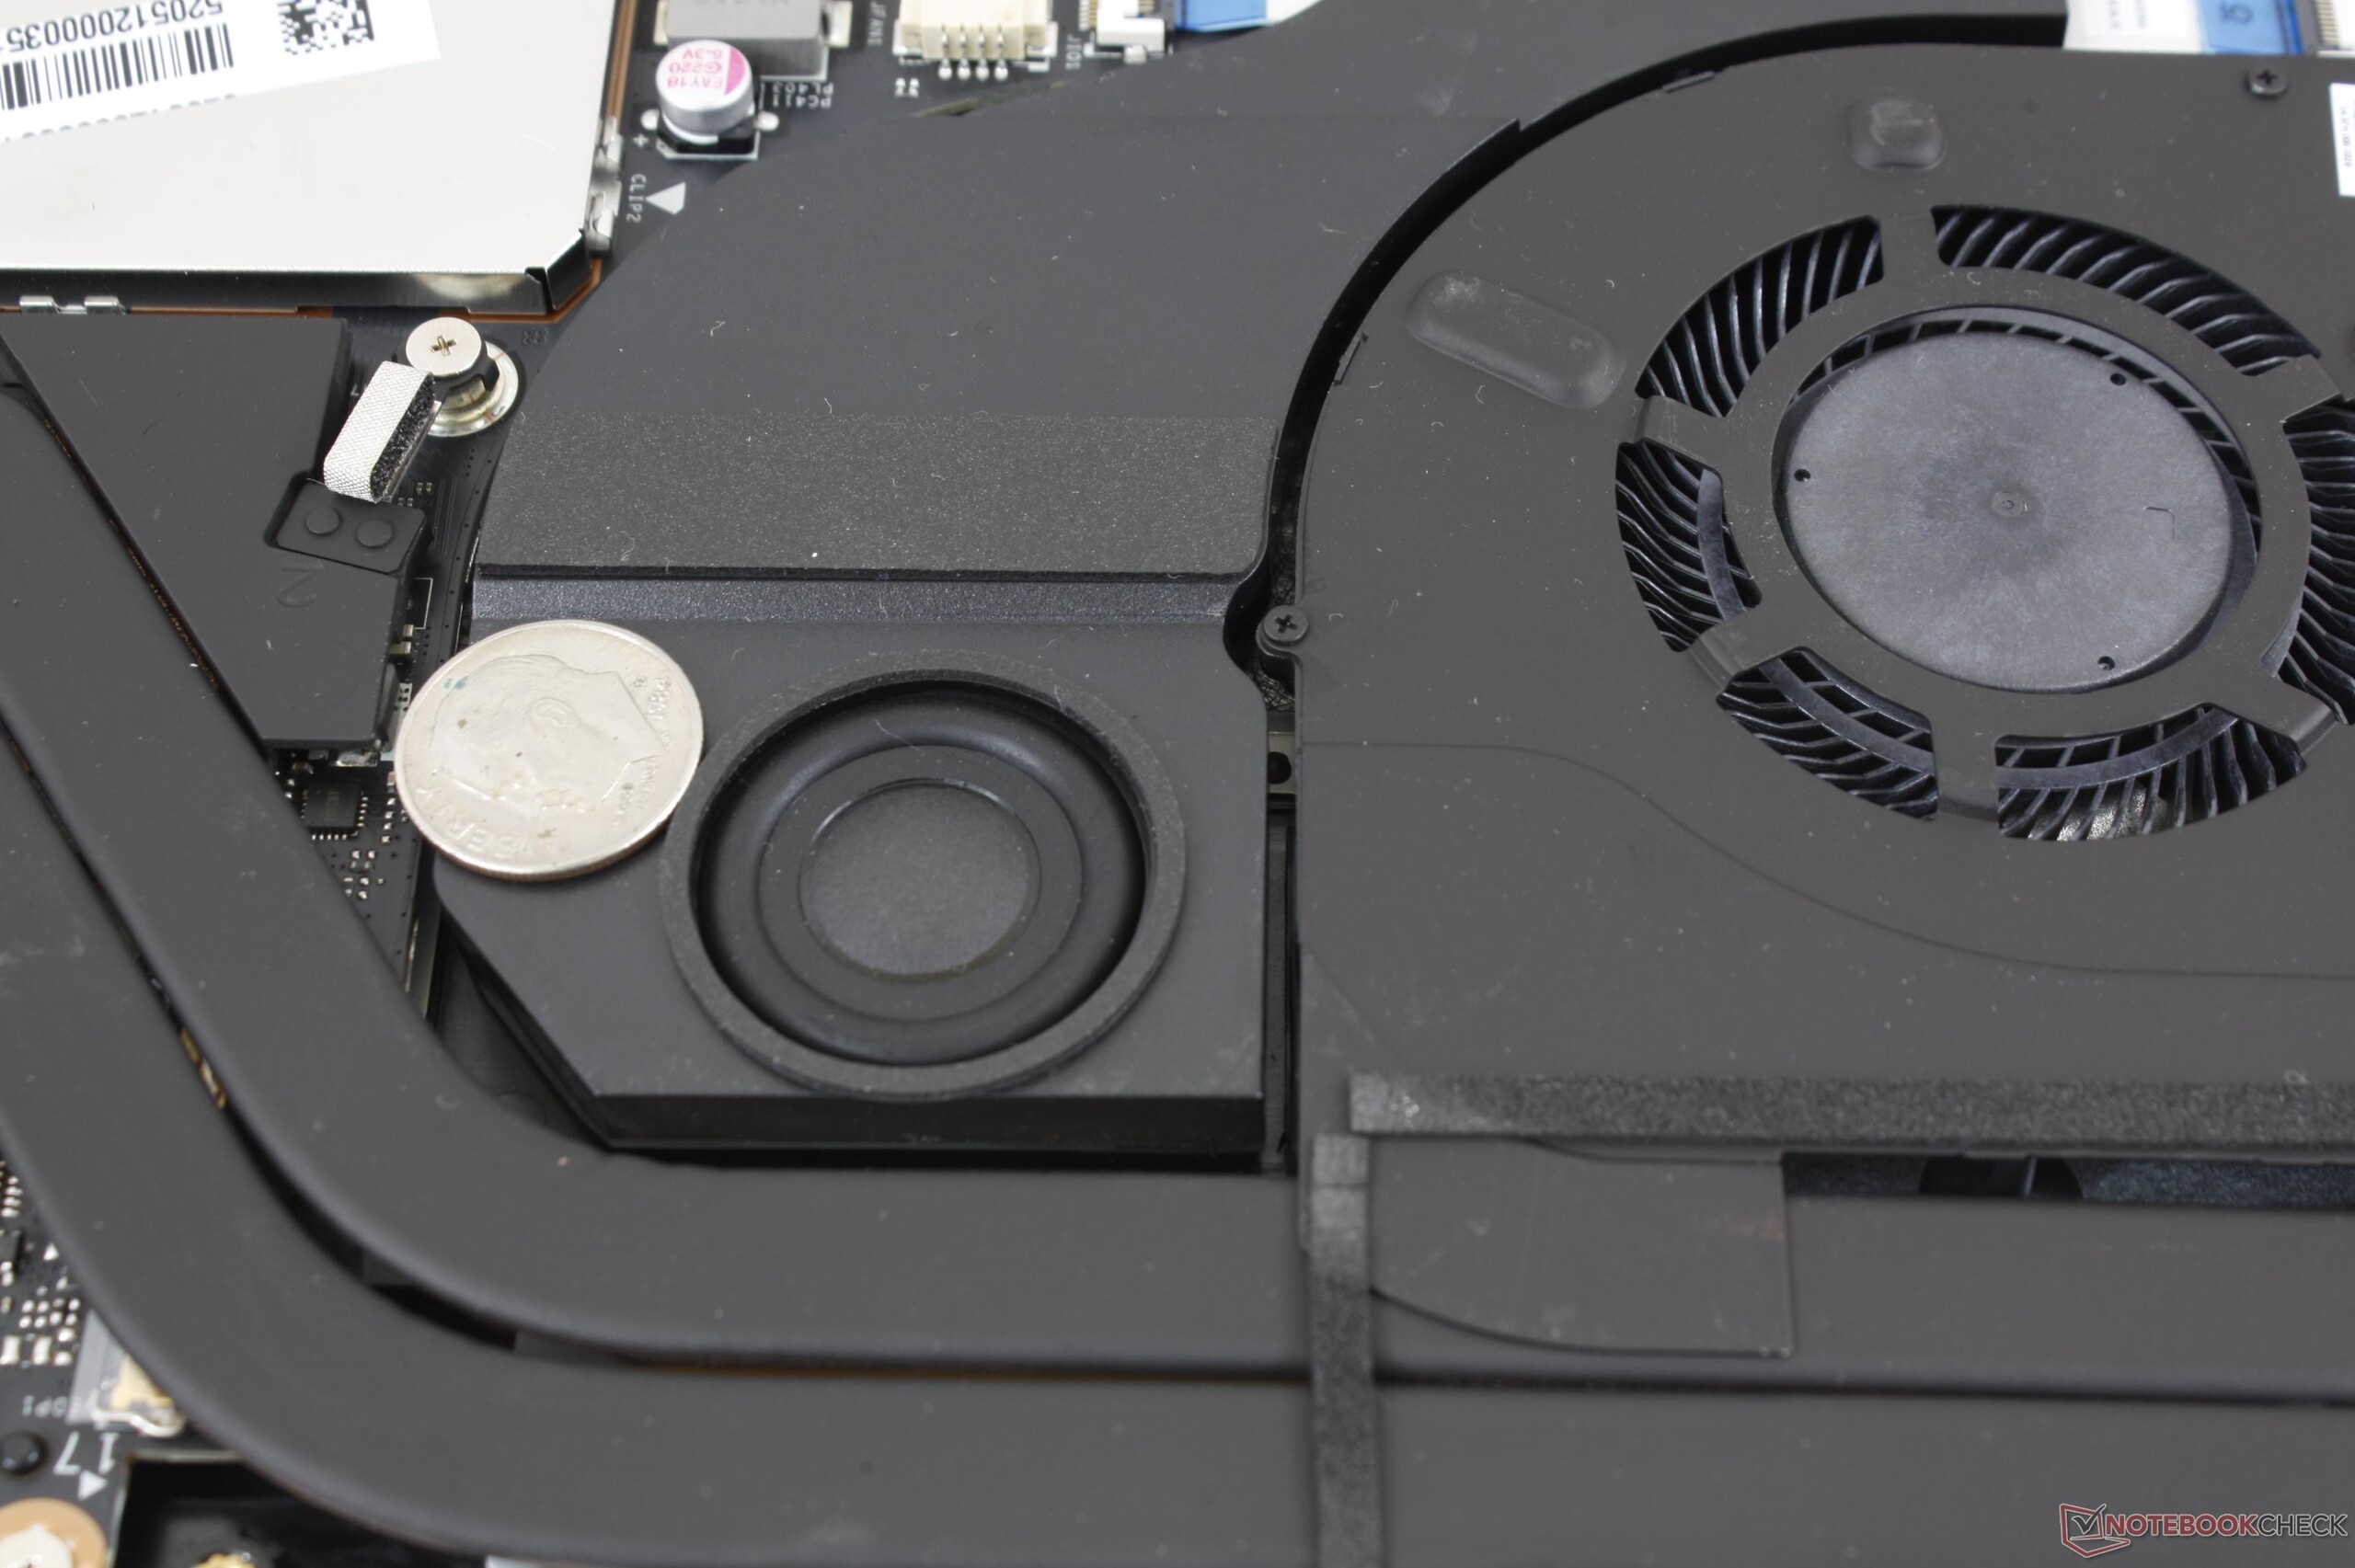
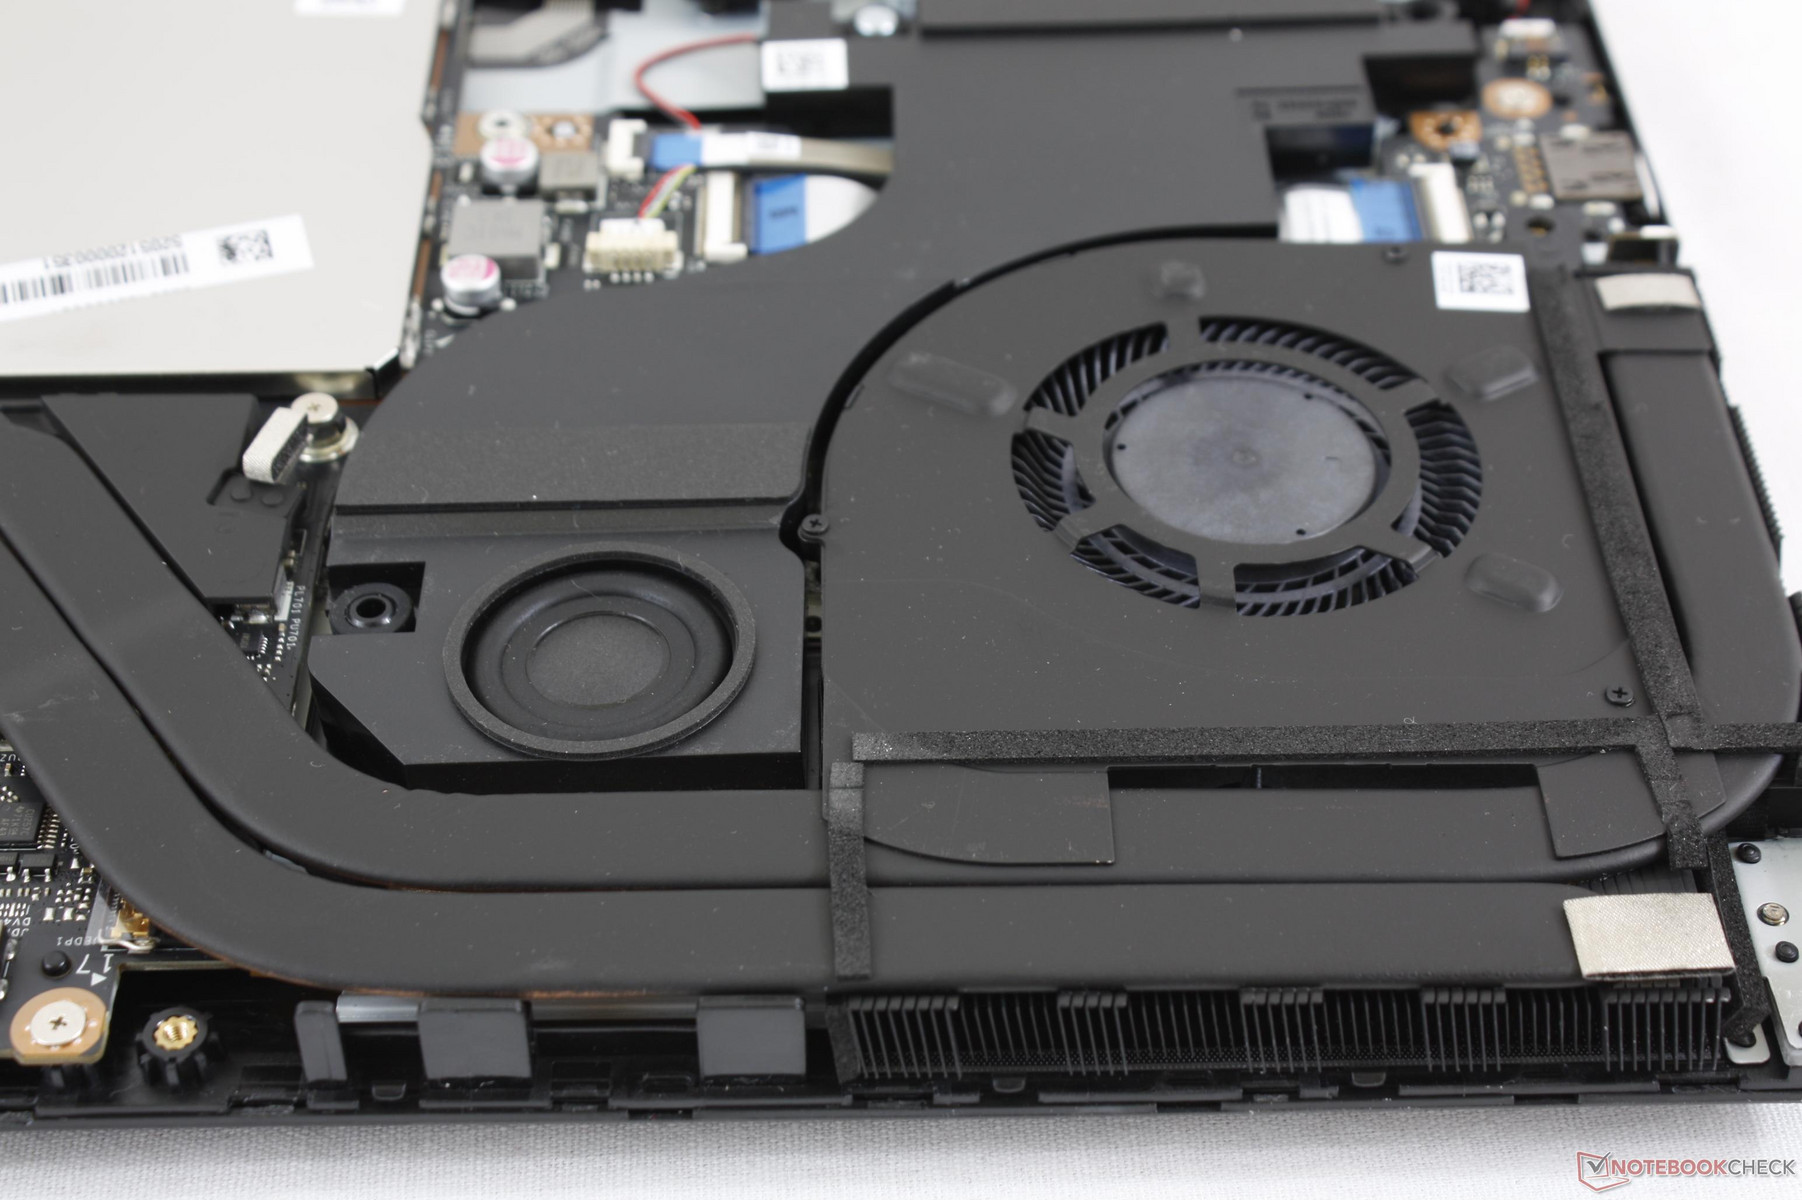
The cooling solution consists of twin fans and three heat pipes in a near symmetrical arrangement. Although the system doesn't carry as many heat pipes as say the thicker MSI GE73, each copper pipe is larger and longer since they extend and bend around the rear corners.
Both system fans will idle on desktop, but low loads like browsing or streaming will kick start them for a low fan noise of 31.2 dB(A). Running the first benchmark scene of 3DMark 06 will bump the fans to 33.4 dB(A) which is still significantly quieter than the Dell G3 17 and Asus GL703GM when subjected to similar loads. In other words, the Lenovo system is able to remain quieter for longer before its fans decide to punch it.
When running Witcher 3, fan noise sits just below 43 dB(A) with seldom short-lived spikes up to 46 dB(A). Overall fan noise is still quieter than the competition if just slightly.
We can notice no electronic noise or coil whine on our test unit.

Noise level
| Idle |
| 28 / 28 / 31.3 dB(A) |
| HDD |
| 31.2 dB(A) |
| Load |
| 33.4 / 46.2 dB(A) |
 | ||
30 dB silent 40 dB(A) audible 50 dB(A) loud |
||
min: | ||
| Lenovo Legion Y730-17ICH, i7-8750H GeForce GTX 1050 Ti Mobile, i7-8750H, Toshiba KBG30ZMT128G | Dell G3 17 3779 GeForce GTX 1050 Mobile, i5-8300H, SK hynix SC311 SATA | Asus Strix GL703GM-DS74 GeForce GTX 1060 Mobile, i7-8750H, Samsung PM961 MZVLW256HEHP | HP Omen 17t-3AW55AV_1 GeForce GTX 1070 Mobile, i7-8750H, Samsung SSD PM981 MZVLB512HAJQ | Dell XPS 15 9575 i7-8705G Vega M GL / 870, i7-8705G, SK hynix PC401 NVMe 500 GB | |
|---|---|---|---|---|---|
| Noise | -8% | -8% | -9% | 2% | |
| off / environment * (dB) | 28 | 30.5 -9% | 28.6 -2% | 27.8 1% | 28.2 -1% |
| Idle Minimum * (dB) | 28 | 30.5 -9% | 29.4 -5% | 31.1 -11% | 28.2 -1% |
| Idle Average * (dB) | 28 | 31.1 -11% | 29.4 -5% | 31.1 -11% | 28.2 -1% |
| Idle Maximum * (dB) | 31.3 | 32.1 -3% | 33.7 -8% | 35 -12% | 28.2 10% |
| Load Average * (dB) | 33.4 | 43.4 -30% | 41.2 -23% | 42 -26% | 29 13% |
| Witcher 3 ultra * (dB) | 42.8 | 47.3 -11% | 44.5 -4% | 44.7 -4% | |
| Load Maximum * (dB) | 46.2 | 39.2 15% | 48.3 -5% | 46.5 -1% | 47.4 -3% |
* ... smaller is better
Temperature
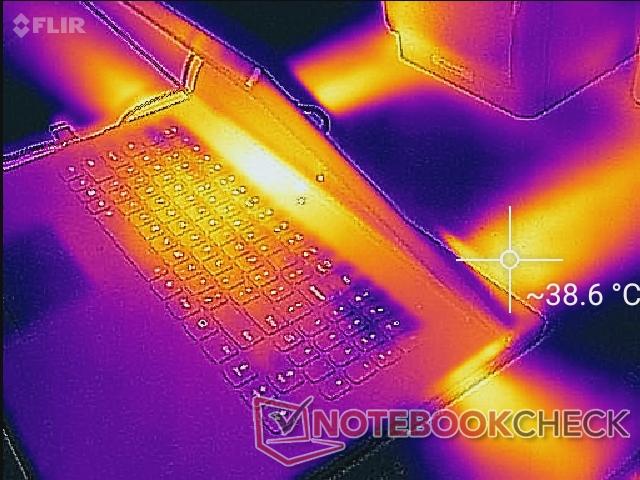
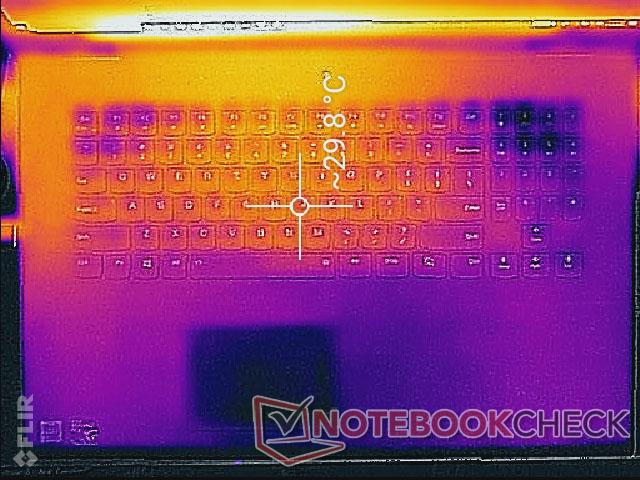
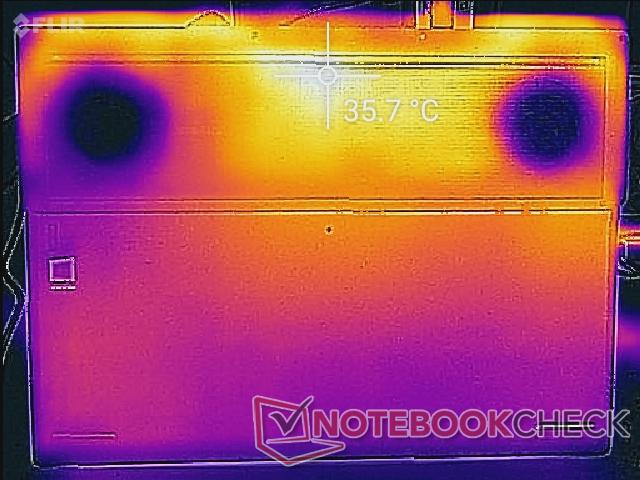
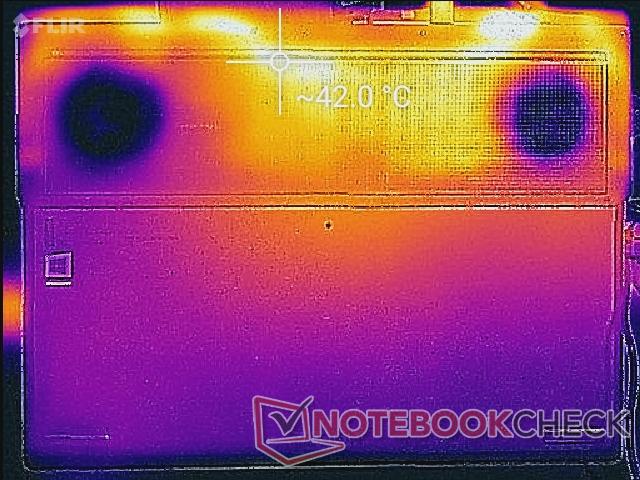
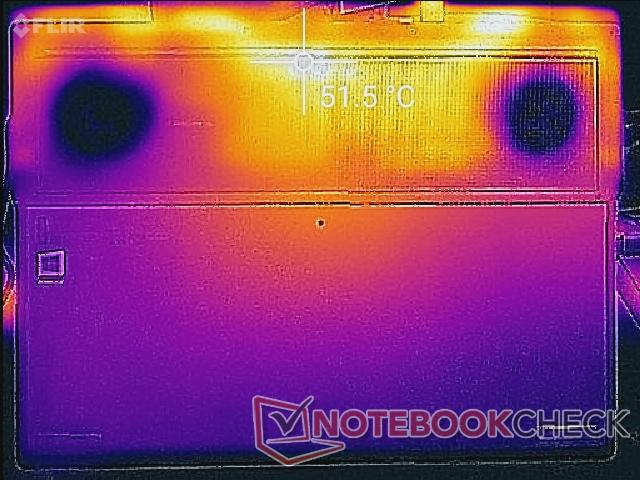
Surface temperatures hover in the low 30 C range with the bottom hot spot reaching up to 36 C when browsing or streaming. When under more demanding loads like gaming or higher, hot spots can be as warm as 40 C on top and 50 C on bottom not unlike the Dell G7 15. Fortunately, these areas are towards the rear of the unit away from the keyboard keys and palm rests as shown by our thermal maps below. The system never becomes uncomfortably warm to use as a result.
A noteworthy feature of the Legion Y730 is its four set of exhaust vents whereas most other gaming laptops have only two sets. Having this many ventilation grilles is usually reserved for thinner laptops with faster GPUs than the GTX 1050 Ti, so we're surprised to see it utilized here on our mainstream Lenovo. The processors are thus given more room to breathe for faster clock rates or lower temperatures.
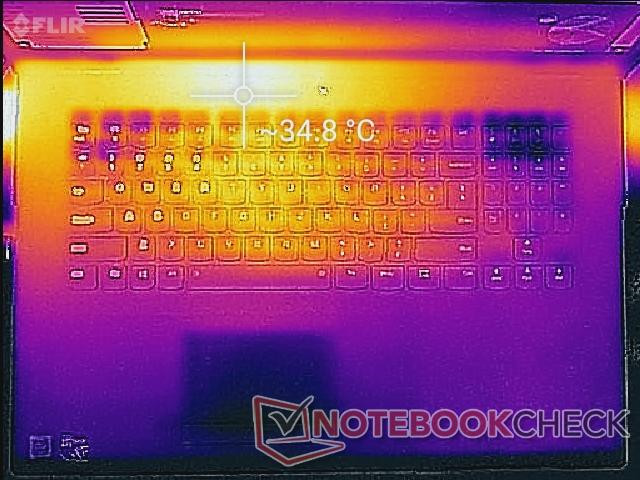
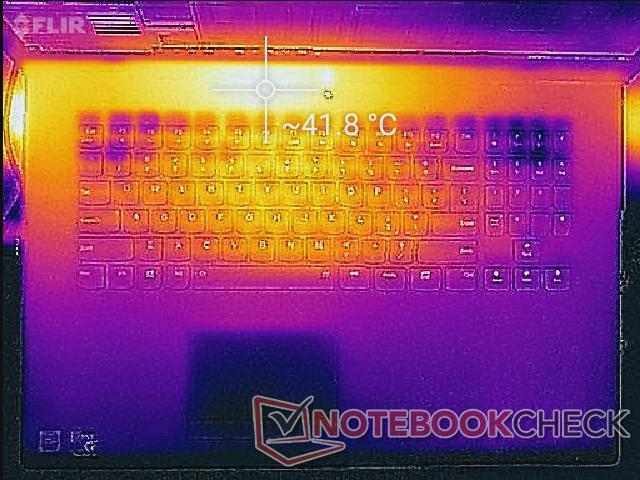
(±) The maximum temperature on the upper side is 42 °C / 108 F, compared to the average of 40.4 °C / 105 F, ranging from 21.2 to 68.8 °C for the class Gaming.
(-) The bottom heats up to a maximum of 51.2 °C / 124 F, compared to the average of 43.2 °C / 110 F
(+) In idle usage, the average temperature for the upper side is 29.2 °C / 85 F, compared to the device average of 33.9 °C / 93 F.
(+) Playing The Witcher 3, the average temperature for the upper side is 28.4 °C / 83 F, compared to the device average of 33.9 °C / 93 F.
(+) The palmrests and touchpad are cooler than skin temperature with a maximum of 28.4 °C / 83.1 F and are therefore cool to the touch.
(±) The average temperature of the palmrest area of similar devices was 28.8 °C / 83.8 F (+0.4 °C / 0.7 F).
Speakers
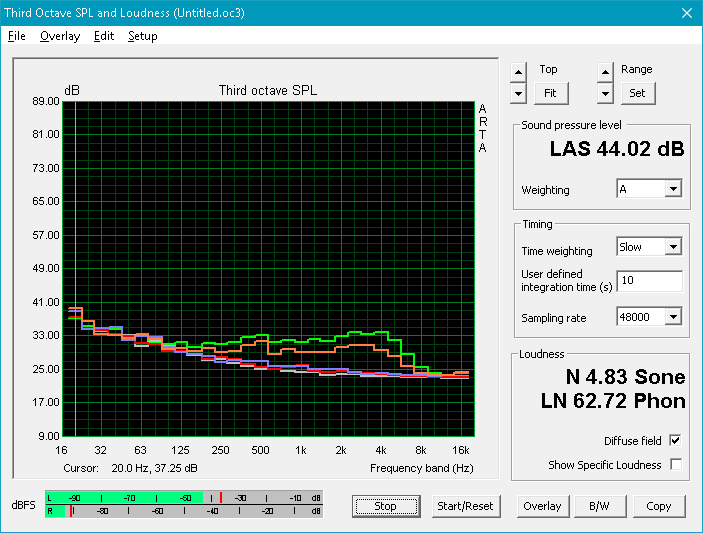
The internal stereo speakers include a dedicated subwoofer for a 2.1 setup. Sound quality is above average for a laptop with better-than-expected bass reproduction as confirmed by our pink noise measurements. The Dolby Atmos software is also easy to use if not a bit lacking in gaming-specific features. Maximum volume introduces no static, rattling, or major imbalances.
A drawback to the thin base and higher bass is reverberation. The palm rests and keyboard will reverberate more compared to other laptops when on higher volume settings. It's noticeable, but thankfully not distracting.


Lenovo Legion Y730-17ICH, i7-8750H audio analysis
(-) | not very loud speakers (69.1 dB)
Bass 100 - 315 Hz
(±) | reduced bass - on average 5.7% lower than median
(±) | linearity of bass is average (12.8% delta to prev. frequency)
Mids 400 - 2000 Hz
(+) | balanced mids - only 3.3% away from median
(+) | mids are linear (5.3% delta to prev. frequency)
Highs 2 - 16 kHz
(+) | balanced highs - only 1.2% away from median
(+) | highs are linear (4.5% delta to prev. frequency)
Overall 100 - 16.000 Hz
(+) | overall sound is linear (13.8% difference to median)
Compared to same class
» 21% of all tested devices in this class were better, 7% similar, 72% worse
» The best had a delta of 6%, average was 18%, worst was 132%
Compared to all devices tested
» 15% of all tested devices were better, 4% similar, 81% worse
» The best had a delta of 4%, average was 24%, worst was 134%
Apple MacBook 12 (Early 2016) 1.1 GHz audio analysis
(+) | speakers can play relatively loud (83.6 dB)
Bass 100 - 315 Hz
(±) | reduced bass - on average 11.3% lower than median
(±) | linearity of bass is average (14.2% delta to prev. frequency)
Mids 400 - 2000 Hz
(+) | balanced mids - only 2.4% away from median
(+) | mids are linear (5.5% delta to prev. frequency)
Highs 2 - 16 kHz
(+) | balanced highs - only 2% away from median
(+) | highs are linear (4.5% delta to prev. frequency)
Overall 100 - 16.000 Hz
(+) | overall sound is linear (10.2% difference to median)
Compared to same class
» 7% of all tested devices in this class were better, 2% similar, 91% worse
» The best had a delta of 5%, average was 18%, worst was 53%
Compared to all devices tested
» 5% of all tested devices were better, 1% similar, 94% worse
» The best had a delta of 4%, average was 24%, worst was 134%
Energy Management
Power Consumption
Idling on desktop demands about 6 W to 12 W depending on the power profile and brightness setting to be more efficient than competitors like the Dell G3 17 and Asus Strix GL703GM. Users making the jump from a GTX 960M gaming laptop to the Legion Y730 will see a significant boost in performance-per-Watt.
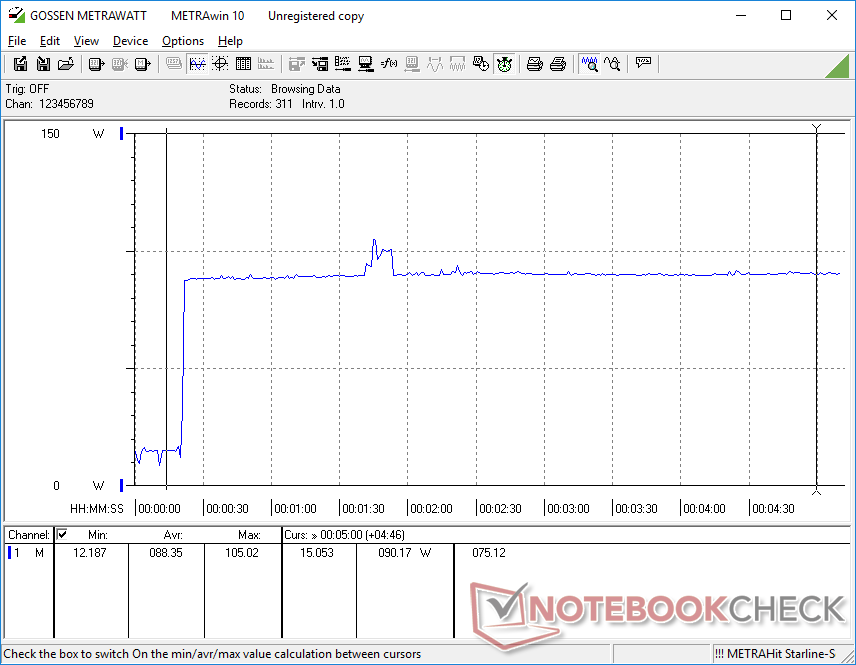
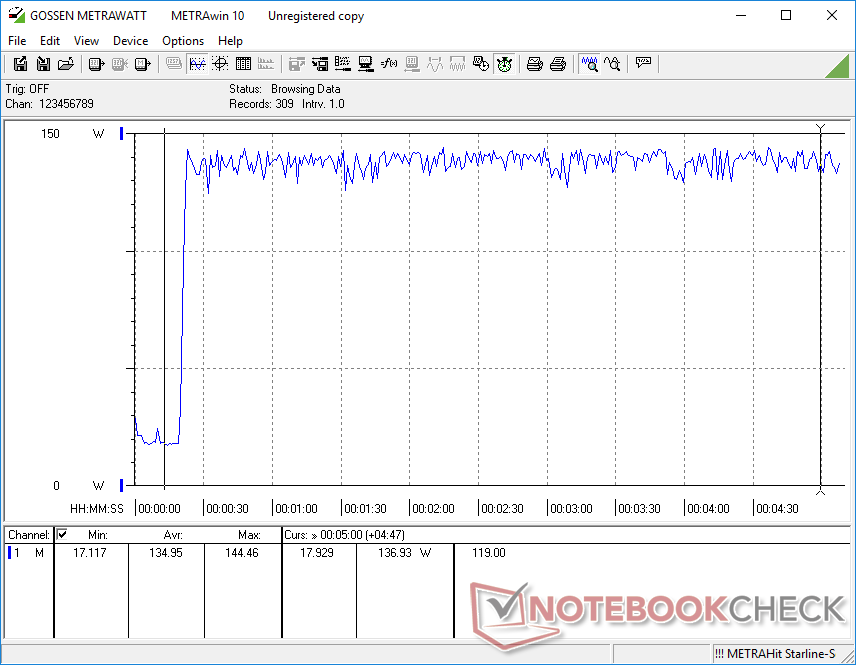
Power consumption remains stable when running Prime95 or FurMark whereas most notebooks have a sharp spike before gradually falling off. The results suggest that the Legion Y730 is better at maintaining Turbo Boost clock rates than competitors which corroborate with our CineBench loop test above.
We are able to measure a maximum draw of 145 W from the small (~14.5 x 6.5 x 3.0 cm) 135 W AC adapter. Lenovo should have shipped a more capable 150 W or 180 W AC adapter instead as it is common practice to have at least a 10 percent overhead.
| Off / Standby | |
| Idle | |
| Load |
|
Key:
min: | |
| Lenovo Legion Y730-17ICH, i7-8750H i7-8750H, GeForce GTX 1050 Ti Mobile, Toshiba KBG30ZMT128G, IPS, 1920x1080, 17.3" | HP Omen 17t-3AW55AV_1 i7-8750H, GeForce GTX 1070 Mobile, Samsung SSD PM981 MZVLB512HAJQ, IPS, 1920x1080, 17.3" | Dell G3 17 3779 i5-8300H, GeForce GTX 1050 Mobile, SK hynix SC311 SATA, IPS, 1920x1080, 17.3" | Asus Strix GL703GM-DS74 i7-8750H, GeForce GTX 1060 Mobile, Samsung PM961 MZVLW256HEHP, TN LED, 1920x1080, 17.3" | Dell XPS 15 9575 i7-8705G i7-8705G, Vega M GL / 870, SK hynix PC401 NVMe 500 GB, IPS, 3840x2160, 15.6" | Asus Strix GL502VT-DS74 6700HQ, GeForce GTX 970M, Lite-On CV1-8B128, IPS, 1920x1080, 15.6" | |
|---|---|---|---|---|---|---|
| Power Consumption | -98% | -14% | -97% | 4% | -39% | |
| Idle Minimum * (Watt) | 6.3 | 17.8 -183% | 7.7 -22% | 18.88 -200% | 6.2 2% | 11.1 -76% |
| Idle Average * (Watt) | 11 | 24.7 -125% | 14 -27% | 24.36 -121% | 12.9 -17% | 14.1 -28% |
| Idle Maximum * (Watt) | 11.5 | 29.6 -157% | 15.5 -35% | 32.27 -181% | 13.6 -18% | 18.4 -60% |
| Load Average * (Watt) | 89.8 | 110 -22% | 95 -6% | 107.74 -20% | 76.1 15% | 96.5 -7% |
| Witcher 3 ultra * (Watt) | 102 | 167.8 -65% | 142 -39% | 84.3 17% | ||
| Load Maximum * (Watt) | 130.7 | 178.6 -37% | 106 19% | 160.28 -23% | 99.4 24% | 159.5 -22% |
* ... smaller is better
Battery Life
When compared to the much older Ideapad Y700 that predates the Legion series, the Y730 is equipped with a larger 76 Wh internal battery. Runtimes are subsequently longer for just over 6.5 hours of constant WLAN use which is above average for a 17-inch gaming laptop.
Charging from near zero to full capacity takes about 1.5 hours.
| Lenovo Legion Y730-17ICH, i7-8750H i7-8750H, GeForce GTX 1050 Ti Mobile, 76 Wh | Alienware 17 R5 i7-8750H, GeForce GTX 1070 Mobile, 99 Wh | Dell G3 17 3779 i5-8300H, GeForce GTX 1050 Mobile, 56 Wh | Asus Strix GL703GM-DS74 i7-8750H, GeForce GTX 1060 Mobile, 74 Wh | Aorus X7 DT v8 i7-8850H, GeForce GTX 1080 Mobile, 94.24 Wh | Lenovo Ideapad Y700 17ISK 80Q0 6700HQ, GeForce GTX 960M, 60 Wh | |
|---|---|---|---|---|---|---|
| Battery runtime | -30% | 37% | -24% | -21% | 13% | |
| Reader / Idle (h) | 13.2 | 4.5 -66% | 12.2 -8% | 5.3 -60% | 4.9 -63% | 11.5 -13% |
| WiFi v1.3 (h) | 6.7 | 3.6 -46% | 5.8 -13% | 3.6 -46% | 3.8 -43% | 5.6 -16% |
| Load (h) | 0.9 | 1.1 22% | 2.1 133% | 1.2 33% | 1.3 44% | 1.5 67% |
Pros
Cons
Verdict
Both the Legion Y730 and Y530 represent the biggest changes to the family yet. The more casual business facade contrasts the mainstream gaming hardware and LED lights underneath for a very different approach than what the Asus ROG, Acer Predator, and MSI G series have to offer. At the same time, the Y730 still manages to throw in some luxuries like Thunderbolt 3, improved cooling, and per-key RGB lights that are normally reserved for "hardcore" gaming laptops. It's an atypical combination that surprisingly works for the Y730.
Aside from the visuals, performance is also top notch. Its CPU is able to maintain higher Turbo Boost clock rates for longer periods than the average Core i7-8750H and at respectable core temperatures. In fact, with core temperatures hovering at just 65 C or cooler when gaming, Lenovo could have dialed back the fans for an even quieter experience. The speakers are excellent, runtimes are long, and the standard 60 Hz IPS display is a perfect fit given the GPU.
There is still a lot of room for improvement. More customized fan controls, better port positioning, narrower bezels, and firmer key feedback would make the system an even better buy at its $1100 starting price. Stronger hinges are definitely near the top of our list as are additional GPU options like the GTX 1060 or 1060 Max-Q. The potential is certainly there to distinguish the Legion series even further from your traditional gaming laptop.
The Legion Y730 balances a casual business look with high-end gaming features surprisingly well for a lower starting price than most. If on a tight budget, the lower-end Core i5-8300H SKU is recommended as the i7-8750H will not significantly boost gaming performance when paired with a GTX 1050 Ti.
Lenovo Legion Y730-17ICH, i7-8750H
- 09/20/2019 v7 (old)
Allen Ngo
Price comparison
