Lenovo Legion Y520-15IKBA (i5-7300HQ, RX 560) Laptop Review
In this review, we will be examining the Legion Y520-15IKBA, which is currently available for around €700 (~$817).
This gets you an Intel Core i5-7300HQ processor, an AMD Radeon RX 560 GPU, 8 GB of RAM and a 1 TB HDD. Without a doubt, this configuration will be sufficient for most games. However, we expect that the HDD will cause longer load times and lower system performance than if Lenovo had equipped the device with an SSD.
We have already covered some of Lenovo’s gaming laptops, including the Lenovo Legion Y720, which excelled in our tests. The mid-range gaming notebook combined decent performance with a well-designed case and 4K capabilities. The Lenovo Y520 series is for those who are not as concerned by gaming at the cutting edge. The Y520 has more moderate styling and is far more competitively priced.
Likewise, we have already tested the Lenovo Legion Y520-15IKBN, a notebook that performed strongly in our tests thanks to its Intel Core i7-7700HQ processor and NVIDIA GeForce GTX 1050 Ti GPU. The Y520-15IKBN showed that a sub €1000 (~$1167) device can compete with other gaming laptops.
Case
We shall not be examining the Y520-15IKBA’s case as it looks identical to its Y520 sibling. Check out our Lenovo Legion Y520-15IKBN review for a detailed look of the case design.
The weight and footprint is the same as the Y520-15IKBN too. The Y520-15IKBA is lighter and compacter than many other gaming notebooks.
Connectivity
The connectivity is also unchanged. The Y520-IKBA has a large selection of ports, a highlight of which is the USB 3.1 Type-C Gen 1 port. This gives the Y520-15IKBA an element of future proofing as more accessories and devices are released with USB Type-C. The other ports are sufficient for everyday gaming or, for example, at a LAN party.


SD Card Reader
We benchmark the SD card readers in all our devices with a Toshiba Exceria Pro SDXC 64 GB UHS-II. The Y520-15IKBA has a mediocre SD card reader that is around 30% slower than the class average for gaming notebooks. However, the level of SD card performance is acceptable at this price point as the Y520-15IKBA performed just as well as comparable devices like the Schenker XMG Apex 15. The biggest drawback of the Y520-15IKBA’s SD card reader is its size, namely its depth. Frustratingly, SD cards protrude by around 1.5 cm (~0.6 in) from the edge of the case.
| SD Card Reader | |
| average JPG Copy Test (av. of 3 runs) | |
| Average of class Gaming (20.9 - 210, n=54, last 2 years) | |
| Schenker XMG Apex 15 (Toshiba Exceria Pro SDXC 64 GB UHS-II) | |
| Lenovo Legion Y520-15IKBN-80WK001KUS (Toshiba Exceria Pro SDXC 64 GB UHS-II) | |
| Lenovo Legion Y520-15IKBA-80WY001VGE (Toshiba Exceria Pro SDXC 64 GB UHS-II) | |
| Asus ROG Strix GL702ZC-GC204T (Toshiba Exceria Pro SDXC 64 GB UHS-II) | |
| Dell Inspiron 15 7000 7577 4K (Toshiba Exceria Pro SDXC 64 GB UHS-II) | |
| maximum AS SSD Seq Read Test (1GB) | |
| Average of class Gaming (25.5 - 261, n=51, last 2 years) | |
| Asus ROG Strix GL702ZC-GC204T (Toshiba Exceria Pro SDXC 64 GB UHS-II) | |
| Lenovo Legion Y520-15IKBN-80WK001KUS (Toshiba Exceria Pro SDXC 64 GB UHS-II) | |
| Schenker XMG Apex 15 (Toshiba Exceria Pro SDXC 64 GB UHS-II) | |
| Lenovo Legion Y520-15IKBA-80WY001VGE (Toshiba Exceria Pro SDXC 64 GB UHS-II) | |
| Dell Inspiron 15 7000 7577 4K (Toshiba Exceria Pro SDXC 64 GB UHS-II) | |
Communication
The Y520-15IKBA is equipped with a relatively slow Wi-Fi module. While the Legion Y720 achieves a transfer rate of up to 660 Mbps, the Y520-15IKBA only manages a measly 300 Mbps, which is more than 50% slower. Likewise, the Y520-15IKBA trails its Y520 sibling by around 50 Mbps. Despite these lackluster results, the Wi-Fi connection is still fast in everyday use, with the Y520-15IKBA able to use 802.11 ac Wi-Fi on 5 GHz networks.
Accessories
Lenovo includes a 135-W power supply in the box, but does not offer any accessories specific to the Y520-15IKBA.
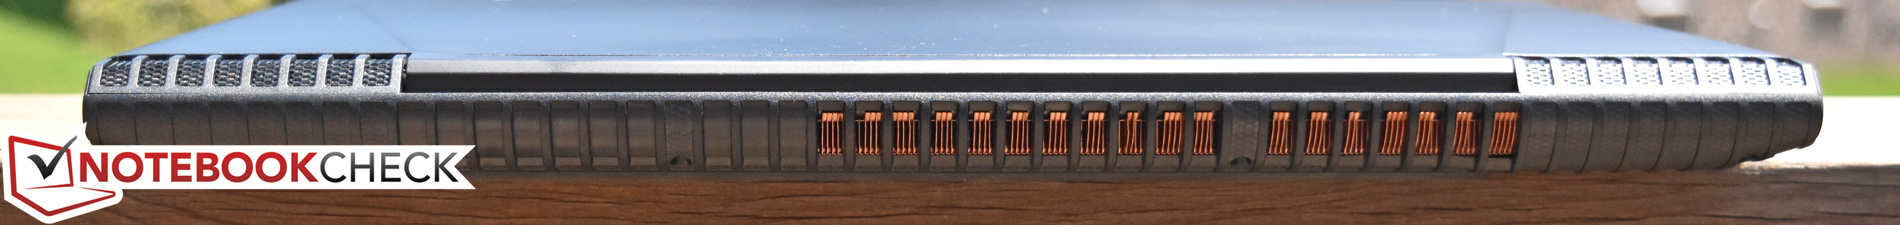
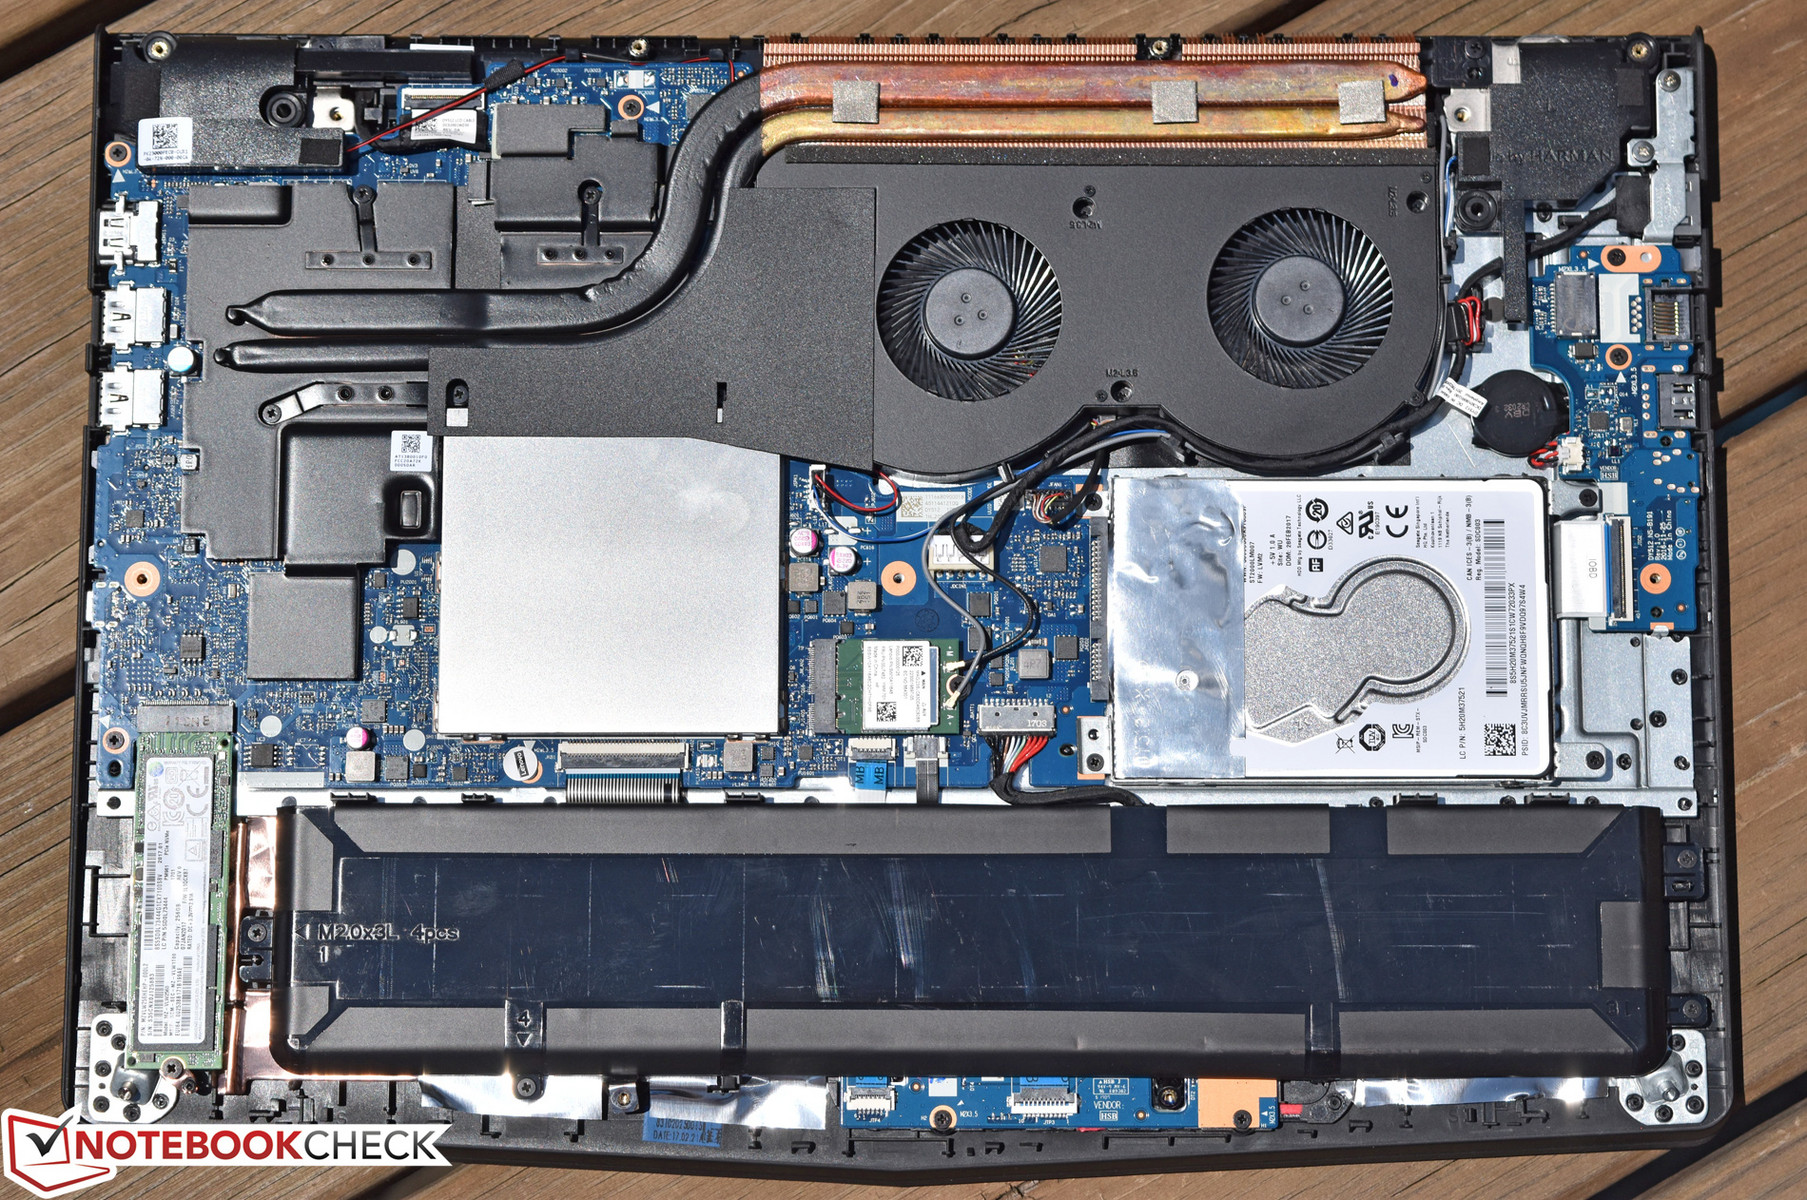
Maintenance
All internal components are accessible by removing the bottom plate. This requires loosening numerous screws.
Warranty
The Y520-15IKBA comes with a twelvemonth Lenovo warranty. Please see our Guarantees, Return policies and Warranties FAQ for country-specific information.
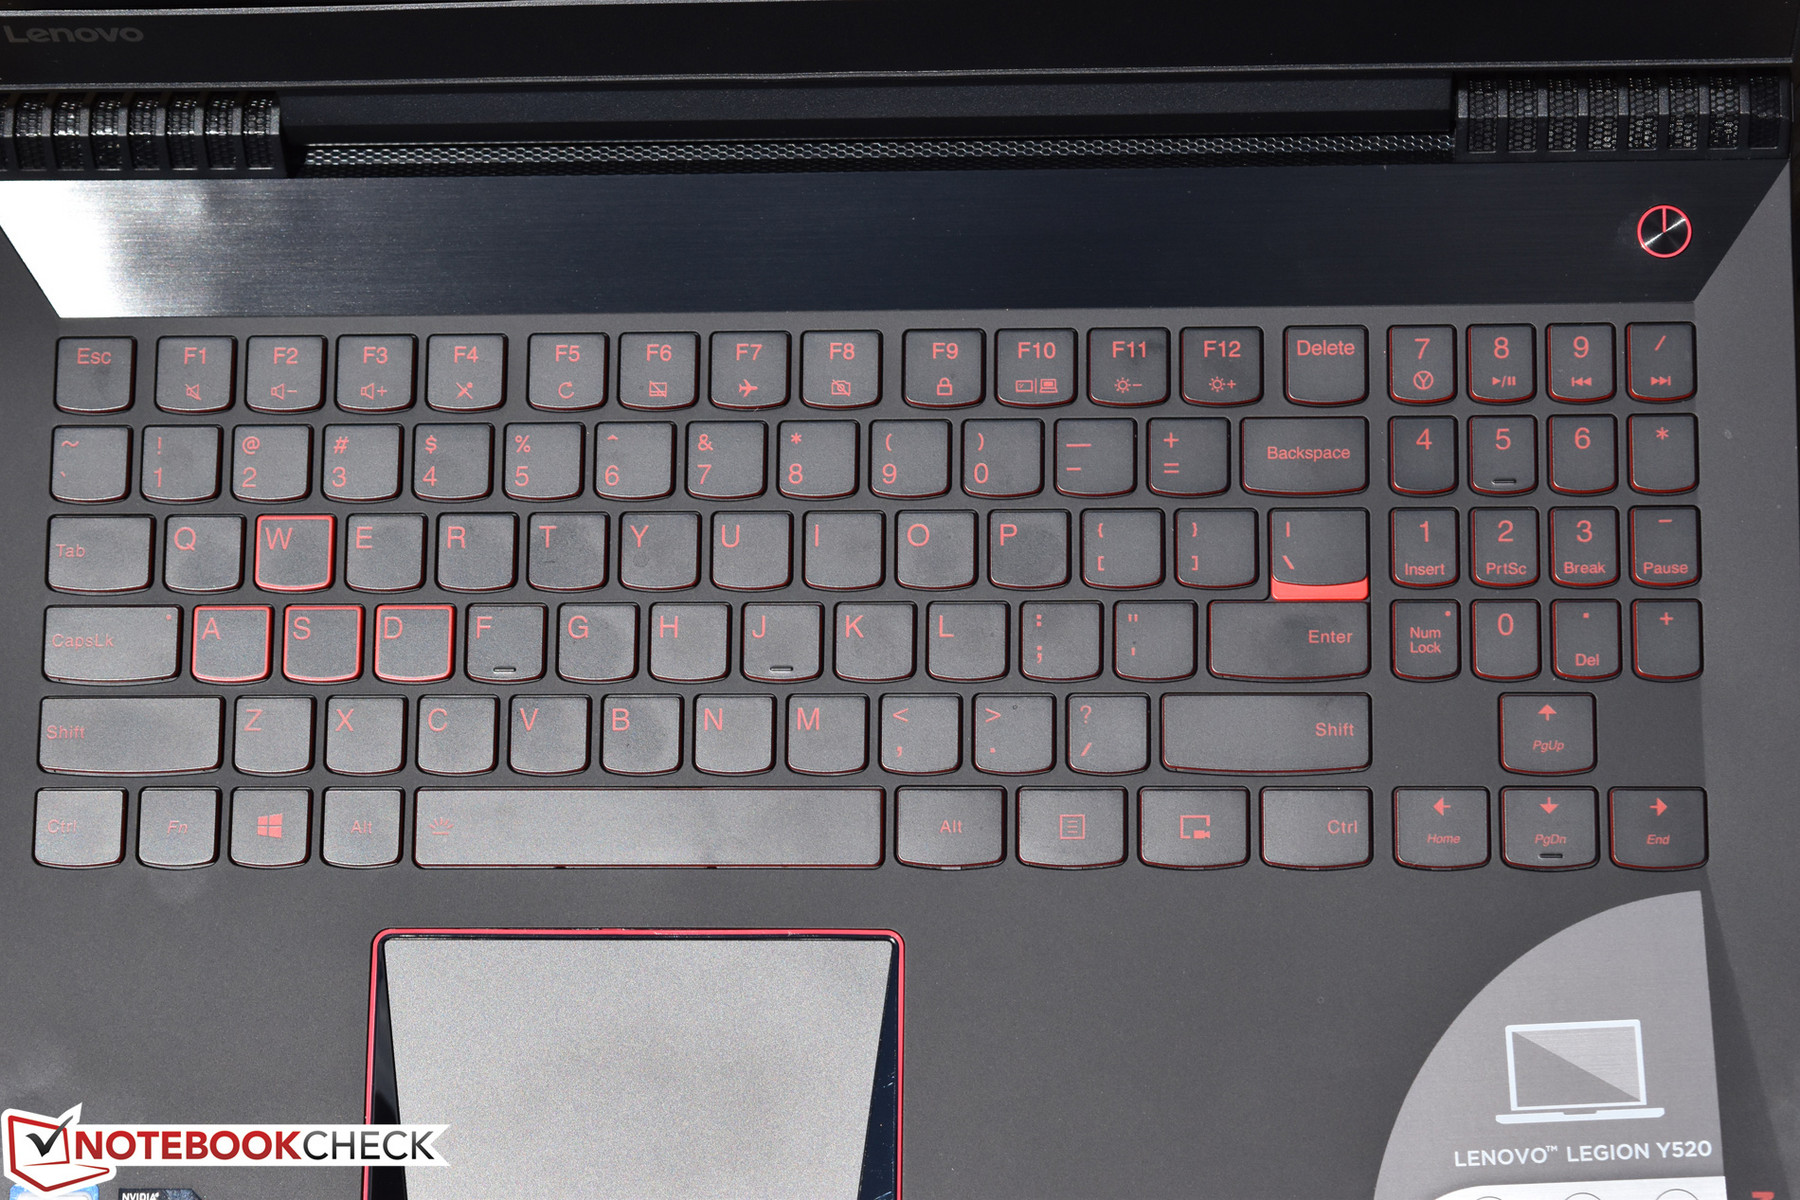
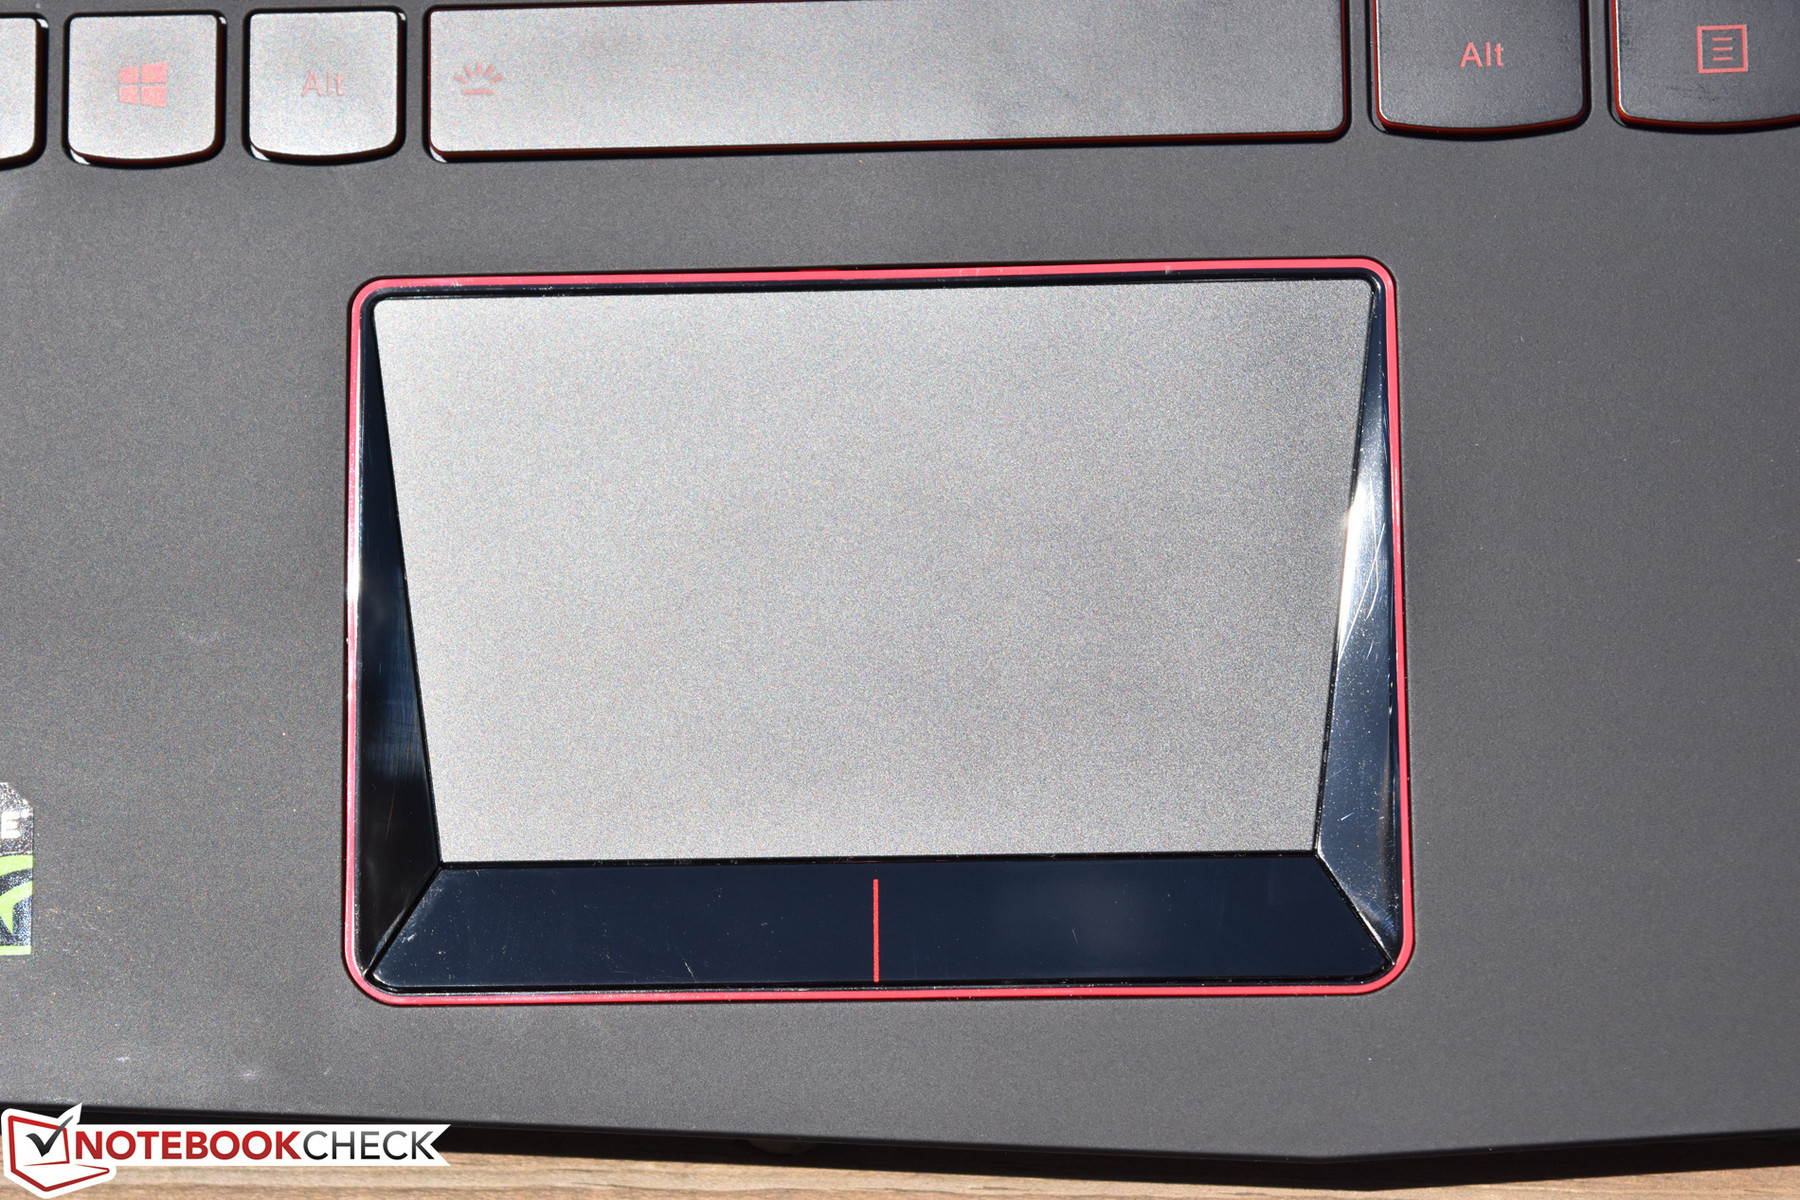
Input Devices
The Y520-15IKBA retains the same keyboard and touchpad as Lenovo used on the Y520-15IKBN. Our test device has no keyboard backlighting though.
Display


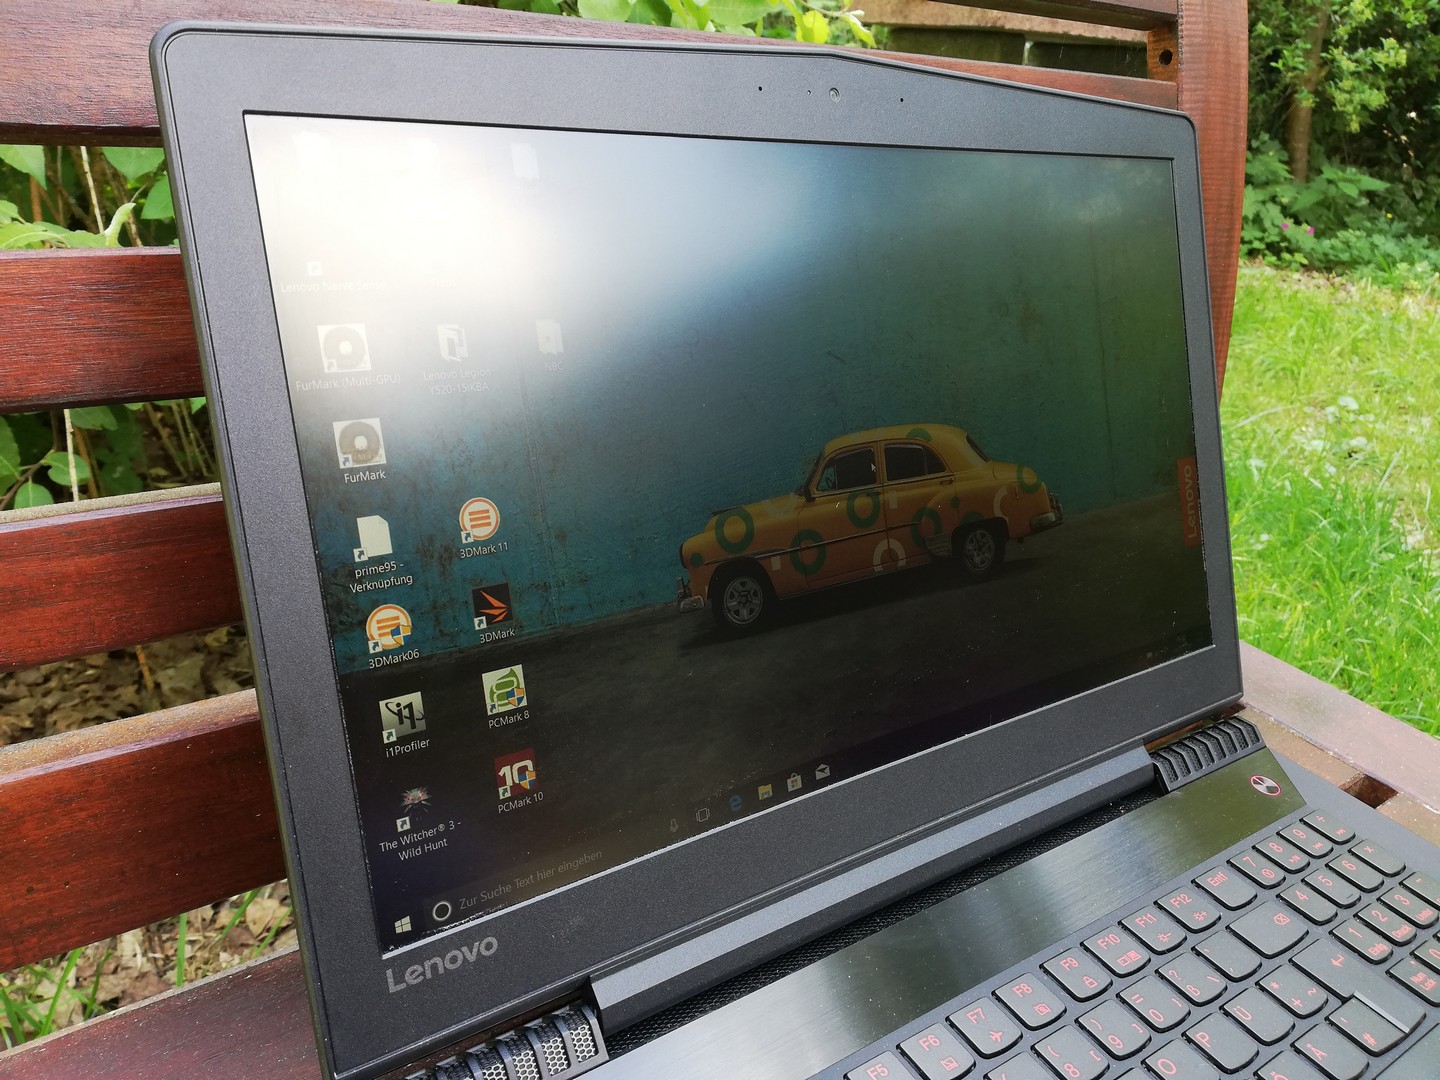
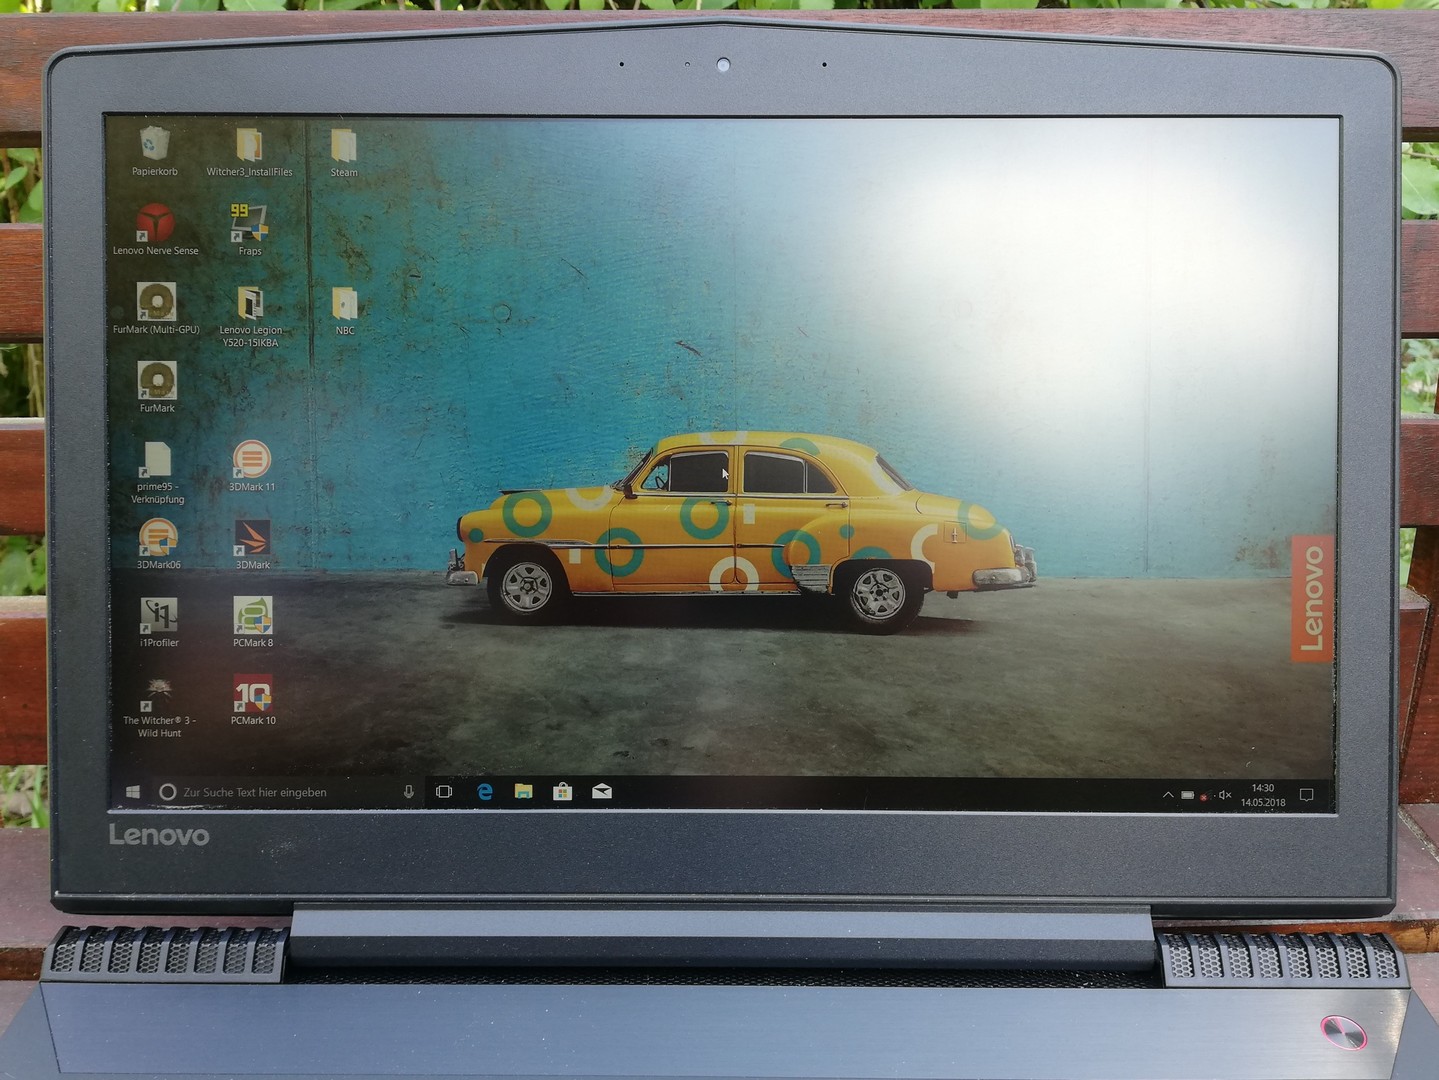
The Y520-15IKBA has a matte 15.6-inch IPS display with a 1,920x1,080 resolution. This is currently the only display that Lenovo offers with the Y520-15IKBA.
While the display brightness is comparatively low, it is sufficiently bright to use the display indoors in well-lit areas.
| |||||||||||||||||||||||||
Brightness Distribution: 87 %
Center on Battery: 244 cd/m²
Contrast: 1013:1 (Black: 0.24 cd/m²)
ΔE ColorChecker Calman: 6.36 | ∀{0.5-29.43 Ø4.73}
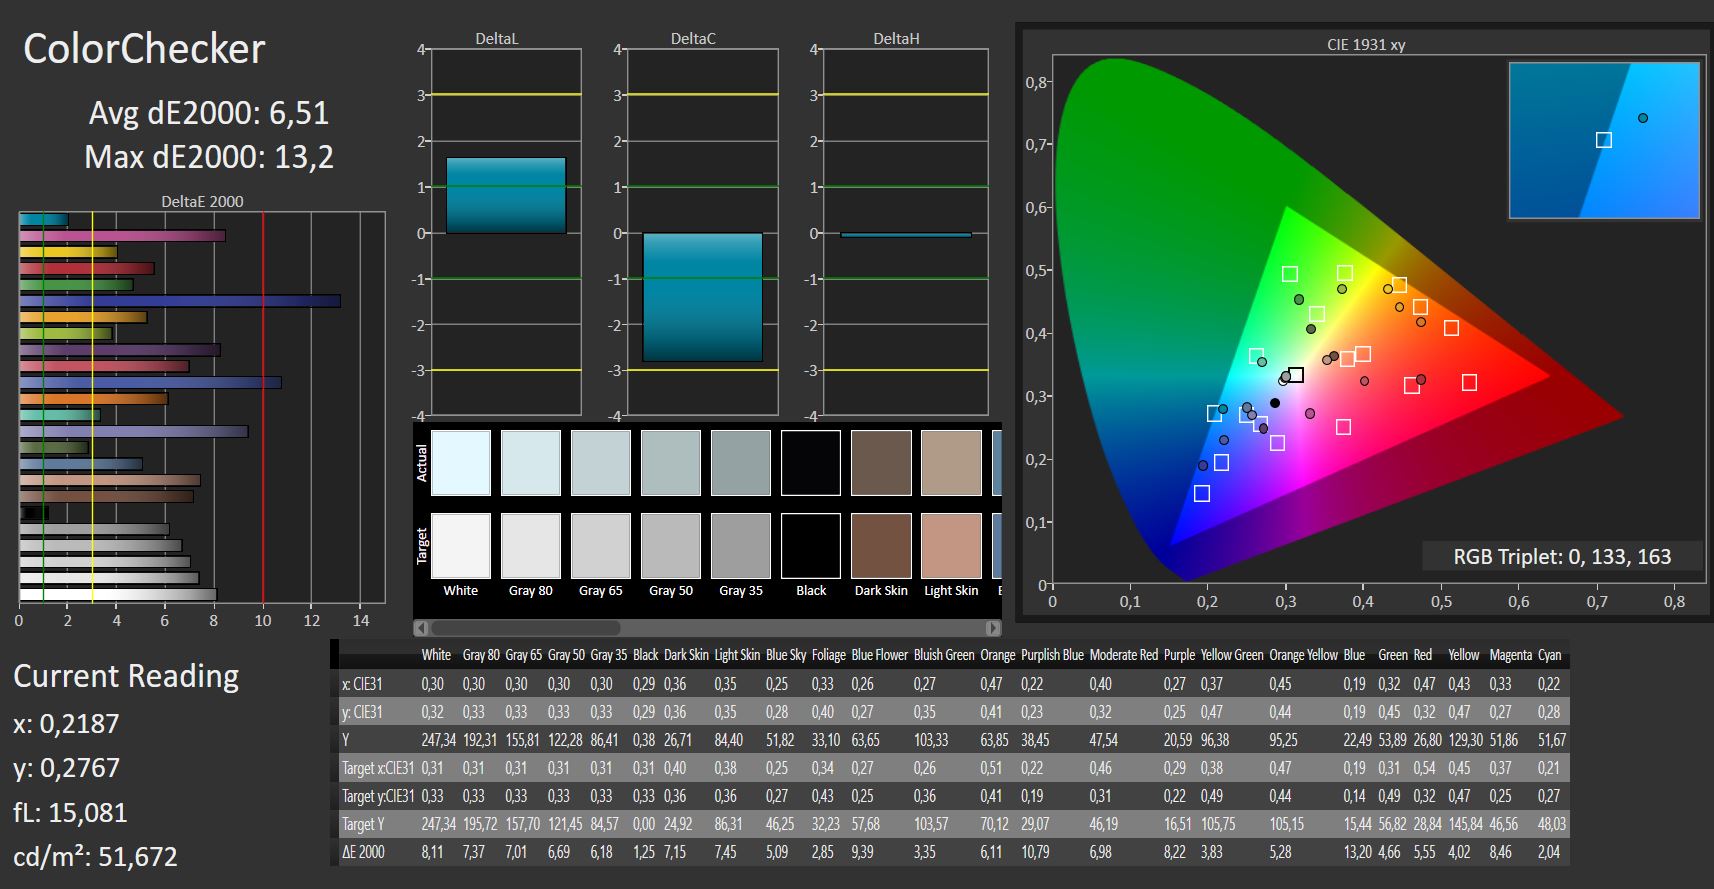
calibrated: 6.51
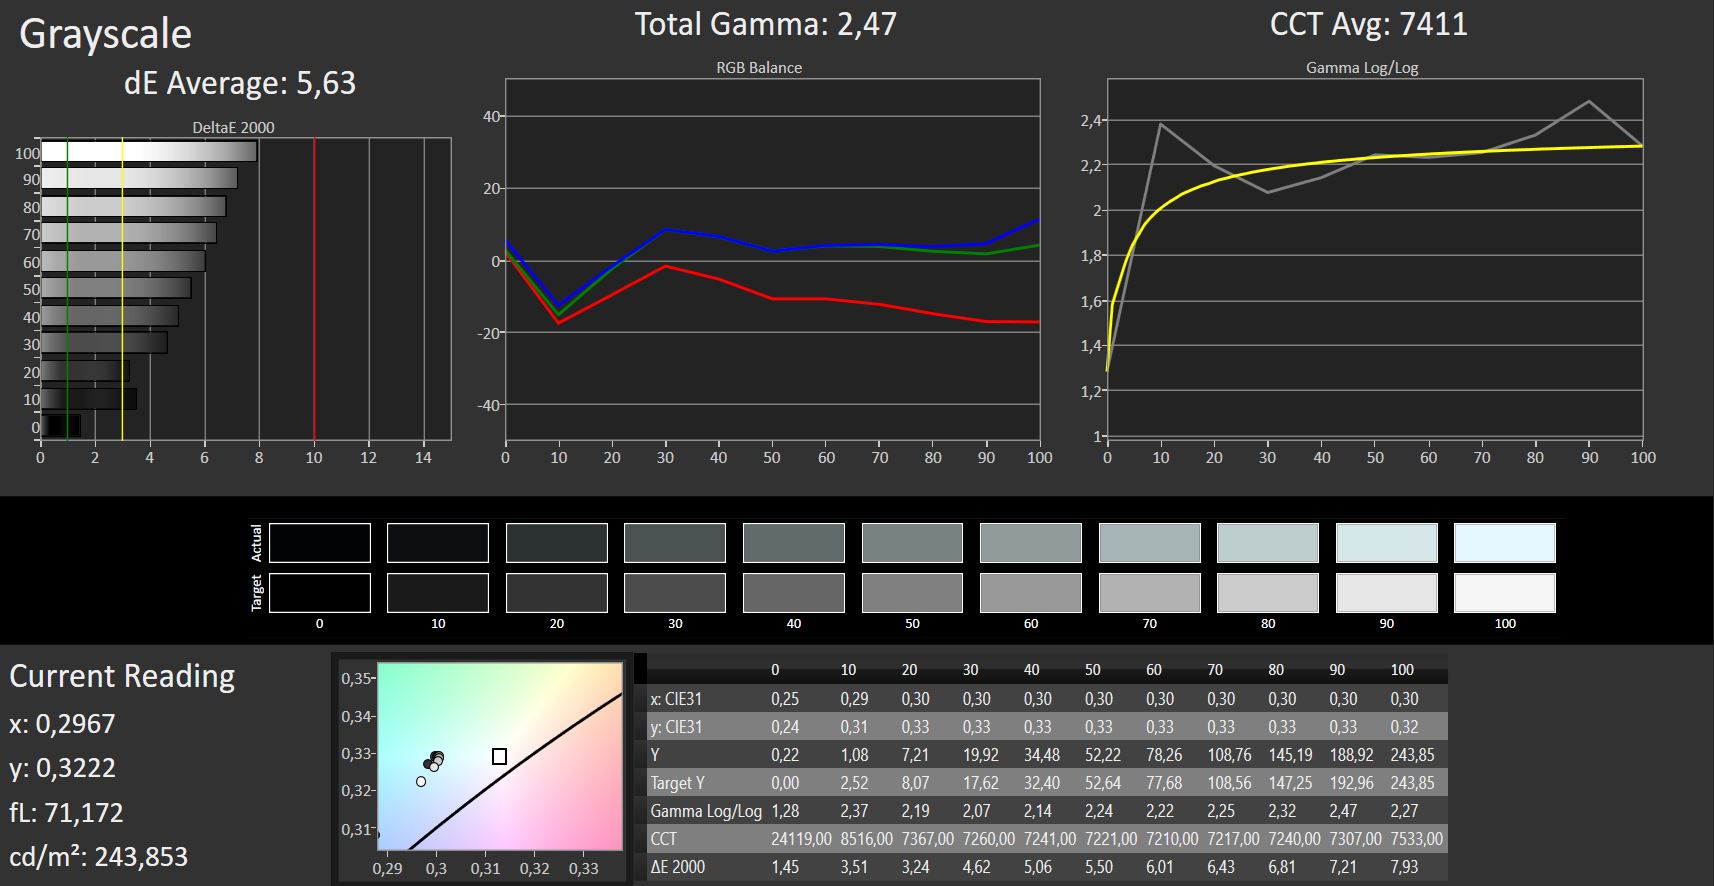
ΔE Greyscale Calman: 5.63 | ∀{0.09-98 Ø4.97}
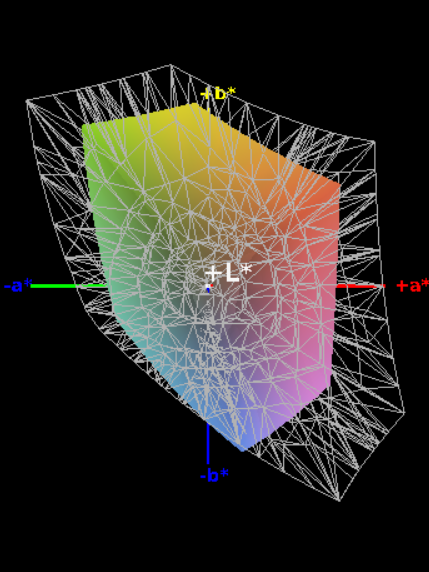
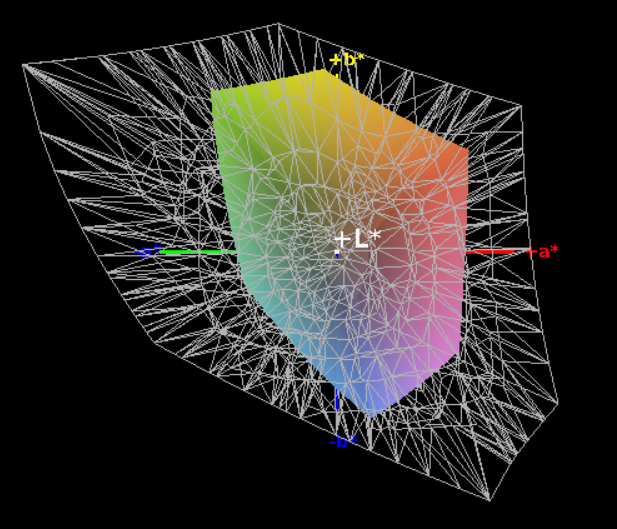
59% sRGB (Argyll 1.6.3 3D)
38% AdobeRGB 1998 (Argyll 1.6.3 3D)
40.86% AdobeRGB 1998 (Argyll 3D)
59.2% sRGB (Argyll 3D)
39.53% Display P3 (Argyll 3D)
Gamma: 2.47
CCT: 7411 K
| Lenovo Legion Y520-15IKBA-80WY001VGE LG Philips LGD0533, , 1920x1080, 15.6" | Alienware 13 R3 (i5-7300HQ, GTX 1050 Ti) Chi Mei CMN1371, , 1920x1080, 13.3" | Schenker XMG Apex 15 LG Philips LP156WF6 (LGD046F), , 1920x1080, 15.6" | Asus ROG Strix GL702ZC-GC204T LG Philips LP173WF4-SPF5, , 1920x1080, 17.3" | Dell Inspiron 15 7000 7577 4K Name: AU Optronics B156ZAN, , 3840x2160, 15.6" | Lenovo Legion Y520-15IKBN-80WK001KUS LP156WF6-SPK3, , 1920x1080, 15.6" | |
|---|---|---|---|---|---|---|
| Display | 61% | 48% | 51% | 69% | ||
| Display P3 Coverage (%) | 39.53 | 66.1 67% | 62 57% | 65.4 65% | 68.4 73% | |
| sRGB Coverage (%) | 59.2 | 90.9 54% | 82.7 40% | 82.6 40% | 97.1 64% | |
| AdobeRGB 1998 Coverage (%) | 40.86 | 66.2 62% | 60.4 48% | 60.4 48% | 69.6 70% | |
| Response Times | -9% | -10% | 15% | 6% | -37% | |
| Response Time Grey 50% / Grey 80% * (ms) | 42 ? | 41.6 ? 1% | 42.4 ? -1% | 36 ? 14% | 35.2 ? 16% | 58.8 ? -40% |
| Response Time Black / White * (ms) | 27 ? | 32 ? -19% | 32 ? -19% | 23 ? 15% | 28.4 ? -5% | 36 ? -33% |
| PWM Frequency (Hz) | 24900 ? | 25000 ? | 20490 ? | 21550 ? | ||
| Screen | 22% | 27% | 19% | 21% | -19% | |
| Brightness middle (cd/m²) | 243 | 363 49% | 269 11% | 415 71% | 322.9 33% | 239 -2% |
| Brightness (cd/m²) | 231 | 322 39% | 274 19% | 365 58% | 309 34% | 244 6% |
| Brightness Distribution (%) | 87 | 80 -8% | 91 5% | 82 -6% | 90 3% | 88 1% |
| Black Level * (cd/m²) | 0.24 | 0.31 -29% | 0.23 4% | 0.42 -75% | 0.36 -50% | 0.35 -46% |
| Contrast (:1) | 1013 | 1171 16% | 1170 15% | 988 -2% | 897 -11% | 683 -33% |
| Colorchecker dE 2000 * | 6.36 | 5.1 20% | 4.25 33% | 4.95 22% | 3.99 37% | 7.3 -15% |
| Colorchecker dE 2000 max. * | 12.76 | 8.9 30% | 10.39 19% | 9.34 27% | 8.97 30% | 24.7 -94% |
| Colorchecker dE 2000 calibrated * | 6.51 | 2.51 61% | ||||
| Greyscale dE 2000 * | 5.63 | 6.2 -10% | 3.11 45% | 4.69 17% | 5.3 6% | 4.9 13% |
| Gamma | 2.47 89% | 2.35 94% | 2.36 93% | 2.33 94% | 2.041 108% | 2.19 100% |
| CCT | 7411 88% | 6827 95% | 6851 95% | 6485 100% | 6941 94% | 7332 89% |
| Color Space (Percent of AdobeRGB 1998) (%) | 38 | 59.2 56% | 54 42% | 54 42% | 62.9 66% | 35 -8% |
| Color Space (Percent of sRGB) (%) | 59 | 90.7 54% | 83 41% | 82 39% | 96.8 64% | 55 -7% |
| Total Average (Program / Settings) | 25% /
25% | 22% /
26% | 28% /
25% | 32% /
29% | -28% /
-22% |
* ... smaller is better
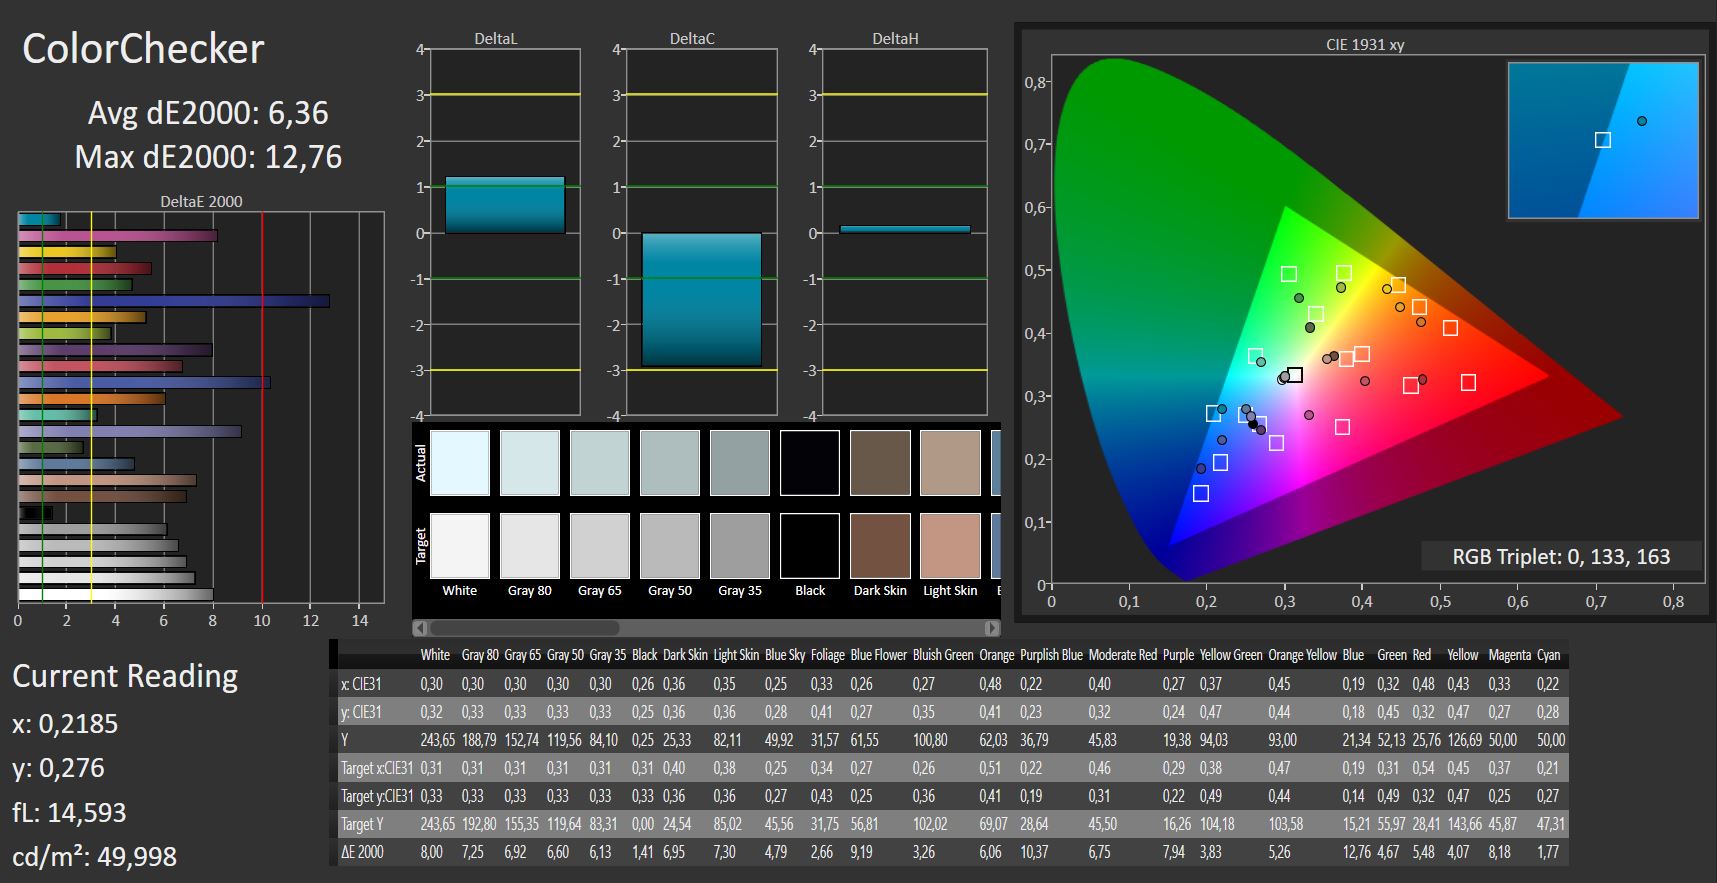
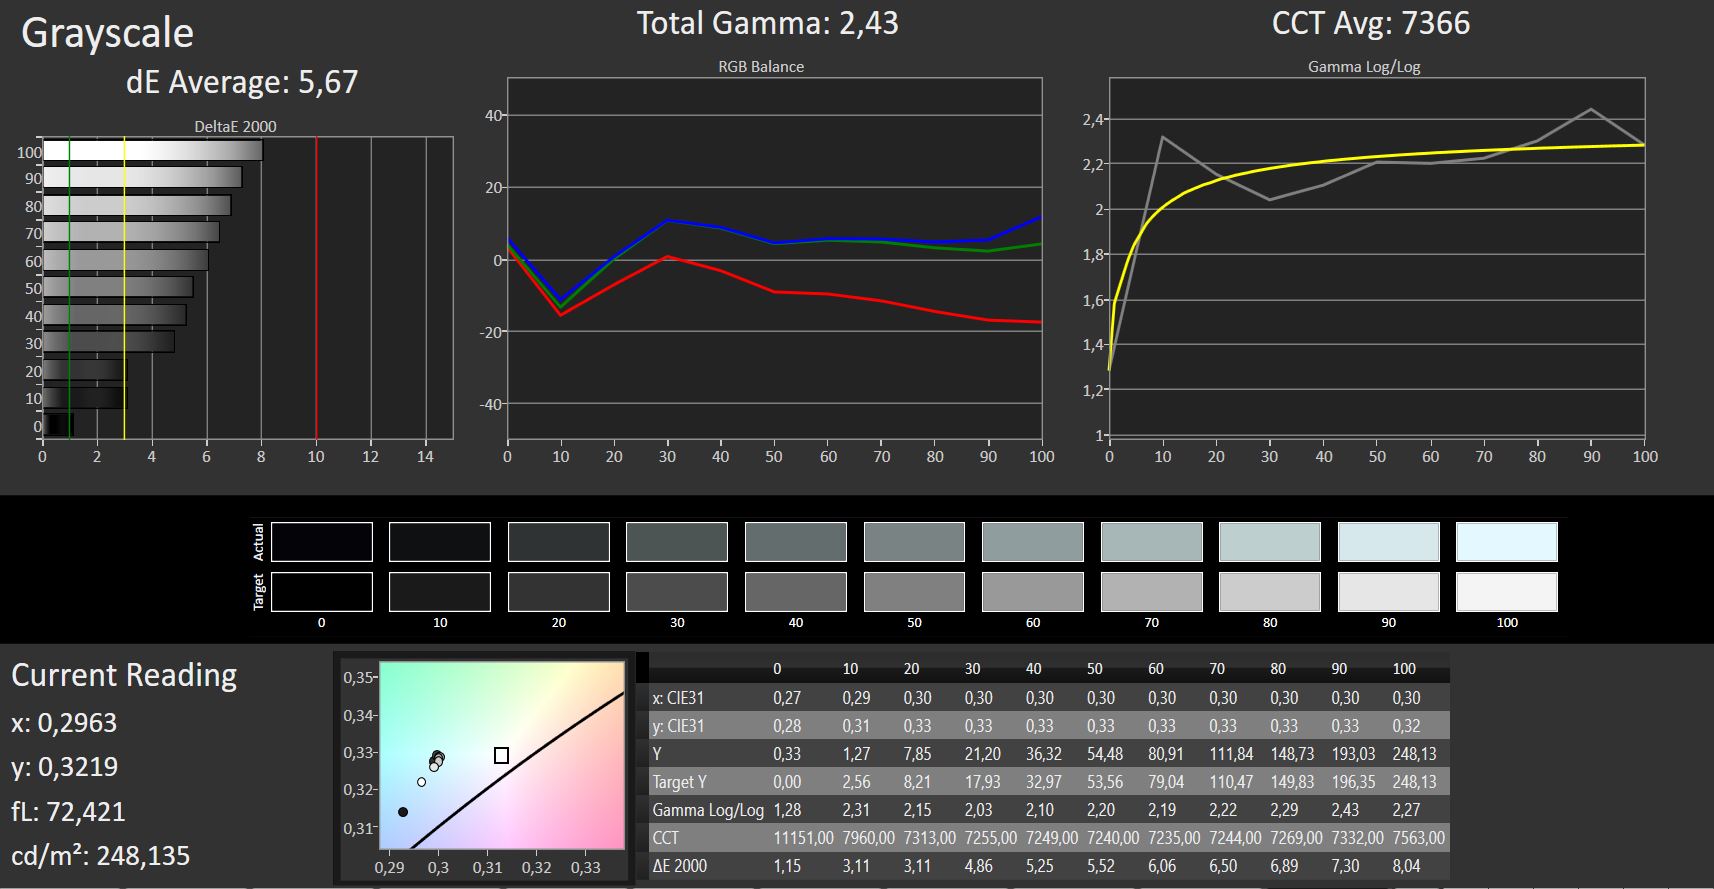
Contents look rather pale and dark at first glance. This is even the case at higher brightness levels. In contrast to colors, black tones look rich and strong. Our tests show that the Y520-15IKBA has a lower black level and a better contrast ratio than the Y520-15IKBN. Therefore, the display is more than just subjectively better than last year’s model.
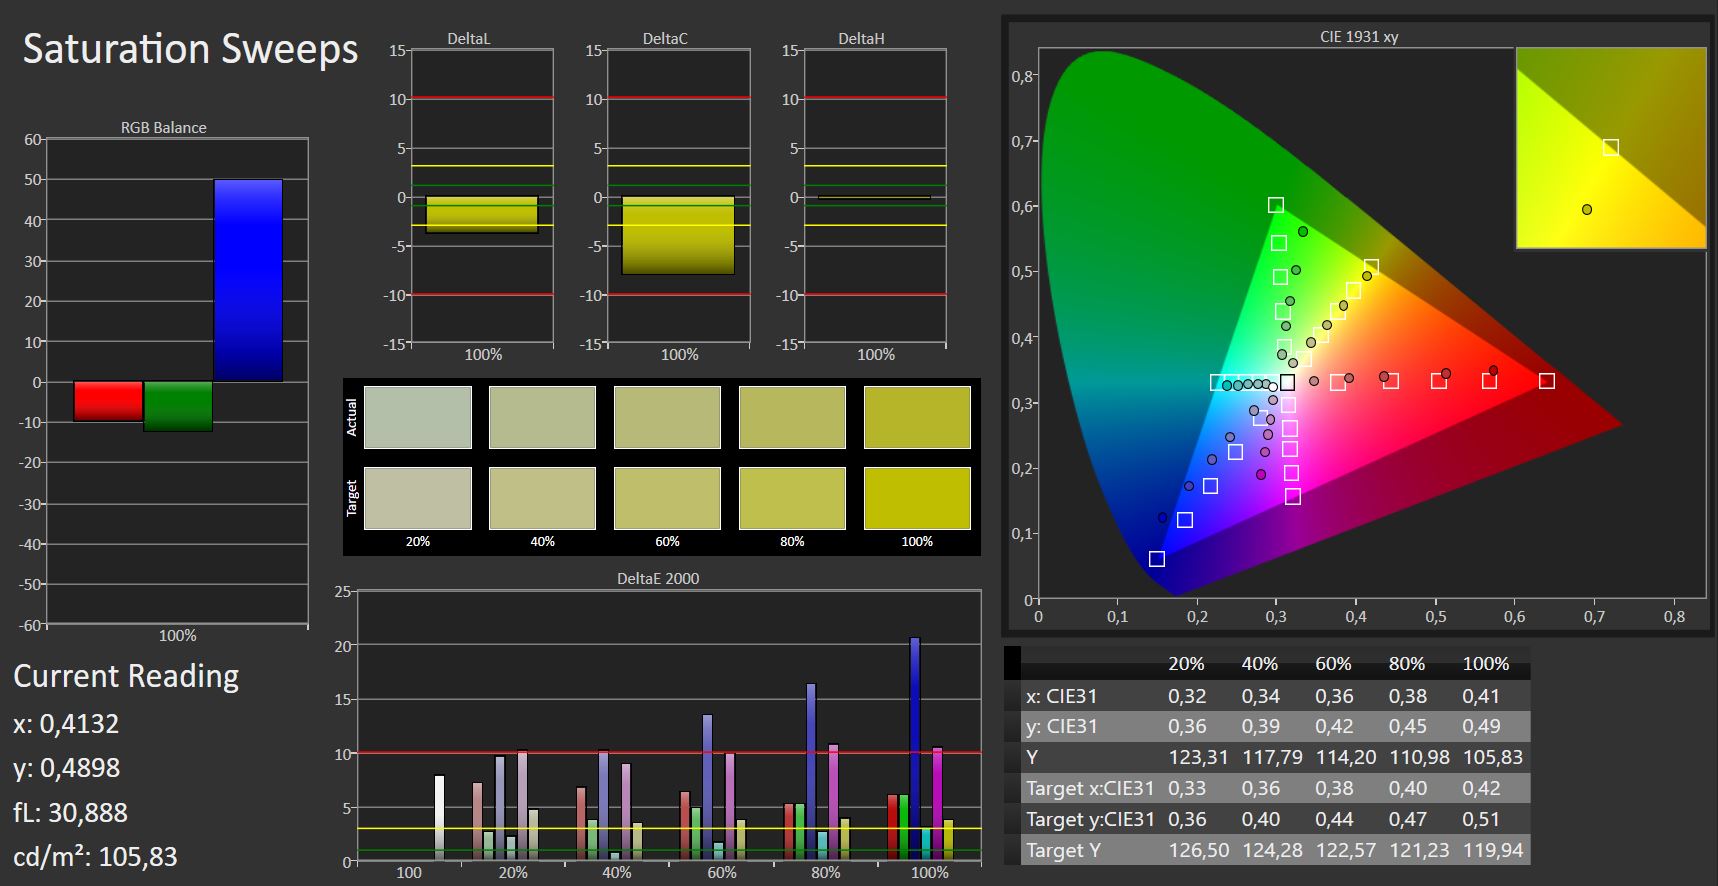
Lenovo has improved the color space coverage too, albeit the Y520-15IKBA still scores lower than average. Our review unit has 59% sRGB and 39% AdobeRGB coverage, neither of which are bad scores. Comparable gaming laptops have much better color space coverage though.
The Y520-15IKBA is hardly usable outside for activities such as extensive outdoor gaming sessions as the display is difficult to read even on cloudy days. Recognizing fast movements is harder still. While the maximum brightness may be enough for web browsing or typing outdoors, the Y520-15IKBA is a device designed primarily for indoor use.
Display Response Times
| ↔ Response Time Black to White | ||
|---|---|---|
| 27 ms ... rise ↗ and fall ↘ combined | ↗ 17 ms rise | 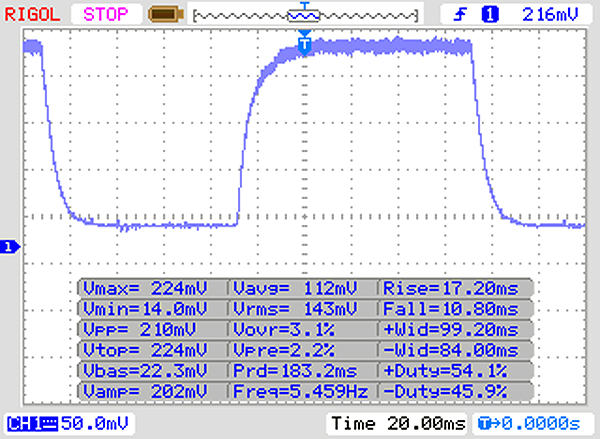 |
| ↘ 10 ms fall | ||
| The screen shows relatively slow response rates in our tests and may be too slow for gamers. In comparison, all tested devices range from 0.1 (minimum) to 240 (maximum) ms. » 67 % of all devices are better. This means that the measured response time is worse than the average of all tested devices (19.9 ms). | ||
| ↔ Response Time 50% Grey to 80% Grey | ||
| 42 ms ... rise ↗ and fall ↘ combined | ↗ 22 ms rise | 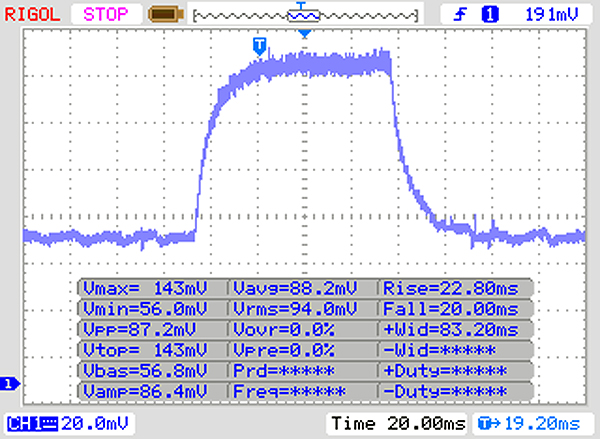 |
| ↘ 20 ms fall | ||
| The screen shows slow response rates in our tests and will be unsatisfactory for gamers. In comparison, all tested devices range from 0.165 (minimum) to 636 (maximum) ms. » 67 % of all devices are better. This means that the measured response time is worse than the average of all tested devices (31.1 ms). | ||
Screen Flickering / PWM (Pulse-Width Modulation)
| Screen flickering / PWM detected | 24900 Hz | ≤ 90 % brightness setting | 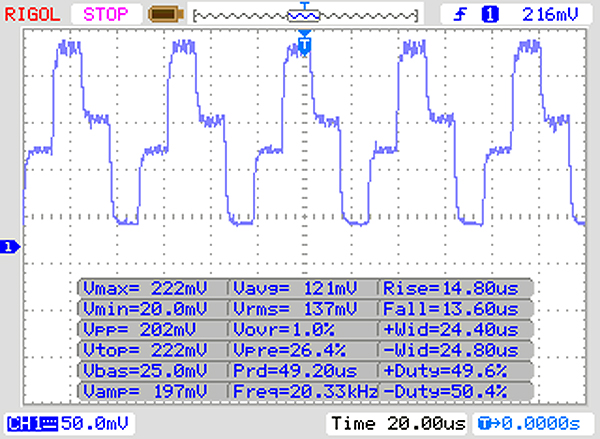 |
The display backlight flickers at 24900 Hz (worst case, e.g., utilizing PWM) Flickering detected at a brightness setting of 90 % and below. There should be no flickering or PWM above this brightness setting. The frequency of 24900 Hz is quite high, so most users sensitive to PWM should not notice any flickering. In comparison: 52 % of all tested devices do not use PWM to dim the display. If PWM was detected, an average of 7798 (minimum: 5 - maximum: 343500) Hz was measured. | |||
The display has strong viewing angles, which IPS panels tend to have. Content is easily readable from any angle with no color or image distortions at acute angles. Moreover, the matte finish prevents any annoying reflections from appearing on the screen.
The Y520-15IKBA uses Pulse-width modulation (PWM) to adjust display brightness. Using a device with PWM for long periods can cause headaches and eye strain for those with sensitive eyes. Please see our article on PWM for further details. Fortunately, the PWM frequency is very high at 24,900 Hz, so you should seldom see a flickering display when using the device.

Performance
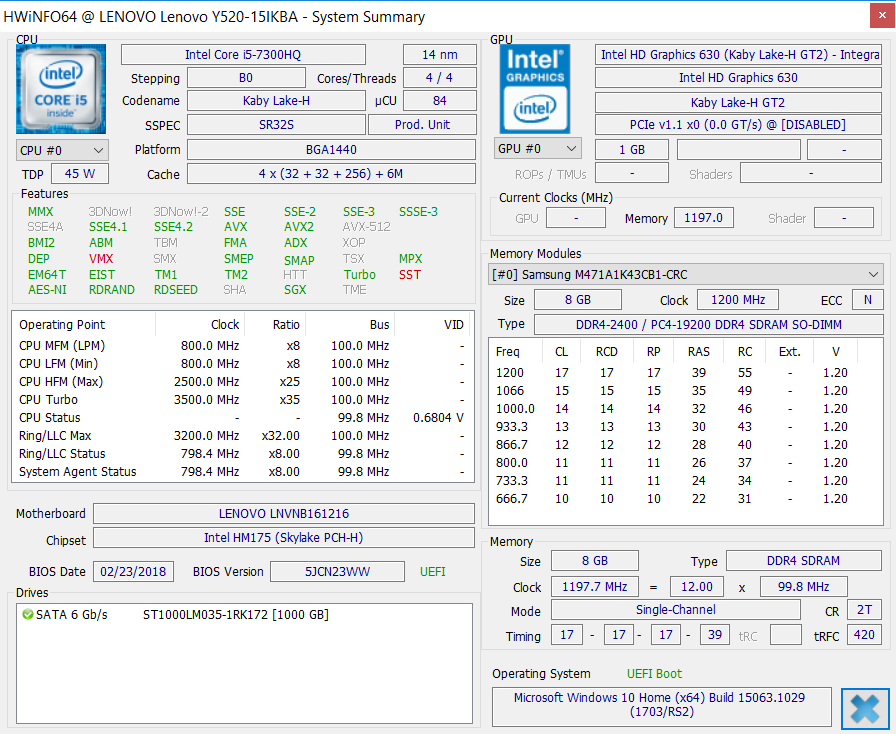
Our review unit is one of the cheapest Legion Y520 configurations and is equipped with an Intel Core i5-7300HQ processor, an AMD Radeon RX 560 dedicated graphics card, 8 GB of RAM and a 5,400 RPM 1 TB HDD. The HDD limits overall performance as it has much slower transfer speeds than an SSD. You could retrofit an SSD, but you could also just buy a slightly more expensive configuration that includes a factory fitted SSD and other upgrades.
For example, spending around €100 (~$117) more will get you not only an additional 128 GB PCIe SSD, but also an Intel Core i7-7700HQ and an NVIDIA GeForce GTX 1050. These CPU and GPU upgrades will bring noticeable performance improvements too.
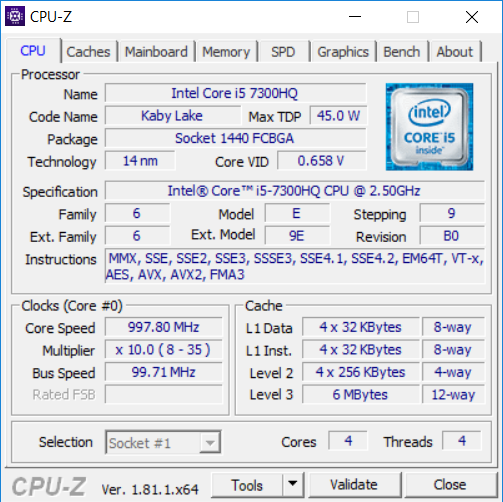
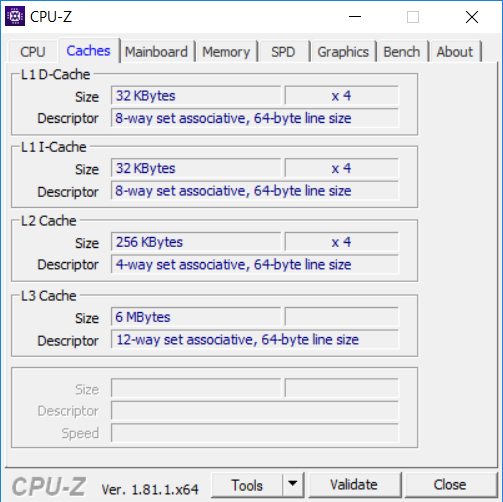
Processor
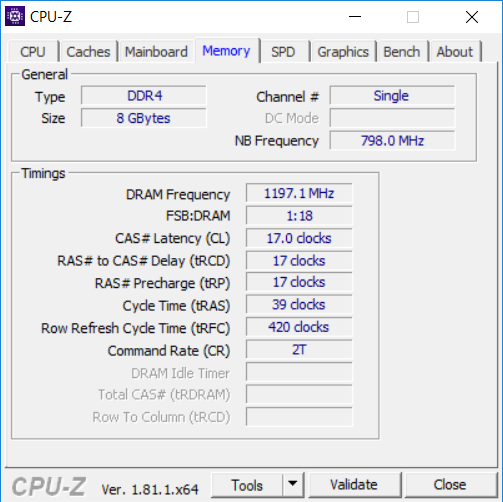
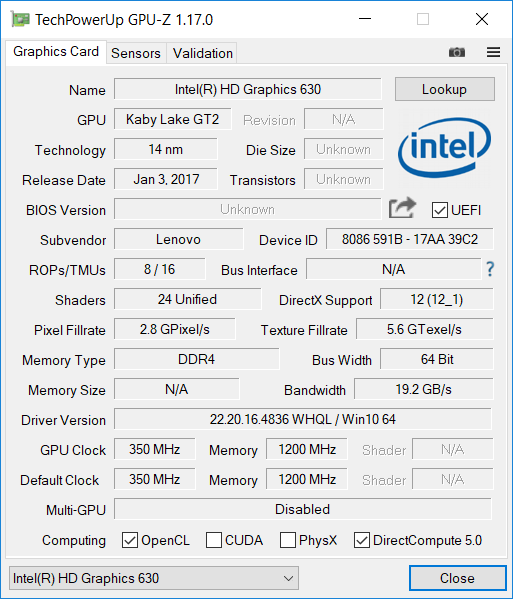
The Intel Core i5-7300HQ is a quad-core CPU based on Intel’s Kaby Lake architecture. The CPU can clock up to 3.5 GHz in single core tasks and up to 3.1 GHz for multi-core processes. The Core i5-7300HQ has a 45-W TDP that can be reduced by the manufacturer where necessary. The CPU integrates an Intel HD Graphics 630, the performance of which is comparable to an NVIDIA GeForce 940M thanks to the processor’s onboard dual channel memory controller.
The Y520-15IKBA performed at expected levels in our Cinebench R15 benchmark. Multi-core performance is slightly below average for Intel Core i5-7300HQ powered devices but the Y520-15IKBA performed at a good level overall. Our review unit maintained peak performance throughout our endurance tests.
You can find how well other Intel Core i5-7300HQ powered notebooks performed on our CPU benchmark page.
System Performance
The Y520-15IKBA performed well in our system performance benchmarks but underperformed against comparable devices. PCMark 10 in particular highlights this. Our review unit performed at the expected level for a Core i5-7300HQ and Radeon RX 560 equipped device. However, it scored 55% lower than the Schenker XMG Apex 15 and 31% worse than the class average for gaming notebooks.
The speed limitation of the 5,400 RPM HDD is apparent in daily use. Windows 10 is plagued by short load times that are not apparent with an SSD. Additionally, programs are generally slow to load.
| PCMark 8 Home Score Accelerated v2 | 4257 points | |
| PCMark 8 Work Score Accelerated v2 | 4700 points | |
| PCMark 10 Score | 3700 points | |
Help | ||
Storage Devices
The Y520-15IKBA has plenty of storage thanks to its 1 TB drive. For reference, the HDD is a Seagate ST1000LM035. However, the 5,400 RPM HDD has much slower read and write speeds than any SSD. Worse still, the HDD is slower than other HDDs. The Seagate ST1000LX015-1U7172 HDD in the ASUS ROG Strix GL702ZC has significantly higher transfer speeds than the HDD in our review unit.
Please see our HDD/SSD benchmark page to compare the Seagate Mobile HDD 1 TB ST1000LM035 performs against other drives.
| Lenovo Legion Y520-15IKBA-80WY001VGE Seagate Mobile HDD 1TB ST1000LM035 | Alienware 13 R3 (i5-7300HQ, GTX 1050 Ti) Samsung PM961 MZVLW256HEHP | Schenker XMG Apex 15 Samsung SSD 960 Evo 250GB m.2 NVMe | Asus ROG Strix GL702ZC-GC204T Seagate Mobile HDD 1TB ST1000LX015-1U7172 | Lenovo Legion Y520-15IKBN-80WK001KUS Samsung PM961 MZVLW256HEHP | Average Seagate Mobile HDD 1TB ST1000LM035 | |
|---|---|---|---|---|---|---|
| CrystalDiskMark 3.0 | 27858% | 35895% | 14% | 26745% | 28% | |
| Read Seq (MB/s) | 81 | 2018 2391% | 1751 2062% | 92.5 14% | 2170 2579% | 90.9 ? 12% |
| Write Seq (MB/s) | 84.4 | 1210 1334% | 1375 1529% | 105.1 25% | 1202 1324% | 88.5 ? 5% |
| Read 512 (MB/s) | 28.29 | 1089 3749% | 792 2700% | 37.67 33% | 786 2678% | 31.5 ? 11% |
| Write 512 (MB/s) | 65.2 | 850 1204% | 1007 1444% | 101.8 56% | 822 1161% | 77.3 ? 19% |
| Read 4k (MB/s) | 0.394 | 58.7 14798% | 60 15128% | 0.484 23% | 58.9 14849% | 0.4174 ? 6% |
| Write 4k (MB/s) | 0.319 | 146.1 45699% | 164.1 51342% | 0.169 -47% | 146.4 45793% | 0.525 ? 65% |
| Read 4k QD32 (MB/s) | 0.838 | 492 58611% | 676 80568% | 1.294 54% | 457.7 54518% | 0.993 ? 18% |
| Write 4k QD32 (MB/s) | 0.431 | 410.2 95074% | 571 132383% | 0.221 -49% | 392.9 91060% | 0.803 ? 86% |

Graphics Card
Lenovo has equipped the Y520-15IKBA with an AMD Radeon RX 560, a mid-range GPU with 2 GB GDDR5 VRAM that can run most current games and complex 3D applications. Our tests indicate that most modern games should be playable at medium graphics settings.
The Radeon RX 560 scores well in 3DMark benchmarks, yet it cannot compete with the more powerful GPUs found in our comparison devices.
Please see our GPU benchmark page for a more detailed look at how the AMD Radeon RX 560 compares against other GPUs.
| 3DMark 11 Performance | 7567 points | |
| 3DMark Cloud Gate Standard Score | 14354 points | |
| 3DMark Fire Strike Score | 4899 points | |
Help | ||
Gaming Performance
The Y520-15IKBA can run most games at medium graphics and less demanding games at higher settings. For example, “The Witcher 3” runs without any issues. Frame rates dip if the system is being particularly taxed, but the cooling system quickly restores the performance.
Almost all the games against which we tested our review unit are playable at medium graphics in 1080p. Overall, the Y520-15IKBA is suitable for gaming.
Please see our gaming benchmark page for a more detailed look at how the AMD Radeon RX 560 performs in other games.
| Thief | |
| 1920x1080 Very High Preset AA:FXAA & High SS AF:8x | |
| Dell Inspiron 15 7000 7577 4K | |
| Alienware 13 R3 (i5-7300HQ, GTX 1050 Ti) | |
| Lenovo Legion Y520-15IKBA-80WY001VGE | |
| Average AMD Radeon RX 560 (Laptop) (n=1) | |
| 1366x768 High Preset AA:FXAA & Low SS AF:4x | |
| Alienware 13 R3 (i5-7300HQ, GTX 1050 Ti) | |
| Lenovo Legion Y520-15IKBA-80WY001VGE | |
| Average AMD Radeon RX 560 (Laptop) (n=1) | |
| 1366x768 Normal Preset AA:FX | |
| Alienware 13 R3 (i5-7300HQ, GTX 1050 Ti) | |
| Lenovo Legion Y520-15IKBA-80WY001VGE | |
| Average AMD Radeon RX 560 (Laptop) (n=1) | |
| 1024x768 Very Low Preset | |
| Alienware 13 R3 (i5-7300HQ, GTX 1050 Ti) | |
| Lenovo Legion Y520-15IKBA-80WY001VGE | |
| Average AMD Radeon RX 560 (Laptop) (n=1) | |
| The Witcher 3 | |
| 1920x1080 Ultra Graphics & Postprocessing (HBAO+) | |
| Average of class Gaming (95 - 240, n=8, last 2 years) | |
| Schenker XMG Apex 15 | |
| Lenovo Legion Y520-15IKBN-80WK001KUS | |
| Dell Inspiron 15 7000 7577 4K | |
| Asus ROG Strix GL702ZC-GC204T | |
| Alienware 13 R3 (i5-7300HQ, GTX 1050 Ti) | |
| Lenovo Legion Y520-15IKBA-80WY001VGE | |
| Average AMD Radeon RX 560 (Laptop) (19.6 - 20.7, n=2) | |
| 1920x1080 High Graphics & Postprocessing (Nvidia HairWorks Off) | |
| Average of class Gaming (181 - 341, n=3, last 2 years) | |
| Schenker XMG Apex 15 | |
| Dell Inspiron 15 7000 7577 4K | |
| Asus ROG Strix GL702ZC-GC204T | |
| Alienware 13 R3 (i5-7300HQ, GTX 1050 Ti) | |
| Lenovo Legion Y520-15IKBA-80WY001VGE | |
| Average AMD Radeon RX 560 (Laptop) (34.1 - 35.2, n=2) | |
| Dragon Age: Inquisition | |
| 1920x1080 Ultra Graphics Quality AA:2x MS | |
| Asus ROG Strix GL702ZC-GC204T | |
| Alienware 13 R3 (i5-7300HQ, GTX 1050 Ti) | |
| Average AMD Radeon RX 560 (Laptop) (23.9 - 26.4, n=2) | |
| Lenovo Legion Y520-15IKBA-80WY001VGE | |
| 1920x1080 High Graphics Quality | |
| Asus ROG Strix GL702ZC-GC204T | |
| Alienware 13 R3 (i5-7300HQ, GTX 1050 Ti) | |
| Average AMD Radeon RX 560 (Laptop) (34.9 - 40.3, n=2) | |
| Lenovo Legion Y520-15IKBA-80WY001VGE | |
| low | med. | high | ultra | |
|---|---|---|---|---|
| BioShock Infinite (2013) | 88.6 | 75.3 | 70.1 | 40.05 |
| Thief (2014) | 38.3 | 35.4 | 34.5 | 30.6 |
| Dragon Age: Inquisition (2014) | 34.9 | 23.9 | ||
| The Witcher 3 (2015) | 35.2 | 20.7 | ||
| Rise of the Tomb Raider (2016) | 51.8 | 47.4 | 35.1 | 27.8 |
Emissions
Fan Noise
Our review unit is whisper quiet when web browsing or doing office work. Ambient noise is almost always louder than the device, while the HDD is barely audible. The fans are noticeable when gaming, but they are not annoying or obtrusive.
Noise level
| Idle |
| 31.3 / 31.3 / 31.3 dB(A) |
| HDD |
| 31.3 dB(A) |
| Load |
| 32.8 / 39 dB(A) |
 | ||
30 dB silent 40 dB(A) audible 50 dB(A) loud |
||
min: | ||
Temperature
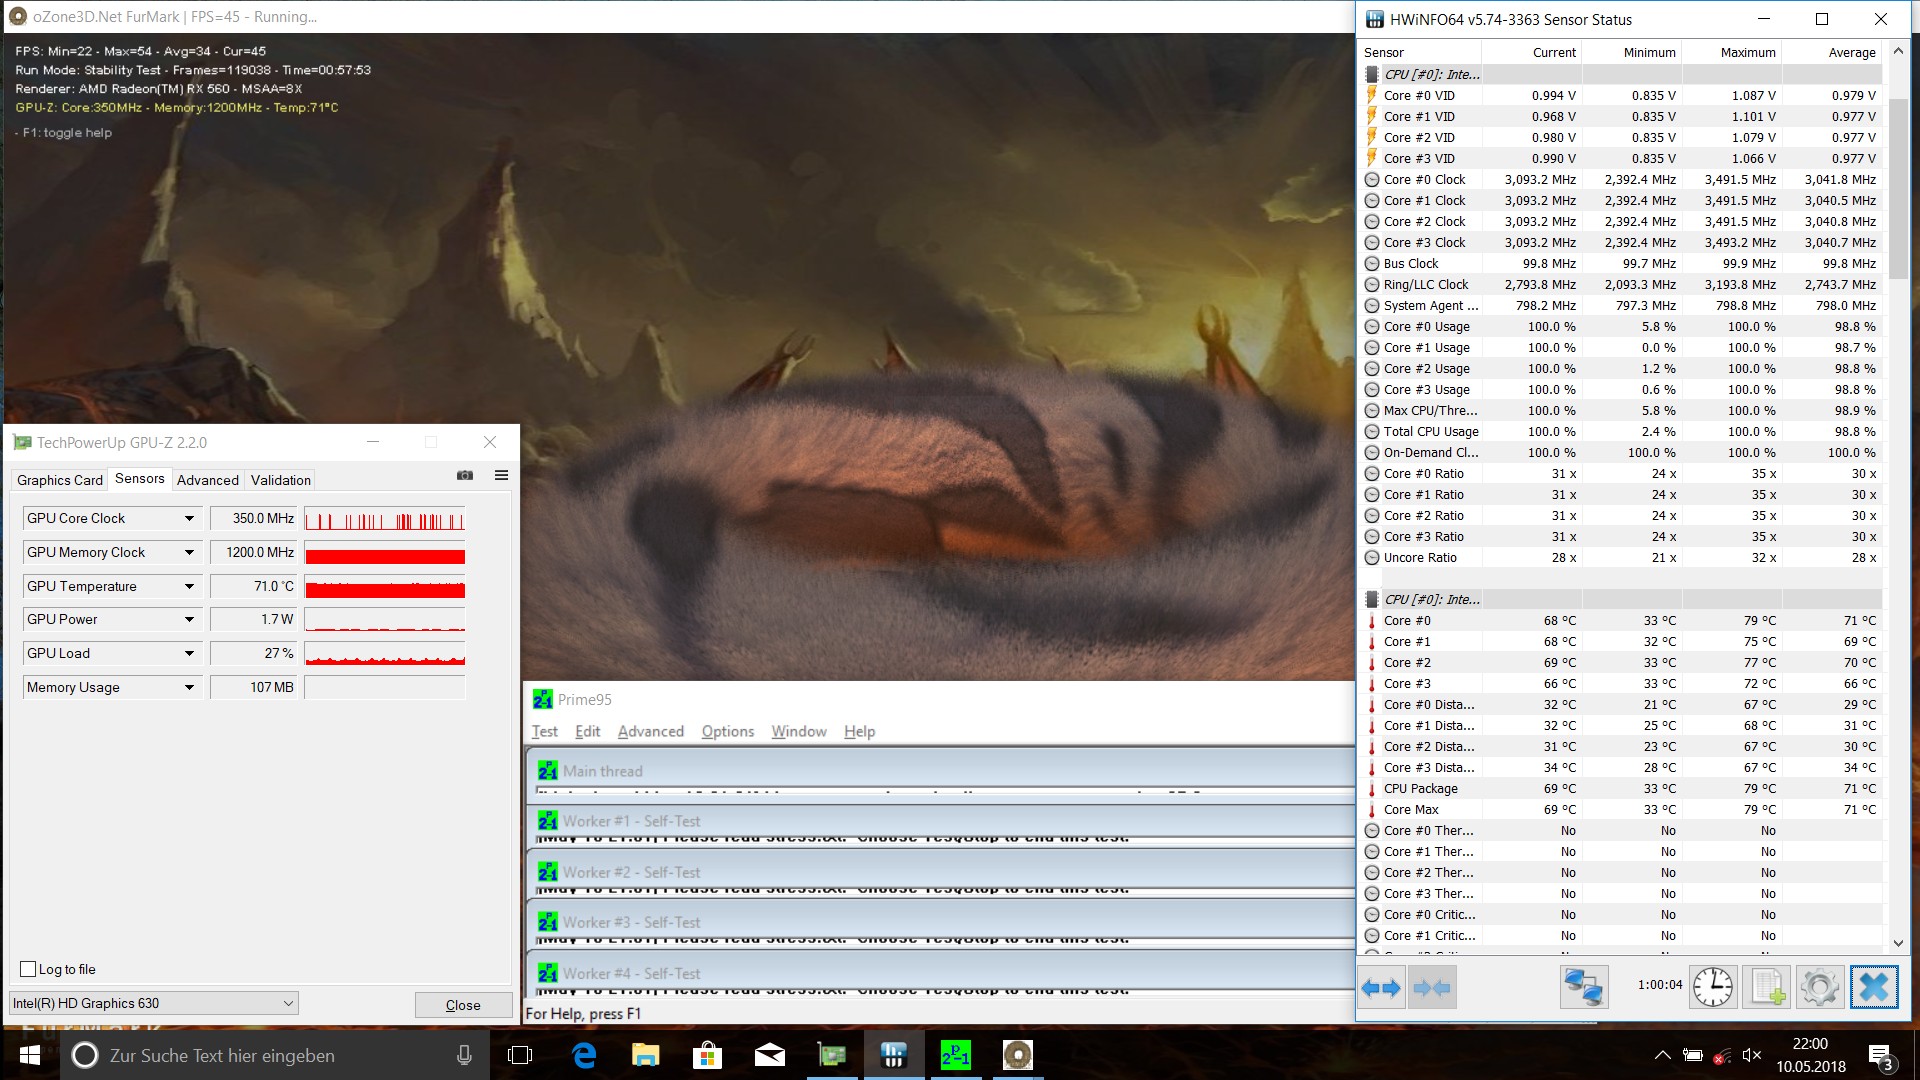
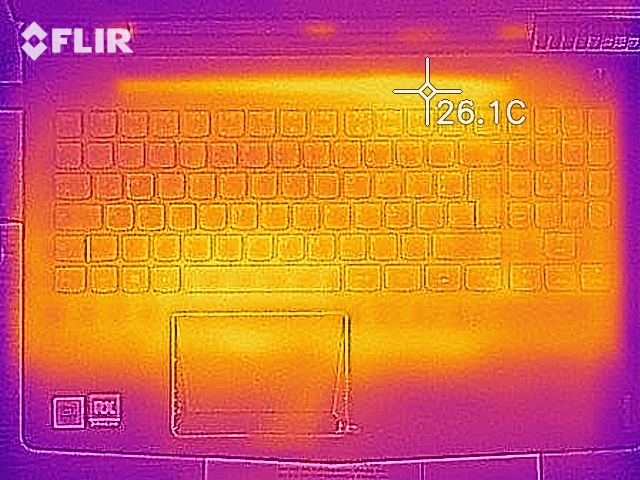
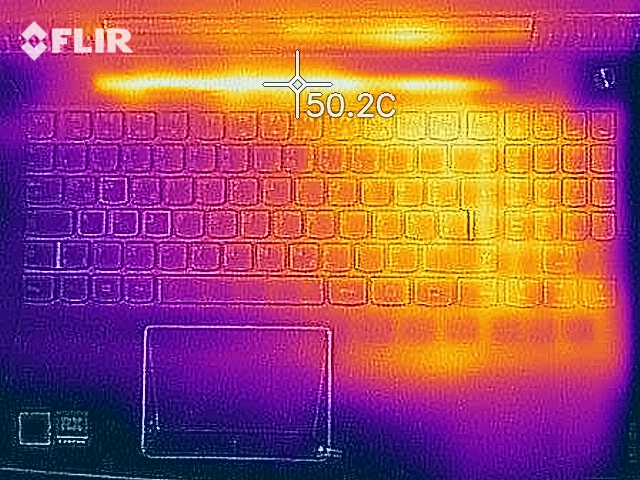
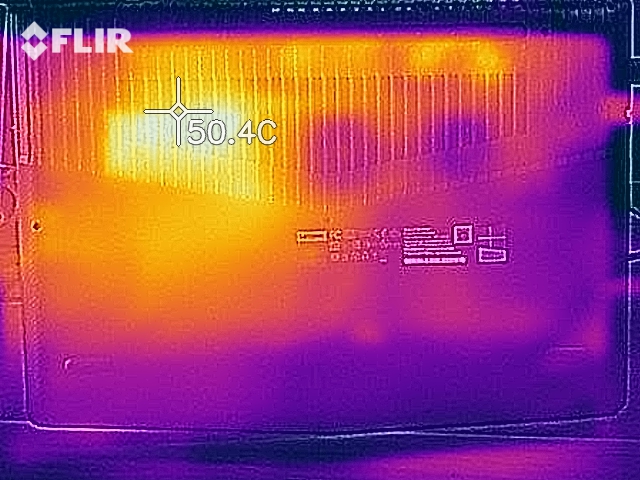
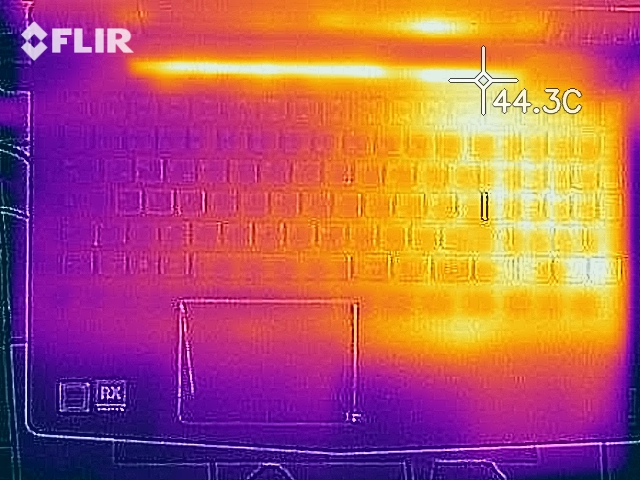
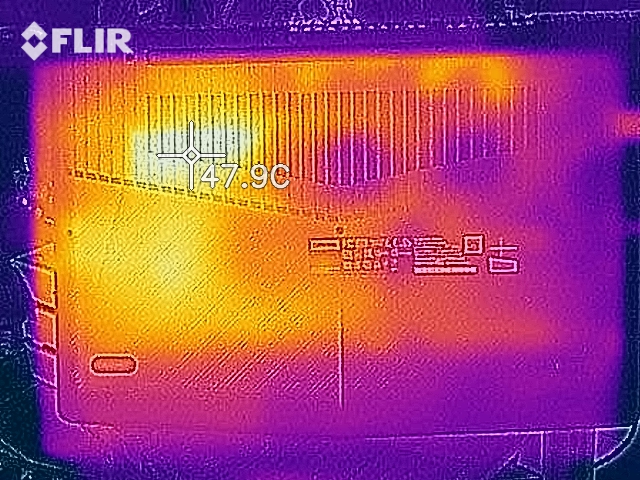
Surface temperatures remain relatively cool even under load. Overall, they averaged 21.3 °C (~0 °F) at idle, and increased to an average of 28.5 °C (~83 °F) under load. The device heats up more in different areas though. Thankfully, the palm rest only reaches an average of 23.6 °C (~74 °F) under load. The biggest change in surface temperature is at the top right-hand corner of the top case, where surface temperatures hit 40 °C (~104 °F). Notably, our test device stayed cooler in “The Witcher 3” benchmark than when stress tested. In a one-hour stress test, the core temperature reached 77 °C (~171 °F), but the CPU still maintained its base clock speed throughout.
(±) The maximum temperature on the upper side is 40.3 °C / 105 F, compared to the average of 40.4 °C / 105 F, ranging from 21.2 to 68.8 °C for the class Gaming.
(+) The bottom heats up to a maximum of 39.6 °C / 103 F, compared to the average of 43.2 °C / 110 F
(+) In idle usage, the average temperature for the upper side is 21.3 °C / 70 F, compared to the device average of 33.9 °C / 93 F.
(+) Playing The Witcher 3, the average temperature for the upper side is 28.9 °C / 84 F, compared to the device average of 33.9 °C / 93 F.
(+) The palmrests and touchpad are cooler than skin temperature with a maximum of 26.5 °C / 79.7 F and are therefore cool to the touch.
(+) The average temperature of the palmrest area of similar devices was 28.8 °C / 83.8 F (+2.3 °C / 4.1 F).

Speakers
The Y520-15IKBA’s speakers sound unbalanced. Deep mid tones are over-represented, obscuring both high tones and bass. Furthermore, playing media at high volumes sounds unpleasant. We would recommend using external speakers or headphones where possible instead of the internal speakers.
Lenovo Legion Y520-15IKBA-80WY001VGE audio analysis
(-) | not very loud speakers (67.9 dB)
Bass 100 - 315 Hz
(-) | nearly no bass - on average 16.2% lower than median
(±) | linearity of bass is average (12.5% delta to prev. frequency)
Mids 400 - 2000 Hz
(±) | higher mids - on average 9.9% higher than median
(±) | linearity of mids is average (8.8% delta to prev. frequency)
Highs 2 - 16 kHz
(+) | balanced highs - only 4.1% away from median
(±) | linearity of highs is average (11% delta to prev. frequency)
Overall 100 - 16.000 Hz
(-) | overall sound is not linear (32.4% difference to median)
Compared to same class
» 98% of all tested devices in this class were better, 1% similar, 1% worse
» The best had a delta of 6%, average was 18%, worst was 132%
Compared to all devices tested
» 91% of all tested devices were better, 1% similar, 7% worse
» The best had a delta of 4%, average was 24%, worst was 134%
Apple MacBook 12 (Early 2016) 1.1 GHz audio analysis
(+) | speakers can play relatively loud (83.6 dB)
Bass 100 - 315 Hz
(±) | reduced bass - on average 11.3% lower than median
(±) | linearity of bass is average (14.2% delta to prev. frequency)
Mids 400 - 2000 Hz
(+) | balanced mids - only 2.4% away from median
(+) | mids are linear (5.5% delta to prev. frequency)
Highs 2 - 16 kHz
(+) | balanced highs - only 2% away from median
(+) | highs are linear (4.5% delta to prev. frequency)
Overall 100 - 16.000 Hz
(+) | overall sound is linear (10.2% difference to median)
Compared to same class
» 7% of all tested devices in this class were better, 2% similar, 91% worse
» The best had a delta of 5%, average was 18%, worst was 53%
Compared to all devices tested
» 5% of all tested devices were better, 1% similar, 94% worse
» The best had a delta of 4%, average was 24%, worst was 134%
Power Management
Power Consumption
The Y520-15IKBA consumes significantly less power than the other devices on our comparison list. Primarily this is because our review unit has less powerful hardware comparatively. We measured average idle and load values of 7.8 W and 106 W respectively. This is well within the capability of the 135-W power supply, so you should have no problem charging the device when gaming.
| Off / Standby | |
| Idle | |
| Load |
|
Key:
min: | |
| Lenovo Legion Y520-15IKBA-80WY001VGE i5-7300HQ, Radeon RX 560 (Laptop), Seagate Mobile HDD 1TB ST1000LM035, IPS, 1920x1080, 15.6" | Alienware 13 R3 (i5-7300HQ, GTX 1050 Ti) i5-7300HQ, GeForce GTX 1050 Ti Mobile, Samsung PM961 MZVLW256HEHP, IPS, 1920x1080, 13.3" | Schenker XMG Apex 15 i7-8700, GeForce GTX 1060 Mobile, Samsung SSD 960 Evo 250GB m.2 NVMe, IPS, 1920x1080, 15.6" | Dell Inspiron 15 7000 7577 4K i7-7700HQ, GeForce GTX 1060 Max-Q, SK hynix SC311 M.2, IPS, 3840x2160, 15.6" | Lenovo Legion Y520-15IKBN-80WK001KUS i7-7700HQ, GeForce GTX 1050 Ti Mobile, Samsung PM961 MZVLW256HEHP, IPS, 1920x1080, 15.6" | Average AMD Radeon RX 560 (Laptop) | Average of class Gaming | |
|---|---|---|---|---|---|---|---|
| Power Consumption | -25% | -48% | -17% | -23% | -12% | -139% | |
| Idle Minimum * (Watt) | 4.7 | 6.6 -40% | 7 -49% | 5.5 -17% | 8.5 -81% | 7.3 ? -55% | 13.2 ? -181% |
| Idle Average * (Watt) | 7.8 | 9.5 -22% | 10 -28% | 10.5 -35% | 9.1 -17% | 8.65 ? -11% | 18.9 ? -142% |
| Idle Maximum * (Watt) | 8.4 | 12.7 -51% | 14 -67% | 10.9 -30% | 9.7 -15% | 9.55 ? -14% | 24.3 ? -189% |
| Load Average * (Watt) | 76.5 | 64 16% | 114 -49% | 72 6% | 79.9 -4% | 69.3 ? 9% | 108 ? -41% |
| Witcher 3 ultra * (Watt) | 93 | 105 -13% | 131 -41% | 97.4 -5% | 97.7 -5% | ||
| Load Maximum * (Watt) | 106 | 146.6 -38% | 164 -55% | 130.4 -23% | 121.5 -15% | 96.4 ? 9% | 254 ? -140% |
* ... smaller is better
Battery Life
The Y520-15IKBA has acceptable battery life. Our test device lasted five hours and thirty-three minutes during our practical Wi-Fi test, during which we run a script that simulates the load required to render websites. This puts the Y520-15IKBA 27% ahead of the class average and 28% ahead of its powerful Y520 sibling. By contrast, the Alienware 13 R3 lasted 38% longer at over seven and a half hours.
| Lenovo Legion Y520-15IKBA-80WY001VGE i5-7300HQ, Radeon RX 560 (Laptop), 45 Wh | Alienware 13 R3 (i5-7300HQ, GTX 1050 Ti) i5-7300HQ, GeForce GTX 1050 Ti Mobile, 76 Wh | Schenker XMG Apex 15 i7-8700, GeForce GTX 1060 Mobile, 62 Wh | Dell Inspiron 15 7000 7577 4K i7-7700HQ, GeForce GTX 1060 Max-Q, 56 Wh | Lenovo Legion Y520-15IKBN-80WK001KUS i7-7700HQ, GeForce GTX 1050 Ti Mobile, 45 Wh | Average of class Gaming | |
|---|---|---|---|---|---|---|
| Battery runtime | ||||||
| WiFi v1.3 (h) | 5.6 | 7.7 38% | 5.6 0% | 5.4 -4% | 4 -29% | 7.02 ? 25% |
Verdict
Pros
Cons
The Lenovo Legion Y520-15IKBA is a viable gaming notebook that is useful outside of just playing games. At just over €700 (~$817), the device is a good choice for those on a tight budget.
The Lenovo Legion Y520-15IKBA is a gaming notebook that is priced competitively for the performance it offers. Lenovo has compromised on some components though to keep the price around €700 (~$817).
Lenovo’s compromises are noticeable. Both Wi-Fi and system performance suffer from cheap components. This is especially the case with the HDD, which considerably slows the system down compared with the performance from an SSD. Fortunately, the Y520-15IKBA is easy to maintain, so an SSD or better Wi-Fi module could easily be retrofitted.
Lenovo Legion Y520-15IKBA-80WY001VGE
- 05/17/2018 v6 (old)
Mike Wobker
Price comparison

