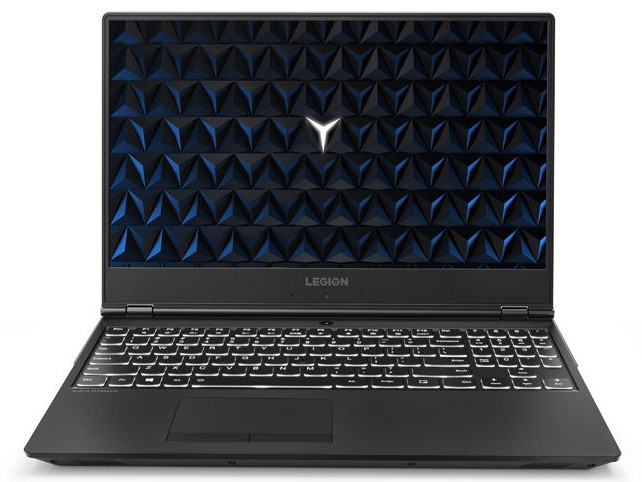
Lenovo Legion Y530 (i7-8750H, GTX1060) Laptop Review

The Lenovo Legion Y530 turned out to be a powerful gaming laptop in our previous review, which had no problems maintaining its performance even for prolonged periods. The few drawbacks mainly focused around the port selection, the slow SSD, and the limited color gamut of the display.
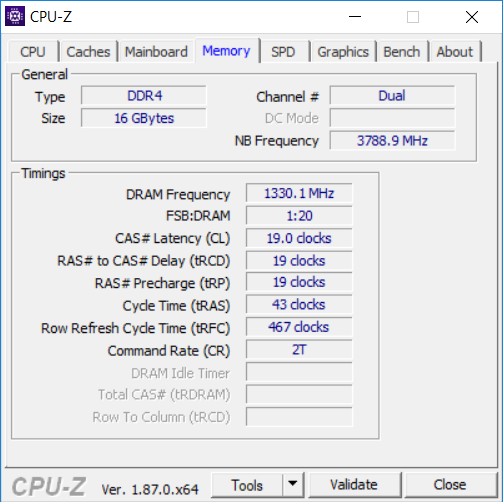
The case is still the same, so potential buyers still have to live without a card reader and both the screen as well as the SSD look better on paper. The performance has also increased thanks to the Intel Core i7-8750H CPU in combination with the Nvidia GeForce GTX 1060 and 16 GB of dual-channel memory. Data can be stored on either a 256 GB SSD or on a 2 TB mechanical hard drive.
We will obviously compare the Legion Y530 with the GTX 1050 Ti SKU and other gaming laptops in this segment. Our comparison group includes the Medion Erazer P6705, HP's Pavilion Gaming 15, the MSI P65 Creator 8RF, Razer's Blade 15, and the Lenovo Legion Y7000.
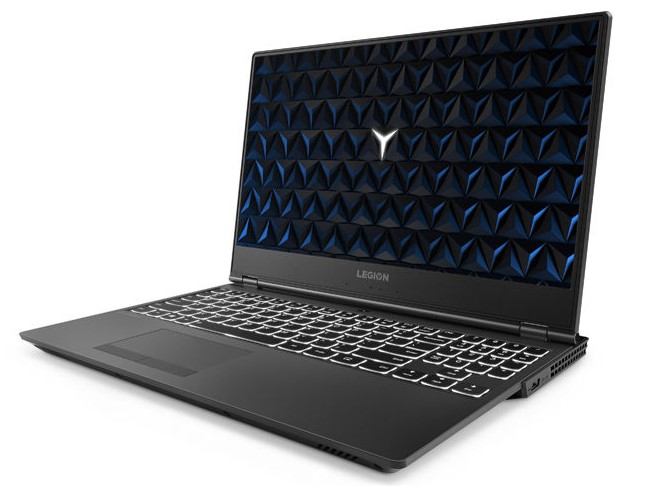
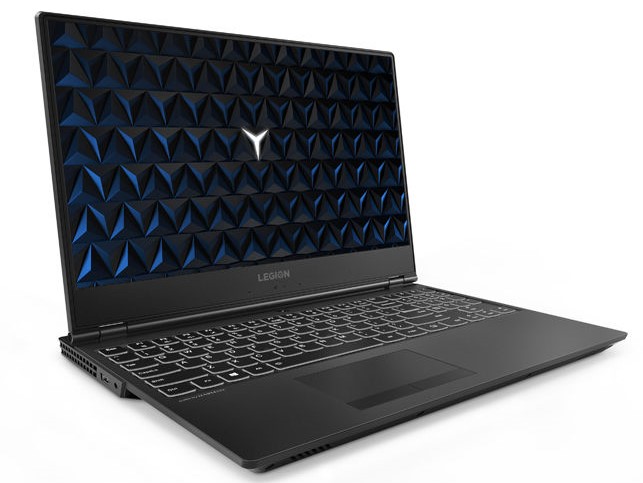
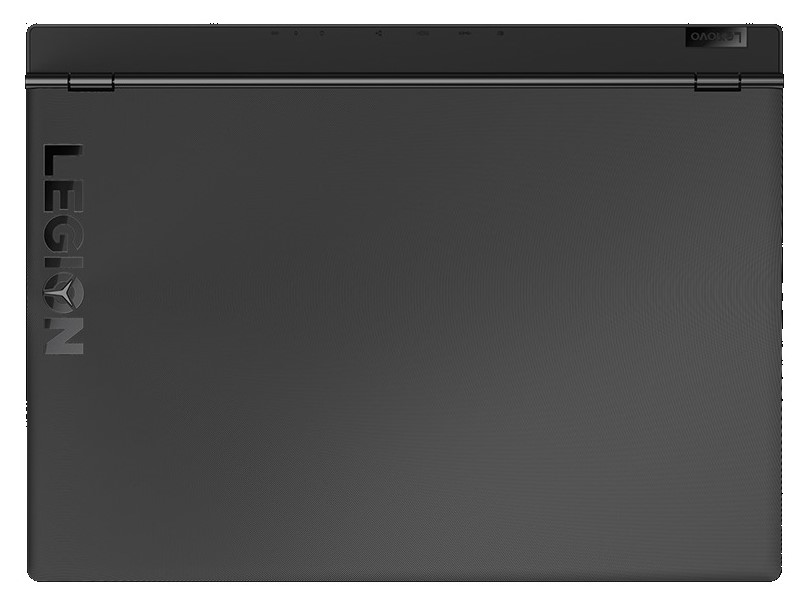
Case - Gaming laptop with bezel-less design
The case of the Lenovo Legion Y530 has not changed, so we recommend our previous review of the base model of the Legion Y530 (Core i5-8300H, GTX 1050 Ti) for a more detailed description of the gaming laptop.
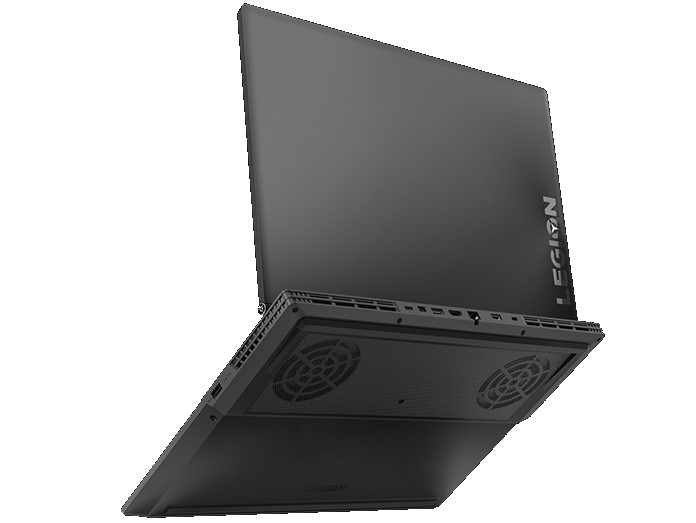
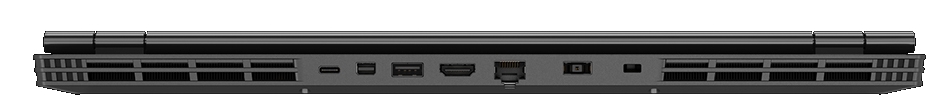
Connectivity - Lenovo notebook with USB Type-C
The Lenovo Legion Y530 offers a sufficient number of ports, which are primarily located at the rear of the gaming laptop. This leaves plenty of space for an external mouse on both sides of the device. Lenovo's laptop does not stand out from the competition in this section, except for the Mini-DisplayPort.


Communication
The Lenovo Legion Y530 can establish wireless connections via Bluetooth 4.1 and Wi-Fi according to the standards 802.11 a/b/g/n/ac. However, we determined mediocre transfer rates of just 293 Mbps receiving and 144 Mbps sending, respectively, in our test. This means that the Y530 is at the bottom of our comparison group and well-below the average for this segment.
Comparison to the base model of the Lenovo Legion Y530 (Core i5-8300H, GTX 1050 Ti) in particular shows that the manufacturer has used a significantly slower WLAN chip for this SKU.
| Networking | |
| iperf3 transmit AX12 | |
| HP Pavilion Gaming 15-cx0003ng | |
| Razer Blade 15 Base Model | |
| Lenovo Legion Y7000P-1060 | |
| Medion Erazer P6705-MD61131 | |
| Lenovo Legion Y530-15ICH | |
| Lenovo Legion Y530-15ICH | |
| iperf3 receive AX12 | |
| Medion Erazer P6705-MD61131 | |
| Razer Blade 15 Base Model | |
| Lenovo Legion Y530-15ICH | |
| Lenovo Legion Y7000P-1060 | |
| HP Pavilion Gaming 15-cx0003ng | |
| MSI P65 8RF-451 - Creator | |
| Lenovo Legion Y530-15ICH | |
Accessories
The box of the Lenovo Legion Y530 includes just the 170-W power adapter.
Maintenance
We recommend our review of the Lenovo Legion Y530 (Core i5-8300H, GTX 1050 Ti) for a description of the maintenance options.
Warranty
Lenovo offers a 24-month warranty for the Legion Y530. Please see our Guarantees, Return policies and Warranties article for country-specific information.
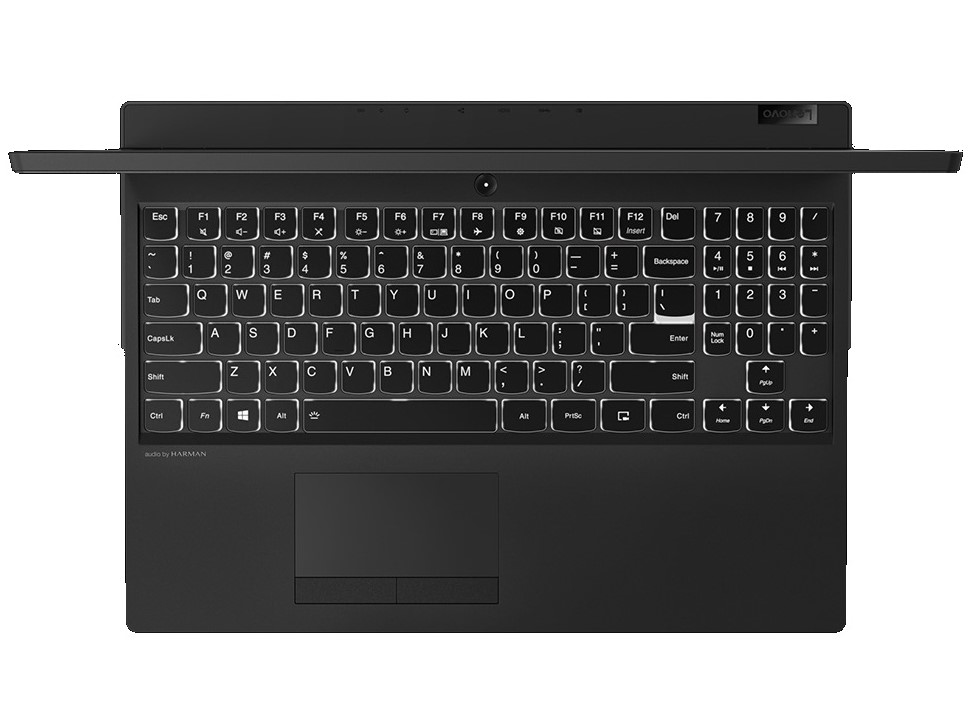
Input Devices - Good gaming keyboard with illumination
The input devices are identical to those of the Lenovo Legion Y530 (Core i5-8300H, GTX 1050 Ti) that we reviewed previously.
Display - Lenovo Legion Y530 with 144 Hz display

The Lenovo Legion Y530 is equipped with a 15.6-inch IPS panel with the Full HD resolution (1920x1080 pixels) and 144 Hz refresh rate. We determined an average luminance of 284 cd/m² for the gaming laptop, which is slightly higher compared to other rivals. The brightness distribution, however, is slightly below average at 83 percent.
Lenovo also offers the Y530 with a 60 Hz screen.
| |||||||||||||||||||||||||
Brightness Distribution: 83 %
Center on Battery: 308 cd/m²
Contrast: 587:1 (Black: 0.52 cd/m²)
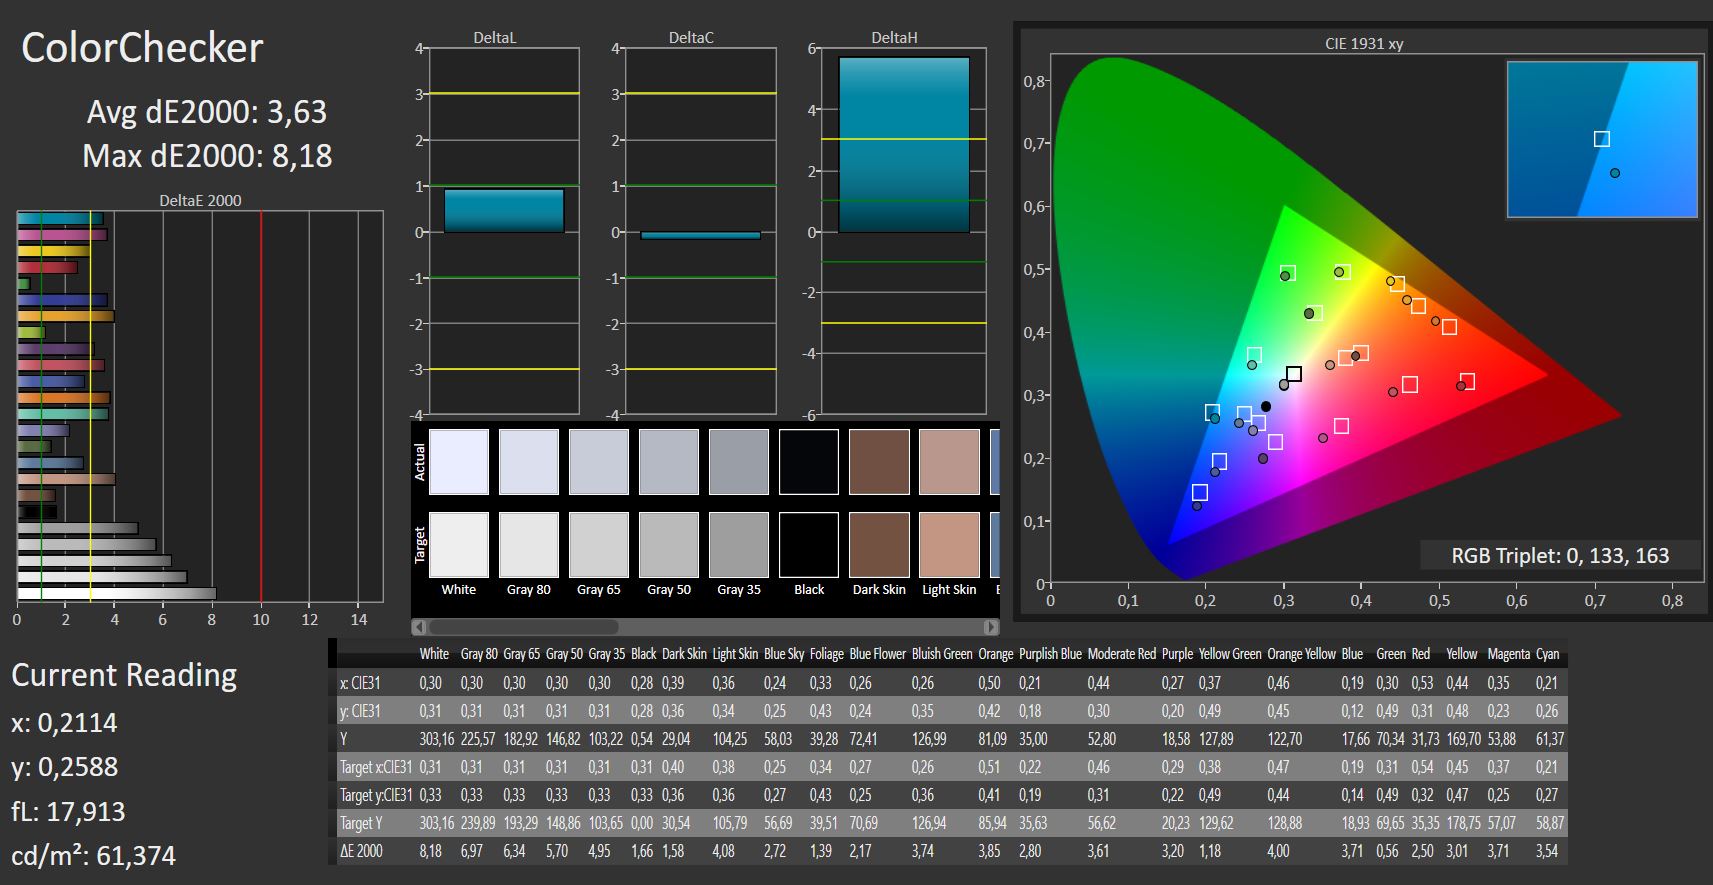
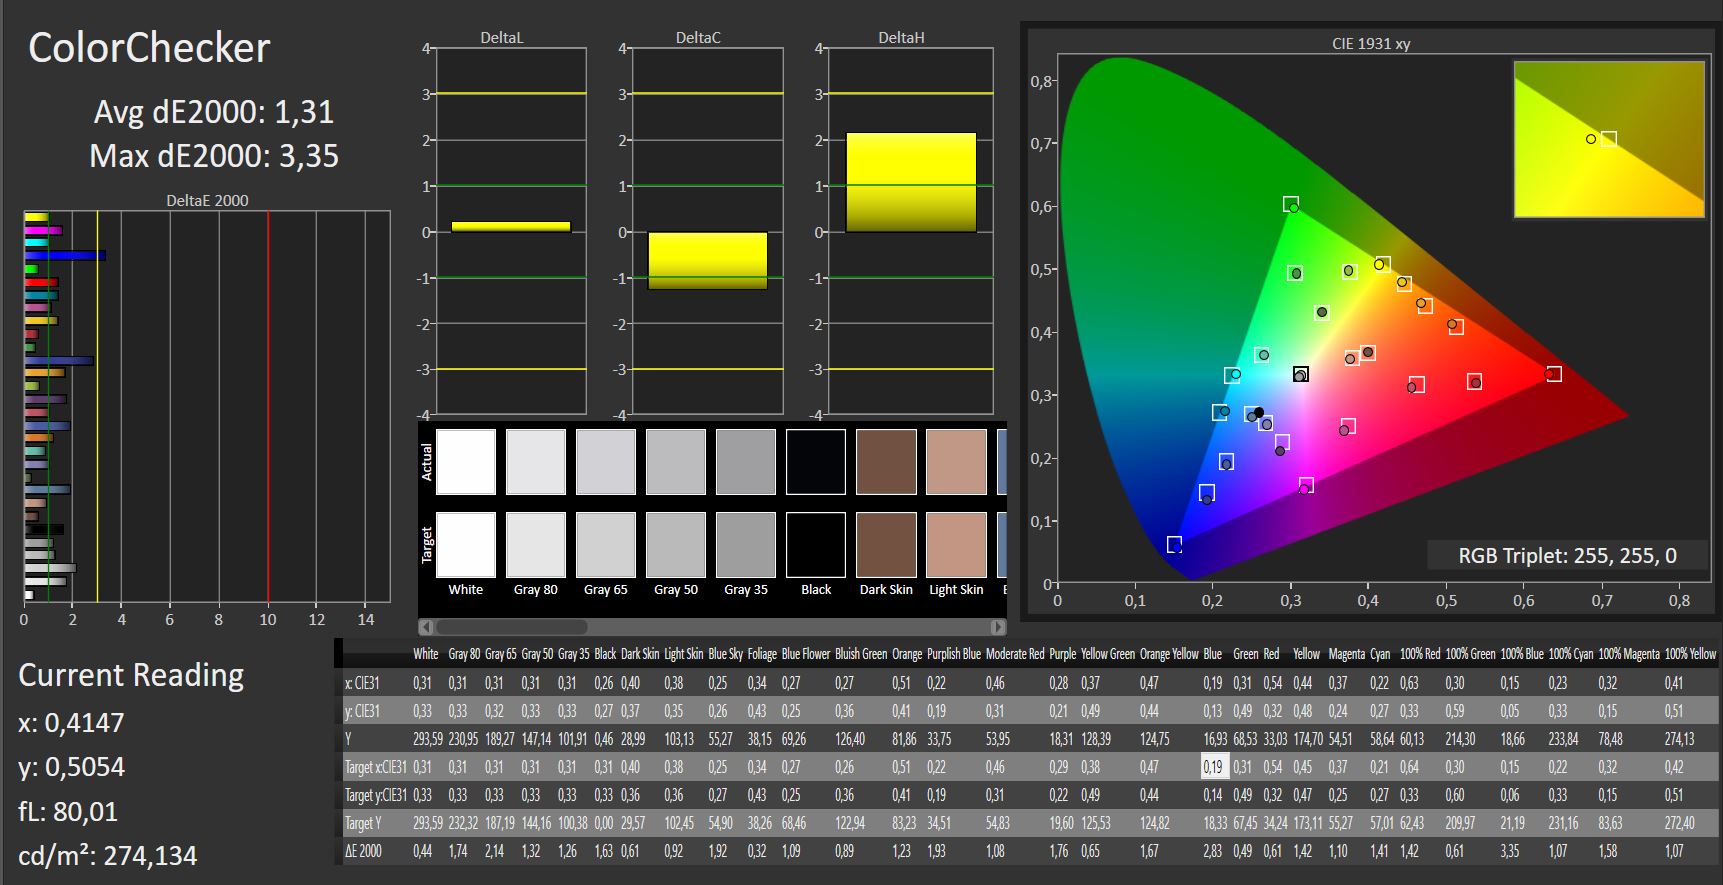
ΔE ColorChecker Calman: 3.63 | ∀{0.5-29.43 Ø4.73}
calibrated: 1.31
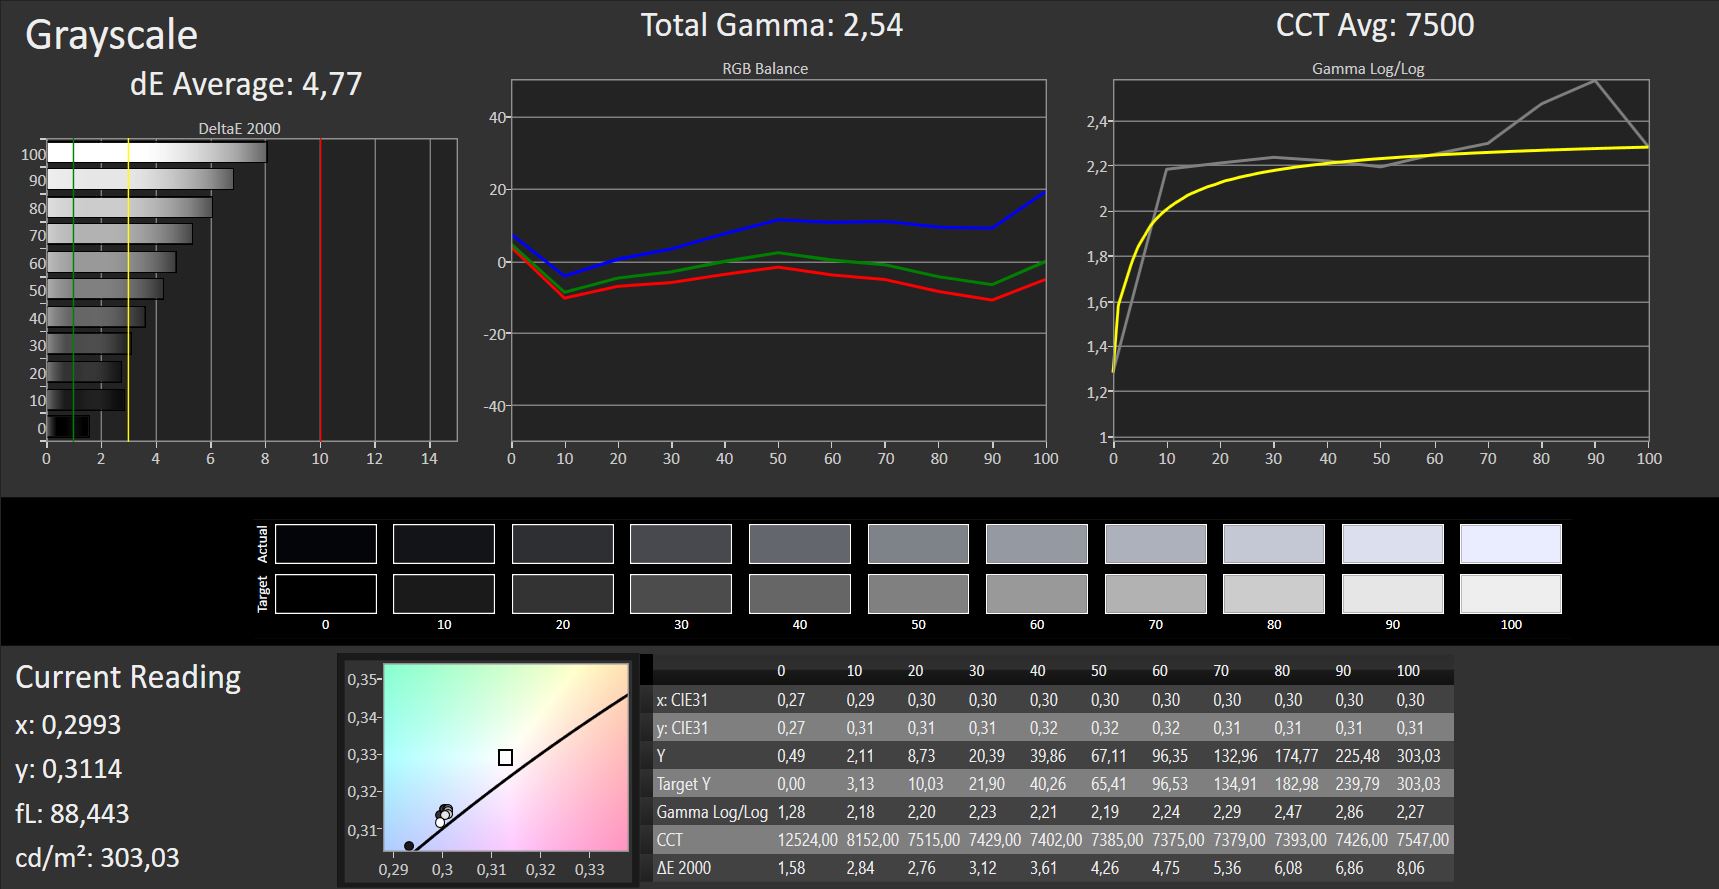
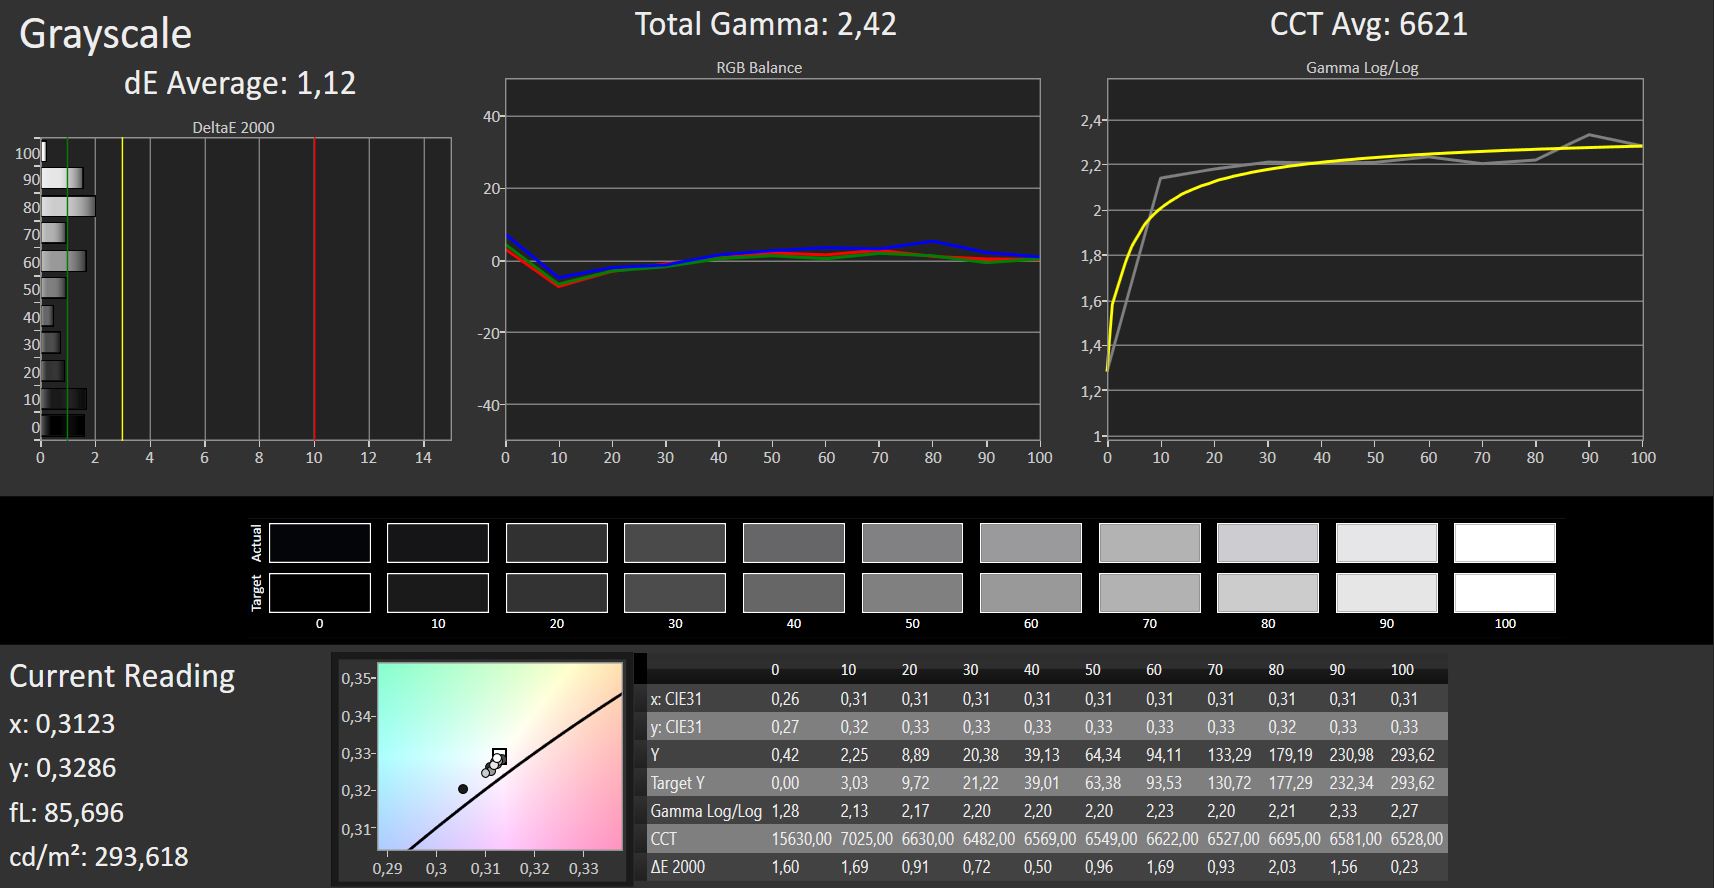
ΔE Greyscale Calman: 4.77 | ∀{0.09-98 Ø4.97}
93% sRGB (Argyll 1.6.3 3D)
59% AdobeRGB 1998 (Argyll 1.6.3 3D)
63.8% AdobeRGB 1998 (Argyll 3D)
93% sRGB (Argyll 3D)
62.5% Display P3 (Argyll 3D)
Gamma: 2.54
CCT: 7500 K
| Lenovo Legion Y530-15ICH LG Display LP156WFG-SPB2, , 1920x1080, 15.6" | HP Pavilion Gaming 15-cx0003ng BOE07A1, , 1920x1080, 15.6" | Lenovo Legion Y7000P-1060 BOE NV156FHM-N61, , 1920x1080, 15.6" | Medion Erazer P6705-MD61131 AU Optronics B156HTN03.8 (AUO38ED), , 1920x1080, 15.6" | MSI P65 8RF-451 - Creator AU Optronics B156HAN08.0 (AUO80ED), , 1920x1080, 15.6" | Razer Blade 15 Base Model BOE NV156FHM-N61, , 1920x1080, 15.6" | Lenovo Legion Y530-15ICH B156HAN02.1, , 1920x1080, 15.6" | |
|---|---|---|---|---|---|---|---|
| Display | -36% | -1% | -41% | 2% | -1% | -38% | |
| Display P3 Coverage (%) | 62.5 | 39.72 -36% | 66.1 6% | 36.4 -42% | 65.1 4% | 66.3 6% | 38.31 -39% |
| sRGB Coverage (%) | 93 | 59.3 -36% | 86.4 -7% | 54.8 -41% | 91.1 -2% | 86.6 -7% | 57.3 -38% |
| AdobeRGB 1998 Coverage (%) | 63.8 | 41.04 -36% | 63.1 -1% | 37.61 -41% | 65.9 3% | 63.3 -1% | 39.58 -38% |
| Response Times | -198% | -206% | -122% | -4% | -191% | -193% | |
| Response Time Grey 50% / Grey 80% * (ms) | 15 ? | 47 ? -213% | 42.8 ? -185% | 44.8 ? -199% | 16 ? -7% | 39.2 ? -161% | 43.6 ? -191% |
| Response Time Black / White * (ms) | 11 ? | 31 ? -182% | 36 ? -227% | 16 ? -45% | 11 ? -0% | 35.2 ? -220% | 32.4 ? -195% |
| PWM Frequency (Hz) | 208 ? | 21740 ? | 21190 ? | ||||
| Screen | 7% | -17% | -71% | -5% | -5% | -36% | |
| Brightness middle (cd/m²) | 305 | 241 -21% | 312.9 3% | 200 -34% | 235 -23% | 273.6 -10% | 282.8 -7% |
| Brightness (cd/m²) | 284 | 236 -17% | 296 4% | 186 -35% | 235 -17% | 262 -8% | 264 -7% |
| Brightness Distribution (%) | 83 | 75 -10% | 88 6% | 85 2% | 85 2% | 86 4% | 88 6% |
| Black Level * (cd/m²) | 0.52 | 0.15 71% | 0.37 29% | 0.43 17% | 0.22 58% | 0.3 42% | 0.42 19% |
| Contrast (:1) | 587 | 1607 174% | 846 44% | 465 -21% | 1068 82% | 912 55% | 673 15% |
| Colorchecker dE 2000 * | 3.63 | 4.85 -34% | 5.49 -51% | 11.39 -214% | 2.82 22% | 3.22 11% | 4.93 -36% |
| Colorchecker dE 2000 max. * | 8.18 | 8.82 -8% | 8.78 -7% | 19.36 -137% | 4.82 41% | 7.61 7% | 17.65 -116% |
| Colorchecker dE 2000 calibrated * | 1.31 | 3.99 -205% | 3.05 -133% | 4.88 -273% | 4.1 -213% | 4.07 -211% | |
| Greyscale dE 2000 * | 4.77 | 5.15 -8% | 4.7 1% | 11.73 -146% | 2.32 51% | 1.4 71% | 3.8 20% |
| Gamma | 2.54 87% | 2.49 88% | 2.29 96% | 1.97 112% | 2.49 88% | 2.24 98% | 2.449 90% |
| CCT | 7500 87% | 7042 92% | 6779 96% | 12614 52% | 6310 103% | 6636 98% | 6112 106% |
| Color Space (Percent of AdobeRGB 1998) (%) | 59 | 38 -36% | 56.3 -5% | 35 -41% | 59 0% | 56.4 -4% | 36 -39% |
| Color Space (Percent of sRGB) (%) | 93 | 59 -37% | 86.1 -7% | 55 -41% | 92 -1% | 86.2 -7% | 57 -39% |
| Total Average (Program / Settings) | -76% /
-29% | -75% /
-38% | -78% /
-72% | -2% /
-4% | -66% /
-27% | -89% /
-56% |
* ... smaller is better
Further measurements with an X-Rite colorimeter reveal a mediocre contrast ratio of 587:1 with an increased black value of 0.52 cd/m². Comparable gaming laptops are often much better in this respect, so our test model is only on the penultimate place within our comparison group. The color gamut on the other hand is superior to the rivals at 93 percent sRGB and 59 percent AdobeRGB.
Our CalMAN analysis also shows a distinct blue cast ex-works, which can be removed with our calibration. The according ICC file is attached in the display box above.

The brightness of the panel is sufficient outdoors as long as you use the Lenovo Legion Y530 in the shade. You can still see picture contents on cloudy days, but you should avoid direct sunlight.
Display Response Times
| ↔ Response Time Black to White | ||
|---|---|---|
| 11 ms ... rise ↗ and fall ↘ combined | ↗ 7 ms rise | 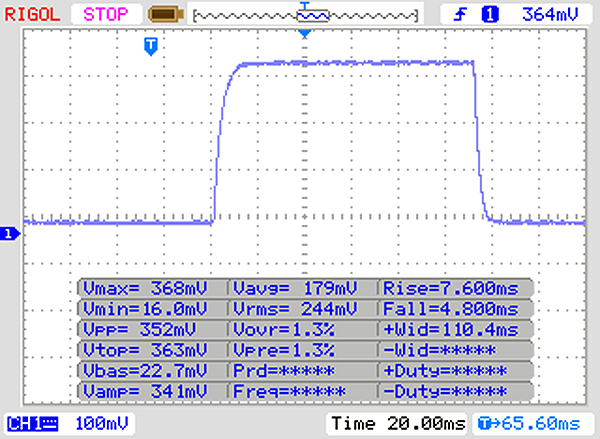 |
| ↘ 4 ms fall | ||
| The screen shows good response rates in our tests, but may be too slow for competitive gamers. In comparison, all tested devices range from 0.1 (minimum) to 240 (maximum) ms. » 29 % of all devices are better. This means that the measured response time is better than the average of all tested devices (19.9 ms). | ||
| ↔ Response Time 50% Grey to 80% Grey | ||
| 15 ms ... rise ↗ and fall ↘ combined | ↗ 8 ms rise | 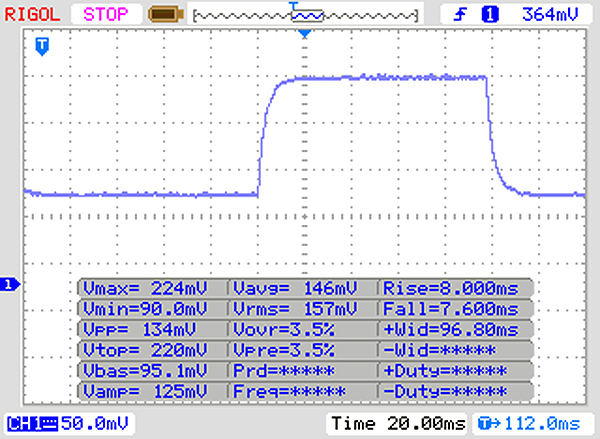 |
| ↘ 7 ms fall | ||
| The screen shows good response rates in our tests, but may be too slow for competitive gamers. In comparison, all tested devices range from 0.165 (minimum) to 636 (maximum) ms. » 29 % of all devices are better. This means that the measured response time is better than the average of all tested devices (31.1 ms). | ||
Screen Flickering / PWM (Pulse-Width Modulation)
| Screen flickering / PWM not detected | 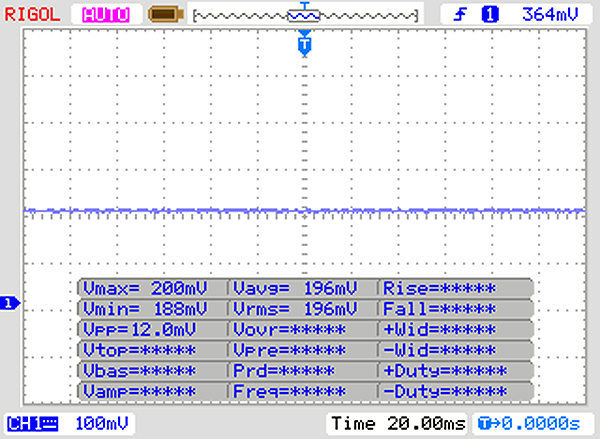 | ||
In comparison: 52 % of all tested devices do not use PWM to dim the display. If PWM was detected, an average of 7798 (minimum: 5 - maximum: 343500) Hz was measured. | |||
The IPS screen of the Legion Y530 offers wide viewing angles. You can see the contents from almost every angle without picture or color distortions.

Performance - Good system performance for Lenovo's laptop
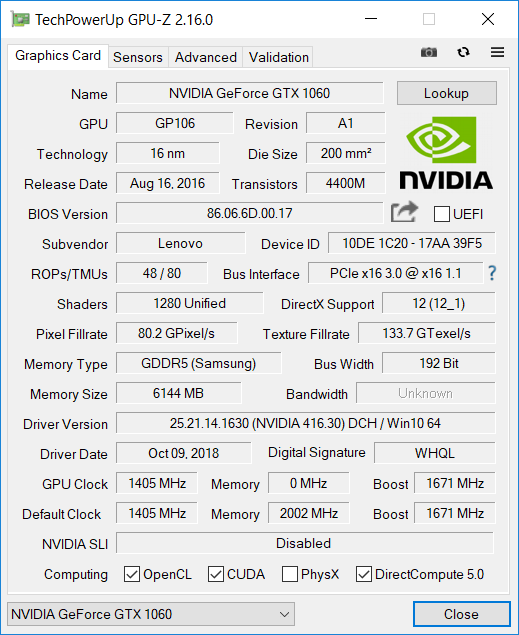
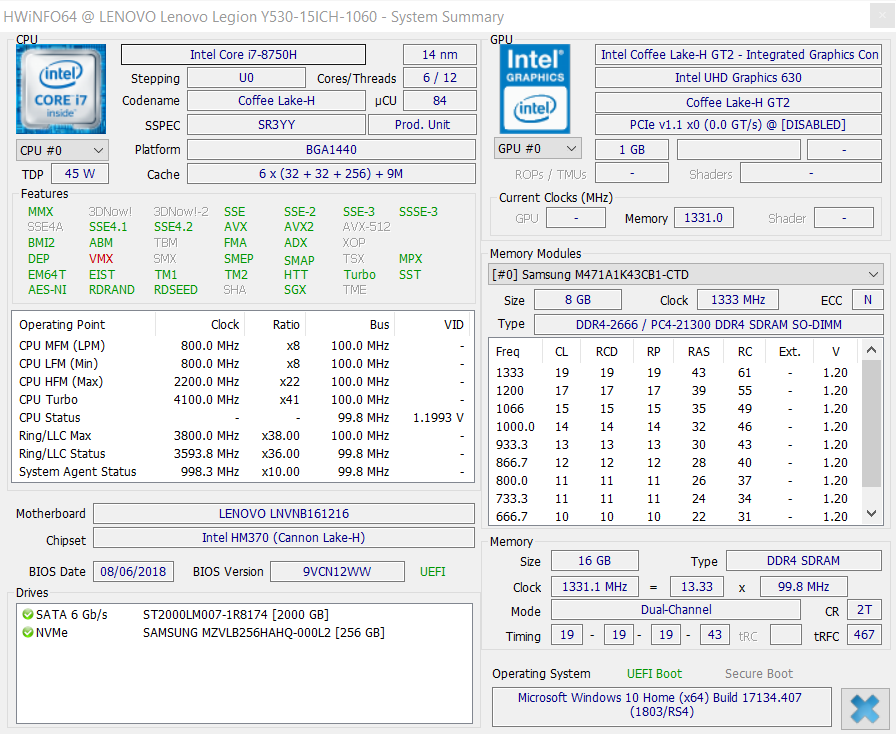
We review the Lenovo Legion Y530 with an Intel Core i7-8750H CPU and Nvidia GeForce GTX 1060 GPU. The memory equipment consists of 16 GB of dual-channel RAM, a 256 GB SSD, and a 2 TB HDD. This configuration should be powerful enough for smooth frame rates at high details in the majority of modern games.
The base model of the Legion Y530 with the Intel Core i5-8300H and GeForce GTX 1050 Ti that we reviewed before is more affordable.
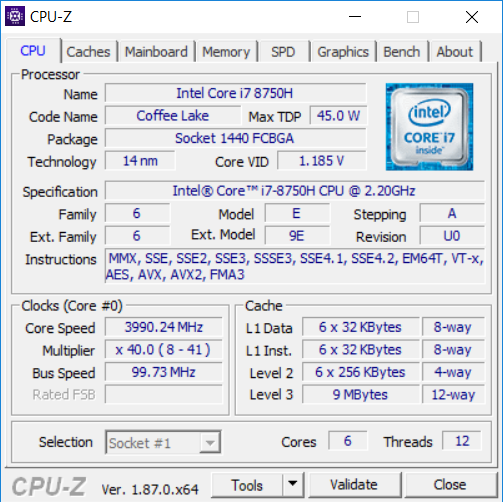
Processor
The Intel Core i7-8750H is a hexa-core processor, which was released at the beginning of 2018. It runs at a base frequency of 2.2 GHz with a maximum Turbo clock of up to 4.1 GHz and can execute up to 12 threads simultaneously. How long it runs at these higher clocks depends mainly on the cooling performance. The power consumption is comparatively high at 45 W, but can be reduced by the manufacturer all the way down to 35 W (cTDP down).
Our Cinebench Multi loop shows that Lenovo utilizes the potential of the Core i7-8750H very well. Comparable laptops with the same CPU are much slower than the Legion Y530. We see a performance drop of around 10 percent after a short while, but this is still better compared to the rivals with the same CPU.
The good performance of the Lenovo Legion Y530 also shows in the multi-core benchmark, where the biggest rival is the Lenovo Legion Y7000. The single-core performance is better on the rivals Razer Blade 15 and MSI P65 Creator 8RF.
System Performance
The Lenovo Legion Y530 secures the second spot in our system performance benchmarks. Its score is above average on the PCMark 10 test, but is still beaten by Lenovo's own Legion Y7000. The Y530 is also on par with comparable devices in PCMark 8, even though the MSI P65 Creator 8RF is slightly ahead of the gaming laptop from Lenovo.
You can compare the performance of the Legion Y530 with other devices in our tech section.
| PCMark 8 Home Score Accelerated v2 | 4440 points | |
| PCMark 8 Work Score Accelerated v2 | 5543 points | |
| PCMark 10 Score | 5125 points | |
Help | ||
Storage Devices
The slow SSD was one of the biggest drawbacks of the Lenovo Legion Y530 (Core i5-8300H, GTX 1050 Ti). Lenovo has now fixed the problem and the drive in our test system manages good write and read transfer rates on par with comparable gaming notebooks. You also get a 2 TB hard drive in addition to the 256 GB SSD.
See our comprehensive SSD/HDD list for more comparisons.
| Lenovo Legion Y530-15ICH Samsung SSD PM981 MZVLB256HAHQ | HP Pavilion Gaming 15-cx0003ng Intel Optane 16 GB MEMPEK1J016GAH + HGST HTS721010A9E630 1 TB HDD | Lenovo Legion Y7000P-1060 Samsung SSD PM981 MZVLB256HAHQ | Medion Erazer P6705-MD61131 Samsung SSD PM981 MZVLB256HAHQ | MSI P65 8RF-451 - Creator Kingston RBUSNS8154P3512GJ | Razer Blade 15 Base Model Samsung SSD PM981 MZVLB256HAHQ | Lenovo Legion Y530-15ICH Toshiba KBG30ZMT128G | Average Samsung SSD PM981 MZVLB256HAHQ | |
|---|---|---|---|---|---|---|---|---|
| CrystalDiskMark 5.2 / 6 | -31% | -8% | 11% | -16% | 9% | -46% | 58% | |
| Write 4K (MB/s) | 108.9 | 59.2 -46% | 92.3 -15% | 107 -2% | 89.2 -18% | 112.5 3% | 71.8 -34% | 116.1 ? 7% |
| Read 4K (MB/s) | 40.23 | 91.3 127% | 39.04 -3% | 39.91 -1% | 34.36 -15% | 43.09 7% | 41.03 2% | 189.5 ? 371% |
| Write Seq (MB/s) | 1390 | 158.3 -89% | 1218 -12% | 1439 4% | 949 -32% | 1450 4% | 349 -75% | 1409 ? 1% |
| Read Seq (MB/s) | 964 | 880 -9% | 755 -22% | 2011 109% | 899 -7% | 1392 44% | 736 -24% | 1624 ? 68% |
| Write 4K Q32T1 (MB/s) | 314.2 | 161.8 -49% | 280.7 -11% | 282.1 -10% | 371.4 18% | 356.1 13% | 105.3 -66% | 360 ? 15% |
| Read 4K Q32T1 (MB/s) | 369.2 | 286.5 -22% | 328 -11% | 326.6 -12% | 399 8% | 406.9 10% | 308 -17% | 396 ? 7% |
| Write Seq Q32T1 (MB/s) | 1506 | 159.8 -89% | 1698 13% | 1441 -4% | 1035 -31% | 1451 -4% | 151.4 -90% | 1492 ? -1% |
| Read Seq Q32T1 (MB/s) | 3446 | 929 -73% | 3430 0% | 3516 2% | 1603 -53% | 3272 -5% | 1262 -63% | 3313 ? -4% |
| Write 4K Q8T8 (MB/s) | 760 | 1152 ? | ||||||
| Read 4K Q8T8 (MB/s) | 811 | 736 ? | ||||||
| AS SSD | -1631% | 60% | 19% | 11% | 58% | -160% | 50% | |
| Seq Read (MB/s) | 1808 | 854 -53% | 864 -52% | 2724 51% | 850 -53% | 1803 0% | 1231 -32% | 2032 ? 12% |
| Seq Write (MB/s) | 1429 | 147 -90% | 1646 15% | 1365 -4% | 869 -39% | 1367 -4% | 131.6 -91% | 1339 ? -6% |
| 4K Read (MB/s) | 46.1 | 105.1 128% | 32.4 -30% | 46.14 0% | 36.43 -21% | 40.75 -12% | 38.71 -16% | 46.1 ? 0% |
| 4K Write (MB/s) | 97 | 59.5 -39% | 88 -9% | 102.6 6% | 84.4 -13% | 93 -4% | 35.74 -63% | 107.4 ? 11% |
| 4K-64 Read (MB/s) | 536 | 42.09 -92% | 770 44% | 567 6% | 839 57% | 749 40% | 335.3 -37% | 712 ? 33% |
| 4K-64 Write (MB/s) | 273.6 | 137.3 -50% | 1392 409% | 459.8 68% | 602 120% | 1270 364% | 78.9 -71% | 999 ? 265% |
| Access Time Read * (ms) | 0.085 | 14.99 -17535% | 0.103 -21% | 0.08 6% | 0.104 -22% | 0.113 -33% | 0.626 -636% | 0.07076 ? 17% |
| Access Time Write * (ms) | 0.038 | 0.043 -13% | 0.044 -16% | 0.037 3% | 0.044 -16% | 0.04 -5% | 0.287 -655% | 0.04352 ? -15% |
| Score Read (Points) | 763 | 233 -69% | 888 16% | 886 16% | 960 26% | 970 27% | 497 -35% | 961 ? 26% |
| Score Write (Points) | 514 | 211 -59% | 1644 220% | 699 36% | 773 50% | 1499 192% | 128 -75% | 1240 ? 141% |
| Score Total (Points) | 1663 | 577 -65% | 3032 82% | 1983 19% | 2233 34% | 2952 78% | 838 -50% | 2671 ? 61% |
| Copy ISO MB/s (MB/s) | 110.1 | 1677 | 840 | 1892 | 1297 ? | |||
| Copy Program MB/s (MB/s) | 94.1 | 764 | 306.9 | 495.5 | 409 ? | |||
| Copy Game MB/s (MB/s) | 81.7 | 1298 | 622 | 1070 | 786 ? | |||
| Total Average (Program / Settings) | -831% /
-957% | 26% /
31% | 15% /
15% | -3% /
-0% | 34% /
38% | -103% /
-112% | 54% /
53% |
* ... smaller is better

GPU Performance
Nvidia's GeForce GTX 1060 is a powerful GPU from 2016, which manages smooth frame rates in modern games. It is equipped with 6 GB of VRAM and is still a mobile high-end graphics card. It is also available in a more efficient Max-Q version with slightly lower performance figures.
Our Legion Y530 with the GTX 1060 performs well in the 3D Marks and is only beaten by the MSI P65 Creator 8RF. More benchmark results of the Nvidia GeForce GTX 1060 are listed on our GPU benchmark page.
| 3DMark 11 - 1280x720 Performance GPU | |
| Average of class Gaming (21841 - 80022, n=108, last 2 years) | |
| MSI P65 8RF-451 - Creator | |
| Average NVIDIA GeForce GTX 1060 Mobile (12620 - 15607, n=77) | |
| Lenovo Legion Y530-15ICH | |
| Lenovo Legion Y7000P-1060 | |
| Razer Blade 15 Base Model | |
| Lenovo Legion Y530-15ICH | |
| Medion Erazer P6705-MD61131 | |
| HP Pavilion Gaming 15-cx0003ng | |
| 3DMark 11 Performance | 13743 points | |
| 3DMark Cloud Gate Standard Score | 34124 points | |
| 3DMark Fire Strike Score | 10389 points | |
Help | ||
Gaming Performance
The Lenovo Legion Y530 with the Nvidia GeForce GTX 1060 can handle any modern game with high graphics settings. We did not notice any problems in the titles we tested. "The Witcher 3" sustained test does not drop, so the performance can be maintained even during long gaming sessions.
More gaming benchmarks with the GeForce GTX 1060 are listed here.
| The Witcher 3 | |
| 1920x1080 High Graphics & Postprocessing (Nvidia HairWorks Off) | |
| Average of class Gaming (181 - 341, n=3, last 2 years) | |
| MSI P65 8RF-451 - Creator | |
| Lenovo Legion Y530-15ICH | |
| Lenovo Legion Y7000P-1060 | |
| Razer Blade 15 Base Model | |
| Average NVIDIA GeForce GTX 1060 Mobile (52.6 - 80.6, n=49) | |
| Medion Erazer P6705-MD61131 | |
| HP Pavilion Gaming 15-cx0003ng | |
| 1920x1080 Ultra Graphics & Postprocessing (HBAO+) | |
| Average of class Gaming (95 - 240, n=8, last 2 years) | |
| MSI P65 8RF-451 - Creator | |
| Lenovo Legion Y530-15ICH | |
| Average NVIDIA GeForce GTX 1060 Mobile (24 - 42.3, n=60) | |
| Razer Blade 15 Base Model | |
| Lenovo Legion Y530-15ICH | |
| Lenovo Legion Y7000P-1060 | |
| Medion Erazer P6705-MD61131 | |
| HP Pavilion Gaming 15-cx0003ng | |
| low | med. | high | ultra | |
|---|---|---|---|---|
| BioShock Infinite (2013) | 280.5 | 232.6 | 224.8 | 114.2 |
| Thief (2014) | 98.4 | 77.9 | ||
| The Witcher 3 (2015) | 78 | 41.4 | ||
| Rise of the Tomb Raider (2016) | 64.8 |
Emissions - Legion Y530 with loud fans
System Noise
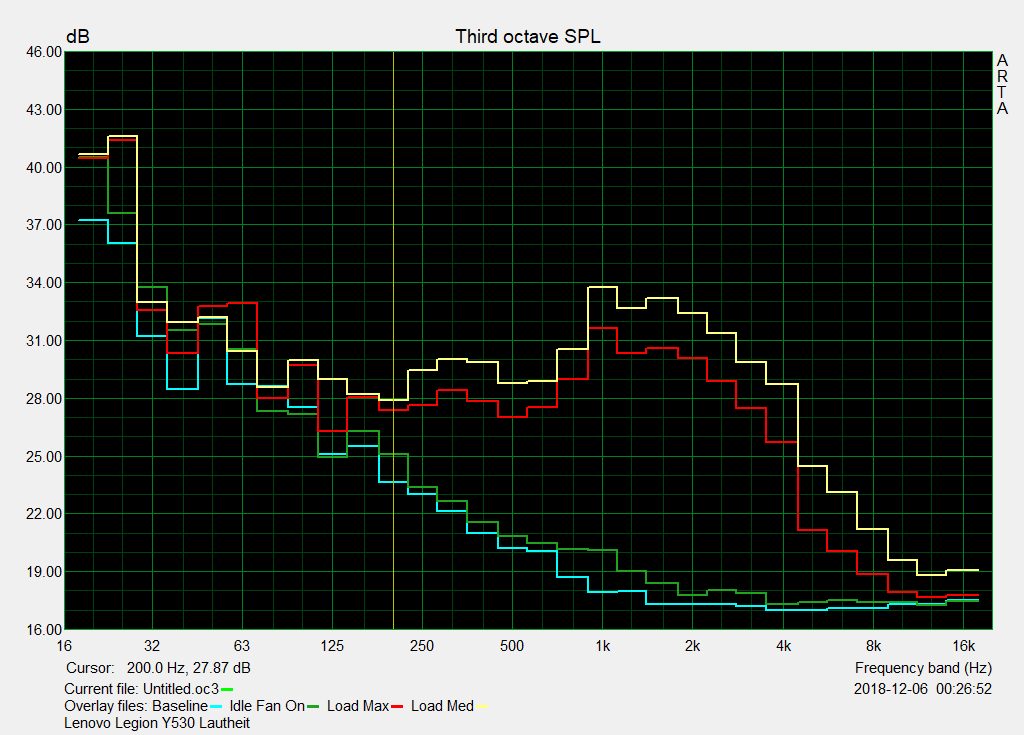
The cooling system of the Lenovo Legion Y530 worked well during our review, but the fans can be quite loud at up to 42 dB(A) under high loads. The resulting murmur is not annoying, but always audible. We therefore recommend headphones for prolonged gaming sessions.
The laptop is very quiet while idling and with light workloads, so the Y530 can also be used in quieter environments.
Noise level
| Idle |
| 30.9 / 30.9 / 31.6 dB(A) |
| HDD |
| 31.3 dB(A) |
| Load |
| 42.3 / 40 dB(A) |
 | ||
30 dB silent 40 dB(A) audible 50 dB(A) loud |
||
min: | ||
Temperature
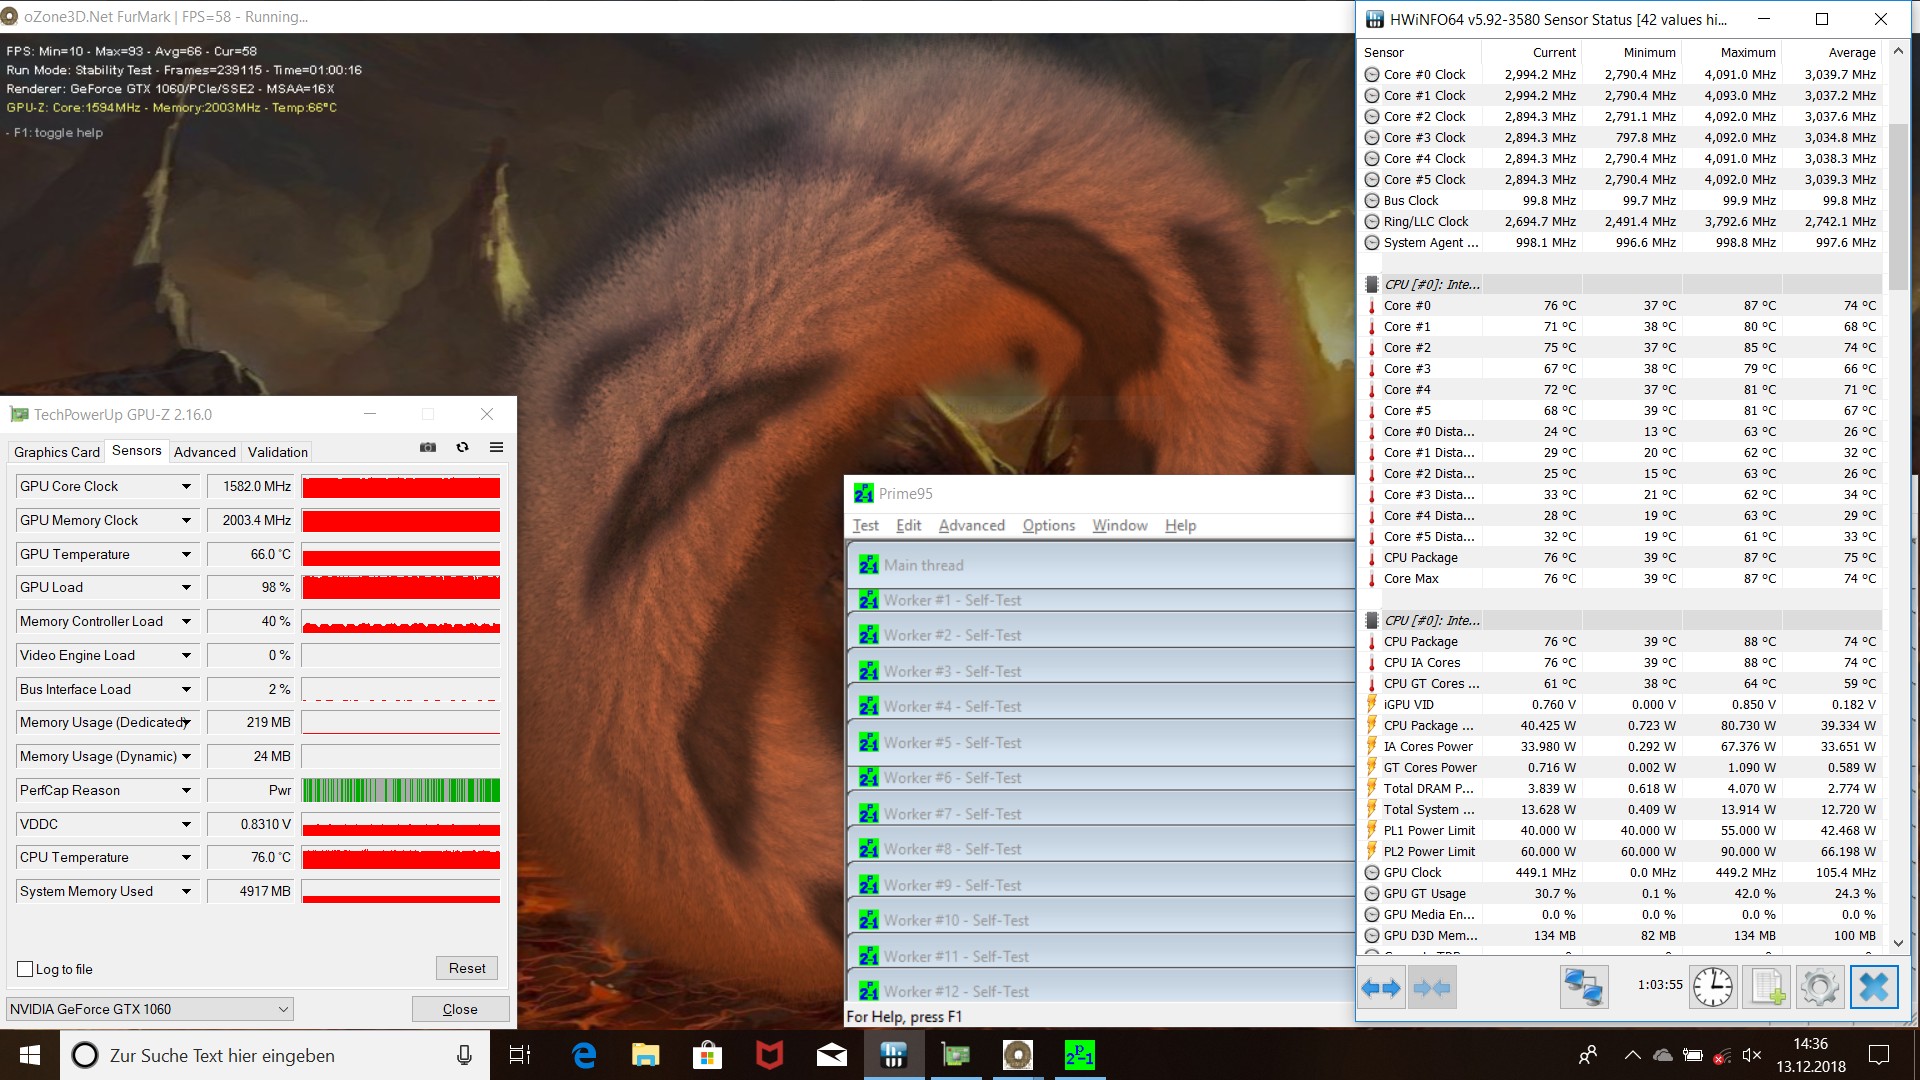
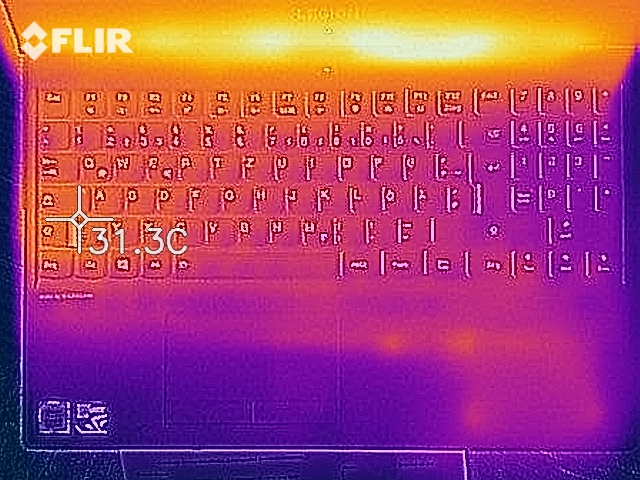
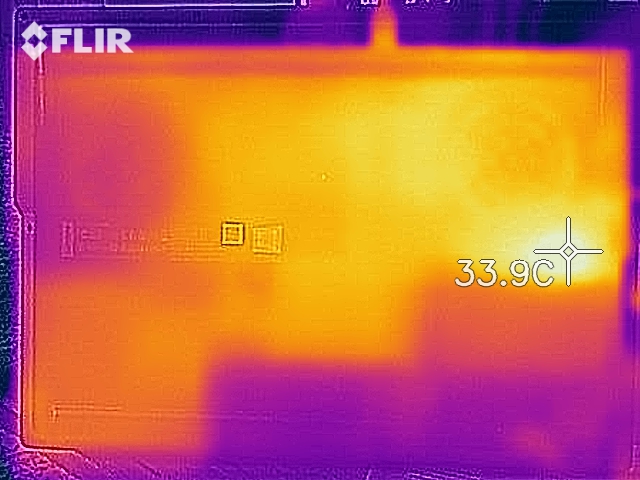
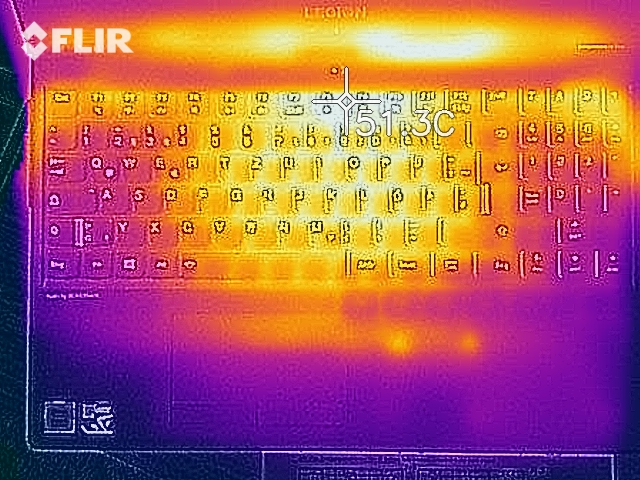
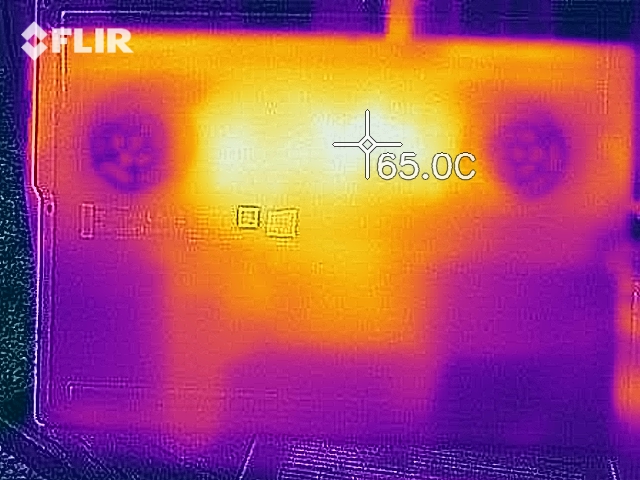
The surface temperatures of the Legion Y530 stay under 27 °C (~81 °F) while idling, but increase up to 48 °C (~118 °F) under load. You can still use the laptop without any limitations and it never feels too hot.
The core temperatures of the gaming notebook reach up to 87 °C (~189 °F) during our one-hour stress test. The CPU clock never falls below the base frequency and the performance immediately after the stress test was not reduced.
(-) The maximum temperature on the upper side is 48.4 °C / 119 F, compared to the average of 40.4 °C / 105 F, ranging from 21.2 to 68.8 °C for the class Gaming.
(-) The bottom heats up to a maximum of 48 °C / 118 F, compared to the average of 43.2 °C / 110 F
(+) In idle usage, the average temperature for the upper side is 25.8 °C / 78 F, compared to the device average of 33.9 °C / 93 F.
(+) The palmrests and touchpad are cooler than skin temperature with a maximum of 29.6 °C / 85.3 F and are therefore cool to the touch.
(±) The average temperature of the palmrest area of similar devices was 28.8 °C / 83.8 F (-0.8 °C / -1.5 F).
Speakers
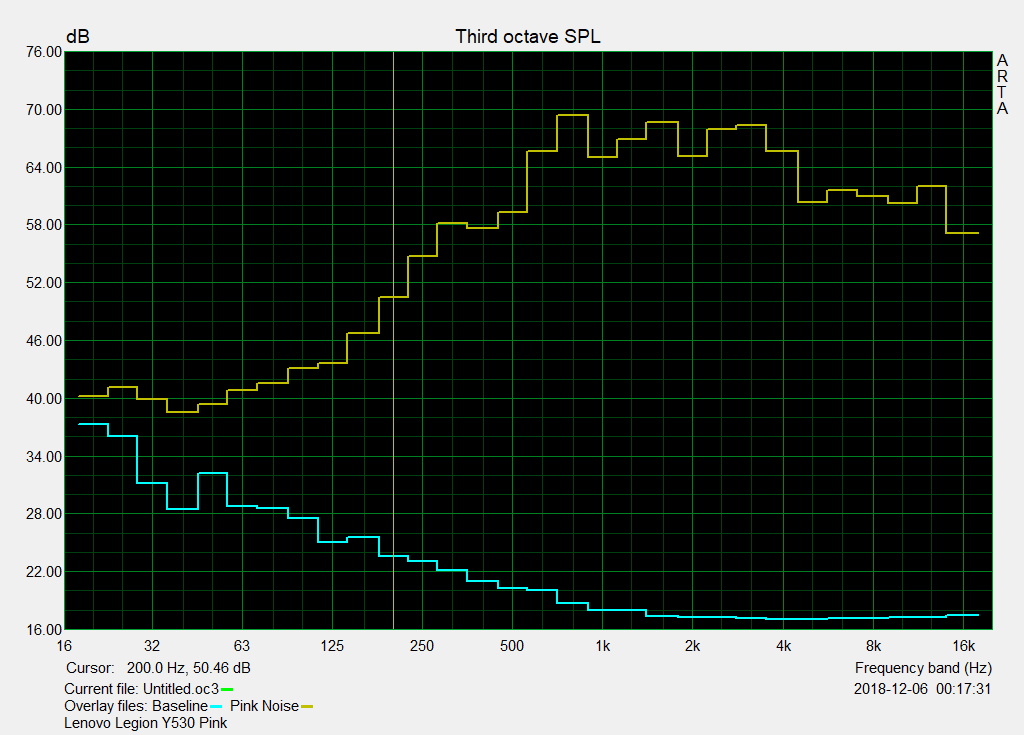
The speakers of the Lenovo Legion Y530 are not very loud, but the sound is comparatively balanced in return. There is even some bass and they are suited for the occasional playback of music or videos. We still recommend external speakers or headphones for better quality.
Lenovo Legion Y530-15ICH audio analysis
(-) | not very loud speakers (68.3 dB)
Bass 100 - 315 Hz
(±) | reduced bass - on average 11.5% lower than median
(+) | bass is linear (6.4% delta to prev. frequency)
Mids 400 - 2000 Hz
(±) | higher mids - on average 5% higher than median
(+) | mids are linear (6.9% delta to prev. frequency)
Highs 2 - 16 kHz
(+) | balanced highs - only 3% away from median
(+) | highs are linear (4.6% delta to prev. frequency)
Overall 100 - 16.000 Hz
(±) | linearity of overall sound is average (16% difference to median)
Compared to same class
» 38% of all tested devices in this class were better, 6% similar, 55% worse
» The best had a delta of 6%, average was 18%, worst was 132%
Compared to all devices tested
» 25% of all tested devices were better, 5% similar, 70% worse
» The best had a delta of 4%, average was 24%, worst was 134%
Energy Management - Gaming notebook with four-hour battery runtime
Power Consumption
Our measurements show a minimum consumption of at least 7.3 W while idling and up to 168 W under load. The results are average within its class and are on the expected level considering the performance.
The provided 170-W power adapter is sufficient for the consumption of Lenovo's gaming laptop.
| Off / Standby | |
| Idle | |
| Load |
|
Key:
min: | |
| Lenovo Legion Y530-15ICH i7-8750H, GeForce GTX 1060 Mobile, Samsung SSD PM981 MZVLB256HAHQ, IPS, 1920x1080, 15.6" | HP Pavilion Gaming 15-cx0003ng i7-8750H, GeForce GTX 1050 Ti Mobile, Intel Optane 16 GB MEMPEK1J016GAH + HGST HTS721010A9E630 1 TB HDD, IPS, 1920x1080, 15.6" | Lenovo Legion Y7000P-1060 i7-8750H, GeForce GTX 1060 Mobile, Samsung SSD PM981 MZVLB256HAHQ, IPS, 1920x1080, 15.6" | Medion Erazer P6705-MD61131 i7-8750H, GeForce GTX 1050 Ti Mobile, Samsung SSD PM981 MZVLB256HAHQ, TN, 1920x1080, 15.6" | MSI P65 8RF-451 - Creator i7-8750H, GeForce GTX 1070 Max-Q, Kingston RBUSNS8154P3512GJ, IPS, 1920x1080, 15.6" | Razer Blade 15 Base Model i7-8750H, GeForce GTX 1060 Max-Q, Samsung SSD PM981 MZVLB256HAHQ, IPS, 1920x1080, 15.6" | Lenovo Legion Y530-15ICH i5-8300H, GeForce GTX 1050 Ti Mobile, Toshiba KBG30ZMT128G, IPS, 1920x1080, 15.6" | Average NVIDIA GeForce GTX 1060 Mobile | Average of class Gaming | |
|---|---|---|---|---|---|---|---|---|---|
| Power Consumption | 16% | 5% | 27% | -6% | -14% | 16% | -36% | -59% | |
| Idle Minimum * (Watt) | 7.3 | 5.5 25% | 4.9 33% | 4 45% | 7.4 -1% | 10.2 -40% | 4.5 38% | 12.7 ? -74% | 13.2 ? -81% |
| Idle Average * (Watt) | 11.1 | 8.5 23% | 8.1 27% | 7 37% | 11.7 -5% | 13.2 -19% | 10 10% | 17.5 ? -58% | 18.9 ? -70% |
| Idle Maximum * (Watt) | 12.6 | 11.9 6% | 16.5 -31% | 11 13% | 16.8 -33% | 17.6 -40% | 13.8 -10% | 21.8 ? -73% | 24.3 ? -93% |
| Load Average * (Watt) | 109 | 94 14% | 109.2 -0% | 72 34% | 94 14% | 99.5 9% | 92.5 15% | 91.7 ? 16% | 108 ? 1% |
| Load Maximum * (Watt) | 168 | 144 14% | 175.2 -4% | 158 6% | 177 -5% | 133.3 21% | 123.2 27% | 156.4 ? 7% | 254 ? -51% |
| Witcher 3 ultra * (Watt) | 86 | 124.6 | 79 | 113.6 | 108.1 |
* ... smaller is better
Battery Runtime
Our realistic Wi-Fi test runs for just about four hours on the Lenovo Legion Y530. This is a bit disappointing compared to the rivals, so our test model is at the bottom of the ranking.
| Lenovo Legion Y530-15ICH i7-8750H, GeForce GTX 1060 Mobile, 52 Wh | HP Pavilion Gaming 15-cx0003ng i7-8750H, GeForce GTX 1050 Ti Mobile, 52.5 Wh | Lenovo Legion Y7000P-1060 i7-8750H, GeForce GTX 1060 Mobile, 57 Wh | Medion Erazer P6705-MD61131 i7-8750H, GeForce GTX 1050 Ti Mobile, 62 Wh | MSI P65 8RF-451 - Creator i7-8750H, GeForce GTX 1070 Max-Q, 82 Wh | Razer Blade 15 Base Model i7-8750H, GeForce GTX 1060 Max-Q, 65 Wh | Lenovo Legion Y530-15ICH i5-8300H, GeForce GTX 1050 Ti Mobile, 52.5 Wh | Average of class Gaming | |
|---|---|---|---|---|---|---|---|---|
| Battery runtime | 106% | 72% | 203% | 109% | 120% | 8% | 119% | |
| Reader / Idle (h) | 8.3 | 10.8 30% | 13.6 64% | 8.9 7% | 7.5 -10% | 11.5 39% | 8.71 ? 5% | |
| WiFi v1.3 (h) | 3.8 | 5.3 39% | 5.8 53% | 6.7 76% | 7.1 87% | 5.5 45% | 4.1 8% | 7.02 ? 85% |
| Load (h) | 0.4 | 1.4 250% | 0.8 100% | 2.5 525% | 1.4 250% | 1.5 275% | 1.47 ? 268% |
Verdict - Powerful gaming laptop from Lenovo
Pros
Cons
The Lenovo Legion Y530 is a powerful gaming laptop in every configuration, which can utilize the power of its components very well and therefore, the results in the synthetic benchmarks and gaming tests are very good. The display produces nice pictures with good colors.
Considering the low price, we can recommend the Lenovo Legion Y530 with the Nvidia GeForce GTX 1060.
The cooling solution has to work well to maintain the performance, but this results in loud fans under load. You might want to use headphones for prolonged gaming sessions. The battery runtime is also comparatively short, even though it is not uncommon for a device from this segment.
Lenovo Legion Y530-15ICH
- 12/14/2018 v6 (old)
Mike Wobker
Price comparison

