Lenovo Legion Y730-15ICH (i5-8300H, GTX 1050 Ti) Laptop Review
The 15.6-inch Legion Y730 was unveiled on the same day as the 15.6-inch Legion Y530 and Y7000 laptops. Unlike its two siblings, however, the Y730 is the higher-end option equipped with features often found on flagship gaming laptops including Thunderbolt 3, per-key RGB keys, and an aluminum chassis. Our table below illustrates the major differences between the Legion Y730 and its less expensive Legion Y530 alternative.
Current SKUs range from the Core i5-8300H CPU with 8 GB DDR4 RAM and 1 TB HDD for $1000 USD up to the Core i5-8750H with 16 GB of RAM and a 128 GB PCIe SSD for $1400 USD. The 60 Hz 1080p IPS display and GeForce GTX 1050 Ti GPU are otherwise fixed across all SKUs. The hardware puts the Y730 firmly in the mainstream category against competitors like the Walmart Overpowered 15, Gigabyte Sabre 15, MSI GF63, Acer Aspire Nitro 15, and Dell G7 15.
The Legion Y730 series consists of 15-inch and 17-inch models. See our existing review on the 17-inch version here as this page will focus on the 15-inch model.
Despite being more feature-packed than the Legion Y530, the two laptops are very similar to each other both inside and out. We recommend checking out our existing review on the Y530 as many of our comments and analyses still apply here.
More Lenovo Legion series reviews:
- Lenovo Legion Y730 17-inch
- Lenovo Legion Y530 (i7-8750H, GTX 1060)
- Lenovo Legion Y530 (i5-8300H, GTX 1050 Ti)
- Lenovo Legion Y7000
- Lenovo Legion C530 Cube
- Lenovo Legion Y920
- Lenovo Legion Y520
| Legion Y530 15-inch | Legion Y730 15-inch | |
|---|---|---|
| Chassis | Largely plastic | Aluminum |
| Keyboard | Single-zone white backlight plus NumPad | Per-key RGB lighting plus Macro Keys |
| GPU | Up to the GTX 1060 | GTX 1050 Ti only |
| Wireless | Intel 3165, Bluetooth 4.2 | Intel 9560, Bluetooth 5.0 |
| Ports | No Thunderbolt 3 | Thunderbolt 3 |
| Battery | 52.5 Wh | 57 Wh |
| Dimensions | 28 x 360 x 268 mm | 19.95 x 362 x 267 mm |
| Weight | 2.34 kg | 2.20 kg |
Case
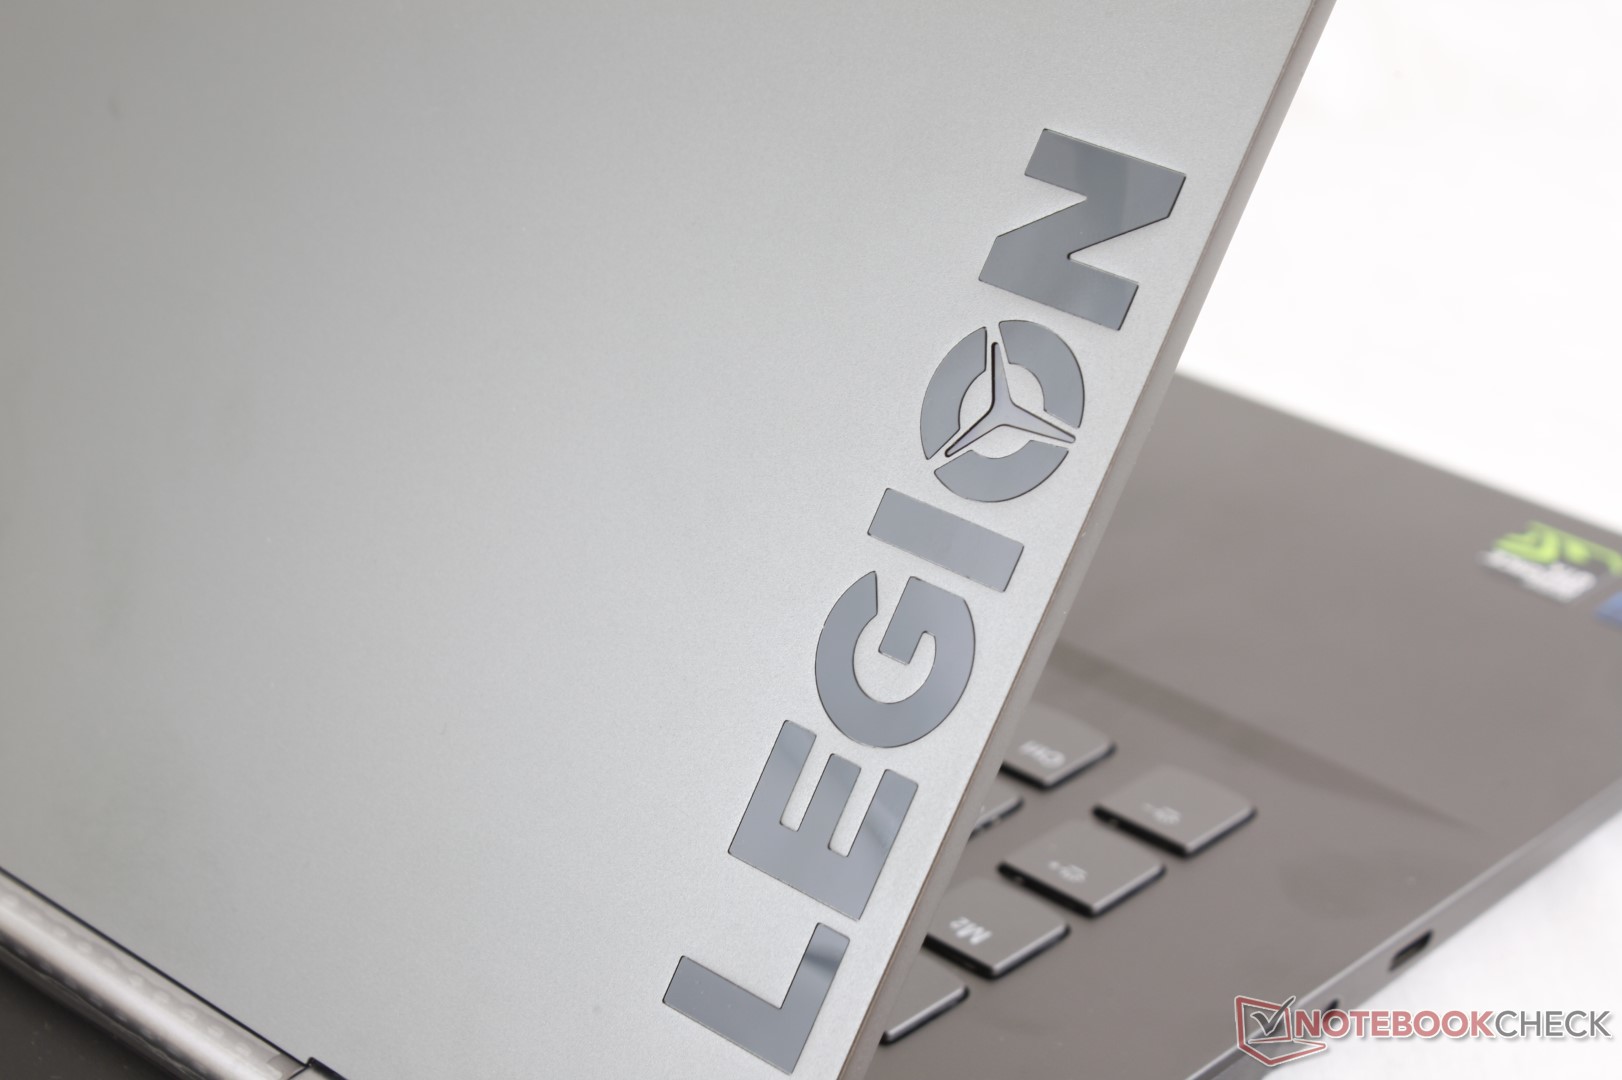
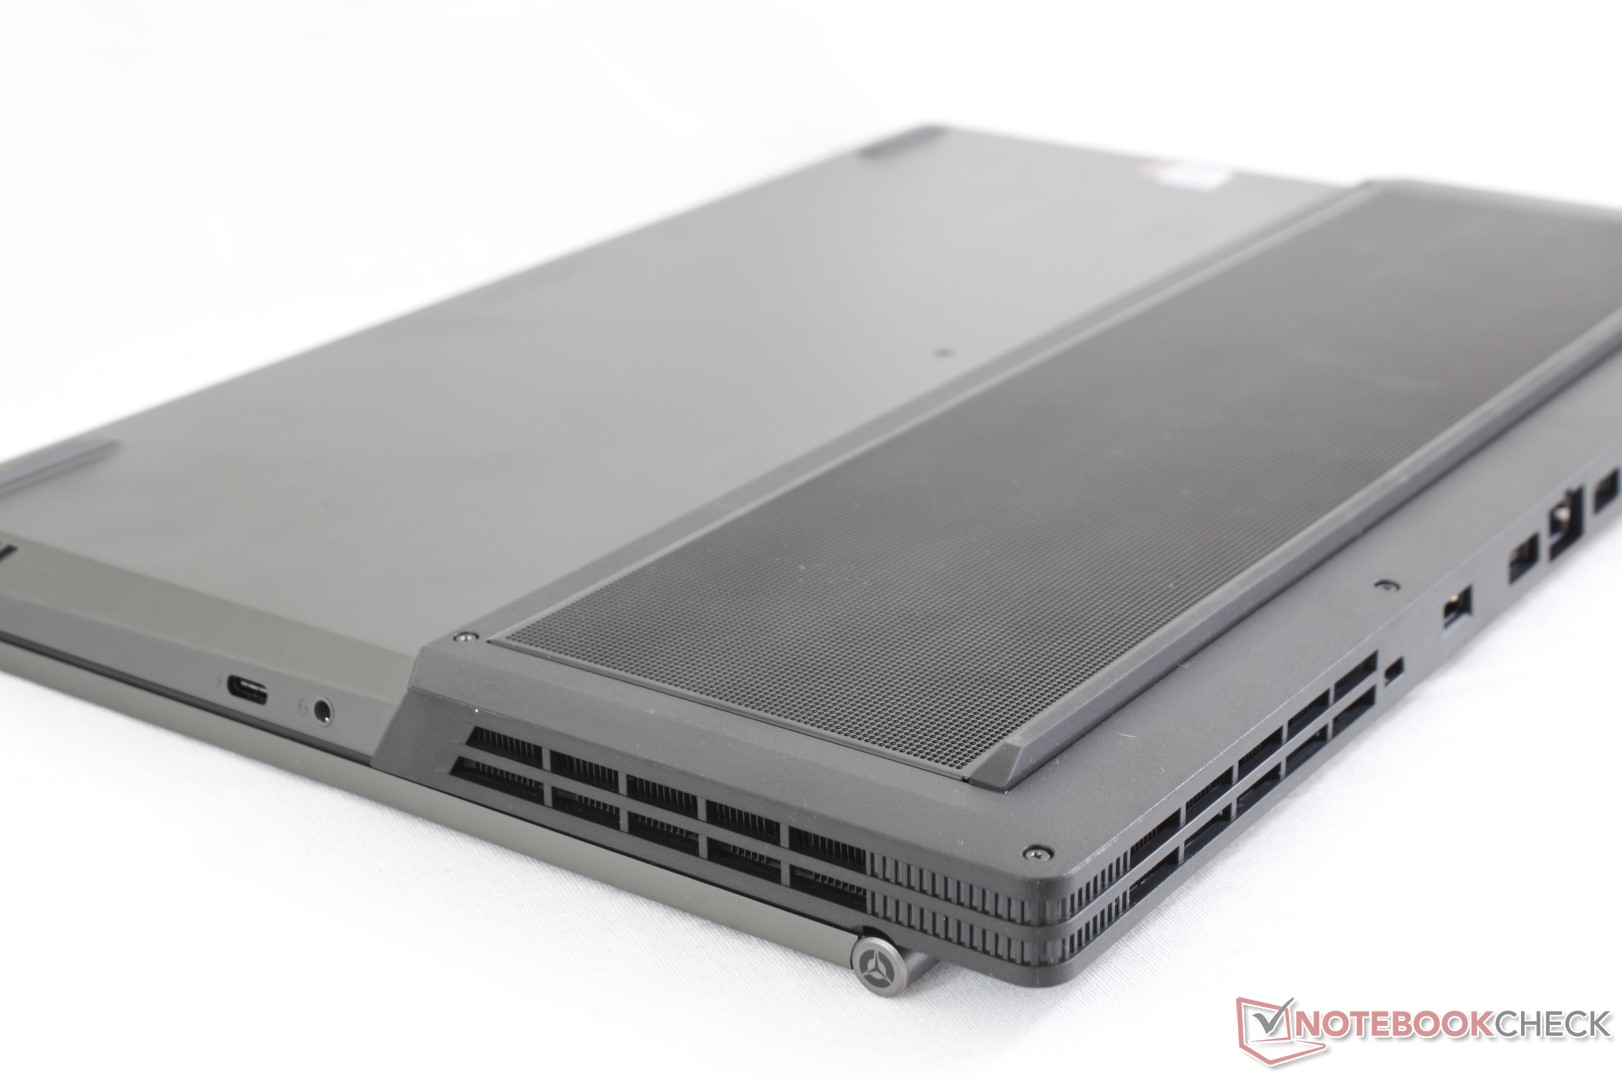
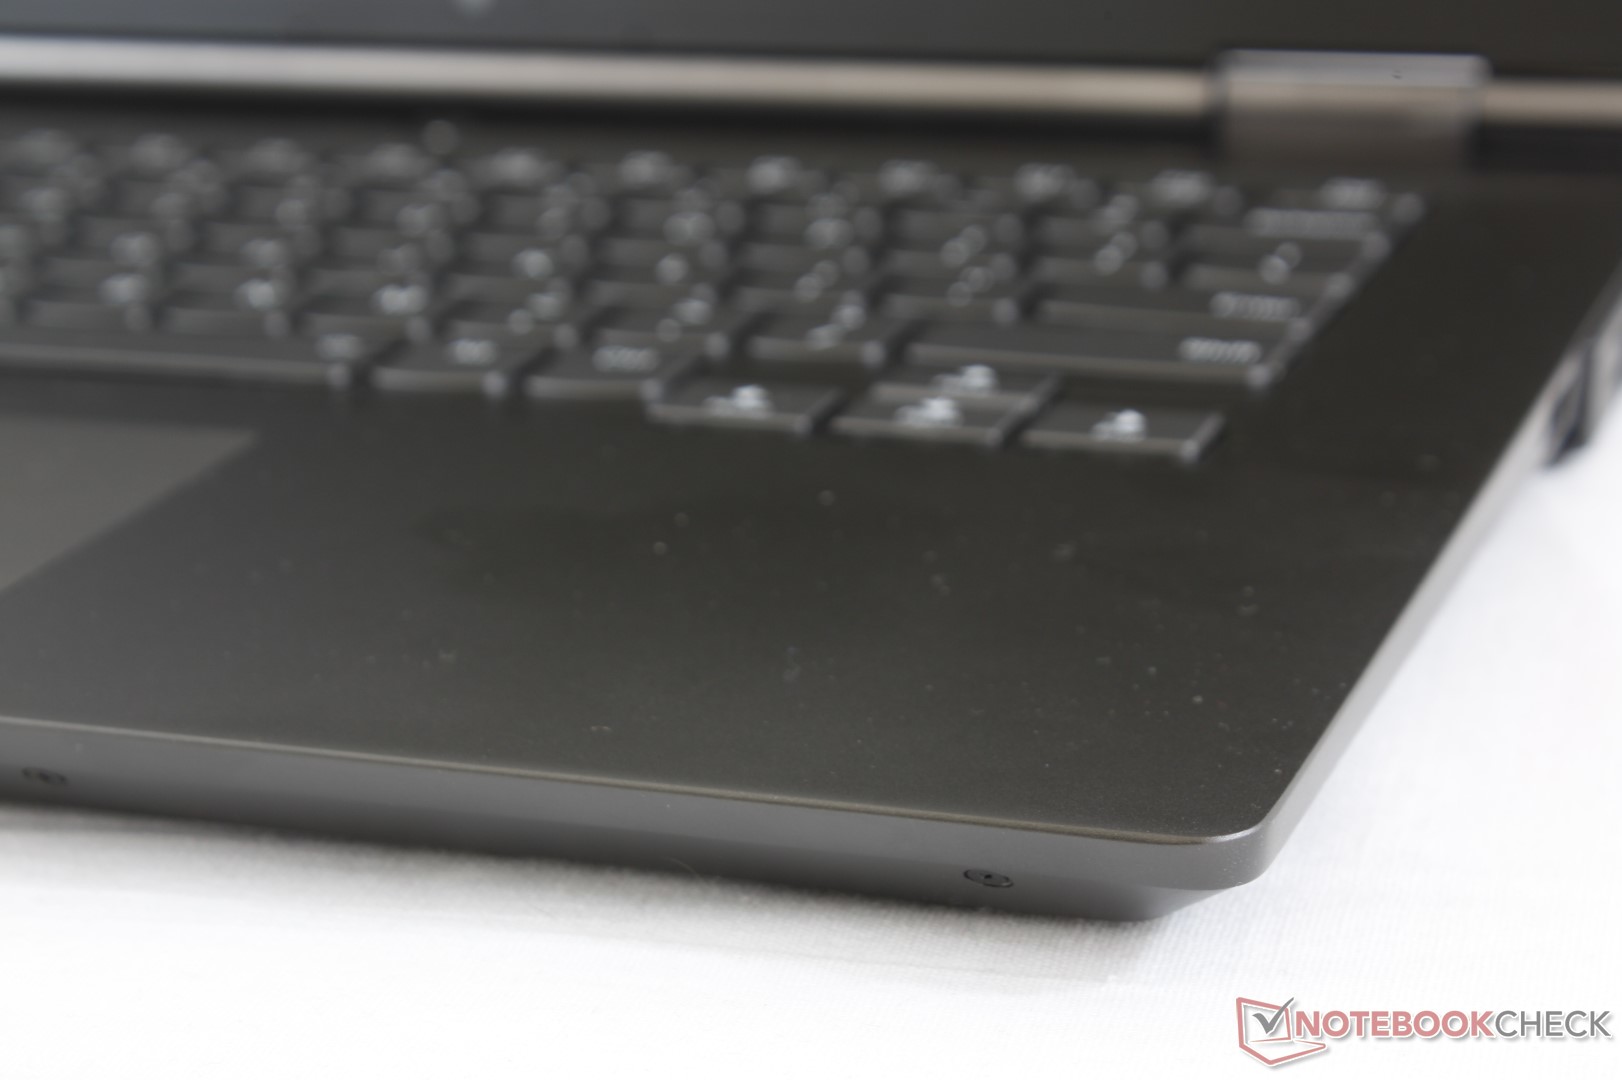
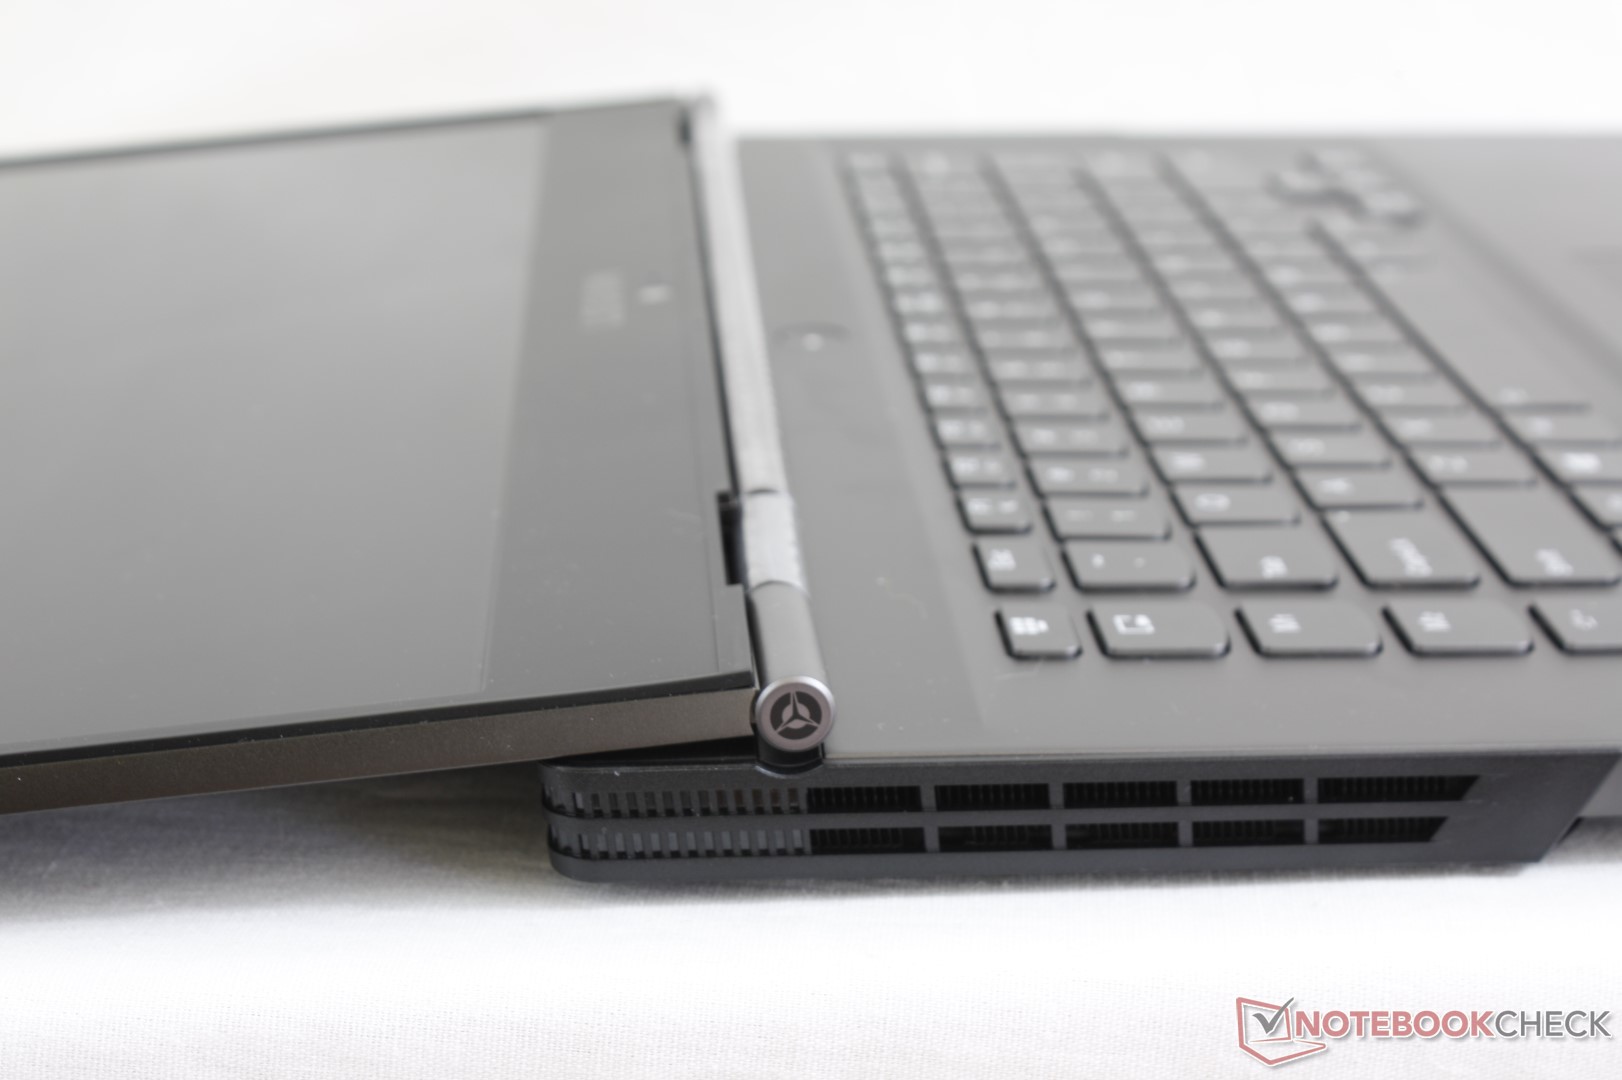
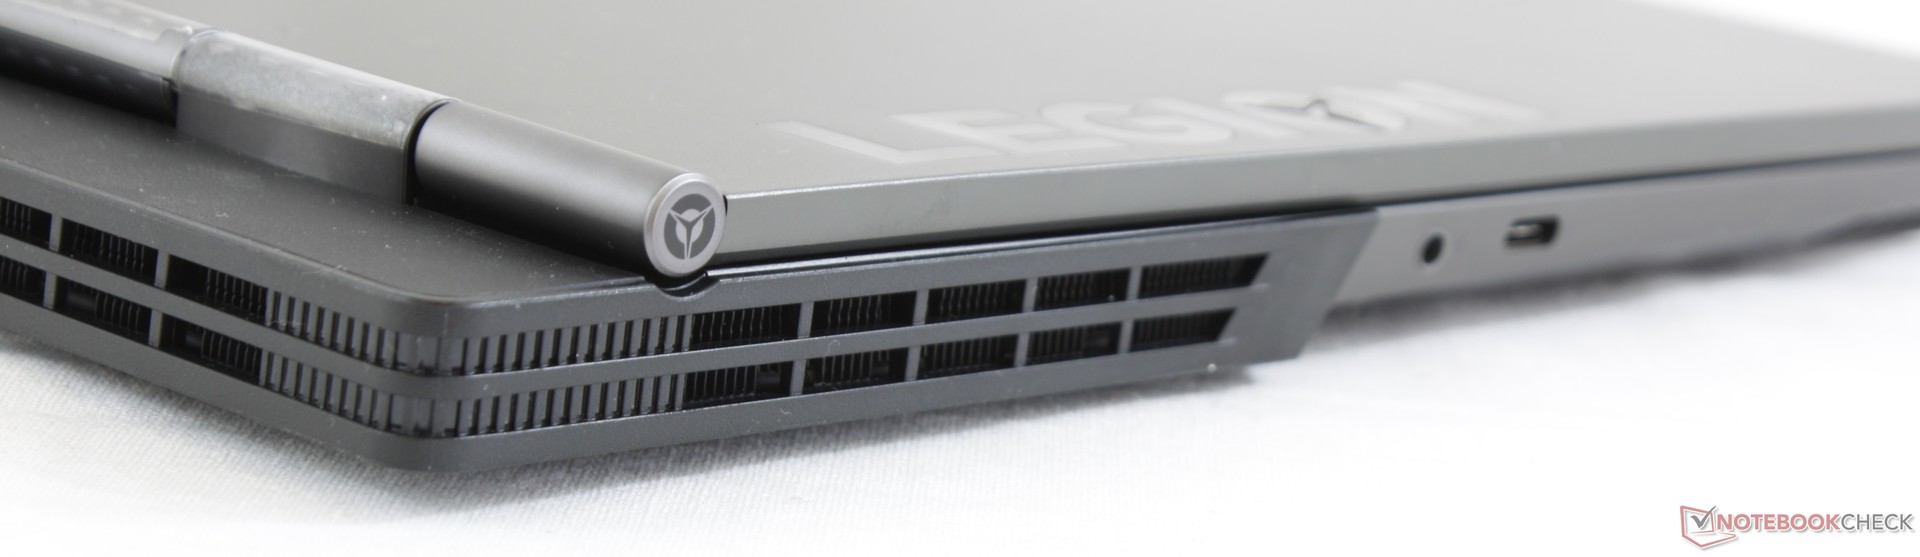
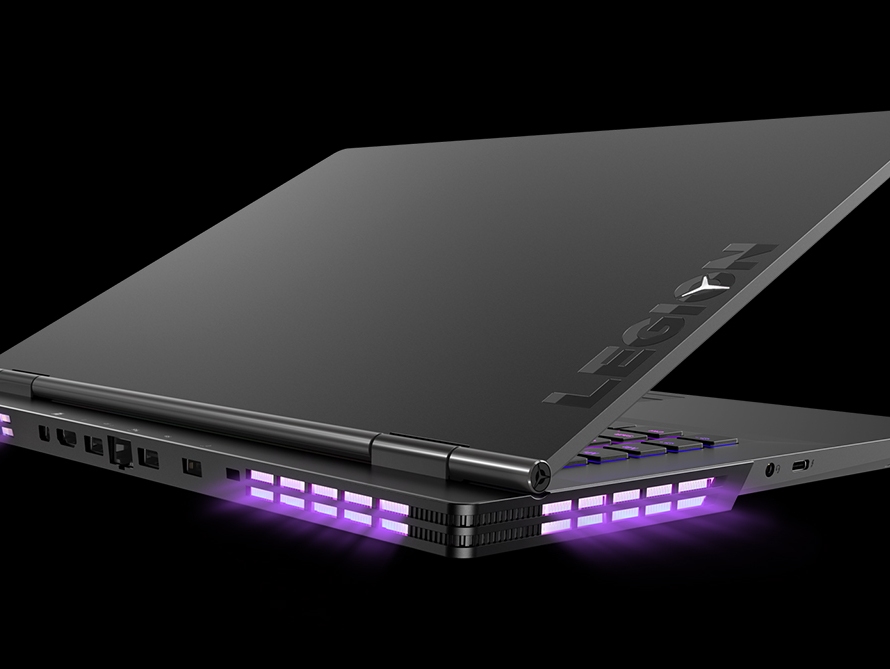
Chassis texture and skeleton are identical to the 17.3-inch Legion Y730-17ICH. The smooth matte aluminum surfaces and uniform design language contrast the older gamer-centric Legion Y520 where bright red accents are prevalent. Lenovo says this was intentional in order to better appeal to business and office users. We are seeing this design trend expanding to other gaming laptops as well such as on the MSI GS65 and Razer Blade series.
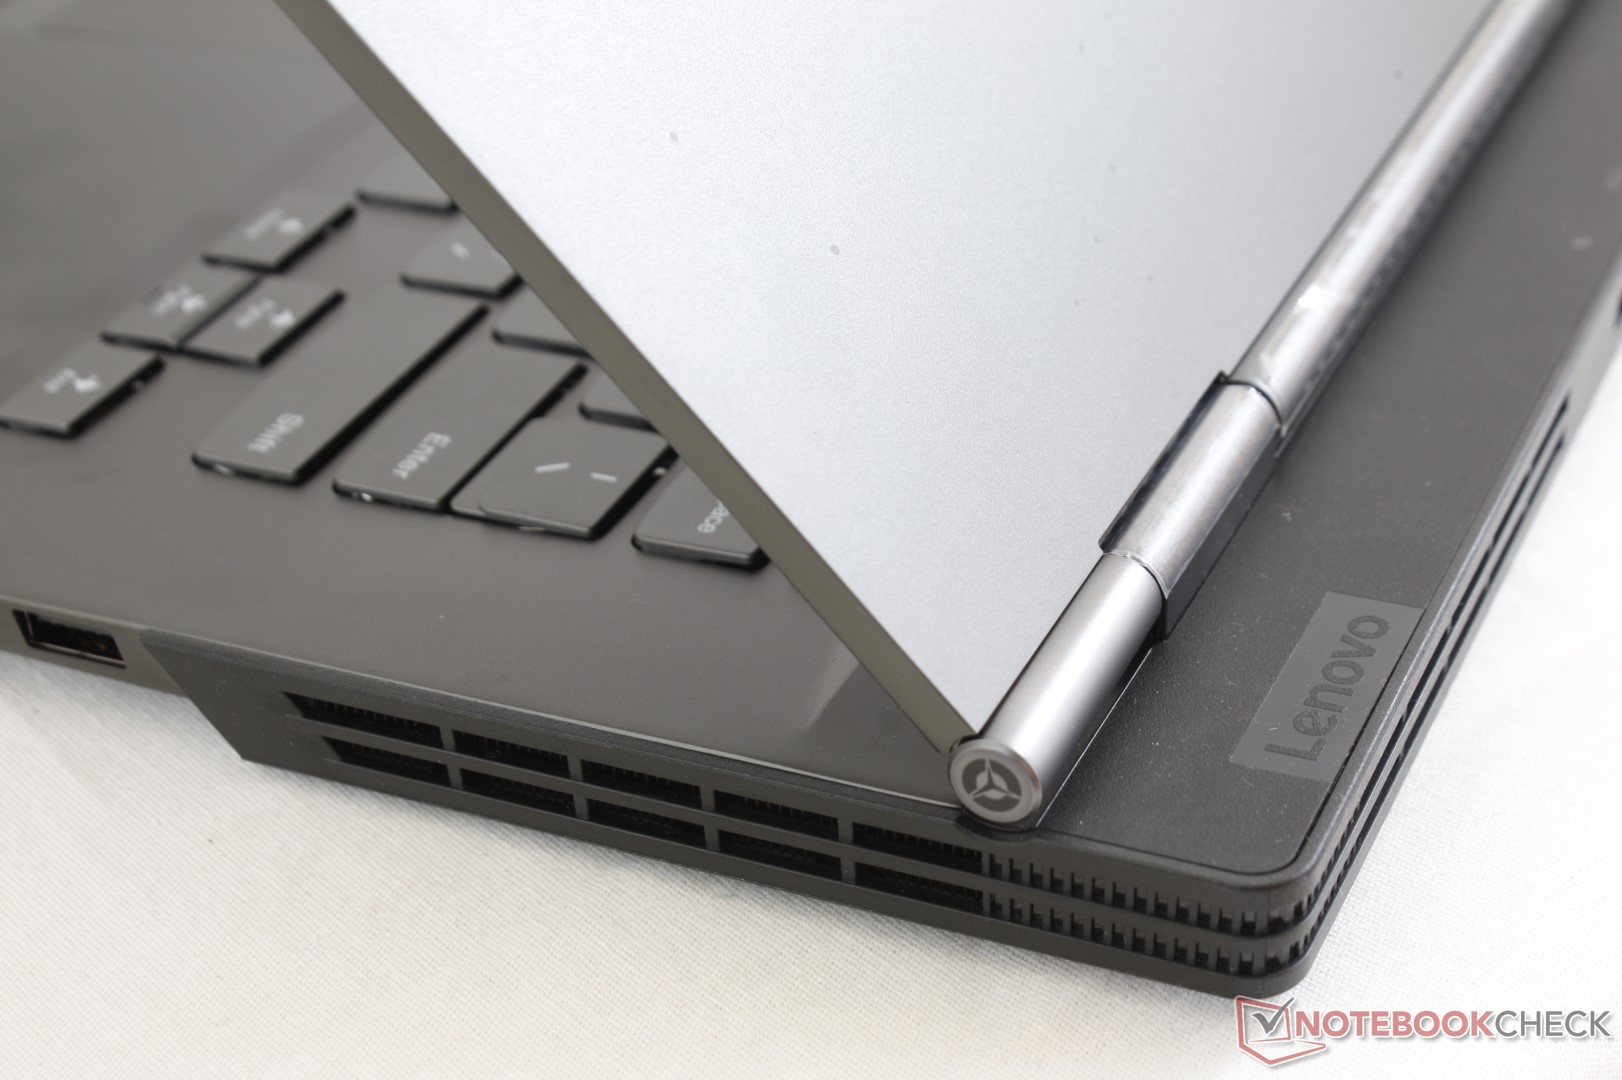
Chassis quality is a mixed bag. The lid in particular is significantly more flexible than the lids of the XPS 15, Razer Blade 15, Gigabyte Aero 15, MSI GF63, and most other 15-inch gaming laptops for that matter. This is likely due to the narrow bezels, lack of any Gorilla Glass reinforcement, and seemingly thinner outer lid material. The dual hinges are decent with a very range, but the lid still wobbles a bit when adjusting the angle or transporting the laptop.
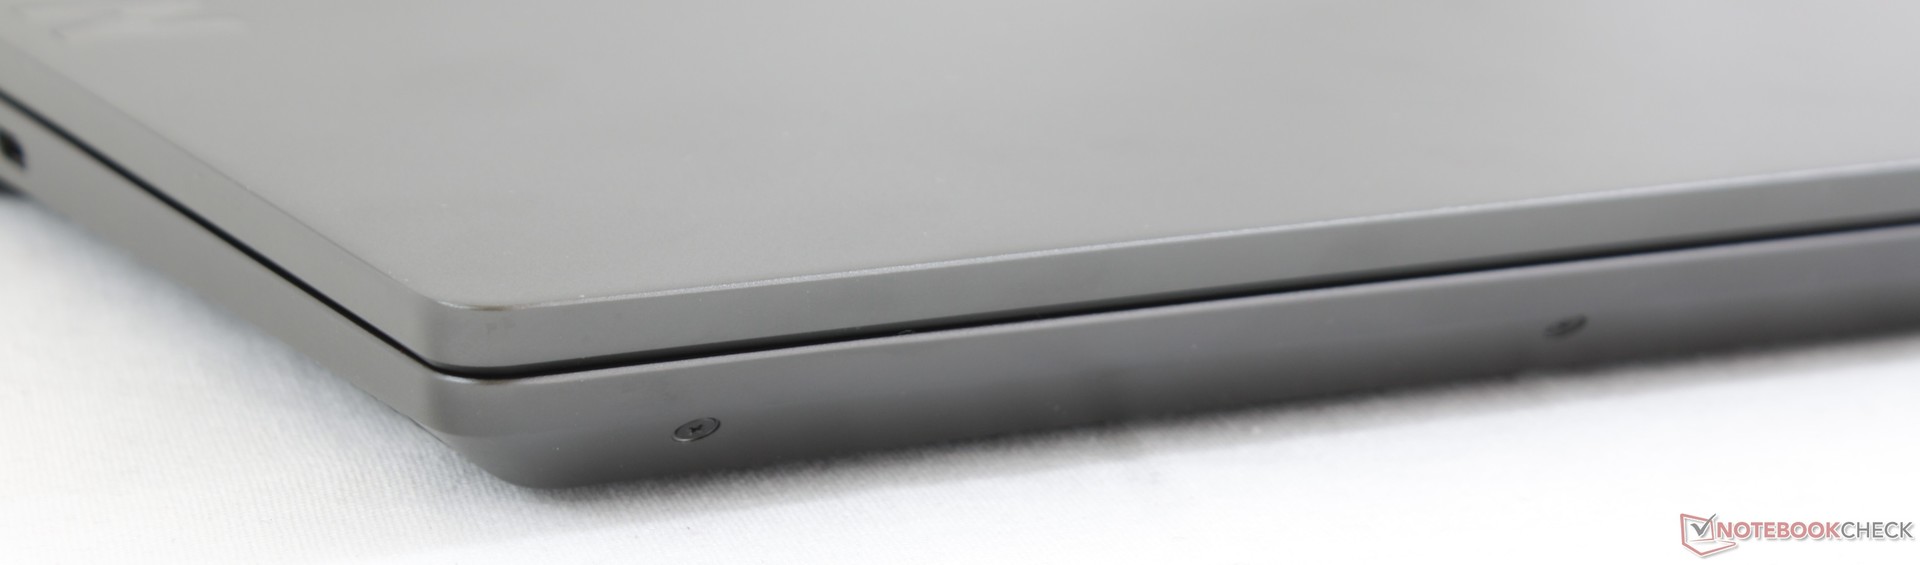
The base is thankfully much more rigid and resistant to twisting than the lid. Even so, we can observe more flexing than the aforementioned Dell, Razer, Gigabyte, and MSI alternatives when applying pressure on the center of the keyboard. Attempting to twist the base from its front two corners results in minor but audible creaking as well. While Lenovo has nailed its unique gaming-business hybrid look and feel, chassis rigidity still has some ways to go.
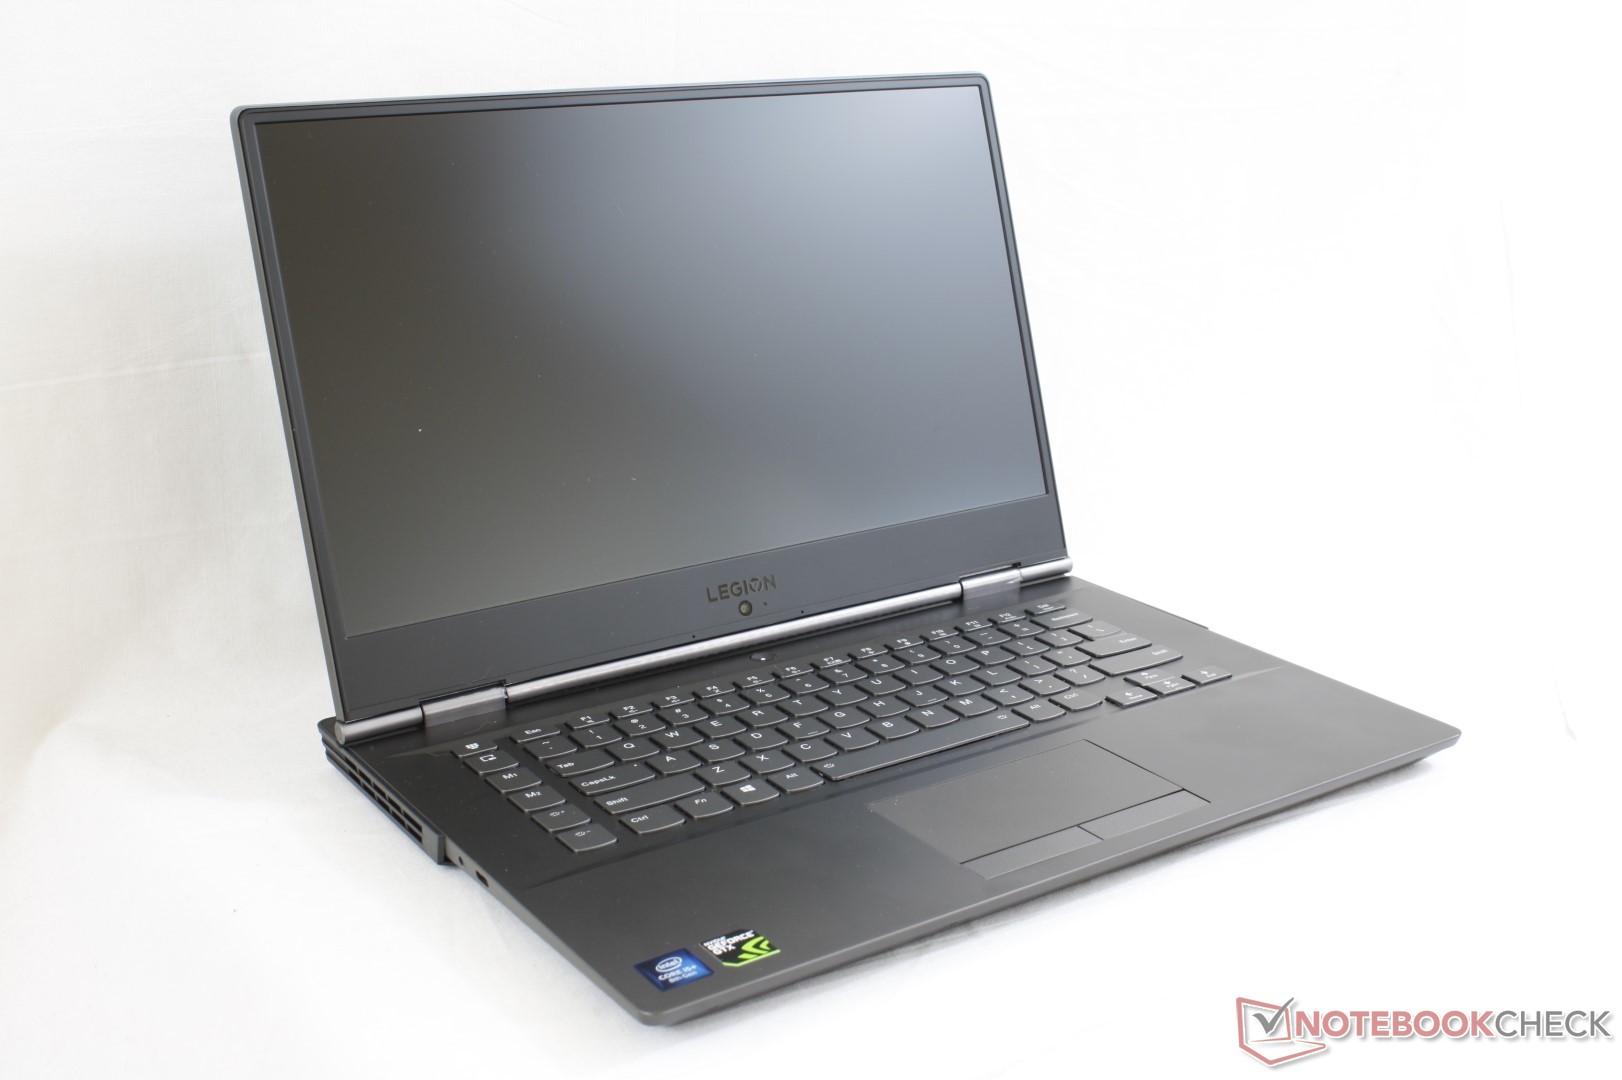
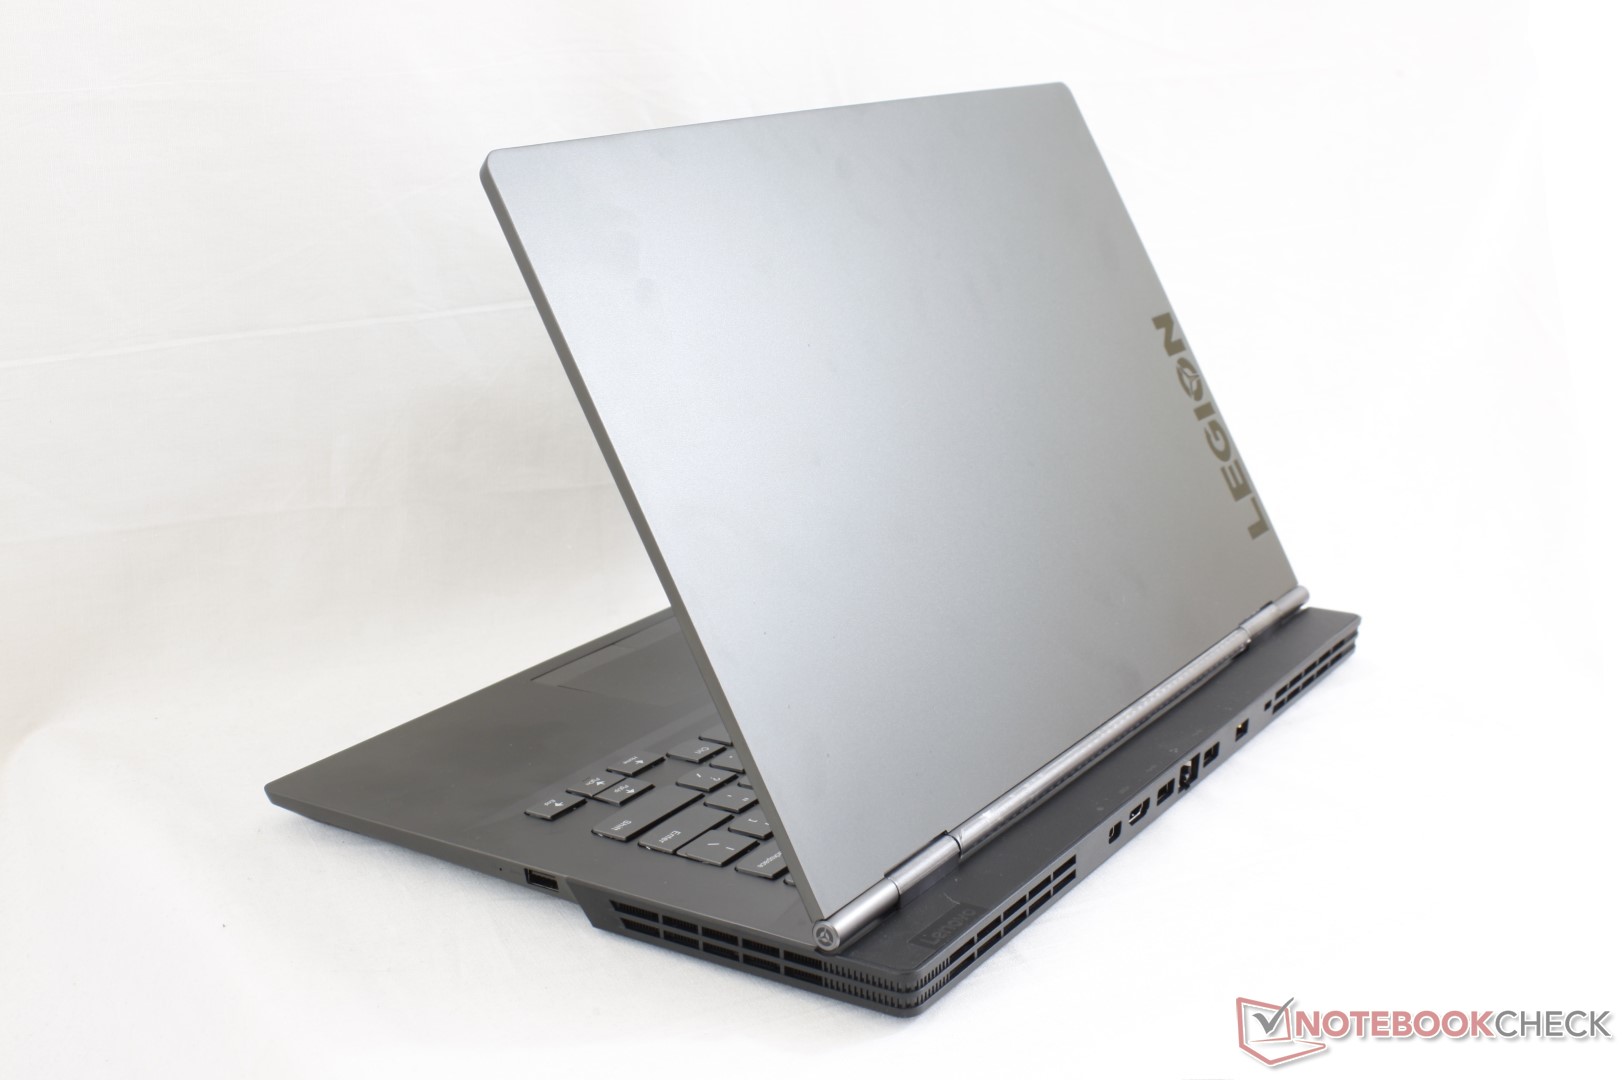
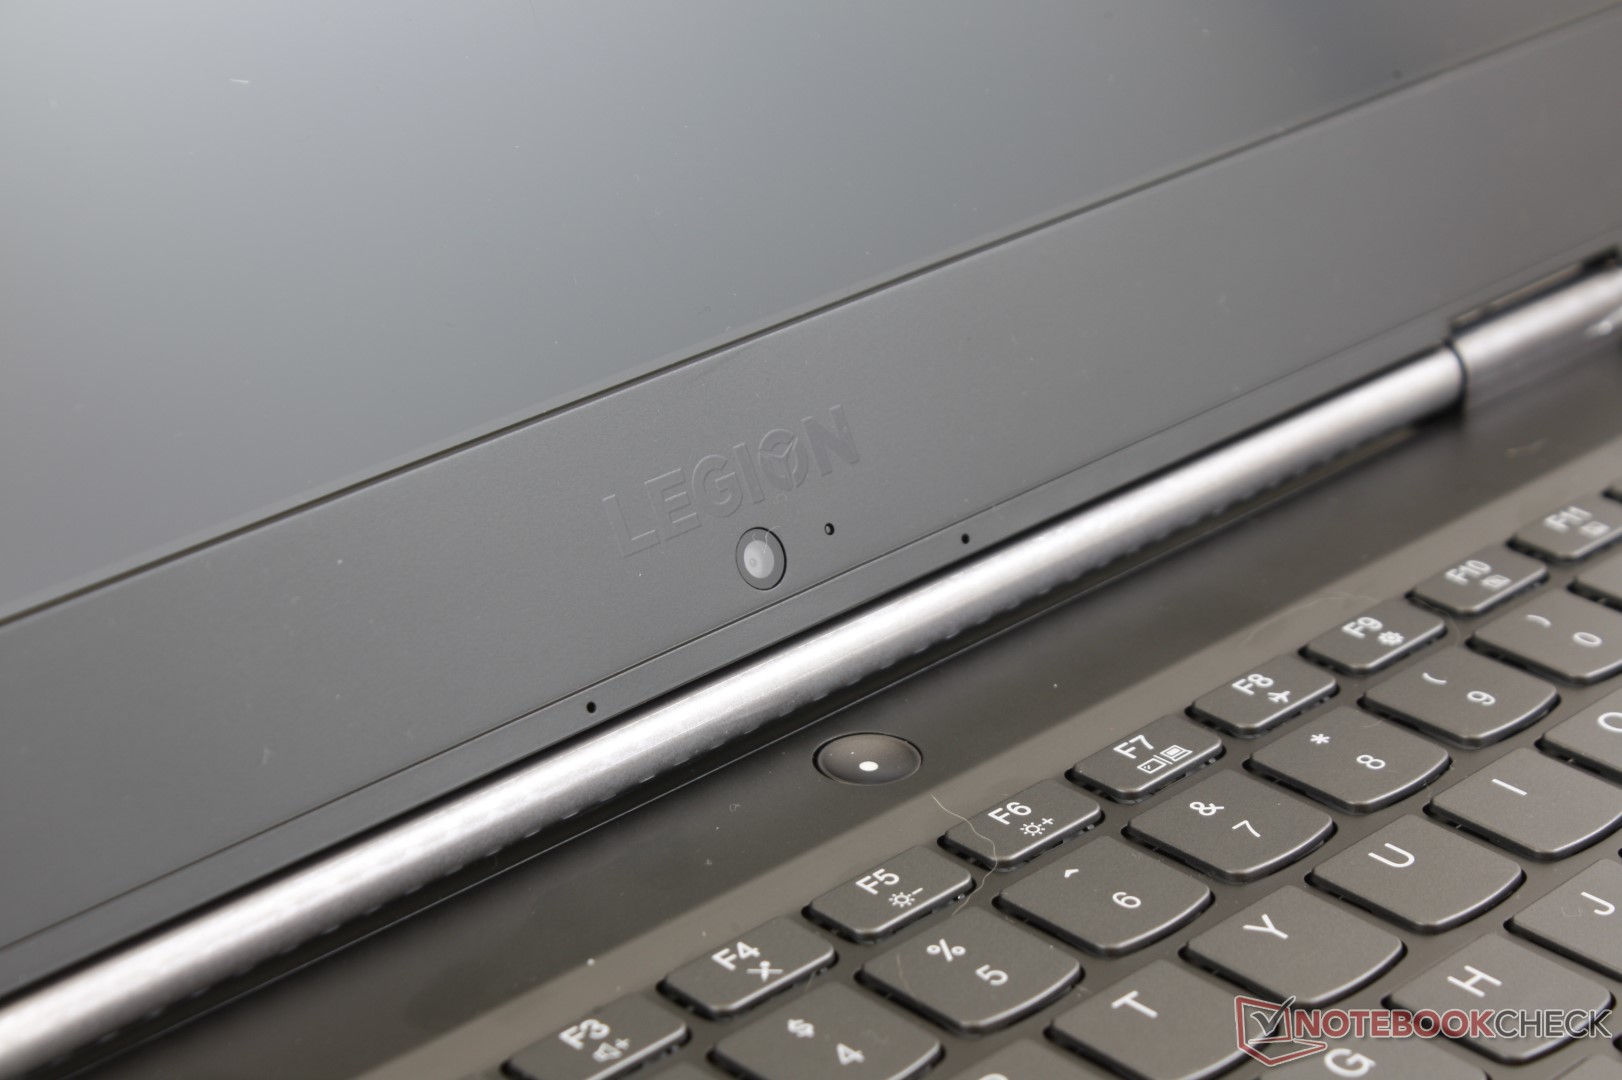

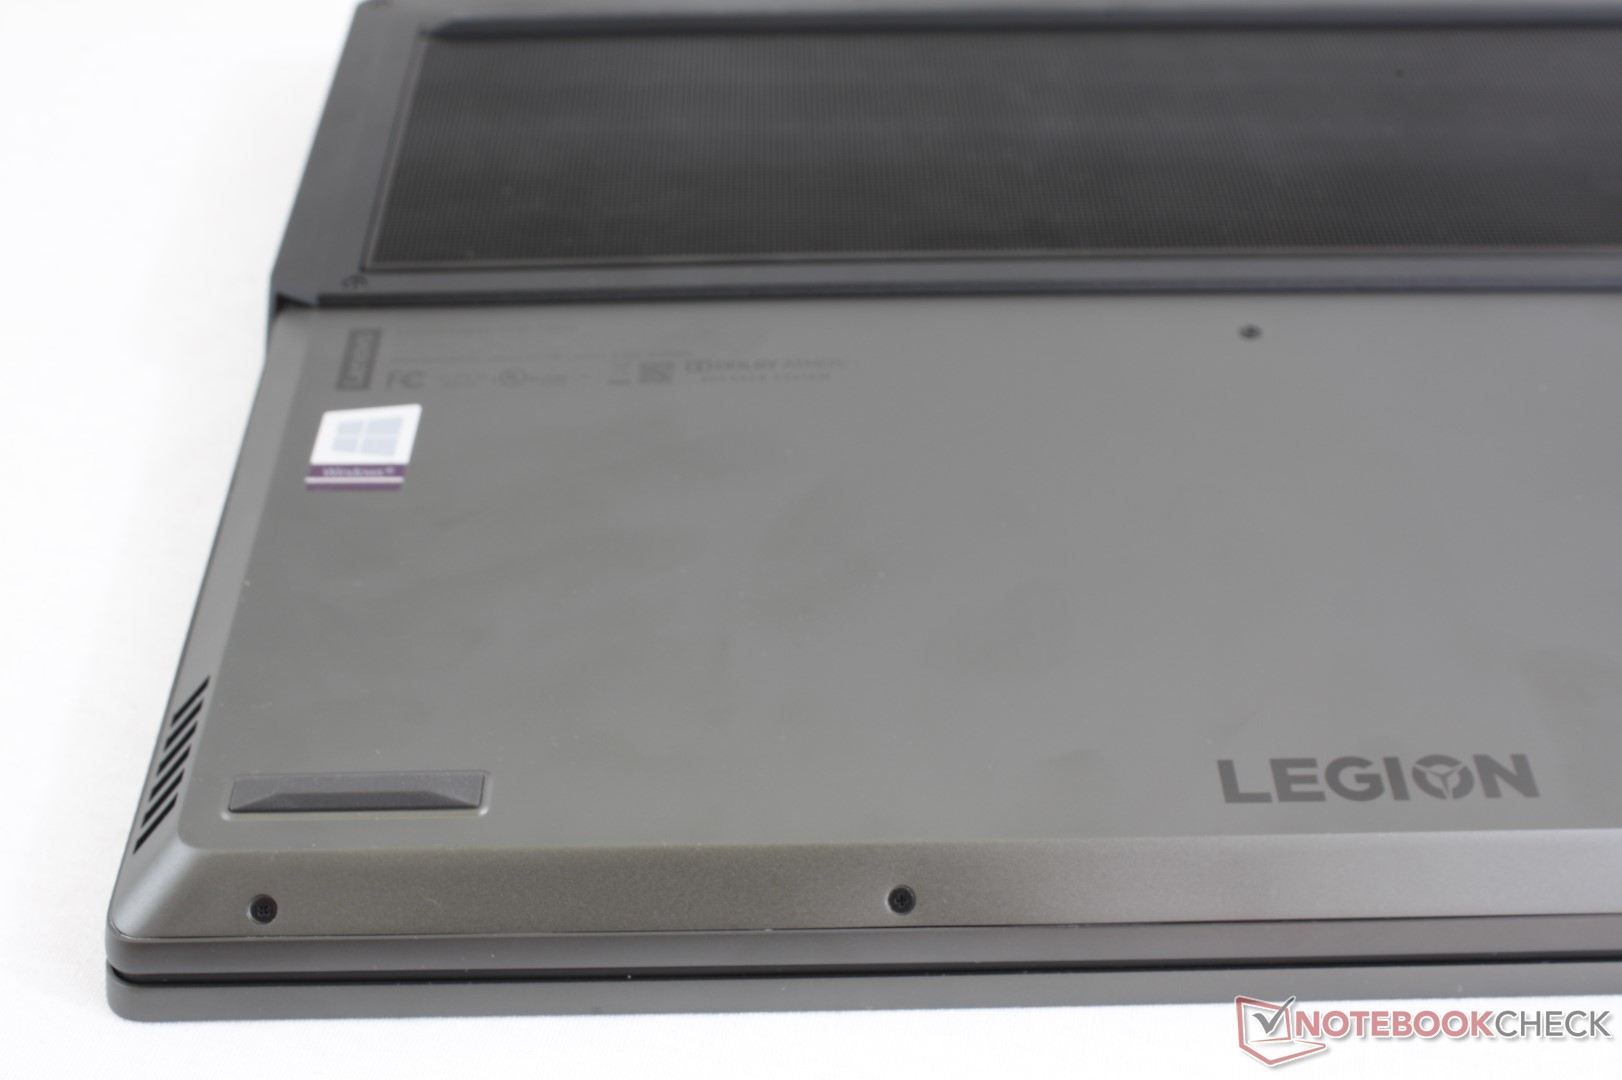
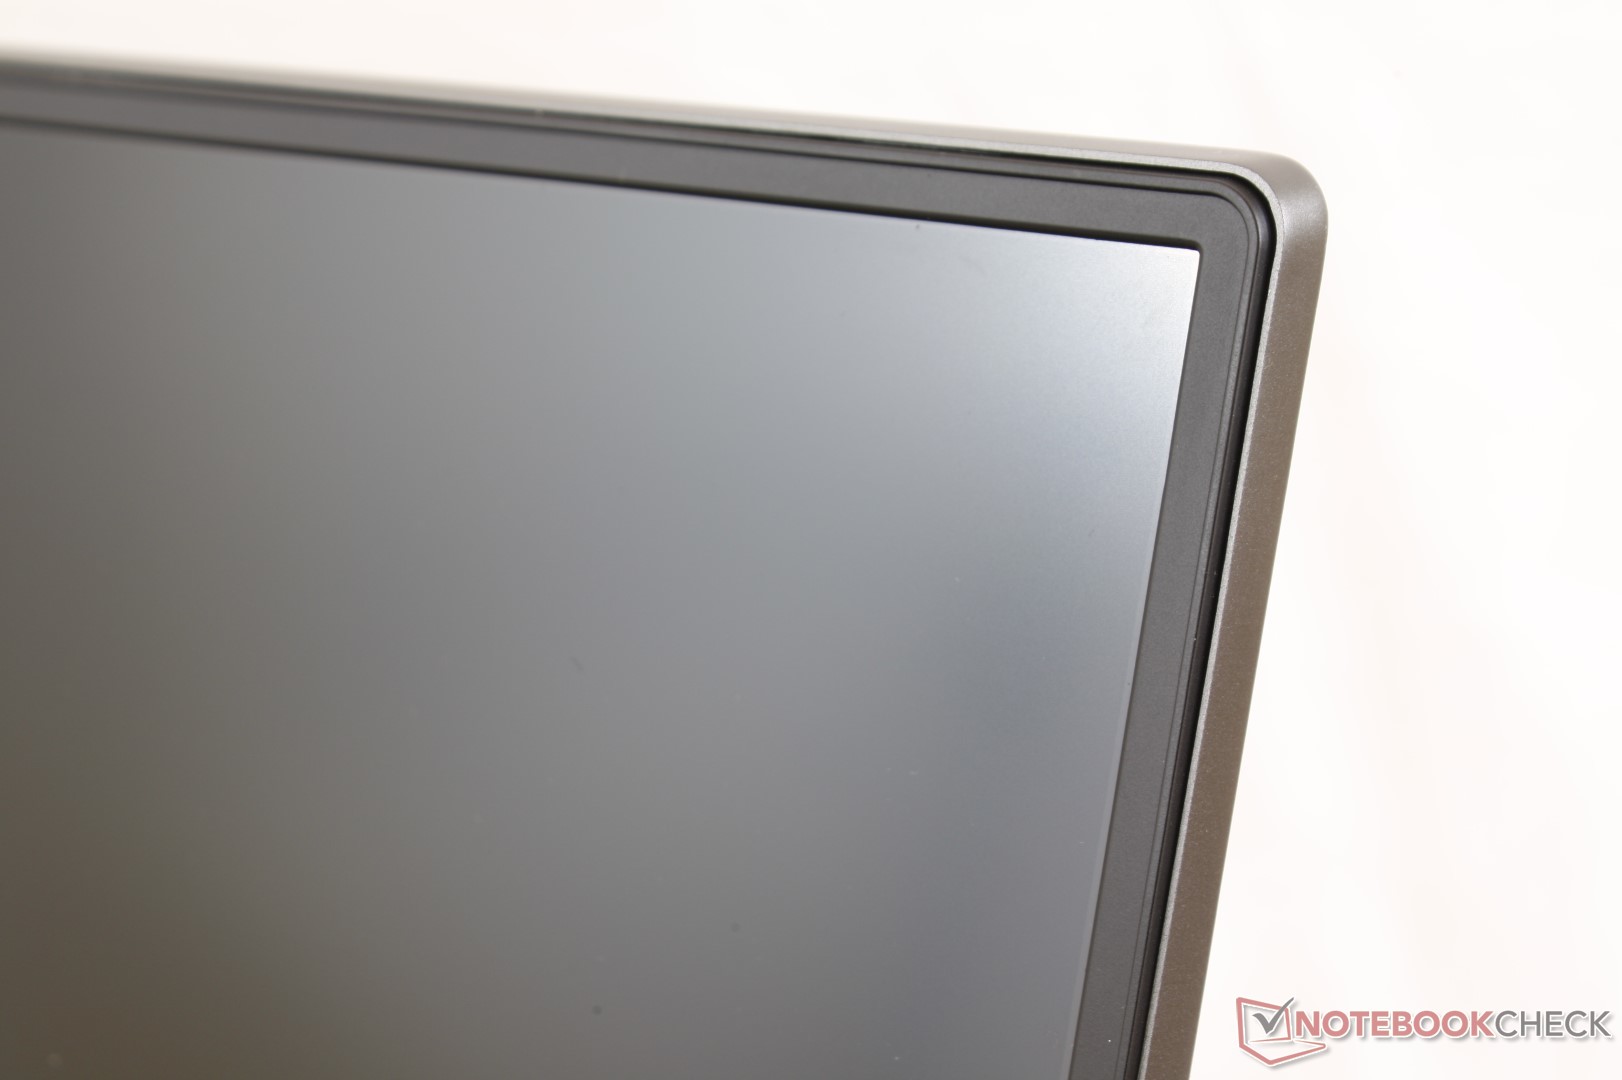
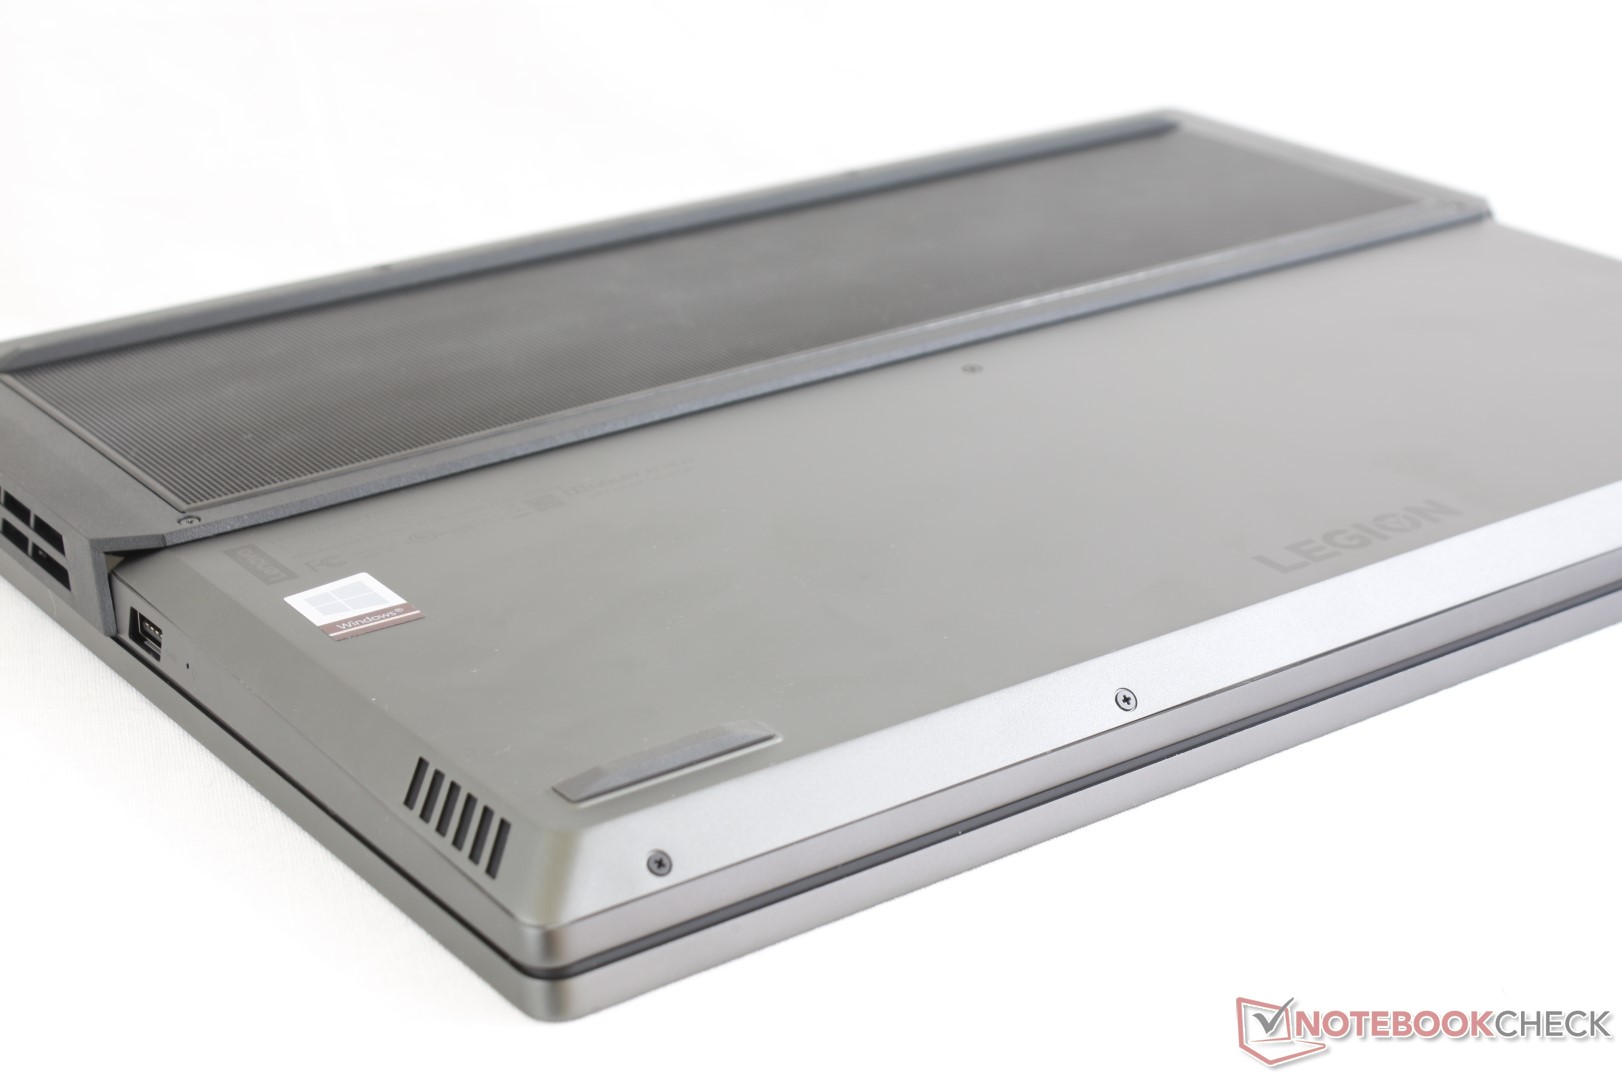
It's difficult to see without having both units side by side, but the Legion Y730 is notably thinner and slightly lighter than the Y530 despite their similar design features. It's worth noting that the Y730 has a rather large footprint for a narrow-bezel laptop because of its protruding rear. The Razer Blade 15, for example, is over 30 mm shorter despite also having narrow bezels on all three sides of the display. Webcam positioning and angle suffer from the "XPS syndrome".
Connectivity
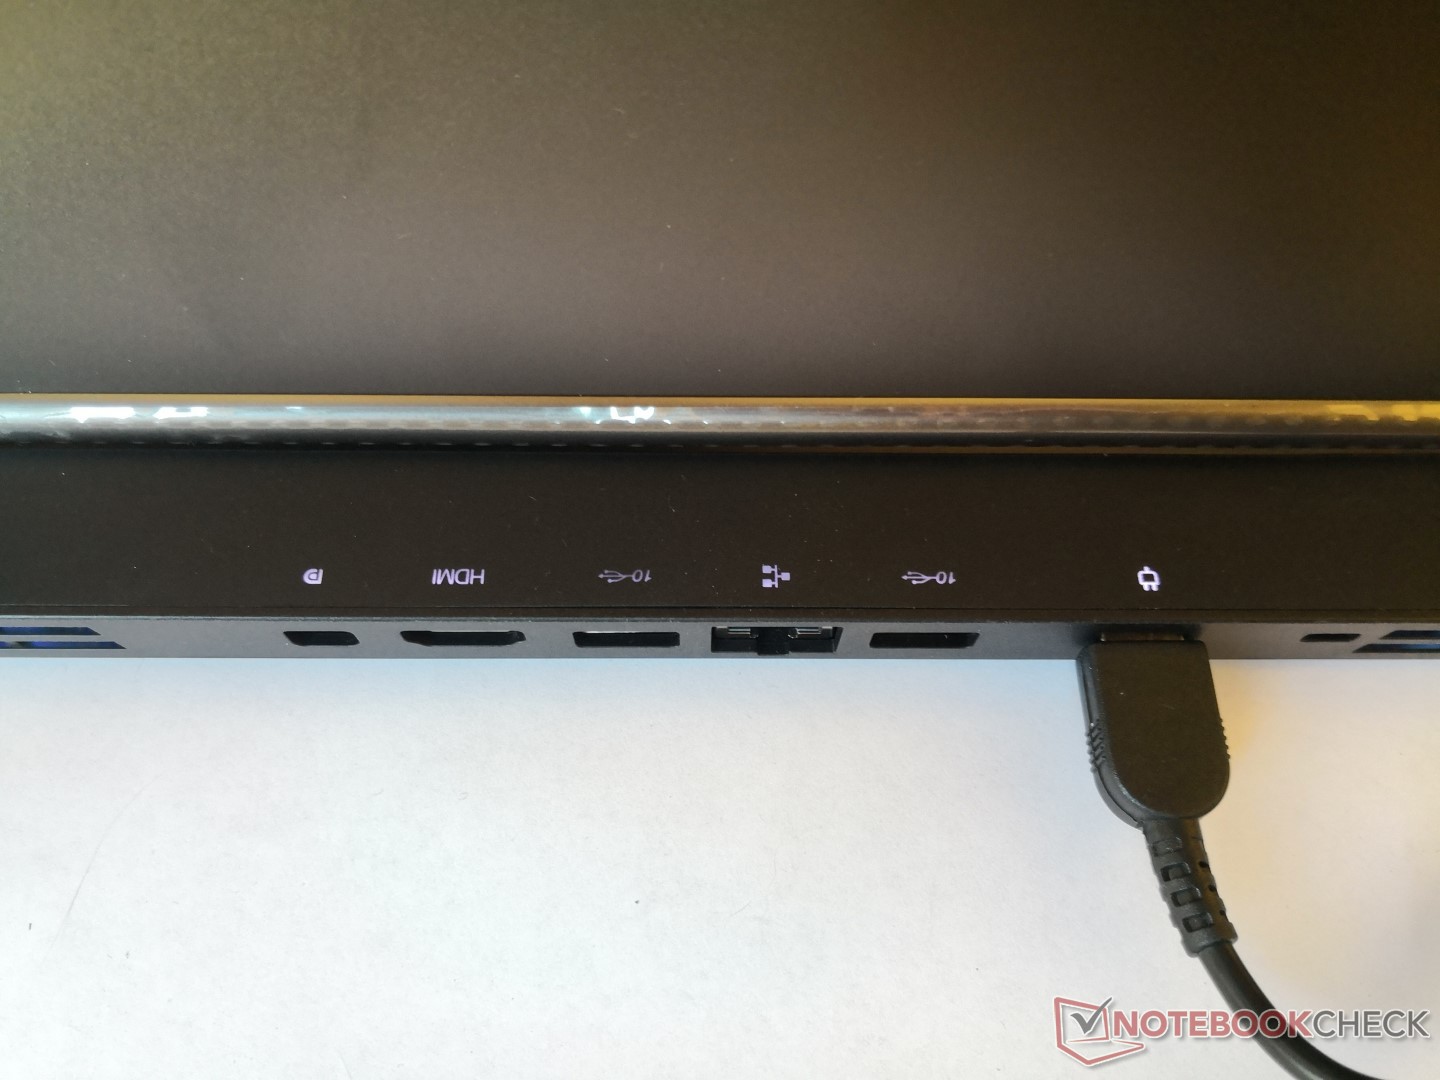
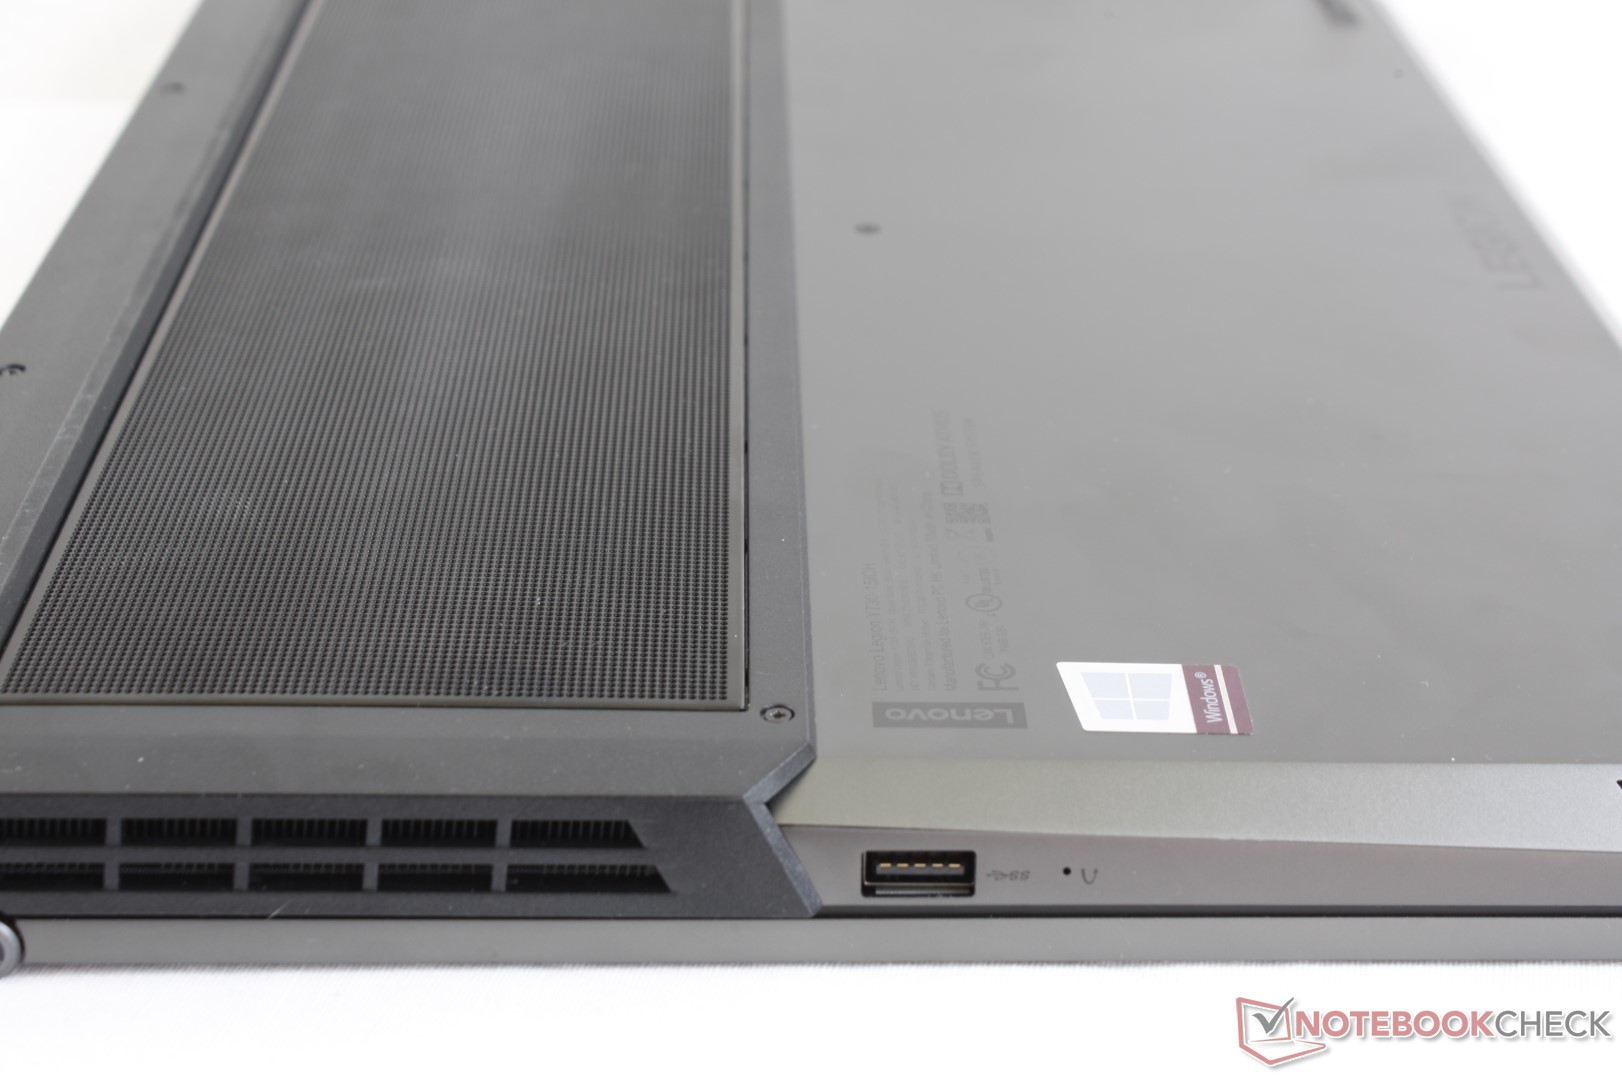
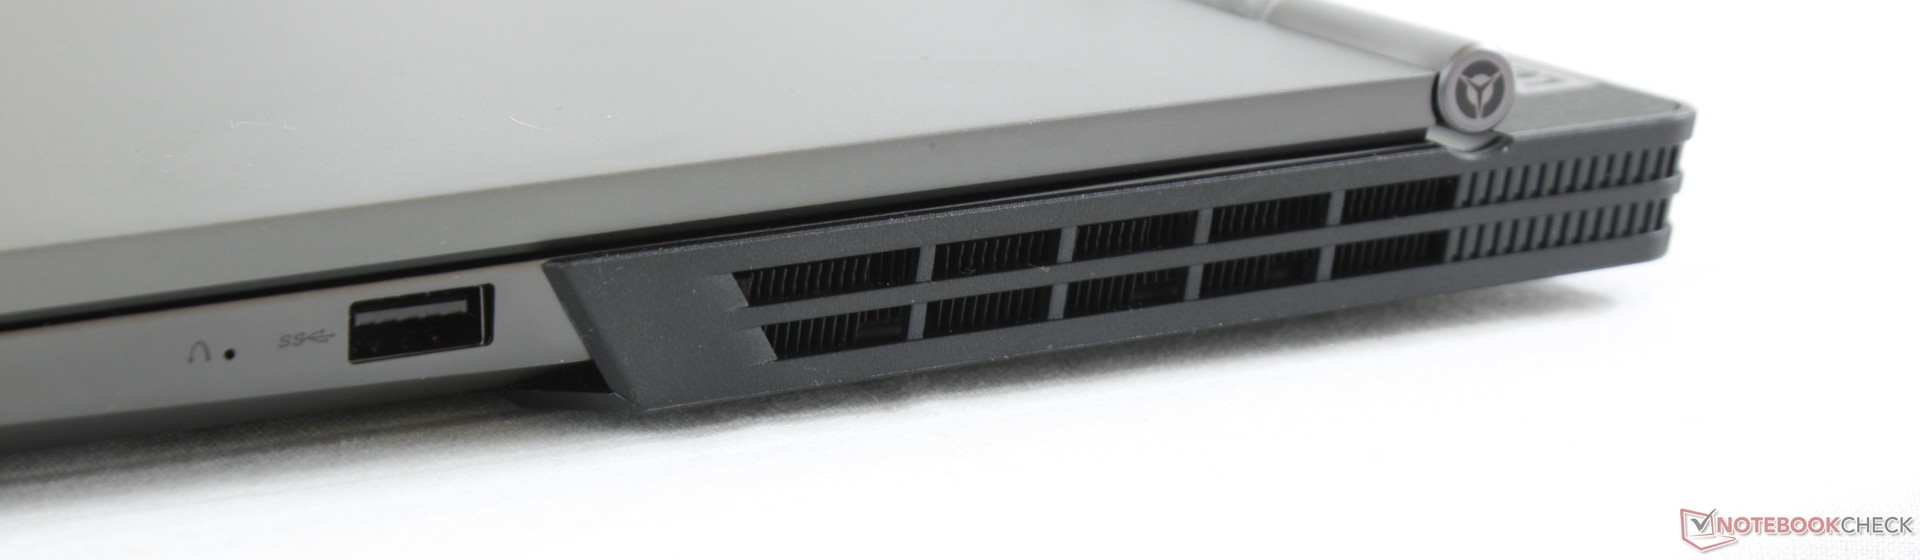
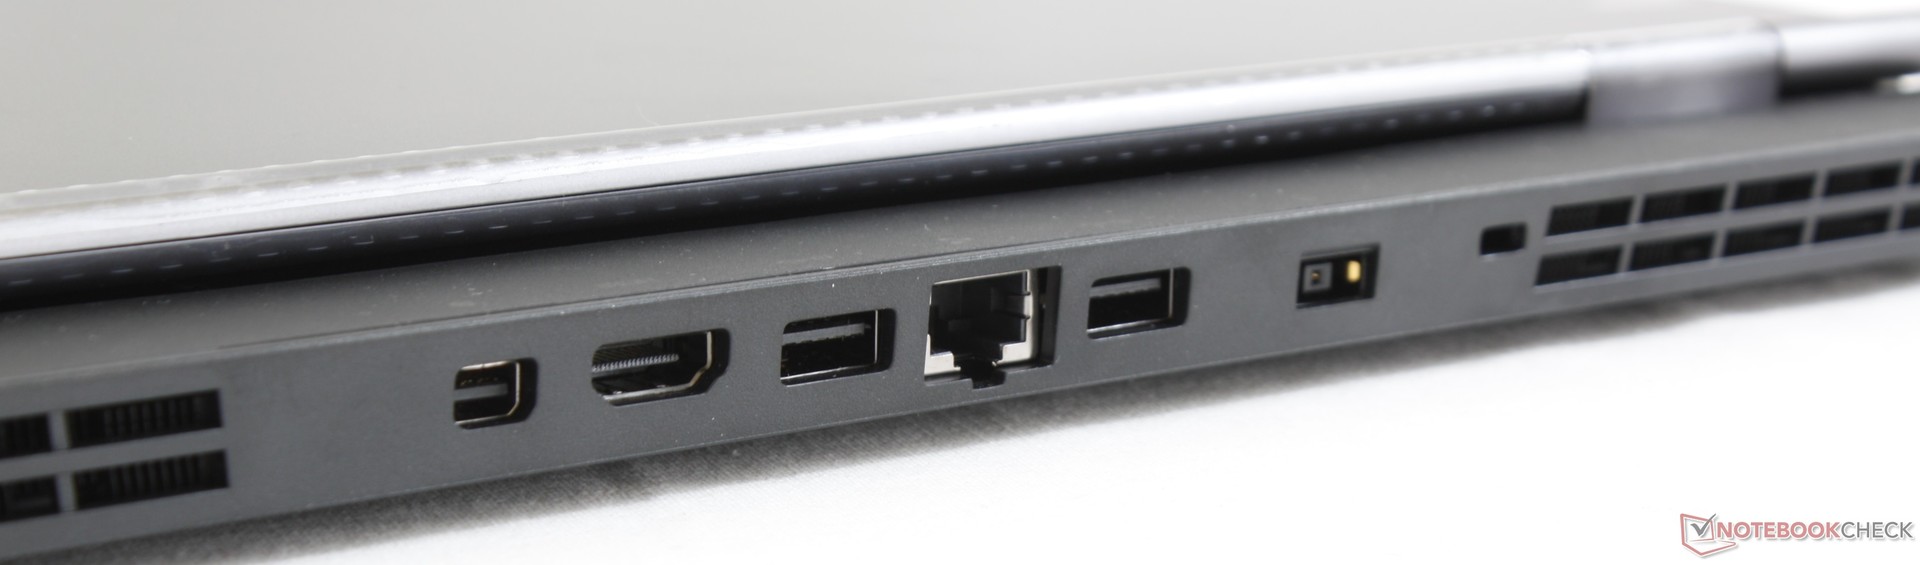
Port options are identical to the Legion Y530 except that the USB Type-C port is now compatible with Thunderbolt 3 devices. Port positioning, however, is different on the Legion Y730. The USB Type-C port has swapped places with the USB Type-A port along the left edge. Most of the ports are still along the back since the ventilation grilles occupy a large portion of the two rear corners.
We can appreciate the LED symbols for each port along the rear to make connecting monitors, Ethernet, or the AC adapter more hassle-free. It can be annoying reaching over to look at the back ports on other laptops every time something needs to be connected.
There is no integrated SD card reader available.
Communication
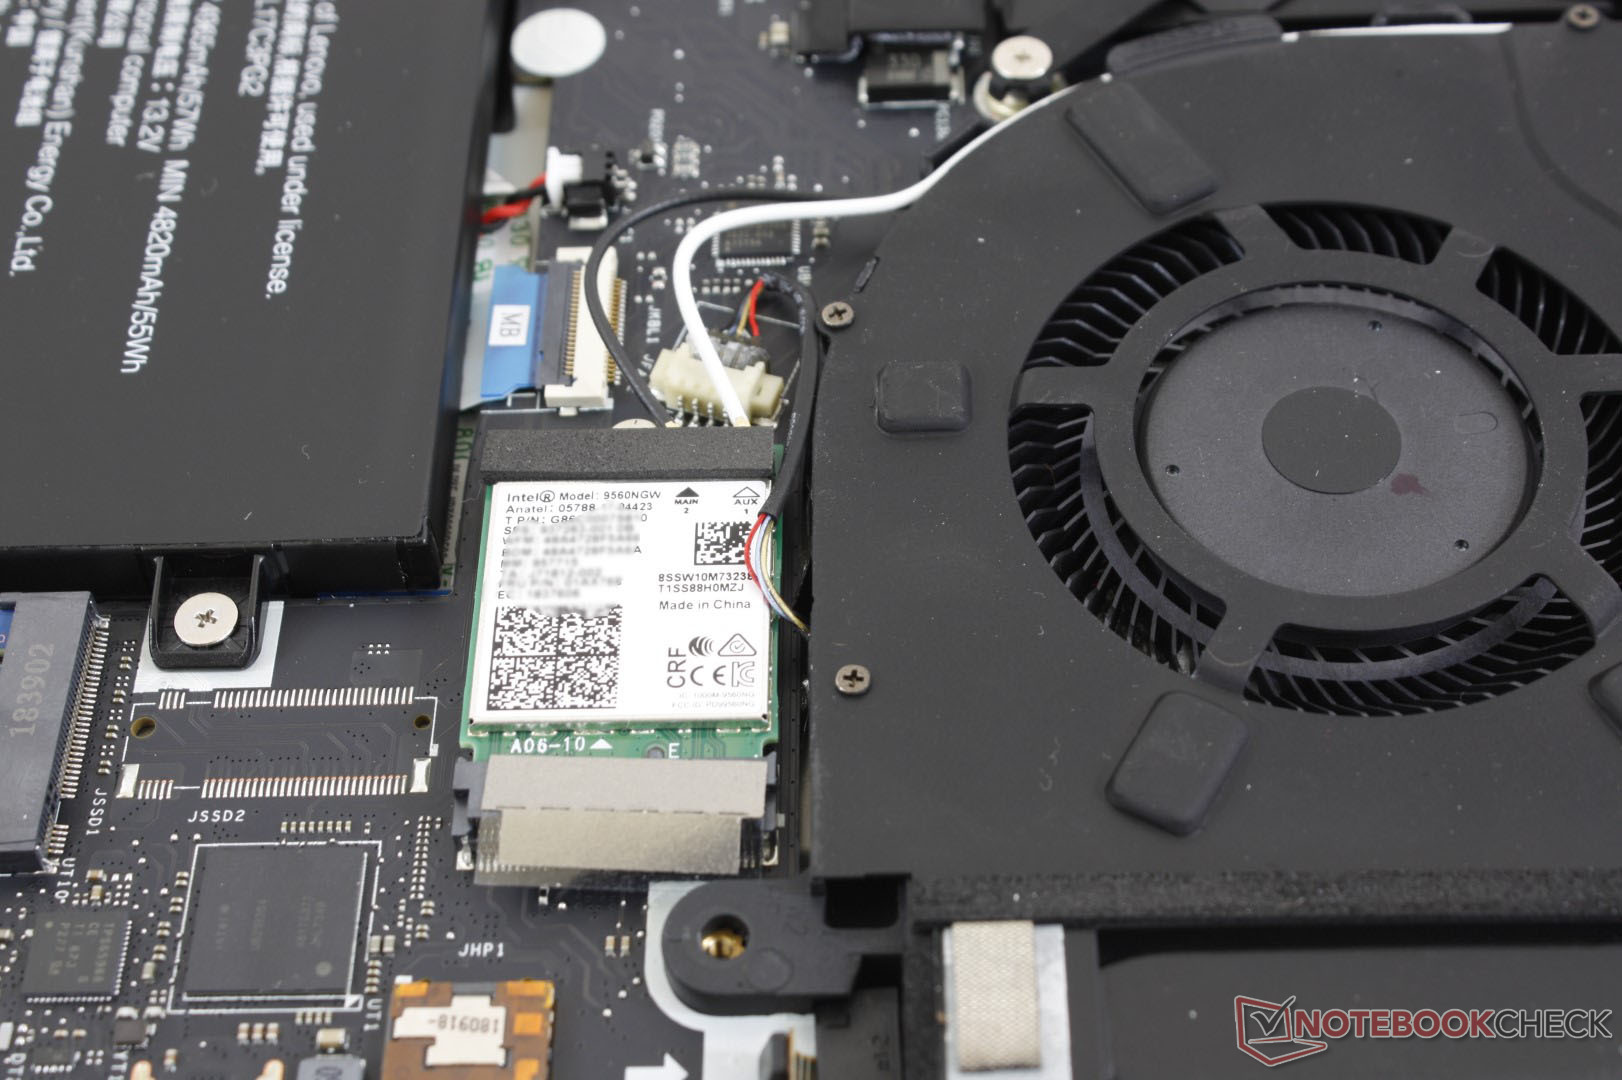
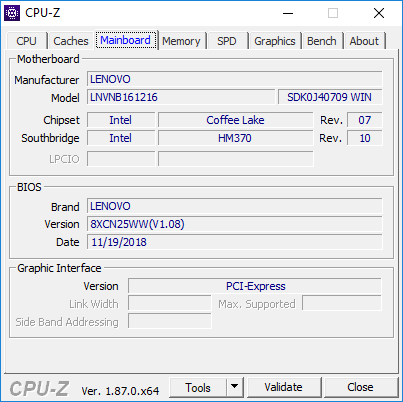
The official Lenovo product page does not specify what the wireless module is other than a vague "802.11 AC 2x2 + Bluetooth 4.1" statement. Upon closer inspection, we can confirm that our test unit is equipped with an even better Intel 9560 for speeds of up to 1.73 Gbps and integrated Bluetooth 5.0. In comparison, our Legion Y530 shipped with the slower 1x1 Intel 3165 module. Unfortunately, we can't guarantee that all retail units will include the Intel 9560 module as found here.
We experienced no connectivity issues during our time with the test unit. Transfer rates from an Intel 9560 are capable of much faster speeds than what we've recorded below since our server setup is limited by a 1 Gbps Ethernet line.
| Networking | |
| iperf3 transmit AX12 | |
| Lenovo Legion Y730-15ICH i5-8300H | |
| Razer Blade 15 Base Model | |
| Dell G7 15-7588 | |
| Lenovo Legion Y530-15ICH | |
| iperf3 receive AX12 | |
| Razer Blade 15 Base Model | |
| Dell G7 15-7588 | |
| Lenovo Legion Y730-15ICH i5-8300H | |
| Lenovo Legion Y530-15ICH | |
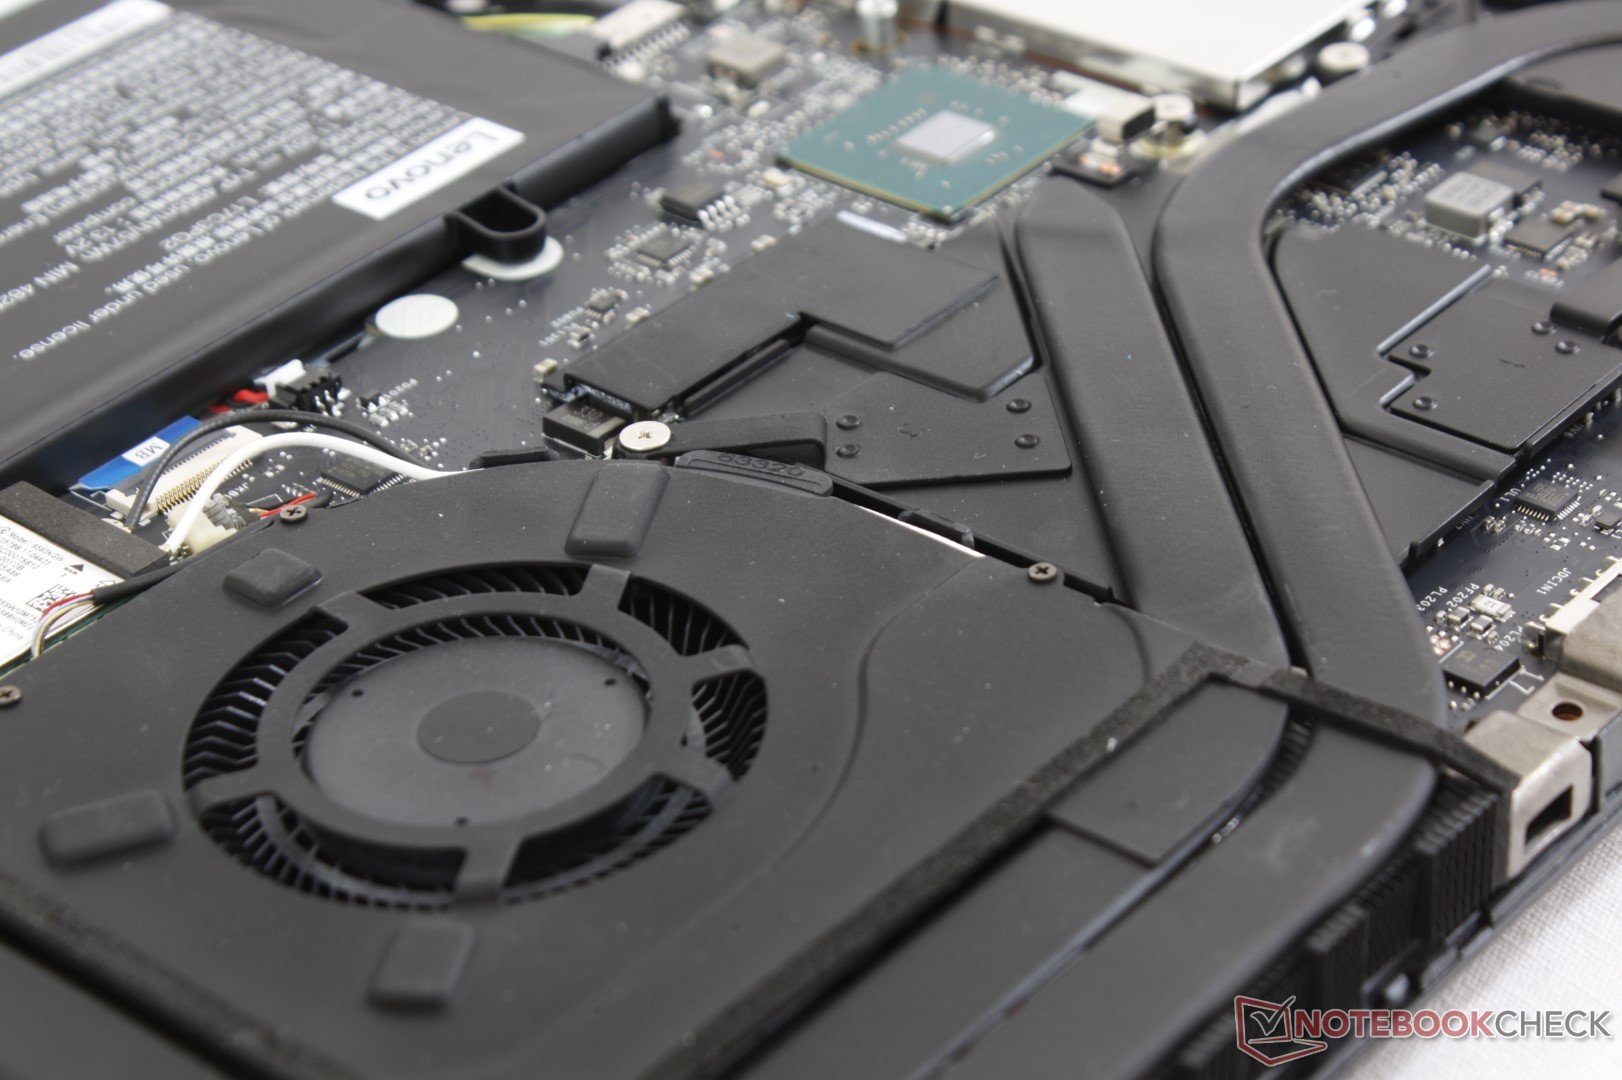
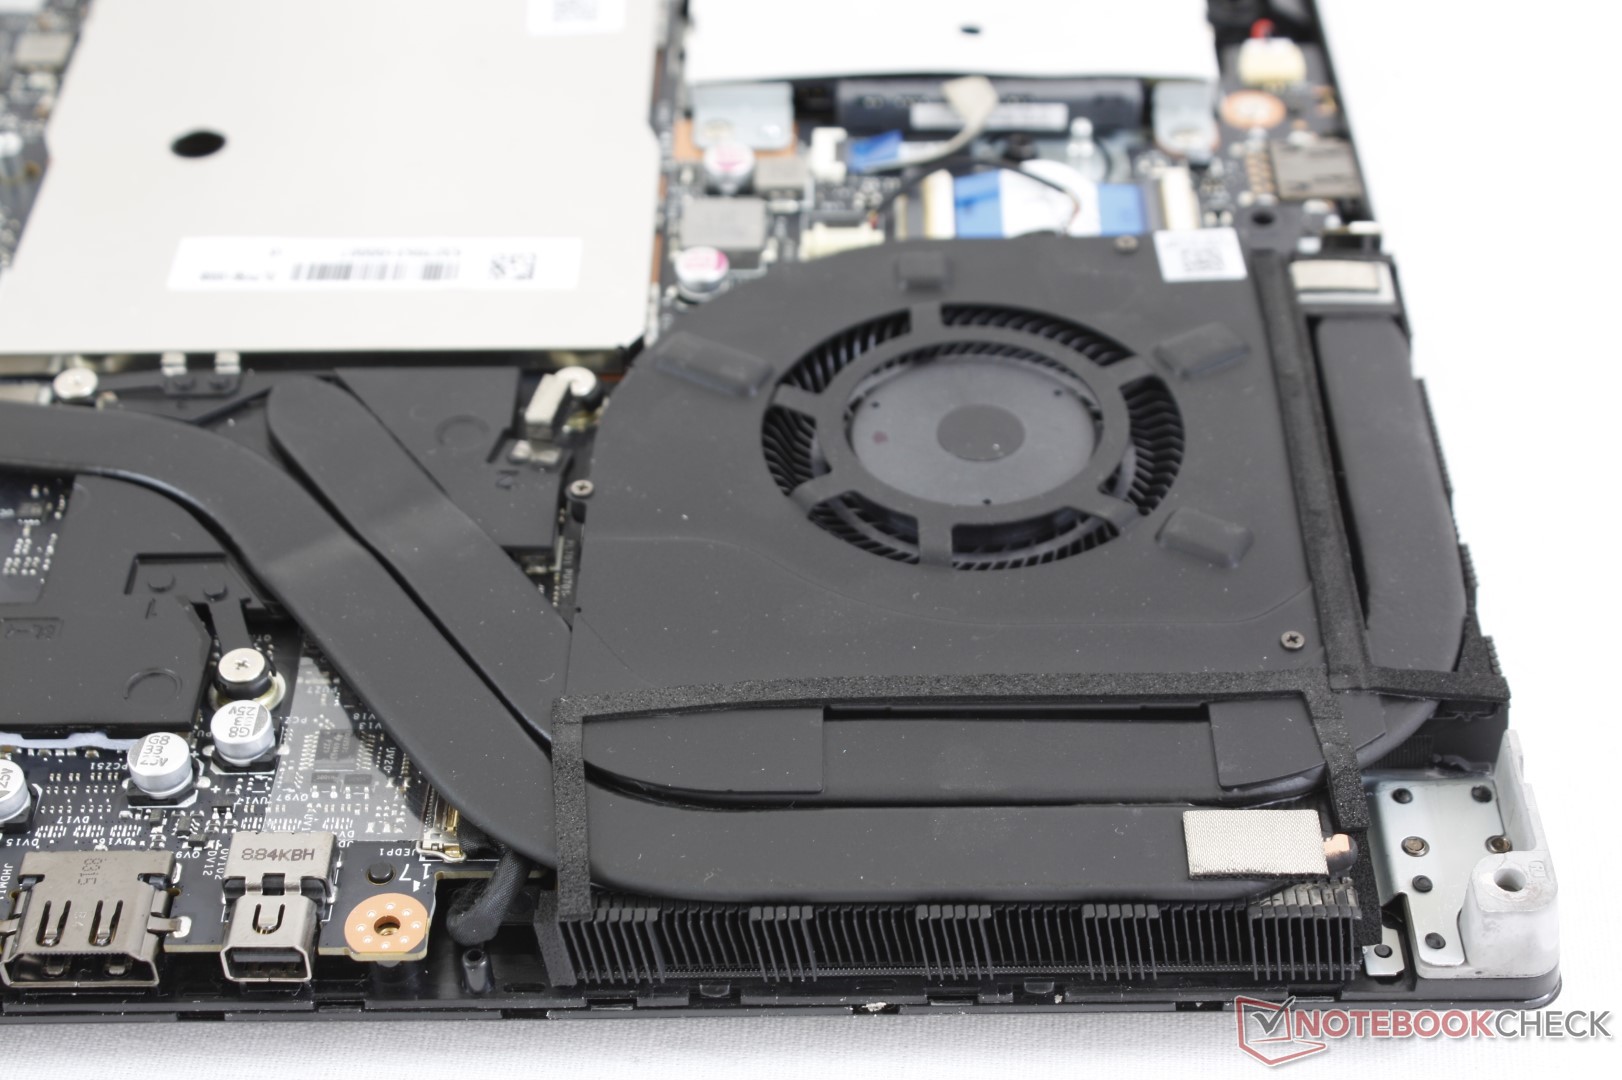
Maintenance
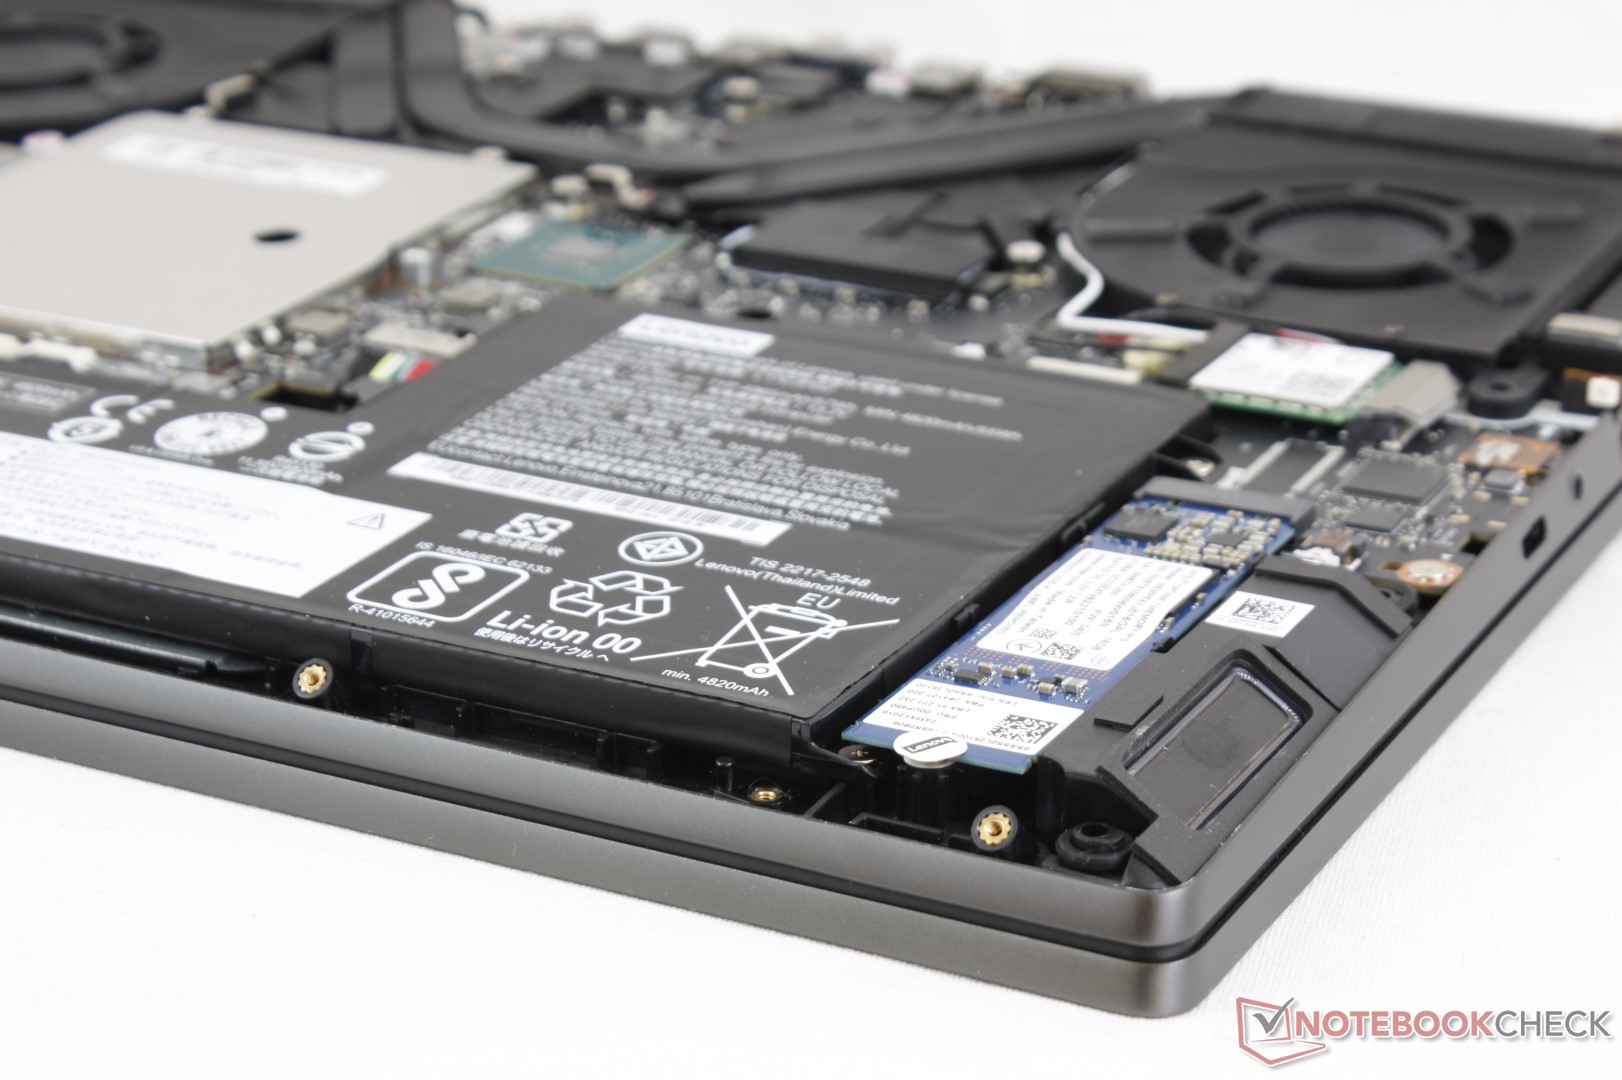
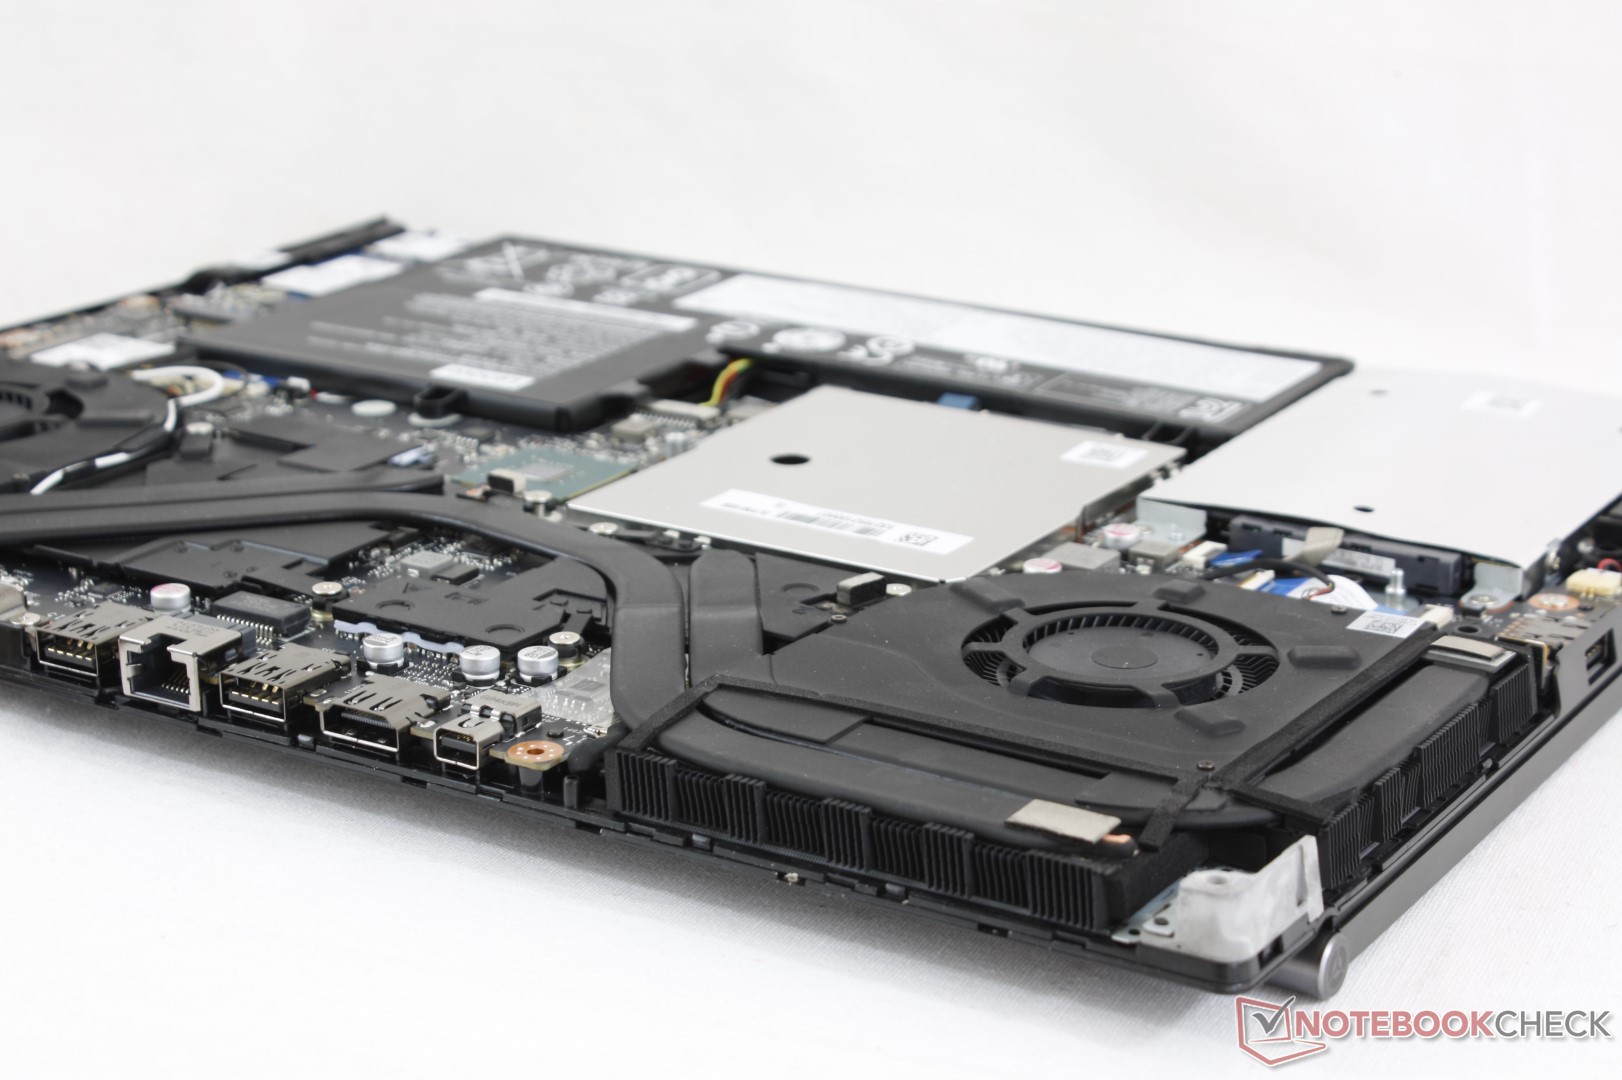
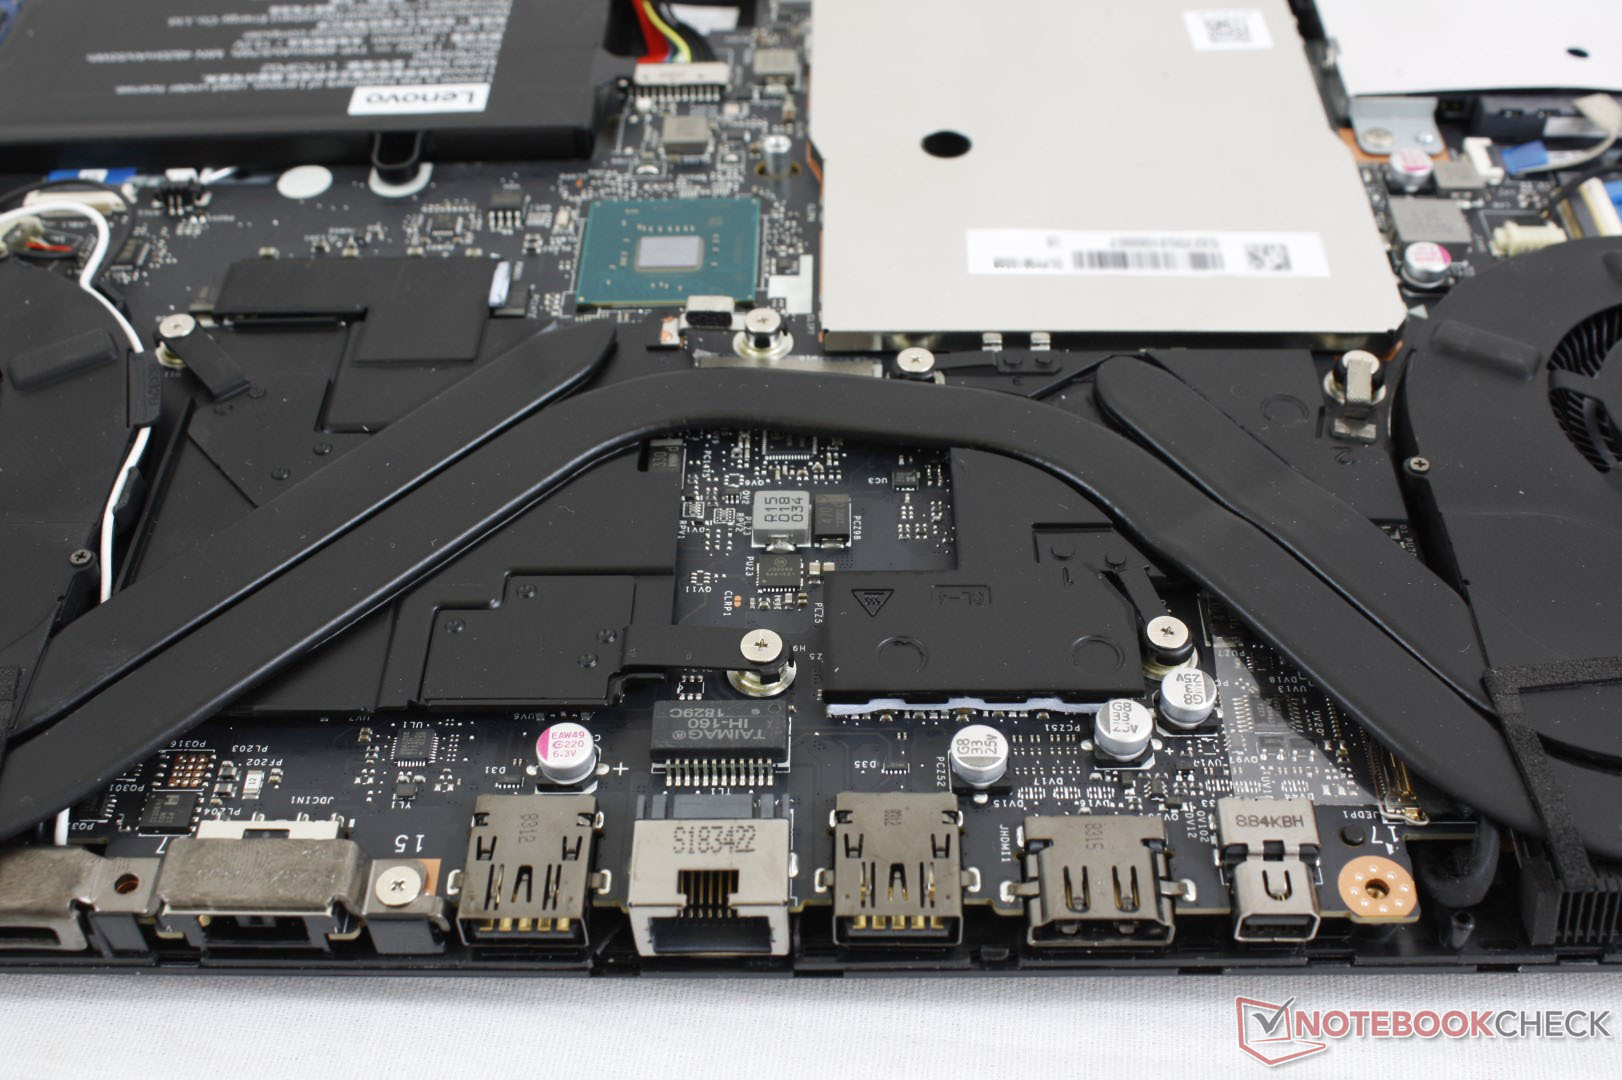
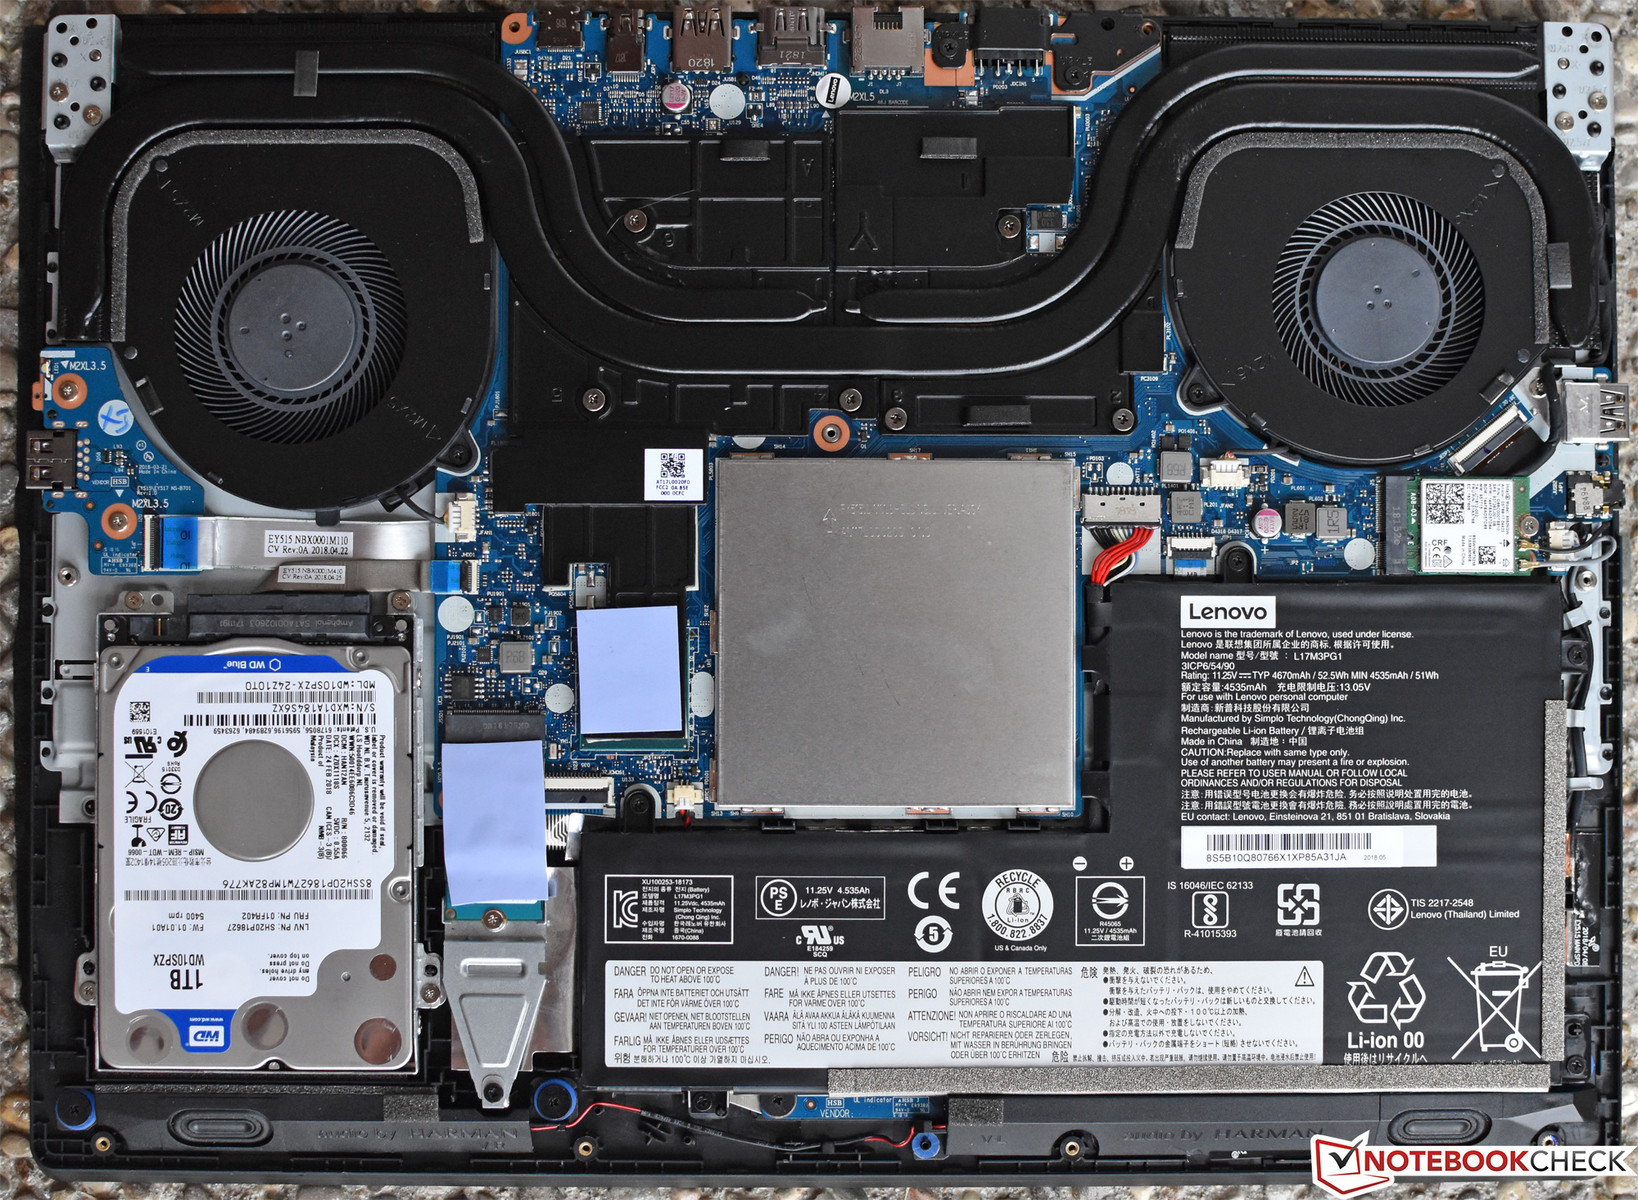
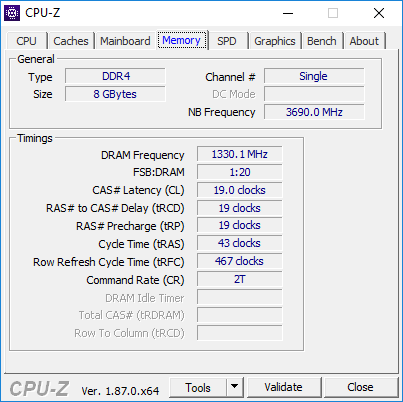
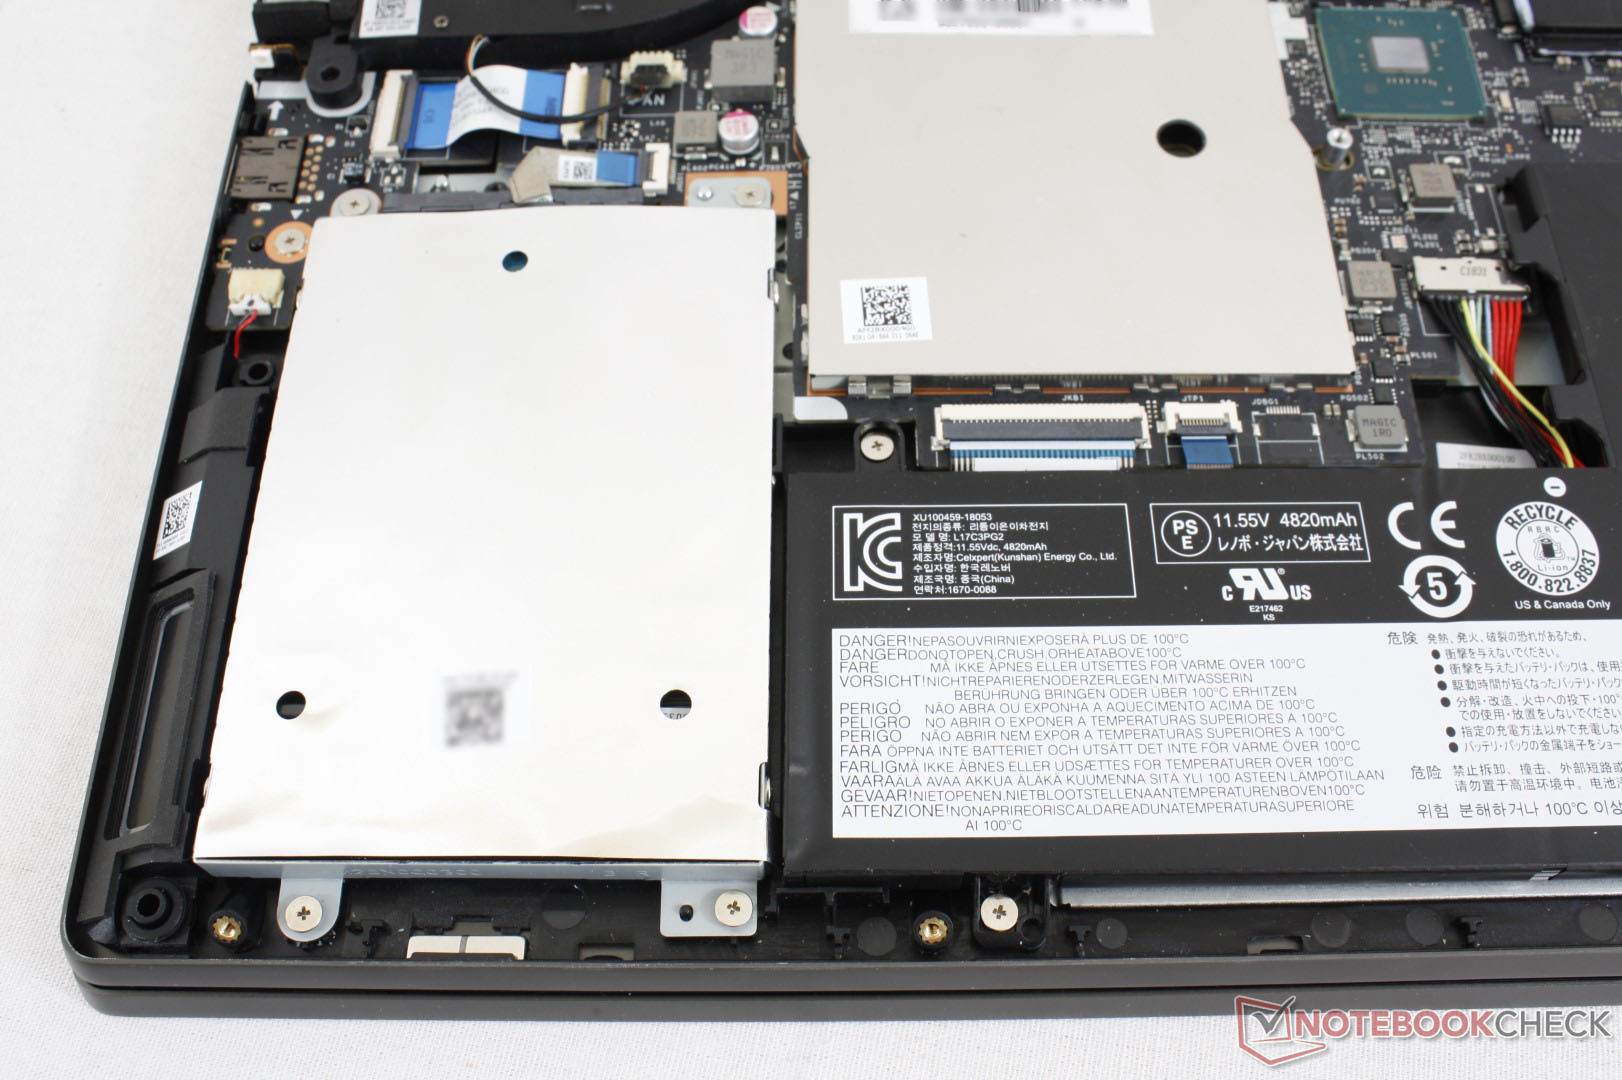
Servicing requires removing 11 Philips screws from the bottom panel. As shown by our images below, there are many similarities between the Legion Y730 and the Y530 in terms of layout and design. An aluminum cover makes RAM access more cumbersome.

Accessories and Warranty
There are no included extras in the box outside of the AC adapter, Quick Start guide, and warranty card.
The standard one-year limited warranty applies with options to extend up to three years. Please see our Guarantees, Return policies and Warranties article for country-specific information. Attempting to upgrade one of the storage drives may void the warranty as shown in our Storage Devices section below.
Input Devices
Keyboard
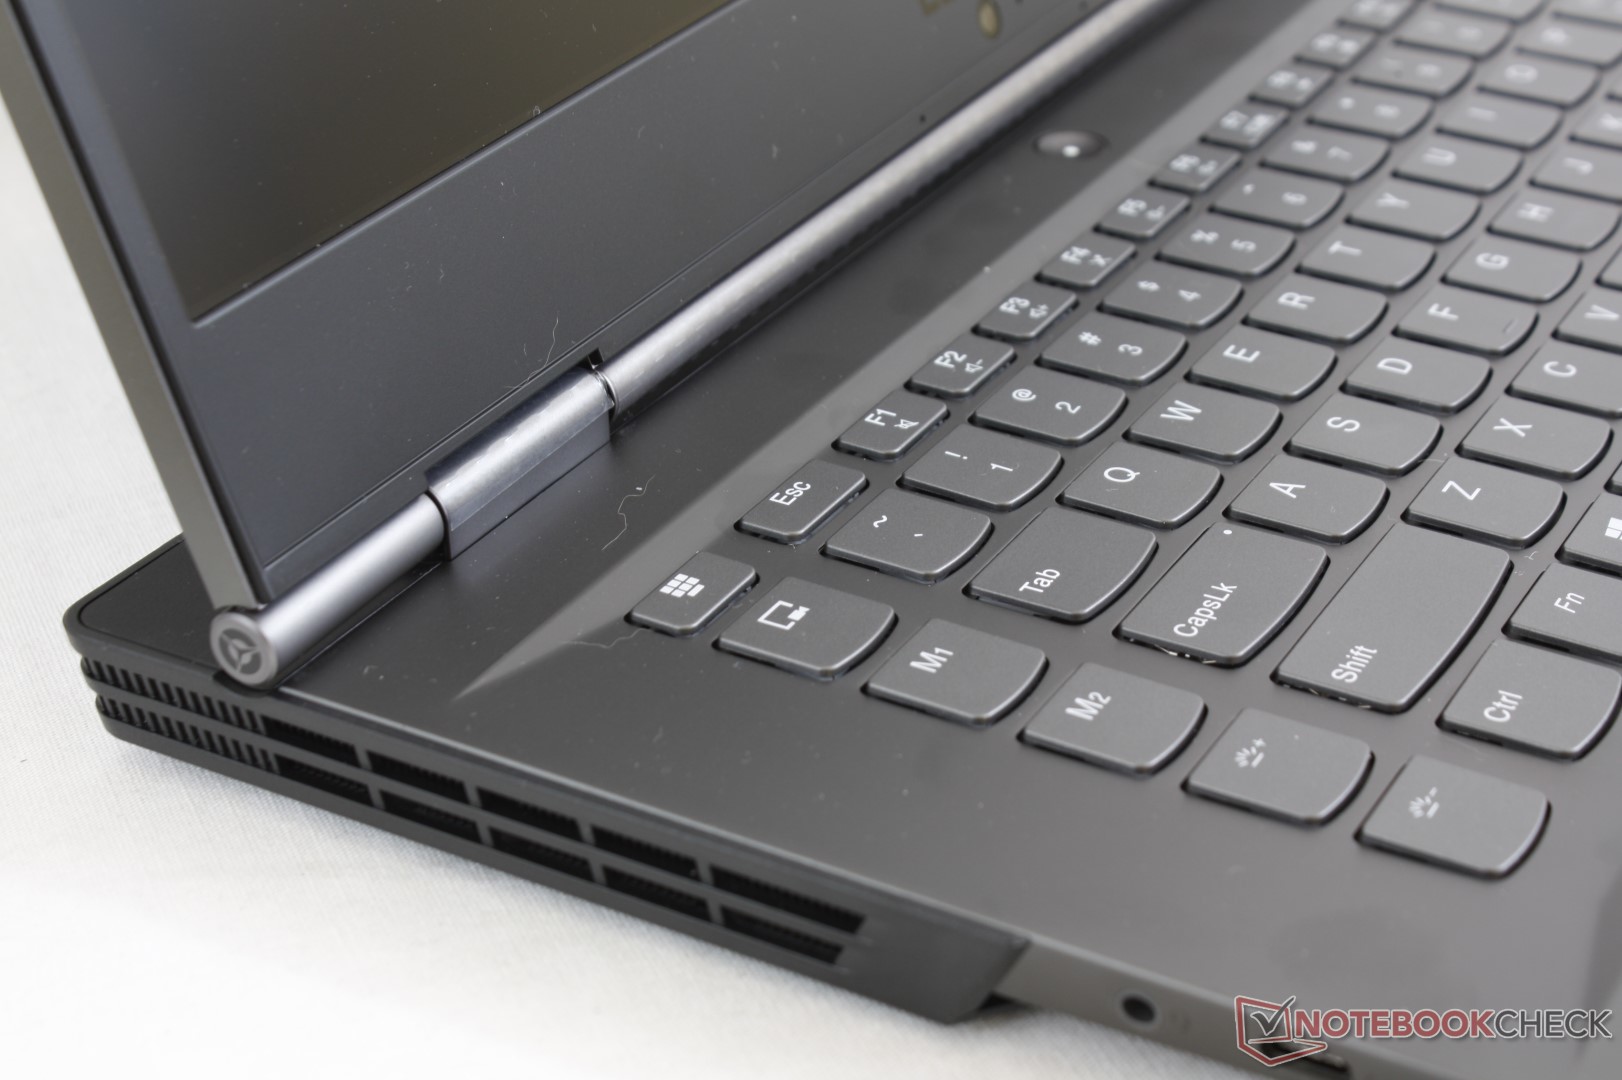
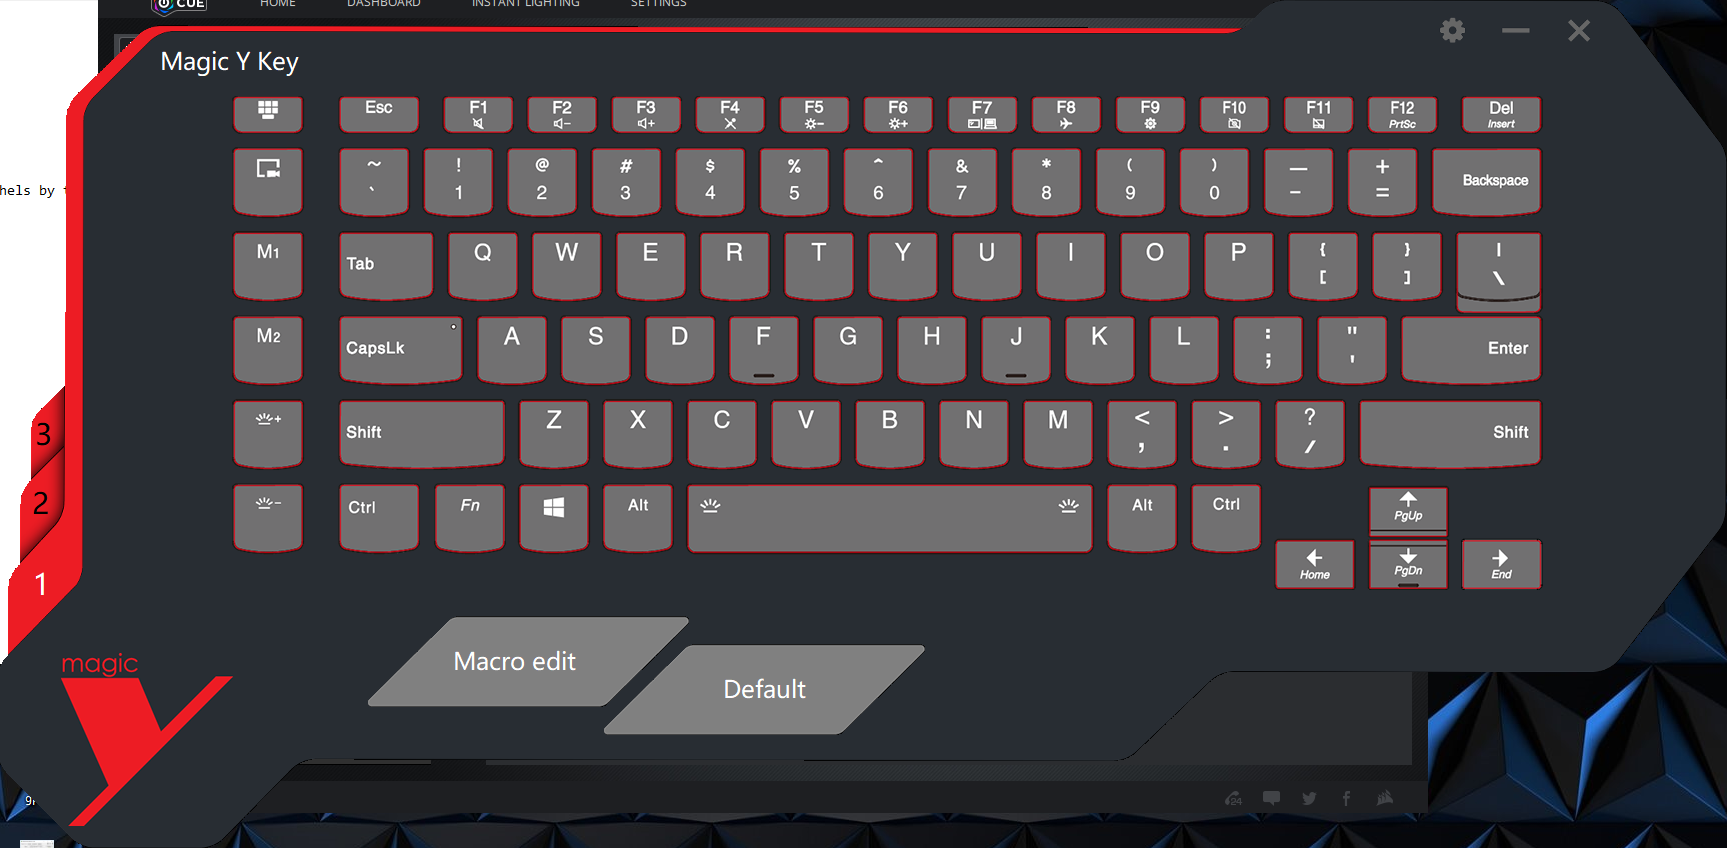
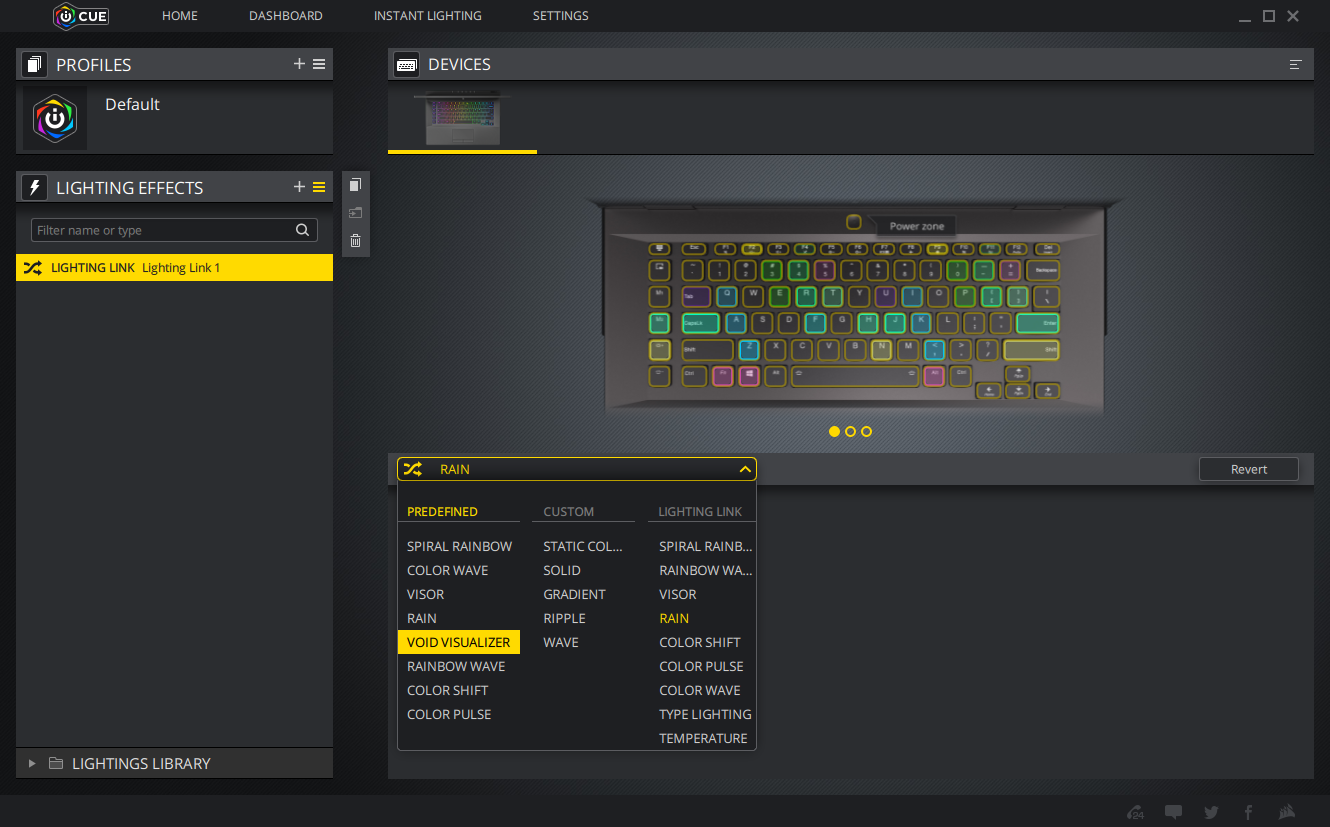
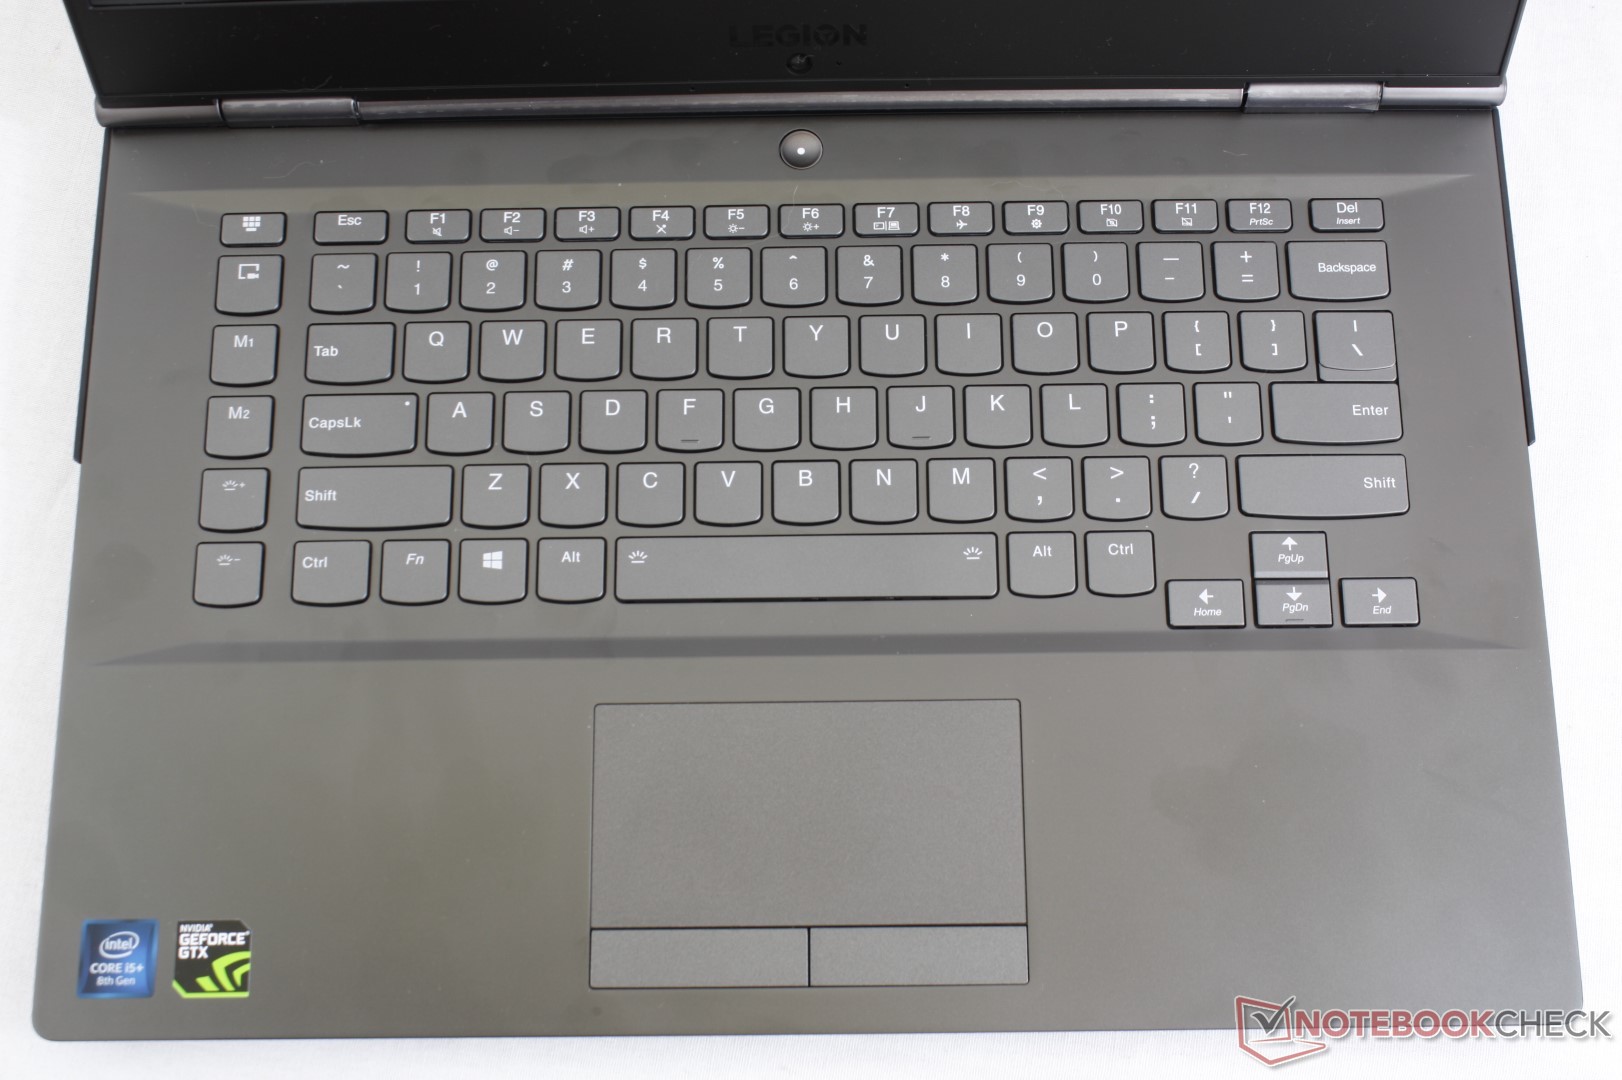
Lenovo has swapped out the NumPad as found on both the Y530 and 17.3-inch Y730-17ICH for a column of Macro keys along the left edge. Gamers may appreciate the change, but users who live by the NumPad may be upset by the sudden switcheroo. Nevertheless, the roomy anti-ghost keys are individually lit with 16 million colors to choose from much like on most pricier alternatives.
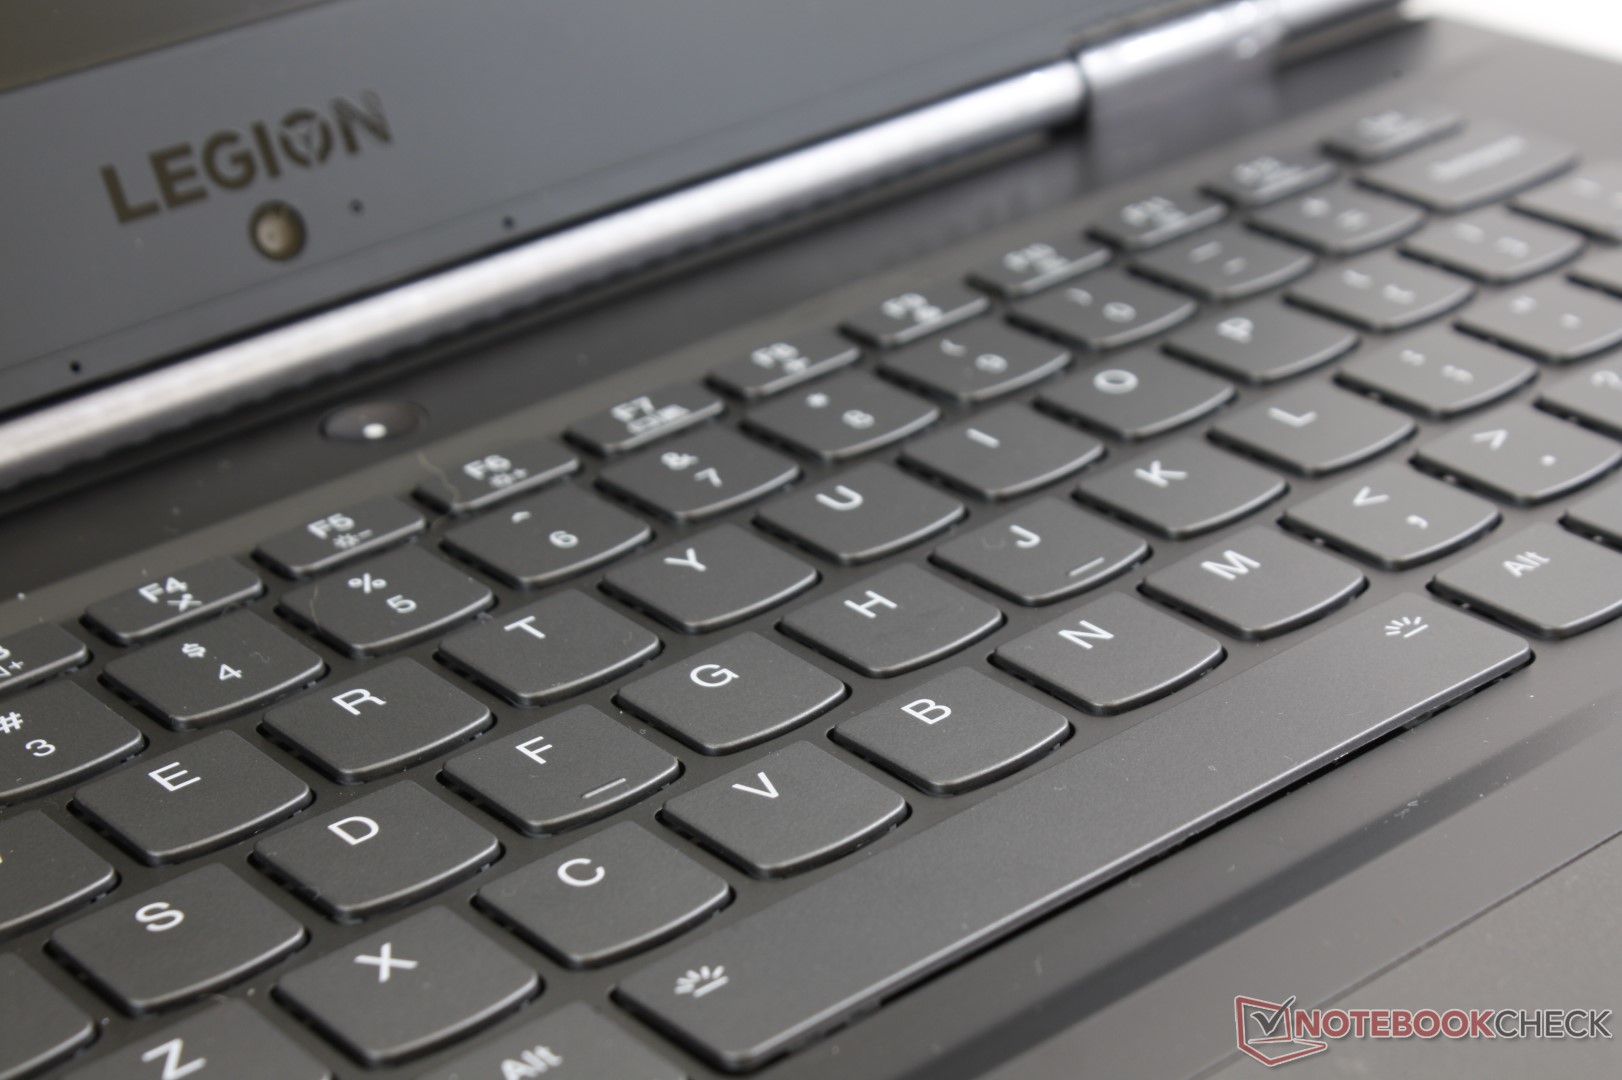
Unfortunately, key feedback is not up to our gaming standards. The keys are very light with shallow travel and spongy feedback when pressed for an unsatisfying typing experience. Perhaps the best aspect of the keyboard is its extremely soft clatter which can be useful if working in classrooms or other noise-sensitive environments.
Touchpad
The Precision trackpad is small at just 10.1 x 5.3 cm compared to 10.5 x 8.5 mm on the XPS 15 since the Lenovo utilizes dedicated mouse keys. The trackpad surface yields slightly when applying moderate pressure, but its surface is otherwise smooth with no sticking no matter the cursor speed. Multi-touch inputs can feel a bit cramped due to the short height of the trackpad.
The two dedicated mouse keys are very quiet with relatively deep travel and soft feedback. Users who prefer more "clicky" keys will find these keys to be too soft while users who prefer quieter key clatter will feel right at home. We would have preferred key travel to be a bit shallower to make presses easier.
Display
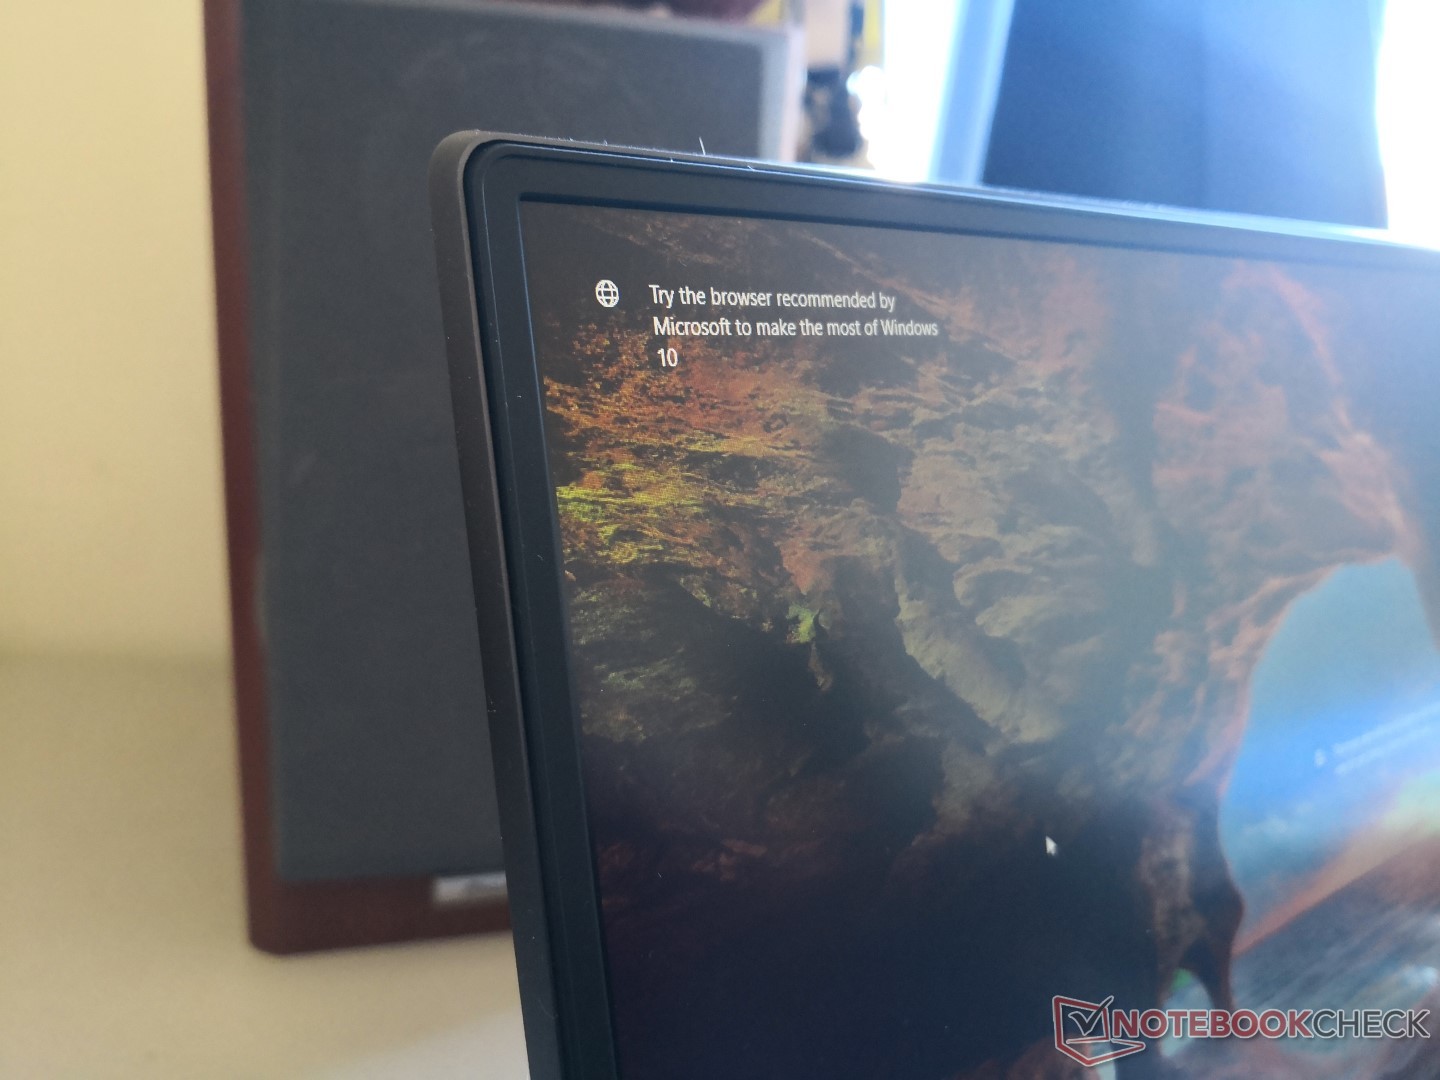
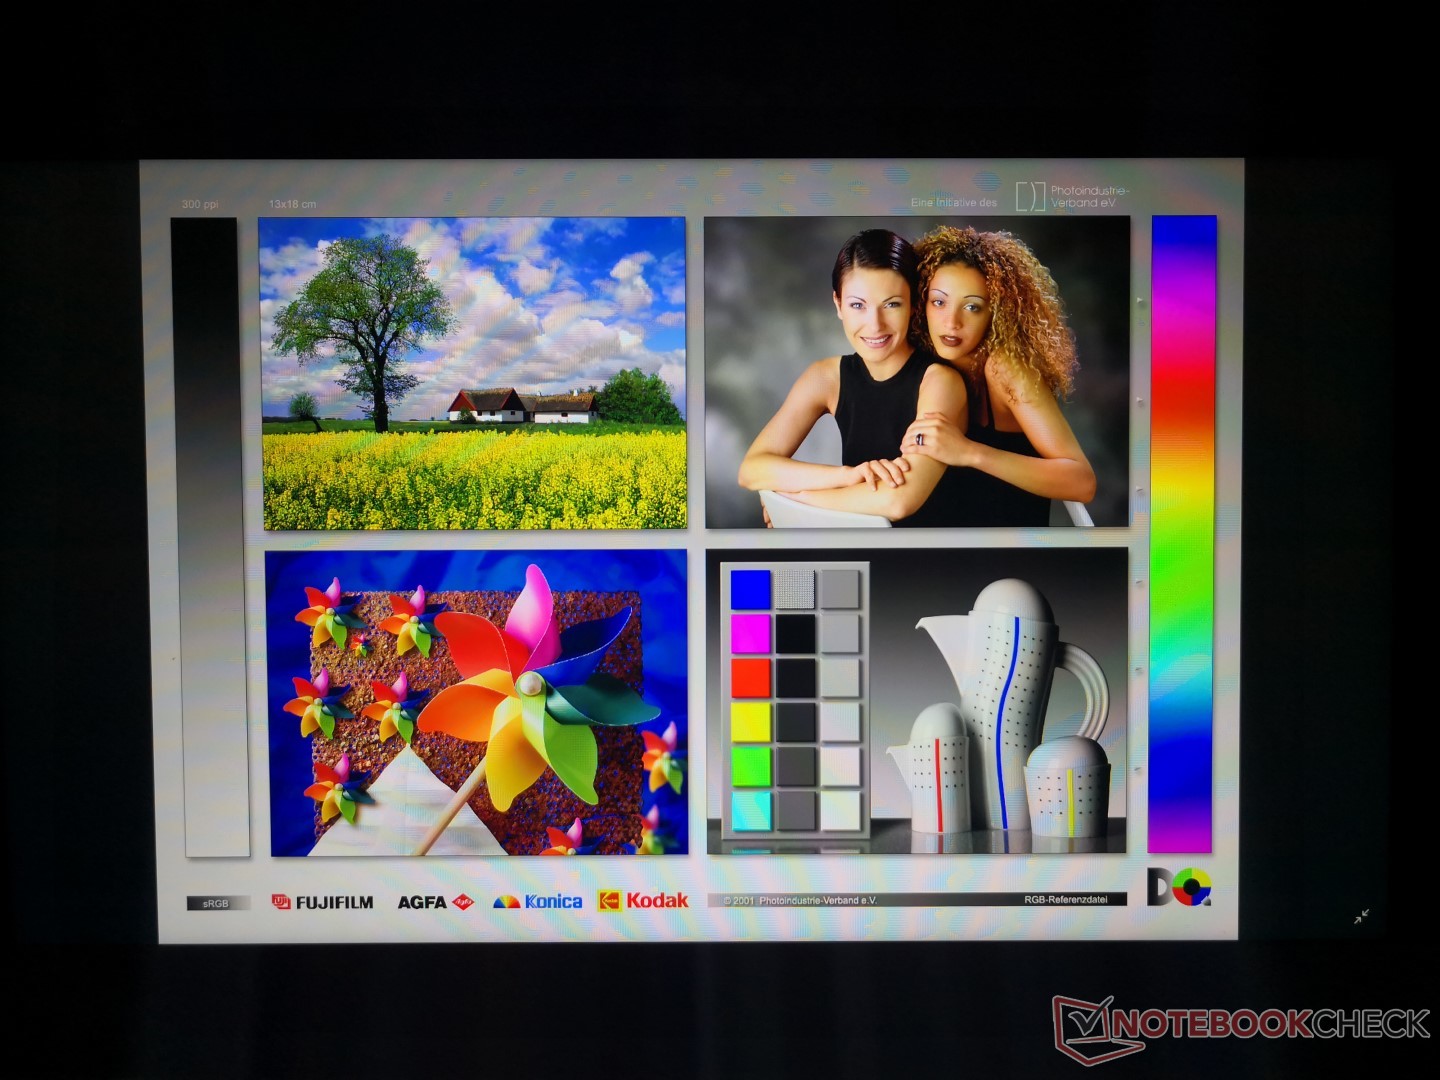
The default 1080p IPS matte screen is fixed with no other resolution or 120 Hz/5 ms options to choose from. In fact, the panel on our Lenovo unit is the same BOE NV156FHM-N61 panel as found on the Razer Blade 15 Base Model for very similar properties between them including color space, contrast, and response times. Consequently, the Lenovo panel suffers from the same drawbacks including heavier ghosting than many competitors. We are able to detect pulse-width modulation as well on all brightness levels except maximum.
Aside from the slow black-white and gray-gray response times, content appears crisp and almost free of any graininess to be close to a glossy panel. It's a mid-range display that sits in between the cheaper TN panels on budget multimedia laptops and the pricier IPS panels with higher refresh rates and faster response times.
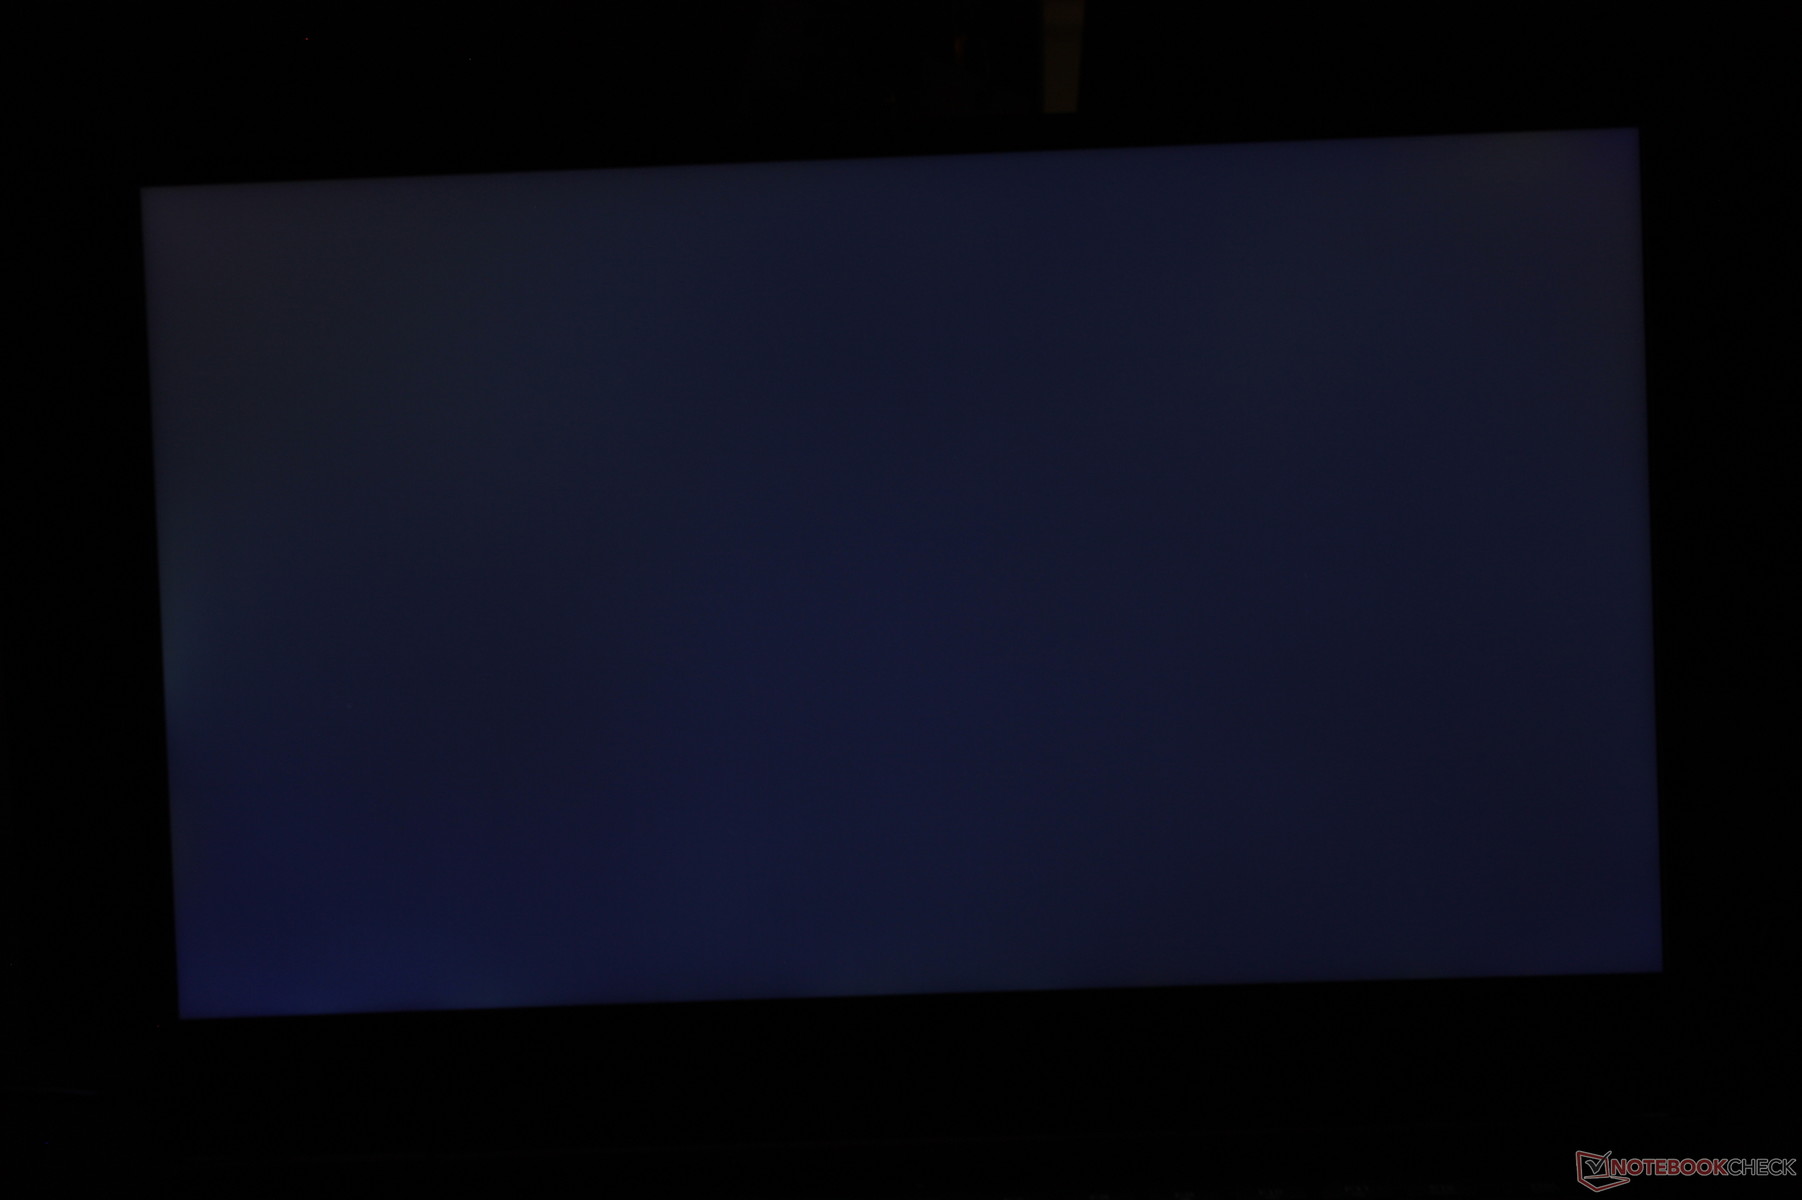
There is slight uneven backlight bleeding on our test unit as shown by the screenshot below. It is very faint and largely unnoticeable during day-to-day use and video playback.


| |||||||||||||||||||||||||
Brightness Distribution: 84 %
Center on Battery: 286.5 cd/m²
Contrast: 868:1 (Black: 0.33 cd/m²)
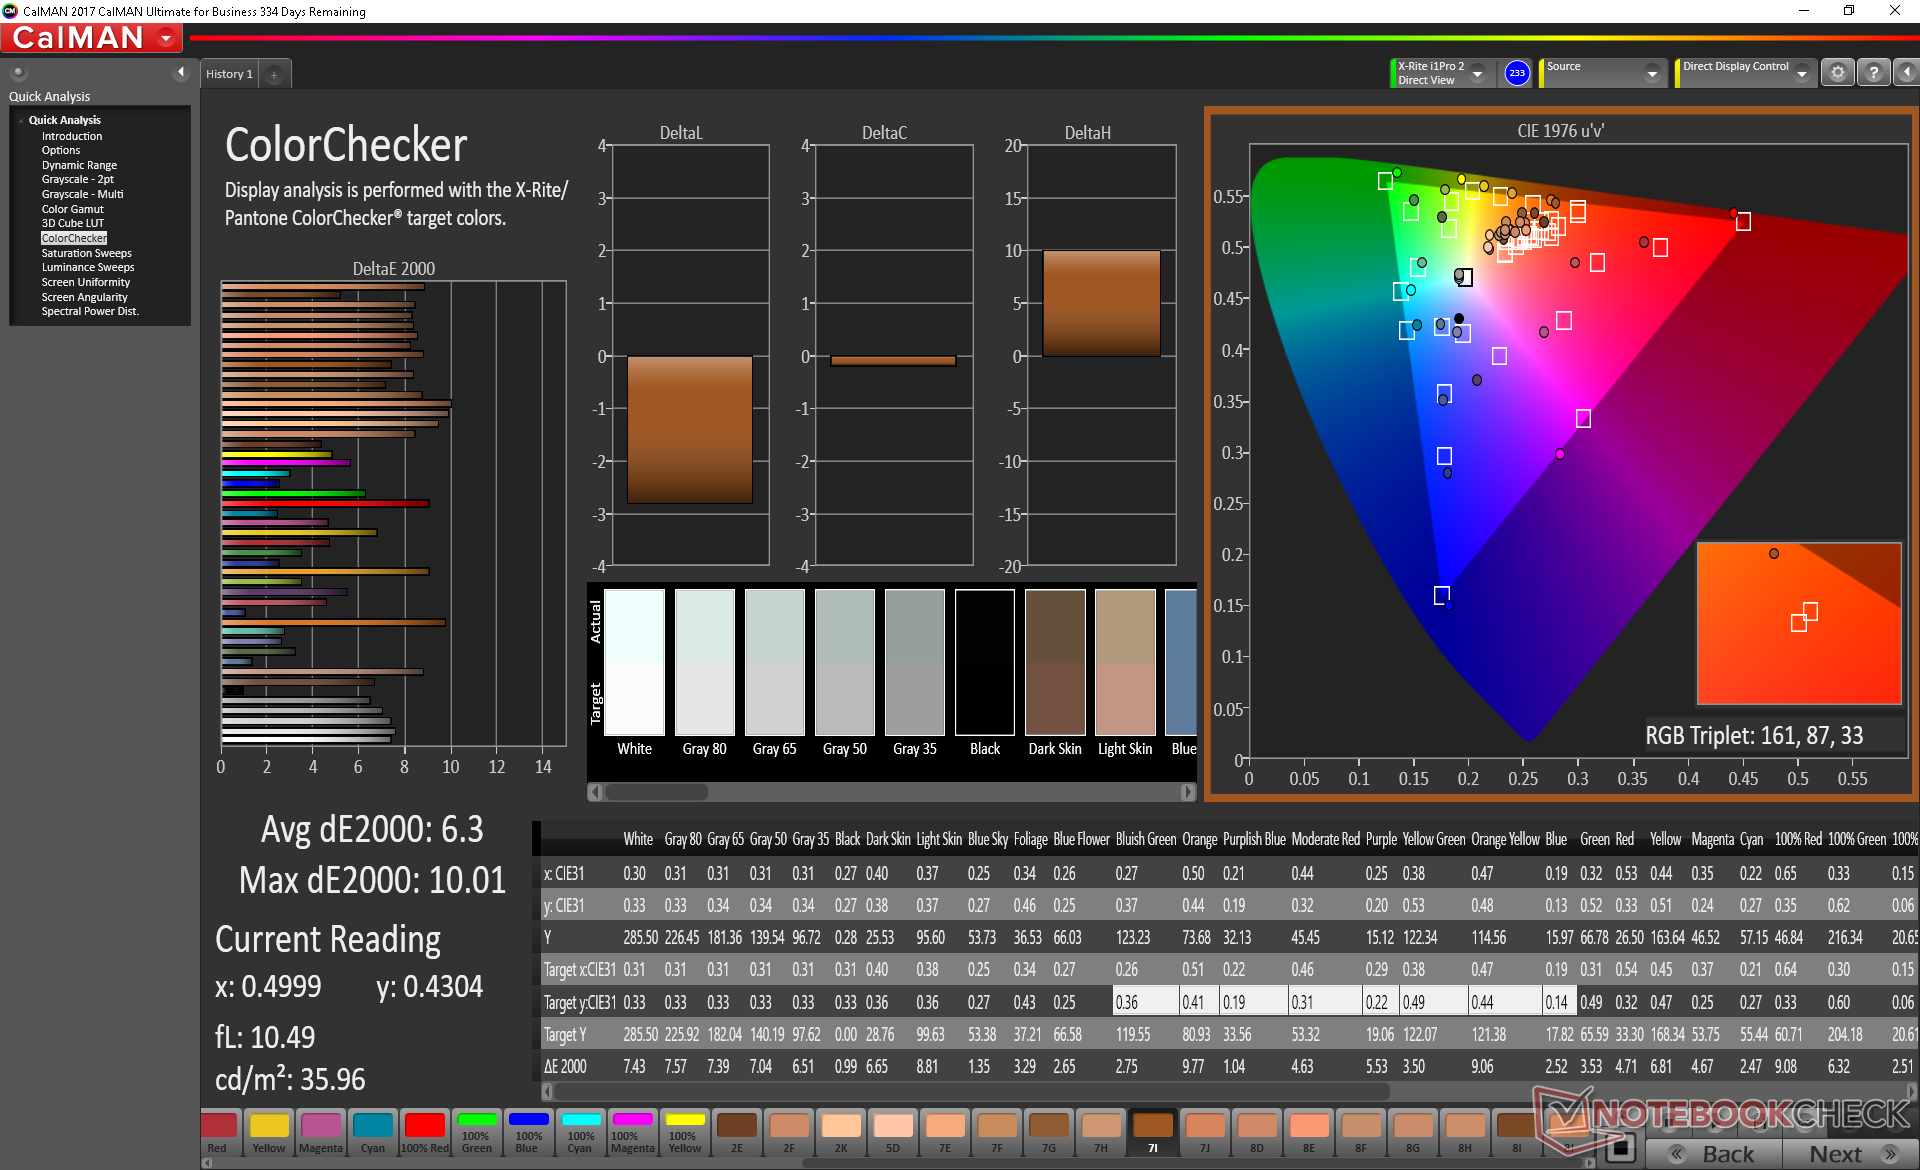
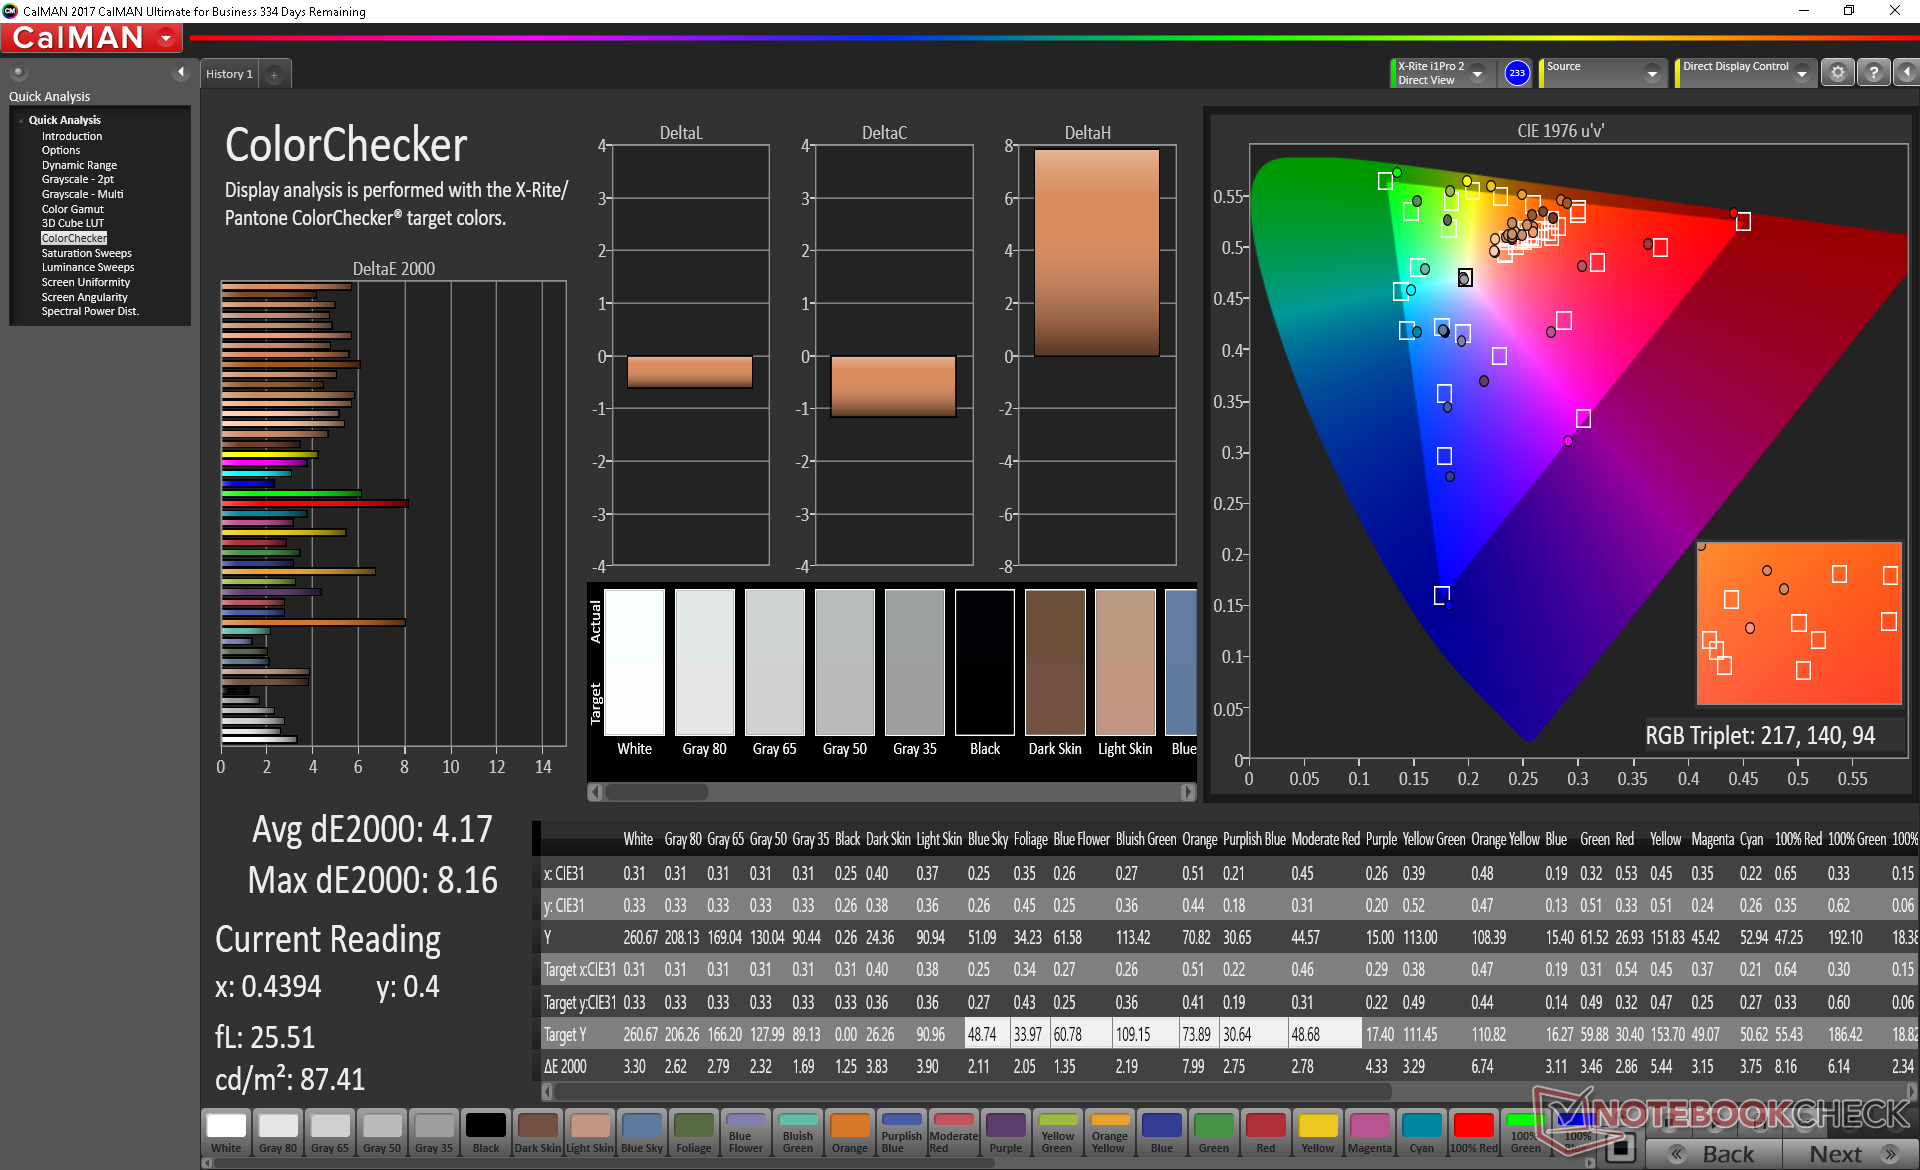
ΔE ColorChecker Calman: 6.3 | ∀{0.5-29.43 Ø4.73}
calibrated: 4.17
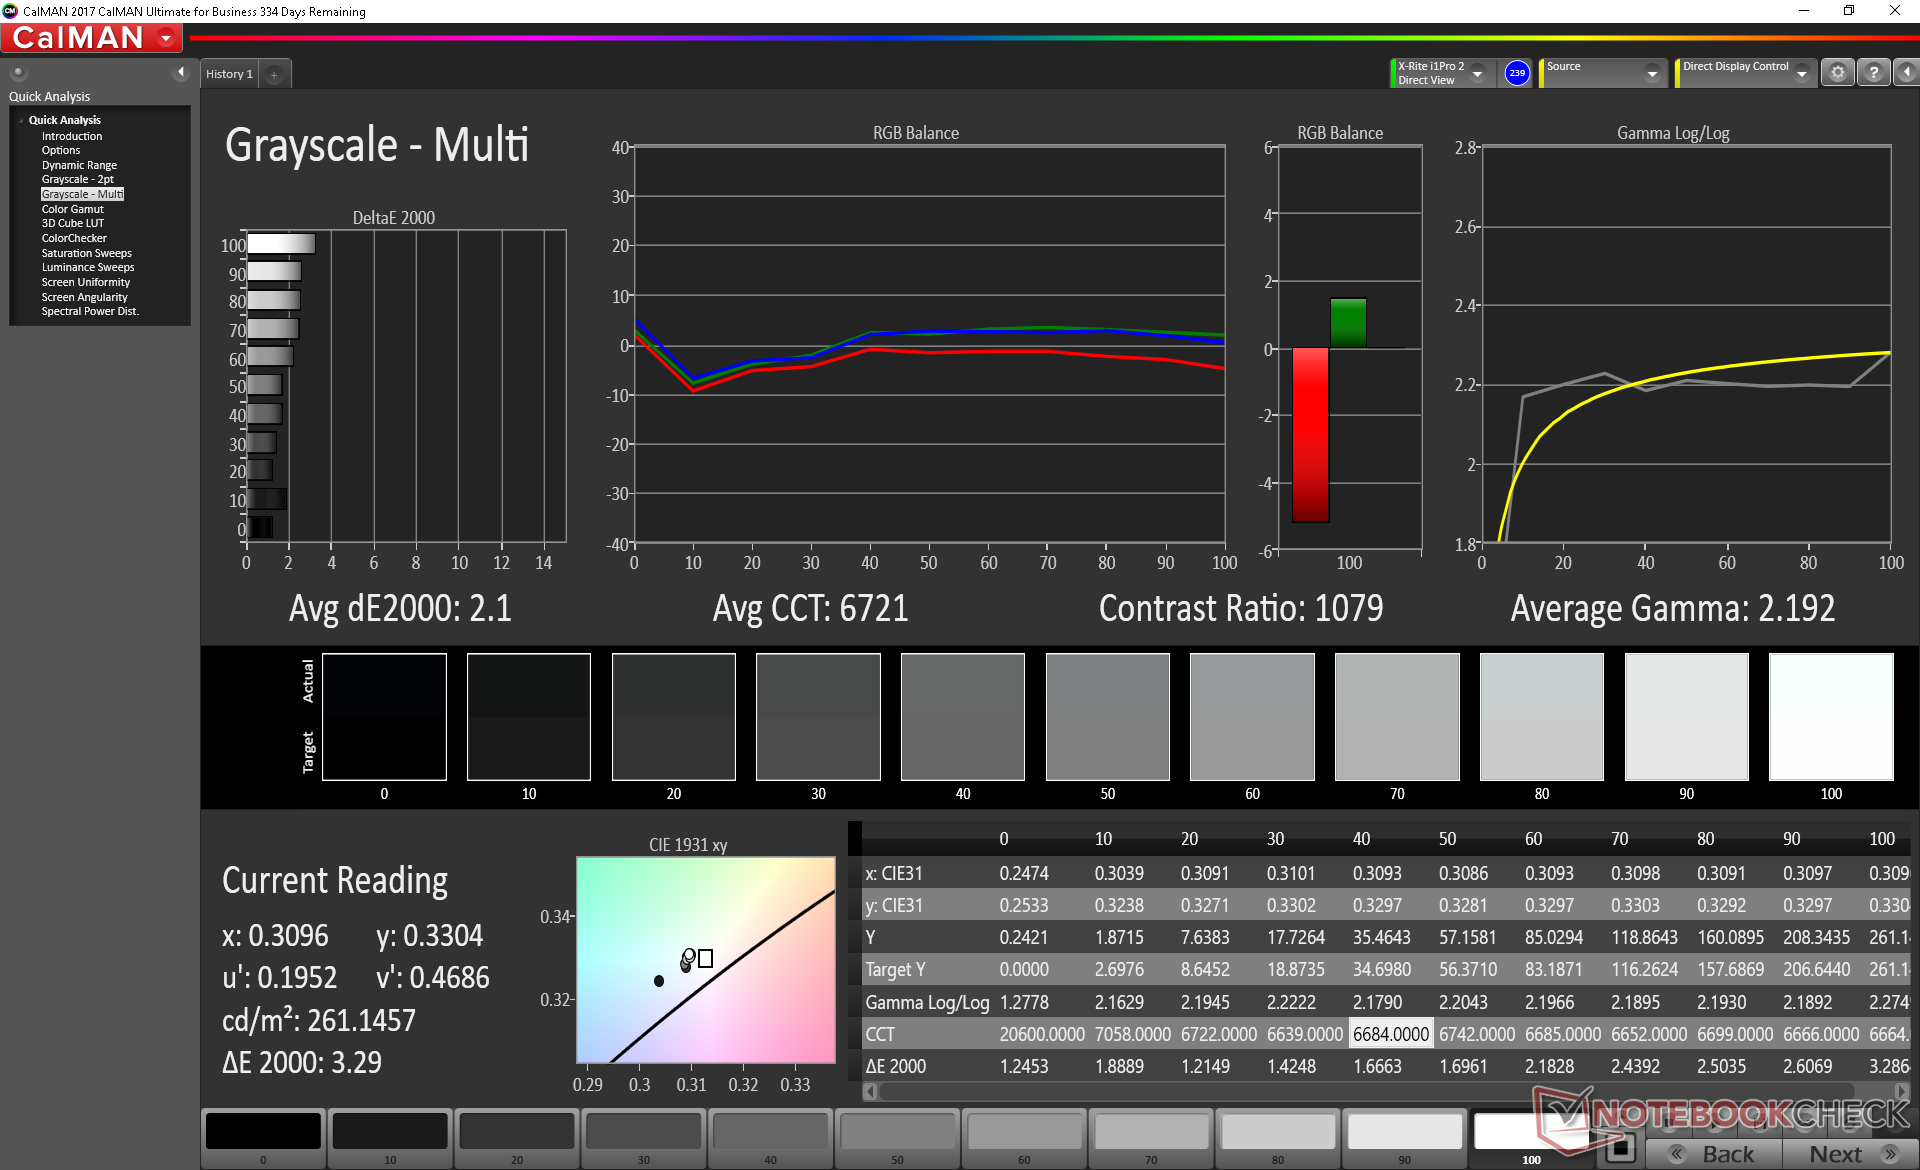
ΔE Greyscale Calman: 5.6 | ∀{0.09-98 Ø4.97}
85.1% sRGB (Argyll 1.6.3 3D)
55.7% AdobeRGB 1998 (Argyll 1.6.3 3D)
62.5% AdobeRGB 1998 (Argyll 3D)
85.5% sRGB (Argyll 3D)
65.9% Display P3 (Argyll 3D)
Gamma: 2.23
CCT: 6822 K
| Lenovo Legion Y730-15ICH i5-8300H BOE NV156FHM-N61, IPS, 15.6", 1920x1080 | Lenovo Legion Y530-15ICH LG Display LP156WFG-SPB2, IPS, 15.6", 1920x1080 | Dell G7 15-7588 LG Philips LGD053F, IPS, 15.6", 1920x1080 | Razer Blade 15 Base Model BOE NV156FHM-N61, IPS, 15.6", 1920x1080 | Asus FX504GD AU Optronics B156HTN03.8, TN LED, 15.6", 1920x1080 | MSI GF63 8RC AU Optronics B156HAN02.1, IPS, 15.6", 1920x1080 | |
|---|---|---|---|---|---|---|
| Display | 2% | -38% | 1% | -39% | -35% | |
| Display P3 Coverage (%) | 65.9 | 62.5 -5% | 37.82 -43% | 66.3 1% | 37.09 -44% | 39.43 -40% |
| sRGB Coverage (%) | 85.5 | 93 9% | 56.2 -34% | 86.6 1% | 55.8 -35% | 59.3 -31% |
| AdobeRGB 1998 Coverage (%) | 62.5 | 63.8 2% | 39.2 -37% | 63.3 1% | 38.34 -39% | 40.73 -35% |
| Response Times | 69% | 22% | 11% | 33% | 28% | |
| Response Time Grey 50% / Grey 80% * (ms) | 43.2 ? | 15 ? 65% | 38.8 ? 10% | 39.2 ? 9% | 41.6 ? 4% | 33.2 ? 23% |
| Response Time Black / White * (ms) | 40 ? | 11 ? 72% | 26.8 ? 33% | 35.2 ? 12% | 15.2 ? 62% | 27.2 ? 32% |
| PWM Frequency (Hz) | 21740 ? | 21190 ? | ||||
| Screen | 7% | -30% | 15% | -33% | -10% | |
| Brightness middle (cd/m²) | 286.5 | 305 6% | 250.9 -12% | 273.6 -5% | 260 -9% | 266.6 -7% |
| Brightness (cd/m²) | 269 | 284 6% | 246 -9% | 262 -3% | 241 -10% | 257 -4% |
| Brightness Distribution (%) | 84 | 83 -1% | 89 6% | 86 2% | 85 1% | 89 6% |
| Black Level * (cd/m²) | 0.33 | 0.52 -58% | 0.34 -3% | 0.3 9% | 0.55 -67% | 0.29 12% |
| Contrast (:1) | 868 | 587 -32% | 738 -15% | 912 5% | 473 -46% | 919 6% |
| Colorchecker dE 2000 * | 6.3 | 3.63 42% | 7.34 -17% | 3.22 49% | 7 -11% | 5.93 6% |
| Colorchecker dE 2000 max. * | 10.01 | 8.18 18% | 28.66 -186% | 7.61 24% | 22.52 -125% | 16.28 -63% |
| Colorchecker dE 2000 calibrated * | 4.17 | 1.31 69% | 4.42 -6% | 4.1 2% | 5.27 -26% | 3.6 14% |
| Greyscale dE 2000 * | 5.6 | 4.77 15% | 6.8 -21% | 1.4 75% | 6.1 -9% | 6.8 -21% |
| Gamma | 2.23 99% | 2.54 87% | 2.164 102% | 2.24 98% | 1.97 112% | 2.43 91% |
| CCT | 6822 95% | 7500 87% | 6780 96% | 6636 98% | 7894 82% | 7192 90% |
| Color Space (Percent of AdobeRGB 1998) (%) | 55.7 | 59 6% | 36 -35% | 56.4 1% | 35.5 -36% | 37.6 -32% |
| Color Space (Percent of sRGB) (%) | 85.1 | 93 9% | 56 -34% | 86.2 1% | 61 -28% | 59.3 -30% |
| Total Average (Program / Settings) | 26% /
14% | -15% /
-25% | 9% /
12% | -13% /
-26% | -6% /
-10% |
* ... smaller is better
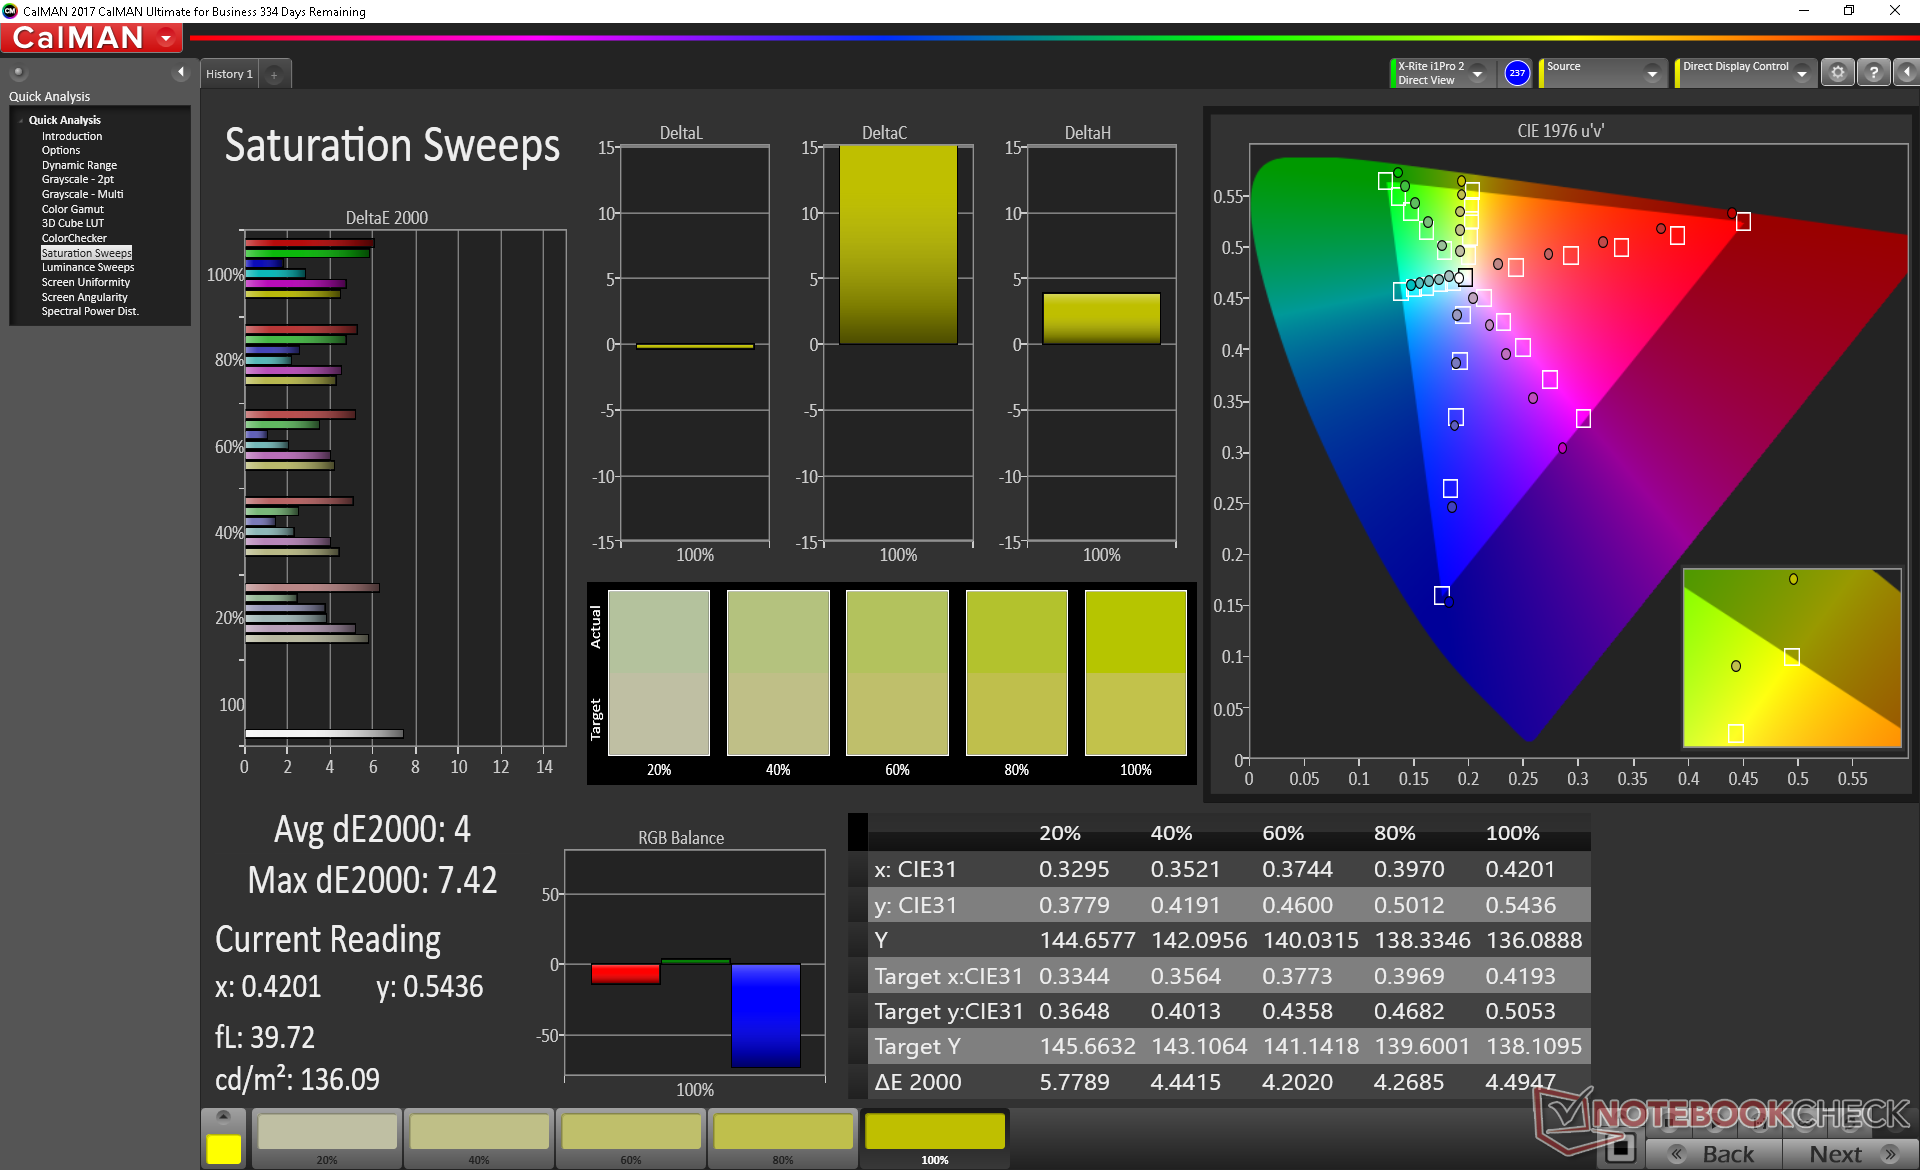
Color space is actually slightly narrower than the LG panel on the less expensive Legion T530. Still, it is thankfully much wider than the panels on the Asus FX504 or MSI GF63 for noticeably deeper colors. Cheaper panels tend to cover ~60 percent of sRGB compared to 85 percent on our Lenovo panel. Gamers who desire full sRGB coverage may want to consider the 15-inch Asus ZenBook UX580 where 100 percent sRGB options exist.

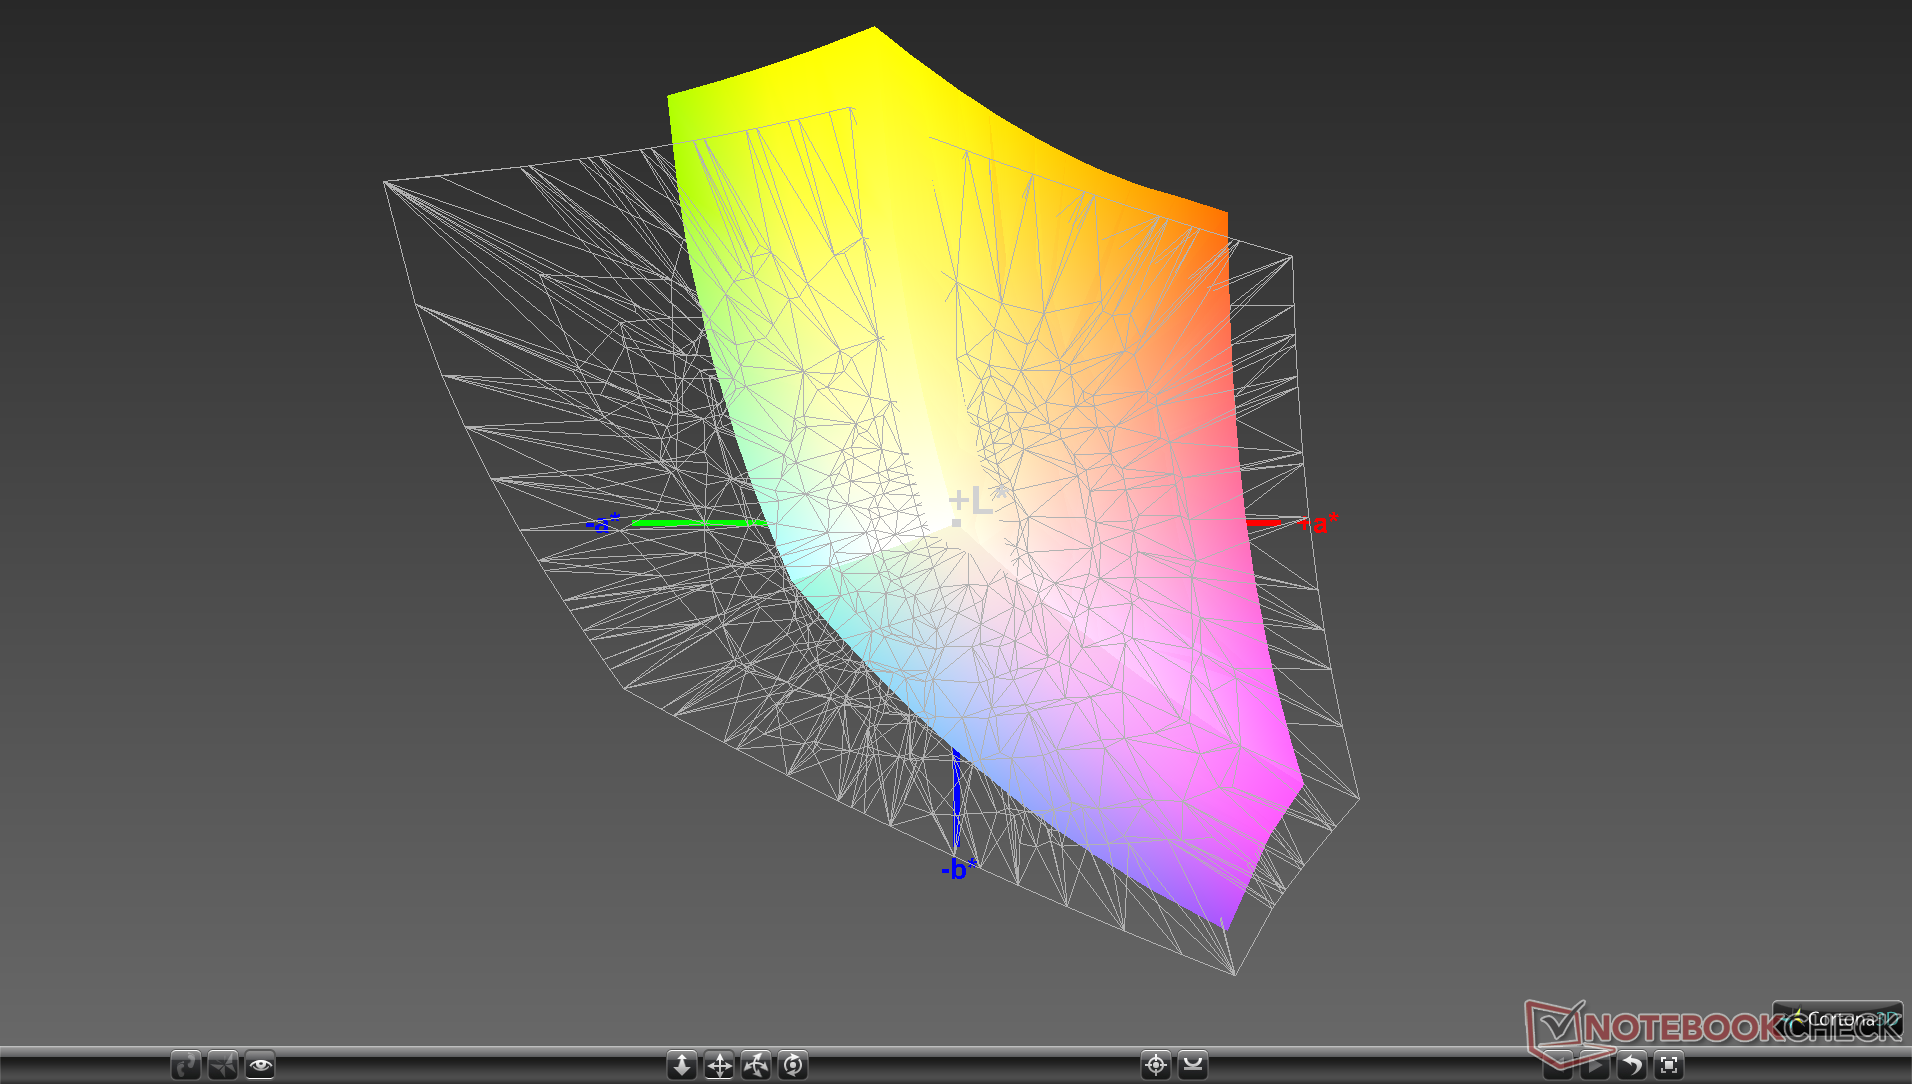
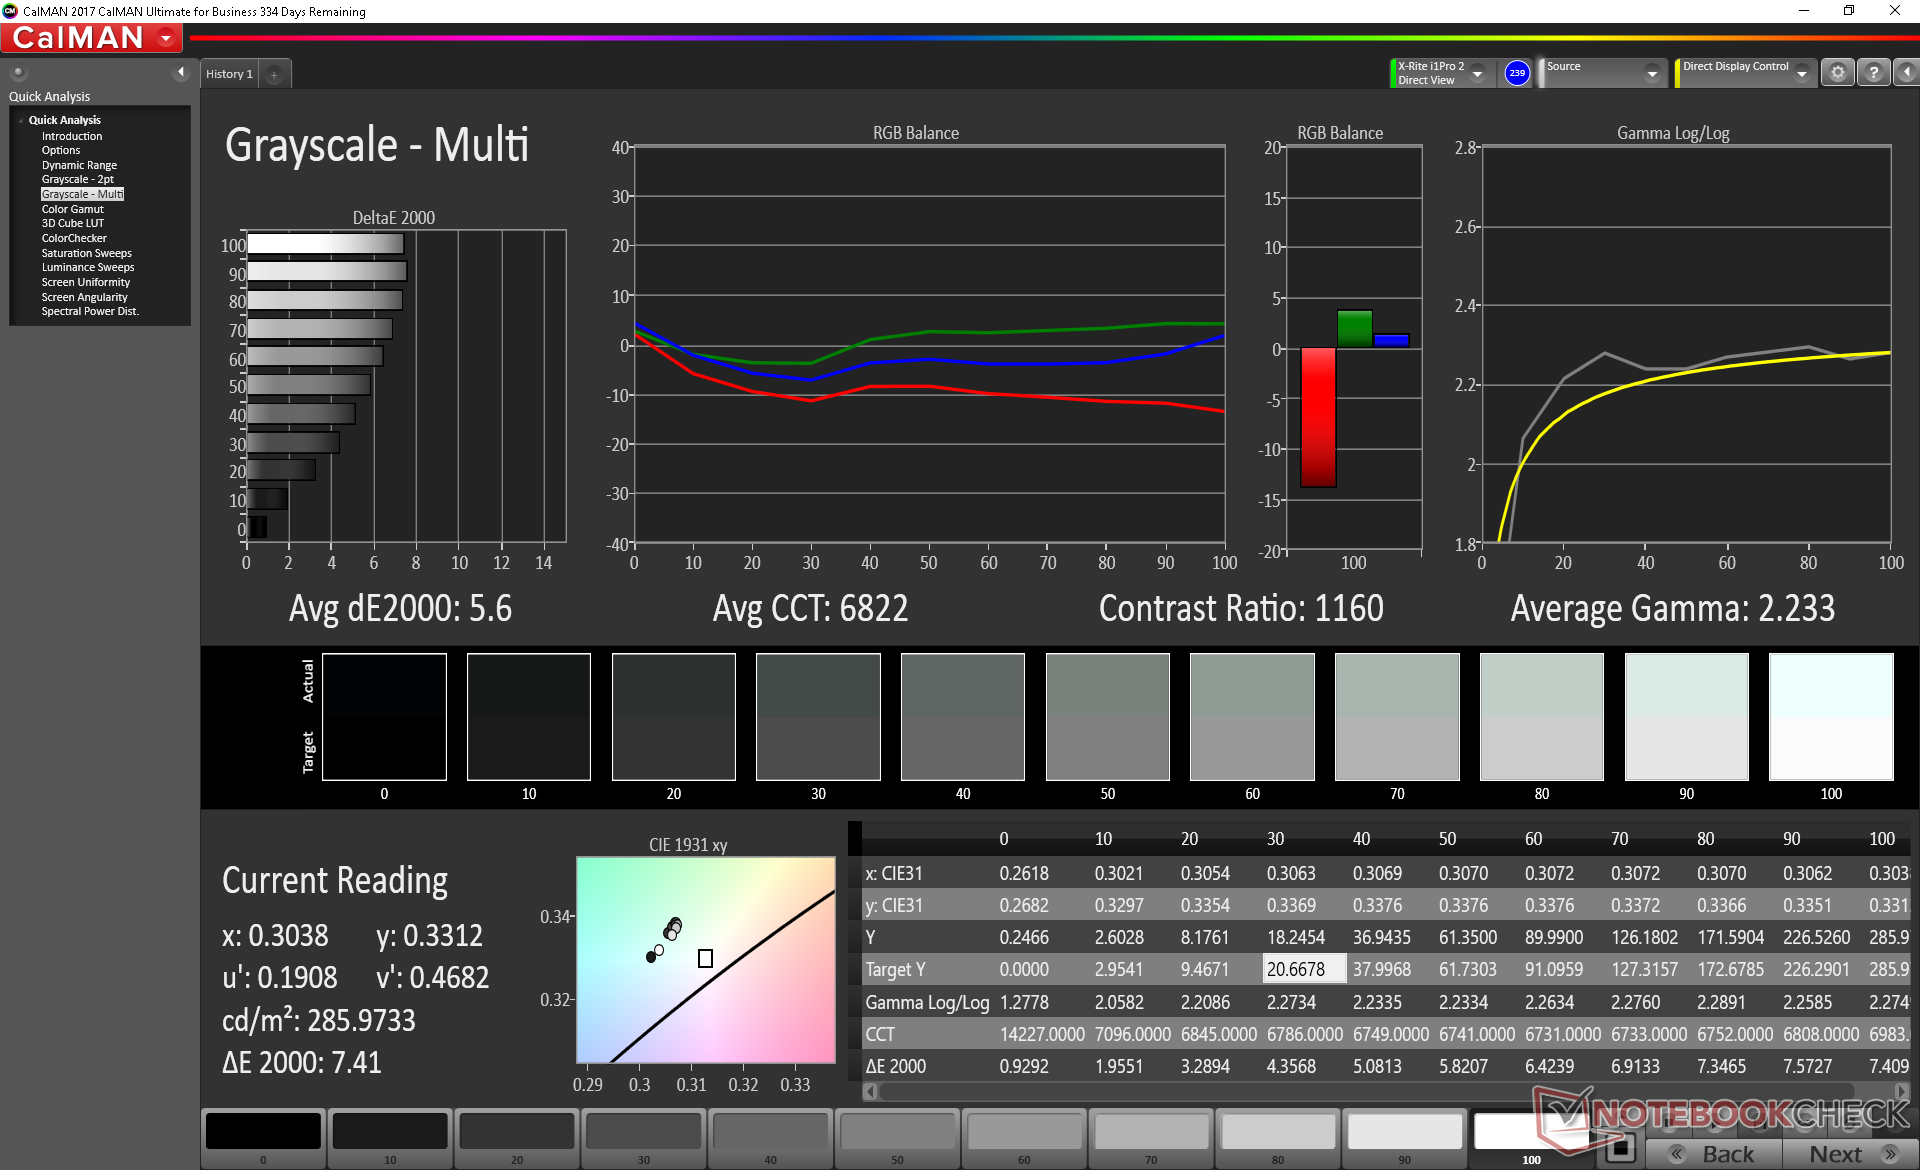
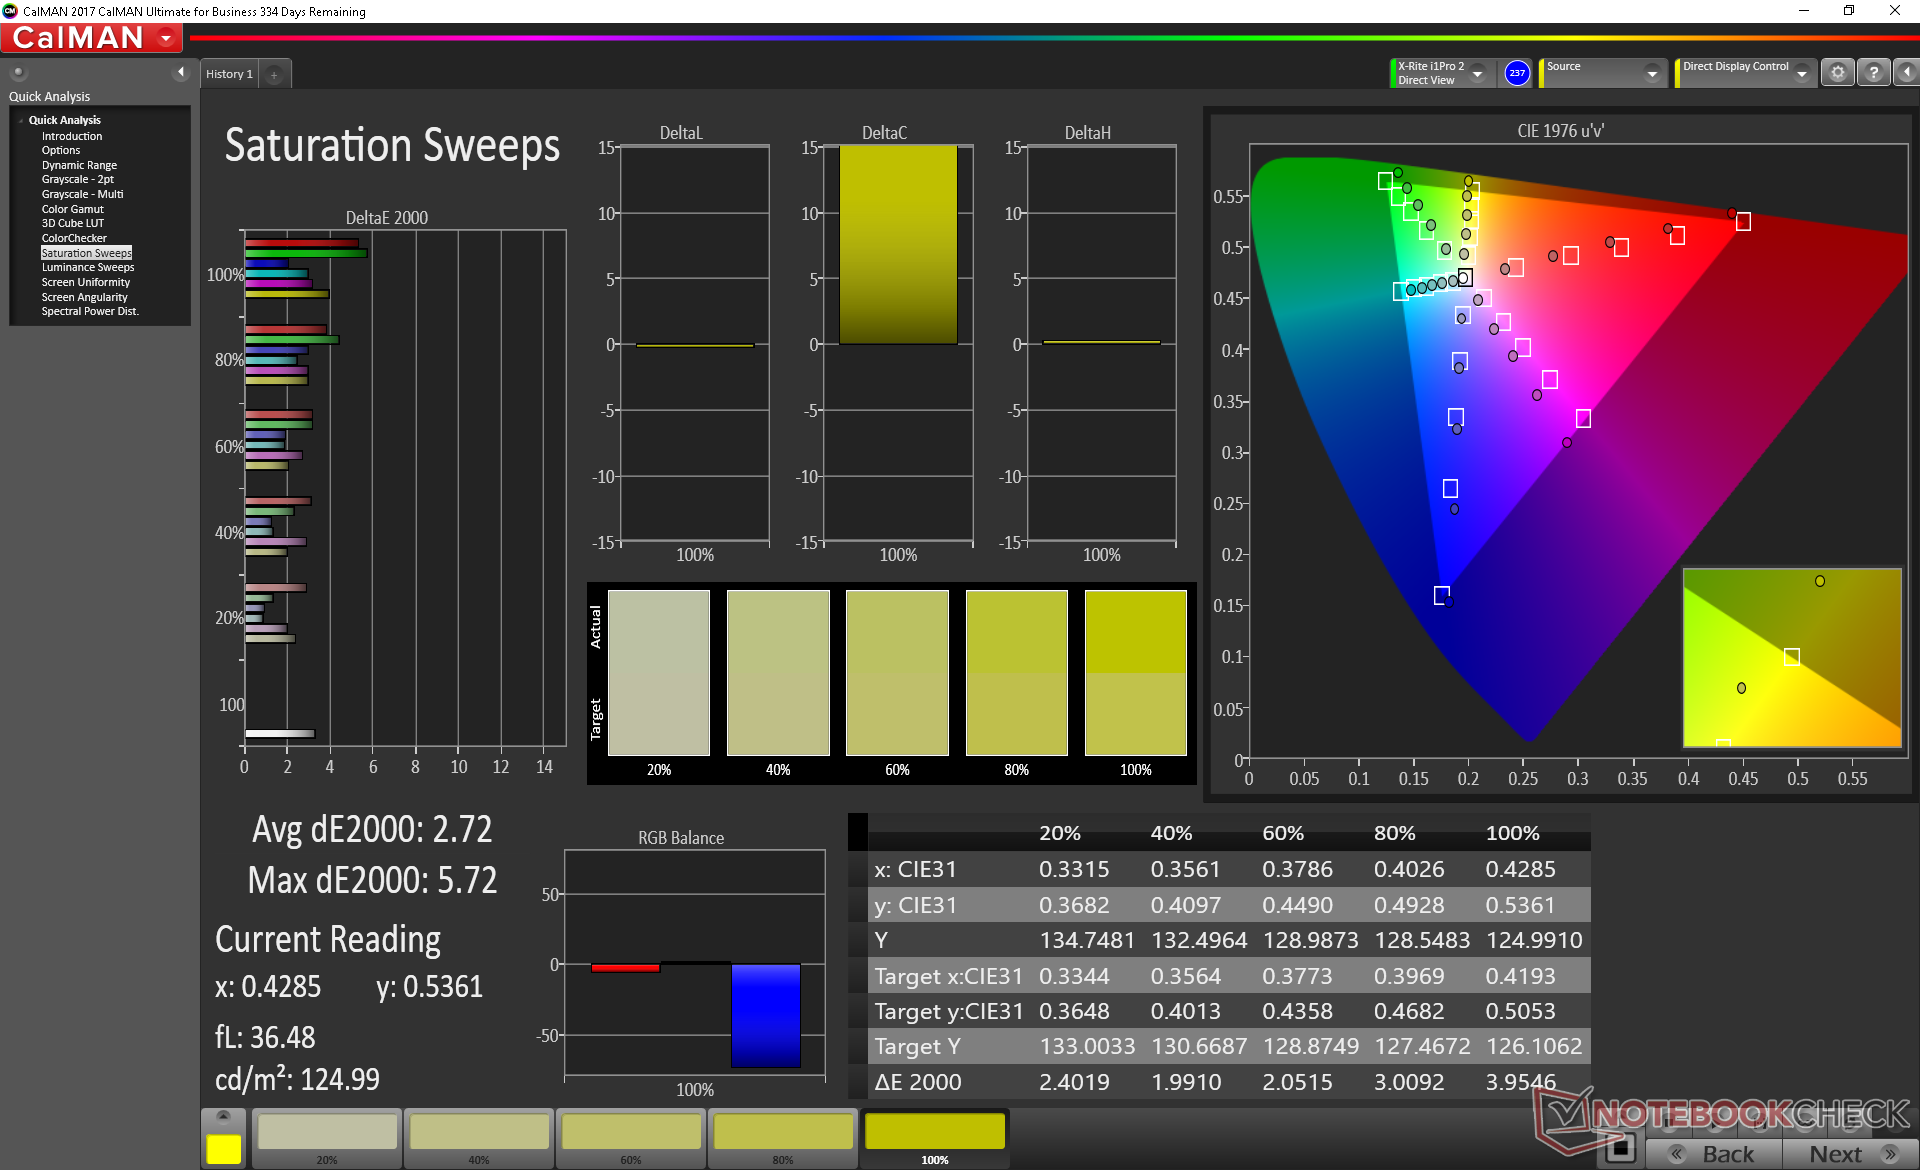
Further measurements with an X-Rite colorimeter reveal a color temperature slightly on the cooler side. A calibration attempt addresses this for more accurate grayscale and colors. Colors still become more inaccurate at higher saturation levels since gamut is smaller than the sRGB standard.
Display Response Times
| ↔ Response Time Black to White | ||
|---|---|---|
| 40 ms ... rise ↗ and fall ↘ combined | ↗ 21.2 ms rise | 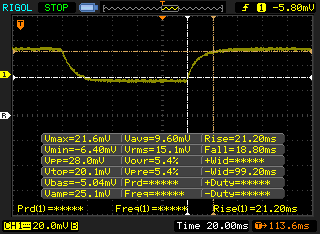 |
| ↘ 18.8 ms fall | ||
| The screen shows slow response rates in our tests and will be unsatisfactory for gamers. In comparison, all tested devices range from 0.1 (minimum) to 240 (maximum) ms. » 97 % of all devices are better. This means that the measured response time is worse than the average of all tested devices (19.9 ms). | ||
| ↔ Response Time 50% Grey to 80% Grey | ||
| 43.2 ms ... rise ↗ and fall ↘ combined | ↗ 25.2 ms rise | 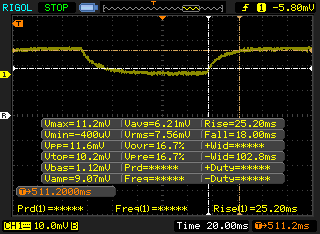 |
| ↘ 18 ms fall | ||
| The screen shows slow response rates in our tests and will be unsatisfactory for gamers. In comparison, all tested devices range from 0.165 (minimum) to 636 (maximum) ms. » 72 % of all devices are better. This means that the measured response time is worse than the average of all tested devices (31.1 ms). | ||
Screen Flickering / PWM (Pulse-Width Modulation)
| Screen flickering / PWM detected | 21740 Hz | ≤ 99 % brightness setting | 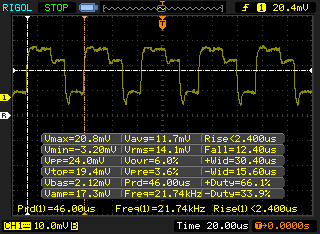 |
The display backlight flickers at 21740 Hz (worst case, e.g., utilizing PWM) Flickering detected at a brightness setting of 99 % and below. There should be no flickering or PWM above this brightness setting. The frequency of 21740 Hz is quite high, so most users sensitive to PWM should not notice any flickering. In comparison: 52 % of all tested devices do not use PWM to dim the display. If PWM was detected, an average of 7798 (minimum: 5 - maximum: 343500) Hz was measured. | |||
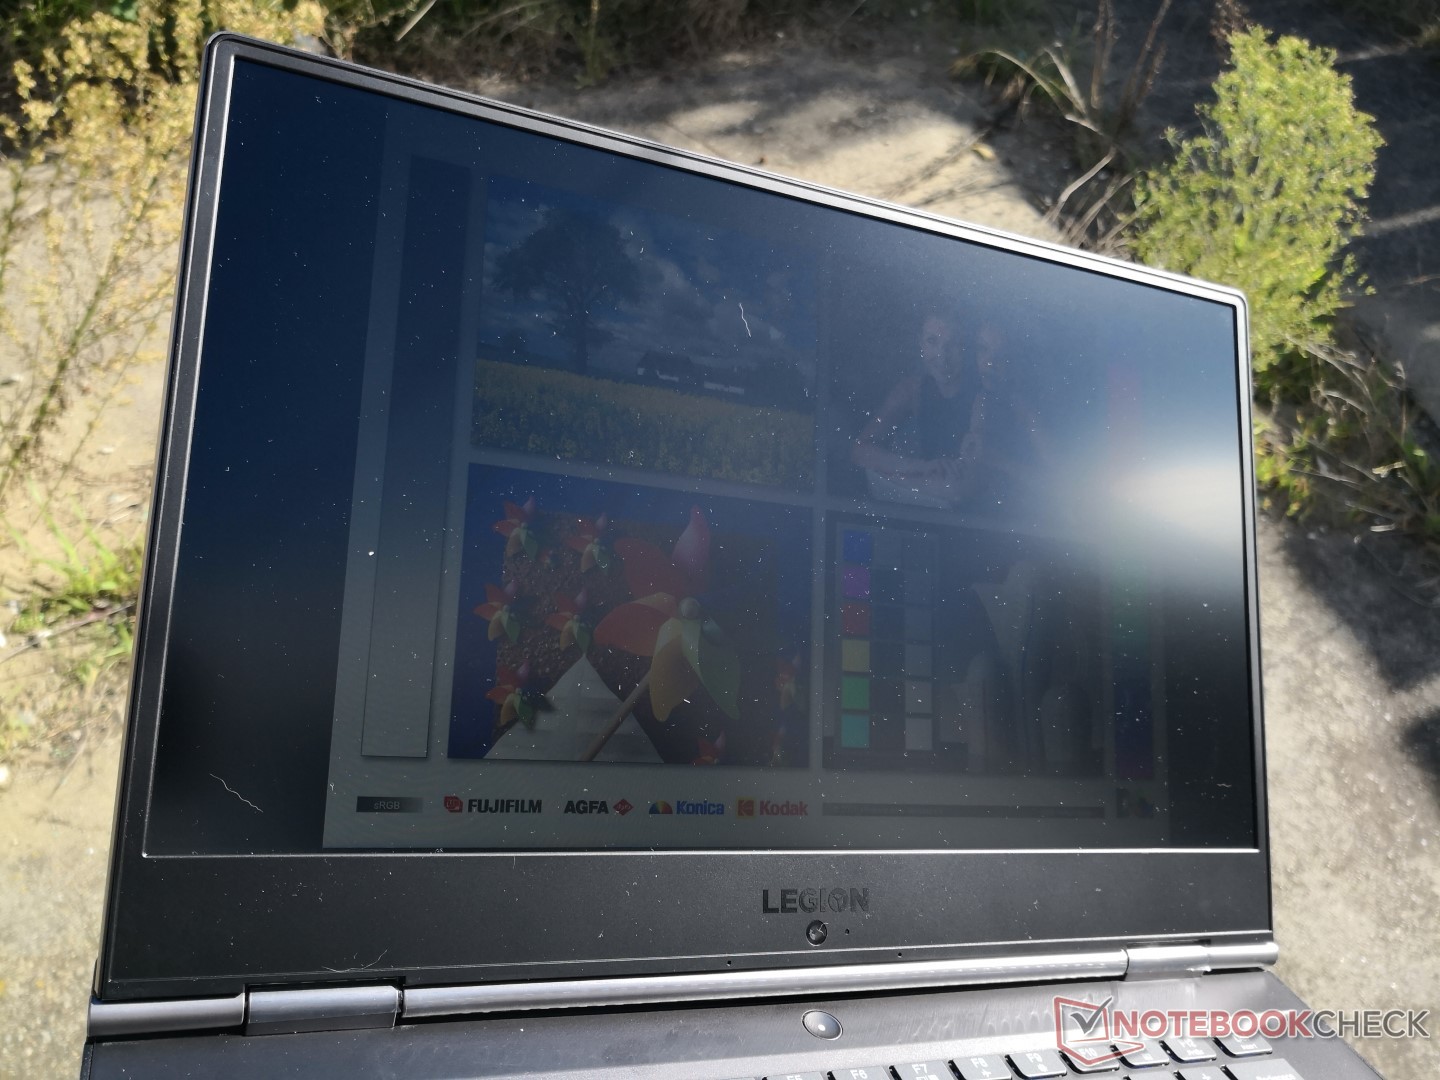
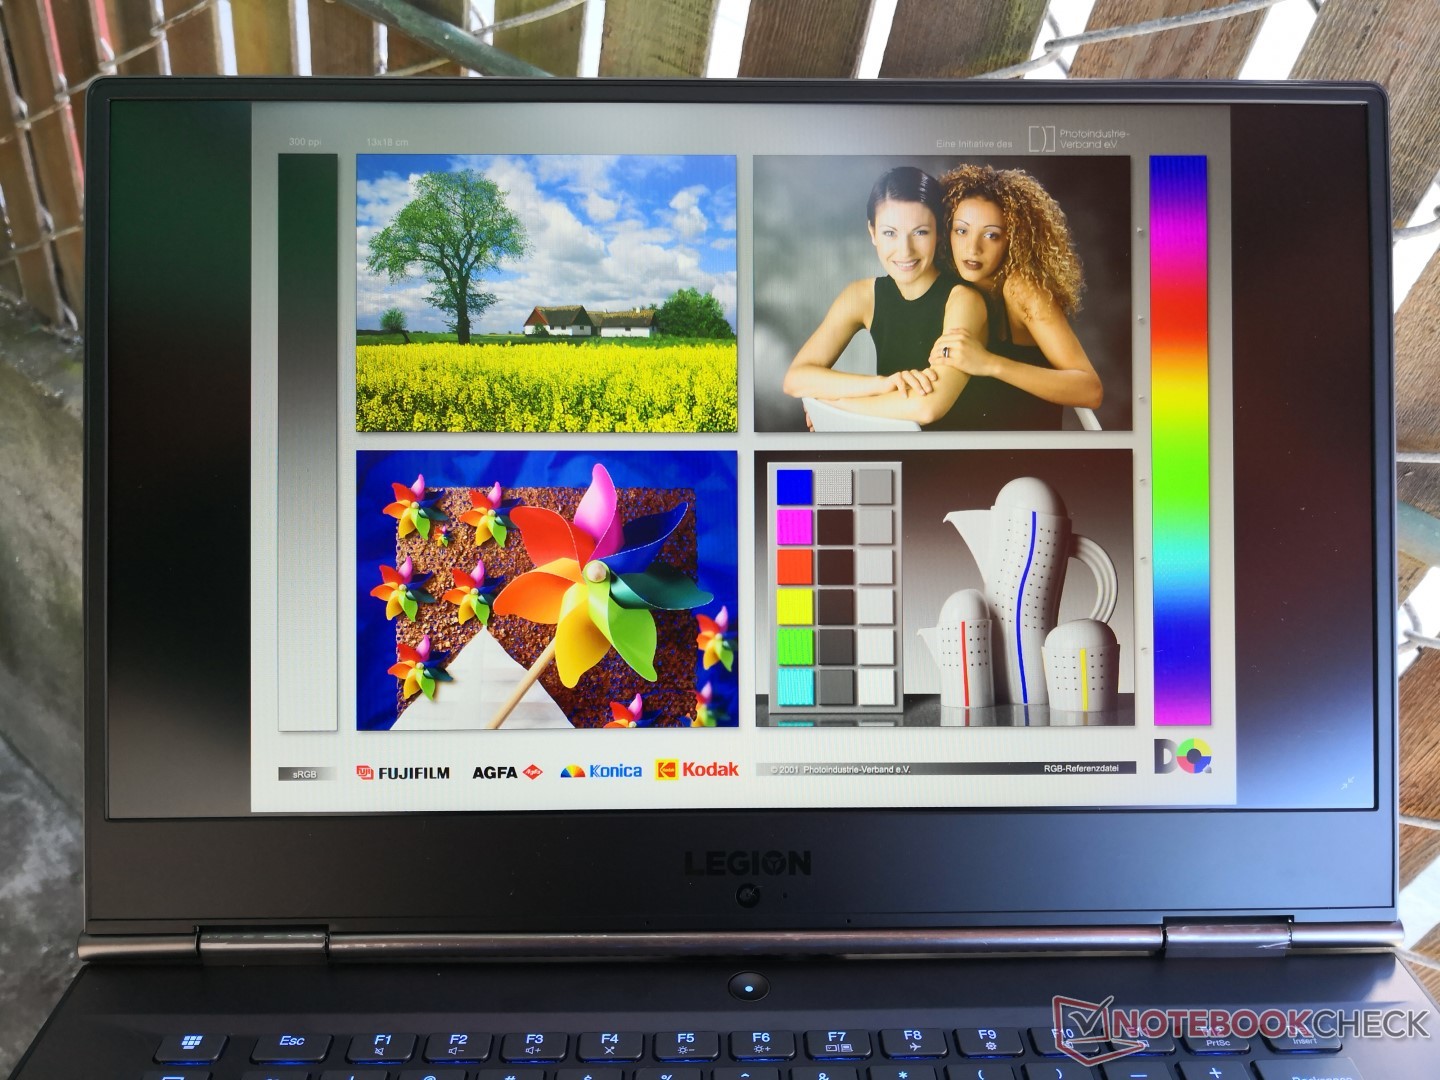
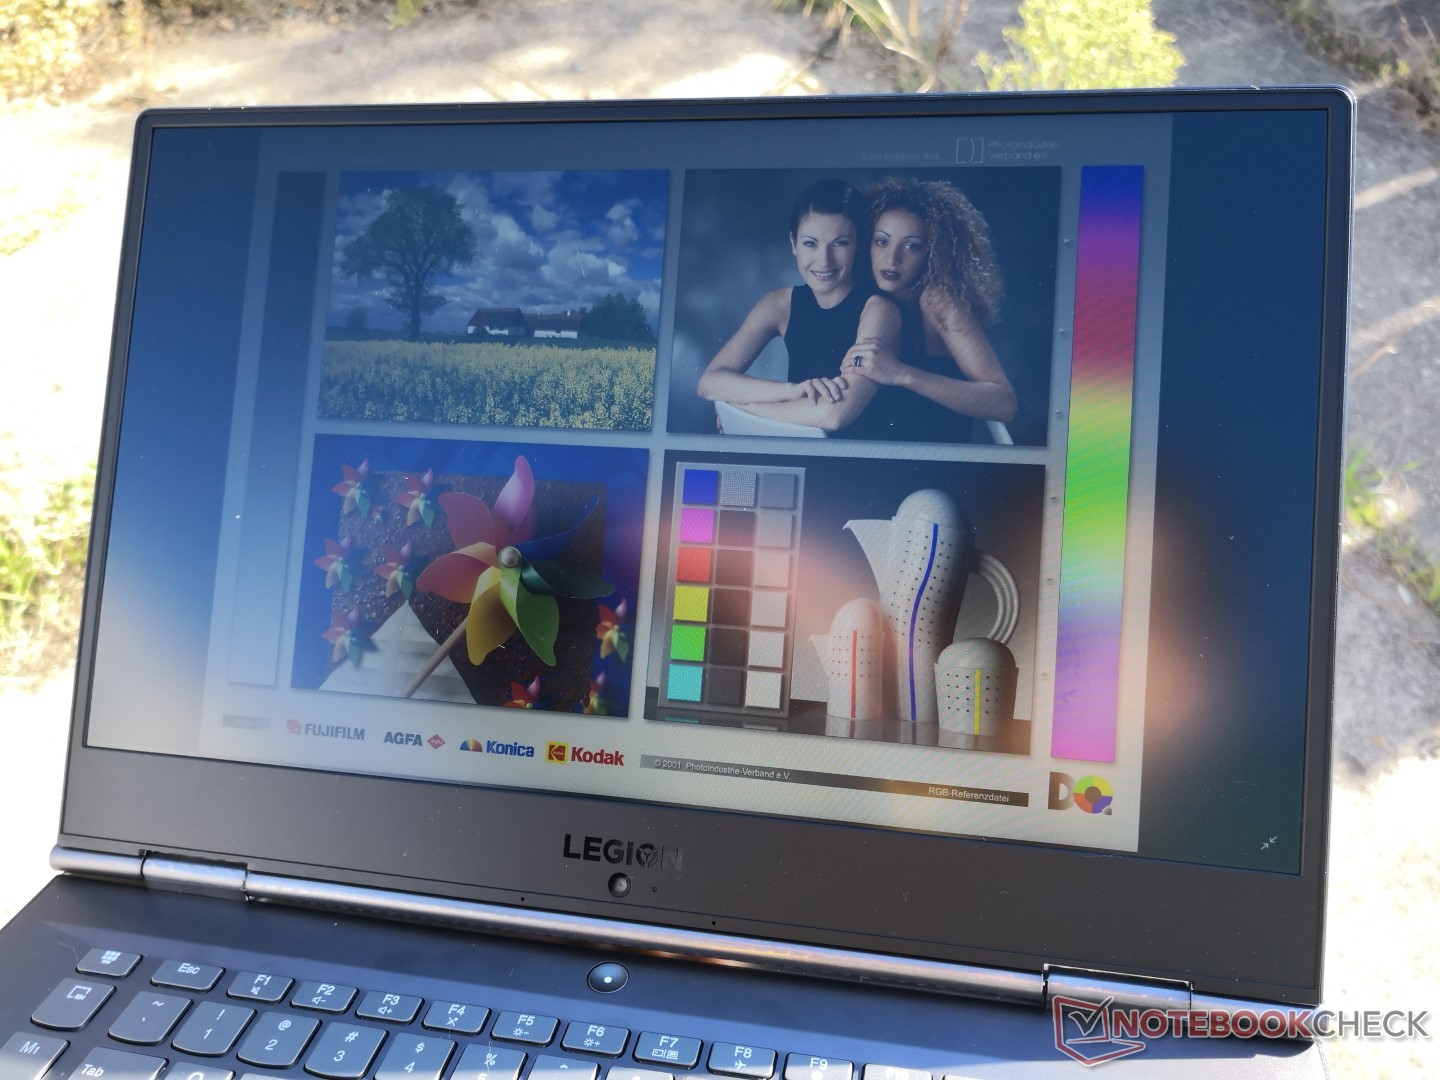
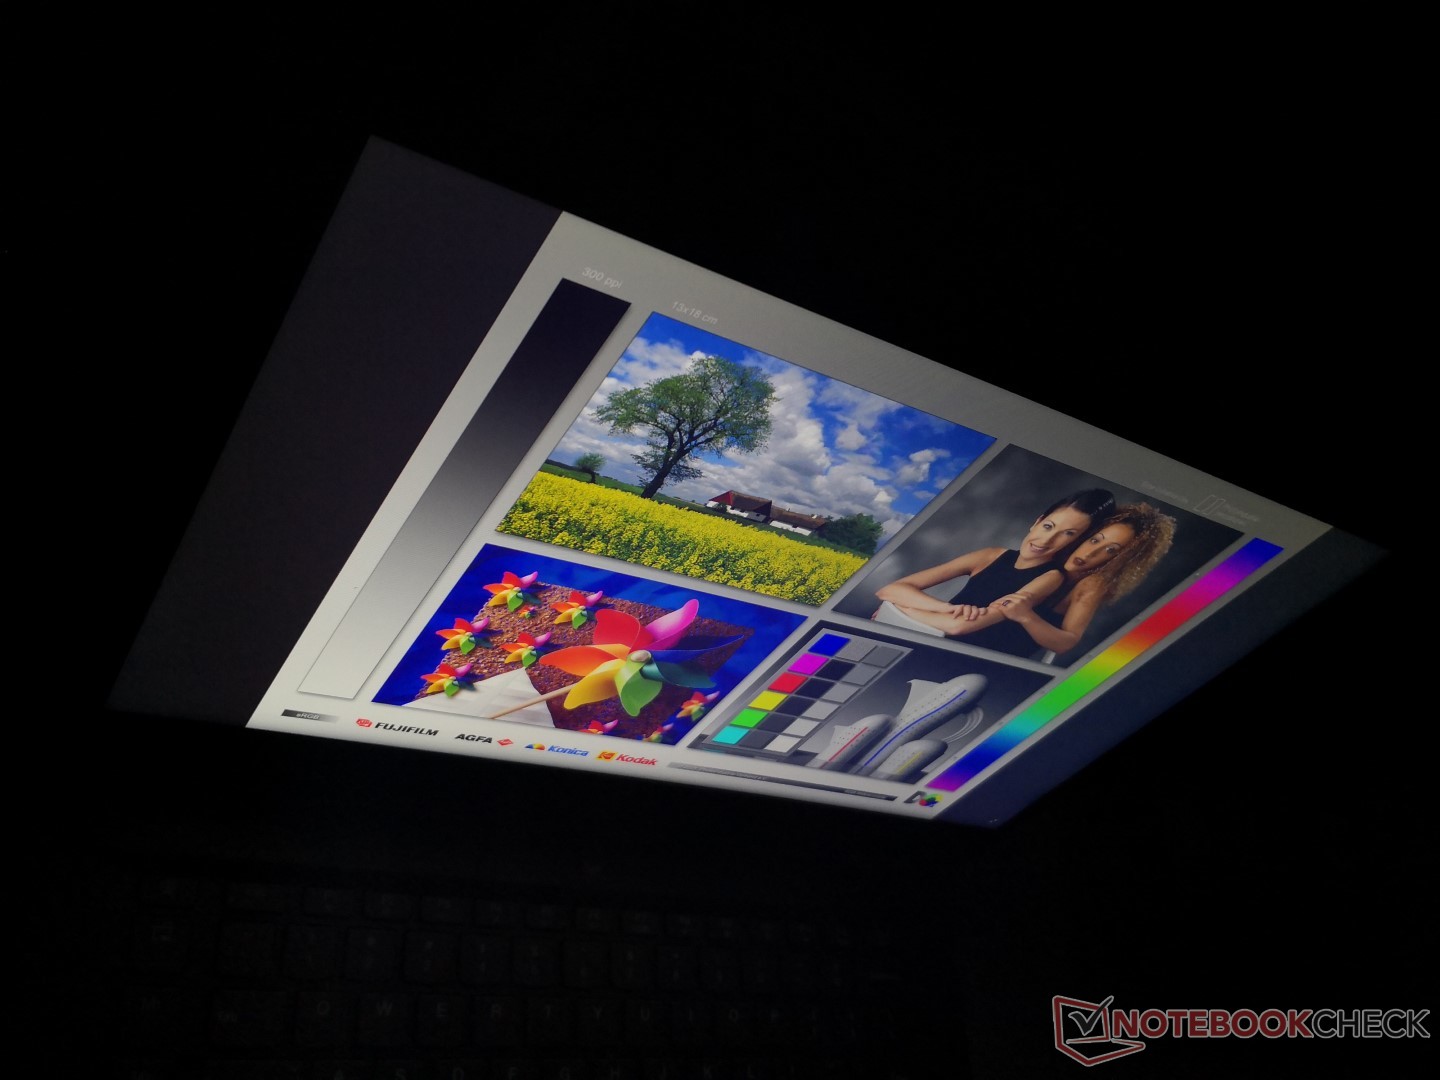
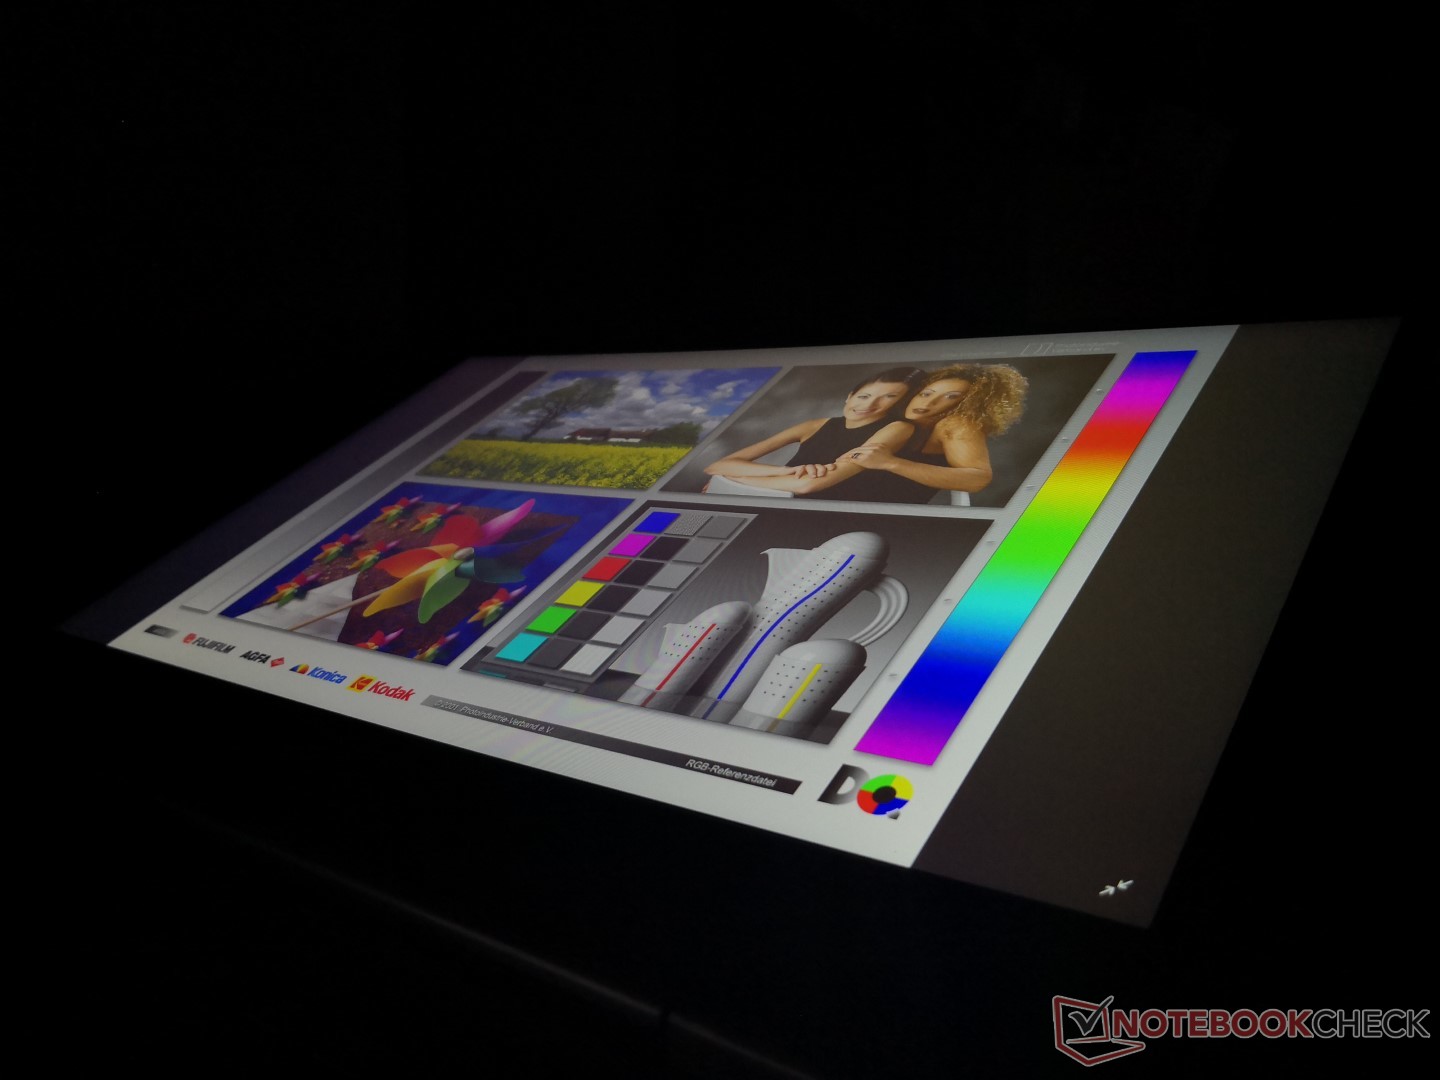
Outdoor visibility is average at best when under shade. Direct sunlight will overwhelm the screen despite it being a matte panel for reduced glare. Viewing angles are excellent with no significant contrast, brightness, or color changes from wide angles.
Performance
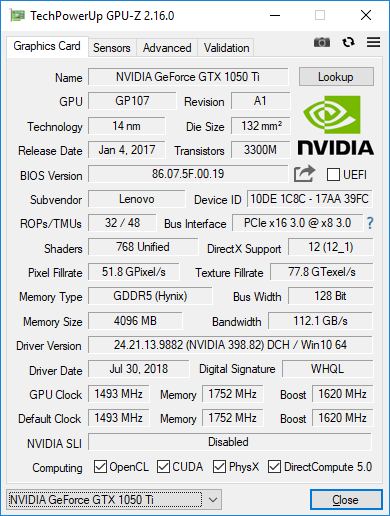
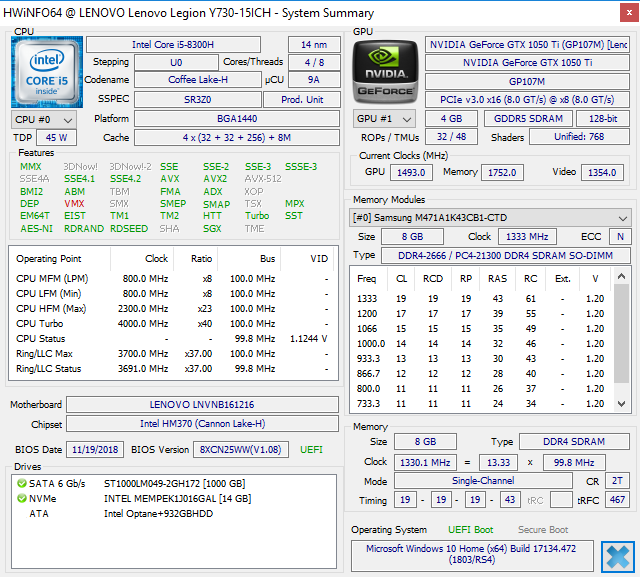
Although Lenovo is marketing the Legion 730 as a higher-end version of the Legion 530, the Legion 730 still carries middle-of-the-road hardware. Its Core i5-8300H and i7-8750H CPU options can be found on most other gaming laptops in the market today while the GeForce GTX 1050 Ti GPU is a budget-mainstream solution.
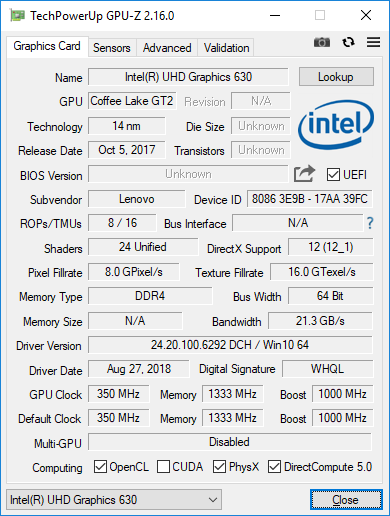
Nvidia Optimus is included for automatic graphics switching to the UHD Graphics 630.
Processor
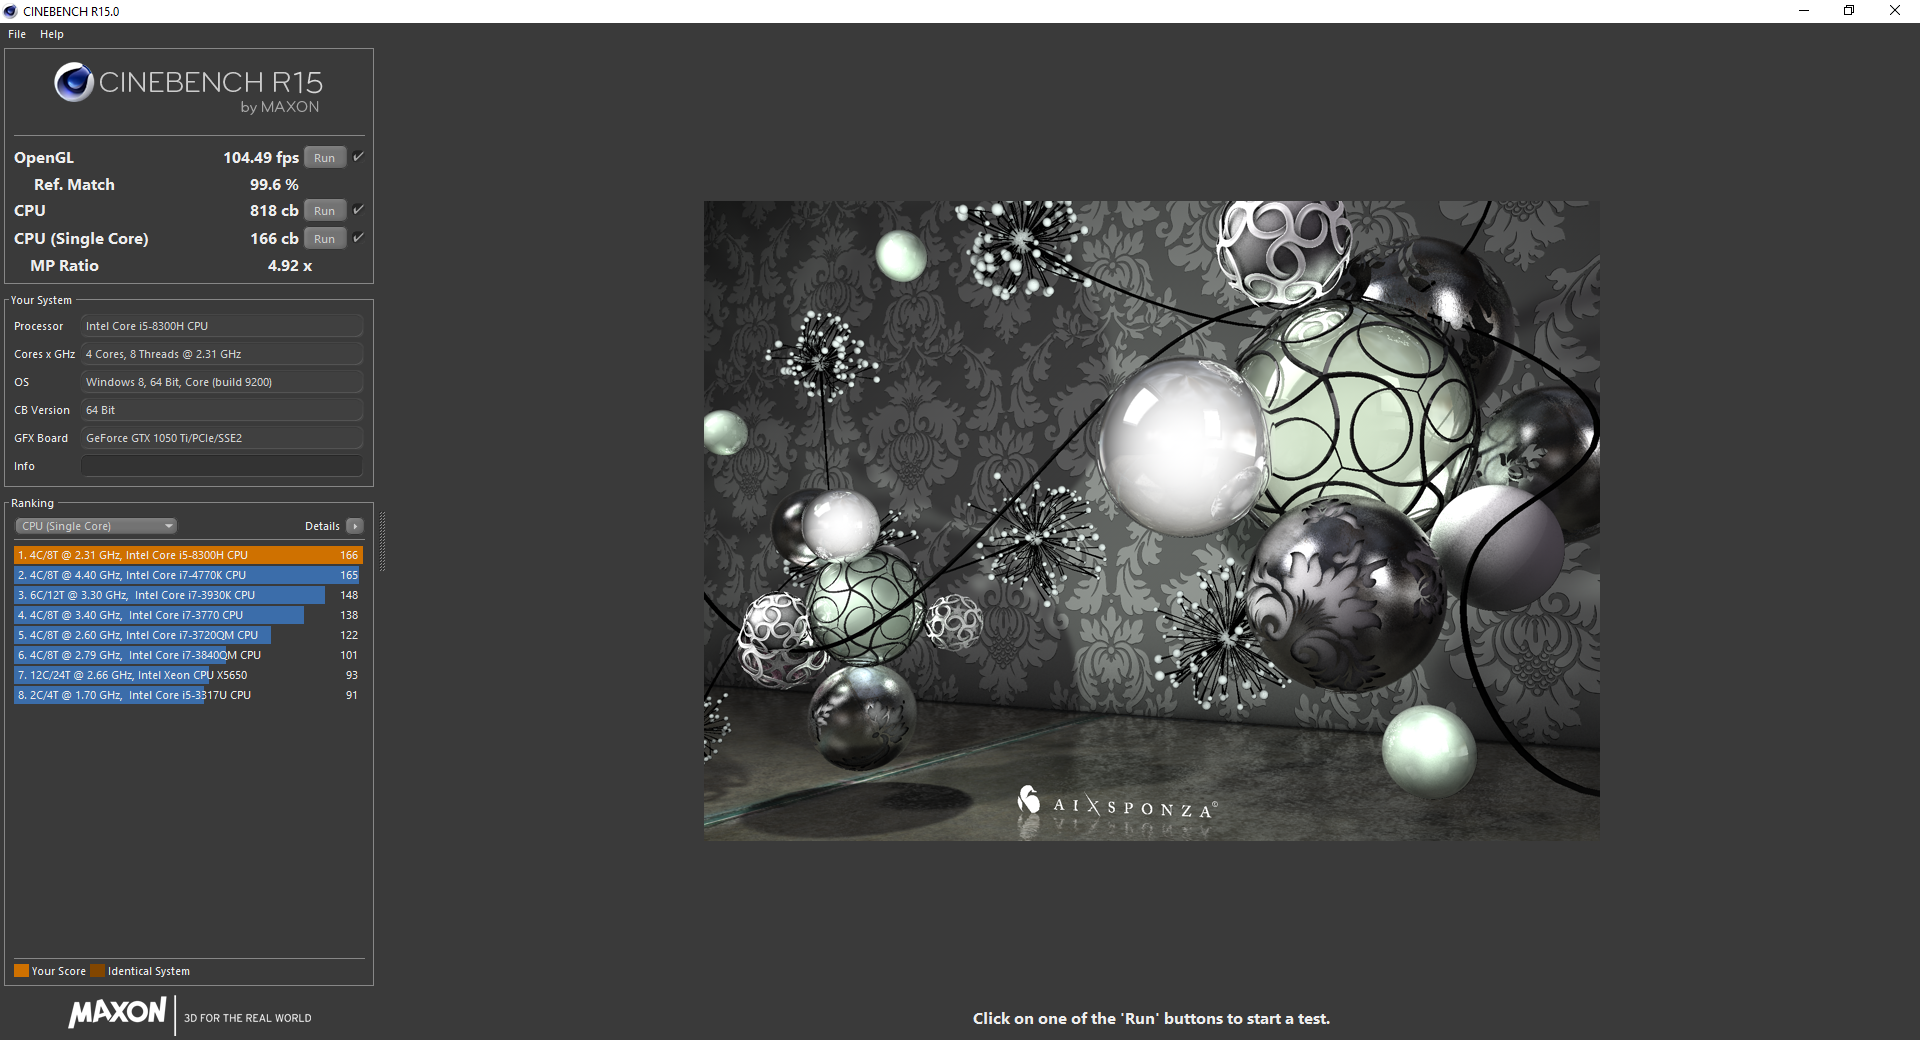
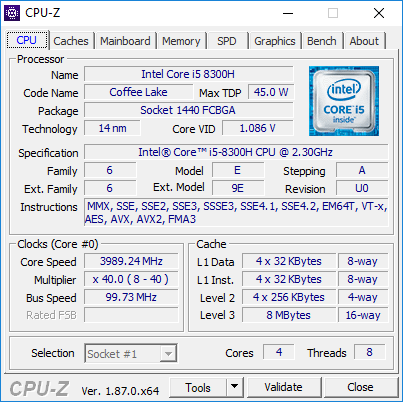
CPU performance according to CineBench R15 Multi-Thread is within 4 percent of the average Core i5-8300H in our database. Users can expect a performance boost of almost 60 percent over the Kaby Lake i5-7300HQ in the last generation Legion Y520 or 25 percent over the i7-7700HQ. The higher-end Core i7-8750H Legion Y730 SKU will be almost 50 percent faster than the i5-8300H in our base test unit.
We can assess CPU performance sustainability by running CineBench R15 Multi-Thread in a loop as shown in our graph below. This is where the Lenovo impresses as there is no dip in performance throughout the entirety of the stress test. Its initial and final scores of 821 points and 822 points contrast the MSI GF63 where it is unable to maintain maximum Turbo Boost for long.
See our dedicated page on the Core i5-8300H for more technical information and benchmark comparisons.
| wPrime 2.10 - 1024m | |
| Average Intel Core i5-8300H (206 - 286, n=4) | |
| Asus FX504GD | |
| HP Omen X 17-ap0xx | |
| Eurocom Sky X4C | |
* ... smaller is better
System Performance
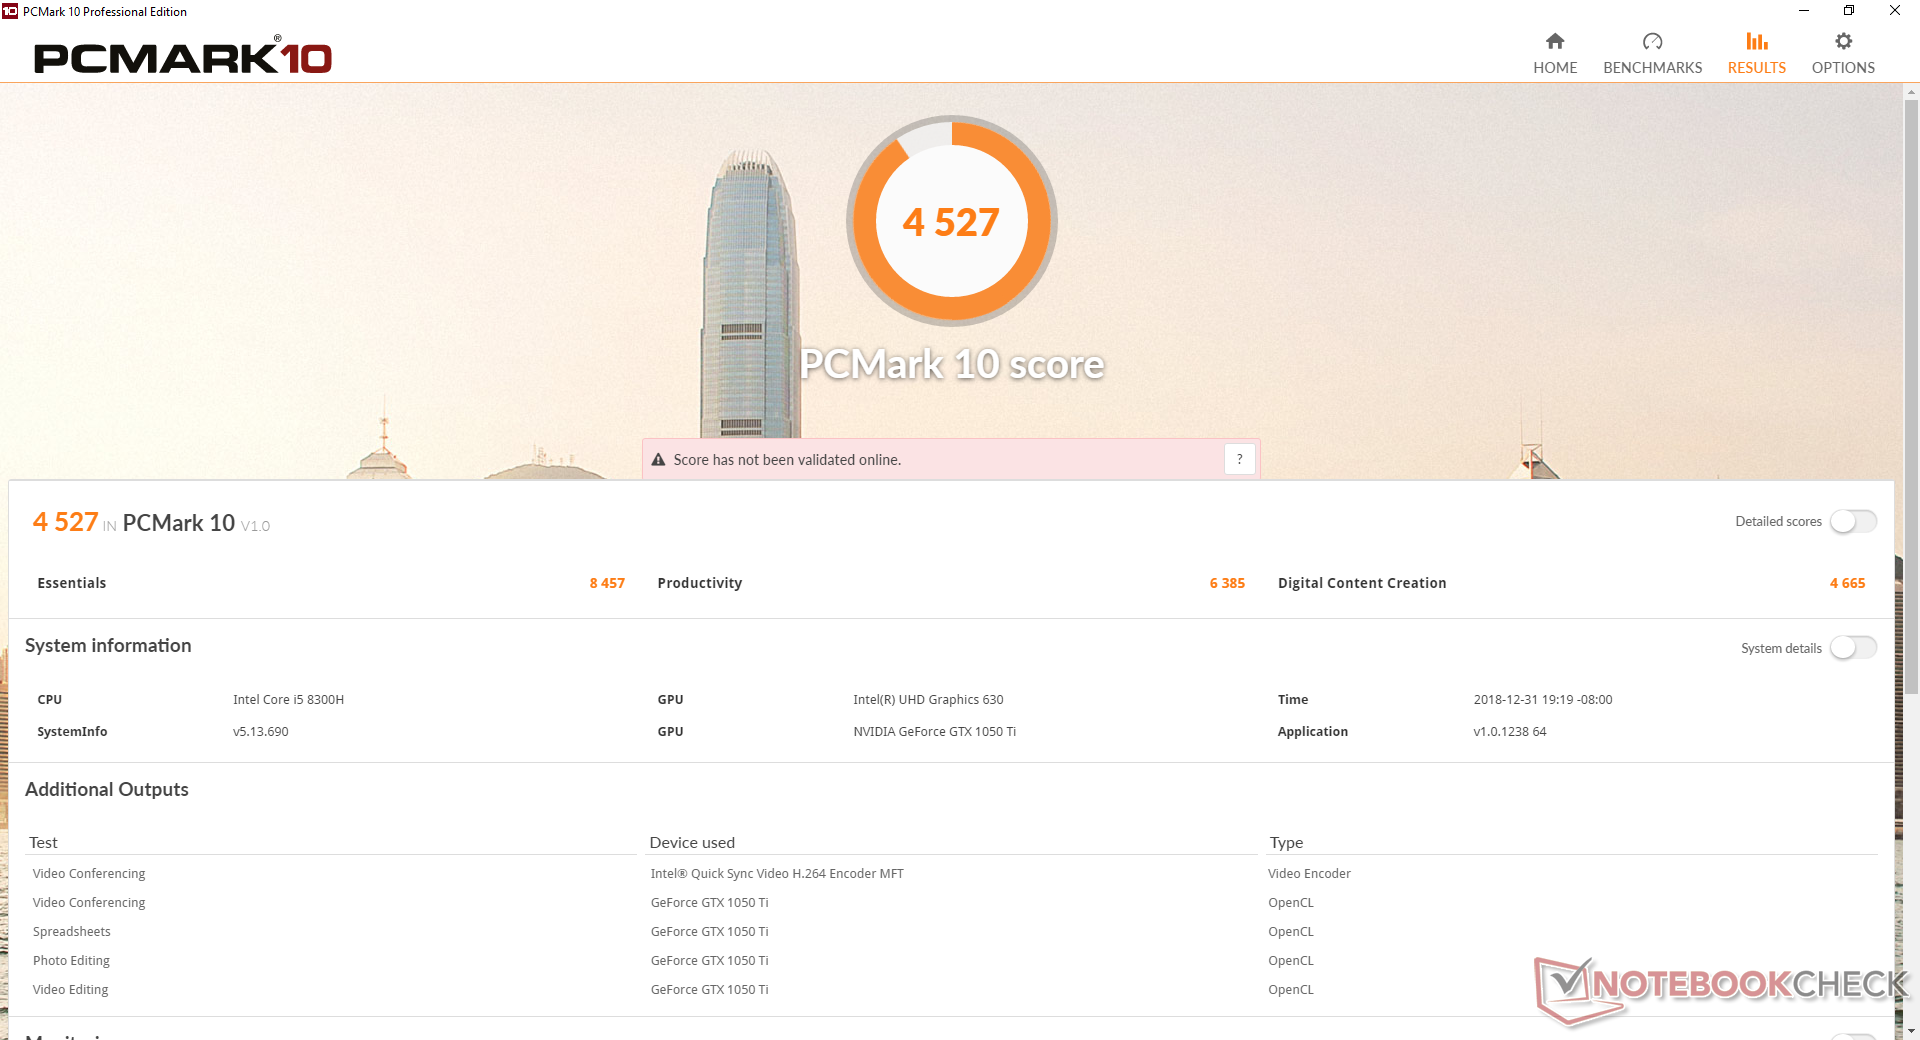
PCMark benchmarks rank our system conveniently in the middle of competing laptops with slower GTX 1050 graphics and laptops with the faster GTX 1060 laptops. While we didn't experience any hardware issues during our time with the test unit, the GPU would sometimes inexplicably be stuck at very low clock rates of just 135 MHz. A quick reboot fixes the problem.
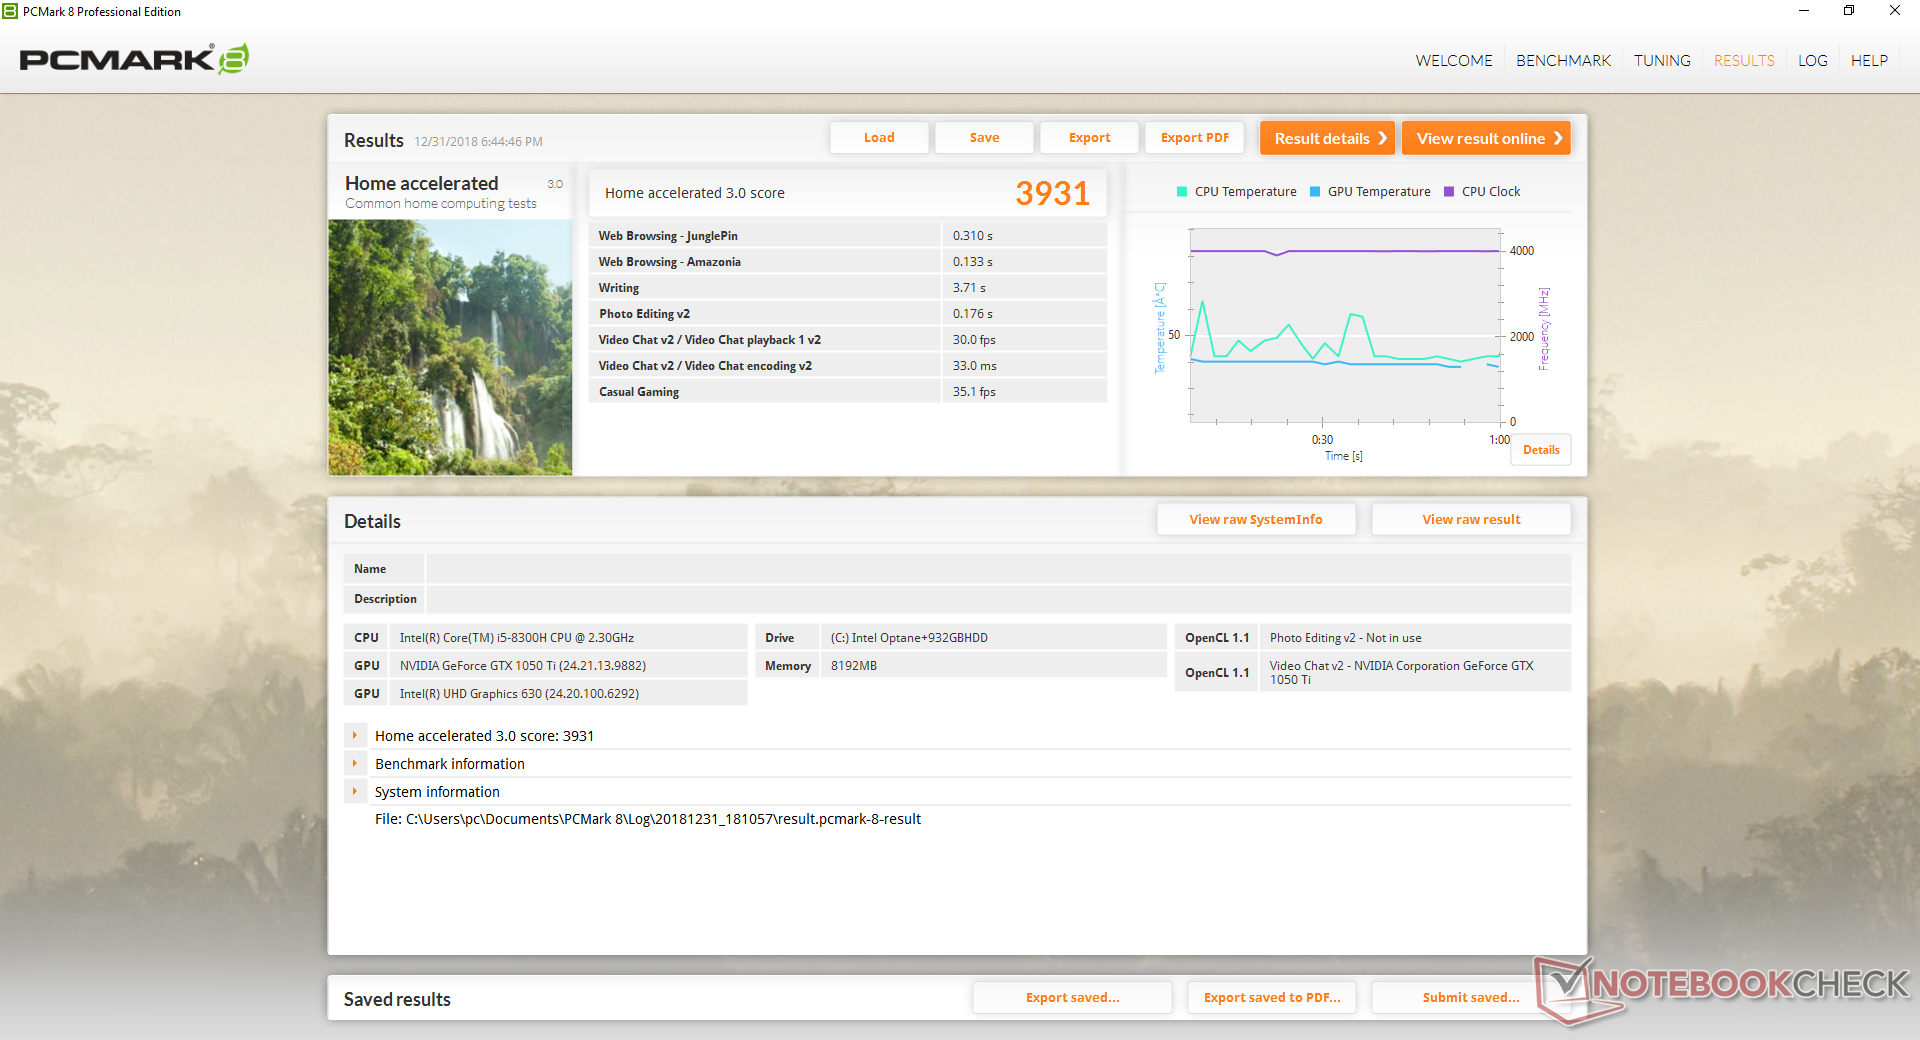
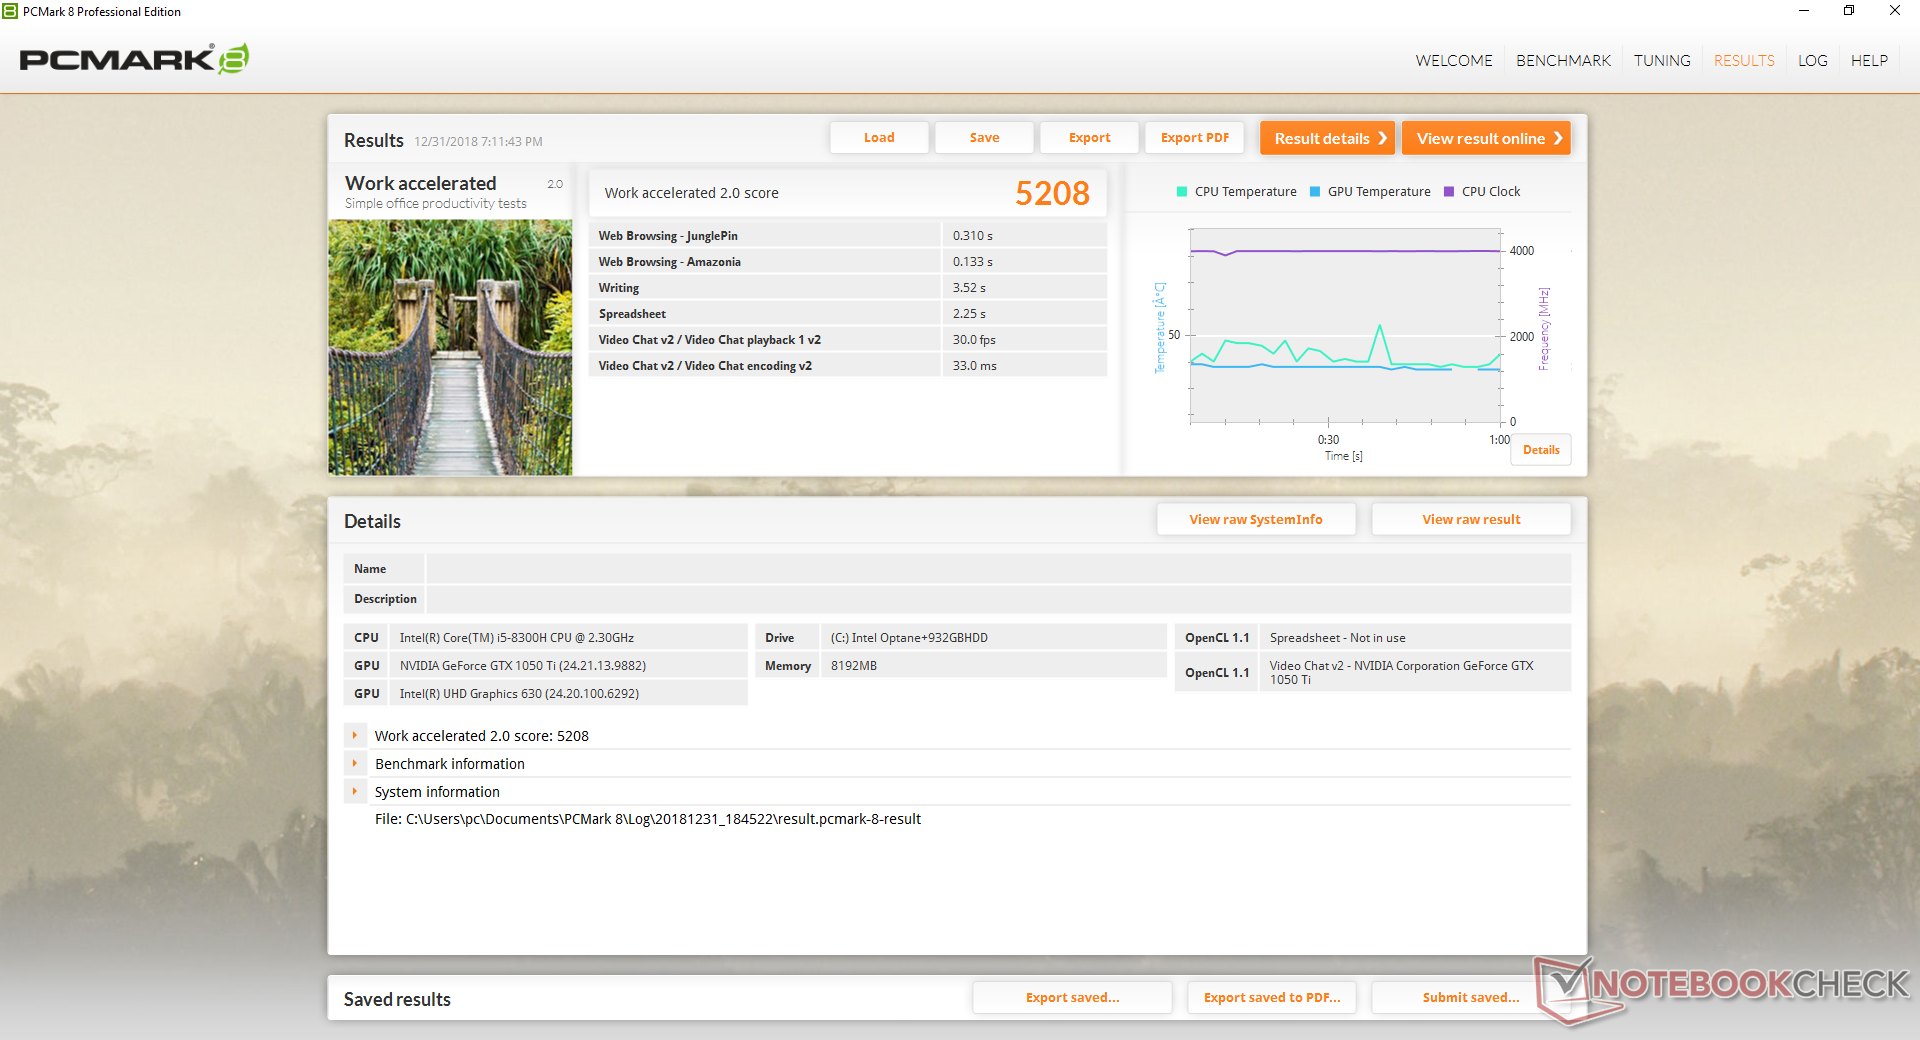
| PCMark 8 Home Score Accelerated v2 | 3931 points | |
| PCMark 8 Work Score Accelerated v2 | 5208 points | |
| PCMark 10 Score | 4527 points | |
Help | ||
Storage Devices
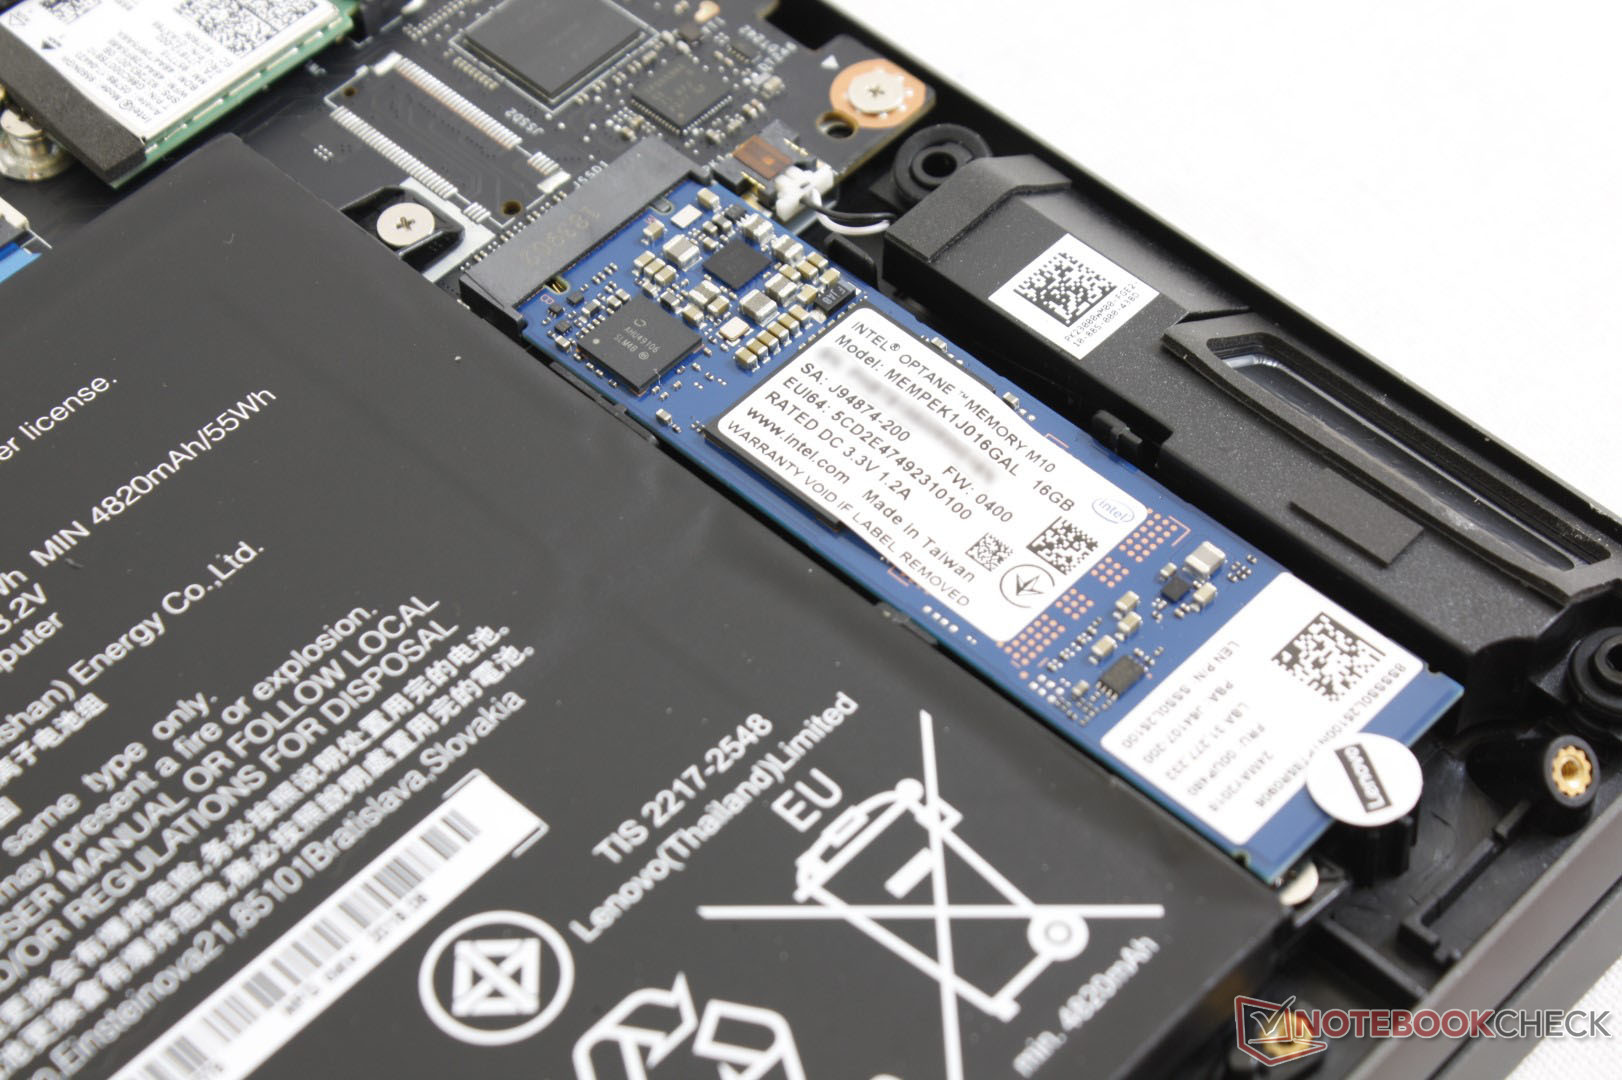
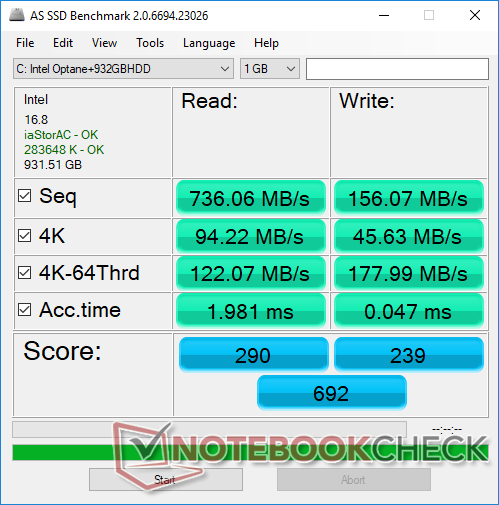
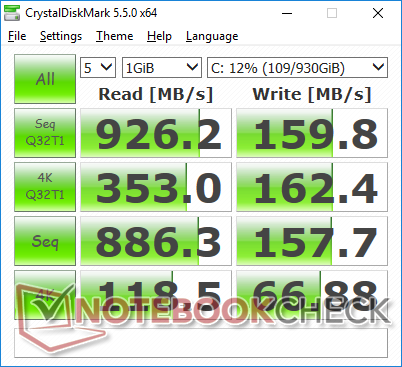
Internal storage options include a 2.5-inch SATA III bay and a M.2 2280 PCIe slot. Our specific test unit comes with a 1 TB Seagate Barracuda ST1000LM049-2GH172 HDD boosted by a 16 GB Intel Optane MEMPEK1J016GAL M.2 module. Removing the Optane module may void the warranty since there is a Lenovo sticker covering the screw. We are unsure if the M.2 slot is x4 or if it is limited to x2.
Sequential read rate is impressive at 886 MB/s according to CrystalDiskMark. In comparison, a lone 7200 RPM HDD without the aid of Intel Optane would top out at under 150 MB/s. Sequential write rate, however, is still inferior to even basic SATA III SSDs like the inexpensive SK hynix SC311. From a gaming perspective, the relatively inexpensive HDD + Optane combo may be lucrative for faster loading times since high capacity NVMe drives are still pricey and loading from a traditional secondary HDD would be much slower.
See our table of HDDs and SSDs for more benchmark comparisons.
| Lenovo Legion Y730-15ICH i5-8300H Intel Optane 16 GB MEMPEK1J016GAL + HGST ST1000LM049 1 TB HDD | Lenovo Legion Y530-15ICH Samsung SSD PM981 MZVLB256HAHQ | Dell G7 15-7588 SK hynix SC311 SATA | Asus FX504GD Seagate Mobile HDD 1TB ST1000LX015-1U7172 | MSI GF63 8RC Seagate BarraCuda Pro Compute 1TB ST1000LM049 | Razer Blade 15 Base Model Samsung SSD PM981 MZVLB256HAHQ | |
|---|---|---|---|---|---|---|
| CrystalDiskMark 5.2 / 6 | 250% | -20% | -82% | -77% | 259% | |
| Write 4K (MB/s) | 66.9 | 108.9 63% | 61.3 -8% | 0.27 -100% | 1.244 -98% | 112.5 68% |
| Read 4K (MB/s) | 118.5 | 40.23 -66% | 22.45 -81% | 0.586 -100% | 0.544 -100% | 43.09 -64% |
| Write Seq (MB/s) | 157.7 | 1390 781% | 243.9 55% | 86.8 -45% | 97.1 -38% | 1450 819% |
| Read Seq (MB/s) | 886 | 964 9% | 506 -43% | 113.2 -87% | 162.1 -82% | 1392 57% |
| Write 4K Q32T1 (MB/s) | 162.4 | 314.2 93% | 145.1 -11% | 0.242 -100% | 1.674 -99% | 356.1 119% |
| Read 4K Q32T1 (MB/s) | 353 | 369.2 5% | 195.1 -45% | 0.963 -100% | 0.998 -100% | 406.9 15% |
| Write Seq Q32T1 (MB/s) | 159.8 | 1506 842% | 186 16% | 98.4 -38% | 134.8 -16% | 1451 808% |
| Read Seq Q32T1 (MB/s) | 926 | 3446 272% | 540 -42% | 110.2 -88% | 154.8 -83% | 3272 253% |

GPU Performance
Graphics performance is within 3 to 4 percent of the average GTX 1050 Ti in our database taken from a sample size of 35 other laptops equipped with the same GPU. In other words, the GPU here is performing exactly where we expect it to be. Users will get a 9 percent GPU boost over the GTX 1050 Ti Max-Q and 25 to 30 percent boost over the GTX 1050. The higher-end GTX 1060 as found on the Legion Y530 is even faster still at about 45 to 50 percent.
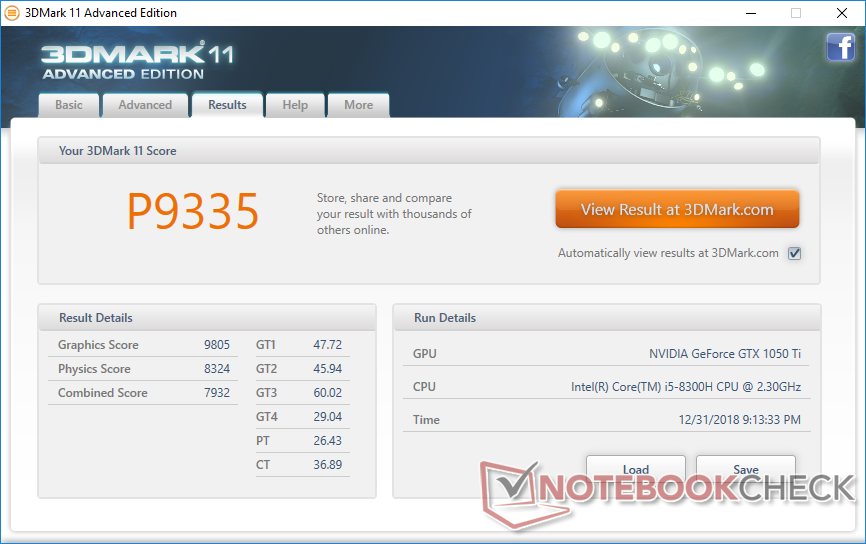
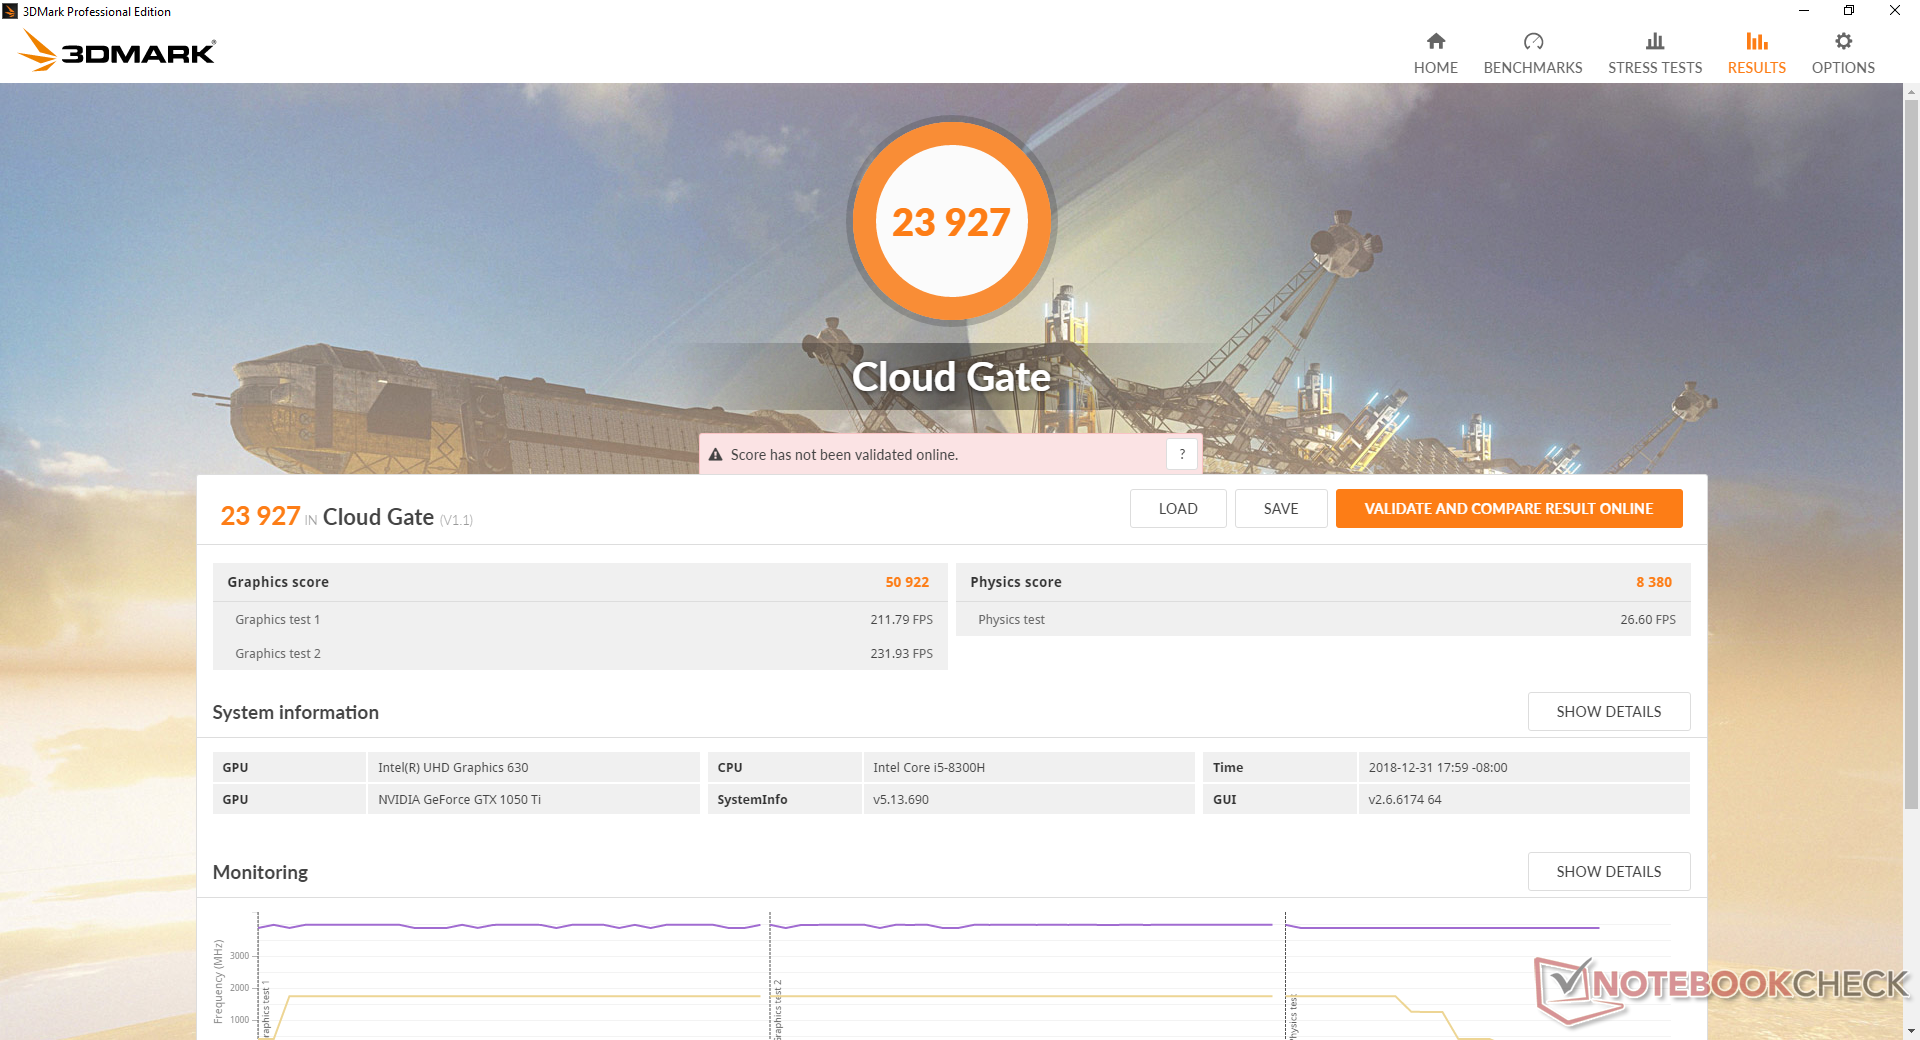
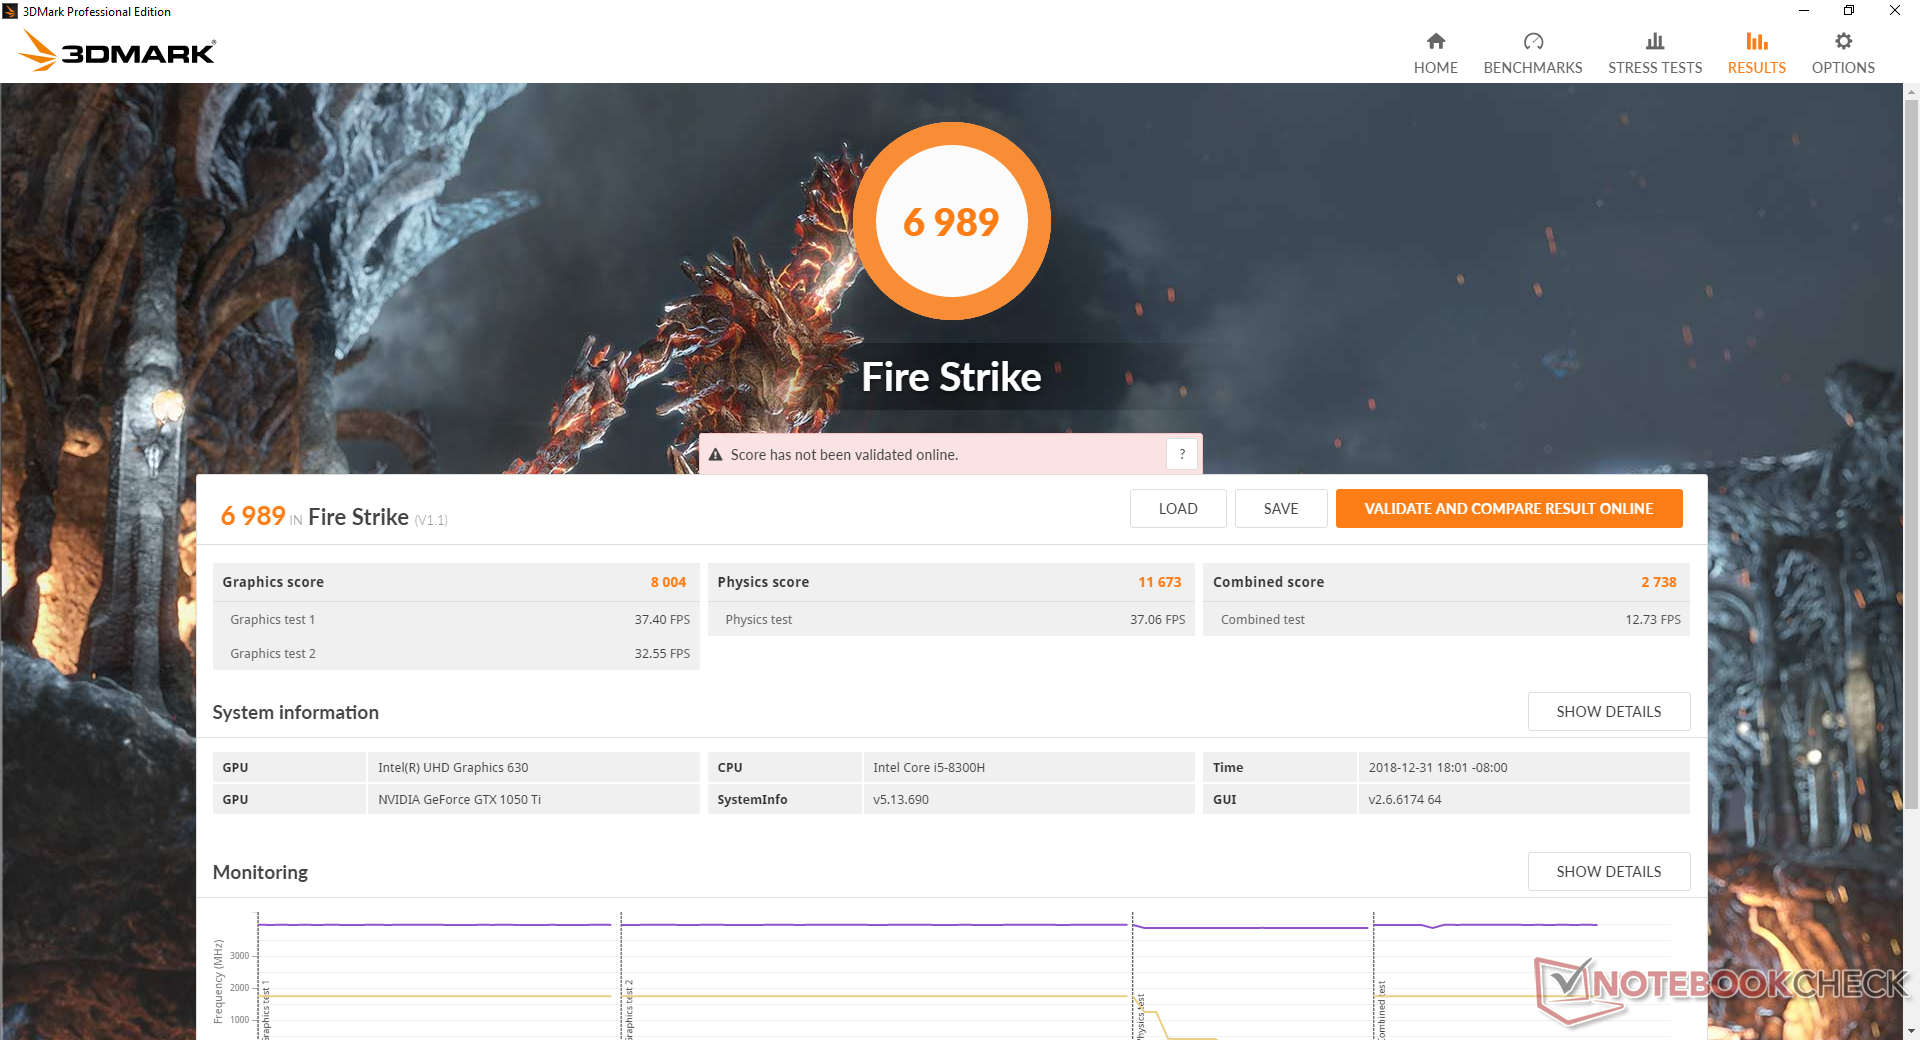
| 3DMark 11 Performance | 9335 points | |
| 3DMark Cloud Gate Standard Score | 23927 points | |
| 3DMark Fire Strike Score | 6989 points | |
Help | ||
Gaming Performance
Users will be able to play the latest titles at the native 1080p resolution. More demanding titles like Witcher 3 will average slower than 30 FPS unless if set to Medium or lower. We are able to record no recurring frame drops or performance dips when gaming to suggest no interfering background activity.
See our dedicated page on the GeForce GTX 1050 Ti for more technical information and benchmark comparisons.
| low | med. | high | ultra | |
|---|---|---|---|---|
| BioShock Infinite (2013) | 233.1 | 198.8 | 176.7 | 74.8 |
| The Witcher 3 (2015) | 142.2 | 91.5 | 51.9 | 27.9 |
| Rise of the Tomb Raider (2016) | 125.3 | 95 | 51.3 | 40 |
Emissions
System Noise
System noise is ever present since our test unit utilizies a primary mechanical drive. As for the actual fans, they remain idle for long periods of low-medium stress and are surprisingly quiet even when running the first benchmark scene of 3DMark 06. Competing laptops like the Asus TUF FX504GD readily jump to 40 dB(A) or higher much sooner than on our Lenovo. Note that the Legion Y530 becomes louder faster than our Y730 when subjected to similar loads since it is equipped with a more demanding GTX 1060 GPU.
When gaming for longer periods, we are able to record a fan noise of 43 dB(A) which is typical of many gaming laptops including the MSI GF63. In comparison, the Dell G7 15 and thinner Blade 15 are each much louder at almost 50 dB(A) when gaming.
We are able to notice slight electronic noise when placing an ear near the keyboard. It's quiet enough to be unnoticeable when during regular use and the louder spinning HDD will drown out the noise anyway.
| Lenovo Legion Y730-15ICH i5-8300H GeForce GTX 1050 Ti Mobile, i5-8300H, Intel Optane 16 GB MEMPEK1J016GAL + HGST ST1000LM049 1 TB HDD | Lenovo Legion Y530-15ICH GeForce GTX 1060 Mobile, i7-8750H, Samsung SSD PM981 MZVLB256HAHQ | Dell G7 15-7588 GeForce GTX 1060 Max-Q, i7-8750H, SK hynix SC311 SATA | Asus FX504GD GeForce GTX 1050 Mobile, i5-8300H, Seagate Mobile HDD 1TB ST1000LX015-1U7172 | MSI GF63 8RC GeForce GTX 1050 Mobile, i5-8300H, Seagate BarraCuda Pro Compute 1TB ST1000LM049 | Razer Blade 15 Base Model GeForce GTX 1060 Max-Q, i7-8750H, Samsung SSD PM981 MZVLB256HAHQ | |
|---|---|---|---|---|---|---|
| Noise | -1% | -2% | -0% | -4% | -6% | |
| off / environment * (dB) | 28.9 | 30.2 -4% | 28.1 3% | 28.1 3% | 28 3% | 27.8 4% |
| Idle Minimum * (dB) | 32.2 | 30.9 4% | 29 10% | 29 10% | 33.8 -5% | 31 4% |
| Idle Average * (dB) | 32.5 | 30.9 5% | 29 11% | 29.2 10% | 34 -5% | 31.2 4% |
| Idle Maximum * (dB) | 32.7 | 31.6 3% | 29.2 11% | 29.7 9% | 34.2 -5% | 31.3 4% |
| Load Average * (dB) | 33.2 | 42.3 -27% | 40.6 -22% | 44.3 -33% | 37.3 -12% | 47.2 -42% |
| Witcher 3 ultra * (dB) | 43.1 | 49.8 -16% | 40.7 6% | 43.4 -1% | 51.3 -19% | |
| Load Maximum * (dB) | 45 | 40 11% | 49.8 -11% | 47.7 -6% | 46 -2% | 44.3 2% |
* ... smaller is better
Noise level
| Idle |
| 32.2 / 32.5 / 32.7 dB(A) |
| Load |
| 33.2 / 45 dB(A) |
 | ||
30 dB silent 40 dB(A) audible 50 dB(A) loud |
||
min: | ||
Temperature
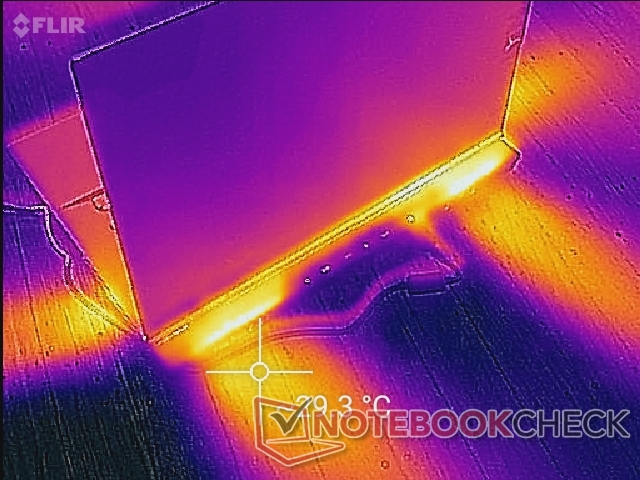
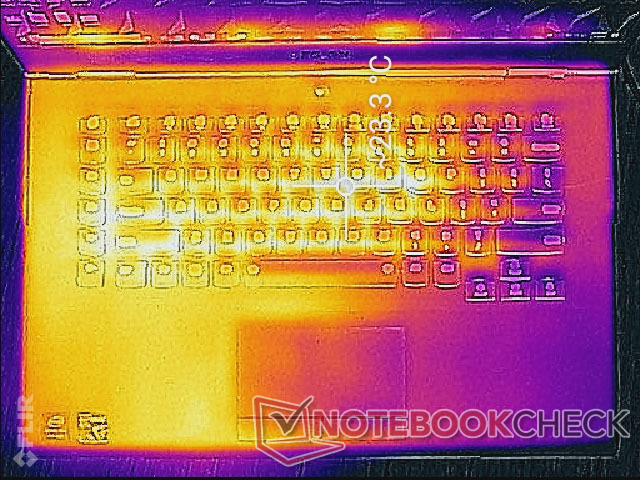
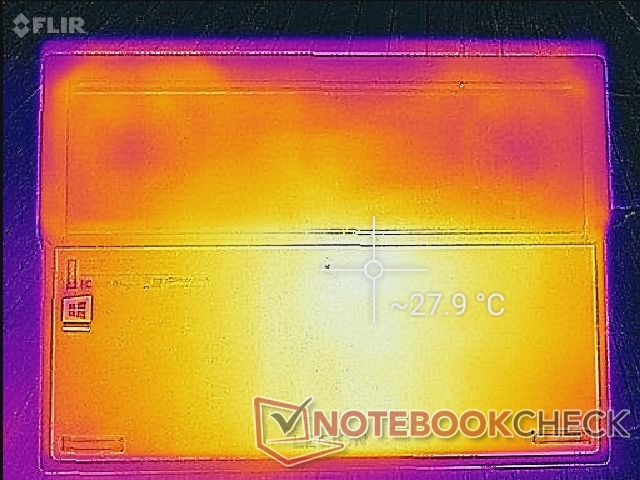
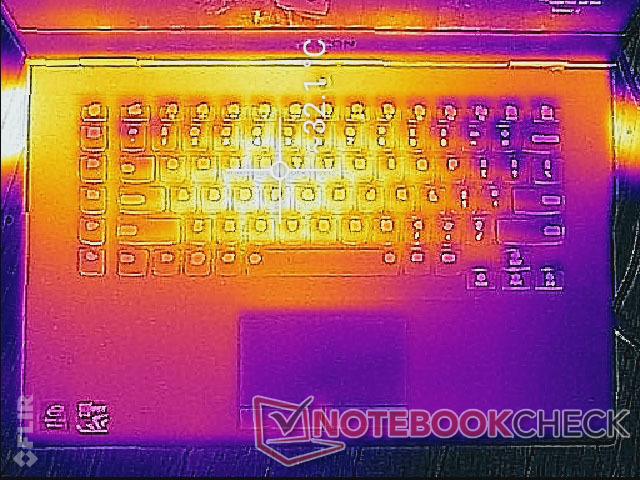
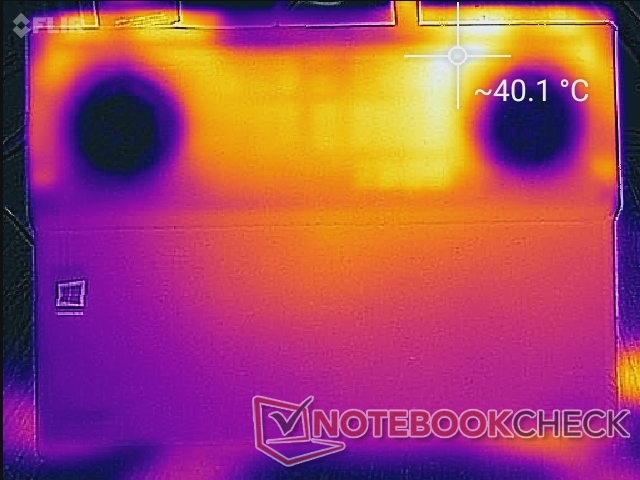
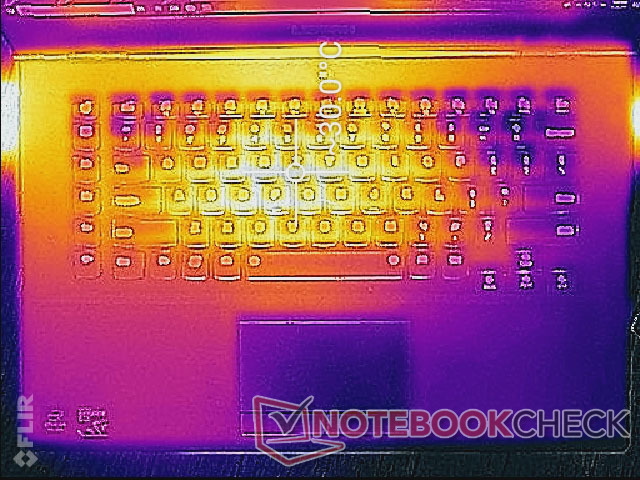
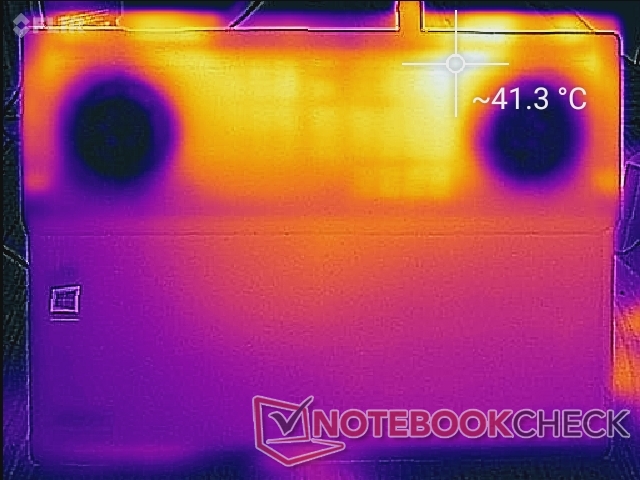
Surface temperatures are quite cool when idling or even when gaming. When idle, the bottom hot spot of 28 C sits directly above the motherboard chipset compared to just 23 C on the keyboard surface. Higher loads like gaming will bump the keyboard center to about 30 C and the bottom to over 40 C. Thankfully, the palm rests and WASD keys remain much cooler in comparison for comfortable use no matter the load.
Note that the Legion Y530 can become significantly warmer to the touch than the Y730 at over 50 C or 65 C when under high stress. This can be partly attributed to its faster i7-8750H CPU and GTX 1060 GPU compared to our slower Y730 configuration.
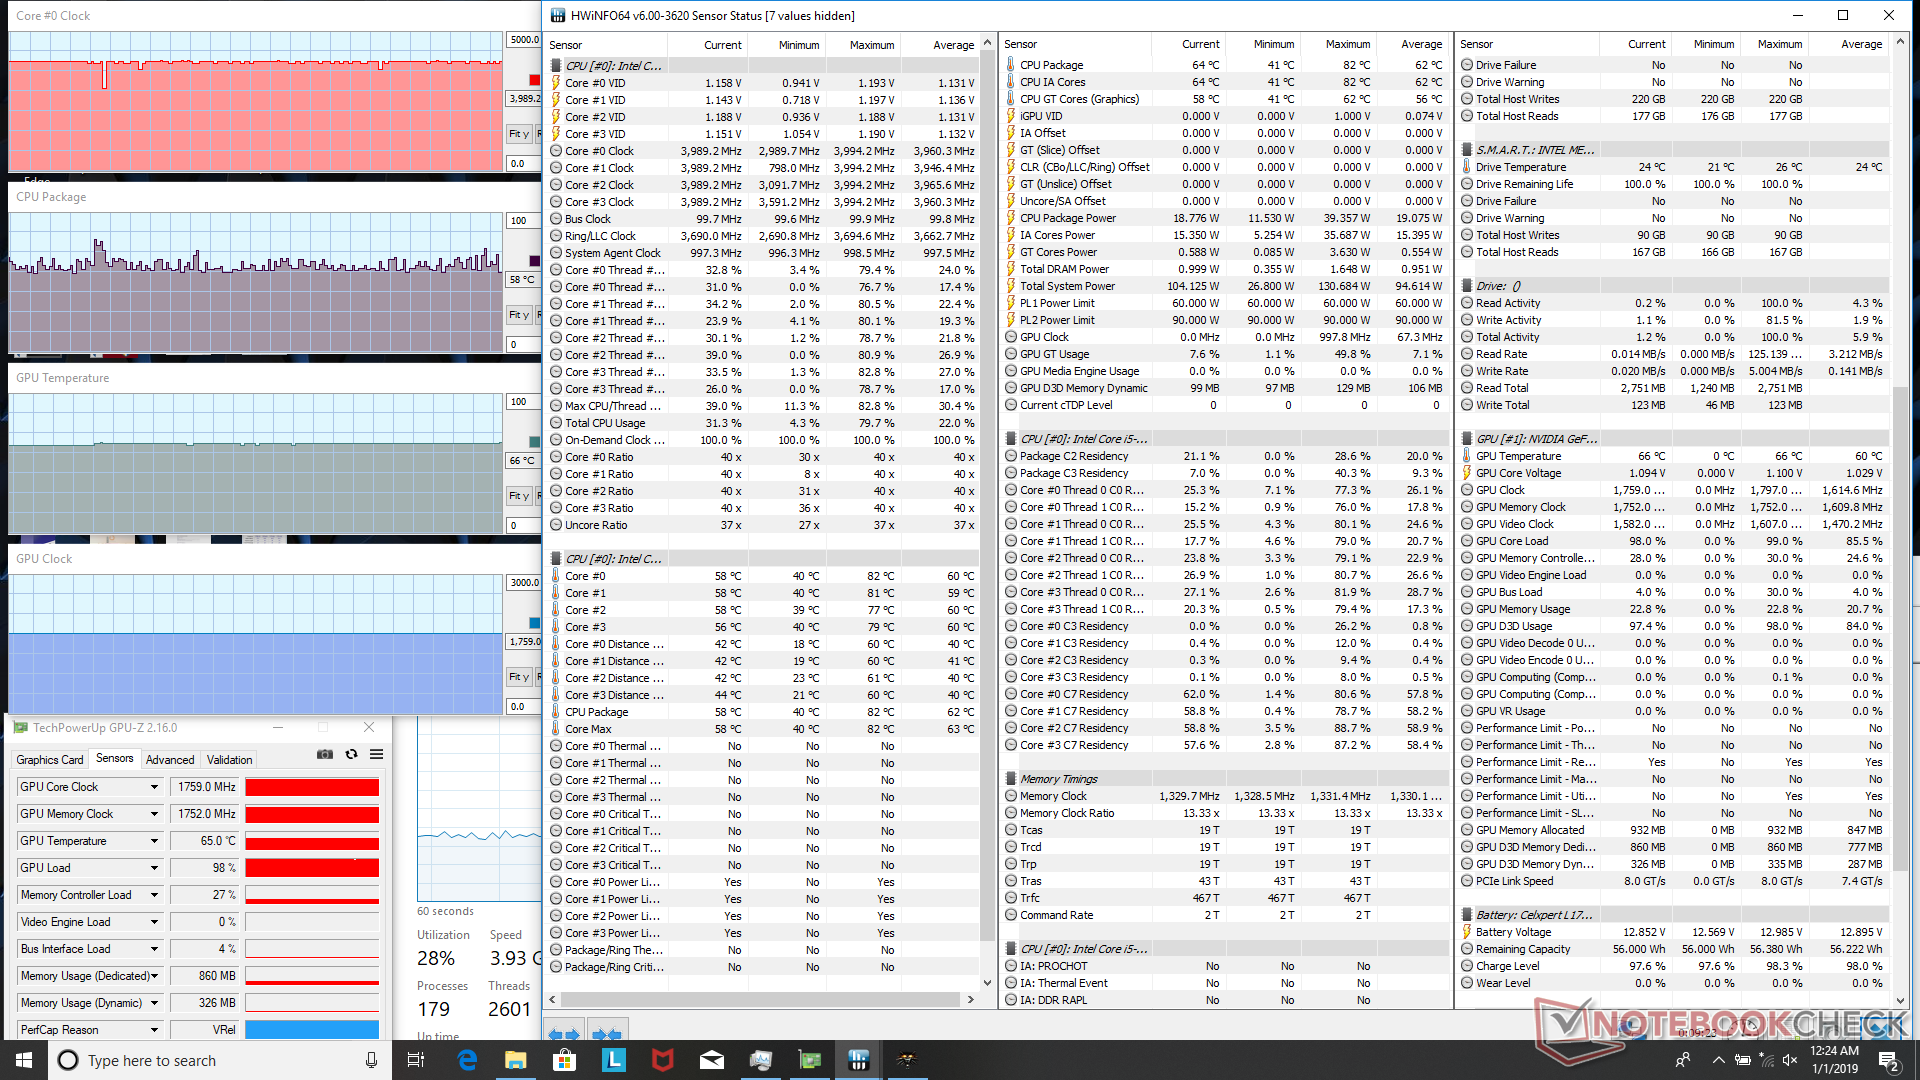
We stress the system to identify for any potential throttling or stability issues. When running Prime95 to stress the CPU, we can observe a stable clock rate and temperature of 3.9 GHz and 72 C, respectively. The results line up with our CineBench loop test results above and our power consumption measurements below. This kind of consistent performance when under extreme loads is ideal for gaming laptops where high Turbo Boost is often desirable. In fact, this laptop is able to maintain the maximum rated Turbo Boost for the i5-8300H without any major dips.
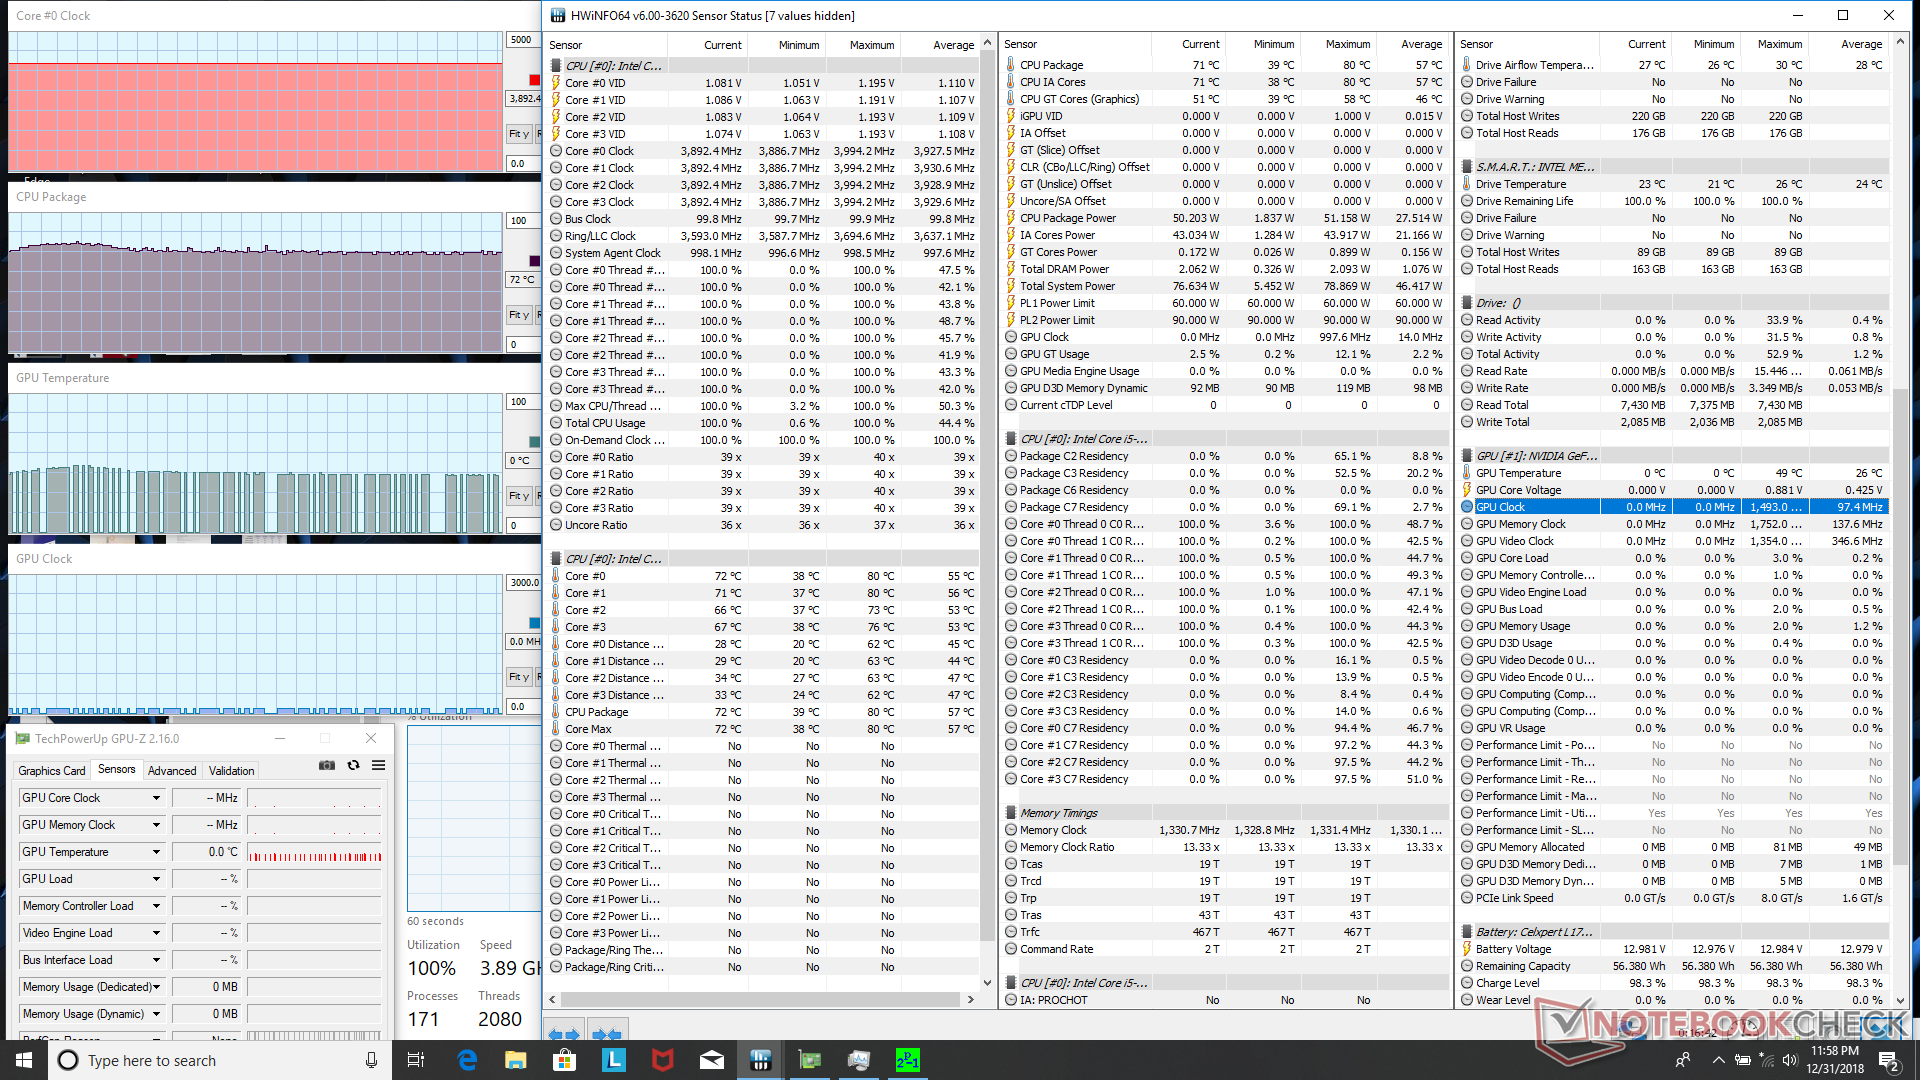
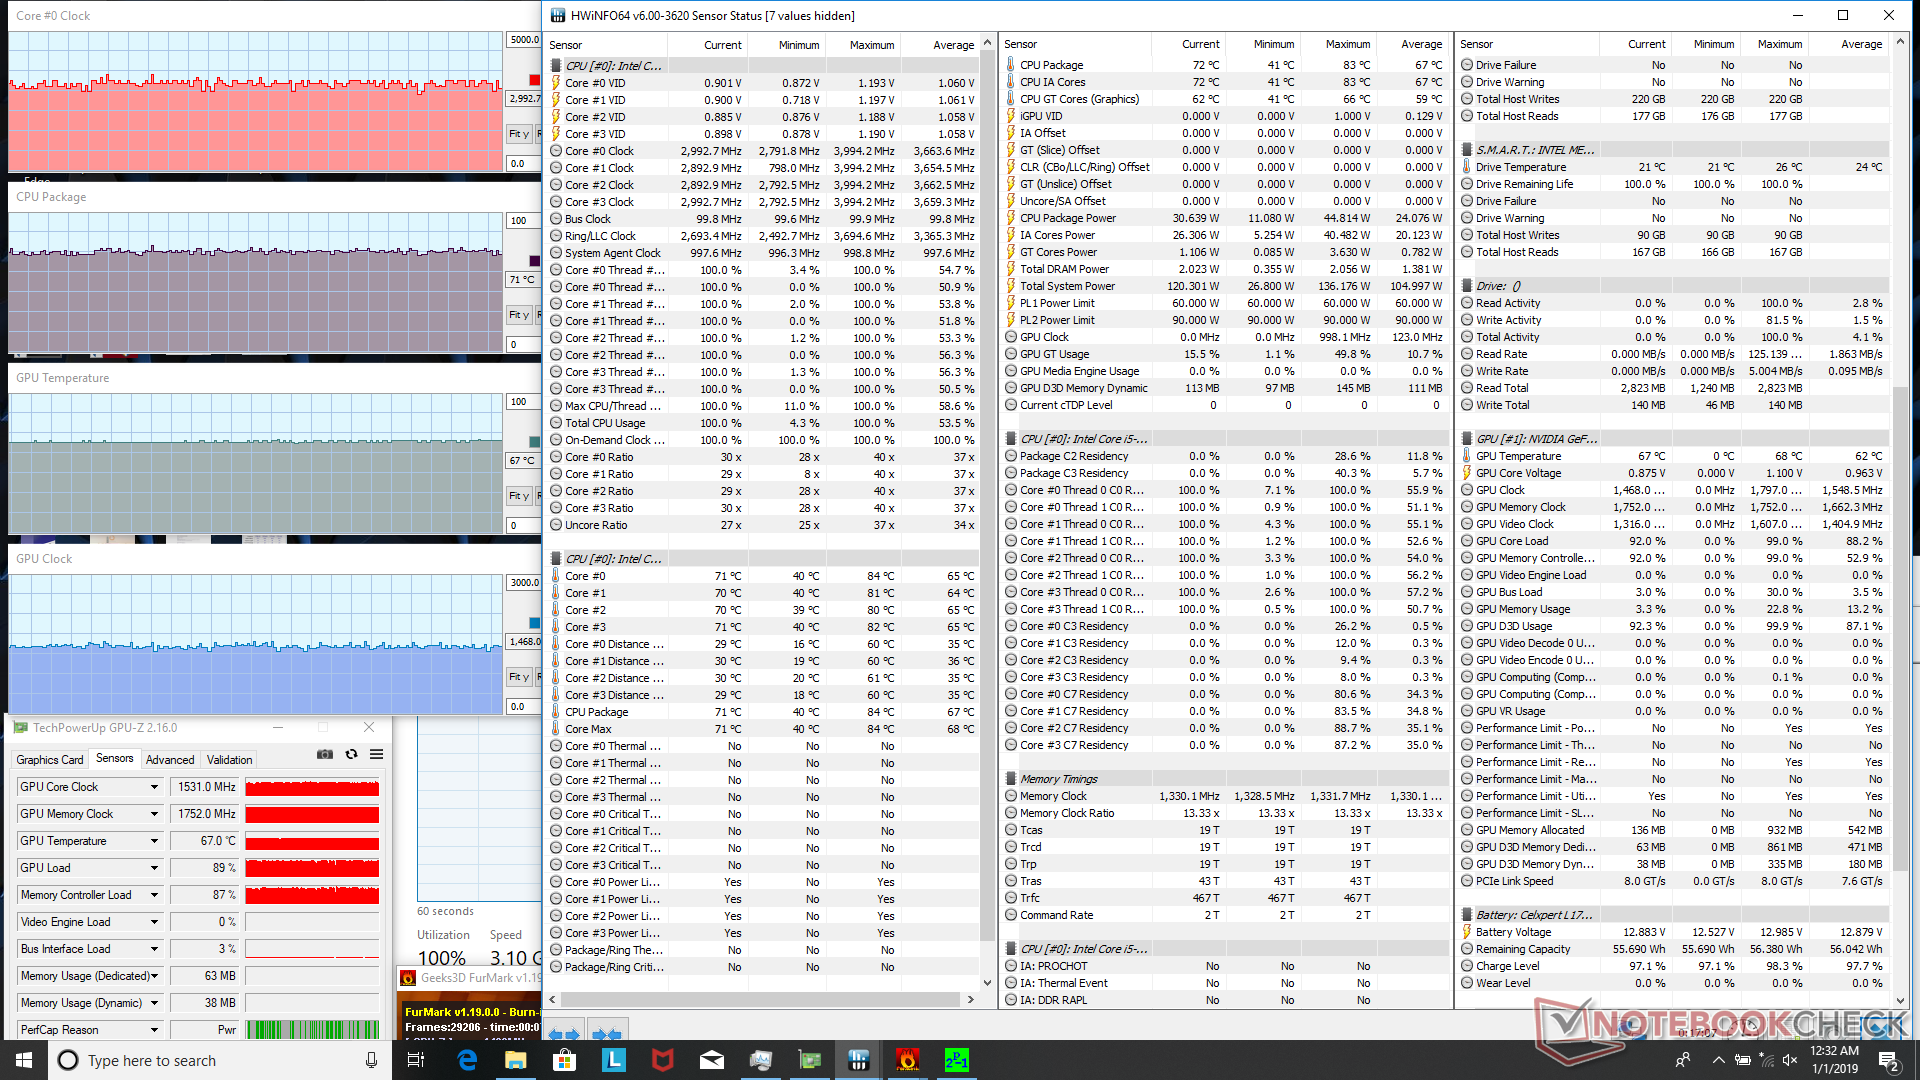
When under both Prime95 and FurMark stress, CPU clock rate drops to 3.0 GHz while CPU and GPU temperatures plateau at 71 C and 67 C, respectively. These temperatures are quite cool for a gaming laptop and they suggest that the chassis may be able to support faster graphics should Lenovo choose to add more SKUs in the future.
Running on battery power will reduce both CPU and GPU performance. A 3DMark 11 run on batteries returns Physics and Graphics scores of 6308 and 6388 points, respectively, compared to 8324 and 9805 points when on mains. Frame rates automatically cap out at 30 FPS if gaming on batteries.
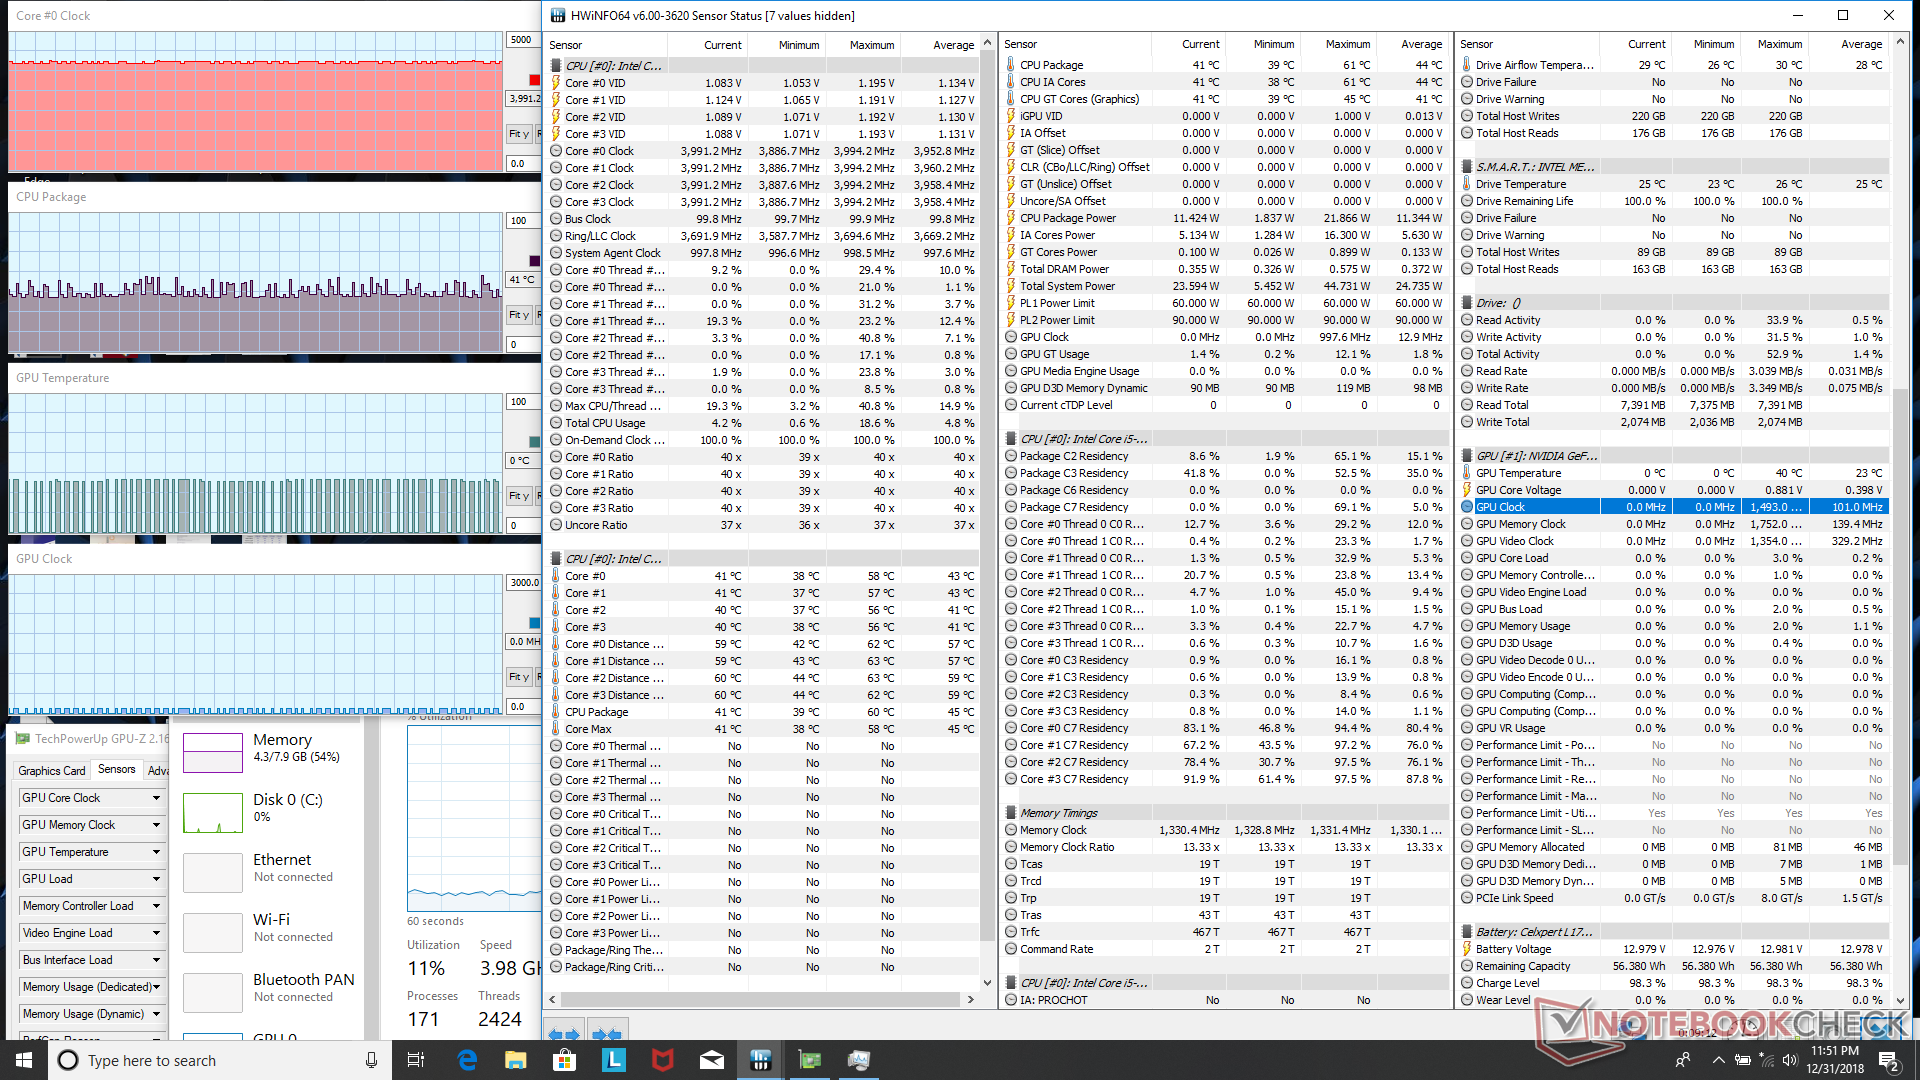
| CPU Clock (GHz) | GPU Clock (MHz) | Average CPU Temperature (°C) | Average GPU Temperature (°C) | |
| System Idle | -- | -- | ~41 | ~34 |
| Prime95 Stress | 3.9 | -- | 72 | -- |
| Prime95 + FurMark Stress | ~3.0 | 1531 | 71 | 67 |
| Witcher 3 Stress | 4.0 | 1759 | ~58 | 66 |
(+) The maximum temperature on the upper side is 30 °C / 86 F, compared to the average of 40.4 °C / 105 F, ranging from 21.2 to 68.8 °C for the class Gaming.
(±) The bottom heats up to a maximum of 40.8 °C / 105 F, compared to the average of 43.2 °C / 110 F
(+) In idle usage, the average temperature for the upper side is 21.7 °C / 71 F, compared to the device average of 33.9 °C / 93 F.
(+) Playing The Witcher 3, the average temperature for the upper side is 25.6 °C / 78 F, compared to the device average of 33.9 °C / 93 F.
(+) The palmrests and touchpad are cooler than skin temperature with a maximum of 23.4 °C / 74.1 F and are therefore cool to the touch.
(+) The average temperature of the palmrest area of similar devices was 28.8 °C / 83.8 F (+5.4 °C / 9.7 F).
Speakers
The 15-inch Y730 is missing the dedicated subwoofer found on the larger 17-inch Y730. As a result, the system is poorer at reproducing lower frequencies and this can even be seen when comparing the pink noise graphs between the two laptops. Sound quality is still relatively balanced for its size category with no static or reverberations when on higher volume settings. Maximum volume is satisfactory for personal gaming or multimedia purposes. The speakers get the job done without adding anything special to the mix.


Lenovo Legion Y730-15ICH i5-8300H audio analysis
(±) | speaker loudness is average but good (72.3 dB)
Bass 100 - 315 Hz
(±) | reduced bass - on average 11.3% lower than median
(±) | linearity of bass is average (14% delta to prev. frequency)
Mids 400 - 2000 Hz
(±) | higher mids - on average 7.1% higher than median
(+) | mids are linear (5.9% delta to prev. frequency)
Highs 2 - 16 kHz
(+) | balanced highs - only 1.7% away from median
(+) | highs are linear (4.8% delta to prev. frequency)
Overall 100 - 16.000 Hz
(±) | linearity of overall sound is average (19.3% difference to median)
Compared to same class
» 65% of all tested devices in this class were better, 8% similar, 27% worse
» The best had a delta of 6%, average was 18%, worst was 132%
Compared to all devices tested
» 47% of all tested devices were better, 8% similar, 46% worse
» The best had a delta of 4%, average was 24%, worst was 134%
Apple MacBook 12 (Early 2016) 1.1 GHz audio analysis
(+) | speakers can play relatively loud (83.6 dB)
Bass 100 - 315 Hz
(±) | reduced bass - on average 11.3% lower than median
(±) | linearity of bass is average (14.2% delta to prev. frequency)
Mids 400 - 2000 Hz
(+) | balanced mids - only 2.4% away from median
(+) | mids are linear (5.5% delta to prev. frequency)
Highs 2 - 16 kHz
(+) | balanced highs - only 2% away from median
(+) | highs are linear (4.5% delta to prev. frequency)
Overall 100 - 16.000 Hz
(+) | overall sound is linear (10.2% difference to median)
Compared to same class
» 7% of all tested devices in this class were better, 2% similar, 91% worse
» The best had a delta of 5%, average was 18%, worst was 53%
Compared to all devices tested
» 5% of all tested devices were better, 1% similar, 94% worse
» The best had a delta of 4%, average was 24%, worst was 134%
Energy Management
Power Consumption
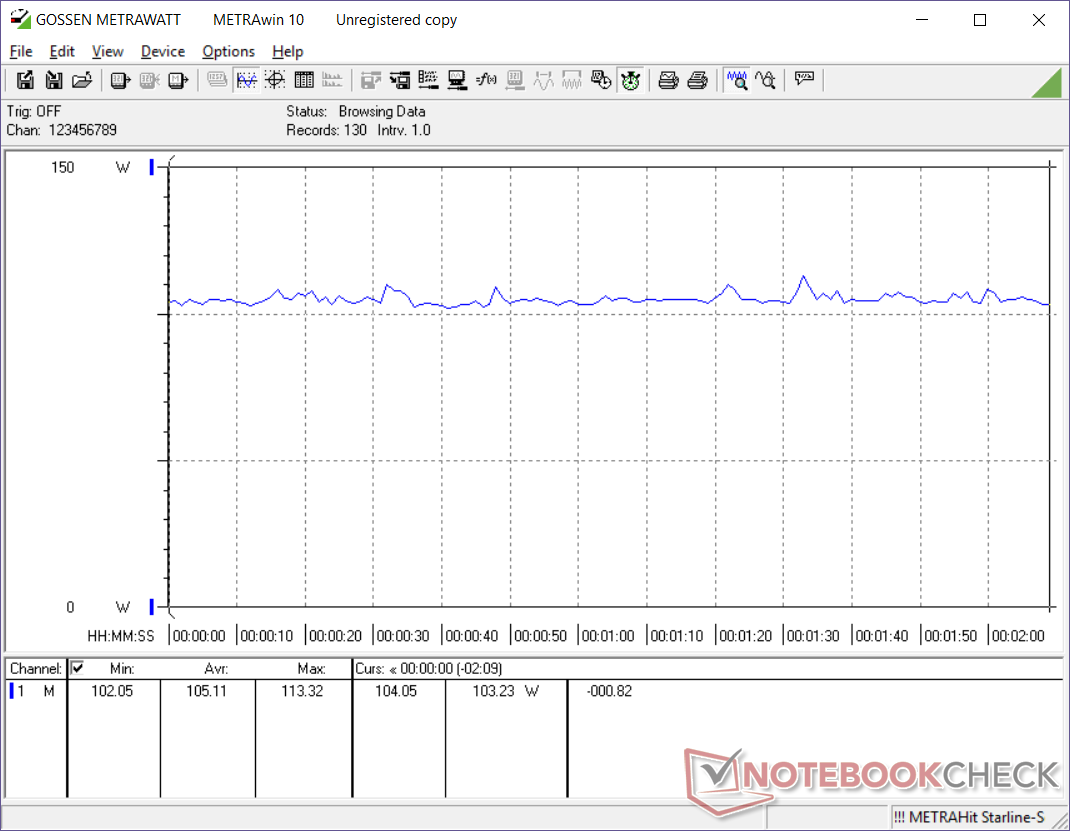
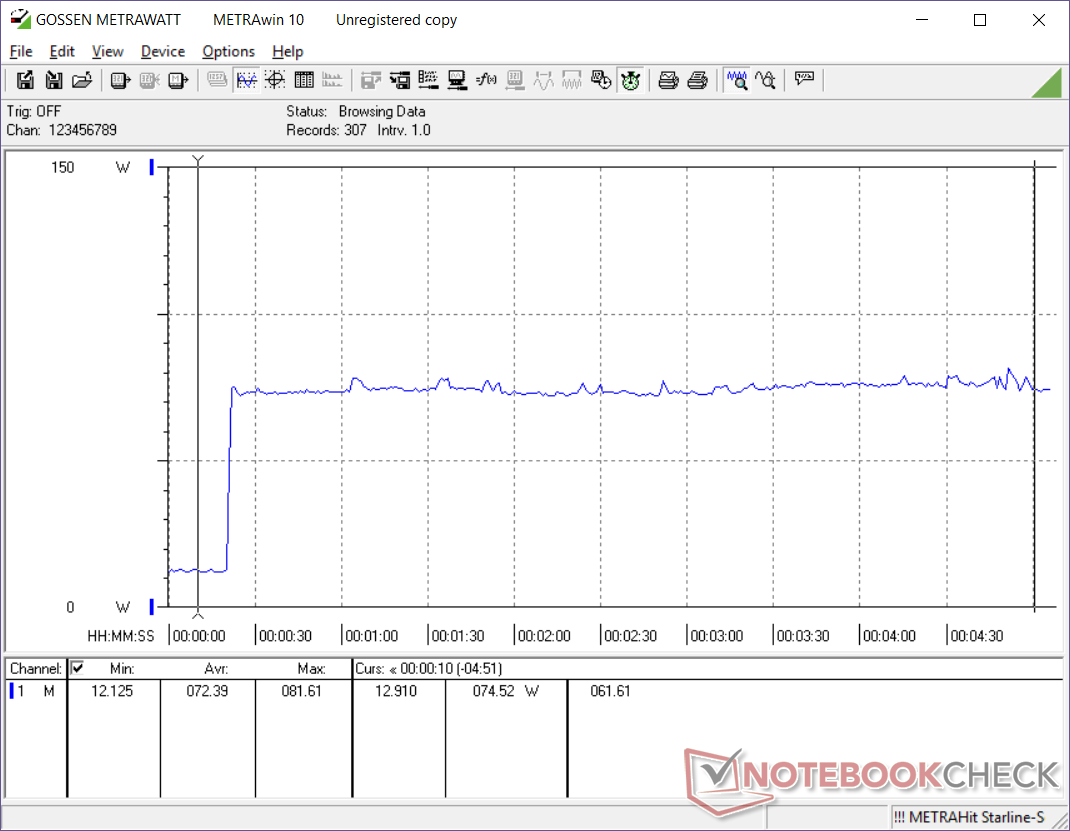
Idling on desktop demands anywhere between 8 W and 13 W depending on the brightness setting and power profile to be just a tad higher than the competing MSI GF63 and Asus TUF FX504 with GTX 1050 graphics. If gaming, power consumption is about 10 to 15 percent higher than each of these aforementioned laptops. When considering that the GTX 1050 Ti is about 25 percent faster than the GTX 1050, the slightly higher consumption is a fair trade-off from a performance-per-Watt perspective.
We are able to record a maximum consumption of 136 W from the medium-sized (~14.4 x 6.4 x 3 cm) 135 W AC adapter when running both Prime95 and FurMark simultaneously. We would have preferred a higher Wattage rating just in case if users wanted to connect any Thunderbolt 3 devices whilst running the laptop at maximum load.
| Off / Standby | |
| Idle | |
| Load |
|
Key:
min: | |
| Lenovo Legion Y730-15ICH i5-8300H i5-8300H, GeForce GTX 1050 Ti Mobile, Intel Optane 16 GB MEMPEK1J016GAL + HGST ST1000LM049 1 TB HDD, IPS, 1920x1080, 15.6" | Lenovo Legion Y530-15ICH i7-8750H, GeForce GTX 1060 Mobile, Samsung SSD PM981 MZVLB256HAHQ, IPS, 1920x1080, 15.6" | Dell G7 15-7588 i7-8750H, GeForce GTX 1060 Max-Q, SK hynix SC311 SATA, IPS, 1920x1080, 15.6" | Asus FX504GD i5-8300H, GeForce GTX 1050 Mobile, Seagate Mobile HDD 1TB ST1000LX015-1U7172, TN LED, 1920x1080, 15.6" | MSI GF63 8RC i5-8300H, GeForce GTX 1050 Mobile, Seagate BarraCuda Pro Compute 1TB ST1000LM049, IPS, 1920x1080, 15.6" | Razer Blade 15 Base Model i7-8750H, GeForce GTX 1060 Max-Q, Samsung SSD PM981 MZVLB256HAHQ, IPS, 1920x1080, 15.6" | |
|---|---|---|---|---|---|---|
| Power Consumption | -5% | 12% | 12% | 16% | -14% | |
| Idle Minimum * (Watt) | 8 | 7.3 9% | 5.5 31% | 7.2 10% | 5.4 32% | 10.2 -27% |
| Idle Average * (Watt) | 11.8 | 11.1 6% | 7.6 36% | 10.2 14% | 10.4 12% | 13.2 -12% |
| Idle Maximum * (Watt) | 13.1 | 12.6 4% | 9 31% | 10.9 17% | 10.5 20% | 17.6 -34% |
| Load Average * (Watt) | 90.2 | 109 -21% | 94 -4% | 93.3 -3% | 84.7 6% | 99.5 -10% |
| Witcher 3 ultra * (Watt) | 107.8 | 116.3 -8% | 95.8 11% | 92.7 14% | 113.6 -5% | |
| Load Maximum * (Watt) | 136.2 | 168 -23% | 154.4 -13% | 102.5 25% | 119.9 12% | 133.3 2% |
* ... smaller is better
Battery Life
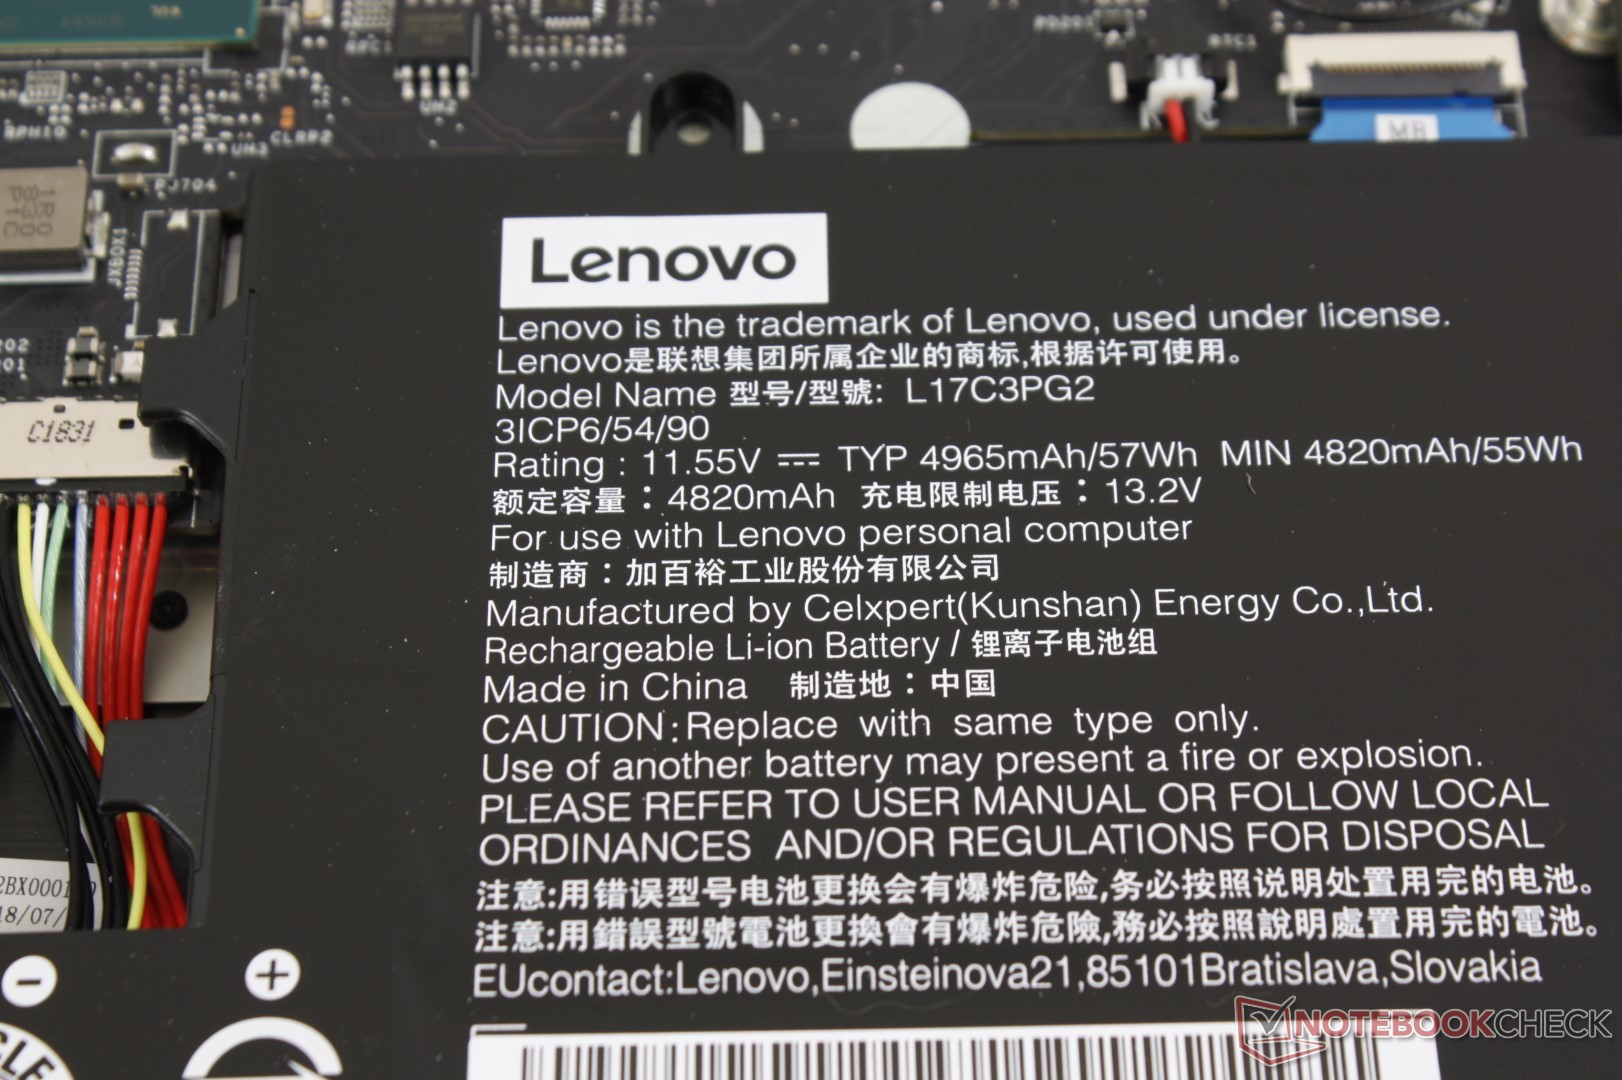
The non-removable 57 Wh battery is about average in terms of capacity and runtime. Expect a real-world WLAN runtime of just over 5 hours on the Balanced profile mode with Optimus set to the integrated GPU. Results are very similar to the MSI GF63 but still a couple of hours shorter than the thicker Dell G7 15.
Charging from empty to full capacity takes 1.5 to 2 hours.
| Lenovo Legion Y730-15ICH i5-8300H i5-8300H, GeForce GTX 1050 Ti Mobile, 57 Wh | Lenovo Legion Y530-15ICH i7-8750H, GeForce GTX 1060 Mobile, 52 Wh | Dell G7 15-7588 i7-8750H, GeForce GTX 1060 Max-Q, 56 Wh | Asus FX504GD i5-8300H, GeForce GTX 1050 Mobile, 48 Wh | MSI GF63 8RC i5-8300H, GeForce GTX 1050 Mobile, 51 Wh | Razer Blade 15 Base Model i7-8750H, GeForce GTX 1060 Max-Q, 65 Wh | |
|---|---|---|---|---|---|---|
| Battery runtime | -34% | 59% | -21% | -2% | 25% | |
| Reader / Idle (h) | 9.6 | 8.3 -14% | 10.9 14% | 7.5 -22% | 9.5 -1% | 11.5 20% |
| WiFi v1.3 (h) | 5.3 | 3.8 -28% | 7.5 42% | 3.7 -30% | 5.5 4% | 5.5 4% |
| Load (h) | 1 | 0.4 -60% | 2.2 120% | 0.9 -10% | 0.9 -10% | 1.5 50% |
Verdict
Pros
Cons
The Legion Y730 is in a precarious position. It's the thinner, lighter, and higher-end version of the Legion Y530 with more bells and whistles like LED lights, aluminum surfaces, and Thunderbolt 3, but it lacks the GeForce GTX 1060 GPU option found on its budget alternative. Why the Legion Y730 is stuck with the GTX 1050 Ti GPU is beyond our reasoning especially since the laptop runs relatively cool when gaming with excellent CPU Turbo Boost performance. The chassis is clearly capable of handling faster GPUs and we suspect that a refresh will come soon enough with next generation Nvidia graphics.
The biggest selling points of the Y730 are its per-key RGB lights and Thunderbolt 3 port for a low price of $1000 USD. Indeed, most entry-level gaming competitors like the MSI GF63, Gigabyte Sabre 15, or Asus TUF FX504 lack one or both of these features. The rest of the laptop, however, is merely average including its slow black-white response times, spongy keyboard keys, and flimsy lid. Gamers would be better off just waiting for a Legion Y730 refresh with faster GPU options or going with the less expensive Legion Y530 and its faster GTX 1060 SKU instead.
A strange amalgamation of high-end features and looks tied down by a mainstream GPU option and a weak lid. The current iteration of the Legion Y730 could use an update sooner rather than later in regards to its chassis rigidity and GPU options.
Lenovo Legion Y730-15ICH i5-8300H
- 01/04/2019 v6 (old)
Allen Ngo
Price comparison
