Lenovo Yoga S730-13IWL (FHD, Core i7-8565U) Laptop Review
The Yoga series has become a well-known brand since its introduction in 2012, with Lenovo exclusively releasing its convertible laptops under the Yoga name, such as the Yoga 730-13IKB. However, the company announced at IFA 2018 in Berlin that it would be expanding its Yoga range to position it alongside the Dell XPS and HP Envy series. Convertible Yoga devices will now have the letter “C” in their model names, such as the Yoga C930-13IKB, to signify that they are convertibles. Likewise, the model numbers of Yoga tablets or 2-in-1s will now be preceded by the letter “D”, while Lenovo will use “S” to denote its traditional laptops. The first model in the Yoga S series is the S730-13IWL, which is the focus of this review.
Please note: Lenovo has not changed its naming scheme for its Yoga series in Canada and the US. The company sells the device as the IdeaPad 730S-13IWL rather than the Yoga S730-13IWL.
Our test device is the most expensive S730-13IWL variant that Lenovo currently sells in Germany. The device is equipped with a 1-TB SSD, 16 GB of RAM and an Intel Core i7-8565U processor, which is based on the new Intel Whiskey Lake architecture. We have chosen to compare the S730-13IWL against other compact 13.3-inch laptops such as the Apple MacBook Air 2018, the ASUS ZenBook S UX391U, the Dell XPS 13 9370 and the HP Envy 13.
Case
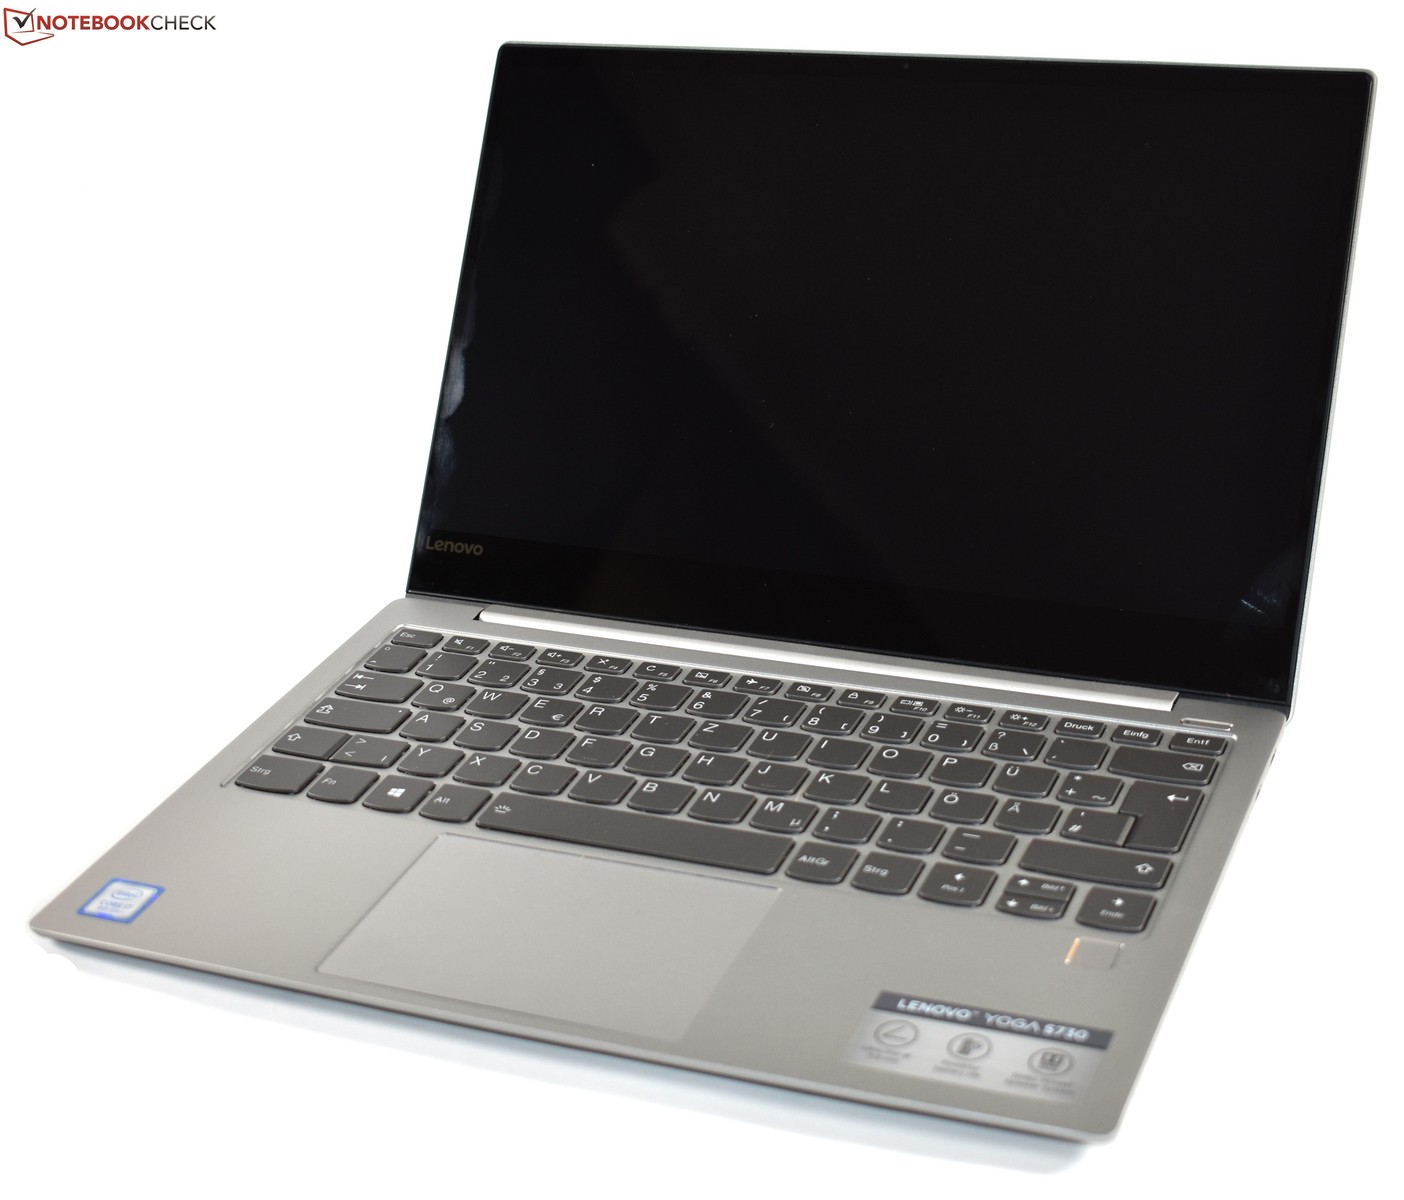
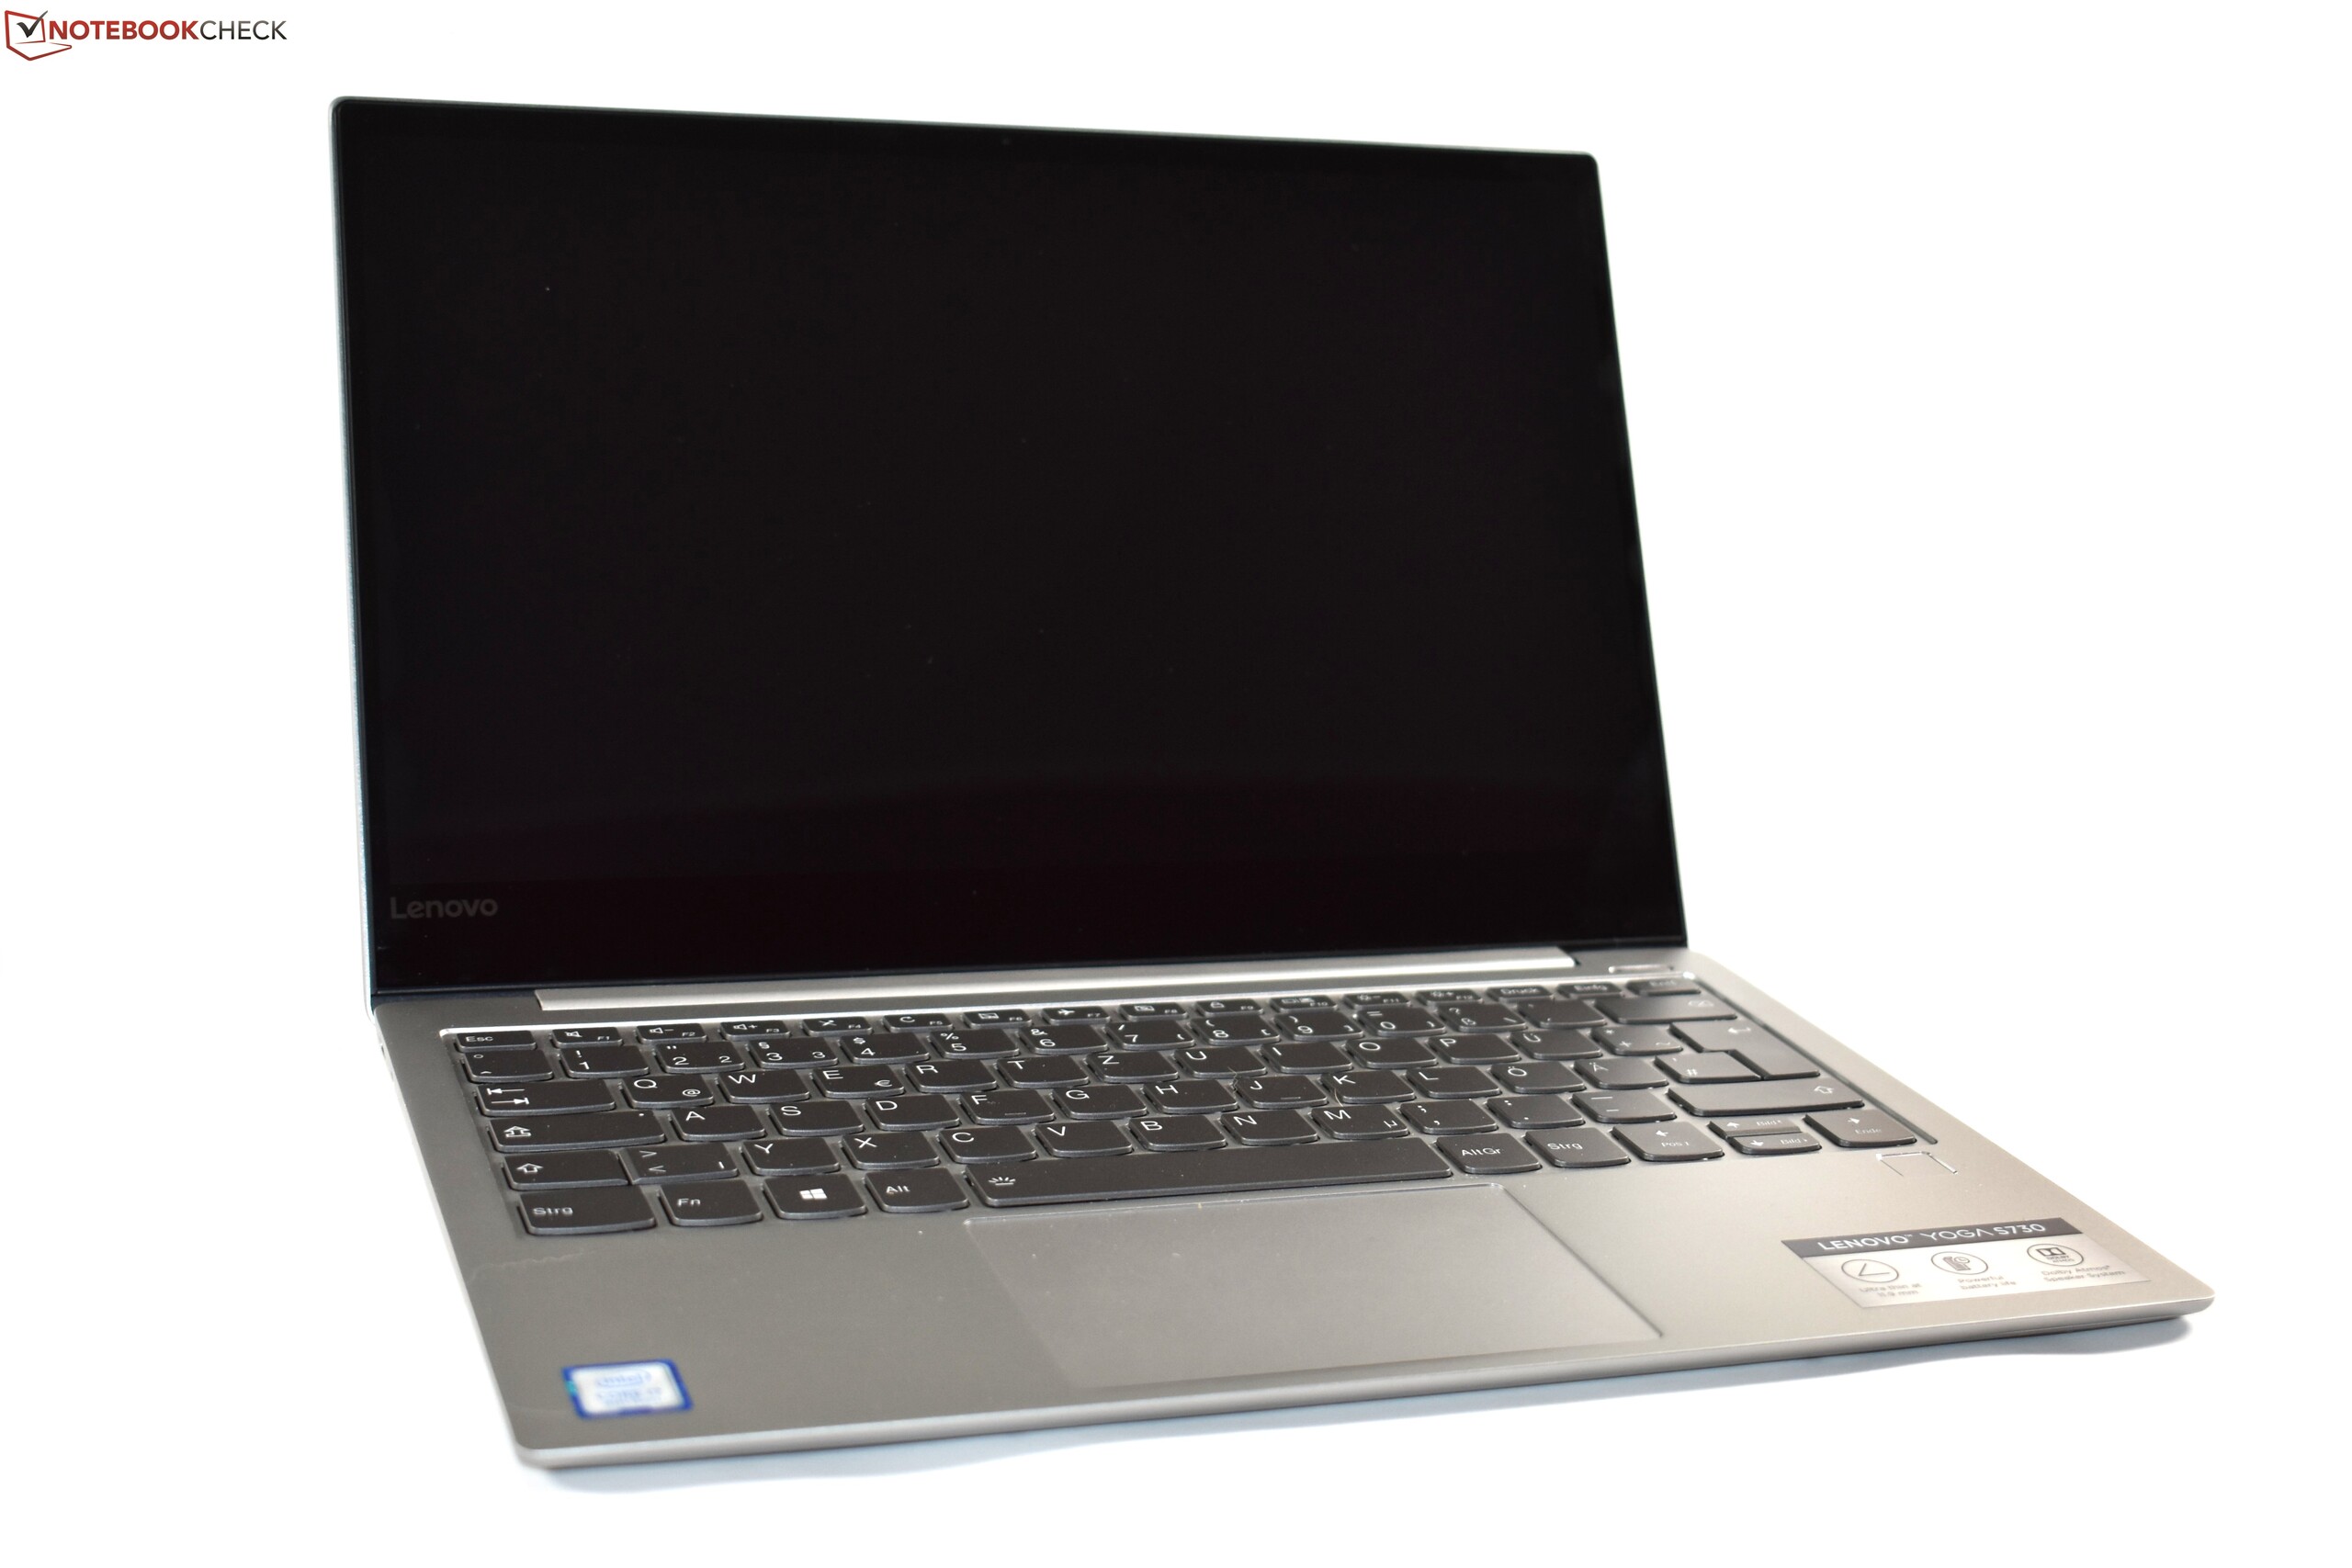
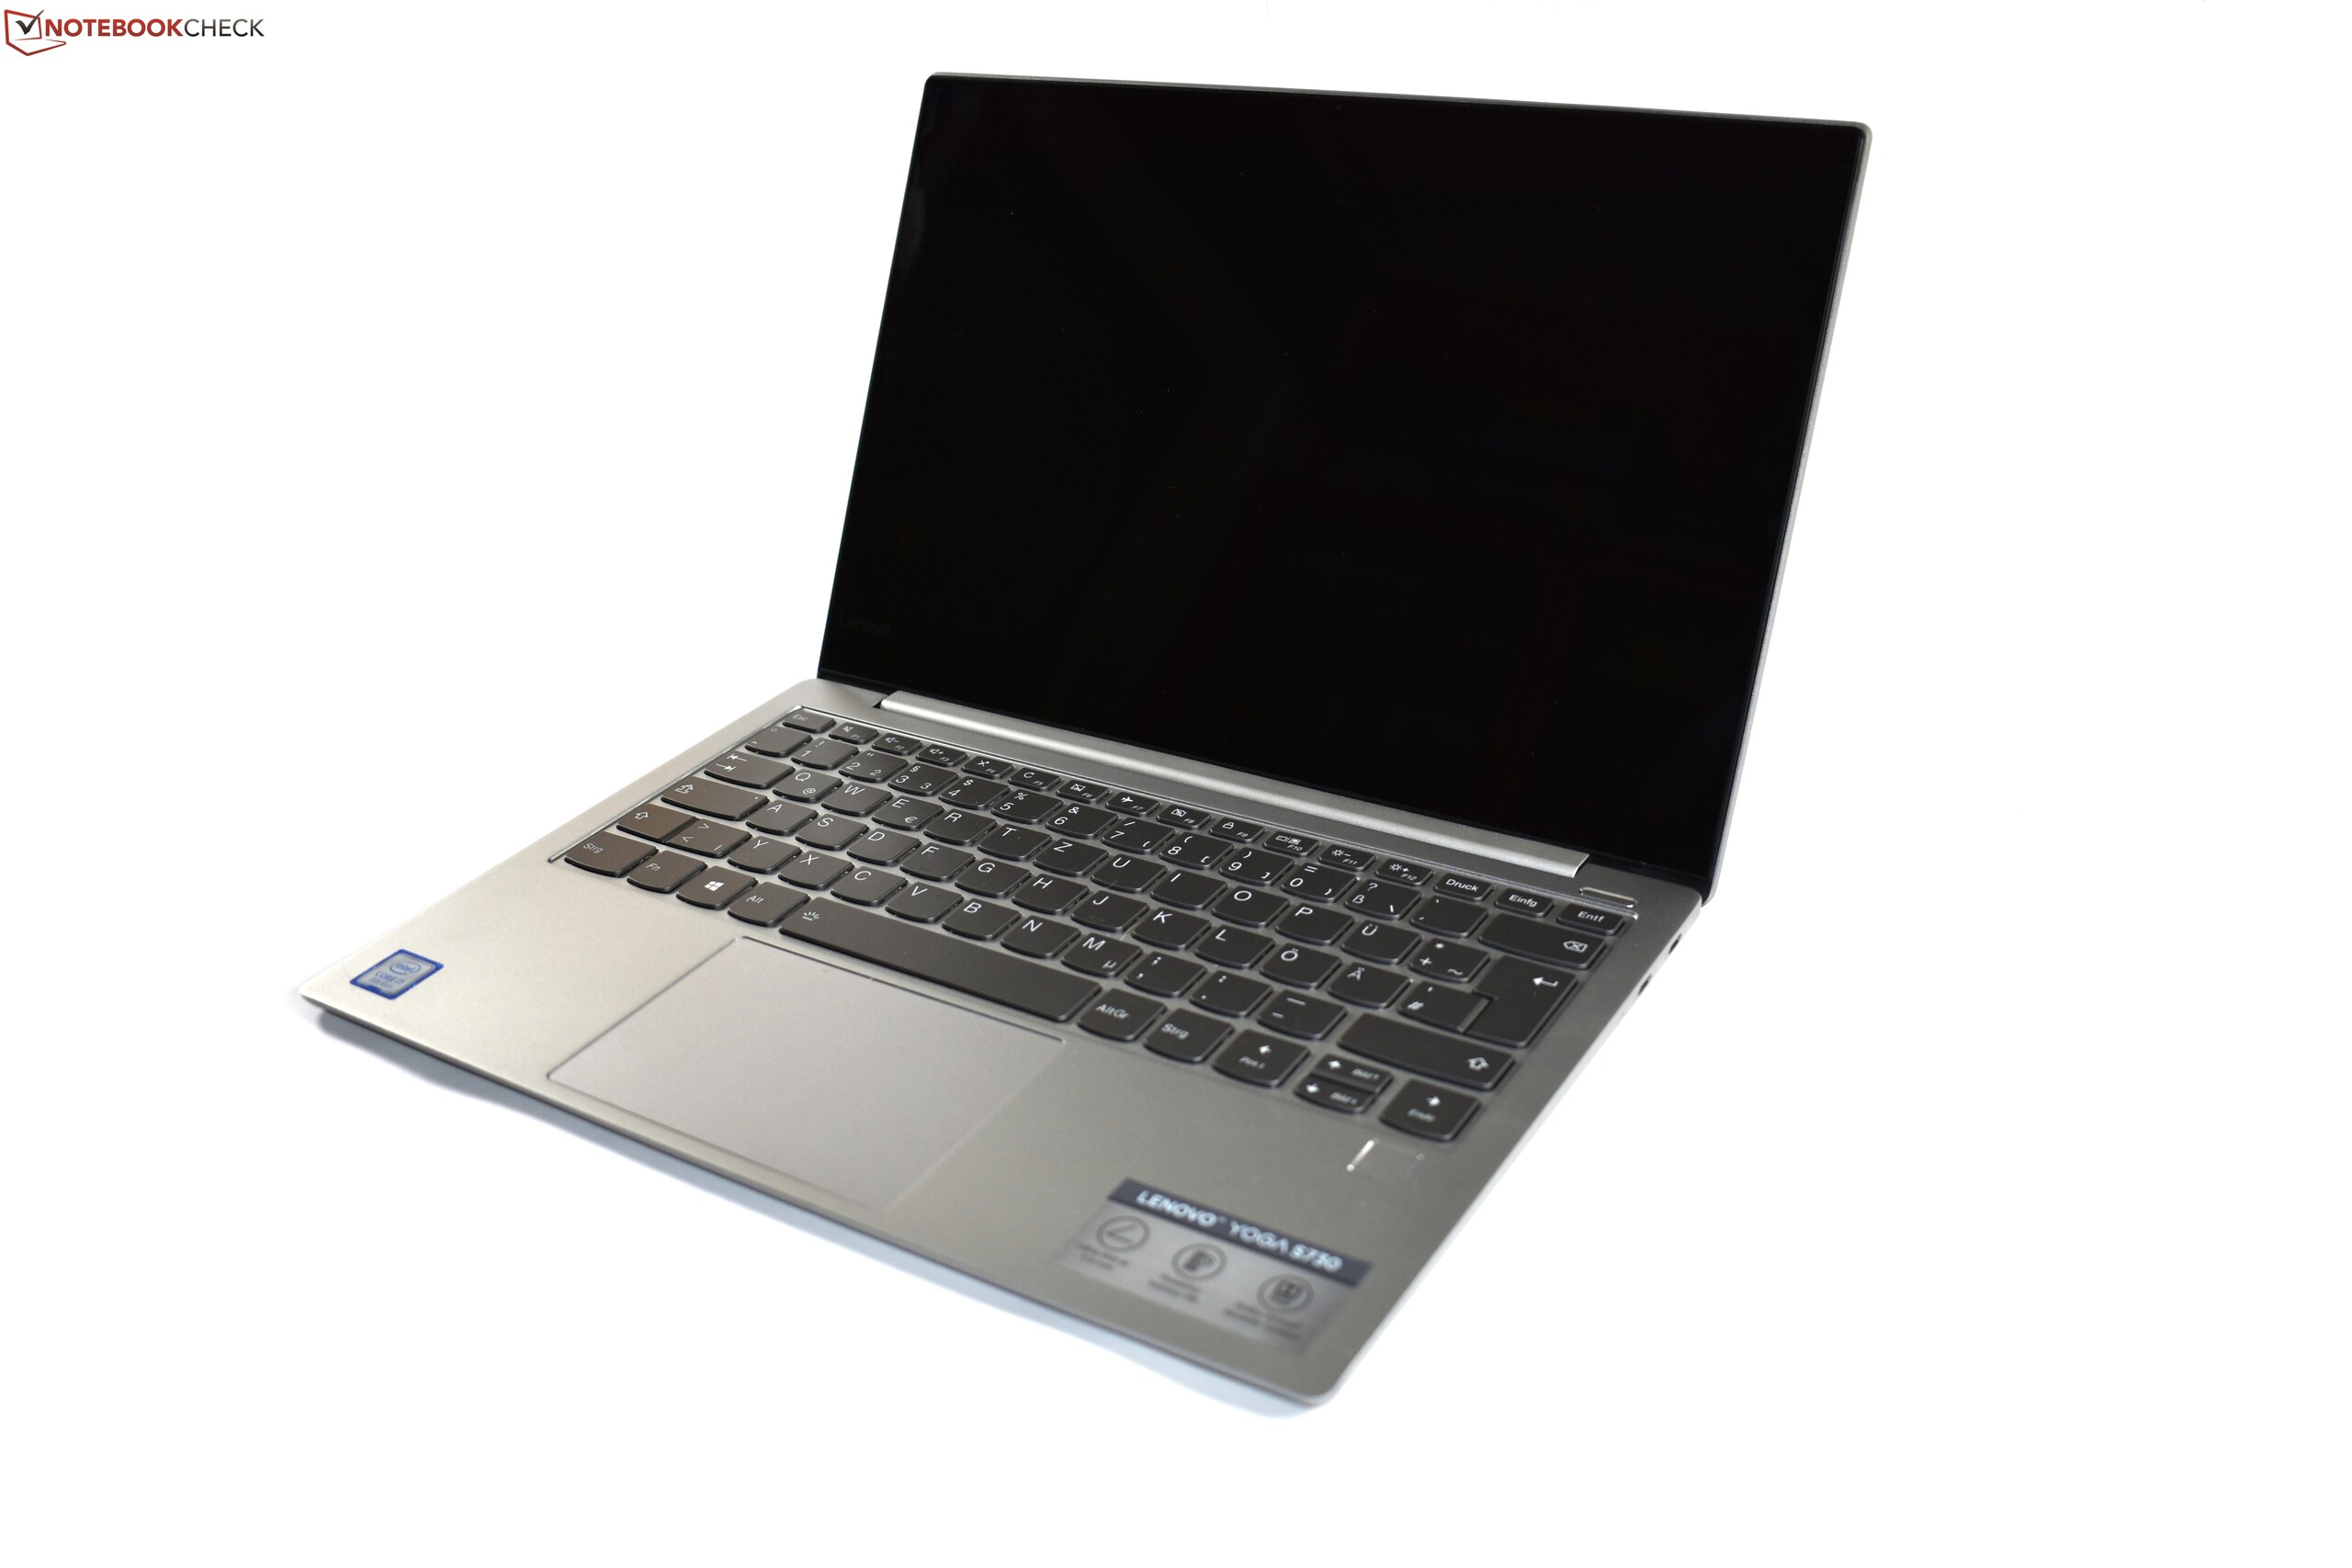
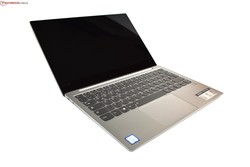
The Yoga S730-13IWL comes in silver or grey finishes. Our test device is the former variant and looks like a subtly redesigned IdeaPad 720s-13IKB. Basically, the keyboard area is roughly the same size, but the Yoga S730-13IWL is visibly slimmer, and Lenovo has equipped its new device with a glass display compared to the plastic display frame that it used in the IdeaPad 720s-13IKB.
Lenovo has constructed the S730-13IWL from aluminium, as well as the glass that it has used for the display. The use of materials is a good thing too as the device feels somewhat structurally unsound. The S730-13IWL is so thin that it feels like we could bend it slightly when we hold it by one of the front corners. Overall though, our test device feels robust, which is what we have come to expect from laptops in this price range. Moreover, the workmanship is to a high level with no uneven gaps between materials.
Lenovo has designed the S730-13IWL with a drop-down hinge that is covered by a plastic cover. It is well balanced too, as we can open the display with one hand. Also, the display hardly shakes when we open it, and it can open to 180°, which is unusually obtuse for a consumer-grade laptop.

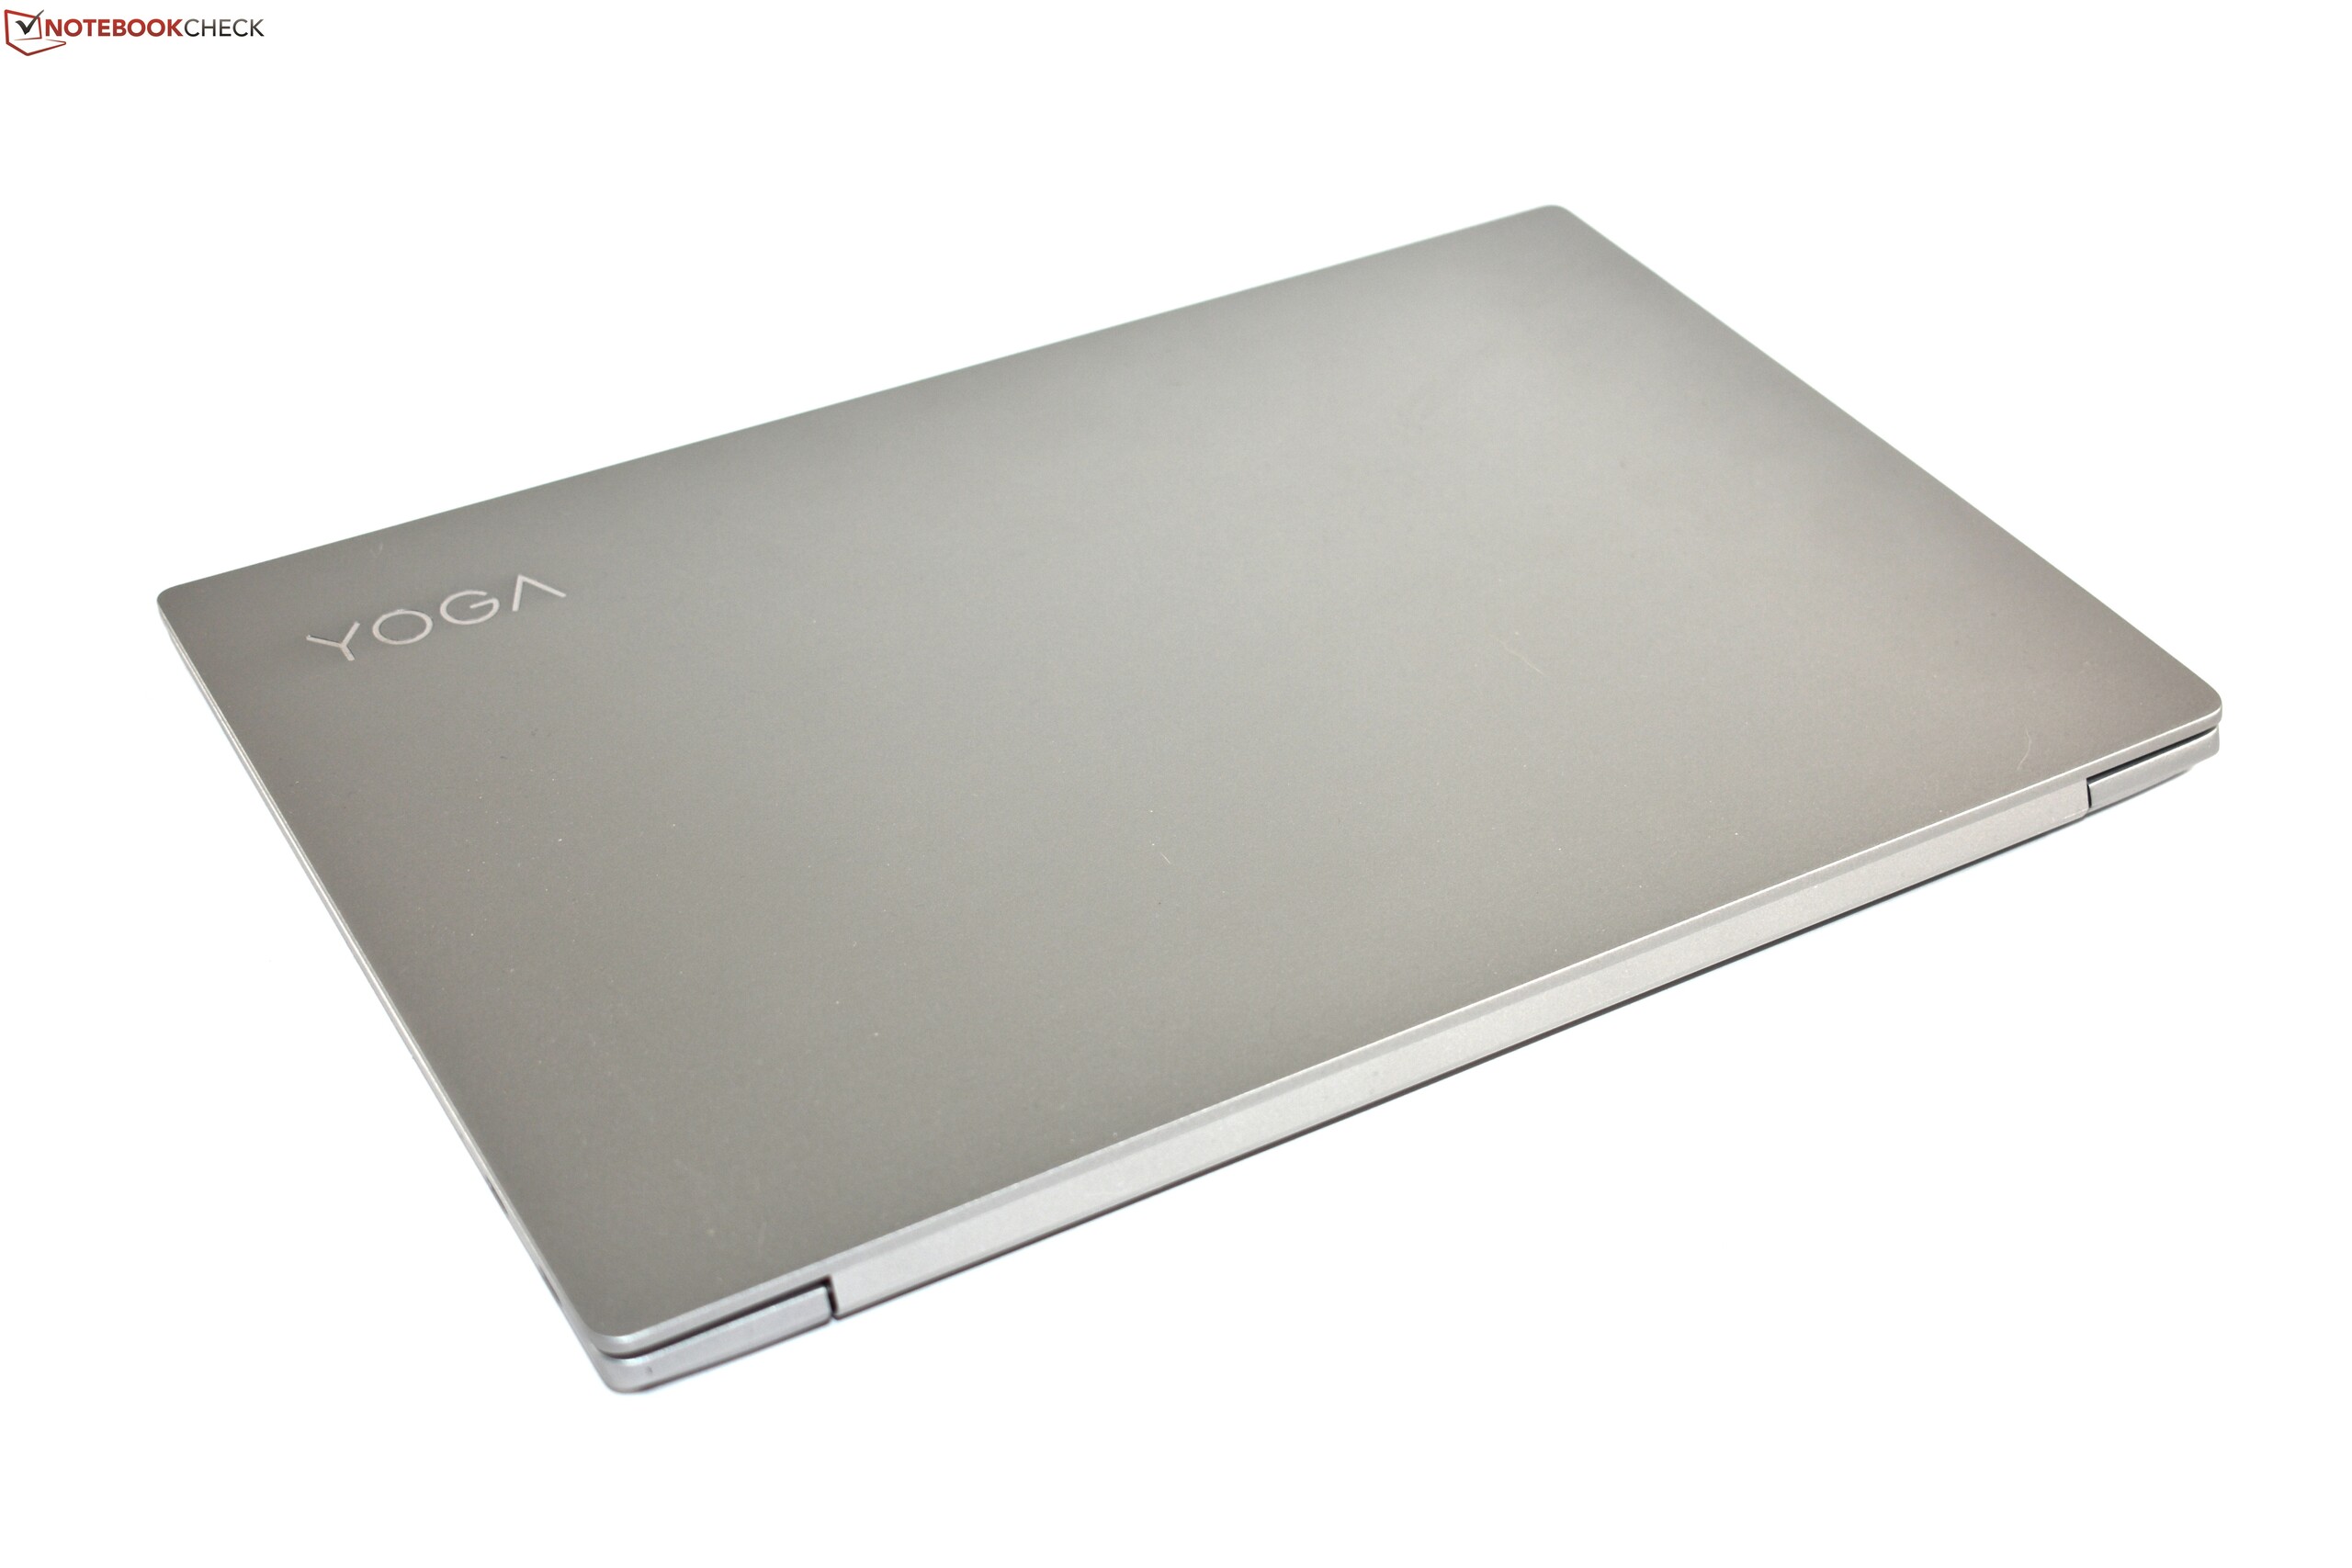
The Yoga S730-13IWL is comfortable to handle thanks to its thin frame and its light weight of around 1.1 kg (~2.4 lb). Our test device has a smaller overall footprint than the Envy 13 and the MacBook Air 2018. The XPS 13 9370 is marginally heavier though, although it is slightly more compact thanks to a narrower display bezel. By contrast, the ZenBook S UX391 is larger, but lighter than the Yoga S730-13IWL.
Connectivity
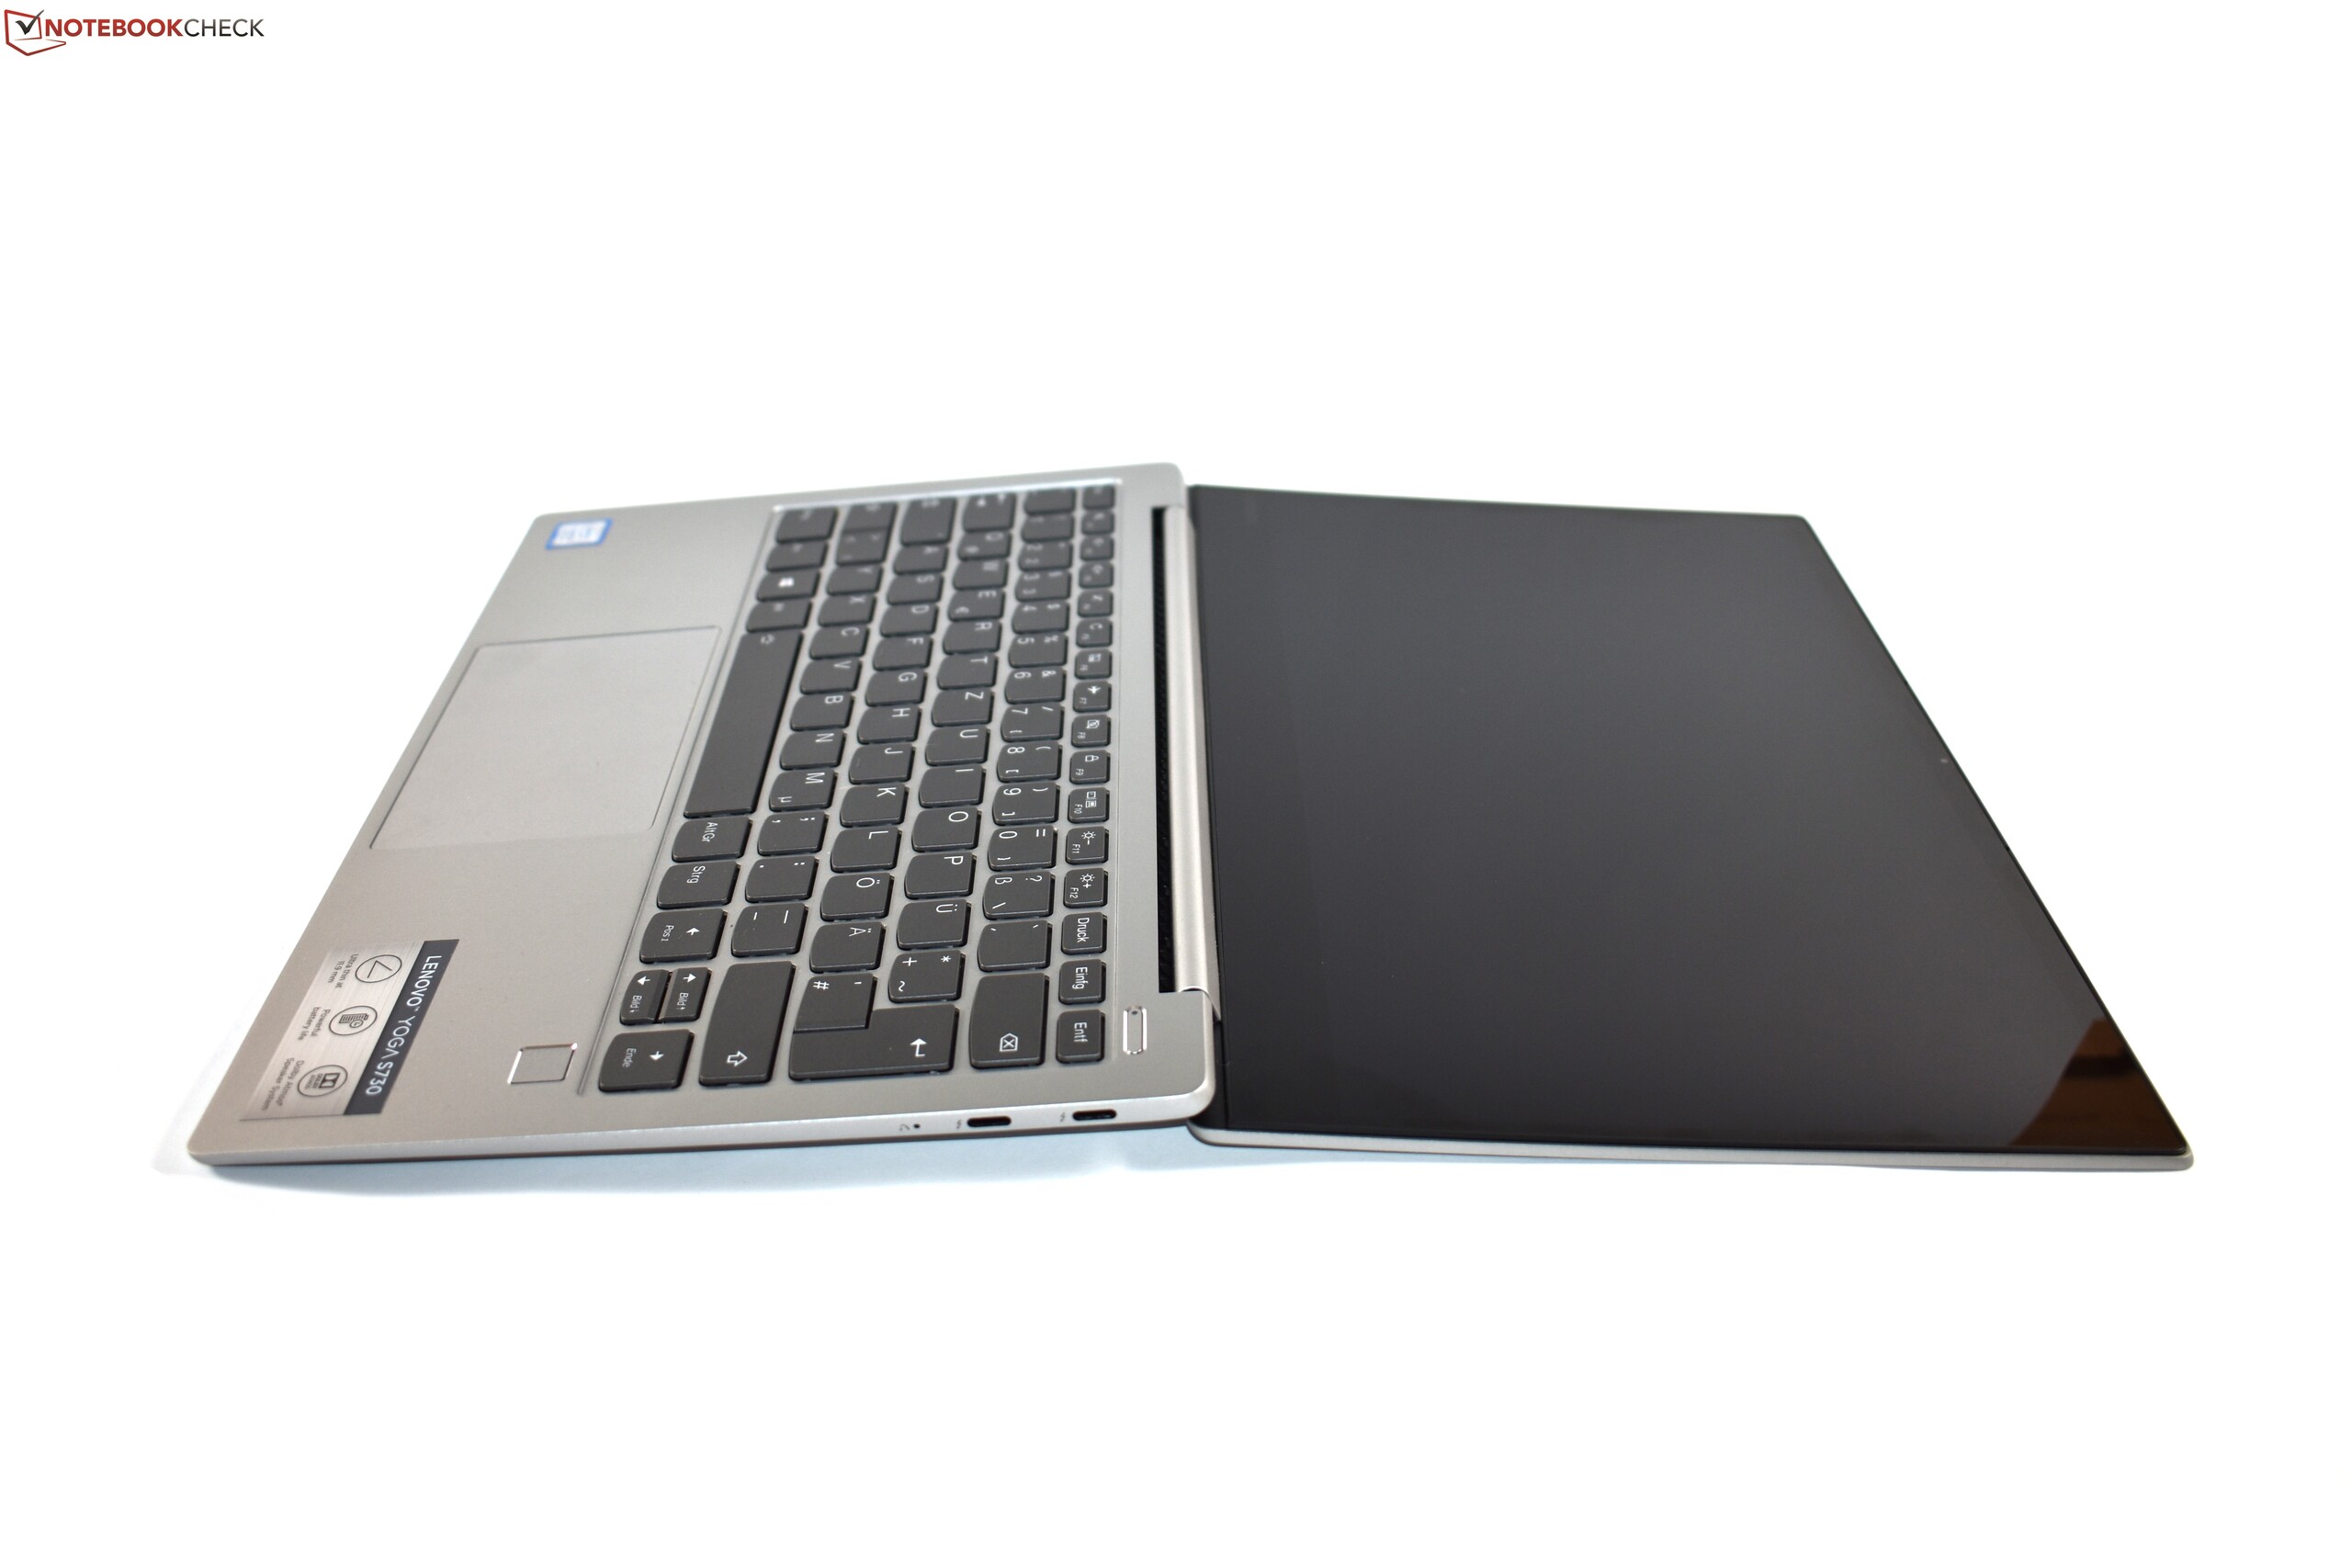
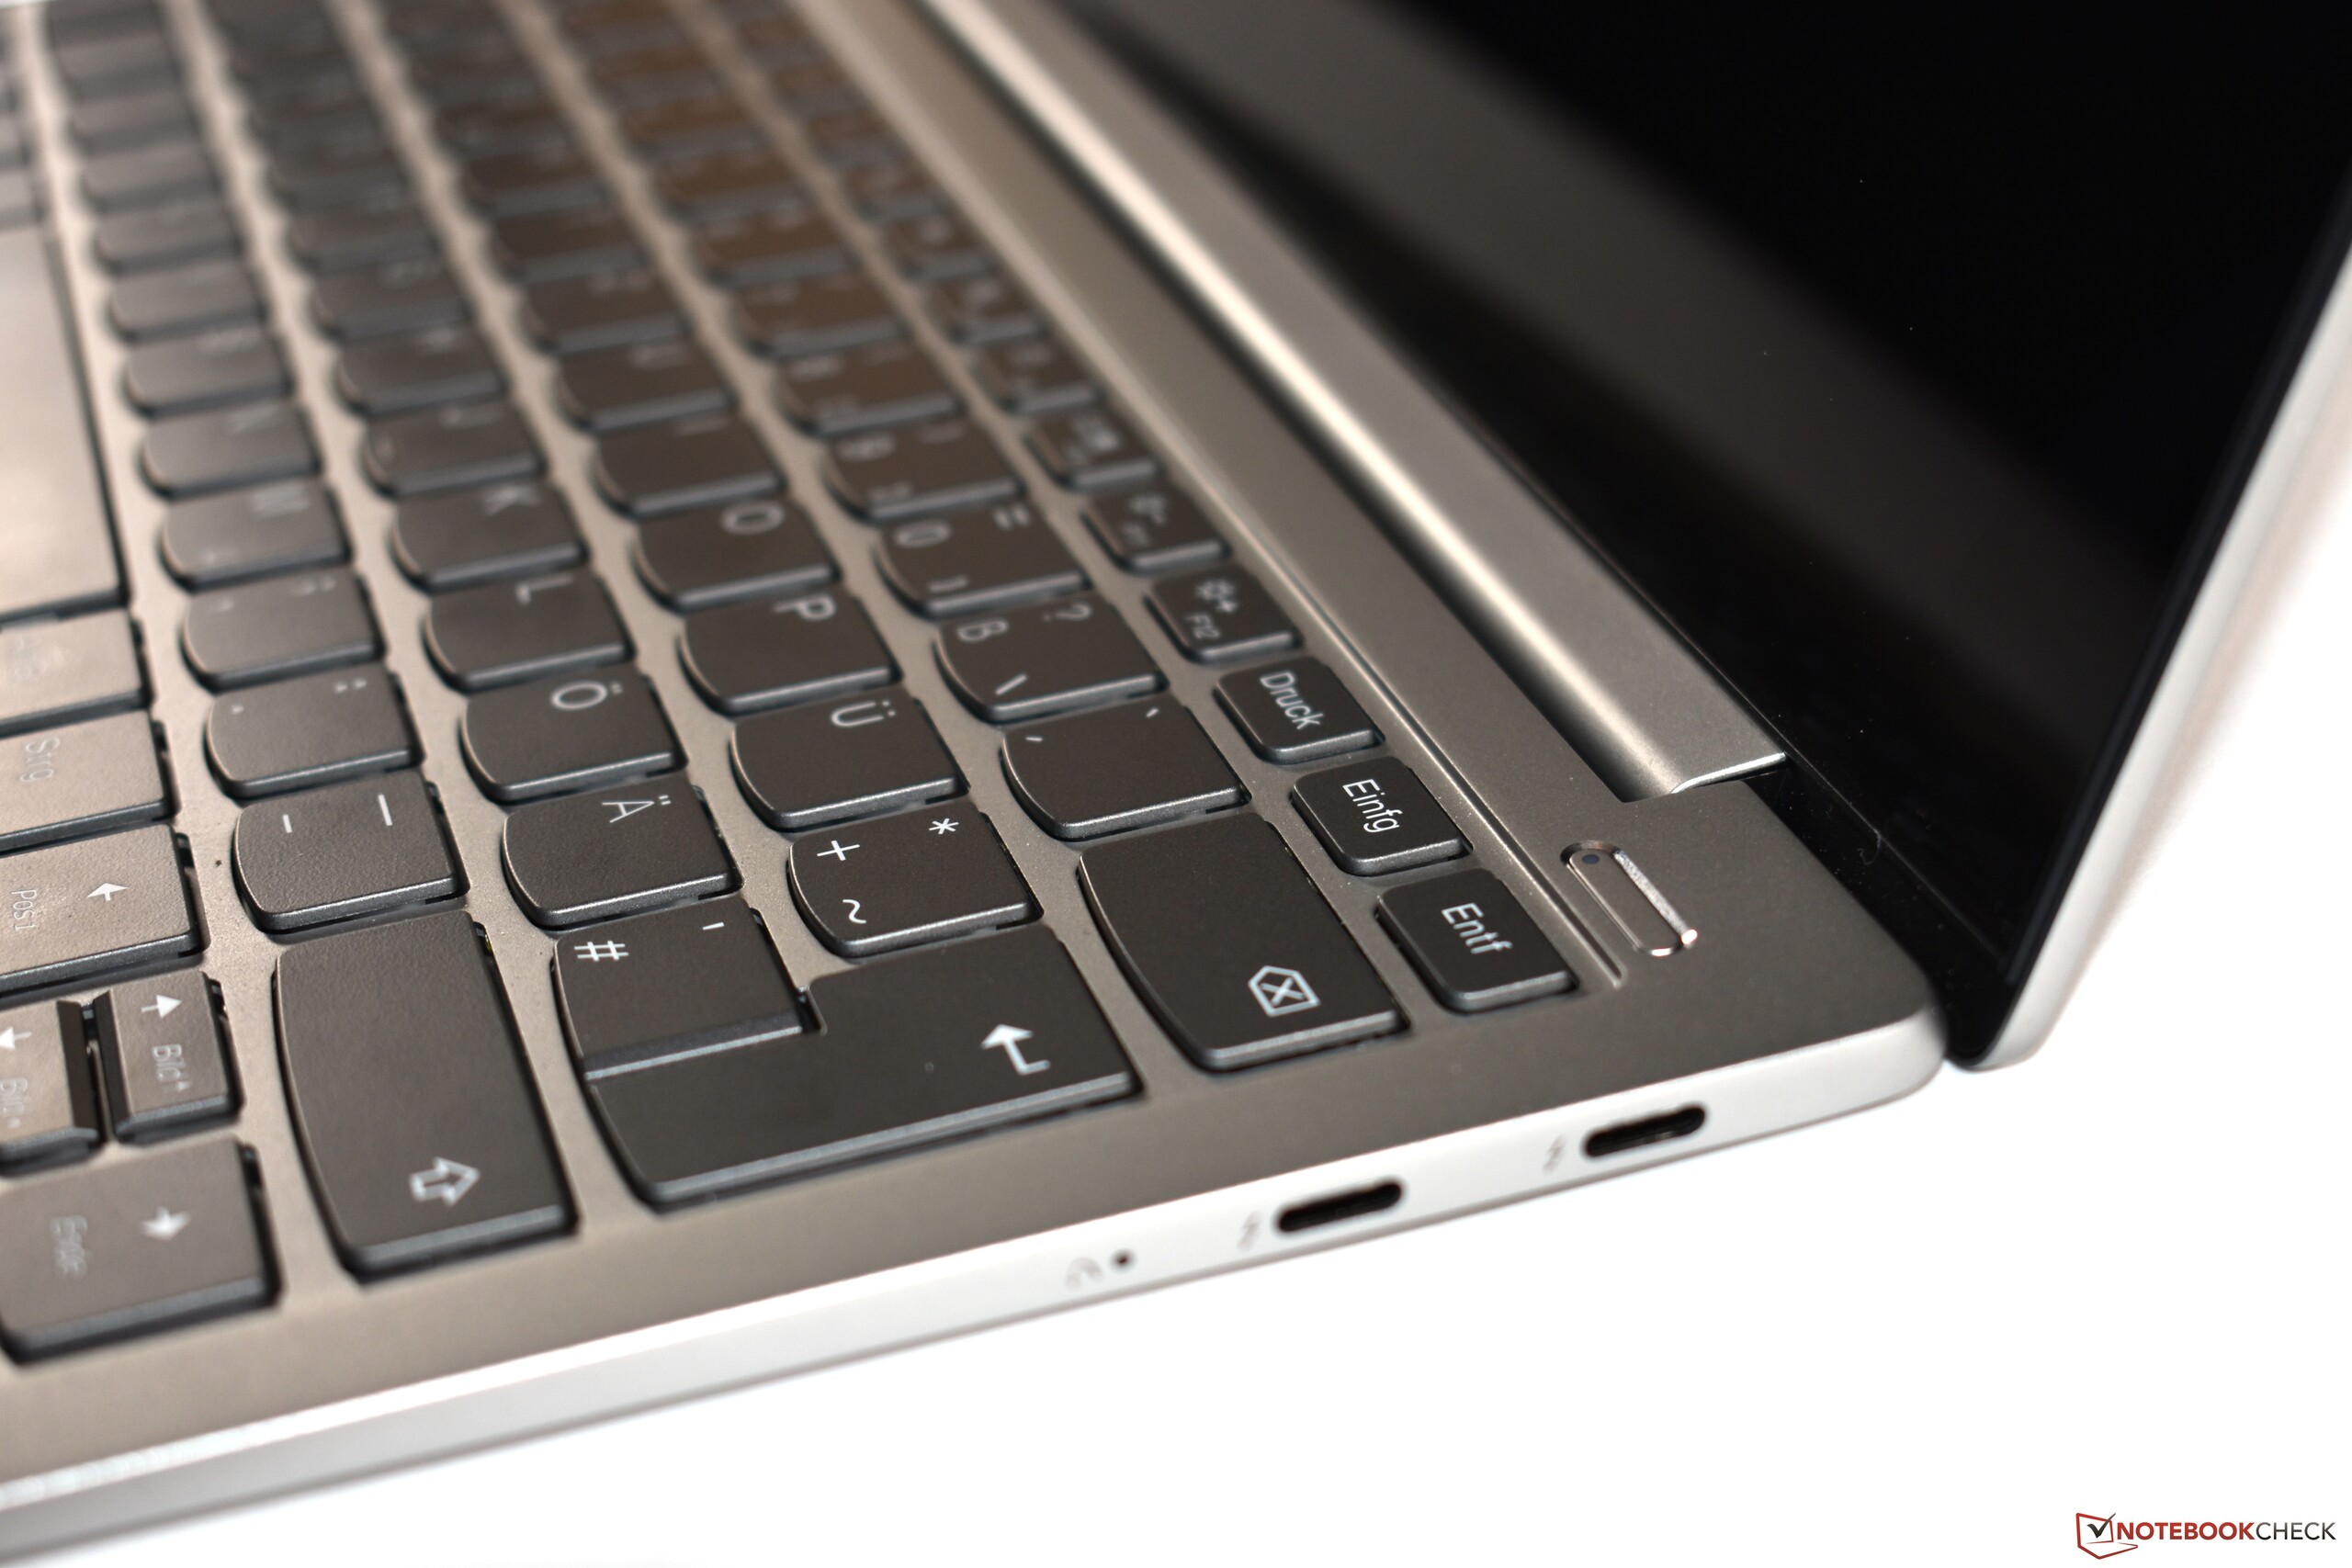
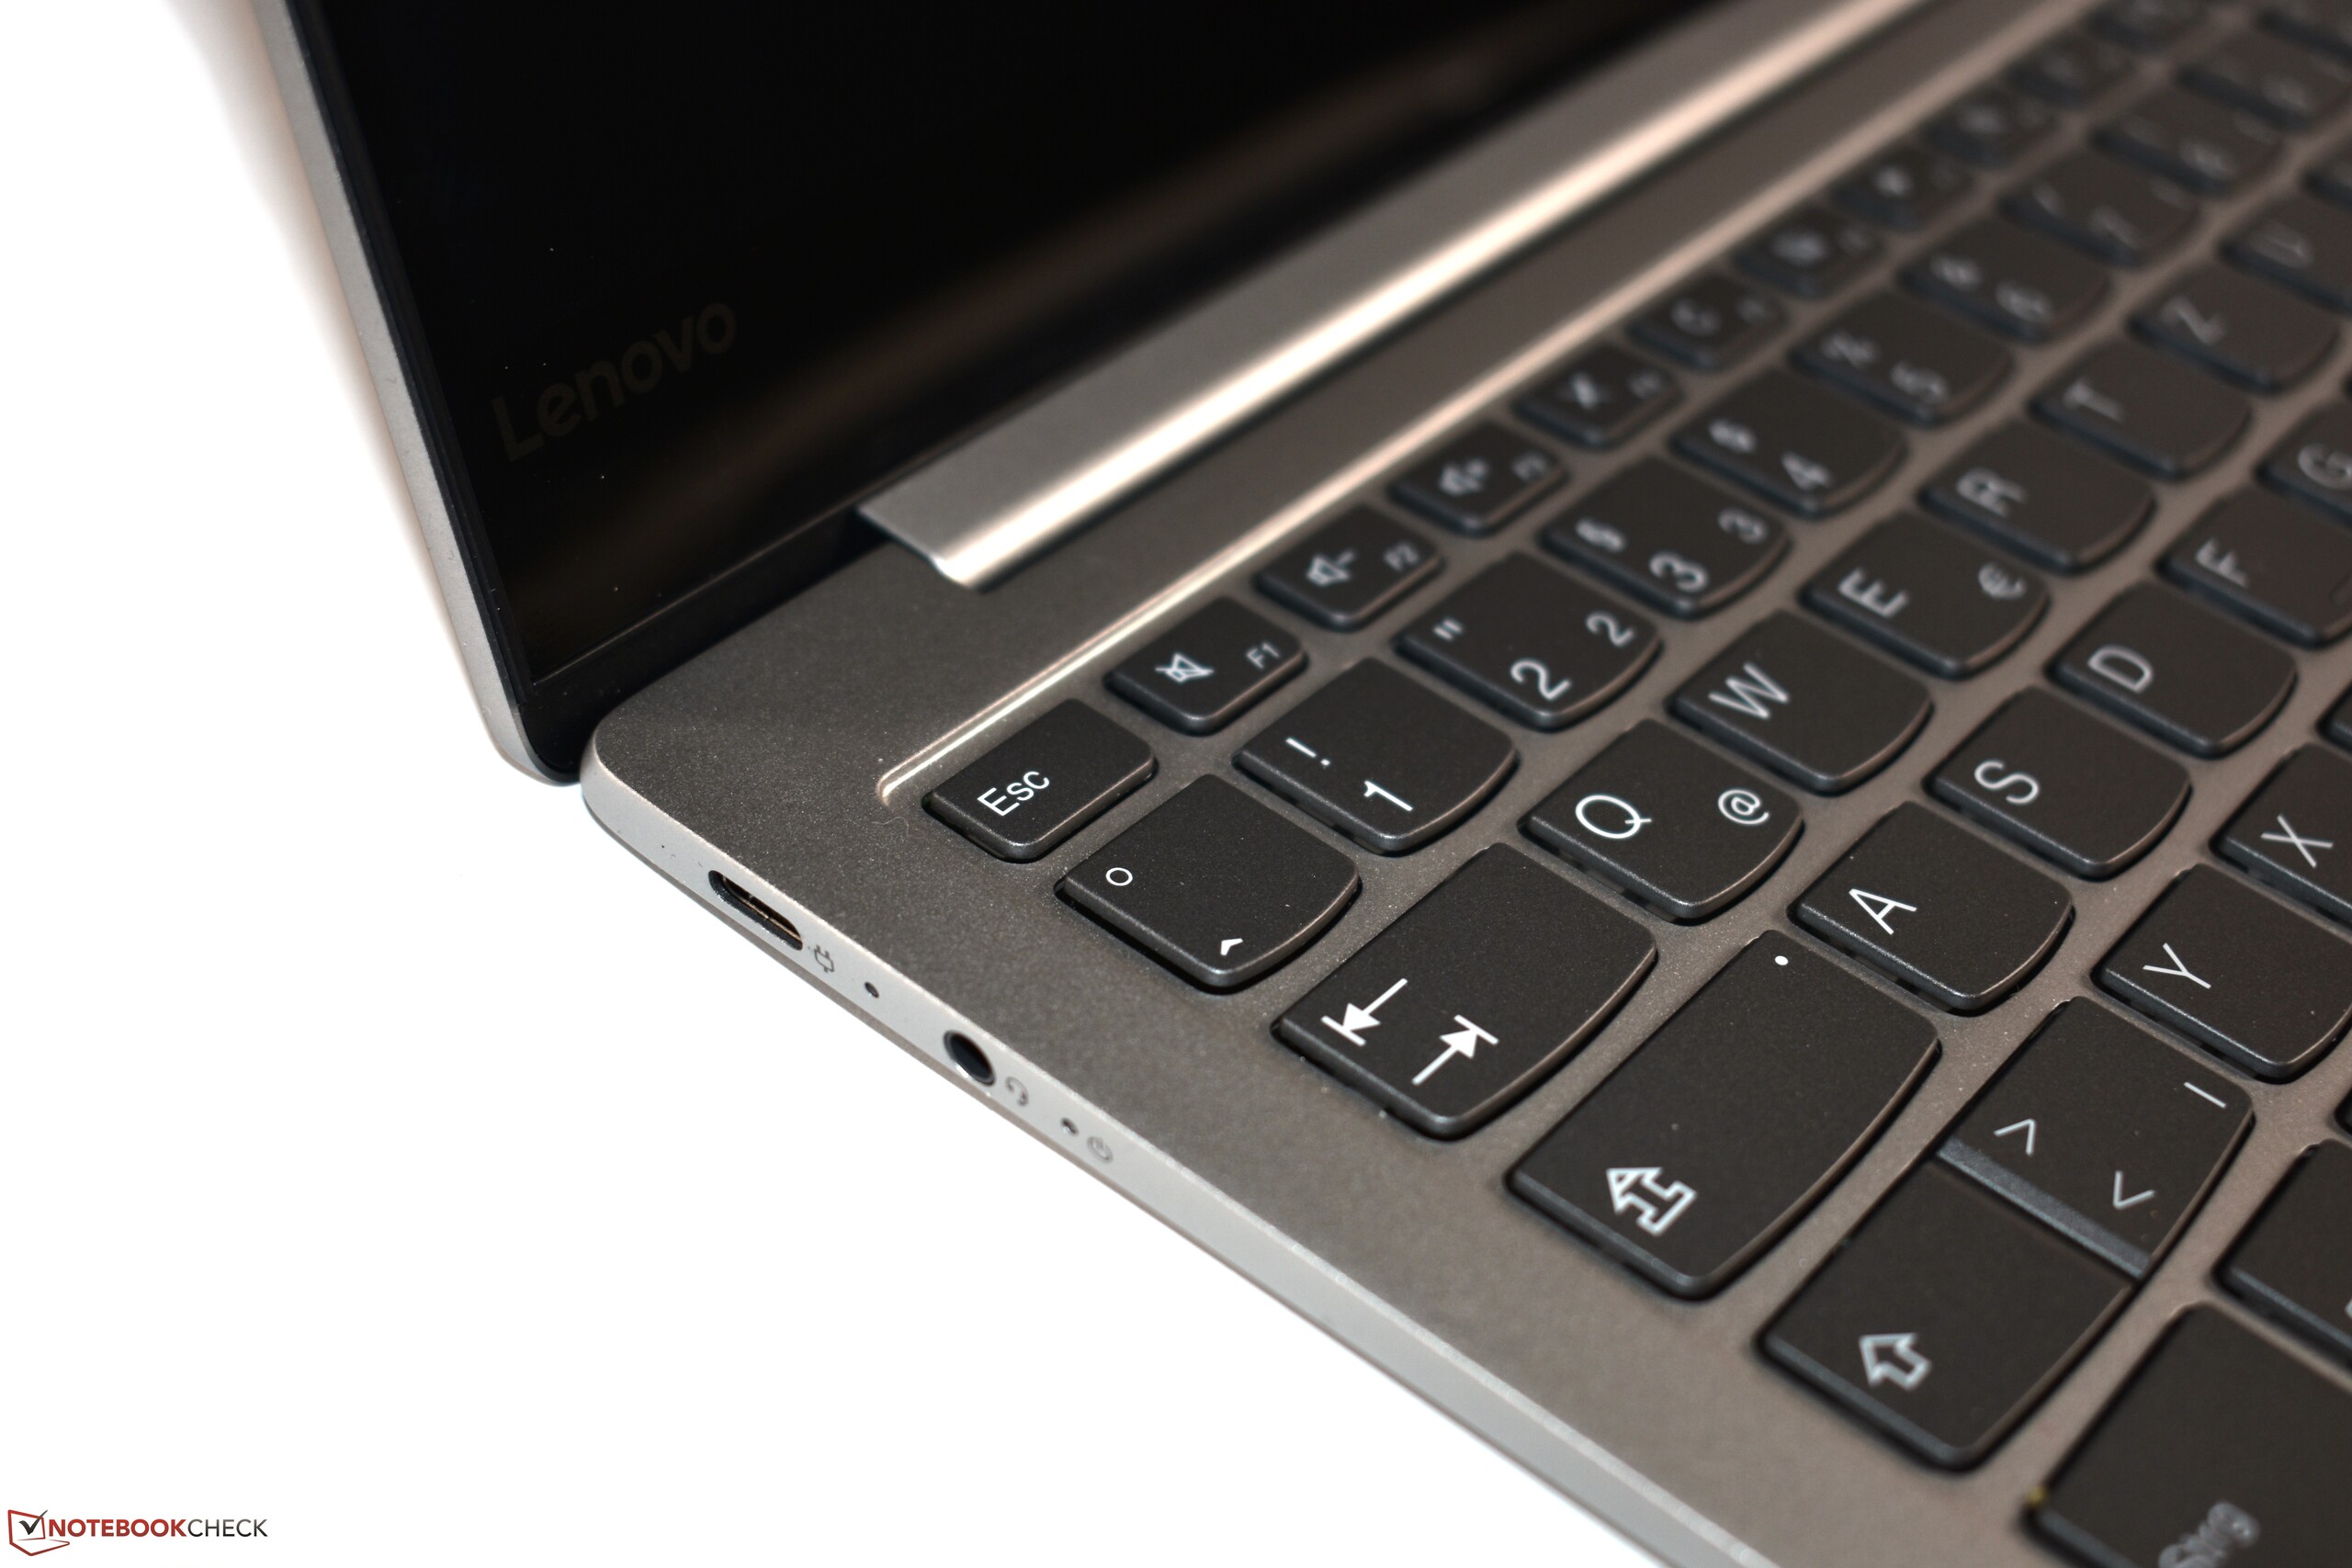
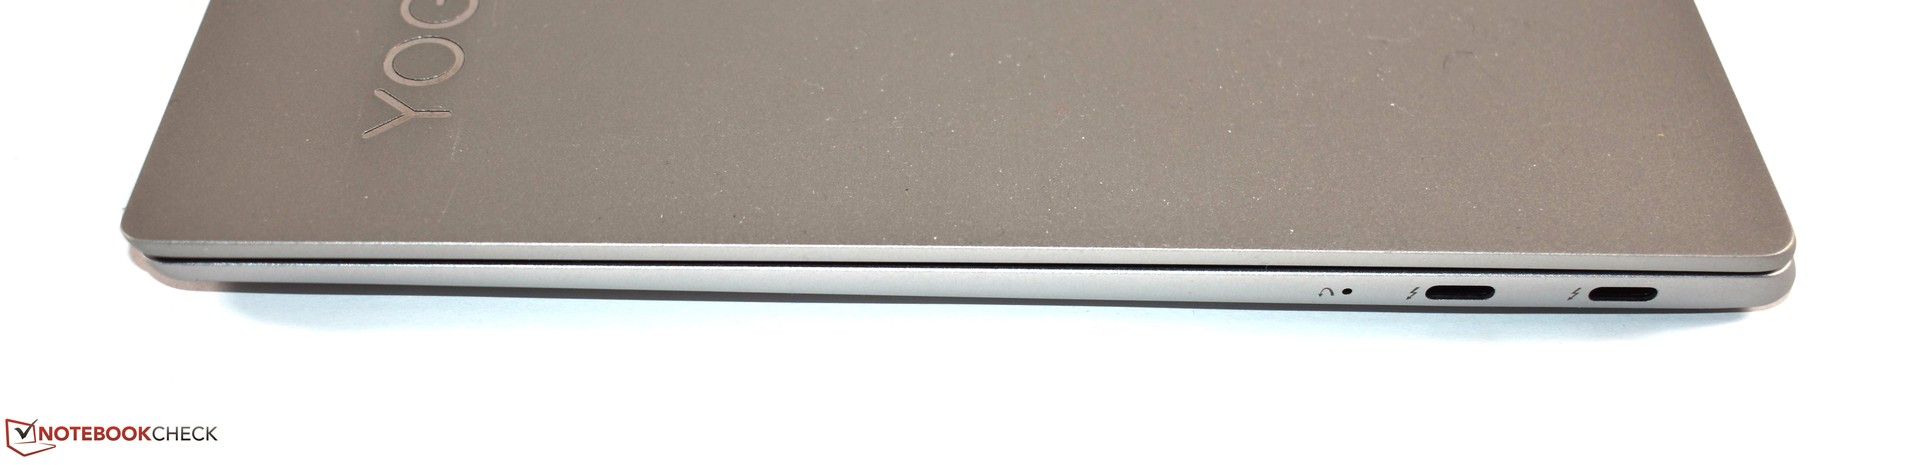
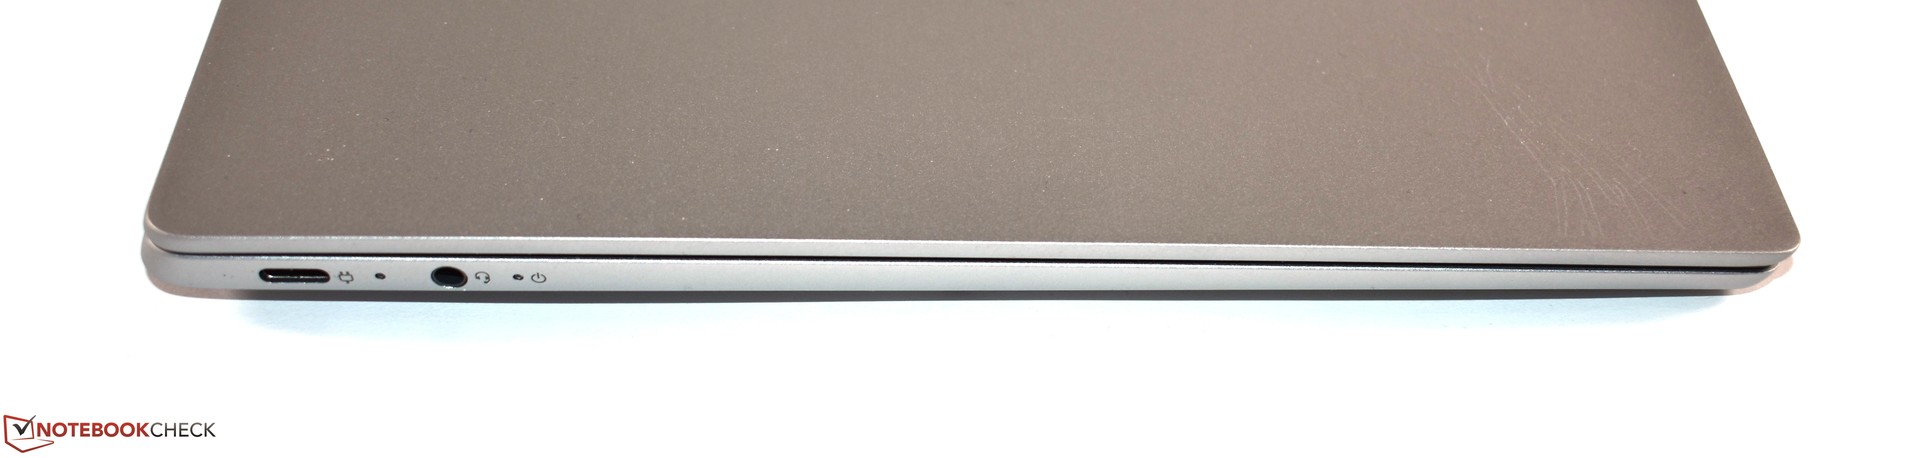
Lenovo has taken a step in the right direction with ports. The Yoga S730-13IWL only has USB Type-C ports but for the headphone jack. The frame is too slim for USB Type-A or HDMI ports, although that was a Lenovo design decision. The S730-13IWL has lost the two USB Type-A ports that the IdeaPad 720s-13IKB has, which have been replaced with three USB Type-C ports. Two are on the right-hand side of the device with the third flanked by the headphone jack on the opposite side. The two right-hand USB Type-C ports support DisplayPort, Thunderbolt 3 and USB-PD, while the third only supports charging.
Only the Envy 13 has USB Type-A ports of our comparison devices with the others having USB Type-C ports exclusively. The Envy 13 and XPS 13 9370 have microSD card readers too, but the IdeaPad 720s-13IKB did not have this either, so at least Lenovo is being consistent in this regard.
Communication
Lenovo's datasheet states that it equips the S730-13IWL with either a 1x1 or 2x2 Wi-Fi module. Unfortunately, our test device has the slower 1x1 module, which is an Intel Dual Band Wireless-AC 3165, as is the case for all models sold in Germany. The Wi-Fi performance is fine for daily use, but iperf3 Client benchmarks demonstrate the limitations that the 3165 module has compared to the more expensive Intel Dual Band Wireless-AC 8265 with its 2x2 antenna.
The webcam and microphones are typical for current laptops, and are good enough for video conferencing. In short, the microphones are better than the webcam, the latter of which takes pictures that are dominated by image noise.
Accessories
Lenovo typically equips its Yoga devices with an active pen, but the Yoga S730-13IWL comes with only a 65 W-USB Type-C charger. Lenovo does not currently sell any S730-13IWL specific accessories either.
Maintenance
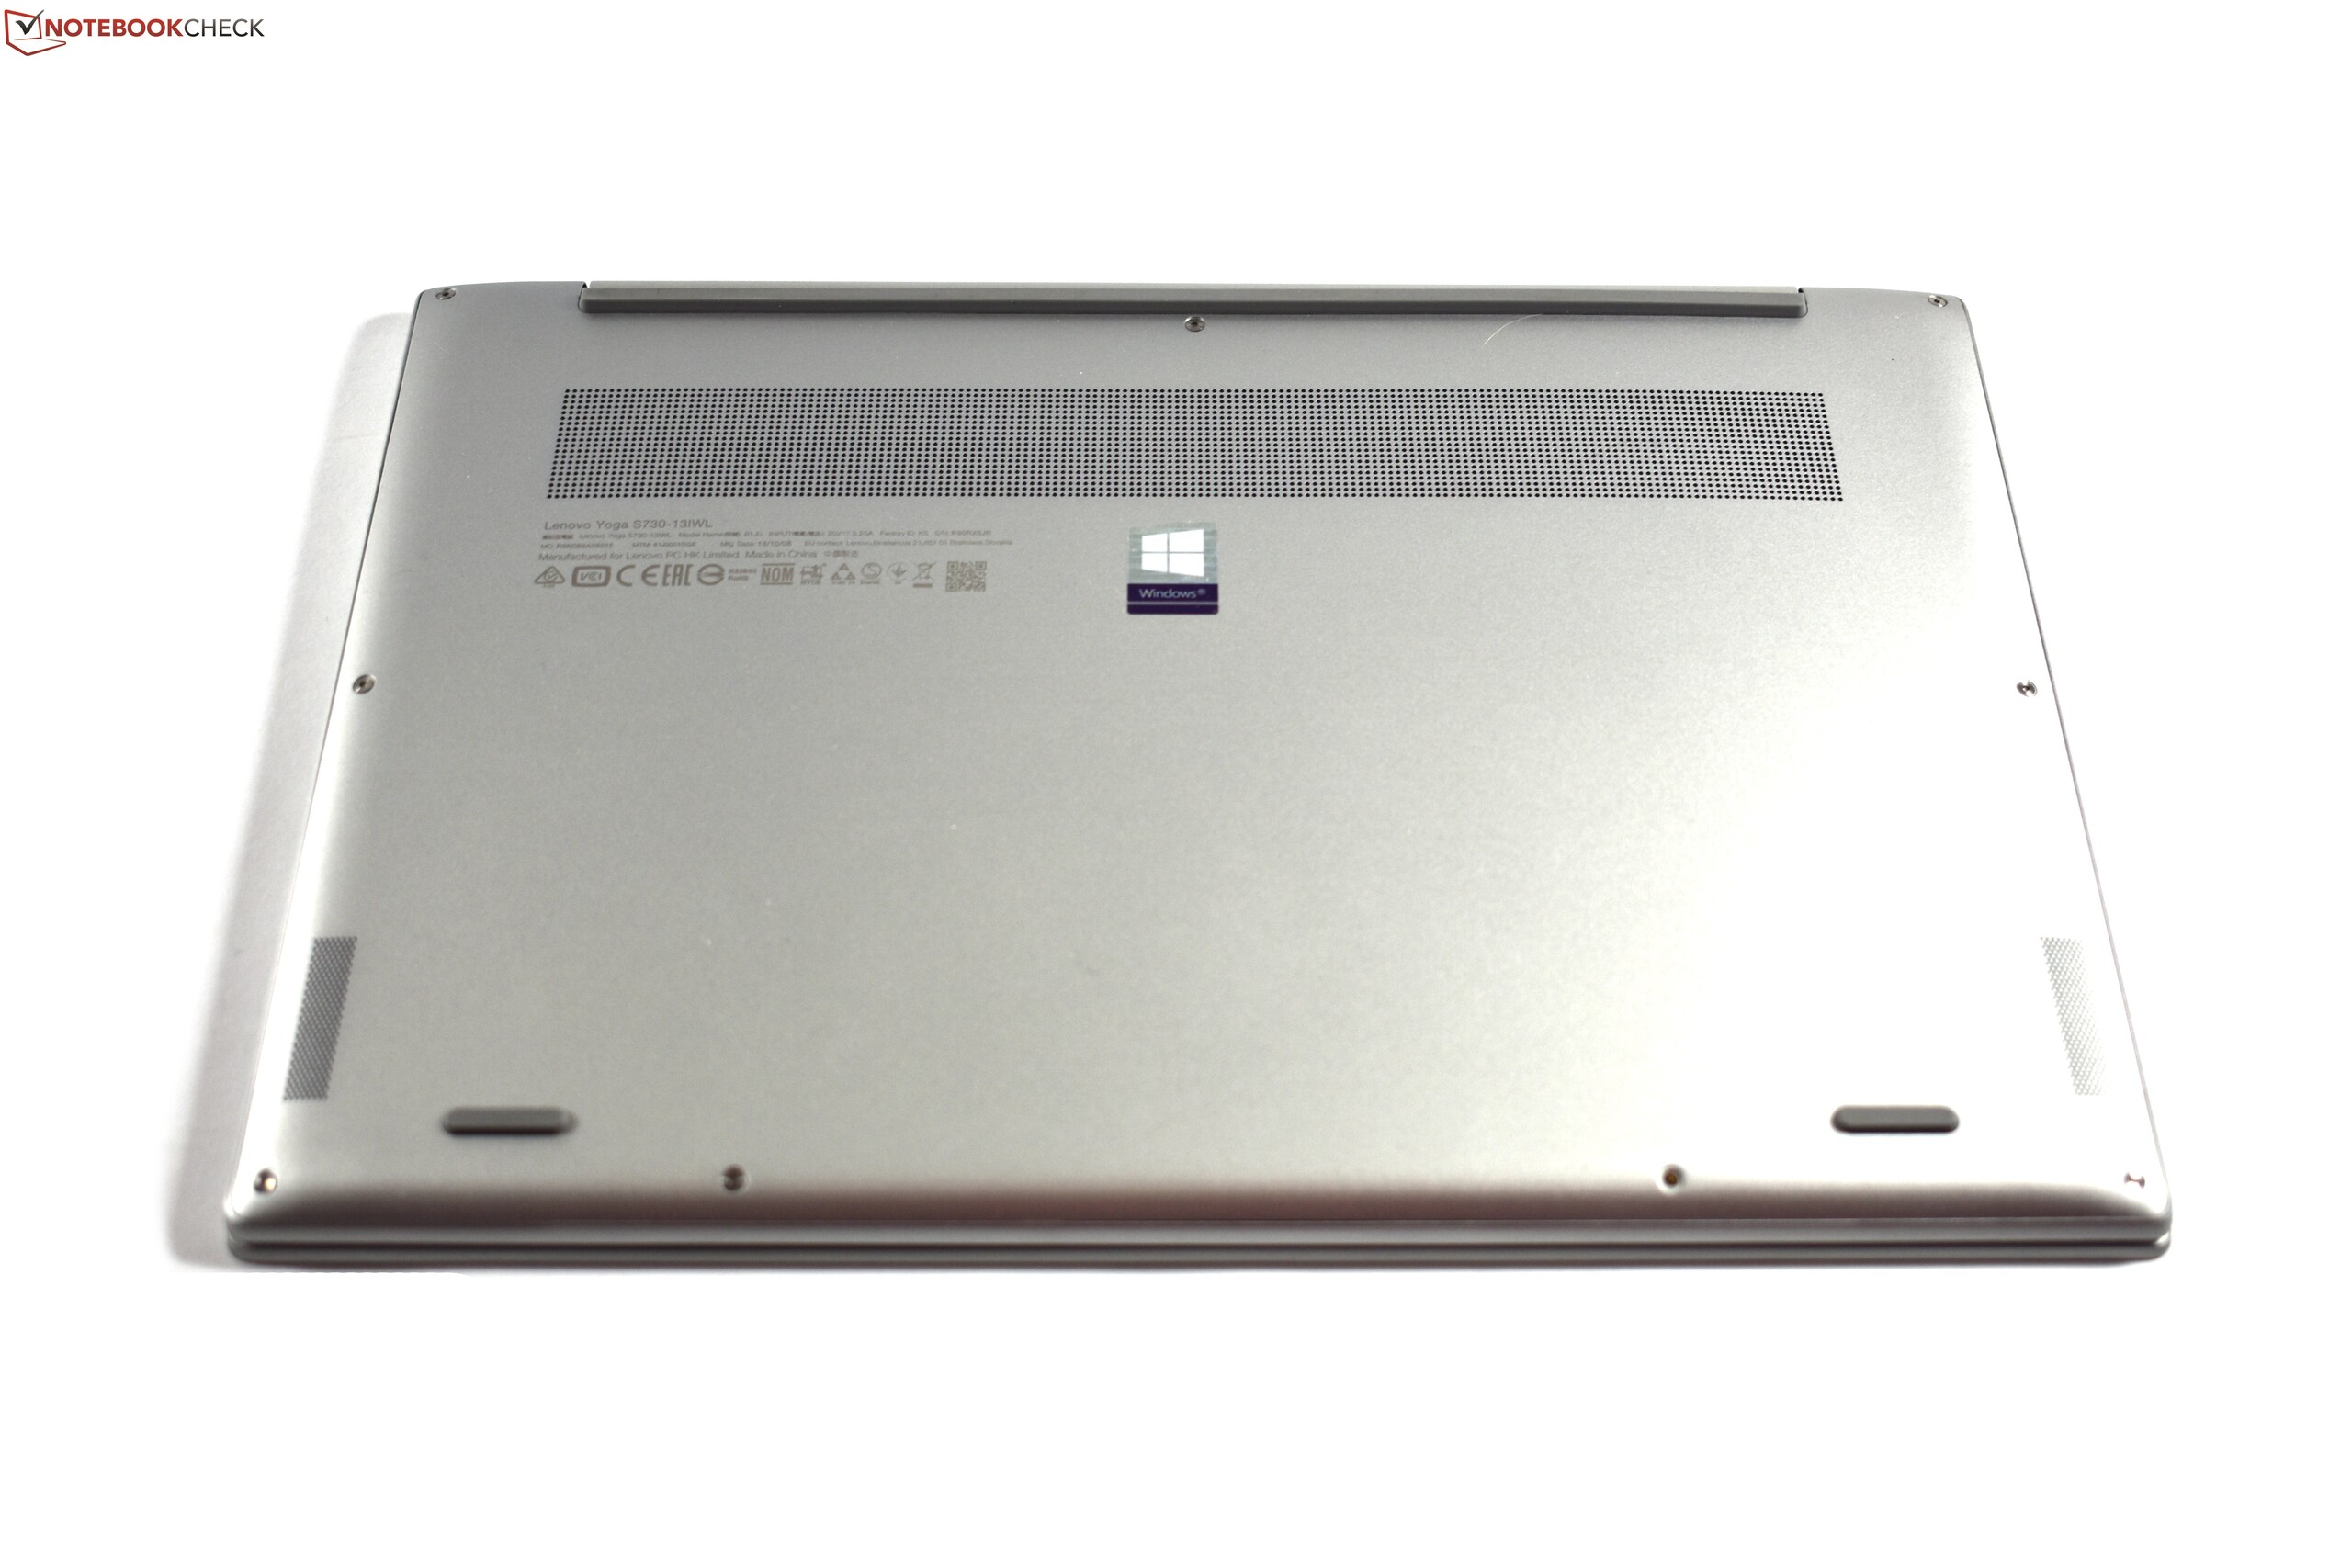
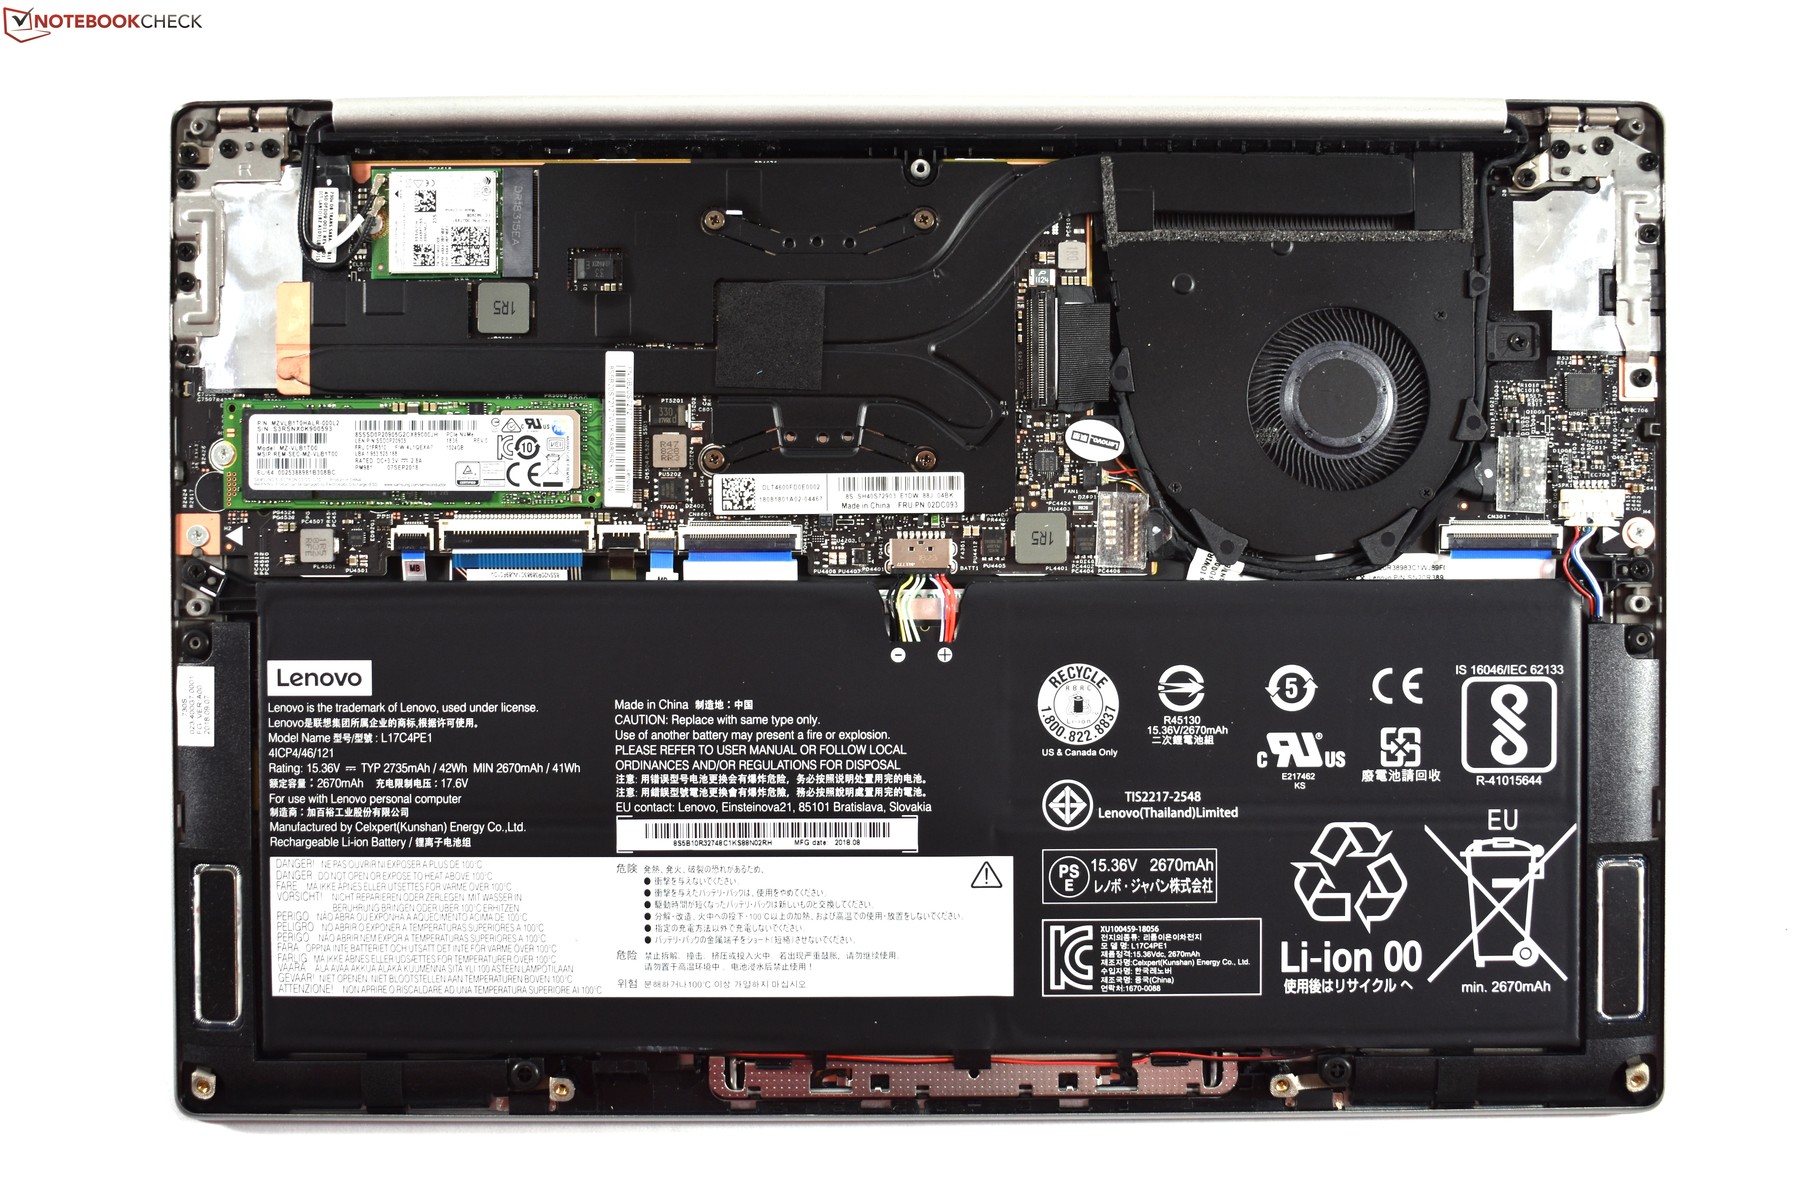
Unlike many other ultra-slimlaptops, the Yoga S730-13IWL can be maintained and repaired to a limited extent. Accessing the internal components requires unscrewing nine Torx T5 screws and carefully prying the bottom case free from several small plastic hooks. Removing the bottom case reveals the battery, the Wi-Fi module, the M.2-2280 SSD, the fan and the heatpipes. The RAM is not upgradable though, as it is soldered to the motherboard.
Warranty
The Yoga S730-13IWL comes with a two-year manufacturer’s warranty, which requires that you return the laptop when it needs to be serviced. This level of warranty cover is standard for laptops at this price. Please see our Guarantees, Return policies and Warranties article for country-specific information.
Input Devices
Keyboard
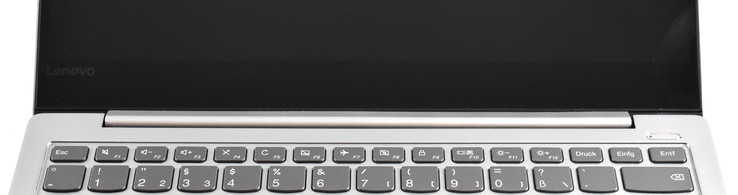
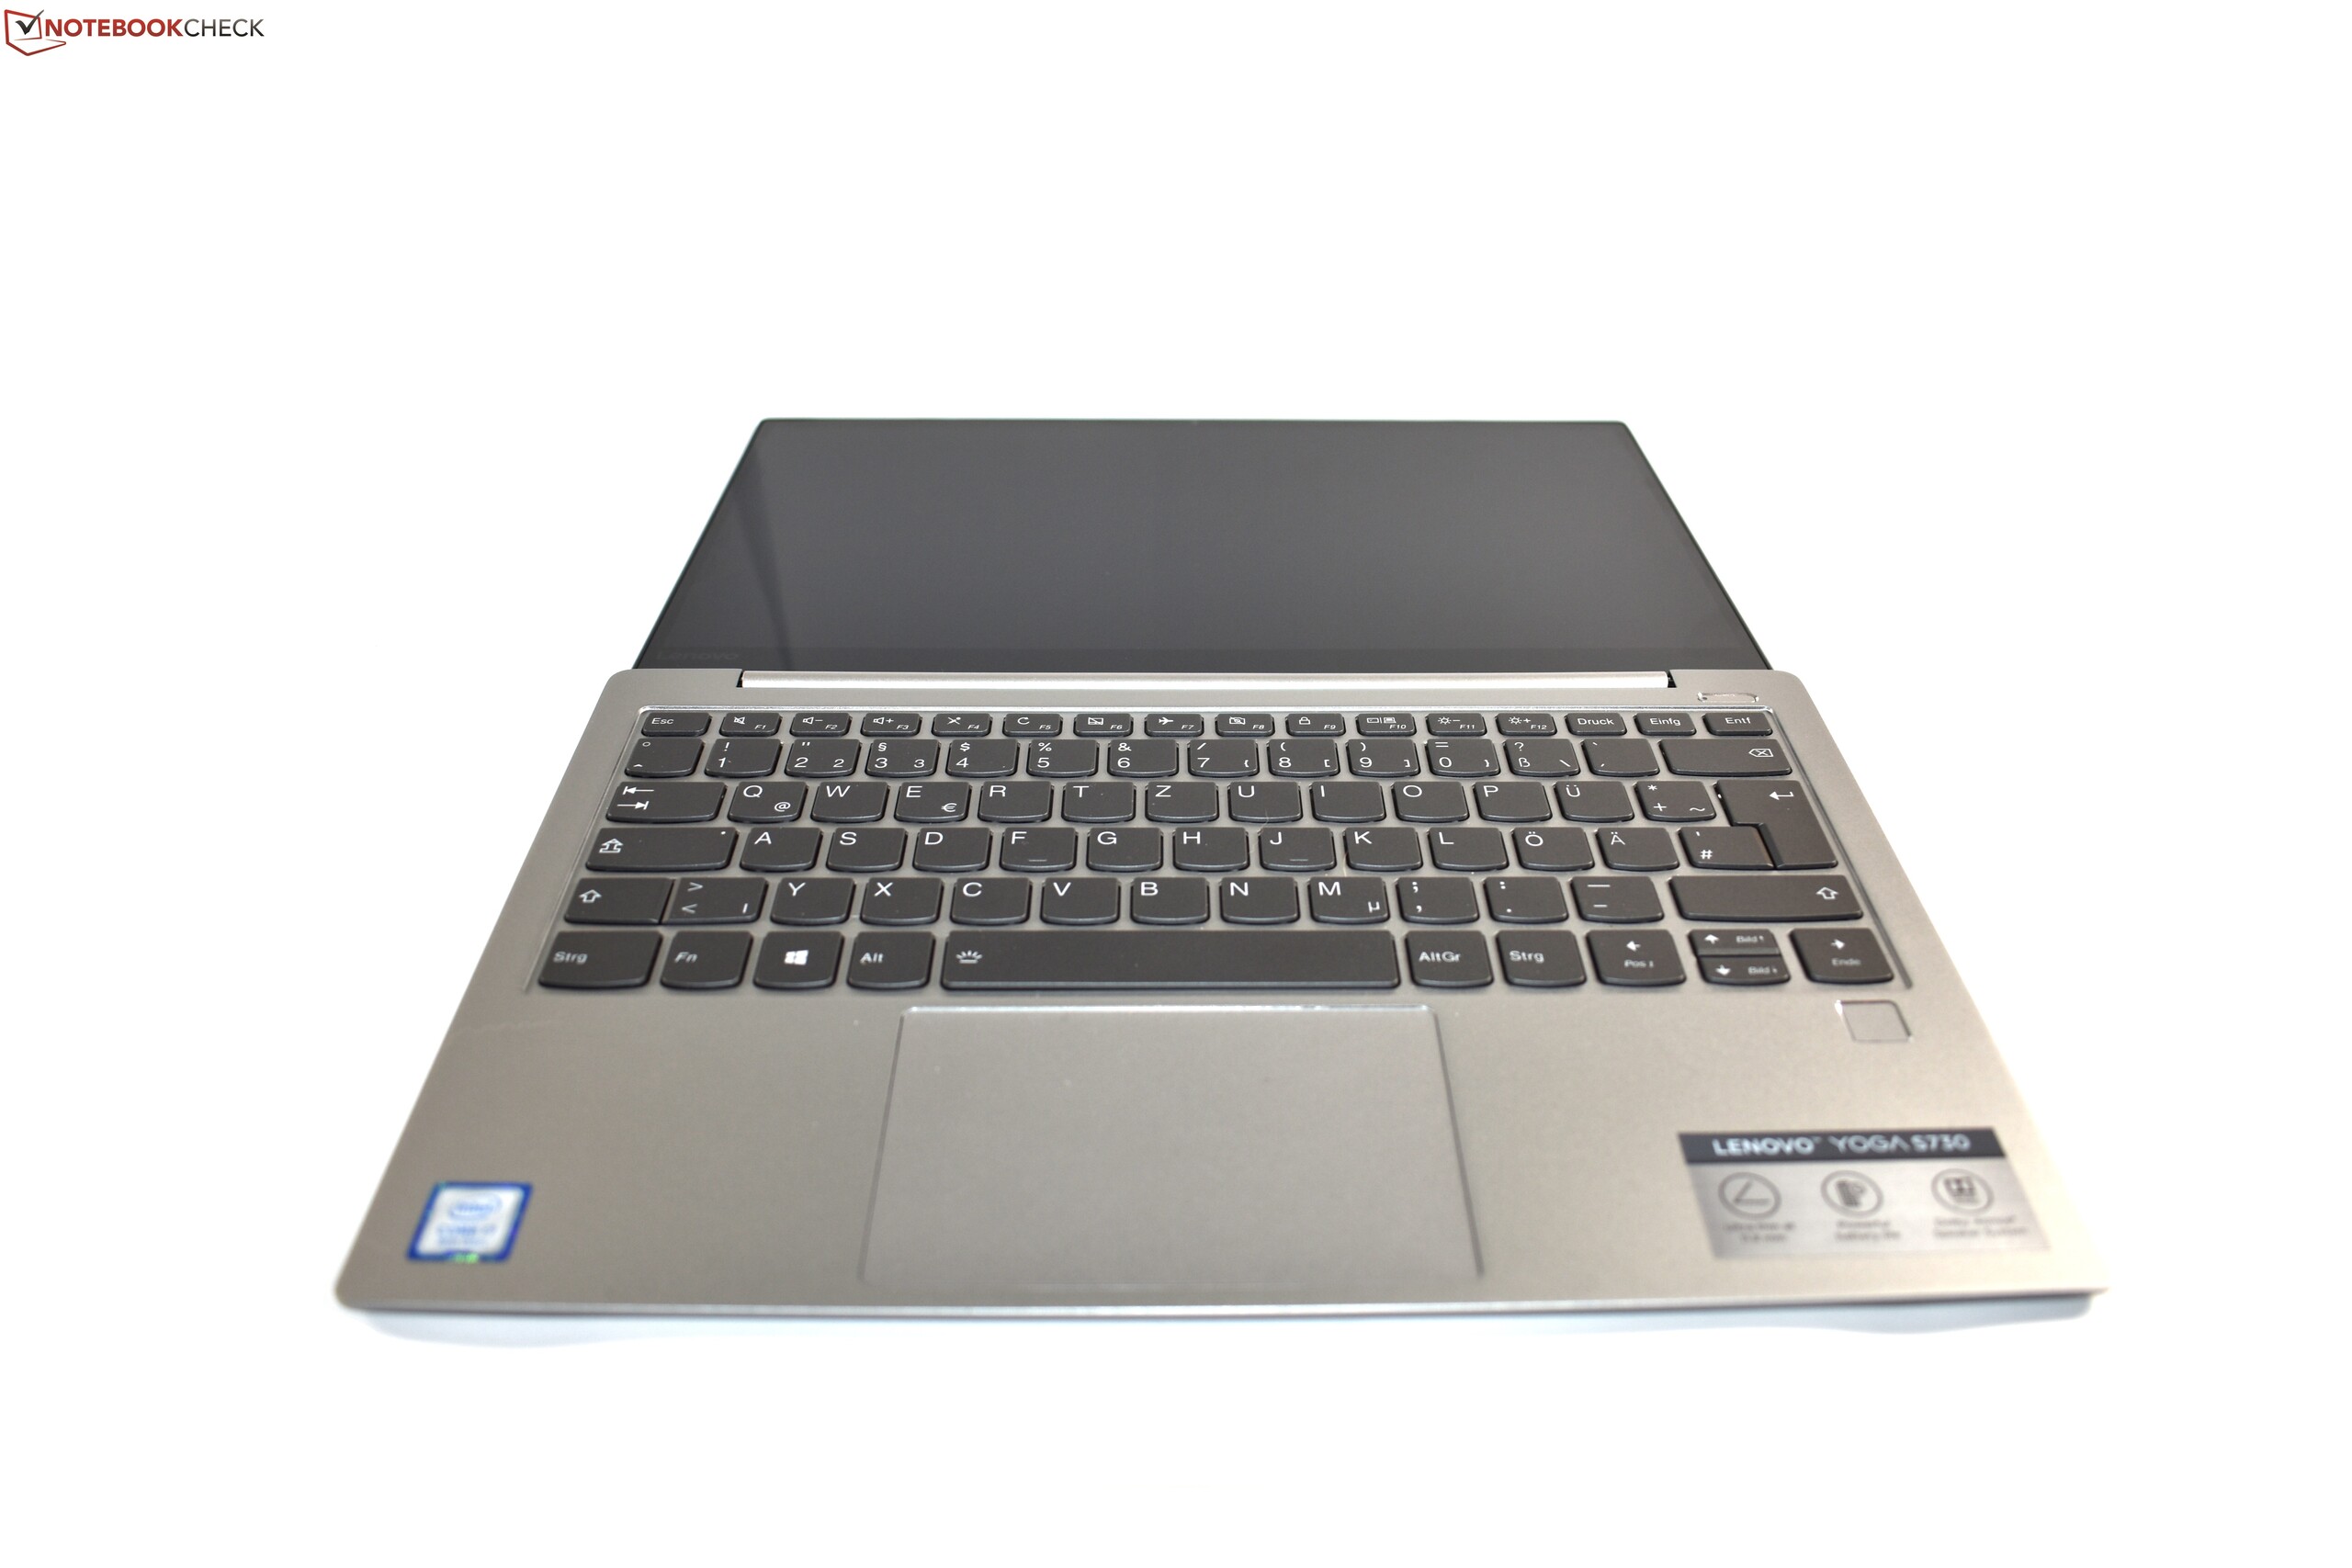
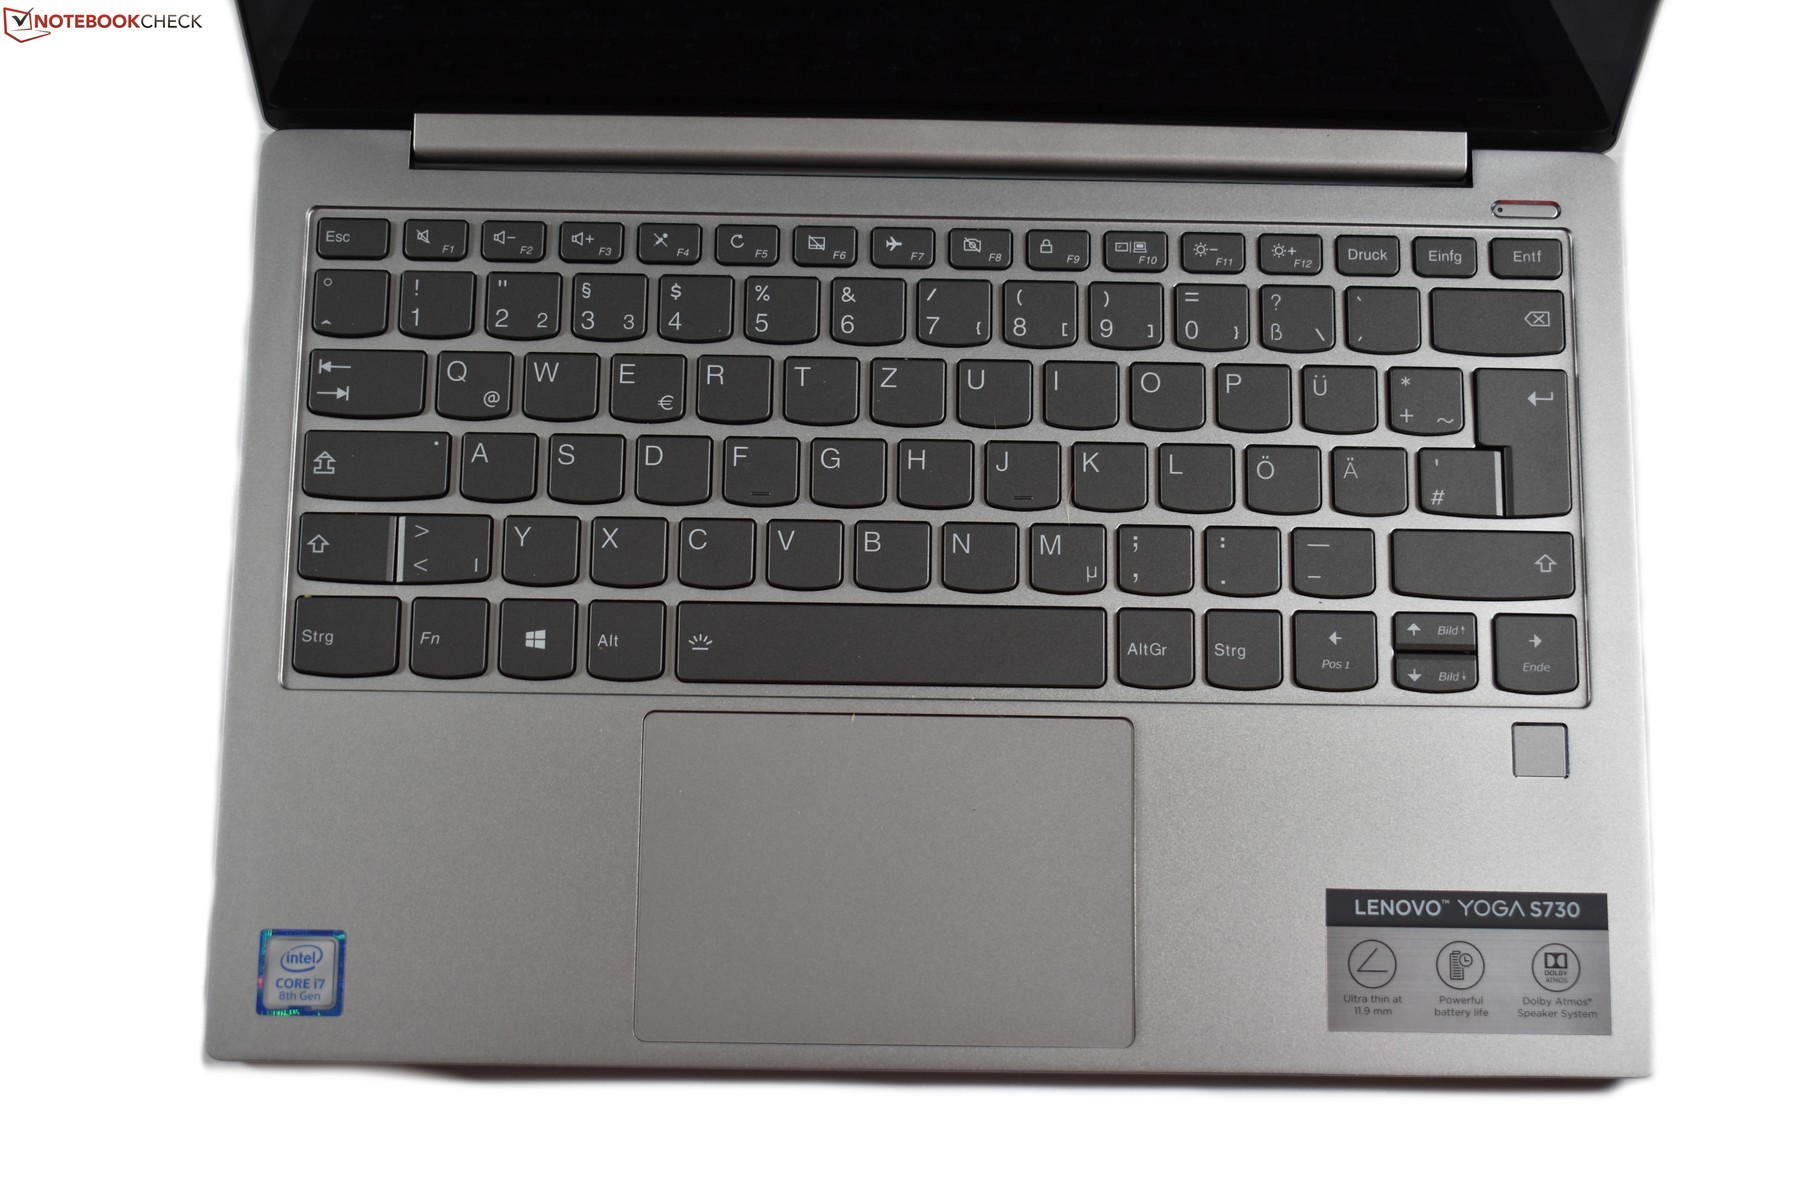
The Yoga S730-13IWL has a six-row chiclet keyboard with a white two-stage backlight. The chiclet keys are rounded and have a smooth finish, which are not as comfortable to type on as Lenovo’s ThinkPad keyboards primarily because of their shorter stroke. However, the keys have more travel than the ones in the MacBook Air 2018. Overall, there is little to complain about the keyboard, but the vertical arrow keys are too small for our liking.
Trackpad
The Yoga S730-13IWL is the first Yoga device to lack a touchscreen and active pen support. The trackpad is therefore the only mouse replacement, a job that it does with flying colours. The trackpad is made from glass and measures 10.5 x 7 cm (~4.1 x 2.7 in), which is a great size in our opinion for a 13.3-inch laptop. The trackpad supports Windows Precision drivers and is smooth to execute multi-finger gestures efficiently.
There are no dedicated mouse buttons either, with Lenovo integrating the ClickPad within the bottom third of the trackpad. The buttons worked well during testing, and the trackpad did not wobble either, which can sometimes prove an issue with cheaper laptops.
Display
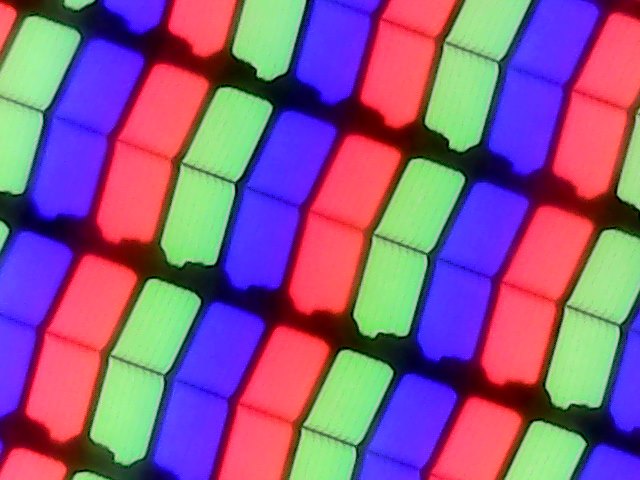
Lenovo sells the Yoga S730-13IWL with just one display option. The device has a 13.3-inch Full HD IPS screen with a glossy finish, with the lack of a 4K option making the S730-13IWL more of a mid-range laptop than something that could challenge the more premium variants of some of our comparison devices.
Lenovo’s datasheet claims that the display should reach a maximum of 300 cd/m². However, X-Rite i1Pro 2 recorded our test device as reaching an average maximum brightness of 323 cd/m². Lenovo has equipped the device with a display that gets just as bright as many of comparison devices, although the XPS 13 9370 gets around 25% brighter than the S730-13IWL.
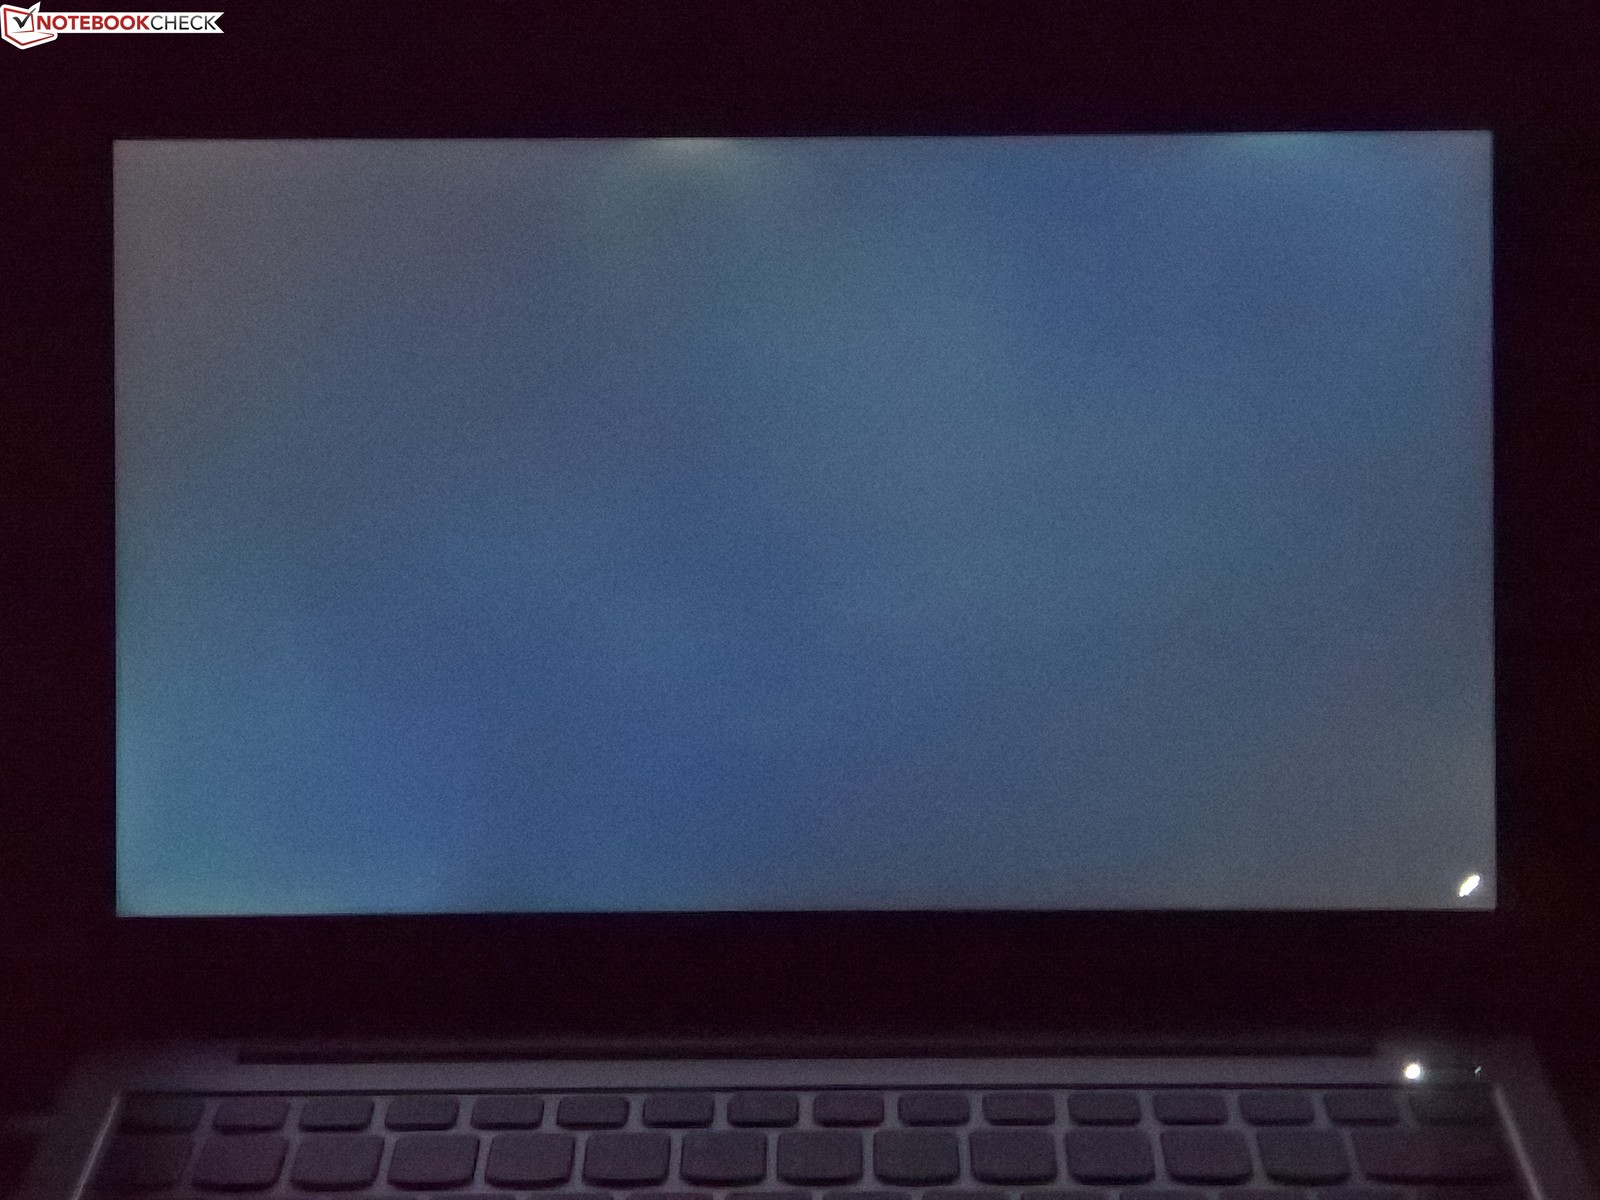
Our test device also hardly suffers from any backlight bleeding, and we could not measure any pulse-width modulation (PWM), which can cause eye strain and headaches for some people. Moreover, our test device has an 85% evenly lit display, which is on par with many of our comparison devices.
| |||||||||||||||||||||||||
Brightness Distribution: 85 %
Center on Battery: 343 cd/m²
Contrast: 1039:1 (Black: 0.33 cd/m²)
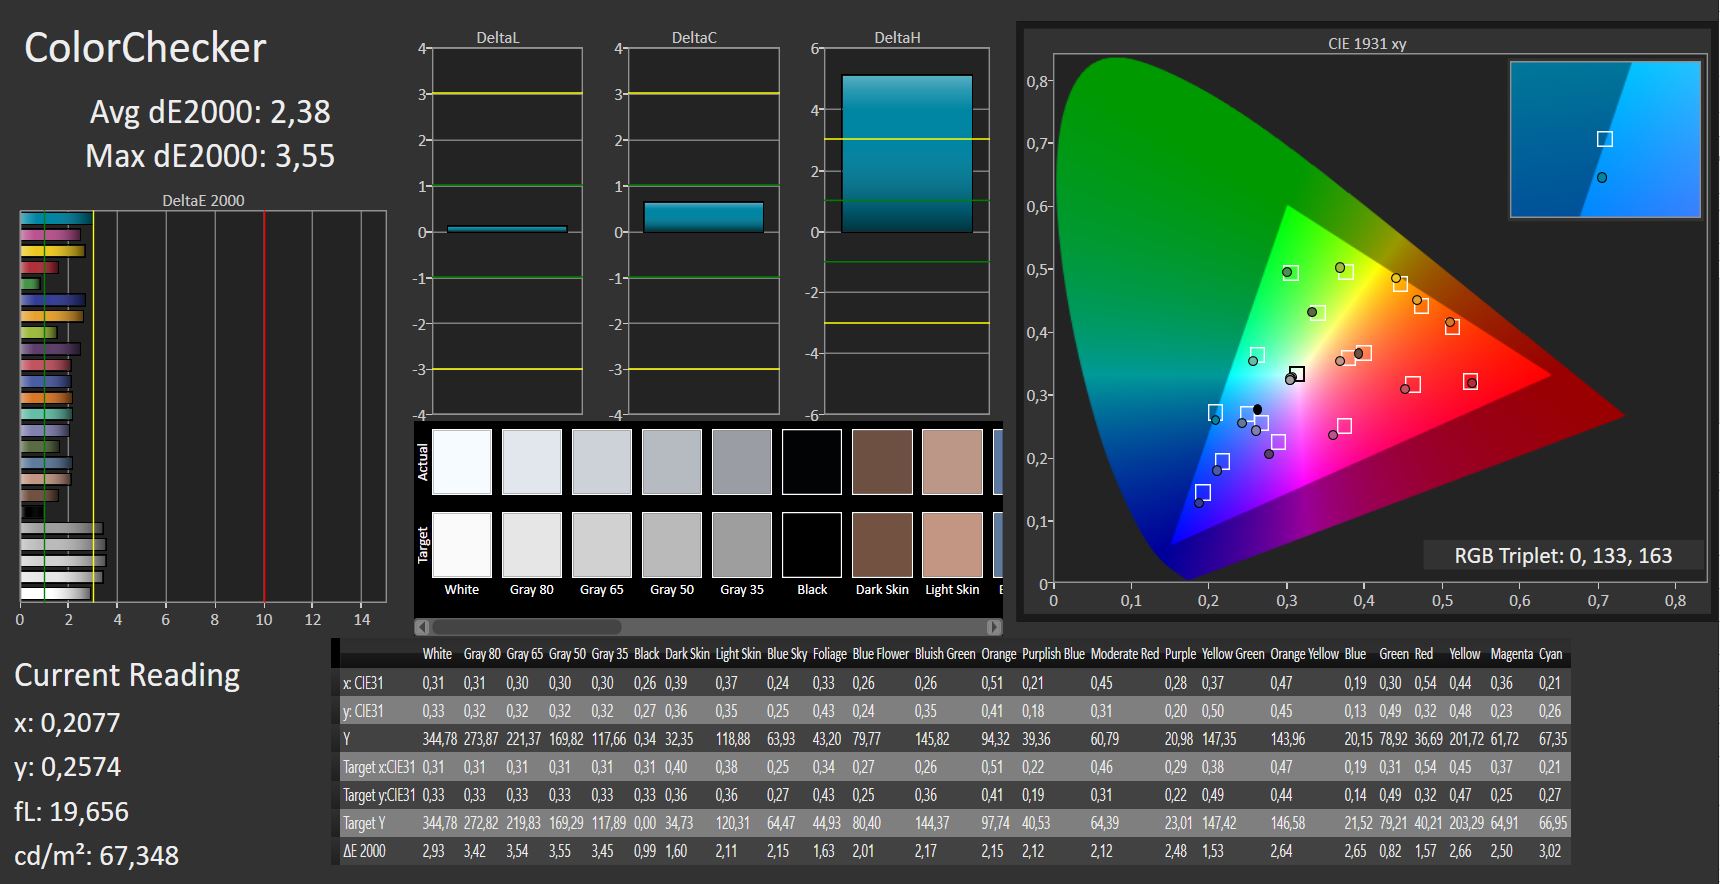
ΔE ColorChecker Calman: 2.38 | ∀{0.5-29.43 Ø4.73}
ΔE Greyscale Calman: 3.01 | ∀{0.09-98 Ø4.97}
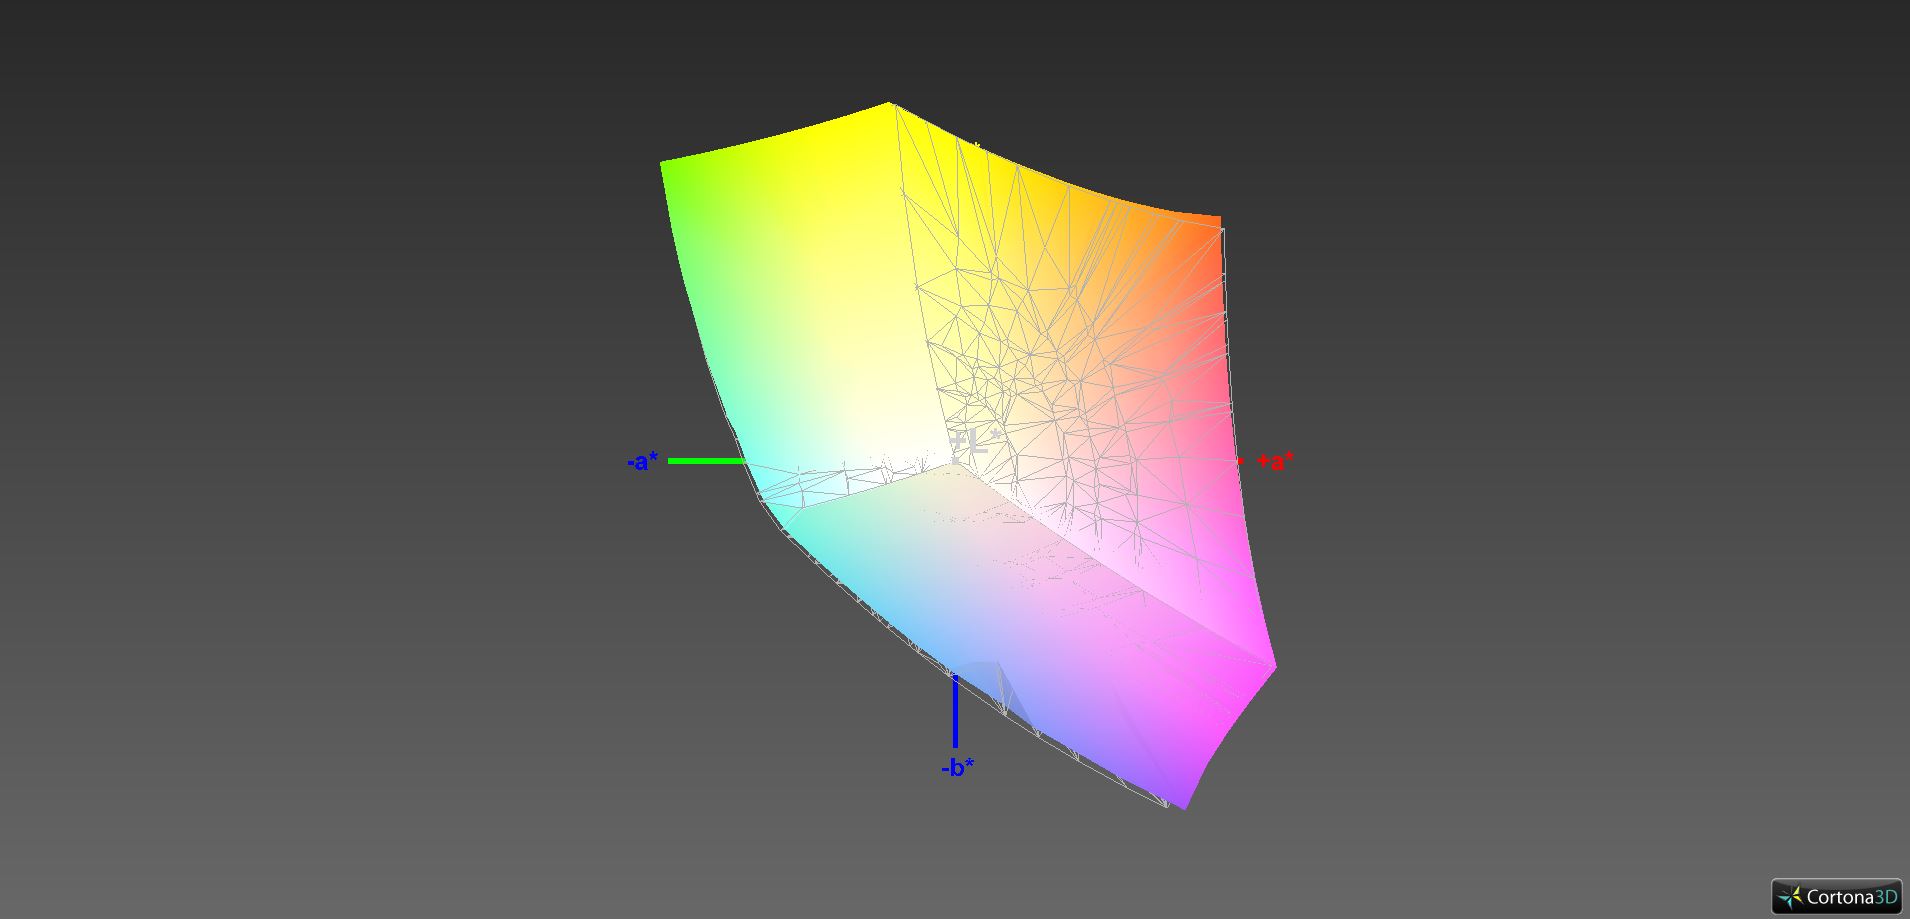
98% sRGB (Argyll 1.6.3 3D)
62% AdobeRGB 1998 (Argyll 1.6.3 3D)
67.8% AdobeRGB 1998 (Argyll 3D)
98.2% sRGB (Argyll 3D)
66.3% Display P3 (Argyll 3D)
Gamma: 2.44
CCT: 7198 K
| Lenovo Yoga S730-13IWL B133HAN05.1, , 1920x1080, 13.3" | Lenovo Ideapad 720S-13IKB LG Philips LGD04EF, , 1920x1080, 13.3" | Dell XPS 13 9370 FHD i5 SHP1484, , 1920x1080, 13.3" | HP Envy 13-ah0003ng M133NVF3 R0, , 1920x1080, 13.3" | Asus ZenBook S UX391U AUO B133HAN04.9, , 1920x1080, 13.3" | Apple MacBook Air 2018 APPA039, , 2560x1600, 13.3" | |
|---|---|---|---|---|---|---|
| Display | -10% | 2% | -17% | -5% | 1% | |
| Display P3 Coverage (%) | 66.3 | 64.3 -3% | 68.9 4% | 54.8 -17% | 64.4 -3% | 67.8 2% |
| sRGB Coverage (%) | 98.2 | 82.3 -16% | 96.6 -2% | 82.5 -16% | 90.5 -8% | 96.1 -2% |
| AdobeRGB 1998 Coverage (%) | 67.8 | 60.2 -11% | 69.6 3% | 56.6 -17% | 65.2 -4% | 69.8 3% |
| Response Times | 27% | -33% | 33% | 11% | 18% | |
| Response Time Grey 50% / Grey 80% * (ms) | 53 ? | 35 ? 34% | 62.4 ? -18% | 31 ? 42% | 44.8 ? 15% | 39.6 ? 25% |
| Response Time Black / White * (ms) | 31 ? | 25 ? 19% | 45.6 ? -47% | 24 ? 23% | 29.2 ? 6% | 28 ? 10% |
| PWM Frequency (Hz) | 131000 ? | 1008 ? | 1000 ? | 113600 ? | ||
| Screen | -46% | -8% | 8% | -37% | 15% | |
| Brightness middle (cd/m²) | 343 | 335 -2% | 428 25% | 289 -16% | 299 -13% | 320 -7% |
| Brightness (cd/m²) | 323 | 303 -6% | 405 25% | 310 -4% | 300 -7% | 315 -2% |
| Brightness Distribution (%) | 85 | 85 0% | 87 2% | 85 0% | 92 8% | 95 12% |
| Black Level * (cd/m²) | 0.33 | 0.46 -39% | 0.26 21% | 0.23 30% | 0.26 21% | 0.29 12% |
| Contrast (:1) | 1039 | 728 -30% | 1646 58% | 1257 21% | 1150 11% | 1103 6% |
| Colorchecker dE 2000 * | 2.38 | 5.09 -114% | 3.8 -60% | 1.64 31% | 5.6 -135% | 1.2 50% |
| Colorchecker dE 2000 max. * | 3.55 | 11.92 -236% | 7.2 -103% | 3.31 7% | 9.1 -156% | 3.2 10% |
| Greyscale dE 2000 * | 3.01 | 3.23 -7% | 4.4 -46% | 1.71 43% | 5.5 -83% | 0.8 73% |
| Gamma | 2.44 90% | 2.18 101% | 2.21 100% | 2.32 95% | 2.47 89% | 2.2 100% |
| CCT | 7198 90% | 6214 105% | 7067 92% | 6291 103% | 7533 86% | 6548 99% |
| Color Space (Percent of AdobeRGB 1998) (%) | 62 | 54 -13% | 62.8 1% | 52 -16% | 58.9 -5% | 62.1 0% |
| Color Space (Percent of sRGB) (%) | 98 | 82 -16% | 96.4 -2% | 82 -16% | 90.3 -8% | 96 -2% |
| Colorchecker dE 2000 calibrated * | 0.99 | 2.6 | 0.5 | |||
| Total Average (Program / Settings) | -10% /
-29% | -13% /
-9% | 8% /
6% | -10% /
-24% | 11% /
13% |
* ... smaller is better

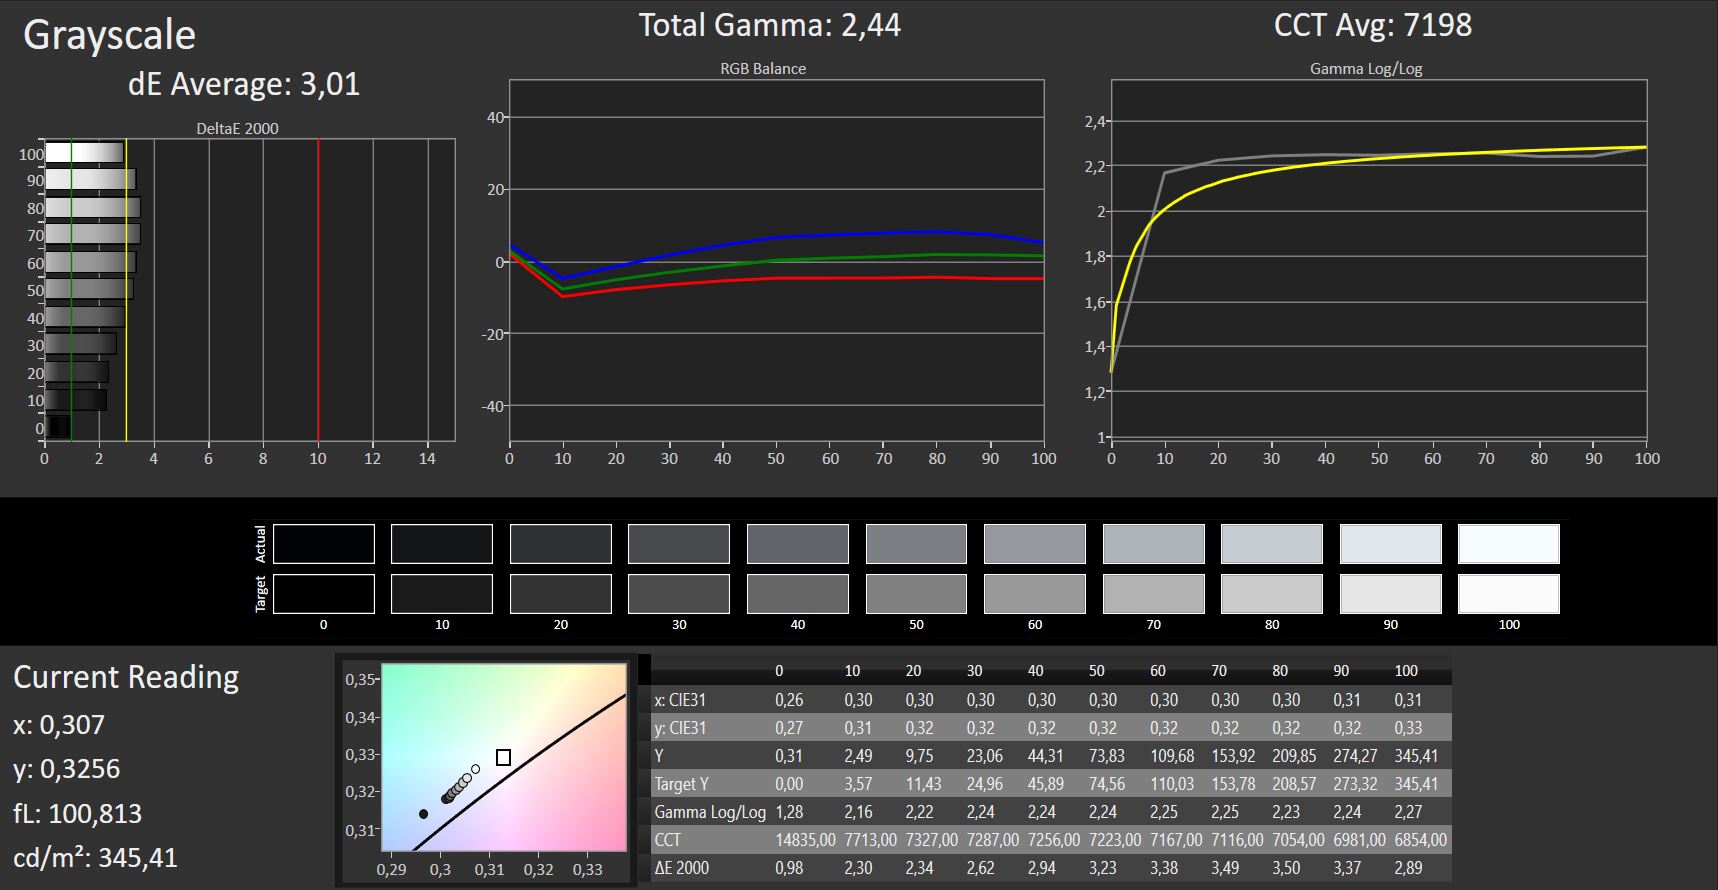
Subjectively, our test device has a decent display. The screen achieved a 1,039:1 contrast ratio in our tests, which is an acceptable level for a device at this price. Moreover, the display has low DeltaE deviations with additional calibration, the ICC profile for which we have included in the box above our comparison table. The display also reproduces images sharply, although a 4K option would do a better job. A 165 PPI pixel density is still suitable for a 13.3-inch display though.
The S730-13IWL also has solid colour space coverage. Lenovo has equipped our test device with an AUO display, although the company may use multiple display manufacturers as many other OEMs do. Our test device achieves 98% sRGB colour space coverage, which is higher than any of our comparison devices, although its AdobeRGB coverage is marginally short of what the XPS 13 9370 and MacBook Air 2018 manage. In short, the S730-13IWL has a display that is colour-accurate enough for semi-professional image editing, while the high colour space coverage ensures decent image quality.


Unfortunately, the S730-13IWL does not get bright enough for outdoor use. The glossy finish to the display attracts reflections even on cloudy days, which would completely overwhelm the display in direct sunlight.
Display Response Times
| ↔ Response Time Black to White | ||
|---|---|---|
| 31 ms ... rise ↗ and fall ↘ combined | ↗ 16 ms rise |  |
| ↘ 15 ms fall | ||
| The screen shows slow response rates in our tests and will be unsatisfactory for gamers. In comparison, all tested devices range from 0.1 (minimum) to 240 (maximum) ms. » 84 % of all devices are better. This means that the measured response time is worse than the average of all tested devices (19.9 ms). | ||
| ↔ Response Time 50% Grey to 80% Grey | ||
| 53 ms ... rise ↗ and fall ↘ combined | ↗ 27 ms rise |  |
| ↘ 26 ms fall | ||
| The screen shows slow response rates in our tests and will be unsatisfactory for gamers. In comparison, all tested devices range from 0.165 (minimum) to 636 (maximum) ms. » 90 % of all devices are better. This means that the measured response time is worse than the average of all tested devices (31.1 ms). | ||
Screen Flickering / PWM (Pulse-Width Modulation)
| Screen flickering / PWM not detected |  | ||
In comparison: 52 % of all tested devices do not use PWM to dim the display. If PWM was detected, an average of 7798 (minimum: 5 - maximum: 343500) Hz was measured. | |||
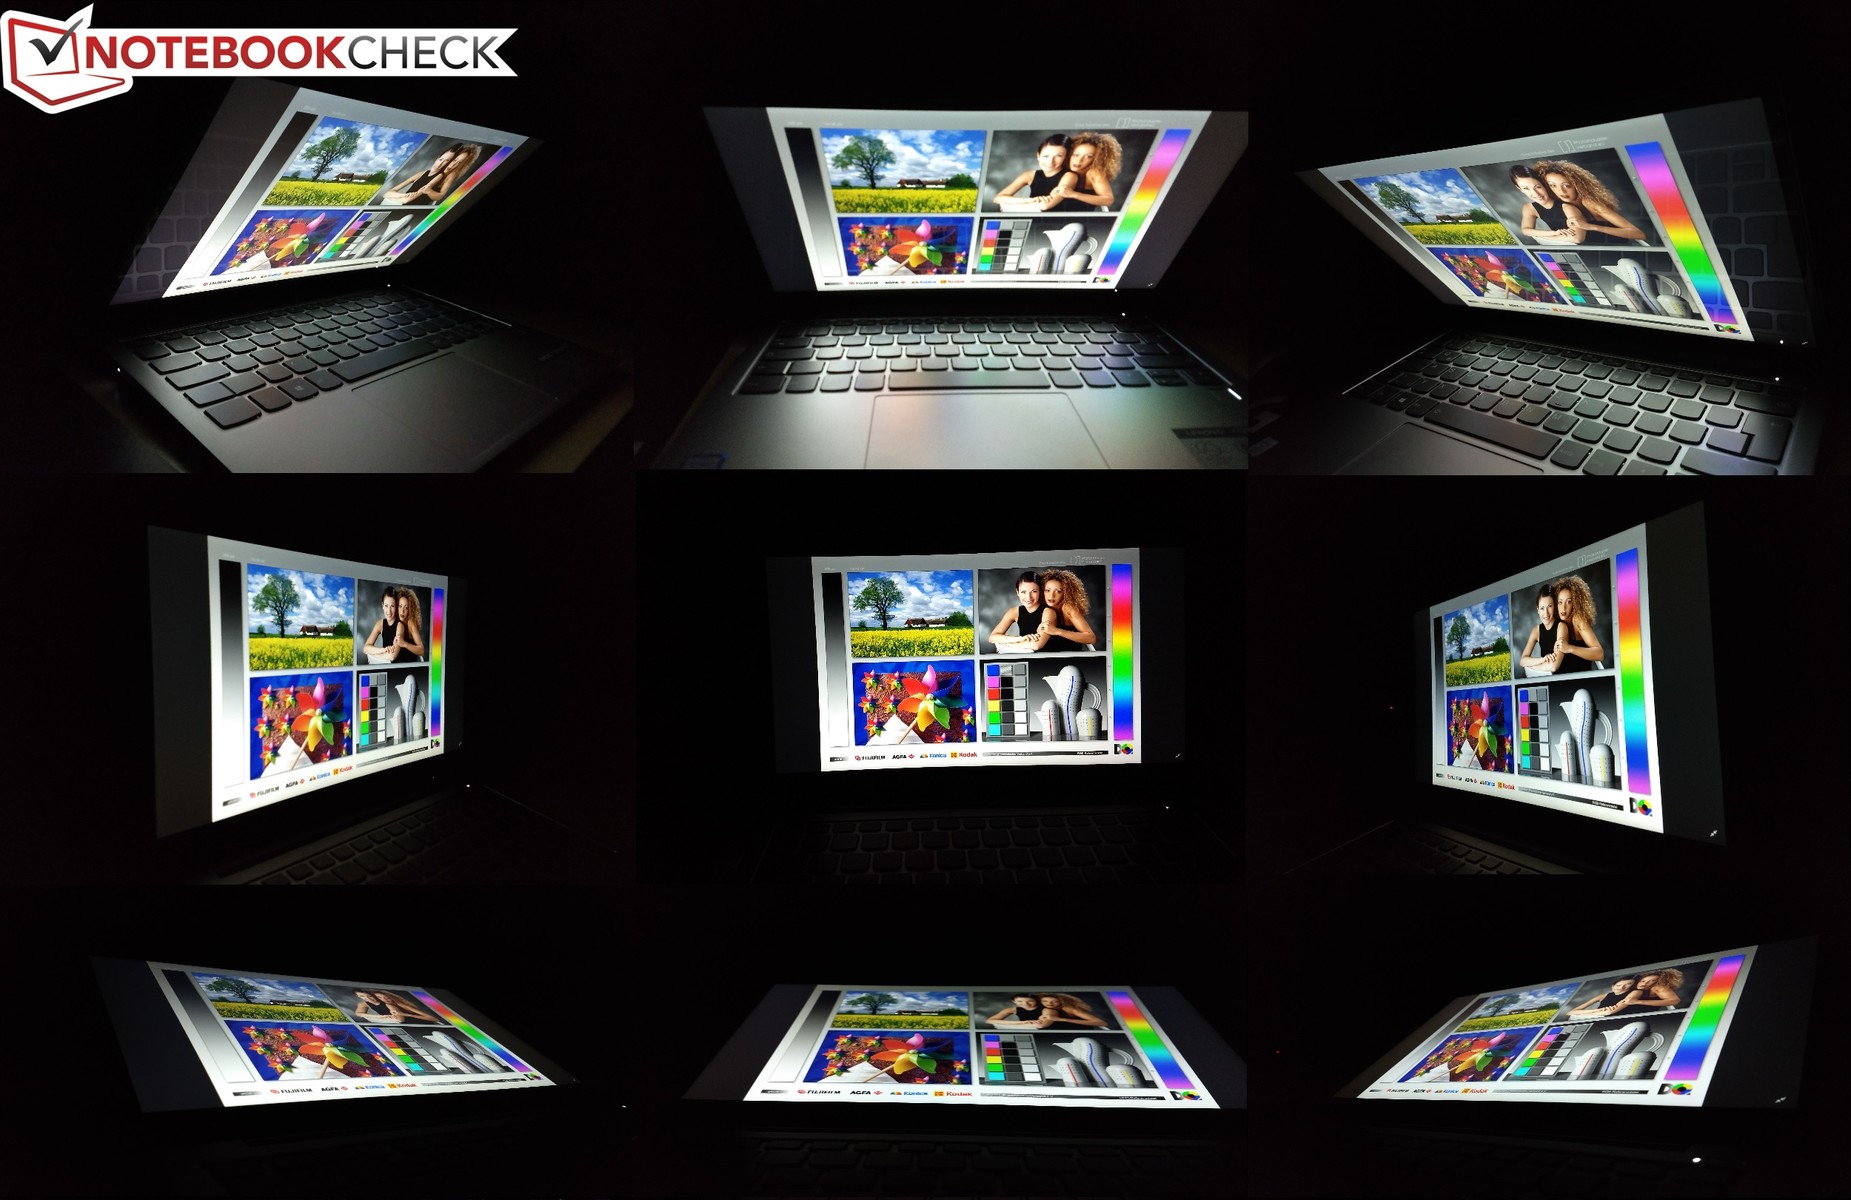
Our test device has stable viewing angles, thanks to its IPS display. We did not notice any glowing effects at acute viewing angles that is typical of many IPS display, nor did we notice any brightness or colour distortions.
Performance
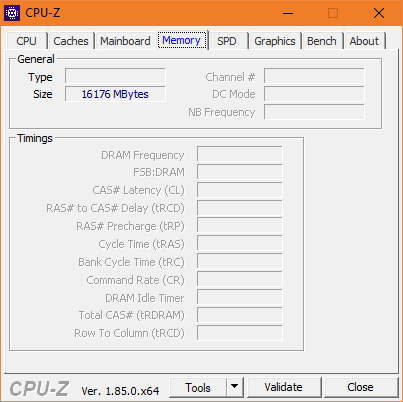
Lenovo currently sells the S730-13IWL in seven configurations in Germany, the cheapest of which is equipped with an Intel Core i5-8265U processor. All other models are equipped with the more powerful Intel Core i7-8565U processor, while RAM varies between 8 GB and 16 GB of DDR3L-2133 memory that is soldered to the motherboard. Lenovo equips the S730-13IWL with either a 256 GB, 512 GB or 1 TB SSD. The company also sells the device in two colours, on which we elaborated towards the beginning of our review.
Processor
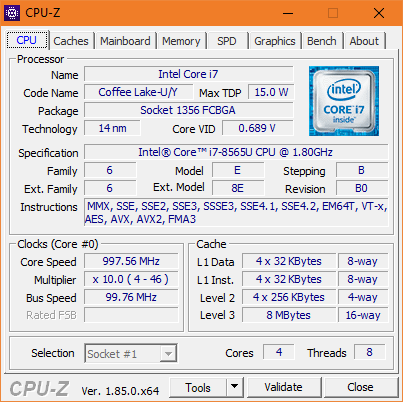
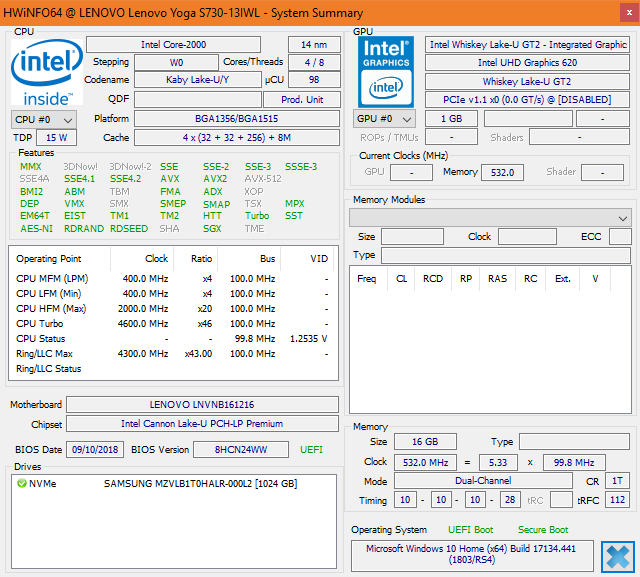
The Core i7-8565U is a new quad-core CPU from Intel’s 8th generation Core processors that is based on the company’s "Whiskey Lake" architecture. The CPU is just a minor update over the Core i7-8550U, with Intel increasing the Turbo Boost clock speed from 4 GHz to 4.6 GHz. Please see our CPU comparison page for more information about various CPUs, including the Core i7-8565U.
The higher clock speed only affected single-core performance in our tests. The CPU consumes 25 W for 30 seconds during a Cinebench R15 multi-core benchmark loop, with the processor clocking between 3.1-3.3 GHz. The TDP then drops to 17 W after 30 seconds, which causes the clock speed to reduce to around 2.6 GHz. Our Cinebench loop demonstrates that our test device cannot even maintain this clock speed though with the TDP sinking to 11 W and the clock speed falling to 2.1 GHz. The CPU core temperatures average around 70 °C (~158 °F) when the TDP is at 11 W, which indicates to us that Lenovo prefers the S730-13IWL to run quieter and cooler than for it to reach its maximum potential performance.
The Core i7-8565U achieves a slightly higher score than the Core i7-8550U in the single-core portion of Cinebench R15, with our test device scoring around 4% higher than the XPS 13 9370 and the ZenBook S UX391U with their Core i7-8550U processors. There is no such advantage in multi-core benchmarks though as the Core i7-8565U could not reach its 600 MHz higher boost clock speed. As a result, our test device only scored 1 more point than the XPS 13 9370 in the Cinebench R15 multi-core benchmark. The XPS gets the most from its processor though, with the S730-13IWL scoring 6% higher than the ZenBook S UX391U and 21% higher than the Envy 13 in the same benchmark.
Predictably, the S730-13IWL wipes the floor with the MacBook Air 2018 and its energy-efficient Core i5-8210Y processor. Interestingly, the 720s-13IKB outscores our test device by the end of our benchmark loop, despite being powered by a Core i5-8250U processor, which is theoretically weaker than the Core i7-8565U. It is worth keeping in mind that our test device does not restrict CPU performance when on battery.
System Performance
The Yoga S730-13IWL performed well in PCMark benchmarks too, although it did not finish top of all our PCMark comparison tables. We have nothing to complain about from using our test device daily either.
| PCMark 8 Home Score Accelerated v2 | 3096 points | |
| PCMark 8 Work Score Accelerated v2 | 4733 points | |
| PCMark 10 Score | 4022 points | |
Help | ||
Storage Devices
Our test device is equipped with a 1-TB Samsung PM981 M.2-2280 SSD, which is an extremely fast PCIe NVMe drive. The PM981 is currently the standard against which other SSDs are measured; none of our comparison devices are equipped with faster SSDs.
| Lenovo Yoga S730-13IWL Samsung SSD PM981 MZVLB1T0HALR | Dell XPS 13 9370 FHD i5 Toshiba XG5 KXG50ZNV256G | HP Envy 13-ah0003ng SK Hynix BC501 HFM512GDJTNG | Asus ZenBook S UX391U Samsung PM961 NVMe MZVLW512HMJP | Lenovo Ideapad 720S-13IKB Samsung PM961 MZVLW256HEHP | Average Samsung SSD PM981 MZVLB1T0HALR | |
|---|---|---|---|---|---|---|
| CrystalDiskMark 5.2 / 6 | -0% | -30% | -12% | -5% | 16% | |
| Write 4K (MB/s) | 139.6 | 128.2 -8% | 112.9 -19% | 98.9 -29% | 115 -18% | 165.7 ? 19% |
| Read 4K (MB/s) | 36.97 | 48.09 30% | 38.69 5% | 38.33 4% | 41.36 12% | 44.6 ? 21% |
| Write Seq (MB/s) | 1490 | 1088 -27% | 654 -56% | 1414 -5% | 1208 -19% | 1982 ? 33% |
| Read Seq (MB/s) | 1321 | 1877 42% | 642 -51% | 1051 -20% | 1448 10% | 1764 ? 34% |
| Write 4K Q32T1 (MB/s) | 302.4 | 367.1 21% | 305.9 1% | 370.7 23% | 395 31% | 395 ? 31% |
| Read 4K Q32T1 (MB/s) | 375.4 | 411.9 10% | 351.6 -6% | 251.4 -33% | 373.9 0% | 434 ? 16% |
| Write Seq Q32T1 (MB/s) | 2391 | 1078 -55% | 869 -64% | 1606 -33% | 1217 -49% | 2351 ? -2% |
| Read Seq Q32T1 (MB/s) | 3272 | 2771 -15% | 1683 -49% | 3218 -2% | 3167 -3% | 3234 ? -1% |
| Write 4K Q8T8 (MB/s) | 1254 | 1408 ? 12% | ||||
| Read 4K Q8T8 (MB/s) | 1525 | 1449 ? -5% |

Graphics Card
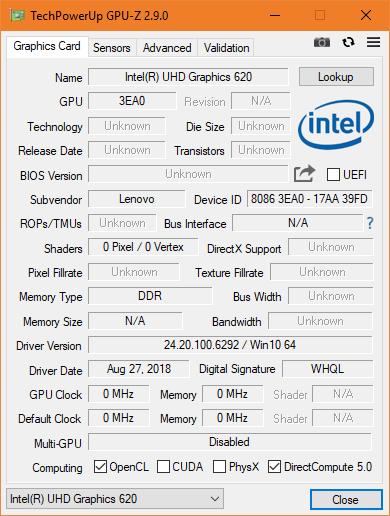
The Core i7-8565U integrates an Intel UHD Graphics 620 GPU, which Intel also uses in its Kaby Lake Refresh CPUs such as the Core i7-8550U and Core i5-8250U.
The S730-13IWL has dual-channel RAM, which allows the system to fully exploit its integrated GPU. The performance pales in comparison to the NVIDIA GeForce MX150 GPU that Lenovo equips in the IdeaPad 720s-13IKB and which HP uses in the Envy 13. Unfortunately, the company does not offer a dedicated GPU option with the S730-13IWL. Our test device does not limit GPU performance when running on battery either.
| 3DMark 11 Performance | 2025 points | |
| 3DMark Cloud Gate Standard Score | 6769 points | |
| 3DMark Fire Strike Score | 1073 points | |
| 3DMark Time Spy Score | 444 points | |
Help | ||
Gaming Performance
The gaming performance of the Intel UHD Graphics 620 is not worth mentioning. The integrated GPU can run some older games smoothly at reduced graphics and low resolutions, but playing newer or more complex games is out of the question.
| low | med. | high | ultra | |
|---|---|---|---|---|
| BioShock Infinite (2013) | 81.7 | 41 | 34.1 | 10.38 |
| Rise of the Tomb Raider (2016) | 19 | |||
| Civilization 6 (2016) | 39.9 | 17.2 |
Emissions
Fan Noise
The fan in our test device is always off when the system is idling. Unfortunately, the device does not operate silently, as it emits an electronic noise that sounds like coil whine. The fan reaches a maximum of 37.5 dB(A) under load, which is neither exceptionally loud nor an annoyingly high frequency.
Noise level
| Idle |
| 30.6 / 30.6 / 30.6 dB(A) |
| Load |
| 37.5 / 34.5 dB(A) |
 | ||
30 dB silent 40 dB(A) audible 50 dB(A) loud |
||
min: | ||
Temperature
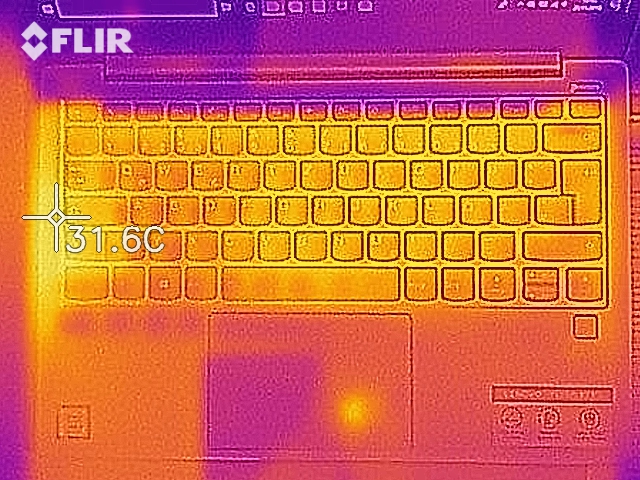
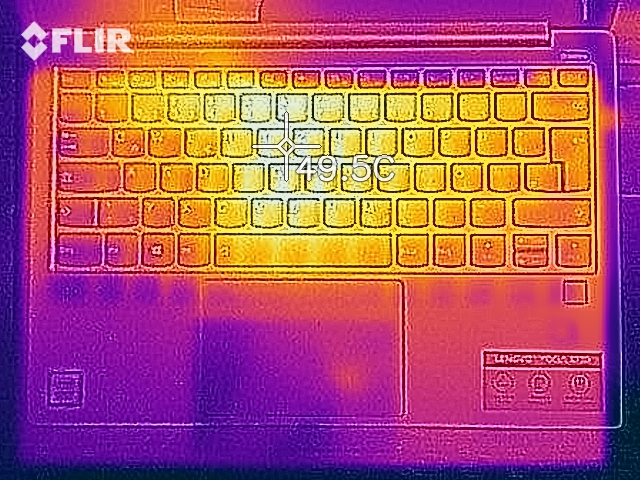
The S730-13IWL also maintains its surface temperatures well despite its slim metal case. Our test device reaches a maximum of 46 °C (~115 °F) on the top case, which is well below the critical 50 °C (~122 °F) threshold, above which we would consider a device to get too hot to use on your lap when it is being pushed hard. On the positive side, the palm rest remained cool throughout testing.
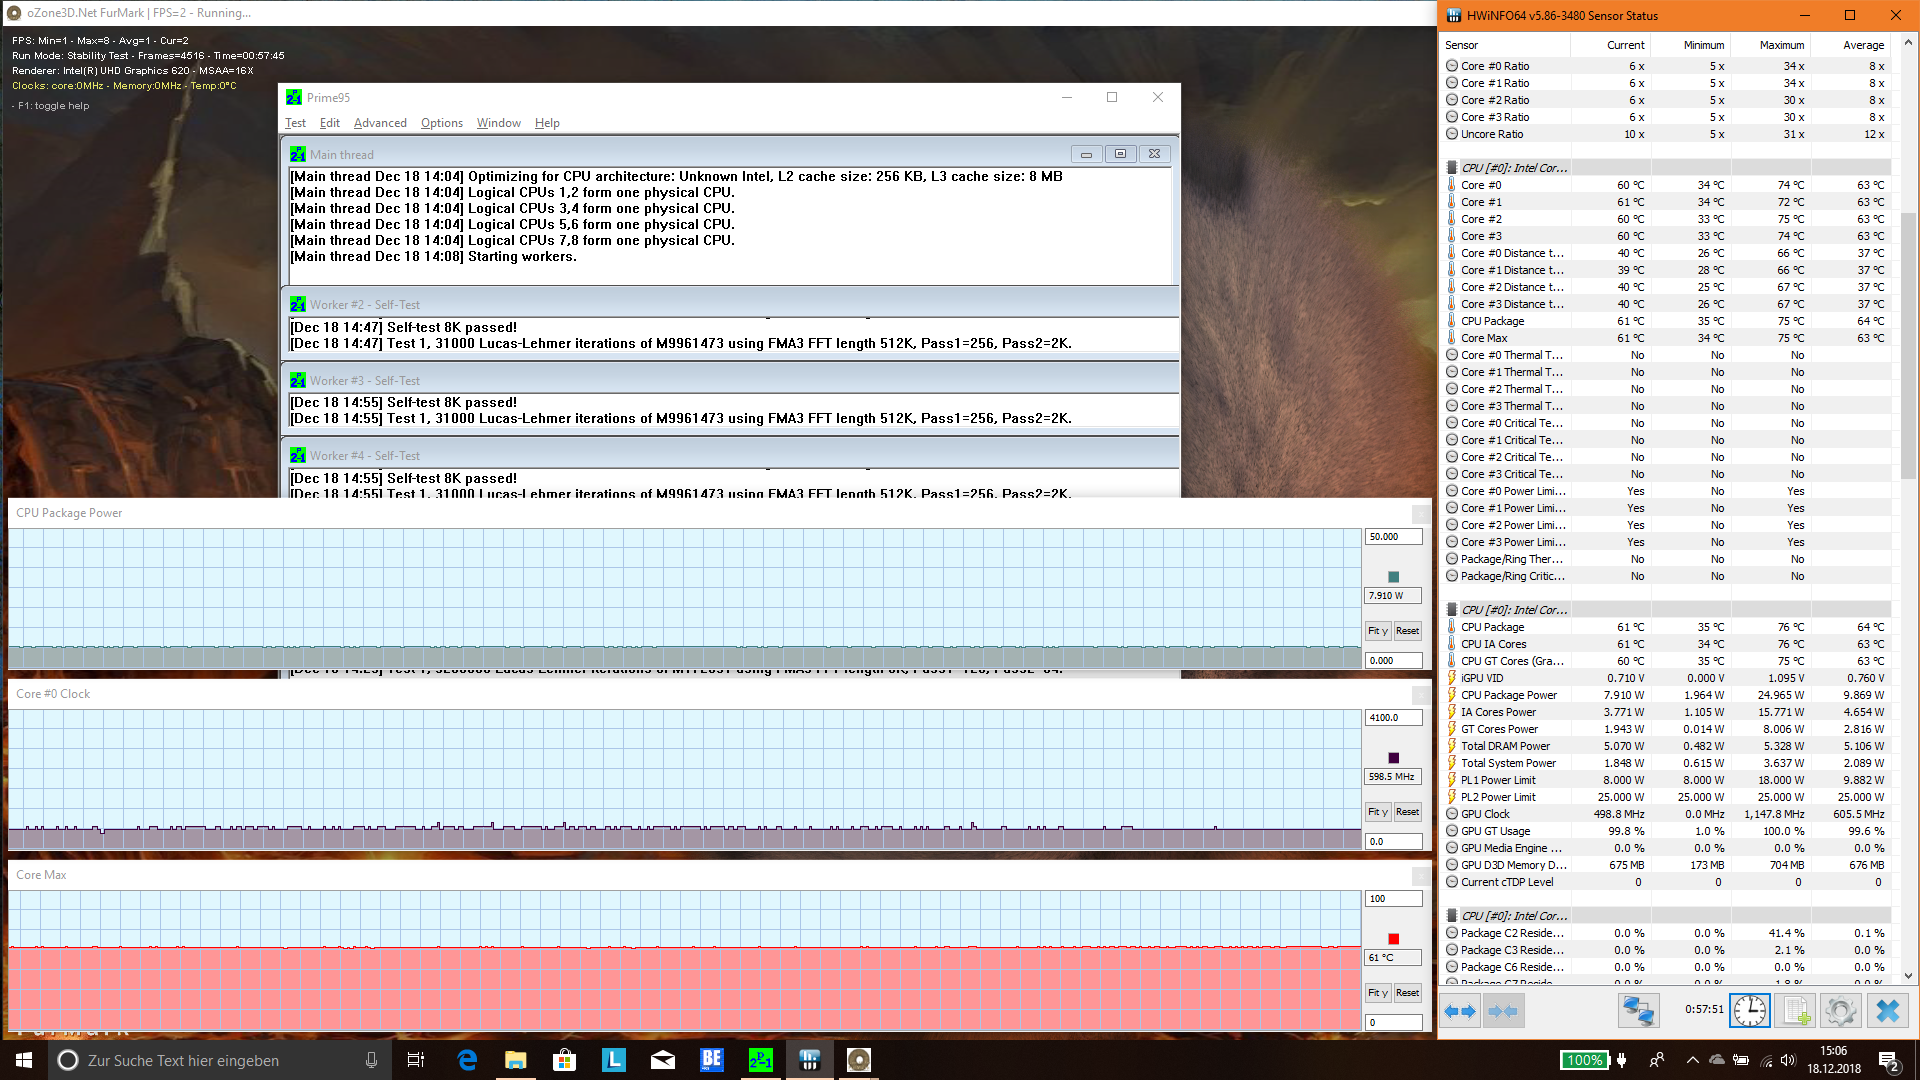
Our test device aggressively manages its temperatures to achieve cool surface temperatures. The CPU core temperatures exceed 90 °C (~194 °F) for a short period during a combined FurMark and Prime95 stress test, but this is only when the CPU is consuming its full 25 W. The core temperatures the drop significantly after 30 seconds when the Turbo Boost switches off. The CPU eventually drops to 8 W during our one-hour stress test, during which the CPU operates at only 600 MHz. The CPU core temperatures stabilise at around 60 °C (~140 °F), but our test device has thermal throttled heavily to cool itself down.
Our test device scored around 300 points lower in 3DMark 11 too when we ran the benchmark immediately after our stress test compared to when we ran after the machine had been idling. In short, expect the S730-13IWL to thermal throttle when pushed hard in daily use too.
(-) The maximum temperature on the upper side is 46.1 °C / 115 F, compared to the average of 34.3 °C / 94 F, ranging from 21.2 to 62.5 °C for the class Office.
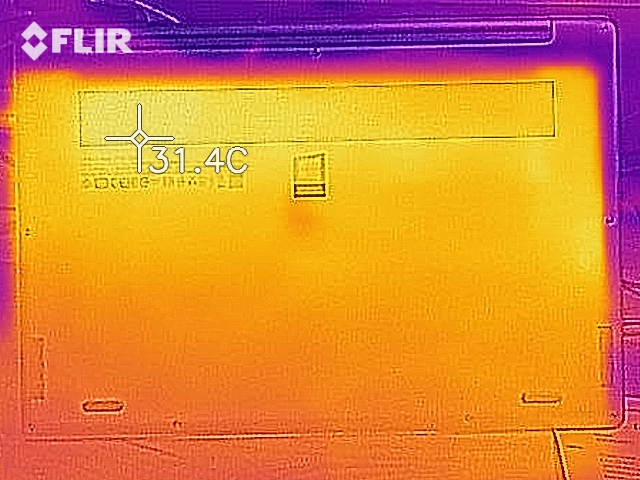
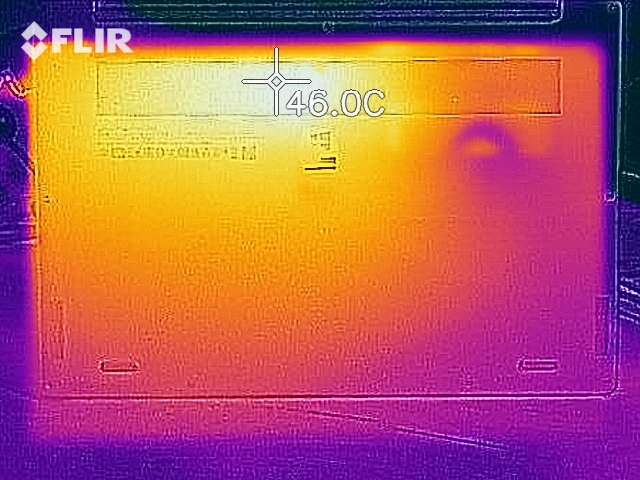
(±) The bottom heats up to a maximum of 43.9 °C / 111 F, compared to the average of 36.8 °C / 98 F
(+) In idle usage, the average temperature for the upper side is 26.4 °C / 80 F, compared to the device average of 29.5 °C / 85 F.
(+) The palmrests and touchpad are cooler than skin temperature with a maximum of 30 °C / 86 F and are therefore cool to the touch.
(-) The average temperature of the palmrest area of similar devices was 27.5 °C / 81.5 F (-2.5 °C / -4.5 F).
Speakers
The S730-13IWL has stereo speakers that are on the underside of the device, which deliver average audio quality for laptop speakers. By contrast, the speakers in the MacBook Air 2018 sound significantly better than those in our test device. The speakers in the Lenovo Yoga C930-13IKB sound better too, thanks to being placed within the hinge. We would recommend connecting external speakers or headphones over Bluetooth or the headphone jack for a better audio experience.
Lenovo advertises the S730-13IWL as having "Dolby Atmos Speakers". Lenovo has pre-installed the Dolby Atmos app to its credit, which is typically a paid app on the Microsoft Store. Activating Atmos causes audio to sound noticeably louder, and there are also sound profile options should you wish to tinker with how your audio sounds. Naturally, it is a matter of taste whether Dolby Atmos and its audio profiles improve audio quality though.
Lenovo Yoga S730-13IWL audio analysis
(-) | not very loud speakers (68.9 dB)
Bass 100 - 315 Hz
(±) | reduced bass - on average 10.4% lower than median
(-) | bass is not linear (15.9% delta to prev. frequency)
Mids 400 - 2000 Hz
(±) | higher mids - on average 6.3% higher than median
(+) | mids are linear (4.7% delta to prev. frequency)
Highs 2 - 16 kHz
(+) | balanced highs - only 3.1% away from median
(+) | highs are linear (4.9% delta to prev. frequency)
Overall 100 - 16.000 Hz
(±) | linearity of overall sound is average (17.7% difference to median)
Compared to same class
» 28% of all tested devices in this class were better, 6% similar, 66% worse
» The best had a delta of 7%, average was 21%, worst was 53%
Compared to all devices tested
» 35% of all tested devices were better, 8% similar, 57% worse
» The best had a delta of 4%, average was 24%, worst was 134%
Apple MacBook Air 2018 audio analysis
(±) | speaker loudness is average but good (75 dB)
Bass 100 - 315 Hz
(±) | reduced bass - on average 8.1% lower than median
(±) | linearity of bass is average (10% delta to prev. frequency)
Mids 400 - 2000 Hz
(+) | balanced mids - only 2.9% away from median
(+) | mids are linear (5.6% delta to prev. frequency)
Highs 2 - 16 kHz
(+) | balanced highs - only 2.2% away from median
(+) | highs are linear (4.5% delta to prev. frequency)
Overall 100 - 16.000 Hz
(+) | overall sound is linear (12.3% difference to median)
Compared to same class
» 16% of all tested devices in this class were better, 5% similar, 80% worse
» The best had a delta of 5%, average was 18%, worst was 53%
Compared to all devices tested
» 10% of all tested devices were better, 2% similar, 87% worse
» The best had a delta of 4%, average was 24%, worst was 134%
Lenovo Yoga C930-13IKB audio analysis
(±) | speaker loudness is average but good (77.4 dB)
Bass 100 - 315 Hz
(+) | good bass - only 4.8% away from median
(±) | linearity of bass is average (8.8% delta to prev. frequency)
Mids 400 - 2000 Hz
(+) | balanced mids - only 3% away from median
(+) | mids are linear (4.6% delta to prev. frequency)
Highs 2 - 16 kHz
(±) | reduced highs - on average 5.1% lower than median
(+) | highs are linear (5.4% delta to prev. frequency)
Overall 100 - 16.000 Hz
(+) | overall sound is linear (14.1% difference to median)
Compared to same class
» 20% of all tested devices in this class were better, 4% similar, 76% worse
» The best had a delta of 6%, average was 20%, worst was 57%
Compared to all devices tested
» 17% of all tested devices were better, 4% similar, 80% worse
» The best had a delta of 4%, average was 24%, worst was 134%
Power Management
Power Consumption
Strikingly, the S730-13IWL has almost the lowest minimum power consumption of our comparison devices with only the MacBook Air 2018 being more energy efficient. However, power consumption rises to a maximum of 53 W under load, which puts our test device bottom in our comparison table in this respect. Fortunately, the Yoga S730-13IWL’s average power consumption under load is on par with our quad-core comparison devices.
The 65-W USB Type-C charger had no issues with recharging our test device throughout our time with it. We do not expect any charging issues in daily use either as its 53-W maximum power consumption is well short of the charger’s rated wattage.
| Off / Standby | |
| Idle | |
| Load |
|
Key:
min: | |
| Lenovo Yoga S730-13IWL i7-8565U, UHD Graphics 620, Samsung SSD PM981 MZVLB1T0HALR, IPS LED, 1920x1080, 13.3" | Dell XPS 13 9370 FHD i5 i5-8250U, UHD Graphics 620, Toshiba XG5 KXG50ZNV256G, IPS, 1920x1080, 13.3" | HP Envy 13-ah0003ng i5-8550U, GeForce MX150, SK Hynix BC501 HFM512GDJTNG, IPS, 1920x1080, 13.3" | Asus ZenBook S UX391U i5-8550U, UHD Graphics 620, Samsung PM961 NVMe MZVLW512HMJP, IPS, 1920x1080, 13.3" | Apple MacBook Air 2018 i5-8210Y, UHD Graphics 617, Apple SSD AP0256, IPS, 2560x1600, 13.3" | Lenovo Ideapad 720S-13IKB i5-8250U, UHD Graphics 620, Samsung PM961 MZVLW256HEHP, IPS, 1920x1080, 13.3" | Average Intel UHD Graphics 620 | Average of class Office | |
|---|---|---|---|---|---|---|---|---|
| Power Consumption | 10% | -16% | -0% | 21% | -3% | -3% | -18% | |
| Idle Minimum * (Watt) | 3 | 3.14 -5% | 5.3 -77% | 3.24 -8% | 2.2 27% | 3.9 -30% | 3.81 ? -27% | 4.4 ? -47% |
| Idle Average * (Watt) | 5.6 | 5.22 7% | 7.3 -30% | 6.1 -9% | 5.7 -2% | 7.7 -38% | 6.94 ? -24% | 7.32 ? -31% |
| Idle Maximum * (Watt) | 11 | 6 45% | 9.3 15% | 9.2 16% | 10.3 6% | 10.4 5% | 8.75 ? 20% | 8.56 ? 22% |
| Load Average * (Watt) | 38 | 38.5 -1% | 39 -3% | 38.8 -2% | 25.6 33% | 33.3 12% | 35 ? 8% | 42.5 ? -12% |
| Load Maximum * (Watt) | 53 | 50.4 5% | 46 13% | 52.6 1% | 30.6 42% | 34 36% | 47.5 ? 10% | 64.1 ? -21% |
* ... smaller is better
Battery Life
The Yoga S730-13IWL has a 42 Wh battery, which is smaller than the batteries in all our comparison devices. By contrast, all our comparison devices but the IdeaPad 720s-13IKB have at least 50 Wh batteries. Predictably, the S730-13IWL has worse battery life than our comparison devices too.
Our test device still achieves a respectable 6:54 hours in our Wi-Fi battery life test, which is just short of a full day’s use. However, the S730-13IWL falls well short of all our comparison devices here, with the XPS 13 9370, MacBook Air 2018 and IdeaPad 720s-13IKB all lasting over 10 hours in the same battery life test. The Envy 13 and ZenBook S UX391U lasted 16% and 19% longer respectively than our test device, which is likely to be the difference between needing to find a charger before the end of the day and having just enough battery life to see you beyond 7/8 hours mixed use on battery.
| Lenovo Yoga S730-13IWL i7-8565U, UHD Graphics 620, 42 Wh | Dell XPS 13 9370 FHD i5 i5-8250U, UHD Graphics 620, 52 Wh | HP Envy 13-ah0003ng i5-8550U, GeForce MX150, 53.2 Wh | Asus ZenBook S UX391U i5-8550U, UHD Graphics 620, 50 Wh | Apple MacBook Air 2018 i5-8210Y, UHD Graphics 617, 50.3 Wh | Lenovo Ideapad 720S-13IKB i5-8250U, UHD Graphics 620, 46 Wh | Average of class Office | |
|---|---|---|---|---|---|---|---|
| Battery runtime | 44% | -1% | 22% | 43% | 14% | 53% | |
| Reader / Idle (h) | 15.9 | 23.6 48% | 15.5 -3% | 22.3 40% | 17.3 9% | 23.7 ? 49% | |
| H.264 (h) | 8.9 | 13.9 56% | 6.3 -29% | 10.4 17% | 12.3 38% | 15 ? 69% | |
| WiFi v1.3 (h) | 6.9 | 10.7 55% | 8 16% | 8.2 19% | 11.1 61% | 10.1 46% | 12.9 ? 87% |
| Load (h) | 1.7 | 2 18% | 1.9 12% | 1.9 12% | 2.2 29% | 1.5 -12% | 1.807 ? 6% |
Verdict
Pros
Cons
Lenovo has left the popular ways of its Yoga series behind with the release of the Yoga S730-13IWL; at least in Europe and Asia anyway, as the company sells the device as the IdeaPad 730s-13IWL in Canada and the US. Lenovo tried undercutting the Dell XPS 13 with the IdeaPad 710s-13ISK and the IdeaPad 720s-13IKB, but the concept is wearing thin with the S730-13IWL.
Lenovo has made too many compromises with the Yoga S730-13IWL, which causes it to fall just short of the best compact ultrabooks that Lenovo is desperately trying to outdo.
Some changes are welcome though, such as the premium aluminium case, which is comfortable to hold thanks to being a few millimetres slimmer. Moreover, we applaud Lenovo for including three USB Type-C ports and for making two of them Thunderbolt 3. Having USB Type-C ports on either side of the device allows you to charge it from either side, which is inherently more flexible than having one side from which to choose.
The display is much better too with a high colour space coverage and no PWM. The keyboard also has a good stroke to it, although it is not at ThinkPad level. Likewise, we like the glass trackpad, while the inclusion of a Samsung PM981 SSD is commendable as it is currently the standard-bearer of NVMe drives. Finally, the 180° hinge opening is useful and is something we are more used to seeing with business laptops than with consumes ones.
Unfortunately, there are some downsides, which mainly stem from the slim case. The battery is comparatively small and yields disappointing battery life. Equally, the lack of USB Type-A may frustrate some people, as could the absence of a dedicated GPU option. Furthermore, Lenovo has equipped the device with a single fan, which causes the processor to thermal throttle heavily. We would have liked matte or 4K display options too because the glossy finish attracts fingerprints and reflections. Moreover, the Wi-Fi card is a weak choice for an expensive laptop, while the coil whine could become irritating in the long run.
The Lenovo Yoga S730-13IWL is a decent laptop overall, but it is not one that we can recommend over its competitors. It is a solid ultrabook in most respect, but devices such as the Dell XPS 13 9370 are more complete all-rounders, while other competitors such as the HP Envy 13 have 4K display options and dedicated GPUs. In short, we would recommend considering the best of our comparison devices before you think about buying the Lenovo Yoga S730-13IWL.
Lenovo Yoga S730-13IWL
- 12/22/2018 v6 (old)
Benjamin Herzig
Price comparison
