Notebook reviews with NVIDIA GeForce MX150 graphics card
Asus ZenBook S13 UX392FN (i7-8565U, GeForce MX150) Laptop Review
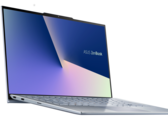
The 13.9-inch ZenBook S13 UX392 is the closest thing you can get to a Dell XPS 14 with even faster graphics performance than what the XPS 13 currently has to offer. Aside from a couple of head-scratching omissions, there's very little to dislike about Asus' latest flagship Ultrabook.
Intel Core i7-8565U, NVIDIA GeForce MX150, 13.9", 1.1 kgASUS ZenBook 14 UX433FN (Core i7-8565U, MX150, SSD, FHD) Laptop Review
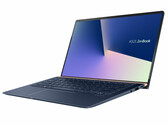
ASUS has packed powerful hardware into a sleek and compact case, which is impressive on the face of it. Unfortunately, this feat cannot be done without compromising somewhere, which we tackle in this review. The UX433FN shares many of its features with its siblings that we have already reviewed like its IPS screen, NVMe SSD, dual-channel RAM and backlit keyboard. Sadly, ASUS equips this model with a reflective display too.
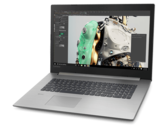
Intel Core i7-8565U, NVIDIA GeForce MX150, 14", 1.2 kgLenovo IdeaPad 330-17IKB (i7-8550U, GeForce MX150) Laptop Review
The IdeaPad 330 17 doesn't break any ground, but we find it to be a little overpriced for the specifications. The GeForce MX150 GPU doesn't make up for the very slow 1 TB HDD or poorly calibrated 900p TN display to justify the $900 USD asking price.
Intel Core i7-8550U, NVIDIA GeForce MX150, 17.3", 2.8 kgDell Inspiron 17-7786 (i7-8565U, 16 GB, 17-inch Touch, MX 150) Convertible Review
The large 17-inch Dell convertible has received a CPU upgrade. In addition to the internal update, the case was also completely redesigned. Find out in this review whether these changes make sense and whether the new Whiskey-Lake-U CPU can ensure a higher performance.
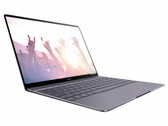
Intel Core i7-8565U, NVIDIA GeForce MX150, 17.3", 2.8 kgHuawei MateBook 13 (i7-8565U, GeForce MX150) Laptop Review
Don't let its diminutive size fool you — this 3:2 13.0-inch laptop is equipped with a much faster GPU than your typical Ultrabook. Huawei's latest offering is supposed to be a mid-range product, but its unique build and specifications are anything but.
Intel Core i7-8565U, NVIDIA GeForce MX150, 13", 1.3 kgRazer Blade Stealth i7-8565U: Intel Core i7-8565U, 13.30", 1.3 kg
Review » Razer Blade Stealth (i7-8565U, GeForce MX150) Laptop Review
Asus VivoBook S15 S530UN-BQ097T: Intel Core i7-8550U, 15.60", 1.8 kg
Review » Asus VivoBook S15 S530UN (i7, FHD, MX150) Laptop Review
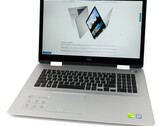
Dell Inspiron 15 7000 2-in-1 Black Edition: Intel Core i7-8565U, 15.60", 2.1 kg
Review » Dell Inspiron 15 7000 2-in-1 Black Edition (i7-8565U, MX150) Convertible Review
Acer Switch 7 BE SW713-51GNP: Intel Core i7-8550U, 13.50", 1.6 kg
Review » Acer Switch 7 Black Edition (i7-8550U, MX150) Convertible Review
Acer Aspire 5 A515-52G-53PU: Intel Core i5-8265U, 15.60", 1.8 kg
Review » Acer Aspire 5 A515-52G (i5-8265U, MX150, SSD, FHD) Laptop Review
Honor Magicbook: Intel Core i5-8250U, 14.00", 1.4 kg
Review » Honor Magicbook (Intel 8250U vs. AMD 2500U) Laptop Review
HP Pavilion 14-ce0002ng: Intel Core i7-8550U, 14.00", 1.7 kg
Review » HP Pavilion 14 (i7-8550U, MX150) Laptop Review
HP Envy 13-ah0003ng: Intel Core i7-8550U, 13.30", 1.2 kg
Review » HP Envy 13t (i7-8550U, MX150, SSD, FHD) Laptop Review
MSI Prestige PS42 8RB-059: Intel Core i7-8550U, 14.00", 1.2 kg
Review » MSI PS42 8RB Prestige (i7-8550U, GeForce MX150) Laptop Review
Huawei MateBook X Pro, i7: Intel Core i7-8550U, 13.90", 1.3 kg
Review » Huawei MateBook X Pro (i7-8550U, MX150) Laptop Review
Huawei MateBook D 15-53010BAJ : Intel Core i5-8250U, 15.60", 1.8 kg
Review » Huawei MateBook D 53010BAJ (8250U, MX150) Laptop Review
Lenovo IdeaPad 530s-14IKB: Intel Core i7-8550U, 14.00", 1.5 kg
Review » Lenovo IdeaPad 530s-14IKB (i7-8550U, MX150, WQHD, IPS) Laptop Review
HP Spectre x360 15-ch011nr: Intel Core i7-8550U, 15.60", 2.1 kg
Review » HP Spectre x360 15 2018 (i7-8550U, GeForce MX150) Convertible Review
MSI PL62 MX150 7300HQ: Intel Core i5-7300HQ, 15.60", 2.2 kg
Review » MSI PL62 (i5-7300HQ, MX150) Laptop Review
Huawei Matebook X Pro i5: Intel Core i5-8250U, 13.90", 1.3 kg
Review » Huawei Matebook X Pro (i5-8250U, MX150) Laptop Review
Asus Zenbook UX3430UN-GV174T: Intel Core i5-8250U, 14.00", 1.3 kg
Review » ASUS ZenBook UX3430UN (i5-8250U, MX150, 256 GB SSD) Subnotebook review
Lenovo ThinkPad T580-20LAS01H00: Intel Core i7-8550U, 15.60", 2.1 kg
Review » Lenovo ThinkPad T580 (i7-8550U, MX150, UHD) Laptop Review
Lenovo ThinkPad T480-20L6S01V00: Intel Core i7-8550U, 14.00", 1.8 kg
Review » Lenovo ThinkPad T480 (i7-8550U, MX150, FHD) Laptop Review
Xiaomi Mi Notebook Air 13.3 2018: Intel Core i5-8250U, 13.30", 1.3 kg
Review » Xiaomi Mi Notebook Air 13.3 2018 (i5-8250U MX150) Review
Lenovo ThinkPad T480s-20L8S02E00: Intel Core i7-8550U, 14.00", 1.3 kg
Review » Lenovo ThinkPad T480s (i7-8550U, MX150 Max-Q) Laptop Review
HP Envy 17-ae143ng: Intel Core i5-8250U, 17.30", 3 kg
Review » HP Envy 17 (i5-8250U, MX150, SSD, FHD) Laptop Review
Asus Zenbook UX430UN: Intel Core i7-8550U, 14.00", 1.3 kg
Review » Asus ZenBook UX430UN (i7-8550U, GeForce MX150) Laptop Review
Samsung Notebook 9 NP900X5T-X01US : Intel Core i7-8550U, 15.00", 1.3 kg
Review » Samsung Notebook 9 NP900X5T (i7-8550U, GeForce MX150) Laptop Review
Asus ZenBook 13 UX331UN: Intel Core i7-8550U, 13.30", 1.1 kg
Review » ASUS ZenBook 13 UX331UN (i7-8550, GeForce MX150, SSD, FHD) Laptop Review
Lenovo IdeaPad 320-15IKBRN 81BG001KGE: Intel Core i5-8250U, 15.60", 2 kg
Review » Lenovo IdeaPad 320-15IKBRN (8250U, MX150, FHD) Laptop Review
Xiaomi Mi Notebook Pro i7: Intel Core i7-8550U, 15.60", 2 kg
Review » Xiaomi Mi Notebook Pro (i7-8550U) Laptop Review
Asus ZenBook 13 UX331UN: Intel Core i7-8550U, 13.30", 1.1 kg
Review » Asus ZenBook 13 UX331UN (i7-8550U, MX150) Laptop Review
Lenovo IdeaPad 320S-13IKB: Intel Core i5-8250U, 13.30", 1.2 kg
Review » Lenovo IdeaPad 320S-13IKBR (i5-8250U, MX150) Laptop Review
Schenker Media 15: Intel Core i7-7700HQ, 15.60", 2.1 kg
Review » Schenker Media 15 (i7-7700HQ, MX150) Laptop Review
HP Spectre x360 15t-bl100: Intel Core i7-8550U, 15.60", 2 kg
Review » HP Spectre x360 15t-bl100 (i7-8550U, MX150) Convertible Review
Dell Inspiron 17-7773-0043: Intel Core i7-8550U, 17.30", 2.9 kg
Review » Dell Inspiron 17 7773 (i7-8550U, 16 GB, 17" Touch) Convertible Review
Xiaomi Mi Notebook Pro i5: Intel Core i5-8250U, 15.60", 2 kg
Review » Xiaomi Mi Notebook Pro i5 Laptop Review
Acer Swift 3 SF314-52G-89SL: Intel Core i7-8550U, 14.00", 1.6 kg
Review » Acer Swift 3 SF314-52G (i7-8550U, MX150, FHD) Laptop Review
Acer Aspire 5 A517-51G-80L: Intel Core i7-8550U, 17.30", 2.9 kg
Review » Acer Aspire 5 A517-51G (i7-8550U, MX 150, Full-HD) Laptop Review
HP Envy 13-ad006ng: Intel Core i7-7500U, 13.30", 1.3 kg
Review » HP Envy 13-ad006ng (i7-7500U, MX150) Laptop Review
Acer Swift 3 SF315-51G-57E5: Intel Core i5-8250U, 15.60", 1.9 kg
Review » Acer Swift 3 SF315 (8250U, MX150, FHD) Laptop Review
Acer Swift 3 SF315-51G-55Z9: Intel Core i5-7200U, 15.60", 2.1 kg
Review » Acer Swift 3 SF315 (i5-7200U, GeForce MX150) Laptop Review
Sager NP5852: Intel Core i7-7700HQ, 15.60", 2.5 kg
Review » Sager NP5852 (Clevo N850HL, i7-7700HQ, MX150) Laptop Review
Acer Aspire 5 A515-51G-51RL: Intel Core i5-7200U, 15.60", 2.1 kg
Review » Acer Aspire 5 A515-51G (7200U, MX150, FHD) Laptop Review
Lenovo ThinkPad T480-20L6S01V00: Intel Core i7-8550U, 14.00", 1.8 kg
External Review » Lenovo ThinkPad T480-20L6S01V00
Lenovo Thinkpad T480-20L5000BMH: Intel Core i7-8550U, 15.00", 1.7 kg
External Review » Lenovo Thinkpad T480-20L5000BMH
Medion Akoya P6685-MD61087: Intel Core i7-8550U, 15.60", 2.1 kg
External Review » Medion Akoya P6685-MD61087
HP Pavilion 15-cs1960nd: Intel Core i5-8265U, 15.60", 1.9 kg
External Review » HP Pavilion 15-cs1960nd
Lenovo Ideapad S530-13IWL-81J700ARSP: Intel Core i5-8265U, 13.30", 1.3 kg
External Review » Lenovo Ideapad S530-13IWL-81J700ARSP
HP Pavilion 15-cs2060tx: Intel Core i5-8265U, 15.60", 1.9 kg
External Review » HP Pavilion 15-cs2060tx
Medion Akoya P6687-MD61007: Intel Core i7-8550U, 15.60", 2.5 kg
External Review » Medion Akoya P6687-MD61007
Huawei MateBook D 15-53010BAJ : Intel Core i5-8250U, 15.60", 1.8 kg
External Review » Huawei MateBook D 53010BAJ
Asus ZenBook RX533FN-A8059T: Intel Core i7-8565U, 15.60", 1.6 kg
External Review » Asus ZenBook RX533FN-A8059T
Asus VivoBook S15 S532FA-BN012T: Intel Core i5-8265U, 15.60", 1.8 kg
External Review » Asus VivoBook S15 S532FA-BN012T
Dell Latitude 15 5501-DJM4N: Intel Core i5-9400H, 15.60", 1.8 kg
External Review » Dell Latitude 15 5501-DJM4N
Lenovo IdeaPad 530S-15IKB-81EV003XRU: Intel Core i5-8250U, 15.60", 1.7 kg
External Review » Lenovo IdeaPad 530S-15IKB-81EV003XRU
Medion Akoya P6685-30025457: Intel Core i5-8250U, 15.60", 2.1 kg
External Review » Medion Akoya P6685-30025457
Asus ZenBook 14 UX433FN-A6096T: Intel Core i7-8565U, 14.00", 1.3 kg
External Review » Asus ZenBook 14 UX433FN-A6096T
HP Pavilion 14-ce0014ns: Intel Core i7-8550U, 14.00", 1.6 kg
External Review » HP Pavilion 14-ce0014ns
MSI PS42 8RB-206NL: Intel Core i7-8550U, 14.00", 1.2 kg
External Review » MSI PS42 8RB-206NL
Lenovo IdeaPad 530S-15IKB 81EV00DQMH: Intel Core i5-8250U, 15.60", 1.7 kg
External Review » Lenovo IdeaPad 530S-15IKB 81EV00DQMH
Honor MagicBook VLT-W50: Intel Core i5-8250U, 14.00", 1.5 kg
External Review » Honor MagicBook VLT-W50
Asus ZenBook S13 UX392FN-AB006T: Intel Core i7-8565U, 13.90", 1.1 kg
External Review » Asus ZenBook S13 UX392FN-AB006T
MSI PS42 8RB-606XES: Intel Core i7-8550U, 14.00", 1.2 kg
External Review » MSI PS42 8RB-606XES
HP Envy 13-ah0006ns: Intel Core i7-8550U, 13.30", 1.3 kg
External Review » HP Envy 13-ah0006ns
Dell Inspiron 15 5584, i5-8265U: Intel Core i5-8265U, 15.60", 2 kg
External Review » Dell Inspiron 15 5584, i5-8265U
Huawei MateBook D 14-53010CQK: Intel Core i7-8550U, 14.00", 1.5 kg
External Review » Huawei MateBook D 14-53010CQK
Asus VivoBook S14 S430FN-EB032T: Intel Core i5-8265U, 14.00", 1.4 kg
External Review » Asus VivoBook S14 S430FN-EB032T
Asus Vivobook A510UN-EJ521T: Intel Core i7-8550U, 15.60", 1.7 kg
External Review » Asus Vivobook A510UN-EJ521T
Asus ZenBook S13 UX392FN-AB006R: Intel Core i7-8565U, 13.90", 1.1 kg
External Review » Asus ZenBook S13 UX392FN-AB006R
Acer Swift 3 SF314-56G-78GZ: Intel Core i7-8565U, 14.00", 1.6 kg
External Review » Acer Swift 3 SF314-56G-78GZ
HP Spectre x360 15-df0000: Intel Core i7-8565U, 15.60", 2.2 kg
External Review » HP Spectre x360 15-df0000
Acer Swift 3 SF315-52G-54DA: Intel Core i5-8250U, 15.60", 1.7 kg
External Review » Acer Swift 3 SF315-52G-54DA
Acer Switch 7 BE SW713-51GNP-81DA: Intel Core i7-8550U, 13.50", 1.2 kg
External Review » Acer Switch 7 BE SW713-51GNP-81DA
Medion Akoya P6645-MD63260: Intel Core i5-8265U, 15.60", 1.8 kg
External Review » Medion Akoya P6645-MD63260
Acer Aspire 5 A517-51-508X: Intel Core i5-8250U, 17.30", 3 kg
External Review » Acer Aspire 5 A517-51-508X
HP Envy 17-bw0001ng: Intel Core i5-8250U, 17.30", 2.9 kg
External Review » HP Envy 17-bw0001ng
Acer Swift 3 SF314-56G: Intel Core i5-8265U, 14.00", 1.5 kg
External Review » Acer Swift 3 SF314-56G
Asus ZenBook 14 UX431FN: Intel Core i5-8265U, 14.00", 1.4 kg
External Review » Asus ZenBook 14 UX431FN
HP Spectre x360 15 (OLED 2019): Intel Core i7-8750H, 15.60", 2.2 kg
External Review » HP Spectre x360 15 (OLED 2019)
Acer Aspire A515-51G-34TP: Intel Core i5-8265U, 15.60", 1.8 kg
External Review » Acer Aspire A515-51G-34TP
Asus Zenbook 13 UX333FN-A4015T: Intel Core i5-8265U, 13.30", 1.2 kg
External Review » Asus Zenbook 13 UX333FN-A4015T
Asus ZenBook S13 UX392FN: Intel Core i7-8565U, 13.90", 1.1 kg
External Review » Asus ZenBook S13 UX392FN
Acer Aspire 5 A515-52G-58S9: Intel Core i5-8265U, 15.60", 1.8 kg
External Review » Acer Aspire 5 A515-52G-58S9
HP Envy 13-ah1000ns: Intel Core i5-8265U, 13.30", 1.3 kg
External Review » HP Envy 13-ah1000ns
Acer Switch 7 SW713-51GNP-89JD: Intel Core i7-8550U, 13.50", 1.6 kg
External Review » Acer Switch 7 SW713-51GNP-89JD
Huawei MateBook 13 i7: Intel Core i7-8565U, 13.00", 1.3 kg
External Review » Huawei MateBook 13 i7
HP Pavilion 14-CE0000NS: Intel Core i7-8550U, 14.00", 1.7 kg
External Review » HP Pavilion 14-CE0000NS
Asus ZenBook 14 UX433FN-A5104T: Intel Core i7-8565U, 14.00", 1.1 kg
External Review » Asus ZenBook 14 UX433FN-A5104T
Asus VivoBook S15 S530FN-BQ390T: Intel Core i5-8265U, 15.60", 1.8 kg
External Review » Asus VivoBook S15 S530FN-BQ390T
Dell Inspiron 15 7586-2379: Intel Core i7-8565U, 15.60", 2 kg
External Review » Dell Inspiron 15 7586-2379
Honor MagicBook VLT-W60A: Intel Core i7-8550U, 14.00", 1.5 kg
External Review » Honor MagicBook VLT-W60A
MSI PS42 8RB-060: Intel Core i5-8250U, 14.00", 1.2 kg
External Review » MSI PS42 8RB-060
Acer Aspire 5 A515-52G-71LD: Intel Core i7-8565U, 15.60", 2.2 kg
External Review » Acer Aspire 5 A515-52G-71LD
Asus ZenBook 13 UX333FN-A3064T: Intel Core i7-8565U, 13.30", 1.1 kg
External Review » Asus ZenBook 13 UX333FN-A3064T
Dell Inspiron 17 7786-PKCJ3, 2-in-1: Intel Core i7-8565U, 17.30", 2.9 kg
External Review » Dell Inspiron 17 7786-PKCJ3, 2-in-1
Dell Inspiron 15 7580-4CDV1: Intel Core i7-8565U, 15.60", 2.2 kg
External Review » Dell Inspiron 15 7580-4CDV1
Dell Inspiron 15 7572: Intel Core i7-8550U, 15.60", 2 kg
External Review » Dell Inspiron 15 7572
Razer Blade Stealth i7-8565U: Intel Core i7-8565U, 13.30", 1.3 kg
External Review » Razer Blade Stealth i7-8565U
Acer Aspire 5 A515-52G-53PU: Intel Core i5-8265U, 15.60", 1.8 kg
External Review » Acer Aspire 5 A515-52G-53PU
Asus VivoBook S15 S510UN-BQ121T: Intel Core i7-8550U, 15.60", 1.5 kg
External Review » Asus VivoBook S15 S510UN-BQ121T
HP Pavilion 15-cs0960nd: Intel Core i5-8250U, 15.60", 2 kg
External Review » HP Pavilion 15-cs0960nd
Asus ZenBook 14 UX433FN-A6090T: Intel Core i5-8250U, 14.00", 1.1 kg
External Review » Asus ZenBook 14 UX433FN-A6090T
Huawei MateBook 13, i7: Intel Core i7-8565U, 13.30", 1.3 kg
External Review » Huawei MateBook 13, i7
Dell Inspiron 15 7000 2-in-1 Black Edition: Intel Core i7-8565U, 15.60", 2.1 kg
External Review » Dell Inspiron 15 7000 2-in-1 Black Edition
HP ENVY 13-ah0001ns: Intel Core i5-8250U, 13.30", 1.3 kg
External Review » HP ENVY 13-ah0001ns
Huawei MateBook D 15 2018 53010BRU: Intel Core i5-8250U, 15.60", 1.9 kg
External Review » Huawei MateBook D 2018 53010BRU
Lenovo ThinkPad T580-20LAS01H00: Intel Core i7-8550U, 15.60", 2.1 kg
External Review » Lenovo ThinkPad T580-20LAS01H00
Medion Akoya P6685-MD60989: Intel Core i5-8250U, 15.60", 2.1 kg
External Review » Medion Akoya P6685-MD60989
Lenovo Ideapad 720s-14IKBR-81BD003RSP: Intel Core i7-8550U, 14.00", 1.6 kg
External Review » Lenovo Ideapad 720s-14IKBR-81BD003RSP
HP Envy x360 15-cn0101ng: Intel Core i5-8250U, 15.60", 2.2 kg
External Review » HP Envy x360 15-cn0101ng
Medion Akoya P6687-MD61005: Intel Core i5-8250U, 15.60", 2.3 kg
External Review » Medion Akoya P6687-MD61005
HP Pavilion 14-ce0012ns: Intel Core i7-8550U, 14.00", 1.6 kg
External Review » HP Pavilion 14-ce0012ns
HP Envy 13-ah0003ng: Intel Core i7-8550U, 13.30", 1.2 kg
External Review » HP Envy 13-ah0003ng
HP Envy 13-ad015na: Intel Core i7-7500U, 13.30", 1.3 kg
External Review » HP Envy 13-ad015na
HP Envy x360 15-cn0004ng: Intel Core i5-8250U, 15.60", 2.1 kg
External Review » HP Envy x360 15-cn0004ng
Dell Inspiron 15 5580: Intel Core i5-8265U, 15.60", 1.8 kg
External Review » Dell Inspiron 15 5580
Asus VivoBook S15 S530UN-BQ353T: Intel Core i7-8550U, 15.60", 1.8 kg
External Review » Asus VivoBook S15 S530UN-BQ353T
Lenovo IdeaPad 330-15IKBR 81DE00WJMH: Intel Core i5-8250U, 15.60", 2.2 kg
External Review » Lenovo IdeaPad 330-15IKBR 81DE00WJMH
Honor Magicbook: Intel Core i5-8250U, 14.00", 1.4 kg
External Review » Honor Magicbook
Asus ZenBook 14 UX433FN: Intel Core i7-8565U, 14.00", 1.1 kg
External Review » Asus ZenBook 14 UX433FN
Asus Zenbook 13 UX331UN-90NB0GY1-M00230: Intel Core i7-8550U, 13.30", 1.1 kg
External Review » Asus Zenbook 13 UX331UN-90NB0GY1-M00230
Acer Swift 3 SF314-55G: Intel Core i3-8145U, 14.00"
External Review » Acer Swift 3 SF314-55G
MSI Prestige PS42 8RB-059: Intel Core i7-8550U, 14.00", 1.2 kg
External Review » MSI Prestige PS42 8RB-059
MSI PL62 7RC-268XES: Intel Core i5-7300HQ, 15.60", 2.2 kg
External Review » MSI PL62 7RC-268XES
Asus VivoBook S13 S330UN: Intel Core i5-8250U, 13.30", 1.2 kg
External Review » Asus VivoBook S13 S330UN
Acer Swift 3-SF314-54G: Intel Core i5-8250U, 14.00", 1.5 kg
External Review » Acer Swift 3-SF314-54G
HP Pavilion 15-cs0007NS: Intel Core i7-8550U, 15.60", 1.9 kg
External Review » HP Pavilion 15-CS0007NS
MSI PS42 8RB-021ES: Intel Core i7-8550U, 14.00", 1.2 kg
External Review » MSI PS42 8RB-021ES
Lenovo Ideapad 520-15IKBR-81BF0074SP: Intel Core i5-8250U, 15.60", 2.2 kg
External Review » Lenovo Ideapad 520-15IKBR-81BF0074SP
Medion Akoya P6687-MD6100: Intel Core i7-8550U, 15.60", 2.1 kg
External Review » Medion Akoya P6687-MD6100
Asus VivoBook S K510UN-BQ297T : Intel Core i5-8250U, 15.60", 1.7 kg
External Review » Asus VivoBook S K510UN-BQ297T
Acer Swift 3 SF315-52G-8376: Intel Core i7-8550U, 15.60", 1.8 kg
External Review » Acer Swift 3 SF315-52G-8376
Acer Aspire Nitro 5 AN515-31-561Q: Intel Core i5-8250U, 15.60", 2.7 kg
External Review » Acer Aspire Nitro 5 AN515-31-561Q
MSI Prestige PS42 8RB-073: Intel Core i7-8550U, 14.10", 1.2 kg
External Review » MSI Prestige PS42 8RB-073
Lenovo Ideapad 320-15IKBRN-81BG00MNSP: Intel Core i5-8250U, 15.60", 2.2 kg
External Review » Lenovo Ideapad 320-15IKBRN-81BG00MNSP
Acer Swift 3 SF314-52-74JS: Intel Core i7-8550U, 15.60", 2.1 kg
External Review » Acer Swift 3 SF314-52-74JS
Asus VivoBook S15 S510UN-BQ256T: Intel Core i5-8250U, 15.60", 1.7 kg
External Review » Asus VivoBook S15 S510UN-BQ256T
Asus ZenBook Pro 14 UX480FD: Intel Core i7-8550U, 14.00", 1.6 kg
External Review » Asus ZenBook Pro 14 UX480FD
Acer Aspire A615-51G-59EA: Intel Core i5-8250U, 15.60", 2.1 kg
External Review » Acer Aspire A615-51G-59EA
Lenovo Ideapad 530S-15IKB: Intel Core i7-8550U, 15.60", 2 kg
External Review » Lenovo Ideapad 530S-15IKB
Acer Aspire 5 A515-51G-83LX: Intel Core i7-8550U, 15.60", 2.2 kg
External Review » Acer Aspire 5 A515-51G-83LX
Acer Aspire 5 A517-51G-8433: Intel Core i7-8550U, 17.30", 2.9 kg
External Review » Acer Aspire 5 A517-51G-8433
Lenovo ThinkPad T480s-20L8S02E00: Intel Core i7-8550U, 14.00", 1.3 kg
External Review » Lenovo ThinkPad T480s-20L8S02E00
Lenovo IdeaPad 520-15IKB-81BF00CXHV: Intel Core i5-8250U, 15.60", 2.2 kg
External Review » Lenovo IdeaPad 520-15IKB-81BF00CXHV
Huawei Matebook D 15 2018: Intel Core i7-8550U, 15.60", 1.9 kg
External Review » Huawei Matebook D 2018
Lenovo Ideapad 320-15IKBR-80XL03MDSP: Intel Core i7-8550U, 15.60", 2.2 kg
External Review » Lenovo Ideapad 320-15IKBR-80XL03MDSP
HP Envy 13-ad109ns: Intel Core i7-8550U, 13.30", 1.4 kg
External Review » HP Envy 13-ad109ns
Asus Zenbook Flip 14 UX461UN-90NB0GD1-M00980: Intel Core i5-8250U, 14.00", 1.5 kg
External Review » Asus Zenbook Flip 14 UX461UN-90NB0GD1-M00980
Asus ZenBook 13 UX331UN-90NB0GY2-M02590: Intel Core i5-8250U, 13.30", 1.1 kg
External Review » Asus ZenBook 13 UX331UN-90NB0GY2-M02590
Acer Swift 3 SF314-52G-50B3: Intel Core i5-8250U, 14.00", 1.7 kg
External Review » Acer Swift 3 SF314-52G-50B3
MSI PL62 7RC-267XES: Intel Core i5-7300HQ, 15.60", 2.2 kg
External Review » MSI PL62 7RC-267XES
Lenovo Ideapad 320-15IKBRN-81BG00EWSP: Intel Core i5-8250U, 15.60", 2.2 kg
External Review » Lenovo Ideapad 320-15IKBRN-81BG00EWSP
Medion Akoya P6687-MD60882: Intel Core i5-8250U, 15.60", 2.3 kg
External Review » Medion Akoya P6687-MD60882
HP Pavilion 15-ck025nd: Intel Core i5-8250U, 15.60", 1.8 kg
External Review » HP Pavilion 15-ck025nd
Lenovo IdeaPad 720S-14IKB 81BD003YMH: Intel Core i5-8250U, 14.00", 1.6 kg
External Review » Lenovo IdeaPad 720S-14IKB 81BD003YMH
Asus ZenBook 13 UX331UN: Intel Core i7-8550U, 13.30", 1.1 kg
External Review » Asus ZenBook 13 UX331UA
Asus ZenBook UX430UN-GV038T: Intel Core i7-8550U, 14.00", 1.3 kg
External Review » Asus ZenBook UX430UN-GV038T
Asus ZenBook Flip 14 UX461UN-E1033T: Intel Core i7-8550U, 14.00", 1.5 kg
External Review » Asus ZenBook Flip 14 UX461UN-E1033T
Samsung Notebook 9 NP900X5T-X01US : Intel Core i7-8550U, 15.00", 1.3 kg
External Review » Samsung Notebook 9 NP900X5T-X01US
Asus ZenBook UX430UN-GV033T: Intel Core i5-8250U, 14.00", 1.3 kg
External Review » Asus ZenBook UX430UN-GV033T
Asus VivoBook S14 S410UN-EB229T: Intel Core i7-8550U, 14.00", 1.3 kg
External Review » Asus VivoBook S14 S410UN-EB229T
Asus VivoBook S14 S410UN-EB177T: Intel Core i5-8250U, 14.00", 1.4 kg
External Review » Asus VivoBook S14 S410UN-EB177T
Huawei MateBook X Pro, i7: Intel Core i7-8550U, 13.90", 1.3 kg
External Review » Huawei MateBook X Pro, i7
Huawei Matebook X Pro i5: Intel Core i5-8250U, 13.90", 1.3 kg
External Review » Huawei Matebook X Pro, i5
Acer Aspire Nitro 5 AN515-31-59RD: Intel Core i5-8250U, 15.60", 2.7 kg
External Review » Acer Aspire Nitro 5 AN515-31-59RD
Xiaomi Mi Notebook Air 13.3 2018: Intel Core i5-8250U, 13.30", 1.3 kg
External Review » Xiaomi Mi Notebook Air 13.3 2018
MSI GV62 7RC-065PL: Intel Core i5-7300HQ, 15.60", 2.2 kg
External Review » MSI GV62 7RC-065PL
Acer Aspire E5-476G-5319: Intel Core i5-8250U, 14.00", 2.1 kg
External Review » Acer Aspire E5-476G-5319
Acer Aspire 5 A515-51G-59WL: Intel Core i5-8250U, 15.60", 2.2 kg
External Review » Acer Aspire 5 A515-51G-59WL
Acer Aspire E15 E5-576G-5762: Intel Core i5-8250U, 15.60", 2.4 kg
External Review » Acer Aspire E15 E5-576G-5762
Asus Zenbook UX430UN: Intel Core i7-8550U, 14.00", 1.3 kg
External Review » Asus Zenbook UX430UN
Asus VivoBook X405UQ: Intel Core i7-7500U, 14.00", 1.3 kg
External Review » Asus VivoBook X405UQ
Asus VivoBook S14 S410UN-EB123T: Intel Core i5-8250U, 14.00", 1.3 kg
External Review » Asus VivoBook S14 S410UN-EB123T
Asus ZenBook 13 UX331UN: Intel Core i7-8550U, 13.30", 1.1 kg
External Review » Asus ZenBook 13 UX331UN
Asus VivoBook Pro 17 N705UN-GC023T: Intel Core i5-7200U, 17.30", 2.2 kg
External Review » Asus VivoBook Pro 17 N705UN-GC023T
MSI GV62 7RC-225UK: Intel Core i5-7300HQ, 15.60", 2.2 kg
External Review » MSI GV62 7RC-225UK
Dell Inspiron 17-7773-9955: Intel Core i5-8250U, 17.30", 2.9 kg
External Review » Dell Inspiron 17-7773-9955
Dell Inspiron 17-7773-0043: Intel Core i7-8550U, 17.30", 2.9 kg
External Review » Dell Inspiron 17-7773-0043
HP Envy 17-ae120nd: Intel Core i7-8550U, 17.30", 3 kg
External Review » HP Envy 17-ae120nd
HP Pavilion 15-ck094nd: Intel Core i7-8550U, 15.60", 2 kg
External Review » HP Pavilion 15-ck094nd
Acer Aspire 5 A517-51G-80L: Intel Core i7-8550U, 17.30", 2.9 kg
External Review » Acer Aspire 5 A517-51G-80L
HP Spectre x360 15t-bl100: Intel Core i7-8550U, 15.60", 2 kg
External Review » HP Spectre x360 15t-bl100
Lenovo IdeaPad 320-15IKB-81BG000BSB: Intel Core i7-8550U, 15.60", 2.2 kg
External Review » Lenovo IdeaPad 320-15IKB-81BG000BSB
Acer Aspire E5-576G-5755: Intel Core i5-8250U, 15.60", 2.2 kg
External Review » Acer Aspire E5-576G-5755
Acer Aspire 5 A517-51G-582X: Intel Core i5-8250U, 17.30", 3 kg
External Review » Acer Aspire 5 A517-51G-582X
Acer Swift 3 SF315-51G-55Z9: Intel Core i5-7200U, 15.60", 2.1 kg
External Review » Acer Swift 3 SF315-51G-55Z9
HP Envy 13-ad104ns: Intel Core i5-8250U, 13.30", 1.3 kg
External Review » HP Envy 13-ad104ns
Asus VivoBook S15 S510UN, i7 8550U: Intel Core i7-8550U, 15.60", 1.7 kg
External Review » Asus VivoBook S15 S510UN, i7 8550U
Acer Aspire 5 A515-51G-50AC: Intel Core i5-8250U, 15.60", 2.2 kg
External Review » Acer Aspire 5 A515-51G-50AC
HP Envy 13-ad142ng: Intel Core i7-8550U, 13.30", 1.3 kg
External Review » HP Envy 13-ad142ng
Acer Swift 3 SF314-52G-89SL: Intel Core i7-8550U, 14.00", 1.6 kg
External Review » Acer Swift 3 SF314-52G-89SL
Acer Aspire 5 A515-51G-500W: Intel Core i5-8250U, 15.60", 2.2 kg
External Review » Acer Aspire 5 A515-51G-500W
Xiaomi Mi Notebook Pro i7: Intel Core i7-8550U, 15.60", 2 kg
External Review » Xiaomi Mi Notebook Pro i7
Xiaomi Mi Notebook Air 13.3 2017: Intel Core i5-7200U, 13.30", 1.3 kg
External Review » Xiaomi Mi Notebook Air 13.3 (2017)
Xiaomi Mi Notebook Pro i5: Intel Core i5-8250U, 15.60", 2 kg
External Review » Xiaomi Mi Notebook Pro
Acer Swift 3 SF315-51G-57E5: Intel Core i5-8250U, 15.60", 1.9 kg
External Review » Acer Swift 3 SF315-51G-57E5
Acer Swift 3 SF314-52-722E: Intel Core i7-7500U, 14.00", 1.8 kg
External Review » Acer Swift 3 SF314-52-722E
Acer Swift 3 SF314-52-717H: Intel Core i7-7500U, 14.00", 1.8 kg
External Review » Acer Swift 3 SF314-52-717H
Acer Switch 7 BE SW713-51GNP: Intel Core i7-8550U, 13.50", 1.6 kg
External Review » Acer Switch 7 BE SW713-51GNP
Asus ZenBook 13 UX331UN: Intel Core i7-8550U, 13.50", 1.1 kg
External Review » Asus ZenBook 13 UX331UN
Acer Switch 7 Black Edition: Intel Core i7-8550U, 13.50", 1.6 kg
External Review » Acer Switch 7 Black Edition
Acer Swift 3 SF314-52G-5848: Intel Core i5-8250U, 14.00", 1.8 kg
External Review » Acer Swift 3 SF314-52G-5848
Asus ZenBook Flip 14 UX461UN: Intel Core i7-8550U, 14.00", 1.5 kg
External Review » Asus ZenBook Flip 14 UX461UN
MSI PL62 7RC-051XES: Intel Core i7-7700HQ, 15.60", 2.2 kg
External Review » MSI PL62 7RC-051XES
HP Envy 13-ad006ng: Intel Core i7-7500U, 13.30", 1.3 kg
External Review » HP Envy 13-ad006ng
MSI PL62 7RC-001: Intel Core i7-7700HQ, 15.60", 2.2 kg
External Review » MSI PL62 7RC-001
MSI PL62 MX150 7700HQ: Intel Core i7-7700HQ
Article » Comparison: NVIDIA GeForce MX150 vs NVIDIA GeForce 940MX